The following table sets forth our estimates of proven and probable reserves and other mineral deposits at our mines reflecting the results of reserve studies. They have been calculated in accordance with the technical definitions contained in the SEC’s Industry Guide 7, and estimates of mine life described herein are derived from such reserve estimates. In the case of the Engenho and Fernandinho mines, where we own 60% of interests, the mineralized materialmaterials disclosed are for the entire mine, and not just for our proportional interest in the mine.
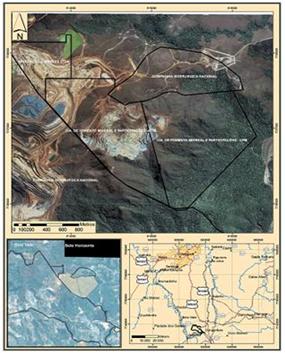
According to the report “Audit of Ore Reserves for CSN Casa de Pedra Iron Mine”, prepared by Golder Associates in May 2007, our reserve estimation process is subject to some smoothing, but does not reflect losses for mine dilution and mining recovery. We intend to perform studies regarding those losses during the preparation process for the new reserve audit. Likewise, Namisa’s estimation process for the Engenho and Fernandinho mines does not reflect losses for mine dilution and mining recovery.
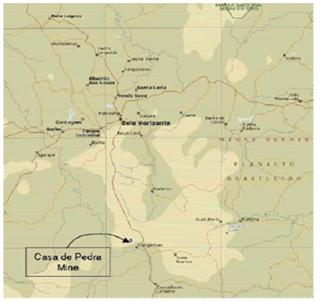
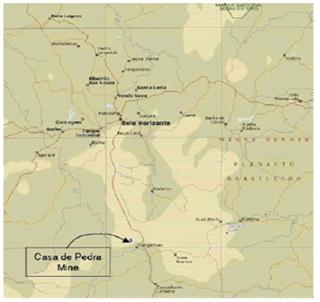
In 2006, we concluded an extensive, multi-year study of our iron ore reserves at Casa de Pedra. The study consisted of three phases. Phase one, which was completed in 1999, covered the ore bodies that are currently being mined or are close to the current operating open pits. Phase two, which was completed in early 2003, covered theotherthe other iron ore deposits at Casa de Pedra site. Phase three started in 2005 and involved a complete revaluation of our mineral reserves at Casa de Pedra.
Eurodollar and Euronotes issued in accordance with Rule 144A and Regulation S under the Securities Act reflect senior unsecured debt instruments issued by us and our offshore subsidiaries, including (i) the US$U.S.$300 million bonds, 10% per annum coupon, and the US$U.S.$300 million notes, 8.25% per annum coupon, issued in 1997 with final maturity in 2047; (ii) the issuance in December 2003 and January 2004 of US$U.S.$550 million notes, 9.75% per annum coupon with final maturity in 2013; (iii) the US$U.S.$400 million notes, 10% per annum coupon,issued in September 2004 and January 2005 with final maturity in 2015, and (iv) the US$U.S.$750 million notes, 6.875% per annum coupon, issued in September 2009 with maturity in 2019.
The table below shows the average interest rate and the average life of our debt.
SIGNATURE
The registrant hereby certifies that it meets all the requirements for filing on Form 20-F and that it has duly caused and authorized the undersigned to sign this annual report on its behalf.
| | |
April 27, 201230, 2014 | Companhia Siderúrgica Nacional |
| | |
| /s/ By:
| Benjamin Steinbruch
|
| | Name:/s/ Benjamin Steinbruch
| Benjamin Steinbruch |
| | Title: | Chief Executive Officer |
|
| /s/
By: | /s/ Rogério Leme Borges dos Santos |
| | Name:
| Rogério Leme Borges dos Santos |
| | Title: | Controller / Principal Financial Officer |
| | | |
147
table of contents
REPORT OF INDEPENDENT REGISTERED PUBLIC ACCOUNTING FIRM
Report of Independent Registered Public Accounting Firm
TheTo the Board of Directors and Shareholders of
Companhia SiderúrgicaSiderurgica Nacional
São Paulo – SP, Brazil
We have audited the accompanying consolidated balance sheetsinternal control over financial reporting of Companhia SiderúrgicaSiderurgica Nacional and subsidiaries (“the Company”(the "Company") as of December 31, 2011 and 2010, and the related consolidated statements of income, changes in shareholders’ equity, comprehensive income and cash flows for each of the years in the three-year period ended December 31, 2011. We also have audited the Company’s internal control over financial reporting as of December 31, 2011,2013, based on the criteria established in Internal Control –— Integrated Framework (1992) issued by the Committee of Sponsoring Organizations of the Treadway Commission (COSO)”.- COSO. The Company’sCompany's management is responsible for these consolidated financial statements, for maintaining effective internal control over financial reporting and for its assessment of the effectiveness of internal control over financial reporting, included in the accompanying Management’s Report on Internal Control over Financial Reporting. Our responsibility is to express an opinion on these consolidated financial statements and an opinion on the Company’sCompany's internal control over financial reporting based on our audits.audit.
We conducted our auditsaudit in accordance with the standards of the Public Company Accounting Oversight Board (United States). - PCAOB. Those standards require that we plan and perform the auditsaudit to obtain reasonable assurance about whether the financial statements are free of material misstatement and whether effective internal control over financial reporting was maintained in all material respects. Our audits of the consolidated financial statements included examining, on a test basis, evidence supporting the amounts and disclosures in the consolidated financial statements, assessing the accounting principles used and significant estimates made by management, and evaluating the overall financial statement presentation. Our audit of internal control over financial reporting included obtaining an understanding of internal control over financial reporting, assessing the risk that a material weakness exists, and testing and evaluating the design and operating effectiveness of internal control based on the assessed risk. Our audits also includedrisk, and performing such other procedures as we considered necessary in the circumstances. We believe that our audits provideaudit provides a reasonable basis for our opinions.opinion.
A company’scompany's internal control over financial reporting is a process designed by, or under the supervision of, the company's principal executive and principal financial officers, or persons performing similar functions, and effected by the company's board of directors, management, and other personnel to provide reasonable assurance regarding the reliability of financial reporting and the preparation of financial statements for external purposes in accordance with generally accepted accounting principles.International Financial Reporting Standards as issued by the International Accounting Standards Board - IASB. A company’scompany's internal control over financial reporting includes those policies and procedures that (1) pertain to the maintenance of records that, in reasonable detail, accurately and fairly reflect the transactions and dispositions of the assets of the company; (2) provide reasonable assurance that transactions are recorded as necessary to permit preparation of financial statements in accordance with generally accepted accounting principles,International Financial Reporting Standards as issued by the International Accounting Standards Board - IASB, and that receipts and expenditures of the company are being made only in accordance with authorizations of management and directors of the company; and (3) provide reasonable assurance regarding prevention or timely detection of unauthorized acquisition, use, or disposition of the company’scompany's assets that could have a material effect on the financial statements.
Because of itsthe inherent limitations of internal control over financial reporting, including the possibility of collusion or improper management override of controls, material misstatements due to error or fraud may not preventbe prevented or detect misstatements.detected on a timely basis. Also, projections of any evaluation of the effectiveness of the internal control over financial reporting to future periods are subject to the risk that the controls may become inadequate because of changes in conditions, or that the degree of compliance with the policies or procedures may deteriorate.
In our opinion, the consolidated financial statements referred to above present fairly, in all material respects, the financial position of Companhia Siderúrgica Nacional and subsidiaries as of December 31, 2011 and 2010, and the results of their operations and their cash flows for each of the years in the three-year period ended December 31, 2011, in conformity with International Financial Report Standards, as issued by the International Accounting Standards Board. Also in our opinion, the Company maintained, in all material respects, effective internal control over financial reporting as of December 31, 2011,2013, based on the criteria established in Internal Control –— Integrated Framework (1992) issued by the Committee of Sponsoring Organizations of the Treadway Commission (COSO)”- COSO.
We have also audited, in accordance with the standards of the Public Company Accounting Oversight Board (United States) - PCAOB, the consolidated financial statements as of and for the years ended December 31, 2013 and 2012 of the Company and our report dated April 30, 2014 expressed an unqualified opinion on those financial statements and included an explanatory paragraph regarding the Company’s adoption of new accounting standards as described in notes 2.y) and 3.
/s/ Deloitte Touche Tohmatsu Auditores Independentes
DELOITTE TOUCHE TOHMATSU AUDITORES INDEPENDENTES
São Paulo – SP, Brazil
April 30, 2014
FS-R1
table of contents
REPORT OF INDEPENDENT REGISTERED PUBLIC ACCOUNTING FIRM
To the Board of Directors and Shareholders of
Companhia Siderurgica Nacional
São Paulo – SP, Brazil
We have audited the accompanying consolidated balance sheets of Companhia Siderurgica Nacional and subsidiaries (the "Company") as of December 31, 2013 and 2012, and the related consolidated statements of income, comprehensive income, shareholders' equity, and cash flows for the years then ended. These financial statements are the responsibility of the Company's management. Our responsibility is to express an opinion on these consolidated financial statements based on our audits.
We conducted our audits in accordance with the standards of the Public Company Accounting Oversight Board (United States) - PCAOB. Those standards require that we plan and perform the audit to obtain reasonable assurance about whether the consolidated financial statements are free of material misstatement. An audit includes examining, on a test basis, evidence supporting the amounts and disclosures in the consolidated financial statements. An audit also includes assessing the accounting principles used and significant estimates made by management, as well as evaluating the overall financial statement presentation. We believe that our audits provide a reasonable basis for our opinion.
In our opinion, such consolidated financial statements present fairly, in all material respects, the financial position of Companhia Siderurgica Nacional and subsidiaries as of December 31, 2013 and 2012, and the results of their operations and their cash flows for the years then ended, in conformity with International Financial Reporting Standards as issued by theInternational Accounting Standards Board - IASB.
As discussed in notes 2.y) and 3 to the consolidated financial statements, the accompanying financial statements as of and for the year ended December 31, 2012 have been retrospectively adjusted for the adoption of International Financial Reporting Standards (“IFRS”) 10,Consolidated Financial Statements, IFRS 11,Joint Arrangements, IFRS 12,Disclosures of Interests in Other Entities, and IAS 1,Presentation of Financial Statements, and various amendments as part of the IFRS Annual Improvements 2009 – 2011.
We have also audited, in accordance with the standards of the Public Company Accounting Oversight Board (United States) - PCAOB, the Company's internal control over financial reporting as of December 31, 2013, based on the criteria established in Internal Control — Integrated Framework (1992) issued by the Committee of Sponsoring Organizations of the Treadway Commission - COSO and our report dated April 30, 2014 expressed an unqualified opinion on the Company's internal control over financial reporting.
/s/ Deloitte Touche Tohmatsu Auditores Independentes
DELOITTE TOUCHE TOHMATSU AUDITORES INDEPENDENTES
São Paulo – SP, Brazil
April 30, 2014
FS-R2
table of contents
Report of Independent Registered Public Accounting Firm
The Board of Directors and Shareholders
Companhia Siderúrgica Nacional
We have audited the accompanying consolidated statements of income, changes in shareholders’ equity, comprehensive income and cash flows of Companhia Siderúrgica Nacionaland its subsidiaries (the “Company”) for the year ended December 31, 2011. These consolidated financial statements are the responsibility of the Company’s management. Our responsibility is to express an opinion on these consolidated financial statements based on our audit.
We conducted our audit in accordance with the standards of the Public Company Accounting Oversight Board (United States). Those standards require that we plan and perform the audit to obtain reasonable assurance about whether the financial statements are free of material misstatement. An audit includes examining, on a test basis, evidence supporting the amounts and disclosures in the financial statements. An audit also includes assessing the accounting principles used and significant estimates made by management, as well as evaluating the overall financial statement presentation. We believe that our audit provides a reasonable basis for our opinion.
In our opinion, the consolidated financial statements referred to above present fairly, in all material respects, the results of their operations and their cash flows of the Company for the year ended December 31, 2011 , in conformity with International Financial Reporting Standards (IFRS) as issued by the International Accounting Standards Board (IASB).
Emphasis
As described in explanatory note 3 to the December 31, 2013 consolidated financial statements, the Company adopted the provisions of IFRS 10 – Consolidated Financial Statements and IFRS 11 - Joint Arrangements in 2013, which included the disclosure of the January 1, 2012 balance sheet.
/s/ KPMG Auditores Independentes
São Paulo, SP - Brazil
April 27,27, 2012, except for explanatory note 3 to the December 31, 2013 consolidated financial statements as to which the date is April 30, 2014.
FS-R1
FS-R3
| | | | | | | |
| Companhia Siderúrgica Nacional and Subsidiaries | | | | |
| Consolidated Balance Sheet | | | | | | |
| Thousands of Brazilian reais |
| |
| Assets | | | | |
| | | Note | | 2011 | | 2010 |
| CURRENT ASSETS | | | | | | |
Cash and cash equivalents | | 5 | | 15,417,393 | | 10,239,278 |
Trade receivables | | 6 | | 1,616,206 | | 1,367,759 |
Inventories | | 7 | | 3,734,984 | | 3,355,786 |
Recoverable taxes | | | | 584,273 | | 473,787 |
Other current assets | | 8 | | 591,450 | | 357,078 |
Total current assets | | | | 21,944,306 | | 15,793,688 |
| |
| NON-CURRENT ASSETS | | | | | | |
Long-term receivables | | | | | | |
Short-term investments measured at fair value | | | | 139,679 | | 112,484 |
Trade receivables | | | | 10,043 | | 58,485 |
Deferred income taxes | | 9 | | 1,840,773 | | 1,592,941 |
Receivables from related parties | | | | 0 | | 479,120 |
Other non-current assets | | 10 | | 2,866,226 | | 3,676,080 |
| | | | | 4,856,721 | | 5,919,110 |
| |
Investments | | 11 | | 2,088,225 | | 2,103,624 |
Property, plant and equipment | | 12 | | 17,377,076 | | 13,776,567 |
Intangible assets | | 13 | | 603,374 | | 462,456 |
Total non-current assets | | | | 24,925,396 | | 22,261,757 |
| |
| TOTAL ASSETS | | | | 46,869,702 | | 38,055,445 |
Companhia Siderúrgica Nacional and Subsidiaries |
Consolidated Balance Sheet |
Thousands of Brazilian reais |
| | | | | | | | |
Assets | | | | | | | |
| | | | | | | | |
| | Note | | 2013 | | 2012 | | 01/01/2012 |
CURRENT ASSETS | | | | | | | |
Cash and cash equivalents | 4 | | 9,995,672 | | 11,891,821 | | 13,440,690 |
Trade receivables | 5 | | 2,522,465 | | 2,661,417 | | 2,146,662 |
Inventories | 6 | | 3,160,985 | | 3,393,193 | | 3,518,907 |
Other current assets | 7 | | 722,920 | | 1,152,155 | | 1,057,717 |
Total current assets | | | 16,402,042 | | 19,098,586 | | 20,163,976 |
| | | | | | | | |
NON-CURRENT ASSETS | | | | | | | |
Long-term receivables | | | | | | | |
Investments measured at fair value | | | 30,756 | | 116,753 | | 139,679 |
Deferred income taxes | 8 | | 2,770,527 | | 2,177,079 | | 1,473,739 |
Other non-current assets | 7 | | 1,835,325 | | 1,627,139 | | 2,930,843 |
| | | | 4,636,608 | | 3,920,971 | | 4,544,261 |
| | | | | | | |
Investments | 9 | | 13,487,023 | | 10,839,787 | | 10,017,456 |
Property, plant and equipment | 10 | | 14,911,426 | | 18,519,064 | | 15,764,495 |
Intangible assets | 11 | | 965,440 | | 904,861 | | 230,979 |
Total non-current assets | | | 34,000,497 | | 34,184,683 | | 30,557,191 |
| | | | | | | | |
TOTAL ASSETS | | | 50,402,539 | | 53,283,269 | | 50,721,167 |
| | | | | | | | |
The accompanying notes are an integral part of these consolidated financial statements. |
FS-1
| | | | | | | |
| Companhia Siderúrgica Nacional and Subsidiaries | | | | | | |
| Consolidated Balance Sheet | | | | | | |
| Thousands of Brazilian reais |
| |
| Liabilities and shareholders´ equity | | | | |
| | | Note | | 2011 | | 2010 |
| SHAREHOLDERS' EQUITY AND LIABILITIES | | | | | | |
| CURRENT LIABILITIES | | | | | | |
| Payroll and related taxes | | | | 202,469 | | 164,799 |
| Trade payables | | | | 1,232,075 | | 623,233 |
| Taxes payable | | | | 325,132 | | 275,991 |
| Borrowings and financing | | 14 | | 2,702,083 | | 1,308,632 |
| Other payables | | 16 | | 1,728,445 | | 1,854,952 |
| Provisions for tax, social security, labor and civil risks | | 19 | | 292,178 | | 222,461 |
| Other provisions | | | | 14,565 | | 5,887 |
| Total current liabilities | | | | 6,496,947 | | 4,455,955 |
| |
| NON-CURRENT LIABILITIES | | | | | | |
| Borrowings and financing | | 14 | | 25,186,505 | | 18,780,815 |
| Other payables | | 16 | | 5,593,520 | | 4,321,666 |
| Deferred income taxes | | 9 | | 37,851 | | |
| Provisions for tax, social security, labor and civil risks | | 19 | | 346,285 | | 2,016,842 |
| Employee Benefits | | 29 | | 469,050 | | 367,839 |
| Other provisions | | | | 322,374 | | 289,640 |
| Total non-current liabilities | | | | 31,955,585 | | 25,776,802 |
| |
| Equity | | 21 | | | | |
| Issued capital | | | | 1,680,947 | | 1,680,947 |
| Capital reserves | | | | 30 | | 30 |
| Earnings reserves | | | | 7,671,620 | | 6,119,798 |
| Other comprehensive income/(loss) | | | | -1,366,776 | | -168,015 |
| Total equity attributable to owners of the Company | | | | 7,985,821 | | 7,632,760 |
| |
| Non-controlling interests | | | | 431,349 | | 189,928 |
| |
| Total equity | | | | 8,417,170 | | 7,822,688 |
| |
| TOTAL EQUITY AND LIABILITIES | | | | 46,869,702 | | 38,055,445 |
| |
| |
| The accompanying notes are an integral part of these consolidated financial statements. | | | | |
Companhia Siderúrgica Nacional and Subsidiaries |
Consolidated Balance Sheet |
Thousands of Brazilian reais |
| | | | | | | | |
Liabilities and shareholders´ equity | | | | | | | |
| | | | | | | | |
| | Note | | 2013 | | 2012 | | 01/01/2012 |
LIABILITIES AND SHAREHOLDERS´ EQUITY | | | | | | | |
CURRENT LIABILITIES | | | | | | | |
Payroll and related taxes | | | 208,921 | | 184,963 | | 164,942 |
Trade payables | 13 | | 1,102,037 | | 2,025,461 | | 1,102,600 |
Taxes payable | | | 304,095 | | 272,766 | | 318,315 |
Borrowings and financing | 12 | | 2,642,807 | | 2,169,122 | | 2,598,045 |
Other payables | 14 | | 972,851 | | 1,582,040 | | 1,939,199 |
Provisions for tax, social security, labor and civil risks | 17 | | 333,519 | | 316,547 | | 258,914 |
Other provisions | | | | | | | 8,133 |
Total current liabilities | | | 5,564,230 | | 6,550,899 | | 6,390,148 |
| | | | | | | | |
NON-CURRENT LIABILITIES | | | | | | | |
Borrowings and financing | 12 | | 25,103,623 | | 27,135,582 | | 24,551,642 |
Other payables | 14 | | 10,061,571 | | 9,009,049 | | 10,210,273 |
Deferred income taxes | 15 | | 268,833 | | 238,241 | | 19,763 |
Provisions for tax, social security, labor and civil risks | 17 | | 479,664 | | 371,697 | | 346,285 |
Pension and healthcare plan | 28 | | 485,105 | | 565,591 | | 469,050 |
Provision for environmental liabilities and decommissioning of assets | 18 | | 370,454 | | 404,697 | | |
Other provisions | | | | | | | 316,836 |
Total non-current liabilities | | | 36,769,250 | | 37,724,857 | | 35,913,849 |
| | | | | | | | |
Equity | 20 | | | | | | |
Issued capital | | | 4,540,000 | | 4,540,000 | | 1,680,947 |
Capital reserves | | | 30 | | 30 | | 30 |
Earnings reserves | | | 2,839,568 | | 3,690,543 | | 7,671,620 |
Other comprehensive income/(loss) | | | 716,972 | | 386,324 | | -1,366,776 |
Total equity attributable to owners of the Company | | | 8,096,570 | | 8,616,897 | | 7,985,821 |
| | | | | | | | |
Non-controlling interests | | | -27,511 | | 390,616 | | 431,349 |
| | | | | | | | |
Total equity | | | 8,069,059 | | 9,007,513 | | 8,417,170 |
| | | | | | | | |
TOTAL LIABILITIES AND SHAREHOLDERS´ EQUITY | | | 50,402,539 | | 53,283,269 | | 50,721,167 |
| | | | | | | | |
The accompanying notes are an integral part of these consolidated financial statements. |
FS-2
| | | | | | | | | |
| Companhia Siderúrgica Nacional and Subsidiaries | | | | | | | | |
| Consolidated Statements of Income | | | | | | | | |
| Thousands of Brazilian reais |
| |
| | | | | | | | | |
| | | Note | | 2011 | | 2010 | | 2009 |
| Net Revenue from sales and/or services | | 23 | | 16.519.584 | | 14.450.510 | | 10.978.364 |
| Cost of sales and/or services | | 24 | | -9.800.844 | | -7.882.726 | | -7.210.774 |
| |
| Gross profit | | | | 6.718.740 | | 6.567.784 | | 3.767.590 |
| |
| Operating expenses | | | | -961.818 | | -1.569.438 | | -206.358 |
| Selling expenses | | 24 | | -604.108 | | -481.978 | | -447.129 |
| General and administrative expenses | | 24 | | -575.585 | | -536.857 | | -480.072 |
| Other operating income | | 25 | | 719.177 | | 48.821 | | 1.368.594 |
| Other operating expenses | | 25 | | -501.302 | | -599.424 | | -647.764 |
| Share of profits of subsidiaries | | | | | | | | 13 |
| |
| Profit before finance income (costs) and taxes | | | | 5.756.922 | | 4.998.346 | | 3.561.232 |
| Finance income | | 26 | | 717.450 | | 643.140 | | 586.025 |
| Finance costs | | 26 | | -2.723.253 | | -2.554.598 | | -832.460 |
| |
| Profit before income taxes | | | | 3.751.119 | | 3.086.888 | | 3.314.797 |
| |
| Income tax and social contribution | | 9 | | -83.885 | | -570.697 | | -699.616 |
| |
| Profit from continuing operations | | | | 3.667.234 | | 2.516.191 | | 2.615.181 |
| |
| Profit for the year attributed to: | | | | | | | | |
| Companhia Siderúrgica Nacional | | | | 3.706.033 | | 2.516.376 | | 2.618.934 |
| Non-controlling interests | | | | -38.799 | | -185 | | -3.753 |
| |
| Earnings per common share - (reais/share) | | | | | | | | |
| Basic | | 28 | | 2.54191 | | 1.72594 | | 1.75478 |
| Diluted | | 28 | | 2.54191 | | 1.72594 | | 1.75478 |
| |
| |
| The accompanying notes are an integral part of these consolidated financial statements. | | | | |
Companhia Siderúrgica Nacional and Subsidiaries | | | | | | |
Consolidated Statements of Income | | | | | | | |
Thousands of Brazilian reais | | | | | | | |
| | | | | | | | |
| | | | | | | | |
| | Note | | 2013 | | 2012 | | 2011 (*) |
Net Revenue from sales and/or services | 22 | | 17,312,432 | | 15,228,589 | | 16,519,584 |
Cost of sales and/or services | 23 | | -12,422,706 | | -11,258,667 | | -9,800,844 |
| | | | | | | |
Gross profit | | | 4,889,726 | | 3,969,922 | | 6,718,740 |
| | | | | | | |
Operating expenses | | | -1,769,972 | | -3,251,353 | | -961,818 |
Selling expenses | 23 | | -874,875 | | -773,488 | | -604,108 |
General and administrative expenses | 23 | | -485,090 | | -467,920 | | -575,585 |
Other operating income | 24 | | 566,063 | | 110,901 | | 719,177 |
Other operating expenses | 24 | | -1,134,208 | | -2,762,282 | | -501,302 |
Share of profits of subsidiaries | 9 | | 158,138 | | 641,436 | | |
| | | | | | | | |
Profit before finance income (costs) and taxes | | | 3,119,754 | | 718,569 | | 5,756,922 |
Finance income | 25 | | 171,984 | | 391,844 | | 717,450 |
Finance costs | 25 | | -2,683,583 | | -2,543,195 | | -2,723,253 |
| | | | | | | | |
Profit (loss) before income taxes | | | 608,155 | | -1,432,782 | | 3,751,119 |
| | | | | | | | |
Income tax and social contribution | 15 | | -74,161 | | 952,208 | | -83,885 |
| | | | | | | | |
Profit (loss) from continuing operations | | | 533,994 | | -480,574 | | 3,667,234 |
| | | | | | | | |
Profit (loss) for the year attributed to: | | | | | | | |
Companhia Siderúrgica Nacional | | | 509,025 | | -420,113 | | 3,706,033 |
Non-controlling interests | | | 24,969 | | -60,461 | | -38,799 |
| | | | | | | | |
Earnings (losses) per common share - (reais/share) | | | | | | | |
Basic | 27 | | 0.34913 | | -0.28815 | | 2.54191 |
Diluted | 27 | | 0.34913 | | -0.28815 | | 2.54191 |
| | | | | | | | |
(*) As disclosed in notes 2(y) and 3, the financial information related to 12/31/11 was not restated by the adoption of the IFRS 10 and 11, as allowed by the IFRS 10 and 11’s relief |
| | | |
The accompanying notes are an integral part of these consolidated financial statements. |
FS-3
| | | | | | | | | |
| Companhia Siderúrgica Nacional and Subsidiaries | | | | | | | | |
| Consolidated Statement of Cash Flow | | | | | | | | |
| Thousands of Brazilian reais |
| |
| |
| | | Note | | 2011 | | 2010 | | 2009 |
| |
| Profit for the year | | | | 3,667,234 | | 2,516,191 | | 2,615,181 |
| Accrued charges on borrowings and financing | | | | 2,650,622 | | 1,489,191 | | 1,130,089 |
| Depreciation/ depletion / amortization | | 12.b) | | 948,251 | | 814,034 | | 797,341 |
| Proceeds from write-off and disposal of assets | | | | 54,727 | | 5,827 | | 70,494 |
| Realization of available-for-sale investments | | | | -698,164 | | | | |
| Deferred income tax and social contribution | | 9 | | -52,542 | | 207,268 | | 122,152 |
| Provision of swaps/forwards transactions | | | | 110,009 | | 126,492 | | -88,986 |
| Gain/(loss) on change in percentage equity interest | | | | | | | | -835,115 |
| Provision for actuarial liabilities | | | | -11,412 | | 2,393 | | -47,622 |
| Provision for tax, social security, labor and civil risks | | | | 62,746 | | 199,558 | | 99,157 |
| Inflation adjustment and exchange differences | | | | -250,083 | | 57,119 | | -2,024,573 |
| Allowance for doubtful debts | | | | 189 | | -46,675 | | 1,527 |
| Other provisions | | | | -19,651 | | -80,570 | | 399,076 |
| Cash generated from operations | | | | 6,461,926 | | 5,290,828 | | 2,238,721 |
| |
| Trade receivables | | | | -339,427 | | 143,250 | | -51,082 |
| Inventories | | | | -410,264 | | -794,331 | | 926,260 |
| Receivables from related parties | | | | 471,666 | | | | |
| Recoverable taxes | | | | 16,700 | | 297,424 | | -317,968 |
| Trade payables | | | | 544,300 | | 11,964 | | -1,137,203 |
| Payroll and related taxes | | | | -47,072 | | -36,757 | | 15,257 |
| Taxes payable | | | | 135,765 | | -101,723 | | 263,734 |
| Taxes in installments - REFIS | | | | -296,304 | | -414,473 | | -103,775 |
| Judicial deposits | | | | -20,253 | | -33,822 | | -737,041 |
| Contingent liabilities | | | | 120,951 | | 16,868 | | -422,375 |
| Interest paid | | | | -2,145,400 | | -1,190,423 | | -992,280 |
| Interest paid on swap transactions | | | | -360,976 | | -676,163 | | -742,700 |
| Other | | | | 70,168 | | 4,662 | | 376,306 |
| Increase (decrease) in assets and liabilities | | | | -2,260,146 | | -2,773,524 | | -2,922,867 |
| |
| Net cash generated by (used in) operating activities | | | | 4,201,780 | | 2,517,304 | | -684,146 |
| |
| Receipt/payment in derivative transactions | | | | -57,157 | | 395,346 | | 248,966 |
| Disposal of investments | | | | 1,310,171 | | | | |
| Net effects of equity swap | | | | | | | | 1,420,322 |
| Investments | | | | -2,126,493 | | -1,370,016 | | -284,232 |
| Property, plant and equipment | | 12 | | -4,400,825 | | -3,635,911 | | -1,996,759 |
| Intangible assets | | 13 | | -707 | | -25,216 | | -5,628 |
| Net cash used in investing activities | | | | -5,275,011 | | -4,635,797 | | -617,331 |
| |
| Borrowings and financing | | 14 | | 7,824,012 | | 8,754,779 | | 7,582,823 |
| Repayments to financial institutions - principal | | 14 | | -1,469,206 | | -2,706,982 | | -2,783,313 |
| Dividends and interest on capital | | | | -1,856,381 | | -1,560,795 | | -2,027,600 |
| Treasury shares | | | | | | | | -1,350,307 |
| Capital contribution by non-controlling shareholders | | | | 242,290 | | 128,811 | | |
| Net cash generated by financing activities | | | | 4,740,715 | | 4,615,813 | | 1,421,603 |
| |
| Exchange rate changes on cash and cash equivalents | | | | 1,510,631 | | -228,833 | | -1,300,744 |
| |
| Increase (decrease) in cash and cash equivalents | | | | 5,178,115 | | 2,268,487 | | -1,180,618 |
| Cash and cash equivalents at the beginning of the year | | | | 10,239,278 | | 7,970,791 | | 9,151,409 |
| Cash and cash equivalents at the end of the year | | | | 15,417,393 | | 10,239,278 | | 7,970,791 |
table of contents
Companhia Siderúrgica Nacional and Subsidiaries |
Consolidated Statements of Comprehensive Income |
Thousands of Brazilian reais |
| | | | | | |
| | | | | | |
| | 2013 | | 2012 | | 2011 (*) |
Profit (loss) for the year | 533,994 | | -480,574 | | 3,667,234 |
| | | | | | |
Other comprehensive income | 330,648 | | 1,753,100 | | -1,198,761 |
Exchange differences arising on translation of foreign operations | 218,927 | | 147,735 | | 195,046 |
Actuarial gains/(losses) on defined benefit plan, net of taxes | 64,336 | | 106,209 | | -74,331 |
Net change in fair value of available-for-sale financial assets, net of taxes | 44,084 | | -8,329 | | -621,312 |
Net change in fair value of available-for-sale financial assets transferred to profit or loss | | | | | -698,164 |
Impairment of available-for-sale assets, net of taxes | 3,301 | | 1,507,485 | | |
| | | | | |
Comprehensive income for the year | 864,642 | | 1,272,526 | | 2,468,473 |
| | | | | |
Attributable to: | | | | | |
Companhia Siderúrgica Nacional | 839,673 | | 1,332,987 | | 2,507,272 |
Non-controlling interests | 24,969 | | -60,461 | | -38,799 |
| |
(*) As disclosed in notes 2(y) and 3, the financial information related to 12/31/11 was not restated by the adoption of the IFRS 10 and 11, as allowed by the IFRS 10 and 11’s relief |
| | | | |
The accompanying notes are an integral part of these consolidated financial statements. |
The accompanying notes are an integral part of these consolidated financial statements.
FS-4
| | | | | | | | | | | | | | | | | |
| Companhia Siderúrgica Nacional and Subsidiaries | | | | | | |
| Consolidated Statement of Changes in Shareholders' Equity | | | | | | |
| Thousands of Brazilian reais |
| | | |
| | | Paid-in Capital | | CapitalReserve | | EarningsReserve | | Retained earnings | | Other comprehensive income | | Equity | | Non-Controling interests | | Consolidated Equity |
| At December 31, 2008 as reported | | 1,680,947 | | 30 | | 3,768,756 | | 1,012,732 | | 200,124 | | 6,662,589 | | | | 6,662,589 |
| Impact of restated of prior years | | | | | | | | (176,185) | | | | (176,185) | | | | (176,185) |
| At December 31, 2008 | | 1,680,947 | | 30 | | 3,768,756 | | 836,547 | | 200,124 | | 6,486,404 | | | | 6,486,404 |
| Unrealized Gain/Loss - Investiments | | | | | | | | | | (602) | | (602) | | | | (602) |
| IFRS adjustments | | | | | | 485,816 | | 175,257 | | (200,124) | | 460,949 | | | | 460,949 |
| Opening balance at January 1, 2009 | | 1,680,947 | | 30 | | 4,254,572 | | 1,011,804 | | (602) | | 6,946,751 | | | | 6,946,751 |
| Approval of prior year’s proposed dividends | | | | | | (485,816) | | | | | | (485,816) | | | | (485,816) |
| Profit for the year | | | | | | | | 2,618,934 | | | | 2,618,934 | | (3,753) | | 2,615,181 |
| Alocation of profit for the year | | | | | | | | | | | | | | | | |
| Declared dividends (R$1,028.82 per thousand shares) | | | | | | | | (1,500,000) | | | | (1,500,000) | | | | (1,500,000) |
| Interest on capital (R$219.46 per thousand shares) | | | | | | | | (319,965) | | | | (319,965) | | | | (319,965) |
| Reserves | | | | | | 1,847,522 | | (1,847,522) | | | | | | | | |
| Proposal to the General Meeting | | | | | | 1,178,635 | | | | | | 1,178,635 | | | | 1,178,635 |
| Comprehensive income | | | | | | | | | | (585,113) | | (585,113) | | | | (585,113) |
| Repurchase of treasury shares as per EGM 8/13/2009 | | | | | | (1,350,308) | | | | | | (1,350,308) | | | | (1,350,308) |
| Cancelation of treasury shares as per EGM 8/21 and 9/14/2009 | | | | | | | | | | | | | | | | |
| Non-controlling interests | | | | | | | | | | | | | | 86,813 | | 86,813 |
| Other | | | | | | | | 3,332 | | | | 3,332 | | | | 3,332 |
| Balances at December 31, 2009 | | 1,680,947 | | 30 | | 5,444,605 | | (33,417) | | (585,715) | | 6,506,450 | | 83,060 | | 6,589,510 |
| Approval of prior year’s proposed dividends | | | | | | (1,178,635) | | | | | | (1,178,635) | | | | (1,178,635) |
| Profit for the year | | | | | | | | 2,516,376 | | | | 2,516,376 | | (185) | | 2,516,191 |
| Allocation of profit for the year | | | | | | | | (272,297) | | | | (272,297) | | | | (272,297) |
| Declared dividends (R$186.76 per thousand shares) | | | | | | | | (356,800) | | | | (356,800) | | | | (356,800) |
| Interest on capital (R$244.72 per thousand shares) | | | | | | | | (1,227,703) | | | | (1,227,703) | | | | (1,227,703) |
| Additional dividends proposed (R$842.06 per thousand shares) | | | | | | 1,227,703 | | | | | | 1,227,703 | | | | 1,227,703 |
| Investment reserve | | | | | | 626,159 | | (626,159) | | | | | | | | |
| Cancelation of treasury shares | | | | | | (34) | | | | | | (34) | | | | (34) |
| Comprehensive income | | | | | | | | | | 417,700 | | 417,700 | | | | 417,700 |
| Non-controlling interests | | | | | | | | | | | | | | 107,053 | | 107,053 |
| Balances at December 31, 2010 | | 1,680,947 | | 30 | | 6,119,798 | | | | (168,015) | | 7,632,760 | | 189,928 | | 7,822,688 |
| Approval of prior year’s proposed dividends | | | | | | (1,227,703) | | | | | | (1,227,703) | | | | (1,227,703) |
| Profit for the year | | | | | | | | 3,706,033 | | | | 3,706,033 | | (38,799) | | 3,667,234 |
| Allocation of profit for the year | | | | | | | | | | | | | | | | |
| Declared dividends (R$635.48 per thousand shared) | | | | | | | | (926,508) | | | | (926,508) | | | | (926,508) |
| Additional dividends proposed (R$599.12 per thousand shares) | | | | | | 273,492 | | (273,492) | | | | | | | | |
| Other comprehensive income | | | | | | | | | | (1,198,761) | | (1,198,761) | | | | (1,198,761) |
| Recognition of reserves | | | | | | 2,506,033 | | (2,506,033) | | | | | | | | |
| Non-controlling interests | | | | | | | | | | | | | | 280,220 | | 280,220 |
| Balances at December 31, 2011 | | 1,680,947 | | 30 | | 7,671,620 | | | | (1,366,776) | | 7,985,821 | | 431,349 | | 8,417,170 |
table of contents
Companhia Siderúrgica Nacional and Subsidiaries |
Consolidated Statement of Cash Flow |
Thousands of Brazilian reais |
| | | | | | | | |
| | Note | | 2013 | | 2012 | | 2011(*) |
| | | | | | | | |
Profit (loss) for the year | | | 533,994 | | -480,574 | | 3,667,234 |
Accrued charges on borrowings and financing | | | 2,233,500 | | 2,203,057 | | 2,650,622 |
Depreciation/ depletion / amortization | | | 1,155,593 | | 1,100,472 | | 948,251 |
Share of profits of investees | | | -158,138 | | -641,436 | | |
Deferred income tax and social contribution | | | -1,216,594 | | -1,274,207 | | -52,542 |
Provision for tax, social security, labor and civil risks | | | 97,371 | | 232,308 | | 183,697 |
Monetary variation and exchange differences | | | 1,638,653 | | 1,010,237 | | -250,083 |
Provision of swaps/forwards transactions | | | 25,597 | | 13,739 | | 110,009 |
Impairment of available-for-sale assets | | | 5,002 | | 2,022,793 | | |
Gain from write off and disposal of assets | | | 31,660 | | 9,759 | | 54,727 |
Provision for actuarial liabilities | | | 13,488 | | -30,655 | | -11,412 |
Realization of available-for-sale investments | | | | | | | -698,164 |
Impairment loss adjustment | | | 48,469 | | | | |
Gain on loss of control over Transnordestina | | | -473,899 | | | | |
Impairment of the Transnordestina old railway network | | | 216,446 | | | | |
Other provisions | | | -3,886 | | 43,372 | | -19,462 |
Cash generated from operations | | | 4,147,256 | | 4,208,865 | | 6,582,877 |
| | | | | | | | |
Trade receivables - third parties | | | -225,028 | | 55,349 | | -482,544 |
Trade receivables - related parties | | | -62,795 | | -318,080 | | 143,117 |
Inventories | | | 259,301 | | 164,755 | | -410,264 |
Receivables from related parties | | | -54,931 | | -4,393 | | 471,666 |
Recoverable taxes | | | 486,787 | | 172,402 | | 16,700 |
Judicial deposits | | | 5,821 | | 32,595 | | -20,253 |
Dividends received from related parties | | | 324,180 | | 247,403 | | |
Trade payables | | | -841,157 | | 727,337 | | 544,300 |
Payroll and related taxes | | | 148,556 | | -110,999 | | -47,072 |
Taxes in installments - REFIS | | | 446,443 | | -125,896 | | -160,539 |
Payables to related parties | | | -3,063 | | | | |
Interest paid | | | -2,376,537 | | -2,447,407 | | -2,145,400 |
Interest on swaps paid | | | -4,617 | | -39,040 | | -360,976 |
Other | | | -52,137 | | -33,918 | | 70,168 |
Increase (decrease) in assets and liabilities | | | -1,949,177 | | -1,679,892 | | -2,381,097 |
| | | | | | | | |
Net cash generated by operating activities | | | 2,198,079 | | 2,528,973 | | 4,201,780 |
| | | | | | | | |
Investments | | | -5,131 | | -166,915 | | -57,157 |
Purchase of property, plant and equipment | | | -2,489,569 | | -2,736,452 | | 1,310,171 |
Cash from merger of subsidiaries | | | | | 14,880 | | |
Receipt/payment in derivative transactions | | | 426,328 | | 65,931 | | -2,126,493 |
Acquisition of subsidiaries | | | | | -301,192 | | -4,400,825 |
Purchase of intangible assets | | | -635 | | -1,388 | | -707 |
Cash and cash equivalents on the loss of control over Transnordestina | | | -146,475 | | | | |
Short-term investment, net of redeemed amount | | | -30,324 | | 22,926 | | |
Net cash used in investing activities | | | -2,245,806 | | -3,102,210 | | -5,275,011 |
| | | | | | | | |
Borrowings and financing raised | | | 1,697,363 | | 3,520,263 | | 7,824,012 |
Repayments to financial institutions - principal | | | -1,923,703 | | -2,429,046 | | -1,469,206 |
Repayments of principal - acquisition of subsidiaries | | | | | -803,456 | | |
Dividends and interest on capital | | | -1,660,503 | | -1,199,734 | | -1,856,381 |
Capital contribution by non-controlling shareholders | | | 5,424 | | 56,194 | | 242,290 |
Net cash (used in) generated by financing activities | | | -1,881,419 | | -855,779 | | 4,740,715 |
| | | | | | | |
Exchange rate changes on cash and cash equivalents | | | 32,997 | | -119,853 | | 1,510,631 |
| | | | | | | |
Increase (decrease) in cash and cash equivalents | | | -1,896,149 | | -1,548,869 | | 5,178,115 |
Cash and cash equivalents at the beginning of the year | | | 11,891,821 | | 13,440,690 | | 10,239,278 |
Cash and cash equivalents at the end of the year | | | 9,995,672 | | 11,891,821 | | 15,417,393 |
(*) As disclosed in notes 2(y) and 3, the financial information related to 12/31/11 was not restated by the adoption of the IFRS 10 and 11, as allowed by the IFRS 10 and 11’s relief
The accompanying notes are an integral part of these consolidated financial statements.
FS-5
| | | | | | | |
| Companhia Siderúrgica Nacional and Subsidiaries | | | | | | |
| Consolidated Statements of Comprehensive Income | | | | | | |
| Thousands of Brazilian reais |
| |
| | | |
| | | 2011 | | 2010 | | 2009 |
| Profit for the year | | 3,667,234 | | 2,516,191 | | 2,615,181 |
| |
| Other comprehensive income | | -1,198,761 | | 417,700 | | -585,113 |
| Exchange differences arising on translation of foreign operations, net of taxes | | 195,046 | | -69,270 | | -618,723 |
| Actuarial gains/(losses) on defined benefit plan, net of taxes | | -74,331 | | -28,603 | | -3,275 |
| Net change in fair value of available-for-sale financial assets, net of taxes | | -621,312 | | 515,573 | | 36,885 |
| Net change in fair value of available-for-sale financial assets transferred to profit or loss | | -698,164 | | 0 | | 0 |
| |
| Comprehensive income for the year | | 2,468,473 | | 2,933,891 | | 2,030,068 |
| |
| Attributable to: | | | | | | |
| Companhia Siderúrgica Nacional | | 2,507,272 | | 2,934,076 | | 2,033,821 |
| Non-controlling interests | | -38,799 | | -185 | | -3,753 |
table of contents
Companhia Siderúrgica Nacional and Subsidiaries |
Consolidated Statement of Changes in Shareholders' Equity |
Thousands of Brazilian reais |
| | | | | | | | | |
| | Paid-in Capital | Capital Reserve | Earnings Reserve | Retained earnings | Other Comprehensive income | Shareholders´ Equity | Non-Controling interests | Consolidated Equity |
Opening balance at January 1, 2011 | 1,680,947 | 30 | 6,119,798 | | -168,015 | 7,632,760 | 189,928 | 7,822,688 |
Approval of prior year’s proposed dividends | | | -1,227,703 | | | -1,227,703 | | -1,227,703 |
Profit for the year | | | | 3,706,033 | | 3,706,033 | -38,799 | 3,667,234 |
Allocation of profit for the year | | | | | | | | |
Declared dividends (R$635.48 per thousand shares) | | | | -926,508 | | -926,508 | | -926,508 |
Additional dividends proposed (R$187.58 per thousand shares) | | | 273,492 | -273,492 | | | | |
Other comprehensive income | | | | | -1,198,761 | -1,198,761 | | -1,198,761 |
Recognition of reserves | | | 2,506,033 | -2,506,033 | | | | |
Non-controlling interests | | | | | | | 280,220 | 280,220 |
Balances at December 31, 2011 (*) | 1,680,947 | 30 | 7,671,620 | | -1,366,776 | 7,985,821 | 431,349 | 8,417,170 |
Capital transactions with shareholders | 2,859,053 | | -3,432,545 | | | -573,492 | | -573,492 |
Capital increases | 2,859,053 | | -2,859,053 | | | | | |
Declared dividends (R$205.77 per thousand shared) | | | -300,000 | | | -300,000 | | -300,000 |
Interest on capital (R$384.10 per thousand shares) | | | -560,000 | | | -560,000 | | -560,000 |
Interest on capital proposed | | | 560,000 | | | 560,000 | | 560,000 |
Approval of prior year’s proposed dividends | | | -273,492 | | | -273,492 | | -273,492 |
Total comprehensive income | | | | -548,532 | 1,753,100 | 1,204,568 | -60,461 | 1,144,107 |
Profit for the year | | | | -420,113 | | -420,113 | -60,461 | -480,574 |
Other comprehensive income | | | | -128,419 | 1,753,100 | 1,624,681 | | 1,624,681 |
Cumulative translation adjustments for the period | | | | | 147,735 | 147,735 | | 147,735 |
Actuarial (losses)/gains on defined benefit pension plan | | | | | -22,21 | -22,210 | | -22,210 |
Available-for-sale assets, net of taxes | | | | | 1,499,156 | 1,499,156 | | 1,499,156 |
Acturial losses reclassification | | | | -128,419 | 128,419 | | | |
Internal changes in shareholders' equity | | | -548,532 | 548,532 | | | | |
Losses absorption for the period | | | -420,113 | 420,113 | | | | |
Acturial losses absorption | | | -128,419 | 128,419 | | | | |
Non-controlling interests in subsidiaries | | | | | | | 19,728 | 19,728 |
Balances at December 31, 2012 | 4,540,000 | 30 | 3,690,543 | | 386,324 | 8,616,897 | 390,616 | 9,007,513 |
Capital transactions with shareholders | | | -560,000 | -800,000 | | -1,360,000 | | -1,360,000 |
Capital increases | | | | | | | | |
Declared dividends (R$418.39 per thousand shared) | | | | -610,000 | | -610,000 | | -610,000 |
Interest on capital (R$130.32 per thousand shares) | | | | -190,000 | | -190,000 | | -190,000 |
Approval of prior year’s proposed dividends | | | -560,000 | | | -560,000 | | -560,000 |
FS-6
Companhia Siderúrgica Nacional and Subsidiaries |
Consolidated Statement of Changes in Shareholders' Equity |
Thousands of Brazilian reais |
| | | | | | | | | |
| | | | | | | | | |
| | Paid-in Capital | Capital Reserve | Earnings Reserve | Retained earnings | Other comprehensive income | Shareholders´Equity | Non-Controling interests | Consolidated Equity |
Total comprehensive income | | | | 509,025 | 330,648 | 839,673 | 24,969 | 864,642 |
Profit for the year | | | | 509,025 | | 509,025 | 24,969 | 533,994 |
Other comprehensive income | | | | | 330,648 | 330,648 | | 330,648 |
Cumulative translation adjustments for the period | | | | | 218,927 | 218,927 | | 218,927 |
Actuarial (losses)/gains on defined benefit pension plan | | | | | 64,336 | 64,336 | | 64,336 |
Available-for-sale assets, net of taxes | | | | | 44,084 | 44,084 | | 44,084 |
Impairment of available-for-sale assets | | | | | 3,301 | 3,301 | | 3,301 |
Internal changes in shareholders' equity | | | -290,975 | 290,975 | | | -443,096 | -443,096 |
Recognition of reserves | | | 25,451 | -25,451 | | | | |
Reversal of statutory working capital reserve | | | -316,426 | 316,426 | | | | |
Non-controlling interests in subsidiaries | | | | | | | -443,096 | -443,096 |
Balances at December 31, 2013 | 4,540,000 | 30 | 2,839,568 | | 716,972 | 8,096,570 | -27,511 | 8,069,059 |
(*) As disclosed in notes 2(y) and 3, the financial information related to 12/31/11 was not restated by the adoption of the IFRS 10 and 11, as allowed by the IFRS 10 and 11’s relief
The accompanying notes are an integral part of these consolidated financial statements.
FS-6FS-7
(expressed Intable of contents
(Expressed in thousands of reais – R$, unless otherwise stated)
1. DESCRIPTION OF BUSINESS
Companhia Siderúrgica Nacional “CSN”, also referred to as the Company, is a publicly-held company incorporated on April 9, 1941, under the laws of the Federative Republic of Brazil (Companhia Siderúrgica Nacional, its subsidiaries, associates and jointly controlled entities collectively referred to herein as "CSN" or the “Company”"Group”).The. The Company’s registered office social is located at Avenida Brigadeiro Faria Lima, 3400 –in São Paulo, SP.SP, Brazil.
CSN is a Company withhas shares listed on the São Paulo Stock Exchange (BOVESPA)(BM&F BOVESPA) and the New York Stock Exchange (NYSE). Accordingly, it reports its information to the Brazilian Securities Commission (CVM) and the U.S. Securities and Exchange Commission (SEC).
The Group's main operating activities of CSN are divided into 5 (five)five (5) operating segments as follows:
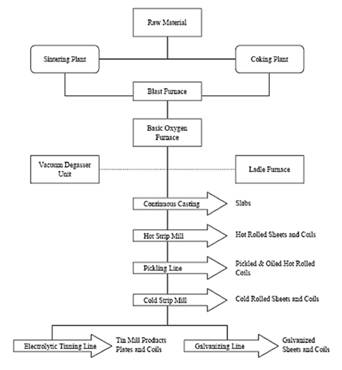
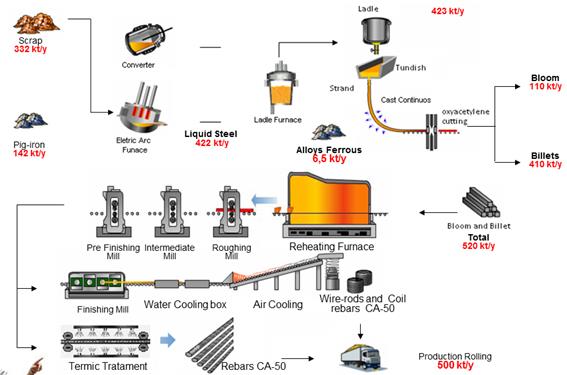
The Company’s main industrial facility is the Presidente Vargas Steel Mill (“UPV”), located in the city of Volta Redonda, State of Rio de Janeiro. This segment consolidates the operations related to the production, distribution and sale of flat steel, long steel, metallic packagingcontainers and galvanized steel. In addition to the facilities in Brazil, CSN has operations in the United States, Portugal and PortugalGermany aimed at gaining markets and performing excellent services for final consumers. Its steels are used in the home appliances, civil construction and automobile industries.
The production of iron ore is developed in the city of Congonhas, in the State of Minas Gerais. It further mines tin in the State of Rondônia to supply the needs of UPV, with the excess of these raw materials being sold to subsidiaries and third parties.CSNparties. CSN holds athe concession to operate TECAR, a solid bulk maritime terminal, one of the 4 (four) terminals that formcomprise the Itaguaí Port, located in Rio de Janeiro. Importations of coal and coke are carried out through this terminal.
The CompanyCSN entered the cement market boosted by the synergy between this new activity and its already existing businesses. Next to the Presidente Vargas Steel Mill in Volta Redonda (RJ), it installed a new business unit: CSN Cimentos, which produces CP-III type cement by using slag produced by the UPV blast furnaces in Volta Redonda. ExploresIt also explores limestone and dolomitodolomite at the Arches drive in the State of Minas Gerais, to feedsupply the needs of UPV and CSN Cement, andof the surplus of such raw materials is sold to subsidiaries and third parties.cement plant.
During 2011, the Clinker used in the manufacture of cement was purchased from third parties, however, by the end of 2011, with the completion of the first stage of the Clinker plant in Arcos (MG), this has already filled the needs of grinding of CSN Cimentos located in Volta Redonda.
Railroads:
CSN has equity interests in twothree railroad companies: MRS Logística S. A., which manages the former Southeast NetworkRailway System of Rede Ferroviária Federal S.A. (RFFSA), and Transnordestina Logística S. A. (“TLSA”) and FTL - Ferrovia Transnordestina Logística S.A. (“FTL”), which operatesoperate the former Northeast NetworkNortheastern Railway System of the RFFSA, in the statesStates of Maranhão, Piauí, Ceará, Rio Grande do Norte, Paraíba, Pernambuco and Alagoas.Alagoas, with TLSA being responsible for the sections of Missão Velha - Salgueiro, Salgueiro - Trindade, Trindade - Eliseu Martins, Salgueiro - Porto de Suape and Missão Velha - Porto de Pecém (Railway System II) and FTL being responsible for the sections of São Luiz - Mucuripe, Arrojado - Recife, Itabaiana - Cabedelo, Paula Cavalcante - Macau and Propriá - Jorge Lins (Railway System I).
PortsPorts::
FS-7FS-8
table of contents
In the State of Rio de Janeiro, by means of its subsidiary Sepetiba Tecon S. A., the Company operates the Container Terminal known as Sepetiba Tecon(Tecon) at the Itaguaí Port. Located in the Bay of Sepetiba, this port has privileged highway, railroad and maritime access.
Tecon handles the shipments of CSN steel products, movement of containers, as well as storage, consolidation and deconsolidation of cargo.
As energy is fundamental in its production process, the Company has invested in assets for generation of electric power to guarantee its self-sufficiency.
For further details on strategic investments in the Company’sGroup's segments, see Note 27 –26 - Business Segment Information.Reporting.
2. SUMMARY OF SIGNIFICANT ACCOUNTING POLICIES
The consolidated financial statements have been prepared and are being presented in accordance with International Financial Reporting Standards (IFRS) issued by the International Accounting Standards Board (IASB).
The preparation of financial statements in conformity with IFRS requires the use of certain critical accounting estimates. It also requires management to exercise its judgment in the process of applying the Company’s accounting policies. The areas involving a higher degree of judgment or complexity, or areas where assumptions and estimates are significant to the consolidated financial statements, are disclosed in the notes to this report and refer to the allowance for doubtful debts, provisionallowance for inventory losses, provision for labor, civil, tax, environmental and social security risks, depreciation, amortization, depletion, provision for impairment, deferred taxes, financial instruments and employee benefits. Actual results may differ from these estimates.
The financial statements are presented in thousands of Brazilian reais (R$). Depending on the applicable IFRS standard, the measurement criterion used in preparing the financial statements considers the historical cost, net realizable value, fair value or recoverable amount.
Some balances for the financial years 2009 and 2010 were reclassified to permit a better comparability with 2011.
The consolidated financial statements were approved by the Board of Directors and authorized for issue on AprilApril30 26, 2012. , 2014.
(b) Consolidated financial statements
The accounting policies have been consistently applied to all consolidated companies.
The consolidated financial statements for the years ended December 31, 20112013 and 20102012 include the following direct and indirect subsidiaries and jointly-controlled subsidiaries,jointly controlled entities, as well as the exclusive funds Diplic, Mugen and Mugen:Vértice:
FS-9
table of contents
· Companies
| | | Equity interests (%) | | |
Companies | | 12/31/2013 | | 12/31/2012 | | Core business |
| | | | | | | |
Direct interest in subsidiaries: full consolidation | | | | | | |
CSN Islands VII Corp. | | 100.00 | | 100.00 | | Financial transactions |
CSN Islands VIII Corp. | | 100.00 | | 100.00 | | Financial transactions |
CSN Islands IX Corp. | | 100.00 | | 100.00 | | Financial transactions |
CSN Islands X Corp. | | 100.00 | | 100.00 | | Financial transactions |
CSN Islands XI Corp. | | 100.00 | | 100.00 | | Financial transactions |
CSN Islands XII Corp. | | 100.00 | | 100.00 | | Financial transactions |
International Investment Fund (1) | | | | 100.00 | | Equity interests and financial transactions |
CSN Minerals S.L.U. | | 100.00 | | 100.00 | | Equity interests |
CSN Export Europe, S.L.U. | | 100.00 | | 100.00 | | Financial transactions and equity interests |
CSN Metals S.L.U. | | 100.00 | | 100.00 | | Equity interests and financial transactions |
CSN Americas S.L.U. | | 100.00 | | 100.00 | | Equity interests and financial transactions |
CSN Steel S.L.U. | | 100.00 | | 100.00 | | Equity interests and financial transactions |
TdBB S.A | | 100.00 | | 100.00 | | Dormant company |
Sepetiba Tecon S.A. | | 99.99 | | 99.99 | | Port services |
Mineração Nacional S.A. | | 99.99 | | 99.99 | | Mining and equity interests |
Florestal Nacional S.A. (2) | | | | 99.99 | | Reforestation |
Companhia Florestal do Brasil | | 99.99 | | | | Reforestation |
Estanho de Rondônia S.A. | | 99.99 | | 99.99 | | Tin mining |
Cia Metalic Nordeste | | 99.99 | | 99.99 | | Manufacture of packaging and distribution of steel products |
Companhia Metalúrgica Prada | | 99.99 | | 99.99 | | Manufacture of packaging and distribution of steel products |
CSN Cimentos S.A. | | 99.99 | | 99.99 | | Cement manufacturing |
CSN Gestão de Recursos Financeiros Ltda. | | 99.99 | | 99.99 | | Dormant company |
Congonhas Minérios S.A. | | 99.99 | | 99.99 | | Mining and equity interests |
CSN Energia S.A. | | 99.99 | | 99.99 | | Sale of electric powe |
FTL - Ferrovia Transnordestina Logística S.A. (3) | | 88.41 | | 99.99 | | Railroad logistics |
Transnordestina Logística S.A. (4) | | | | 76.13 | | Railroad logistics |
| | | | | | | |
Indirect interest in subsidiaries: full consolidation | | | | | | |
CSN Aceros S.A. | | 100.00 | | 100.00 | | Equity interests |
Companhia Siderúrgica Nacional LLC | | 100.00 | | 100.00 | | Steel |
CSN Europe Lda. | | 100.00 | | 100.00 | | Financial transactions, product sales and equity interests |
CSN Ibéria Lda. | | 100.00 | | 100.00 | | Financial transactions, product sales and equity interests |
CSN Portugal, Unipessoal Lda. | | 100.00 | | 100.00 | | Financial transactions and product sales |
Lusosider Projectos Siderúrgicos S.A. | | 99.99 | | 100.00 | | Equity interests |
Lusosider Aços Planos, S. A. | | 99.98 | | 99.94 | | Steel and equity interests |
CSN Acquisitions, Ltd. | | 100.00 | | 100.00 | | Financial transactions and equity interests |
CSN Resources S.A. | | 100.00 | | 100.00 | | Financial transactions and equity interests |
CSN Holdings (UK) Ltd | | 100.00 | | 100.00 | | Financial transactions and equity interests |
CSN Handel GmbH | | 100.00 | | 100.00 | | Financial transactions, product sales and equity interests |
Companhia Brasileira de Latas | | 59.17 | | 59.17 | | Sale of cans and containers in general and equity interests |
Rimet Empreendimentos Industriais e Comerciais S. A. | | 58.96 | | 58.96 | | Production and sale of steel containers and forestry |
Companhia de Embalagens Metálicas MMSA | | 58.98 | | 58.98 | | Production and sale of cans and related activities |
Empresa de Embalagens Metálicas - LBM Ltda. | | 58.98 | | 58.98 | | Sales of containers and holding interests in other entities |
Empresa de Embalagens Metálicas - MUD Ltda. | | 58.98 | | 58.98 | | Production and sale of household appliances and related products |
Companhia de Embalagens Metálicas - MTM do Nordeste | | 58.98 | | 58.98 | | Production and sale of cans and related activities |
Companhia de Embalagens Metálicas - MTM | | 58.98 | | 58.98 | | Production and sale of cans and related activities |
CSN Steel Comercializadora, S.L.U. | | 100.00 | | 100.00 | | Financial transactions, product sales and equity interests |
CSN Steel Holdings 1, S.L.U. | | 100.00 | | 100.00 | | Financial transactions, product sales and equity interests |
CSN Steel Holdings 2, S.L.U. | | 100.00 | | 100.00 | | Financial transactions, product sales and equity interests |
Stalhwerk Thüringen GmbH | | 100.00 | | 100.00 | | Production and sale of long steel and related activities |
CSN Steel Sections UK Limited | | 100.00 | | 100.00 | | Financial transactions, product sales and equity interests |
CSN Steel Sections Czech Republic s.r.o. | | 100.00 | | 100.00 | | Financial transactions, product sales and equity interests |
CSN Steel Sections Polska Sp.Z.o.o | | 100.00 | | 100.00 | | Financial transactions, product sales and equity interests |
| | | | | | | |
Direct interest in jointly controlled entities: proportionate consolidation | | | | |
Itá Energética S.A. | | 48.75 | | 48.75 | | Electric power generation |
CGPAR - Construção Pesada S.A. | | 50.00 | | 50.00 | | Mining support services and equity interests |
Consórcio da Usina Hidrelétrica de Igarapava | | 17.92 | | 17.92 | | Electric power consortium |
| | | | | | | |
Direct interest in jointly controlled entities: equity method | | | | | | |
Nacional Minérios S.A. | | 60.00 | | 60.00 | | Mining and equity interests |
MRS Logística S.A. | | 27.27 | | 27.27 | | Railroad transportation |
Aceros Del Orinoco S.A. | | 22.73 | | 22.73 | | Dormant company |
CBSI - Companhia Brasileira de Serviços de Infraestrutura | | 50.00 | | 50.00 | | Provision of services |
Transnordestina Logística S.A. (4) | | 77.30 | | | | Railroad logistics |
| | | | | | | |
Indirect interest in jointly controlled entities: equity method | | | | | | |
Namisa International Minérios SLU | | 60.00 | | 60.00 | | Financial transactions, product sales and equity interests |
Namisa Europe, Unipessoal Lda. | | 60.00 | | 60.00 | | Equity interests and sales of products and minerals |
Namisa Handel GmbH | | 60.00 | | 60.00 | | Financial transactions, product sales and equity interests |
MRS Logística S.A. | | 6.00 | | 6.00 | | Railroad transportation |
Aceros Del Orinoco S.A. | | 9.08 | | 9.08 | | Dormant company |
| | | | | | | |
Direct interest in associates: equity method | | | | | | |
Arvedi Metalfer do Brasil S.A. | | 20.00 | | 20.00 | | Steel and equity interests |
(1)Company liquidated on May 9, 2013.
(2)Company merged on September 30, 2013.
(3)New corporate name of TFNE - Transnordestina Ferrovias do Nordeste S.A., changed on February 15, 2013.
FS-8FS-10
| | | | | | | |
| | | Equity interest (%) | | |
| Companies | | 12/31/2011 | | 12/31/2010 | | Main activities |
| Direct interest: full consolidation | | | | | | |
| CSN Islands VII Corp. | | 100.00 | | 100.00 | | Financial transactions |
| CSN Islands VIII Corp. | | 100.00 | | 100.00 | | Financial transactions |
| CSN Islands IX Corp. | | 100.00 | | 100.00 | | Financial transactions |
| CSN Islands X Corp. | | 100.00 | | 100.00 | | Financial transactions |
| CSN Islands XI Corp. | | 100.00 | | 100.00 | | Financial transactions |
| CSN Islands XII Corp. | | 100.00 | | 100.00 | | Financial transactions |
| Tangua Inc. | | 100.00 | | 100.00 | | Financial transactions |
| International Investment Fund | | 100.00 | | 100.00 | | Equity interests and financial transactions |
| CSN Minerals S. L.(1) | | 100.00 | | 100.00 | | Equity interests |
| CSN Export Europe, S.L. (2) | | 100.00 | | 100.00 | | Financial transactions, product sales and equity interests |
| CSN Metals S.L. (3) | | 100.00 | | 100.00 | | Equity interests and financial transactions |
| CSN Americas S.L. (4) | | 100.00 | | 100.00 | | Equity interests and financial transactions |
| CSN Steel S.L. (5) | | 100.00 | | 100.00 | | Equity interests and financial transactions |
| TdBB S.A | | 100.00 | | 100.00 | | Dormant company |
| Sepetiba Tecon S.A. | | 99.99 | | 99.99 | | Port services |
| Mineração Nacional S.A. | | 99.99 | | 99.99 | | Mining and equity interests |
| CSN Aços Longos S.A.- merged by Parent Company on 1/28/2011 | | | | 99.99 | | Manufacture and sale of steel and/or metallurgical products |
| Florestal Nacional S.A.(6) | | 99.99 | | 99.99 | | Reforestation |
| Estanho de Rondônia S.A. | | 99.99 | | 99.99 | | Tin mining |
| Cia Metalic Nordeste | | 99.99 | | 99.99 | | Manufacture of packaging and distribution of steel products |
| Companhia Metalúrgica Prada | | 99.99 | | 99.99 | | Manufacture of packaging and distribution of steel products |
| CSN Cimentos S.A. | | 99.99 | | 99.99 | | Cement manufacturing |
| Inal Nordeste S.A.- merged by Parent Company on 5/30/2011 | | | | 99.99 | | Service center for steel products |
| CSN Gestão de Recursos Financeiros Ltda. | | 99.99 | | 99.99 | | Dormant company |
| Congonhas Minérios S.A. | | 99.99 | | 99.99 | | Mining and equity interests |
| CSN Energia S.A. | | 99.99 | | 99.99 | | Sale of electric power |
| Transnordestina Logística S.A. | | 70.91 | | 76.45 | | Railroad logistics |
| Indirect interest: full consolidation | | | | | | |
| CSN Aceros S.A. | | 100.00 | | 100.00 | | Equity interests |
| Companhia Siderurgica Nacional LLC | | 100.00 | | 100.00 | | Steel |
| CSN Europe Lda.(7) | | 100.00 | | 100.00 | | Financial transactions, product sales and equity interests |
| CSN Ibéria Lda. | | 100.00 | | 100.00 | | Financial transactions and equity interests |
| CSN Portugal, Unipessoal Lda. (8) | | 100.00 | | 100.00 | | Financial transactions and product sales |
| Lusosider Projectos Siderúrgicos S.A. | | 100.00 | | 100.00 | | Equity interests |
| Lusosider Aços Planos, S. A. | | 99.94 | | 99.94 | | Steel and equity interests |
| CSN Acquisitions, Ltd. | | 100.00 | | 100.00 | | Financial transactions and equity interests |
| CSN Resources S.A.(9) | | 100.00 | | 100.00 | | Financial transactions and equity interests |
| CSN Finance UK Ltd | | 100.00 | | 100.00 | | Financial transactions and equity interests |
| CSN Holdings UK Ltd | | 100.00 | | 100.00 | | Financial transactions and equity interests |
| CSN Handel GmbH(10) | | 100.00 | | | | Financial transactions, product sales and equity interests |
| Itamambuca Participações S. A. - merged by CSN Cimentos em 5/30/2011 | | | | 99.99 | | Mining and equity interests |
| Companhia Brasileira de Latas (11) | | 59.17 | | | | Sale of cans and containers in general and equity interests |
| Rimet Empreendimentos Industriais e Comerciais S. A.(11) | | 58.08 | | | | Production and sale of steel containers and forestry |
| Companhia de Embalagens Metálicas MMSA (11) | | 58.98 | | | | Production and sale of cans and related activities |
| Empresa de Embalagens Metálicas - LBM Ltda. (11) | | 58.98 | | | | Sales of containers and holding interests in other entities |
| Empresa de Embalagens Metálicas - MUD Ltda. (11) | | 58.98 | | | | Production and sale of household appliances and related products |
| Empresa de Embalagens Metálicas - MTM do Nordeste (11) | | 58.98 | | | | Production and sale of cans and related activities |
| Companhia de Embalagens Metálicas - MTM (11) | | 58.98 | | | | Production and sale of cans and related activities |
| Direct interest: proportionate consolidation | | | | | | |
| Nacional Minérios S.A. | | 60.00 | | 60.00 | | Mining and equity interests |
| Itá Energética S.A. | | 48.75 | | 48.75 | | Generation of electric power |
| MRS Logística S.A. | | 27.27 | | 22.93 | | Railroad transportation |
| Consórcio da Usina Hidrelétrica de Igarapava | | 17.92 | | 17.92 | | Electric power consortium |
| Aceros Del Orinoco S.A. | | 22.73 | | 22.73 | | Dormant company |
| CBSI - Companhia Brasileira de Serviços de Infraestrutura (12) | | 50.00 | | | | Provision of services |
| Indirect interest: proportionate consolidation | | | | | | |
| Namisa International Minerios SLU | | 60.00 | | 60.00 | | Equity interests and sales of products and minerals |
| Namisa Europe, Unipessoal Lda. | | 60.00 | | 60.00 | | Equity interests and sales of products and minerals |
| MRS Logística S.A. | | 6.00 | | 10.34 | | Railroad transportation |
| Aceros Del Orinoco S.A. | | 9.08 | | 9.08 | | Dormant company |
| Aloadus Handel GmbH (10) | | 60.00 | | | | Financial transactions, product sales and equity interests |
| | |
(1) | | New corporate name of CSN Energy S.à.r.l., changed on December 15, 2010. |
(2) | | New corporate name of CSN Export S.à.r.l., changed on August 9, 2011. |
(3) | | New corporate name of CSN Overseas S.à.r.l., changed on December 15, 2010. |
(4) | | New corporate name of CSN Panamá S.à.r.l., changed on December 15, 2010. |
(5) | | New corporate name of CSN Steel S.à.r.l., changed on December 17, 2010. |
(6) | | New corporate name of Itaguaí Logística S.A., changed on December 27, 2010. |
(7) | | New corporate name of CSN Madeira Lda., changed on January 8, 2010. |
(8) | | New corporate name of Hickory-Comércio Internacional e Serviços Lda., changed on January 8, 2010. |
(9) | | New corporate name of CSN Cement S.à.r.l., changed on June 18, 2010. |
(10) | | Companies that became subsidiaries on November 3, 2011. |
table of contents
FS-9
(11)(4)Companies thatOn December 27, 2013, TLSA became subsidiaries on July 12, 2011.
(12)Equity interest acquired on December 5, 2011.a jointly controlled entity and the investment accounted for under the equity method, as mentioned in note 9.b.
· Exclusive funds
| | | | | | | | |
| | | Interest held | | | | Equity interests (%) | | |
| Exclusive funds | | 12/31/2011 | | 12/31/2010 | | Main activities | | 12/31/2013 | | 12/31/2012 | | Core business |
| | | | | | | | |
| Direct interest: full consolidation | | | | | | | | | | | | |
| DIPLIC - Fundo de investimento multimercado | | 100.00 | | 100.00 | | Investment fund | |
| Mugen - Fundo de investimento multimercado | | 100.00 | | 100.00 | | Investment fund | |
DIPLIC - Private credit balanced mutual fund | | | 100.00 | | 100.00 | | Investment fund |
Mugen - Private credit balanced mutual fund | | | 100.00 | | 100.00 | | Investment fund |
Caixa Vértice - Private credit balanced mutual fund | | Caixa Vértice - Private credit balanced mutual fund | 100.00 | | 100.00 | | Investment fund |
In preparing the consolidated financial statements the following consolidation procedures have been applied:
Unrealized gains on transactions with subsidiaries and jointly controlled entities are eliminated to the extent of CSN’s equity interests in the related entity in the consolidation process. Unrealized losses are eliminated in the same manner as unrealized gains, although only to the extent that there are indications of impairment. The base date of the financial statements of the subsidiaries and jointly controlled entities and affiliated companiesis the same as that of the Company, and their accounting policies are in line with the policies adopted by the Company.
· Subsidiaries
Subsidiaries are all entities (including special purpose entities) over which the Company has the power to determine the, whose financial and operating policies generally accompanying a shareholding of more than one half ofcan be conducted by the voting rights.Company and when it is exposed to, or has rights to, variable returns from its involvement with the entity and has the ability to use its power to affect its returns. The existence and effect of potential voting rights that are actually exercisable or convertible are taken into consideration when assessing whether the Company controls another entity. Subsidiaries are fully consolidated from the date when control is transferred to the Company and are deconsolidated from the date when such control ceases.
· JointJointly controlled entities
Jointly controlled entities are all entities over which the Group has joint control with one or more other parties. The investments in joint arrangements are classified as joint operations or joint ventures depending on the contractual rights and characteristics of each investor.
The investments in jointly controlled entities classified as joint venturesare accounted for under the equity method and are not consolidated. Some joint arrangements were considered as joint operation in 2013, due to the application of IFRS 11, see further details in note 3.
Jointly arrangements are all entities over which the Company has joint control with one or more other parties. The investments in joint arrangements are classified as joint operations or joint ventures depending on the contractual rights and characteristics of each investor.
Joint arrangements are accounted for in the financial statements in order to represent the Company's contractual rights and obligations. Thus, the assets, liabilities, revenues and expenses related to its interests in joint arrangements are accounted for individually in the financial statements.
The Company eliminates the effect on profit or loss of transactions carried out with joint controlled entities and, as a result, reclassifies part of the share of profits (losses) of jointly controlled entities are included in the consolidated financial statements from the date when shared control starts through the date when shared control ceases to exist. Jointly controlled entities are proportionately consolidated.finance costs, cost of sales and income tax and social contribution.
·Associates
Associates are all entities over which the Company has significant influence but not control, generally through a shareholding of 20% to 50% of the voting rights. Investments in associates are accounted for under the equity method of accounting and are initially recognized at cost.
FS-11
· Transactions and non-controlling interests
The Company treats transactions with non-controlling interests as transactions with owners of Company equity. For purchases from non-controlling interests, the difference between any consideration paid and the relevant share acquired of the carrying value of net assets of the subsidiary is recorded in shareholders' equity. Gains and losses on disposals to non-controlling interests are also recognized directly in shareholders' equity, in line item “Valuation adjustments to equity”.
When the Company no longer holds control, any retained interest in the entity is remeasured to its fair value, with the change in the carrying amount recognized in profit or loss. The fair value is the initial carrying amount for the purposes of subsequently accounting for the retained interest asin an associate, joint venture or financial asset. In addition, any amounts previously recognized in other comprehensive income in respect of that entity are accounted for as if the Company had directly disposed of the related assets or liabilities. This may mean that amounts previously recognized in other comprehensive income are reclassified to profit or loss.
(c) Foreign currencies
i. Functional and presentation currency
FS-10
Items included in the financial statements of each one of the Company’sCompany's subsidiaries are measured using the currency of the primary economic environment in which the subsidiary operates (“functional currency”). The consolidated financial statements are presented in Brazilian reais (R$), which is the Company’s functional currency and the Group’s presentation currency.
ii. Balances and transactions
Transactions in foreign currencies are translated into the functional currency using the exchange rates in effect at the dates of the transactions or valuation on which items are remeasured. Foreign exchange gains and losses resulting from the settlement of these transactions and from the translation at exchange rates in effect as as of December 31, 20112013 of monetary assets and liabilities denominated in foreign currencies are recognized in the income statement, except when they are recognized in shareholders' equity as qualifying cash flow hedges and qualifying net investment hedges.
The asset and liability balances are translated at the exchange rate in effect at the end of the reporting period. As of December 31, 2011,2013, US$1 is equivalent to R$1.87582.3426 (R$1.66622.0435 as of December 31, 2010)2012), EUR€$ 1 is equivalent to R$2.43423.2265 (R$2.22802.6954 as of December 31, 2010), A$2012) and ¥$ 1 is equivalent to R$1.91160.02233 (R$1.69590.02372 as of December 31, 2010) and JPY 1 is equivalent to R$0.02431 (R$0.0205 as of December 31, 2010)2012).
All other foreign exchange gains and losses, including foreign exchange gains and losses related to loans and cash and cash equivalents, are presented in the income statement as finance income or costs.
Changes in the fair value of monetary securities denominated in foreign currency, classified as available-for-sale, are segregated into translation differences resulting from changes in the amortized cost of the security and other changes in the carrying amount of the security. Exchange differences related to changes in amortized cost are recognized in profit or loss, and other changes in the carrying amount are recognized in shareholders' equity.
Exchange differences on non-monetary financial assets and liabilities classified as measured at fair value through profit or loss are recognized in profit or loss as part of the gain or loss on the fair value. Exchange differences on non-monetary financial assets, such as investments in shares classified as available-for-sale, are included in comprehensive income in shareholders' equity.
iii. Group companies
The results and financial position of all the Group’s entities (none of which has the currency of a hyper-inflationary economy) that have a functional currency different from the reporting currency are translated into the reporting currency as follows:
FS-12
· Assets and liabilities in each balance sheet presented have been translated at the exchange rate at the end of the reporting period.period;
· Income and expenses of each income statement are translated at average exchange rates (unless this average is not a reasonable approximation of the cumulative effect of the rates in effect at the transaction dates, in which case income and expenses are translated at the rate in effect at the transaction dates); and
· All resulting exchange differences are recognized as a separate component in other comprehensive income.
On consolidation, exchange differences resulting from the translation of monetary items with characteristics of net investment in foreign operations are recognized in shareholders' equity. When a foreign operation is partly disposed of or sold, exchange differences previously recorded in other comprehensive income are recognized in the income statement as part of the gain or loss on sale.
(d) Cash and cash equivalents
FS-11
Cash and cash equivalents include cash on hand and in banks and other short-term highly liquid investments redeemable within 90 days from the end of the reporting period, readily convertible into a known amount of cash and subject to an insignificant risk of change in value. Certificates of deposit that can be redeemed at any time without penalties are considered as cash equivalents.
(e) Trade receivables
Trade receivables are initially recognized at fair value, including the related taxes and expenses. Foreign currency-denominated trade receivables are adjusted at the exchange rate in effect at the end of the reporting period. The allowance for estimated losses on doubtful debts waswere recognized in an amount considered sufficient to cover any losses. Management’s assessment takes into consideration the customer’s history and financial position, as well as the opinion of our legal counsel regarding the collection of these receivables for recognizing the allowance.allowance for estimated losses.
(f) Inventories
Inventories are statedcarried at the lower of cost and net realizable value. Cost is determined using the weighted average cost method on the acquisition of raw materials. The costs of finished products and work in process comprise raw materials, labor and other direct costs (based on the normal production capacity). Net realizable value represents the estimated selling price in the normal course of business, less estimatedcosts of completion and costs necessary to make the sale. Losses The allowance for estimated losses for slow-moving or obsolete inventories are recognized when considered appropriate.
Stockpiled ore inventories are accounted for as processed when removed from the mine. The cost of finished products comprises all direct costs necessary to transform stockpiled inventories into finished products.
(g) Investments
ForeignInvestments in subsidiaries, joint venture entities and associates are accounted for under the equity method of accounting and are initially recognized at cost. The gains or losses are recognized in profit or loss as operating revenue (or expenses) in the financial statements. In the case of foreign exchange differences arising on translating foreign investments that have a functional currency different from the Company’s, changes in investments due exclusively to foreign exchange differences, as well as adjustments to pension plans and available-for-sale investments that impact the subsidiaries’ shareholders' equity, are recognized in other comprehensive income,line item “Cumulative translation adjustments”, in the Company’s shareholders' equity, and are only recognized in profit or loss when the investment is disposed of or written off due to impairment loss. Other investments are recognized and maintained at cost or fair value.
FS-13
When necessary, the accounting policies of subsidiaries and jointly controlledjoint venture entities are changed to ensure consistency and uniformity of criteria with the policies adopted by the Company.
(h) Business combination
The acquisition method is used to account for each business combination conducted by the Company. The consideration transferred for acquiring a subsidiary is the fair value of the assets transferred, liabilities incurred and equity instruments issued by the Company. The consideration transferred includes the fair value of any asset or liability resulting from a contingent consideration arrangement, where applicable. Acquisition-related costs are recognized in profit or loss for the year, as incurred. Identifiable assets acquired and liabilities assumed in a business combination are initially measured at their fair values at the acquisition date. The Company recognizes non-controlling interests in the acquiree according to the proportional non-controlling interest held in the fair value of the acquiree’s new assets (see note 3)4).
(i) Property, plant and equipment
Property, plant and equipment are carried at cost of acquisition, formation or construction, less accumulated depreciation or depletion and any impairment loss. Depreciation is calculated under the straight-line method based on the remaining economic useful economic lives of assets, as mentioned in note 12.10. The depletion of mines is calculated based on the quantity of ore mined. Land is not depreciated since itstheir useful life is considered indefinite. However, if the tangible assets are mine-specific, that is, used in the mining activity, they are depreciated over the economicshorter of the normal useful lives forof such assets.assets or the useful life of the mine. The Company recognizes in the carryingamountcarrying amount of property, plant and equipment the cost of replacement, reducing the carrying amount of the part that it is replacing if it is probable that future economic benefits embodied therein will revert to the Company, and if the cost of the asset can be reliably measured. All other disbursements are expensed as incurred. Borrowing costs related to funds obtained for construction in progress are capitalized until these projects are completed.
FS-12
If some components of property, plant and equipment have different useful lives, these components are separately recognized as property, plant and equipment items.
Gains and losses on disposal are determined by comparing the sale value less the residual value and are recognized in ‘Other operating income (expenses)’.
Mineral rights acquired are classified as other assets in property, plant and equipment.
Exploration expenditures are recognized as expenses until the viability of mining activities is established; after this period subsequent development costs are capitalized. Exploration and valuation expenditures include:
· Research and analysis of exploration area historical data;
· Topographic, geological, geochemical and geophysical studies;
· Determine the mineral asset’s volume and quality/grade of deposits;
· Examine and test the extraction processes and methods;
· Topographic surveys of transportation and infrastructure needs;
· Market studies and financial studies.
The costs for the development of new mineral deposits or capacity expansion in mines in operationsoperation are capitalized and amortized using the produced (extracted) units method based on the probable and proven ore quantities.
The development stage includes:
· Drillings to define the ore body;
· Access and draining plans;
· Advance removal of overburden (top soil and waste material removed prior to initial mining of the ore body) and waste material (non-economic material that is intermingled with the ore body). This is often referred to as stripping.
FS-14
Stripping costs (the costs associated with the removal of overburdened and other waste materials) incurred during the development of a mine, before production commences, are capitalized as part of the depreciable cost of developing the property. Such costs are subsequently amortized over the useful life of the mine based on proven and probable reserves.
Post-production stripping costs are included in the cost of the inventory produced (that is extracted), at each mine individuallyexcept when a new campaign is launched to permit the access to a significant new ore body. In such cases, the cost is capitalized as a non-current asset and amortized during the period that stripping costs are incurred.extraction of the ore body.
The Company holds spare parts that will be used to replace parts of property, plant and equipment and that will increase the asset’s useful life and the useful life of which exceeds 12 months. months. These parts are classified in property, plant and equipment and not in inventories.
(j) Intangible assets
Intangible assets comprise assets acquired from third parties, including through business combinations and/or those internally generated.
These assets are recognized at cost of acquisition or formation, less amortization calculated on a straight-line basis based on the exploration or recovery periods.
FS-13
Intangible assets with indefinite useful lives and goodwill based on expected future profitability are not amortized.
· Goodwill
Goodwill represents the positive difference between the amount paid and/or payable for the acquisition of a business and the net fair values of the assets and liabilities of the acquiree. Goodwill on acquisitions of subsidiaries is recognized as ‘Intangible assets’ in the consolidated financial statements. In the individual balance sheet, goodwill is included in investments. Negative goodwill is recognized as a gain in profit for the period at the acquisition date. Goodwill is annually tested for impairment. Impairment losses on goodwill are not reversed. Gains and losses on the disposal of a Cash-Generating Unit (CGU) include the carrying amount of goodwill related to the CGU sold.
Goodwill is allocated to CGUs for impairment testing purposes. The allocation is made to Cash-Generating Units or groups of Cash-Generating Units that are expected to benefit from the business combination from which the goodwill arose, and the unit is not greater than the operating segment.
· Software
Software licenses purchased are capitalized based on the costs incurred to purchase the software and make it ready for use. These costs are amortized on a straight-line basis over the estimated economic useful lives.lives of 1 to 5 years.
(k) Impairment of non-financial assets
Assets with infinite useful lives, such as goodwill, are not subject to amortization and are annually tested for impairment. Assets subject to amortization are tested for impairment when whenever events or changes in circumstances indicate that their carrying amounts may not be recoverable. An impairment loss is recognized at the amount by which the carrying amount of an asset exceeds its recoverable amount. The recoverable amount is the higher of the fair value of an asset less costs to sell and its value in use. For impairment testing purposes, assets are grouped at their lowest levels for which there are separately identifiable cash flows (Cash Generating Units, -or CGUs). Non-financial assets, except goodwill, that are considered impaired are subsequently reviewed for possible reversal of the impairment at the reporting date.
(l) Employee benefits
FS-15
i. Employee benefits
Defined contribution plans
A defined contribution plan is as a post-employment benefit plan whereby an entity pays fixed contributions to a separate entity (pension fund) and will not have any legal or constructive obligation to pay additional amounts. Obligations for contributions to defined contribution pension plans are recognized as employee benefit expenses in the income statement for the periods during which services are provided by employees. Contributions paid in advance are recognized as an asset on condition that either cash reimbursement or reduction in future payments is available. Contributions to a defined contribution plan that is expected to mature twelve (12) months after the end of the period in which the employee provides services are discounted to their present values.
Defined benefit plans
A defined benefit plan is a post-employment benefit plan other than a defined contribution plan. The Company’s net obligation regarding defined pension benefit plans is calculated individually for each plan by estimating the value of the future benefit that the employees accrue as return for services provided in the current period and in prior periods; such benefit is discounted to its present value. Any unrecognized costs of past services and the fair values of any plan assets are deducted. The discount rate is the yield presented at the end of the reporting period for top line debt securities whose maturity dates approximate the terms and conditions of the Company’s obligations and which are denominated in the same currency as theonethe one in which it is expected that the benefits will be paid. The calculation is made annually by a qualified actuary using the projected unit credit method. When the calculation results in a benefit for the Company, the asset to be recognized is limited to the total amount of any unrecognized costs of past services and the present value of the economic benefits available in the form of future plan reimbursements or reduction in future contributions to the plan. In calculating the present value of economic benefits, consideration is given to any minimum funding requirements that apply to any Company plan. An economic benefit is available to the Company if it is realizable during the life of the plan or upon settlement of the plan’s liabilities.
FS-14
SomeThe Company and some of the Company’s entitiesits subsidiaries offered a postretirement healthcare benefit to its employees. The right to these benefits is usually contingent to their remaining in employment until the retirement age and the completion of the minimum length of service. The expected costs of these benefits are accumulated during the employment period, and were calculated using the same accounting method used for defined benefit pension plans. These obligations are annually evaluatedvalued by qualified independent actuaries.
When the benefits of a plan are increased, the portion of the increased benefit related to past services of employees is recognized on a straight-line basis over the average periodin profit or loss until the benefits become vested. When the benefits become immediately vested, the expense is recognized in profit or loss.
The Company has chosen to recognize all the actuarial gains and losses resulting from defined benefit plans immediately in other comprehensive income, and only registered in income statement ifsubsequently transferred to retained earnings or accumulated losses. If the plan is extinguished.extinguished, actuarial gains and losses are recognized in profit or loss.
ii. Profit sharing and bonus
Employee profit sharing and executives’ variable compensation are linked to the achievement of operating and financial targets. The Company when such goals are met, recognizes a liability and an expense substantially allocated to production cost and, where applicable, to general and administrative expenses.expenses when such goals are met.
(m) Provisions
Provisions are recognized when: (i) the Company has a present legal or constructive obligation as a result of past events, (ii) it is probable that an outflow of resources will be required to settle a present obligation, and (iii) the amount can be reliably measured. Provisions are determined discounting the expected future cash flows based on a pre-tax discount rate that reflects current market assessments of the time value of money and, where appropriate, the specific risks of the liability.
(n) Concessions
FS-16
The Company has government concessions and their payments are classified as operating leases.
(o) Share capital
Common shares are classified in shareholders' equity.
Incremental costs directly attributable to the issue of new shares or options are shown in shareholders' equity as a deduction from the proceeds, net of taxes.
When the Company or any of its subsidiariesGroup company buys Company shares (treasury shares), the amount paid, including any directly attributable additional costs (net of income tax), is deducted from shareholders' equity attributable to owners of the Company until the shares are canceled or reissued. When these shares are subsequently reissued, any amount received, net of any directly attributable additional transaction costs and the related income tax and social contribution effects, is included in shareholders' equity attributable to owners of the Company.
(p) Revenue recognition
FS-15
Operating revenue from the sale of goods in the normal course of business is measured at the fair value of the consideration received or receivable. Revenue is recognized when there is convincing evidence that the most significant risks and rewards of ownership of goods have been transferred to the buyer, it is probable that future economic benefits will flow to the entity, the associated costs and possible return of goods can be reliably estimated, there is no continued involvement with the goods sold, and the amount of the operating revenue can be reliably measured. If it is probable that discounts will be granted and the value thereof can be reliably measured, then the discount is recognized as a reduction of the operating revenue as sales are recognized. Revenue from services provided is recognized as it is realized.
The appropriate timing for transfer of risks and rewards varies depending on the individual terms and conditions of the sales contract. For international sales, this timing depends on the type of term of the contract.
(q) Finance income and finance costs
Finance income includes interest income from funds invested (including available-for-sale financial assets), dividend income (except for dividends received from investees accounted for under the equity method in Company), gains on disposal of available-for-sale financial assets, changes in the fair value of financial assets measured at fair value through profit or loss, and gains on hedging instruments that are recognized in profit or loss. Interest income is recognized in profit or loss under the effective interest method. Dividend income is recognized in profit or loss when the Company’s right to receive payment has been established. Distributions received from investees accounted for byunder the equity method reduce the investment value.
Finance costs comprise interest expenses on borrowings, net of the discount to present value of the provisions, dividends on preferred shares classified as liabilities, losses in the fair value of financial instruments measured at fair value through profit or loss, impairment losses recognized in financial assets, and losses on hedging instruments that are recognized in profit or loss. Borrowing costs that are not directly attributable to the acquisition, construction or production of a qualifying asset are measured through profit or loss under the effective interest method.
Foreign exchange gains and losses are reported on a net basis.
(r) Income tax and social contribution
Current and deferred income tax and social contribution are calculated based on the tax lawlaws enacted or substantially enacted by the end of the reporting period, including in the countries where the Group entities operate and generate taxable profit. Management periodically assesses the positions assumed in the tax calculations with respect to situations where applicable tax regulations are open to interpretations. The Company recognizes provisions, when appropriate, based on the estimated payments to tax authorities.
FS-17
table of contents
The income tax and social contribution expense comprises current and deferred taxes. The current and deferred taxes are recognized in profit or loss unless they are related to business combinations or items recognized directly recognized in shareholders' equity.
Current tax is the expected tax payable or receivable on taxable profit or loss for the year at tax rates that have been enacted or substantially enacted by the end of the reporting period and any adjustment to taxes payable in relation to prior years.
Deferred tax is recognized on temporary differences between the carrying amounts of assets and liabilities in the financial statements and the corresponding tax bases used in the computation of taxable profit. Deferred tax is not recognized for the following temporary differences: initial recognition of assets and liabilities in a transaction that is not a business combination and does not affect either the accounting or taxable profit or loss, and differences associated with investments in subsidiaries and controlled entities when it is probable that they will not reverse in the foreseeable future. Moreover, a deferred tax liability is not recognized for taxable temporary differences resulting in the initial recognition of goodwill. The deferred tax is measured at the rates that are expected to be applied on temporary differences when they reverse, based on the laws thathavethat have been enacted or substantially enacted by the end of the reporting period.
FS-16
Current income tax and social contribution are carried at their net amounts by the taxpayer, in liabilities when there are amounts payable or in assets when prepaid amounts exceed the total amount due at the end of the reporting period.
Deferred tax assets and liabilities are offset when there is a legally enforceable right to set off current tax assets against current tax liabilities and when they relate to income taxes levied by the same taxation authority on the same entity subject to taxation.
A deferred income tax and social contribution asset is recognized for all tax losses, tax credits, and deductible temporary differences to the extent that it is probable that taxable profits will be available against which those tax losses, tax credits, and deductible temporary differences can be utilized.
Deferred income tax and social contribution assets are reviewed at the end of each reporting period and reduced to the extent that their realization is no longer probable.
(s) EarningsEarnings/(loss) per share
Basic earningsearnings/loss per share are calculated by means of the profitprofit/loss for the year attributable to owners of the Company and the weighted average number of common shares outstanding in the related period. Diluted earningsearnings/loss per share are calculated by means of the average number of shares outstanding, adjusted by instruments potentially convertible into shares, with diluting effect, in the reported periods. The Company does not have any instruments potentially convertible into shares and, accordingly, diluted earningsearnings/loss per share are equal to basic earningsearnings/loss per share.
(t) Environmental and restoration costs
The Company recognizes a provision for the costs of recovery of areas and fines when a loss is probable and the amounts of the related costs can be reliably measured. Generally, the period for providing for the amount to be used in recovery coincides with the end of a feasibility study or the commitment to adopt a formal action plan.
Expenses related to compliance with environmental regulations are charged to profit or loss or capitalized, as appropriate. Capitalization is considered appropriate when the expenses refer to items that will continue to benefit the Company and that are basically related to the acquisition and installation of equipment to control and/or prevent pollution.
(u) Research and development
FS-18
All these costs are recognized in the income statement when incurred, except when they meet the criteria for capitalization. Expenditures on researchResearch and development of new productsexpenditures recognized as expense for the year ended December 31, 20112013 amounted to R$6,5325,810 (R$4,314 for the year ended6,033 as of December 31, 2010)2012).
(v) Financial instruments
i) Financial assets
Financial assets are classified into the following categories: measured at fair value through profit or loss, loans and receivables, held-to-maturity, and available-for- sale. The classification depends on the purpose for which the financial assets were acquired. Management determines the classification of its financial assets at the time of initial recognition.
· Financial assets measured at fair value through profit or loss
FS-17
Financial assets at fair value through profit or loss are financial assets held for active and frequent trading. Derivatives are also categorized as held for trading and, accordingly, are classified in this category unless they have been designed as cash flow hedging instruments. Assets in this category are classified in current assets.
· Loans and receivables
This category includeincludes loans and receivables that are non-derivative financial assets with fixed or determinable payments not quoted in an active market. They are included in current assets, except those with maturity of more than 12 months after the end of the reporting period (which are classified as non-current assets). Loans and receivables include loans to associates, trade receivables and cash and cash equivalents, except short-term investments. Cash and cash equivalents are recognized at fair value. Loans and receivables are carried at amortized cost using the effective interest method.
· Held-to-maturity assets
These are basically financial assets acquired with the positive intent and ability to hold to maturity. Held-to-maturity investments are initially recognized at their value plus any directly attributable transaction costs. Subsequent to initial recognition, they are measured at amortized cost using the effective interest method, less any impairment loss.
· Available-for-sale financial assets
These are non-derivative financial assets, designated as available-for-sale, that are not classified in any other category. They are included in non-current assets when they are strategic investments of the Company, unless Management intends to dispose of the investment within up to 12 months from the end of the reporting period. Available-for-sale financial assets are recognized at fair value.
· Recognition and measurement
Regular purchases and sales of financial assets are recognized at the trading date - the date on which the Company undertakes to buy or sell the asset. Investments are initially recognized at their fair value, plus transaction costs for all financial assets not classified as at fair value through profit or loss. Financial assets at fair value through profit or loss are initially recognized at their fair value and the transaction costs are charged to the income statement. Financial assets are derecognized when the rights to receive cash flows from the investments have expired or have been transferred, in the latter case, provided that the Company has transferred significantly all risks and rewards of ownership. Available-for-sale financial assets and financial assets at fair value through profit or loss are subsequently carried at fair value. Loans and receivables are carried at amortized cost using the effective interest method.
Gains or losses resulting from changes in the fair value of financial assets at fair value through profit or loss are presented in the income statement under “finance income” in the period in which they arise. Dividend income from financial assets at fair value through profit or loss is recognized in the income statement as part of other finance income when the Company’s right to receive the dividends has been established.
FS-19
Changes in the fair value of monetary securities denominated in a foreign currency and classified as available-for-sale are segregated into translation differences resulting from changes in the amortized cost of the security and other changes in the carrying amount of the security. Exchange differences on monetary securities are recognized in profit or loss, while exchange differences on non-monetary securities are recognized in shareholders' equity. Changes in the fair value of monetary and non-monetary securities classified as available-for-sale are recognized in other comprehensive income and are only recognized in profit or loss when the investment is sold or written off as a loss.
Interest on available-for-sale securities, calculated under the effective interest method, is recognized in the income statement as part of other income. Dividends from available-for-sale equity instruments, such as shares, are recognized in the income statement as part of other finance income when the Company’s right to receive payments has been established.
FS-18
The fair values of publicly quoted investments are based on current purchase prices. If the market for a financial asset (and for instruments not listed on a stock exchange) is not active, the Company establishes the fair value by using valuation techniques. These techniques include the use of recent transactions contracted with third parties, reference to other instruments that are substantially similar, analysis of discounted cash flows, and pricing models that make maximum use of market inputs and relies as little as possible on entity-specific inputs.
ii) Impairment of financial assets
The Company assesses atof the end of each reporting period whether there is objective evidence that a financial asset or a group of financial assets isimpaired. impaired.
· Assets measured at amortized cost
A financial asset or a group of financial assets is impaired and impairment losses are incurred only if there is objective evidence of impairment as a result of one or more events that occurred after the initial recognition of the asset (a “loss event”) and such loss event (or events) has an impact on the estimated future cash flows of the financial asset or group of financial assets that can be reliably estimated.
The criteria used by CSN to determine whether there is objective evidence of an impairment loss include:
· significant financial difficulty of the issuer or counterparty;
· a breach of contract, such as default or delinquency in interest or principal payments;
· the issue,issuer, for economic or legal reasons relating to the borrower’s financial difficulty, grants to the borrower a concession that the lender would not otherwise consider;
· it becoming probable that the borrower will enter bankruptcy or other financial reorganization;
· the disappearance of an active market for that financial asset because of financial difficulties; or
· observable data indicating that there is a measurable decrease in the estimated future cash flows from a portfolio of financial assets since the initial recognition of such assets, although the decrease cannot yet be identified with the individual financial assets in the portfolio, including:
- adverse changes in the payment status of borrowers in the portfolio;
- national or local economic conditions that correlate with defaults on the assets in the portfolio.
The amount of the loss is measured as the difference between the carrying amount of the assetassets and the present value of estimated future cash flows (excluding future credit losses that have not been incurred) discounted at the original effective interest rate of the financial asset. The carrying amount of the asset is reduced and the amount of the loss is recognized in the income statement. If a loan or held-to-maturity investment has a variable interest rate, the discount rate to measure an impairment loss is the current effective interest rate determined pursuant to thecontract. As a practical expedient, the Company may measure impairment on the basis of an instrument’s fair value using an observable market price.
FS-20
If, in a subsequent period, the amount of the impairment loss decreases and the decrease can be related objectively to an event occurring after the impairment was recognized (such as an improvement in the debtor’s credit rating), the previously recognized impairment loss is reversed and recognized in the consolidated income statement.
· Assets classified as available-for-sale
FS-19
In the case of equity securities classified as available-for-sale, a significant or prolonged decline in the fair value of an investment in an equity instrument below its cost is also objective evidence of impairment.Determining what is considered a “significant” or “prolonged” decline requires judgment. For this judgment we assess, among other factors, the historical changes in the equity prices, the duration and proportion in which the fair value of the investment is lower than its cost, and the financial health and short-term prospects of the business for the investee, including factors such as: industry and segment performance, changes in technology, and operating and financial cash flows.If there is any of this evidence of impairment of available-for-sale financial assets, the cumulative loss—measured as the difference between the acquisition cost and the current fair value, less any impairment loss on the financial asset previously recorded in profit or loss—is reclassified from shareholders' equity and recognized in the income statement. If,Impairment losses recognized in a subsequent period, the fair value of a debt instrument classifiedincome statement as available-for-sale increases and the increase can be objectively related to an event occurring after the impairment loss was recognized in profit or loss, the impairment loss isinstruments are not reversed through the income statement.
CSN tested for impairment its available-for-sale investment in Usiminas shares (see note 15)13).
iii) Financial liabilities
Financial liabilities are classified into the following categories: measured at fair value through profit or loss and other financial liabilities. Management determines the classification of its financial liabilities at the time of initial recognition.
· Financial liabilities measured at fair value through profit or loss
Financial liabilities at fair value through profit or loss are financial liabilities held for trading or designated as at fair value through profit or loss.
Derivatives are also classified as trading securities, and thereby are classified so, unless they have been designated as effective hedging instruments.
· Other financial liabilities
Other financial liabilities are measured at amortized cost using the effective interest method.
The Company holds the following non-derivative financial liabilities: borrowings, financing and debentures, and trade payables.
· Offsetting financial instruments
Financial assets and financial liabilities are offset and the net amount is reported in the balance sheet when there is a legally enforceable right to set off recognized amounts and the intention to either settle them on a net basis or to realize the asset and settle the liability simultaneously.
iv) Derivative instruments and hedging activities
· Derivatives measured at fair value through profit or loss
Certain derivative instruments do not qualify for hedge accounting. Changes in the fair value of any of these derivative instruments are immediately recognized in the income statement under “Other gains (losses), net”“Finance income” and “Finance costs”.Even though the Company uses derivatives for hedging purposes, it does not apply hedge accounting.
FS-21
· Foreign exchange gains or losses on foreign operations
Any gain or loss on the instrument related to the effective portion is recognized in equity. The gain or loss related to the ineffective portion is immediately recognized in the income statement under “Other gains (losses), net”.
Gains and losses accumulated in shareholders' equity are included in the income statement when the foreign operation is partially disposed of or sold.
FS-20
(w) Segment information
An operating segment is a component of the Group committed to the business activities from which it can obtain revenues and incur expenses, including revenues and expenses related to transactions with any other components of the Group. All the operating results of operating segments are reviewed regularly by the Executive Officers of CSN to make decisions regarding funds to be allocated to the segment and assessment of its performance, and for which there is distinct financial information available (see Note 27)26).
(x) Government grants
Government grants are not recognized until there is reasonable assurance that the Company will comply with the conditions attaching to them and that the grants will be received, when they will be recognized in profit or loss on a systematic basis over the periods in which the Company recognizes as expenses the related costs the grants are intended to compensate.
The Company has state tax incentives in the North and Northeast regions that are recognized in profit or loss as a reduction of the corresponding costs, expenses and taxes.
(y) New and revised pronouncements adopted for the first in the year beginning January 1, 2013
On January 1, 2013 the Company adopted for the first time certain standards and revised amendments that require the presentation of the adjusted comparative amounts. These include IFRS 10Consolidated Financial Statements, IFRS 11Joint Arrangements, andIFRS 12Disclosure of Interests in Other Entities. The amendments provide additional transition relief, limiting the requirement to provide adjusted comparative information to only the immediately preceding comparative period. The effective date of the amendments is annual periods beginning on or after January 1, 2013, which is aligned with the effective date of IFRS 10, IFRS 11 and IFRS 12. The Company applied transition relief as described above with respect to the adoption of those standards, providing adjusted comparative information to the immediately preceding period of January 1, 2012. As a result, the balances for the year ended December 31, 2012 and the beginning balance at January 1, 2012 are being restated. The financial information related to the year ended December 31, 2011 remain unchanged as such as the related notes that contain information for the year then ended December 31, 2011. Those notes are: 22 – Net sales revenue; 23 – Expenses by nature; 24 – Other operating income (expenses); 25 – Finance income (costs); 26 – Segment Information; 32 - Additional information to cash flows and 33 – Statement of comprehensive income.
The new and revised pronouncements that have had a material impact on the Company’s financial statements and, consequently, resulted in the restatement of the amounts, are described in Note 3.
Other new and revised pronouncements and interpretations adopted for the first time in 2013 include: IAS 1Presentation of Financial Statements; IAS 19Employee Benefits; IFRS 13Fair Value Measurement; IFRS 7Financial Instruments: Disclosures; IAS 27Consolidated and Separate Financial Statements; IAS 28Investments in Associates; and IFRIC 20Stripping Costs in the Production Phase of a Surface Mine. However, they did not have any material impacts on the Company’s financial statements.
(z)New standards and interpretations issued and not yet adopted
SeveralThe following standards, amendments to standards and IFRS interpretations issued by the IASB haveare not yet become effective and were not early adopted by the Company for the year ended December 31, 2011, as follows:2013:
FS-22
Standard | Description | Effective date |
Amendments
IAS 32 | Financial Instruments: Presentation, on the offsetting of assets and liabilities. Provides additional clarifications to the application guidance in IAS 32 on the requirement to offset financial assets and financial liabilities in the balance sheet. | January 1, 2014 |
Revised IFRS 10, IFRS12 and IAS27 | The amendments to IFRS10 define an investment entity and require a reporting entity that meets the definition of an investment entity not to consolidate its subsidiaries but instead to measure its subsidiaries at fair value through profit or loss in its consolidated and separate financial statements. The amendments to IFRS 712 and IAS 27 introduce new requirements to the disclosure of investment entities. | Disclosures – Transfers of Financial Assets
| JulyJanuary 1, 20112014
|
IFRIC 21 | Clarifies that an entity recognizes a liability for a tax when the activity that triggers payment occurs. For a levy that requires its payment to be triggered upon reaching a certain threshold, the interpretation indicates that no liability should be recognized before the specified minimum threshold is reached. | January 1, 2014 |
Revised IAS 39 | This revision provides relief on the discontinuance of hedge accounting when the novation of a derivative designated as hedging instrument meets certain criteria. | January 1, 2014 |
Amendment to IAS 36 | The amendment reduces the circumstances in which the recoverable amount of assets or cash-generating units is required to be disclosed. | January 1, 2014 |
IFRS 9 | Financial Instruments | January 1,. IFRS 9 retains but simplifies the mixed measurement model and establishes two primary measurement categories for financial assets: amortized cost and fair value. The basis for classification depends on the entity’s business model and the contractual cash flow characteristics of the financial asset. The IAS 39 guidance on the impairment of financial assets and on hedge accounting continues to apply. The amendment to IFRS 9 postpones the effective date from 2013
|
to 2015. It also eliminates the requirement for restatement of comparative information and requires additional disclosures on the transition to IFRS 10 | Consolidated Financial Statements
| January 1, 2013
|
IFRS 11
| Joint Arrangements
| January 1, 2013
|
IFRS 12
| Disclosure of Interests in Other Entities
| January 1, 2013
|
IFRS 13
| Fair Value Measurement
| January 1, 2013
|
Amendments to IAS 1
| Presentation of Items of Other Comprehensive Income
| July 1, 2012
|
Amendments to IAS 12
| Deferred Taxes - Recovery of Underlying Assets
| January 1, 2012
|
IAS 19 (revised in 2011)
| Employee Benefits
| January 1, 2013
|
IAS 27 (revised in 2011)
| Separate Financial Statements
| January 1, 2013
|
IAS 28 (revised in 2011)
| Investments in Associates and Joint Ventures
| January 1, 2013
|
IFRIC 20
| Stripping Costs in the Production Phase of a Surface Mine
| January 1, 2013
|
9. | | January 1, 2015 |
These standards, amendments and interpretations are effective for annual reporting periods beginning on or after 2012 and 2013 and were not used in preparing these financial statements. No material impact of these new Standards on the Group’s financial statements are expected, except for IFRS 9Financial Instruments, which can change the classification and measurement of the financial assets held by the Group, IFRIC 20Shipping Costs in the Production Phase of a Surface Mine, which can impact the accounting of waste stripping in non-current assets, and IFRS 10, IFRS 11 and IFRS 12, which can impact the entities currently consolidated and/or proportionately consolidated by the Group. The Company does not expect to early adopt this standard andthat these new standards will have a material impact on its impact has not yet been measured.
financial statements in 2014.
3. CHANGES IN ACCOUNTING POLICIES
The Company applied, beginning January 1, 2013, IFRS 10Consolidated Financial Statements,, which establishes principles for the presentation and preparation of consolidated financial statements when an entity controls one or more entities, and IFRS 11Joint Arrangements, which requires a new assessment of joint arrangements, focusing on the rights and obligations of the arrangement, instead of its legal form. IFRS 10 supersedes the consolidation requirements of SIC-12Consolidation of Special Purpose Entitiesand IAS 27Separate and Consolidated Financial Statements. IFRS 11 supersedes IAS 31Interests in Joint Venturesand SIC-13Joint Ventures - Non-Monetary Contributions by Venturers.
Accordingly, as the proportionate consolidation method for entities qualified as joint ventures is no longer allowed, the Company no longer consolidates its joint arrangements entities Nacional Minérios S.A., MRS Logística S.A., and CBSI - Companhia Brasileira de Serviços de Infraestrutura, and started to account for these investiments under theequity method. In addition to the application of IFRS 11, management adopts as accounting policy the elimination of the effect on profit or loss of transactions carried out with joint venture entities. As a result, part of the share of profits (losses) of jointly controlled entities was reclassified to finance costs, cost of sales and income tax and social contribution.
FS-23
table of contents
The Company also applied, beginning January 1, 2013, IFRS 12 –Disclosure of Interest in Other Entities, which requires disclosures of the nature of, and risks associated with, the Company's interests in other entities and the effects of those interests on its financial position, financial performance and cash flows.
For purposes of comparison, the balances as of December 31, 2012 and the opening balance as of January 1, 2012 have been adjusted taking into account said changes in accounting policy, and are being presented for comparative purposes in the notes to the financial statements, as shown below:
i.Balance sheet as of December 31, 2012
| | | | | | |
| | | | | | 12/31/2012 |
| | Published balance sheet | | Adoption of IFRS 10 and IFRS 11 | | Adjusted balance sheet |
| | | |
ASSETS | | | | | |
Current assets | | | | | |
Cash and cash equivalents | 14,444,875 | | -2,553,054 | | 11,891,821 |
Trade receivables | 1,794,566 | | 866,851 | | 2,661,417 |
Inventories | 3,580,025 | | -186,832 | | 3,393,193 |
Other current assets | 1,302,479 | | -150,324 | | 1,152,155 |
Total current assets | 21,121,945 | | -2,023,359 | | 19,098,586 |
| | | | | | |
Non-current assets | | | | | |
Long-term assets | | | | | |
Investments measured at fair value | 116,753 | | | | 116,753 |
Deferred income taxes | 2,372,501 | | -195,422 | | 2,177,079 |
Other non-current assets | 1,648,056 | | -20,917 | | 1,627,139 |
| 4,137,310 | | -216,339 | | 3,920,971 |
| | | | | | |
Investment | 2,351,774 | | 8,488,013 | | 10,839,787 |
Property, plant and equipment | 20,408,747 | | -1,889,683 | | 18,519,064 |
Intangible assets | 1,275,452 | | -370,591 | | 904,861 |
Total non-current assets | 28,173,283 | | 6,011,400 | | 34,184,683 |
| | | | | | |
TOTAL ASSETS | 49,295,228 | | 3,988,041 | | 53,283,269 |
| | | | | |
LIABILITIES AND SHAREHOLDERS' EQUITY | | | | | |
Current liabilities | | | | | |
Payroll and related taxes | 241,291 | | -56,328 | | 184,963 |
Trade payables | 1,957,789 | | 67,672 | | 2,025,461 |
Taxes payable | 336,348 | | -63,582 | | 272,766 |
Borrowings and financing | 2,295,409 | | -126,287 | | 2,169,122 |
Other payables | 1,221,350 | | 360,690 | | 1,582,040 |
Provision for tax, social security, labor, civil and environmental risks | 355,889 | | -39,342 | | 316,547 |
Total current liabilities | 6,408,076 | | 142,823 | | 6,550,899 |
| | | | | | |
Non-current liabilities | | | | | |
Borrowings and financing | 27,856,350 | | -720,768 | | 27,135,582 |
Other payables | 4,388,451 | | 4,620,598 | | 9,009,049 |
Deferred income taxes | 284,110 | | -45,869 | | 238,241 |
Provision for tax, social security, labor, civil and environmental risks | 371,697 | | | | 371,697 |
Pension and healthcare plan | 565,591 | | | | 565,591 |
Provision for environmental liabilities and decommissioning of assets | 413,440 | | -8,743 | | 404,697 |
Total non-current liabilities | 33,879,639 | | 3,845,218 | | 37,724,857 |
| | | | | | |
Shareholders’ equity | | | | | |
Issued capital | 4,540,000 | | | | 4,540,000 |
Reserves | 3,690,573 | | | | 3,690,573 |
Other comprehensive income | 386,324 | | | | 386,324 |
Non-controlling interests | 390,616 | | | | 390,616 |
Total shareholders' equity | 9,007,513 | | | | 9,007,513 |
| | | | | | |
TOTAL LIABILITIES AND SHAREHOLDERS' EQUITY | 49,295,228 | | 3,988,041 | | 53,283,269 |
FS-24
table of contents
ii.Statement of income for the year ended December 31, 2012
| | | | | | |
| | | | | | 12/31/2012 |
| | Published
balance sheet | | Adoption of
IFRS 10 and
IFRS 11 | | Adjusted balance
heet |
Net revenue from sales and/or services | 16,896,264 | | -1,667,675 | | 15,228,589 |
Cost of sales and/or services | -12,072,206 | | 813,539 | | -11,258,667 |
Gross profit | 4,824,058 | | -854,136 | | 3,969,922 |
Operating expenses/income | -4,182,361 | | 931,008 | | -3,251,353 |
Selling expenses | -931,525 | | 158,037 | | -773,488 |
General and administrative expenses | -576,514 | | 108,594 | | -467,920 |
Other operating income (expenses), net | -952 | | 642,388 | | 641,436 |
Share of profits (losses) of Subsidiaries | -2,673,370 | | 21,989 | | -2,651,381 |
Operating profit before finance income (costs) | 641,697 | | 76,872 | | 718,569 |
Finance income (costs), net | -1,992,405 | | -158,946 | | -2,151,351 |
Loss before income tax and social contribution | -1,350,708 | | -82,074 | | -1,432,782 |
Income tax and social contribution | 870,134 | | 82,074 | | 952,208 |
Loss for the year | -480,574 | | | | -480,574 |
Attributable to: | | | | | |
Companhia Siderúrgica Nacional | -420,113 | | | | -420,113 |
Non-controlling interests | -60,461 | | | | -60,461 |
FS-25
iii.Balance sheet as of January 1, 2012
| | | | | | |
| | | | | | 01/01/2012 |
| | Published
balance sheet | | Adoption of
IFRS 10 and
IFRS 11 | | Adjusted
balance sheet |
| | | |
ASSETS | | | | | |
Current assets | | | | | |
Cash and cash equivalents | 15,417,393 | | -1,976,703 | | 13,440,690 |
Trade receivables | 1,616,206 | | 530,456 | | 2,146,662 |
Inventories | 3,734,984 | | -216,077 | | 3,518,907 |
Other current assets | 1,175,723 | | -118,006 | | 1,057,717 |
Total current assets | 21,944,306 | | -1,780,330 | | 20,163,976 |
| | | | | | |
Non-current liabilities | | | | | |
Long-term assets | | | | | |
Short-term investments measured at fair value | 139,679 | | | | 139,679 |
Deferred income taxes | 1,840,773 | | -367,034 | | 1,473,739 |
Other non-current assets | 2,876,269 | | 54,574 | | 2,930,843 |
| | 4,856,721 | | -312,460 | | 4,544,261 |
| | | | | | |
Investment | 2,088,225 | | 7,929,231 | | 10,017,456 |
Property, plant and equipment | 17,377,076 | | -1,612,581 | | 15,764,495 |
Intangible assets | 603,374 | | -372,395 | | 230,979 |
Total non-current assets | 24,925,396 | | 5,631,795 | | 30,557,191 |
| | | | | | |
TOTAL ASSETS | 46,869,702 | | 3,851,465 | | 50,721,167 |
| | | | | | |
LIABILITIES AND SHAREHOLDERS' EQUITY | | | | | |
Current liabilities | | | | | |
Payroll and related taxes | 202,469 | | -37,527 | | 164,942 |
Trade payables | 1,232,075 | | -129,475 | | 1,102,600 |
Taxes payable | 325,132 | | -6,817 | | 318,315 |
Borrowings and financing | 2,702,083 | | -104,038 | | 2,598,045 |
Other payables | 1,728,445 | | 210,754 | | 1,939,199 |
Provision for tax, social security, labor, civil and environmental risks | 292,178 | | -33,264 | | 258,914 |
Other provisions | 14,565 | | -6,432 | | 8,133 |
Total current liabilities | 6,496,947 | | -106,799 | | 6,390,148 |
| | | | | | |
Non-current liabilities | | | | | |
Borrowings and financing | 25,186,505 | | -634,863 | | 24,551,642 |
Other payables | 5,593,520 | | 4,616,753 | | 10,210,273 |
Deferred income taxes | 37,851 | | -18,088 | | 19,763 |
Provision for tax, social security, labor, civil and environmental risks | 346,285 | | | | 346,285 |
Pension and healthcare plan | 469,050 | | | | 469,050 |
Provision for environmental liabilities and decommissioning of assets | 322,374 | | -5,538 | | 316,836 |
Total non-current liabilities | 31,955,585 | | 3,958,264 | | 35,913,849 |
| | | | | | |
Shareholders’ equity | | | | | |
Issued capital | 1,680,947 | | | | 1,680,947 |
Reserves | 7,671,650 | | | | 7,671,650 |
Other comprehensive income | -1,366,776 | | | | -1,366,776 |
Non-controlling interests | 431,349 | | | | 431,349 |
Total shareholders' equity | 8,417,170 | | | | 8,417,170 |
| | | | | | |
TOTAL LIABILITIES AND SHAREHOLDERS' EQUITY | 46,869,702 | | 3,851,465 | | 50,721,167 |
| | | | | |
FS-26
FS-21·Stahlwerk Thüringen GmbH (“SWT”) and Gallardo Sections
On July 12, 2011, CSN conducted,January 31, 2012, through its wholly-owned subsidiary “Prada”CSN Steel S.L., CSN completed the acquisition of all the shares (“Shares”) of the Spanish companies (a) Dankerena Guipúzcoa, S.L. (currently named CSN Steel Holdings 2, S.L.U.) and Grupo Alfonso Gallardo Thüringen, S.L.U. (currently named CSN Steel Holdings 1, S.L.U.), holding companies that together hold 100% of the capital of the German company Stahlwerk Thüringen GmbH (“SWT”), a capital increaseproducer of long steel located in Companhia Brasileira de LatasUnterwellenborn, Germany, specialized in the production of shapes and with installed capacity of 1.1 million metric tons of steel/year; and (b) Gallardo Sections S.L.U. (currently named CSN Steel Comercializadora, S.L.U.), a trader of SWT products, all previously held by Grupo Alfonso Gallardo, S.L.U. (“CBL”) through the capitalization of receivables. As a result, the Company became the holder of CBL’s control, with an equity interest equivalent to 59.17% of its voting capital, represented by 784,055,451 common shares (“Acquisition”AG Group”).
TheThis acquisition helps CSN to strengthen its role in the long steel segment, by strengthening its portfolio of CBL’s control will generate operating and administrative synergies that will result in a decrease in production costs, logistics costs, and administrative costs.world class assets.
As mentioned in Notenote 2(i), the acquisition method was used to account for identifiable assets acquired liabilities assumed, and non-controlling interests. Non-controlling interests in CBL equivalent to 40.83% were proportionately determined, based on the fair value of identifiable assets acquired and liabilities assumed. Some of the non-controlling shareholders are in the corporate structure of CSN’s parent group.
The purchase price of R$43,316301,192 (€131,790), including the final adjustment to the purchase price of R$1,943 (€850), was allocated between identified assets acquired and liabilities assumed, measured at fair value. In the asset and liabilitypurchase price identification process, werethe Company considered the intangible assets that were not recognized inadjustments presented below and the acquirees’ books.starting point was the transaction amount of R$1,104,648 (€483,350)
| | Amounts in R$ |
Transaction price | | 1,104,648 |
Net debt | | -857,031 |
Provisions | | -11,782 |
Tax credits | | 13,498 |
Working capital | | 51,859 |
(=) Purchase price | | 301,192 |
The transaction costs are represented by consulting services and lawyers’ fees totaling R$485,20.879, which have been allocated to profit or lossincluded in the income statement, in general and administrative expenses, as incurred.
The tables below show the allocation of identifiable assets acquired and liabilities assumed recognized at the acquisition date, the purchase price considered onin the acquisition of CBL’s control,SWT and Gallardo Sections, and the calculation of the resulting goodwill.
| | | | | | | |
| Assets acquired and liabilities assumed | | Carrying
amounts | | Adjustments to
fair value | | Total fair value |
| Current assets | | 62,182 | | (7,465) | | 54,717 |
| Non-current assets (*) | | 44,718 | | 89,449 | | 134,167 |
| Current liabilities | | (144,225) | | 10,522 | | (133,703) |
| Non-current liabilities (**) | | (567,469) | | 351,035 | | (216,434) |
| Total assets acquired and liabilities assumed | | (604,794) | | 443,541 | | (161,253) |
(*) Comprising mainly the fair value adjustment to property, plant and equipment amounting to R$90,572. Total fair value of property, plant and equipment was measured at R$123,518.
(**) Comprising mainly the fair value adjustment to receivables from CSN amountingto R$388,640.
The fair value adjustments made based on the corporate balance sheet to prepare the opening balance sheet were adjusted after the completion of the valuation report in December 2011.2012.
| | | Carrying
amounts | | Fair value
adjustments | | Total fair value |
Assets acquired | | | |
Current assets (*) | | 400,387 | | | | 400,387 |
Non-current assets (**) | | 191,956 | | 786,988 | | 978,944 |
Current liabilities | | -262,203 | | | | -262,203 |
Non-current liabilities (***) | | -842,526 | | -209,005 | | -1,051,531 |
Total assets acquired | | -512,386 | | 577,983 | | 65,597 |
(*) Includes R$14,880 of cash and cash equivalents.
(**) Comprising mainly the fair value adjustment to property, plant and equipment amounting to R$392,817. Total fair value of property, plant and equipment was measured at R$582,478.
(***) Refers to the deferred income tax on the fair value adjustments.
FS-27
Goodwill arising on acquisition | | |
Goodwill arising on acquisition
| |
|
(-(+) Book value of CBL Purchase price | | (604,794) 301,192 |
(+(-) Fair value adjustments to assets acquired and liabilities assumed | | 443,541 |
(=) Total fair value of assets acquired and liabilities assumed | | 65,597 |
(161,253)(=) Goodwill arising on acquisition (note 11)
|
| 235,595 |
Goodwill arising on the acquisition was mainly based on expected future earnings.
5.CASH AND CASH EQUIVALENTS
| | | |
| 12/31/2013 | | 12/31/2012 |
Current | | | |
Cash and cash equivalents | | | |
Cash and banks | 178,920 | | 205,056 |
| | | | |
Short-term investments | | | |
In Brazil: | | | |
Government securities | 48,206 | | 862,299 |
Private securities | 240,852 | | 540,688 |
| 289,058 | | 1,402,987 |
Abroad: | | | |
Time deposits | 9,527,694 | | 10,283,778 |
Total short-term investments | 9,816,752 | | 11,686,765 |
Cash and cash equivalents | 9,995,672 | | 11,891,821 |
The funds available in the Company and subsidiaries set up in Brazil are basically invested in investment funds, classified as exclusive, with repurchase agreements backed by government and private bonds with immediate liquidity.
Private securities are short-term investments in Bank Deposit Certificates (CDBs) with yields pegged to the Interbank Deposit Certificate (CDI) fluctuation, and government securities are basically repurchase agreements backed by National Treasury Notes series B (NTN-B) and Financial Treasury Bills (LFTs).The exclusive funds managed by BTG Pactual Serviços Financeiros S.A. DTVM and Caixa Econômica Federal and their assets collateralize possible losses on investments and transactions carried out. Investments in funds were consolidated.
In addition, a significant part of the funds of the Company and its foreign subsidiaries is invested in Time Deposits with leading banks, bearing fixed rates.
6.TRADE RECEIVABLES
| | | | |
| | 12/31/2013 | | 12/31/2012 |
Trade receivables | | | |
Third parties | | | |
Domestic market | 790,225 | | 776,442 |
Foreign market | 950,145 | | 754,159 |
Allowance for doubtful debts | -114,172 | | -111,532 |
| 1,626,198 | | 1,419,069 |
Related parties (Note 19 - b) | 107,443 | | 227,021 |
| 1,733,641 | | 1,646,090 |
| | | |
Other receivables | | | |
Dividends receivable (Note 19 - b) | 717,595 | | 955,869 |
Other receivables | 71,229 | | 59,458 |
| | 788,824 | | 1,015,327 |
| 2,522,465 | | 2,661,417 |
The breakdown of gross trade receivables from third parties is as follows:
FS-28
| | | | | |
| | | 12/31/2013 | | 12/31/2012 |
Falling due | | 1,339,481 | | 1,272,669 |
Overdue until 180 days | | 216,392 | | 113,793 |
Overdue above 180 days | | 184,497 | | 144,139 |
| | 1,740,370 | | 1,530,601 |
In order to meet the needs of some customers in the domestic market, related to the extension of the payment term for billing of steel, in common agreement with CSN’s internal commercial policy and maintenance of its very short-term receipts (up to 7 days), at the request of the customer, transactions are carried out for assignment of receivables without co-obligation negotiated between the customer and banks with common relationship, where CSN assigns the trade notes/bills that it issues to the banks with common relationship.
Due to the characteristics of the transactions for assignment of receivables without co-obligation, after assignment of the customer’s trade notes/bills and receipt of the funds from the closing of each transaction, CSN settles the trade receivables and becomes entirely free of the credit risk on the transaction. This transaction totals R$386,732 as of December 31, 2013 (R$224,718 as of December 31, 2012), less the trade receivables.
The changes in the Company’s allowance for doubtful debts are as follows:
| | | 12/31/2013 | | 12/31/2012 |
Opening balance | | -111,532 | | -124,939 |
Estimated losses | | -17,988 | | -11,073 |
Recovery of receivables | | 15,348 | | 24,480 |
Closing balance | | -114,172 | | -111,532 |
7.INVENTORIES
| | | | |
| | 12/31/2013 | | 12/31/2012 |
Finished products | 743,831 | | 980,375 |
Work in process | 650,311 | | 668,170 |
Raw materials | 714,365 | | 722,922 |
Storeroom supplies | 1,003,473 | | 1,018,625 |
Iron ore | 139,275 | | 74,340 |
Advances to suppliers | 11,915 | | 36,921 |
(-) Allowance for inventory losses | -102,185 | | -108,160 |
| | 3,160,985 | | 3,393,193 |
Changes in the allowance for inventory losses are as follows:
| | | 12/31/2013 | | 12/31/2012 |
Opening balance | | -108,160 | | -94,950 |
Allowance for/reversals of slow-moving inventories and obsolescence | | 5,975 | | -13,210 |
Closing balance | | -102,185 | | -108,160 |
Allowances for certain items considered obsolete or slow-moving were recognized.
As of December 31, 2013, the Company has long-term iron ore inventories amounting to R$144,483, classified in other non-current assets (R$144,483 as of December 31, 2012), as described in note 8.
FS-29
The group of other current and non-current assets is comprised as follows:
| | | | | | | | |
| | Current | Non-current |
| | 12/31/2013 | | 12/31/2012 | | 12/31/2013 | | 12/31/2012 |
Judicial deposits (Note 17) | | | | | 693,714 | | 718,026 |
Credits with the PGFN (*) | | | | | 88,921 | | 84,392 |
Recoverable taxes (**) | 480,495 | | 407,297 | | 112,788 | | 183,092 |
Prepaid expenses | 37,369 | | 38,767 | | 38,117 | | 42,893 |
Actuarial asset - related party (Note 19 b) | | | | | 97,051 | | 93,546 |
Derivative financial instruments (Note 13 I) | 9,681 | | 239,266 | | 3,879 | | |
Guarantee margin on financial instruments (Note 13 l) | | | 426,328 | | | | |
Securities held for trading (Note 13 I) | 9,906 | | | | | | |
Iron ore inventory (Note 7) | | | | | 144,483 | | 144,483 |
Northeast Investment Fund (FINOR) | | | | | 8,452 | | 8,452 |
Trade receivables | | | | | 9,970 | | 8,983 |
Loans with related parties (Note 19 b) | 147,273 | | 5,362 | | 603,862 | | 314,699 |
Other receivables from related parties (Note 19 b) | 15,658 | | 20,309 | | 18,129 | | 10,515 |
Other | 22,538 | | 14,826 | | 15,959 | | 18,058 |
| 722,920 | | 1,152,155 | | 1,835,325 | | 1,627,139 |
(*) Refers to the excess judicial deposit originated by the 2009 REFIS (Tax Debt Refinancing Program).
.
(**) Refers mainly to taxes on revenue (PIS/COFINS) and State VAT (ICMS) on the acquisition of fixed assets which will be recovered over a 48-month period, and income tax and social contribution for offset.
9.INVESTMENTS
The breakdown of investments is as follows:
| | 12/31/2013 | | 31/12/2012 |
Nacional Minérios S.A. | 8,346,387 | | 7,801,690 |
MRS Logística S.A. | 726,825 | | 685,586 |
CBSI - Companhia Brasileira de Serviços de Infraestrutura | 4,350 | | 1,888 |
Arvedi Metalfer do Brasil | 18,574 | | 12,977 |
Panatlântica | 24,819 | | 12,965 |
Usiminas | 2,380,355 | | 2,323,172 |
Transnordestina | 1,984,205 | | - |
Outros | 1,508 | | 1,509 |
| | 13,487,023 | | 10,839,787 |
a)Events in 2013
· Transnordestina Logística S.A. (“TLSA”)
On September 20, 2013, the Company signed (i) An Addendum to the Concession Agreement of the Northeast Railway System, which encompasses the stretches between the cities of São Luís to Mucuripe, Arrojado to Recife, Itabaiana to Cabedelo, Paula Cavalcante to Macau, and Propriá to Jorge Lins (“Railway System I”) and the stretchesbetween the cities of Missão Velha to Salgueiro, Salgueiro to Trindade, Trindade to Eliseu Martins, Salgueiro to Porto de Suape, and Missão Velha to Porto de Pecém (“Railway System II”), to include therein obligations assumed by TLSA related to the implementation of the Railway System II, as well as the adaptation of the sections that comprise it and (ii) Conduct Adjustment Agreement between ANTT and TLSA, with the purpose of resolving pending items existing between the parties.
FS-30
table of contents
On that date the following agreements were also signed (i) a new Shareholders' Agreement of TLSA between CSN, Valec Engenharia, Construções e Ferrovias S.A. (“Valec”), Fundo de Desenvolvimento do Nordeste – FDNE (“FDNE”) and BNDES Participações S.A. – BNDESPAR (“BNDESPAR”), with the intervenience of TLSA, whose effectiveness was conditioned to the disproportionate spin-off of TLSA, to be implemented under the terms of ANTT Resolution 4,042/2013; and (ii) Investment Agreement between CSN, Valec and FDNE, with the intervenience of TLSA, which besides other matters, deals with the new budget and the sources of funds that will have to be contributed to TLSA or financed for implementation of the Railway System II.
At the Extraordinary Shareholders' Meeting held on December 27, 2013, as part of the reorganization process described above, the shareholders approved the disproportionate spin-off of TLSA, completing the segregation of Railway System I and Railway System II.
This purpose of this restructuring was to rebalance economically and financially the Northeast Railway System concession, leading to the extension of the Railway System II operation concession, which could reach 2057, and the segregation of the assets related to Railway System I, which were merged into subsidiary FTL - Ferrovia Transnordestina Logística S.A. (“FTL”), with the maintenance of the assets related to Railway System II in TLSA.
As a result of the spin-off, CSN became the holder of an 88.41% stake in FTL and a 77.30% stake in TLSA.
With the completion of the spin-off, the new Shareholders’ Agreement became effective and control is now jointly held with the shareholders part of the public block, which became the holders of substantive rights to make certain material company decisions and influence the ordinary course of business, as well as CSN, by influencing budgeting, internal policies, capital expenditures, debt, etc., thus typifying the loss of control by CSN, pursuant to specific IFRS criteria.
Accordingly, as of December 31, 2013, in accordance with IFRS 10, CSN reversed all TLSA assets and liabilities and non-controlling interests and started to recognize the remaining stake in this investment at fair value on the date control was lost. After this initial recognition, the investment starts to be measured under the equity method.
The gain generated by the loss of control over the investment recognized in the income statement, in other operating income, is broken down as follows:
| |
|
| | 12/31/2013 |
(+) | Fair value of the remaining investment | 1,984,204 |
(-) | Carrying amount of net assets | 1,714,232 |
(+) | Carrying amount of non-controlling interests | 389,133 |
| Gain on loss of control over Transnordestina | 659,105 |
(-) | Capitalized interest written off | 185,206 |
| Gain on loss of control over Transnordestina (Note 24) | 473,899 |
| | | |
(-) | Income tax and social contribution | 161,126 |
| PurchaseGain on loss of control, net of income tax and social contribution
| 312,773 |
b)Changes in investments in joint ventures, associates, and other investments
| | 12/31/2013 | | 12/31/2012 |
Opening balance of investments | 10,839,787 | | 10,017,456 |
Opening balance of impairment loss allowance | | | |
Transnordestina Investment balance at 12.31.2012 | 1,452,074 | | |
Capital increase/acquisition of shares | 164,941 | | 165,792 |
Capital reduction | -153,305 | | |
Dividends | -85,998 | | -547,604 |
Comprehensive income(¹) | 73,213 | | 94,967 |
Share of profits of investees (²) | 542,711 | | 1,103,632 |
Gain on loss of control over Transnordestina | 659,106 | | |
Other | -5,506 | | 5,544 |
Closing balance of investments | 13,487,023 | | 10,839,787 |
FS-31
1.Refers to the mark-to-market of investments classified as available for sale and translation to the reporting currency of the foreign investments, the functional currency of which is not the Brazilian real.
2.Below is the reconciliation of the share of profit of jointly controlled entities with the share of profit of investees recognized in the balance sheet after the reclassifications:
| | 12/31/2013 | | 12/31/2012 |
Share of profit of jointly controlled entities | 542,711 | | 1,103,632 |
Reclassifications | | | |
To cost of sales | -137,418 | | -93,592 |
To finance costs | -624,096 | | -606,703 |
To taxes | 258,914 | | 238,099 |
Other | | | |
Elimination of Transnordestina’s profit | 120,102 | | |
Other | -2,075 | | |
Adjusted share of profit of investees | 158,138 | | 641,436 |
c)Investments in joint ventures and joint operations
The balances of the balance sheets and income statements of the companies under joint control are stated below:
FS-32
| |
12/31/2013 | |
12/31/2012 |
| | Nacional Minérios (*) | | Itá
Energética | | MRS
Logística | | CBSI | | CGPAR | | Transnordestina Logística | | Nacional Minérios (*) | | Itá
Energética | | MRS
Logística | | CBSI | | CGPAR |
Equity interest (%) | | 60.00% | | 48.75% | | 27.27% | | 50.00% | | 50.00% | | 77.30% | | 60.00% | | 48.75% | | 27.27% | | 50.00% | | 50.00% |
Balance sheet | | | | | | | | | | | | | | | | | | | | | | |
Current assets | | | | | | | | | | | | | | | | | | | | | | |
Cash and cash equivalents | | 4,815,211 | | 45,894 | | 471,079 | | 12,897 | | 28,582 | | 195,830 | | 4,081,425 | | 72,754 | | 331,515 | | 5,480 | | 25,245 |
Other current assets | | 1,135,192 | | 16,682 | | 630,121 | | 21,407 | | 33,055 | | 39,183 | | 1,572,995 | | 16,616 | | 600,407 | | 19,903 | | 17,431 |
Total current assets | | 5,950,403 | | 62,576 | | 1,101,200 | | 34,304 | | 61,637 | | 235,013 | | 5,654,420 | | 89,370 | | 931,922 | | 25,383 | | 42,676 |
Non-current assets | | | | | | | | | | | | | | | | | | | | | | |
Long-term assets | | 8,391,119 | | 34,029 | | 414,624 | | 4 | | 11 | | 229,280 | | 8,296,673 | | 39,771 | | 440,545 | | | | 246 |
Investments, PP&E and intangible assets | | 1,356,909 | | 603,268 | | 5,281,642 | | 6,872 | | 45,405 | | 5,080,841 | | 1,216,907 | | 640,850 | | 4,906,609 | | 3,887 | | 32,276 |
Total non-current assets | | 9,748,028 | | 637,297 | | 5,696,266 | | 6,876 | | 45,416 | | 5,310,121 | | 9,513,580 | | 680,621 | | 5,347,154 | | 3,887 | | 32,522 |
Total assets | | 15,698,431 | | 699,873 | | 6,797,466 | | 41,180 | | 107,053 | | 5,545,134 | | 15,168,000 | | 769,991 | | 6,279,076 | | 29,270 | | 75,198 |
| | | | | | | | | | | | | | | | | | | | | | |
Current liabilities | | | | | | | | | | | | | | | | | | | | | | |
Borrowings and financing | | 42,247 | | | | 333,796 | | | | 20,053 | | 97,681 | | 1,588 | | 41,957 | | 380,656 | | | | 13,883 |
Other current liabilities | | 1,318,884 | | 35,174 | | 841,681 | | 22,437 | | 36,733 | | 51,901 | | 1,887,841 | | 45,701 | | 829,185 | | 16,131 | | 44,641 |
Total current liabilities | | 1,361,131 | | 35,174 | | 1,175,477 | | 22,437 | | 56,786 | | 149,582 | | 1,889,429 | | 87,658 | | 1,209,841 | | 16,131 | | 58,524 |
Non-current liabilities | | | | | | | | | | | | | | | | | | | | | | |
Borrowings and financing | | 339,961 | | | | 2,566,412 | | | | 21,664 | | 3,479,420 | | 335,806 | | | | 2,253,721 | | | | 14,814 |
Other non-current liabilities | | 86,694 | | 1,870 | | 390,228 | | 10,050 | | 18,956 | | 201,900 | | 19,595 | | 5,812 | | 301,393 | | 9,364 | | |
Total non-current liabilities | | 426,655 | | 1,870 | | 2,956,640 | | 10,050 | | 40,620 | | 3,681,320 | | 355,401 | | 5,812 | | 2,555,114 | | 9,364 | | 14,814 |
Shareholders’ equity | | 13,910,645 | | 662,829 | | 2,665,349 | | 8,693 | | 9,647 | | 1,714,232 | | 12,923,170 | | 676,521 | | 2,514,121 | | 3,775 | | 1,860 |
Total liabilities and shareholders’ equity | 15,698,431 | | 699,873 | | 6,797,466 | | 41,180 | | 107,053 | | 5,545,134 | | 15,168,000 | | 769,991 | | 6,279,076 | | 29,270 | | 75,198 |
| | | | | | | | | | | | | | | | | | | | | | |
| |
12/31/2013 | |
12/31/2012 |
| | Nacional Minérios (*) | | Itá Energética | | MRS Logística | | CBSI | | CGPAR | | Transnordestina Logística | | Nacional Minérios (*) | | Itá Energética | | MRS Logística | | CBSI | | CGPAR |
Equity interest (%) | | 60.00% | | 48.75% | | 27.27% | | 50.00% | | 50.00% | | 77.30% | | 60.00% | | 48.75% | | 27.27% | | 50.00% | | 50.00% |
Statements of Income | | | | | | | | | | | | | | | | | | | | | | |
Net revenue | | 2,369,836 | | 153,105 | | 3,038,142 | | 109,650 | | 178,762 | | 58,465 | | 3,836,415 | | 217,493 | | 3,013,158 | | 61,915 | | 14,060 |
Cost of sales and services | | -1,346,658 | | -79,745 | | -1,926,923 | | -96,502 | | -148,998 | | -60,840 | | -2,730,077 | | -66,162 | | -1,993,927 | | -58,245 | | -8,780 |
Gross profit | | 1,023,178 | | 73,360 | | 1,111,219 | | 13,148 | | 29,764 | | -2,375 | | 1,106,338 | | 151,331 | | 1,019,231 | | 3,670 | | 5,280 |
Operating (expenses) income | | -113,212 | | -44,154 | | -277,814 | | -6,399 | | -1,402 | | -315,776 | | -412,091 | | -48,688 | | -262,777 | | -3,807 | | -16 |
Finance income (costs), net | | 1,621,386 | | 1,266 | | -114,637 | | 751 | | 306 | | -18,843 | | 1,329,707 | | -1,745 | | -82,417 | | 174 | | 29 |
Income before income tax and social contribution | 2,531,352 | | 30,472 | | 718,768 | | 7,500 | | 28,668 | | -336,994 | | 2,023,954 | | 100,898 | | 674,037 | | 37 | | 5,293 |
Current and deferred income tax and social contribution | -1,543,876 | | -10,263 | | -245,748 | | -2,584 | | -9,614 | | 178,937 | | -407,469 | | -33,962 | | -227,497 | | -10 | | -1,794 |
Profit for the year | | 987,476 | | 20,209 | | 473,020 | | 4,916 | | 19,054 | | -158,057 | | 1,616,485 | | 66,936 | | 446,540 | | 27 | | 3,499 |
| | | | | | | | | | | | | | | | | | | | | | | |
(*) Refer to the consolidated balances and profit or loss of Nacional Minérios S. A.
The balance sheet and income statement amounts refer to 100% of the companies’ results.
·NACIONAL MINÉRIOS S.A. - (“Namisa”)
Headquartered in Congonhas, State of Minas Gerais, this company is primarily engaged in the production, purchase and sale of iron ore and is mainly focused on foreign markets for the sale of its products. Its major operations are carried out in the cities of Congonhas, Ouro Preto, Itabirito and Rio Acima, in the State of Minas Gerais, and in Itaguaí, in the State of Rio de Janeiro.
In November 2008, 40% of Namisa’s capital became held by Big Jump Energy Participações S.A (“Big Jump”), whose shareholders were Posco and Brazil Japan Iron Ore Corp, (“BJIOC” or “Consortium”), a consortium of Asian companies formed by Itochu Corporation, Nippon Steel, JFE Steel Corporation, Sumitomo Metal Industries Ltd., Kobe Steel Ltd., and Nisshin Steel Co. Ltd.. As a result, CSN became the holder of 60% of Namisa´s capital.
On July 30, 2009, Big Jump Energy Participações S.A. was merged into Namisa and, as a result, Posco and BJIOC became the holders of a direct interest in Namisa. In 2011, Nippon Steel and Sumitomo Metal Industries Ltd., until then members of the Consortium, sold their interests to the other members of the Consortium, followed by the entry of a new shareholder, China Steel Corp. (“CSC”). After these transactions, the new corporate structure of Namisa is as follows: CSN 60%, BJIOC 32.52%, Posco 6.48%, and CSC 1%. CSN’s interests in Namisa did not change as a result of any of these events.
Under IFRS 10, paragraph B55, when assessing whether an investor has control of an investee, the investor shall determine whether it is exposed to, or has rights over, the variable returns arising from its relationship with the investee. The Shareholders’ Agreement entered into between the Consortium and CSN grants both the Consortium and CSN, through substantive rights, the power to influence the ordinary course of Namisa’s business, by beingactively involved in setting its budget, accounting policies, capital expenditures, management compensation, dividend distribution policy, among other matters.
FS-33
table of contents
The Shareholders’ Agreement also provides that certain situations of extreme impasse between the shareholders that are not resolved after mediation and negotiation procedures between the executive officers of the parties may give CSN the right to exercise a call option and the Consortium the right to exercise a put option regarding the equity interest held by the Consortium in Namisa.
Other agreements executed to make such association feasible, among them the share purchase agreement and the long-term operational agreements between Namisa, CSN and the Consortium, provide for certain obligations that, in case breached or not cured within the relevant cure period may give rise, in certain specifc situations, to the right of non-breached party to exercise a put or call option, as the case may be, with respect to the equity interest held by the Consortium in Namisa.
The material change in Namisa’s profit for this quarter is mainly due to its adherence to the tax installment programs introduced by Laws No.12,865/13 and 11,941/09, which generated a net negative impact on the joint venture entity amounting to R$889,772, which is reflected in the consolidated, through equity accounting, in the amount of R$533,863 corresponding to its 60% equity interest.
Namisa´s bylaws provide the payment of minimum dividends equivalent to 50% of the profit for the year. However, on March 28, 2014, the shareholders meeting approved, among other matters, the following measures in the Ordinary General Shareholder´s Meeting of Namisa: (i) allocation of profits for the years ended December 31, 2013 and 2012 as Earnings Reserves; and (ii) no dividends are declared for 2013 fiscal year.
·ITÁ ENERGÉTICA S.A. - (“ITASA”)
ITASA is a corporation originally created to carry out the construction of the Itá hydroelectric power plant: contracting for the supply of goods and services necessary to carry out the project and raising funds, including posting the corresponding guarantees.
CSN holds 48.75% of ITASA’s share capital.
·MRS LOGÍSTICA S.A. (“MRS”)
This subsidiary, located in Rio de Janeiro, RJ, is engaged in providing public railroad freight transportation services, on the basis of an onerous concession agreement, on the tracks of the Southeast Railway System, - located between the cities of Rio de Janeiro, São Paulo and Belo Horizonte, previously belonging to Rede Ferroviária Federal S.A.- RFFSA, which was privatized on September 20, 1996.
As of December 31, 2013 the Company directly held 27.27% and indirectly, through its jointly controlled entity Nacional Minérios S.A. (Namisa), 6% of MRS’s capital.
MRS can also engage in modal transportation services related to railroad transportation and also participate in projects aimed at expanding the railroad services granted on a concession basis.
For provision of the services covered by the concession agreement obtained for a period of 30 years starting on December 1, 1996, extendable for an equal period by exclusive decision of the concession grantor, MRS leased from RFFSA for the same concession period the assets required for operation and maintenance of the railroad freight transportation activities. Upon extinction of the concession, all leased assets will be transferred to the ownership of the railroad transportation operator designated in that same act.
·CONSÓRCIO DA USINA HIDRELÉTRICA DE IGARAPAVA
FS-34
Igarapava Hydroelectric Power Plant is located in Rio Grande, in the city of Conquista, MG, with installed capacity of 210 MW. It consists of 5 bulb type generating units and is considered a major mark for power generation in Brazil.
CSN holds 17.92% of investment in the consortium, whose specific purpose is the distribution of electric power, which is made according to the percentage equity interest of each company.
The balance of property, plant and equipment less depreciation as of December 31, 2013 is R$29,417 (R$30,584 as of December 31, 2012) and the amount of the expense in 2013 is R$6,024 (R$6,620 in 2012).
·CBSI - COMPANHIA BRASILEIRA DE SERVIÇOS DE INFRAESTRUTURA (“CBSI”)
CSN holds 50% of CBSI's share capital. The investment is the result of a joint venture between CSN and CKLS Serviços Ltda. Based in the city of Araucária, PR, CBSI is primarily engaged in providing services to subsidiaries, associates, controlling companies and third-party entities, and can operate activities related to the refurbishment and maintenance of industrial machinery and equipment, construction maintenance, industrial cleaning, logistic preparation of products, among other activities.
·CGPAR CONSTRUÇÃO PESADA S.A. (“CGPAR”)
CSN holds 50% of CGPAR's share capital. The investment is the result of a joint venture between CSN and GPA Construção Pesada e Mineração Ltda. Based in the city of Belo Horizonte, MG, CGPAR is mainly engaged in providing services related to the support to the extraction of iron ore, earth leveling, earthmoving, and dam construction.
·TRANSNORDESTINA LOGÍSTICA S.A. (“TLSA”)
It is primarily engaged in the operation and development of the railroad freight transportation public service in the Brazil’s Northeastern railway system, which encompasses the stretches between Missão Velha to Salgueiro, Salgueiro to Trindade, Trindade to Eliseu Martins, Salgueiro to Porto de Suape, and Missão Velha to Porto de Pecém (“Railway System II”).
As of December 31, 2013 CSN held 77.30% of Transnordestina Logística’s share capital.
d)Other investments
·Usinas Siderúrgicas de Minas Gerais S.A. – USIMINAS (“Usiminas”)
Usiminas, headquartered in Belo Horizonte, State of Minas Gerais, is engaged in steel and related operations. Usiminas produces flat rolled steel in the Intendente Câmara and José Bonifácio de Andrada e Silva plants, located in Ipatinga, Minas Gerais, and Cubatão, São Paulo, respectively, to be sold in the domestic market and also for exports. It also exploits iron ore mines located in Itaúna, Minas Gerais, to meet its verticalization and production cost optimization strategies. Usiminas also has service and distribution centers located in several regions of Brazil, and the Cubatão, São Paulo, and Praia Mole, Espírito Santo, ports, as well as in locations strategic for the shipment of its production.
As of December 31, 2012 and 2013, the Company reached holdings of 14.13% in common shares and 20.69% in preferred shares of Usiminas' share capital.
Usiminas is listed on the São Paulo Stock Exchange (“BM&F BOVESPA”: USIM3 and USIM5).
·PANATLÂNTICA S. A. (“Panatlântica”)
Publicly-held company, headquartered in the city of Gravataí, State of Rio Grande do Sul, engaged in the manufacturing, trade, import, export and processing of steel and ferrous or non-ferrous metals, coated or not. This investment is carried at fair value.
FS-35
CSN currently holds 9.41% (9.40% as of December 31, 2012) of Panatlântica’s total share capital.
·ARVEDI METALFER DO BRASIL S.A. (“Arvedi”)
On July 31, 2012, the Company acquired a non-controlling interest corresponding to 20% of the capital of Arvedi, company in preoperating stage focused on the production of pipes, headquartered in Salto, State of São Paulo.
10.PROPERTY, PLANT AND EQUIPMENT
| Consolidated |
| Land | | Buildings | | Machinery,
equipment
and
facilities | | Furniture
and
fixtures | | Construction
in progress | | Other (*) | | Total |
Balance at January 1, 2012 | | | | | | | | | | | | | |
Cost | 155,180 | | 1,668,999 | | 9,987,105 | | 136,003 | | 6,633,330 | | 932,006 | | 19,512,623 |
Accumulated depreciation | | | -239,796 | | -3,106,905 | | -104,796 | | | | -296,631 | | -3,748,128 |
Balance at January 1, 2012 | 155,180 | | 1,429,203 | | 6,880,200 | | 31,207 | | 6,633,330 | | 635,375 | | 15,764,495 |
Effect of foreign exchange differences | 5,656 | | 22,322 | | 246,204 | | 377 | | 471 | | -148,268 | | 126,762 |
Acquisition through business combination | 22,852 | | 103,739 | | 419,787 | | 1,202 | | 1,079 | | 33,819 | | 582,478 |
Acquisitions | 2,726 | | 20,871 | | 573,286 | | 7,199 | | 2,117,354 | | 15,016 | | 2,736,452 |
Capitalized interest (Notes 25 and 32) | | | | | | | | | 401,827 | | | | 401,827 |
Write-offs | -1,375 | | -255 | | -7,091 | | -48 | | -769 | | -221 | | -9,759 |
Depreciation | | | -61,524 | | -990,309 | | -6,007 | | | | -37,188 | | -1,095,028 |
Estimated losses on disposal of assets | | | | | | | | | | | -6,676 | | -6,676 |
Transfers to other asset categories | | | 13,876 | | 168,777 | | 332 | | -20,634 | | -162,351 | | |
Transfers to intangible assets | | | | | | | | | -3,074 | | -787 | | -3,861 |
Other | | | | | -73,876 | | | | 62,785 | | 33,465 | | 22,374 |
Balance at December 31, 2012 | 185,039 | | 1,528,232 | | 7,216,978 | | 34,262 | | 9,192,369 | | 362,184 | | 18,519,064 |
Cost | 185,039 | | 1,828,492 | | 11,358,581 | | 145,255 | | 9,192,369 | | 683,889 | | 23,393,625 |
Accumulated depreciation | | | -300,260 | | -4,141,603 | | -110,993 | | | | -321,705 | | -4,874,561 |
Balance at December 31, 2012 | 185,039 | | 1,528,232 | | 7,216,978 | | 34,262 | | 9,192,369 | | 362,184 | | 18,519,064 |
Effect of foreign exchange differences | 8,487 | | 28,882 | | 120,361 | | 488 | | 1,440 | | 1,905 | | 161,563 |
Acquisitions | 69 | | 1,555 | | 320,845 | | 3,562 | | 2,152,462 | | 11,076 | | 2,489,569 |
Capitalized interest (Notes 25 and 32) | | | | | | | | | 490,747 | | | | 490,747 |
Write-offs | -15 | | -71 | | -9,316 | | -12 | | -21,423 | | -823 | | -31,660 |
Depreciation | | | -60,122 | | -1,015,895 | | -5,867 | | | | -35,488 | | -1,117,372 |
Estimated losses on disposal of assets | | | | | | | | | | | -4,670 | | -4,670 |
Transfers to other asset categories | 19,721 | | 328,043 | | 1,311,628 | | 1,694 | | -1,841,181 | | 180,095 | | |
Transfers to intangible assets | | | | | | | | | -74,958 | | | | -74,958 |
Loss of control over Transnordestina | | | | | -963 | | | | -5,021,863 | | -6 | | -5,022,832 |
Capitalized interest written off (Note 9.b) | | | | | | | | | -185,206 | | | | -185,206 |
Impairment in jointly controlled entity Transnordestina (**) | | | | | | | | | | -279,296 | | -279,296 |
Other | | | | | -160,805 | | | | 79,248 | | 48,034 | | -33,523 |
Balance at December 31, 2013 | 213,301 | | 1,826,519 | | 7,782,833 | | 34,127 | | 4,771,635 | | 283,011 | | 14,911,426 |
Cost | 213,301 | | 2,196,994 | | 12,968,200 | | 151,479 | | 4,771,635 | | 627,845 | | 20,929,454 |
Accumulated depreciation | | | -370,475 | | -5,185,367 | | -117,352 | | | | -344,834 | | -6,018,028 |
Balance at December 31, 2013 | 213,301 | | 1,826,519 | | 7,782,833 | | 34,127 | | 4,771,635 | | 283,011 | | 14,911,426 |
(*) It refers basically to railway assets, such as yards, tracks and railway sleepers. Also comprises leasehold improvements, vehicles, hardware, mines and ore bodies and replacement storeroom supplies.
(**)The disproportionate spin-off of Transnordestina Logística S.A. (“TLSA”) resulted in the execution of an Addendum to the Concession Agreement of the Northeast Railway System and the merger of Railway System I’s assets and liabilities into FTL – Ferrovia Transnordestina Logística S.A. (in operation), with the maintenance of Railway System II’s assets and liabilities (New Transnordestina project) in TLSA. As a result, TLSA assessed the future performance of its operating assets related to Railway System I (in operation). The analysis resulted in the recognition of an impairment loss of R$279,296, recognized in line item “Other operating expenses” in subsidiary and consolidated of R$216,446, as described in Note 24. The recoverable amount of these assets was determined based on the value in use. The discount rate used to measure the value in use was 9.15% per year.
The breakdown of the projects comprising construction in progress is as follows:
FS-36
| Project description | Start date | Completion date | | 12/31/2013 | 12/31/2012 |
Logistics | | | | | | |
| | Expansion of Transnordestina railroad by 1,728 km to boost the transportation of varied products as iron ore, limestone, soybeans, cotton, sugarcane, fertilizers, oil and fuels. | 2009 | 2016 | (*) | | 3,925,720 |
| | Equalization of Berth 301. | 2012 | 2014 | | 151,932 | 27,554 |
| | Current investments for maintenance of current operations. | | | | 231,832 | 726,416 |
| | | | | | 383,764 | 4,679,690 |
Mining | | | | | | |
| | Expansion of Casa de Pedra Mine capacity production. | 2007 | 2015/2016 | (1) | 1,090,568 | 1,329,565 |
| | Expansion of TECAR’s export capacity. | 2009 | 2014/2016 | (2) | 404,374 | 695,859 |
| | Current investments for maintenance of current operations. | | | | 42,866 | 332,638 |
| | | | | | 1,537,808 | 2,358,062 |
Steel | | | | | | |
| | Construction of a long steel plant to produce rebar and machine wire. | 2008 | 2014 | (3) | 1,592,016 | 1,460,694 |
| | Implementation of the AF#3’s gas pressure recovery. | 2006 | 2014 | | 74,337 | 60,750 |
| | Current investments for maintenance of current operations. | | | | 679,495 | 356,105 |
| | | | | | 2,345,848 | 1,877,549 |
Cement | | | | | | |
| | Construction of cement plants. | 2011 | 2015 | | 476,076 | 241,412 |
| | Current investments for maintenance of current operations. | | | | 28,139 | 35,656 |
| | | | | | 504,215 | 277,068 |
Total construction in progress | | | 4,771,635 | 9,192,369 |
| | | | | | | |
(*) As a result of the loss of control, the subsidiary Transnordestina was deconsolidated at December 31, 2013. (See Note 9 b.)
(1) Expected date for completion of the 40 Mtpa and 42 Mtpa stages
(2) Expected date for completion of the 45 Mtpa and 60 Mtpa stages
(3) Started in January 2014.
The costs classified in construction in progress comprise basically the acquisition of services, purchase of parts to be used as investments for improvement of performance, upgrading of technology, enlargement, expansion and acquisition of assets that will be transferred to the relevant line items and depreciated as from the time they are available for use.
The costs incurred to refurbish and replace property, plant and equipment items totaled R$151,517 as of December 31, 2013 (R$273,339 as of December 31, 2012), which were capitalized and will be depreciated over the period until the next maintenance event.
Other repair and maintenance expenses are charged to operating costs and expenses when incurred.
In view of the need to review the useful lives at least every financial year, in 2013 management performed the review for all the Company’s units. As a result, the estimated useful lives for the current year are as follows:
|
|
Buildings | 43 |
Machinery, equipment and facilities | 14 |
Furniture and fixtures | 11 |
Other | 26 |
a)As of December 31, 2013, the Company capitalized borrowing costs amounting to R$490,747 (R$401,827 as of December 31, 2012). These costs are basically estimated for the mining and long steel projects, mainly relating to:(i)
FS-37
table of contents
Casa de Pedra expansion (ii); construction of the long steel mill in the city ofVolta Redonda (RJ), see notes 25 and 32.
The rates used to capitalize borrowing costs are as follows:
| | | | | |
Rates | | 12/31/2013 | | 12/31/2012 |
Specific projects | | TJLP + 1.3% to 3.2% | | TJLP + 1.3% to 3.2% |
| UM006 + 2.7% | | UM006 + 2.7% |
Unspecified projects | | 8.35% | | 8.47% |
b)Additions to depreciation, amortization and depletion for the year were distributed as follows:
| | 12/31/2013 | | 12/31/2012 | | 12/31/2011 |
Production cost | 1,068,156 | | 1,062,950 | | 892,297 |
Selling expenses | 8,248 | | 8,041 | | 7,130 |
General and administrative expenses | 17,426 | | 14,742 | | 29,941 |
| | 1,093,830 | | 1,085,733 | | 929,368 |
Other operating expenses (*) | 61,763 | | 14,739 | | 18,883 |
| | 1,155,593 | | 1,100,472 | | 948,251 |
(*) Refers to the depreciation of unused equipment (see note 24).
c)The Casa de Pedra mine is an asset that belongs to CSN, which has the exclusive right to explore such mine. Our mining activities of Casa de Pedra are based on the ‘Mine Manifest’, which grants CSN full ownership over the mineral deposits existing within our property limits.
As of December 31, 2013 the net property, plant and equipment of Casa de Pedra was R$3,277,205 (R$2,892,120 as of December 31, 2012), represented mainly by construction in progress amounting to R$1,090,642 (R$1,612,000 as of December 31, 2012).
11.INTANGIBLE ASSETS
| | Goodwill | Customer relations | Software | Other | Total |
Balance at January 1, 2012 | | | | | |
Cost | 431,173 | | 36,253 | 941 | 468,367 |
Accumulated amortization | -150,004 | | -26,523 | | -176,527 |
Adjustment for accumulated recoverable value | -60,861 | | | | -60,861 |
Balance at January 1, 2012 | 220,308 | | 9,730 | 941 | 230,979 |
Effect of foreign exchange differences | | 30,501 | 104 | 14,043 | 44,648 |
Acquisitions through business combination (*) | 235,595 | 316,939 | | 77,232 | 629,766 |
Acquisitions and expenditures | | | 916 | 472 | 1,388 |
Disposals | | | | -564 | -564 |
Transfer of property, plant and equipment | | | 3,861 | | 3,861 |
Amortization | | | -5,442 | | -5,442 |
Other movements | | | 225 | | 225 |
Balance at December 31, 2012 | 455,903 | 347,440 | 9,394 | 92,124 | 904,861 |
Cost | 666,768 | 347,440 | 41,849 | 92,124 | 1,148,181 |
Accumulated amortization | -150,004 | | -32,455 | | -182,459 |
Adjustment for accumulated recoverable value | -60,861 | | | | -60,861 |
Balance at December 31, 2012 | 455,903 | 347,440 | 9,394 | 92,124 | 904,861 |
Effect of foreign exchange differences | | 64,570 | 148 | 18,127 | 82,845 |
Acquisitions and expenditures | | | 635 | | 635 |
Disposals | | | -1 | -820 | -821 |
Impairment loss | -48,469 | | | | -48,469 |
Transfer of property, plant and equipment | | | 74,958 | | 74,958 |
Loss of control over Transnordestina | | | -10,128 | | -10,128 |
Amortization | | -30,530 | -7,691 | | -38,221 |
Other movements | | | 39 | -259 | -220 |
Balance at December 31, 2013 | 407,434 | 381,480 | 67,354 | 109,172 | 965,440 |
Cost | 666,768 | 415,899 | 107,416 | 109,172 | 1,299,255 |
Accumulated amortization | -150,004 | -34,419 | -40,062 | | -224,485 |
Adjustment for accumulated recoverable value | -109,330 | | | | -109,330 |
Balance at December 31, 2013 | 407,434 | 381,480 | 67,354 | 109,172 | 965,440 |
FS-38
(*) Goodwill based on expected future earnings, arising on the business combination of CSN Steel S. L. with the companies Stahlwerk Thüringen Gmbh (SWT) and Gallardo Sections on January 31, 2012 (see note 4).
The useful life of software is 01 to 05 years and of other intangible assets is 13 to 30 years.
Goodwill: The economic basis of goodwill is the expected future earnings and, in accordance with the new pronouncements, these amounts are not amortized since January 1, 2009, when they became subject only to impairment testing.
·Impairment testing for goodwill
In order to conduct impairment testing, goodwill is allocated to CSN’s operating divisions that represent the lowest level of assets or group of assets at which goodwill is monitored by the Company's senior management, never above Operating Segments.
Cash generating unit | | Segment | | 12/31/2013 | | 12/31/2012 | | Investor |
Packaging (*) | | Steel | | 158,748 | | 207,217 | | CSN |
Flat steel | | Steel | | 13,091 | | 13,091 | | CSN |
Long steel | | Steel | | 235,595 | | 235,595 | | CSN Steel S.L. |
| | | | 407,434 | | 455,903 | | |
(*) Goodwill of the cash-generating unit (CGU) Steel Containers is presented net of an impairment loss recorded in 2011 in the line item of other operating income and expenses in the income statement for the year, amounting to R$60,861. During the 4th quarter of 2013, the Company identified again an impairment of goodwill of the CGU Steel Containers and recorded the amount of R$48,469.
The recoverable amount of a Cash-Generating Unit (“CGU”) is determined based on value-in-use calculations.
These calculations use cash flow projections, before income tax and social contribution, based on financial budgets approved by management for a three-year period. The amounts related to cash flows subsequent to the three-year period were extrapolated based on the estimated growth rates shown below. The growth rate does not exceed the average long-term growth rate of the industry in which the Cash-Generating Unit (“CGU”) operates.
The main assumptions used in calculating the values in use as of December 31, 2013 are as follows:
|
| Packaging |
| Flat steel |
| Long steel |
Gross margin (i) | | Average Gross Margin based on the history and the budget projections for the next 2 years; beginning in the third year, average price, consideredoperating cost and expense projections, simulated based on an industrial activity centralization and plant modernization scenario, also taking into account other revenues from sale of assets. | | Average Gross Margin based on the history and projections approved by the Board for the next three years, and long-term price and foreign exchange curves obtained in industry reports. | | Based on the projections approved by the Board for the next three years, long-term price and foreign exchange curves, and taking into consideration the production volume ramp up after plant start-up. |
Cost adjustment | | Operating costs based on the history and the budget projections for the next two years; beginning in the third year, operating cost projections incorporating the simulated benefits based on an industrial activity centralization and plant modernization scenario. | | Cost adjustment based on historical data and price and foreign exchange curves obtained in industry reports. | | Cost adjustment based on historical data and price and foreign exchange curves obtained in industry reports. |
Growth rate (ii) | | Sales volume growth projection prepared based on the sales department’s forecast for the main market segments, and also taking into account the simulation of new production capacity based on an industrial activity centralization and plant modernization scenario. | | Average growth rate of 2.0% p.a. used to extrapolate the cash flows after the budgeted period. | | Average growth rate of 2.0% p.a. used to extrapolate the cash flows after the budgeted period. |
Discount rate (iii) | | Effective discount rate of 8.2% p.a., before income tax and social contribution. | | Effective discount rate of 8.2% p.a., before income tax and social contribution. | | Effective discount rate of 8.2% p.a., before income tax and social contribution. |
(i) Budgeted gross margin.
(ii) Weighted average growth rate, used to extrapolate the cash flows after the budgeted period.
(iii) Pretax discount rate, applied to cash flow projections.
FS-39
table of contents
12.BORROWINGS, FINANCING AND DEBENTURES
The balances of borrowings, financing and debentures, which are carried at amortized cost, are as follows:
| | | Rates p.a. (%) | Current liabilities | Non-current liabilities |
| | | 12/31/2013 | 12/31/2012 | 12/31/2013 | 12/31/2012 |
FOREIGN CURRENCY | | | | | | |
Prepayment | | 1% to 3.50% | 105,874 | 162,290 | 1,166,615 | 1,104,271 |
Prepayment | | 3.51% to 7.50% | 207,331 | 8,954 | 1,276,717 | 878,705 |
Perpetual bonds | | 7.00% | 3,189 | 2,781 | 2,342,600 | 2,043,500 |
Fixed rate notes | | 4.14 to 10% | 156,868 | 1,265,330 | 5,505,110 | 4,802,225 |
Financed imports | | 6.24% | | 6,813 | | |
BNDES/FINAME | | Res. 635/87 interest + 1.7% and 2.7% | 12,356 | 32,395 | | 10,755 |
Intercompany | | 6M Libor + 2.25 and 3% | | | | |
Other | | 3.51% to 7.50% + 1.2% | 49,306 | 9,860 | 442,843 | 409,337 |
| | | | 534,924 | 1,488,423 | 10,733,885 | 9,248,793 |
LOCAL CURRENCY | | | | | | |
BNDES/FINAME | | TJLP + 1.5% to 3.2% and 2.5% to 10% fixed rate | 97,044 | 346,623 | 962,684 | 1,535,255 |
Debentures | | 105.8% to 110.8% CDI and TJLP + 0.85% | 846,387 | 128,239 | 1,932,500 | 4,436,892 |
Prepayment | | 106.5% to 110,79% CDI and 8% fixed rate | 101,330 | 163,812 | 5,345,000 | 4,800,000 |
CCB | | 112.5% CDI | 1,085,436 | 62,072 | 6,200,000 | 7,200,000 |
Intercompany | | 110.79% CDI | | | | |
Other | | | 8,527 | 10,983 | 15,505 | 16,581 |
| | | | 2,138,724 | 711,729 | 14,455,689 | 17,988,728 |
Total borrowings and financing | 2,673,648 | 2,200,152 | 25,189,574 | 27,237,521 |
Transaction costs and issue premiums | -30,841 | -31,030 | -85,951 | -101,939 |
Total borrowings and financing + transaction costs | 2,642,807 | 2,169,122 | 25,103,623 | 27,135,582 |
The balances of prepaid intercompany borrowings total R$2,943,964 as of December 31, 2013 (R$2,339,776 as of December 31, 2012) and the balances of Fixed Rate Notes and Intercompany Bonds total R$2,452,956 (R$3,545,340 as of December 31, 2012), see note 19.
· Funding transaction costs
As of December 31, 2013, funding transaction costs are as follows:
| | | | | |
| | | Current | | Noncurrent | | TIR(1) |
| | | | |
Fixed rate notes | | 1,865 | | 3,830 | | 6.5% to 10.7% |
BNDES | | 631 | | 2,660 | | 1.44% to 9.75% |
Prepayment | | 8,162 | | 15,766 | | 10.08% to 12.44% |
Prepayment | | 2,213 | | 8,368 | | 2.68% to 4.04% |
CCB | | 17,472 | | 54,834 | | 11.33% to 14.82% |
Other | | 498 | | 493 | | 6.75% to 12.59% and 10.7% to 13.27% |
| | 30,841 | | 85,951 | | |
(1)TIR – Annual internal rate of return
FS-40
·Maturities of borrowings, financing and debentures presented in non-current liabilities
As of December 31, 2013, the principal of long-term borrowings, financing and debentures by maturity year is as follows:
| | | |
2015 | | 3,181,503 | | 13% |
2016 | | 3,210,020 | | 13% |
2017 | | 3,628,773 | | 14% |
2018 | | 3,997,706 | | 16% |
2019 | | 3,813,514 | | 15% |
After 2019 | | 5,015,458 | | 19% |
Perpetual bonds | | 2,342,600 | | 10% |
| | 25,189,574 | | 100% |
·Amortizations and new borrowings, financing and debentures
The table below shows the amortizations and new funding in the current year:
| | 12/31/2013 | | 12/31/2012 |
Opening balance | | 29,304,704 | | 26,973,247 |
Funding | | 1,697,363 | | 3,520,263 |
Amortization | | -4,300,240 | | -4,876,453 |
Loss of control over Trasnordestina | | -3,180,821 | | |
Other (*) | | 4,225,424 | | 3,687,647 |
Closing balance | | 27,746,430 | | 29,304,704 |
(*) Includes unrealized foreign exchange and inflation adjustments.
In December 2013, the Company redeemed all the Guaranteed Bonds issued in 2003, through its wholly-owned subsidiary CSN Islands VIII Corp., guaranteed by CSN, at a rate of 9.75% per year, amounting to US$550 million (R$1,270,775) in principal and US$27 million (R$62,295) in interest.
Borrowing and financing contracts with certain financial institutions contain some covenants that are usual in financial agreements in general and the Company is compliant with them as of December 31, 2013.
·Debentures
i. Companhia Siderúrgica Nacional
6th issue
In September 2012 the Company issued 156,500 nonconvertible, unsecured debentures, of which 106,500 1st series debentures and 50,000 2nd series debentures, with a unit face value of R$10 totaling R$1,565,000 that pay interestequivalent to 105.80% of the CDI Cetip rate for the 1st series and 106.00% per year for the 2nd series, maturing in March and September 2015, respectively, both with early redemption option.
FS-41
table of contents
·Guarantees provided
Guarantees provided for the borrowings comprise property, plant and equipment items and sureties and do not include guarantees provided for subsidiaries and jointly controlled entities. As of December 31, 2013, the amount is R$4,234 (R$12,233 as of December 31, 2012).
13.FINANCIAL INSTRUMENTS
I - Identification and measurement of financial instruments
The Company enters into transactions involving various financial instruments, mainly cash and cash equivalents, including short-term investments, marketable securities, trade receivables, trade payables, and borrowings and financing. Additionally, it also carries out transactions involving derivative financial instruments, especially exchange and interest rate swaps.
Considering the nature of these instruments, their fair value is basically determined by the use of Brazil’s money market and mercantile and futures exchange quotations. The amounts recorded in current assets and current liabilities have immediate liquidity or short-term maturity, mostly less than three months. Considering the maturities and features of such instruments, their carrying amounts approximate their fair values.
·Classification of financial instruments
Consolidated | | | |
12/31/2013 | | 12/31/2012 |
| Notes |
| Available for sale | | Fair value through profit or loss | | Loans and receivables - effective interest rate | | Other liabilities - amortized cost method | | Balances | | Available for sale | | Fair value through profit or loss | | Loans and receivables - effective interest rate | | Other liabilities - amortized cost method | | Balances |
Assets | | | | | | | | | | | | | | | | | | | | | | |
Current assets | | | | | | | | | | | | | | | | | | | | | | |
Cash and cash equivalents | | 5 | | | | | | 9,995,672 | | | | 9,995,672 | | | | | | 11,891,821 | | | | 11,891,821 |
Trade receivables, net | | 6 | | | | | | 1,733,641 | | | | 1,733,641 | | | | | | 1,646,090 | | | | 1,646,090 |
Guarantee margin on financial instruments | | 8 and 13 | | | | | | | | | | | | | | 426,328 | | | | 426,328 |
Derivative financial instruments | | 8 and 13 | | 9,681 | | | | | | 9,681 | | | | 239,266 | | | | | | 239,266 |
Trading securities | | 8 | | | | 9,906 | | | | | | 9,906 | | | | | | | | | | |
Total | | | | | | 19,587 | | 11,729,313 | | | | 11,748,900 | | | | 239,266 | | 13,964,239 | | | | 14,203,505 |
| | | | | | | | | | | | | | | | | | | | | | |
Non-current assets | | | | | | | | | | | | | | | | | | | | | | |
Other trade receivables | | 8 | | | | | | 9,970 | | | | 9,970 | | | | | | 8,983 | | | | 8,983 |
Investments | | | | 2,405,174 | | | | | | | | 2,405,174 | | 2,336,137 | | | | | | | | 2,336,137 |
Derivative financial instruments | | 8 | | | | 3,879 | | | | | | 3,879 | | | | | | | | | | |
Short-term investments | | | | | | | | 30,756 | | | | 30,756 | | | | | | 116,753 | | | | 116,753 |
Total | | | | 2,405,174 | | 3,879 | | 40,726 | | | | 2,449,779 | | 2,336,137 | | | | 125,736 | | | | 2,461,873 |
| | | | | | | | | | | | | | | | | | | | | | | |
Total assets | | | | 2,405,174 | | 23,466 | | 11,770,039 | | | | 14,198,679 | | 2,336,137 | | 239,266 | | 14,089,975 | | | | 16,665,378 |
| | | | | | | | | | | | | | | | | | | | | | |
Liabilities | | | | | | | | | | | | | | | | | | | | | | |
Current liabilities | | | | | | | | | | | | | | | | | | | | | | |
Borrowings and financing | | 12 | | | | | | | | 2,673,648 | | 2,673,648 | | | | | | | | 2,200,152 | | 2,200,152 |
Derivative financial instruments | | 13 and 14 | | 6,822 | | | | | | 6,822 | | | | 244,333 | | | | | | 244,333 |
Trade payables | | | | | | | | | | 1,102,037 | | 1,102,037 | | | | | | | | 2,025,461 | | 2,025,461 |
Total | | | | | | 6,822 | | | | 3,775,685 | | 3,782,507 | | | | 244,333 | | | | 4,225,613 | | 4,469,946 |
| | | | | | | | | | | | | | | | | | | | | | | |
Non-current liabilities | | | | | | | | | | | | | | | | | | | | | | |
Borrowings and financing | | 12 | | | | | | | | 25,189,574 | | 25,189,574 | | | | | | | | 27,237,521 | | 27,237,521 |
Derivative financial instruments | | 13 and 14 | | 17,375 | | | | | | 17,375 | | | | | | | | | | |
Total | | | | | | 17,375 | | | | 25,189,574 | | 25,206,949 | | | | | | | | 27,237,521 | | 27,237,521 |
| | | | | | | | | | | | | | | | | | | | | | | |
Total liabilities | | | | | | 24,197 | | | | 28,965,259 | | 28,989,456 | | | | 244,333 | | | | 31,463,134 | | 31,707,467 |
·Fair value measurement
The financial instruments recognized at fair value require the disclosure of fair value measurements in three hierarchy levels.
·Level 1: quoted prices (unadjusted) in active markets for identical assets or liabilities.
FS-42
·Level 2: other available inputs, except those of Level 1 that are observable for the asset or liability, whether directly (i.e., prices) or indirectly (i.e., derived from prices)
·Level 3: inputs unavailable due to slight or no market activity and which is significant for the definition of the fair value of assets.
The following table shows the financial instruments recognized at fair value through profit or loss using a valuation method:
Consolidated | | | | | | | | 12/31/2013 | | | | | | | | 12/31/2012 |
| | Level 1 | | Level 2 | | Level 3 | | Balances | | Level 1 | | Level 2 | | Level 3 | | Balances |
Assets | | | | | | | | | | | | | | | | |
Current assets | | | | | | | | | | | | | | | | |
Financial assets at fair value through profit or loss | | | | | | | | | | | | | | | | |
Derivative financial instruments | | | | 9,681 | | | | 9,681 | | | | 239,266 | | | | 239,266 |
Trading securities | | 9,906 | | | | | | 9,906 | | | | | | | | |
Non-current assets | | | | | | | | | | | | | | | | |
Available-for-sale financial assets | | | | | | | | | | | | | | | | |
Investments | | 2,405,174 | | | | | | 2,405,174 | | 2,336,137 | | | | | | 2,336,137 |
Financial assets at fair value through profit or loss | | | | | | | | | | | | | | | | |
Derivative financial instruments | | | | 3,879 | | | | 3,879 | | | | | | | | |
Total assets | | 2,415,080 | | 13,560 | | | | 2,428,640 | | 2,336,137 | | 239,266 | | | | 2,575,403 |
| | | | | | | | | | | | | | | | | |
Liabilities | | | | | | | | | | | | | | | | |
Current liabilities | | | | | | | | | | | | | | | | |
Financial liabilities at fair value through profit or loss | | | | | | | | | | | | | | | | |
Derivative financial instruments | | | | 6,822 | | | | 6,822 | | | | 244,333 | | | | 244,333 |
Non-current liabilities | | | | | | | | | | | | | | | | |
Financial liabilities at fair value through profit or loss | | | | | | | | | | | | | | | | |
Derivative financial instruments | | | | 17,375 | | | | 17,375 | | | | | | | | |
Total liabilities | | | | 24,197 | | | | 24,197 | | | | 244,333 | | | | 244,333 |
II – Investments in financial instruments classified as available for sale and measured at fair value through OCI
These consist mainly of investments in shares acquired in Brazil involving top ranked companies, which are recognized in non-current assets, and any gains or losses are recognized in shareholders' equity, where they will remain until actual realization of the securities or when any loss is considered unrecoverable.
Impairment of financial assets classified as available for sale
The Company has investments in common (USIM3) and preferred (USIM5) shares (“Usiminas Shares”), designated as available-for-sale financial assets as they do not meet the criteria to be classified within any of the other categories of financial instruments (loans and receivables, held-to-maturity investments or financial assets at fair value through profit or loss). The asset is classified as a non-current asset under line item “investments” and is carried at fair value based on the quoted price on the stock exchange (BM&FBOVESPA).
Considering the volatility of the quotations of Usiminas shares, the Company evaluated whether, at the end of the reporting period, there was objective evidence of impairment of these financial assets, i.e., the Company’s management evaluated if the decline in the market value of Usiminas shares should be considered either significant or prolonged. In turn, this valuation requires judgment based on CSN’s policy, prepared according to practices used in the domestic and international markets, and consists of an instrument by instrument analysis based on quantitative and qualitative information available in the market, from the time an instrument shows a drop of 20% or more in its market value or from the time there is a significant drop in its market value as compared to its acquisition price during more than twelve months.
Based on the qualitative and quantitative elements, management concluded, in its best judgment, that there was evidence of a significant impairment of the investment in Usiminas shares as of June 30, 2012, and, consequently, reclassified the accumulated losses recorded in other comprehensive income amounting to R$1,599,485, net ofincome tax and social contribution, to profit for the year, by recognizing R$2,022,793 in other operating expenses and R$423,308 in deferred taxes.
FS-43
In December 2012 there was an additional recognition of R$264,441 related to deferred taxes on accumulated losses due to the annual analysis of the effective income tax and social contribution rate that took into consideration the temporary differences generated by this investment in CSN subsidiaries resulting from the reclassification of accumulated losses.
As of June 30, 2013, there was an additional decline in the quotation of the common shares (USIM3) as compared with the quotation as of June 30, 2012 which, according to the Company's accounting policy, generated a loss of R$5,002, recorded directly in other operating expenses. Beginning this date, pursuant to a Company's policy, gains and losses arising from the variation of the quotation of shares were recognized in other comprehensive income.
The Company continues to evaluate strategic alternatives with respect to its investment in Usiminas. These initiatives can, for example, affect the way an investment is recorded in the Company’s financial statements.
III – Fair values of assets and liabilities as compared to their carrying amounts
Financial assets and liabilities at fair value through profit or loss are recognized in current and non-current assets and liabilities, and any gains and possible losses are recognized as finance income or finance costs, respectively.
The amounts are recognized in the financial statements at their carrying amounts, which are substantially similar to those that would be obtained if they were traded in the market. The fair values of other long-term assets and liabilities do not differ significantly from their carrying amounts, except the amounts below.
The estimated fair value of consolidated long-term borrowings and financing was calculated at prevailing market rates, taking into consideration the nature, term and risks similar to those of the recorded contracts, and was classified in level 1 of the hierarchy of “quoted prices (unadjusted) in active markets for identical assets or liabilities”, as compared below:
| | | | 12/31/2013 | | | | 12/31/2012 |
| | Carrying amount | |
Fair value
| | Carrying amount | | Fair value |
Perpetual bonds | 2,345,789 | | 1,938,780 | | 2,046,281 | | 2,102,366 |
Fixed rate notes | 5,661,978 | | 6,032,207 | | 6,067,555 | | 6,811,081 |
IV Financial risk management policy
The Company has and follows a policy of managing its risks, with guidelines regarding the risks incurred by the company. Pursuant to this policy, the nature and general position of financial risks are regularly monitored and managed in order to assess the results and the financial impact on cash flow. The credit limits and the quality of counterparties’ hedge instruments are also periodically reviewed.
The risk management policy was established by the Board of Directors. Under this policy, market risks are hedged when it is considered necessary to support the corporate strategy or when it is necessary to maintain a level of financial flexibility.
Under the terms of the risk management policy, the Company manages some risks by using derivative financial instruments. The Company’s risk policy prohibits any speculative deals or short sales.
·Foreign exchange rate risk
The Company assesses its exchange exposure by subtracting its liabilities from its assets denominated in dollar and euro, thus arriving at its net exchange exposure, which is the foreign currency exposure risk. Therefore, besides the trade receivables arising from exports and investments overseas that in economic terms constitute natural hedges, the Company further considers and uses various financial instruments, such as derivative instruments (US$ to realand euro to dollar swaps, and forward exchange contracts, etc.) to manage its risks of fluctuations in currencies other than the Brazilian real.
FS-44
·Policies on the use of hedging derivatives
The Company’s financial policy reflects the parameters of liquidity, credit and market risks approved by the Audit Committee and Board of Directors. The use of derivative instruments in order to prevent fluctuations in interest and exchange rates from having a negative impact on the company’s balance sheet and income statement should consider the same parameters. As provided for in internal rules, this financial investment policy has been approved and is being managed by the finance officers.
At the meetings of the Executive Officers and Board of Directors, the officers and directors routinely present and discuss the Company’s financial positions. Under the bylaws, transactions involving material amounts require the prior approval of management bodies. The use of other derivative instruments is contingent upon the express prior approval of the Board of Directors.
To finance its activities, the Company resorts to the capital markets, both locally and internationally, and based on the indebtedness profile it is seeking, part of the debt is pegged to foreign currency, basically to the US dollar, which causes Management to seek hedging for debt through derivative financial instruments.
To contract derivative financial instruments for hedging within the internal control structure, the following policies are adopted:
·ongoing calculation of exchange exposure that occurs by analyzing assets and liabilities exposed to foreign currency, under the following terms: (i) trade receivables and payables in foreign currency; (ii) cash and cash equivalents and debts in foreign currency considering the maturity of the assets and liabilities exposed to exchange fluctuations;
·presentation of the financial position and exchange exposure on a routine basis of meetings of the Executive Officers and Board of Directors that approve the hedging strategy;
·carrying out derivative hedging transactions only with leading banks, diluting the credit risk through diversification among these banks;
·Foreign exchange exposure
The consolidated net exposure as of December 31, 2013 is as follows:
| | | | 12/31/2013 |
Foreign Exchange Exposure | | (Amounts in
US$’000) | | (Amounts in
€’000) |
Cash and cash equivalents overseas | | 4,086,520 | | 1,266 |
Trade receivables - foreign market | | 303,186 | | 33,994 |
Intercompany borrowings | | 154,098 | | 78,026 |
Other assets | | 21,152 | | 54,152 |
Total assets | | 4,564,956 | | 167,438 |
Borrowings and financing | | -4,589,982 | | -121,041 |
Trade payables | | -39,383 | | -2,202 |
Other liabilities | | -9,140 | | -16,943 |
Intercompany borrowings | | -34,076 | | |
Total liabilities | | -4,672,581 | | -140,186 |
Gross exposure | | -107,625 | | 27,252 |
Notional amount of derivatives contracted | | 403,000 | | -90,000 |
Net exposure | | 295,375 | | -62,748 |
FS-45
table of contents
Gains and losses on these transactions are consistent with the policies and strategies defined by management.
· Exchange swap transactions
The Company carries out exchange swap transactions in order to hedge its assets and liabilities against any fluctuations in the US dollar-real and euro-real parities. This hedge through exchange swaps provides the Company, through the long position of the contract, with a forward rate agreement (FRA) gain on the exchange coupon, which at the same time improves our investment rates and reduces the cost of our funding in the international market.
As of December 31, 2013, the consolidated position of these contracts is as follows:
| | | | | | | | | | | | | 12/31/2013 | | | | | | | | 12/31/2012 | | 12/31/2013 |
| | | | | | | | | Appreciation (R$) | | Fair value (market) | | | | Appreciation (R$) | | Fair value (market) | | Impact on finance income (cost) in 2013 |
Counterparties | | Transaction maturity | | Functional currency | | Notional amount | | Asset position | | Liability position | | Amounts receivable/ (payable) | | Notional amount | | Asset position | | Liability position | | Amounts receivable/ (payable) | |
Santander | | 2/1/2015 | | US dollar | | 10,000 | | 26,512 | | -22,633 | | 3,879 | | 10,000 | | 22,686 | | -20,946 | | 1,740 | | 2,139 |
Goldman Sachs | | 1/4/2014 | | US dollar | | 10,000 | | 23,697 | | -22,799 | | 898 | | | | | | | | | | 898 |
HSBC | | 1/4/2014 | | US dollar | | 90,000 | | 213,306 | | -205,171 | | 8,135 | | | | | | | | | | 8,135 |
Total dollar-to-CDI swap | | | | 110,000 | | 263,515 | | -250,603 | | 12,912 | | 10,000 | | 22,686 | | -20,946 | | 1,740 | | 11,172 |
| | | | | | | | | | | | | | | | | | | | | | |
Itaú BBA | | 7/5/2014 | | US dollar | | 60,000 | | 141,019 | | -141,359 | | -340 | | | | | | | | | | -340 |
Itaú BBA | | 5/7/2014 to 5/14/2014 | | US dollar | | 25,000 | | 58,734 | | -58,485 | | 249 | | | | | | | | | | 249 |
HSBC | | 7/5/2014 | | US dollar | | 153,000 | | 359,599 | | -360,487 | | -888 | | | | | | | | | | -888 |
HSBC | | 5/7/2014 to 5/14/2014 | | US dollar | | 55,000 | | 129,244 | | -128,862 | | 382 | | | | | | | | | | 382 |
Total dollar-to-real swap (NDF) | | | | 293,000 | | 688,596 | | -689,193 | | -597 | | | | | | | | | | -597 |
| | | | | | | | | | | | | | | | | | | | | | |
BES | | 3/31/2014 to 4/24/2014 | | US dollar | | 11,801 | | 27,878 | | -27,861 | | 17 | | 44,392 | | 90,687 | | -94,928 | | -4,241 | | 4,035 |
Total dollar-to-euro swap | | | | 11,801 | | 27,878 | | -27,861 | | 17 | | 44,392 | | 90,687 | | -94,928 | | -4,241 | | 4,035 |
| | | | | | | | | | | | | | | | | | | | | | | |
Itaú BBA | | 02/19/2014 | | Euro | | 30,000 | | 94,858 | | -96,632 | | -1,774 | | 40,000 | | 51,793 | | -52,876 | | -1,083 | | -2,534 |
HSBC | | 02/19/2014 | | Euro | | 30,000 | | 94,900 | | -96,632 | | -1,732 | | 25,000 | | 32,373 | | -33,047 | | -674 | | -8,097 |
Goldman Sachs | | 02/19/2014 | | Euro | | 30,000 | | 94,880 | | -96,632 | | -1,752 | | 25,000 | | 32,363 | | -33,047 | | -684 | | -2,559 |
Total dollar-to-euro swap (NDF) | | | | 90,000 | | 284,638 | | -289,896 | | -5,258 | | 90,000 | | 116,529 | | -118,970 | | -2,441 | | -13,190 |
| | | | | | | | | | | | | | | | | | | | | | |
Deutsche Bank | | 12/12/2013 | | Yen | | | | | | | | | | 59,090,000 | | 237,526 | | -236,965 | | 561 | | -5,374 |
Total yen-to-dollar swap | | | | | | | | | | | | 59,090,000 | | 237,526 | | -236,965 | | 561 | | -5,374 |
| | | | | | | | | | | | | | | | | | | | | | | |
CSFB | | 12/2/2014 | | Real | | 21,500 | | 36,526 | | -36,862 | | -336 | | 64,500 | | 109,540 | | -110,226 | | -686 | | -4,268 |
Total LIBOR-to-CDI interest rate swap | | | | 21,500 | | 36,526 | | -36,862 | | -336 | | 64,500 | | 109,540 | | -110,226 | | -686 | | -4,268 |
| | | | | | | | | | | | | | | | | | | | | | |
Itaú BBA | | 1/3/2016 | | Real | | 150,000 | | 152,610 | | -159,712 | | -7,102 | | | | | | | | | | -7,102 |
HSBC | | 2/5/2016 to 3/1/2016 | | Real | | 185,000 | | 187,395 | | -197,157 | | -9,762 | | | | | | | | | | -9,762 |
Deutsche Bank | | 1/3/2016 | | Real | | 10,000 | | 10,114 | | -10,625 | | -511 | | | | | | | | | | -511 |
Fixed rate-to-CDI interest rate swap | | | | 345,000 | | 350,119 | | -367,494 | | -17,375 | | | | | | | | | | -17,375 |
| | | | | | | | | | | | | | | | | | | | | | | |
| | | | 1,651,272 | | -1,661,909 | | -10,637 | | | | 576,968 | | -582,035 | | -5,067 | | -25,597 |
·Classification of the derivatives in the balance sheet and statement of income
FS-46
table of contents
| | | | | | | | | | | | | | 12/31/2013 |
Instruments | | Assets | | Liabilities | | Finance income (costs), net (Note 25) |
| | Current | | Non-current | | Total | | Current | | Non-current | | Total | |
CDI-to-dollar swap | | 9,033 | | 3,879 | | 12,912 | | | | | | | | 11,172 |
Dollar-to-euro swap (NDF) | | | | | | | | 5,258 | | | | 5,258 | | -13,190 |
Yen-to-dollar swap (*) | | | | | | | | | | | | | | -5,374 |
Dollar-to-euro swap | | 17 | | | | 17 | | | | | | | | 4,035 |
Dollar-to-real swap (NDF) | | 631 | | | | 631 | | 1,228 | | | | 1,228 | | -597 |
Libor-to-CDI swap | | | | | | | | 336 | | | | 336 | | -4,268 |
Fixed rate-to-CDI swap | | | | | | | | | | 17,375 | | 17,375 | | -17,375 |
| | | 9,681 | | 3,879 | | 13,560 | | 6,822 | | 17,375 | | 24,197 | | -25,597 |
| | | | | | | | | | | | | | | |
| | | | | | | | | | | | | | | 12/31/2012 |
Instruments | | Ativo | | Passivo | | Finance income (costs), net (Note 25) |
| | Current | | Non-current | | Total | | Current | | Non-current | | Total | |
CDI-to-dollar swap | | 1,740 | | | | 1,740 | | | | | | | | 8,301 |
Dollar-to-euro swap (NDF) | | | | | | | | 2,441 | | | | 2,441 | | -5,116 |
Yen-to-dollar swap | | 237,526 | | | | 237,526 | | 236,965 | | | | 236,965 | | 307 |
Dollar-to-euro swap | | | | | | | | 4,241 | | | | 4,241 | | -8,065 |
Libor-to-CDI swap | | | | | | | | 686 | | | | 686 | | -9,166 |
| | | 239,266 | | | | 239,266 | | 244,333 | | | | 244,333 | | -13,739 |
(*) The positions of the swap transactions were settled on December 12, 2013, together with its guarantee deposit.
Dollar-to-CDI exchange swap
As of December 31, 2013 the Company held a short position in a foreign exchange swap of US$110,000,000, where it receives exchange differences plus interest of 3.5% per year on average and pays 100% of CDI in the short position of the foreign exchange swap.
Dollar-to-real swap (NDF)
The Company conducted NDF (Non Deliverable Forward) transactions for the purpose of ensuring the forward purchase of US dollars, which are settled, without physical delivery, by the difference in contracted R$/US$ buy parity against the R$/US$ sell parity, with is the Sale Ptax T-1 to maturity. The transactions are contracted with prime financial institutions, on the over-the-counter market, and allocated to the exclusive funds.
US dollar-to-Euro exchange swap
The subsidiary Lusosider carries out transactions with derivatives to hedge its exposure against the euro-dollar fluctuation.
US dollar-to-Euro exchange swap (NDF)
In addition to the swaps above, the Company also contracted NDFs (non-deliverable forwards) to hedge its euro-denominated assets. Basically the Company contracted financial derivatives for its euro-denominated assets, where it will receive the difference between the US dollar exchange rate change for the period, multiplied by the notional amount (long position) and pay the difference between the exchange rate change in euro for the period on the notional euro amount on the contract date (short position). In general, these are transactions conducted in the Brazilian over-the-counter market that have as counterparties prime financial institutions, contracted under the exclusive funds.
Interest rate swap transactions (LIBOR to CDI)
FS-47
The objective of these transactions is to hedge transactions indexed to US dollar LIBOR against fluctuations in Brazilian interest rates. Basically, the Company carried out swaps of its obligations indexed to the LIBOR, in which it receives interest of 1.25% p.a. on the notional value of the dollar (long position) and pays 96% of the CDI on the notional amount in reais of the contract date (short position), hedging an export prepayment transaction of the same amount. The gains and losses on these contracts are directly related to fluctuations in exchange rates (US$) and interest rates (LIBOR and CDI). In general, these are transactions conducted in the Brazilian over-the-counter market that have as counterparty a prime financial institution.
Interest rate swap transactions (Fixed rate to CDI)
Its purpose is to peg obligations subject to a fixed rate to the fluctuation of the average interest rate of the one-day interbank deposits (CDI), calculated and disclosed by CETIP. Basically, the Company carried out swaps of its obligations indexed to the fixed rate, in which it receives interest on the notional amount (long position) and pays 100% of the CDI on the notional amount in reais of the contract date (short position). The gains and losses on this contract are directly related to CDI variation. In general, these are transactions conducted in the Brazilian over-the-counter market that have as counterparty a prime financial institution, contracted within the exclusive funds.
·Sensitivity analysis of exchange rate swaps
The Company considered scenarios 1 and 2 as 25% and 50% of appreciation for volatility of the currency, using as reference the closing exchange rate as of December 31, 2013 for dollar-to-real exchange swap R$2.3426, and for dollar-to-euro exchange swap R$1.3773.
| | | | | | | | | | | 12/31/2013 |
Instruments | | Notional amount | | Risk | | Probable scenario (*) | | Scenario 1 | | Scenario 2 |
Dollar-to-CDI exchange swap | | 110,000 | | US dollar | | 12,912 | | -64,422 | | -128,844 |
| | | | | | | | | | | |
Total dollar-to-euro swap (NDF) | | -90,000 | | Euro | | 5,258 | | 72,595 | | 145,192 |
| | | | | | | | | | | |
Euro-to-dollar exchange swap | | 11,801 | | US dollar | | 17 | | -13,109 | | -26,222 |
| | | | | | | | | | | |
Dollar-to-real swap (NDF) | | 293,000 | | US dollar | | 597 | | -171,595 | | -343,191 |
(*) The sensitivity analysis is based on the assumption of maintaining, as a probable scenario, the market values as of December 31, 2013 recognized in liabilities.
·Sensitivity analysis of interest rate swaps
The Company considered scenarios 1, 2, 3 and 4 as 25% and 50% of appreciation and devaluation for volatility of the interest as of December 31, 2013.
| | | 12/31/2013 |
Instruments | | Notional amount | | Risk | | Scenario 1 | | Scenario 2 | | Scenario 3 | | Scenario 4 |
| | | | | | | | | | | | |
LIBOR-to-CDI interest rate swap | | 21,500 | | (Libor) US$ | | -9,849 | | -11,725 | | 9,849 | | 11,725 |
| | | | | | | | | | | | |
Fixed rate-to-CDI interest rate swap | | 345,000 | | CDI | | -11,428 | | -19,855 | | 5,425 | | 13,852 |
·Interest rate risk
Short- and long-term liabilities indexed to floating interest rate and inflation indices. Due to this exposure, the Company undertakes derivative transactions to better manage these risks.
·Sensitivity analysis of changes in interest rates
FS-48
The Company considers the effects of a 5% increase or decrease in interest rates on its outstanding borrowings, financing and debentures as of December 31, 2013 in the consolidated financial statements.
| | | | | Impact on profit or loss |
Changes in interest rates | | % a.a | | 12/31/2013 | | 12/31/2012 |
TJLP | | 5.00 | | 2,521 | | 8,409 |
Libor | | 0.35 | | 5,725 | | 6,535 |
CDI | | 9.77 | | 71,507 | | 49,566 |
·Share market price risks
The Company is exposed to the risk of changes in equity prices due to the investments made and classified as available-for-sale. Equity investments refer to blue chips traded on BM&F BOVESPA.
The following table shows the impact of the net changes in the market value of financial instruments classified as available-for-sale on shareholders' equity, in other comprehensive income.
| | | | | | | |
| | | Other comprehensive income |
| | | 12/31/2013 | | 12/31/2012 | | Net change |
Net change in available-for-sale financial assets | | 779,526 | | 732,141 | | 47,385 |
The Company considers as probable scenario the amounts recognized at market values as of December 31, 2013. Sensitivity analysis is based on the assumption of maintaining as probable scenario the market values as of December 31, 2013. Therefore, there is no impact on the financial instruments classified as available for sale already presented above. The Company considered scenarios 1 and 2 as 25% and 50% of appreciation for volatility of the shares.
| | | | Impact on equity |
Companies | | Probable | | Scenario 1 | | Scenario 2 |
Usiminas | | 772,190 | | 199,711 | | 399,421 |
Panatlântica | | 7,336 | | 2,947 | | 5,894 |
| | 779,526 | | 202,658 | | 405,315 |
·Credit risks
The exposure to credit risks of financial institutions is in line with the parameters established in the financial policy. The Company adopts the practice of analyzing in detail the financial position of its customers and suppliers, establishing a credit limit and conducting ongoing monitoring of the outstanding balance.
As regards short-term investments, the Company only makes investments in institutions with low credit risk as rated by credit rating agencies. As part of the funds is invested in repos (repurchase agreements) backed by Brazilian government bonds, there is also exposure to Brazil’s sovereign risk.
·Capital management
The Company manages its capital structure to ensure that it will be capable of providing return to its shareholders and benefits to other stakeholders, and maintain an optimal capital structure to reduce this cost.
·Liquidity risk
FS-49
It is the risk that the Company may not have sufficient net funds to honor its financial commitments as a result of mismatching of terms or volumes between scheduled receipts and payments.
To manage cash liquidity in domestic and foreign currency, assumptions of future disbursements and receipts are established and daily monitored by the treasury area. The payment schedules for the long-term portions of borrowings, financing and debentures are shown in note 12.
The following table shows the contractual maturities of financial liabilities, including accrued interest.
| | | | | | | | | | |
At December 31, 2013 | Less than one year | | From one to two years | | From two to five years | | Over five years | | Total |
Borrowings, financing and debentures | 2,673,648 | | 6,391,523 | | 11,439,993 | | 7,358,058 | | 27,863,222 |
Derivative financial instruments | 6,822 | | 17,375 | | | | | | 24,197 |
Trade payables | 1,102,037 | | | | | | | | 1,102,037 |
| | | | | | | | | |
At December 31, 2012 | | | | | | | | | |
Borrowings, financing and debentures | 2,200,152 | | 2,838,954 | | 10,248,009 | | 14,150,558 | | 29,437,673 |
Derivative financial instruments | 244,333 | | | | | | | | 244,333 |
Trade payables | 2,025,461 | | | | | | | | 2,025,461 |
V – Margin deposits
The Company holds margin deposits totaling R$426,328 as of December 31, 2012; this amount is invested at Deutsche Bank as guarantee of the derivative financial instrument contracts, basically swaps between CSN Islands VIII and CSN. This deposit was settled together with the respective swap on December 12, 2013.
14.OTHER PAYABLES
The group of other payables classified in current and non-current liabilities is comprised as follows:
| Current | Non-current |
| | 12/31/2013 | | 12/31/2012 | | 12/31/2013 | | 12/31/2012 |
Payables to related parties (Note 19 b) | 422,150 | | 703,236 | | 8,522,685 | | 7,758,093 |
Derivative financial instruments (Note 13 I) | 6,822 | | 244,333 | | 17,375 | | |
Dividends and interest on capital payable to Company owners (Note 19 a) | | | 155,537 | | | | |
Dividends and interest on capital payable non-controlling shareholders | 2,036 | | 146,081 | | | | |
Advances from customers | 28,213 | | 31,062 | | | | |
Taxes in installments (Note 16) | 247,387 | | 166,818 | | 1,454,838 | | 1,085,079 |
Profit sharing - employees | 121,631 | | 7,771 | | | | |
Other payables | 144,612 | | 127,202 | | 66,673 | | 165,877 |
| 972,851 | | 1,582,040 | | 10,061,571 | | 9,009,049 |
15.INCOME TAX AND SOCIAL CONTRIBUTION
(a)Income tax and social contribution recognized in profit or loss:
The income tax and social contribution recognized in profit or loss for the year are as follows:
| | 12/31/2013 | | 12/31/2012 | | 12/31/2011 |
Income tax and social contribution (expenses) income | | | | | |
Current | -1,290,755 | | -321,999 | | -136,427 |
Deferred | 1,216,594 | | 1,274,207 | | 52,542 |
| -74,161 | | 952,208 | | -83,885 |
FS-50
The reconciliation of Company and consolidated income tax and social contribution expenses and income and the result from applying the effective rate on profit before income tax (IRPJ) and social contribution (CSLL) are as follows:
| | 12/31/2013 | | 12/31/2012 | | 12/31/2011 |
Profit (loss) before income tax and social contribution | 608,155 | | (1,432,782) | | 3,751,119 |
Tax rate | 34% | | 34% | | 34% |
Income tax and social contribution at combined statutory rate | -206,773 | | 487,146 | | -1,275,380 |
Adjustment to reflect effective rate: | | | | | |
Interest on capital benefit | 255,000 | | | | |
Share of profits of investees | | | | | |
Income subject to special tax rates or untaxed | 227,097 | | 444,378 | | 1,279,431 |
Transfer pricing adjustment | -31,404 | | | | |
Tax incentives | | | | | 73,134 |
REFIS effect | -689,299 | | 39,256 | | -16,060 |
Sale of nondeductible securities | | | | | -189,946 |
Tax loss carryforwards without recognizing deferred taxes | -166,734 | | -42,683 | | |
Subsidiaries’ tax credit | 550,270 | | | | 44,434 |
Other permanent deductions (add-backs) | -12,318 | | 24,111 | | 502 |
Income tax and social contribution in profit for the year | -74,161 | | 952,208 | | -83,885 |
Effective tax rate | 12% | | -66% | | -2% |
(b)Deferred income tax and social contribution:
The deferred income tax and social contribution are calculated on income tax and social contribution loss carryforwards and related temporary differences between the tax bases of assets and liabilities and the accounting balances of the financial statements. They are presented at net amounts when related to a sole jurisdiction.
| | Opening balance | Movement | Closing balance |
| | 12/31/2012 | Comprehensive
income | Profit or
loss | Tax
credits
(**) | 12/31/2013 |
Deferred tax assets | | | | | |
Income tax loss carryforwards | 818,705 | 32,800 | 289,105 | -8,314 | 1,132,296 |
Social contribution loss carryforwards | 242,606 | | 153,390 | -6,690 | 389,306 |
Acquisition of income tax loss carryforwards (Law 12,865/13 REFIS) | | | 401,953 | -401,953 | |
Acquisition of social contribution tax loss carryforwards (Law 12,865/13 REFIS) | | | 148,316 | -148,316 | |
Temporary differences | 1,115,768 | -77,567 | 210,724 | | 1,248,925 |
- Provision for tax, social security, labor, civil and environmental risks | 171,262 | | 36,245 | | 207,507 |
- Provision for environmental liabilities | 130,358 | | -12,563 | | 117,795 |
- Asset impairment losses | 53,887 | | -437 | | 53,450 |
- Inventory impairment losses | 29,638 | | -1,082 | | 28,556 |
- (Gains) losses on financial instruments | 47,524 | | -51,349 | | -3,825 |
- (Gains) losses on available-for-sale financial assets | 310,586 | -24,410 | 803 | | 286,979 |
- Actuarial liability (pension and healthcare plan) | 157,684 | -33,143 | 7,397 | | 131,938 |
- Accrued supplies and services | 55,072 | | 36,735 | | 91,807 |
- Allowance for doubtful debts | 25,812 | | 1,937 | | 27,749 |
- Goodwill on merger | -89,402 | -19,996 | -13,774 | | -123,172 |
- Unrealized exchange differences (*) | 197,944 | | 348,097 | | 546,041 |
- (Gain) on loss of control over Transnordestina | | | -224,096 | | -224,096 |
- Other | 25,403 | -18 | 82,811 | | 108,196 |
Non-current assets | 2,177,079 | -44,767 | 1,203,488 | -565,273 | 2,770,527 |
| | | | | | |
Deferred tax liabilities | | | | | |
- Business combination | 225,965 | 41,263 | -15,119 | | 252,109 |
- Other | 12,276 | 2,435 | 2,013 | | 16,724 |
Non-current liabilities | 238,241 | 43,698 | -13,106 | | 268,833 |
(*) The Company taxes foreign exchange differences on a cash basis to calculate income tax and social contribution.
(**) Use of tax credits on tax loss carryforwards of subsidiaries to settle tax debts as prescribed by Law 12865/13, Art. 40, Par. 7 (REFIS). (See Note 16.)
FS-51
Some Group companies recognized tax credits on income tax and social contribution loss carryforwards not subject to statute of limitations and based on the history of profitability and expected future taxable profits determined in technical studies approved by Management.
Since they are subject to significant factors that may change the projections for realization, the carrying amounts of deferred tax assets and projections are reviewed annually. These studies indicate the realization of these tax assets within the term stipulated by the mentioned instruction and the limit of 30% of the taxable profit.
The estimate of recovery of the deferred income tax and social contribution assets is as follows:
|
| |
Up to 1 year | | 380,960 |
From 1 to 2 years | | 485,077 |
From 2 to 3 years | | 651,435 |
From 3 to 5 years | | 43,3164,130 |
|
| 1,521,602 |
Certain Group companies have tax assets amounting to R$196,461 and R$28,556, related to income tax and social contribution loss carryforwards, for which no deferred taxes were set up, of which R$37,082 expire in 2015, R$10,982 in 2018 and R$84,324 in 2025. The remaining tax assets refer to domestic companies and, therefore, are not subject to statute of limitations.
The Company’s corporate structure includes foreign subsidiaries whose profits are subject to income tax levied by the related countries, recognized at tax rates lower than the prevailing rate in Brazil.
For the years of 2010 to 2013 these subsidiaries generated profits amounting to R$4,027,058, which, tax authorities may understand that have already been distributed, hence, it would be subject to additional taxation in Brazil, in the approximate amount of R$1,300,000 in income tax and social contribution. The Company, based on its legal counsel’s opinion, assessed the likelihood of loss as possible in a potential challenge by tax authorities and, therefore, no provision was recognized in the financial statements.
(c)Income tax and social contribution recognized in shareholders' equity:
The income tax and social contribution recognized directly in shareholders' equity are as follows:
| | 12/31/2013 | | 12/31/2012 | | 12/31/2011 |
Income tax and social contribution | | | | | |
Actuarial gains on defined benefit pension plan | 33,012 | | 66,155 | | 54,714 |
Changes in the fair value on available-for-sale financial assets | -401,574 | | -377,164 | | 241,484 |
Exchange differences on translating foreign operations | -425,510 | | -425,510 | | -425,510 |
| -794,072 | | -736,519 | | -129,312 |
(d)Provisional Measure no. 627 of 2013 (“MP 627/13”)
FS-52
table of contents
On November 11, 2013 the Provisional Measure no.627 (“MP”) was issued to repeal the Transitional Tax Regime (RTT) and introduce other provisions, including: (i) it amends Decree-Law 1,598/77, which addresses the corporate income tax, and the social contribution on net income law; (ii) it establishes that any change in or the adoption of accounting methods and criteria under administrative measures issued based on the jurisdiction attributed by the Commercial Law, after the enactment of this Provisional Act, shall not have any impact on the calculation of federal taxes until a tax law addressing the matter is enacted; (iii) it provides for a specific treatment of the potential taxation of profits or dividends; (iv) it includes provisions on the calculation of interest on capital; and (v) it provides new considerations about investments accounted for by the equity method of accounting. The provisions of Provisional Act 627 are effective from 2015, however, its early irrevocable adoption in 2014 could eliminate the potential tax effects, especially those related to dividends and interest on capital actually paid since 2008 until the Provisional Act issue date.
The Company prepared studies on the possible effects that could arise from the provisions of said Provisional Act and concluded that they would not result in material adjustments to its financial statements for the year ended December 31, 2013.
Management is awaiting the analysis of said Provisional Measure by the Legislative Authority to decide on its possible early adoption in calendar 2014.
(e)Tax incentives
The Company is granted by Income Tax incentives based on the legislation in effect, such as: Worker Food Program, the Rouanet Law (tax incentives related to cultural activities), Tax Incentives for Audiovisual Activities, and Funds for the Rights of Children and Adolescents. As of December 31, 2013, these tax incentives total R$329 (R$237 as of December 31, 2012).
16.TAXES IN INSTALLMENTS
In November and December 2013 the Company joined the Tax Recovery Program established by Law 12,865/13 and Law 11,941/09.
The position of the debts arising from these tax installment plans, recorded in taxes in installments in current and non-current liabilities, is as follows:
| Current | Non-current |
| | 12/31/2013 | | 12/31/2012 | | 12/31/2013 | | 12/31/2012 |
Federal REFIS Law 11,941/09 (a) | 140,446 | | 119,977 | | 1,001,630 | | 998,668 |
Federal REFIS Law 12,865/13 (a) | 27,124 | | | | 384,872 | | |
Other taxes in installments (b) | 79,817 | | 46,841 | | 68,336 | | 86,411 |
| | 247,387 | | 166,818 | | 1,454,838 | | 1,085,079 |
a)Tax Recovery Program (Federal Refis) – Law11,941/09 and Law 12,865/13
·New deadline – Law 11,941/09
On November 26, 2009, the Company and some subsidiaries joined the Tax Recovery Programs established by Law 11,941/09 and Provisional Act 470/2009, aimed at settling tax liabilities through a special payment system and installment plan for the settlement of tax and social security obligations.
With the new deadline to join the Law11,941/09 tax installment program established by the RFB/PGFN, pursuant to Law 12,865/13, the Company analyzed with its legal counsel the lawsuits that could have changed or be subject to new jurisprudence, the Company concluded that some tax debts could be included in the new tax installment plan onDecember 27, 2013.
FS-53
·Profits for Foreign Subsidiaries– Law 12,865/13
Under Article 40 of Law 12,865/13, the federal government allowed the payment in installments of income tax and social contribution arising from the application of Article 74 ofProvisional Measure2158-35/2001, the so-called Profits for Foreign Subsidiaries, which requires that profits earned by foreign subsidiaries or associates be taxed at yearend.
The Company elected to join the amounts corresponding to the assessed period (2004-2009), on November 29, 2013.
Both programs provide for reductions in fines and interest, however, only income tax and social contribution debt arising from the application of Law 12,865/12 could be settled with tax credits claimed on tax loss carryforwards of subsidiaries and the Company. The tax credit utilized by the subsidiaries total R$565,273, of which R$550,270 did not have a recognized tax credit, as shown in Note 15.
The remaining balance was divided into 180 monthly installments adjusted by the SELIC and the amount determined pursuant to Laws 11,941/09 and 12,865/13 is subject to approval by the tax authorities.
The adoption of the programs described above had a negative impact on the Company's profit for the fourth quarter, as shown below:
| | | |
(=) Goodwill arising on acquisitionTaxes | | -805,748 |
Fines and charges | | -569,465 |
Interest | | -519,764 |
204,569Total
| | -1,894,977 |
| | |
Discounts | | |
Fines and charges | | 446,570 |
Interest | | 255,102 |
Utilization of income tax and social contribution credit on tax loss carryforwards | 565,273 |
Total reductions | | 1,266,945 |
| | |
Total taxes payable | | -628,032 |
| | |
Deferred income tax and social contribution on fines and interest | 224,769 |
| | |
Net effect on loss (profit) | | -403,263 |
b)Other tax installments (regular and other)
The Group companies also joined the Regular social security tax (INSS) installment plan and other plans.
17.PROVISION FOR TAX, SOCIAL SECURITY, LABOR, CIVIL AND ENVIRONMENTAL RISKS AND JUDICIAL DEPOSITS
Claims of different nature are being challenged at the appropriate courts. Details of the accrued amounts and related judicial deposits are as follows:
| | | | | | | | |
| | | | 12/31/2013 | | | | 12/31/2012 |
| | Accrued liabilities | | Judicial deposits | | Accrued liabilities | | Judicial deposits |
Tax | | 259,725 | | 87,391 | | 178,657 | | 99,400 |
Social security and labor | | 298,637 | | 138,911 | | 263,700 | | 156,772 |
Civil | | 82,143 | | 29,022 | | 96,705 | | 36,109 |
Environmental | | 4,262 | | 961 | | 7,056 | | |
Judicial deposits | | | | 8,935 | | | | 11,350 |
| | | 644,767 | | 265,220 | | 546,118 | | 303,631 |
Legal obligations challenged in courts: | | | | | | | | |
Tax | | | | | | | | |
Salary Premium for education | | 46,193 | | 46,193 | | 24,077 | | 46,193 |
Income tax on ”Plano Verão” | | 20,892 | | 366,951 | | 20,892 | | 348,969 |
Other provisions | | 101,331 | | 15,350 | | 97,157 | | 19,233 |
| | | 168,416 | | 428,494 | | 142,126 | | 414,395 |
| | 813,183 | | 693,714 | | 688,244 | | 718,026 |
FS-54
table of contents
The changes in the provision for tax, social security, labor, civil and environmental risks in the year ended December 31, 2013 were as follows:
| | | | | | | | | | | |
| | | | | | | | | | Current + Non-current |
Nature | | 12/31/2012 | | Additions | | Net adjustment | | Net utilization of reversal | | 12/31/2013 |
Tax | | 320,783 | | 72,980 | | 42,475 | | -8,097 | | 428,141 |
Social security | | 43,858 | | | | 3,403 | | | | 47,261 |
Labor | | 219,842 | | 100,304 | | 24,924 | | -93,694 | | 251,376 |
Civil | | 96,705 | | 6,862 | | 2,022 | | -23,446 | | 82,143 |
Environmental | | 7,056 | | 3,663 | | 964 | | -7,421 | | 4,262 |
| | | 688,244 | | 183,809 | | 73,788 | | -132,658 | | 813,183 |
The provision for tax, social security, labor, civil and environmental liabilities was estimated by management and is mainly based on the legal counsel’s assessment. Only proceedings for which the risk is classified as probable loss are accrued. Moreover, this provision includes tax liabilities resulting from contingencies filed by the Company, subject to SELIC (Central Bank’s policy rate).
a) Tax lawsuits
Goodwill arisingI - Income tax and social contribution
“Plano Verão” -CSN is claiming the recognition of financial and tax effects on the acquisition comprises mainly the expected synergies generatedcalculation of income tax and social contribution, related to removal by the business combinationgovernment of Prada Embalagensinflation measured according to the Consumer Price Index (IPC) in January and February 1989, involving a total percentage figure of 51.87% (‘Plano Verão”).
In 2004, the lawsuit was terminated with CBL,a final and unappealable decision that granted the right to apply the index of 42.72% (January 1989), with the 12.15% already applied to be deducted from this index. The final decision also granted application of the index of 10.14% (February 1989). The proceeding is currently at expert discovery stage.
As of December 31, 2013, there is an amount of R$366,951 (R$348,969 as of December 31, 2012) deposited in court, classified in a specific account of judicial deposits in long-term receivables, and a provision of R$20,892 (R$20,892 as of December 31, 2012), which represents the portion not recognized by the courts.
FS-55
II - Salary premium for education - "Salário Educação"
CSN has filed a lawsuit challenging the constitutionality of the salary premium for education and for discussing the possibility of recovering the amounts paid in the period from January 5, 1989 to October 16, 1996. The lawsuit was unsuccessful, and the TRF upheld the decision unfavorable to CSN, a decision that is final and unappealable.
In view of the final and unappealable decision, CSN tried to make payment of the amount due, though the FNDE and INSS did not reach an agreement as to which agency should receive it. They also required that the amount should be paid along with a fine, with which the Company did not agree.
Lawsuits were then filed challenging the above events, with judicial deposit of the amounts involved in the lawsuits. In the first lawsuit, the lower court partly accepted the Company’s request, with the judge deducting the fine, but upholding the SELIC rate, with counterarguments against the defendant’s appeal against the SELIC rate.
As of December 31, 2013 the accrued amount totals R$46,193 (R$24,077 as of December 31, 2012) and the judicial deposit amounts to R$46,193 (R$46,193 as of December 31, 2012).
III - Other
CSN has also recognized provisions for lawsuits relating to INSS, FGTS Complementary Law 110, PIS Law 10,637/02 and PIS/COFINS - Manaus Free Trade Zone, totaling R$101,331 as of December 31, 3012 (R$97,157 as of December 31, 2012), which includes legal charges.
b) Payroll and related taxes
As of December 31, 2013, the Group is a defendant in 9,067 labor lawsuits, for which a provision has been recorded in the amount of R$251,376 (R$219,842 as of December 31, 2012). Most of the claims relate to subsidiary and/or joint liability, salary equalization, health hazard premiums and hazardous duty premiums, overtime pay, difference in the 40% fine for the severance pay fund (FGTS) as a result of federal government economic plans, health care plan, indemnity claims resulting from alleged occupational diseases or on-the-job accidents, breaks between working hours, and differences in profit sharing from 1997 to 1999 and from 2001 to 2003.
c) Civil lawsuits
Among the civil lawsuits in which the Company is a defendant are claims for compensation. Generally these lawsuits result from on-the-job accidents, occupational diseases and contractual litigation related to the industrial activities of the Group, real estate actions, healthcare plan, and reimbursement of costs incurred in labor courts. For lawsuits involving civil matters, a provision has been recognized in the amount of R$82,143 as of December 31, 2013 (R$96,705 as of December 31, 2012).
d) Other
§Competition
On June 14, 2010, the Regional Federal Court of Brasília rejected the annulment action filed by CSN against CADE, which aimed at annulling its fine for the alleged infringements laid down in Articles 20 and 21, I, of Law 8,884/1984. The Company filed appropriate appeals against this decision, which were dismissed, resulting in the filing of a Motion for clarification, which is pending judgment. The collection of the R$65,292 fine is suspended by a Court decision, which stays the collection as from the date CSN issued a guarantee letter. This proceeding is classified as risk of possible loss.
§Environmental
The environmental administrative/judicial proceedings filed against the Company include mainly administrative proceedings for alleged environmental irregularities and the regularization of environmental permits; at the judicial level, the Company is a party to actions collecting the fines imposed for such alleged environmental irregularities andpublic civil actions claiming regularization coupled with compensation, in most cases claiming environmental recovery. In general these proceedings arise from alleged damages to the environment related to the Company’s industrial activities. The environmental proceedings total R$4,262 (R$7,056 as of December 31, 2012).
FS-56
table of contents
In July 2012 the Company received a legal notice in the lawsuit filed by the State Attorney's Office of the State of Rio de Janeiro, related to Volta Grande IV district in the city of Volta Redonda-RJ, claiming, among others, the removal of two industrial waste cells and 750 (seven hundred and fifty) homes. This lawsuit is classified as probable loss risk, but there is not an estimated amount due to the illiquidity of the claims.
As a result of the lawsuit mentioned in the paragraph above, after August 2012 the Company received legal notices related to some lawsuits filed by one of the dwellers of the Volta Grande IV district, who claims the payment of compensation for property damages and pain and suffering, whose amounts are illiquid at the moment, and this lawsuit is classified as possible loss risk.
On the same matter (Bairro Volta Grande IV), in August 2013 the Company received a subpoena about the lawsuits filed by the Federal Public Prosecution Office (Federal Courts), which has the same claim of the lawsuit filed by the State Public Prosecution Office, described above. This new lawsuit is classified with a possible level of risk, since the trend is that the State courts’ decision prevails also in note 13.the Federal courts. The risk amount in this new lawsuit is the same of the lawsuit filed by the State Public Prosecution Office.
§Other administrative and judicial proceedings
The business combination with Companhia Brasileira de Latas,Group is a defendant in other administrative and judicial proceedings (tax, social security, labor, civil, and environmental), in the approximate amount of R$12,370,964, of which took place on July 12, 2011, is under review of Conselho Administrativo de Defesa Econômica, or CADE, (Brazilian antitrust agency).
(a)R$6,525,528 refers to the tax assessment notice issued against the Company for an alleged sale of 40% of the shares of its subsidiary NAMISA to a Japanese-Korean consortium, thus failing to determine and pay taxes on the capital gain resulting from this transaction, and in May 2013, the São Paulo -SP Regional Judgment Office (first administrative court) issued a favorable decision to the Company and cancelled the tax assessment notice. In light of this decision, an ex-officio appeal was filed that will be judged by the Administrative Board of Tax Appeals (CARF);
(b)R$680,546 refers to execution proceedings filed against us to require the ICMS allegedly levied on the electricity acquired by our Steel Plant, which is fully consumed in manufacturing steel products. The tax authorities argue that the use of electricity in the production process as an input does not preclude its taxation by the ICMS.
(c)R$533,890 refers to the offset of taxes that were not approved by the Federal Revenue Service (FRS) for certain reasons. The taxes involved are CSLL, IRPJ, IPI, PIS and COFINS. It is our understanding that we have enough documentation to make evidence that we were duly entitled to the offset at the time.
(d)R$417,537 refers to a decision of the Federal Revenue Service (FRS) that partially denied to us certain benefits granted by the Provisional Measure nº470 (a tax recovery program) based on the grounds that we had not enough tax losses to pay the certain of that program installments. The FRS disallowed those loses based on the rational that they had already been used in the taxation, in Brazil, of our foreign subsidiaries’ profits, which is a domestic tax regime of foreign subsidiaries contested by us.
(e)R$330,421 refers to the disallowance of the ICMS tax credits claimed by the Company between April of 1999 and September of 2002. The matter under dispute relates to the proper tax bases to be applied in the interstate transfer of iron ore from our Casa de Pedra mine to our Presidente Vargas Steel Plant. In accordance with the tax authorities in the State of Rio de Janeiro (location of the Steel Plant), the tax bases used by us in the State of Minas Gerais (location of Casa de Pedra) is not in compliance with the regulation in Rio de Janeiro, then the excess of credits appropriated in the transfer was not to be admitted in Rio de Janeiro.
(f)R$260,321 refers to the tax assessments issued against us to disallow the credits of ICMS transferred to us in acquisition of certain branches of our subsidiary INAL in Rio de Janeiro. According to the tax authorities, the acquisition of a company’s branch does not entitle the buyer to the ICMS credits owned by target branch. In viewof assessment, the Company filed a writ of mandamus to claim its right to proceed with this transfer, which had a final favorable decision in the Judiciary Courts. This favorable decision favors our case in the Administrative Court of Appeals of the State of Rio de Janeiro.
FS-22FS-57
(g)R$2,153,777 refers to other tax lawsuits (federal, state, and municipal).
(h)R$1,044,079 refers to labor and social security lawsuits; R$350,218 refers to civil lawsuits, and R$74,647 to environmental lawsuits.
The assessments made by legal counsel define these administrative and judicial proceedings as entailing risk of possible loss and, therefore, no provision was recorded in conformity with management’s judgment and accounting practices adopted in Brazil.
4.18.PROVISION FOR ENVIRONMENTAL LIABILITIES AND ASSET RETIREMENT OBLIGATION
The balance of the provision for environmental liabilities and decommissioning of assets is as follows:
| | | |
| | 12/31/2013 | | 12/31/2012 |
Environmental liabilities | 346,455 | | 383,405 |
Asset retirement obligation - ARO | 23,999 | | 21,292 |
| 370,454 | | 404,697 |
a) Environmental liabilities
As of December 31, 2013, a provision is maintained for expenditures relating to environmental investigation and recovery services for potentially contaminated areas surrounding establishments in the States of Rio de Janeiro, Minas Gerais and Santa Catarina. Estimated expenditures will be reviewed periodically and the amounts already recognized will be adjusted whenever needed. These are management’s best estimates considering recovery studies in areas that have been degraded and are in the process of being used for activities. This provision is recognized in operating expenses.
The provision is measured at the present value of the expenditures required to settle the obligation, using a pretax rate that reflects current market assessments of the time value of money and the specific risks of the obligation. The increase in the obligation due to passage of time is recognized as other operating expenses.
The long-term interest rate used to discount to present value and update the provision through December 31, 2013 was 11.00%. The liability recognized is periodically updated based on the general market price index (IGPM) for the period.
b) Asset retirement obligation - ARO
ARO consist of estimated costs for decommissioning, retirement or restoration of areas upon the termination of activities related to mining resources. The initial measurement is recognized as a liability discounted to present value and subsequently through increase in expenses over time. The asset decommissioning cost equivalent to the initial liability is capitalized as part of the carrying amount of the asset, being depreciated over the useful life of the asset.
19. RELATED-PARTY BALANCES AND TRANSACTIONS
a) Transactions with Holding Company
Vicunha Siderurgia S.A. is a holding company set up for the purpose of holding equity interests in other companies and is the Company’s main shareholder, with 47.86% of the voting shares.
On December 27, 2010, Rio IACO acquired 58,193,503 shares of Caixa Beneficente dos Empregados da CSN (“CBS”) and currentlyIaco Participações S.A. holds 3.99% of CSN’s issued capital, and became partCSN.
FS-58
· Liabilities
| | | | | | | | | | | | | |
| | | | | | | | | | | Paid |
| Companies | | Mandatory minimum
dividend | | Proposed additional
dividend | | Proposed interest on
capital | | Total | | Dividends | | Interest on
capital |
| Vicunha Siderurgia | | 443,386 | | 130,881 | | | | 574,267 | | 717,835 | | 170,746 |
| Rio Iaco | | 36,981 | | 10,916 | | | | 47,897 | | 59,871 | | 14,241 |
| Total at 12/31/2011 | | 480,367 | | 141,797 | | | | 622,164 | | 777,706 | | 184,987 |
| Total at 12/31/2010 | | 141,174 | | 636,509 | | 184,985 | | 962,668 | | 717,834 | | 33,499 |
| | | | | | | |
Companies | | Proposed | | Paid |
| | Dividends | | Dividends | | Interest on capital |
Vicunha Steel | | | | 435,482 | | 358,921 |
Rio Iaco | | | | 36,319 | | 29,934 |
Total at 12/31/2013 | | | | 471,801 | | 388,855 |
Total at 12/31/2012 | | 155,537 | | 622,164 | | |
Vicunha Siderurgia’s corporate structure is as follows (unaudited information):
Vicunha Aços S.A. – holds 99.99% of Vicunha Siderurgia S.A.
Vicunha Steel S.A. – holds 66.96% of Vicunha Aços S.A.
National Steel S.A. – holds 33.04% of Vicunha Aços S.A.
CFL Participações S.A. – holds 40% of National Steel S.A. and 39.99% of Vicunha Steel S.A.
Rio Purus Participações S.A. – holds 60% of National Steel S.A., 59.99% of Vicunha Steel S.A. and 99.99% of Rio Iaco Participações S.A.
b) Transactions with jointly controlled entities, associates, exclusive funds and other related parties
The Company’s strategic areas of mining, logistics and energy maintain equity interests in companies under joint control. The characteristics, objectives and transactions with these companies are as follows. The consolidated information is presented according to the criteria set out in note 2.
· Assets By transaction
| | | | | | | |
| Companies | | Trade receivables | | Intercompany loan (*) | | Total |
| Nacional Minérios S.A. | | 31,338 | | | | 31,338 |
| MRS Logística S.A. | | 403 | | | | 403 |
| Total at 12/31/2011 | | 31,741 | | | | 31,741 |
| Total at 12/31/2010 | | 19,115 | | 496,438 | | 515,552 |
| | | Assets | | Liabilities |
| | Current | | Non-current | | Total | | Current | | Non-current | | Total |
| | | | | | |
Assets | | | | | | | | | | | | |
Trade receivables | | 107,443 | | | | 107,443 | | | | | | |
Loans | | 147,273 | | 603,862 | | 751,135 | | | | | | |
Dividends receivable | | 717,595 | | | | 717,595 | | | | | | |
Actuarial asset | | | | 97,051 | | 97,051 | | | | | | |
Other receivables | | 15,658 | | 18,129 | | 33,787 | | | | | | |
| | 987,969 | | 719,042 | | 1,707,011 | | | | | | |
Liabilities | | | | | | | | | | | | |
Other payables | | | | | | | | | | | | |
Accounts payable | | | | | | | | 600 | | 618 | | 1,218 |
Advances from customers(1) | | | | | | | | 421,550 | | 8,522,067 | | 8,943,617 |
Trade payables | | | | | | | | 52,949 | | | | 52,949 |
Actuarial liability | | | | | | | | | | 11,139 | | 11,139 |
| | | | | | | | | 475,099 | | 8,533,824 | | 9,008,923 |
Total at 12/31/2013 | | 987,969 | | 719,042 | | 1,707,011 | | 475,099 | | 8,533,824 | | 9,008,923 |
Total at 12/31/2012 | | 1,208,633 | | 418,760 | | 1,627,393 | | 715,422 | | 7,845,506 | | 8,560,928 |
| | | | | | | | | | | | |
| | | Statement of Income | | | | | | | | | | |
Revenues | | | | | | | | | | | | |
Sales | | 862,004 | | | | | | | | | | |
Interest | | 25,576 | | | | | | | | | | |
Expenses | | | | | | | | | | | | |
Purchases | | -917,469 | | | | | | | | | | |
Interest | | -421,659 | | | | | | | | | | |
Total at 12/31/2013 | | 451,548 | | | | | | | | | | |
Total at 12/31/2012 | | 67,354 | | | | | | | | | | |
| | | | | | | | | | | | | |
(*) In 2011 total payments of Nacional Minérios S.A. to CSN amounted to R$1,278,457 (loan non-consolidated corresponds to R$ 511,382) of which R$53,800 was paid in January related to interest and R$1,224,657 in April related to early settlement as provided for in the related agreement.FS-59
FS-23
| | | | | | | | | |
| |
| Companies | | Advances from customers | | Trade payables | | Other payables | | Total |
| Nacional Minérios S.A. | | 3,270,663 | | | | 2,404 | | 3,273,067 |
| MRS Logística S.A. | | | | 7,085 | | 6,562 | | 13,647 |
| Total at 12/31/2011 | | 3,270,663 | | 7,085 | | 8,966 | | 3,286,714 |
| Total at 12/31/2010 | | 3,169,817 | | 7,369 | | 6,725 | | 3,183,911 |
Nacional Minérios: The advancea.Advance from customerscustomer received from the jointly controlled entity Nacional Minérios S.A. refers Refers to the contractual obligation forof supply of iron ore and port services. The agreementcontract is subject to interest rate of 12.5% p.a. and expires in September 2042.
MRS Logística: We have recorded in other payables the amount accrued to cover contractual expenses for take or pay and block rates relating to the railroad transportation agreement.
· Profit or lossBy company
| | | | | | | | | | | | | |
| Companies | | Revenues | | Expenses |
| | Sales | | Interest | | Total | | Purchases | | Interest | | Total |
| | | | | | |
| |
| Nacional Minérios S.A. | | 378,020 | | 16,965 | | 394,985 | | 6,296 | | 385,622 | | 391,918 |
| MRS Logística S.A. | | | | | | | | 279,545 | | | | 279,545 |
| Itá Energética S.A. | | | | | | | | 28,267 | | | | 28,267 |
| Total at 12/31/2011 | | 378,020 | | 16,965 | | 394,985 | | 314,108 | | 385,622 | | 699,730 |
| Total at 12/31/2010 | | 277,751 | | 45,977 | | 323,729 | | 336,623 | | 373,606 | | 710,229 |
| | | Assets | | Liabilities | | Statement of Income |
| | Current | | Non-current | | Total | | Current | | Non-current | | Total | | Sales | | Purchases | | Finance income and costs, net | | Total |
| | | | | | | | | | |
Parent Company | | | | | | | | | | | | | | | | | | | | |
Vicunha Steel S.A. | | | | | | | | | | | | | | | | | | (1,849) | | (1,849) |
| | | | | | | | | | | | | | | | | | -1,849 | | -1,849 |
Subsidiaries | | | | | | | | | | | | | | | | | | | | |
Ferrovia Transnordestina Logística S.A.(1) | | 60,498 | | 45,216 | | 105,714 | | | | | | | | | | | | -62 | | -62 |
| | | 60,498 | | 45,216 | | 105,714 | | | | | | | | | | | | -62 | | -62 |
Jointly controlled entities | | | | | | | | | | | | | | | | | | | | |
Nacional Minérios S.A. | | 797,939 | | 321,466 | | 1,119,405 | | 422,150 | | 8,522,685 | | 8,944,835 | | 357,731 | | -3,519 | | -394,456 | | -40,244 |
MRS Logística S.A. | | 30,635 | | | | 30,635 | | 43,194 | | | | 43,194 | | | | -555,261 | | | | -555,261 |
Transnordestina Logística S.A(2) | | 33,431 | | 237,262 | | 270,693 | | | | | | | | 46 | | | | -883 | | -837 |
CBSI - Companhia Brasileira de Serviços e Infraestrutura | | 4,899 | | 8,363 | | 13,262 | | 6,056 | | | | 6,056 | | | | -122,348 | | | | -122,348 |
CGPAR Construção Pesada S.A. | | 546 | | 9,236 | | 9,782 | | 3,677 | | | | 3,677 | | | | -200,689 | | | | -200,689 |
| | 867,450 | | 576,327 | | 1,443,777 | | 475,077 | | 8,522,685 | | 8,997,762 | | 357,777 | | -881,817 | | -395,339 | | -919,379 |
Other related parties | | | | | | | | | | | | | | | | | | | | |
CBS Previdência | | | | 97,051 | | 97,051 | | 8 | | | | 8 | | | | -13,392 | | | | -13,392 |
Fundação CSN | | 320 | | 448 | | 768 | | 14 | | 11,139 | | 11,153 | | | | -1,983 | | 83 | | -1,900 |
Usiminas | | 18,112 | | | | 18,112 | | | | | | | | 50,722 | | -8,355 | | | | 42,367 |
Panatlântica | | 28,619 | | | | 28,619 | | | | | | | | 453,505 | | | | | | 453,505 |
Ibis Participações e Serviços | | | | | | | | | | | | | | | | -9,717 | | | | -9,717 |
Companhia de Gás do Ceará | | | | | | | | | | | | | | | | -2,205 | | | | -2,205 |
| | 47,051 | | 97,499 | | 144,550 | | 22 | | 11,139 | | 11,161 | | 504,227 | | -35,652 | | 83 | | 468,658 |
Associates | | | | | | | | | | | | | | | | | | | | |
Arvedi Metalfer do Brasil S.A. | | 12,970 | | | | 12,970 | | | | | | | | | | | | 1,084 | | 1,084 |
Total at 12/31/2013 | | 987,969 | | 719,042 | | 1,707,011 | | 475,099 | | 8,533,824 | | 9,008,923 | | 862,004 | | -917,469 | | -396,083 | | -451,548 |
Total at 12/31/2012 | | 1,208,633 | | 418,760 | | 1,627,393 | | 715,422 | | 7,845,506 | | 8,560,928 | | 563,203 | | -300,589 | | -329,968 | | -67,354 |
1.Refers to loans of the subsidiary FTL – Ferrrovia Transnordestina Logísitca S.A. to the jointly controlled entity Transnordestina Logística S.A.
The main transactions carried out by2.Transnordestina Logística S.A. contracts in Brazilian reais: interest equivalent to 102.5% of the CompanyCDI with its jointly controlled entities are salesfinal maturity in December 2015. As of December 31, 2013, borrowings total R$270,693 (R$210,966 as of December 31, 2012), of which R$33,431 is classified in short term and purchases of products and services, which include the supply of iron ore, the provision of port services and railroad transportation, as well as the supply of electric power for operations.R$237,262 is classified in long term.
c)Other unconsolidated related parties
· CBS Previdência
The Company is the main sponsor of this non-profit entity established in July 1960, primarily engaged in the payment of benefits that supplement the official government Social Security benefits to participants. In its capacity as sponsor, CSN carries out transactions involving the payment of contributions and recognition of actuarial liabilities calculated in defined benefit plans, as detailed in Note 29.note 28.
· Fundação CSN
The Company develops socially responsible policies concentrated today in Fundação CSN, of which it is the sponsor.founding. The transactions between the parties relate to the operating and financial support for Fundação CSN to carry out the social projects undertaken mainly in the locations where the Company operates.
· Banco FibraCASH AND CASH EQUIVALENTS
| | | |
| 12/31/2013 | | 12/31/2012 |
Current | | | |
Cash and cash equivalents | | | |
Cash and banks | 178,920 | | 205,056 |
| | | | |
Short-term investments | | | |
In Brazil: | | | |
Government securities | 48,206 | | 862,299 |
Private securities | 240,852 | | 540,688 |
| 289,058 | | 1,402,987 |
Abroad: | | | |
Time deposits | 9,527,694 | | 10,283,778 |
Total short-term investments | 9,816,752 | | 11,686,765 |
Cash and cash equivalents | 9,995,672 | | 11,891,821 |
The funds available in the Company and subsidiaries set up in Brazil are basically invested in investment funds, classified as exclusive, with repurchase agreements backed by government and private bonds with immediate liquidity.
Private securities are short-term investments in Bank Deposit Certificates (CDBs) with yields pegged to the Interbank Deposit Certificate (CDI) fluctuation, and government securities are basically repurchase agreements backed by National Treasury Notes series B (NTN-B) and Financial Treasury Bills (LFTs).The exclusive funds managed by BTG Pactual Serviços Financeiros S.A. DTVM and Caixa Econômica Federal and their assets collateralize possible losses on investments and transactions carried out. Investments in funds were consolidated.
In addition, a significant part of the funds of the Company and its foreign subsidiaries is invested in Time Deposits with leading banks, bearing fixed rates.
6.TRADE RECEIVABLES
| | | | |
| | 12/31/2013 | | 12/31/2012 |
Trade receivables | | | |
Third parties | | | |
Domestic market | 790,225 | | 776,442 |
Foreign market | 950,145 | | 754,159 |
Allowance for doubtful debts | -114,172 | | -111,532 |
| 1,626,198 | | 1,419,069 |
Related parties (Note 19 - b) | 107,443 | | 227,021 |
| 1,733,641 | | 1,646,090 |
| | | |
Other receivables | | | |
Dividends receivable (Note 19 - b) | 717,595 | | 955,869 |
Other receivables | 71,229 | | 59,458 |
| | 788,824 | | 1,015,327 |
| 2,522,465 | | 2,661,417 |
The breakdown of gross trade receivables from third parties is as follows:
FS-28
| | | | | |
| | | 12/31/2013 | | 12/31/2012 |
Falling due | | 1,339,481 | | 1,272,669 |
Overdue until 180 days | | 216,392 | | 113,793 |
Overdue above 180 days | | 184,497 | | 144,139 |
| | 1,740,370 | | 1,530,601 |
In order to meet the needs of some customers in the domestic market, related to the extension of the payment term for billing of steel, in common agreement with CSN’s internal commercial policy and maintenance of its very short-term receipts (up to 7 days), at the request of the customer, transactions are carried out for assignment of receivables without co-obligation negotiated between the customer and banks with common relationship, where CSN assigns the trade notes/bills that it issues to the banks with common relationship.
Due to the characteristics of the transactions for assignment of receivables without co-obligation, after assignment of the customer’s trade notes/bills and receipt of the funds from the closing of each transaction, CSN settles the trade receivables and becomes entirely free of the credit risk on the transaction. This transaction totals R$386,732 as of December 31, 2013 (R$224,718 as of December 31, 2012), less the trade receivables.
The changes in the Company’s allowance for doubtful debts are as follows:
| | | 12/31/2013 | | 12/31/2012 |
Opening balance | | -111,532 | | -124,939 |
Estimated losses | | -17,988 | | -11,073 |
Recovery of receivables | | 15,348 | | 24,480 |
Closing balance | | -114,172 | | -111,532 |
7.INVENTORIES
| | | | |
| | 12/31/2013 | | 12/31/2012 |
Finished products | 743,831 | | 980,375 |
Work in process | 650,311 | | 668,170 |
Raw materials | 714,365 | | 722,922 |
Storeroom supplies | 1,003,473 | | 1,018,625 |
Iron ore | 139,275 | | 74,340 |
Advances to suppliers | 11,915 | | 36,921 |
(-) Allowance for inventory losses | -102,185 | | -108,160 |
| | 3,160,985 | | 3,393,193 |
Changes in the allowance for inventory losses are as follows:
| | | 12/31/2013 | | 12/31/2012 |
Opening balance | | -108,160 | | -94,950 |
Allowance for/reversals of slow-moving inventories and obsolescence | | 5,975 | | -13,210 |
Closing balance | | -102,185 | | -108,160 |
Allowances for certain items considered obsolete or slow-moving were recognized.
As of December 31, 2013, the Company has long-term iron ore inventories amounting to R$144,483, classified in other non-current assets (R$144,483 as of December 31, 2012), as described in note 8.
FS-29
The group of other current and non-current assets is comprised as follows:
| | | | | | | | |
| | Current | Non-current |
| | 12/31/2013 | | 12/31/2012 | | 12/31/2013 | | 12/31/2012 |
Judicial deposits (Note 17) | | | | | 693,714 | | 718,026 |
Credits with the PGFN (*) | | | | | 88,921 | | 84,392 |
Recoverable taxes (**) | 480,495 | | 407,297 | | 112,788 | | 183,092 |
Prepaid expenses | 37,369 | | 38,767 | | 38,117 | | 42,893 |
Actuarial asset - related party (Note 19 b) | | | | | 97,051 | | 93,546 |
Derivative financial instruments (Note 13 I) | 9,681 | | 239,266 | | 3,879 | | |
Guarantee margin on financial instruments (Note 13 l) | | | 426,328 | | | | |
Securities held for trading (Note 13 I) | 9,906 | | | | | | |
Iron ore inventory (Note 7) | | | | | 144,483 | | 144,483 |
Northeast Investment Fund (FINOR) | | | | | 8,452 | | 8,452 |
Trade receivables | | | | | 9,970 | | 8,983 |
Loans with related parties (Note 19 b) | 147,273 | | 5,362 | | 603,862 | | 314,699 |
Other receivables from related parties (Note 19 b) | 15,658 | | 20,309 | | 18,129 | | 10,515 |
Other | 22,538 | | 14,826 | | 15,959 | | 18,058 |
| 722,920 | | 1,152,155 | | 1,835,325 | | 1,627,139 |
(*) Refers to the excess judicial deposit originated by the 2009 REFIS (Tax Debt Refinancing Program).
.
(**) Refers mainly to taxes on revenue (PIS/COFINS) and State VAT (ICMS) on the acquisition of fixed assets which will be recovered over a 48-month period, and income tax and social contribution for offset.
9.INVESTMENTS
Banco FibraThe breakdown of investments is as follows:
| | 12/31/2013 | | 31/12/2012 |
Nacional Minérios S.A. | 8,346,387 | | 7,801,690 |
MRS Logística S.A. | 726,825 | | 685,586 |
CBSI - Companhia Brasileira de Serviços de Infraestrutura | 4,350 | | 1,888 |
Arvedi Metalfer do Brasil | 18,574 | | 12,977 |
Panatlântica | 24,819 | | 12,965 |
Usiminas | 2,380,355 | | 2,323,172 |
Transnordestina | 1,984,205 | | - |
Outros | 1,508 | | 1,509 |
| | 13,487,023 | | 10,839,787 |
a)Events in 2013
·Transnordestina Logística S.A. (“TLSA”)
On September 20, 2013, the Company signed (i) An Addendum to the Concession Agreement of the Northeast Railway System, which encompasses the stretches between the cities of São Luís to Mucuripe, Arrojado to Recife, Itabaiana to Cabedelo, Paula Cavalcante to Macau, and Propriá to Jorge Lins (“Railway System I”) and the stretchesbetween the cities of Missão Velha to Salgueiro, Salgueiro to Trindade, Trindade to Eliseu Martins, Salgueiro to Porto de Suape, and Missão Velha to Porto de Pecém (“Railway System II”), to include therein obligations assumed by TLSA related to the implementation of the Railway System II, as well as the adaptation of the sections that comprise it and (ii) Conduct Adjustment Agreement between ANTT and TLSA, with the purpose of resolving pending items existing between the parties.
FS-30
table of contents
On that date the following agreements were also signed (i) a new Shareholders' Agreement of TLSA between CSN, Valec Engenharia, Construções e Ferrovias S.A. (“Valec”), Fundo de Desenvolvimento do Nordeste – FDNE (“FDNE”) and BNDES Participações S.A. – BNDESPAR (“BNDESPAR”), with the intervenience of TLSA, whose effectiveness was conditioned to the disproportionate spin-off of TLSA, to be implemented under the terms of ANTT Resolution 4,042/2013; and (ii) Investment Agreement between CSN, Valec and FDNE, with the intervenience of TLSA, which besides other matters, deals with the new budget and the sources of funds that will have to be contributed to TLSA or financed for implementation of the Railway System II.
At the Extraordinary Shareholders' Meeting held on December 27, 2013, as part of the reorganization process described above, the shareholders approved the disproportionate spin-off of TLSA, completing the segregation of Railway System I and Railway System II.
This purpose of this restructuring was to rebalance economically and financially the Northeast Railway System concession, leading to the extension of the Railway System II operation concession, which could reach 2057, and the segregation of the assets related to Railway System I, which were merged into subsidiary FTL - Ferrovia Transnordestina Logística S.A. (“FTL”), with the maintenance of the assets related to Railway System II in TLSA.
As a result of the spin-off, CSN became the holder of an 88.41% stake in FTL and a 77.30% stake in TLSA.
With the completion of the spin-off, the new Shareholders’ Agreement became effective and control is now jointly held with the shareholders part of the public block, which became the holders of substantive rights to make certain material company decisions and influence the ordinary course of business, as well as CSN, by influencing budgeting, internal policies, capital expenditures, debt, etc., thus typifying the loss of control by CSN, pursuant to specific IFRS criteria.
Accordingly, as of December 31, 2013, in accordance with IFRS 10, CSN reversed all TLSA assets and liabilities and non-controlling interests and started to recognize the remaining stake in this investment at fair value on the date control was lost. After this initial recognition, the investment starts to be measured under the equity method.
The gain generated by the loss of control over the investment recognized in the income statement, in other operating income, is broken down as follows:
| |
|
| | 12/31/2013 |
(+) | Fair value of the remaining investment | 1,984,204 |
(-) | Carrying amount of net assets | 1,714,232 |
(+) | Carrying amount of non-controlling interests | 389,133 |
| Gain on loss of control over Transnordestina | 659,105 |
(-) | Capitalized interest written off | 185,206 |
| Gain on loss of control over Transnordestina (Note 24) | 473,899 |
| | |
(-) | Income tax and social contribution | 161,126 |
| Gain on loss of control, net of income tax and social contribution | 312,773 |
b)Changes in investments in joint ventures, associates, and other investments
| | 12/31/2013 | | 12/31/2012 |
Opening balance of investments | 10,839,787 | | 10,017,456 |
Opening balance of impairment loss allowance | | | |
Transnordestina Investment balance at 12.31.2012 | 1,452,074 | | |
Capital increase/acquisition of shares | 164,941 | | 165,792 |
Capital reduction | -153,305 | | |
Dividends | -85,998 | | -547,604 |
Comprehensive income(¹) | 73,213 | | 94,967 |
Share of profits of investees (²) | 542,711 | | 1,103,632 |
Gain on loss of control over Transnordestina | 659,106 | | |
Other | -5,506 | | 5,544 |
Closing balance of investments | 13,487,023 | | 10,839,787 |
FS-31
1.Refers to the mark-to-market of investments classified as available for sale and translation to the reporting currency of the foreign investments, the functional currency of which is not the Brazilian real.
2.Below is the reconciliation of the share of profit of jointly controlled entities with the share of profit of investees recognized in the balance sheet after the reclassifications:
| | 12/31/2013 | | 12/31/2012 |
Share of profit of jointly controlled entities | 542,711 | | 1,103,632 |
Reclassifications | | | |
To cost of sales | -137,418 | | -93,592 |
To finance costs | -624,096 | | -606,703 |
To taxes | 258,914 | | 238,099 |
Other | | | |
Elimination of Transnordestina’s profit | 120,102 | | |
Other | -2,075 | | |
Adjusted share of profit of investees | 158,138 | | 641,436 |
c)Investments in joint ventures and joint operations
The balances of the balance sheets and income statements of the companies under joint control are stated below:
FS-32
| |
12/31/2013 | |
12/31/2012 |
| | Nacional Minérios (*) | | Itá
Energética | | MRS
Logística | | CBSI | | CGPAR | | Transnordestina Logística | | Nacional Minérios (*) | | Itá
Energética | | MRS
Logística | | CBSI | | CGPAR |
Equity interest (%) | | 60.00% | | 48.75% | | 27.27% | | 50.00% | | 50.00% | | 77.30% | | 60.00% | | 48.75% | | 27.27% | | 50.00% | | 50.00% |
Balance sheet | | | | | | | | | | | | | | | | | | | | | | |
Current assets | | | | | | | | | | | | | | | | | | | | | | |
Cash and cash equivalents | | 4,815,211 | | 45,894 | | 471,079 | | 12,897 | | 28,582 | | 195,830 | | 4,081,425 | | 72,754 | | 331,515 | | 5,480 | | 25,245 |
Other current assets | | 1,135,192 | | 16,682 | | 630,121 | | 21,407 | | 33,055 | | 39,183 | | 1,572,995 | | 16,616 | | 600,407 | | 19,903 | | 17,431 |
Total current assets | | 5,950,403 | | 62,576 | | 1,101,200 | | 34,304 | | 61,637 | | 235,013 | | 5,654,420 | | 89,370 | | 931,922 | | 25,383 | | 42,676 |
Non-current assets | | | | | | | | | | | | | | | | | | | | | | |
Long-term assets | | 8,391,119 | | 34,029 | | 414,624 | | 4 | | 11 | | 229,280 | | 8,296,673 | | 39,771 | | 440,545 | | | | 246 |
Investments, PP&E and intangible assets | | 1,356,909 | | 603,268 | | 5,281,642 | | 6,872 | | 45,405 | | 5,080,841 | | 1,216,907 | | 640,850 | | 4,906,609 | | 3,887 | | 32,276 |
Total non-current assets | | 9,748,028 | | 637,297 | | 5,696,266 | | 6,876 | | 45,416 | | 5,310,121 | | 9,513,580 | | 680,621 | | 5,347,154 | | 3,887 | | 32,522 |
Total assets | | 15,698,431 | | 699,873 | | 6,797,466 | | 41,180 | | 107,053 | | 5,545,134 | | 15,168,000 | | 769,991 | | 6,279,076 | | 29,270 | | 75,198 |
| | | | | | | | | | | | | | | | | | | | | | |
Current liabilities | | | | | | | | | | | | | | | | | | | | | | |
Borrowings and financing | | 42,247 | | | | 333,796 | | | | 20,053 | | 97,681 | | 1,588 | | 41,957 | | 380,656 | | | | 13,883 |
Other current liabilities | | 1,318,884 | | 35,174 | | 841,681 | | 22,437 | | 36,733 | | 51,901 | | 1,887,841 | | 45,701 | | 829,185 | | 16,131 | | 44,641 |
Total current liabilities | | 1,361,131 | | 35,174 | | 1,175,477 | | 22,437 | | 56,786 | | 149,582 | | 1,889,429 | | 87,658 | | 1,209,841 | | 16,131 | | 58,524 |
Non-current liabilities | | | | | | | | | | | | | | | | | | | | | | |
Borrowings and financing | | 339,961 | | | | 2,566,412 | | | | 21,664 | | 3,479,420 | | 335,806 | | | | 2,253,721 | | | | 14,814 |
Other non-current liabilities | | 86,694 | | 1,870 | | 390,228 | | 10,050 | | 18,956 | | 201,900 | | 19,595 | | 5,812 | | 301,393 | | 9,364 | | |
Total non-current liabilities | | 426,655 | | 1,870 | | 2,956,640 | | 10,050 | | 40,620 | | 3,681,320 | | 355,401 | | 5,812 | | 2,555,114 | | 9,364 | | 14,814 |
Shareholders’ equity | | 13,910,645 | | 662,829 | | 2,665,349 | | 8,693 | | 9,647 | | 1,714,232 | | 12,923,170 | | 676,521 | | 2,514,121 | | 3,775 | | 1,860 |
Total liabilities and shareholders’ equity | 15,698,431 | | 699,873 | | 6,797,466 | | 41,180 | | 107,053 | | 5,545,134 | | 15,168,000 | | 769,991 | | 6,279,076 | | 29,270 | | 75,198 |
| | | | | | | | | | | | | | | | | | | | | | |
| |
12/31/2013 | |
12/31/2012 |
| | Nacional Minérios (*) | | Itá Energética | | MRS Logística | | CBSI | | CGPAR | | Transnordestina Logística | | Nacional Minérios (*) | | Itá Energética | | MRS Logística | | CBSI | | CGPAR |
Equity interest (%) | | 60.00% | | 48.75% | | 27.27% | | 50.00% | | 50.00% | | 77.30% | | 60.00% | | 48.75% | | 27.27% | | 50.00% | | 50.00% |
Statements of Income | | | | | | | | | | | | | | | | | | | | | | |
Net revenue | | 2,369,836 | | 153,105 | | 3,038,142 | | 109,650 | | 178,762 | | 58,465 | | 3,836,415 | | 217,493 | | 3,013,158 | | 61,915 | | 14,060 |
Cost of sales and services | | -1,346,658 | | -79,745 | | -1,926,923 | | -96,502 | | -148,998 | | -60,840 | | -2,730,077 | | -66,162 | | -1,993,927 | | -58,245 | | -8,780 |
Gross profit | | 1,023,178 | | 73,360 | | 1,111,219 | | 13,148 | | 29,764 | | -2,375 | | 1,106,338 | | 151,331 | | 1,019,231 | | 3,670 | | 5,280 |
Operating (expenses) income | | -113,212 | | -44,154 | | -277,814 | | -6,399 | | -1,402 | | -315,776 | | -412,091 | | -48,688 | | -262,777 | | -3,807 | | -16 |
Finance income (costs), net | | 1,621,386 | | 1,266 | | -114,637 | | 751 | | 306 | | -18,843 | | 1,329,707 | | -1,745 | | -82,417 | | 174 | | 29 |
Income before income tax and social contribution | 2,531,352 | | 30,472 | | 718,768 | | 7,500 | | 28,668 | | -336,994 | | 2,023,954 | | 100,898 | | 674,037 | | 37 | | 5,293 |
Current and deferred income tax and social contribution | -1,543,876 | | -10,263 | | -245,748 | | -2,584 | | -9,614 | | 178,937 | | -407,469 | | -33,962 | | -227,497 | | -10 | | -1,794 |
Profit for the year | | 987,476 | | 20,209 | | 473,020 | | 4,916 | | 19,054 | | -158,057 | | 1,616,485 | | 66,936 | | 446,540 | | 27 | | 3,499 |
| | | | | | | | | | | | | | | | | | | | | | | |
(*) Refer to the consolidated balances and profit or loss of Nacional Minérios S. A.
The balance sheet and income statement amounts refer to 100% of the companies’ results.
·NACIONAL MINÉRIOS S.A. - (“Namisa”)
Headquartered in Congonhas, State of Minas Gerais, this company is primarily engaged in the production, purchase and sale of iron ore and is mainly focused on foreign markets for the sale of its products. Its major operations are carried out in the cities of Congonhas, Ouro Preto, Itabirito and Rio Acima, in the State of Minas Gerais, and in Itaguaí, in the State of Rio de Janeiro.
In November 2008, 40% of Namisa’s capital became held by Big Jump Energy Participações S.A (“Big Jump”), whose shareholders were Posco and Brazil Japan Iron Ore Corp, (“BJIOC” or “Consortium”), a consortium of Asian companies formed by Itochu Corporation, Nippon Steel, JFE Steel Corporation, Sumitomo Metal Industries Ltd., Kobe Steel Ltd., and Nisshin Steel Co. Ltd.. As a result, CSN became the holder of 60% of Namisa´s capital.
On July 30, 2009, Big Jump Energy Participações S.A. was merged into Namisa and, as a result, Posco and BJIOC became the holders of a direct interest in Namisa. In 2011, Nippon Steel and Sumitomo Metal Industries Ltd., until then members of the Consortium, sold their interests to the other members of the Consortium, followed by the entry of a new shareholder, China Steel Corp. (“CSC”). After these transactions, the new corporate structure of Vicunha SiderurgiaNamisa is as follows: CSN 60%, BJIOC 32.52%, Posco 6.48%, and CSC 1%. CSN’s interests in Namisa did not change as a result of any of these events.
Under IFRS 10, paragraph B55, when assessing whether an investor has control of an investee, the investor shall determine whether it is exposed to, or has rights over, the variable returns arising from its relationship with the investee. The Shareholders’ Agreement entered into between the Consortium and CSN grants both the Consortium and CSN, through substantive rights, the power to influence the ordinary course of Namisa’s business, by beingactively involved in setting its budget, accounting policies, capital expenditures, management compensation, dividend distribution policy, among other matters.
FS-33
table of contents
The Shareholders’ Agreement also provides that certain situations of extreme impasse between the shareholders that are not resolved after mediation and negotiation procedures between the executive officers of the parties may give CSN the right to exercise a call option and the Consortium the right to exercise a put option regarding the equity interest held by the Consortium in Namisa.
Other agreements executed to make such association feasible, among them the share purchase agreement and the long-term operational agreements between Namisa, CSN and the Consortium, provide for certain obligations that, in case breached or not cured within the relevant cure period may give rise, in certain specifc situations, to the right of non-breached party to exercise a put or call option, as the case may be, with respect to the equity interest held by the Consortium in Namisa.
The material change in Namisa’s profit for this quarter is mainly due to its adherence to the tax installment programs introduced by Laws No.12,865/13 and 11,941/09, which generated a net negative impact on the joint venture entity amounting to R$889,772, which is reflected in the consolidated, through equity accounting, in the amount of R$533,863 corresponding to its 60% equity interest.
Namisa´s bylaws provide the payment of minimum dividends equivalent to 50% of the profit for the year. However, on March 28, 2014, the shareholders meeting approved, among other matters, the following measures in the Ordinary General Shareholder´s Meeting of Namisa: (i) allocation of profits for the years ended December 31, 2013 and 2012 as Earnings Reserves; and (ii) no dividends are declared for 2013 fiscal year.
·ITÁ ENERGÉTICA S.A. - (“ITASA”)
ITASA is a corporation originally created to carry out the construction of the Itá hydroelectric power plant: contracting for the supply of goods and services necessary to carry out the project and raising funds, including posting the corresponding guarantees.
CSN holds 48.75% of ITASA’s share capital.
·MRS LOGÍSTICA S.A. (“MRS”)
This subsidiary, located in Rio de Janeiro, RJ, is engaged in providing public railroad freight transportation services, on the basis of an onerous concession agreement, on the tracks of the Southeast Railway System, - located between the cities of Rio de Janeiro, São Paulo and Belo Horizonte, previously belonging to Rede Ferroviária Federal S.A.- RFFSA, which was privatized on September 20, 1996.
As of December 31, 2013 the Company directly held 27.27% and indirectly, through its jointly controlled entity Nacional Minérios S.A. (Namisa), 6% of MRS’s capital.
MRS can also engage in modal transportation services related to railroad transportation and also participate in projects aimed at expanding the railroad services granted on a concession basis.
For provision of the services covered by the concession agreement obtained for a period of 30 years starting on December 1, 1996, extendable for an equal period by exclusive decision of the concession grantor, MRS leased from RFFSA for the same concession period the assets required for operation and maintenance of the railroad freight transportation activities. Upon extinction of the concession, all leased assets will be transferred to the ownership of the railroad transportation operator designated in that same act.
·CONSÓRCIO DA USINA HIDRELÉTRICA DE IGARAPAVA
FS-34
Igarapava Hydroelectric Power Plant is located in Rio Grande, in the city of Conquista, MG, with installed capacity of 210 MW. It consists of 5 bulb type generating units and is considered a major mark for power generation in Brazil.
CSN holds 17.92% of investment in the consortium, whose specific purpose is the distribution of electric power, which is made according to the percentage equity interest of each company.
The balance of property, plant and equipment less depreciation as of December 31, 2013 is R$29,417 (R$30,584 as of December 31, 2012) and the amount of the expense in 2013 is R$6,024 (R$6,620 in 2012).
·CBSI - COMPANHIA BRASILEIRA DE SERVIÇOS DE INFRAESTRUTURA (“CBSI”)
CSN holds 50% of CBSI's share capital. The investment is the result of a joint venture between CSN and CKLS Serviços Ltda. Based in the city of Araucária, PR, CBSI is primarily engaged in providing services to subsidiaries, associates, controlling companies and third-party entities, and can operate activities related to the refurbishment and maintenance of industrial machinery and equipment, construction maintenance, industrial cleaning, logistic preparation of products, among other activities.
·CGPAR CONSTRUÇÃO PESADA S.A. (“CGPAR”)
CSN holds 50% of CGPAR's share capital. The investment is the result of a joint venture between CSN and GPA Construção Pesada e Mineração Ltda. Based in the city of Belo Horizonte, MG, CGPAR is mainly engaged in providing services related to the support to the extraction of iron ore, earth leveling, earthmoving, and dam construction.
·TRANSNORDESTINA LOGÍSTICA S.A. (“TLSA”)
It is primarily engaged in the operation and development of the railroad freight transportation public service in the Brazil’s Northeastern railway system, which encompasses the stretches between Missão Velha to Salgueiro, Salgueiro to Trindade, Trindade to Eliseu Martins, Salgueiro to Porto de Suape, and Missão Velha to Porto de Pecém (“Railway System II”).
As of December 31, 2013 CSN held 77.30% of Transnordestina Logística’s share capital.
d)Other investments
·Usinas Siderúrgicas de Minas Gerais S.A. – USIMINAS (“Usiminas”)
Usiminas, headquartered in Belo Horizonte, State of Minas Gerais, is engaged in steel and related operations. Usiminas produces flat rolled steel in the Intendente Câmara and José Bonifácio de Andrada e Silva plants, located in Ipatinga, Minas Gerais, and Cubatão, São Paulo, respectively, to be sold in the domestic market and also for exports. It also exploits iron ore mines located in Itaúna, Minas Gerais, to meet its verticalization and production cost optimization strategies. Usiminas also has service and distribution centers located in several regions of Brazil, and the Cubatão, São Paulo, and Praia Mole, Espírito Santo, ports, as well as in locations strategic for the shipment of its production.
As of December 31, 2012 and 2013, the Company reached holdings of 14.13% in common shares and 20.69% in preferred shares of Usiminas' share capital.
Usiminas is listed on the São Paulo Stock Exchange (“BM&F BOVESPA”: USIM3 and USIM5).
·PANATLÂNTICA S. A. (“Panatlântica”)
Publicly-held company, headquartered in the city of Gravataí, State of Rio Grande do Sul, engaged in the manufacturing, trade, import, export and processing of steel and ferrous or non-ferrous metals, coated or not. This investment is carried at fair value.
FS-35
CSN currently holds 9.41% (9.40% as of December 31, 2012) of Panatlântica’s total share capital.
·ARVEDI METALFER DO BRASIL S.A. (“Arvedi”)
On July 31, 2012, the Company acquired a non-controlling interest corresponding to 20% of the capital of Arvedi, company in preoperating stage focused on the production of pipes, headquartered in Salto, State of São Paulo.
10.PROPERTY, PLANT AND EQUIPMENT
| Consolidated |
| Land | | Buildings | | Machinery,
equipment
and
facilities | | Furniture
and
fixtures | | Construction
in progress | | Other (*) | | Total |
Balance at January 1, 2012 | | | | | | | | | | | | | |
Cost | 155,180 | | 1,668,999 | | 9,987,105 | | 136,003 | | 6,633,330 | | 932,006 | | 19,512,623 |
Accumulated depreciation | | | -239,796 | | -3,106,905 | | -104,796 | | | | -296,631 | | -3,748,128 |
Balance at January 1, 2012 | 155,180 | | 1,429,203 | | 6,880,200 | | 31,207 | | 6,633,330 | | 635,375 | | 15,764,495 |
Effect of foreign exchange differences | 5,656 | | 22,322 | | 246,204 | | 377 | | 471 | | -148,268 | | 126,762 |
Acquisition through business combination | 22,852 | | 103,739 | | 419,787 | | 1,202 | | 1,079 | | 33,819 | | 582,478 |
Acquisitions | 2,726 | | 20,871 | | 573,286 | | 7,199 | | 2,117,354 | | 15,016 | | 2,736,452 |
Capitalized interest (Notes 25 and 32) | | | | | | | | | 401,827 | | | | 401,827 |
Write-offs | -1,375 | | -255 | | -7,091 | | -48 | | -769 | | -221 | | -9,759 |
Depreciation | | | -61,524 | | -990,309 | | -6,007 | | | | -37,188 | | -1,095,028 |
Estimated losses on disposal of assets | | | | | | | | | | | -6,676 | | -6,676 |
Transfers to other asset categories | | | 13,876 | | 168,777 | | 332 | | -20,634 | | -162,351 | | |
Transfers to intangible assets | | | | | | | | | -3,074 | | -787 | | -3,861 |
Other | | | | | -73,876 | | | | 62,785 | | 33,465 | | 22,374 |
Balance at December 31, 2012 | 185,039 | | 1,528,232 | | 7,216,978 | | 34,262 | | 9,192,369 | | 362,184 | | 18,519,064 |
Cost | 185,039 | | 1,828,492 | | 11,358,581 | | 145,255 | | 9,192,369 | | 683,889 | | 23,393,625 |
Accumulated depreciation | | | -300,260 | | -4,141,603 | | -110,993 | | | | -321,705 | | -4,874,561 |
Balance at December 31, 2012 | 185,039 | | 1,528,232 | | 7,216,978 | | 34,262 | | 9,192,369 | | 362,184 | | 18,519,064 |
Effect of foreign exchange differences | 8,487 | | 28,882 | | 120,361 | | 488 | | 1,440 | | 1,905 | | 161,563 |
Acquisitions | 69 | | 1,555 | | 320,845 | | 3,562 | | 2,152,462 | | 11,076 | | 2,489,569 |
Capitalized interest (Notes 25 and 32) | | | | | | | | | 490,747 | | | | 490,747 |
Write-offs | -15 | | -71 | | -9,316 | | -12 | | -21,423 | | -823 | | -31,660 |
Depreciation | | | -60,122 | | -1,015,895 | | -5,867 | | | | -35,488 | | -1,117,372 |
Estimated losses on disposal of assets | | | | | | | | | | | -4,670 | | -4,670 |
Transfers to other asset categories | 19,721 | | 328,043 | | 1,311,628 | | 1,694 | | -1,841,181 | | 180,095 | | |
Transfers to intangible assets | | | | | | | | | -74,958 | | | | -74,958 |
Loss of control over Transnordestina | | | | | -963 | | | | -5,021,863 | | -6 | | -5,022,832 |
Capitalized interest written off (Note 9.b) | | | | | | | | | -185,206 | | | | -185,206 |
Impairment in jointly controlled entity Transnordestina (**) | | | | | | | | | | -279,296 | | -279,296 |
Other | | | | | -160,805 | | | | 79,248 | | 48,034 | | -33,523 |
Balance at December 31, 2013 | 213,301 | | 1,826,519 | | 7,782,833 | | 34,127 | | 4,771,635 | | 283,011 | | 14,911,426 |
Cost | 213,301 | | 2,196,994 | | 12,968,200 | | 151,479 | | 4,771,635 | | 627,845 | | 20,929,454 |
Accumulated depreciation | | | -370,475 | | -5,185,367 | | -117,352 | | | | -344,834 | | -6,018,028 |
Balance at December 31, 2013 | 213,301 | | 1,826,519 | | 7,782,833 | | 34,127 | | 4,771,635 | | 283,011 | | 14,911,426 |
(*) It refers basically to railway assets, such as yards, tracks and railway sleepers. Also comprises leasehold improvements, vehicles, hardware, mines and ore bodies and replacement storeroom supplies.
(**)The disproportionate spin-off of Transnordestina Logística S.A. (“TLSA”) resulted in the execution of an Addendum to the Concession Agreement of the Northeast Railway System and the merger of Railway System I’s assets and liabilities into FTL – Ferrovia Transnordestina Logística S.A. (in operation), with the maintenance of Railway System II’s assets and liabilities (New Transnordestina project) in TLSA. As a result, TLSA assessed the future performance of its operating assets related to Railway System I (in operation). The analysis resulted in the recognition of an impairment loss of R$279,296, recognized in line item “Other operating expenses” in subsidiary and consolidated of R$216,446, as described in Note 24. The recoverable amount of these assets was determined based on the value in use. The discount rate used to measure the value in use was 9.15% per year.
The breakdown of the projects comprising construction in progress is as follows:
FS-36
| Project description | Start date | Completion date | | 12/31/2013 | 12/31/2012 |
Logistics | | | | | | |
| | Expansion of Transnordestina railroad by 1,728 km to boost the transportation of varied products as iron ore, limestone, soybeans, cotton, sugarcane, fertilizers, oil and fuels. | 2009 | 2016 | (*) | | 3,925,720 |
| | Equalization of Berth 301. | 2012 | 2014 | | 151,932 | 27,554 |
| | Current investments for maintenance of current operations. | | | | 231,832 | 726,416 |
| | | | | | 383,764 | 4,679,690 |
Mining | | | | | | |
| | Expansion of Casa de Pedra Mine capacity production. | 2007 | 2015/2016 | (1) | 1,090,568 | 1,329,565 |
| | Expansion of TECAR’s export capacity. | 2009 | 2014/2016 | (2) | 404,374 | 695,859 |
| | Current investments for maintenance of current operations. | | | | 42,866 | 332,638 |
| | | | | | 1,537,808 | 2,358,062 |
Steel | | | | | | |
| | Construction of a long steel plant to produce rebar and machine wire. | 2008 | 2014 | (3) | 1,592,016 | 1,460,694 |
| | Implementation of the AF#3’s gas pressure recovery. | 2006 | 2014 | | 74,337 | 60,750 |
| | Current investments for maintenance of current operations. | | | | 679,495 | 356,105 |
| | | | | | 2,345,848 | 1,877,549 |
Cement | | | | | | |
| | Construction of cement plants. | 2011 | 2015 | | 476,076 | 241,412 |
| | Current investments for maintenance of current operations. | | | | 28,139 | 35,656 |
| | | | | | 504,215 | 277,068 |
Total construction in progress | | | 4,771,635 | 9,192,369 |
| | | | | | | |
(*) As a result of the loss of control, the subsidiary Transnordestina was deconsolidated at December 31, 2013. (See Note 9 b.)
(1) Expected date for completion of the 40 Mtpa and 42 Mtpa stages
(2) Expected date for completion of the 45 Mtpa and 60 Mtpa stages
(3) Started in January 2014.
The costs classified in construction in progress comprise basically the acquisition of services, purchase of parts to be used as investments for improvement of performance, upgrading of technology, enlargement, expansion and acquisition of assets that will be transferred to the relevant line items and depreciated as from the time they are available for use.
The costs incurred to refurbish and replace property, plant and equipment items totaled R$151,517 as of December 31, 2013 (R$273,339 as of December 31, 2012), which were capitalized and will be depreciated over the period until the next maintenance event.
Other repair and maintenance expenses are charged to operating costs and expenses when incurred.
In view of the need to review the useful lives at least every financial transactions carried outyear, in 2013 management performed the review for all the Company’s units. As a result, the estimated useful lives for the current year are as follows:
|
|
Buildings | 43 |
Machinery, equipment and facilities | 14 |
Furniture and fixtures | 11 |
Other | 26 |
a)As of December 31, 2013, the Company capitalized borrowing costs amounting to R$490,747 (R$401,827 as of December 31, 2012). These costs are basically estimated for the mining and long steel projects, mainly relating to:(i)
FS-37
table of contents
Casa de Pedra expansion (ii); construction of the long steel mill in the city ofVolta Redonda (RJ), see notes 25 and 32.
The rates used to capitalize borrowing costs are as follows:
| | | | | |
Rates | | 12/31/2013 | | 12/31/2012 |
Specific projects | | TJLP + 1.3% to 3.2% | | TJLP + 1.3% to 3.2% |
| UM006 + 2.7% | | UM006 + 2.7% |
Unspecified projects | | 8.35% | | 8.47% |
b)Additions to depreciation, amortization and depletion for the year were distributed as follows:
| | 12/31/2013 | | 12/31/2012 | | 12/31/2011 |
Production cost | 1,068,156 | | 1,062,950 | | 892,297 |
Selling expenses | 8,248 | | 8,041 | | 7,130 |
General and administrative expenses | 17,426 | | 14,742 | | 29,941 |
| | 1,093,830 | | 1,085,733 | | 929,368 |
Other operating expenses (*) | 61,763 | | 14,739 | | 18,883 |
| | 1,155,593 | | 1,100,472 | | 948,251 |
(*) Refers to the depreciation of unused equipment (see note 24).
c)The Casa de Pedra mine is an asset that belongs to CSN, which has the exclusive right to explore such mine. Our mining activities of Casa de Pedra are based on the ‘Mine Manifest’, which grants CSN full ownership over the mineral deposits existing within our property limits.
As of December 31, 2013 the net property, plant and equipment of Casa de Pedra was R$3,277,205 (R$2,892,120 as of December 31, 2012), represented mainly by construction in progress amounting to R$1,090,642 (R$1,612,000 as of December 31, 2012).
11.INTANGIBLE ASSETS
| | Goodwill | Customer relations | Software | Other | Total |
Balance at January 1, 2012 | | | | | |
Cost | 431,173 | | 36,253 | 941 | 468,367 |
Accumulated amortization | -150,004 | | -26,523 | | -176,527 |
Adjustment for accumulated recoverable value | -60,861 | | | | -60,861 |
Balance at January 1, 2012 | 220,308 | | 9,730 | 941 | 230,979 |
Effect of foreign exchange differences | | 30,501 | 104 | 14,043 | 44,648 |
Acquisitions through business combination (*) | 235,595 | 316,939 | | 77,232 | 629,766 |
Acquisitions and expenditures | | | 916 | 472 | 1,388 |
Disposals | | | | -564 | -564 |
Transfer of property, plant and equipment | | | 3,861 | | 3,861 |
Amortization | | | -5,442 | | -5,442 |
Other movements | | | 225 | | 225 |
Balance at December 31, 2012 | 455,903 | 347,440 | 9,394 | 92,124 | 904,861 |
Cost | 666,768 | 347,440 | 41,849 | 92,124 | 1,148,181 |
Accumulated amortization | -150,004 | | -32,455 | | -182,459 |
Adjustment for accumulated recoverable value | -60,861 | | | | -60,861 |
Balance at December 31, 2012 | 455,903 | 347,440 | 9,394 | 92,124 | 904,861 |
Effect of foreign exchange differences | | 64,570 | 148 | 18,127 | 82,845 |
Acquisitions and expenditures | | | 635 | | 635 |
Disposals | | | -1 | -820 | -821 |
Impairment loss | -48,469 | | | | -48,469 |
Transfer of property, plant and equipment | | | 74,958 | | 74,958 |
Loss of control over Transnordestina | | | -10,128 | | -10,128 |
Amortization | | -30,530 | -7,691 | | -38,221 |
Other movements | | | 39 | -259 | -220 |
Balance at December 31, 2013 | 407,434 | 381,480 | 67,354 | 109,172 | 965,440 |
Cost | 666,768 | 415,899 | 107,416 | 109,172 | 1,299,255 |
Accumulated amortization | -150,004 | -34,419 | -40,062 | | -224,485 |
Adjustment for accumulated recoverable value | -109,330 | | | | -109,330 |
Balance at December 31, 2013 | 407,434 | 381,480 | 67,354 | 109,172 | 965,440 |
FS-38
(*) Goodwill based on expected future earnings, arising on the business combination of CSN Steel S. L. with this bankthe companies Stahlwerk Thüringen Gmbh (SWT) and Gallardo Sections on January 31, 2012 (see note 4).
The useful life of software is 01 to 05 years and of other intangible assets is 13 to 30 years.
Goodwill: The economic basis of goodwill is the expected future earnings and, in accordance with the new pronouncements, these amounts are limitednot amortized since January 1, 2009, when they became subject only to current account operations and investments in fixed-income securities.impairment testing.
· Ibis Participações e ServiçosImpairment testing for goodwill
Ibis Participações e ServiçosIn order to conduct impairment testing, goodwill is underallocated to CSN’s operating divisions that represent the controllowest level of assets or group of assets at which goodwill is monitored by the Company's senior management, never above Operating Segments.
Cash generating unit | | Segment | | 12/31/2013 | | 12/31/2012 | | Investor |
Packaging (*) | | Steel | | 158,748 | | 207,217 | | CSN |
Flat steel | | Steel | | 13,091 | | 13,091 | | CSN |
Long steel | | Steel | | 235,595 | | 235,595 | | CSN Steel S.L. |
| | | | 407,434 | | 455,903 | | |
(*) Goodwill of the cash-generating unit (CGU) Steel Containers is presented net of an impairment loss recorded in 2011 in the line item of other operating income and expenses in the income statement for the year, amounting to R$60,861. During the 4th quarter of 2013, the Company identified again an impairment of goodwill of the CGU Steel Containers and recorded the amount of R$48,469.
The recoverable amount of a Board memberCash-Generating Unit (“CGU”) is determined based on value-in-use calculations.
These calculations use cash flow projections, before income tax and social contribution, based on financial budgets approved by management for a three-year period. The amounts related to cash flows subsequent to the three-year period were extrapolated based on the estimated growth rates shown below. The growth rate does not exceed the average long-term growth rate of the Company.industry in which the Cash-Generating Unit (“CGU”) operates.
The main assumptions used in calculating the values in use as of December 31, 2013 are as follows:
|
| Packaging |
| Flat steel |
| Long steel |
Gross margin (i) | | Average Gross Margin based on the history and the budget projections for the next 2 years; beginning in the third year, average price, operating cost and expense projections, simulated based on an industrial activity centralization and plant modernization scenario, also taking into account other revenues from sale of assets. | | Average Gross Margin based on the history and projections approved by the Board for the next three years, and long-term price and foreign exchange curves obtained in industry reports. | | Based on the projections approved by the Board for the next three years, long-term price and foreign exchange curves, and taking into consideration the production volume ramp up after plant start-up. |
Cost adjustment | | Operating costs based on the history and the budget projections for the next two years; beginning in the third year, operating cost projections incorporating the simulated benefits based on an industrial activity centralization and plant modernization scenario. | | Cost adjustment based on historical data and price and foreign exchange curves obtained in industry reports. | | Cost adjustment based on historical data and price and foreign exchange curves obtained in industry reports. |
Growth rate (ii) | | Sales volume growth projection prepared based on the sales department’s forecast for the main market segments, and also taking into account the simulation of new production capacity based on an industrial activity centralization and plant modernization scenario. | | Average growth rate of 2.0% p.a. used to extrapolate the cash flows after the budgeted period. | | Average growth rate of 2.0% p.a. used to extrapolate the cash flows after the budgeted period. |
Discount rate (iii) | | Effective discount rate of 8.2% p.a., before income tax and social contribution. | | Effective discount rate of 8.2% p.a., before income tax and social contribution. | | Effective discount rate of 8.2% p.a., before income tax and social contribution. |
(i) Budgeted gross margin.
(ii) Weighted average growth rate, used to extrapolate the cash flows after the budgeted period.
(iii) Pretax discount rate, applied to cash flow projections.
FS-24FS-39
table of contents
12.BORROWINGS, FINANCING AND DEBENTURES
The balances of borrowings, financing and transactions between the Company and these entitiesdebentures, which are carried at amortized cost, are as follows:
| | | Rates p.a. (%) | Current liabilities | Non-current liabilities |
| | | 12/31/2013 | 12/31/2012 | 12/31/2013 | 12/31/2012 |
FOREIGN CURRENCY | | | | | | |
Prepayment | | 1% to 3.50% | 105,874 | 162,290 | 1,166,615 | 1,104,271 |
Prepayment | | 3.51% to 7.50% | 207,331 | 8,954 | 1,276,717 | 878,705 |
Perpetual bonds | | 7.00% | 3,189 | 2,781 | 2,342,600 | 2,043,500 |
Fixed rate notes | | 4.14 to 10% | 156,868 | 1,265,330 | 5,505,110 | 4,802,225 |
Financed imports | | 6.24% | | 6,813 | | |
BNDES/FINAME | | Res. 635/87 interest + 1.7% and 2.7% | 12,356 | 32,395 | | 10,755 |
Intercompany | | 6M Libor + 2.25 and 3% | | | | |
Other | | 3.51% to 7.50% + 1.2% | 49,306 | 9,860 | 442,843 | 409,337 |
| | | | 534,924 | 1,488,423 | 10,733,885 | 9,248,793 |
LOCAL CURRENCY | | | | | | |
BNDES/FINAME | | TJLP + 1.5% to 3.2% and 2.5% to 10% fixed rate | 97,044 | 346,623 | 962,684 | 1,535,255 |
Debentures | | 105.8% to 110.8% CDI and TJLP + 0.85% | 846,387 | 128,239 | 1,932,500 | 4,436,892 |
Prepayment | | 106.5% to 110,79% CDI and 8% fixed rate | 101,330 | 163,812 | 5,345,000 | 4,800,000 |
CCB | | 112.5% CDI | 1,085,436 | 62,072 | 6,200,000 | 7,200,000 |
Intercompany | | 110.79% CDI | | | | |
Other | | | 8,527 | 10,983 | 15,505 | 16,581 |
| | | | 2,138,724 | 711,729 | 14,455,689 | 17,988,728 |
Total borrowings and financing | 2,673,648 | 2,200,152 | 25,189,574 | 27,237,521 |
Transaction costs and issue premiums | -30,841 | -31,030 | -85,951 | -101,939 |
Total borrowings and financing + transaction costs | 2,642,807 | 2,169,122 | 25,103,623 | 27,135,582 |
The balances of prepaid intercompany borrowings total R$2,943,964 as of December 31, 2013 (R$2,339,776 as of December 31, 2012) and the balances of Fixed Rate Notes and Intercompany Bonds total R$2,452,956 (R$3,545,340 as of December 31, 2012), see note 19.
·Funding transaction costs
As of December 31, 2013, funding transaction costs are as follows:
| | | | | |
| | | Current | | Noncurrent | | TIR(1) |
| | | | |
Fixed rate notes | | 1,865 | | 3,830 | | 6.5% to 10.7% |
BNDES | | 631 | | 2,660 | | 1.44% to 9.75% |
Prepayment | | 8,162 | | 15,766 | | 10.08% to 12.44% |
Prepayment | | 2,213 | | 8,368 | | 2.68% to 4.04% |
CCB | | 17,472 | | 54,834 | | 11.33% to 14.82% |
Other | | 498 | | 493 | | 6.75% to 12.59% and 10.7% to 13.27% |
| | 30,841 | | 85,951 | | |
(1)TIR – Annual internal rate of return
FS-40
·Maturities of borrowings, financing and debentures presented in non-current liabilities
As of December 31, 2013, the principal of long-term borrowings, financing and debentures by maturity year is as follows:
| | | |
2015 | | 3,181,503 | | 13% |
2016 | | 3,210,020 | | 13% |
2017 | | 3,628,773 | | 14% |
2018 | | 3,997,706 | | 16% |
2019 | | 3,813,514 | | 15% |
After 2019 | | 5,015,458 | | 19% |
Perpetual bonds | | 2,342,600 | | 10% |
| | 25,189,574 | | 100% |
·Amortizations and new borrowings, financing and debentures
The table below shows the amortizations and new funding in the current year:
| | 12/31/2013 | | 12/31/2012 |
Opening balance | | 29,304,704 | | 26,973,247 |
Funding | | 1,697,363 | | 3,520,263 |
Amortization | | -4,300,240 | | -4,876,453 |
Loss of control over Trasnordestina | | -3,180,821 | | |
Other (*) | | 4,225,424 | | 3,687,647 |
Closing balance | | 27,746,430 | | 29,304,704 |
(*) Includes unrealized foreign exchange and inflation adjustments.
In December 2013, the Company redeemed all the Guaranteed Bonds issued in 2003, through its wholly-owned subsidiary CSN Islands VIII Corp., guaranteed by CSN, at a rate of 9.75% per year, amounting to US$550 million (R$1,270,775) in principal and US$27 million (R$62,295) in interest.
Borrowing and financing contracts with certain financial institutions contain some covenants that are usual in financial agreements in general and the Company is compliant with them as of December 31, 2013.
· Companhia de Gás do CearáDebentures
A natural gas distributor under the control structure of Vicunha Siderurgia.
i) Assets and liabilities
| | | | | | | | | | | | | |
| Companies | | Assets | | Liabilities |
| | Banks/Short-term
investments | | Trade
receivables | | Total | | Actuarial
liabilities | | Trade payables | | Total |
| | | | | | |
| CBS Previdência (Note 29) | | | | | | | | 11,673 | | | | 11,673 |
| Fundação CSN | | | | 1,504 | | 1,504 | | | | 321 | | 321 |
| Banco Fibra | | 72 | | | | 72 | | | | | | |
| Usiminas (Note 11) | | | | 28,509 | | 28,509 | | | | 170 | | 170 |
| Panatlântica (Note 11) | | | | 24,858 | | 24,858 | | | | | | |
| Companhia de Gás do Ceará | | | | | | | | | | 40 | | 40 |
| Total at 12/31/2011 | | 72 | | 54,871 | | 54,943 | | 11,673 | | 531 | | 12,204 |
| Total at 12/31/2010 | | 86 | | 25,881 | | 25,967 | | | | 16,133 | | 16,133 |
ii) Profiti. Companhia Siderúrgica Nacional
6th issue
In September 2012 the Company issued 156,500 nonconvertible, unsecured debentures, of which 106,500 1st series debentures and 50,000 2nd series debentures, with a unit face value of R$10 totaling R$1,565,000 that pay interestequivalent to 105.80% of the CDI Cetip rate for the 1st series and 106.00% per year for the 2nd series, maturing in March and September 2015, respectively, both with early redemption option.
FS-41
table of contents
·Guarantees provided
Guarantees provided for the borrowings comprise property, plant and equipment items and sureties and do not include guarantees provided for subsidiaries and jointly controlled entities. As of December 31, 2013, the amount is R$4,234 (R$12,233 as of December 31, 2012).
13.FINANCIAL INSTRUMENTS
I - Identification and measurement of financial instruments
The Company enters into transactions involving various financial instruments, mainly cash and cash equivalents, including short-term investments, marketable securities, trade receivables, trade payables, and borrowings and financing. Additionally, it also carries out transactions involving derivative financial instruments, especially exchange and interest rate swaps.
Considering the nature of these instruments, their fair value is basically determined by the use of Brazil’s money market and mercantile and futures exchange quotations. The amounts recorded in current assets and current liabilities have immediate liquidity or lossshort-term maturity, mostly less than three months. Considering the maturities and features of such instruments, their carrying amounts approximate their fair values.
·Classification of financial instruments
| | | | | | | | | | | |
| Companies | | Revenues | | Expenses |
| | Sales / Interest
income | | Total | | Pension fund
expenses | | Purchases/
Other
expenses | | Total |
| | | | | |
| CBS Previdência (Note 29) | | | | | | 51,595 | | | | 51,595 |
| Fundação CSN | | | | | | | | 2,650 | | 2,650 |
| Banco Fibra | | 35 | | 35 | | | | | | |
| Usiminas (Note 11) | | 310,479 | | 310,479 | | | | 7,971 | | 7,971 |
| Panatlântica (Note 11) | | 264,653 | | 264,653 | | | | | | |
| Ibis Participações e Serviços | | | | | | | | 8,961 | | 8,961 |
| Companhia de Gás do Ceará | | | | | | | | 2,570 | | 2,570 |
| Total at 12/31/2011 | | 575,167 | | 575,167 | | 51,595 | | 22,152 | | 73,747 |
| Total at 12/31/2010 | | 413,401 | | 413,401 | | 82,041 | | 58,651 | | 140,692 |
Consolidated | | | |
12/31/2013 | | 12/31/2012 |
| Notes |
| Available for sale | | Fair value through profit or loss | | Loans and receivables - effective interest rate | | Other liabilities - amortized cost method | | Balances | | Available for sale | | Fair value through profit or loss | | Loans and receivables - effective interest rate | | Other liabilities - amortized cost method | | Balances |
Assets | | | | | | | | | | | | | | | | | | | | | | |
Current assets | | | | | | | | | | | | | | | | | | | | | | |
Cash and cash equivalents | | 5 | | | | | | 9,995,672 | | | | 9,995,672 | | | | | | 11,891,821 | | | | 11,891,821 |
Trade receivables, net | | 6 | | | | | | 1,733,641 | | | | 1,733,641 | | | | | | 1,646,090 | | | | 1,646,090 |
Guarantee margin on financial instruments | | 8 and 13 | | | | | | | | | | | | | | 426,328 | | | | 426,328 |
Derivative financial instruments | | 8 and 13 | | 9,681 | | | | | | 9,681 | | | | 239,266 | | | | | | 239,266 |
Trading securities | | 8 | | | | 9,906 | | | | | | 9,906 | | | | | | | | | | |
Total | | | | | | 19,587 | | 11,729,313 | | | | 11,748,900 | | | | 239,266 | | 13,964,239 | | | | 14,203,505 |
| | | | | | | | | | | | | | | | | | | | | | |
Non-current assets | | | | | | | | | | | | | | | | | | | | | | |
Other trade receivables | | 8 | | | | | | 9,970 | | | | 9,970 | | | | | | 8,983 | | | | 8,983 |
Investments | | | | 2,405,174 | | | | | | | | 2,405,174 | | 2,336,137 | | | | | | | | 2,336,137 |
Derivative financial instruments | | 8 | | | | 3,879 | | | | | | 3,879 | | | | | | | | | | |
Short-term investments | | | | | | | | 30,756 | | | | 30,756 | | | | | | 116,753 | | | | 116,753 |
Total | | | | 2,405,174 | | 3,879 | | 40,726 | | | | 2,449,779 | | 2,336,137 | | | | 125,736 | | | | 2,461,873 |
| | | | | | | | | | | | | | | | | | | | | | | |
Total assets | | | | 2,405,174 | | 23,466 | | 11,770,039 | | | | 14,198,679 | | 2,336,137 | | 239,266 | | 14,089,975 | | | | 16,665,378 |
| | | | | | | | | | | | | | | | | | | | | | |
Liabilities | | | | | | | | | | | | | | | | | | | | | | |
Current liabilities | | | | | | | | | | | | | | | | | | | | | | |
Borrowings and financing | | 12 | | | | | | | | 2,673,648 | | 2,673,648 | | | | | | | | 2,200,152 | | 2,200,152 |
Derivative financial instruments | | 13 and 14 | | 6,822 | | | | | | 6,822 | | | | 244,333 | | | | | | 244,333 |
Trade payables | | | | | | | | | | 1,102,037 | | 1,102,037 | | | | | | | | 2,025,461 | | 2,025,461 |
Total | | | | | | 6,822 | | | | 3,775,685 | | 3,782,507 | | | | 244,333 | | | | 4,225,613 | | 4,469,946 |
| | | | | | | | | | | | | | | | | | | | | | | |
Non-current liabilities | | | | | | | | | | | | | | | | | | | | | | |
Borrowings and financing | | 12 | | | | | | | | 25,189,574 | | 25,189,574 | | | | | | | | 27,237,521 | | 27,237,521 |
Derivative financial instruments | | 13 and 14 | | 17,375 | | | | | | 17,375 | | | | | | | | | | |
Total | | | | | | 17,375 | | | | 25,189,574 | | 25,206,949 | | | | | | | | 27,237,521 | | 27,237,521 |
| | | | | | | | | | | | | | | | | | | | | | | |
Total liabilities | | | | | | 24,197 | | | | 28,965,259 | | 28,989,456 | | | | 244,333 | | | | 31,463,134 | | 31,707,467 |
·Fair value measurement
The financial instruments recognized at fair value require the disclosure of fair value measurements in three hierarchy levels.
·Level 1: quoted prices (unadjusted) in active markets for identical assets or liabilities.
FS-42
·Level 2: other available inputs, except those of Level 1 that are observable for the asset or liability, whether directly (i.e., prices) or indirectly (i.e., derived from prices)
·Level 3: inputs unavailable due to slight or no market activity and which is significant for the definition of the fair value of assets.
The following table shows the financial instruments recognized at fair value through profit or loss using a valuation method:
Consolidated | | | | | | | | 12/31/2013 | | | | | | | | 12/31/2012 |
| | Level 1 | | Level 2 | | Level 3 | | Balances | | Level 1 | | Level 2 | | Level 3 | | Balances |
Assets | | | | | | | | | | | | | | | | |
Current assets | | | | | | | | | | | | | | | | |
Financial assets at fair value through profit or loss | | | | | | | | | | | | | | | | |
Derivative financial instruments | | | | 9,681 | | | | 9,681 | | | | 239,266 | | | | 239,266 |
Trading securities | | 9,906 | | | | | | 9,906 | | | | | | | | |
Non-current assets | | | | | | | | | | | | | | | | |
Available-for-sale financial assets | | | | | | | | | | | | | | | | |
Investments | | 2,405,174 | | | | | | 2,405,174 | | 2,336,137 | | | | | | 2,336,137 |
Financial assets at fair value through profit or loss | | | | | | | | | | | | | | | | |
Derivative financial instruments | | | | 3,879 | | | | 3,879 | | | | | | | | |
Total assets | | 2,415,080 | | 13,560 | | | | 2,428,640 | | 2,336,137 | | 239,266 | | | | 2,575,403 |
| | | | | | | | | | | | | | | | | |
Liabilities | | | | | | | | | | | | | | | | |
Current liabilities | | | | | | | | | | | | | | | | |
Financial liabilities at fair value through profit or loss | | | | | | | | | | | | | | | | |
Derivative financial instruments | | | | 6,822 | | | | 6,822 | | | | 244,333 | | | | 244,333 |
Non-current liabilities | | | | | | | | | | | | | | | | |
Financial liabilities at fair value through profit or loss | | | | | | | | | | | | | | | | |
Derivative financial instruments | | | | 17,375 | | | | 17,375 | | | | | | | | |
Total liabilities | | | | 24,197 | | | | 24,197 | | | | 244,333 | | | | 244,333 |
II – Investments in financial instruments classified as available for sale and measured at fair value through OCI
These consist mainly of investments in shares acquired in Brazil involving top ranked companies, which are recognized in non-current assets, and any gains or losses are recognized in shareholders' equity, where they will remain until actual realization of the securities or when any loss is considered unrecoverable.
Impairment of financial assets classified as available for sale
The Company has investments in common (USIM3) and preferred (USIM5) shares (“Usiminas Shares”), designated as available-for-sale financial assets as they do not meet the criteria to be classified within any of the other categories of financial instruments (loans and receivables, held-to-maturity investments or financial assets at fair value through profit or loss). The asset is classified as a non-current asset under line item “investments” and is carried at fair value based on the quoted price on the stock exchange (BM&FBOVESPA).
Considering the volatility of the quotations of Usiminas shares, the Company evaluated whether, at the end of the reporting period, there was objective evidence of impairment of these financial assets, i.e., the Company’s management evaluated if the decline in the market value of Usiminas shares should be considered either significant or prolonged. In turn, this valuation requires judgment based on CSN’s policy, prepared according to practices used in the domestic and international markets, and consists of an instrument by instrument analysis based on quantitative and qualitative information available in the market, from the time an instrument shows a drop of 20% or more in its market value or from the time there is a significant drop in its market value as compared to its acquisition price during more than twelve months.
Based on the qualitative and quantitative elements, management concluded, in its best judgment, that there was evidence of a significant impairment of the investment in Usiminas shares as of June 30, 2012, and, consequently, reclassified the accumulated losses recorded in other comprehensive income amounting to R$1,599,485, net ofincome tax and social contribution, to profit for the year, by recognizing R$2,022,793 in other operating expenses and R$423,308 in deferred taxes.
FS-43
In December 2012 there was an additional recognition of R$264,441 related to deferred taxes on accumulated losses due to the annual analysis of the effective income tax and social contribution rate that took into consideration the temporary differences generated by this investment in CSN subsidiaries resulting from the reclassification of accumulated losses.
As of June 30, 2013, there was an additional decline in the quotation of the common shares (USIM3) as compared with the quotation as of June 30, 2012 which, according to the Company's accounting policy, generated a loss of R$5,002, recorded directly in other operating expenses. Beginning this date, pursuant to a Company's policy, gains and losses arising from the variation of the quotation of shares were recognized in other comprehensive income.
The Company continues to evaluate strategic alternatives with respect to its investment in Usiminas. These initiatives can, for example, affect the way an investment is recorded in the Company’s financial statements.
III – Fair values of assets and liabilities as compared to their carrying amounts
Financial assets and liabilities at fair value through profit or loss are recognized in current and non-current assets and liabilities, and any gains and possible losses are recognized as finance income or finance costs, respectively.
The amounts are recognized in the financial statements at their carrying amounts, which are substantially similar to those that would be obtained if they were traded in the market. The fair values of other long-term assets and liabilities do not differ significantly from their carrying amounts, except the amounts below.
The estimated fair value of consolidated long-term borrowings and financing was calculated at prevailing market rates, taking into consideration the nature, term and risks similar to those of the recorded contracts, and was classified in level 1 of the hierarchy of “quoted prices (unadjusted) in active markets for identical assets or liabilities”, as compared below:
| | | | 12/31/2013 | | | | 12/31/2012 |
| | Carrying amount | |
Fair value
| | Carrying amount | | Fair value |
Perpetual bonds | 2,345,789 | | 1,938,780 | | 2,046,281 | | 2,102,366 |
Fixed rate notes | 5,661,978 | | 6,032,207 | | 6,067,555 | | 6,811,081 |
d) KeyIV Financial risk management personnelpolicy
The Company has and follows a policy of managing its risks, with guidelines regarding the risks incurred by the company. Pursuant to this policy, the nature and general position of financial risks are regularly monitored and managed in order to assess the results and the financial impact on cash flow. The credit limits and the quality of counterparties’ hedge instruments are also periodically reviewed.
The risk management policy was established by the Board of Directors. Under this policy, market risks are hedged when it is considered necessary to support the corporate strategy or when it is necessary to maintain a level of financial flexibility.
Under the terms of the risk management policy, the Company manages some risks by using derivative financial instruments. The Company’s risk policy prohibits any speculative deals or short sales.
·Foreign exchange rate risk
The Company assesses its exchange exposure by subtracting its liabilities from its assets denominated in dollar and euro, thus arriving at its net exchange exposure, which is the foreign currency exposure risk. Therefore, besides the trade receivables arising from exports and investments overseas that in economic terms constitute natural hedges, the Company further considers and uses various financial instruments, such as derivative instruments (US$ to realand euro to dollar swaps, and forward exchange contracts, etc.) to manage its risks of fluctuations in currencies other than the Brazilian real.
FS-44
·Policies on the use of hedging derivatives
The key management personnel, who have authorityCompany’s financial policy reflects the parameters of liquidity, credit and responsibilitymarket risks approved by the Audit Committee and Board of Directors. The use of derivative instruments in order to prevent fluctuations in interest and exchange rates from having a negative impact on the company’s balance sheet and income statement should consider the same parameters. As provided for planning, directingin internal rules, this financial investment policy has been approved and controllingis being managed by the finance officers.
At the meetings of the Executive Officers and Board of Directors, the officers and directors routinely present and discuss the Company’s activities, includefinancial positions. Under the membersbylaws, transactions involving material amounts require the prior approval of management bodies. The use of other derivative instruments is contingent upon the express prior approval of the Board of DirectorsDirectors.
To finance its activities, the Company resorts to the capital markets, both locally and the executive officers. The following is informationinternationally, and based on the compensationindebtedness profile it is seeking, part of such personnelthe debt is pegged to foreign currency, basically to the US dollar, which causes Management to seek hedging for debt through derivative financial instruments.
To contract derivative financial instruments for hedging within the internal control structure, the following policies are adopted:
·ongoing calculation of exchange exposure that occurs by analyzing assets and liabilities exposed to foreign currency, under the related balancesfollowing terms: (i) trade receivables and payables in foreign currency; (ii) cash and cash equivalents and debts in foreign currency considering the maturity of the assets and liabilities exposed to exchange fluctuations;
·presentation of the financial position and exchange exposure on a routine basis of meetings of the Executive Officers and Board of Directors that approve the hedging strategy;
·carrying out derivative hedging transactions only with leading banks, diluting the credit risk through diversification among these banks;
·Foreign exchange exposure
The consolidated net exposure as of December 31, 2011.2013 is as follows:
| | | | | |
| | | 12/31/2011 | | 12/31/2010 |
| | | P&L | | P&L |
| Short-term benefits for employees and officers | | 23,728 | | 17,881 |
| Post-employment benefits | | 91 | | 81 |
| Other long-term benefits | | n/a | | n/a |
| Severance benefits | | n/a | | n/a |
| Share-based compensation | | n/a | | n/a |
| | | 23,819 | | 17,962 |
| n/a – not applicable | | | | |
| | | | 12/31/2013 |
Foreign Exchange Exposure | | (Amounts in
US$’000) | | (Amounts in
€’000) |
Cash and cash equivalents overseas | | 4,086,520 | | 1,266 |
Trade receivables - foreign market | | 303,186 | | 33,994 |
Intercompany borrowings | | 154,098 | | 78,026 |
Other assets | | 21,152 | | 54,152 |
Total assets | | 4,564,956 | | 167,438 |
Borrowings and financing | | -4,589,982 | | -121,041 |
Trade payables | | -39,383 | | -2,202 |
Other liabilities | | -9,140 | | -16,943 |
Intercompany borrowings | | -34,076 | | |
Total liabilities | | -4,672,581 | | -140,186 |
Gross exposure | | -107,625 | | 27,252 |
Notional amount of derivatives contracted | | 403,000 | | -90,000 |
Net exposure | | 295,375 | | -62,748 |
FS-25
FS-45
table of contents
Gains and losses on these transactions are consistent with the policies and strategies defined by management.
·e) Policy Exchange swap transactions
The Company carries out exchange swap transactions in order to hedge its assets and liabilities against any fluctuations in the US dollar-real and euro-real parities. This hedge through exchange swaps provides the Company, through the long position of the contract, with a forward rate agreement (FRA) gain on the exchange coupon, which at the same time improves our investment rates and reduces the cost of our funding in the international market.
As of December 31, 2013, the consolidated position of these contracts is as follows:
| | | | | | | | | | | | | 12/31/2013 | | | | | | | | 12/31/2012 | | 12/31/2013 |
| | | | | | | | | Appreciation (R$) | | Fair value (market) | | | | Appreciation (R$) | | Fair value (market) | | Impact on finance income (cost) in 2013 |
Counterparties | | Transaction maturity | | Functional currency | | Notional amount | | Asset position | | Liability position | | Amounts receivable/ (payable) | | Notional amount | | Asset position | | Liability position | | Amounts receivable/ (payable) | |
Santander | | 2/1/2015 | | US dollar | | 10,000 | | 26,512 | | -22,633 | | 3,879 | | 10,000 | | 22,686 | | -20,946 | | 1,740 | | 2,139 |
Goldman Sachs | | 1/4/2014 | | US dollar | | 10,000 | | 23,697 | | -22,799 | | 898 | | | | | | | | | | 898 |
HSBC | | 1/4/2014 | | US dollar | | 90,000 | | 213,306 | | -205,171 | | 8,135 | | | | | | | | | | 8,135 |
Total dollar-to-CDI swap | | | | 110,000 | | 263,515 | | -250,603 | | 12,912 | | 10,000 | | 22,686 | | -20,946 | | 1,740 | | 11,172 |
| | | | | | | | | | | | | | | | | | | | | | |
Itaú BBA | | 7/5/2014 | | US dollar | | 60,000 | | 141,019 | | -141,359 | | -340 | | | | | | | | | | -340 |
Itaú BBA | | 5/7/2014 to 5/14/2014 | | US dollar | | 25,000 | | 58,734 | | -58,485 | | 249 | | | | | | | | | | 249 |
HSBC | | 7/5/2014 | | US dollar | | 153,000 | | 359,599 | | -360,487 | | -888 | | | | | | | | | | -888 |
HSBC | | 5/7/2014 to 5/14/2014 | | US dollar | | 55,000 | | 129,244 | | -128,862 | | 382 | | | | | | | | | | 382 |
Total dollar-to-real swap (NDF) | | | | 293,000 | | 688,596 | | -689,193 | | -597 | | | | | | | | | | -597 |
| | | | | | | | | | | | | | | | | | | | | | |
BES | | 3/31/2014 to 4/24/2014 | | US dollar | | 11,801 | | 27,878 | | -27,861 | | 17 | | 44,392 | | 90,687 | | -94,928 | | -4,241 | | 4,035 |
Total dollar-to-euro swap | | | | 11,801 | | 27,878 | | -27,861 | | 17 | | 44,392 | | 90,687 | | -94,928 | | -4,241 | | 4,035 |
| | | | | | | | | | | | | | | | | | | | | | | |
Itaú BBA | | 02/19/2014 | | Euro | | 30,000 | | 94,858 | | -96,632 | | -1,774 | | 40,000 | | 51,793 | | -52,876 | | -1,083 | | -2,534 |
HSBC | | 02/19/2014 | | Euro | | 30,000 | | 94,900 | | -96,632 | | -1,732 | | 25,000 | | 32,373 | | -33,047 | | -674 | | -8,097 |
Goldman Sachs | | 02/19/2014 | | Euro | | 30,000 | | 94,880 | | -96,632 | | -1,752 | | 25,000 | | 32,363 | | -33,047 | | -684 | | -2,559 |
Total dollar-to-euro swap (NDF) | | | | 90,000 | | 284,638 | | -289,896 | | -5,258 | | 90,000 | | 116,529 | | -118,970 | | -2,441 | | -13,190 |
| | | | | | | | | | | | | | | | | | | | | | |
Deutsche Bank | | 12/12/2013 | | Yen | | | | | | | | | | 59,090,000 | | 237,526 | | -236,965 | | 561 | | -5,374 |
Total yen-to-dollar swap | | | | | | | | | | | | 59,090,000 | | 237,526 | | -236,965 | | 561 | | -5,374 |
| | | | | | | | | | | | | | | | | | | | | | | |
CSFB | | 12/2/2014 | | Real | | 21,500 | | 36,526 | | -36,862 | | -336 | | 64,500 | | 109,540 | | -110,226 | | -686 | | -4,268 |
Total LIBOR-to-CDI interest rate swap | | | | 21,500 | | 36,526 | | -36,862 | | -336 | | 64,500 | | 109,540 | | -110,226 | | -686 | | -4,268 |
| | | | | | | | | | | | | | | | | | | | | | |
Itaú BBA | | 1/3/2016 | | Real | | 150,000 | | 152,610 | | -159,712 | | -7,102 | | | | | | | | | | -7,102 |
HSBC | | 2/5/2016 to 3/1/2016 | | Real | | 185,000 | | 187,395 | | -197,157 | | -9,762 | | | | | | | | | | -9,762 |
Deutsche Bank | | 1/3/2016 | | Real | | 10,000 | | 10,114 | | -10,625 | | -511 | | | | | | | | | | -511 |
Fixed rate-to-CDI interest rate swap | | | | 345,000 | | 350,119 | | -367,494 | | -17,375 | | | | | | | | | | -17,375 |
| | | | | | | | | | | | | | | | | | | | | | | |
| | | | 1,651,272 | | -1,661,909 | | -10,637 | | | | 576,968 | | -582,035 | | -5,067 | | -25,597 |
·Classification of the derivatives in the balance sheet and statement of income
FS-46
table of contents
| | | | | | | | | | | | | | 12/31/2013 |
Instruments | | Assets | | Liabilities | | Finance income (costs), net (Note 25) |
| | Current | | Non-current | | Total | | Current | | Non-current | | Total | |
CDI-to-dollar swap | | 9,033 | | 3,879 | | 12,912 | | | | | | | | 11,172 |
Dollar-to-euro swap (NDF) | | | | | | | | 5,258 | | | | 5,258 | | -13,190 |
Yen-to-dollar swap (*) | | | | | | | | | | | | | | -5,374 |
Dollar-to-euro swap | | 17 | | | | 17 | | | | | | | | 4,035 |
Dollar-to-real swap (NDF) | | 631 | | | | 631 | | 1,228 | | | | 1,228 | | -597 |
Libor-to-CDI swap | | | | | | | | 336 | | | | 336 | | -4,268 |
Fixed rate-to-CDI swap | | | | | | | | | | 17,375 | | 17,375 | | -17,375 |
| | | 9,681 | | 3,879 | | 13,560 | | 6,822 | | 17,375 | | 24,197 | | -25,597 |
| | | | | | | | | | | | | | | |
| | | | | | | | | | | | | | | 12/31/2012 |
Instruments | | Ativo | | Passivo | | Finance income (costs), net (Note 25) |
| | Current | | Non-current | | Total | | Current | | Non-current | | Total | |
CDI-to-dollar swap | | 1,740 | | | | 1,740 | | | | | | | | 8,301 |
Dollar-to-euro swap (NDF) | | | | | | | | 2,441 | | | | 2,441 | | -5,116 |
Yen-to-dollar swap | | 237,526 | | | | 237,526 | | 236,965 | | | | 236,965 | | 307 |
Dollar-to-euro swap | | | | | | | | 4,241 | | | | 4,241 | | -8,065 |
Libor-to-CDI swap | | | | | | | | 686 | | | | 686 | | -9,166 |
| | | 239,266 | | | | 239,266 | | 244,333 | | | | 244,333 | | -13,739 |
(*) The positions of the swap transactions were settled on December 12, 2013, together with its guarantee deposit.
Dollar-to-CDI exchange swap
As of December 31, 2013 the Company held a short position in a foreign exchange swap of US$110,000,000, where it receives exchange differences plus interest of 3.5% per year on average and pays 100% of CDI in the short position of the foreign exchange swap.
Dollar-to-real swap (NDF)
The Company conducted NDF (Non Deliverable Forward) transactions for the purpose of ensuring the forward purchase of US dollars, which are settled, without physical delivery, by the difference in contracted R$/US$ buy parity against the R$/US$ sell parity, with is the Sale Ptax T-1 to maturity. The transactions are contracted with prime financial institutions, on the over-the-counter market, and allocated to the exclusive funds.
US dollar-to-Euro exchange swap
The subsidiary Lusosider carries out transactions with derivatives to hedge its exposure against the euro-dollar fluctuation.
US dollar-to-Euro exchange swap (NDF)
In addition to the swaps above, the Company also contracted NDFs (non-deliverable forwards) to hedge its euro-denominated assets. Basically the Company contracted financial derivatives for its euro-denominated assets, where it will receive the difference between the US dollar exchange rate change for the period, multiplied by the notional amount (long position) and pay the difference between the exchange rate change in euro for the period on the notional euro amount on the contract date (short position). In general, these are transactions conducted in the Brazilian over-the-counter market that have as counterparties prime financial institutions, contracted under the exclusive funds.
Interest rate swap transactions (LIBOR to CDI)
FS-47
The objective of these transactions is to hedge transactions indexed to US dollar LIBOR against fluctuations in Brazilian interest rates. Basically, the Company carried out swaps of its obligations indexed to the LIBOR, in which it receives interest of 1.25% p.a. on the notional value of the dollar (long position) and pays 96% of the CDI on the notional amount in reais of the contract date (short position), hedging an export prepayment transaction of the same amount. The gains and losses on these contracts are directly related to fluctuations in exchange rates (US$) and interest rates (LIBOR and CDI). In general, these are transactions conducted in the Brazilian over-the-counter market that have as counterparty a prime financial institution.
Interest rate swap transactions (Fixed rate to CDI)
Its purpose is to peg obligations subject to a fixed rate to the fluctuation of the average interest rate of the one-day interbank deposits (CDI), calculated and disclosed by CETIP. Basically, the Company carried out swaps of its obligations indexed to the fixed rate, in which it receives interest on the notional amount (long position) and pays 100% of the CDI on the notional amount in reais of the contract date (short position). The gains and losses on this contract are directly related to CDI variation. In general, these are transactions conducted in the Brazilian over-the-counter market that have as counterparty a prime financial institution, contracted within the exclusive funds.
·Sensitivity analysis of exchange rate swaps
The Company considered scenarios 1 and 2 as 25% and 50% of appreciation for volatility of the currency, using as reference the closing exchange rate as of December 31, 2013 for dollar-to-real exchange swap R$2.3426, and for dollar-to-euro exchange swap R$1.3773.
| | | | | | | | | | | 12/31/2013 |
Instruments | | Notional amount | | Risk | | Probable scenario (*) | | Scenario 1 | | Scenario 2 |
Dollar-to-CDI exchange swap | | 110,000 | | US dollar | | 12,912 | | -64,422 | | -128,844 |
| | | | | | | | | | | |
Total dollar-to-euro swap (NDF) | | -90,000 | | Euro | | 5,258 | | 72,595 | | 145,192 |
| | | | | | | | | | | |
Euro-to-dollar exchange swap | | 11,801 | | US dollar | | 17 | | -13,109 | | -26,222 |
| | | | | | | | | | | |
Dollar-to-real swap (NDF) | | 293,000 | | US dollar | | 597 | | -171,595 | | -343,191 |
(*) The sensitivity analysis is based on the assumption of maintaining, as a probable scenario, the market values as of December 31, 2013 recognized in liabilities.
·Sensitivity analysis of interest rate swaps
The Company considered scenarios 1, 2, 3 and 4 as 25% and 50% of appreciation and devaluation for volatility of the interest as of December 31, 2013.
| | | 12/31/2013 |
Instruments | | Notional amount | | Risk | | Scenario 1 | | Scenario 2 | | Scenario 3 | | Scenario 4 |
| | | | | | | | | | | | |
LIBOR-to-CDI interest rate swap | | 21,500 | | (Libor) US$ | | -9,849 | | -11,725 | | 9,849 | | 11,725 |
| | | | | | | | | | | | |
Fixed rate-to-CDI interest rate swap | | 345,000 | | CDI | | -11,428 | | -19,855 | | 5,425 | | 13,852 |
·Interest rate risk
Short- and long-term liabilities indexed to floating interest rate and inflation indices. Due to this exposure, the Company undertakes derivative transactions to better manage these risks.
·Sensitivity analysis of changes in interest rates
FS-48
The Company considers the effects of a 5% increase or decrease in interest rates on its outstanding borrowings, financing and debentures as of December 31, 2013 in the consolidated financial statements.
| | | | | Impact on profit or loss |
Changes in interest rates | | % a.a | | 12/31/2013 | | 12/31/2012 |
TJLP | | 5.00 | | 2,521 | | 8,409 |
Libor | | 0.35 | | 5,725 | | 6,535 |
CDI | | 9.77 | | 71,507 | | 49,566 |
·Share market price risks
The Company is exposed to the risk of changes in equity prices due to the investments made and classified as available-for-sale. Equity investments refer to blue chips traded on BM&F BOVESPA.
The following table shows the impact of the net changes in the market value of financial instruments classified as available-for-sale on shareholders' equity, in other comprehensive income.
| | | | | | | |
| | | Other comprehensive income |
| | | 12/31/2013 | | 12/31/2012 | | Net change |
Net change in available-for-sale financial assets | | 779,526 | | 732,141 | | 47,385 |
The Company considers as probable scenario the amounts recognized at market values as of December 31, 2013. Sensitivity analysis is based on the assumption of maintaining as probable scenario the market values as of December 31, 2013. Therefore, there is no impact on the financial instruments classified as available for sale already presented above. The Company considered scenarios 1 and 2 as 25% and 50% of appreciation for volatility of the shares.
| | | | Impact on equity |
Companies | | Probable | | Scenario 1 | | Scenario 2 |
Usiminas | | 772,190 | | 199,711 | | 399,421 |
Panatlântica | | 7,336 | | 2,947 | | 5,894 |
| | 779,526 | | 202,658 | | 405,315 |
·Credit risks
The exposure to credit risks of financial institutions is in line with the parameters established in the financial policy. The Company adopts the practice of analyzing in detail the financial position of its customers and suppliers, establishing a credit limit and conducting ongoing monitoring of the outstanding balance.
As regards short-term investments, the Company only makes investments in institutions with low credit risk as rated by credit rating agencies. As part of the funds is invested in repos (repurchase agreements) backed by Brazilian government bonds, there is also exposure to Brazil’s sovereign risk.
·Capital management
The Company manages its capital structure to ensure that it will be capable of providing return to its shareholders and benefits to other stakeholders, and maintain an optimal capital structure to reduce this cost.
·Liquidity risk
FS-49
It is the risk that the Company may not have sufficient net funds to honor its financial commitments as a result of mismatching of terms or volumes between scheduled receipts and payments.
To manage cash liquidity in domestic and foreign currency, assumptions of future disbursements and receipts are established and daily monitored by the treasury area. The payment schedules for the long-term portions of borrowings, financing and debentures are shown in note 12.
The following table shows the contractual maturities of financial liabilities, including accrued interest.
| | | | | | | | | | |
At December 31, 2013 | Less than one year | | From one to two years | | From two to five years | | Over five years | | Total |
Borrowings, financing and debentures | 2,673,648 | | 6,391,523 | | 11,439,993 | | 7,358,058 | | 27,863,222 |
Derivative financial instruments | 6,822 | | 17,375 | | | | | | 24,197 |
Trade payables | 1,102,037 | | | | | | | | 1,102,037 |
| | | | | | | | | |
At December 31, 2012 | | | | | | | | | |
Borrowings, financing and debentures | 2,200,152 | | 2,838,954 | | 10,248,009 | | 14,150,558 | | 29,437,673 |
Derivative financial instruments | 244,333 | | | | | | | | 244,333 |
Trade payables | 2,025,461 | | | | | | | | 2,025,461 |
V – Margin deposits
The Company holds margin deposits totaling R$426,328 as of December 31, 2012; this amount is invested at Deutsche Bank as guarantee of the derivative financial instrument contracts, basically swaps between CSN Islands VIII and CSN. This deposit was settled together with the respective swap on December 12, 2013.
14.OTHER PAYABLES
The group of other payables classified in current and non-current liabilities is comprised as follows:
| Current | Non-current |
| | 12/31/2013 | | 12/31/2012 | | 12/31/2013 | | 12/31/2012 |
Payables to related parties (Note 19 b) | 422,150 | | 703,236 | | 8,522,685 | | 7,758,093 |
Derivative financial instruments (Note 13 I) | 6,822 | | 244,333 | | 17,375 | | |
Dividends and interest on capital payable to Company owners (Note 19 a) | | | 155,537 | | | | |
Dividends and interest on capital payable non-controlling shareholders | 2,036 | | 146,081 | | | | |
Advances from customers | 28,213 | | 31,062 | | | | |
Taxes in installments (Note 16) | 247,387 | | 166,818 | | 1,454,838 | | 1,085,079 |
Profit sharing - employees | 121,631 | | 7,771 | | | | |
Other payables | 144,612 | | 127,202 | | 66,673 | | 165,877 |
| 972,851 | | 1,582,040 | | 10,061,571 | | 9,009,049 |
15.INCOME TAX AND SOCIAL CONTRIBUTION
(a)Income tax and social contribution recognized in profit or loss:
The income tax and social contribution recognized in profit or loss for the year are as follows:
| | 12/31/2013 | | 12/31/2012 | | 12/31/2011 |
Income tax and social contribution (expenses) income | | | | | |
Current | -1,290,755 | | -321,999 | | -136,427 |
Deferred | 1,216,594 | | 1,274,207 | | 52,542 |
| -74,161 | | 952,208 | | -83,885 |
FS-50
The reconciliation of Company and consolidated income tax and social contribution expenses and income and the result from applying the effective rate on profit before income tax (IRPJ) and social contribution (CSLL) are as follows:
| | 12/31/2013 | | 12/31/2012 | | 12/31/2011 |
Profit (loss) before income tax and social contribution | 608,155 | | (1,432,782) | | 3,751,119 |
Tax rate | 34% | | 34% | | 34% |
Income tax and social contribution at combined statutory rate | -206,773 | | 487,146 | | -1,275,380 |
Adjustment to reflect effective rate: | | | | | |
Interest on capital benefit | 255,000 | | | | |
Share of profits of investees | | | | | |
Income subject to special tax rates or untaxed | 227,097 | | 444,378 | | 1,279,431 |
Transfer pricing adjustment | -31,404 | | | | |
Tax incentives | | | | | 73,134 |
REFIS effect | -689,299 | | 39,256 | | -16,060 |
Sale of nondeductible securities | | | | | -189,946 |
Tax loss carryforwards without recognizing deferred taxes | -166,734 | | -42,683 | | |
Subsidiaries’ tax credit | 550,270 | | | | 44,434 |
Other permanent deductions (add-backs) | -12,318 | | 24,111 | | 502 |
Income tax and social contribution in profit for the year | -74,161 | | 952,208 | | -83,885 |
Effective tax rate | 12% | | -66% | | -2% |
(b)Deferred income tax and social contribution:
The deferred income tax and social contribution are calculated on income tax and social contribution loss carryforwards and related temporary differences between the tax bases of assets and liabilities and the accounting balances of the financial statements. They are presented at net amounts when related to a sole jurisdiction.
| | Opening balance | Movement | Closing balance |
| | 12/31/2012 | Comprehensive
income | Profit or
loss | Tax
credits
(**) | 12/31/2013 |
Deferred tax assets | | | | | |
Income tax loss carryforwards | 818,705 | 32,800 | 289,105 | -8,314 | 1,132,296 |
Social contribution loss carryforwards | 242,606 | | 153,390 | -6,690 | 389,306 |
Acquisition of income tax loss carryforwards (Law 12,865/13 REFIS) | | | 401,953 | -401,953 | |
Acquisition of social contribution tax loss carryforwards (Law 12,865/13 REFIS) | | | 148,316 | -148,316 | |
Temporary differences | 1,115,768 | -77,567 | 210,724 | | 1,248,925 |
- Provision for tax, social security, labor, civil and environmental risks | 171,262 | | 36,245 | | 207,507 |
- Provision for environmental liabilities | 130,358 | | -12,563 | | 117,795 |
- Asset impairment losses | 53,887 | | -437 | | 53,450 |
- Inventory impairment losses | 29,638 | | -1,082 | | 28,556 |
- (Gains) losses on financial instruments | 47,524 | | -51,349 | | -3,825 |
- (Gains) losses on available-for-sale financial assets | 310,586 | -24,410 | 803 | | 286,979 |
- Actuarial liability (pension and healthcare plan) | 157,684 | -33,143 | 7,397 | | 131,938 |
- Accrued supplies and services | 55,072 | | 36,735 | | 91,807 |
- Allowance for doubtful debts | 25,812 | | 1,937 | | 27,749 |
- Goodwill on merger | -89,402 | -19,996 | -13,774 | | -123,172 |
- Unrealized exchange differences (*) | 197,944 | | 348,097 | | 546,041 |
- (Gain) on loss of control over Transnordestina | | | -224,096 | | -224,096 |
- Other | 25,403 | -18 | 82,811 | | 108,196 |
Non-current assets | 2,177,079 | -44,767 | 1,203,488 | -565,273 | 2,770,527 |
| | | | | | |
Deferred tax liabilities | | | | | |
- Business combination | 225,965 | 41,263 | -15,119 | | 252,109 |
- Other | 12,276 | 2,435 | 2,013 | | 16,724 |
Non-current liabilities | 238,241 | 43,698 | -13,106 | | 268,833 |
(*) The Company taxes foreign exchange differences on a cash basis to calculate income tax and social contribution.
(**) Use of tax credits on tax loss carryforwards of subsidiaries to settle tax debts as prescribed by Law 12865/13, Art. 40, Par. 7 (REFIS). (See Note 16.)
FS-51
Some Group companies recognized tax credits on income tax and social contribution loss carryforwards not subject to statute of limitations and based on the history of profitability and expected future taxable profits determined in technical studies approved by Management.
Since they are subject to significant factors that may change the projections for realization, the carrying amounts of deferred tax assets and projections are reviewed annually. These studies indicate the realization of these tax assets within the term stipulated by the mentioned instruction and the limit of 30% of the taxable profit.
The estimate of recovery of the deferred income tax and social contribution assets is as follows:
|
| |
Up to 1 year | | 380,960 |
From 1 to 2 years | | 485,077 |
From 2 to 3 years | | 651,435 |
From 3 to 5 years | | 4,130 |
|
| 1,521,602 |
Certain Group companies have tax assets amounting to R$196,461 and R$28,556, related to income tax and social contribution loss carryforwards, for which no deferred taxes were set up, of which R$37,082 expire in 2015, R$10,982 in 2018 and R$84,324 in 2025. The remaining tax assets refer to domestic companies and, therefore, are not subject to statute of limitations.
The Company’s corporate structure includes foreign subsidiaries whose profits are subject to income tax levied by the related countries, recognized at tax rates lower than the prevailing rate in Brazil.
For the years of 2010 to 2013 these subsidiaries generated profits amounting to R$4,027,058, which, tax authorities may understand that have already been distributed, hence, it would be subject to additional taxation in Brazil, in the approximate amount of R$1,300,000 in income tax and social contribution. The Company, based on its legal counsel’s opinion, assessed the likelihood of loss as possible in a potential challenge by tax authorities and, therefore, no provision was recognized in the financial statements.
(c)Income tax and social contribution recognized in shareholders' equity:
The income tax and social contribution recognized directly in shareholders' equity are as follows:
| | 12/31/2013 | | 12/31/2012 | | 12/31/2011 |
Income tax and social contribution | | | | | |
Actuarial gains on defined benefit pension plan | 33,012 | | 66,155 | | 54,714 |
Changes in the fair value on available-for-sale financial assets | -401,574 | | -377,164 | | 241,484 |
Exchange differences on translating foreign operations | -425,510 | | -425,510 | | -425,510 |
| -794,072 | | -736,519 | | -129,312 |
(d)Provisional Measure no. 627 of 2013 (“MP 627/13”)
FS-52
table of contents
On November 11, 2013 the Provisional Measure no.627 (“MP”) was issued to repeal the Transitional Tax Regime (RTT) and introduce other provisions, including: (i) it amends Decree-Law 1,598/77, which addresses the corporate income tax, and the social contribution on net income law; (ii) it establishes that any change in or the adoption of accounting methods and criteria under administrative measures issued based on the jurisdiction attributed by the Commercial Law, after the enactment of this Provisional Act, shall not have any impact on the calculation of federal taxes until a tax law addressing the matter is enacted; (iii) it provides for a specific treatment of the potential taxation of profits or dividends; (iv) it includes provisions on the calculation of interest on capital; and (v) it provides new considerations about investments accounted for by the equity method of accounting. The provisions of Provisional Act 627 are effective from 2015, however, its early irrevocable adoption in 2014 could eliminate the potential tax effects, especially those related to dividends and interest on capital actually paid since 2008 until the Provisional Act issue date.
The Company prepared studies on the possible effects that could arise from the provisions of said Provisional Act and concluded that they would not result in material adjustments to its financial statements for the year ended December 31, 2013.
Management is awaiting the analysis of said Provisional Measure by the Legislative Authority to decide on its possible early adoption in calendar 2014.
(e)Tax incentives
AtThe Company is granted by Income Tax incentives based on the legislation in effect, such as: Worker Food Program, the Rouanet Law (tax incentives related to cultural activities), Tax Incentives for Audiovisual Activities, and Funds for the Rights of Children and Adolescents. As of December 31, 2013, these tax incentives total R$329 (R$237 as of December 31, 2012).
16.TAXES IN INSTALLMENTS
In November and December 2013 the Company joined the Tax Recovery Program established by Law 12,865/13 and Law 11,941/09.
The position of the debts arising from these tax installment plans, recorded in taxes in installments in current and non-current liabilities, is as follows:
| Current | Non-current |
| | 12/31/2013 | | 12/31/2012 | | 12/31/2013 | | 12/31/2012 |
Federal REFIS Law 11,941/09 (a) | 140,446 | | 119,977 | | 1,001,630 | | 998,668 |
Federal REFIS Law 12,865/13 (a) | 27,124 | | | | 384,872 | | |
Other taxes in installments (b) | 79,817 | | 46,841 | | 68,336 | | 86,411 |
| | 247,387 | | 166,818 | | 1,454,838 | | 1,085,079 |
a)Tax Recovery Program (Federal Refis) – Law11,941/09 and Law 12,865/13
·New deadline – Law 11,941/09
On November 26, 2009, the Company and some subsidiaries joined the Tax Recovery Programs established by Law 11,941/09 and Provisional Act 470/2009, aimed at settling tax liabilities through a meeting heldspecial payment system and installment plan for the settlement of tax and social security obligations.
With the new deadline to join the Law11,941/09 tax installment program established by the RFB/PGFN, pursuant to Law 12,865/13, the Company analyzed with its legal counsel the lawsuits that could have changed or be subject to new jurisprudence, the Company concluded that some tax debts could be included in the new tax installment plan onDecember 11, 2000,27, 2013.
FS-53
·Profits for Foreign Subsidiaries– Law 12,865/13
Under Article 40 of Law 12,865/13, the federal government allowed the payment in installments of income tax and social contribution arising from the application of Article 74 ofProvisional Measure2158-35/2001, the so-called Profits for Foreign Subsidiaries, which requires that profits earned by foreign subsidiaries or associates be taxed at yearend.
The Company elected to join the amounts corresponding to the assessed period (2004-2009), on November 29, 2013.
Both programs provide for reductions in fines and interest, however, only income tax and social contribution debt arising from the application of Law 12,865/12 could be settled with tax credits claimed on tax loss carryforwards of subsidiaries and the Company. The tax credit utilized by the subsidiaries total R$565,273, of which R$550,270 did not have a recognized tax credit, as shown in Note 15.
The remaining balance was divided into 180 monthly installments adjusted by the SELIC and the amount determined pursuant to Laws 11,941/09 and 12,865/13 is subject to approval by the tax authorities.
The adoption of the programs described above had a negative impact on the Company's profit for the fourth quarter, as shown below:
| | |
Taxes | | -805,748 |
Fines and charges | | -569,465 |
Interest | | -519,764 |
Total | | -1,894,977 |
| | |
Discounts | | |
Fines and charges | | 446,570 |
Interest | | 255,102 |
Utilization of income tax and social contribution credit on tax loss carryforwards | 565,273 |
Total reductions | | 1,266,945 |
| | |
Total taxes payable | | -628,032 |
| | |
Deferred income tax and social contribution on fines and interest | 224,769 |
| | |
Net effect on loss (profit) | | -403,263 |
b)Other tax installments (regular and other)
The Group companies also joined the Regular social security tax (INSS) installment plan and other plans.
17.PROVISION FOR TAX, SOCIAL SECURITY, LABOR, CIVIL AND ENVIRONMENTAL RISKS AND JUDICIAL DEPOSITS
Claims of different nature are being challenged at the appropriate courts. Details of the accrued amounts and related judicial deposits are as follows:
| | | | | | | | |
| | | | 12/31/2013 | | | | 12/31/2012 |
| | Accrued liabilities | | Judicial deposits | | Accrued liabilities | | Judicial deposits |
Tax | | 259,725 | | 87,391 | | 178,657 | | 99,400 |
Social security and labor | | 298,637 | | 138,911 | | 263,700 | | 156,772 |
Civil | | 82,143 | | 29,022 | | 96,705 | | 36,109 |
Environmental | | 4,262 | | 961 | | 7,056 | | |
Judicial deposits | | | | 8,935 | | | | 11,350 |
| | | 644,767 | | 265,220 | | 546,118 | | 303,631 |
Legal obligations challenged in courts: | | | | | | | | |
Tax | | | | | | | | |
Salary Premium for education | | 46,193 | | 46,193 | | 24,077 | | 46,193 |
Income tax on ”Plano Verão” | | 20,892 | | 366,951 | | 20,892 | | 348,969 |
Other provisions | | 101,331 | | 15,350 | | 97,157 | | 19,233 |
| | | 168,416 | | 428,494 | | 142,126 | | 414,395 |
| | 813,183 | | 693,714 | | 688,244 | | 718,026 |
FS-54
table of contents
The changes in the provision for tax, social security, labor, civil and environmental risks in the year ended December 31, 2013 were as follows:
| | | | | | | | | | | |
| | | | | | | | | | Current + Non-current |
Nature | | 12/31/2012 | | Additions | | Net adjustment | | Net utilization of reversal | | 12/31/2013 |
Tax | | 320,783 | | 72,980 | | 42,475 | | -8,097 | | 428,141 |
Social security | | 43,858 | | | | 3,403 | | | | 47,261 |
Labor | | 219,842 | | 100,304 | | 24,924 | | -93,694 | | 251,376 |
Civil | | 96,705 | | 6,862 | | 2,022 | | -23,446 | | 82,143 |
Environmental | | 7,056 | | 3,663 | | 964 | | -7,421 | | 4,262 |
| | | 688,244 | | 183,809 | | 73,788 | | -132,658 | | 813,183 |
The provision for tax, social security, labor, civil and environmental liabilities was estimated by management and is mainly based on the legal counsel’s assessment. Only proceedings for which the risk is classified as probable loss are accrued. Moreover, this provision includes tax liabilities resulting from contingencies filed by the Company, subject to SELIC (Central Bank’s policy rate).
a) Tax lawsuits
I - Income tax and social contribution
“Plano Verão” -CSN is claiming the recognition of financial and tax effects on the calculation of income tax and social contribution, related to removal by the government of inflation measured according to the Consumer Price Index (IPC) in January and February 1989, involving a total percentage figure of 51.87% (‘Plano Verão”).
In 2004, the lawsuit was terminated with a final and unappealable decision that granted the right to apply the index of 42.72% (January 1989), with the 12.15% already applied to be deducted from this index. The final decision also granted application of the index of 10.14% (February 1989). The proceeding is currently at expert discovery stage.
As of December 31, 2013, there is an amount of R$366,951 (R$348,969 as of December 31, 2012) deposited in court, classified in a specific account of judicial deposits in long-term receivables, and a provision of R$20,892 (R$20,892 as of December 31, 2012), which represents the portion not recognized by the courts.
FS-55
II - Salary premium for education - "Salário Educação"
CSN has filed a lawsuit challenging the constitutionality of the salary premium for education and for discussing the possibility of recovering the amounts paid in the period from January 5, 1989 to October 16, 1996. The lawsuit was unsuccessful, and the TRF upheld the decision unfavorable to CSN, a decision that is final and unappealable.
In view of the final and unappealable decision, CSN tried to make payment of the amount due, though the FNDE and INSS did not reach an agreement as to which agency should receive it. They also required that the amount should be paid along with a fine, with which the Company did not agree.
Lawsuits were then filed challenging the above events, with judicial deposit of the amounts involved in the lawsuits. In the first lawsuit, the lower court partly accepted the Company’s request, with the judge deducting the fine, but upholding the SELIC rate, with counterarguments against the defendant’s appeal against the SELIC rate.
As of December 31, 2013 the accrued amount totals R$46,193 (R$24,077 as of December 31, 2012) and the judicial deposit amounts to R$46,193 (R$46,193 as of December 31, 2012).
III - Other
CSN has also recognized provisions for lawsuits relating to INSS, FGTS Complementary Law 110, PIS Law 10,637/02 and PIS/COFINS - Manaus Free Trade Zone, totaling R$101,331 as of December 31, 3012 (R$97,157 as of December 31, 2012), which includes legal charges.
b) Payroll and related taxes
As of December 31, 2013, the Group is a defendant in 9,067 labor lawsuits, for which a provision has been recorded in the amount of R$251,376 (R$219,842 as of December 31, 2012). Most of the claims relate to subsidiary and/or joint liability, salary equalization, health hazard premiums and hazardous duty premiums, overtime pay, difference in the 40% fine for the severance pay fund (FGTS) as a result of federal government economic plans, health care plan, indemnity claims resulting from alleged occupational diseases or on-the-job accidents, breaks between working hours, and differences in profit sharing from 1997 to 1999 and from 2001 to 2003.
c) Civil lawsuits
Among the civil lawsuits in which the Company is a defendant are claims for compensation. Generally these lawsuits result from on-the-job accidents, occupational diseases and contractual litigation related to the industrial activities of the Group, real estate actions, healthcare plan, and reimbursement of costs incurred in labor courts. For lawsuits involving civil matters, a provision has been recognized in the amount of R$82,143 as of December 31, 2013 (R$96,705 as of December 31, 2012).
d) Other
§Competition
On June 14, 2010, the Regional Federal Court of Brasília rejected the annulment action filed by CSN against CADE, which aimed at annulling its fine for the alleged infringements laid down in Articles 20 and 21, I, of Law 8,884/1984. The Company filed appropriate appeals against this decision, which were dismissed, resulting in the filing of a Motion for clarification, which is pending judgment. The collection of the R$65,292 fine is suspended by a Court decision, which stays the collection as from the date CSN issued a guarantee letter. This proceeding is classified as risk of possible loss.
§Environmental
The environmental administrative/judicial proceedings filed against the Company include mainly administrative proceedings for alleged environmental irregularities and the regularization of environmental permits; at the judicial level, the Company is a party to actions collecting the fines imposed for such alleged environmental irregularities andpublic civil actions claiming regularization coupled with compensation, in most cases claiming environmental recovery. In general these proceedings arise from alleged damages to the environment related to the Company’s industrial activities. The environmental proceedings total R$4,262 (R$7,056 as of December 31, 2012).
FS-56
table of contents
In July 2012 the Company received a legal notice in the lawsuit filed by the State Attorney's Office of the State of Rio de Janeiro, related to Volta Grande IV district in the city of Volta Redonda-RJ, claiming, among others, the removal of two industrial waste cells and 750 (seven hundred and fifty) homes. This lawsuit is classified as probable loss risk, but there is not an estimated amount due to the illiquidity of the claims.
As a result of the lawsuit mentioned in the paragraph above, after August 2012 the Company received legal notices related to some lawsuits filed by one of the dwellers of the Volta Grande IV district, who claims the payment of compensation for property damages and pain and suffering, whose amounts are illiquid at the moment, and this lawsuit is classified as possible loss risk.
On the same matter (Bairro Volta Grande IV), in August 2013 the Company received a subpoena about the lawsuits filed by the Federal Public Prosecution Office (Federal Courts), which has the same claim of the lawsuit filed by the State Public Prosecution Office, described above. This new lawsuit is classified with a possible level of risk, since the trend is that the State courts’ decision prevails also in the Federal courts. The risk amount in this new lawsuit is the same of the lawsuit filed by the State Public Prosecution Office.
§Other administrative and judicial proceedings
The Group is a defendant in other administrative and judicial proceedings (tax, social security, labor, civil, and environmental), in the approximate amount of R$12,370,964, of which
(a)R$6,525,528 refers to the tax assessment notice issued against the Company for an alleged sale of 40% of the shares of its subsidiary NAMISA to a Japanese-Korean consortium, thus failing to determine and pay taxes on the capital gain resulting from this transaction, and in May 2013, the São Paulo -SP Regional Judgment Office (first administrative court) issued a favorable decision to the Company and cancelled the tax assessment notice. In light of this decision, an ex-officio appeal was filed that will be judged by the Administrative Board of Directors decidedTax Appeals (CARF);
(b)R$680,546 refers to adoptexecution proceedings filed against us to require the ICMS allegedly levied on the electricity acquired by our Steel Plant, which is fully consumed in manufacturing steel products. The tax authorities argue that the use of electricity in the production process as an input does not preclude its taxation by the ICMS.
(c)R$533,890 refers to the offset of taxes that were not approved by the Federal Revenue Service (FRS) for certain reasons. The taxes involved are CSLL, IRPJ, IPI, PIS and COFINS. It is our understanding that we have enough documentation to make evidence that we were duly entitled to the offset at the time.
(d)R$417,537 refers to a profit distribution policydecision of the Federal Revenue Service (FRS) that partially denied to us certain benefits granted by the Provisional Measure nº470 (a tax recovery program) based on the grounds that we had not enough tax losses to pay the certain of that program installments. The FRS disallowed those loses based on the rational that they had already been used in the taxation, in Brazil, of our foreign subsidiaries’ profits, which afteris a domestic tax regime of foreign subsidiaries contested by us.
(e)R$330,421 refers to the disallowance of the ICMS tax credits claimed by the Company between April of 1999 and September of 2002. The matter under dispute relates to the proper tax bases to be applied in the interstate transfer of iron ore from our Casa de Pedra mine to our Presidente Vargas Steel Plant. In accordance with the tax authorities in the State of Rio de Janeiro (location of the Steel Plant), the tax bases used by us in the State of Minas Gerais (location of Casa de Pedra) is not in compliance with the provisions containedregulation in 6404/76, as amended by Law 9457/97, will entailRio de Janeiro, then the distributionexcess of allcredits appropriated in the profittransfer was not to be admitted in Rio de Janeiro.
(f)R$260,321 refers to the Company’s shareholders, provided thattax assessments issued against us to disallow the following priorities are preserved, irrespectivecredits of their order: (i) carrying outICMS transferred to us in acquisition of certain branches of our subsidiary INAL in Rio de Janeiro. According to the business strategy; (ii) fulfillingtax authorities, the acquisition of a company’s branch does not entitle the buyer to the ICMS credits owned by target branch. In viewof assessment, the Company filed a writ of mandamus to claim its obligations; (iii) makingright to proceed with this transfer, which had a final favorable decision in the required investments; and (iv) maintaining a healthy financial situationJudiciary Courts. This favorable decision favors our case in the Administrative Court of Appeals of the Company.State of Rio de Janeiro.
FS-57
(g)R$2,153,777 refers to other tax lawsuits (federal, state, and municipal).
(h)R$1,044,079 refers to labor and social security lawsuits; R$350,218 refers to civil lawsuits, and R$74,647 to environmental lawsuits.
The assessments made by legal counsel define these administrative and judicial proceedings as entailing risk of possible loss and, therefore, no provision was recorded in conformity with management’s judgment and accounting practices adopted in Brazil.
5.18. PROVISION FOR ENVIRONMENTAL LIABILITIES AND ASSET RETIREMENT OBLIGATION
The balance of the provision for environmental liabilities and decommissioning of assets is as follows:
| | | |
| | 12/31/2013 | | 12/31/2012 |
Environmental liabilities | 346,455 | | 383,405 |
Asset retirement obligation - ARO | 23,999 | | 21,292 |
| 370,454 | | 404,697 |
a) Environmental liabilities
As of December 31, 2013, a provision is maintained for expenditures relating to environmental investigation and recovery services for potentially contaminated areas surrounding establishments in the States of Rio de Janeiro, Minas Gerais and Santa Catarina. Estimated expenditures will be reviewed periodically and the amounts already recognized will be adjusted whenever needed. These are management’s best estimates considering recovery studies in areas that have been degraded and are in the process of being used for activities. This provision is recognized in operating expenses.
The provision is measured at the present value of the expenditures required to settle the obligation, using a pretax rate that reflects current market assessments of the time value of money and the specific risks of the obligation. The increase in the obligation due to passage of time is recognized as other operating expenses.
The long-term interest rate used to discount to present value and update the provision through December 31, 2013 was 11.00%. The liability recognized is periodically updated based on the general market price index (IGPM) for the period.
b) Asset retirement obligation - ARO
ARO consist of estimated costs for decommissioning, retirement or restoration of areas upon the termination of activities related to mining resources. The initial measurement is recognized as a liability discounted to present value and subsequently through increase in expenses over time. The asset decommissioning cost equivalent to the initial liability is capitalized as part of the carrying amount of the asset, being depreciated over the useful life of the asset.
19.RELATED-PARTY BALANCES AND TRANSACTIONS
a)Transactions with Holding Company
Vicunha Siderurgia S.A. is a holding company set up for the purpose of holding equity interests in other companies and is the Company’s main shareholder, with 47.86% of the voting shares.
Rio Iaco Participações S.A. holds 3.99% of CSN.
FS-58
·Liabilities
| | | | | | | |
Companies | | Proposed | | Paid |
| | Dividends | | Dividends | | Interest on capital |
Vicunha Steel | | | | 435,482 | | 358,921 |
Rio Iaco | | | | 36,319 | | 29,934 |
Total at 12/31/2013 | | | | 471,801 | | 388,855 |
Total at 12/31/2012 | | 155,537 | | 622,164 | | |
Vicunha Siderurgia’s corporate structure is as follows (unaudited information):
Vicunha Aços S.A. – holds 99.99% of Vicunha Siderurgia S.A.
Vicunha Steel S.A. – holds 66.96% of Vicunha Aços S.A.
National Steel S.A. – holds 33.04% of Vicunha Aços S.A.
CFL Participações S.A. – holds 40% of National Steel S.A. and 39.99% of Vicunha Steel S.A.
Rio Purus Participações S.A. – holds 60% of National Steel S.A. 59.99% of Vicunha Steel S.A. and 99.99% of Rio Iaco Participações S.A.
b)Transactions with jointly controlled entities, associates, exclusive funds and other related parties
·By transaction
| | | Assets | | Liabilities |
| | Current | | Non-current | | Total | | Current | | Non-current | | Total |
| | | | | | |
Assets | | | | | | | | | | | | |
Trade receivables | | 107,443 | | | | 107,443 | | | | | | |
Loans | | 147,273 | | 603,862 | | 751,135 | | | | | | |
Dividends receivable | | 717,595 | | | | 717,595 | | | | | | |
Actuarial asset | | | | 97,051 | | 97,051 | | | | | | |
Other receivables | | 15,658 | | 18,129 | | 33,787 | | | | | | |
| | 987,969 | | 719,042 | | 1,707,011 | | | | | | |
Liabilities | | | | | | | | | | | | |
Other payables | | | | | | | | | | | | |
Accounts payable | | | | | | | | 600 | | 618 | | 1,218 |
Advances from customers(1) | | | | | | | | 421,550 | | 8,522,067 | | 8,943,617 |
Trade payables | | | | | | | | 52,949 | | | | 52,949 |
Actuarial liability | | | | | | | | | | 11,139 | | 11,139 |
| | | | | | | | | 475,099 | | 8,533,824 | | 9,008,923 |
Total at 12/31/2013 | | 987,969 | | 719,042 | | 1,707,011 | | 475,099 | | 8,533,824 | | 9,008,923 |
Total at 12/31/2012 | | 1,208,633 | | 418,760 | | 1,627,393 | | 715,422 | | 7,845,506 | | 8,560,928 |
| | | | | | | | | | | | |
| | | Statement of Income | | | | | | | | | | |
Revenues | | | | | | | | | | | | |
Sales | | 862,004 | | | | | | | | | | |
Interest | | 25,576 | | | | | | | | | | |
Expenses | | | | | | | | | | | | |
Purchases | | -917,469 | | | | | | | | | | |
Interest | | -421,659 | | | | | | | | | | |
Total at 12/31/2013 | | 451,548 | | | | | | | | | | |
Total at 12/31/2012 | | 67,354 | | | | | | | | | | |
| | | | | | | | | | | | | |
FS-59
a.Advance from customer received from the jointly controlled entity Nacional Minérios S.A. Refers to the contractual obligation of supply of iron ore and port services. The contract is subject to interest rate of 12.5% p.a. and expires in September 2042.
·By company
| | | Assets | | Liabilities | | Statement of Income |
| | Current | | Non-current | | Total | | Current | | Non-current | | Total | | Sales | | Purchases | | Finance income and costs, net | | Total |
| | | | | | | | | | |
Parent Company | | | | | | | | | | | | | | | | | | | | |
Vicunha Steel S.A. | | | | | | | | | | | | | | | | | | (1,849) | | (1,849) |
| | | | | | | | | | | | | | | | | | -1,849 | | -1,849 |
Subsidiaries | | | | | | | | | | | | | | | | | | | | |
Ferrovia Transnordestina Logística S.A.(1) | | 60,498 | | 45,216 | | 105,714 | | | | | | | | | | | | -62 | | -62 |
| | | 60,498 | | 45,216 | | 105,714 | | | | | | | | | | | | -62 | | -62 |
Jointly controlled entities | | | | | | | | | | | | | | | | | | | | |
Nacional Minérios S.A. | | 797,939 | | 321,466 | | 1,119,405 | | 422,150 | | 8,522,685 | | 8,944,835 | | 357,731 | | -3,519 | | -394,456 | | -40,244 |
MRS Logística S.A. | | 30,635 | | | | 30,635 | | 43,194 | | | | 43,194 | | | | -555,261 | | | | -555,261 |
Transnordestina Logística S.A(2) | | 33,431 | | 237,262 | | 270,693 | | | | | | | | 46 | | | | -883 | | -837 |
CBSI - Companhia Brasileira de Serviços e Infraestrutura | | 4,899 | | 8,363 | | 13,262 | | 6,056 | | | | 6,056 | | | | -122,348 | | | | -122,348 |
CGPAR Construção Pesada S.A. | | 546 | | 9,236 | | 9,782 | | 3,677 | | | | 3,677 | | | | -200,689 | | | | -200,689 |
| | 867,450 | | 576,327 | | 1,443,777 | | 475,077 | | 8,522,685 | | 8,997,762 | | 357,777 | | -881,817 | | -395,339 | | -919,379 |
Other related parties | | | | | | | | | | | | | | | | | | | | |
CBS Previdência | | | | 97,051 | | 97,051 | | 8 | | | | 8 | | | | -13,392 | | | | -13,392 |
Fundação CSN | | 320 | | 448 | | 768 | | 14 | | 11,139 | | 11,153 | | | | -1,983 | | 83 | | -1,900 |
Usiminas | | 18,112 | | | | 18,112 | | | | | | | | 50,722 | | -8,355 | | | | 42,367 |
Panatlântica | | 28,619 | | | | 28,619 | | | | | | | | 453,505 | | | | | | 453,505 |
Ibis Participações e Serviços | | | | | | | | | | | | | | | | -9,717 | | | | -9,717 |
Companhia de Gás do Ceará | | | | | | | | | | | | | | | | -2,205 | | | | -2,205 |
| | 47,051 | | 97,499 | | 144,550 | | 22 | | 11,139 | | 11,161 | | 504,227 | | -35,652 | | 83 | | 468,658 |
Associates | | | | | | | | | | | | | | | | | | | | |
Arvedi Metalfer do Brasil S.A. | | 12,970 | | | | 12,970 | | | | | | | | | | | | 1,084 | | 1,084 |
Total at 12/31/2013 | | 987,969 | | 719,042 | | 1,707,011 | | 475,099 | | 8,533,824 | | 9,008,923 | | 862,004 | | -917,469 | | -396,083 | | -451,548 |
Total at 12/31/2012 | | 1,208,633 | | 418,760 | | 1,627,393 | | 715,422 | | 7,845,506 | | 8,560,928 | | 563,203 | | -300,589 | | -329,968 | | -67,354 |
1.Refers to loans of the subsidiary FTL – Ferrrovia Transnordestina Logísitca S.A. to the jointly controlled entity Transnordestina Logística S.A.
2.Transnordestina Logística S.A. contracts in Brazilian reais: interest equivalent to 102.5% of the CDI with final maturity in December 2015. As of December 31, 2013, borrowings total R$270,693 (R$210,966 as of December 31, 2012), of which R$33,431 is classified in short term and R$237,262 is classified in long term.
c)Other unconsolidated related parties
·CBS Previdência
The Company is the main sponsor of this non-profit entity established in July 1960, primarily engaged in the payment of benefits that supplement the official government Social Security benefits to participants. In its capacity as sponsor, CSN carries out transactions involving the payment of contributions and recognition of actuarial liabilities calculated in defined benefit plans, as detailed in note 28.
·Fundação CSN
The Company develops socially responsible policies concentrated today in Fundação CSN, of which it is the founding. The transactions between the parties relate to the operating and financial support for Fundação CSN to carry out the social projects undertaken mainly in the locations where the Company operates.
·CASH AND CASH EQUIVALENTS
| | | | | | | | |
| | | 12/31/2011 | | 12/31/2010 | 12/31/2013 | | 12/31/2012 |
| Current | | | | | | | |
| Cash and cash equivalents | | | | | | | |
| Cash and banks | | 101,360 | | 156,580 | 178,920 | | 205,056 |
| | | | | | | | |
| Short-term investments | | | | | | | |
In Brazil: | | | | | | | |
Government bonds | | 646,594 | | 477,529 | |
Private securities and debentures (*) | | 2,017,019 | | 2,134,364 | |
Government securities | | 48,206 | | 862,299 |
Private securities | | 240,852 | | 540,688 |
| | | 2,663,613 | | 2,611,893 | 289,058 | | 1,402,987 |
Abroad: | | | | | | | |
Time deposits | | 12,652,420 | | 7,470,805 | 9,527,694 | | 10,283,778 |
| Total short-term investments | | 15,316,033 | | 10,082,698 | 9,816,752 | | 11,686,765 |
| Cash and cash equivalents | | 15,417,393 | | 10,239,278 | 9,995,672 | | 11,891,821 |
The funds available in the Company and subsidiaries set up in Brazil are basically invested in exclusive investment funds, classified as exclusive, with repurchase agreements backed by Brazilian government and private bonds with immediate liquidity.
Private securities are short-term investments in Bank Deposit Certificates (CDBs) with yields pegged to the Interbank Deposit Certificate (CDI) fluctuation, and government securities are basically repurchase agreements backed by National Treasury Notes series B (NTN-B) and Financial Treasury Bills (LFTs).The exclusive funds managed by BTG Pactual Serviços Financeiros S.A. DTVM and Caixa Econômica Federal and their assets collateralize possible losses on investments and transactions carried out. Investments in funds were consolidated.
In addition, a significant part of the funds of the Company and its foreign subsidiaries is invested in time depositsTime Deposits with leading banks.
The exclusive funds managed by BTG Pactual Serviços Financeiros S.A. DTVM and their assets collateralize possible losses on investments and transactions carried out. The funds’ unit holders also guarantee the funds’ equity in the event of losses arising from changes in interest and exchange rates, or other financial assets.
(*) Private securities: short–term investments amounting to R$1,952,274 as of December 31, 2011 (R$2,079,549 as of December 31, 2010) backed by Bank Certificates of Deposit, which yield pegged to the Interbank Certificates of Deposit rate (CDI).
Debentures: investments amounting to R$64,745 as of December 31, 2011 (R$54,815 as of December 31, 2010), of jointly controlled entity MRS, which yield pegged to the Interbank Certificates of Deposit rate (CDI), in securities issued by the following banks: Santander, Votorantim, Safra, Itaú BBA and Bradesco.banks, bearing fixed rates.
6. TRADE RECEIVABLES
| | | | |
| | 12/31/2013 | | 12/31/2012 |
Trade receivables | | | |
Third parties | | | |
Domestic market | 790,225 | | 776,442 |
Foreign market | 950,145 | | 754,159 |
Allowance for doubtful debts | -114,172 | | -111,532 |
| 1,626,198 | | 1,419,069 |
Related parties (Note 19 - b) | 107,443 | | 227,021 |
| 1,733,641 | | 1,646,090 |
| | | |
Other receivables | | | |
Dividends receivable (Note 19 - b) | 717,595 | | 955,869 |
Other receivables | 71,229 | | 59,458 |
| | 788,824 | | 1,015,327 |
| 2,522,465 | | 2,661,417 |
The breakdown of gross trade receivables from third parties is as follows:
FS-26
FS-28
| | | | | |
| | | 12/31/2011 | | 12/31/2010 |
| Trade receivables | | | | |
Third parties | | | | |
Domestic market | | 982,129 | | 846,507 |
Foreign market | | 701,807 | | 530,356 |
Allowance for doubtful debts | | (124,939) | | (117,402) |
| | | 1,558,997 | | 1,259,461 |
Related parties (Note 4 - b) | | | | |
| | | 1,558,997 | | 1,259,461 |
| Other receivables | | | | |
Receivables from subsidiaries and jointly controlled entities | | 1,557 | | 17,318 |
Other receivables | | 55,652 | | 90,980 |
| | | 57,209 | | 108,298 |
| | | 1,616,206 | | 1,367,759 |
| | | | | |
| | | 12/31/2013 | | 12/31/2012 |
Falling due | | 1,339,481 | | 1,272,669 |
Overdue until 180 days | | 216,392 | | 113,793 |
Overdue above 180 days | | 184,497 | | 144,139 |
| | 1,740,370 | | 1,530,601 |
In order to meet the needs of some customers in the domestic market, related to the extension of the payment term for billing of steel, in common agreement with CSN’s internal commercial policy and maintenance of its very short-term receipts (up to 147 days), at the request of the customer, transactions are carried out for assignment of receivables without co-obligation negotiated between the customer and banks with common relationship, where CSN assigns the trade notes/bills that it issues to the banks with common relationship.
Due to the characteristics of the transactions for assignment of receivables without co-obligation, after assignment of the customer’s trade notes/bills and receipt of the funds from the closing of each transaction, CSN settles the trade receivables and becomes entirely free of the credit risk on the transaction.
This transaction totals R$262,367386,732 as of December 31, 20112013 (R$247,680224,718 as of December 31, 2010)2012), less the trade receivables.
The changes in the Company’s allowance for doubtful debts are as follows:
| | | | | |
| | | 12/31/2011 | | 12/31/2010 |
| Opening balance | | (117,402) | | (164,077) |
| Allowance for losses on trade receivables | | (20,005) | | (7,439) |
| Recovery (reversal) of receivables | | 12,468 | | 54,114 |
| Closing balance | | (124,939) | | (117,402) |
| | | 12/31/2013 | | 12/31/2012 |
Opening balance | | -111,532 | | -124,939 |
Estimated losses | | -17,988 | | -11,073 |
Recovery of receivables | | 15,348 | | 24,480 |
Closing balance | | -114,172 | | -111,532 |
7. INVENTORIES
| | | | | |
| | | 12/31/2011 | | 12/31/2010 |
| Finished products | | 997,128 | | 1,015,534 |
| Work in process | | 776,918 | | 588,668 |
| Raw materials | | 847,598 | | 638,857 |
| Storeroom supplies | | 897,940 | | 800,090 |
| Iron ore | | 215,400 | | 312,637 |
| | | 3,734,984 | | 3,355,786 |
| | | | |
| | 12/31/2013 | | 12/31/2012 |
Finished products | 743,831 | | 980,375 |
Work in process | 650,311 | | 668,170 |
Raw materials | 714,365 | | 722,922 |
Storeroom supplies | 1,003,473 | | 1,018,625 |
Iron ore | 139,275 | | 74,340 |
Advances to suppliers | 11,915 | | 36,921 |
(-) Allowance for inventory losses | -102,185 | | -108,160 |
| | 3,160,985 | | 3,393,193 |
Changes in the allowance for inventory losses are as follows:
| | | 12/31/2013 | | 12/31/2012 |
Opening balance | | -108,160 | | -94,950 |
Allowance for/reversals of slow-moving inventories and obsolescence | | 5,975 | | -13,210 |
Closing balance | | -102,185 | | -108,160 |
FS-27
| | | | | |
| | | 12/31/2011 | | 12/31/2010 |
| Opening balance | | (64,115) | | (50,306) |
| Allowance for obsolete or slow-moving inventories | | (19,030) | | (13,809) |
| Closing balance | | (83,145) | | (64,115) |
Allowances for certain items considered obsolete or slow-moving were recognized.
As of December 31, 2011,2013, the Company has long-term iron ore inventories amounting to R$144,483, classified in other non-current assets (R$130,341144,483 as of December 31, 2010).2012), as described in note 8.
FS-29
The group of other current assets is comprised as follows:
| | | | | |
| | | 12/31/2011 | | 12/31/2010 |
| Prepaid taxes | | 104,733 | | 89,596 |
| Guarantee margin on financial instruments (Note 15 V) | | 407,467 | | 254,485 |
| Unrealized gains on derivatives (Note 15) | | 55,115 | | |
| Prepaid expenses | | 24,135 | | 12,997 |
| | | 591,450 | | 357,078 |
9.INCOME TAX AND SOCIAL CONTRIBUTION
(a)Income tax and social contribution recognized in profit or loss:
The income tax and social contribution recognized in profit or loss for the year are as follows:
| | | | | |
| | | 12/31/2011 | | 12/31/2010 |
| Income tax and social contribution income (expenses) | | | | |
Current | | (136,427) | | (363,429) |
Deferred | | 52,542 | | (207,268) |
| | | (83,885) | | (570,697) |
The reconciliation of income tax and social contribution expenses and income and the result from applying the effective rate on profit before income tax (IRPJ) and social contribution (CSLL) are as follows:
| | | | | |
| | | 12/31/2011 | | 12/31/2010 |
| Profit before income tax and social contribution | | 3,751,119 | | 3,086,888 |
Tax rate | | 34% | | 34% |
| Income tax and social contribution at combined statutory rate | | (1,275,380) | | (1,049,542) |
| Adjustment to reflect effective rate: | | | | |
Interest on capital benefit | | | | 121,312 |
Income subject to special tax rates or untaxed | | 1,279,431 | | 216,529 |
Tax incentives | | 73,134 | | 33,824 |
Adjustments arising from Law 11941 and MP 470 installment plans | | (16,060) | | 106,216 |
Sale of nondeductible securities | | (189,946) | | |
Income tax and social contribution credits | | 44,434 | | |
Other permanent deductions (additions) | | 502 | | 964 |
| Income tax and social contribution in profit (loss) for the period | | (83,885) | | (570,697) |
| Effective rate | | 2% | | 18% |
FS-28
(b)Deferred income tax and social contribution:
The deferred income tax and social contribution are calculated on tax losses of income tax, the negative social contribution basis and related temporary differences between the tax bases of assets and liabilities and the accounting balances of the financial statements.
| | | | | |
| | | 12/31/2011 | | 12/31/2010 |
| Deferred tax assets | | | | |
Income tax loss carryforwards | | 425,406 | | 4,944 |
Social contribution loss carryforwards | | 157,858 | | 1,871 |
Temporary differences | | 1,257,509 | | 1,586,126 |
- Provision for contingencies | | 211,835 | | 240,753 |
- Allowance for asset impairment losses | | 60,930 | | 27,915 |
- Allowance for inventory losses | | 30,814 | | 26,012 |
- Allowance for gains/losses on financial instruments | | 253,985 | | 183,169 |
- Accrued pension plan payments | | 144,066 | | 103,033 |
- Accrued interest on capital | | 74 | | 121,351 |
- Allowance for long-term sales | | 1,221 | | 1,221 |
- Accrued supplies and services | | 67,445 | | 43,828 |
- Allowance for doubtful debts | | 45,342 | | 145,390 |
- Goodwill on acquisition | | 371,153 | | 599,730 |
- Other | | 70,644 | | 93,726 |
Non-current assets | | 1,840,773 | | 1,592,941 |
| |
| Deferred tax liabilities | | | | |
- Adjustment to PP&E useful lives (Law 11638/07) | | 37,776 | | |
- Other (*) | | 75 | | |
Non-current liabilities | | 37,851 | | |
(*) Related to a sole jurisdiction, thus presented at net amounts.
Some subsidiaries of CSN recognized tax credits on income tax and social contribution tax loss carryforwards not subject to statute of limitations and based on the history of profitability and expected future taxable profits determined in technical studies approved by Management.
In July 2010, the Company joined the REFIS (tax debt refinancing program) and elected to offset part of the balance ofincome tax and social contribution loss carryforwardsas of December 31, 2009 recognized in part B of the LALUR (taxable income computation book), amounting to R$110,192 and R$39,669, respectively, against the four last installments of the tax refinancing plan, consisting of debts enrolled under Provisional Measure 470/09 and payable in 12 installments, as prescribed by relevantlegislation.
Since they are subject to significant factors that may change the projections for realization, the carrying amounts of deferred tax assets are reviewed quarterly and projections are reviewed annually. These studies indicate the realization of these tax assets within the term stipulated by the mentioned instruction and the limit of 30% of the taxable profit.
Certain CSN subsidiaries have tax assets amounting to R$536.886 and R$167.504, related to income tax and social contribution loss carryforwards, for which no deferred taxes were set up, off which R$54 expires in 2012, R$9,726 in 2013, R$696 in 2014, R$27,976 in 2015, R$15 in 2016, R$46 in 2017 and R$44.138 in 2025. The remaining tax assets refer to domestic companies and, therefore, are not subject to statute of limitations.
The tax benefit of goodwill of Nacional Minérios S.A., which arose on the merger of Big Jump in July 2009, amounted to R$1,391,858.Up to December 2011 a total amount of R$672,732 (R$394,360 up to 2010) had been realized, leaving aremaining amount of R$719,126, which will be realized through 2014. In 2012 and 2013, this realization will be R$278,372 per year and in the last year, 2014, the benefit will be R$162,382.
FS-29
The undistributed profits of the Company’s foreign subsidiaries have been invested and will continue to be indefinitely invested in their operations. These undistributed profits of the Company’s foreign subsidiaries amounted to R$8,033,902as ofDecember 31, 2011 (R$2,434,537 as of December 31, 2010).
(c)Income tax and social contribution recognized in equity
The income tax and social contribution recognized directly in equity are as follows:
| | | | | |
| | | 12/31/2011 | | 12/31/2010 |
| Income tax and social contribution (losses)/gains | | | | |
Gain/(loss) on defined benefit pension plan | | 163,931 | | 125,065 |
Changes in the fair value on available-for-sale financial assets | | 241,484 | | 75,522 |
Exchange variation on foreign operations | | 425,510 | | 433,297 |
(d)Tax incentives
The Company enjoys Income Tax incentives based on the legislation in effect, such as: Worker Food Program, the Rouanet Law (tax incentives related to cultural activities), Tax Incentives for Audiovisual Activities, and Funds for the Rights of Children and Adolescents. As of December 31, 2011, these tax incentives total R$1,914 (R$8,160 as of December 31, 2010).
10.OTHER NON-CURRENT ASSETS
The group of other non-current assets is comprised as follows:
| | | | | |
| | | 12/31/2011 | | 12/31/2010 |
| Judicial deposits (Note 19) | | 1,760,814 | | 2,774,706 |
| Recoverable taxes (*) | | 257,977 | | 247,910 |
| Prepaid expenses | | 115,853 | | 115,755 |
| Unrealized gains on derivatives (Note 15) | | 376,344 | | 254,231 |
| Iron ore inventories | | 144,483 | | 130,341 |
| Northeast Investment Fund - FINOR | | 47,754 | | |
| Others | | 163,001 | | 153,137 |
| | | 2,866,226 | | 3,676,080 |
| | | | | | | | |
| | Current | Non-current |
| | 12/31/2013 | | 12/31/2012 | | 12/31/2013 | | 12/31/2012 |
Judicial deposits (Note 17) | | | | | 693,714 | | 718,026 |
Credits with the PGFN (*) | | | | | 88,921 | | 84,392 |
Recoverable taxes (**) | 480,495 | | 407,297 | | 112,788 | | 183,092 |
Prepaid expenses | 37,369 | | 38,767 | | 38,117 | | 42,893 |
Actuarial asset - related party (Note 19 b) | | | | | 97,051 | | 93,546 |
Derivative financial instruments (Note 13 I) | 9,681 | | 239,266 | | 3,879 | | |
Guarantee margin on financial instruments (Note 13 l) | | | 426,328 | | | | |
Securities held for trading (Note 13 I) | 9,906 | | | | | | |
Iron ore inventory (Note 7) | | | | | 144,483 | | 144,483 |
Northeast Investment Fund (FINOR) | | | | | 8,452 | | 8,452 |
Trade receivables | | | | | 9,970 | | 8,983 |
Loans with related parties (Note 19 b) | 147,273 | | 5,362 | | 603,862 | | 314,699 |
Other receivables from related parties (Note 19 b) | 15,658 | | 20,309 | | 18,129 | | 10,515 |
Other | 22,538 | | 14,826 | | 15,959 | | 18,058 |
| 722,920 | | 1,152,155 | | 1,835,325 | | 1,627,139 |
(*) Refers to the excess judicial deposit originated by the 2009 REFIS (Tax Debt Refinancing Program).
.
(**) Refers mainly to taxes on revenue (PIS/COFINS) and State VAT (ICMS) on the acquisition of fixed assets which will be recovered over a 48-month period.period, and income tax and social contribution for offset.
11.9. INVESTMENTS
The breakdown of investments is as follows:
| | 12/31/2013 | | 31/12/2012 |
Nacional Minérios S.A. | 8,346,387 | | 7,801,690 |
MRS Logística S.A. | 726,825 | | 685,586 |
CBSI - Companhia Brasileira de Serviços de Infraestrutura | 4,350 | | 1,888 |
Arvedi Metalfer do Brasil | 18,574 | | 12,977 |
Panatlântica | 24,819 | | 12,965 |
Usiminas | 2,380,355 | | 2,323,172 |
Transnordestina | 1,984,205 | | - |
Outros | 1,508 | | 1,509 |
| | 13,487,023 | | 10,839,787 |
a) Other InvestmentsEvents in 2013
| | | | | |
| | | 12/31/2011 | | 12/31/2010 |
| Riversdale Mining | | - | | 1.061.961 |
| Panatlântica | | 12.030 | | 19.800 |
| Usiminas | | 2.077.277 | | 1.020.350 |
| Other | | (1.082) | | 1.513 |
| Total Investments | | 2.088.225 | | 2.103.624 |
FS-30
·RIVERSDALE MINING LIMITED - Riversdale
On April 20, 2011, the Company adhered to the tender offer of Riversdale Mining Limited (“Riversdale”) shares conducted by Rio Tinto. Therefore, the Company sold 100% of its equity interest held in Riversdale’s share capital, corresponding to 47,291,891 shares at the price of A$16.50 per share, totalingA$780,316.
· PANATLÂNTICA Transnordestina Logística S.A. (“TLSA”)
On January 5, 2010,September 20, 2013, the Company’s Board of Directors approvedCompany signed (i) An Addendum to the acquisition of common shares representing 9.39%Concession Agreement of the capital stockNortheast Railway System, which encompasses the stretches between the cities of Panatlântica S.A. (“Panatlântica”), a publicly-held company, headquartered in the city of Gravataí, State of Rio Grande do Sul, engaged in the manufacturing, trade, import, export and processing of steel and ferrous or non-ferrous metals, coated or not. This investment is carried at fair value.
·USIMINAS
Usinas Siderúrgicas de Minas Gerais S.A. – USIMINAS, headquartered in Belo Horizonte, State of Minas Gerais, is engaged in steel and related operations. USIMINAS produces flat rolled steel in the Intendente Câmara and José Bonifácio de Andrada e Silva plants, located in Ipatinga, Minas Gerais, and Cubatão, São Paulo, respectively,Luís to be sold in the domestic marketMucuripe, Arrojado to Recife, Itabaiana to Cabedelo, Paula Cavalcante to Macau, and also for exports, and it also exploits iron ore mines located in Itaúna, Minas Gerais,Propriá to meet its verticalization and production cost optimization strategies. USIMINAS also has service and distribution centers located in several regions of Brazil,Jorge Lins (“Railway System I”) and the Cubatãstretchesbetween the cities of Missão SãVelha to Salgueiro, Salgueiro to Trindade, Trindade to Eliseu Martins, Salgueiro to Porto de Suape, and Missão Paulo, and Praia Mole, Espírito Santo, ports,Velha to Porto de Pecém (“Railway System II”), to include therein obligations assumed by TLSA related to the implementation of the Railway System II, as well as the adaptation of the sections that comprise it and (ii) Conduct Adjustment Agreement between ANTT and TLSA, with the purpose of resolving pending items existing between the parties.
FS-30
table of contents
On that date the following agreements were also signed (i) a new Shareholders' Agreement of TLSA between CSN, Valec Engenharia, Construções e Ferrovias S.A. (“Valec”), Fundo de Desenvolvimento do Nordeste – FDNE (“FDNE”) and BNDES Participações S.A. – BNDESPAR (“BNDESPAR”), with the intervenience of TLSA, whose effectiveness was conditioned to the disproportionate spin-off of TLSA, to be implemented under the terms of ANTT Resolution 4,042/2013; and (ii) Investment Agreement between CSN, Valec and FDNE, with the intervenience of TLSA, which besides other matters, deals with the new budget and the sources of funds that will have to be contributed to TLSA or financed for implementation of the Railway System II.
At the Extraordinary Shareholders' Meeting held on December 27, 2013, as part of the reorganization process described above, the shareholders approved the disproportionate spin-off of TLSA, completing the segregation of Railway System I and Railway System II.
This purpose of this restructuring was to rebalance economically and financially the Northeast Railway System concession, leading to the extension of the Railway System II operation concession, which could reach 2057, and the segregation of the assets related to Railway System I, which were merged into subsidiary FTL - Ferrovia Transnordestina Logística S.A. (“FTL”), with the maintenance of the assets related to Railway System II in locations strategic for the shipment of its production.TLSA.
As a result of the spin-off, CSN became the holder of an 88.41% stake in FTL and a 77.30% stake in TLSA.
With the completion of the spin-off, the new Shareholders’ Agreement became effective and control is now jointly held with the shareholders part of the public block, which became the holders of substantive rights to make certain material company decisions and influence the ordinary course of business, as well as CSN, by influencing budgeting, internal policies, capital expenditures, debt, etc., thus typifying the loss of control by CSN, pursuant to specific IFRS criteria.
Accordingly, as of December 31, 2011,2013, in accordance with IFRS 10, CSN reversed all TLSA assets and liabilities and non-controlling interests and started to recognize the Company reached holdings of 11.97%remaining stake in common shares and 20.14% in preferred shares of Usiminas’ share capital.this investment at fair value on the date control was lost. After this initial recognition, the investment starts to be measured under the equity method.
USIMINASThe gain generated by the loss of control over the investment recognized in the income statement, in other operating income, is listed on the São Paulo Stock Exchange (“Bovespa”: USIM3 and USIM5).broken down as follows:
| |
|
| | 12/31/2013 |
(+) | Fair value of the remaining investment | 1,984,204 |
(-) | Carrying amount of net assets | 1,714,232 |
(+) | Carrying amount of non-controlling interests | 389,133 |
| Gain on loss of control over Transnordestina | 659,105 |
(-) | Capitalized interest written off | 185,206 |
| Gain on loss of control over Transnordestina (Note 24) | 473,899 |
| | |
(-) | Income tax and social contribution | 161,126 |
| Gain on loss of control, net of income tax and social contribution | 312,773 |
b) InvestmentsChanges in investments in joint ventures, associates, and other investments
| | 12/31/2013 | | 12/31/2012 |
Opening balance of investments | 10,839,787 | | 10,017,456 |
Opening balance of impairment loss allowance | | | |
Transnordestina Investment balance at 12.31.2012 | 1,452,074 | | |
Capital increase/acquisition of shares | 164,941 | | 165,792 |
Capital reduction | -153,305 | | |
Dividends | -85,998 | | -547,604 |
Comprehensive income(¹) | 73,213 | | 94,967 |
Share of profits of investees (²) | 542,711 | | 1,103,632 |
Gain on loss of control over Transnordestina | 659,106 | | |
Other | -5,506 | | 5,544 |
Closing balance of investments | 13,487,023 | | 10,839,787 |
FS-31
1.Refers to the mark-to-market of investments classified as available for sale and translation to the reporting currency of the foreign investments, the functional currency of which is not the Brazilian real.
2.Below is the reconciliation of the share of profit of jointly controlled entities with the share of profit of investees recognized in the balance sheet after the reclassifications:
| | 12/31/2013 | | 12/31/2012 |
Share of profit of jointly controlled entities | 542,711 | | 1,103,632 |
Reclassifications | | | |
To cost of sales | -137,418 | | -93,592 |
To finance costs | -624,096 | | -606,703 |
To taxes | 258,914 | | 238,099 |
Other | | | |
Elimination of Transnordestina’s profit | 120,102 | | |
Other | -2,075 | | |
Adjusted share of profit of investees | 158,138 | | 641,436 |
c)Investments in joint ventures and joint operations
The balances of the balance sheets and income statements of the companies under sharedjoint control are stated below and have been consolidated into the Company’s financial statements according to the percentage equity interests described in item (b) of Note 2.below:
| | | | | | | | | | | | | |
| | | 12/31/2011 | | 12/31/2010 |
| | | Nacional | | MRS | | Itá | | Nacional | | MRS | | Itá |
| | | Minérios (*) | | Logística | | Energética | | Minérios (*) | | Logística | | Energética |
| Current assets | | 4,155,543 | | 917,291 | | 81,729 | | 3,937,574 | | 1,034,466 | | 82,817 |
| Non-current assets | | 9,526,804 | | 4,625,495 | | 719,606 | | 9,519,584 | | 3,769,877 | | 769,422 |
Long-term receivables | | 8,422,434 | | 336,439 | | 44,239 | | 8,570,421 | | 476,757 | | 48,850 |
Investments, PP&E and intangible assets | | 1,104,370 | | 4,289,056 | | 675,367 | | 949,163 | | 3,293,120 | | 720,572 |
| Total assets | | 13,682,347 | | 5,542,786 | | 801,335 | | 13,457,158 | | 4,804,343 | | 852,239 |
| |
| Current liabilities | | 1,260,068 | | 1,108,938 | | 100,175 | | 1,273,436 | | 1,015,234 | | 115,454 |
| Non-current liabilities | | 307,352 | | 2,134,906 | | 62,637 | | 1,455,604 | | 1,769,261 | | 139,870 |
| Total equity | | 12,114,927 | | 2,298,942 | | 638,523 | | 10,728,118 | | 2,019,848 | | 596,915 |
| Total liabilities and equity | | 13,682,347 | | 5,542,786 | | 801,335 | | 13,457,158 | | 4,804,343 | | 852,239 |
| | | 12/31/2011 | | 12/31/2010 |
| | | Nacional | | | | Itá | | Nacional | | | | Itá |
| | | Minérios (*) | | MRS Logística | | Energética | | Minérios (*) | | MRS Logística | | Energética |
| Net operating revenue | | 3,766,712 | | 2,862,337 | | 242,913 | | 2,937,169 | | 2,247,101 | | 222,594 |
Cost of sales and services | | (1,646,011) | | (1,732,552) | | (81,692) | | (1,109,067) | | (1,326,655) | | (76,600) |
| Gross profit | | 2,120,701 | | 1,129,785 | | 161,221 | | 1,828,102 | | 920,446 | | 145,994 |
Operating (expenses) income | | (634,475) | | (199,754) | | (66,223) | | (476,621) | | (306,668) | | (52,422) |
Finance income (costs), net | | 1,016,743 | | (134,272) | | (12,327) | | 1,016,778 | | 38,243 | | (23,890) |
Profit before income tax and social contribution | | 2,502,969 | | 795,759 | | 82,671 | | 2,368,259 | | 652,021 | | 69,682 |
Current and deferred income tax and social contribution | | (429,226) | | (272,714) | | (28,103) | | (412,989) | | (216,451) | | (23,724) |
| Profit for the period | | 2,073,743 | | 523,045 | | 54,568 | | 1,955,270 | | 435,570 | | 45,958 |
FS-31FS-32
| |
12/31/2013 | |
12/31/2012 |
| | Nacional Minérios (*) | | Itá
Energética | | MRS
Logística | | CBSI | | CGPAR | | Transnordestina Logística | | Nacional Minérios (*) | | Itá
Energética | | MRS
Logística | | CBSI | | CGPAR |
Equity interest (%) | | 60.00% | | 48.75% | | 27.27% | | 50.00% | | 50.00% | | 77.30% | | 60.00% | | 48.75% | | 27.27% | | 50.00% | | 50.00% |
Balance sheet | | | | | | | | | | | | | | | | | | | | | | |
Current assets | | | | | | | | | | | | | | | | | | | | | | |
Cash and cash equivalents | | 4,815,211 | | 45,894 | | 471,079 | | 12,897 | | 28,582 | | 195,830 | | 4,081,425 | | 72,754 | | 331,515 | | 5,480 | | 25,245 |
Other current assets | | 1,135,192 | | 16,682 | | 630,121 | | 21,407 | | 33,055 | | 39,183 | | 1,572,995 | | 16,616 | | 600,407 | | 19,903 | | 17,431 |
Total current assets | | 5,950,403 | | 62,576 | | 1,101,200 | | 34,304 | | 61,637 | | 235,013 | | 5,654,420 | | 89,370 | | 931,922 | | 25,383 | | 42,676 |
Non-current assets | | | | | | | | | | | | | | | | | | | | | | |
Long-term assets | | 8,391,119 | | 34,029 | | 414,624 | | 4 | | 11 | | 229,280 | | 8,296,673 | | 39,771 | | 440,545 | | | | 246 |
Investments, PP&E and intangible assets | | 1,356,909 | | 603,268 | | 5,281,642 | | 6,872 | | 45,405 | | 5,080,841 | | 1,216,907 | | 640,850 | | 4,906,609 | | 3,887 | | 32,276 |
Total non-current assets | | 9,748,028 | | 637,297 | | 5,696,266 | | 6,876 | | 45,416 | | 5,310,121 | | 9,513,580 | | 680,621 | | 5,347,154 | | 3,887 | | 32,522 |
Total assets | | 15,698,431 | | 699,873 | | 6,797,466 | | 41,180 | | 107,053 | | 5,545,134 | | 15,168,000 | | 769,991 | | 6,279,076 | | 29,270 | | 75,198 |
| | | | | | | | | | | | | | | | | | | | | | |
Current liabilities | | | | | | | | | | | | | | | | | | | | | | |
Borrowings and financing | | 42,247 | | | | 333,796 | | | | 20,053 | | 97,681 | | 1,588 | | 41,957 | | 380,656 | | | | 13,883 |
Other current liabilities | | 1,318,884 | | 35,174 | | 841,681 | | 22,437 | | 36,733 | | 51,901 | | 1,887,841 | | 45,701 | | 829,185 | | 16,131 | | 44,641 |
Total current liabilities | | 1,361,131 | | 35,174 | | 1,175,477 | | 22,437 | | 56,786 | | 149,582 | | 1,889,429 | | 87,658 | | 1,209,841 | | 16,131 | | 58,524 |
Non-current liabilities | | | | | | | | | | | | | | | | | | | | | | |
Borrowings and financing | | 339,961 | | | | 2,566,412 | | | | 21,664 | | 3,479,420 | | 335,806 | | | | 2,253,721 | | | | 14,814 |
Other non-current liabilities | | 86,694 | | 1,870 | | 390,228 | | 10,050 | | 18,956 | | 201,900 | | 19,595 | | 5,812 | | 301,393 | | 9,364 | | |
Total non-current liabilities | | 426,655 | | 1,870 | | 2,956,640 | | 10,050 | | 40,620 | | 3,681,320 | | 355,401 | | 5,812 | | 2,555,114 | | 9,364 | | 14,814 |
Shareholders’ equity | | 13,910,645 | | 662,829 | | 2,665,349 | | 8,693 | | 9,647 | | 1,714,232 | | 12,923,170 | | 676,521 | | 2,514,121 | | 3,775 | | 1,860 |
Total liabilities and shareholders’ equity | 15,698,431 | | 699,873 | | 6,797,466 | | 41,180 | | 107,053 | | 5,545,134 | | 15,168,000 | | 769,991 | | 6,279,076 | | 29,270 | | 75,198 |
| | | | | | | | | | | | | | | | | | | | | | |
| |
12/31/2013 | |
12/31/2012 |
| | Nacional Minérios (*) | | Itá Energética | | MRS Logística | | CBSI | | CGPAR | | Transnordestina Logística | | Nacional Minérios (*) | | Itá Energética | | MRS Logística | | CBSI | | CGPAR |
Equity interest (%) | | 60.00% | | 48.75% | | 27.27% | | 50.00% | | 50.00% | | 77.30% | | 60.00% | | 48.75% | | 27.27% | | 50.00% | | 50.00% |
Statements of Income | | | | | | | | | | | | | | | | | | | | | | |
Net revenue | | 2,369,836 | | 153,105 | | 3,038,142 | | 109,650 | | 178,762 | | 58,465 | | 3,836,415 | | 217,493 | | 3,013,158 | | 61,915 | | 14,060 |
Cost of sales and services | | -1,346,658 | | -79,745 | | -1,926,923 | | -96,502 | | -148,998 | | -60,840 | | -2,730,077 | | -66,162 | | -1,993,927 | | -58,245 | | -8,780 |
Gross profit | | 1,023,178 | | 73,360 | | 1,111,219 | | 13,148 | | 29,764 | | -2,375 | | 1,106,338 | | 151,331 | | 1,019,231 | | 3,670 | | 5,280 |
Operating (expenses) income | | -113,212 | | -44,154 | | -277,814 | | -6,399 | | -1,402 | | -315,776 | | -412,091 | | -48,688 | | -262,777 | | -3,807 | | -16 |
Finance income (costs), net | | 1,621,386 | | 1,266 | | -114,637 | | 751 | | 306 | | -18,843 | | 1,329,707 | | -1,745 | | -82,417 | | 174 | | 29 |
Income before income tax and social contribution | 2,531,352 | | 30,472 | | 718,768 | | 7,500 | | 28,668 | | -336,994 | | 2,023,954 | | 100,898 | | 674,037 | | 37 | | 5,293 |
Current and deferred income tax and social contribution | -1,543,876 | | -10,263 | | -245,748 | | -2,584 | | -9,614 | | 178,937 | | -407,469 | | -33,962 | | -227,497 | | -10 | | -1,794 |
Profit for the year | | 987,476 | | 20,209 | | 473,020 | | 4,916 | | 19,054 | | -158,057 | | 1,616,485 | | 66,936 | | 446,540 | | 27 | | 3,499 |
| | | | | | | | | | | | | | | | | | | | | | | |
(*) Refer to the consolidated balances and profit or loss of Nacional Minérios S. A.
The balance sheet and income statement amounts refer to 100% of the companies’ results.
· NACIONAL MINÉRIOS – NAMISAS.A. - (“Namisa”)
Headquartered in Congonhas, State of Minas Gerais, this company is primarily engaged in the production, purchase and sale of iron ore and is mainly focused on foreign markets for the sale of its products. Its major operations are carried out in the cities of Congonhas, Ouro Preto, Itabirito and Rio Acima, in the State of Minas Gerais, and in Itaguaí, in the State of Rio de Janeiro.
In DecemberNovember 2008, CSN sold 2,271,825 shares40% of the votingNamisa’s capital of Nacional Minérios S.A. to the companybecame held by Big Jump Energy Participações S.A.(S.A (“Big Jump)Jump”), thewhose shareholders of which are the companieswere Posco and Brazil Japan Iron Ore Corp, (Itochu(“BJIOC” or “Consortium”), a consortium of Asian companies formed by Itochu Corporation, Nippon Steel, JFE Steel Corporation, Sumitomo Metal Industries Ltd., Kobe Steel Ltd., and Nisshin Steel Co. Ltd., Nippon Steel). Subsequent to this sale,Ltd.. As a result, CSN became the holder of 60% of Namisa´s capital.
On July 30, 2009, Big Jump subscribedEnergy Participações S.A. was merged into Namisa and, as a result, Posco and BJIOC became the holders of a direct interest in Namisa. In 2011, Nippon Steel and Sumitomo Metal Industries Ltd., until then members of the Consortium, sold their interests to the other members of the Consortium, followed by the entry of a new shares, paying up in cash the total amount of US$3,041,473 thousand, corresponding to R$7,286,154, of which R$6,707,886 was recognized as goodwill on the share subscription.
Due toshareholder, China Steel Corp. (“CSC”). After these transactions, the new corporate structure of Namisa is as follows: CSN 60%, BJIOC 32.52%, Posco 6.48%, and CSC 1%. CSN’s interests in Namisa did not change as a result of any of these events.
Under IFRS 10, paragraph B55, when assessing whether an investor has control of an investee, the jointly controlled entity, where Big Jump holds 40%investor shall determine whether it is exposed to, or has rights over, the variable returns arising from its relationship with the investee. The Shareholders’ Agreement entered into between the Consortium and CSN 60%,grants both the Consortium and CSN, through substantive rights, the power to influence the ordinary course of Namisa’s business, by beingactively involved in view of the shareholders’ agreement signed by the parties, CSN consolidates it proportionately.setting its budget, accounting policies, capital expenditures, management compensation, dividend distribution policy, among other matters.
FS-33
Such shareholders’ agreement prescribestable of contents
The Shareholders’ Agreement also provides that certain situations of severeextreme impasse between the shareholders that are not resolved after mediation and negotiation procedures between the executive officers of the parties may give CSN the right to exercise itsa call option and Big Jumpthe Consortium the right to exercise itsa put option regarding the equity interest held by Big Jumpthe Consortium in Namisa.
Other agreements signed, in orderexecuted to make such association feasible, among them the agreement forshare purchase of sharesagreement and the long-term operatingoperational agreements between Namisa, CSN and CSN,the Consortium, provide for certain obligations to do that, ifin case breached or not complied with or remediedcured within the stipulated deadlines in certain extreme situationsrelevant cure period may give rise, in certain specifc situations, to the right on the part of the aggrievednon-breached party to exercise itsa put or call option, as the case may be, with respect to the equity interest held by Big Jumpthe Consortium in Namisa.
FurtherThe material change in Namisa’s profit for this quarter is mainly due to its adherence to the process of restructuring Namisa,tax installment programs introduced by Laws No.12,865/13 and 11,941/09, which generated a net negative impact on July 30, 2009 this jointly controlledthe joint venture entity merged its parent Big Jump Energy Participações S.A., such that Posco and Brazil Japan Iron Corp. began holding a direct interest in Namisa. There was no changeamounting to R$889,772, which is reflected in the consolidated, through equity interest held by CSN as a resultaccounting, in the amount of this merger transaction.R$533,863 corresponding to its 60% equity interest.
In July and November 2011, respectively, Nippon Steel and Sumitomo Metal Industries, until then membersNamisa´s bylaws provide the payment of minimum dividends equivalent to 50% of the BJIOC consortium, sold their interestsprofit for the year. However, on March 28, 2014, the shareholders meeting approved, among other matters, the following measures in the Ordinary General Shareholder´s Meeting of Namisa: (i) allocation of profits for the years ended December 31, 2013 and 2012 as Earnings Reserves; and (ii) no dividends are declared for 2013 fiscal year.
·ITÁ ENERGÉTICA S.A. - (“ITASA”)
ITASA is a corporation originally created to carry out the other members and, with the entryconstruction of the new shareholder China Steel Corp. (CSC),Itá hydroelectric power plant: contracting for the new corporate structuresupply of Namisa startedgoods and services necessary to be as follows: carry out the project and raising funds, including posting the corresponding guarantees.
CSN 60%, BJIOC 32.52%, Posco 6.48% and CSC 1%.holds 48.75% of ITASA’s share capital.
· MRS LOGÍSTICA S.A. (“MRS”)
This subsidiary, located in Rio de Janeiro, RJ, is engaged in providing public railroad freight transportation services, on the basis of an onerous concession agreement, on the tracks of the Southeast Network,Railway System, - located between the cities of Rio de Janeiro, São Paulo and Belo Horizonte, previously belonging to Rede Ferroviária Federal S.A.- RFFSA, which was privatized on September 20, 1996. In 2008 CSN transferred to Namisa in the form of a capital contribution a 10% equity interest of MRS, decreasing its direct interest from 32.93% to 22.93%. Thus, CSN still holds indirect interests of 6%, through its subsidiary Nacional Minérios S.A.– Namisa, a proportionately consolidated entity.
In 2010 CSN held an indirect interest of 4.34% through its subsidiary International Investment Fund (IIF). On December 23, 2011 IIF distributed dividends to CSN, paid with the transfer of MRS shares to CSN.
As of December 31, 2011,2013 the Company directly held a direct interest27.27% and indirectly, through its jointly controlled entity Nacional Minérios S.A. (Namisa), 6% of 27.27%.MRS’s capital.
FS-32
MRS can also engage in modal transportation services related to railroad transportation and also participate in projects aimed at expanding the railroad services granted on a concession basis.
For provision of the services covered by the concession agreement obtained for a period of 30 years starting on December 1, 1996, extendable for an equal period by exclusive decision of the concession grantor, MRS leased from RFFSA for the same concession period the assets required for operation and maintenance of the railroad freight transportation activities. Upon extinction of the concession, all leased assets will be transferred to the ownership of the railroad transportation operator designated in that same act.
·ITÁ ENERGÉTICA S.A. - ITASA
CSN holds 48.75% of the subscribed capital and all the common shares issued by Itasa, a special purpose company originally created to carry out the construction of the Itá hydroelectric power plant: contracting for the supply of goods and services necessary to carry out the project and raising funds, including posting the corresponding guarantees.
Itasa has a 60.5% stake in Consórcio Itá, which was created to operate the Itá hydroelectric power plant, pursuant to the concession agreement of December 28, 1995 and its 1st amendment, dated July 31, 2000, signed between the members of the consortium (Itasa and Centrais Geradoras do Sul do Brasil - Gerasul, formerly named Tractebel Energia S.A.), granted by the federal government through the Agência Nacional de Energia Elétrica, or ANEEL (National Electric Power Agency), which expires in October 2030.
Under the terms of the concession agreement, ITASA has the right to 60.5% of an average of 668 MW, the quantity corresponding to the project energy prorated among the consortium members, with the other consortium member Tractebel Energia S.A.(‘Tractebel”) being entitled to the remaining 39.5%.Of the average of 404.14 MW to which this subsidiary is entitled, an average of 342.95 MW is sold to its shareholders in proportion to their equity interest in the company, and an average of 61.19 MW is sold to consortium member Tractebel.
· CONSÓRCIO DA USINA HIDRELÉTRICA DE IGARAPAVA
FS-34
Igarapava Hydroelectric Power Plant is located in Rio Grande, which is located 400 kilometers from Belo Horizonte and 450 kilometers from São Paulo,in the city of Conquista, MG, with installed capacity of 210 MW. It consists of 5 bulb type generating units and is considered a major mark for power generation in Brazil.
Igarapava stands out for being the first hydroelectric power plant built through a consortium involving five major companies.
CSN holds 17.92% of the subscribed capital ofinvestment in the consortium, whose specific purpose is the distribution of electric power, which is made according to the percentage equity interest of each company.
The balance of property, plant and equipment less depreciation as of December 31, 20112013 is R$31,75129,417 (R$32,91930,584 as of December 31, 2010)2012) and the amount of the expense attributable to CSNin 2013 is R$6,3666,024 (R$7,333 as of December 31, 2010)6,620 in 2012).
· CBSI - COMPANHIA BRASILEIRA DE SERVIÇOS DE INFRAESTRUTURA (“CBSI”)
In December 2011, CSN subscribed to 1,876,146 common shares, corresponding toholds 50% of the capital of CBSI - Companhia Brasileira de Serviços de Infraestrutura (“CBSI”).CBSI's share capital. The investment is the result of a joint venture between CSN and CKLS Serviços Ltda. basedBased in the city of Araucária, PR.PR, CBSI is primarily engaged in providing services to subsidiaries, associates, controlling companies and third-party entities, and can operate activities related to the assemblyrefurbishment and installationmaintenance of industrial machinery and equipment, construction road recovery and paving, constructionmaintenance, industrial cleaning, logistic preparation of plants, electric stations and substations, special engineering services to design structural projects, andproducts, among other related activities.
·CGPAR CONSTRUÇÃO PESADA S.A. (“CGPAR”)
CSN holds 50% of CGPAR's share capital. The investment is the result of a joint venture between CSN and GPA Construção Pesada e Mineração Ltda. Based in the city of Belo Horizonte, MG, CGPAR is mainly engaged in providing services related to the support to the extraction of iron ore, earth leveling, earthmoving, and dam construction.
·TRANSNORDESTINA LOGÍSTICA S.A. (“TLSA”)
It is primarily engaged in the operation and development of the railroad freight transportation public service in the Brazil’s Northeastern railway system, which encompasses the stretches between Missão Velha to Salgueiro, Salgueiro to Trindade, Trindade to Eliseu Martins, Salgueiro to Porto de Suape, and Missão Velha to Porto de Pecém (“Railway System II”).
As of December 31, 2013 CSN held 77.30% of Transnordestina Logística’s share capital.
12.d)Other investments
·Usinas Siderúrgicas de Minas Gerais S.A. – USIMINAS (“Usiminas”)
Usiminas, headquartered in Belo Horizonte, State of Minas Gerais, is engaged in steel and related operations. Usiminas produces flat rolled steel in the Intendente Câmara and José Bonifácio de Andrada e Silva plants, located in Ipatinga, Minas Gerais, and Cubatão, São Paulo, respectively, to be sold in the domestic market and also for exports. It also exploits iron ore mines located in Itaúna, Minas Gerais, to meet its verticalization and production cost optimization strategies. Usiminas also has service and distribution centers located in several regions of Brazil, and the Cubatão, São Paulo, and Praia Mole, Espírito Santo, ports, as well as in locations strategic for the shipment of its production.
As of December 31, 2012 and 2013, the Company reached holdings of 14.13% in common shares and 20.69% in preferred shares of Usiminas' share capital.
Usiminas is listed on the São Paulo Stock Exchange (“BM&F BOVESPA”: USIM3 and USIM5).
·PANATLÂNTICA S. A. (“Panatlântica”)
Publicly-held company, headquartered in the city of Gravataí, State of Rio Grande do Sul, engaged in the manufacturing, trade, import, export and processing of steel and ferrous or non-ferrous metals, coated or not. This investment is carried at fair value.
FS-35
CSN currently holds 9.41% (9.40% as of December 31, 2012) of Panatlântica’s total share capital.
·ARVEDI METALFER DO BRASIL S.A. (“Arvedi”)
On July 31, 2012, the Company acquired a non-controlling interest corresponding to 20% of the capital of Arvedi, company in preoperating stage focused on the production of pipes, headquartered in Salto, State of São Paulo.
10. PROPERTY, PLANT AND EQUIPMENT
| Consolidated |
| Land | | Buildings | | Machinery,
equipment
and
facilities | | Furniture
and
fixtures | | Construction
in progress | | Other (*) | | Total |
Balance at January 1, 2012 | | | | | | | | | | | | | |
Cost | 155,180 | | 1,668,999 | | 9,987,105 | | 136,003 | | 6,633,330 | | 932,006 | | 19,512,623 |
Accumulated depreciation | | | -239,796 | | -3,106,905 | | -104,796 | | | | -296,631 | | -3,748,128 |
Balance at January 1, 2012 | 155,180 | | 1,429,203 | | 6,880,200 | | 31,207 | | 6,633,330 | | 635,375 | | 15,764,495 |
Effect of foreign exchange differences | 5,656 | | 22,322 | | 246,204 | | 377 | | 471 | | -148,268 | | 126,762 |
Acquisition through business combination | 22,852 | | 103,739 | | 419,787 | | 1,202 | | 1,079 | | 33,819 | | 582,478 |
Acquisitions | 2,726 | | 20,871 | | 573,286 | | 7,199 | | 2,117,354 | | 15,016 | | 2,736,452 |
Capitalized interest (Notes 25 and 32) | | | | | | | | | 401,827 | | | | 401,827 |
Write-offs | -1,375 | | -255 | | -7,091 | | -48 | | -769 | | -221 | | -9,759 |
Depreciation | | | -61,524 | | -990,309 | | -6,007 | | | | -37,188 | | -1,095,028 |
Estimated losses on disposal of assets | | | | | | | | | | | -6,676 | | -6,676 |
Transfers to other asset categories | | | 13,876 | | 168,777 | | 332 | | -20,634 | | -162,351 | | |
Transfers to intangible assets | | | | | | | | | -3,074 | | -787 | | -3,861 |
Other | | | | | -73,876 | | | | 62,785 | | 33,465 | | 22,374 |
Balance at December 31, 2012 | 185,039 | | 1,528,232 | | 7,216,978 | | 34,262 | | 9,192,369 | | 362,184 | | 18,519,064 |
Cost | 185,039 | | 1,828,492 | | 11,358,581 | | 145,255 | | 9,192,369 | | 683,889 | | 23,393,625 |
Accumulated depreciation | | | -300,260 | | -4,141,603 | | -110,993 | | | | -321,705 | | -4,874,561 |
Balance at December 31, 2012 | 185,039 | | 1,528,232 | | 7,216,978 | | 34,262 | | 9,192,369 | | 362,184 | | 18,519,064 |
Effect of foreign exchange differences | 8,487 | | 28,882 | | 120,361 | | 488 | | 1,440 | | 1,905 | | 161,563 |
Acquisitions | 69 | | 1,555 | | 320,845 | | 3,562 | | 2,152,462 | | 11,076 | | 2,489,569 |
Capitalized interest (Notes 25 and 32) | | | | | | | | | 490,747 | | | | 490,747 |
Write-offs | -15 | | -71 | | -9,316 | | -12 | | -21,423 | | -823 | | -31,660 |
Depreciation | | | -60,122 | | -1,015,895 | | -5,867 | | | | -35,488 | | -1,117,372 |
Estimated losses on disposal of assets | | | | | | | | | | | -4,670 | | -4,670 |
Transfers to other asset categories | 19,721 | | 328,043 | | 1,311,628 | | 1,694 | | -1,841,181 | | 180,095 | | |
Transfers to intangible assets | | | | | | | | | -74,958 | | | | -74,958 |
Loss of control over Transnordestina | | | | | -963 | | | | -5,021,863 | | -6 | | -5,022,832 |
Capitalized interest written off (Note 9.b) | | | | | | | | | -185,206 | | | | -185,206 |
Impairment in jointly controlled entity Transnordestina (**) | | | | | | | | | | -279,296 | | -279,296 |
Other | | | | | -160,805 | | | | 79,248 | | 48,034 | | -33,523 |
Balance at December 31, 2013 | 213,301 | | 1,826,519 | | 7,782,833 | | 34,127 | | 4,771,635 | | 283,011 | | 14,911,426 |
Cost | 213,301 | | 2,196,994 | | 12,968,200 | | 151,479 | | 4,771,635 | | 627,845 | | 20,929,454 |
Accumulated depreciation | | | -370,475 | | -5,185,367 | | -117,352 | | | | -344,834 | | -6,018,028 |
Balance at December 31, 2013 | 213,301 | | 1,826,519 | | 7,782,833 | | 34,127 | | 4,771,635 | | 283,011 | | 14,911,426 |
FS-33
| | | | | | | | | | | | | | | |
| | | |
| | | Land | | Buildings | | Machinery,
equipment and
facilities | | Furniture and fixtures | | Construction in progress | | Other (*) | | Total |
| Balance at December 31,2009 | | 126,059 | | 1,289,511 | | 6,243,494 | | 22,415 | | 2,089,735 | | 1,362,133 | | 11,133,347 |
Effect of foreign exchange differences | | (1,659) | | (175) | | (2,762) | | (50) | | (746) | | (10,373) | | (15,765) |
Acquisitions | | | | | | | | | | 3,481,249 | | | | 3,481,249 |
Derecognized projects | | | | | | | | | | (15,501) | | | | (15,501) |
Disposals | | | | | | (5,065) | | (22) | | | | 14,760 | | 9,673 |
Transfers to other categories of assets | | 10,785 | | 159,987 | | 1,343,721 | | 10,591 | | (1,040,761) | | (484,323) | | |
Depreciation | | | | (74,344) | | (677,266) | | (4,469) | | | | (36,877) | | (792,956) |
Other | | 40,607 | | (161,371) | | 71,902 | | (38) | | 1,830 | | 23,590 | | (23,480) |
Balance at December 31,2010 | | 175,792 | | 1,213,608 | | 6,974,024 | | 28,427 | | 4,515,806 | | 868,910 | | 13,776,567 |
Effect of foreign exchange differences | | 1,234 | | 3,640 | | 16,377 | | 135 | | (157) | | 2,162 | | 23,391 |
Acquistion through business combination | | 3,325 | | 10,805 | | 14,050 | | 562 | | 4,204 | | 90,572 | | 123,518 |
Acquisitions | | | | | | | | | | 4,400,828 | | | | 4,400,828 |
Derecognized projects | | | | | | | | | | (3,778) | | | | (3,778) |
Disposals | | | | (6,719) | | (30,059) | | (17) | | | | (13,294) | | (50,089) |
Depreciation | | | | (39,364) | | (821,672) | | (4,931) | | | | (65,441) | | (931,408) |
Reversal of allowance for loss on asset disposal | | | | | | | | | | | | 4,774 | | 4,774 |
Transfers to other categories of assets | | 14,233 | | 273,320 | | 1,477,118 | | 9,172 | | (1,848,785) | | 74,942 | | |
Transfers to intangible assets | | | | | | | | | | (11,104) | | (383) | | (11,487) |
Other | | | | (170) | | (4,883) | | 54 | | (695) | | 50,454 | | 44,760 |
| Balance at December 31,2011 | | 194,584 | | 1,455,120 | | 7,624,955 | | 33,402 | | 7,056,319 | | 1,012,696 | | 17,377,076 |
(*) ReferIt refers basically to railway assets, such as yards, tracks and railway sleepers. Also comprises leasehold improvements, vehicles, hardware, mines and ore bodies and replacement storeroom supplies.
(**)The disproportionate spin-off of Transnordestina Logística S.A. (“TLSA”) resulted in the execution of an Addendum to the Concession Agreement of the Northeast Railway System and the merger of Railway System I’s assets and liabilities into FTL – Ferrovia Transnordestina Logística S.A. (in operation), with the maintenance of Railway System II’s assets and liabilities (New Transnordestina project) in TLSA. As a result, TLSA assessed the future performance of its operating assets related to Railway System I (in operation). The analysis resulted in the recognition of an impairment loss of R$279,296, recognized in line item “Other operating expenses” in subsidiary and consolidated of R$216,446, as described in Note 24. The recoverable amount of these assets was determined based on the value in use. The discount rate used to measure the value in use was 9.15% per year.
The breakdown of the projects comprising construction in progress is as follows:
| | | | | | | | | | |
| | Project objective | | Start date | | Scheduled completion | | 12/31/2010 | | 12/31/2011 |
| Construction in Progress - Main projects | | | | | | | | |
| Logistics | | | | | | | 1,889,411 | | 3,795,760 |
| | Expansion of Transnordestina railroad around 1,728 km to boost the transportation of varied products as iron ore, limestone, soybeans, cotton, sugarcane, fertilizers, oil and fuels. | | 2009 | | 2014 | | 1,774,875 | | 3,489,871 |
| | Expansion of MRS's capacity and current investments for maintenance of current operations | | | | | | 111,763 | | 290,410 |
| | Current investments for maintenance of current operations | | | | | | 2,773 | | 15,479 |
| Mining | | | | | | | 1,364,733 | | 1,931,047 |
| | Expansion of Casa de Pedra Mine capacity production to 42 Mtpa | | 2007 | | 2012/13(1) | | 1,101,234 | | 1,322,433 |
| | Expansion of TECAR to permit an annual exportation of 60 Mtpa | | 2009 | | 2013 | | 167,163 | | 425,134 |
| | Expansion of Namisa capacity production to 39 Mtpa | | 2008 | | 2015/16 | | 81,172 | | 137,059 |
| | Current investments for maintenance of current operations | | | | | | 15,164 | | 46,421 |
| Steel | | | | | | | 803,798 | | 1,164,239 |
| | Implementation of the long steel mill in the states of Rio de Janeiro, Minas Gerais and São Paulo forproduction of rebar and wire rod. | | 2008 | | 2013(2) | | 618,832 | | 907,521 |
| | Current investments for maintenance of current operations | | | | | | | | |
| | Expansion of TECAR to allow annual exports of 45 mtpy | | | | | | 184,966 | | 256,718 |
| | Expansion of Namisa production capacity to 39 mpty | | | | | | | | |
| Cement | | | | | | | 457,864 | | 165,273 |
| | Construcion of Cement plant in the Northeast and Southern region of Brazil and in the city of Arcos, MinasGerais | | 2011 | | 2013(3) | | 98,258 | | 132,986 |
| | Construcion of clinquer plant in the city of Arcos, Minas Gerais | | 2007 | | 2011(4) | | 357,981 | | 27,536 |
| | Current investments for maintenance of current operations | | | | | | 1,625 | | 4,751 |
| | Total construction in progress | | | | | | 4,515,806 | | 7,056,319 |
FS-36
| Project description | Start date | Completion date | | 12/31/2013 | 12/31/2012 |
Logistics | | | | | | |
| | Expansion of Transnordestina railroad by 1,728 km to boost the transportation of varied products as iron ore, limestone, soybeans, cotton, sugarcane, fertilizers, oil and fuels. | 2009 | 2016 | (*) | | 3,925,720 |
| | Equalization of Berth 301. | 2012 | 2014 | | 151,932 | 27,554 |
| | Current investments for maintenance of current operations. | | | | 231,832 | 726,416 |
| | | | | | 383,764 | 4,679,690 |
Mining | | | | | | |
| | Expansion of Casa de Pedra Mine capacity production. | 2007 | 2015/2016 | (1) | 1,090,568 | 1,329,565 |
| | Expansion of TECAR’s export capacity. | 2009 | 2014/2016 | (2) | 404,374 | 695,859 |
| | Current investments for maintenance of current operations. | | | | 42,866 | 332,638 |
| | | | | | 1,537,808 | 2,358,062 |
Steel | | | | | | |
| | Construction of a long steel plant to produce rebar and machine wire. | 2008 | 2014 | (3) | 1,592,016 | 1,460,694 |
| | Implementation of the AF#3’s gas pressure recovery. | 2006 | 2014 | | 74,337 | 60,750 |
| | Current investments for maintenance of current operations. | | | | 679,495 | 356,105 |
| | | | | | 2,345,848 | 1,877,549 |
Cement | | | | | | |
| | Construction of cement plants. | 2011 | 2015 | | 476,076 | 241,412 |
| | Current investments for maintenance of current operations. | | | | 28,139 | 35,656 |
| | | | | | 504,215 | 277,068 |
Total construction in progress | | | 4,771,635 | 9,192,369 |
| | | | | | | |
(*) As a result of the loss of control, the subsidiary Transnordestina was deconsolidated at December 31, 2013. (See Note 9 b.)
(1) Expected date for completion of the 40 Mtpa and 42 Mtpa Stagesstages
(2) Expected date for completion of the Rio de Janeiro unity45 Mtpa and 60 Mtpa stages
(3) Expected date for completion of new grinding on Arcos - MG
(4) Manufacturing plant Started in operation, in “ramp-up”January 2014.
The costs classified in construction in progress comprise basically the acquisition of services, purchase of parts to be used as investments for improvement of performance, upgrading of technology, enlargement, expansion and acquisition of assets that will be transferred to the relevant line items and depreciated as from the time they are available for use.
Current investments for maintenance areThe costs incurred to refurbish and replace property, plant and equipment items totaled R$151,517 as of December 31, 2013 (R$273,339 as of December 31, 2012), which were capitalized and will be depreciated on an accrual basisover the period until the next maintenance event of the relevant asset, totaling R$654,741 as of December 31, 2011 (R$495,430 as of December 31, 2010).event.
Others repairsOther repair and maintenance expenses are charged to operating costs and expenses when incurred.
FS-34
In view of the need to review the useful lives at least every financial year, in 20112013 management performed the review for all the Company’s units. As a result, the estimated useful lives for the current year are as follows:
| | |
|
Buildings | | 46 43 |
Machinery, equipment and facilities | | 13 14 |
Furniture and fixtures | | 10 11 |
Other | | 34 26 |
a) TheAs of December 31, 2013, the Company capitalized borrowing costs amounting to R$353,156490,747 (R$215,624401,827 as of December 31, 2010) (see note 26).These2012). These costs are basically calculatedestimated for the mining cement,and long steel and Transnordestina projects, mainly relating to:(i)
FS-37
table of contents
Casa de Pedra Mine expansion; expansion (ii) construction of the cement plant in Volta Redonda, RJ, and the clinker plant in the city of Arcos, MG; (iii); construction of the long steel mill in the city ofVolta Redonda RJ;(RJ), see notes 25 and (iv) extension of Transnordestina railroad, which will connect the countryside of the northeast region to the Suape, State of Pernambuco, and Pecém, State of Ceará, ports. 32.
The rates used to capitalize borrowing costs are as follows:
| | |
FEES |
Specific | | Non-specific |
projects | | projects |
TJLP + 1.3% to 3.2% | | 10.56% |
UM006 + 2.7% | | |
| | | | | |
Rates | | 12/31/2013 | | 12/31/2012 |
Specific projects | | TJLP + 1.3% to 3.2% | | TJLP + 1.3% to 3.2% |
| UM006 + 2.7% | | UM006 + 2.7% |
Unspecified projects | | 8.35% | | 8.47% |
b) Additions to depreciation, amortization and depletion for the periodyear were distributed as follows:
| | | | | |
| | | |
| | | 12/31/2011 | | 12/31/2010 |
| Production cost | | 892,297 | | 770,542 |
| Selling expenses | | 7,130 | | 6,471 |
| General and administrative expenses | | 29,941 | | 29,156 |
| Other operating expenses | | 18,883 | | 7,865 |
| | | 948,251 | | 814,034 |
| | 12/31/2013 | | 12/31/2012 | | 12/31/2011 |
Production cost | 1,068,156 | | 1,062,950 | | 892,297 |
Selling expenses | 8,248 | | 8,041 | | 7,130 |
General and administrative expenses | 17,426 | | 14,742 | | 29,941 |
| | 1,093,830 | | 1,085,733 | | 929,368 |
Other operating expenses (*) | 61,763 | | 14,739 | | 18,883 |
| | 1,155,593 | | 1,100,472 | | 948,251 |
(*) Refers to the depreciation of unused equipment (see note 24).
c) The Casa de Pedra mine is an asset that belongs to CSN, which has the exclusive right to explore such mine.Our mining activities of Casa de Pedra are based on the ‘Mine Manifest’, which grants CSN full ownership over the mineral deposits existing within our property limits.
As of December 31, 20112013 the net property, plant and equipment of Casa de Pedra was R$2,485,0773,277,205 (R$2,167,3782,892,120 as of December 31, 2010)2012), represented mainly by construction in progress amounting to R$1,123,8211,090,642 (R$911,0771,612,000 as of December 31, 2010). Up to December 31, 2011, interest capitalized in property, plant and equipment of Casa de Pedra totaled R$82,607 (R$48,590 as of December 31, 2010)2012).
13.11. INTANGIBLE ASSETS
| | Goodwill | Customer relations | Software | Other | Total |
Balance at January 1, 2012 | | | | | |
Cost | 431,173 | | 36,253 | 941 | 468,367 |
Accumulated amortization | -150,004 | | -26,523 | | -176,527 |
Adjustment for accumulated recoverable value | -60,861 | | | | -60,861 |
Balance at January 1, 2012 | 220,308 | | 9,730 | 941 | 230,979 |
Effect of foreign exchange differences | | 30,501 | 104 | 14,043 | 44,648 |
Acquisitions through business combination (*) | 235,595 | 316,939 | | 77,232 | 629,766 |
Acquisitions and expenditures | | | 916 | 472 | 1,388 |
Disposals | | | | -564 | -564 |
Transfer of property, plant and equipment | | | 3,861 | | 3,861 |
Amortization | | | -5,442 | | -5,442 |
Other movements | | | 225 | | 225 |
Balance at December 31, 2012 | 455,903 | 347,440 | 9,394 | 92,124 | 904,861 |
Cost | 666,768 | 347,440 | 41,849 | 92,124 | 1,148,181 |
Accumulated amortization | -150,004 | | -32,455 | | -182,459 |
Adjustment for accumulated recoverable value | -60,861 | | | | -60,861 |
Balance at December 31, 2012 | 455,903 | 347,440 | 9,394 | 92,124 | 904,861 |
Effect of foreign exchange differences | | 64,570 | 148 | 18,127 | 82,845 |
Acquisitions and expenditures | | | 635 | | 635 |
Disposals | | | -1 | -820 | -821 |
Impairment loss | -48,469 | | | | -48,469 |
Transfer of property, plant and equipment | | | 74,958 | | 74,958 |
Loss of control over Transnordestina | | | -10,128 | | -10,128 |
Amortization | | -30,530 | -7,691 | | -38,221 |
Other movements | | | 39 | -259 | -220 |
Balance at December 31, 2013 | 407,434 | 381,480 | 67,354 | 109,172 | 965,440 |
Cost | 666,768 | 415,899 | 107,416 | 109,172 | 1,299,255 |
Accumulated amortization | -150,004 | -34,419 | -40,062 | | -224,485 |
Adjustment for accumulated recoverable value | -109,330 | | | | -109,330 |
Balance at December 31, 2013 | 407,434 | 381,480 | 67,354 | 109,172 | 965,440 |
FS-35
FS-38
| | | | | | | | | | | |
| | | |
| | | Goodwill | | Intangible assets with finite useful lives | | Software | | Other | | Total |
| Balance at December 31,2009 | | 423,698 | | 9,982 | | 23,879 | | | | 457,559 |
Acquisitions and expenditures | | | | | | 25,239 | | 1,002 | | 26,241 |
Amortization | | | | (4,991) | | (16,353) | | | | (21,344) |
| Balance at December 31,2010 | | 423,698 | | 4,991 | | 32,765 | | 1,002 | | 462,456 |
Effect of foreign exchange differences | | | | | | 6 | | 72 | | 78 |
Acquisitions through business combination (*) | | 204,569 | | | | | | | | 204,569 |
Acquisitions and expenditures | | | | | | 350 | | 353 | | 703 |
Disposals | | | | | | (784) | | (489) | | (1,273) |
Impairment losses | | (60,861) | | | | | | | | (60,861) |
Transfer of property, plant and equipment | | | | | | 11,487 | | | | 11,487 |
Transfer of long-term receivables | | | | | | | | 2,977 | | 2,977 |
Amortization | | | | (4,991) | | (9,622) | | (2,230) | | (16,843) |
Other movements | | | | | | (2,113) | | 2,194 | | 81 |
| Balance at December 31,2011 | | 567,406 | | | | 32,089 | | 3,879 | | 603,374 |
(*) Goodwill based on expected future earnings, arising on the Prada Embalagens and CBL business combination of CSN Steel S. L. with the companies Stahlwerk Thüringen Gmbh (SWT) and Gallardo Sections on July 12, 2011.
Recoverable amount of the Packaging cash-generating unit (“CGU”), determined based on the business valuation report prepared by independent appraisers. As a result of this valuation, the company recognized an impairment adjustment amounting to R$60,861
The concession intangible asset with definite useful life refers to the amount originally paid by shareholders, whose economic basis was expected future earnings due to the concession right, recorded by the Company’s jointly controlled entity. The amortization is calculated on a straight-line basis over the concession period.January 31, 2012 (see note 4).
The useful life of software is one01 to five05 years and of other intangible assets is 13 to 30 years.
Goodwill:The economic basis of goodwill is the expected future earnings and, in accordance with the new pronouncements, these amounts are not amortized since January 1, 2009, when they became subject only to impairment testing.
| | | | |
Goodwill on Investments | | Balance at
12/31/2011 | | Investor |
Flat steel | | 13,091 | | CSN |
Subtotal Company | | 13,091 | | |
Mining | | 347,098 | | Namisa |
Packaging | | 207,217 | | CSN |
Total consolidated | | 567,406 | | |
· Impairment testing for goodwill
In order to conduct impairment testing, goodwill is allocated to CSN’s operating divisions that represent the lowest level within the Companyof assets or group of assets at which goodwill is monitored for internalby the Company's senior management, purpose, never above Operating Segments.
| | | | | | | |
| Cash-generating unit | | Segment | | 12/31/2011 | | 12/31/2010 |
| Mining (Namisa) | | Mining | | 347,098 | | 347,098 |
| Packaging (*) | | Steel | | 207,217 | | 63,509 |
| Flat steel | | Steel | | 13,091 | | 13,091 |
| | | | | 567,406 | | 423,698 |
Cash generating unit | | Segment | | 12/31/2013 | | 12/31/2012 | | Investor |
Packaging (*) | | Steel | | 158,748 | | 207,217 | | CSN |
Flat steel | | Steel | | 13,091 | | 13,091 | | CSN |
Long steel | | Steel | | 235,595 | | 235,595 | | CSN Steel S.L. |
| | | | 407,434 | | 455,903 | | |
(*) AmountGoodwill of the cash-generating unit (CGU) Steel Containers is presented net of an impairment loss recorded in 2011 in the impairment adjustmentline item of other operating income and expenses in the income statement for the year, amounting to R$60,861. During the 4th quarter of 2013, the Company identified again an impairment of goodwill of the CGU Steel Containers and recorded the amount of R$48,469.
FS-36
The recoverable amount of a Cash-Generating Unit (“CGU”) is determined based on value-in-use calculations.
These calculations use cash flow projections, before income tax and social contribution, based on financial budgets approved by management for a three-year period. The amounts related to cash flows subsequent to the three-year period were extrapolated based on the estimated growth rates shown below. The growth rate does not exceed the average long-term growth rate of the industry in which the Cash-Generating Unit (“CGU”) operates.
The main assumptions used in calculating the values in use as of December 31, 20112013 are as follows:
|
| | |
| Mining | Packaging |
| Flat steel |
| Long steel |
Gross margin (i) | For gross margin were used the expansion plans alreadyapproved in the Company’s business plan, iron ore prices onthe international market, based on projections prepared byofficial institutions of the mining industry and the projectedUS dollar (US$) versus Brazilian reais (R$) rate curve until2020, made available by the Central Bank of Brazil(BACEN). After 2020, no variance was considered.
| Average gross margin of eachcash-generating unitGross Margin based on itshistorythe history and the budget projections for the next 2 years; beginning in the third year, average price, operating cost and expense projections, simulated based on an industrial activity centralization and plant modernization scenario, also taking into account other revenues from sale of assets. | | Average Gross Margin based on the history and projections approvedbyapproved by the Board for the next threeyears;three years, and long-term price and foreign exchange curves obtained in industry reports. | Averagegross margin of eachcash-generating unit based
| Based on itshistory andthe projections approvedbyapproved by the Board for the next threeyears;three years, long-term price and foreign exchange curves, and taking into consideration the production volume ramp up after plant start-up. |
Cost adjustment | Cost adjustment | | Operating costs based on long-term inflation projections;the history and the budget projections for the next two years; beginning in the third year, operating cost projections incorporating the simulated benefits based on an industrial activity centralization and plant modernization scenario. | | Cost adjustment based on long-term inflation projections;historical data and price and foreign exchange curves obtained in industry reports. | | Cost adjustment based on long-term inflation projections; historical data and price and foreign exchange curves obtained in industry reports. |
Growth rate (ii) | Cash flows were made considering a
| Sales volume growth projection period up to2041,prepared based on the maturity term ofsales department’s forecast for the main contractsmarket segments, and to whichthe Company's Business Plan is tied. Therefore it was notused a grow rate, given thatalso taking into account the projection period exceeds 30years.simulation of new production capacity based on an industrial activity centralization and plant modernization scenario. | Average growth rateof 2.1% p.a.used to extrapolate the cash flowsafter the budgeted period;
| Average growth rate of 0.5% p.a.used2.0% p.a. used to extrapolate the cash flowsafterflows after the budgeted period;period. | | Average growth rate of 2.0% p.a. used to extrapolate the cash flows after the budgeted period. |
Discount rate (iii) | Pretax US dollar 11% | Effective discount rate of 8.2% p.a., before income tax and social contribution. | | Effective discount rate. rate of 8.2% p.a., before income tax and social contribution. | Pretax 16.75% | Effective discount rate of 8.2% p.a. discount rate. | Pretax 11% p.a. discount rate. , before income tax and social contribution. |
(*) Assumptions used by independent experts.
(i) Budgeted gross margin.
(ii) Weighted average growth rate, used to extrapolate the cash flows after the budgetbudgeted period.
(iii) Pretax discount rate, applied to cash flow projections.
FS-39
table of contents
14.12. BORROWINGS, FINANCING AND DEBENTURES
The balances of borrowings, financing and debentures, which are carried at amortized cost, are as follows:
| | | Rates p.a. (%) | Current liabilities | Non-current liabilities |
| | | 12/31/2013 | 12/31/2012 | 12/31/2013 | 12/31/2012 |
FOREIGN CURRENCY | | | | | | |
Prepayment | | 1% to 3.50% | 105,874 | 162,290 | 1,166,615 | 1,104,271 |
Prepayment | | 3.51% to 7.50% | 207,331 | 8,954 | 1,276,717 | 878,705 |
Perpetual bonds | | 7.00% | 3,189 | 2,781 | 2,342,600 | 2,043,500 |
Fixed rate notes | | 4.14 to 10% | 156,868 | 1,265,330 | 5,505,110 | 4,802,225 |
Financed imports | | 6.24% | | 6,813 | | |
BNDES/FINAME | | Res. 635/87 interest + 1.7% and 2.7% | 12,356 | 32,395 | | 10,755 |
Intercompany | | 6M Libor + 2.25 and 3% | | | | |
Other | | 3.51% to 7.50% + 1.2% | 49,306 | 9,860 | 442,843 | 409,337 |
| | | | 534,924 | 1,488,423 | 10,733,885 | 9,248,793 |
LOCAL CURRENCY | | | | | | |
BNDES/FINAME | | TJLP + 1.5% to 3.2% and 2.5% to 10% fixed rate | 97,044 | 346,623 | 962,684 | 1,535,255 |
Debentures | | 105.8% to 110.8% CDI and TJLP + 0.85% | 846,387 | 128,239 | 1,932,500 | 4,436,892 |
Prepayment | | 106.5% to 110,79% CDI and 8% fixed rate | 101,330 | 163,812 | 5,345,000 | 4,800,000 |
CCB | | 112.5% CDI | 1,085,436 | 62,072 | 6,200,000 | 7,200,000 |
Intercompany | | 110.79% CDI | | | | |
Other | | | 8,527 | 10,983 | 15,505 | 16,581 |
| | | | 2,138,724 | 711,729 | 14,455,689 | 17,988,728 |
Total borrowings and financing | 2,673,648 | 2,200,152 | 25,189,574 | 27,237,521 |
Transaction costs and issue premiums | -30,841 | -31,030 | -85,951 | -101,939 |
Total borrowings and financing + transaction costs | 2,642,807 | 2,169,122 | 25,103,623 | 27,135,582 |
FS-37
| | | | | | | | | | | |
| | | | | Current liabilities | | Non-current liabilities |
| | | Rates in (%) | | 12/31/2011 | | 12/31/2010 | | 12/31/2011 | | 12/31/2010 |
| FOREIGN CURRENCY | | | | | | | | | | |
| Prepayment | | 1% to 3.50% | | 381,333 | | 473,255 | | 573,388 | | 1,840,269 |
| Prepayment | | 3.51% to 7.50% | | 148,597 | | 138,210 | | 1,281,171 | | 522,116 |
| Guaranteed perpetual bonds | | 7.00% | | 2,553 | | 2,268 | | 1,875,800 | | 1,666,200 |
| Fixed rate notes | | 9.75% | | 4,191 | | 4,546 | | 1,031,690 | | 916,410 |
| Fixed rate notes | | 6.50% | | 53,851 | | 47,834 | | 1,875,800 | | 1,666,200 |
| Fixed rate notes | | 6.875% | | 26,598 | | 23,626 | | 1,406,850 | | 1,249,650 |
| Fixed rate notes | | 10.5% | | 34,390 | | 32,074 | | 750,320 | | 666,480 |
| Financed imports | | 3.52% to 6.00% | | 261 | | 57,293 | | | | 59,322 |
| Financed imports | | 6.01% to 8.00% | | 25,248 | | 16,849 | | 27,310 | | 24,396 |
| CCB | | 1.54% | | 176,440 | | | | | | |
| BNDES/FINAME | | Interest R. Res. 635/87+1.7% and 2.7% | | 25,903 | | 20,085 | | 36,750 | | 55,256 |
| Other | | 3.3% to 5.37% and CDI +1.2% | | 105,181 | | 85,790 | | 145,438 | | 103,587 |
| | | | | 984,546 | | 901,830 | | 9,004,517 | | 8,769,886 |
| LOCAL CURRENCY | | | | | | | | | | |
| BNDES/FINAME | | TJLP + 1.5% to 3.2% | | 430,432 | | 308,968 | | 1,744,727 | | 1,907,596 |
| Debentures | | 103.6 % and 110.8% CDI and9.4% + IGPM and 1% + TJLP | | 672,073 | | 41,750 | | 2,822,424 | | 1,760,846 |
| Prepayment | | 104.8% and 109.5 % CDI | | 537,128 | | 64,216 | | 4,523,224 | | 3,400,000 |
| CCB | | 112.5% CDI | | 101,280 | | 1,354 | | 7,200,000 | | 3,000,000 |
| Other | | | | 9,509 | | 26,443 | | 37,058 | | 23,303 |
| | | | | 1,750,422 | | 442,731 | | 16,327,433 | | 10,091,745 |
| Total borrowings and financing | | | | 2,734,968 | | 1,344,561 | | 25,331,950 | | 18,861,631 |
| Transaction costs | | | | (32,885) | | (35,929) | | (145,445) | | (80,816) |
| Total borrowings and financing +transaction costs | | | | 2,702,083 | | 1,308,632 | | 25,186,505 | | 18,780,815 |
The balances of prepaid intragroupintercompany borrowings related to the Company total R$2,244,9272,943,964 as of December 31, 20112013 (R$2,080,7212,339,776 as of December 31, 2010)2012) and the balances of Fixed Rate Notes and Intercompany Bonds total R$2,452,956 (R$3,545,340 as of December 31, 2012), see note 4.19.
· Funding transaction costs
As of December 31, 20112013, funding transaction costs are as follows:
| | | | | | | | | | | | | | | | | | | | | |
| | | |
| | | Short term | | Long term | | | | |
| | | | 2013 | | 2014 | | 2015 | | 2016 | | 2017 | | After 2017 | | Total | | TJ(1) | | TIR(2) |
| Fixed rate notes | | 4,067 | | 4,779 | | 3,478 | | 3,100 | | 2,203 | | 2,203 | | 4,852 | | 20,615 | | 6.5% to 10% | | 6.75% to 10.7% |
| BNDES | | 553 | | 491 | | 423 | | 389 | | 389 | | 389 | | 3,491 | | 5,572 | | 1.3% to 1.7% | | 1.44% to 7.39% |
| BNDES | | 1,578 | | 1,578 | | 284 | | | | | | | | | | 1,862 | | 2.2% to 3.2% | | 7.59% to 9.75% |
| Prepayment | | 8,059 | | 8,020 | | 6,397 | | 2,219 | | 2,219 | | 2,219 | | 1,354 | | 22,428 | | 109.50% and 110.79% CDI | | 10.08% to 12.44% |
| Prepayment | | 509 | | 509 | | 509 | | 509 | | 509 | | 346 | | | | 2,382 | | 2.37% and 3.24% | | 2.68% to 4.04% |
| CCB | | 17,472 | | 16,220 | | 17,651 | | 13,902 | | 13,902 | | 10,056 | | 18,046 | | 89,777 | | 112.5% CDI | | 11.33% to 14.82% |
| Other | | 647 | | 427 | | 427 | | 427 | | 427 | | 427 | | 674 | | 2,809 | | 110.8% and 103.6% CDI | | 12.59% and 13.27% |
| | | 32,885 | | 32,024 | | 29,169 | | 20,546 | | 19,649 | | 15,640 | | 28,417 | | 145,445 | | | | |
| | | | | |
| | | Current | | Noncurrent | | TIR(1) |
| | | | |
Fixed rate notes | | 1,865 | | 3,830 | | 6.5% to 10.7% |
BNDES | | 631 | | 2,660 | | 1.44% to 9.75% |
Prepayment | | 8,162 | | 15,766 | | 10.08% to 12.44% |
Prepayment | | 2,213 | | 8,368 | | 2.68% to 4.04% |
CCB | | 17,472 | | 54,834 | | 11.33% to 14.82% |
Other | | 498 | | 493 | | 6.75% to 12.59% and 10.7% to 13.27% |
| | 30,841 | | 85,951 | | |
(1)TJ – Annual interest rate contracted(2) TIR – Annual internal rate of return
FS-40
· Maturities of borrowings, financing and debentures presented in non-current liabilities
As of December 31, 2011,2013, the principal of long-term borrowings, financing and debentures by maturity year is as follows:
| | | |
2015 | | 3,181,503 | | 13% |
2016 | | 3,210,020 | | 13% |
2017 | | 3,628,773 | | 14% |
2018 | | 3,997,706 | | 16% |
2019 | | 3,813,514 | | 15% |
After 2019 | | 5,015,458 | | 19% |
Perpetual bonds | | 2,342,600 | | 10% |
| | 25,189,574 | | 100% |
FS-38
| | | | | |
| 2013 | | 2,263,889 | | 9% |
| 2014 | | 1,933,763 | | 8% |
| 2015 | | 2,346,461 | | 9% |
| 2016 | | 2,444,259 | | 10% |
| 2017 | | 3,166,273 | | 12% |
| After 2017 | | 11,301,505 | | 45% |
| Perpetual bonds | | 1,875,800 | | 7% |
| | | 25,331,950 | | 100% |
· Amortizations and new borrowings, financing and debentures
The table below shows the amortizations and new funding in the current period:year:
| | | | | |
| | | |
| | | 12/31/2011 | | 12/31/2010 |
| Opening balance | | 20,089,447 | | 14,267,601 |
| Funding | | 7,824,012 | | 8,754,779 |
| Amortization | | (3,614,606) | | (3,897,405) |
| Other (*) | | 3,589,735 | | 964,472 |
| Closing balance | | 27,888,588 | | 20,089,447 |
| | 12/31/2013 | | 12/31/2012 |
Opening balance | | 29,304,704 | | 26,973,247 |
Funding | | 1,697,363 | | 3,520,263 |
Amortization | | -4,300,240 | | -4,876,453 |
Loss of control over Trasnordestina | | -3,180,821 | | |
Other (*) | | 4,225,424 | | 3,687,647 |
Closing balance | | 27,746,430 | | 29,304,704 |
(*) Includes unrealized foreign exchange differences and inflation adjustments.
LoansIn December 2013, the Company redeemed all the Guaranteed Bonds issued in 2003, through its wholly-owned subsidiary CSN Islands VIII Corp., guaranteed by CSN, at a rate of 9.75% per year, amounting to US$550 million (R$1,270,775) in principal and US$27 million (R$62,295) in interest.
Borrowing and financing contracts with certain financial institutions contain some covenants that are usual in financial agreements in general and the Company is compliant with them atas of December 31, 2011.
In February 2011, the Company entered into with Caixa Econômica Federal a Corporate Loan Transaction - Large Corporations, by issuing a bank credit certificate of R$2 billion, with final amortization maturity of 94 months. This CCB (bank credit note) bears interest equivalent to 112.5% of the CDI (interbank deposit rate), as released by CETIP (OTC Clearing House), per year, and interest is paid on a quarterly basis, in March, June, September and December.
In April 2011, the Company contracted an Export Credit Note amounting to R$1.5 billion from Banco do Brasil, which will mature in April 2019.
This NCE (export credit note) bears interest equivalent to 110.8% of the CDI (interbank deposit rate), as released by CETIP, per year, and interest is paid on a semiannual basis, in April and October.
In August 2011, the Company entered into with Caixa Econômica Federal a Corporate Loan Transaction - Large Corporations, by issuing a bank credit certificate of R$2.2 billion, with final amortization maturity of 108 months. This CCB (bank credit note) bears interest equivalent to 112.5% of the CDI (interbank deposit rate), as released by CETIP, per year, and interest is paid on a quarterly basis, in February, May, August and November.
In December 2011 the Company settled in advance its export receivables securitization program with the payment of R$313,842 (R$283,857 in principal, R$2,373 in interest and R$27,612 in premium paid to creditors for early settlement).2013.
· Debentures
i. Companhia Siderúrgica Nacional
4th6th issue
As approved at the Board of Directors’ meeting held on December 20, 2005 and ratified on April 24, 2006,In September 2012 the Company issued on February 1, 2006, 60,000156,500 nonconvertible, unsecured debentures, in singleof which 106,500 1st series with a unit face value of R$10.These debentures were issued in the total amount of R$600,000 and the proceeds from their trading with financial institutions were received on May 3, 2006.
FS-39
The face value of these50,000 2nd series debentures, earns interest equivalent to 103.6% of CDI rate, as released by Cetip, per year, and maturity of the face value is scheduled for February 1, 2012, with an early redemption option.
5th issue
As approved at the Board of Directors’ meeting held on July 12, 2011, the Company issued on July 20, 2011, 115 nonconvertible, unsecured debentures, in single series, with a unit face value of R$10 million. These debentures were issued in the total amount oftotaling R$1,150,000 and the proceeds from their trading with financial institutions were received on August 23, 2011.
The face value of these debentures earns1,565,000 that pay interestequivalent to 110.8%105.80% of the CDI as released by Cetip rate for the 1st series and 106.00% per year for the 2nd series, maturing in March and maturity of the face value is scheduled for February 1, 2012,September 2015, respectively, both with an early redemption option.
ii. Transnordestina LogísticaFS-41
On March 10, 2010 Transnordestina Logística S.A obtained approval from the Northeast Development Fund - FDNE for issuetable of the 1st Series of its 1st Private Issue of convertible debentures, consisting of eight series in the total amount of R$2,672,400.The first, third, and fourth series refer to funds to be invested in the Missão Velha – Salgueiro – Trindade e Salgueiro – Porto de Suape module, which also includes the investments in the Suape Port, and the reconstruction of the Cabo to Porto Real de Colégio railroad section. The second, fifth and sixth series refer to funds to be invested in the Eliseu Martins – Trindade module. The seventh and eighth series refer to funds to be invested in the Missão Velha – Pecém module, which also includes the investments in the Pecém Port.contents
| | | | | | | | | | | | | | | | | |
| | | | | General | | Number | | Unit | | | | | | | | Balance (R$) |
| Issue | | Series | | meeting | | issued | | face value | | Issue | | Maturity | | Charges | | 12/31/2011 |
| 1st | | 1st | | 2/8/2010 | | 336,647,184 | | R$ 1,00 | | 03/09/10 | | 10/3/2027 | | TJLP + 0.85% p.a. | | 336,647 |
| 1st | | 2ª | | 2/8/2010 | | 350,270,386 | | R$ 1,00 | | 11/25/2010 | | 10/3/2027 | | TJLP + 0.85% p.a. | | 350,270 |
| 1st | | 3ª | | 2/8/2010 | | 338,035,512 | | R$ 1,00 | | 1/12/2010 | | 10/3/2027 | | TJLP + 0.85% p.a. | | 338,036 |
| 1st | | 4ª | | 2/8/2010 | | 468,293,037 | | R$ 1,00 | | 10/04/11 | | 10/3/2027 | | TJLP + 0.85% p.a. | | 468,293 |
· Guarantees provided
Guarantees provided for the borrowings comprise property, plant and equipment items and sureties as shown in the table below, and do not include guarantees provided for subsidiaries and jointly controlled entities.
| | | | | |
| | | 12/31/2011 | | 12/31/2010 |
| Property, plant and equipment | | 19,383 | | 30,288 |
| Collateral | | 87,550 | | 74,488 |
| Securitizations (exports) (*) | | | | 113,936 |
| | | 106,933 | | 218,712 |
(*) Because As of December 31, 2013, the early settlementamount is R$4,234 (R$12,233 as of export receivables, the securitization reserve fund amounts were redeemed.December 31, 2012).
15.13. FINANCIAL INSTRUMENTS
I - Identification and measurement of financial instruments
The Company enters into transactions involving various financial instruments, mainly cash and cash equivalents, including short-term investments, marketable securities, trade receivables, trade payables, and borrowings and financing. Additionally, it also carries out transactions involving derivative financial instruments, especially exchange and interest rate swaps.
FS-40
Considering the nature of these instruments, their fair value is basically determined by the use of Brazil’s money market and mercantile and futures exchange quotations. The amounts recorded in current assets and current liabilities have immediate liquidity or short-term maturity, mostly less than three months. Considering the maturities and features of such instruments, their carrying amounts approximate their fair values.
· Classification of financial instruments
| | | | | | | | | | | | | | | | | | | | | | | |
| | | 12/31/2011 | | 12/31/2010 |
| Consolidated | | Notes | | Available for sale | | Fair value through profit or loss | | Loans and receivables -effective interest | | Other Liabilities - amortized cost method | | Balances | | Available for sale | | Fair value through profit or loss | | Loans and receivables - effective interest | | Other Liabilities - amortized cost method | | Balances |
| Assets | | | | | | | | | | | | | | | | | | | | | | |
Current | | | | | | | | | | | | | | | | | | | | | | |
Cash and cash equivalents | | 5 | | | | | | 15,417,393 | | | | 15,417,393 | | | | | | 10,239,278 | | | | 10,239,278 |
Trade receivables, net | | 6 | | | | | | 1,558,997 | | | | 1,558,997 | | | | | | 1,259,461 | | | | 1,259,461 |
Guarantee margin on financial instruments | | 8 and 15 | | | | | | 407,467 | | | | 407,467 | | | | | | 254,485 | | | | 254,485 |
Derivative financial instruments | | 8 and 15 | | | | 55,115 | | | | | | 55,115 | | | | | | | | | | |
Securitization reserve fund | | | | | | | | | | | | | | | | | | 22,644 | | | | 22,644 |
| | | | | | | | | | | | | | | | | | | | | | | |
Non-current | | | | | | | | | | | | | | | | | | | | | | |
Other trade receivables | | | | | | | | 57,797 | | | | 57,797 | | | | | | 58,485 | | | | 58,485 |
Investments | | | | 2,089,309 | | | | | | | | 2,089,309 | | 2,102,112 | | | | | | | | 2,102,112 |
Derivative financial instruments | | 10 | | | | 376,344 | | | | | | 376,344 | | | | 254,231 | | | | | | 254,231 |
Securitization reserve fund | | | | | | | | | | | | | | | | | | 32,031 | | | | 32,031 |
Short-term investments | | | | | | | | 139,679 | | | | 139,679 | | | | | | 112,484 | | | | 112,484 |
| |
| Liabilities | | | | | | | | | | | | | | | | | | | | | | |
Current | | | | | | | | | | | | | | | | | | | | | | |
Borrowings, financing and debentures | | 14 | | | | | | | | 2,734,968 | | 2,734,968 | | | | | | | | 1,344,561 | | 1,344,561 |
Derivative financial instruments | | 15 and 16 | | | | 2,971 | | | | | | 2,971 | | | | 116,407 | | | | | | 116,407 |
Trade payables | | | | | | | | | | 1,232,075 | | 1,232,075 | | | | | | | | 623,233 | | 623,233 |
Non-current | | | | | | | | | | | | | | | | | | | | | | |
Borrowings, financing and debentures | | 14 | | | | | | | | 25,331,950 | | 25,331,950 | | | | | | | | 18,861,631 | | 18,861,631 |
Derivative financial instruments | | 15 and 16 | | | | 373,430 | | | | | | 373,430 | | | | 254,494 | | | | | | 254,494 |
Consolidated | | | |
12/31/2013 | | 12/31/2012 |
| Notes |
| Available for sale | | Fair value through profit or loss | | Loans and receivables - effective interest rate | | Other liabilities - amortized cost method | | Balances | | Available for sale | | Fair value through profit or loss | | Loans and receivables - effective interest rate | | Other liabilities - amortized cost method | | Balances |
Assets | | | | | | | | | | | | | | | | | | | | | | |
Current assets | | | | | | | | | | | | | | | | | | | | | | |
Cash and cash equivalents | | 5 | | | | | | 9,995,672 | | | | 9,995,672 | | | | | | 11,891,821 | | | | 11,891,821 |
Trade receivables, net | | 6 | | | | | | 1,733,641 | | | | 1,733,641 | | | | | | 1,646,090 | | | | 1,646,090 |
Guarantee margin on financial instruments | | 8 and 13 | | | | | | | | | | | | | | 426,328 | | | | 426,328 |
Derivative financial instruments | | 8 and 13 | | 9,681 | | | | | | 9,681 | | | | 239,266 | | | | | | 239,266 |
Trading securities | | 8 | | | | 9,906 | | | | | | 9,906 | | | | | | | | | | |
Total | | | | | | 19,587 | | 11,729,313 | | | | 11,748,900 | | | | 239,266 | | 13,964,239 | | | | 14,203,505 |
| | | | | | | | | | | | | | | | | | | | | | |
Non-current assets | | | | | | | | | | | | | | | | | | | | | | |
Other trade receivables | | 8 | | | | | | 9,970 | | | | 9,970 | | | | | | 8,983 | | | | 8,983 |
Investments | | | | 2,405,174 | | | | | | | | 2,405,174 | | 2,336,137 | | | | | | | | 2,336,137 |
Derivative financial instruments | | 8 | | | | 3,879 | | | | | | 3,879 | | | | | | | | | | |
Short-term investments | | | | | | | | 30,756 | | | | 30,756 | | | | | | 116,753 | | | | 116,753 |
Total | | | | 2,405,174 | | 3,879 | | 40,726 | | | | 2,449,779 | | 2,336,137 | | | | 125,736 | | | | 2,461,873 |
| | | | | | | | | | | | | | | | | | | | | | | |
Total assets | | | | 2,405,174 | | 23,466 | | 11,770,039 | | | | 14,198,679 | | 2,336,137 | | 239,266 | | 14,089,975 | | | | 16,665,378 |
| | | | | | | | | | | | | | | | | | | | | | |
Liabilities | | | | | | | | | | | | | | | | | | | | | | |
Current liabilities | | | | | | | | | | | | | | | | | | | | | | |
Borrowings and financing | | 12 | | | | | | | | 2,673,648 | | 2,673,648 | | | | | | | | 2,200,152 | | 2,200,152 |
Derivative financial instruments | | 13 and 14 | | 6,822 | | | | | | 6,822 | | | | 244,333 | | | | | | 244,333 |
Trade payables | | | | | | | | | | 1,102,037 | | 1,102,037 | | | | | | | | 2,025,461 | | 2,025,461 |
Total | | | | | | 6,822 | | | | 3,775,685 | | 3,782,507 | | | | 244,333 | | | | 4,225,613 | | 4,469,946 |
| | | | | | | | | | | | | | | | | | | | | | | |
Non-current liabilities | | | | | | | | | | | | | | | | | | | | | | |
Borrowings and financing | | 12 | | | | | | | | 25,189,574 | | 25,189,574 | | | | | | | | 27,237,521 | | 27,237,521 |
Derivative financial instruments | | 13 and 14 | | 17,375 | | | | | | 17,375 | | | | | | | | | | |
Total | | | | | | 17,375 | | | | 25,189,574 | | 25,206,949 | | | | | | | | 27,237,521 | | 27,237,521 |
| | | | | | | | | | | | | | | | | | | | | | | |
Total liabilities | | | | | | 24,197 | | | | 28,965,259 | | 28,989,456 | | | | 244,333 | | | | 31,463,134 | | 31,707,467 |
· Fair value measurement
The financial instruments recognized at fair value require the disclosure of fair value measurements atin three hierarchy levels:levels.
· Level 1: quoted prices (unadjusted) in active markets for identical assets or liabilities.
FS-42
· Level 2: other available inputs, except those of Level 1 that are observable for the asset or liability, whether directly (i.e., prices) or indirectly (i.e., derived from prices)
· Level 3: inputs unavailable due to slight or no market activity and which is significant for the definition of the fair value of assets.
The following table shows the financial instruments recognized at fair value through profit or loss using a valuation method:
Consolidated | | | | | | | | 12/31/2013 | | | | | | | | 12/31/2012 |
| | Level 1 | | Level 2 | | Level 3 | | Balances | | Level 1 | | Level 2 | | Level 3 | | Balances |
Assets | | | | | | | | | | | | | | | | |
Current assets | | | | | | | | | | | | | | | | |
Financial assets at fair value through profit or loss | | | | | | | | | | | | | | | | |
Derivative financial instruments | | | | 9,681 | | | | 9,681 | | | | 239,266 | | | | 239,266 |
Trading securities | | 9,906 | | | | | | 9,906 | | | | | | | | |
Non-current assets | | | | | | | | | | | | | | | | |
Available-for-sale financial assets | | | | | | | | | | | | | | | | |
Investments | | 2,405,174 | | | | | | 2,405,174 | | 2,336,137 | | | | | | 2,336,137 |
Financial assets at fair value through profit or loss | | | | | | | | | | | | | | | | |
Derivative financial instruments | | | | 3,879 | | | | 3,879 | | | | | | | | |
Total assets | | 2,415,080 | | 13,560 | | | | 2,428,640 | | 2,336,137 | | 239,266 | | | | 2,575,403 |
| | | | | | | | | | | | | | | | | |
Liabilities | | | | | | | | | | | | | | | | |
Current liabilities | | | | | | | | | | | | | | | | |
Financial liabilities at fair value through profit or loss | | | | | | | | | | | | | | | | |
Derivative financial instruments | | | | 6,822 | | | | 6,822 | | | | 244,333 | | | | 244,333 |
Non-current liabilities | | | | | | | | | | | | | | | | |
Financial liabilities at fair value through profit or loss | | | | | | | | | | | | | | | | |
Derivative financial instruments | | | | 17,375 | | | | 17,375 | | | | | | | | |
Total liabilities | | | | 24,197 | | | | 24,197 | | | | 244,333 | | | | 244,333 |
FS-41
| | | | | | | | | | | | | | | | | |
| | | | | 12/31/2011 | | | | 12/31/2010 |
| Consolidated | | Level 1 | | Level 2 | | Level 3 | | Balances | | Level 1 | | Level 2 | | Level 3 | | Balances |
| Assets | | | | | | | | | | | | | | | | |
Current | | | | | | | | | | | | | | | | |
Financial assets at fair value through profit or loss | | | | | | | | | | | | | | | | |
Derivative financial instruments | | | | 55,115 | | | | 55,115 | | | | | | | | |
| |
Non-current | | | | | | | | | | | | | | | | |
Available-for-sale financial assets | | | | | | | | | | | | | | | | |
Investments | | 2,089,309 | | | | | | 2,089,309 | | 2,102,112 | | | | | | 2,102,112 |
| |
Financial assets at fair value through profit or loss | | | | | | | | | | | | | | | | |
Derivative financial instruments | | | | 376,344 | | | | 376,344 | | | | 254,231 | | | | 254,231 |
| |
| Liabilities | | | | | | | | | | | | | | | | |
Current | | | | | | | | | | | | | | | | |
Financial liabilities at fair value through profit or loss | | | | | | | | | | | | | | | | |
Derivative financial instruments | | | | 2,971 | | | | 2,971 | | | | 116,407 | | | | 116,407 |
| |
Non-current | | | | | | | | | | | | | | | | |
Financial liabilities at fair value through profit or loss | | | | | | | | | | | | | | | | |
Derivative financial instruments | | | | 373,430 | | | | 373,430 | | | | 254,494 | | | | 254,494 |
II – investmentsInvestments in financial instruments classified as available for sale and measured at fair value through OCI
These consist mainly of investments in shares acquired in Brazil and abroad involving top ranked companies, classified by international rating agencies as investment grade, which are recognized in non-current assets, and any gains or losses are recognized in shareholders' equity, where they will remain until actual realization of the securities or when any loss is considered unrecoverable.
Potential impairmentImpairment of financial assets classified as available for sale
During 2010 and 2011 CSN investedThe Company has investments in ordinarycommon (USIM3) and preferred (USIM5) shares of (“Usiminas classifiedShares”), designated as available-for-sale financial instruments available for saleassets as they do not attendmeet the criteria to be classified within any of the other categories of financial instruments (measured(loans and receivables, held-to-maturity investments or financial assets at fair value through profit and loss, held to maturity or loans and receivables)loss). The instruments areasset is classified as a non-current asset under non-current financial instrumentsline item “investments” and measuredis carried at their fair value based on theirthe quoted price on the stock exchange (BM&FBOVESPA).
Considering the volatility of the quotations of Usiminas shares, the Company evaluated whether, at 31the end of the reporting period, there was objective evidence of impairment of these financial assets, i.e., the Company’s management evaluated if the decline in the market value of Usiminas shares should be considered either significant or prolonged. In turn, this valuation requires judgment based on CSN’s policy, prepared according to practices used in the domestic and international markets, and consists of an instrument by instrument analysis based on quantitative and qualitative information available in the market, from the time an instrument shows a drop of 20% or more in its market value or from the time there is a significant drop in its market value as compared to its acquisition price during more than twelve months.
Based on the qualitative and quantitative elements, management concluded, in its best judgment, that there was evidence of a significant impairment of the investment in Usiminas shares as of June 30, 2012, and, consequently, reclassified the accumulated losses recorded in other comprehensive income amounting to R$1,599,485, net ofincome tax and social contribution, to profit for the year, by recognizing R$2,022,793 in other operating expenses and R$423,308 in deferred taxes.
FS-43
In December 2011 (BOVESPA). 2012 there was an additional recognition of R$264,441 related to deferred taxes on accumulated losses due to the annual analysis of the effective income tax and social contribution rate that took into consideration the temporary differences generated by this investment in CSN subsidiaries resulting from the reclassification of accumulated losses.
As of June 30, 2013, there was an additional decline in the quotation of the common shares (USIM3) as compared with the quotation as of June 30, 2012 which, according to the Company's accounting policy, generated a loss of R$5,002, recorded directly in other operating expenses. Beginning this date, pursuant to a Company's policy, gains and losses arising from the variation of the quotation of shares were recognized in other comprehensive income.
The company is evaluatingCompany continues to evaluate strategic alternatives with respect to its investment in Usiminas.
Considering These initiatives can, for example, affect the declineway an investment is recorded in market value of the shares Usiminas during the year, the Company has evaluated whether, at the balance sheet date, there is objective evidence of impairment of its investments in Usiminas. Management evaluated if the decline in market value of the shares Usiminas should be considered either significant or prolonged. Determining whether a decline is significant or prolonged requires judgment and according to CSN’s accounting policy, which is based on national and international application, an instrument by instrument analysis is made based on quantitative and qualitative information from the moment on onwards that the decline either above 20% or more than 12 months.
Despite the Company’s investment strategy and despite the fact that both the ordinary and preferred shares are equity instruments, management separately evaluated the ordinary and preferred shares for impairment considering the different rights attached to them. The policy of the Company requires a detailed analysis of the percentage and period of decline, characteristics of the instrument, the segment in which the entity operates and volatility of the instrument. Additionally, macro-economic factors, qualitative analyses and other relevant factors after the balance sheet date until the date of approval of the financial statements are taken into consideration to the extent that is possible within the context of the standards, their interpretations and application in practice.
To determine the period of decline of the market value of the instruments below their cost, the Company compared their respective weighted average cost of acquisition at balance sheet date with the last trading date on which the quoted maximum price was above this weighted average cost of acquisition. In case of the ordinary shares the period of decline was calculated at 1 month, while in the case of the preferred shares the period of decline was calculated at 7 months. Management is of the opinion that, considering its accounting policy, the decline is not prolonged.
Volatility measures the dispersions between returns of a share or index. Volatility is a measure of risk of a share, but also serves to evaluate to what extent price variations historically are within expectations. Historical volatility of the shares is calculated and considered in order to identify the expected fluctuation of the respective instruments, evaluate the expected future volatility and conclude if a decline in market value of an instrument below its cost should be considered significant.
FS-42
The following table shows these indicators for a period of 12 years,long period sufficient to eliminate volatility spikes caused by economic crises:
| | | | | |
| Period | | Volatility |
| | | USIM3 | | USIM5 |
| 1/3/2000 to 12/31/2011 | | 50.42% | | 48.57% |
In light of this information, Management concluded that the decline in market value relative to their price of acquisition of the shares of USIM3 and USIM5 at 31 December 2011 of 30.8% and 34.5%, respectively, is not significant.At 25 April 2012 the decline of the shares had significantly reduced to26.1% and 27.3% respectively, further supporting the volatility of the securities.
Management considers that during the period under analysis there have not been significant changes with an adverse effect in the technological, market, economic and legal environment in which Usiminas operates. Further, while the market value of Usiminas at 31 December 2011 was below the value of its net assets at that date (R$ 13.5 billion and R$ 19 billion respectively) and the company therefore was required to evaluate impairment of its assets in accordance with IAS38.12(d), the company did not register any such impairment.
Considering the quantitative and qualitative analyses above, Management is of the opinion that there is no objective evidence of impairment of the ordinary and preferred shares of Usiminas and consequently has not reclassified losses thus far recognized in other comprehensive income (R$ 767,924, net of tax).statements.
III – Fair values of assets and liabilities as compared to their carrying amounts
Financial assets and liabilities at fair value through profit or loss are recognized in current and non-current assets and liabilities, and any gains and possible losses are recognized as finance income or finance costs, respectively.
The amounts are recognized in the financial statements at their carrying amounts, which are substantially similar to those that would be obtained if they were traded in the market. The fair values of other long-term assets and liabilities do not differ significantly from their carrying amounts, except the amounts below.
The estimated fair valuesvalue of consolidated long-term borrowings and financing werewas calculated at prevailing market rates, taking into consideration the nature, termsterm and risks similar to those of the recorded contracts, and was classified in level 1 of the hierarchy of “quoted prices (unadjusted) in active markets for identical assets or liabilities”, as compared below:
| | | | | | | | | |
| | | 12/31/2011 | | 12/31/2010 |
| | | Carrying amount | | Fair value | | Carrying amount | | Fair value |
| Guaranteed perpetual bonds | | 1,878,353 | | 1,819,903 | | 1,668,468 | | 1,663,701 |
| Fixed rate notes | | 5,183,690 | | 5,832,364 | | 4,606,820 | | 4,966,629 |
| | | | 12/31/2013 | | | | 12/31/2012 |
| | Carrying amount | |
Fair value
| | Carrying amount | | Fair value |
Perpetual bonds | 2,345,789 | | 1,938,780 | | 2,046,281 | | 2,102,366 |
Fixed rate notes | 5,661,978 | | 6,032,207 | | 6,067,555 | | 6,811,081 |
IV – Financial risk management policy
The Company has and follows a policy of managing its risks, with guidelines regarding the risks incurred by the company. Pursuant to this policy, the nature and general position of financial risks are regularly monitored and managed in order to assess the results and the financial impact on cash flow. The credit limits and the quality of counterparties’ hedge instruments are also periodically reviewed.
The risk management policy was established by the Board of Directors. Under this policy, market risks are hedged when it is considered necessary to support the corporate strategy or when it is necessary to maintain a level of financial flexibility.
Under the terms of the risk management policy, the Company manages some risks by using derivative financial instruments. The Company’s risk policy prohibits any speculative deals or short sales.
· Liquidity risk
FS-43
It is the risk that the Company may not have sufficient net funds to honor its financial commitments as a result of mismatching of terms or volumes between scheduled receipts and payments.
To manage cash liquidity in domestic and foreign currency, assumptions of future disbursements and receipts are established and daily monitored by the treasury area. The payment schedules for the long-term portions of borrowings, financing and debentures are shown in Note 14.
The following table shows the contractual maturities of financial liabilities, including estimated interest payments.
| | | | | | | | | | | |
| At December 31, 2011 | | Less than one year | | From one to two years | | From two to five years | | Over five years | | Total |
| Borrowings, financing and debentures | | 2,734,968 | | 2,263,889 | | 6,724,483 | | 16,343,578 | | 28,066,918 |
| Derivative financial instruments | | 2,971 | | 373,430 | | | | | | 376,401 |
| Trade payables | | 1,232,075 | | | | | | | | 1,232,075 |
| | | | | | | | | | | |
| At December 31, 2010 | | | | | | | | | | |
| Borrowings, financing and debentures | | 1,344,561 | | 4,254,057 | | 6,357,169 | | 8,250,405 | | 20,206,192 |
| Derivative financial instruments | | 116,407 | | 254,494 | | | | | | 370,901 |
| Trade payables | | 623,232 | | | | | | | | 623,232 |
·Foreign exchange rate risk
The Company assesses its exchange exposure by subtracting its liabilities from its assets denominated in dollar euro and australian dollar,euro, thus arriving at its net exchange exposure, which is the foreign currency exposure risk. Therefore, besides the trade receivables arising from exports and investments overseas that in economic terms constitute natural hedges, the Company further considers and uses various financial instruments, such as derivative instruments (US$ to Real realand euro to dollar swaps, and forward exchange contracts, etc.) to manage its risks of fluctuations in currencies other than the Brazilian real.
FS-44
· Policies on the use of hedging derivatives
The Company’s financial policy reflects the parameters of liquidity, credit and market risks approved by the Audit Committee and Board of Directors. The use of derivative instruments in order to prevent fluctuations in interest and exchange rates from having a negative impact on the company’s balance sheet and income statement should consider the same parameters. As provided for in internal rules, this financial investment policy has been approved and is being managed by the finance officers.
At the meetings of the Executive Officers and Board of Directors, the officers and directors routinely present and discuss the Company’s financial positions. Under the bylaws, transactions involving material amounts require the prior approval of management bodies. The use of other derivative instruments is contingent upon the express prior approval of the Board of Directors.
To finance its activities, the Company resorts to the capital markets, both locally and internationally, and based on the indebtedness profile it is seeking, part of the debt is pegged to foreign currency, basically to the US dollar, which causes Management to seek hedging for debt through derivative financial instruments.
To contract derivative financial instruments for hedging within the internal control structure, the following policies are adopted:
· ongoing calculation of exchange exposure that occurs by analyzing assets and liabilities exposed to foreign currency, under the following terms:(i) trade receivables and payables in foreign currency; (ii) cash and cash equivalents and debts in foreign currency considering the maturity of the assets and liabilities exposed to exchange fluctuations;
FS-44
· presentation of the financial position and exchange exposure on a routine basis atof meetings of the Executive Officers and Board of Directors that approve the hedging strategy;
· carrying out derivative hedging transactions only with leading banks, diluting the credit risk through diversification among these banks;
·Foreign exchange exposure
The consolidated net exposure as of December 31, 20112013 is as follows:
| | | | | | | |
| Foreign Exchange Rate Exposure | | Amounts US$ | | Amounts EUR | | Amounts A$ |
| | thousand) | | thousand) | | thousand) |
| Cash and cash equivalents overseas | | 5,613,908 | | | | 302,553 |
| Derivative guarantee margin | | 217,223 | | | | |
| Trade receivables - foreign market | | 287,616 | | 7,844 | | |
| Other assets | | 139,219 | | 118 | | |
| Total assets | | 6,257,966 | | 7,962 | | 302,553 |
| Borrowings and financing | | (5,299,622) | | | | |
| Trade payables | | (10,779) | | (1,450) | | |
| Other liabilities | | (56,479) | | (16) | | |
| Total liabilities | | (5,366,880) | | (1,466) | | |
| Gross exposure | | 891,086 | | 6,496 | | 302,553 |
| Notional amount of derivatives contracted | | 267,856 | | (90,000) | | |
| Net exposure | | 1,158,942 | | (83,504) | | 302,553 |
| | | | 12/31/2013 |
Foreign Exchange Exposure | | (Amounts in
US$’000) | | (Amounts in
€’000) |
Cash and cash equivalents overseas | | 4,086,520 | | 1,266 |
Trade receivables - foreign market | | 303,186 | | 33,994 |
Intercompany borrowings | | 154,098 | | 78,026 |
Other assets | | 21,152 | | 54,152 |
Total assets | | 4,564,956 | | 167,438 |
Borrowings and financing | | -4,589,982 | | -121,041 |
Trade payables | | -39,383 | | -2,202 |
Other liabilities | | -9,140 | | -16,943 |
Intercompany borrowings | | -34,076 | | |
Total liabilities | | -4,672,581 | | -140,186 |
Gross exposure | | -107,625 | | 27,252 |
Notional amount of derivatives contracted | | 403,000 | | -90,000 |
Net exposure | | 295,375 | | -62,748 |
FS-45
table of contents
Gains and losses on these transactions are consistent with the policies and strategies defined by management.
· Exchange swap transactions
The Company carries out exchange swap transactions in order to hedge its assets and liabilities against any fluctuations in the US dollar-real parity.
and euro-real parities. This hedge through exchange swaps provides the Company, through the long position of the contract, with a forward rate agreement (FRA) gain on the exchange coupon, which at the same time improves our investment rates and reduces the cost of our funding in the international market.
As of December 31, 2011,2013, the Company had a longconsolidated position in exchange swap of US$367,856 thousand (US$1,249,529 thousandthese contracts is as follows:
| | | | | | | | | | | | | 12/31/2013 | | | | | | | | 12/31/2012 | | 12/31/2013 |
| | | | | | | | | Appreciation (R$) | | Fair value (market) | | | | Appreciation (R$) | | Fair value (market) | | Impact on finance income (cost) in 2013 |
Counterparties | | Transaction maturity | | Functional currency | | Notional amount | | Asset position | | Liability position | | Amounts receivable/ (payable) | | Notional amount | | Asset position | | Liability position | | Amounts receivable/ (payable) | |
Santander | | 2/1/2015 | | US dollar | | 10,000 | | 26,512 | | -22,633 | | 3,879 | | 10,000 | | 22,686 | | -20,946 | | 1,740 | | 2,139 |
Goldman Sachs | | 1/4/2014 | | US dollar | | 10,000 | | 23,697 | | -22,799 | | 898 | | | | | | | | | | 898 |
HSBC | | 1/4/2014 | | US dollar | | 90,000 | | 213,306 | | -205,171 | | 8,135 | | | | | | | | | | 8,135 |
Total dollar-to-CDI swap | | | | 110,000 | | 263,515 | | -250,603 | | 12,912 | | 10,000 | | 22,686 | | -20,946 | | 1,740 | | 11,172 |
| | | | | | | | | | | | | | | | | | | | | | |
Itaú BBA | | 7/5/2014 | | US dollar | | 60,000 | | 141,019 | | -141,359 | | -340 | | | | | | | | | | -340 |
Itaú BBA | | 5/7/2014 to 5/14/2014 | | US dollar | | 25,000 | | 58,734 | | -58,485 | | 249 | | | | | | | | | | 249 |
HSBC | | 7/5/2014 | | US dollar | | 153,000 | | 359,599 | | -360,487 | | -888 | | | | | | | | | | -888 |
HSBC | | 5/7/2014 to 5/14/2014 | | US dollar | | 55,000 | | 129,244 | | -128,862 | | 382 | | | | | | | | | | 382 |
Total dollar-to-real swap (NDF) | | | | 293,000 | | 688,596 | | -689,193 | | -597 | | | | | | | | | | -597 |
| | | | | | | | | | | | | | | | | | | | | | |
BES | | 3/31/2014 to 4/24/2014 | | US dollar | | 11,801 | | 27,878 | | -27,861 | | 17 | | 44,392 | | 90,687 | | -94,928 | | -4,241 | | 4,035 |
Total dollar-to-euro swap | | | | 11,801 | | 27,878 | | -27,861 | | 17 | | 44,392 | | 90,687 | | -94,928 | | -4,241 | | 4,035 |
| | | | | | | | | | | | | | | | | | | | | | | |
Itaú BBA | | 02/19/2014 | | Euro | | 30,000 | | 94,858 | | -96,632 | | -1,774 | | 40,000 | | 51,793 | | -52,876 | | -1,083 | | -2,534 |
HSBC | | 02/19/2014 | | Euro | | 30,000 | | 94,900 | | -96,632 | | -1,732 | | 25,000 | | 32,373 | | -33,047 | | -674 | | -8,097 |
Goldman Sachs | | 02/19/2014 | | Euro | | 30,000 | | 94,880 | | -96,632 | | -1,752 | | 25,000 | | 32,363 | | -33,047 | | -684 | | -2,559 |
Total dollar-to-euro swap (NDF) | | | | 90,000 | | 284,638 | | -289,896 | | -5,258 | | 90,000 | | 116,529 | | -118,970 | | -2,441 | | -13,190 |
| | | | | | | | | | | | | | | | | | | | | | |
Deutsche Bank | | 12/12/2013 | | Yen | | | | | | | | | | 59,090,000 | | 237,526 | | -236,965 | | 561 | | -5,374 |
Total yen-to-dollar swap | | | | | | | | | | | | 59,090,000 | | 237,526 | | -236,965 | | 561 | | -5,374 |
| | | | | | | | | | | | | | | | | | | | | | | |
CSFB | | 12/2/2014 | | Real | | 21,500 | | 36,526 | | -36,862 | | -336 | | 64,500 | | 109,540 | | -110,226 | | -686 | | -4,268 |
Total LIBOR-to-CDI interest rate swap | | | | 21,500 | | 36,526 | | -36,862 | | -336 | | 64,500 | | 109,540 | | -110,226 | | -686 | | -4,268 |
| | | | | | | | | | | | | | | | | | | | | | |
Itaú BBA | | 1/3/2016 | | Real | | 150,000 | | 152,610 | | -159,712 | | -7,102 | | | | | | | | | | -7,102 |
HSBC | | 2/5/2016 to 3/1/2016 | | Real | | 185,000 | | 187,395 | | -197,157 | | -9,762 | | | | | | | | | | -9,762 |
Deutsche Bank | | 1/3/2016 | | Real | | 10,000 | | 10,114 | | -10,625 | | -511 | | | | | | | | | | -511 |
Fixed rate-to-CDI interest rate swap | | | | 345,000 | | 350,119 | | -367,494 | | -17,375 | | | | | | | | | | -17,375 |
| | | | | | | | | | | | | | | | | | | | | | | |
| | | | 1,651,272 | | -1,661,909 | | -10,637 | | | | 576,968 | | -582,035 | | -5,067 | | -25,597 |
·Classification of December 31, 2010) where we received,the derivatives in the long position, exchange rate change plus 3.4541% per year on average (in 2010, exchange rate change plus 2.29% per year),balance sheet and paid 100%statement of CDI, in the short positionincome
FS-46
table of contents
| | | | | | | | | | | | | | 12/31/2013 |
Instruments | | Assets | | Liabilities | | Finance income (costs), net (Note 25) |
| | Current | | Non-current | | Total | | Current | | Non-current | | Total | |
CDI-to-dollar swap | | 9,033 | | 3,879 | | 12,912 | | | | | | | | 11,172 |
Dollar-to-euro swap (NDF) | | | | | | | | 5,258 | | | | 5,258 | | -13,190 |
Yen-to-dollar swap (*) | | | | | | | | | | | | | | -5,374 |
Dollar-to-euro swap | | 17 | | | | 17 | | | | | | | | 4,035 |
Dollar-to-real swap (NDF) | | 631 | | | | 631 | | 1,228 | | | | 1,228 | | -597 |
Libor-to-CDI swap | | | | | | | | 336 | | | | 336 | | -4,268 |
Fixed rate-to-CDI swap | | | | | | | | | | 17,375 | | 17,375 | | -17,375 |
| | | 9,681 | | 3,879 | | 13,560 | | 6,822 | | 17,375 | | 24,197 | | -25,597 |
| | | | | | | | | | | | | | | |
| | | | | | | | | | | | | | | 12/31/2012 |
Instruments | | Ativo | | Passivo | | Finance income (costs), net (Note 25) |
| | Current | | Non-current | | Total | | Current | | Non-current | | Total | |
CDI-to-dollar swap | | 1,740 | | | | 1,740 | | | | | | | | 8,301 |
Dollar-to-euro swap (NDF) | | | | | | | | 2,441 | | | | 2,441 | | -5,116 |
Yen-to-dollar swap | | 237,526 | | | | 237,526 | | 236,965 | | | | 236,965 | | 307 |
Dollar-to-euro swap | | | | | | | | 4,241 | | | | 4,241 | | -8,065 |
Libor-to-CDI swap | | | | | | | | 686 | | | | 686 | | -9,166 |
| | | 239,266 | | | | 239,266 | | 244,333 | | | | 244,333 | | -13,739 |
(*) The positions of the swap transactions were settled on December 12, 2013, together with its guarantee deposit.
Dollar-to-CDI exchange swap contract.
As of December 31, 20112013 the Company held a short position in a foreign exchange swap of US$100,000 thousand,110,000,000, where we paid foreignit receives exchange changedifferences plus interest of 2.39%3.5% per year on average in the short position and receivedpays 100% of CDI in the longshort position of the foreign exchange swap.
As of December 31, 2011, the consolidated position of these contracts is as follows:
a) Outstanding transactionsDollar-to-real swap (NDF)
·The Company conducted NDF (Non Deliverable Forward) transactions for the purpose of ensuring the forward purchase of US dollars, which are settled, without physical delivery, by the difference in contracted R$/US$ buy parity against the R$/US$ sell parity, with is the Sale Ptax T-1 to maturity. The transactions are contracted with prime financial institutions, on the over-the-counter market, and allocated to the exclusive funds.
US dollar-to-realdollar-to-Euro exchange swap
FS-45
| | | | | | | | | | | |
| | | | | 12/31/2011 |
| | | | | | | Appreciation (R$) | | Fair value |
| Counterparties | | Transaction maturity | | Notional (US$ thousand) | | Asset position | | Liability position | | Amount receivable / (payable) |
| JP Morgan | | 2/1/2012 to 3/1/2012 | | 9,981 | | 19,127 | | (18,556) | | 571 |
| HSBC | | 4/22/2012 to 6/15/2012 | | 101,317 | | 192,919 | | (176,554) | | 16,365 |
| Société Générale | | 02/1/2012 to 8/2/2012 | | 16,635 | | 30,554 | | (29,362) | | 1,192 |
| Bradesco | | 8/1/2012 | | 3,327 | | 6,279 | | (5,743) | | 536 |
| Banco do Brasil | | 7/2/2012 to 9/3/2012 | | 6,654 | | 12,605 | | (12,413) | | 192 |
| Santander | | 2/1/2012 to 1/2/2015 | | 14,990 | | 28,900 | | (28,416) | | 484 |
| Goldman Sachs | | 1/2/2015 | | 190,000 | | 371,174 | | (352,514) | | 18,660 |
| Banco de Tokyo | | 12/15/2016 | | 24,952 | | 46,980 | | (47,960) | | (980) |
| | | | | 367,856 | | 708,538 | | (671,518) | | 37,020 |
| |
| | | | | 12/31/2010 |
| | | | | | | Appreciation (R$) | | Fair value |
| | | | | | | | (market) |
| Counterparties | | Transaction maturity | | Notional (US$ thousand) | | Asset position | | Liability position | | Amount (payable) |
| |
| JP Morgan | | 11/1/2011 to '3/1/2012 | | 6,654 | | 11,078 | | (11,170) | | (92) |
| HSBC | | 1/3/2011 | | 223,000 | | 372,794 | | (385,900) | | (13,106) |
| Société Générale | | 2/1/2011 to '12/1/2011 | | 23,289 | | 39,687 | | (50,254) | | (10,567) |
| Pactual | | 7/1/2011 | | 3,327 | | 5,847 | | (8,573) | | (2,726) |
| Deutsche Bank | | 1/3/2011 to 2/1/2011 | | 265,000 | | 443,143 | | (468,544) | | (25,401) |
| Santander | | 1/3/2011 to 1/2/2015 | | 131,625 | | 220,951 | | (239,169) | | (18,218) |
| Goldman Sachs | | 1/3/2011 to 1/2/2015 | | 130,000 | | 215,302 | | (224,658) | | (9,356) |
| Itau BBA | | 1/3/2011 to 12/1/2011 | | 466,634 | | 779,802 | | (809,381) | | (29,579) |
| | | | | 1,249,529 | | 2,088,604 | | (2,197,649) | | (109,045) |
·Real-to-US dollar exchange swap
| | | | | | | | | | | |
| | | | | 12/31/2011 |
| | | | | | | Appreciation (R$) | | Fair value |
| | | | | | | | (market) |
| | | Transaction | | Notional (US$ | | Asset | | Liability | | Amount |
| Counterparties | | maturity | | thousand) | | position | | position | | (payable) |
| Santander | | 2/1/2012 | | (70,000) | | 130,266 | | (130,787) | | (521) |
| Goldman Sachs | | 2/1/2012 | | (30,000) | | 55,704 | | (56,030) | | (326) |
| | | | | (100,000) | | 185,970 | | (186,817) | | (847) |
·Iene-to-US dollar exchange swap
FS-46
| | | | | | | | | | | |
| | | | | 12/31/2011 |
| | | | | | | Appreciation (R$) | | Fair value |
| | | | | | | | (market) |
| | | Transaction | | | | Asset | | Liability | | Amount |
| Counterparties | | maturity | | Notional (iene) | | position | | position | | receivable |
| Deutsche Bank | | 12/12/2013 | | 59,090,000 | | 374,455 | | (373,430) | | 1,025 |
| | | | | 59,090,000 | | 374,455 | | (373,430) | | 1,025 |
| |
| |
| | | | | 12/31/2010 |
| | | | | | | Appreciation (R$) | | Fair value |
| | | | | | | | (market) |
| Counterparties | | Transaction maturity | | Notional (iene) | | Asset position | | Liability position | | Amount receivable/ (payable) |
| Deutsche Bank | | 12/12/2013 | | 59,090,000 | | 254,231 | | (254,231) | | |
| | | | | 59,090,000 | | 254,231 | | (254,231) | | |
b) Settled US dollar-realThe subsidiary Lusosider carries out transactions
| | | | | | | | | | | | | | | | | | | |
| | | Appreciation 2011 | | | | Appreciation 2010 | | | | |
Counterparties | | Notional(US$thousand) | | Asset position (R$) | | Liability position(R$) | | Amount received / (paid) in 2011 | | Notional(US$thousand) | | Asset position (R$) | | Liability position(R$) | | Fair value in2010 | | Impact onP&L in 2011 |
| Deutsche Bank | | 2,352,000 | | 3,809,284 | | (3,927,022) | | (117,738) | | 265,000 | | 443,143 | | (468,544) | | (25,401) | | (92,337) |
| Goldman Sachs | | 100,000 | | 2,978,316 | | (2,975,695) | | 2,621 | | 100,000 | | 167,243 | | (173,031) | | (5,788) | | 8,409 |
| HSBC | | 1,843,000 | | 3,022,397 | | (3,092,542) | | (70,145) | | 223,000 | | 372,794 | | (385,900) | | (13,106) | | (57,039) |
| Itau BBA | | 809,635 | | 1,345,353 | | (1,380,319) | | (34,966) | | 466,635 | | 779,802 | | (809,378) | | (29,576) | | (5,390) |
| Santander | | 246,625 | | 412,585 | | (434,164) | | (21,579) | | 121,625 | | 204,241 | | (221,856) | | (17,615) | | (3,964) |
| BTG Pactual | | 3,327 | | 5,542 | | (9,050) | | (3,508) | | 3,327 | | 5,847 | | (8,573) | | (2,726) | | (782) |
| Société Générale | | 23,289 | | 41,093 | | (52,363) | | (11,270) | | 23,289 | | 39,687 | | (50,255) | | (10,568) | | (702) |
| JP Morgan | | 3,327 | | 5,737 | | (6,075) | | (338) | | 6,654 | | 11,078 | | (11,170) | | (92) | | (246) |
| Bradesco | | 1,663 | | 3,143 | | (2,755) | | 388 | | | | | | | | | | 388 |
| | | 5,382,866 | | 11,623,450 | | (11,879,985) | | (256,535) | | 1,209,530 | | 2,023,835 | | (2,128,707) | | (104,872) | | (151,663) |
with derivatives to hedge its exposure against the euro-dollar fluctuation.
The position of outstanding transactions was recorded in the Company’s assets and liabilities and totals R$37,020 in assets and R$847 in liabilities as of December 31, 2011 (R$109,045 in liabilities as of December 31, 2010) and its effects are recognized in the Company’s finance income (costs) as loss totaling R$115,490 as of December 31, 2011 (loss of R$231,673 as of December 31, 2010) (see Note 26).
·Euro-to-US dollarUS dollar-to-Euro exchange swap (NDF)
In addition to the swaps above, the Company also contracted NDFs (non-deliverable forwards) to hedge its euro-denominated assets. Basically the Company contracted financial derivatives for its euro-denominated assets, where it will receive the difference between the US dollar exchange rate change for the period, multiplied by the notional amount (long position) and pay the difference between the exchange rate change in euro for the period on the notional euro amount on the contract date (short position).In. In general, these are transactions conducted in the Brazilian over-the-counter market that have as counterparties prime financial institutions, contracted under the exclusive funds.
As of December 31, 2011, the consolidated position of these contracts was as follows:
a) Outstanding transactions
FS-47
| | | | | | | | | | | |
| | | | | | | 12/31/2011 |
| | | | | | | Appreciation (R$) | | Fair value (market) |
| | | | | Notional (EUR | | Asset | | Liability | | Amount |
| Counterparties | | Transaction maturity | | thousand) | | position | | position | | receivable |
| HSBC | | 1/12/2012 | | 25,000 | | 51,469 | | (48,556) | | 2,913 |
| Deutsche Bank | | 1/12/2012 | | 25,000 | | 51,521 | | (48,556) | | 2,965 |
| Goldman Sachs | | 1/12/2012 | | 40,000 | | 128,761 | | (121,389) | | 7,372 |
| | | | | 90,000 | | 231,751 | | (218,501) | | 13,250 |
| |
| |
| | | | | | | 12/31/2010 |
| | | | | | | Appreciation (R$) | | Fair value (market) |
| | | | | Notional (EUR | | Asset | | Liability | | Amount |
| Counterparties | | Transaction maturity | | thousand) | | position | | position | | receivable |
| HSBC | | 1/20/2011 | | 15,000 | | 34,029 | | (33,424) | | 605 |
| Deutsche Bank | | 1/20/2011 | | 25,000 | | 56,648 | | (55,707) | | 941 |
| Goldman Sachs | | 1/20/2011 | | 50,000 | | 113,295 | | (111,415) | | 1,880 |
| | | | | 90,000 | | 203,972 | | (200,546) | | 3,426 |
b) Settled transactions
| | | | | | | | | | | | | | | | | | | |
| | | Appreciation 2011 | | | | Appreciation 2010 | | | | |
| Counterparties | | Notional (EUR thousand) | | Asset position (R$) | | Liability position (R$) | | Received / (paid) in 2011 | | Notional (EUR thousand) | | Asset position (R$) | | Liability position (R$) | | Fair value in 2010 | | Impact on P&L in 2011 |
| |
| Deutsche Bank | | 210,000 | | 475,582 | | (481,504) | | (5,922) | | 25,000 | | 56,648 | | (55,707) | | 941 | | (6,863) |
| Goldman Sachs | | 140,000 | | 321,800 | | (319,448) | | 2,352 | | 50,000 | | 113,295 | | (111,415) | | 1,880 | | 472 |
| HSBC | | 15,000 | | 34,029 | | (33,413) | | 616 | | 15,000 | | 34,029 | | (33,424) | | 605 | | 11 |
| Itau BBA | | 85,000 | | 199,820 | | (197,116) | | 2,704 | | | | | | | | | | 2,704 |
| | | 450,000 | | 1,031,231 | | (1,031,481) | | (250) | | 90,000 | | 203,972 | | (200,546) | | 3,426 | | (3,676) |
The position of outstanding transactions was recognized in the Company’s assets and totals R$13,250 as of December 31, 2011 (R$3,426 in assets as of December 31, 2010) and its effects are recognized in the Company’s finance income (costs) as a gain totaling R$9,574 as of December 31, 2011 (loss of R$6,763 as of December 31, 2010) (see Note 26).
·Real-Commercial U.S. Dollar Exchange Rate Futures
It seeks to hedge foreign-denominated liabilities against the real fluctuation. The Company may buy or sell commercial U.S. dollar futures on the Commodities and Futures Exchange (BM&F) to mitigate the foreign exchange exposure of its US dollar-denominated liabilities. The specifications of the Real-U.S. dollar exchange rate futures contract, including detailed explanation on the contract’s features and the calculation of daily adjustments, are published by the BM&F and disclosed on its website (www.bmf.com.br).In 2011, the Company did not contract U.S. dollar futures transactions.Throughout 2010, the Company paid R$179,564 and received R$259,490 in adjustments, thus with a gain of R$79,926.Gains and losses from these contracts are directly related to the foreign exchange fluctuations.
·Other derivatives
The subsidiary Lusosider carries out transactions with derivatives to hedge its exposure against the euro-dollar fluctuation. As of December 31, 2011, the gross position was US$35,352 thousand and the net position was US$144 thousand (including the derivatives below).
FS-48
| | | | | | | | | | | |
| | | | | 12/31/2011 |
| Counterparties | | Transaction maturity | | Notional (US$ thousand) | | Appreciation (R$) | | Fair value (market) |
| | | | Asset position | | Liability position | | Amount receivable |
| BES | | 4/30/2012 | | 20,208 | | 38,017 | | (34,049) | | 3,968 |
| BNP | | 1/31/2012 | | 15,000 | | 28,219 | | (25,453) | | 2,766 |
| | | | | 35,208 | | 66,236 | | (59,502) | | 6,734 |
The position of outstanding transactions was recognized in the Company’s assets and totals R$6,734 as of December 31, 2011.
On September 26, 2011, the subsidiary Tecon settled its derivative transactions used to hedge its exposure to Real-Yen fluctuation, the notional amount of which was JPY 2,390,398 (outstanding short position of R$8,042 as of December 31, 2010).
Gains or losses on these transactions as of December 31, 2011 are consolidated into the Company’s finance income (costs) as a gain totaling R$16,501 (loss of R$8,388 in 2010) (see Note 26).
·Sensitivity analysis of the US dollar-to-real exchange swap
The sensitivity analysis is based in the assumption of maintaining, as a probable scenario, the fair values as of December 31, 2011 recognized in assets, amounting to R$37,020 and in liabilities, amounting to R$847.The Company considered the scenarios below for the real-dollar parity volatility.
- Scenario 1: (25% real appreciation) R$-US$ parity of 1.4069;
- Scenario 2: (50% real appreciation) R$-US$ parity of 0.9379;
- Scenario 3: (25% real depreciation) R$-US$ parity of 2.3448;
- Scenario 4: (50% real depreciation) R$-US$ parity of 2.8137.
| | | | | | | | | | | | | |
| | | 12/31/2011 |
| | | | | Reference | | | | | | | | |
| | | | | value (US$ | | | | | | | | |
| | | Risk | | thousand) | | Scenario 1 | | Scenario 2 | | Scenario 3 | | Scenario 4 |
| |
| | | | | 1.8758 | | 1.4069 | | 0.9379 | | 2.3448 | | 2.8137 |
| |
| Net currency swap | | US dollar fluctuation | | 267,856 | | (125,611) | | (251,222) | | 125,611 | | 251,222 |
| |
| Exchange position functional currency BRL | | US dollar fluctuation | | 891,086 | | (417,875) | | (835,749) | | 417,875 | | 835,749 |
| (not incluing exchange derivatives above) | | | | | | | | | | | | |
| |
| Consolidated exchange position | | US dollar fluctuation | | 1,158,942 | | (543,486) | | (1,086,971) | | 543,486 | | 1,086,971 |
| (including exchange derivatives above) | | | | | | | | | | | | |
·Sensitivity analysis of the euro-to-dollar exchange swap
The sensitivity analysis is based on the assumption of maintaining, as a probable scenario, the fair values as of December 31, 2011 recognized in assets, amounting to R $13,250.The Company considered the scenarios below for the real-euro parity volatility.
- Scenario 1: (25% real appreciation) R$-euro parity of 1.8257;
- Scenario 2: (50% real appreciation) R$-euro parity of 1.2171;
- Scenario 3: (25% real depreciation) R$-euro parity of 3.0428;
FS-49
- Scenario 4: (50% real depreciation) R$-euro parity of 3.6513.
| | | | | | | | | | | | | |
| | | 12/31/2011 |
| | | | | Reference | | | | | | | | |
| | | Risk | | value (EUR | | Scenario 1 | | Scenario 2 | | Scenario 3 | | Scenario 4 |
| | | | | thousand) | | | | | | | | |
| |
| | | | | 2.4342 | | 1.8257 | | 1.2171 | | 3.0428 | | 3.6513 |
| |
| Net currency swap | | euro fluctuation | | (90,000) | | 54,770 | | 109,539 | | (54,770) | | (109,539) |
| |
| Exchange position functional currency BRL | | euro fluctuation | | 6,496 | | (3,954) | | (7,907) | | 3,954 | | 7,907 |
| (not incluing exchange derivatives above) | | | | | | | | | | | | |
| |
| Consolidated exchange position | | euro fluctuation | | (83,504) | | 50,816 | | 101,632 | | (50,816) | | (101,632) |
| (including exchange derivatives above) | | | | | | | | | | | | |
·Sensitivity analysis of exchange exposure to australian dollar
The sensitivity analysis is based on the assumption of maintaining, as a probable scenario, the fair values as of December 31, 2011.The Company considered the scenarios below for the real-australian dollar parity volatility.
- Scenario 1: (25% real appreciation) R$-A$ of 1.4337;
- Scenario 2: (50% real appreciation) R$-A$ of 0.9558;
- Scenario 3: (25% real depreciation) R$-A$ parity of 2.3895;
- Scenario 4: (50% real depreciation) R$-A$ parity of 2.8674.
| | | | | | | | | | | | | |
| | | 12/31/2011 |
| | | | | Reference | | | | | | | | |
| | | Risk | | value (A$ | | Scenario 1 | | Scenario 2 | | Scenario 3 | | Scenario 4 |
| | | | | thousand) | | | | | | | | |
| |
| | | | | 1.9116 | | 1.4337 | | 0.9558 | | 2.3895 | | 2.8674 |
| |
| Exchange position functional currency BRL | | Australian dollar fluctuation | | 302,553 | | (144,590) | | (289,180) | | 144,590 | | 289,180 |
·Sensitivity analysis of exchange dollar-to-euro swap
The sensitivity analysis is based on the assumption of maintaining, as a probable scenario, the fair values as of December 31, 2011 recognized in assets, amounting to R $6,734.The Company considered the following scenarios for the real-euro parity volatility.
- Scenario 1: (25% real appreciation) euro-dollar parity of 0.9856;
- Scenario 2: (50% real appreciation) euro-dollar parity of 0.6571;
- Scenario 3: (25% real depreciation) euro-dollar parity of 1.6426;
- Scenario 4: (50% real depreciation) euro-dollar parity of 1.9712.
FS-50
| | | | | | | | | | | | | |
| | | 12/31/2011 |
| | | | | Reference | | | | | | | | |
| | | Risk | | value (US$ | | Scenario 1 | | Scenario 2�� | | Scenario 3 | | Scenario 4 |
| | | | | thousand) | | | | | | | | |
| | | | | 1.3141 | | 0.9856 | | 0.6571 | | 1.6426 | | 1.9712 |
| |
| Net currency swap | | US dollar fluctuation | | 35,208 | | (11,567) | | (23,133) | | 11,567 | | 23,133 |
| |
| Exchange position functional currency EURO | US dollar fluctuation | | (35,352) | | 11,614 | | 23,228 | | (11,614) | | (23,228) |
| (not incluing exchange derivatives above) | | | | | | | | | | | | |
| |
| Consolidated exchange position | | US dollar fluctuation | | (144) | | 47 | | 95 | | (47) | | (95) |
| (including exchange derivatives above) | | | | | | | | | | | | |
·Interest rate risk
Short- and long-term liabilities to indexed to floatinginterest rate and inflation indices. Due to this exposure, the Company undertakes derivative transactions to better manage these risks.
·Interest rate swap transactions (LIBOR to CDI)
FS-47
The objective of these transactions is to hedge transactions indexed to US dollar LIBOR against fluctuations in Brazilian interest rates. Basically, the Company carried out swaps of its obligations indexed to the LIBOR, in which it receives interest of 1.25% p.a. on the notional value of the dollar (long position) and pays 96% of the CDI on the notional amount in reais atof the contract date (short position).The notional amount of this swap as of December 31, 2011 is US$107,500 thousand,, hedging an export prepayment transaction inof the same amount. The gains and losses on these contracts are directly related to fluctuations in exchange rates (US$) and interest rates (LIBOR and CDI).In. In general, these are transactions conducted in the Brazilian over-the-counter market that have as a counterparty a prime financial institution.
As of December 31, 2011, the position of these contracts is as follows:Interest rate swap transactions (Fixed rate to CDI)
a)OutstandingIts purpose is to peg obligations subject to a fixed rate to the fluctuation of the average interest rate of the one-day interbank deposits (CDI), calculated and disclosed by CETIP. Basically, the Company carried out swaps of its obligations indexed to the fixed rate, in which it receives interest on the notional amount (long position) and pays 100% of the CDI on the notional amount in reais of the contract date (short position). The gains and losses on this contract are directly related to CDI variation. In general, these are transactions
| | | | | | | | | | | |
| | | | | 12/31/2011 |
| | | | | Notional | | | | | | |
| | | | | (US$ | | Appreciation (R$) | | Fair value |
| | | | | thousand) | | | | | | (market) (R$) |
| Counterparties | | Transaction maturity | | 2011 | | Long position | | Short position | | Amount payable |
| CSFB | | 2/13/2012 | | 107,500 | | 182,432 | | (184,556) | | (2,124) |
| |
| |
| | | | | 12/31/2010 |
| | | | | Notional | | | | | | |
| | | | | (US$ | | Appreciation (R$) | | Fair value |
| | | | | thousand) | | | | | | (market) (R$) |
| Counterparties | | Transaction maturity | | 2010 | | Long position | | Short position | | Amount payable |
| CSFB | | 2/12/2011 | | 150,000 | | 254,575 | | (257,584) | | (3,009) |
b)Settled transactions
FS-51
| | | | | | | | | | | | | | | | | | | | | |
| | | | | Appreciation 2011 | | | | Appreciation 2010 | | | | |
| Counterparties | | Maturity | | Notional (US$thousand) | | Long position(R$) | | Short position(R$) | | Paid in 2011 | | Notional(US$ thousand) | | Long position(R$) | | Short position(R$) | | Fair value in2010 | | Impact onP&L in 2011 |
| CSFB | | 14/2/2011 | | 150,000 | | 255,238 | | (260,757) | | (5,519) | | 150,000 | | 254,575 | | (257,584) | | (3,009) | | (2,510) |
| CSFB | | 12/5/2011 | | 150,000 | | 255,151 | | (260,582) | | (5,431) | | | | | | | | | | (5,431) |
| CSFB | | 12/8/2011 | | 129,000 | | 219,172 | | (224,641) | | (5,469) | | | | | | | | | | (5,469) |
| CSFB | | 14/11/2011 | | 129,000 | | 219,547 | | (224,607) | | (5,060) | | | | | | | | | | (5,060) |
| | | | | 558,000 | | 949,108 | | (970,587) | | (21,479) | | 150,000 | | 254,575 | | (257,584) | | (3,009) | | (18,470) |
The position of outstanding transactions was recognized conducted in the Company’s liabilities and totals R$2,124 in 2011 (R$3,009 in liabilitiesBrazilian over-the-counter market that have as of December 31, 2010) and its effects were recognized incounterparty a prime financial institution, contracted within the Company’s finance income (costs) as loss totaling R$20,594 (loss of R$18,864 in 2010).exclusive funds.
· Sensitivity analysis of interestexchange rate swaps (LIBOR to CDI)
The Company considered scenarios 1 and 2 as 25% and 50% of appreciation for volatility of the currency, using as reference the closing exchange rate as of December 31, 2013 for dollar-to-real exchange swap R$2.3426, and for dollar-to-euro exchange swap R$1.3773.
| | | | | | | | | | | 12/31/2013 |
Instruments | | Notional amount | | Risk | | Probable scenario (*) | | Scenario 1 | | Scenario 2 |
Dollar-to-CDI exchange swap | | 110,000 | | US dollar | | 12,912 | | -64,422 | | -128,844 |
| | | | | | | | | | | |
Total dollar-to-euro swap (NDF) | | -90,000 | | Euro | | 5,258 | | 72,595 | | 145,192 |
| | | | | | | | | | | |
Euro-to-dollar exchange swap | | 11,801 | | US dollar | | 17 | | -13,109 | | -26,222 |
| | | | | | | | | | | |
Dollar-to-real swap (NDF) | | 293,000 | | US dollar | | 597 | | -171,595 | | -343,191 |
(*) The sensitivity analysis is based on the assumption of maintaining, as a probable scenario, the fairmarket values as of December 31, 20112013 recognized in liabilities, amounting to R$2,124.Theliabilities.
·Sensitivity analysis of interest rate swaps
The Company considered scenarios 1, 2, 3 and 4 as 25% and 50% of appreciation and devaluation for volatility of the following scenarios for the LIBOR (US$) and CDI interest rates volatility.
| | | | | | | | | | | | | |
| | | 12/31/2011 |
| | | Notional (US$ thousand) | | Risk | | 25% | | 50% | | 25% | | 50% |
| LIBOR-to-CDI interest rate swap | | 107,500 | | (Libor) US$ | | (25,586) | | (30,176) | | 25,586 | | 30,176 |
as of December 31, 2013.
| | | 12/31/2013 |
Instruments | | Notional amount | | Risk | | Scenario 1 | | Scenario 2 | | Scenario 3 | | Scenario 4 |
| | | | | | | | | | | | |
LIBOR-to-CDI interest rate swap | | 21,500 | | (Libor) US$ | | -9,849 | | -11,725 | | 9,849 | | 11,725 |
| | | | | | | | | | | | |
Fixed rate-to-CDI interest rate swap | | 345,000 | | CDI | | -11,428 | | -19,855 | | 5,425 | | 13,852 |
·Interest rate risk
Short- and long-term liabilities indexed to floating interest rate and inflation indices. Due to this exposure, the Company undertakes derivative transactions to better manage these risks.
· Sensitivity analysis of changes in interest rates
FS-48
The Company considers the effects of a 5% increase or decrease in interest rates on its outstanding borrowings, financing and debentures as of December 31, 20112013 in the consolidated financial statements.
| | | | | | | |
| | | | | Impact on profit or loss |
| Changes in interest rates | | % p.a. | | 12/31/2011 | | 12/31/2010 |
| TJLP | | 6.00 | | 1,372 | | 6,465 |
| Libor | | 0.81 | | 7,941 | | 7,102 |
| CDI | | 10.87 | | 72,607 | | 42,103 |
| | | | | Impact on profit or loss |
Changes in interest rates | | % a.a | | 12/31/2013 | | 12/31/2012 |
TJLP | | 5.00 | | 2,521 | | 8,409 |
Libor | | 0.35 | | 5,725 | | 6,535 |
CDI | | 9.77 | | 71,507 | | 49,566 |
· Share market price risks
The Company is exposed to the risk of changes in equity prices due to the investments made and classified as available-for-sale. Equity investments refer to blue chips traded on BM&F BOVESPA.
The following table summarizesshows the impact of the net changes in pricesthe market value of financial instruments classified as available-for-sale on profit or loss for the year andshareholders' equity, in other comprehensive income:
| | | | | | | | | |
| | | Profit (loss) for the year | | Other comprehensive income |
| | | 12/31/2011 | | 12/31/2010 | | 12/31/2011 | | 12/31/2010 |
| Net change in the fair value of financial instruments classified as available for sale | | (621,312) | | 515,573 | | (767,015) | | 552,461 |
income.
On April 20, 2011, the Company sold 100% of its equity interest held in Riversdale’s share capital, corresponding to 47,291,891 shares at the price of A$16.50 per share, totaling a gain of R$698,164.
| | | | | | | |
| | | Other comprehensive income |
| | | 12/31/2013 | | 12/31/2012 | | Net change |
Net change in available-for-sale financial assets | | 779,526 | | 732,141 | | 47,385 |
The Company considers as probable scenario the amounts recognized at market pricesvalues as of December 31, 2011.2013. Sensitivity analysis is based on the assumption of maintaining as probable scenario the market values as of December 31, 2011.2013. Therefore, there is no impact on the financial instruments classified as available for sale already presented above. The Company considered the following scenarios 1 and 2 as 25% and 50% of appreciation for volatility of the shares:shares.
FS-52
- Scenario 1: (25% appreciation of shares);
- Scenario 2: (50% appreciation of shares);
- Scenario 3: (25% devaluation of shares);
- Scenario 4: (50% devaluation of shares);
| | | | | | | | | | | |
| | | Impact on profit and equity |
| Companies | | Probable | | 25% | | 50% | | 25% | | 50% |
| Usiminas | | (767,924) | | 509,296 | | 1,018,593 | | (509,296) | | (1,018,593) |
| Panatlântica | | 909 | | 2,663 | | 5,326 | | (2,663) | | (5,326) |
| | | (767,015) | | 511,959 | | 1,023,919 | | (511,959) | | (1,023,919) |
| | | | Impact on equity |
Companies | | Probable | | Scenario 1 | | Scenario 2 |
Usiminas | | 772,190 | | 199,711 | | 399,421 |
Panatlântica | | 7,336 | | 2,947 | | 5,894 |
| | 779,526 | | 202,658 | | 405,315 |
· Credit risks
The exposure to credit risks of financial institutions is in line with the parameters established in the financial policy.Thepolicy. The Company adopts the practice of analyzing in detail the financial position of its customers and suppliers, establishing a credit limit and conducting ongoing monitoring of the outstanding balance.
As regards short-term investments, the Company only makes investments in institutions with low credit risk as rated by credit rating agencies. As part of the funds is invested in reporepos (repurchase agreements) backed by Brazilian government bonds, there is also exposure to Brazil’s sovereign risk.
· Capital management
The Company manages its capital structure to ensure that it will be capable of providing return to its shareholders and benefits to other stakeholders, and maintain an optimal capital structure to reduce this cost.
·Liquidity risk
FS-49
It is the risk that the Company may not have sufficient net funds to honor its financial commitments as a result of mismatching of terms or volumes between scheduled receipts and payments.
To manage cash liquidity in domestic and foreign currency, assumptions of future disbursements and receipts are established and daily monitored by the treasury area. The payment schedules for the long-term portions of borrowings, financing and debentures are shown in note 12.
The following table shows the contractual maturities of financial liabilities, including accrued interest.
| | | | | | | | | | |
At December 31, 2013 | Less than one year | | From one to two years | | From two to five years | | Over five years | | Total |
Borrowings, financing and debentures | 2,673,648 | | 6,391,523 | | 11,439,993 | | 7,358,058 | | 27,863,222 |
Derivative financial instruments | 6,822 | | 17,375 | | | | | | 24,197 |
Trade payables | 1,102,037 | | | | | | | | 1,102,037 |
| | | | | | | | | |
At December 31, 2012 | | | | | | | | | |
Borrowings, financing and debentures | 2,200,152 | | 2,838,954 | | 10,248,009 | | 14,150,558 | | 29,437,673 |
Derivative financial instruments | 244,333 | | | | | | | | 244,333 |
Trade payables | 2,025,461 | | | | | | | | 2,025,461 |
V – Margin deposits
The Company holds margin deposits totaling R$407,467 (R$254,485426,328 as of December 31, 2010);2012; this amount is invested at Deutsche Bank as guarantee of the derivative financial instrument contracts, specificallybasically swaps between CSN Islands VIII and CSN. This deposit was settled together with the respective swap on December 12, 2013.
16.14. OTHER PAYABLES
The group of other payables classified in current and non-current liabilities is comprised as follows:
| | | | | | | | | |
| | | Current | | Non-current |
| | | Consolidated | | Consolidated |
| | | 12/31/2011 | | 12/31/2010 | | 12/31/2011 | | 12/31/2010 |
| Amounts due to related parties (*) | | 178,635 | | 148,364 | | 3,094,453 | | 3,028,924 |
| Unrealized losses on derivatives (Note 15 I) | | 2,971 | | 116,407 | | 373,430 | | 254,494 |
| Dividends and interest on capital payable | | 928,924 | | 631,344 | | | | |
| Advances from customers | | 23,868 | | 35,361 | | | | |
| Taxes in installments | | 313,201 | | 656,678 | | 1,910,576 | | 859,898 |
| Profit sharing - employees | | 131,755 | | 90,243 | | | | |
| Other payables | | 149,091 | | 176,555 | | 215,061 | | 178,350 |
| | | 1,728,445 | | 1,854,952 | | 5,593,520 | | 4,321,666 |
| Current | Non-current |
| | 12/31/2013 | | 12/31/2012 | | 12/31/2013 | | 12/31/2012 |
Payables to related parties (Note 19 b) | 422,150 | | 703,236 | | 8,522,685 | | 7,758,093 |
Derivative financial instruments (Note 13 I) | 6,822 | | 244,333 | | 17,375 | | |
Dividends and interest on capital payable to Company owners (Note 19 a) | | | 155,537 | | | | |
Dividends and interest on capital payable non-controlling shareholders | 2,036 | | 146,081 | | | | |
Advances from customers | 28,213 | | 31,062 | | | | |
Taxes in installments (Note 16) | 247,387 | | 166,818 | | 1,454,838 | | 1,085,079 |
Profit sharing - employees | 121,631 | | 7,771 | | | | |
Other payables | 144,612 | | 127,202 | | 66,673 | | 165,877 |
| 972,851 | | 1,582,040 | | 10,061,571 | | 9,009,049 |
FS-53
(*) The nature of transactions with related parties are described in note 4.15.INCOME TAX AND SOCIAL CONTRIBUTION
17.(a) GUARANTEES Income tax and social contribution recognized in profit or loss:
The income tax and social contribution recognized in profit or loss for the year are as follows:
| | 12/31/2013 | | 12/31/2012 | | 12/31/2011 |
Income tax and social contribution (expenses) income | | | | | |
Current | -1,290,755 | | -321,999 | | -136,427 |
Deferred | 1,216,594 | | 1,274,207 | | 52,542 |
| -74,161 | | 952,208 | | -83,885 |
FS-50
The reconciliation of Company and consolidated income tax and social contribution expenses and income and the result from applying the effective rate on profit before income tax (IRPJ) and social contribution (CSLL) are as follows:
| | 12/31/2013 | | 12/31/2012 | | 12/31/2011 |
Profit (loss) before income tax and social contribution | 608,155 | | (1,432,782) | | 3,751,119 |
Tax rate | 34% | | 34% | | 34% |
Income tax and social contribution at combined statutory rate | -206,773 | | 487,146 | | -1,275,380 |
Adjustment to reflect effective rate: | | | | | |
Interest on capital benefit | 255,000 | | | | |
Share of profits of investees | | | | | |
Income subject to special tax rates or untaxed | 227,097 | | 444,378 | | 1,279,431 |
Transfer pricing adjustment | -31,404 | | | | |
Tax incentives | | | | | 73,134 |
REFIS effect | -689,299 | | 39,256 | | -16,060 |
Sale of nondeductible securities | | | | | -189,946 |
Tax loss carryforwards without recognizing deferred taxes | -166,734 | | -42,683 | | |
Subsidiaries’ tax credit | 550,270 | | | | 44,434 |
Other permanent deductions (add-backs) | -12,318 | | 24,111 | | 502 |
Income tax and social contribution in profit for the year | -74,161 | | 952,208 | | -83,885 |
Effective tax rate | 12% | | -66% | | -2% |
(b)Deferred income tax and social contribution:
The deferred income tax and social contribution are calculated on income tax and social contribution loss carryforwards and related temporary differences between the tax bases of assets and liabilities and the accounting balances of the financial statements. They are presented at net amounts when related to a sole jurisdiction.
| | Opening balance | Movement | Closing balance |
| | 12/31/2012 | Comprehensive
income | Profit or
loss | Tax
credits
(**) | 12/31/2013 |
Deferred tax assets | | | | | |
Income tax loss carryforwards | 818,705 | 32,800 | 289,105 | -8,314 | 1,132,296 |
Social contribution loss carryforwards | 242,606 | | 153,390 | -6,690 | 389,306 |
Acquisition of income tax loss carryforwards (Law 12,865/13 REFIS) | | | 401,953 | -401,953 | |
Acquisition of social contribution tax loss carryforwards (Law 12,865/13 REFIS) | | | 148,316 | -148,316 | |
Temporary differences | 1,115,768 | -77,567 | 210,724 | | 1,248,925 |
- Provision for tax, social security, labor, civil and environmental risks | 171,262 | | 36,245 | | 207,507 |
- Provision for environmental liabilities | 130,358 | | -12,563 | | 117,795 |
- Asset impairment losses | 53,887 | | -437 | | 53,450 |
- Inventory impairment losses | 29,638 | | -1,082 | | 28,556 |
- (Gains) losses on financial instruments | 47,524 | | -51,349 | | -3,825 |
- (Gains) losses on available-for-sale financial assets | 310,586 | -24,410 | 803 | | 286,979 |
- Actuarial liability (pension and healthcare plan) | 157,684 | -33,143 | 7,397 | | 131,938 |
- Accrued supplies and services | 55,072 | | 36,735 | | 91,807 |
- Allowance for doubtful debts | 25,812 | | 1,937 | | 27,749 |
- Goodwill on merger | -89,402 | -19,996 | -13,774 | | -123,172 |
- Unrealized exchange differences (*) | 197,944 | | 348,097 | | 546,041 |
- (Gain) on loss of control over Transnordestina | | | -224,096 | | -224,096 |
- Other | 25,403 | -18 | 82,811 | | 108,196 |
Non-current assets | 2,177,079 | -44,767 | 1,203,488 | -565,273 | 2,770,527 |
| | | | | | |
Deferred tax liabilities | | | | | |
- Business combination | 225,965 | 41,263 | -15,119 | | 252,109 |
- Other | 12,276 | 2,435 | 2,013 | | 16,724 |
Non-current liabilities | 238,241 | 43,698 | -13,106 | | 268,833 |
(*) The Company taxes foreign exchange differences on a cash basis to calculate income tax and social contribution.
(**) Use of tax credits on tax loss carryforwards of subsidiaries to settle tax debts as prescribed by Law 12865/13, Art. 40, Par. 7 (REFIS). (See Note 16.)
FS-51
Some Group companies recognized tax credits on income tax and social contribution loss carryforwards not subject to statute of limitations and based on the history of profitability and expected future taxable profits determined in technical studies approved by Management.
Since they are subject to significant factors that may change the projections for realization, the carrying amounts of deferred tax assets and projections are reviewed annually. These studies indicate the realization of these tax assets within the term stipulated by the mentioned instruction and the limit of 30% of the taxable profit.
The estimate of recovery of the deferred income tax and social contribution assets is as follows:
|
| |
Up to 1 year | | 380,960 |
From 1 to 2 years | | 485,077 |
From 2 to 3 years | | 651,435 |
From 3 to 5 years | | 4,130 |
|
| 1,521,602 |
Certain Group companies have tax assets amounting to R$196,461 and R$28,556, related to income tax and social contribution loss carryforwards, for which no deferred taxes were set up, of which R$37,082 expire in 2015, R$10,982 in 2018 and R$84,324 in 2025. The remaining tax assets refer to domestic companies and, therefore, are not subject to statute of limitations.
The Company’s corporate structure includes foreign subsidiaries whose profits are subject to income tax levied by the related countries, recognized at tax rates lower than the prevailing rate in Brazil.
For the years of 2010 to 2013 these subsidiaries generated profits amounting to R$4,027,058, which, tax authorities may understand that have already been distributed, hence, it would be subject to additional taxation in Brazil, in the approximate amount of R$1,300,000 in income tax and social contribution. The Company, based on its legal counsel’s opinion, assessed the likelihood of loss as possible in a potential challenge by tax authorities and, therefore, no provision was recognized in the financial statements.
(c)Income tax and social contribution recognized in shareholders' equity:
The income tax and social contribution recognized directly in shareholders' equity are as follows:
| | 12/31/2013 | | 12/31/2012 | | 12/31/2011 |
Income tax and social contribution | | | | | |
Actuarial gains on defined benefit pension plan | 33,012 | | 66,155 | | 54,714 |
Changes in the fair value on available-for-sale financial assets | -401,574 | | -377,164 | | 241,484 |
Exchange differences on translating foreign operations | -425,510 | | -425,510 | | -425,510 |
| -794,072 | | -736,519 | | -129,312 |
(d)Provisional Measure no. 627 of 2013 (“MP 627/13”)
FS-52
table of contents
On November 11, 2013 the Provisional Measure no.627 (“MP”) was issued to repeal the Transitional Tax Regime (RTT) and introduce other provisions, including: (i) it amends Decree-Law 1,598/77, which addresses the corporate income tax, and the social contribution on net income law; (ii) it establishes that any change in or the adoption of accounting methods and criteria under administrative measures issued based on the jurisdiction attributed by the Commercial Law, after the enactment of this Provisional Act, shall not have any impact on the calculation of federal taxes until a tax law addressing the matter is enacted; (iii) it provides for a specific treatment of the potential taxation of profits or dividends; (iv) it includes provisions on the calculation of interest on capital; and (v) it provides new considerations about investments accounted for by the equity method of accounting. The provisions of Provisional Act 627 are effective from 2015, however, its early irrevocable adoption in 2014 could eliminate the potential tax effects, especially those related to dividends and interest on capital actually paid since 2008 until the Provisional Act issue date.
The Company prepared studies on the possible effects that could arise from the provisions of said Provisional Act and concluded that they would not result in material adjustments to its financial statements for the year ended December 31, 2013.
Management is awaiting the analysis of said Provisional Measure by the Legislative Authority to decide on its possible early adoption in calendar 2014.
(e)Tax incentives
The Company is liablegranted by Income Tax incentives based on the legislation in effect, such as: Worker Food Program, the Rouanet Law (tax incentives related to cultural activities), Tax Incentives for guaranteesAudiovisual Activities, and Funds for its subsidiariesthe Rights of Children and jointly controlled entities,Adolescents. As of December 31, 2013, these tax incentives total R$329 (R$237 as follows:
| | | | | | | | | | | | | | | | | | | | | |
| | | Currency | | Maturities | | Borrowings | | Tax collections | | Other | | Total |
| | | | | | | 12/31/2011 | | 12/31/2010 | | 12/31/2011 | | 12/31/2010 | | 12/31/2011 | | 12/31/2010 | | 12/31/2011 | | 12/31/2010 |
| |
| Transnordestina | | R$ | | Up to 5/8/2028and undefined | | 1,358,657 | | 1,145,397 | | 1,800 | | | | 7,686 | | 5,186 | | 1,368,143 | | 1,150,583 |
| CSN Cimentos | | R$ | | Up to 11/18/2014and undefined | | | | | | 30,213 | | 32,745 | | 30,097 | | 26,987 | | 60,310 | | 59,732 |
| Prada | | R$ | | Up to 12/10/2013and undefined | | | | | | 9,958 | | 9,958 | | 2,440 | | 740 | | 12,398 | | 10,698 |
| Sepetiba Tecon | | R$ | | 1/31/2012 | | 700 | | 1,465 | | | | 15,000 | | | | 61,519 | | 700 | | 77,984 |
| Itá Energética | | R$ | | 9/15/2013 | | 7,326 | | 9,587 | | | | | | | | | | 7,326 | | 9,587 |
| CSN Energia | | R$ | | Up to 12/30/2012and undefined | | | | | | 2,392 | | 1,029 | | 2,336 | | 2,336 | | 4,728 | | 3,365 |
| Congonhas Minérios | | R$ | | 5/21/2018 | | 2,000,000 | | | | | | | | | | | | 2,000,000 | | - |
| Total in R$ | | | | | | 3,366,683 | | 1,156,449 | | 44,363 | | 58,732 | | 42,559 | | 96,768 | | 3,453,605 | | 1,311,949 |
| |
| CSN Islands VIII | | US$ | | 12/16/2013 | | 550,000 | | 550,000 | | | | | | | | | | 550,000 | | 550,000 |
| CSN Islands IX | | US$ | | 1/15/2015 | | 400,000 | | 400,000 | | | | | | | | | | 400,000 | | 400,000 |
| CSN Islands XI | | US$ | | 9/21/2019 | | 750,000 | | 750,000 | | | | | | | | | | 750,000 | | 750,000 |
| CSN Islands XII | | US$ | | Perpetual | | 1,000,000 | | 1,000,000 | | | | | | | | | | 1,000,000 | | 1,000,000 |
| Aços Longos | | US$ | | 12/31/2011 | | | | 4,431 | | | | | | | | | | | | 4,431 |
| CSN Resources | | US$ | | 7/21/2020 | | 1,000,000 | | 1,000,000 | | | | | | | | | | 1,000,000 | | 1,000,000 |
| Total in US$ | | | | | | 3,700,000 | | 3,704,431 | | | | | | | | | | 3,700,000 | | 3,704,431 |
| Total in R$ | | | | | | 6,940,460 | | 6,172,323 | | | | | | | | | | 6,940,460 | | 6,172,323 |
| | | | | | | 10,307,143 | | 7,328,772 | | 44,363 | | 58,732 | | 42,559 | | 96,768 | | 10,394,065 | | 7,484,272 |
of December 31, 2012).
18.16. TAXES IN INSTALLMENTS
In November and December 2013 the Company joined the Tax Recovery Program established by Law 12,865/13 and Law 11,941/09.
The position of the debts arising from these tax installment plans, recorded in taxes in installments in current and non-current liabilities, is as follows:
| Current | Non-current |
| | 12/31/2013 | | 12/31/2012 | | 12/31/2013 | | 12/31/2012 |
Federal REFIS Law 11,941/09 (a) | 140,446 | | 119,977 | | 1,001,630 | | 998,668 |
Federal REFIS Law 12,865/13 (a) | 27,124 | | | | 384,872 | | |
Other taxes in installments (b) | 79,817 | | 46,841 | | 68,336 | | 86,411 |
| | 247,387 | | 166,818 | | 1,454,838 | | 1,085,079 |
a) Tax Recovery Program (REFIS)(Federal Refis) – Law11,941/09 and Law 12,865/13
· Federal REFISNew deadline – Law 11,941/09
On November 26, 2009, the Company itsand some subsidiaries and jointly controlled entities joined the Tax Recovery Programs established by Law 11941/11,941/09 and Provisional MeasureAct 470/2009, aimed at settling tax liabilities through a special payment system and installment plan for the settlement of tax and social security obligations. Joining the special tax programs reduced the amount of fines, interest and legal charges previously due.
Management’s decision took into consideration matters already judgedWith the new deadline to join the Law11,941/09 tax installment program established by higher courts, as well as the assessment of outsideRFB/PGFN, pursuant to Law 12,865/13, the Company analyzed with its legal counsel regarding the possibility of favorable outcomeslawsuits that could have changed or be subject to new jurisprudence, the Company concluded that some tax debts could be included in the contingencies in progress.new tax installment plan onDecember 27, 2013.
FS-53
·Profits for Foreign Subsidiaries– Law 12,865/13
The tax debts enrolled under Provisional Measure 470/09 were payableUnder Article 40 of Law 12,865/13, the federal government allowed the payment in 12 installments starting November 2009.In July 2010, the Company elected to offsetof income tax and social contribution carryforwards againstarising from the last four installmentsapplication of Article 74 ofProvisional Measure2158-35/2001, the installment plan, as allowedso-called Profits for Foreign Subsidiaries, which requires that profits earned by relevant legislation.foreign subsidiaries or associates be taxed at yearend.
InThe Company elected to join the amounts corresponding to the assessed period (2004-2009), on November 2009 and February 2010, the debts payable enrolled in the installment plan under Law 11,941/09, already recognized through provisions, were reviewed based on the29, 2013.
Both programs provide for reductions in debits set forth in special programs, according to the waiver date of administrative appeals or legal proceedings. In the first quarter of 2010, the negative effect beforefines and interest, however, only income tax and social contribution of R$42,365 was accounted for in other operating income and expenses and in finance income (costs) (see Notes 25 and 26).
In June, 2011, the Group companies consolidated the debts enrolled in the tax program set forth by Law 11941/09, payable in 180 SELIC-adjusted installments. As a result of the consolidation, the provision increased R$19,734 in the second quarter of 2011, recognized in line item Finance income (costs) and other expenses, before income tax and social contribution.
FS-54
With respect to judicial deposits linked to REFIS proceedings, the Company obtained a favorable opiniondebt arising from the National Treasury Attorney General’s Office (PGFN)application of Law 12,865/12 could be settled with tax credits claimed on tax loss carryforwards of subsidiaries and the Federal Revenue Service (RFB) onCompany. The tax credit utilized by the treatment given to the excess deposit generated after applicationsubsidiaries total R$565,273, of the reductions obtained forwhich R$550,270 did not have a recognized tax paymentcredit, as shown in cash.
Accordingly, the Company filed a request for offset of the deposit surplus against taxes in installments under the Law 11941 REFIS program with the PGFN. We are awaiting a reply from the PGFN of the intended offset.Note 15.
The positionremaining balance was divided into 180 monthly installments adjusted by the SELIC and the amount determined pursuant to Laws 11,941/09 and 12,865/13 is subject to approval by the tax authorities.
The adoption of REFIS debts recorded in taxes inthe programs described above had a negative impact on the Company's profit for the fourth quarter, as shown below:
| | |
Taxes | | -805,748 |
Fines and charges | | -569,465 |
Interest | | -519,764 |
Total | | -1,894,977 |
| | |
Discounts | | |
Fines and charges | | 446,570 |
Interest | | 255,102 |
Utilization of income tax and social contribution credit on tax loss carryforwards | 565,273 |
Total reductions | | 1,266,945 |
| | |
Total taxes payable | | -628,032 |
| | |
Deferred income tax and social contribution on fines and interest | 224,769 |
| | |
Net effect on loss (profit) | | -403,263 |
b)Other tax installments in current(regular and non-current liabilities as of December 31, 2011 was R$2,094,741 (R$1,444,207 as of December 31, 2010).other)
The Group companies also joined the Regular social security tax (INSS) installment plan and other plans.
19.17. PROVISIONSPROVISION FOR TAX, SOCIAL SECURITY, LABOR, CIVIL AND CIVILENVIRONMENTAL RISKS AND JUDICIAL DEPOSITS
Claims of different nature are being challenged at the appropriate courts. Details of the accrued amounts and related judicial deposits are as follows:
| | | | | | | | | |
| | | 12/31/2011 | | 12/31/2010 |
| | | Judicial deposits | | Accrued liabilities | | Judicial deposits | | Accrued liabilities |
| Social security and labor | | 131,443 | | 284,556 | | 107,100 | | 247,212 |
| Civil | | 50,909 | | 94,183 | | 47,216 | | 80,331 |
| Ambiental | | | | 6,906 | | | | 500 |
| Tax | | 1,159,881 | | 94,317 | | 878,309 | | 86,342 |
| Judicial deposits | | 26,928 | | | | 46,160 | | |
| | | 1,369,161 | | 479,962 | | 1,078,785 | | 414,385 |
| Legal obligations challenged in court: | | | | | | | | |
| Tax | | | | | | | | |
IPI premium credit | | | | | | 1,227,892 | | 1,227,892 |
CSLL credit on exports | | | | 9,016 | | | | 401,916 |
Salary premium for education | | 36,189 | | 33,121 | | 36,189 | | 33,121 |
CIDE | | 2,895 | | 3,246 | | 54,211 | | 27,545 |
Income tax on ”Plano Verão” | | 345,676 | | 20,892 | | 341,551 | | 20,892 |
Other provisions | | 6,893 | | 92,226 | | 36,078 | | 113,552 |
| | | 391,653 | | 158,501 | | 1,695,921 | | 1,824,918 |
| | | 1,760,814 | | 638,463 | | 2,774,706 | | 2,239,303 |
| Total current | | | | 292,178 | | | | 222,461 |
| Total non-current | | 1,760,814 | | 346,285 | | 2,774,706 | | 2,016,842 |
| | | | | | | | |
| | | | 12/31/2013 | | | | 12/31/2012 |
| | Accrued liabilities | | Judicial deposits | | Accrued liabilities | | Judicial deposits |
Tax | | 259,725 | | 87,391 | | 178,657 | | 99,400 |
Social security and labor | | 298,637 | | 138,911 | | 263,700 | | 156,772 |
Civil | | 82,143 | | 29,022 | | 96,705 | | 36,109 |
Environmental | | 4,262 | | 961 | | 7,056 | | |
Judicial deposits | | | | 8,935 | | | | 11,350 |
| | | 644,767 | | 265,220 | | 546,118 | | 303,631 |
Legal obligations challenged in courts: | | | | | | | | |
Tax | | | | | | | | |
Salary Premium for education | | 46,193 | | 46,193 | | 24,077 | | 46,193 |
Income tax on ”Plano Verão” | | 20,892 | | 366,951 | | 20,892 | | 348,969 |
Other provisions | | 101,331 | | 15,350 | | 97,157 | | 19,233 |
| | | 168,416 | | 428,494 | | 142,126 | | 414,395 |
| | 813,183 | | 693,714 | | 688,244 | | 718,026 |
FS-54
table of contents
The changes in the provisionsprovision for contingenciestax, social security, labor, civil and environmental risks in the year ended December 31, 20112013 were as follows:
| | | | | | | | | | | | | | | | | |
| Current + Non-current | | Current |
| |
| Nature | | 12/31/2010 | | Additions | | Inflationadjustment | | Transfer (*) | | Utilization | | 12/31/2011 | | 12/31/2011 | | 12/31/2010 |
| Civil | | 80,831 | | 17,188 | | 24,639 | | | | (21,569) | | 101,089 | | 87,343 | | 57,622 |
| Labor | | 188,188 | | 50,383 | | 48,019 | | | | (63,570) | | 223,020 | | 204,615 | | 164,839 |
| Tax | | 1,911,260 | | 68,915 | | 24,906 | | (1,597,659) | | (154,604) | | 252,818 | | 220 | | |
| Social security | | 59,024 | | 28 | | 2,726 | | | | (242) | | 61,536 | | | | |
| | | 2,239,303 | | 136,514 | | 100,290 | | (1,597,659) | | (239,985) | | 638,463 | | 292,178 | | 222,461 |
| | | | | | | | | | | |
| | | | | | | | | | Current + Non-current |
Nature | | 12/31/2012 | | Additions | | Net adjustment | | Net utilization of reversal | | 12/31/2013 |
Tax | | 320,783 | | 72,980 | | 42,475 | | -8,097 | | 428,141 |
Social security | | 43,858 | | | | 3,403 | | | | 47,261 |
Labor | | 219,842 | | 100,304 | | 24,924 | | -93,694 | | 251,376 |
Civil | | 96,705 | | 6,862 | | 2,022 | | -23,446 | | 82,143 |
Environmental | | 7,056 | | 3,663 | | 964 | | -7,421 | | 4,262 |
| | | 688,244 | | 183,809 | | 73,788 | | -132,658 | | 813,183 |
(*) The transfers to taxes in installments were made due to the compliance with Law 11,941/09 and refer to the social contribution on exports (CSLL Exportação),COFINS Law 10833/03, CIDE and State VAT (IPI) on exports premium credit.
FS-55
The provisionsprovision for civil, labor, tax, environmental and social security, labor, civil and environmental liabilities werewas estimated by management and areis mainly based on the legal counsel’s assessment. Only proceedings for which the risk is classified as probable loss are accrued. Moreover, these provisions includethis provision includes tax liabilities resulting from contingencies filed by the Company, subject to SELIC (Central Bank’s policy rate).
The Company and its subsidiaries are defendants in other administrative and judicial proceedings (labor, civil, tax and environmental), in the approximate amount of R$6,880,921, of which R$525,139 related to civil lawsuits, R$45,078 related to environmental and R$1,114,509 to labor and social security lawsuits. The assessments made by legal counsel define these administrative and judicial proceedings as entailing risk of possible loss and, therefore, no provision was recorded in conformity with Management’s judgment and accounting practices.
As for the tax lawsuits these represent R$5,196,195, and R$1,687,349 from this total refers to the assessment notice issued against the Company for an alleged nonpayment of income tax (IRPJ) and social contribution on net income (CSLL) on profits recognized in the balance sheets of its subsidiaries in Luxembourg. In view of the recent changes in administrative and judicial decisions, our outside legal counsel believes that this decision will not reach the profits recognized and not yet made available by our foreign subsidiaries, subject matter of the assessment notice, in light of the protection granted by the Brazil-Luxembourg treaty. However, because of the current undefined position of administrative and judicial courts, the possibility of an unfavorable outcome was classified as possible.
a) Labor lawsuits
As of December 31, 2011, the Company and its subsidiaries is a defendant in12,993labor lawsuits, for which a provision has been recorded in the amount of R$223,020(R$188,188 asof December 31,2010). Most of the claims relate to subsidiary and/or joint liability, salary equalization, health hazard premiums and hazardous duty premiums, overtime pay, difference in the 40% fine for the severance pay fund (FGTS) as a result of federal government economic plans, health care plan, indemnity contingencies resulting from alleged occupational diseases or on-the-job accidents, and differences in profit sharing from 1997 to 1999 and from 2001 to 2003.
b) Civil lawsuits
Among the civil lawsuits in which the Company is a defendant are claims for compensation. Generally these lawsuits result from on-the-job accidents, occupational diseases and contractual litigation related to the Company’s industrial activities and its subsidiaries. For lawsuits involving civil matters, a provision has been recognized in the amount of R$94,183 as of December 31, 2011 (R$80,331 as of December 31, 2010).
c) Tax lawsuits
§I - Income tax and social contribution
(i) “Plano“Plano Verão” - The CompanyCSN is claiming the recognition of financial and tax effects on the calculation of income tax and social contribution, related to removal by the government of inflation measured according to the Consumer Price Index (IPC) in January and February 1989, involving a total percentage figure of 51.87% (“Summer Plan”(‘Plano Verão”).
In 2004, the lawsuit was terminated with a final and unappealable decision that granted the right to apply the index of 42.72% (January 1989), with the 12.15% already applied to be deducted from this index. The final decision also granted application of the index of 10.14% (February 1989).The. The proceeding is currently at expert discovery stage.
As of December 31, 2011,2013, there is an amount of R$345,676366,951 (R$341,551348,969 as of December 31, 2010)2012) deposited in court, classified in a specific account of judicial deposits in long-term receivables, and a provision of R$20,892 (R$20,892 as of December 31, 2010)2012), which represents the portion not recognized by the courts.
FS-55
(ii) CSLL Export (Social Contribution on Income from Export Revenues) – In February 2004 the Company filed a lawsuit claiming that it should not be subject to paymenttable of CSLL (social contribution) on its export revenues/profits, as well as to obtain court authorization to offset all the amounts of CSLL incorrectly paid on such export revenues/profits since the publication of Constitutional Amendment 33/2001, which provided new wording to article 149, paragraph 2 of the 1988 Federal Constitution (CF/88), by determining that “social contributions shall not be levied on export revenues”.contents
Since then the Company was maintaining the CSLL on export revenues/profits in a provision; however, after the STF ruling on Extraordinary Appeal (RE) 564,413 (leading case) in a vote on the non-levy of CSLL on taxpayers’ exports, still not yet published, the Company decided to include this lawsuit in the installment plan established by Law 11941/09 (REFIS).The adjusted amount of the lawsuit included in the installment plan was R$365,466.
§Economic Intervention Contribution (CIDE)
The Company was challenging the legal validity of Law 10168/00, which introduced the collection of CIDE on amounts paid, credited or remitted to non-resident beneficiaries by way of royalties or compensation for agreements involving supply, technical assistance, assignment and licenses for use of trademarks and patents.
The ruling at the lower court was unfavorable and this was upheld by the 2nd Region TRF (Federal regional Court).The Company filed Appeals for Declaratory Judgment, which were dismissed, and an extraordinary appeal was filed with the STF, admissibility of which is presently awaiting the higher court’s decision.
In view of the unfavorable decisions and the benefits involving reduction in fines and interest, the Company’s Board of Directors approved including the amounts covered by the court litigation in the tax recovery program introduced by Law 11941/2009.
After application of the benefits of this program, the Company maintains judicial deposits in the amount of R$6,200, of which R$2,895 involves excess deposits after application of the REFIS reductions that may be offset converted into income. As of December 31, 2011 there is a provision recognized in the amount of R$3,246 (R$3,246 as of December 31, 2010), including legal charges.
§II - Salary premium for education – “Salá- "Salário Educação”o"
The CompanyCSN has filed a lawsuit challenging the constitutionality of the salary premium for education and for discussing the possibility of recovering the amounts paid in the period from January 5, 1989 to October 16, 1996. The lawsuit was unsuccessful, and the TRF upheld the decision unfavorable to CSN, a decision that is final and unappealable. unappealable.
In view of the final and unappealable decision, CSN tried to make payment of the amount due, though the FNDE and INSS did not reach an agreement as to which agency should receive it. They also required that the amount should be paid along with a fine, with which the Company did not agree.
Lawsuits were then filed challenging the above events, with judicial deposit of the amounts involved in the lawsuits. In the first lawsuit, the lower court partly accepted the Company’s request, with the judge deducting the fine, but upholding the SELIC rate, with counterarguments against the defendant’s appeal against the SELIC rate.
TheAs of December 31, 2013 the accrued amount and judicial deposittotals R$46,193 (R$24,077 as of December 31, 2011 totals2012) and the judicial deposit amounts to R$33,12146,193 (R$33,12146,193 as of December 31, 2010)2012).
§On-the-job accident insuranceIII - SATOther
The Company is challenging in court the increase in the SAT rate from 1% to 3% (first lawsuit), and is also challenging the increase in SAT for purposes of the Special Retirement Contribution, which was set at 6%, according to legislation applicable to employees exposed to toxic material (second lawsuit).
FS-57
As regards the first lawsuit mentioned above, the lower court decision was unfavorable and the lawsuit is now being judged by the 2nd Region TRF. With respect to the second lawsuit, its decision was unfavorable to the Company and the amount due in this lawsuit, R$33,077, was deposited in court, in favor of the INSS (National Institute of Social Security).
The accrued amount as of December 31, 2011 totals R$61,536 (R$59,024 as of December 31, 2010), which includes legal charges and refers exclusively to the lawsuit related to the increase from 1% to 3% for all the Company’s locations and its subsidiary Cia Metalúrgica Prada’s locations.
In view of the likelihood of loss in this court challenge, the CSN Board of Directors approved including the amount relating to this matter in the installment payment program under Law 11941/2009.Due to joining the REFIS and waiver of the lawsuit challenging the rate increase from 1% to 3%, CSN included the unassessed period in the Ordinary Installment Payment Program, in 60 stallments.
§IPI export premium credit
The tax legislation allowed Brazilian companies to recognize a federal VAT (IPI) premium credit until 1983, when by executive order from the government these benefits were cancelled and it was no longer permitted to utilize these credits.
The Company challenged the constitutionality of this act and filed a lawsuit claiming the right to utilize the IPI premium credit on exports from 1992 to 2002, since only laws passed by the legislature can cancel or revoke benefits granted by past legislation.
On August 13, 2009, the STF rendered a decision, with general repercussion, determining that the IPI premium credit was only in effect through October 1990.Accordingly, the credits accrued after 1990 were not recognized and, in view of this STF decision, the Company’s Board of Directors approved including this matter in the tax recovery program for tax debts introduced by Provisional Measure 470/09 and Law 11941/09, which entails benefits in terms of reduction of fines, interest and legal charges.
The Company maintained a provision for the amount of the credits already offset, plus late payment charges through September 30, 2009.The new amount of debt after application of the reductions prescribed in the program under Law 11941/09 was offset against the judicial deposits related to these lawsuits, resulting in excess deposits in the amount of R$516 million after application of the REFIS reductions, which can be refunded.
The debts under Provisional Measure (MP) 470/09 were paid in 12 installments as from November 2009, with the last four installments being replaced by the use of the income tax and social contribution tax loss carryforwards, in the manner provided by relevant legislation.
§Other
The Company has also recognized provisions for lawsuits relating to INSS, FGTS Complementary Law 110, COFINS Law 10833/03, PIS Law 10637/10,637/02 and PIS/COFINS –- Manaus Free Trade Zone, totaling R$90,703101,331 as of December 31, 20113012 (R$84,36797,157 as of December 31, 2010)2012), which includes legal charges.
With respect tob) Payroll and related taxes
As of December 31, 2013, the COFINS Law 10833/03 debt, the Board of Directors approved inclusion of the related amountsGroup is a defendant in the tax recovery program under Law 11941/09.The Company maintained9,067 labor lawsuits, for which a provision for the amount of these credits already offset, plus late payment charges through September 30, 2009.
The new amount of debts after application of the reductions allowed under the program of Law 11941/09 was offset against judicial deposits related to these lawsuits, resulting in excess depositshas been recorded in the amount of R$9,141 after application251,376 (R$219,842 as of December 31, 2012). Most of the REFIS reductions,claims relate to subsidiary and/or joint liability, salary equalization, health hazard premiums and hazardous duty premiums, overtime pay, difference in the 40% fine for the severance pay fund (FGTS) as a result of federal government economic plans, health care plan, indemnity claims resulting from alleged occupational diseases or on-the-job accidents, breaks between working hours, and differences in profit sharing from 1997 to 1999 and from 2001 to 2003.
c) Civil lawsuits
Among the civil lawsuits in which may be refunded.the Company is a defendant are claims for compensation. Generally these lawsuits result from on-the-job accidents, occupational diseases and contractual litigation related to the industrial activities of the Group, real estate actions, healthcare plan, and reimbursement of costs incurred in labor courts. For lawsuits involving civil matters, a provision has been recognized in the amount of R$82,143 as of December 31, 2013 (R$96,705 as of December 31, 2012).
d) Other
FS-58
§ Competition
On June 14, 2010, the Regional Federal Court of Brasília rejected the annulment action filed by CSN against CADE, (The Anti-Trust Board), which aimed at annulling its fine for the alleged infringements laid down in Articles 20 and 21, I, of Law 8884/1984.The8,884/1984. The Company filed appropriate appeals against this decision, which were dismissed, resulting in the filing of a Motion for Clarification,clarification, which is pending judgment. The collection of the R$65,292 fine is suspended by a Court decision, which stays the collection as from the date CSN issued a guarantee letter. This actionproceeding is classified as risk of possible loss.
§ Environmental
The environmental administrative/judicial proceedings filed against the Company include mainly administrative proceedings for alleged environmental irregularities and the regularization of environmental permits; at the judicial level, the Company is a party to actions collecting the fines imposed for such alleged environmental irregularities andpublic civil actions claimclaiming regularization coupled with compensation, in most cases claiming environmental recovery. In general these proceedings arise from alleged damages to the environment related to the Company’s industrial activities. The environmental proceedings total R$6,9064,262 (R$5007,056 as of December 31, 2010)2012).
FS-56
table of contents
In July 2012 the Company received a legal notice in the lawsuit filed by the State Attorney's Office of the State of Rio de Janeiro, related to Volta Grande IV district in the city of Volta Redonda-RJ, claiming, among others, the removal of two industrial waste cells and 750 (seven hundred and fifty) homes. This lawsuit is classified as probable loss risk, but there is not an estimated amount due to the illiquidity of the claims.
As a result of the lawsuit mentioned in the paragraph above, after August 2012 the Company received legal notices related to some lawsuits filed by one of the dwellers of the Volta Grande IV district, who claims the payment of compensation for property damages and pain and suffering, whose amounts are illiquid at the moment, and this lawsuit is classified as possible loss risk.
On the same matter (Bairro Volta Grande IV), in August 2013 the Company received a subpoena about the lawsuits filed by the Federal Public Prosecution Office (Federal Courts), which has the same claim of the lawsuit filed by the State Public Prosecution Office, described above. This new lawsuit is classified with a possible level of risk, since the trend is that the State courts’ decision prevails also in the Federal courts. The risk amount in this new lawsuit is the same of the lawsuit filed by the State Public Prosecution Office.
§ Arbitration Other administrative and judicial proceedings
RefersThe Group is a defendant in other administrative and judicial proceedings (tax, social security, labor, civil, and environmental), in the approximate amount of R$12,370,964, of which
(a)R$6,525,528 refers to the tax assessment notice issued against the Company for an arbitration proceedingalleged sale of 40% of the shares of its subsidiary NAMISA to a Japanese-Korean consortium, thus failing to determine and pay taxes on the capital gain resulting from this transaction, and in May 2013, the São Paulo -SP Regional Judgment Office (first administrative court) issued a favorable decision to the Company and cancelled the tax assessment notice. In light of this decision, an ex-officio appeal was filed that will be judged by the Administrative Board of Tax Appeals (CARF);
(b)R$680,546 refers to execution proceedings filed against us to require the ICMS allegedly levied on the electricity acquired by our Steel Plant, which is fully consumed in manufacturing steel products. The tax authorities argue that the use of electricity in the production process as an input does not preclude its taxation by the ICMS.
(c)R$533,890 refers to the offset of taxes that were not approved by the Federal Revenue Service (FRS) for certain reasons. The taxes involved are CSLL, IRPJ, IPI, PIS and COFINS. It is our understanding that we have enough documentation to make evidence that we were duly entitled to the offset at the time.
(d)R$417,537 refers to a decision of the Federal Revenue Service (FRS) that partially denied to us certain benefits granted by the Provisional Measure nº470 (a tax recovery program) based on the grounds that we had not enough tax losses to pay the certain of that program installments. The FRS disallowed those loses based on the rational that they had already been used in the taxation, in Brazil, of our foreign subsidiaries’ profits, which is a domestic tax regime of foreign subsidiaries contested by us.
(e)R$330,421 refers to the disallowance of the ICMS tax credits claimed by the Company between April of 1999 and September of 2002. The matter under dispute relates to the proper tax bases to be applied in the interstate transfer of iron ore from our Casa de Pedra mine to our Presidente Vargas Steel Plant. In accordance with the ICC for the purpose of determining possible damages due to breach of contract,tax authorities in the estimated amountState of R$84,323 (US$53.0 million).The proceedingRio de Janeiro (location of the Steel Plant), the tax bases used by us in the State of Minas Gerais (location of Casa de Pedra) is at initial arguments presentationnot in compliance with the regulation in Rio de Janeiro, then the excess of credits appropriated in the transfer was not to be admitted in Rio de Janeiro.
(f)R$260,321 refers to the tax assessments issued against us to disallow the credits of ICMS transferred to us in acquisition of certain branches of our subsidiary INAL in Rio de Janeiro. According to the tax authorities, the acquisition of a company’s branch does not entitle the buyer to the ICMS credits owned by target branch. In viewof assessment, the Company filed a writ of mandamus to claim its right to proceed with this transfer, which had a final favorable decision in the Judiciary Courts. This favorable decision favors our case in the Administrative Court of Appeals of the State of Rio de Janeiro.
FS-57
(g)R$2,153,777 refers to other tax lawsuits (federal, state, and documentary evidence stage. This proceeding is classifiedmunicipal).
(h)R$1,044,079 refers to labor and social security lawsuits; R$350,218 refers to civil lawsuits, and R$74,647 to environmental lawsuits.
The assessments made by legal counsel define these administrative and judicial proceedings as entailing risk of possible loss.loss and, therefore, no provision was recorded in conformity with management’s judgment and accounting practices adopted in Brazil.
20.18. PROVISIONSPROVISION FOR ENVIRONMENTAL LIABILITIES ANDDECOMMISSIONING OF ASSETS ASSET RETIREMENT OBLIGATION
The balance of the provision for environmental liabilities and decommissioning of assets is as follows:
| | | |
| | 12/31/2013 | | 12/31/2012 |
Environmental liabilities | 346,455 | | 383,405 |
Asset retirement obligation - ARO | 23,999 | | 21,292 |
| 370,454 | | 404,697 |
a) Environmental liabilities
As ofDecember 31, 2011,2013, a provision is recognized in the amount of R$312,612 (R$278,106 as of December 31, 2010)maintained for expenditures relating to environmental investigation and recovery services for potentially contaminated areas surrounding establishments in the States of Rio de Janeiro, Minas Gerais and Santa Catarina. Estimated expenditures will be reviewed periodically and the amounts already recognized will be adjusted whenever needed. These are management’s best estimates considering recovery studies in areas that have been degraded and are in the process of being used for activities. These provisions areThis provision is recognized in operating expenses.
The provisions areprovision is measured at the present value of the expenditures required to settle the obligation, using a pretax rate that reflects current market assessments of the time value of money and the specific risks of the obligation. The increase in the obligation due to passage of time is recognized as other operating expenses.
The long-term interest rate used to discount to present value and update the provision through December 31, 2011 is2013 was 11.00%.The. The liability recognized is periodically updated based on these discount rates plus the general market price index (IGPM) for the period.
b) Decommissioning of AssetsAsset retirement obligation - ARO
Obligations on decommissioning of assetsARO consist of estimated costs for decommissioning, retirement or restoration of areas upon the termination of activities related to mining resources. The initial measurement is recognized as a liability discounted to present value and subsequently through increase in expenses over time. The asset decommissioning cost equivalent to the initial liability is capitalized as part of the carrying amount of the asset, being depreciated over the useful life of the asset.
19.RELATED-PARTY BALANCES AND TRANSACTIONS
a)Transactions with Holding Company
Vicunha Siderurgia S.A. is a holding company set up for the purpose of holding equity interests in other companies and is the Company’s main shareholder, with 47.86% of the voting shares.
Rio Iaco Participações S.A. holds 3.99% of CSN.
FS-58
·Liabilities
| | | | | | | |
Companies | | Proposed | | Paid |
| | Dividends | | Dividends | | Interest on capital |
Vicunha Steel | | | | 435,482 | | 358,921 |
Rio Iaco | | | | 36,319 | | 29,934 |
Total at 12/31/2013 | | | | 471,801 | | 388,855 |
Total at 12/31/2012 | | 155,537 | | 622,164 | | |
Vicunha Siderurgia’s corporate structure is as follows (unaudited information):
Vicunha Aços S.A. – holds 99.99% of Vicunha Siderurgia S.A.
Vicunha Steel S.A. – holds 66.96% of Vicunha Aços S.A.
National Steel S.A. – holds 33.04% of Vicunha Aços S.A.
CFL Participações S.A. – holds 40% of National Steel S.A. and 39.99% of Vicunha Steel S.A.
Rio Purus Participações S.A. – holds 60% of National Steel S.A. 59.99% of Vicunha Steel S.A. and 99.99% of Rio Iaco Participações S.A.
b)Transactions with jointly controlled entities, associates, exclusive funds and other related parties
·By transaction
| | | Assets | | Liabilities |
| | Current | | Non-current | | Total | | Current | | Non-current | | Total |
| | | | | | |
Assets | | | | | | | | | | | | |
Trade receivables | | 107,443 | | | | 107,443 | | | | | | |
Loans | | 147,273 | | 603,862 | | 751,135 | | | | | | |
Dividends receivable | | 717,595 | | | | 717,595 | | | | | | |
Actuarial asset | | | | 97,051 | | 97,051 | | | | | | |
Other receivables | | 15,658 | | 18,129 | | 33,787 | | | | | | |
| | 987,969 | | 719,042 | | 1,707,011 | | | | | | |
Liabilities | | | | | | | | | | | | |
Other payables | | | | | | | | | | | | |
Accounts payable | | | | | | | | 600 | | 618 | | 1,218 |
Advances from customers(1) | | | | | | | | 421,550 | | 8,522,067 | | 8,943,617 |
Trade payables | | | | | | | | 52,949 | | | | 52,949 |
Actuarial liability | | | | | | | | | | 11,139 | | 11,139 |
| | | | | | | | | 475,099 | | 8,533,824 | | 9,008,923 |
Total at 12/31/2013 | | 987,969 | | 719,042 | | 1,707,011 | | 475,099 | | 8,533,824 | | 9,008,923 |
Total at 12/31/2012 | | 1,208,633 | | 418,760 | | 1,627,393 | | 715,422 | | 7,845,506 | | 8,560,928 |
| | | | | | | | | | | | |
| | | Statement of Income | | | | | | | | | | |
Revenues | | | | | | | | | | | | |
Sales | | 862,004 | | | | | | | | | | |
Interest | | 25,576 | | | | | | | | | | |
Expenses | | | | | | | | | | | | |
Purchases | | -917,469 | | | | | | | | | | |
Interest | | -421,659 | | | | | | | | | | |
Total at 12/31/2013 | | 451,548 | | | | | | | | | | |
Total at 12/31/2012 | | 67,354 | | | | | | | | | | |
| | | | | | | | | | | | | |
FS-59
a.Advance from customer received from the jointly controlled entity Nacional Minérios S.A. Refers to the contractual obligation of supply of iron ore and port services. The liability recognizedcontract is subject to interest rate of 12.5% p.a. and expires in September 2042.
·By company
| | | Assets | | Liabilities | | Statement of Income |
| | Current | | Non-current | | Total | | Current | | Non-current | | Total | | Sales | | Purchases | | Finance income and costs, net | | Total |
| | | | | | | | | | |
Parent Company | | | | | | | | | | | | | | | | | | | | |
Vicunha Steel S.A. | | | | | | | | | | | | | | | | | | (1,849) | | (1,849) |
| | | | | | | | | | | | | | | | | | -1,849 | | -1,849 |
Subsidiaries | | | | | | | | | | | | | | | | | | | | |
Ferrovia Transnordestina Logística S.A.(1) | | 60,498 | | 45,216 | | 105,714 | | | | | | | | | | | | -62 | | -62 |
| | | 60,498 | | 45,216 | | 105,714 | | | | | | | | | | | | -62 | | -62 |
Jointly controlled entities | | | | | | | | | | | | | | | | | | | | |
Nacional Minérios S.A. | | 797,939 | | 321,466 | | 1,119,405 | | 422,150 | | 8,522,685 | | 8,944,835 | | 357,731 | | -3,519 | | -394,456 | | -40,244 |
MRS Logística S.A. | | 30,635 | | | | 30,635 | | 43,194 | | | | 43,194 | | | | -555,261 | | | | -555,261 |
Transnordestina Logística S.A(2) | | 33,431 | | 237,262 | | 270,693 | | | | | | | | 46 | | | | -883 | | -837 |
CBSI - Companhia Brasileira de Serviços e Infraestrutura | | 4,899 | | 8,363 | | 13,262 | | 6,056 | | | | 6,056 | | | | -122,348 | | | | -122,348 |
CGPAR Construção Pesada S.A. | | 546 | | 9,236 | | 9,782 | | 3,677 | | | | 3,677 | | | | -200,689 | | | | -200,689 |
| | 867,450 | | 576,327 | | 1,443,777 | | 475,077 | | 8,522,685 | | 8,997,762 | | 357,777 | | -881,817 | | -395,339 | | -919,379 |
Other related parties | | | | | | | | | | | | | | | | | | | | |
CBS Previdência | | | | 97,051 | | 97,051 | | 8 | | | | 8 | | | | -13,392 | | | | -13,392 |
Fundação CSN | | 320 | | 448 | | 768 | | 14 | | 11,139 | | 11,153 | | | | -1,983 | | 83 | | -1,900 |
Usiminas | | 18,112 | | | | 18,112 | | | | | | | | 50,722 | | -8,355 | | | | 42,367 |
Panatlântica | | 28,619 | | | | 28,619 | | | | | | | | 453,505 | | | | | | 453,505 |
Ibis Participações e Serviços | | | | | | | | | | | | | | | | -9,717 | | | | -9,717 |
Companhia de Gás do Ceará | | | | | | | | | | | | | | | | -2,205 | | | | -2,205 |
| | 47,051 | | 97,499 | | 144,550 | | 22 | | 11,139 | | 11,161 | | 504,227 | | -35,652 | | 83 | | 468,658 |
Associates | | | | | | | | | | | | | | | | | | | | |
Arvedi Metalfer do Brasil S.A. | | 12,970 | | | | 12,970 | | | | | | | | | | | | 1,084 | | 1,084 |
Total at 12/31/2013 | | 987,969 | | 719,042 | | 1,707,011 | | 475,099 | | 8,533,824 | | 9,008,923 | | 862,004 | | -917,469 | | -396,083 | | -451,548 |
Total at 12/31/2012 | | 1,208,633 | | 418,760 | | 1,627,393 | | 715,422 | | 7,845,506 | | 8,560,928 | | 563,203 | | -300,589 | | -329,968 | | -67,354 |
1.Refers to loans of the subsidiary FTL – Ferrrovia Transnordestina Logísitca S.A. to the jointly controlled entity Transnordestina Logística S.A.
2.Transnordestina Logística S.A. contracts in Brazilian reais: interest equivalent to 102.5% of the CDI with final maturity in December 2015. As of December 31, 2013, borrowings total R$270,693 (R$210,966 as of December 31, 20112012), of which R$33,431 is classified in short term and R$24,327 (R$17,421237,262 is classified in long term.
c)Other unconsolidated related parties
·CBS Previdência
The Company is the main sponsor of this non-profit entity established in July 1960, primarily engaged in the payment of benefits that supplement the official government Social Security benefits to participants. In its capacity as sponsor, CSN carries out transactions involving the payment of contributions and recognition of actuarial liabilities calculated in defined benefit plans, as detailed in note 28.
·Fundação CSN
The Company develops socially responsible policies concentrated today in Fundação CSN, of which it is the founding. The transactions between the parties relate to the operating and financial support for Fundação CSN to carry out the social projects undertaken mainly in the locations where the Company operates.
·Banco Fibra
FS-60
Banco Fibra is under the control structure of Vicunha Siderurgia and the financial transactions carried out with this bank are limited to current account operations and investments in fixed-income securities.
·Ibis Participações e Serviços Ltda.
Ibis Participações e Serviços is under the control of a Board member of the Company.
·Companhia de Gás do Ceará
A natural gas distributor under the control structure of Vicunha Siderurgia.
(f)Key management personnel
The key management personnel, who have authority and responsibility for planning, directing and controlling the Company’s activities, include the members of the Board of Directors and statutory directors. The following is information on the compensation of such personnel and the related balances as of December 31, 2010).2013.
| | | 12/31/2013 | | 12/31/2012 |
| | | Statement of Income |
Short-term benefits for employees and officers | | 29,540 | | 30,539 |
Post-employment benefits | | 118 | | 115 |
Other long-term benefits | | n/a | | n/a |
Severance benefits | | n/a | | n/a |
Share-based compensation | | n/a | | n/a |
| | | 29,658 | | 30,654 |
n/a – not applicable
21.(g) SHAREHOLDERS´Policy on investments and payment of interest on capital and dividends
At a meeting held on December 11, 2000, the Board of Directors decided to adopt a profit distribution policy which, after compliance with the provisions contained in Law 6,404/76, as amended by Law 9,457/97, will entail the distribution of all the profit to the Company’s shareholders, provided that the following priorities are preserved, irrespective of their order: (i) carrying out the business strategy; (ii) fulfilling its obligations; (iii) making the required investments; and (iv) maintaining a healthy financial situation of the Company.
20.SHAREHOLDERS' EQUITY
FS-59
i. IssuedPaid-in capital
Fully subscribed and paid-in capital as of December 31, 20112012 and 2013 is R$1,680,947 (R$1,680,947 as of December 31, 2010)4,540,000 represented by 1,457,970,108 (1,483,033,685 as of December 31, 2010) book-entry common shares without par value. Each common share entitles its holder to one vote in Shareholders’ Meetings. The Extraordinary Shareholders´ Meeting held on March 25, 2010 approved the stock split, at the ratio of one (1) common share for each two (2) shares.
ii.AuthorizedII. Authorized capital
The Company’s bylaws in effect as of December 31, 20112013 determine that the capital can be raised to up to 2,400,000,000 shares by decision of the Board of Directors.
iii.LegalIII. Legal reserve
This reserve is recognized at the rate of 5% of the profit for each period, as provided for by Article 193 of Law 6404/76.This reserve6,404/76, up to the ceiling as prescribed by prevailing legislation, has already been reached.of 20% of share capital.
FS-61
table of contents
iv.TreasuryIV.Treasury shares
As of December 31, 2011,2013, the Company did not have any treasury shares. On August 2, 2011, the Company approved the cancelation of 25,063,577 existing treasury shares without decreasing capital.
v. Ownership structure
As ofDecember 31, 2011,2013, the Company’s ownership structure was as follows: follows:
| | | | | | | | | | | | | |
| | | 12/31/2011 | | 31/12/2010 |
| | | Quantity ofordinary shares | | % total ofshares | | % withouttreasury shares | | Quantity of ordinary shares | | % total ofshares | | % without treasuryshares |
| Vicunha Siderurgia S.A. | | 697,719,990 | | 47.86% | | 47.86% | | 697,719,990 | | 47.05% | | 47.86% |
| Rio Iaco Participações S.A. (*) | | 58,193,503 | | 3.99% | | 3.99% | | 58,193,503 | | 3.92% | | 3.99% |
| Caixa Beneficente dos Empregados da CSN - CBS | | 12,788,231 | | 0.88% | | 0.88% | | 12,788,231 | | 0.86% | | 0.88% |
| BNDESPAR | | 31,773,516 | | 2.18% | | 2.18% | | 31,773,516 | | 2.14% | | 2.18% |
| NYSE - ADRs | | 373,772,695 | | 25.64% | | 25.64% | | 358,913,048 | | 24.20% | | 24.62% |
| BOVESPA | | 283,722,173 | | 19.45% | | 19.45% | | 298,581,820 | | 21.83% | | 20.47% |
| | | 1,457,970,108 | | 100.00% | | 100.00% | | 1,457,970,108 | | 98.31% | | 100.00% |
| Treasury stock | | | | | | | | 25,063,577 | | 1.69% | | |
| Total shares | | 1,457,970,108 | | 100.00% | | | | 1,483,033,685 | | 100.00% | | |
| | | | | 12/31/2013 | | | | 12/31/2012 |
| | | Number of common shares | | % of total shares | | Number of common shares | | % of total shares |
Vicunha Siderurgia S.A. | | 697,719,990 | | 47.86% | | 697,719,990 | | 47.86% |
Rio Iaco Participações S.A. (*) | | 58,193,503 | | 3.99% | | 58,193,503 | | 3.99% |
Caixa Beneficente dos Empregados da CSN - CBS | | 12,788,231 | | 0.88% | | 12,788,231 | | 0.88% |
BNDES Participações S.A. - BNDESPAR | | 8,794,890 | | 0.60% | | 27,509,316 | | 1.89% |
NYSE (ADRs) | | 356,019,691 | | 24.42% | | 342,997,950 | | 23.53% |
BM&FBovespa | | 324,453,803 | | 22.25% | | 318,761,118 | | 21.85% |
| | 1,457,970,108 | | 100.00% | | 1,457,970,108 | | 100.00% |
(*) Rio Iaco Participação S. A. is a company part of the control group.
vi. Changes in outstanding shares
| | | | | |
| | | | | |
| | | Number of shares | | Treasury shares |
| Balance at December 31,2009 | | 1,457,970,108 | | 52,389,112 |
| Cancelation of shares | | | | (27,325,535) |
| Balance at December 31,2010 | | 1,457,970,108 | | 25,063,577 |
| Cancellation of shares | | | | (25,063,577) |
| Balance at December 31,2011 | | 1,457,970,108 | | |
22.21. PAYMENT TO SHAREHOLDERS
FS-60
| | 12/31/2013 |
Profit for the year | | 509,025 |
Legal reserve | | -25,451 |
Reversal of statutory working capital reserve | | 316,426 |
Profit for allocation | | 800,000 |
| | |
Allocation: | | |
Dividends distributed on 08/06/2013 and 11/13/2013 | | 610,000 |
Interest on capital distributed on 8/6/2013 and 11/13/2013 | | 190,000 |
Total dividends and interest on capital | | 800,000 |
| | | |
| | 12/31/2011 |
Profit for the year | | 3,706,033 |
Reversion of prior year unrealized earnings reserve
| | 3,779,357 |
Basic profit used to determine dividends | | 7,485,390 |
|
Proposed allocation: | | |
Statutory reserve (working capital) (*)
| | (5,717,390) |
Investment reserve
| | (568,000) |
Total allocation to reserves
| | (6,285,390) |
Proposed dividends
| | (1,200,000) |
Total proposed dividends
| | (1,200,000) |
| Weighted average number of shares | | 1,457,970 |
Dividends and interest on capital per share | | 0,8231 0.54871 |
|
Additional information: | | |
Mandatory minimum dividends for the year (**)Additional information:
| | | 926,508 |
Dividends from previous years Prior years’ dividends payable
| | 1,373 2,036 |
Dividends payable (balance in liabilities) |
| 927,8812,036
|
(*) The Annual General Meeting shall decide on the allocation of excess of the Reserve.
(**) CSN’s bylaws require the distribution of mandatory minimum dividends of 25% of the net income after the deduction of the legal reserves.
23.22. NET SALES REVENUE
Net sales revenue areis comprised as follows:
| | | | | | | |
| | | 12/31/2011 | | 12/31/2010 | | 12/31/2009 |
| Gross revenue | | | | | | |
Domestic market | | 13,366,345 | | 13,201,074 | | 10,488,409 |
Foreign market | | 6,417,397 | | 4,270,333 | | 3,197,187 |
| | | 19,783,742 | | 17,471,407 | | 13,685,596 |
| Deductions | | | | | | |
Cancelled sales and discounts granted | | (257,888) | | (416,706) | | (462,954) |
Taxes levied on sales | | (3,006,270) | | (2,604,191) | | (2,244,278) |
| | | (3,264,158) | | (3,020,897) | | (2,707,232) |
| Net revenue | | 16,519,584 | | 14,450,510 | | 10,978,364 |
| | | 12/31/2013 | | 12/31/2012 | | 12/31/2011 (*) |
Gross revenue | | | | | | |
Domestic market | | 14,635,703 | | 13,742,201 | | 13,366,345 |
Foreign market | | 6,143,242 | | 4,813,693 | | 6,417,397 |
| | 20,778,945 | | 18,555,894 | | 19,783,742 |
Deductions | | | | | | |
Cancelled sales and discounts | | -206,109 | | -312,687 | | -257,888 |
Taxes levied on sales | | -3,260,404 | | -3,014,618 | | -3,006,270 |
| | -3,466,513 | | -3,327,305 | | -3,264,158 |
Net revenue | | 17,312,432 | | 15,228,589 | | 16,519,584 |
(*) As disclosed in notes 2(y) and3, the financial information related to 12/31/11 was not restated by the adoption of the IFRS 10 and 11, as allowed by the IFRS 10 and 11’s relief.
FS-62
24.23. EXPENSES BY NATURE
| | | 12/31/2013 | | 12/31/2012 | | 12/31/2011(*) |
Raw materials and inputs | | -5,998,881 | | -5,734,685 | | -3,927,105 |
Labor cost | | -1,590,892 | | -1,482,838 | | -1,647,545 |
Supplies | | -1,145,772 | | -979,894 | | -1,084,440 |
Maintenance cost (services and materials) | | -1,297,377 | | -1,018,545 | | -969,376 |
Outsourcing services | | -2,117,701 | | -1,521,275 | | -1,981,025 |
Depreciation, amortization and depletion (Note 10 b) | -1,093,830 | | -1,085,733 | | -929,368 |
Other | | -538,218 | | -677,105 | | -441,678 |
| | | -13,782,671 | | -12,500,075 | | -10,980,537 |
| | | | | | | |
Classified as: | | | | | | |
Cost of sales (Note 26) | | -12,422,706 | | -11,258,667 | | -9,800,844 |
Selling expenses (Note 26) | | -874,875 | | -773,488 | | -604,108 |
General and administrative expenses (Note 26) | | -485,090 | | -467,920 | | -575,585 |
| | -13,782,671 | | -12,500,075 | | -10,980,537 |
FS-61
| | | | | | | |
| | | 12/31/2011 | | 12/31/2010 | | 12/31/2009 |
| Raw Material | | (3,927,105) | | (3,245,396) | | (1,907,607) |
| Labor cost | | (1,647,545) | | (1,226,087) | | (1,086,005) |
| Consumable materials | | (1,084,440) | | (1,061,012) | | (907,844) |
| Maintenance cost | | (969,376) | | (856,297) | | (691,905) |
| Outsourcing services | | (1,981,025) | | (1,542,638) | | (1,577,641) |
| Depreciation, Amortization and Depletion | | (925,790) | | (808,215) | | (770,068) |
| Others (*) | | (445,256) | | (161,916) | | (1,196,905) |
| | | (10,980,537) | | (8,901,561) | | (8,137,975) |
| Rated: | | | | | | |
Cost of sales and/or services | | (9,800,844) | | (7,882,726) | | (7,210,774) |
Selling expenses | | (604,108) | | (481,978) | | (447,129) |
General and administrative expenses | | (575,585) | | (536,857) | | (480,072)�� |
| | | (10,980,537) | | (8,901,561) | | (8,137,975) |
(*) Include increase/reductionAs disclosed in finished goodsnotes 2(y) and in work in process.3, the financial information related to 12/31/11 was not restated by the adoption of the IFRS 10 and 11, as allowed by the IFRS 10 and 11’s relief.
25.24. OTHER OPERATING INCOME (EXPENSES)
| | | | | | | |
| | | 12/31/2011 | | 12/31/2010 | | 12/31/2009 |
| Other operating expenses | | | | | | |
Taxes and fees | | (37,499) | | (81,394) | | (109,753) |
Effect of REFIS - Law 11941/09 and MP 470/09 | | (16,119) | | (8,444) | | |
Provision for contingencies and net losses on reversals | | (75,823) | | (182,761) | | (297,695) |
Contractual and nondeductible fines | | (45,537) | | (155,445) | | (46,882) |
Fixed cost of equipment stoppages | | (33,674) | | (21,213) | | (34,198) |
Write-off of obsolete assets | | (85,120) | | (32,098) | | (99,457) |
Expenses on studies and project engineering | | (42,050) | | (21,142) | | (6,385) |
Pension plan (Note 29 c) | | (67,276) | | (63,110) | | |
Impairment loss adjustment | | (60,861) | | | | (23,137) |
Healthcare plan (Note 29 d) | | (37,343) | | (33,817) | | (30,257) |
| | | (501,302) | | (599,424) | | (647,764) |
Other operating income | | | | | | |
Sale of Riversdale shares (Note 11) | | 698,198 | | | | |
Gain on acquisition of "precatórios" | | | | 15,595 | | |
PIS/COFINS/ICMS untimely credits | | | | 32,739 | | |
Dividends received from third parties | | 14,199 | | | | |
Other income | | 6,780 | | 487 | | 863,297 |
| | | 719,177 | | 48,821 | | 1,368,594 |
| Other operating (expenses) income | | 217,875 | | (550,603) | | 720,830 |
| | | 12/31/2013 | | 12/31/2012 | | 12/31/2011(*) |
Other operating income | | | | | | |
Sale of Riversdale shares (Note 9) | | | | | | 698,164 |
Untimely PIS/COFINS/ICMS credits | | 404 | | 26,860 | | |
Reversal of actuarial liability/provision for actuarial asset | | 985 | | 43,749 | | |
Lawsuit indemnities/wins | | 51,737 | | 20,567 | | |
Rentals and leases | | 817 | | 2,645 | | |
Reversal of provisions | | 7,120 | | 1,953 | | 3,091 |
Gain on loss of control over Transnordestina (Note 9) | | 473,899 | | | | |
Other revenues | | 31,101 | | 15,127 | | 17,922 |
| | 566,063 | | 110,901 | | 719,177 |
| | | | | | | |
Other operating expenses | | | | | | |
Taxes and fees | | -103,446 | | -72,999 | | -37,499 |
Provision for tax, social security, labor, civil and environmental risks,
net of reversals | -255,527 | | -295,665 | | -75,823 |
Contractual, nondeductible fines | | -6,479 | | -61,439 | | -45,537 |
Depreciation of unused equipment (Note 10 b) | | -61,763 | | -14,739 | | -33,674 |
Residual value of permanent assets written off (Note 10) | | -31,660 | | -9,759 | | -62,917 |
Inventory impairment losses/reversals (Note 7) | | 5,975 | | -13,210 | | -22,203 |
Expenses on studies and project engineering | | -95,688 | | -58,080 | | -42,050 |
Pension plan expenses | | | | -5,256 | | -62,313 |
Healthcare plan expenses | | -55,720 | | -51,234 | | -42,306 |
Impairment loss adjustment | | -48,469 | | | | -60,861 |
Impairment of available-for-sale security | | -5,002 | | -2,022,793 | | |
REFIS effect - Law 11,941/09 and Law 12,865/13, net | | -129,743 | | | | -16,119 |
Impairment of the Transnordestina old railway network (Note 10) | | -216,446 | | | | |
Other expenses | | -130,240 | | -157,108 | | |
| | -1,134,208 | | -2,762,282 | | -501,302 |
Other operating income (expenses), net | | -568,145 | | -2,651,381 | | 217,875 |
(*) As disclosed in notes 2(y) and 3, the financial information related to 12/31/11 was not restated by the adoption of the IFRS 10 and 11, as allowed by the IFRS 10 and 11’s relief.
FS-63
26.25. FINANCE INCOME (COSTS)
| | | 12/31/2013 | | 12/31/2012 | | 12/31/2011(*) |
Finance income | | | | | | |
Related parties (Note 19 b) | | 25,576 | | 68,023 | | 29,300 |
Income from short-term investments | | 125,685 | | 177,328 | | 538,882 |
Net effect of REFIS - Law 11,941/09 and MP 470/09 | | | | 115,457 | | |
Other income | | 20,723 | | 31,036 | | 149,268 |
| | | 171,984 | | 391,844 | | 717,450 |
Finance costs | | | | | | |
Borrowings and financing - foreign currency | | -743,276 | | -675,379 | | -639,197 |
Borrowings and financing - local currency | | -1,559,312 | | -1,531,514 | | -1,622,365 |
Related parties (Note 19 b) | | -421,659 | | -397,991 | | -389,059 |
Capitalized interest (Notes 10 and 32) | | 490,747 | | 401,827 | | 353,156 |
Losses on derivatives (*) | | -21,643 | | -9,166 | | -20,594 |
REFIS effect - Law 11,941/09 and Law 12,865/13, net | | -277,032 | | | | -77,335 |
Interest, fines and late payment charges | | -72,065 | | -157,277 | | -264,359 |
Other finance costs | | -135,500 | | -178,185 | | -224,168 |
| | | -2,739,740 | | -2,547,685 | | -2,883,921 |
Inflation adjustment and exchange differences, net | | | | | | |
Inflation adjustments | | -37,858 | | -143,774 | | -37,451 |
Exchange differences | | 97,969 | | 152,837 | | 286,074 |
Exchange losses on derivatives (*) | | -3,954 | | -4,573 | | -87,955 |
| | 56,157 | | 4,490 | | 160,668 |
| | | | | | | |
Finance costs, net | | -2,511,599 | | -2,151,351 | | -2,005,803 |
| | | | | | |
(*) Statement of gains and losses on derivative transactions | | | | |
Real-to-dollar swap | | 11,172 | | 8,301 | | -115,490 |
Euro-to-dollar swap | | -13,190 | | -5,116 | | 9,574 |
Yen-to-dollar swap | | -5,374 | | 307 | | 1,460 |
Dollar-to-euro swap | | 4,035 | | -8,065 | | 16,501 |
Fixed rate-to-dollar swap | | -597 | | | | |
| | | -3,954 | | -4,573 | | -87,955 |
Libor-to-CDI swap | | -4,268 | | -9,166 | | -20,594 |
Fixed rate-to-CDI swap | | -17,375 | | | | |
| | -21,643 | | -9,166 | | -20,594 |
| | | -25,597 | | -13,739 | | -108,549 |
FS-62
| | | | | | | |
| | | 12/31/2011 | | 12/31/2010 | | 12/31/2009 |
| Finance costs: | | | | | | |
| Borrowings and financing - foreign currency | | (639,197) | | (641,632) | | (598,849) |
| Borrowings and financing - local currency | | (1,622,365) | | (791,926) | | (277,699) |
| Related parties | | (389,059) | | (374,929) | | (365,150) |
| Capitalized interest | | 353,156 | | 215,624 | | 85,260 |
| PIS/COFINS on other revenues | | (1,230) | | (1,079) | | (1,072) |
| Losses on derivatives (*) | | (20,594) | | (27,252) | | (152,102) |
| Net effect of REFIS - Law 11941/09 and MP 470/09 | | (77,335) | | (33,921) | | 2,336 |
| Interest, fines and late payment charges | | (264,359) | | (283,768) | | (281,190) |
| Other finance costs | | (222,938) | | (261,570) | | (304,049) |
| | | (2,883,921) | | (2,200,453) | | (1,892,515) |
| Finance income: | | | | | | |
| Related parties | | 29,300 | | 53,491 | | 55,750 |
| Income from short-term investments | | 538,882 | | 394,183 | | 276,177 |
| Other income | | 149,268 | | 195,466 | | 254,098 |
| | | 717,450 | | 643,140 | | 586,025 |
| |
| Inflation adjustments: | | | | | | |
| - Assets | | 6,330 | | 271 | | 8,465 |
| - Liabilites | | (43,781) | | (8,714) | | 69,266 |
| | | (37,451) | | (8,443) | | 77,731 |
| Exchange gains (losses): | | | | | | |
| - On assets | | 1,041,200 | | (585,719) | | (295,526) |
| - On liabilities | | (753,666) | | 398,527 | | 995,064 |
| - Exchange gains (losses) on derivatives (*) | | (89,415) | | (158,510) | | 282,786 |
| | | 198,119 | | (345,702) | | 982,324 |
| Inflation adjustment and exchange gains (losses), net | | 160,668 | | (354,145) | | 1,060,055 |
| |
| Finance costs, net | | (2,005,803) | | (1,911,458) | | (246,435) |
| |
| (*) Statement of gains and losses on derivative transactions | | | | | | |
| CDI to USD swap | | (115,490) | | (231,673) | | (581,523) |
| EUR to USD swap | | 9,574 | | (6,763) | | |
| Future US dollar | | | | 79,926 | | (231,563) |
| Total return equity swap | | | | | | 1,026,463 |
| Other | | 16,501 | | (8,388) | | (65,248) |
| | | (89,415) | | (166,898) | | 148,129 |
| Libor to CDI swap | | (20,594) | | (18,864) | | (17,445) |
| | | (20,594) | | (18,864) | | (17,445) |
| | | (110,009) | | (185,762) | | 130,684 |
(*) As disclosed in notes 2(y) and 3, the financial information related to 12/31/11 was not restated by the adoption of the IFRS 10 and 11, as allowed by the IFRS 10 and 11’s relief.
27.26. SEGMENT INFORMATION
FS-64
According to the Company’sGroup’s structure, its businesses are distributed into 5 (five)five (5) operating segments. Accordingly, we analyzed our information by segment as follows:
· Steel
The Steel Segment consolidates all the operations related to the production, distribution and sale of flat steel, metal containerslong steel, metallic packaging and galvanized steel, with operations in Brazil, the United States, Portugal and Portugal.Germany. This segment supplies the following markets: construction, steel packaging for the Brazilian chemical and food industries, home appliances, automobile and OEM (motors and compressors).The. The Company’s steel units produce hothot- and cold rolledcold-rolled steel, galvanized and pre-painted steel of great durability. They also produce tinplate,tin mill, a raw material used to produce metal containers.metallic packaging.
FS-63
Overseas, Lusosider, which is based in Portugal, also produces metal sheets, as well as galvanized steel. CSN LLC in the U.S.A. meets local market needs by supplying cold rolled and galvanized steel. For 2013, itIn January 2012, CSN acquired Stahlwerk Thüringen (SWT), a manufacturer of long steel located in Unterwellenborn, Germany. SWT is slated to beginspecialized in the production of shapes used for construction and has an installed production capacity of 1.1 million metric tons of steel/year.
In January 2014 the production of long steel products. The initial production slated,products started, with capacity of 500,000 metric tons per year, which will consolidate the company as a source of complete construction solutions, complementing its portfolio of products with high added value in the steel chain.
· Mining
This segment encompasses the activities of iron ore and tin mining.mining, The high-quality iron ore operations are located in the Iron Quadrilateral in MG, the Casa de Pedra mine in Congonhas, MG, that produces high quality iron ore, as well as the Company’s subsidiaryjointly controlled entity Nacional Minérios S.A. (Namisa), which has its own mines, also of excellent quality, and also sells third party iron ore. Furthermore, CSN also ownscontrols Estanho de Rondônia S.A. (ERSA), a company that has both tin mining and casting units.
CSN holds the concession to operate TECAR, a solid bulk terminal, one of the four4 (four) terminals that comprise the Itaguaí Port, in Rio de Janeiro. CoalImportations of coal and coke imports are carried out through this terminal.
· Logistics
i. Railroad
CSN has equity interests in twothree railroad companies: MRS Logística, S.A., which manages the former Southeast NetworkRailway System of Rede Ferroviária Federal S.A. (RFFSA), and Transnordestina Logística S.A. and FTL - Ferrovia Transnordestina Logística S.A. , which operatesoperate the former Northeast NetworkRailway System of the RFFSA in the Statesstates of Maranhão, Piauí, Ceará, Rio Grande do Norte, Paraíba, Pernambuco and Alagoas.
a) MRS
The railroad transportation services provided by MRS are based on the supply of raw materials and the shipment of final products. The total amount of iron ore, coal and coke consumed by the Presidente Vargas Mill is carried by MRS, as is part of the steel produced by CSN for the domestic market and for export.
The Southeast Brazilian railroad system, encompassing 1,674 kilometers of tracks, serves the tri-state industrial area of São Paulo-Rio de Janeiro-Minas Gerais, linking the mines located in Minas Gerais to the ports located in São Paulo and Rio de Janeiro, and the steel mills of CSN, Companhia Siderúrgica Paulista (or Cosipa) and Gerdau Açominas. Besides serving other customers, the railroad system carries iron ore from the Company’s mines in Casa de Pedra, Minas Gerais, and coke and coal from the Itaguaí Port, in Rio de Janeiro, to Volta Redonda, and carries CSN’s exportsexport products to the ports of Itaguaí and Rio de Janeiro. Its volumes of cargo carried account for approximately 28% of the total volume carried by the Southeast railroad system.
FS-65
b) Transnordestina LogísticaTLSA and FTL
Together, CSN and the federal government will be making investments for implementation of the Transnordestina Project for construction of around 1,728 km of new lines. The work on this project, slated for conclusionWe hold participations in 2013, further includes complementing and renewing part of the infrastructure (or lines) of the concession held by Transnordestina Logística, which will be expanded from the nearly 2,600 kilometers of track presently operating to around 4,300 kilometers.
Transnordestina Logística S.A. has a 30-year concession granted in 1998companies that have concessions to operate the Northeastern Brazil railroad system. This railway system, covers 4,238 kilometers of railroadswhich operates in the states of Maranhão, Piauí, Ceará, Paraíba, Pernambuco, Alagoas and Rio Grande do Norte. Moreover, it links upNorte and connects with the mainregion’s leading ports, in the region, thus providingoffering an important competitive advantage by means ofthrough opportunities for combinedintermodal transportation solutions and made-to-measure logistics projects tailored to customer needs.projects. The Northeastern railway system is currently divided into the Railway System I, operated by FTL – Ferrovia Transnordestina Logística S.A., and the Railway System II, operated by Transnordestina Logística S.A.
The project underway will increaseAs of December 31, 2013, in compliance with Resolution 4,042/2013 issued by the transportation capacityregulatory agency Agência Nacional de Transportes Terrestres (ANTT) and as a result of a disproportionate spin-off of Transnordestina Logística 20-fold, bringing it up the levelS.A. occurred on December 27, 2013, CSN held 88.41% of the most modern railroads incapital stock of FTL – Ferrovia Transnordestina Logística S.A., which has a concession to operate the entire world.Railway System I (which encompasses the stretches between the cities of São Luís – Mucuripe, Arrojado – Recife, Itabaiana – Cabedelo, Paula Cavalcante – Macau, and Propriá – Jorge Lins) of Brazil’s Northeastern railway system until 2027, renewable for an additional 30 years. The Railway System I consists of 4,238 km of railroads. As of December 31, 2013, R$98 million was outstanding over the remaining 15 years of the concession.
FS-64
With its new configuration,As of December 31, 2013, we held 77.30% of the capital stock of Transnordestina Logística S.A., which has a concession to operate the Railway System II (which encompasses the stretches between Missão Velha – Salgueiro, Salgueiro – Trindade, Trindade – Eliseu Martins, Salgueiro – Porto de Suape and Missão Velha – Porto de Pecém) of Brazil’s Northeastern railway system. Once concluded, the Railway System II will becomehave an extension of 1,728 km of tracks that will connect the best logistics option for exportinterior of grains through theNortheast Brazil to Pecém and Suape ports, as well as other solid bulk cargos such as iron ore fromPorts. This concession has been granted in 1997 and recently had its original term extended to until the Northeast Region, playing an important role inearlier of 2057 or the region’s development.date when Transnordestina Logística S.A. reaches a rate of annual return of 6.75% of its total investment.
See further details on the restructuring of the Nova Transnordestina project in Note 9.
ii.II. Ports
The Port logistics segment consolidates the operation of the terminal built during the post-privatization period of the ports, Sepetiba Tecon.Tecon S.A or TECON. The Sepetiba terminal features complete infrastructure to meet all the needs of exporters, importers and ship-owners. Its installed capacity exceeds that of most other Brazilian terminals. It has excellent depths of 14.5 meters in the mooring berths and a huge storage area, as well as the most modern and appropriate equipment, systems and intermodal connections.
The Company’s constant investment in projects in the terminals consolidates the Itaguaí Port Complex as one of the most modern in Brazil, at present with capacity for handling 480 thousand containers and 30 million metric tons per year of bulk cargo.
· Energy
CSN is one of the largest industrial consumers of electric power in Brazil. As energy is fundamental toin its production process, the Company invests in assets for generation of electric power to guarantee its self-sufficiency. These assets are as follows: Itá hydroelectric power plant,facility, in the State of Santa Catarina, with rated capacity of 1,450 MW, where CSN has a share of 29.5%; Igarapava hydroelectric power plant,facility, Minas Gerais, with rated capacity of 210 MW, in which CSN holds of 17.9% of the capital; and a thermoelectric co-generation Central UnitPower Plant with rated capacity of 238 MW, which has been operating at the UPV since 1999.For1999. For fuel the Central UnitPower Plant uses the residual gases produced by the steel mill itself. Through these three power generation assets, CSN obtains total rated capacity of 430 MW.
· Cement
The cement division consolidates the Company’s cement production, distribution and sales operations, which use the slag produced by the Volta Redonda plant’s blast furnaces. In 2011, the clinker used in cement production is leased was acquiredfrom third parties; however, at the end of 2011, with the completion of the first stage of the Arcos Clinker plant, MG, this plant already supplied the millinggrinding needs of CSN Cimentos in Volta Redonda.
FS-66
The information presented to Management regarding the performance of each business segment is generally derived directly from the accounting records, combined with some intercompany allocations.
· Sales by geographic area
Sales by geographic area are determined based on the customers’ location. DomesticOn a consolidated basis, domestic sales are represented by revenues from customers located in Brazil and export sales are represented by revenues from customers located abroad.
·Profit per segment
As explained in Note 3, beginning 2013, the Company no longer proportionately consolidates jointly controlled entities Namisa, MRS and CBSI.
For segment information preparation and presentation purposes, Management decided to maintain the proportionate consolidation of the jointly controlled entities, as historically presented. For consolidated profit reconciliation purposes, the amounts of these companies were eliminated in the column “Corporate expenses/elimination”.
| | | | | | | | | | | | | | | | | 12/31/2013 |
Profit or loss | | Steel | | Mining | | Logistics | | | | Energy | | Cement | | Corporate
expenses/
elimination | | Consolidated |
| | | | Port | | Railroads | | | | |
Metric tons (thou.) - (unaudited) (*) | | 6,116,944 | | 21,534,147 | | | | | | | | 2,045,862 | | | | |
Net revenues | | | | | | | | | | | | | | | | |
Domestic market | | 9,695,736 | | 679,974 | | 194,842 | | 1,074,216 | | 211,797 | | 415,577 | | -1,025,068 | | 11,247,074 |
Foreign market | | 2,697,471 | | 4,616,754 | | | | | | | | | | -1,248,867 | | 6,065,358 |
Total net revenue (Note 22) | | 12,393,207 | | 5,296,728 | | 194,842 | | 1,074,216 | | 211,797 | | 415,577 | | -2,273,935 | | 17,312,432 |
Cost of sales and services (Note 23) | | -9,961,948 | | -2,829,028 | | -97,488 | | -708,407 | | -161,435 | | -276,752 | | 1,612,352 | | -12,422,706 |
Gross profit | | 2,431,259 | | 2,467,700 | | 97,354 | | 365,809 | | 50,362 | | 138,825 | | -661,583 | | 4,889,726 |
General and administrative expenses (Note 23) | | -738,655 | | -69,364 | | -22,743 | | -100,062 | | -20,384 | | -68,219 | | -340,538 | | -1,359,965 |
Depreciation (Note 10 b) | | 761,086 | | 219,742 | | 7,272 | | 140,551 | | 17,067 | | 30,631 | | -82,519 | | 1,093,830 |
Proportionate EBITDA of jointly controlled entities | | | | | | | | | | | | | | 780,606 | | 780,606 |
Adjusted EBITDA | | 2,453,690 | | 2,618,078 | | 81,883 | | 406,298 | | 47,045 | | 101,237 | | -304,034 | | 5,404,197 |
| | | | | | | | | | | | | | | | | |
| | | | | | | | | | | | | | | | | |
| | | | | | | | | | | | | | | | | 12/31/2013 |
Sales by geographic area | | Steel | | Mining | | Logistics | | | | Energy | | Cement | | Corporate
expenses/
elimination | | Consolidated |
| | | | Port | | Railroads | | | | |
Asia | | 45,105 | | 3,610,625 | | | | | | | | | | | | 3,655,730 |
North America | | 635,749 | | | | | | | | | | | | | | 635,749 |
Latin America | | 153,027 | | | | | | | | | | | | | | 153,027 |
Europe | | 1,839,732 | | 1,006,129 | | | | | | | | | | | | 2,845,861 |
Other | | 23,858 | | | | | | | | | | | | -1,248,867 | | -1,225,009 |
Foreign market | | 2,697,471 | | 4,616,754 | | | | | | | | | | -1,248,867 | | 6,065,358 |
Domestic market | | 9,695,736 | | 679,974 | | 194,842 | | 1,074,216 | | 211,797 | | 415,577 | | -1,025,068 | | 11,247,074 |
TOTAL | | 12,393,207 | | 5,296,728 | | 194,842 | | 1,074,216 | | 211,797 | | 415,577 | | -2,273,935 | | 17,312,432 |
FS-65
FS-67
| | | | | | | | | | | | | | | | | |
| | | 12/31/2011 |
| | | Steel | | Mining | | Logistics | | Energy | | Cement | | Corporate expenses/elimination | | Consolidated |
| | | | | Ports | | Railroad | | | | |
| Revenues and expenses | | | | | | | | | | | | | | | | |
| Metric tons (thou.) - (unaudited) (*) | | 4,895,581 | | 23,849,514 | | | | | | | | 1,754,596 | | | | |
| Revenues | | | | | | | | | | | | | | | | |
Domestic market | | 8,190,463 | | 834,144 | | 142,778 | | 1,022,885 | | 183,492 | | 332,950 | | (564,796) | | 10,141,916 |
Foreign market | | 1,287,274 | | 5,107,707 | | | | | | | | | | (17,313) | | 6,377,668 |
| Cost of sales and services | | (7,038,168) | | (2,185,149) | | (85,474) | | (667,186) | | (105,497) | | (268,432) | | 549,062 | | (9,800,844) |
| Gross profit | | 2,439,569 | | 3,756,702 | | 57,304 | | 355,699 | | 77,995 | | 64,518 | | (33,047) | | 6,718,740 |
| Selling and administrative expenses | | (471,003) | | (149,862) | | (18,303) | | (90,020) | | (25,408) | | (67,712) | | (357,385) | | (1,179,693) |
| Depreciation | | 606,810 | | 161,655 | | 5,674 | | 105,454 | | 22,495 | | 23,222 | | 4,058 | | 929,368 |
| Adjusted EBITDA | | 2,575,376 | | 3,768,495 | | 44,675 | | 371,133 | | 75,082 | | 20,028 | | (386,374) | | 6,468,415 |
| |
| | | 12/31/2011 |
| | | Steel | | Mining | | Logistics | | Energy | | Cement | | Corporate expenses/elimination | | Consolidated |
| | | | | Ports | | Railroad | | | | |
| Sales by geographical area | | | | | | | | | | | | | | | | |
| Asia | | 31,255 | | 4,250,002 | | | | | | | | | | | | 4,281,257 |
| North America | | 502,486 | | | | | | | | | | | | | | 502,486 |
| Latin America | | 147,363 | | | | | | | | | | | | | | 147,363 |
| Europe | | 560,880 | | 857,705 | | | | | | | | | | | | 1,418,585 |
| Other | | 45,290 | | | | | | | | | | | | (17,313) | | 27,977 |
| Foreign market | | 1,287,274 | | 5,107,707 | | | | | | | | | | (17,313) | | 6,377,668 |
| Domestic market | | 8,190,463 | | 834,144 | | 142,778 | | 1,022,885 | | 183,492 | | 332,950 | | (564,796) | | 10,141,916 |
| TOTAL | | 9,477,737 | | 5,941,851 | | 142,778 | | 1,022,885 | | 183,492 | | 332,950 | | (582,109) | | 16,519,584 |
table of contents
Profit or loss | | | | | | | | | | | | | | | | 12/31/2012 |
| | Steel | | Mining | | Logistics | | | | Energy | | Cement | | Corporate
expenses/
elimination | | Consolidated |
| | | | Port | | Railroads | | | | |
Metric tons (thou.) - (unaudited) (*) | | 5,828,718 | | 20,181,321 | | | | | | | | 1,972,020 | | | | |
Net revenues | | | | | | | | | | | | | | | | |
Domestic market | | 8,478,244 | | 713,445 | | 151,514 | | 1,066,756 | | 228,667 | | 387,672 | | -567,486 | | 10,458,812 |
Foreign market | | 2,324,038 | | 3,772,104 | | | | | | | | | | -1,326,365 | | 4,769,777 |
Total net revenue (Note 22) | | 10,802,282 | | 4,485,549 | | 151,514 | | 1,066,756 | | 228,667 | | 387,672 | | -1,893,851 | | 15,228,589 |
Cost of sales and services (Note 23) | | -8,867,820 | | -2,449,839 | | -82,585 | | -729,684 | | -153,031 | | -286,316 | | 1,310,608 | | -11,258,667 |
Gross profit | | 1,934,462 | | 2,035,710 | | 68,929 | | 337,072 | | 75,636 | | 101,356 | | -583,243 | | 3,969,922 |
General and administrative expenses (Note 23) | | -616,976 | | -59,404 | | -20,482 | | -95,246 | | -21,792 | | -68,195 | | -359,313 | | -1,241,408 |
Depreciation (Note 10 b) | | 750,507 | | 190,019 | | 6,653 | | 139,386 | | 17,238 | | 26,902 | | -44,972 | | 1,085,733 |
Proportionate EBITDA of jointly controlled entities | | | | | | | | | | | | | | 717,627 | | 717,627 |
Adjusted EBITDA | | 2,067,993 | | 2,166,325 | | 55,100 | | 381,212 | | 71,082 | | 60,063 | | -269,901 | | 4,531,874 |
| | | | | | | | | | | | | | | | | |
| | | | | | | | | | | | | | | | | |
| | | | | | | | | | | | | | | | | |
| | | | | | | | | | | | | | | | | 12/31/2012 |
Sales by geographic area | | Steel | | Mining | | Logistics | | | | Energy | | Cement | | Corporate
expenses/
elimination | | Consolidated |
| | | | Port | | Railroads | | | | |
Asia | | 30,495 | | 2,964,154 | | | | | | | | | | | | 2,994,649 |
North America | | 585,505 | | 16,589 | | | | | | | | | | | | 602,094 |
Latin America | | 203,069 | | | | | | | | | | | | | | 203,069 |
Europe | | 1,491,195 | | 791,361 | | | | | | | | | | | | 2,282,556 |
Other | | 13,774 | | | | | | | | | | | | -1,326,365 | | -1,312,591 |
Foreign market | | 2,324,038 | | 3,772,104 | | | | | | | | | | -1,326,365 | | 4,769,777 |
Domestic market | | 8,478,244 | | 713,445 | | 151,514 | | 1,066,756 | | 228,667 | | 387,672 | | -567,486 | | 10,458,812 |
TOTAL | | 10,802,282 | | 4,485,549 | | 151,514 | | 1,066,756 | | 228,667 | | 387,672 | | -1,893,851 | | 15,228,589 |
| | | | | | | | | | | | | | | | | 12/31/2011 (**) |
| | | Steel | | Mining | | Logistics | | | | Energy | | Cement | | Corporate
expenses/
elimination | | Consolidated |
| | | | | Ports | | Railroads | | | | |
Profit or loss | | | | | | | | | | | | | | | | |
Metric tons (thou.) - (unaudited) (*) | | 4,895,581 | | 23,849,514 | | | | | | | | 1,754,596 | | | | |
Revenues | | | | | | | | | | | | | | | | |
Domestic market | | 8,190,463 | | 834,144 | | 142,778 | | 1,022,885 | | 183,492 | | 332,950 | | -564,796 | | 10,141,916 |
Foreign market | | 1,287,274 | | 5,021,814 | | | | | | | | | | 68,580 | | 6,377,668 |
| | | 9,477,737 | | 5,855,958 | | 142,778 | | 1,022,885 | | 183,492 | | 332,950 | | -496,216 | | 16,519,584 |
Cost of sales and services (Note 23) | | -7,038,168 | | -2,185,149 | | -85,474 | | -667,186 | | -105,497 | | -268,432 | | 549,062 | | -9,800,844 |
Gross profit | | 2,439,569 | | 3,670,809 | | 57,304 | | 355,699 | | 77,995 | | 64,518 | | 52,846 | | 6,718,740 |
General and administrative expenses (Note 23) | | -471,003 | | -63,967 | | -18,303 | | -90,020 | | -25,408 | | -67,712 | | -443,280 | | -1,179,693 |
Participação acionistas não controladores | | | | | | | | | | | | | | | | |
Outras receitas operacionais | | | | | | | | | | | | | | | | |
Depreciation (Note 10 b) | | 606,810 | | 161,655 | | 5,674 | | 105,454 | | 22,495 | | 23,222 | | 4,058 | | 929,368 |
Adjusted EBITDA | | 2,575,376 | | 3,768,497 | | 44,675 | | 371,133 | | 75,082 | | 20,028 | | -386,376 | | 6,468,415 |
| | | | | | | | | | | | | | | | | |
| | | | | | | | | | | | | | | | | |
| | | | | | | | | | | | | | | | | 12/31/2011 (**) |
| | | Steel | | Mining | | Logistics | | | | Energy | | Cement | | Corporate
expenses/
elimination | | Consolidated |
| | | | | Ports | | Railroads | | | | |
Sales by geographic area | | | | | | | | | | | | | | | |
|
Asia | | 31,255 | | 4,188,229 | | | | | | | | | | 61,774 | | 4,281,258 |
North America | | 502,486 | | | | | | | | | | | | | | 502,486 |
Latin America | | 147,363 | | | | | | | | | | | | | | 147,363 |
Europe | | 560,880 | | 833,585 | | | | | | | | | | 24,120 | | 1,418,585 |
Other | | 45,290 | | | | | | | | | | | | -17,314 | | 27,976 |
Foreign market | | 1,287,274 | | 5,021,814 | | | | | | | | | | 68,580 | | 6,377,668 |
Domestic market | | 8,190,463 | | 834,144 | | 142,778 | | 1,022,885 | | 183,492 | | 332,950 | | -564,796 | | 10,141,916 |
TOTAL | | 9,477,737 | | 5,855,958 | | 142,778 | | 1,022,885 | | 183,492 | | 332,950 | | -496,216 | | 16,519,584 |
(*) The ore sales volumes presented in this note take into consideration Company sales and the interest in its subsidiaries and jointly controlled entities (Namisa 60%).
| | | | | | | | | | | | | | | | | |
| | | 12/31/2010 |
| | | Steel | | Mining | | Logistics | | Energy | | Cement | | Corporate expenses/elimination | | Consolidated |
| | | | | Ports | | Railroad | | | | |
| Revenues and expenses | | | | | | | | | | | | | | | | |
| Metric tons (thou.) - (unaudited) (*) | | 4,795,851 | | 18,554,984 | | | | | | | | 991,789 | | | | |
| Revenues | | | | | | | | | | | | | | | | |
Domestic market | | 8,763,470 | | 573,976 | | 119,315 | | 838,436 | | 113,517 | | 201,841 | | (363,750) | | 10,246,805 |
Foreign market | | 1,162,539 | | 3,041,166 | | | | | | | | | | | | 4,203,705 |
| Cost of sales and services | | (6,225,820) | | (1,252,474) | | (70,046) | | (521,747) | | (41,579) | | (163,631) | | 392,571 | | (7,882,726) |
| Gross profit | | 3,700,189 | | 2,362,668 | | 49,269 | | 316,689 | | 71,938 | | 38,210 | | 28,821 | | 6,567,784 |
| Selling and administrative expenses | | (443,100) | | (69,068) | | (16,590) | | (70,644) | | (25,555) | | (43,119) | | (350,759) | | (1,018,835) |
| Depreciation | | 519,411 | | 145,817 | | 5,577 | | 102,629 | | 22,501 | | 13,648 | | (3,414) | | 806,169 |
| Adjusted EBITDA | | 3,776,500 | | 2,439,417 | | 38,256 | | 348,674 | | 68,884 | | 8,739 | | (325,352) | | 6,355,118 |
| |
| | | 12/31/2010 |
| | | Steel | | Mining | | Logistics | | Energy | | Cement | | Corporate expenses/elimination | | Consolidated |
| | | | | Ports | | Railroad | | | | |
| Sales by geographical area | | | | | | | | | | | | | | | | |
| Asia | | 40,752 | | 2,513,499 | | | | | | | | | | | | 2,554,251 |
| North America | | 432,229 | | | | | | | | | | | | | | 432,229 |
| Latin America | | 193,692 | | | | | | | | | | | | | | 193,692 |
| Europe | | 454,997 | | 527,667 | | | | | | | | | | | | 982,664 |
| Other | | 40,869 | | | | | | | | | | | | | | 40,869 |
| Foreign market | | 1,162,539 | | 3,041,166 | | | | | | | | | | | | 4,203,705 |
| Domestic market | | 8,763,470 | | 573,976 | | 119,315 | | 838,436 | | 113,517 | | 201,841 | | (363,750) | | 10,246,805 |
| TOTAL | | 9,926,009 | | 3,615,142 | | 119,315 | | 838,436 | | 113,517 | | 201,841 | | (363,750) | | 14,450,510 |
(**) As disclosed in notes 2(y) and 3, the financial information related to 12/31/11 was not restated by the adoption of the IFRS 10 and 11, as allowed by the IFRS 10 and 11’s relief.
(*) The ore sales volumes presented in this note take into consideration Company´s salesAdjusted EBITDA is the tool based on which the chief operating decision maker measures segment performance and the interest in its subsidiariescapacity to generate recurring operating cash, and jointly controlled entities (Namisa 60%).
FS-66
| | | | | | | | | | | | | | | | | |
| | | 12/31/2009 |
| | | Steel | | Mining | | Logistical | | Energy | | Cement | | Corporate expenses/elimination | | Consolidated |
| | | | | Ports | | Railroad | | | | |
| Revenue and expenses | | | | | | | | | | | | | | | | |
| Tonnes (thou.) - (unaudited) (*) | | 4,110,266 | | 17,478,837 | | | | | | | | 338,272 | | | | |
| Revenue | | | | | | | | | | | | | | | | |
Domestic market | | 7,045,510 | | 247,490 | | 144,363 | | 822,503 | | 116,641 | | 60,380 | | (330,353) | | 8,106,534 |
Foreign market | | 1,155,780 | | 1,716,050 | | | | | | | | | | | | 2,871,830 |
| Cost of sales and services | | (5,692,531) | | (1,247,696) | | (75,563) | | (464,104) | | (43,363) | | (60,893) | | 373,376 | | (7,210,774) |
| Gross profit | | 2,508,759 | | 715,844 | | 68,800 | | 358,399 | | 73,278 | | (513) | | 43,023 | | 3,767,590 |
| Selling and administrative expenses | | (370,445) | | (39,745) | | (14,290) | | (58,283) | | (24,978) | | (16,135) | | (403,325) | | (927,201) |
| Depreciation | | 484,351 | | 134,665 | | 10,776 | | 109,514 | | 25,234 | | 8,714 | | 6,898 | | 780,152 |
| Adjusted EBITDA | | 2,622,665 | | 810,764 | | 65,286 | | 409,630 | | 73,534 | | (7,934) | | (353,404) | | 3,620,541 |
| |
| | | 12/31/2009 |
| | | Steel | | Mining | | Logistical | | Energy | | Cement | | Corporate expenses/elimination | | Consolidated |
| | | | | Ports | | Railroad | | | | |
| Sales by geography | | | | | | | | | | | | | | | | |
| Asia | | 248,663 | | 1,368,608 | | | | | | | | | | | | 1,617,271 |
| North America | | 322,798 | | 79,426 | | | | | | | | | | | | 402,224 |
| Latin America | | 117,982 | | | | | | | | | | | | | | 117,982 |
| Europe | | 424,314 | | 268,016 | | | | | | | | | | | | 692,330 |
| Other | | 42,023 | | | | | | | | | | | | | | 42,023 |
| Foreign market | | 1,155,780 | | 1,716,050 | | | | | | | | | | | | 2,871,830 |
| Domestic market | | 7,045,510 | | 247,490 | | 144,363 | | 822,503 | | 116,641 | | 60,380 | | (330,353) | | 8,106,534 |
| TOTAL | | 8,201,290 | | 1,963,540 | | 144,363 | | 822,503 | | 116,641 | | 60,380 | | (330,353) | | 10,978,364 |
(*) The ore sales volumes presented in this note take into consideration Company´s sales and the interest in its subsidiaries and jointly controlled entities (Namisa 60%).
The adjusted EBITDA consists of profit for the year plusless net finance income (costs), income tax and social contribution, depreciation and amortization, share of profits of investments, and other operating income (expenses), which are deducted because they mainly refer to non-recurring itemsplus the proportional EBITDA of jointly controlled entities. Even though it is an indicator used in segment performance measurements, EBITDA is not a measurement recognized by accounting practices adopted in Brazil or IFRS, does not have a standard definition, and may not be comparable with measurements using similarnames provided by other entities. As required by IFRS 8, the table below shows the reconciliation of the operation.measurement used by the chief operating decision maker with the results determined using the accounting practices.
FS-68
| | | 12/31/2013 | | 12/31/2012 | | 12/31/2011(*) |
Profit (loss) for the year | | 533,994 | | -480,574 | | 3,667,234 |
Depreciation (Note 10 b) | | 1,093,830 | | 1,085,733 | | 929,368 |
Income tax and social contribution (Note 15) | | 74,161 | | -952,208 | | 83,885 |
Finance income (Note 25) | | 2,511,599 | | 2,151,351 | | 2,005,803 |
EBITDA | | 4,213,584 | | 1,804,302 | | 6,686,290 |
Other operating income (expenses) (Note 24) | | 568,145 | | 2,651,381 | | -217,875 |
Share of profits of investees | | -158,138 | | -641,436 | | |
Proportionate EBITDA of jointly controlled entities | | 780,606 | | 717,627 | | |
Adjusted EBITDA (*) | | 5,404,197 | | 4,531,874 | | 6,468,415 |
(*) As disclosed in notes 2(y) and 3, the financial information related to 12/31/11 was not restated by the adoption of the IFRS 10 and 11, as allowed by the IFRS 10 and 11’s relief.
(*) The Company’s executive officers use AdjustedCompany discloses its adjusted EBITDA as a tool to measurenet of its share of profits of investments and other operating income (expenses) because it understands that these should not be included in the calculation of recurring operating cash generation capacity, as well as a means for allowing it to make comparisons with other companies.
| | | | | | | |
| | | 12/31/2011 | | 12/31/2010 | | 12/31/2009 |
| Adjusted EBITDA | | 6,468,415 | | 6,355,118 | | 3,620,541 |
| Depreciation | | (929,368) | | (806,169) | | (780,152) |
| Other operating income (expenses) (Note 25) | | 217,875 | | (550,603) | | 720,843 |
| Finance income (expenses) (Note 26) | | (2,005,803) | | (1,911,458) | | (246,435) |
| Pretax income | | 3,751,119 | | 3,086,888 | | 3,314,797 |
| Income tax and social contribution (Note 9) | | (83,885) | | (570,697) | | (699,616) |
| Profit for the year | | 3,667,234 | | 2,516,191 | | 2,615,181 |
generation.
28.27. EARNINGS (LOSS) PER SHARE (EPS)
Basic earnings (loss) per share:
Basic earnings (loss) per share have been calculated based on the profit attributable to the owners of CSN divided by the weighted average number of common shares outstanding during the year, (after the stock split), excluding the common shares purchased and held as treasury shares, as follows:
| | 12/31/2013 | | 12/31/2012 | | 12/31/2011 |
| | Common shares |
Profit (loss) for the year | | | | | |
Attributed to owners of the Company | 509,025 | | -420,113 | | 3,706,033 |
Weighted average number of shares | 1,457,970 | | 1,457,970 | | 1,457,970 |
Basic and diluted EPS | 0.34913 | | -0.28815 | | 2.54191 |
FS-67
| | | | | | | |
| | | 12/31/2011 | | 12/31/2010 | | 12/31/2009 |
| | | Common shares |
| Profit for the year | | | | | | |
Attributed to Company owners | | 3,706,033 | | 2,516,376 | | 2,618,934 |
Attributed to non-controlling interests | | (38,799) | | (185) | | (3,753) |
| Weighted average number of shares | | 1,457,970 | | 1,457,970 | | 1,492,453 |
| Basic and diluted EPS | | 2,54191 | | 1,72594 | | 1,75478 |
29.28. EMPLOYEE BENEFITS
The pension plans granted by the Company cover substantially all employees. The plans are administered by Caixa Beneficente dos Empregados da CSN (‘CBS”), which is a private non-profit pension fund established in July 1960. The members of CBS are employees—and former employees—of the Company and some subsidiaries that joined the fund through an agreement, and the employees of CBS itself. The Executive Officers of CBS is comprised of a CEO and two other executive officers, all appointed by CSN, which is the main sponsor of CBS. The Decision-Making Board is the higher decision-making and guideline-setting body of CBS, presided over by the president of the pension fund and made up of 10ten members, six chosen by CSN in its capacity as main sponsor of CBS and four elected by the fund’s participants.
Until December 1995, CBS Previdência administered two defined benefit plans based on years of service, salary and Social Security benefits. On December 27, 1995 the then Private Pension Secretariat (“SPC”) approved the implementation of a new benefit plan, effective beginning that date, and called Mixed Supplementary Benefit Plan (‘Mixed Plan”), structured in the form of a variable contribution plan. Employees hired after that date were only entitled to join the new Mixed Plan. In addition, all active employees who were participants of the old defined benefitsbenefit plans had the opportunity to switch to the new Mixed Plan.
FS-69
table of contents
As of December 31, 20112013 CBS had 31,48233,939 participants (30,540(33,037 as of December 31, 2010)2012), of whom 16,60319,325 were active contributors (15,433(18,262 as of December 31, 2010)2012), 9,7059,460 were retired employees (9,888(9,587 as of December 31, 2010)2012), and 5,1745,154 were related beneficiaries (5,219(5,188 as of December 31, 2010).Out2012). Out of the total participants as atof December 31, 2011, 13,7262013, 13,061 belonged to the defined benefit plan, and 17,75618,457 to the mixed plan, 1,568 to the CBSPrev Namisa plan, and 763 to the CBSPrev plan.
The plan assets of CBS are primarily invested in repurchase agreements (backed by federal government bonds), federal securities indexed to inflation, shares, loans and real estate. As of December 31, 20112013 CBS held 12,788,231 common shares of CSN (12,788,231 common shares as of December 31, 2010)2012). The total plan assets of the entity amounted to R$3.8 billion and R$3.64.1 billion as atof December 31, 2011 and 2010, respectively.2013 (R$4.3 billion as of December 31, 2012). The administrators of the CBS funds seek to match plan assets with benefit obligations payable on a long-term basis. Pension funds in Brazil are subject to certain restrictions regarding their capacity for investment in foreign assets and, therefore, these funds invest mainly in Brazilian securities.
Plan Assets are all available assets and the benefit plans’ investments, not including the amounts of debts to sponsors.
For the defined benefit plans “35% of salary average” and “salary average Supplementation Plan”, the Company holds a financial guarantee with CBS Previdência, the entity that administrates said plans, to ensure their financial and actuarial balance, in the event of any future actuarial loss or actuarial gain. As provided for in the prevailing law that governs the pension fund market, for the years ended December 31, 2012 and 2013, there was no need for CSN to pay the installments, since the defined benefit plan posted actuarial gains for the period.
a. Description of the pension plans
Plan covering 35% of average salary
This plan began on February 1, 1966 and is a defined benefit plan aimed at paying pensions (for length of service, special situations, disability or old age) on a lifetime basis, equivalent to 35% of the adjusted average of the participant’s salary for the last 12 months. The plan also guarantees sick pay to participants on Official Social Security leaves of absence and further ensures payments of savings fund, funeral allowance and pecuniary aid. This plan was discontinued on October 31, 1977 when the new supplementary plan based on average salary took effect.
Supplementary average salary plan
This plan began on November 1, 1977 and is a defined benefit plan, aimed at complementing the difference between the adjusted average of the participant’s salary for the last 12 months and the Official Social Security benefit for retirement, alsoon a lifetime basis. As in the 35% plan, there is coverage for the benefits of sick pay, death and pension. This plan was discontinued on December 26, 1995 with the creation of the mixed supplementary benefit plan.
FS-68
Mixed supplementary benefit plan
This plan began on December 27, 1995 and is a variable contribution plan. Besides the scheduled retirement benefit, it also covers the payment of risk benefits (pension paid while the participant is still working, disability compensation and sick/accident pay).Under. Under this plan, the retirement benefit is calculated based on the amount accumulated by the monthly contributions of the participants and sponsors, as well as on each participant’s option for the manner in which they receive them, which can be lifetime (with or without continuity of pension for death) or through a percentage applied to the balance of the fund generating the benefit (loss for indefinite period).After. After retirement is granted, the plan takes on the characteristics of a defined benefit plan. This plan was discontinued on October 16, 2013 when the CBSOPrev plan became effective.
CBS Prev Plan
FS-70
The new CBS Prev Plan, which is a defined contribution plan, started on September 16, 2013. Under this plan, the retirement benefit is determined based on the accumulated amount by monthly contributions of participants and sponsors. To receive the benefit, each participant can opt for: (a) receiving part in cash (up to 25%) and the remaining balance through a monthly income through a percentage applied to the fund generating the benefit, not being applicable to death pension benefits, or (b) receive only a monthly income through a percentage applied to the fund generating the benefit.
With the creation of the CBS Prev Plan, the mixed supplementary benefit plan was discontinued for the entry of new participants as from September 16, 2013.
b. Investment policy
The investment policy establishes the principles and guidelines that will govern the investments of funds entrusted to the entity, in order to foster the security, liquidity and profitability required to ensure equilibrium between the plan’s assets and liabilities, based on an ALM (Asset Liability Management) study that takes into consideration the benefits of participants and beneficiaries for each plan.
The investment plan is reviewed annually and approved by the Decision-Making Board considering a 5-year horizon, as established by resolution CGPC 7 of December 4, 2003. The investment limits and criteria established in the policy are based on Resolution 3792/3,792/09 published by the National Monetary Council (“CMN”).
c. Employee benefits
The actuarial calculations are updated at the end of each annual reporting period by outside actuaries and presented in the financial statements pursuant to IAS 19Employee Benefits.
| | | | | |
| | | 12/31/2011 | | 12/31/2010 |
| Obligations recognized in the balance sheet | | | | |
| Pension plan benefits | | 11,673 | | |
| Post-employment healthcare benefits | | 457,377 | | 367,839 |
| | | 469,050 | | 367,839 |
| | | | | | | | |
| | 12/31/2013 | | 12/31/2012 | | 12/31/2013 | | 12/31/2012 |
| | Actuarial asset | | Actuarial liability |
Pension plan benefits (Note 8) | 97,051 | | 93,546 | | 11,139 | | 17,939 |
Post-employment healthcare benefits | | | | | 473,966 | | 547,652 |
| 97,051 | | 93,546 | | 485,105 | | 565,591 |
The reconciliation of employee benefits’ assets and liabilities is as follows:
| | | | | |
| | | 12/31/2011 | | 12/31/2010 |
| Present value of defined benefit obligations | | (2,153,649) | | (1,982,556) |
| Fair value of plan assets | | 2,384,450 | | 2,316,018 |
| (Deficit)/surplus | | 230,801 | | 333,462 |
| Restriction to actuarial assets due to recovery limitation | | (174,926) | | (280,582) |
| (Liabilities)/assets, net | | 55,875 | | 52,880 |
| Liabilities | | (11,673) | | |
| Assets (*) | | 67,548 | | 52,880 |
| Net (liabilities)/assets recognized in the balance sheet | | (11,673) | | |
| | 12/31/2013 | | 12/31/2012 |
Present value of defined benefit obligation | 2,263,012 | | 2,666,261 |
Fair value of plan assets | -2,684,783 | | -2,923,483 |
Deficit/(surplus) | -421,771 | | -257,222 |
Restriction to actuarial assets due to recovery limitation | 335,859 | | 181,615 |
Liabilities/(assets), net | -85,912 | | -75,607 |
Liabilities | 11,139 | | 17,939 |
Assets | -97,051 | | -93,546 |
Net liabilities/(assets) recognized in the balance sheet | -85,912 | | -75,607 |
Changes in the present value of defined benefit obligation during the year2013 are as follows:
| | 12/31/2013 | | 12/31/2012 |
Present value of obligations at the beginning of the year | 2,666,261 | | 2,153,649 |
Cost of services | 6,375 | | 5,801 |
Interest cost | 239,310 | | 215,850 |
Benefits paid | -208,951 | | -193,563 |
Actuarial loss/(gain) | -439,983 | | 484,524 |
Present value of obligations at the end of the year | 2,263,012 | | 2,666,261 |
FS-69FS-71
| | | | | | | |
| | | 12/31/2011 | | 12/31/2010 | | 31/12/2009 |
| Present value of obligations at the beginning of the year | | 1,982,556 | | 1,731,767 | | 1,415,029 |
| Cost of services | | 5,579 | | 1,313 | | 1,249 |
| Interest cost | | 202,242 | | 185,285 | | 174,122 |
| Benefits paid | | (178,403) | | (166,147) | | (148,561) |
| Actuarial loss/(gain) | | 141,675 | | 225,341 | | 287,146 |
| Other | | | | 4,997 | | 2,782 |
| Present value of obligations at the end of the year | | 2,153,649 | | 1,982,556 | | 1,731,767 |
table of contents
Changes in the fair values of plan assets in the current yearduring 2013 are as follows:
| | | | | | | |
| | | 12/31/2011 | | 12/31/2010 | | 12/31/2009 |
| Fair value of assets at the beginning of the year | | 2,316,018 | | 2,160,158 | | 1,396,350 |
| Expected return on plan assets | | 260,163 | | 218,229 | | 176,356 |
| Sponsors' contributions | | 67,709 | | 63,109 | | 68,890 |
| Participants' contributions | | | | | | 2,782 |
| Benefits paid | | (178,402) | | (166,147) | | (148,561) |
| Actuarial (gains) losses | | (81,038) | | 40,669 | | 664,341 |
| Fair value of plan assets at the end of the year | | 2,384,450 | | 2,316,018 | | 2,160,158 |
| | 12/31/2013 | | 12/31/2012 |
Fair value of assets at the beginning of the year | -2,923,483 | | -2,384,450 |
Expected return on plan assets | -263,410 | | -272,406 |
Sponsors' contributions | | | -3,797 |
Benefits paid | 208,951 | | 193,563 |
Actuarial gains/(losses) | 293,159 | | -456,393 |
Fair value of assets at the end of the year | -2,684,783 | | -2,923,483 |
The amounts recognized in the income statement for the year ended December 31, 2013 are comprised as follows:
| | | | | | | |
| | | 12/31/2011 | | 12/31/2010 | | 12/31/2009 |
| Cost of current services | | (5,579) | | (1,313) | | (1,249) |
| Interest cost | | (202,242) | | (185,285) | | (174,122) |
| Expected return on plan assets | | 260,163 | | 218,229 | | 176,356 |
| Sponsors' contributions transferred in prior year | | 67,710 | | 63,109 | | 68,890 |
| | | 120,052 | | 94,740 | | 69,875 |
| Total unrecognized revenue (*) | | 103,678 | | 94,740 | | 73,357 |
| Total (costs)/revenue recognized in the income statement | | 16,374 | | | | (3,482) |
| Total (costs)/revenue, net | | 120,052 | | 94,740 | | 69,875 |
| | 12/31/2013 | | 12/31/2012 |
Cost of current services | 6,375 | | 5,801 |
Interest cost | 239,310 | | 215,850 |
Expected return on plan assets | -263,410 | | -272,406 |
Interest on the asset ceiling effect | 16,908 | | |
Sponsors' contributions transferred in prior year | | | -3,797 |
| | -817 | | -54,552 |
Total unrecognized costs (income) (*) | 168 | | -37,477 |
Total costs/(income) recognized in the income statement | -985 | | -17,075 |
Total costs (revenue), net (*) | -817 | | -54,552 |
(*) The Company did not recognize in its balance sheetEffect of the asset and the balancing items thereto resulting from the actuarial valuationlimit of surplus plans because there is no clear evidenceparagraph 58 (b) of its realization, in accordance with IAS 19Employee benefits.Benefits.
The (cost)/income is recognized in the income statement in other operating expenses.
Changes in actuarial gains and losses in 2013 are as follows:
| | | | | | | |
| | | 12/31/2011 | | 12/31/2010 | | 12/31/2009 |
| Actuarial gains and (losses) | | (222,712) | | (184,671) | | 377,195 |
| Restriction due to recovery limitation | | 105,655 | | 99,509 | | (361,355) |
| | | (117,057) | | (85,162) | | 15,840 |
| Actuarial gains and (losses) recognized in other comprehensive income | | (28,048) | | | | |
| Unrecognized actuarial gains/(losses) (*) | | (89,009) | | (85,162) | | 15,840 |
| Total cost of actuarial (gains) and losses | | (117,057) | | (85,162) | | 15,840 |
| | 12/31/2013 | | 12/31/2012 |
Actuarial (gains) and losses | -146,823 | | 28,131 |
Restriction due to recovery limitation | 137,336 | | 6,688 |
| -9,487 | | 34,819 |
Actuarial (gains) and losses recognized in other comprehensive income | -9,319 | | -2,658 |
Unrecognized actuarial (gains) and losses (*) | -168 | | 37,477 |
Total cost of actuarial (gains) and losses | -9,487 | | 34,819 |
(*) The actuarial loss resultsActuarial (gains) losses result from the fluctuation in the investments that form CBS’s asset portfolio.
Breakdown of actuarial gains and losses:
| 12/31/2013 |
(Gain)/loss due to change in demographic assumptions (*) | 57,015 |
(Gain)/loss due to change in financial assumptions (*) | -586,272 |
Gain)/loss due to adjustments to experience | 89,275 |
Return on plan assets (less interest income) | 293,160 |
Actuarial (gains) and losses | -146,822 |
(*) Breakdown required based on item 41 of IAS 19 (R1).
The history of actuarial gains and losses is as follows:
FS-70FS-72
| | | | | | | | | |
| | | 12/31/2011 | | 12/31/2010 | | 12/31/2009 | | 01/01/2009 (**) |
| Present value of defined benefit obligations | | (2,153,649) | | (1,982,556) | | (1,731,767) | | (1,415,029) |
| Fair value of plan assets | | 2,384,450 | | 2,316,018 | | 2,160,158 | | 1,396,350 |
| Surplus | | 230,801 | | 333,462 | | 428,391 | | (18,679) |
| Experience adjustments to plan obligations | | 141,675 | | 225,341 | | 287,146 | | |
| Experience adjustments to plan assets | | (81,038) | | 40,669 | | 664,341 | | |
table of contents
| | 12/31/2013 | | 12/31/2012 | | 12/31/2011 | | 12/31/2010 | | 12/31/2009 | | 01/01/2009 |
Present value of defined benefit obligations | 2,263,012 | | 2,666,261 | | 2,153,649 | | 1,982,556 | | 1,731,767 | | -1,415,029 |
Fair value of plan assets | -2,684,783 | | -2,923,483 | | -2,384,450 | | -2,316,018 | | -2,160,158 | | 1,396,350 |
Deficit/(surplus) | -421,771 | | -257,222 | | -230,801 | | -333,462 | | -428,391 | | -18,679 |
Experience adjustments to plan obligations | -439,983 | | 484,524 | | 141,674 | | 225,341 | | 287,146 | | |
Experience adjustments to plan assets | -293,159 | | 456,393 | | -81,038 | | 40,669 | | 664,341 | | |
The main actuarial assumptions used were as follows:
| | | | | | | |
| | | 12/31/2011 | | 12/31/2010 | | 12/31/2009 |
| Actuarial funding method | | Projected unit credit | | Projected unit credit | | Projected unit credit |
| Functional currency | | Real (R$) | | Real (R$) | | Real (R$) |
| Recognition of plan assets | | Fair value | | Fair value | | Fair value |
| Amount used as estimate of equity at the end of the year | | Best estimate for equity at the end of the fiscal year, obtained based on a projection of October amountsrecorded | | Best estimate for equity at the end of the fiscal year, obtained based on a projection of October amountsrecorded | | Best estimate for equity at the end of the fiscal year, obtained based on a projection of October amountsrecorded |
| Discount rate | | 10.46% | | 10.66% | | 11.18% |
| Inflation rate | | 4.6% | | 4.4% | | 4.20% |
| Nominal salary increase rate | | 5.65% | | 5.44% | | 5.24% |
| Nominal benefit increase rate | | 4.6% | | 4.4% | | 4.20% |
| Rate of return from investments | | 11,52% - 12,24% | | 11,31% - 12,21% | | 10,21% - 10,78% |
| General mortality table | | AT 2000 segregated by gender | | AT 2000 segregated by gender | | AT 2000 segregated by gender |
| Disability table | | Mercer Disability with probabilities multiplied by 2 | | Mercer Disability with probabilities multiplied by 2 | | Mercer Disability with probabilities multiplied by 2 |
| Disability mortality table | | Winklevoss - 1% | | Winklevoss - 1% | | Winklevoss - 1% |
| Turnover table | | 2% p.a. millennium plan, nil for defined benefit plans | | 2% p.a. millennium plan, nil for defined benefit plans | | 2% p.a. millennium plan, nil for defined benefit plans |
| Retirement age | | 100% on first date he/shed becomes eligible for programmed retirement benefit under plan | | 100% on first date he/shed becomes eligible for programmed retirement benefit under plan | | 100% on first date he/shed becomes eligible for programmed retirement benefit under plan |
| |
| Household of active participants | | 95% will be married at the time of retirement, with the wife being 4 years younger than the husband | | 95% will be married at the time of retirement, with the wife being 4 years younger than the husband | | 95% will be married at the time of retirement, with the wife being 4 years younger than the husband |
| | 12/31/2013 | | 12/31/2012 |
Actuarial financing method | Projected unit credit | | Projected unit credit |
Functional currency | Real (R$) | | Real (R$) |
Recognition of plan assets | Fair value | | Fair value |
Amount used as estimate of equity at the end of the year | Best estimate for equity at the end of the fiscal year, obtained based on a projection of October amounts recorded | | Best estimate for equity at the end of the fiscal year, obtained based on a projection of October amounts recorded |
Nominal discount rate | 11.83% | | 9.31% |
Inflation rate | 5.00% | | 5.00% |
Nominal salary increase rate | 6.05% | | 6.05% |
Nominal benefit increase rate | 6.05% | | 5.00% |
Rate of return on investments | 11.83% | | 9.31% |
General mortality table | Milênio Plan and Medical Care Plan: AT 2000 segregated by gender | | AT 2000 segregated by gender |
35% and Supplementary Average Salary plans: AT 2000 segregated by gender (smoothed) | |
Disability table | Mercer Disability with probabilities multiplied by 2 | | Mercer Disability with probabilities multiplied by 2 |
Disability mortality table | Winklevoss - 1% | | Winklevoss - 1% |
Turnover table | Millennium plan 3% p.a., nil for DB plans | | Millennium plan 3% p.a., nil for DB plans |
Retirement age | 100% on first date he/shed becomes eligible for programmed retirement benefit under plan | | 100% on first date he/shed becomes eligible for programmed retirement benefit under plan |
Household of active participants | 95% will be married at the time of retirement, with the wife being 4 years younger than the husband | | 95% will be married at the time of retirement, with the wife being 4 years younger than the husband |
The assumptions related to the mortality table are based on published statistics and mortality tables. These tables represent an average life expectancy in years of employees retiring at the age of 65, as shown below:
| | | | | | | |
| | | 12/31/2011 | | 12/31/2010 | | 12/31/2009 |
| Longevity at age of 65 for current participants | | | | | | |
| Male | | 19.55 | | 19.55 | | 19.55 |
| Female | | 22.17 | | 22.17 | | 22.17 |
| | 12/31/2013 | | 12/31/2012 |
Longevity at age of 65 for current participants | | | |
Male | 20.45 | | 19.55 |
Female | 23.02 | | 22.17 |
Longevity at age of 65 for current participants who are 40 | | | |
Male | 20.45 | | 19.55 |
Female | 23.02 | | 22.17 |
Allocation of plan assets:
| | | | | | | | | |
| | | 12/31/2011 | | 12/31/2010 |
| Variable income | | 360,958 | | 15.14% | | 234,303 | | 10.12% |
| Fixed income | | 1,756,831 | | 73.68% | | 1,961,306 | | 84.68% |
| Real estate | | 190,756 | | 8.00% | | 52,352 | | 2.26% |
| Other | | 75,905 | | 3.18% | | 68,057 | | 2.94% |
| Total | | 2,384,450 | | 100.00% | | 2,316,018 | | 100.00% |
Expected long-term return on plan assets:
| | | | | | | | | |
| | | 12/31/2011 | | 12/31/2010 | | | | |
| Variable income | | 18.05% | | 15.58% | | | | |
| Fixed income | | 10.53% | | 10.44% | | | | |
| Real estate | | 10.34% | | 9.62% | | | | |
| Other | | 10.34% | | 9.62% | | | | |
| Total | | 11.78% | | 11.62% | | | | |
| | | | 12/31/2013 | | | | 12/31/2012 |
Variable income | 118,596 | | 4.42% | | 110,668 | | 3.79% |
Fixed income | 2,398,472 | | 89.34% | | 2,631,187 | | 90.00% |
Real estate | 107,386 | | 4.00% | | 118,739 | | 4.06% |
Other | 60,329 | | 2.24% | | 62,889 | | 2.15% |
Total | 2,684,783 | | 100.00% | | 2,923,483 | | 100.00% |
The actual return on plan assets was R$179,126 (R$258,89829,749 as of December 31, 2010)2013 (R$728,800 as of December 31, 2012).
FS-73
FS-71
Variable-incomeThe fair value measurements of plan assets comprise mainly CSN shares.by major categories are as follows:
| Fair value measurements on plan assets at
December 31, 2013 |
| Total | | Quoted prices
in active markets | | Unquoted prices |
Fixed Income | 3,673,181 | | 3,376,864 | | 296,317 |
Government Bonds | 2,644,401 | | 2,644,401 | | - |
Corporate Bonds | 296,317 | | - | | 296,317 |
Committed Operations | 732,463 | | 732,463 | | - |
Variable Income | 111,141 | | 111,141 | | - |
Common and Preferred Shares | 111,141 | | 111,141 | | - |
Real State | 164,334 | | - | | 164,334 |
Loans to participants | 102,212 | | - | | 102,212 |
Total | 4,050,868 | | 3,488,005 | | 562,863 |
Funds not related to risk plans | -1,366,085 | | | | |
Fair Value of plan assets at end of year | 2,684,783 | | | | |
Fixed-income
Fixed income assets comprise mostly debentures, Certificates of Interbank Deposit (“CDI”) and, National Treasury Notes (“NTN-B”). and Committed Operations.
Variable income assets comprise mainly CSN shares.
Real estate refers to buildings appraised by a specialized asset appraisal firm. There are no assets in use by CSN and its subsidiaries.
Loans to participants follow the rules approved by the CBS's Council and the maximum limit of 15% of total resources, established in Resolution No. 3,792/09 issued by the National Monetary Council (“CMN”)
For the defined benefit plans, the expense as of December 31, 20112013 was R$67,276740 (R$63,1105,256 as of December 31, 2010)2012).
For the mixed plan, which has defined contribution components, the expense in 2011 was R$29,487 (R$22,514 as of December 31, 2010)2013 was R$31,542 (R$31,657 as of December 31, 2012).
For the defined contribution plan CBSPrev Namisa, the expense in 2013 was R$1,427 (R$1,466 as of December 31, 2012).
For the defined contribution plan CBSPrev, the expense in 2013 was R$1,122.
d. Expected contributions
ExpectedThere are no expected contributions of R$69,244that will be paid to the defined benefitsbenefit plans in 2012.2014.
For the mixed supplementary benefitpension plan, which includes defined contribution components, expected contributions of R$27,50031,820 will be paid in 2012.2014.
POST-EMPLOYMENT HEALTH CARE PLANe.Sensitivity analysis
FS-74
table of contents
The quantitative sensitivity analysis regarding the significant assumptions, for the pension plans as of December 31, 2013 is as follows:
| | | | | | | | |
| 12/31/2013 |
| | Plan covering 35%of average salary | | Supplementaryaverage salary plan | | Mixed supplementarybenefit plan |
| |
| Assumption: Discount rate | | | | | | | | |
| Sensitivity level | 0.5% | -0.5% | | 0.5% | -0.5% | | 0.5% | -0.5% |
| Effect on current service cost and on interest on | | | | | | | | |
| actuarial obligations | 38 | -53 | | -302 | 248 | | -1,129 | -1,129 |
| Effect on present value of obligations | -12,970 | 13,980 | | -58,025 | 62,661 | | -23,372 | -23,372 |
| |
| Assumption: Salary growth | | | | | | | | |
| Sensitivity level | 0.5% | -0.5% | | 0.5% | -0.5% | | 0.5% | -0.5% |
| Effect on current service cost and on interest on | | | | | | | | |
| actuarial obligations | | | | 9 | -8 | | 132 | -127 |
| Effect on present value of obligations | 4 | -4 | | 47 | -47 | | 206 | -201 |
| |
| Assumption: Mortality table | | | | | | | | |
| Sensitivity level | 1.0% | -1.0% | | 1.0% | -1.0% | | 1.0% | -1.0% |
| Effect on current service cost and on interest on | | | | | | | | |
| actuarial obligations | -860 | 849 | | -3,268 | 3,189 | | 311 | -236 |
| Effect on present value of obligations | -7,271 | 7,176 | | -27,617 | 26,950 | | -3,693 | 3,629 |
| |
| Assumption: Benefit adjustment | | | | | | | | |
| Sensitivity level | 0.5% | -0.5% | | 0.5% | -0.5% | | 0.5% | -0.5% |
| Effect on current service cost and on interest on | | | | | | | | |
| actuarial obligations | 659 | -624 | | 2,341 | -2,220 | | 273 | -273 |
| Effect on present value of obligations | 5,571 | -5,272 | | 19,730 | -18,713 | | 2,307 | -2,307 |
The forecast benefits for future years of the defined benefit plans are as follows:
Forecast benefit payments | 2013 |
Year 1 | 160,574 |
Year 2 | 165,456 |
Year 3 | 162,841 |
Year 4 | 160,059 |
Year 5 | 157,109 |
Next 5 years | 735,292 |
Total forecast payments | 1,541,331 |
f.Post-employment health care plan
Refer to a healthcare plan created on December 1, 1996 exclusively for retired former employees, pensioners, those who received an amnesty, war veterans, widows of employees who died as a result of on-the-job accidents and former employees who retired on or before March 20, 1997 and their related dependents. Since then, the health carehealthcare plan hasdoes not permittedallow the inclusion of new beneficiaries. The plan is sponsored by CSN and administered by Caixa Beneficente dos Empregados da Cia. Siderúrgica Nacional - CBS.
The amounts recognized in the balance sheet were determined as follows:
| | | | | |
| | | 12/31/2011 | | 12/31/2010 |
| Present value of obligations | | 457,377 | | 367,839 |
| Liabilities | | 457,377 | | 367,839 |
| | 12/31/2013 | | 12/31/2012 |
Present value of obligations | 473,966 | | 547,652 |
Passivo | 473,966 | | 547,652 |
FS-75
table of contents
The reconciliation of liabilities for healthcare benefits is as follows:
| | | | | |
| | | 12/31/2011 | | 12/31/2010 |
| Actuarial liabilities at the beginning of the year | | 367,839 | | 317,145 |
| Interest on actuarial obligation | | 39,616 | | 35,457 |
| Sponsor's contributions transferred in prior year | | (34,653) | | (33,064) |
| Recognition of (gain)/loss for the year | | 84,575 | | 48,301 |
| Actuarial liabilities at the end of the year | | 457,377 | | 367,839 |
| | 12/31/2013 | | 12/31/2012 |
Actuarial liabilities at the beginning of the year | 547,652 | | 457,377 |
Interest on actuarial obligation | 49,164 | | 45,967 |
Sponsors' contributions transferred in prior year | -34,691 | | -32,874 |
Recognition of loss for the year | -88,159 | | 77,182 |
Actuarial liabilities at the end of the year | 473,966 | | 547,652 |
For the post-employment healthcare benefit plan, the expense in 2011 was R$37,343 (R$33,817 as of December 31, 2010)2013 was R$55,720 (R$51,234 as of December 31, 2012).
The actuarial gains and losses recognized in shareholders' equity are as follows:
| | | | | | | |
| | | 12/31/2011 | | 12/31/2010 | | 12/31/2009 |
| Actuarial loss on obligation | | 84,575 | | 48,301 | | 17,232 |
| Loss recognized in equity | | 84,575 | | 48,301 | | 17,232 |
| | 12/31/2013 | | 12/31/2012 |
Actuarial loss on obligation | -88,159 | | 77,182 |
Loss recognized in shareholders' equity | -88,159 | | 77,182 |
The history of actuarial gains and losses is as follows:
| | 12/31/2013 | | 12/31/2012 | | 12/31/2011 | | 12/31/2010 | | 12/31/2009 | | 01/01/2009 |
Present value of defined benefit obligation | 473,966 | | 547,652 | | 457,377 | | 367,839 | | 317,145 | | -296,608 |
Deficit/(surplus) | 473,966 | | 547,652 | | 457,377 | | 367,839 | | 317,145 | | -296,608 |
Experience adjustments to plan obligations | -88,159 | | 77,182 | | 84,575 | | 48,301 | | 17,232 | | 9,023 |
FS-72
| | | | | | | | | |
| | | 12/31/2011 | | 12/31/2010 | | 31/12/2009 | | 01/01/2009 (**) |
| Present value of defined benefit obligation | | (457,377) | | (367,839) | | (317,145) | | (296,608) |
| (Deficit)/surplus | | (457,377) | | (367,839) | | (317,145) | | (296,608) |
| Experience adjustments to plan obligations | | 84,575 | | 48,301 | | 17,232 | | 9,023 |
(**) IAS 19 requires disclosure of the history for 5 (five) years, although this does not have to be retrospectively applied for a first-time adopter of IFRS.
The impact on a one-percent change in the assumed trend rate of the healthcare cost is as follows:
| | | | | | | | | | | | | |
| | | 12/31/2011 | | 12/31/2010 | | 12/31/2009 |
| | | Increase | | Reduction | | Increase | | Reduction | | Increase | | Reduction |
| Effect on total cost of current service and finance cost | | | | | | 3,603 | | (3,128) | | 3,274 | | (2,847) |
| Effect on defined benefit obligation | | 42,032 | | (35,916) | | 34,122 | | (29,617) | | 29,287 | | (25,461) |
| | 12/31/2013 | | 12/31/2012 |
| Increase | | Reduction | | Increase | | Reduction |
Effect on total cost of current service and finance cost | 5,472 | | -4,683 | | | | |
Effect on defined benefit obligation | 46,275 | | -39,605 | | 54,292 | | -46,668 |
The actuarial assumptions used for calculating post-employmentpostemployment healthcare benefits were:
| | | | | | | |
| | | 12/31/2011 | | 12/31/2010 | | 12/31/2009 |
| Biometric | | | | | | |
| General mortality table | | AT 2000 segregated by gender | | AT 2000 segregated by gender | | AT 2000 segregated by gender |
| Turnover | | N.A. | | N.A. | | N.A. |
| Household | | Actual household | | Actual household | | Actual household |
| |
| |
| Financial | | 12/31/2011 | | 12/31/2010 | | 12/31/2009 |
| Actuarial nominal discount rate | | 10.46% | | 10.77% | | 11.18% |
| Inflation | | 4.6% | | 4.4% | | 4.2% |
| Increase in medical cost based on age | | 4.6% | | 1.5% | | 1.5% |
| Nominal medical costs growth rate | | 2.31% | | 2.31% | | 2.31% |
| Average medical costs | | 299.69 | | 316.22 | | 274.16 |
| 12/31/2013 | | 12/31/2012 |
Biometrics | | | |
General mortality table | AT 2000 segregated by gender | | AT 2000 segregated by gender |
Turnover | n/a | | n/a |
Household | Actual household | | Actual household |
| | | |
| | | |
Financial | | | |
Actuarial nominal discount rate | 11.83% | | 9.31% |
Inflation | 5.00% | | 5.00% |
Nominal increase in medical cost based on age | 5,53% - 8,15% | | 5,53% - 8,15% |
Nominal medical costs growth rate | 8.15% | | 8.15% |
Average medical cost | 380.05 | | 345.61 |
g.Sensitivity analysis
FS-76
table of contents
The quantitative sensitivity analysis regarding the significant assumptions, for the postemployment healthcare plans as of December 31, 2013 is as follows:
| | | | 12/31/2013 |
| | Medical Assistance Plan |
Assumption: Discount rate | | Assumption: Discount rate |
Sensitivity level | | 0.5% | -0.5% |
Effect on current service cost and on interest on actuarial obligations | | 14,986 | 15,107 |
Effect on present value of obligations | | -18,916 | 20,579 |
| | | |
Assumption: Salary growth | | Assumption: Medical Inflation |
Sensitivity level | | 1.0% | -1.0% |
Effect on current service cost and on interest on actuarial obligations | | 20,519 | 10,364 |
Effect on present value of obligations | | 46,275 | (39,605) |
| | | | |
Assumption: Mortality table | | Assumption: Mortality table |
Sensitivity level | | 1.0% | -1.0% |
Effect on current service cost and on interest on actuarial obligations | | 12,426 | 17,750 |
Effect on present value of obligations | | -22,161 | 22,858 |
The forecast benefits for future years of the postemployment healthcare plans are as follows:
Forecast benefit payments | | 2013 |
Year 1 | | 39,577 |
Year 2 | | 37,400 |
Year 3 | | 35,235 |
Year 4 | | 33,089 |
Year 5 | | 30,966 |
Next 5 years | | 124,419 |
Total forecast payments | | 300,686 |
FS-77
The Company is liable for guarantees for its subsidiaries and jointly controlled entities, as follows:
| | Currency | | Maturities | | Loans | | Tax foreclosure | | Other | | Total |
| | | | | | 12/31/2013 | | 12/31/2012 | | 12/31/2013 | | 12/31/2012 | | 12/31/2013 | | 12/31/2012 | | 12/31/2013 | | 12/31/2012 |
Transnordestina Logísitca | R$ | | Up to 12/8/2027 and indefinite | | 1,875,360 | | 1,626,509 | | 20,600 | | 1,800 | | 168,009 | | 4,866 | | 2,063,969 | | 1,633,175 |
| | | | | | | | | | | | | | | | | | | | |
FTL - Ferrovia Transnordestina | R$ | | 11/15/2020 | | 125,250 | | | | | | | | | | | | 125,250 | | |
| | | | | | | | | | | | | | | | | | | | |
CSN Cimentos | R$ | | Up to 10/25/2015 and indefinite | | | | | | 26,423 | | 25,403 | | 39,287 | | 42,397 | | 65,710 | | 67,800 |
Prada | R$ | | Up to 2/7/2014 and indefinite | | | | | | 10,133 | | 10,133 | | 21,916 | | 21,616 | | 32,049 | | 31,749 |
| | | | | | | | | | | | | | | | | | | | |
Itá Energética | R$ | | | | | | 7,326 | | | | | | | | | | | | 7,326 |
| | | | | | | | | | | | | | | | | | | | |
CSN Energia | R$ | | Indefinite | | | | | | 2,829 | | 4,192 | | | | | | 2,829 | | 4,192 |
| | | | | | | | | | | | | | | | | | | | |
Congonhas Minérios | R$ | | 5/21/2019 | | 2,000,000 | | 2,000,000 | | | | | | | | | | 2,000,000 | | 2,000,000 |
| | | | | | | | | | | | | | | | | | | | |
Fundação CSN | R$ | | Indefinite | | 1,003 | | 1,003 | | | | | | | | | | 1,003 | | 1,003 |
| | | | | | | | | | | | | | | | | | | | |
Total in R$ | | | | | 4,001,613 | | 3,634,838 | | 59,985 | | 41,528 | | 229,212 | | 68,879 | | 4,290,810 | | 3,745,245 |
| | | | | | | | | | | | | | | | | | | | |
CSN Islands VIII | US$ | | | | | | 550,000 | | | | | | | | | | | | 550,000 |
| | | | | | | | | | | | | | | | | | | | |
CSN Islands IX | US$ | | 1/15/2015 | | 400,000 | | 400,000 | | | | | | | | | | 400,000 | | 400,000 |
| | | | | | | | | | | | | | | | | | | | |
CSN Islands XI | US$ | | 9/21/2019 | | 750,000 | | 750,000 | | | | | | | | | | 750,000 | | 750,000 |
| | | | | | | | | | | | | | | | | | | | |
CSN Islands XII | US$ | | Perpetual | | 1,000,000 | | 1,000,000 | | | | | | | | | | 1,000,000 | | 1,000,000 |
| | | | | | | | | | | | | | | | | | | | |
CSN Resources | US$ | | 7/21/2020 | | 1,200,000 | | 1,200,000 | | | | | | | | | | 1,200,000 | | 1,200,000 |
| | | | | | | | | | | | | | | | | | | | |
Sepetiba Tecon | US$ | | 3/15/2014 | | 15,708 | | | | | | | | | | | | 15,708 | | |
| | | | | | | | | | | | | | | | | | | | |
CSN Handel | US$ | | 6/27/2015 | | 100,000 | | | | | | | | | | | | 100,000 | | |
| | | | | | | | | | | | | | | | | | | | |
Total in US$ | | | | | 3,465,708 | | 3,900,000 | | | | | | | | | | 3,465,708 | | 3,900,000 |
| | | | | | | | | | | | | | | | | | | | |
CSN Steel S.L. | EUR | | 1/31/2020 | | 120,000 | | 120,000 | | | | | | | | | | 120,000 | | 120,000 |
| | | | | | | | | | | | | | | | | | | | |
Total in EUR | | | | | 120,000 | | 120,000 | | | | | | | | | | 120,000 | | 120,000 |
Total in R$ | | | | | 8,505,948 | | 8,218,991 | | | | | | | | | | 8,505,948 | | 8,218,991 |
| | | | | | 12,507,561 | | 11,853,829 | | 59,985 | | 41,528 | | 229,212 | | 68,879 | | 12,796,758 | | 11,964,236 |
FS-78
30. COMMITMENTS
a. Take-or-pay contracts
As of December 31, 20112013 and 2010,2012, the Company was a party to take-or-pay contracts as shown in the following table:
Concessionaire | Type of service | | Agreement terms and conditions | | 2012 | | 2013 | | 2014 | | 2015 | | 2016 | | 2017 | | After 2017 | | Total |
MRS Logística | Iron ore transportation | | Contractual clause providing for guaranteed revenue on railway freight. In the case of CSN, this means a minimum payment of 80% of freight estimate. | | 142,190 | | 100,368 | | 214,639 | | 214,639 | | 107,319 | | | | | | 536,597 |
| | | | | | | | | | | | | | | | | | | | |
MRS Logística | Steel products transportation | | Transportation of at least 80% of annual volume agreed with MRS. | | 68,248 | | 66,047 | | 65,516 | | 65,516 | | 27,298 | | | | | | 158,330 |
| | | | | | | | | | | | | | | | | | | | |
MRS Logística | Iron ore, coal and coke transportation | | Transportation of 8,280,000 metric tons per year of iron ore and 3,600,000 metric tons per year of coal, coke and other reducing agents. | | 23,334 | | 128,387 | | 132,770 | | 132,770 | | 132,770 | | 132,770 | | 1,194,931 | | 1,726,011 |
| | | | | | | | | | | | | | | | | | | | |
FCA (*) | Mining products transportation | | Transportation of at least 1,900,000 metric tons per year. | | 734 | | 4,101 | | | | | | | | | | | | |
| | | | | | | | | | | | | | | | | | | | |
FCA | FCA railway transportation of clinker to CSN Cimentos | | Transportation of at least 675,000 metric tons per year of clinker in 2011 and 738,000 metric tons per year of clinker starting 2012. | | 2,733 | | 1,478 | | 27,300 | | 27,300 | | 27,300 | | 27,300 | | 63,701 | | 172,901 |
| | | | | | | | | | | | | | | | | | | | |
White Martins | Supply of gas (oxygen, nitrogen and argon) | | CSN undertakers to buy at least 90% of the annual volume of gas contracted with White Martins. | | 110,999 | | 27,941 | | 95,301 | | 95,301 | | 95,301 | | | | | | 285,903 |
| | | | | | | | | | | | | | | | | | | | |
CEG Rio | Supply of natural gas | | CSN undertakes to buy at least 70% of the monthly natural gas volume. | | 441,804 | | 438,504 | | 145,416 | | | | | | | | | | 145,416 |
| | | | | | | | | | | | | | | | | | | | |
Vale S.A | Supply of iron ore pellets | | CSN undertakes to buy at least 90% of the volume of iron ore pellets secured by contract. The take-or-pay volume is determined every 18 months. | | 444,642 | | 383,327 | | 114,962 | | | | | | | | | | 114,962 |
| | | | | | | | | | | | | | | | | | | | |
Compagás | Supply of natural gas | | CSN undertakes to buy at least 80% of the annual natural gas volume secured agreed with Compagás. | | 18,874 | | 18,414 | | 18,349 | | 18,349 | | 18,349 | | 18,349 | | 128,446 | | 201,842 |
| | | | | | | | | | | | | | | | | | | | |
COPEL | Power supply | | CSN undertakers to buy at least 80% of the annual energy volume contracted with COPEL. | | 15,202 | | 18,697 | | 8,553 | | 8,553 | | 8,553 | | 8,553 | | 28,510 | | 62,722 |
| | | | | | | | | | | | | | | | | | | | |
K&K Tecnologia | Processing of blast furnace sludge generated during pig iron production | | CSN undertakes to supply at least 3,000 metric tons per month of blast furnace sludge for processing at K&K sludge concentration plant. | | 7,585 | | 8,460 | | 7,074 | | 7,074 | | 7,074 | | 7,074 | | 44,212 | | 72,508 |
| | | | | | | | | | | | | | | | | | | | |
Harsco Metals | Processing of slag generated during pig iron and steel production | | Harsco Metals undertakes to process metal products and slag crushing byproducts resulting from CSN’s pig iron and steel manufacturing process, receiving for this processing the amount corresponding to the product of the multiplication of unit price (R$/t) by total production of liquid steel from CSN steel mill, ensuring a minimum production of liquid steel of 400,000 metric tons. | | 40,506 | | 42,504 | | 15,944 | | | | | | | | | | 15,944 |
| | | | | | | | | | | | | | | | | | | | |
Siemens | Manufacturing, repair, recovery and production of ingot casting machine units | | Siemens undertakes to manufacture, repair, recover and produce, in whole or in part, ingot casting machine units to provide the necessary off-line and on-line maintenance of continuous ingot casting machine assemblies of the Presidente Vargas plant (UPV). Payment is set at R$/t of produced steel plates. | | 46,424 | | 40,596 | | 17,213 | | | | | | | | | | 17,213 |
(*) in renegotiation phase. | | | | | | | | | | | | | | | | |
| | | | | | 1,363,275 | | 1,278,824 | | 863,037 | | 569,502 | | 423,964 | | 194,046 | | 1,459,800 | | 3,510,349 |
FS-73
FS-79
| | | | | | | | | | | | | | | | | | | | | |
| | | | | | | Payments | | Minimum future payments |
| Concessionaire | | Type of service | | Agreement terms and conditions | | 2010 | | 2011 | | 2012 | | 2013 | | 2014 | | 2015 | | After 2015 | | Total |
| MRS Logística | | Iron ore transportation. | | Contractual clause providing for guaranteed revenue on railway freight. In the case ofCSN, this means a minimum payment of 80% of freight estimate. | | 92,504 | | 153,870 | | 176,058 | | 176,058 | | 176,058 | | 176,058 | | 88,029 | | 792,261 |
| MRS Logística | | Steel products transportation | | Transportation of at least 80% of annual volume agreed with MRS. | | | | 17,606 | | 58,762 | | 58,762 | | 58,762 | | 58,762 | | 24,484 | | 259,532 |
| MRS Logística | | Iron ore, coke and coal transportation. | | Transportation of 8,280,000 metric tons per year of iron ore and 3,600,000 metric tonsper year of coal, coke and other reducing agents. | | 7,151 | | 41,463 | | 100,060 | | | | | | | | | | 100,060 |
| FCA | | Mining products transportation. | | Transportation of at least 1,900,000 metric tons per year. | | 419 | | 1,324 | | 63,085 | | 63,085 | | | | | | | | 126,170 |
| FCA | | FCA railway transportation ofclinker to CSN Cimentos. | | Transportation of at least 675,000 metric tons per year of clinker in 2011 and 738,000metric tons per year of clinker starting 2012. | | | | 1,648 | | 26,937 | | 26,937 | | 26,937 | | 26,937 | | 116,727 | | 224,475 |
| ALL | | Railway transportation of steelproducts. | | Rail transportation of at least, 20,000 metric tons of steel products monthly, which can vary 10% up or down, originated at the Água Branca Terminal in São Paulo for CSN PR in Araucária, State of Paraná. | | 10,214 | | 14,774 | | 3,540 | | | | | | | | | | 3,540 |
| White Martins | | Supply of gas (oxygen, nitrogenand argon). | | CSN undertakers to buy at least 90% of the annual volume of gas contracted withWhite Martins. | | 103,098 | | 102,274 | | 93,606 | | 93,606 | | 93,606 | | 93,606 | | 93,606 | | 468,030 |
| CEG Rio | | Supply of natural gas. | | CSN undertakes to buy at least 70% of the monthly natural gas volume | | 431,093 | | 432,449 | | 280,322 | | | | | | | | | | 280,322 |
| Vale S.A | | Supply of iron ore pellets. | | CSN undertakes to buy at least 90% of the volume of iron ore pellets secured bycontract. The take-or-pay volume is determined every 18 months. | | 195,221 | | 349,797 | | 176,305 | | 176,305 | | 117,537 | | | | | | 470,147 |
| Compagás | | Supply of natural gas. | | CSN undertakes to buy at least 80% of the monthly natural gas volume contracted withCompagás. | | 15,318 | | 16,884 | | 13,281 | | 13,281 | | 13,281 | | 13,281 | | 119,531 | | 172,655 |
| COPEL | | Power supply. | | CSN undertakers to buy at least 80% of the annual energy volume contracted withCOPEL. | | 13,178 | | 13,378 | | 7,487 | | 7,487 | | 7,487 | | 7,487 | | 39,934 | | 69,882 |
| K&K Tecnologia | | Processing of blast furnace sludge generated during pig ironproduction. | | CSN undertakes to supply at least 3,000 metric tons per month of blast furnace sludge for processing at K&K sludge concentration plant. | | 1,082 | | 6,186 | | 7,074 | | 7,074 | | 7,074 | | 7,074 | | 51,283 | | 79,579 |
| Harsco Metals | | Processing of slag generated during pig iron and steel production. | | Harsco Metals undertakes to process metal products and slag crushing byproducts resulting from CSN’s pig iron and steel manufacturing process, receiving for this processing the amount corresponding to the product of the multiplication of unit price (R$/t) by total production of liquid steel from CSN steel mill, ensuring a minimumproduction of liquid steel of 400,000 metric tons. | | 37,279 | | 39,739 | | 30,000 | | 30,000 | | 15,000 | | | | | | 75,000 |
| Siemens | | Manufacturing, repair, recoveryand production of ingot castingmachine units. | | Siemens undertakes to manufacture, repair, recover and produce, in whole or in part, ingot casting machine units to provide the necessary off-line and on-line maintenance of continuous ingot casting machine assemblies of the Presidente Vargas plant (UPV). Payment is set at R$/t of produce steel plates. | | 38,569 | | 38,817 | | 32,324 | | 18,856 | | | | | | | | 51,180 |
| |
| | | | | | | 945,126 | | 1,230,209 | | 1,068,841 | | 671,451 | | 515,742 | | 383,205 | | 533,594 | | 3,172,833 |
Minimum future payments related to government concessions as of December 31, 20112013 fall due according to the schedule set out in the following table:
| | | | | | | | | | | | | | | |
| | | | | Minimum future payments |
Company
Concession | | Type of service | | 2012 | | 2013 | | 2014 | | 2015 | | After 2015 | | Total |
| MRS | | 30-year concession, renewable for another 30 years, to provide iron ore railway transportation services from the Casa de Pedra mines, in Minas Gerais, coke and coal from the Itaguaí Port, in Rio de Janeiro, to Volta Redonda, transportation of export goods to the Itaguaí and Rio de Janeiro Ports, and shipping of finishedgoods to the domestic market. | | 80,315 | | 80,315 | | 80,315 | | 80,315 | | 823,230 | | 1,144,490 |
| |
| Transnordestina | | 30-year concession granted on December 31, 1997, renewable for another 30years for the development of public utility to operate the Northeastern railwaysystem. The railway system covers 4,238 kilometers of railroads in the states ofMaranhão, Piauí, Ceará, Paraíba, Pernambuco, Alagoas and Rio Grande do Norte. | | 6,494 | | 6,494 | | 6,494 | | 6,494 | | 74,135 | | 100,111 |
| |
| Tecar | | Concession to operate TECAR, a solid bulk terminal, one of the four terminals that comprise the Itaguaí Port, in Rio de Janeiro, for a period ending 2022 and renewable for another 25 years. | | 111,225 | | 117,913 | | 125,922 | | 125,922 | | 881,455 | | 1,362,437 |
| |
| Tecon | | 25-year concession granted in July 2001, renewable for another 25 years, tooperate the container terminal at the Itaguaí Port. | | 22,129 | | 22,129 | | 22,129 | | 22,129 | | 221,293 | | 309,809 |
| |
| | | | | 220,163 | | 226,851 | | 234,860 | | 234,860 | | 2,000,113 | | 2,916,847 |
Company | | | | | | | | | | | | | | |
Concession | | Type of service | | $2,014.00 | | $2,015.00 | | $2,016.00 | | $2,017.00 | | After 2017 | | Total |
MRS | | 30-year concession, renew able for another 30 years, to provide iron ore railway transportation services from the Casa de Pedra mines, in Minas Gerais, coke and coal from the Itaguaí Port, in Rio de Janeiro, to Volta Redonda, transportation of export goods to the Itaguaí and Rio de Janeiro Ports, and shipping of finished goods to the domestic market. | | 90,952 | | 90,952 | | 90,952 | | 90,952 | | 750,356 | | 1,114,164 |
FTL (Ferrovia Transnordestina Logística) | | 30-year concession granted on December 31, 1997, renewable for another 30 years for the development of public utility to operate the Northeastern railway system. The railway system covers 4,238 kilometers of railroads in the states of Maranhão, Piauí, Ceará, Paraíba, Pernambuco, Alagoas and Rio Grande do Norte. | | 7,296 | | 7,296 | | 7,296 | | 7,296 | | 68,702 | | 97,886 |
Tecar | | Concession to operate TECAR, a solid bulk terminal, one of the four terminals that comprise the Itaguaí Port, in Rio de Janeiro, for a period ending 2022 and renew able for another 25 years. | | 185,771 | | 185,771 | | 185,771 | | 185,771 | | 928,855 | | 1,671,939 |
Tecon | | 25-year concession granted in July 2001, renewable for another 25 years, to operate the container terminal at the Itaguaí Port. | | 24,756 | | 24,756 | | 24,756 | | 24,756 | | 198,045 | | 297,069 |
| | | | 308,775 | | 308,775 | | 308,775 | | 308,775 | | 1,945,958 | | 3,181,058 |
c. Projects and other commitments
· Steel – Flat and long steel
CSN intends to produce 500,000 metric tons per year of long steel products, with an estimate of 400,000 t/year of rebar and 100,000 t/year of wirerod. The facilities will use scrap and pig iron as their main raw materials. In addition to this plant, CSN is assessing the option of implementing in Brazil other similar projects, also with 500,000 t/year capacity each.
· Iron ore project
FS-74
CSNThe expansion plan projects producing 89 mtpyMtpa of iron ore products including 50 mtpy at Casa de Pedra and 39 mtpy at Namisa.increase port capacity by 84 Mtpa in TECAR. In addition, athe first stage, CSN project producing up to 66 Mtpa of iron ore and is inventinginvesting in the expansion of theexpanding sea port capacity in Itaguaí seaport,, or TECAR, for a capacity of 84 mtpy. The current annual export capacity is equivalent to 30 million metric tons.60 Mtpa. Coal and coke imports are carried out through this the TECAR terminal.
Coal and coke imports are made using the TECAR terminal, whose concession agreement is 25 years, extendable for another 25 years.
Upon concession termination, all rights and privileges transferred to Tecon will be handed back to CDRJ (Companhia Docas do Rio de Janeiro), together with the assets owned by CSN and those resulting from investments made by CSN in leased assets, declared as returnable assets by CDRJ as they are necessary to the continuity of the related services. Any assets declared as returnable assets will be compensated by CDRJ at their residual value, less related depreciation/amortization.
FS-80
·Cement project
Up to December 2011 the Company had invested R$770 million in the constructiontable of an entirely new grinding unit in Volta Redonda and a new clinker blast furnace in Arcos, MG, with production capacity of 2.4 mtpy and 830,000 t/year, respectively. This project represents CSN’s entry into the cement market, taking advantage of the slag generated by its blast furnaces and its limestone reserves in Arcos.
In the fourth quarter of 2011, CSN cement sales totaled 484,346 metric tons (342,799 as of December 31, 2010) and we expect reaching full production capacity by 2012.These investments are partially financed by the BNDES.
contents
· Nova Transnordestina project
The Nova Transnordestina project includes building 1,728 km in new, next-generation, wide-gauge tracks. The project posts a 39% progress and completion is estimated for the end of 2016. The Company expects that the investments will permit Transnordestina Logística S.A. to boost the transportation of several products, such as iron ore, limestone, soy, cotton, sugarcane, fertilizers, oil, and fuel. The investments willConcessionaire of the Nova Transnordestina project, until no longer than 2057: the concession can be financed by means of several agencies, such asterminated before this date if the Northeast Investment Fund (FINOR),minimum return agreed with the Northeast Development Authority (SUDENE) and the BNDES. The CompanyGovernment is reached. Transnordestina has already obtained the required environmental permits and purchased part of the equipment contracted some of theand services and in certain regions the project is at an advanced implementation stage.
The financing sources of the project are: (i) financing granted by Banco do Nordeste/ FNE and the BNDES, (ii) debentures issued by FDNE, (iii) Permanent Track Use contracts, and (iv) interest in the capital of CSN and public shareholders. The approved construction investment is R$7,542,000 and the balance of disbursable funds will be adjusted using the IPCA as from April 2012. Should additional funds be required, they will be provided by CSN and/or third parties through the celebration of an Permanent Track Use Agreement.
The Company guarantees 100% of TLSA’s financing granted by Banco do Nordeste/FNE and the BNDES, and 40% of the debentures issued by FDNE. Under the FDNE charter, approved by Federal Decree 6,952/2009, and the Investment Agreement entered into with the public shareholders/ financiers, 50% of the debentures should be converted into TLSA shares.
·Expansion of Cimentos Sudeste
in addition to the current production of approximately 2.4 Mtpa at the Presidente Vargas Plant in Rio de Janeiro, CSN plans to expand its cement operation to 5.4 Mtpa. This additional 3 Mtpa volume will be obtained through the construction of a plant integrated with the cement mill and the clinker furnace in the State of Minas Gerais, where the Company already operates a clinker furnace using limestone from its own mine. The Company is the guarantor of BNDES loans for the Transnordestina project, which as of December 31, 2011 total R$392,874 (R$373,484 as of December 31, 2010). These loans are being used to finance the investmentsassessing growth opportunities in Transnordestina’s infrastructure. The maximum amount of future payments that can be required from the guarantor under the guarantee is R$392,874.other regions.
· CSN’s Logistic Platform Project in Itaguaí
Under the terms of the concession agreement, CSN is responsible for unloading at least 3.0 million per year of coal and coke from CSN’s suppliers through the terminal, as well as handling ore shipments. Among the approved investments announced by CSN, we highlight the development and expansion of the solid bulk terminal at Itaguaí so that it can also handle up to 84 million metric tons per year of iron ore.ore per year.
· Long-term agreements with Namisa
The Company has signed long-term agreements with Namisa for the provision of port operation services and supplies of run-of-mine (ROM) iron ore from the Casa de Pedra mine, as described below:
i. Port operating servicesoperation service agreement
FS-75
OnOctober 21, December 30, 2008, CSN entered into an agreement for the provision of port services to Namisa for a 35-year34-year period, consisting of receiving, handling, storing and shipping Namisa’s iron ore in annual volumes that range from 18.0 million to 39.0 million tonnes. On December 30, 2008,metric tons. CSN has received the amount of approximately R$5.3 billion as an advance for part of the payments due for the services to be provided under this agreement. The amounts charged for these port services are reviewed on a quarterly basis and adjusted considering the changes in the market price offor iron ore.
ii.II. High Silicasilicon ROM
On October 21,December 30, 2008, CSN also entered into an agreement for the supply of high silica crude ironsilicon ROM ore ROM to Namisa for a period of 3530 years in volumes that range from 25.742.0 to 54.0 million tons to 46.5 millionmetric tons per year. On December 30, 2008, CSN has received approximately R$1.6 billion as an advance for part of the payments due for the supplies made under this agreement.
FS-81
table of contents
The supply price is reviewed on a quarterly basis and adjusted considering the changes in the market price for iron ore.
III. Low silicon ROM
On December 30, 2008, CSN entered into an agreement for the supply of low silicon ROM ore to beNamisa for a period of 35 years in volumes that range from 2.8 to 5.04 million metric tons per year. CSN has received approximately R$424 million as an advance for part of the payments due for the supplies made under this agreement. The supply price is reviewed on a quarterly basis and adjusted considering the changes in the market price of iron ore.
iii. Low Silica ROM
On October 21, 2008, CSN entered into an agreement for the supply of low silica crude iron ore ROM ore to Namisa for a period of 9 years in volumes that range from 8 million tons to 30.6 million tons per year. On December 30 2008, CSN has received approximately R$424 billion as an advance for part of the payments due for the supplies to be made under this agreement. The supply price is reviewed on a quarterly basis and adjusted considering the changes in the market price of iron ore.
31. INSURANCE
Aiming to properly mitigate risk and in view of the nature of its operations, the Company and its subsidiaries have taken out several different types of insurance policies. Such policies are contracted in line with the CSN Risk Management policy and are similar to the insurance taken out by other companies operating in the same lines of business as CSN and its subsidiaries. The risks covered under such policies include the following: Domestic Transportation, International Transportation, Carrier’s Civil Liability, Importation, Exportation, Life and Casualty, Health Coverage, Fleet Vehicles, D&O (Civil Liability Insurance for Directors and Officers), General Civil Liability, Engineering Risks, Sundry Risks, Export Credit, Performance Bond and Port Operator’s Civil Liability.
In 2011,2013, after negotiation with insurers and reinsurers in Brazil and abroad, an Insurance Issue Certificate was issued Insurance Issued Certificate to hiringfor the contracting of a policy of Operational Risk of Property DamageDamages and Loss of Profits, with effect from March 23, 2011 to March 22, 2012, which had its term extended by the period of March 23, 2012June 30, 2013 to June 30, 2012.2014. Under the insurance policy, the LMI (Maximum Limit of Indemnity) is R$850,000US$500,000,000 and covers the following units and subsidiaries of the Company: Usina Presidente Vargas, Mineração Casa de Pedra, Mine, CSN Paraná, Arcos Mining,Terminal de cargas Tecar, Terminal Tecon, Namisa, CSN Porto Real, TECON Terminal, TECAR Coal Terminal, NAMISAHandel and Namisa Handel. CSN Cement. The Company decided to taketakes responsibility for a range of retention of R$170 millionUS$300,000,000 in excess of the deductibles for property damagedamages and loss of profits and co-participate with 53.55% of the risks. The Company plans to reduce the co-participation.profits.
In view of their nature, the risk assumptions adopted are not part of the scope of an audit of the financial statements and, accordingly, were not examined by our independent auditors.
32. ADDITIONAL INFORMATION TO CASH FLOWS
| | | | | | Consolidated |
| | 12/31/2013 | | 12/31/2012 | | 12/31/2011 (*) |
Deferred income tax and social contribution paid | 45,388 | | 72,780 | | 165,321 |
Increase of PP&E with interest capitalization | 490,747 | | 401,827 | | 353,156 |
Capital reduction with no cash effect | 153,305 | | | | |
| | 689,440 | | 474,607 | | 518,477 |
(*) As disclosed in notes 2(y) and 3, the financial information related to 12/31/11 was not restated by the adoption of the IFRS 10 and 11, as allowed by the IFRS 10 and 11’s relief.
33.STATEMENT OF COMPREHENSIVE INCOME
| | 12/31/2013 | | 12/31/2012 | | 12/31/2011 (*) |
Profit (loss) for the year | 533,994 | | -480,574 | | 3,667,234 |
| | | | | | |
Other comprehensive income | | | | | |
| | | | | | |
Items that will not be subsequently reclassified to the statement of income | | | | | |
Actuarial (losses) gains on defined benefit pension plan, net of taxes, net of deferred tax benefit (expense) of R$-33,143 in 2013, R$11,441 in 2012 and R$38,288 in 2011 | 64,336 | | 106,209 | | -74,331 |
| 64,336 | | 106,209 | | -74,331 |
| | | | | | |
Items that could be subsequently reclassified to the statement of income | | | | | |
Cumulative translation adjustments for the year | 218,927 | | 147,735 | | 195,046 |
Available-for-sale assets, net of taxes, net of deferred tax benefit (expense) of R$-24,410 in 2013, R$-618,648 in 2012 and R$165,962 in 2011 | 47,385 | | 1,499,156 | | -621,312 |
Net change in fair value of available-for-sale financial assets transferred to profit or loss | | | | -698,164 |
| 266,312 | | 1,646,891 | | -1,124,430 |
Total comprehensive income for the year | 864,642 | | 1,272,526 | | 2,468,473 |
| | | | | |
Attributable to: | | | | | |
Owners of the Company | 839,673 | | 1,332,987 | | 2,507,272 |
Non-controlling interests | 24,969 | | -60,461 | | -38,799 |
| 864,642 | | 1,272,526 | | 2,468,473 |
| | | | | | |
(*) As disclosed in notes 2(y) and 3, the financial information related to 12/31/11 was not restated by the adoption of the IFRS 10 and 11, as allowed by the IFRS 10 and 11’s relief.
FS-82
table of contents
34.SUBSEQUENT EVENTS
·Debentures – 7th issue
In March 2013 the Company issued 40,000 nonconvertible, unsecured debentures, in single series, in the total amount of R$400,000,000 bearing interest at a rate of 111.20% of the CDI rate per annum, and mature in March 2021, with early redemption option.
The net proceeds raised by the Company through the issue will be used to partially settle the 1st installment amortization of the Company’s 6th debenture issue, that due on March 30, 2014.
· Bond issuanceConselho Administrativo de Defesa Econômica – CADE Decision - Usiminas
On April 10, 2014 CADE issued its decision on the matter and a term of undertaking (Termo de Compromisso de Desempenho), or TCD, was executed by CADE and CSN. Under the terms of CADE’s decision and the TCD, CSN shall reduce its interest in Usiminas, within a specified timeframe. The timeframe and percentage reduction are confidential. Furthermore, our political rights in Usiminas will continue to be suspended until we reach the thresholds established in the TCD.
·Prepayment loan
On January 30,April 24, 2014, the Company entered into a new prepayment loan issued by Banco Santander in the amount of US$ 200 million which will mature in April 2019.
FS-83
table of contents
The following consolidated financial statements of Namisa, together with the report of Deloitte Touche Tohmatsu Auditores Independentes thereon, are filed as part of this annual report.
| | |
Nacional Minérios S.A. | | Page |
Report of Independent Registered Public Accounting Firm | | FS-R1 |
Consolidated financial statements: | | |
Balance sheets as of December 31, 2013 and 2012 | | FS- 1 |
| Statements of income for the years ended December 31, 2013 and 2012 | | FS- 3 |
| Statements of comprehensive income for the years ended December 31, 2013 and 2012 | | FS- 4 |
| Statements of cash flow for the years ended December 31, 2013 and 2012 | | FS- 5 |
| Statements of changes in shareholders’ equity for the years ended December 31, 2013 and 2012 | | FS- 6 |
| Notes to consolidated financial statement | | FS- 7 |
| | | |
table of contents
REPORT OF INDEPENDENT REGISTERED PUBLIC ACCOUNTING FIRM
To the Board of Directors and Shareholders of
Nacional Minérios S/A.
São Paulo – SP, Brazil
We have audited the accompanying consolidated balance sheet of Nacional Minérios S/A. and subsidiaries (the "Company") as of December 31, 2013 and 2012, and the related consolidated statements of income, comprehensive income, shareholders' equity, and cash flows for the years then ended. These financial statements are the responsibility of the Company's management. Our responsibility is to express an opinion on these consolidated financial statements based on our audits.
We conducted our audits in accordance with the auditing standards generally accepted in the United States of America. Those standards require that we plan and perform the audit to obtain reasonable assurance about whether the consolidated financial statements are free of material misstatement. The Company is not required to have, nor were we engaged to perform, an audit of its internal control over financial reporting. Our audits included consideration of internal control over financial reporting as a basis for designing audit procedures that are appropriate in the circumstances, but not for the purpose of expressing an opinion on the effectiveness of the Company’s internal control over financial reporting. Accordingly, we express no such opinion. An audit also includes examining, on a test basis, evidence supporting the amounts and disclosures in the consolidated financial statements, assessing the accounting principles used and significant estimates made by management, as well as evaluating the overall financial statement presentation. We believe that our audits provide a reasonable basis for our opinion.
In our opinion, such consolidated financial statements present fairly, in all material respects, the financial position of Nacional Minérios S/A. and subsidiaries as of December 31, 2013 and 2012, and the results of their operations and their cash flows for the years then ended, in conformity with International Financial Reporting Standards as issued by theInternational Accounting Standards Board - IASB.
/s/ Deloitte Touche Tohmatsu Auditores Independentes
DELOITTE TOUCHE TOHMATSU AUDITORES INDEPENDENTES
São Paulo – SP, Brasil
March 28, 2014
FS-R1
table of contents
Nacional Minérios S.A. | | | | |
Consolidated Balance Sheet | | | | | |
Thousands of Brazilian reais | | | | | |
| | | | | | |
Assets | | | | | |
| | | | | | |
| | Note | | 2013 | | 2012 |
CURRENT ASSETS | | | | | |
Cash and cash equivalents | 4 | | 4,815,211 | | 4,081,425 |
Trade receivables | 5 | | 220,739 | | 498,578 |
Inventories | 6 | | 85,599 | | 199,886 |
Advances to suppliers | | | 423,245 | | 694,029 |
Recoverable taxes | 7 | | 47,866 | | 150,891 |
Loans and receivables | | | 51,854 | | 26,375 |
Other assets | | | 3,549 | | 3,235 |
Total current assets | | | 5,648,063 | | 5,654,419 |
| | | | | | |
NON-CURRENT ASSETS | | | | | |
Advances to suppliers | 8 | | 8,522,067 | | 7,757,475 |
Loans and receivables | 8 | | 39,824 | | 69,479 |
Deferred taxes | 9 | | 1,968 | | 325,706 |
Recoverable taxes | 7 | | 124,596 | | 140,309 |
Other assets | | | 5,006 | | 3,704 |
Investments | 10 | | 171,760 | | 171,760 |
Property, plant and equipment | 11 | | 506,233 | | 466,459 |
Intangible assets | 12 | | 584,140 | | 578,688 |
Total non-current assets | | | 9,955,594 | | 9,513,580 |
| | | | | | |
TOTAL ASSETS | | | 15,603,657 | | 15,167,999 |
| | | | | | |
| | | | | | |
The accompanying notes are an integral part of these consolidated financial statements. |
FS-1
table of contents
Nacional Minérios S.A. | | | | | |
Consolidated Balance Sheet | | | | | |
Thousands of Brazilian reais | | | | | |
| | | | | | |
Liabilities and shareholders´ equity | | | | | |
| | | | | | |
| | Note | | 2013 | | 2012 |
LIABILITIES AND SHAREHOLDERS´ EQUITY | | | | | |
CURRENT LIABILITIES | | | | | |
Borrowings and financing | 13 | | 42,247 | | 1,588 |
Trade payables to third parties | | | 40,089 | | 76,806 |
Trade payables to related parties | 8 | | 17,487 | | 131,852 |
Accrued payroll and related taxes | | | 11,522 | | 18,456 |
Taxes payable | | | 22,488 | | 19,494 |
Proposed dividends | 16 | | 336,673 | | 736,673 |
Other payables | | | 82,229 | | 96,318 |
Total current liabilities | | | 552,735 | | 1,081,187 |
| | | | | | |
NON-CURRENT LIABILITIES | | | | | |
Borrowings and financing | 13 | | 339,961 | | 335,806 |
Provision for risks | 14 | | 5,020 | | 5,008 |
Tax payable | | | 65,981 | | - |
Other payables | | | 15,693 | | 14,587 |
Total non-current liabilities | | | 426,655 | | 355,401 |
| | | | | | |
Equity | | | | | |
Issued capital | 16 | | 2,800,000 | | 2,800,000 |
Capital reserves | 16 | | 6,473,699 | | 6,473,699 |
Earnings reserves | 16 | | 5,188,931 | | 4,296,075 |
Other comprehensive income | | | 161,637 | | 161,637 |
Total equity | | | 14,624,267 | | 13,731,411 |
| | | | | | |
TOTAL LIABILITIES AND SHAREHOLDERS´ EQUITY | | | 15,603,657 | | 15,167,999 |
| | | | | | |
| | | | | | |
The accompanying notes are an integral part of these consolidated financial statements. |
FS-2
Nacional Minérios S.A. | | | | |
Consolidated Statements of Income | | | | | |
Thousands of Brazilian reais | | | | | |
| | | | | | |
| | | | | | |
| | Note | | 2013 | | 2012 |
NET OPERATING REVENUE | 18 | | 2,369,836 | | 3,836,415 |
COST OF SALES | 19 | | -1,090,901 | | -2,203,494 |
| | | | | |
GROSS PROFIT | | | 1,278,935 | | 1,632,921 |
| | | | | |
OPERATING EXPENSES | | | | | |
Selling expenses | 19 | | -419,915 | | -828,646 |
General and administrative expenses | 19 | | -55,966 | | -57,985 |
Other expenses, net | 19 | | -21,033 | | -52,043 |
| | | | -496,914 | | -938,674 |
| | | | | | |
OPERATING PROFIT BEFORE FINANCE INCOME (COSTS) | | | 782,021 | | 694,247 |
| | | | | | |
FINANCE INCOME | | | | | |
Finance income, net | 20 | | 1,131,149 | | 1,034,301 |
Foreign exchange gains, net | 20 | | 523,562 | | 295,407 |
| | | | 1,654,711 | | 1,329,708 |
| | | | | | |
PROFIT BEFORE INCOME TAX AND SOCIAL CONTRIBUTION | | | 2,436,732 | | 2,023,955 |
| | | | | | |
INCOME TAX AND SOCIAL CONTRIBUTION | | | | | |
Current | 9 | | -1,220,138 | | -122,016 |
Deferred | 9 | | -323,738 | | -285,453 |
| | | | | | |
NET INCOME FOR THE YEAR | | | 892,856 | | 1,616,486 |
| | | | | | |
BASIC AND DILUTED EARNINGS | | | | | |
PER THOUSAND SHARES - R$ | | | 1.8794 | | 3.4026 |
| | | | | | |
| |
The accompanying notes are an integral part of these consolidated financial statements. |
FS-3
Nacional Minérios S.A. | | | |
Consolidated Statements of Comprehensive Income | | | |
Thousands of Brazilian reais | | | |
| | | | |
| | | | |
| | 2013 | | 2012 |
NET INCOME FOR THE YEAR | 892,856 | | 1,616,486 |
| | | | |
Other comprehensive income: | | | |
Exchange differences arising on translation of foreign operation | - | | - |
| | | | |
Total comprehensive income for the year | 892,856 | | 1,616,486 |
| | | |
| | |
The accompanying notes are an integral part of these consolidated financial statements. | |
FS-4
Nacional Minérios S.A. | | | | |
Consolidated Statement of Cash Flow | | | | |
Thousands of Brazilian reais | | | | |
| | | | | |
| | | 2013 | | 2012 |
CASH FLOWS FROM OPERATING ACTIVITIES | | | | |
Net income for the year | | 892,856 | | 1,616,486 |
Adjustments to reconcile the fiscal years net income with funds deriving from operational activities: | | | | |
Inflation adjustments and exchange differences, net | | -2,529 | | -31,085 |
Accrued charges on borrowings and financing | | 23,244 | | 24,977 |
Depreciation/depletion/amortization | | 20,716 | | 16,423 |
Income tax and social contribution deferred | | 1,543,876 | | 407,469 |
Provision for sales in installments | | 41,658 | | -42,175 |
Provision for interest receivable | | -686,333 | | -656,686 |
Dividends receivable - MRS Logística | | -31,841 | | -24,239 |
Other provisions | | 12,795 | | 88,522 |
| | | 1,814,442 | | 1,399,692 |
(Increase) decrease in operating assets: | | | | |
Trade receivables | | 238,369 | | -203,312 |
Inventories | | 92,417 | | 50,735 |
Advances to suppliers | | 24,115 | | -16,635 |
Recoverable taxes | | -16,585 | | -179,839 |
Other receivables | | 18,987 | | 5,200 |
| | | | | |
Increase (decrease) in operating liabilities: | | | | |
Trade payables to third parties | | -55,768 | | -1,715 |
Trade payables to related parties | | 57,579 | | 463,279 |
Accrued payroll and related taxes | | 892 | | 2,815 |
Taxes payable | | 70,711 | | -1,733 |
Other payables | | -5,283 | | -13,043 |
| | | | | |
Dividends received | | 33,171 | | 26,057 |
Income taxes paid | | -1,084,816 | | -119,268 |
Interest paid | | -21,837 | | -27,855 |
| | | | | |
Net cash generated by operating activities | | 1,166,394 | | 1,384,378 |
| | | | | |
CASH FLOWS FROM INVESTING ACTIVITIES | | | | |
Purchase of property, plant and equipment | | -66,841 | | -127,871 |
Net cash used in investing activities | | -66,841 | | -127,871 |
| | | | | |
CASH FLOWS FROM FINANCING ACTIVITIES | | | | |
New borrowings and financing | | - | | 12,989 |
Repayment of borrowings and financing | | -2,655 | | -1,414 |
Dividends paid | | -400,000 | | -300,000 |
| | | | | |
Net cash used in financing activities | | -402,655 | | -288,425 |
| | | | |
Effect of exchange rate changes on cash and cash equivalents | | 36,888 | | 53,538 |
| | | | |
NET INCREASE IN CASH AND CASH EQUIVALENTS | | 733,786 | | 1,021,620 |
| | | | | |
Cash and cash equivalents at the beginning of the year | | 4,081,425 | | 3,059,805 |
Cash and cash equivalents at the end of the year | | 4,815,211 | | 4,081,425 |
| | 733,786 | | 1,021,620 |
The accompanying notes are an integral part of these consolidated financial statements.
FS-5
Nacional Minérios S.A. |
Consolidated Statement of Changes in Shareholders' Equity |
Thousands of Brazilian reais | | | | | | | |
| | | | | | | | |
| | | | | | | | |
| | | Capital Reserves | | | | |
| | Share capital | Share premium | Special goodwill reserve | Earnings reserves | Other comprehensive income | Retained earnings | Total |
BALANCES AT DECEMBER 31, 2011 | 1,173,954 | 6,707,886 | 1,391,859 | 2,679,589 | 161,637 | - | 12,114,925 |
| | | | | | | | |
Net income | | | | | | 1,616,486 | 1,616,486 |
Capital increase (16.a) | 1,626,046 | -1,626,046 | | | | | |
Allocations: | | | | | | | |
Earnings reserves (16.d) | | | | 1,616,486 | | -1,616,486 | |
| | | | | | | | |
Balances at December 31, 2012 | 2,800,000 | 5,081,840 | 1,391,859 | 4,296,075 | 161,637 | - | 13,731,411 |
| | | | | | | | |
Net income | | | | | | 892,856 | 892,856 |
Allocations: | | | | | | | |
Earnings reserves (16.d) | | | | 892,856 | | -892,856 | |
| | | | | | | | |
Balances at December 31, 2013 | 2,800,000 | 5,081,840 | 1,391,859 | 5,188,931 | 161,637 | - | 14,624,267 |
The accompanying notes are an integral part of these consolidated financial statements.
FS-6
table of contents
Nacional Minérios s.a.
Notes to the Financial Statements
FOR THE YEARS ENDED DECEMBER 31, 2013 AND 2012
(In thousands of Brazilian reais - R$, unless otherwise stated)
1.GENERAL INFORMATION
Nacional Minérios S.A. (“Company” or “Namisa”) is a private corporation, incorporated in November 2006 and domiciled in Brazil. Its registered head office is in Congonhas, State of Minas Gerais.
The Company is controlled under a Shareholders’ Agreement entered into by Companhia Siderúrgica Nacional (“CSN”), which holds 60% of Namisa shares, and an Asian Consortium formed by the companies Itochu Corporation, JFE Steel Corporation, POSCO, Kobe Steel Ltd., Nisshin Steel Co. Ltd. and China Steel Corp, which jointly hold 40% of Namisa shares.
The Company and its subsidiaries included in the consolidated financial statements operate under joint control and carry out their mining operations in the Ferriferous Quadrilateral, in Minas Gerais, where the Company has ore mining rights and iron ore processing facilities. The Company also has an integrated logistics network, based on long-term contracts with CSN, consisting on a railroad and port facilities used to ship its production. This integrated logistics network allows transporting the iron ore produced in Congonhas, Ouro Preto, Itabirito, Rio Acima, and Nova Lima, State of Minas Gerais, to Itaguaí, State of Rio de Janeiro.
Own iron ore, added to the iron ore purchased from third parties, is basically sold in the international market, mainly in Europe and Asia. The prices charged in these markets are historically cyclical and subject to significant fluctuations over short periods of time, as a result of several factors related to worldwide demand, strategies adopted by the main steel producers, and foreign exchange rate. All these factors are beyond the Company’s control.
2.BASIS OF PRESENTATION AND SIGNIFICANT ACCOUNTING POLICIES
The consolidated financial statements have been prepared in accordance with International Financial Reporting Standards (IFRS)issued by the International Accounting Standards Board (IASB).
FS-7
The consolidated financial statements have been prepared based on the historical cost basis, except for certain financial instruments that are measured at fair values, as explained in the accounting policies below. Historical cost is generally based on the fair value of the consideration given in exchange for assets.
The significant accounting policies adopted in the preparation of the consolidated financial statements are as follows:
a)Foreign currency translation
(i)Functional and presentation currency
The consolidated financial statements have been prepared and are presented in Brazilian reais (R$), which is the Company's functional currency.
In 2012 the Company priced,implemented changes in the management of its wholly-owned subsidiary Namisa International Minérios, S.L.U. (“Namisa International”) and, as a result, started to centralize its corporate strategy, which is now an extension of its parent company’s business. Accordingly, it was necessary to meet the requirements of IAS 21 - Effects of Changes in Exchange Rates, to determine this subsidiary’s functional currency, which until December 31, 2011 was the US dollar. Based on the standard’s requirements, the Company changed this subsidiary’s functional currency to Brazilian real and prospectively recognized, beginning 2012, the translation effects directly in profit or loss for the year.
(ii)Balances and transactions
Foreign currency-denominated transactions are translated into the functional currency using the exchange rates effective on the transaction or valuation dates when items are measured. Exchange gains and losses resulting from the settlement of such transactions and the translation at the foreign exchange rates at year end, related to foreign currency denominated monetary assets and liabilities, are recognized in the income statement under “Foreign exchange gains, net”.
b)Use of estimates and judgments
Critical accounting estimates and assumptions are those deemed important to describe and record the Company’s financial position and require analysis and decision-making power, and more complex and subjective estimates and assumptions by Management. The application of these critical accounting policies frequently requires Management analysis and decision-making about the impacts of matters inherently uncertain with regard to the results from operations and the carrying amounts of assets and liabilities. Actual results may differ from these estimates.
FS-8
table of contents
The estimates and assumptions that present a significant risk of causing a material adjustment to the carrying amounts of assets and liabilities within the next fiscal year are disclosed in the notes to the consolidated financial statements and refer to taxes on income, goodwill impairment testing, revenue recognition, review of useful lives and impairment of property, plant, and equipment, contingent assets and liabilities, legal obligations and obligations related to decommissioning and impairment of assets.
c)Cash and cash equivalents
Include cash, bank deposit accounts and short-term investments, which consist of highly liquid temporary investments, stated at cost plus income earned through the end of the reporting period, with an insignificant risk of change in fair or realizable values.
d)Trade receivables
Correspond to the amounts receivable from customers for the sale of iron ore in the normal course of the Company’s business. These are initially recognized at fair value and subsequently measured using the effective interest method less an allowance for impairment losses, if necessary. Foreign trade receivables are adjusted using the exchange rates prevailing at the end of the reporting period.
e)Inventories
Inventories are carried at the lower of cost and net realizable value. Cost is determined using the weighted average cost method on the acquisition of raw materials. The costs of finished products and work in process comprise raw materials, labor and other direct costs (based on the normal production capacity). Net realizable value represents the estimated selling price in the normal course of business, less estimated costs of completion and costs necessary to make the sale.
f)Advances to suppliers
Consist of long-term advances made to CSN for purchases of raw materials and provision of port services. The advances were initially recognized at fair value and are measured at amortized cost plus contractually agreed interest (see note 8). The advances are realized when the raw materials are delivered and port services are provided; 34% of the interest calculated monthly is received in cash. The portion not expected to be realized within 12 months is classified in noncurrent assets.
FS-9
g)Property, plant and equipment
Property, plant and equipment are carried at historical cost, consisting of the acquisition, production or construction cost, less accumulated depreciation and impairment losses, if any.
The elements of cost of a property, plant and equipment item comprise: (i) its purchase price, including import duties and non-refundable purchase taxes, after deducting trade discounts and rebates; (ii) any costs directly attributable to bringing the asset to the location and condition necessary for it to be capable of operating in the manner intended by Management; and (iii) the initial estimate of the costs of dismantling and removing the item and restoring the site on which it is located. These costs represent the obligation incurred by the Company when the item is acquired or as a consequence of having used the item during a particular period for purposes other than to produce inventories during that period.
Gains and losses on the disposal of a property, plant and equipment item are calculated by comparing the disposal proceeds with the carrying amount of the property, plant and equipment item, and are recognized at their net amount, as other income, in profit or loss.
Depreciation is recognized in profit or loss using the straight-line method, based on the estimated useful lives of each part of an item of property, plant and equipment, and ore deposits depletion is calculated based on the ore volume extracted as compared to the mineable reserve, as this is the method that most closely reflects the expected pattern of consumption of the future economic benefits embodied in the asset. Land is not depreciated.
The depreciation methods, the useful lives and the residual values are reviewed at the end of the reporting period, and possible adjustments are recognized as changes in accounting estimates.
Exploration expenditures are recognized as expenses until the viability of mining activities is established; after this period subsequent development costs are capitalized. Exploration and valuation expenditures include:
·Research and analysis of exploration area historical data;
·Topographic, geological, geochemical and geophysical studies;
·Determine the mineral asset’s volume and quality;
·Examine and test the extraction processes and methods;
·Topographic surveys of the transportation and infrastructure needs;
·Market studies and financial studies;
The costs for the development of new mineral deposits or capacity expansion in mines in operation are capitalized and amortized using the produced (extracted) units method based on the probable and proven ore quantities.
Stripping costs (the costs associated with the removal of overburdened and other waste materials) incurred during the development of a mine, before production commences, are capitalized as part of the depreciable cost of developing the property. Such costs aresubsequently amortized over the useful life of the mine based on proven and probable reserves.
FS-10
Post-production stripping costs are included in the cost of the inventory produced (that is extracted), except when a new campaign is launched to permit the access to a significant new ore body. In such cases, the cost is capitalized as a non-current asset and amortized during the extraction of the ore body.
h)Intangible assets
Consist basically of goodwill arising on the acquisition of subsidiary, subsequently merged, as detailed in note 12, recognized as the positive difference between the price paid and the net fair value of the acquiree’s assets and liabilities.
Goodwill has an indefinite useful life, is not subject to amortization, and is tested for impairment at least annually. Impairment losses, if any, are not reversed in subsequent periods.
The Company has a single Cash Generating Unit (CGU), dedicated exclusively to iron ore processing, to which goodwill was allocated for impairment test purposes.
FS-11
i)Impairment of nonfinancial assets
The Company reviews annually, or in a shorter period when there is evidence of impairment, the carrying amount of nonfinancial assets subject to amortization to assess events or changes in economic, operating or technological circumstances that might indicate an impairment of assets. Whenever such evidences are identified and the carrying amount exceeds the recoverable amount, an allowance for impairment is recognized to adjust the carrying amount to the recoverable amount. The recoverable amount of an asset is the higher of its value in use or its fair value less costs to sell.
j)Current and noncurrent assets and liabilities
An asset is recognized in the balance sheet when it is probable that its future economic benefits will flow to the Company and its cost or amount can be measured reliably. A liability is recognized in the balance sheet when the Company has a legal or constructive obligation as a result of a past event and it is probable that an outflow of funds will be required to settle the obligation. Liabilities include charges, inflation adjustments, or exchange differences incurred, when applicable. Assets and liabilities are classified as current when their realization or settlement within the next twelve months is probable. Otherwise, assets and liabilities are stated as noncurrent.
k)Borrowings and financing
Adjusted through the end the reporting period according to exchange fluctuation or for inflation indices, and the financial charges incurred, as contractually agreed.
l)Employee benefits – pension fund and variable compensation program
The Company sponsors a pension plan created in 2012, managed by a pension fund (CBSPREV Namisa), which grants employees defined contribution pension benefit and defined benefit risk benefits (sickness allowance, disability retirement pensions, and survivors’ pensions), fully funded by the employees.
The regular contributions to the pension plan cover the net costs and are recognized in profit or loss for the period when they become due. The Company’s obligation is limited to the monthly contributions made during the time an employee is working. As the risk benefits are fully funded by the employees, the Company only recognizes a liability when the fund accumulated for this purpose is insufficient to cover the benefits provided.
The Company recognizes a liability related to the variable compensation program and profit sharing and bonus payment expenses, calculated based on qualitative and quantitative goals set by Management and recognized in employee benefits line items, in profit or loss.
FS-12
m)Contingent assets and contingent liabilities, and legal obligations
Provisions are recognized when the Company has a present obligation (legal or constructive) as a result of a past event, it is probable that the Company will be required to settle the obligation, and a reliable estimate can be made of the amount of the obligation.
Contingent assets are recognized only when there are collaterals or favorable, unappealable court decisions. Contingent assets with a probable favorable outcome are only disclosed in an explanatory note. Contingent liabilities are provided for to the extent that the Company expects to disburse cash, losses are assessed as probable, and the involved amounts can be reliably measured. When the expected likelihood of loss is assessed as possible, a description of the lawsuits and involved amounts is disclosed in the explanatory notes. Contingent liabilities whose likelihood of loss is assessed as remote are neither provided for nor disclosed, and legal obligations are recognized as payable.
n)Income tax and social contribution
Taxes on income comprise current and deferred income tax (IRPJ) and social contribution (CSLL). These taxes are recognized in the income statement, except to the extent that they relate to items recognized directly in equity. In this case, they are also recognized in equity, in other comprehensive income.
Current taxes are calculated based on tax laws enacted or substantially enacted by the end of the reporting period in the countries where the Company and its subsidiaries operate and generate taxable profit. In Brazil, the statutory income tax rate is 34%.
Deferred taxes are recognized on temporary differences between the tax bases of assets and liabilities and their carrying amounts in the consolidated financial statements, except: (i) on the initial recognition of assets and liabilities in a transaction that is not a business combination and that affects neither the taxable profit nor the accounting profit; and (ii) differences associated with investments in subsidiaries and controlled entities when it is probable that they will not reverse in the foreseeable future.
Deferred tax assets are only recognized to the extent that it is probable that taxable profits will be available against which those temporary differences can be utilized, based on future projected earnings prepared and supported based on internal assumptions and future economic scenarios, which may, therefore, be subject to changes.
Deferred tax assets and liabilities are presented on a net basis since there is a legally enforceable right to set off current tax assets against current tax liabilities and when they relate to income taxes imposed by the same tax authority on the same entity subject to taxation.
FS-13
o)Investments
As mentioned in note 10, the 10% of preferred shares of MRS Logística is the only investment of the Company and is measured at historical cost
p)Distribution of dividends
The distribution of dividends to the Company’s shareholders is recognized as a liability in the Company’s consolidated financial statements at the end of the year, according to its bylaws. Any amount in excess of the mandatory minimum dividend is accrued on the date it is approved by shareholders at the General Meeting. As mentioned in note 16, theShareholders are discussing the long-term agreements entered into with Companhia Siderurgica Nacional for purchases of raw materials and port services, and accordingly dividends decisions have been extensively discussed before any distribution.
FS-14
q)Net operating revenue
Revenue from the sale of iron ore in the normal course of business is measured at the fair value of the consideration received or receivable. Operating revenue is recognized when there is convincing evidence that the most significant risks and rewards of ownership of goods have been transferred to the buyer, it is probable that future economic benefits will flow to the entity, the associated costs and possible returns can be reliably estimated, there is no continued involvement with the goods sold, and the amount of the operating revenue can be reliably measured. If it is probable that discounts will be granted and the value thereof can be reliably measured, then the discount is recognized as a reduction of the operating revenue as sales are recognized.
Due to the individual terms of the sales and freight agreement, the transfer of the risks and rewards usually takes place when the products are load into the ship, in the port of origin.
r)Finance income and finance costs
Finance income comprises interest earned on short-term investments, prepayments to related parties, dividends (except for dividends received by investees measured under equity method at the parent), and changes in the fair value of financial assets measured at fair value through profit or loss. Interest income is recognized in profit or loss under the effective interest method. Dividend income is recognized in profit or loss when the Company’s right to receive the payment has been established. Distributions received from investees accounted for using the equity method reduce the value of the investment.
When applicable, finance costs include costs on interest on borrowings, net of discount to present value of provisions, changes in the fair value of financial assets measured at fair value through profit or loss, and impairment losses recognized in financial assets. Borrowing costs that are not directly attributable to the acquisition, construction or production of a qualifying asset are measured through profit or loss using the effective interest method.
Exchange gains and losses are reported on a net basis.
s)Financial instruments
Financial assets and financial liabilities
·Financial assets
Financial assets can be classified in the following categories: (i) at fair value through profit or loss; (iii) held to maturity; (iii) loans and receivables; and (iv) available for sale. The classification depends on the nature and purpose of the financial assets and is determined on initial recognition. The Company does not have assets classified as held to maturity or available for sale.
(i)At fair value through profit or loss
Financial assets are measured at fair value through profit or loss when they are held for trading, or are designated as measured at fair value through profit or loss on their initial recognition. Financial assets are classified as held for trading when acquired mainly to be sold in the short term. A financial that is not held for trading can bedesignated as at fair value through profit on initial recognition, when such designation would eliminate or significantly reduce an inconsistency in the measurement or recognition.Financial assets at fair value through profit or loss are measured at fair value, together with gains and losses recognized in profit or loss for the year. Net gains or losses recognized in profit or loss include dividends or interest earned by the financial asset.
FS-15
(ii)Loans and receivables
These consist of financial assets with fixed or determinable payments that are not quoted in an active market, measured at amortized cost using the effective interest method, less the allowance for impairment losses, when applicable. Interest income is recognized using the effective interest method.
Effective interest method
A method used to calculate the amortized cost of a financial asset or a financial liability and allocate interest income or interest expenses over the relevant period. The effective interest rate is the rate that exactly discounts estimated future cash payments or receipts (including all fees paid or received that are an integral part of the effective interest rate, transaction costs, and other premiums or discounts) through the expected financial asset life, or, when appropriate, for a shorter period.
·Financial liabilities
Financial liabilities can be classified as: (i) financial liabilities at fair value through profit or loss; or (ii) other financial liabilities. The Company does not have financial liabilities measured at fair value.
Other financial liabilities are initially measured at fair value, less transaction costs, and are subsequently measured at amortized cost using the effective interest method, with interest expense recognized on a yield basis. The effective interest method is a method of calculating the amortized cost of a financial liability and allocating interest expense over the year.
The effective interest rate is the rate that exactly discounts estimated future cash payments through the expected life of the financial liability or, where appropriate, over a shorter period.
t)New and revised standards adopted for the first time as effective as for the year beginning January 1, 2013.
The following new standards, amendments to and interpretations of standards were issued by the International Accounting Standards Board - IASB effective as for the year beginning January 1, 2013:
·IAS 1 - Presentation of Financial Statements
·IAS 19 (R) - Employee Benefits
·IAS 28 (R) - Investments in Associates and Joint Ventures
FS-16
·IFRS 7 - Financial Instruments: Disclosures
·IFRS 10 - Consolidated Financial Statements
·IFRS 11 - Joint Arrangements
·IFRS 12 - Disclosure of Interests in Other Entities
·IFRS 13 - Fair Value Measurement
·IFRIC 20 - Stripping Costs in the Production Phase of a Surface Mine
These new standards were considered in the preparation of these consolidated financial statements; however, there is no material impact on the presentation and on the Company's financial position and results of operations.
u)New standards, amendments to and interpretations issued and not yet adopted
The following standards, amendments to and IFRS interpretations issued by the IASB are not yet effective and were not early adopted by the Company for the year ended December 31, 2013:
Standard | Description | Effective date |
IAS 32 | Financial Instruments: Presentation, on the offsetting of assets and liabilities. Provides additional clarifications to the application guidance in IAS 32 on the requirement to offset financial assets and financial liabilities in the balance sheet. | January 1, 2014 |
Revised IFRS 10, IFRS12 and IAS27 | The amendments to IFRS10 define an investment entity and require a reporting entity that meets the definition of an investment entity not to consolidate its subsidiaries but instead to measure its subsidiaries at fair value through profit or loss in its consolidated and separate financial statements. The amendments to IFRS 12 and IAS 27 introduce new requirements to the disclosure of investment entities. | January 1, 2014 |
IFRIC 21 | Clarifies that an entity recognizes a liability for a tax when the activity that triggers payment occurs. For a levy that requires its payment to be triggered upon reaching a certain threshold, the interpretation indicates that no liability should be recognized before the specified minimum threshold is reached. | January 1, 2014 |
Revised IAS 39 | This revision provides relief on the discontinuance of hedge accounting when the novation of a derivative designated as hedging instrument meets certain criteria. | January 1, 2014 |
Amendment to IAS 36 | The amendment reduces the circumstances in which the recoverable amount of assets or cash-generating units is required to be disclosed. | January 1, 2014 |
IFRS 9 | Financial Instruments. IFRS 9 retains but simplifies the mixed measurement model and establishes two primary measurement categories for financial assets: amortized cost and fair value. The basis for classification depends on the entity’s business model and the contractual cash flow characteristics of the financial asset. The IAS 39 guidance on the impairment of financial assets and on hedge accounting continues to apply. The amendment to IFRS 9 postpones the effective date from 2013 to 2015. It also eliminates the requirement for restatement of comparative information and requires additional disclosures on the transition to IFRS 9. | January 1, 2015 |
FS-17
The Company does not expected that these new standards will have a material impact on its financial statements in 2014.
3.CONSOLIDATED FINANCIAL STATEMENTS
The subsidiaries included in the consolidated financial statements are all entities, whose financial and operating policies can be conducted by the Company and when it is exposed to, or has rights to, variable returns from its involvement with the entity and has the ability to use its power to affect its returns. The existence and effect of potential voting rights that are actually exercisable or convertible are taken into consideration when assessing whether the Company controls another entity. Subsidiaries are fully consolidated from the date when control is transferred to the Company and are deconsolidated from the date when such control ceases.
The consolidated financial statements used in the consolidation process are prepared based on the accounting policies described above and include the consolidated financial statements of the Company and its subsidiaries listed below, and have been prepared in accordance with the following criteria: (a) elimination of intragroup balances in consolidated companies; (b) elimination of the Parent Company’s investments against the related investee’s equity, as applicable; (c) elimination of revenues and expenses arising from transactions between consolidated companies; and (d) elimination of profits on inventories, when applicable, arising from sales between consolidated companies.
FS-18
4.CASH AND CASH EQUIVALENTS
| | |
| | 2013 | | 2012 |
| | | | |
Cash and bank deposit accounts | | 3,626 | | 2,675 |
Short-term investments: | | | | |
In Brazil (a) | | 507,065 | | 433,121 |
Abroad (b) | | 4,304,520 | | 3,645,629 |
| | 4,811,585 | | 4,078,750 |
Total | | 4,815,211 | | 4,081,425 |
(a)Fixed income - are investments in Bank Deposit Certificates (CDBs) and debentures with yield linked to the variation of the Interbank Deposit Certificate (CDI). These investments yield approximately 100% of the CDI variation and can be immediately redeemed by the Company, without risks of significant changes in their carrying amount.
(b)Time deposits - temporary deposits in prime banks with daily liquidity, yielding fixed rates of approximately to 0.8% per year.
FS-19
table of contents
5.TRADE RECEIVABLES
| | | |
| | | 2013 | | 2012 |
| | | | | |
Current: | | | | |
Trade receivables - related parties (note 8) | | 403 | | 293,998 |
Domestic customers | | 1,868 | | 855 |
Foreign customers | | 218,468 | | 203,725 |
Total | | 220,739 | | 498,578 |
As of December 31, 2013 and 2012, there were no past-due receivables and the average days sales outstanding was 47 days (40 days in 2012).
To determine the recovery of trade receivables, the Company takes into consideration any change in the customer’s creditworthiness from the date the credit was originally granted through the end of the reporting period. The credit risk concentration is limited because the customer base is comprehensive and there is no relationship between customers.
6.Inventories
| | |
| | 2013 | | 2012 |
| | | | |
Finished goods | | 42,192 | | 157,383 |
Raw materials | | 9,259 | | 6,391 |
Storeroom supplies | | 32,892 | | 33,154 |
Inventories in transit | | 1,256 | | 2,958 |
Total | | 85,599 | | 199,886 |
| | | | |
The Company assesses periodically the need to recognize an allowance for inventory losses and, as of December 31, 2013 and 2012, there was no need to recognize such an allowance.
7.RECOVERABLE TAXES
| | |
| | 2013 | | 2012 |
| | | | |
Prepaid income tax and social contribution | | 8,071 | | 93,933 |
State VAT (ICMS) | | 148,974 | | 144,990 |
Taxes on revenue (PIS and COFINS) | | 4,396 | | 43,099 |
Withholding Income Tax (IRRF) | | 10,814 | | 5,064 |
Other | | 207 | | 4,114 |
Total | | 172,462 | | 291,200 |
| | | | |
Current assets | | 47,866 | | 150,891 |
Noncurrent assets | | 124,596 | | 140,309 |
Total | | 172,462 | | 291,200 |
The non-current portion refers basically to ICMS credits. Namisa is an export company, accumulating ICMS credits in its branches, mainly in Congonhas due to its mining processingoperations with CSN Resourcesand also in Ouro Preto and Fernandinho due to its purchases of electric power and diesel oil.
FS-20
The Company's management periodically assesses the recovery of ICMS credits and concluded that it is not necessary to record any allowance for impairment of these credits.
The Company has been successful in realizing the ICMS credits through the acquisition of trucks for transportation of iron ore.
8.RELATED-PARTY BALANCES AND TRANSACTIONS
The Company’s operations are integrated with CSN, including service provision, iron ore supply, in Casa Pedra, port loading, in the Coal Terminal (“TECAR”) in Itaguaí, RJ, and the railway transportation transactions, the latter with MRS Logística S.A. (“MRS Logística”).
As of December 31, 2013 and 2012, the balances of assets and liabilities and the transaction amounts are as follows:
a)Balance sheet accounts
| | | |
| | | | |
| | | | MRS | Asian | | | MRS | Asian | |
| | | | | | | | | | |
| | | | | | | | | |
Assets | | | | | | | | |
Current assets: | | | | | | | | |
Trade receivables | 403 | - | - | 403 | 293,998 | - | - | 293,998 |
Other receivables (1) | 40,533 | - | - | 40,533 | 13,702 | - | - | 13,702 |
Dividends (1) | - | 11,234 | - | 11,234 | - | 10,606 | - | 10,606 |
Prepayments (2) | 421,550 | - | - | 421,550 | 668,200 | - | - | 668,200 |
Total | 462,486 | 11,234 | - | 473,720 | 975,900 | 10,606 | - | 986,506 |
Noncurrent assets: | | | | | | | | |
Prepayments (2) | 8,522,067 | - | - | 8,522,067 | 7,757,475 | - | - | 7,757,475 |
Loans and receivables | 39,824 | - | - | 39,824 | 69,479 | - | - | 69,479 |
Total | 8,561,891 | - | - | 8,561,891 | 7,826,954 | - | - | 7,826,954 |
| | | | | | | | | |
FS-21
Liabilities | | | | | | | | |
Current liabilities: | | | | | | | | |
Trade payables | 11,125 | 6,362 | - | 17,487 | 121,273 | 10,579 | - | 131,852 |
Borrowings and financing | 40,054 | - | - | 40,054 | 145 | - | - | 145 |
Dividends | 202,004 | - | 134,669 | 336,673 | 442,004 | - | 294,669 | 736,673 |
Other payables | 59,531 | 2,465 | - | 61,996 | 56,265 | 10,578 | - | 66,843 |
Total | 312,714 | 8,827 | 134,669 | 456,210 | 619,687 | 21,157 | 294,669 | 935,513 |
Noncurrent liabilities: | | | | | | | | |
Borrowings and financing | 320,936 | - | - | 320,936 | 314,699 | - | - | 314,699 |
Total | 320,936 | - | - | 320,936 | 314,699 | - | - | 314,699 |
(1)Refer to amounts recorded in the balance sheet, in line item ‘Loans and receivables’.
(2)Refer to amounts recorded in the balance sheet, in line item ‘Advances to suppliers’.
FS-22
b)Related-party transactions
| | | |
| | | | |
| | | | MRS | Asian | | | MRS | Asian | |
| | | | | | | | | | |
| | | | | | | | | |
Profit or loss | | | | | | | | |
Revenues | 20,495 | - | 223,146 | 243,641 | 1.046.225 | - | 178,039 | 1,224,264 |
Costs | (330,910) | (206,826) | - | (537,736) | (1,291,860) | (456,290) | - | (1,751,150) |
Finance income (costs), net | 1,022,217 | 33,325 | - | 1,055,542 | 929,836 | 24,239 | - | 954,075 |
Exchange gains (losses), net | (43,854) | - | - | (43,854) | (11,275) | - | - | (11,275) |
Total | 667,948 | (173,501) | 223,146 | 717,593 | 672,926 | (432,051) | 178,039 | 415,914 |
| | | | | | | | |
c)Description of the agreements with related parties
The following is a description of the main transactions with related parties:
i)Companhia Siderúrgica Nacional (“CSN”) - (prepayment) and ore exports
The Company entered into long-term agreements with CSN, for the provisions of port operation services and raw iron ore supply (“ROM”) from the Casa de Pedra mine, as described below:
·Port operation services and iron ore supply agreement
On December 30, 2008, the Company entered into an additional bond issuanceagreement to acquire port services and purchase iron ore with CSN, for an estimated 34-year period. The agreement volume is 1.7 million metric tons of raw iron ore and port services for a volume of 1.1 million metric tons. The Company prepaid the equivalent to approximately 60% of the port services value, amounting to US$200R$7.3 billion. The prepaid amounts are adjusted for inflation at the rate of 12.5% per year.
Additionally, the Company conducts iron ore exports to CSN subsidiaries abroad, to sell the iron ore in the international market.
FS-23
table of contents
ii)Loans (export prepayments)
The Company entered into export prepayment financial agreements with certain CSN subsidiaries, which are detailed in note 13.
iii)MRS Logística
The Company entered into a long-term railway transportation service agreement to ship and handle its production. The obligations assumed and the amounts involved as detailed in note 14.
iv)Asian Consortium
The Company exports its products to the members of the Asian Consortium, under long-term agreements and at prices based on market quotations.
d)Management compensation
The key management personnel, who have the authority and responsibility for planning, managing and controlling Company operations, include the members of the Board of Directors, the statutory officers, and the other officers. The table below shows the breakdown of their compensation as of December 31, 2013 and 2012:
| 2013 | | 2012 |
| | | |
Compensation | 2,549 | | 2,631 |
Postemployment benefits | 22 | | 16 |
Total | 2,571 | | 2,647 |
| | | |
9.INCOME TAX AND SOCIAL CONTRIBUTION
a)Income tax and social contribution expenses recognized in profit or loss:
| |
| 2013 | | 2012 |
| | | |
Current | (1,220,138) | | (122,016) |
Deferred | (323,738) | | (285,453) |
Total | (1,543,876) | | (407,469) |
| | | |
b)The reconciliation of the consolidated income tax and social contribution expenses with the effective statutory rates is as follows:
FS-24
| | | |
| | | 2013 | 2012 |
| | | | |
Profit before income tax and social contribution | | 2,436,732 | 2,023,955 |
Income tax and social contribution expenses based on pretax profit, at their combined statutory rate | | 34% | 34% |
| | | (828,489) | (688,145) |
| | | | |
Effect of income tax on permanent differences: | | | |
Tax-exempt foreign profit | | 238,175 | 273,905 |
Foreign profit taxable in Brazil | | (54,287) | - |
Transfer pricing adjustments (PECEX) | | (22,862) | - |
Not taxable gain with fines and interest reverted by the adherence of REFIS (note 20) | | 114,466 | - |
REFIS – Law nº 12,864/13 – principal amount (note 22) | | (995,383) | - |
Tax incentive - Workers' Meal Program (PAT). | | 8,421 | 3,129 |
Other permanent differences | | (3,917) | 3,642 |
Income tax and social contribution expenses | | (1,543,876) | (407,469) |
| | | |
c)Deferred income tax and social contribution are recognized to reflect the tax effects attributable to temporary differences between the tax bases of assets and liabilities and their carrying amounts, as shown below:
| | |
| | 2013 | 2012 |
| | | |
Assets: | | |
Allowance for losses - advances to suppliers | 3,297 | 3,297 |
CFM/Cayman goodwill prior to merger, added in 2008 | - | 484 |
Operating provisions | 20,712 | 24,615 |
Provision for loss on inventories | 12,148 | 29,970 |
Goodwill deductible for tax purposes - Big Jump | 162,383 | 440,756 |
Deferred tax liabilities recognized by the deductibility of goodwill generated by the acquisition of Cayman and CFM in prior year | (196,572) | (188,028) |
Exchange differences | - | 14,612 |
Total | 1,968 | 325,706 |
The movement in the deferred taxes balance in the years ended December 31, 2013 and 2012 is as follows:
| | |
| | 2013 | 2012 |
Opening balance | 325,706 | 611,159 |
Goodwill amortization for tax purposes | (287,401) | (326,367) |
Recognition (reversal) of operating provisions | (3,903) | 17,230 |
Adjustments for temporarily nondeductible inventories | (17,822) | 29,766 |
Exchange differences | (14,612) | 14,612 |
Utilization of tax loss carryforwards | - | (20,694) |
Closing balance | 1,968 | 325,706 |
A substancial portion of deferred income tax and social contribution is related to goodwill generated on a merger of subsidiary. Management conducted a study and expects to full realize deferred tax assets in 2014.
FS-25
Provisional Act 627 of 2013
On November 11, 2013 Provisional Act (“MP”) 627 was issued to repeal the Transitional Tax Regime (RTT) and introduce other provisions, including: (i) it amends Decree Law 1,598/77, which addresses the corporate income tax and the social contribution on net income law; (ii) it establishes that any change in or the adoption of accounting methods and criteria under administrative measures issued based on the jurisdiction attributed by the Commercial Law, after the enactment of this Provisional Act, shall not have any impact on the calculation of federal taxes until a tax law addressing the matter is enacted; (iii) it provides for a specific treatment of the potential taxation of profits or dividends; (iv) it includes provisions on the calculation of interest on capital; and (v) it provides new considerations about investments accounted for by the equity method of accounting. The provisions of Provisional Act 627 are effective from 2015; however, its early irrevocable adoption in 2014 could eliminate the potential tax effects, especially those related to dividends and interest on capital actually paid since 2008 until the Provisional Act issue date.
FS-26
table of contents
The Company prepared studies on the possible effects that could arise from the provisions of said Provisional Act and concluded that they would not result in material adjustments to its consolidated financial statements for the year ended December 31, 2013.
Management is awaiting the analysis of said Provisional Act by the Legislative Power to decide on its possible early adoption in calendar 2014.
10.INVESTMENT
| | | |
| | | 2013 | | 2012 |
| | | | | |
Investment in equity securities: | | | | |
MRS Logística S.A. | | 171,760 | | 171,760 |
| | | - | | - |
| | | 171,760 | | 171,760 |
| | | | |
The following is a brief description of the investment:
·MRS Logística
In November 2008, CSN capitalized at Namisa 10% of the nonvoting, nonconvertible class “A” preferred shares of MRS Logística, for R$172 million, as disclosed in the subscription report and share valuation report issued by reopeningMRS Logística.
MRS Logística is a corporation engaged in the operation and development of public cargo railway transportation services in the Southeast network, which covers Rio de Janeiro, São Paulo, and Belo Horizonte.
The investment in MRS is measured at historical cost.
FS-27
table of contents
11.PROPERTY, PLANT AND EQUIPMENT
a)Breakdown of property, plant and equipment
| | | | |
| | | | |
| | Depreciation rate (% p.a.) | | | | | | |
| |
| | | | | | | | |
Land | | 4,443 | - | 4,443 | 4,443 | - | 4,443 |
Buildings | 2.46 | 113,159 | (7,353) | 105,806 | 110,371 | (4,651) | 105,720 |
Furniture and fixtures | 9.30 | 5,144 | (1,536) | 3,608 | 5,042 | (1,233) | 3,809 |
Vehicles | 12.69 | 1,063 | (317) | 746 | 873 | (181) | 692 |
Machinery, equipment and facilities | 6.14 | 203,082 | (66,822) | 136,260 | 192,681 | (50,825) | 141,856 |
Computer equipment | 20.30 | 3,567 | (2,287) | 1,280 | 3,248 | (1,723) | 1,525 |
Mines and ore deposits | (*) | 13,232 | (1,320) | 11,912 | 13,231 | (1,016) | 12,215 |
Improvements in third party assets | 18.60 | 1,841 | (1,716) | 125 | 1,842 | (1,597) | 245 |
Third-party assets held by us | 6.67 | 531 | (68) | 463 | 530 | (32) | 498 |
Other assets | | 7,433 | - | 7,433 | 5,084 | - | 5,084 |
Construction in progress | | 234,157 | - | 234,157 | 190,372 | - | 190,372 |
Total | | 587,652 | (81,419) | 506,233 | 527,717 | (61,258) | 466,459 |
| | | | | | | |
(*) The depletion of ore deposits is calculated based on the volume of ore extracted as compared to the mineable reserve, and the Company estimates that the deposits will be depleted in 30 years.
In view of the need to review the useful lives at least every financial year, in 2013 management performed the review for all the Company’s units. As a result, the estimated useful lives for the current year are stated above.
b)Construction in progress
Costs classified as construction in progress consisted basically of services acquired and parts and pieces purchased, to be used as investments for performance improvement, technological upgrading, expansions, and acquisition of assets, which will be transferred to the related line items and depreciated from the moment they become available for use. As of December 31, 2013 and 2012, the balance is apportioned among the following projects:
Main projects | 2013 | 2012 |
| | | |
Expansion of administrative facilities | 11,470 | 6,387 |
Engenho-Pires road | 120,080 | 100,177 |
Expansion of production capacity - Pires | 78,622 | 70,614 |
Pelletization plant | 11,868 | 13,194 |
Expansion of production capacity - Fernandinho | 12,117 | - |
Other | 234,157 | 190,372 |
FS-28
table of contents
Movement in property, plant and equipment:
| | |
| | | | | | | |
| | | | | | | |
| | | | | | | |
Buildings | 105,720 | - | - | (2,702) | 2,788 | 105,806 |
Machinery and equipment | 141,856 | 4,130 | (2,045) | (15,733) | 8,052 | 136,260 |
Furniture and fixtures | 3,809 | 268 | (22) | (452) | 5 | 3,608 |
Vehicles | 692 | 190 | - | (136) | - | 746 |
Computer equipment | 1,525 | 268 | (2) | (564) | 53 | 1,280 |
Land | 4,443 | - | - | - | - | 4,443 |
Mines and ore deposits | 12,215 | - | - | (303) | - | 11,912 |
Leasehold improvements | 245 | - | - | (120) | - | 125 |
Third-party assets held by us | 498 | - | - | (35) | - | 463 |
Other assets | 5,084 | 1,292 | (1,397) | (114) | 2,568 | 7,433 |
Construction in progress | 190,372 | 60,693 | - | - | (16,908) | 234,157 |
Total | 466,459 | 66,841 | (3,466) | (20,159) | (3,442) | 506,233 |
| | | | | | | |
| | | | | | | |
| | | | | | | |
Buildings | 13,792 | - | - | (1,897) | 93,825 | 105,720 |
Machinery and equipment | 76,278 | 33,716 | (33) | (11,808) | 43,703 | 141,856 |
Furniture and fixtures | 2,321 | 1,870 | - | (458) | 76 | 3,809 |
Vehicles | 21,849 | 42 | - | (1,329) | (19,870) | 692 |
Computer equipment | 914 | 711 | (6) | (455) | 361 | 1,525 |
Land | 4,443 | - | - | - | - | 4,443 |
Mines and ore deposits | 12,388 | 96 | - | (324) | 55 | 12,215 |
Leasehold improvements | 384 | - | (19) | (120) | - | 245 |
Third-party assets held by us | - | 530 | - | (32) | - | 498 |
Other assets | 7,825 | 877 | - | - | (3.618) | 5,084 |
Construction in progress | 213,874 | 89,872 | - | - | (113,374) | 190,372 |
Total | 354,068 | 127,714 | (58) | (16,423) | 1,158 | 466,459 |
12.INTANGIBLE ASSETS
The carrying amounts of intangible assets as of December 31, 2013 and 2012 are as follows:
| | | |
| | Amortization rate
(% p.a.) | | |
| | | | | |
| | | | | | | | |
Goodwill - CFM | - | 578,531 | - | 578,531 | 578,531 | - | 578,531 |
Software | 21.05 | 6,186 | (577) | 5,609 | 176 | (19) | 157 |
Total | | 584,717 | (577) | 584,140 | 578,707 | (19) | 578,688 |
| | | | | | | | |
FS-29
Origin of goodwill based on future earnings
In July 2007, Namisa acquired Companhia de Fomento Mineral e Participações - CFM (“CFM”), based in Ouro Preto, State of Minas Gerais, and its wholly-owned subsidiary Cayman Mineração do Brasil Ltda. (“Cayman”), which were engaged in the extraction of iron ore and also owned iron ore processing facilities in the same State. The goodwill arising on this transaction is based on expected future earnings and was allocated to a single CGU since the Company operates only in the mining segment and all its assets generate cash flows together. This amount has not been amortized since 2009 due to the adoption of the international financial reporting standards and its carrying amount represents the net amount existing when the amortization was discontinued.
Impairment test
Goodwill was allocated to the Company’s mining segment for impairment test purposes.
The recoverable amount of a CGU is determined based on value-in-use calculations. These calculations use cash flow projections, before income tax and social contribution, based on financial budgets approved by Management for a three-year period. The cash flow amounts subsequent to the three-year period were extrapolated based on the estimated growth rates shown below. The growth rate does not exceed the average long-term growth rate of the mining segment.
To prepare the cash flow projection that supports this valuation, the Company adopted the following assumptions:
·Gross margin: this margin was calculated based on the expansion plans already approved in the Company’s business plan. The iron ore prices in the international market were used as basis in projections prepared by official mining industry institutions and the foreign exchange rate was calculated using a projected US dollar curve in real terms through 2016, disclosed by the Central Bank of Brazil (BACEN), since from 2016 onward the change used is zero.
·Cost adjustment: cost adjustment was based on historical data and price and foreign exchange curves used in industry reports.
·Growth rate: the cash flow projection period extends to 2052 due to the length of some projects’ implementation periods and the termination dates of the main agreements based on which the business plan was developed. It is not necessary, therefore, to take into consideration a growth rate since the projection period exceeds 30 years.
FS-30
table of contents
·Discount rate: set at 8.2% per year, before taxes on income.
13.BORROWINGS AND FINANCING
| | | |
| | | | | |
| | | | | |
Current liabilities: | | | | |
PPE - related parties (note 8). | | | 40,054 | 145 |
National Bank for Economic and Social Development (BNDES) - FINAME | | | 2,193 | 1,443 |
| | | | 42,247 | 1,588 |
| | | | | |
Noncurrent liabilities: | | | | |
PPE - related parties (note 8). | | | 320,936 | 314,699 |
BNDES - FINAME | | | 19,025 | 21,107 |
| | | | 339,961 | 335,806 |
| | | | 382,208 | 337,394 |
| | | | |
Borrowings and financing from related parties refer basically to export prepayments, with the following characteristics and terms and conditions:
·CSN Portugal Lda. (former CSN Export S.à.r.l.):US$1 billion bonds,100 million agreement (equivalent to R$169 million), bearing interest of 6.5% per year. In August and October 2008 two installments were paid, both amounting to US$20 million, and the US$60 million balance (equivalent to R$101 million) was restructured in December 2008, setting final maturity for March 2015.
·CSN Europe Lda. (former CSN Madeira):US$34 million agreement (equivalent to R$80 million) with Namisa Europe, bearing interest of 5.37% per year and maturing in July 2020.
June 2015.
· MergerCSN Ibéria: US$60 million agreement (equivalent to R$105 million), bearing interest of the clinker plant6.8% per year, with final maturity in March 2015.
·Namisa Europe: agreements amounting to US$75 million (equivalent to R$141 million), bearing interest of 3.48% per year, which were settled in October 2012.
FS-76In February 2011, the Company entered into with two special credit transactions with the BNDES to purchase operating equipment, amounting to R$5,266 and R$5,035, with final repayment within 94 months and bearing interest of 5.5% and 8.0% per year, respectively, payable on a monthly basis.
On January 31,
In September 2012, the Company and its subsidiary CSN Cimentos entered into with a special credit transaction with the BNDES to purchase operating equipment, amounting to R$12,989, with final repayment within 104 months and sale agreement to acquire CSN Cimentos’ unit in Arcos, MG. Asbearing interest of 5.5%, payable on a result,the clinker plant is now a branch ofCSN.
·Purchase of Alfonso Gallardo Group assets
On January 31, 2012, Companhia Siderúrgica Nacional, through its wholly-owned subsidiary CSN Steel, completed the acquisition of all shares held by the Alfonso Gallardo Group in the Companies Stahlwerk Thüringen (SWT)monthly basis starting July and Gallardo Sections. Total transaction price was €482.5 million.August 2014.
The Company shall make allocationsmaturities of the purchase price to assets acquired and liabilities assumed andnoncurrent portion of our borrowings is disclosed in note 23 (d).
None of the determination of any goodwill resulting from that transaction. At this moment,existing loan agreements contain restrictive covenants. The agreements entered into with the Company does not have enough information to meetBNDES are collateralized by the disclosures related to the acquisition, required by IFRS 3 – Business Combination.financed assets.
·14. SettlementPROVISION FOR RISKS
FS-31
The provisions for risks were estimated by Management based on information provided by its legal counsel (in-house and outside), which analyzed the outstanding lawsuits. The provisions were set up in an amount considered sufficient to cover probable losses on the outstanding lawsuits, as follows:
| | | |
| | | | 2013 | 2012 |
| | | | | |
Labor | | | 931 | 494 |
Environmental | | | 4,089 | 4,514 |
Total | | | 5,020 | 5,008 |
| | | | |
Additionally, the Company is a party to other lawsuits classified by the legal counsel as possible losses, which totaled R$2,393,829 as of December 31, 2013, (R$1,923,642 at December 31, 2012), of which R$16,993 (R$11,105 at December 31, 2012) in labor lawsuits, R$3,272 (R$1,132 at December 31, 2012) in civil lawsuits, R$2,365,255 (R$2,179,876 at December 31, 2012) in taxes lawsuits, and R$8,309 (R$570 at December 31, 2012) in environmental lawsuits.
On February 1,We present below a brief description of the most significant lawsuits:
a)Administrative proceeding - IRPJ/CSLL assessment notice on profits abroad, amounting to R$256,234, including principal, fine, and interest: this tax assessment notice refers to the assessment of income tax and social contribution on 2008 profits reported by foreign subsidiaries.
b)Administrative proceeding - IRRF assessment notice of R$145,142, including principal, fine, and interest: this tax assessment notice refers to the assessment of a Withholding Income Tax (IRRF), allegedly due by Namisa as the taxpayer responsible for withholding and payment of the tax levied on the capital gain earned by a legal entity domiciled abroad, which sold an asset in Brazil.
c)Administrative proceeding - IRPJ/CSLL assessment notice - disallowance of R$1,887,705 in goodwill, including principal, fine, and interest: this tax assessment refers to the disallowance of the amortization of goodwill expenses in 2009, 2010 and 2011, as a result of a merger of Big Jump Energy Participações S.A..
FS-32
table of contents
15.CONTRACTUAL OBLIGATIONS
In January 2011 the Company, together with its controlling shareholder CSN, entered into an iron ore railway transportation agreement with MRS Logística, for a 16-year period. This agreement contains a clause that ensures a minimum payment of 80% of the contracted volume. The minimum future payment required until the termination of the agreement is approximately R$3,889,763, with minimum annual payments of approximately R$444,544.
16.EQUITY
a)Issued capital
As of December 31, 2013 and 2012, the Company settled the fourth issue debentures amounting toCompany’s capital is R$635,285 (R$600,000 in principal and R$35,285 in interest), which had been issued on February 1, 2006 and paid interest equivalent to 103.6% of the CDI Cetip.2,800,000, represented by 475,067,405 common shares without par value, held as follows:
·Issuance of promissory notes (“Promissory Notes”)
Shareholders | Country | Number
of shares | Equity interest (%) |
Companhia Siderúrgica Nacional | Brazil | 285,040,443 | 60.00% |
Brazil Japan Iron Ore Corporation | Japan | 154,491,661 | 32.52% |
POSCO | South Korea | 30,784,627 | 6.48% |
China Steel Corporation | China | 4,750,674 | 1.00% |
Total | | 475,067,405 | 100.00% |
| | | |
In March 2012, the Company has approved the first (1st) issuance of promissory notes (“Promissory Notes”) of the Company for public distribution with restricted placement efforts, pursuant to CVM Rules (“Issuance”).
The Issuance comprised 40 Promissory Notes with unit value of R$20 million, totaling R$800 million, fully subscribed and paid up on this date. The net amount raised by the Company through this Issuance will be fully allocated to extend the Company’s debt profile, after the deduction of applicable commissions and expenses.
main corporate acts analyzed in meetings were:
·(i) CADE
On April 11, 2012, Conselho Administrativo de Defesa Econômica (CADE) issued an injunctive order barring us from, among others, acquiring more Usiminas shares or exercising our voting rights on the shares we already own. We are analyzing alternatives to preserve our rights.
·Annual General Meeting
At the Annual Shareholders’Extraordinary Shareholders Meeting held on April 27,March 29, 2012, the shareholders approved the Company’s distributionManagement's proposal for allocation of the profit for the year ended December 31, 2011, amounting to R$2,073,345, as follows:
(1)Allocation of R$103,667 to the legal reserve;
(2)Allocation of R$933,005 to the investment reserve;
(3)Distribution of R$1,036,673 as dividends, corresponding to the amount of approximately R$2.18 per share; Such dividend will be paid by the Company in two installments, the first of which of R$518,336 on July 18, 2012 and the second of R$518,336 on December 4, 2012, without adjustment for inflation.
(4)Reduction of minimum dividends to be declared at the next Extraordinary Shareholders Meeting, related to fiscal year 2012, from 50% to 25% of the profit for the year.
(ii)At the Extraordinary Shareholders Meeting of March 30, 2012, the following resolutions were approved:
(1)Capital increase with goodwill reserve, amounting to R$1,626,046;
(2)Transfer of the balance existing in the “Unrealized earnings reserve”, amounting to R$956,578, to the account “Investment reserve”, both belonging to the group of earnings reserve.
FS-33
(iii)At the Extraordinary Shareholders Meeting held on December 28, 2012, the following resolutions were approved:
(1)Partial payment of the dividends for 2011, amounting to R$300,000, up to December 31, 2012;
(2) Temporary suspension of the payment of the remaining portion of the dividends for 2011 up to March 15, 2013, and the shareholders shall, up to that date, call and install a new shareholders meeting for the related decision;
In 2013, at the Extraordinary Shareholders Meeting held on June 3, 2013 the shareholders unanimously approved the payment of an additional portion of the dividends declared in 2011, amounting to R$ 400,000, for settlement on June 5, 2013.
b)Capital reserve
The capital reserve, amounting to R$6,473,699 on December 31, 2013 and 2012, consists of R$5,081,840 recognized on December 30, 2008, related to premium arising on the issue of 187,749,249 new registered common shares, without par value, subscribed and paid in by Big Jump Energy Participações S.A., at the unit price of R$38.81, of which R$3.08 represent the unit issue price, set according to Article 170, II, of Law 6,404, of December 15, 1976, and R$35.73 per share was allocated to the capital reserve; and the special goodwill reserve on the merger of Big Jump Energy Participações S.A., amounting to R$1,391,859, as approved at the EGM held on July 30, 2009.
c)Legal reserve
This reserve is recognized at the rate of 5% of the profit for each period, as provided for by Article 193 of Law 6,404/76, up to the ceiling of 20% of share capital. Since 2012 the Company, in its interpretation of article 193, paragraph 1, of the aforementioned Law, has not recognized the legal reserve since it understands that its capital reserves exceed 30% of the capital.
d)Allocation of results
As mentioned in the explanatory note N. 8.c), the Company has long term agreements entered into with its shareholder, CSN, for the purchase of iron ore and for the rendering of port services, in which there were made pre-payments for the approximate term of 34 years and which outstanding amounts are updated monthly by a fixed interest rate, contractually defined.
During the 2012 fiscal year, the Administration questioned the contractual systematic that is being used for updating the outstanding amounts of the above mentioned pre-payments, once the Administration understands that it causes distortions on the cash positions and on the results of the Company, which tend to repeat themselves in future periods. Considering that, the Administration submitted to the Board of Directors a proposal to address the contractual interest issue; however, there was not an approval of the proposal by the Board of Directors, at that time, and the discussions on these agreements and on their eventual amendments remain pending until the closing of such consolidated financial statements.
FS-34
These consolidated financial statements have been prepared based on the existing agreements and include the update of the prepayment balance at the rate contractually established, as detailed in the explanatory note N. 8.c) and do not consider eventual impacts arising from the conclusion of these discussions on the estimates used to determine the value of the involved assets, which judgment by the Administration is complex, under the Administration opinion. A change to those estimates, as a result of the conclusion of discussions between the parties, will be recognized in the consolidated financial statements prospectively.
Therefore, the allocation of the unrealizedresults related to the fiscal years ended as of December 31, 2013 and December 31, 2012 are stated below, being the portion of the accumulated profits that exceed the operational result allocated to a reserve for contingencies and the outstanding amount not absorbed by the reserve for contingencies allocated for investments’ reserve.
| | 2013 | 2012 |
Net profit | 892,856 | 1,616,486 |
Reserve for investments | - | (120,411) |
Reserve for contingencies | (892,856) | (1,496,075) |
e)Dividends
The Company's bylaws provide for the payment of minimum dividends equivalent to 50% of the profit for the year; however, in the years ended December 31, 2013 and 2012, in order to avoid the distribution of dividends that may be affected by the aforementioned discussions that are still pending and the fact that the dividends declared in 2011 were not fully settled, no dividends are being proposed for 2013, a decision to be ratified at the Shareholders Meeting.
f)Contingency reserve
In view of the scenario previously described, the Company's management proposes the allocation of a portion of the profit for the years ended December 31, 2013 and 2012 for the recognition of a contingency reserve as required by Article 195 of Law 6,404/76, amounting to R$892,856 and R$1,496,075, respectively.
17.EARNINGS PER SHARE
Basic earnings reserve,per share were calculated based on profit for the year divided by the average number of common shares outstanding during the year. The Company does not have treasury shares. Earnings per share were calculated as shown in the table below:
| | | 2013 | 2012 |
| | | | |
Profit attributable to Namisa’s owners | 892,856 | 1,616,486 |
Weighted average number of shares | 475,067 | 475,067 |
Basic earnings per share | | 1.8794 | 3.4026 |
| | | |
The Company does not have instruments convertible into shares in the reporting periods, therefore, basic earnings per share are equal to diluted earnings per share.
FS-35
18.NET OPERATING REVENUE
The reconciliation between gross revenue and the revenue disclosed in the income statement is as follows:
| | | | | |
| | | | | | 2013 | 2012 |
| | | | | |
Gross operating revenue: | | | | |
Domestic market | | | 38,681 | 117,545 |
Foreign market | | | 2,339,830 | 3,738,455 |
| | | | 2,378,511 | 3,856,000 |
Less: | | | | |
Taxes on sales | | | (7,596) | (19,405) |
Returns and abatements | | | (1,079) | (180) |
| | | | (8,675) | (19,585) |
| | | | |
Net operating revenue | | | 2,369,836 | 3,836,415 |
| | | | |
FS-36
-table of contents
19. DeclarationINFORMATION ON THE NATURE OF THE EXPENSES RECOGNIZED IN THE INCOME STATEMENT
| | | |
| | | 2013 | 2012 |
| | | | | |
Third-party material | | | (487,835) | (925,214) |
Port handling | | | (255,767) | (526,583) |
Railway freight | | | (221,459) | (456,290) |
Processing services | | | - | (424,554) |
Freight and insurance | | | (159,531) | (273,700) |
Raw material | | | (97,179) | (110,004) |
Labor | | | (102,149) | (98,484) |
Operating services | | | (48,360) | (61,229) |
Maintenance | | | (62,535) | (44,172) |
Demurrage | | | (22,246) | (24,838) |
Infrastructure services | | | (25,189) | (22,259) |
Depreciation | | | (21,341) | (16,423) |
Other | | | (84,224) | (158,418) |
| | | | (1,587,815) | (3,142,168) |
| | | | | |
Cost of sales | | | (1,090,901) | (2,203,494) |
Selling expenses | | | (419,915) | (828,646) |
General and administrative expenses | | | (55,966) | (57,985) |
Other expenses, net | | | (21,033) | (52,043) |
Total | | | (1,587,815) | (3,142,168) |
20.NET FINANCE INCOME (LOSS) AND INFLATION ADJUSTMENTS AND FOREIGN EXCHANGE DIFFERENCES
| | |
| | 2013 | 2012 |
| | | |
Finance costs: | | |
Related parties | (21,915) | (68,770) |
Interest and fines - REFIS | (344,786) | - |
Other finance costs | (16,084) | (3,593) |
| | (382,785) | (72,363) |
Finance income: | | |
Related parties | 1,044,132 | 998,606 |
Dividends | 33,325 | 24,239 |
Interest and fines gain on the adherence of REFIS | 336,967 | - |
Other finance income | 99,510 | 83,819 |
| | 1,513,934 | 1,106,664 |
| | |
Finance income (costs), net | 1,131,149 | 1,034,301 |
| | | |
FS-37
Exchange differences: | | |
Exchange gains: | | |
Related parties | 2,207 | 43,268 |
Third parties | 569,164 | 282,094 |
Exchange losses: | | |
Related parties | (46,091) | (29,002) |
Third parties | (61) | (208) |
| | | |
Foreign exchange gains (losses), net | 525,219 | 296,122 |
Monetary variation , net | (1,657) | (715) |
Monetary and foreign exchange gains (losses), net | 523,562 | 295,407 |
FS-38
21.POSTEMPLOYMENT BENEFITS - PENSION FUND PROGRAM
The Company sponsors a pension plan created in 2012, managed by a pension fund (CBSPREV Namisa), which grants employees defined contribution pension benefit and defined benefit risk benefits (sickness allowance, disability retirement pensions, and survivors’ pensions), fully funded by the employees.
The Company’s obligation is limited to the monthly contributions made during the time an employee is working. In the year ended December 31, 2013, the contributions made by the Company totaled R$1,342 (R$1,667 in 2012). As for the risk benefits, which are fully funded by the employees, the Company conducted an actuarial valuation as of December 31, 2013 and 2012 and concluded that there is no residual risk to be provided for.
22.Tax Recovery Program (REFIS)
On October 9, 2013, the federal government enacted Law 12,865/13, subsequently amended by Provisional Act 627, of December 11, 2013, which permitted companies to make the voluntary payment of IRPJ (corporate income tax) and CSLL (social contribution on net income) on profits generated by subsidiaries and/or foreign subsidiaries, as defined in Article 74 of Provisional Act 2,158-35/01, up to the year ended December 31, 2012.
Such program permitted the payment of taxes in up to 180 installments, offering discounts of 100% on fines and interest for payments made in cash and of 80% on fines and 50% on interest for payments made in installments. The legislation also permitted the utilization of tax losses of subsidiaries and of direct or indirect parent company, for settlement of the amounts included in the program.
Therefore, the Company's management assessed its foreign operations, comparing them with the several cases in the market that are being discussed at the administrative and judicial levels, and decided to include in the program the amounts related to profits earned by its foreign subsidiaries from 2009 to 2012.
The amounts of IRPJ and CSLL resulting from the enrollment in the plan totaled R$892,649, with R$554,485 related to the years from 2009 to 2011 being paid in cash and R$87,828 related to the year 2012 being paid in 180 installments, plus fine and interest, with a down payment of 20% of the total amount, plus fine and interest calculated net of the reductions provided for in the program, totaling R$17,566. Furthermore, the amount of R$1,200,000, corresponding258,157 related to the tax loss acquired from the indirect controlling shareholder Vicunha S.A. was paid in cash. The balancepayable at December 31, 2013 totaled R$0.8230670,588, to be settled in 180 installments, the first 12 classified in current liabilities and the others in non-current liabilities. The enrollment in the program resulted in the recognition of an income tax expense of R$995,383 in the year ended December 31, 2013.
FS-39
23.FINANCIAL INSTRUMENTS
a)Identification and measurement of financial instruments
The Company’s financial instruments consist of short-term investments, trade receivables, trade payables, and borrowings and financing. The Company does not use derivative financial instruments, such as currency swaps or interest swaps.
The amounts are disclosed in the consolidated financial statements at their amortized cost and are substantially similar to those that would be obtained if traded in the market. The fair values of other long-term assets and liabilities, except borrowings and financing, do not differ significantly from their carrying amounts.
FS-40
b)Classification of financial instruments
| | | |
Assets | | Other liabilities at amortized cost | | | Other
liabilities at amortized cost | |
| | | | | | | | | |
Current assets: | | | | | | |
Cash and cash equivalents | 4,815,211 | - | 4,815,211 | 4,081,425 | - | 4,081,425 |
Trade receivables | 220,739 | - | 220,739 | 498,578 | - | 498,578 |
Advances to suppliers | 423,245 | | 423,245 | 694,029 | - | 694,029 |
Loans and receivables | 51,854 | - | 51,854 | 26,375 | - | 26,375 |
| | | | | | |
Noncurrent assets: | | | | | | |
Advances to suppliers | 8,522,067 | - | 8,522,067 | 7,757,475 | - | 7,757,475 |
Loans and receivables | 39,824 | - | 39,824 | 69,479 | | 69,479 |
| | | | | | | | | | |
Liabilities and equity | | | | | | |
Current liabilities: | | | | | | |
Borrowings and financing | - | 42,247 | 42,247 | - | 1,588 | 1,588 |
Trade payables | - | 57,576 | 57,576 | - | 208,658 | 208,658 |
Noncurrent liabilities: | | | | | | |
Borrowings and financing | - | 339,961 | 339,961 | - | 335,806 | 335,806 |
| | | | | | |
| | | | | | | | | | | | | | | | | | |
c)Financial risk management policy
The Company has and follows a risk management policy, containing guidelines regarding the incurred risks. Pursuant to this policy, the nature and general position of financial risks are monitored and managed on a regular basis to assess the results and the financial impact on cash flow. The credit limits are also reviewed on a periodic basis.
The risk management policy was set by the Board of Directors. Under this policy, the market risks are hedged to maintain the corporate strategy or the financial flexibility level.
d)Liquidity risk
The liquidity risk is the risk that the Company may not have sufficient funds to honor its financial commitments as a result of mismatching of terms or volumes between expected amounts collectible and payable.
FS-41
table of contents
To manage cash liquidity both in domestic and foreign currencies, future disbursements and cash inflow assumptions are established and daily monitored by the treasury area.
The table below shows the contractual maturities of financial iabilities, including the payment estimate:
| | | | | | |
Borrowings and financing | 42,247 | 326,858 | 12,224 | 879 | 382,208 |
Trade payables | | 57,576 | - | - | - | 57,576 |
| | | | | | |
| | | | | | | |
| | | | | | |
Borrowings and financing | 1,588 | 317,374 | 6,687 | 11,745 | 337,394 |
Trade payables | | 208,658 | - | - | - | 208,658 |
| | | | | | |
e)Foreign exchange risk
The Company assesses its foreign exchange exposure by deducting its liabilities from its US dollar-denominated assets to obtain its net foreign exchange exposure, which is actually the foreign exchange exposure risk, and also takes intoconsideration the maturity of the related assets and liabilities subject to exchange fluctuation. Basically, the Company’s financial instruments exposed to foreign exchange risk originate from exports and the investments abroad, which in economic terms constitute a natural hedge, except for the amounts kept in cash and cash equivalents abroad. This position is kept in US dollar for future investments.
The consolidated net exposure as of December 31, 2013 is as follows:
| 2013 |
| |
| |
Cash and cash equivalents abroad | 1,838,811 |
Trade receivables | 93,259 |
Receivables from related parties | 34,109 |
Total assets | 1,966,179 |
Borrowings and financing | 154,098 |
Trade payables | 433 |
Other liabilities | 292 |
Total liabilities | 157,823 |
Accounting foreign exchange exposure, net | 1,808,355 |
| |
FS-42
table of contents
Gains and losses on these transactions are consistent with the policies and strategies set by Management.
·Sensitivity analysis
We estimated the adjustments in four scenarios for the consolidated foreign exchange transactions exposed to US dollar fluctuation, using the exchange rate at December 31, 2013 of R$2.3426 per share;US$1.00, as follows:
·Scenario 1: (50% real appreciation) R$/US$ parity of 1.1713.
·Scenario 2: (25% real appreciation) R$/US$ parity of 1.7570.
·Scenario 3: (25% real depreciation) R$/US$ parity of 2.9283.
·Scenario 4: (50% real depreciation) R$/US$ parity of 3.5139.
| | |
| | | | Impacts estimated in Brazilian reais |
| | | | | |
| | | | | | | |
Exchange rate | | 2,3426 | 1,1713 | 1,75695 | 2,9283 | 3,51390 |
Assets: | | | | | | |
Cash and cash equivalents | US dollar fluctuation | 1,838,811 | (2,153,800) | (1,076,900) | 1,076,900 | 2,153,800 |
Trade receivables | US dollar fluctuation | 93,259 | (109,234) | (54,617) | 54,617 | 109,234 |
Receivables from related parties | US dollar fluctuation | 34,109 | (39,952) | (19,976) | 19,976 | 39,952 |
| | | 1,966,179 | (2,302,986) | (1,151,493) | 1,151,493 | 2,302,986 |
Liabilities: | | | | | | |
Borrowings and financing | US dollar fluctuation | 154,098 | (180,495) | (90,248) | 90,248 | 180,495 |
Trade payables | US dollar fluctuation | 433 | (508) | (254) | 254 | 508 |
Other liabilities | US dollar fluctuation | 292 | (342) | (171) | 171 | 342 |
| | | 154,823 | (181,345) | (90,673) | 90,673 | 181,345 |
Net effect | | 1,811,356 | (2,121,641) | (1,060,820) | 1,060,820 | 2,121,641 |
-f) Paid in capital increaseInterest rate risk
The Company did not identify any material floating interest rate and inflation index risk to its long-term liabilities.
g)Credit risks
The exposure to the credit risks of financial institutions follows the parameters set out in the amountfinancial policy. The Company adopts the procedure of R$2,859,053.
-Allocation toanalyzing in detail the statutory reserves in the amountfinancial position of R$ 3,426,336.
its customers and suppliers, defining a credit limit and constantly monitoring its outstanding balance.
FS-77FS-43
By analyzing the geographical distribution of our exports, we observed a strong concentration of sales in Asia. This is due to the fact that China maintains a strong demand for iron ore and the fact that our shareholders are major steel mills located in Japan and Korea, with which we have long-term agreements.
Conducting most of the sales against the presentation of credit letters and based on customer assessments, as well as the diversification of receivables and the control over sales financing are the usual procedures that the Company adopts to minimize possible credit risks of its business partners. In the year ended December 31, 2013, our total sales to customers that individually make up more than 10% of sales revenue, totaled 35%.
As for short-term investments, the Company only makes investments in low credit risk institutions awarded by rating agencies.
h)Capital management
The Company manages its capital structure for the purpose of safeguarding its ability to continue as a going concern, in order to provide returns for shareholders and benefits for other stakeholders, while maintaining an optimal capital structure to reduce this cost.
24.INSURANCE
Due to the nature of its operations, the Company renewed with a local insurer, for the period June 30, 2013 to June 30, 2014, the coverage of named perils for the following locations: (a) mine, BR 040, km 602, Ouro Preto, MG; (b) mine, Inconfidentes Highway, km 40, no number, Itabirito, MG; (c) office, Rua Iguatemi, 192, 25º andar, Itaim, SP; and (d) property damages, fire/lightening/any type of explosion, and loss of profits resulting from fire/lightening/any type of explosion, in the total risk amount of R$2.4 billion (property damages and loss of profits), and indemnity ceilings, in case of accidents, of R$50 million (property damages), and R$200 million (loss of profits).
The risk assumptions adopted, in view of their nature, are not part of the scope of the audit of the consolidated financial statements and, therefore, were not audited by our independent auditors.
25.APPROVAL OF THE CONSOLIDATED FINANCIAL STATEMENTS FOR ISSUE
The consolidated financial statements were authorized for issue by the Executive Committee’s meeting held on March 28th, 2014.
FS-44