UNITED STATES
SECURITIES AND EXCHANGE COMMISSION
WASHINGTON, D.C. 20549
FORM 20-F
| o | REGISTRATION STATEMENT PURSUANT TO SECTION 12(b) OR (g) OF THE SECURITIES EXCHANGE ACT OF 1934 |
| x | ANNUAL REPORT PURSUANT TO SECTION 13 OR 15(d) OF THE SECURITIES EXCHANGE ACT OF 1934 |
| | For the fiscal year ended December 31, 20102011 |
| o | TRANSITION REPORT PURSUANT TO SECTION 13 OR 15 (d) OF THE SECURITIES EXCHANGE ACT OF 1934 |
| | For the transition period from _______________ to ________________ |
| o | SHELL COMPANY REPORT PURSUANT TO SECTION 13 OR 15(d) OF THE SECURITIES EXCHANGE ACT OF 1934 |
| | Date of event requiring this shell company report______________ |
Commission File Number 0-9266
AVINO SILVER & GOLD MINES LTD.
(Exact name of Registrant as specified in its charter)
Not Applicable
(Translation of Registrant’s name into English)
British Columbia, Canada
(Jurisdiction of incorporation or organization)
570 Granville Street, Suite 900 Vancouver, British Columbia V6C 3P1, Canada
(Address of principal executive offices)
David Wolfin, 570 Granville Street, Suite 900 Vancouver, British Columbia V6C 3P1, Canada,
Tel: 604-682-3701, Email: dwolfin@avino.com
(Name, Telephone, E-mail and/or Facsimile number and Address of Company Contact Person)
Securities registered or to be registered pursuant to Section 12(b) of the Act:
| Not Applicable | | Not Applicable |
| Title of Each Class | | Name of Each Exchange on Which Registered |
Securities registered or to be registered pursuant to Section 12(g) of the Act:
Common Shares, without Par Value
(Title of Class)
Securities for which there is a reporting obligation pursuant to Section 15(d) of the Act:
Not Applicable
(Title of Class)
Indicate the number of outstanding shares of each of the issuer’s classes of capital or common stock
as of the close of the period covered by the annual report.
There were 26,157,22726,910,227 common shares, without par value, issued and outstanding as of December 31, 2010.
2011.
Indicate by check mark if the registrant is a well-known seasoned issuer, as defined in Rule 405 of the Securities Act.
oYes x No
If this report is an annual or transition report, indicate by check mark if the registrant is not required to file reports pursuant to Section 13 or 15(d) of the Securities Exchange Act of 1934.
oYes xNo
Indicate by check mark whether the registrant (1) has filed all reports required to be filed by Section 13 or 15(d) of the Securities Exchange Act of 1934 during the preceding 12 months (or for such shorter period that the registrant was required to file such reports), and (2) has been subject to such filing requirements for the past 90 days.
x Yes o No
Indicate by check mark whether the registrant has submitted electronically and posted on its corporate web site, if any, every Interactive Data File required to be submitted and posted pursuant to Rule 405 of Regulation S-T (§232.405 of this chapter) during the preceding 12 months (or for such shorter period that the registrant was required to submit and post such files).
o Yes o No
Indicate by check mark whether the registrant is a large accelerated filer, an accelerated filer, or a non-accelerated filer. See definition of “accelerated filer and large accelerated filer” in Rule 12b-2 of the Exchange Act. (Check one):
Large Accelerated File o Accelerated Filer o Non-Accelerated Filer x
Indicate by check mark which basis of accounting the registrant has used to prepare the financial statements included in this filing:
| U.S. GAAP o | International Financial Reporting Standards as issued | Other xo |
| | by the International Accounting Standards Board ox | |
If “Other” has been checked in response to the previous question, indicate by check mark which financial statement item
the registrant has elected to follow.
Item 17 xo Item 18 o
If this is an annual report, indicate by check mark whether the registrant is a shell company (as defined in Rule 12b-2 of the Exchange Act).
Yes o No x
(APPLICABLE ONLY TO ISSUERS INVOLVED IN BANKRUPTCY PROCEEDINGS DURING THE PAST FIVE YEARS.)
Indicate by check mark whether the registrant has filed all documents and reports required to be filed by Sections 12, 13 or 15(d) of the Securities Exchange Act of 1934 subsequent to the distribution of securities under a plan confirmed by a court.
Yes o No o
TABLE OF CONTENTS
| | | Page | |
| Introduction | | | 2 | 3 |
| Currency | | | 2 | 3 |
| Forward-looking Statements | | | 2 | 3 |
| Cautionary Note to United States Investors Concerning Estimate of Measured and Indicated Mineral Resources | 4 |
| Cautionary Note Regarding Clarification and Retraction of Technical Property Disclosure | 4 |
| Explanatory Note regarding Presentation of Financial Information | 3 | 6 |
| Glossary of Mining Terms | | | 4 | |
| | | | | 7 |
| Part I | | | | 6 | 10 |
| | | | | |
| Item 1. | Identity of Directors, Senior Management and Advisors | | | 6 | 10 |
| Item 2. | Offer Statistics and Expected Timetable | | | 6 | 10 |
| Item 3. | Key Information | | | 6 | 10 |
| Item 4. | Information on the Company | | | 14 | 17 |
| Item 5. | Operating and Financial Review and Prospects | | | 45 | |
| Item 6. | Directors, Senior Management and Employees | | | 50 | 49 |
| Item 7. | Major Shareholders and Related Party Transactions | | | 60 | 59 |
| Item 8. | Financial Information | | | 61 | 60 |
| Item 9. | The Offer and Listing | | | 62 | 60 |
| Item 10. | Additional Information | | | 64 | 61 |
| Item 11. | Quantitative and Qualitative Disclosures About Market Risk | | | 70 | 67 |
| Item 12. | Description of Securities Other than Equity Securities | | | 70 | |
| | | | | 67 |
| Part II | | | | 71 | 68 |
| | | | | |
| Item 13. | Defaults, Dividend Arrearages and Delinquencies | | | 71 | 68 |
| Item 14. | Material Modifications to the Rights of Security Holders and Use of Proceeds | | | 71 | 68 |
Item 15T.15. | Controls and Procedures | | | 71 | 68 |
| Item 16A. | Audit Committee Financial Expert | | | 72 | 69 |
| Item 16B. | Code of Ethics | | | 72 | 69 |
| Item 16C. | Principal Accountant Fees and Services | | | 73 | 70 |
| Item 16D. | Exemptions from the Listing Standards for Audit Committees | | | 73 | 71 |
| Item 16E. | Purchases of Equity Securities by the Issuer and Affiliated Purchasers | | | 73 | 71 |
| Item 16F. | Changes in Registrants Certifying Accountant | | | 73 | 71 |
| Item 16G. | Corporate Governanace | | | 73 | 71 |
| Item 16H. | Mine Safety Disclosure | | | | 71 |
| Part III | | | | 74 | 72 |
| | | | | |
| Item 17. | Financial Statements | | | 74 | 72 |
| Item 18. | Financial Statements | | | 74 | 72 |
| Item 19. | Exhibits | | | 74 | 72 |
INTRODUCTION
In this Annual Report on Form 20-F, which we refer to as the “Annual Report”, except as otherwise indicated or as the context otherwise requires, the “Company”, “we”, “our” or “us” refers to Avino Silver & Gold Mines Ltd.
We were incorporated by Memorandum of Association under the laws of the Province of British Columbia on May 15, 1969,1968, and on August 22, 1969, by virtue of an amalgamation with Ace Mining Company Ltd., became a public company whose common shares are registered under the United States Securities Exchange Act of 1934, as amended, and changed its name to Avino Mines & Resources Limited. On April 12, 1995, we changed our corporate name to International Avino Mines Ltd. and affected a reverse stock split of one common share for every five common shares outstanding. On August 29, 1997, we changed our corporate name to Avino Silver & Gold Mines Ltd. to better reflect our business of exploring for and mining silver and gold. Our principal executive office is located at Suite 900, 570 Granville Street, Vancouver, British Columbia V6C 3P1, Canada.
You should rely only on the information contained in this Annual Report. We have not authorized anyone to provide you with information that is different. The information in this Annual Report may only be accurate on the date of this Annual Report or on or as at any other date provided with respect to specific information.
CURRENCY
Unless we otherwise indicate in this Annual Report, all references to “Canadian Dollars”, “CDN$” or “$” are to the lawful currency of Canada and all references to “U.S. Dollars” or “US$” are to the lawful currency of the United States.
FORWARD-LOOKING STATEMENTS
Certain statements contained in this document, other than statements of historical fact, including, without limitation, those concerning the economic outlook for the silver mining industry, expectations regarding silver prices, production, cash costs and other operating results, growth prospects and outlook of the Company’s operations, individually or in the aggregate, including the completion and commencement of commercial operations of certain of the Company’s exploration and production projects, the Company’s liquidity and capital resources and capital expenditure, and the outcome and consequences of any potential or pending litigation or regulatory proceedings, contain forward-looking statements regarding the Company’s operations, economic performance and financial condition.
These forward-looking statements involve known and unknown risks, uncertainties and other factors that may cause the Company’s actual results, performance or achievements to differ materially from the anticipated results, performance or achievements expressed or implied in these forward-looking statements. Although the Company believes that the expectations reflected in such forward-looking statements are reasonable, no assurance can be given that such expectations will prove to have been correct. Accordingly, results could differ materially from those set out in the forward-looking statements as a result of, amongst other factors, changes in economic and market conditions, success of business and operating initiatives, changes in the regulatory environment and other government actions, fluctuations in silver prices and exchange rates, political changes in Mexico, competition for resource properties and infrastructure in the mineral exploration industry, the Company’s ability to obtain additional financing, and business and operational risk management and other factors as determined in “Item 3D.: Risk Factors” and elsewhere in this annual report. These factors are not necessarily all of the important factors that could cause the Company’s actual results to differ materially from those expressed in any forward-looking statements. Other unknown or unpredictable factors could also have material adverse effects on future results.
The Company undertakes no obligation to update publicly or release any revisions to these forward-looking statements to reflect events or circumstances after the date of this annual report or to reflect the occurrence of unanticipated events. All subsequent written or oral forward-looking statements attributable to the Company or any person acting on its behalf are qualified by the cautionary statements herein.
CAUTIONARY NOTE TO UNITED STATES INVESTORS CONCERNING ESTIMATE OF MEASURED AND INDICATED MINERAL RESOURCES
In Canada, an issuer is required to provide technical information with respect to mineralization, including reserves and resources, if any, on its mineral exploration properties in accordance with Canadian requirements, which differ significantly from the requirements of the Securities and Exchange Commission (the “SEC”) applicable to registration statements and reports filed by United States companies pursuant to the United States Securities Act of 1933, as amended (the “Securities Act”), or the United States Securities Exchange Act of 1934, as amended (the “Exchange Act”). As such, information contained in this annual report concerning descriptions of mineralization under Canadian standards may not be comparable to similar information made public by United States companies subject to the reporting and disclosure requirements of the SEC. In particular, this annual report on Form 20-F includes the terms “mineral resource,” “measured mineral resource,” “indicated mineral resource” and “inferred mineral resource”. Investors are advised that these terms are defined in and required to be disclosed under Canadian rules by National Instrument 43-101 (“NI 43-101”). U.S. Investors are cautioned not to assume that any part of the mineral deposits in these categories will ever be converted into reserves. However, these terms are not defined terms under SEC Industry Guide 7 and are not permitted to be used in reports and registration statements filed with the SEC by U.S. domestic issuers. In addition, NI 43-101 permits disclosure of “contained ounces” of mineralization. In contrast, the SEC only permits issuers to report mineralization as in place tonnage and grade without reference to unit measures.
The definitions of proven and probable reserves used in NI 43-101 differ from the definitions in SEC Industry Guide 7. Under SEC Industry Guide 7 (under the Exchange Act), as interpreted by the staff of the SEC, mineralization may not be classified as a “reserve” for United States reporting purposes unless the determination has been made that the mineralization could be economically and legally produced or extracted at the time the reserve determination is made. Among other things, all necessary permits would be required to be in hand or issuance imminent in order to classify mineralized material as reserves under the SEC standards.
United States investors are cautioned not to assume that any part or all of the mineral deposits identified as an “indicated mineral resource,” “measured mineral resource” or “inferred mineral resource” will ever be converted to reserves as defined in NI 43-101 or SEC Industry Guide 7. Further, “inferred mineral resources” have a great amount of uncertainty as to their existence and economic and legal feasibility. It cannot be assumed that all or any part of an inferred mineral resource will ever be upgraded to a higher category. Under Canadian securities legislation, estimates of inferred mineral resources may not form the basis of feasibility or pre-feasibility studies, or economic studies. U.S. investors are cautioned not to assume that part or all of an inferred mineral resource exists, or is economically or legally mineable.
CAUTIONARY NOTE REGARDING CLARIFICATION AND RETRACTION OF
TECHNICAL PROPERTY DISCLOSURE
On May 11, 2012, as a result of a review by the British Columbia Securities Commission (“BCSC”), we issued a news release to clarify and retract certain disclosures made pertaining to conceptual exploration targets and economic analyses of mineral resources at our Avino property in Durango, Mexico.
As indicated in the news release, certain disclosure relating to our properties provided in news releases, on our website and in investor materials, do not comply with Canadian National Instrument 43-101 - Standards of Disclosure for Mineral Projects (“NI 43-101”). In particular, the March 12, 2012 independent NI 43-101 technical report and preliminary economic assessment on the tailings resources, prepared by an independent engineering firm, is not complete and contains items not compliant with NI 43-101. There are also compliance issues in our news releases dated February 28, 2012, April 5, 2012 and April 23, 2012, and in our website materials with respect to disclosure related to our main Avino mine resources. In addition, the website, fact sheet, and corporate presentation on our website disclosed results of economic analysis of an in-situ inferred resource estimate at San Gonzalo. The Company’s technical report on file does not support the estimate and analysis. With respect to the March 12, 2012 NI 43-101 technical report, we plan to file a restated report that clarifies the status of various in-situ and tailings resource estimates and the economic analysis, once received from our independent consultant.
Retraction of In-Situ Estimates at Avino Vein (“ET Zone”)
With respect to the news releases dated February 28, 2012, April 5, 2012, and April 23, 2012, as well as on the Company’s fact sheet and corporate presentation, we disclosed that a resource remained within the ET Zone when operations at the ET Zone ceased in 2001. Such disclosure was with respect to resources of the mine when it shut down in November 2001. These figures were produced by our geological mine staff and are not compliant with NI 43-101. Since no mining has been conducted since November 2001, this resource estimate represents the only assessment of remaining tonnage. As a result of the foregoing, such disclosure may have created the appearance that we regarded this 2001 estimate as a current mineral resource estimate, and the April 23, 2012 news release stated that the Company would be adding to the estimate. These statements triggered the requirement under NI 43-101 for the Company to file a supporting current NI 43-101 technical report.
Additionally, the “Projects” section of our website discloses a “target potential” at the Avino Mine. This disclosure did not use a range of tonnes and grade as required by NI 43-101 for an exploration target nor did it provide the information and cautionary language required.
As the Company does not currently have a valid NI 43-101 compliant resource estimate on the ET Zone, we retracted all statements relating to mineral resource estimates associated with the Avino Mine or ET Zone, and have amended our corporate presentation, website and fact sheet to remove any mineral resource estimates. No Qualified Person (as defined by NI 43-101) has performed sufficient work to classify the non-compliant estimate prepared in 2001 as a current mineral resource, and we did not intend to treat the estimate as current. We also retracted the quantity and grade of a potential target. These retractions are pending a scheduled re-estimation of current in-situ resources at the Avino property and the new report will consider additional grade-tonnage ranges that could qualify as potential exploration targets.
Subsequent to the mine closing in 2001, we have drilled 32 holes below the 12 level where mining ceased. There were 4 holes in 2006, 12 holes in 2007, 8 holes in 2008, and 8 holes to date in 2012. The Company is planning to release a NI 43-101 compliant resource estimate on the ET Zone later this year which will incorporate the drilling between 2006 and 2012.
Clarification of Resource Estimates and Retraction of Economic Forecast at San Gonzalo Zone
Pursuant to the news release, we also restated the validity of the original NI 43-101 Resource Estimate (August 31, 2009) of 444,250 tonnes grading 2.61 g/t Au and 332 g/t Ag plus small additional higher grade historical silver resource estimates surrounding the old mine workings. This tonnage has been depleted by tonnage mined to obtain the bulk sample.
Our website, fact-sheet, and the corporate presentation on our website disclosed select results of economic analysis on an inferred resource at San Gonzalo Zone’s bulk sampling program without the proper cautionary language as required by NI 43-101. This cautionary language must state that the economic results are preliminary in nature; that they include inferred mineral resources that are considered too geologically speculative to have economic considerations applied to them that would enable them to be categorized as mineral reserves; and that there is no certainty that the preliminary economic results will be realized. This cautionary language is required because the resource at San Gonzalo is considered to be in the inferred category. In the interim, the materials in question have been removed from our website.
In addition, the disclosure of an in-situ inferred resource and economic parameters triggered a requirement to file a NI 43-101 technical report. The Company’s current report on file does not support the disclosure, contrary to NI 43-101 and the resource estimates and economic factors should not be relied on until independently verified and supported by a technical report.
Oxide and Sulfide Tailings Resources
The Company filed the NI 43-101 technical report prepared by the independent consultant dated March 12, 2012, in support of disclosure from the Company’s news release dated March 20, 2012 regarding the “Tailings Retreatment Process Option Update” of an inferred resource contained in the oxide tailings. The foregoing technical report improperly relied on a 2005 report for the oxide tailings estimate but provides no indication as to the methodology used to establish the oxide material, and the technical report did not independently verify the tonnage or grade of the tailings deposit. The tailings estimates and economic analysis are not supported by a NI 43-101 compliant technical report and should not be relied on until independently verified and supported by a technical report. The BCSC’s review identified instances where the technical report does not comply with NI 43-101 requirements. The report on file is not a complete property report because it focused on tailings and excluded estimates and analysis for in-situ resources. We had relied on the results of the technical report for information about tailings in its other materials, including the corporate presentation, fact sheet and website.
The foregoing technical report is being amended to consider all relevant information about the subject property, including adequacy of verification of the oxide tailings estimate, validity of the sulfide tailings estimate, removal of non-compliant economic analysis for the sulfide tailings, validity of in-situ estimates, and the current status of the San Gonzalo in-situ inferred resource estimate and economic analysis.
We will promptly announce any material changes to its property information that result from amendments to the technical report and made a "provisional" retraction of the prior current oxide tailings and preliminary economic assessment, pending verification in a new technical report to be filed within 45-days. Our independent consultant is currently updating the technical report on the tailings resource to factor in all of the concerns. We expect this amended report to be completed within 45 days and if the report is not ready, a news release providing an update to the amended report’s status and progress will be issued. We will also promptly announce any material changes to its tailings resource estimates, economic analyses, or other information that result from preparation of the new report. The new report will also consider the status of resource estimates and other information disclosed by the Company at San Gonzalo and other areas of the subject property.
EXPLANATORY NOTE REGARDING PRESENTATION OF FINANCIAL INFORMATION
The annual audited consolidated financial statements contained in this annual report on Form 20-F are reported in Canadian dollars. For all periods up to and including the year ended December 31, 2010, we prepared our consolidated financial statements in accordance with Canadian generally accepted accounting principles (‘‘Canadian GAAP’’). The annual audited consolidated financial statements for the year ended December 31, 2011 are our first annual consolidated financial statements that have been prepared in accordance with International Financial Reporting Standards (‘‘IFRS’’) as issued by the International Accounting Standards Board (‘‘IASB’’) and IFRS 1, First Time Adoption of International Financial Reporting Standards. See International Financial Reporting Standards — Transition from Canadian GAAP to IFRS in our ‘‘Management’s Discussion and Analysis of Financial Condition and Results of Operations’’ included in this annual report on Form 20-F under ‘‘Item 5 — Operating and Financial Review and Prospects.’’
We have prepared the annual audited consolidated financial statements that comply with IFRS as described in the accounting policies in Note 2 of our annual audited consolidated financial statements. In preparing the annual audited consolidated financial statements, our opening statement of financial position was prepared at January 1, 2010, our date of transition to IFRS. Note 20 of our annual audited consolidated financial statements explains the principal adjustments we made in restating our Canadian GAAP statements of financial position as at January 1, 2010 and December 31, 2010 and our previously published Canadian GAAP consolidated statements of operations and comprehensive loss for the year ended December 31, 2010.
GLOSSARY OF MINING TERMS
| agglomeration | Cementing crushed or ground rock particles together into larger pieces, usually to make them easier to handle; used frequently in heap-leaching operations. |
| |
| anomalous | A value, or values, in which the amplitude is statistically between that of a low contrast anomaly and a high contrast anomaly in a given data set. |
| |
| anomaly | Any concentration of metal noticeably above or below the average background concentration. |
| |
| assay | An analysis to determine the presence, absence or quantity of one or more components. |
breccia | |
| Breccia | A rock in which angular fragments are surrounded by a mass of finer-grained material. |
| |
| cretaceous | The geologic period extending from 135 million to 65 million years ago. |
| |
cubic meters or m3m3 | A metric measurement of volume, being a cube one meter in length on each side. |
| |
| cyanidation | A method of extracting exposed gold or silver grains from crushed or ground ore by dissolving it in a weak cyanide solution. |
| |
| diamond drill | A rotary type of rock drill that cuts a core of rock that is recovered in long cylindrical sections, two centimeters or more in diameter. |
| |
| fault | A fracture in a rock where there has been displacement of the two sides. |
| |
| grade | The concentration of each ore metal in a rock sample, usually given as weight percent. Where extremely low concentrations are involved, the concentration may be given in grams per tonne (g/t or gpt) or ounces per ton (oz/t). The grade of an ore deposit is calculated, often using sophisticated statistical procedures, as an average of the grades of a very large number of samples collected from throughout the deposit. |
heap leaching | A process whereby valuable metals, usually gold and silver, are leached from a heap, or pad, of crushed ore by leaching solutions percolating down through the heap and collected from a sloping, impermeable liner below the pad. |
| hectare or ha | An area totaling 10,000 square meters. |
| |
| highly anomalous | An anomaly which is 50 to 100 times average background, i.e. it is statistically much greater in amplitude. |
lpIp induced polarization | A method of ground geophysics surveying employing an electrical current to determine indications of mineralization, also referred to as “IP”. |
laterite | A residual product of rock decay that is red in colour and has a high content in the oxides of iron and hydroxide of aluminum. |
| mineral reserve | The economically mineable part of a measured or indicated mineral resource demonstrated by at least a preliminary feasibility study. This study must include adequate information on mining, processing, metallurgical, economic and other relevant factors that demonstrate, at the time of the reporting, that economic extraction can be justified. A mineral reserve includes diluting materials and allowances for losses that may occur when the material is mined. Mineral resources are sub-divided in order of increasing confidence into “probable” and “proven” mineral reserves. A probable mineral reserve has a lower level of confidence than a proven mineral reserve. The term “mineral reserve” does not necessarily signify that extraction facilities are in place or operative or that all governmental approvals have been received. It does signify that there are reasonable expectations of such approvals. |
| |
| mineral resource | The estimated quantity and grade of mineralization that is of potential economic merit. A resource estimate does not require specific mining, metallurgical, environmental, price and cost data, but the nature and continuity or mineralization must be understood. Mineral resources are sub-divided in order of increasing geological confidence into “inferred”, “indicated”, and “measured” categories. An inferred mineral resource has a lower level of confidence than that applied to an indicated mineral resource. An indicated mineral resource has a higher level of confidence than an inferred mineral resource, but has a lower level of confidence than a measured mineral resource. A mineral resource is a concentration or occurrence of natural, solid, inorganic or fossilized organic material in or on the earth’s crust in such form and quantity and of such grade or quality that it has reasonable prospects for economic extraction. |
mineralization
| |
| mineralization | Usually implies minerals of value occurring in rocks. |
| |
| net smelter or NSR Royalty | Payment of a percentage of net mining profits after deducting applicable smelter charges. |
NQ
| Denotes a definition of drill size of approximately 2-1/2 inches.
|
oxide
Oxide | A compound of oxygen and some other element. |
ore
| |
| ore | A natural aggregate of one or more minerals which may be mined and sold at a profit, or from which some part may be profitably separated. |
outcrop
| An exposure of rock at the earth’s surface.
|
possible or inferred ore
| Term used to describe ore where the mineralization is believed to exist on the basis of some geological information, but the size, shape, grade, and tonnage are a matter of speculation.
|
prefeasibility study and preliminary feasibility study | Each means a comprehensive study of the viability of a mineral project that has advanced to a stage where mining method, in the case of underground mining, or the pit configuration, in the case of open pit mining, has been established, and which, if an effective method of mineral processing has been determined, includes a financial analysis based on reasonable assumptions of technical, engineering, operating and economic factors, and the evaluation of other relevant factors which are sufficient for a qualified person, acting reasonably, to determine if all or part of the mineral resource may be classified as a mineral reserve. |
| |
| probable mineral reserve | The economically mineable part of an indicated, and in some circumstances, a measured mineral resource demonstrated by at least a prefeasibility study. This study must include adequate information on mining, processing, metallurgical, economic, and other relevant factors that demonstrate, at the time of reporting, that economic extraction can be justified. |
proven mineral reserve | The economically mineable part of a measured mineral resource demonstrated by at least a prefeasibility study. This study must include adequate information on mining, processing, metallurgical, economic, and other relevant factors that demonstrate, at the time of reporting, that economic extraction is justified. The term should be restricted to that part of the deposit where production planning is taking place and for which any variation in the estimate would not significantly affect potential economic viability. |
| |
| quartz | Silica or SiO2,SiO2, a common constituent of veins, especially those containing gold and silver mineralization. |
tailings
| |
| Tailings | Material rejected from a mill after most of the recoverable valuable minerals have been extracted. |
ton
| |
| ton | Imperial measurement of weight equivalent to 2,000 pounds. |
tonne
| |
| Tonne | Metric measurement of weight equivalent to 2,205 pounds (1,000 kg) |
tpd
| |
| Tpd | Tonnes per day. |
trench
| |
| Trench | A long, narrow excavation dug through overburden, or blasted out of rock, to expose a vein or ore structure. |
veins
| |
| veins | The mineral deposits that are found filling openings in rocks created by faults or replacing rocks on either side of faults. |
PART I
Item 1. Identity of Directors, Senior Management and Advisors
Not applicable.
Item 2. Offer Statistics and Expected Timetable
Not applicable.
Item 3. Key Information
A. Selected Financial Data
The selected historical consolidated financial information presented in the tableset forth below has been derived from our annual audited consolidated financial statements for each of the years in the five-year period ended December 31, 2011.
For the years ended December 31, 2011 and 2010, we have prepared our consolidated financial statements in accordance with IFRS, as issued by the IASB. Our December 31, 2010 consolidated financial statements were initially prepared in accordance with Canadian GAAP, consistent with the prior years and the periods ended December 31, 2009, 2008 and 2007. We have adjusted our consolidated financial information at and for the year ended December 31, 2010,
in accordance with IFRS 1, and therefore the financial information set forth in this annual report on Form 20-F for the year ended December 31,
2009, December 31, 2008, December 31, 2007(1) and2010 may differ from information previously published. We adopted IFRS with a transition date of January
31, 2007, is derived from1, 2010. For details regarding the
audited financial statements ofadjustments made with respect to the
Company. Thecomparative data refer to Note 20 to our annual audited consolidated financial statements
contained in this annual report on Form 20-F. The selected historical consolidated financial information presented below is condensed and may not contain all of the information that you should consider. This selected financial data should be read in conjunction with our annual audited consolidated financial statements, the notes thereto and the section entitled ‘‘Item 5 — Operating and Financial Review and Prospects.’’
In accordance with IFRS
The tables below set forth selected consolidated financial data under IFRS for the years ended December 31, 2010,2011 and 2010. The information has been derived from our annual audited consolidated financial statements set forth in ‘‘Item 17 — Financial Statements.’’
| | | Years Ended December 31, | |
| | | 2011 | | | 2010 | |
| Summary of Operations: | | | | | | |
| Revenue | | $ | - | | | $ | - | |
| Interest Income | | | 78,857 | | | | 14,206 | |
| Other Income | | | 10,499 | | | | - | |
| Expenses | | | | | | | | |
| Operating and administrative | | | 4,042,647 | | | | 1,110,643 | |
| Unrealized (loss) gain in investments in related companies | | | (212,966 | ) | | | 313,323 | |
| Foreign exchange gain | | | 68,404 | | | | 19,951 | |
| Deferred income tax expense | | | (86,498 | ) | | | (27,677 | ) |
| Net loss | | | (4,184,351 | ) | | | (790,840 | ) |
| | | | | | | | | |
| Loss per share | | | (0.16 | ) | | | (0.04 | ) |
| | | | | | | | | |
| Weighted average number of shares outstanding | | | 26,795,632 | | | | 21,059,008 | |
| | | 2011 | | | 2010 | | | 2009 | |
| Balance Sheet Data: | | | | | | | | | |
| Total assets | | $ | 26,136,355 | | | $ | 26,578,517 | | | $ | 19,206,464 | |
| Cash and cash equivalents | | | 5,282,464 | | | | 9,051,848 | | | | 2,830,093 | |
| Total liabilities | | | 3,202,096 | | | | 2,662,727 | | | | 2,539,563 | |
| Shareholders’ equity | | | 22,934,259 | | | | 23,915,790 | | | | 16,480,901 | |
In accordance with Canadian GAAP
The tables below for the years ended December 31, 2009, 2008, and December 31, 2008 are included in this Annual Report. The selected historical financial information for the eleven month period ended December 31, 2007 and the year ended January 31, 2007, presented in the table below are derived from financial statements of the Company that are not included in this Annual Report. Thecontain selected financial information presented below should be read in conjunction with the Company’s consolidated financial statements and the notes thereto (Item 17) and the Operating and Financial Review and Prospects (Item 5) included elsewhere in this Annual Report.
The selected financial data has been prepared in accordance with Canadian generally accepted accounting principles,GAAP, which we refer to as “Canadian GAAP”. Thehave been derived from our previously published audited consolidated financial statements included in Item 17 in this Annual Report are also prepared under Canadian GAAP. Included within these consolidated financial statements in Note 20 is a reconciliation between Canadian GAAP and United States generally accepted accounting principals, referred to as “US GAAP”, which differ, among other things, in respect tofor the recording of deferred exploration expenditures and stock-based compensation expense for non-service orientated equity awards.
_________________
(1)In 2007, the Company changed its financial year end from January 31 to December 31. Consequently, the period ended December 31, 2007 is an 11 month fiscal year. (referred hereinafter as fiscal year end “2007-II”)periods ending on such dates.
| Canadian GAAP | | | | | Eleven Months Ended | |
| | | Years Ended December 31, | | | December 31, | |
| | | 2009 | | | 2008 | | | 2007 | |
| Summary of Operations: | | | | | | | | | |
| Revenue | | $ | - | | | $ | - | | | $ | - | |
| Interest Income | | | 68,224 | | | | 146,386 | | | | 359,339 | |
| Expenses | | | | | | | | | | | | |
| Operating and administrative | | | 669,178 | | | | 1,575,913 | | | | 868,527 | |
| Write-down of mineral properties | | | 608,118 | | | | - | | | | - | |
| Equity losses in Cia Minera Mexicana de Avino, S.A. de C.V. | | | - | | | | - | | | | - | |
| Litigation settlement | | | - | | | | 2,785 | | | | (759,302 | ) |
| Misappropriation loss | | | - | | | | - | | | | (86,155 | ) |
| Mineral property option revenue | | | - | | | | 25,000 | | | | - | |
| Write-down of investment | | | - | | | | - | | | | - | |
| Site assessment of Cia Minera Mexicana de Avino, S.A. de C.V. | | | - | | | | - | | | | - | |
| Future income tax benefit (expense) | | | 239,562 | | | | (98,653 | ) | | | 501,083 | |
| Net loss | | | (987,759 | ) | | | (1,538,876 | ) | | | (885,863 | ) |
| Loss per share | | | (0.05 | ) | | | (0.07 | ) | | | (0.04 | ) |
| | | | | | | | | | | | | |
| Weighted average number of shares outstanding | | | 20,584,727 | | | | 20,584,727 | | | | 20,584,727 | |
| Canadian GAAP | | | | | | | | | | | Eleven Months Ended | | | Year Ended | |
| | | Years Ended December 31, | | | December 31, | | | January 31, | |
| | | 2010 | | | 2009 | | | 2008 | | | 2007 | | | 2007 | |
| Summary of Operations: | | | | | | | | | | | | | | | |
| Revenue | | $ | - | | | $ | - | | | $ | - | | | $ | - | | | $ | - | |
| Interest Income | | | 14,206 | | | | 68,224 | | | | 146,386 | | | | 359,339 | | | | 430,231 | |
| Expenses | | | | | | | | | | | | | | | | | | | | |
| Operating and administrative | | | 1,130,679 | | | | 669,178 | | | | 1,575,913 | | | | 868,527 | | | | 4,014,734 | |
| Write-down of mineral properties | | | - | | | | 608,118 | | | | - | | | | - | | | | - | |
| Equity losses in Cia Minera Mexicana de Avino, S.A. de C.V. | | | - | | | | - | | | | - | | | | - | | | | 33,581 | |
| Litigation settlement | | | - | | | | - | | | | - | | | | (759,302 | ) | | | - | |
| Misappropriation loss | | | - | | | | - | | | | - | | | | (86,155 | ) | | | - | |
| Mineral property option revenue | | | - | | | | - | | | | 25,000 | | | | - | | | | - | |
| Future income tax benefit (expense) | | | (332,141 | ) | | | 239,562 | | | | (98,653 | ) | | | 501,083 | | | | - | |
| Net loss | | | (1,490,194 | ) | | | (987,759 | ) | | | (1,538,876 | ) | | | (885,863 | ) | | | (3,648,539 | ) |
| Loss per share | | | (0.07 | ) | | | (0.05 | ) | | | (0.07 | ) | | | (0.04 | ) | | | (0.20 | ) |
| | | | | | | | | | | | | | | | | | | | | |
| Weighted average number of shares outstanding | | | 21,059,008 | | | | 20,584,727 | | | | 20,584,727 | | | | 20,584,727 | | | | 18,385,007 | |
| | | | | | | | | | | | | | | | | | | | | |
| | | | | | | | | | | | | | | | | | | | | |
| | | As at December 31, | | | As at January 31, | | |
| | | 2010 | | | 2009 | | | 2008 | | | 2007 | | | 2007 | | | 2009 | | | 2008 | | | 2007 | |
| Balance Sheet Data: | | | | | | | | | | | | | | | | | | | | | | | | |
| Total assets | | $ | 27,048,567 | | | $ | 19,206,278 | | | $ | 20,126,230 | | | $ | 21,190,940 | | | $ | 23,295,039 | | | $ | 19,206,278 | | | $ | 20,126,230 | | | $ | 21,190,940 | |
| Cash and cash equivalents | | | 9,051,456 | | | | 2,829,605 | | | | 3,575,241 | | | | 6,342,481 | | | | 11,045,106 | | | | 2,829,605 | | | | 3,575,241 | | | | 6,342,481 | |
| Total liabilities | | | 2,669,485 | | | | 2,241,179 | | | | 2,508,776 | | | | 2,532,414 | | | | 3,789,083 | | | | 2,241,179 | | | | 2,508,776 | | | | 2,532,414 | |
| Shareholders’ equity | | | 24,379,082 | | | | 16,965,099 | | | | 17,617,454 | | | | 18,658,526 | | | | 19,505,956 | | | | 16,965,099 | | | | 17,617,454 | | | | 18,658,526 | |
| United States GAAP | | | | | Eleven Months Ended | |
| | | Years Ended December 31, | | | December 31, | |
| | | 2009 | | | 2008 | | | 2007 | |
| Summary of Operations: | | | | | | | | | |
| Net loss per Canadian GAAP | | $ | (987,759 | ) | | $ | (1,538,876 | ) | | $ | (885,863 | ) |
| Adjustments | | | (95,108 | ) | | | (1,851,231 | ) | | | (2,833,433 | ) |
| Net loss per US GAAP | | | (1,082,867 | ) | | | (3,390,107 | ) | | | (3,719,296 | ) |
| Loss per share per US GAAP | | | (0.05 | ) | | | (0.17 | ) | | | (0.18 | ) |
| United States GAAP | | | | | | | | | | | Eleven Months Ended | | | Year Ended | |
| | | Years Ended December 31, | | | December 31, | | | January 31, | |
| | | 2010 | | | 2009 | | | 2008 | | | 2007 | | | 2007 | |
| Summary of Operations: | | | | | | | | | | | | | | | |
| Net loss per Canadian GAAP | | $ | (1,490,194 | ) | | $ | (987,759 | ) | | $ | (1,538,876 | ) | | $ | (885,863 | ) | | $ | (3,648,539 | ) |
| Adjustments | | | (396,664 | ) | | | (95,108 | ) | | | (1,851,231 | ) | | | (2,833,433 | ) | | | (10,277,556 | ) |
| Net loss per US GAAP | | | (1,886,858 | ) | | | (1,082,867 | ) | | | (3,390,107 | ) | | | (3,719,296 | ) | | | (13,926,095 | ) |
| Loss per share per US GAAP | | | (0.09 | ) | | | (0.05 | ) | | | (0.17 | ) | | | (0.18 | ) | | | (0.76 | ) |
| | | As at December 31, | | | As at January 31, | | | As at December 31, | |
| | | 2010 | | | 2009 | | | 2008 | | | 2007 | | | 2007 | | | 2009 | | | 2008 | | | 2007 | |
| Balance Sheet Data: | | | | | | | | | | | | | | | | | | | | | | | | |
| Total assets under Canadian GAAP | | $ | 27,048,567 | | | $ | 19,206,278 | | | $ | 20,126,230 | | | $ | 21,190,940 | | | $ | 23,295,039 | | | | 19,206,278 | | | | 20,126,230 | | | | 21,190,940 | |
| Adjustments | | | (15,302,311 | ) | | | (14,573,506 | ) | | | (14,861,524 | ) | | | (13,096,805 | ) | | | (10,747,339 | ) | | | (14,573,506 | ) | | | (14,861,524 | ) | | | (13,096,805 | ) |
| Total assets under US GAAP | | | 11,746,256 | | | | 4,632,772 | | | | 5,264,706 | | | | 8,094,135 | | | | 12,547,700 | | | | 4,632,772 | | | | 5,264,706 | | | | 8,094,135 | |
| | | | | | | | | | | | | | | | | | | | | | | | | | | | | | | | | |
| Total equity under Canadian GAAP | | | 24,379,082 | | | | 16,965,099 | | | | 17,617,454 | | | | 18,658,526 | | | | 19,505,956 | | | | 16,965,099 | | | | 17,617,454 | | | | 18,658,526 | |
| Adjustments | | | (13,276,163 | ) | | | (12,879,499 | ) | | | (12,927,955 | ) | | | (11,261,889 | ) | | | (10,747,339 | ) | | | (12,879,499 | ) | | | (12,927,955 | ) | | | (11,261,889 | ) |
| Total equity under US GAAP | | | 11,102,919 | | | | 4,085,600 | | | | 4,689,499 | | | | 7,396,637 | | | | 8,758,617 | | | | 4,085,600 | | | | 4,689,499 | | | | 7,396,637 | |
Exchange Rates
The following table sets forth information as to the period end, average, the high and the low exchange rate for Canadian Dollars and U.S. Dollars for the periods indicated based on the noon buying rate in New York City for cable transfers in Canadian Dollars as certified for customs purposes by the Federal Reserve Bank of New York (Canadian dollar = US$1).
| | | | | | | | | | | | | | | | | | | | | | | | |
| | | | | | | | | | | | | | | | | | | | | | | | | |
2007 | | | 1.1357 | | | | 1.1792 | | | | 1.1824 | | | | 1.0989 | | |
2007 II | | | 1.0651 | | | | 0.9913 | | | | 1.1853 | | | | 0.9170 | | | | 1.0651 | | | | 0.9913 | | | | 1.1853 | | | | 0.9170 | |
2008 | | | 1.0660 | | | | 1.2246 | | | | 1.2969 | | | | 0.9719 | | | | 1.0660 | | | | 1.2246 | | | | 1.2969 | | | | 0.9719 | |
2009 | | | 1.1420 | | | | 1.0466 | | | | 1.3000 | | | | 1.0292 | | | | 1.1420 | | | | 1.0466 | | | | 1.3000 | | | | 1.0292 | |
2010 | | | 1.0299 | | | | 0.9946 | | | | 1.0778 | | | | 0.9946 | | | | 1.0299 | | | | 0.9946 | | | | 1.0778 | | | | 0.9946 | |
2011 | | | | 0.9891 | | | | 1.0170 | | | | 1.0630 | | | | 0.9383 | |
The following table sets forth the high and low exchange rate for the past six months based on the noon buying rate. As of June 30, 2011,May 12, 2012, the exchange rate was CDN$0.9643 for each US$1.
| | | | | | |
| January 2011 | | | 1.0022 | | | | 0.9862 | |
| February 2011 | | | 0.9955 | | | | 0.9739 | |
| March 2011 | | | 0.9918 | | | | 0.9686 | |
| April 2011 | | | 0.9691 | | | | 0.9486 | |
| May 2011 | | | 0.9809 | | | | 0.9486 | |
| June 2011 | | | 0.9861 | | | | 0.9643 | |
| | | | | | |
| November 2011 | | | 1.0487 | | | | 1.0126 | |
| December 2011 | | | 1.0406 | | | | 1.0105 | |
| January 2012 | | | 1.0272 | | | | 0.9986 | |
| February 2012 | | | 1.0016 | | | | 0.9866 | |
| March 2012 | | | 1.0015 | | | | 0.9849 | |
| April 2012 | | | 1.0197 | | | | 0.9961 | |
B. Capitalization and Indebtedness
Not Applicable.
C. Reasons for the Offer and Use of Proceeds
Not Applicable.
D. Risk Factors
In addition to the other information presented in this Annual Report, the following should be considered carefully in evaluating the Company and its business. This Annual Report contains forward-looking statements that involve risks and uncertainties. The Company’s actual results may differ materially from the results discussed in the forward-looking statements. Factors that might cause such a difference include, but are not limited to, those discussed below and elsewhere in this Annual Report.
We will be required to raise additional capital to mine our properties. The Company is currently in the exploration stageand development stages on its properties. The Company is currently focusing on creating an effective plan to mine its San Gonzalo orebody. Our ability to raise funds will depend on several factors, including, but not limited to, current economic conditions, our properties, our prospects, metal prices, businesses competing for financing and our financial condition. There can be no assurance that we will be able to raise funds, or to raise funds on commercially reasonable terms.
We have incurred net losses since our inception and expect losses to continue. We have not been profitable since our inception. For the year ended December 31, 2010,2011, we had a net loss of $1,490,194$4,184,351 and an accumulated deficit on December 31, 20102011 of $25,660,878.$28,319,741. The Company has not generated revenues from operations since 2001 and does not expect to generate revenues from operations until one or more of its properties are placed in production. There is no assurance that any of the Company’s properties will be placed in production or that the Company’s operations will be profitable in the future.
The mining industry is highly speculative and involves substantial risks. Even when mining is conducted on properties known to contain significant quantities of mineral deposits it is generally accepted in the mining industry that most exploration projects do not result in the discovery of mineable deposits of ore that can be extracted in a commercially economical manner. There may be limited availability of water, which is essential to milling operations, and interruptions may be caused by adverse weather conditions. Operations are subject to a variety of existing laws and regulations relating to exploration and development, permitting procedures, safety precautions, property reclamation, employee health and safety, air quality standards, pollution and other environmental protection controls. Mining activities are subject to substantial operating hazards, some of which are not insurable or may not be insured for economic reasons.
The commercial quantities of ore cannot be accurately predicted. Whether an ore body will be commercially viable depends on a number of factors including the particular attributes of the deposit, such as size, grade and proximity to infrastructure, as well as mineral prices and government regulations, including regulations relating to prices, taxes, royalties, land tenure, land use, importing and exporting of minerals and environmental protection. The exact effect of these factors cannot be accurately predicted, but the combination of these factors may result in a mineral deposit being unprofitable.
There are no assurances that we can produce minerals on a commercially viable basis. The Company’s ability to generate revenue and profit is expected to occur through exploration of its existing properties as well as through acquisitions of interests in new properties. Substantial expenditures will be incurred in an attempt to establish the economic feasibility of mining operations by identifying mineral deposits and establishing ore reserves through drilling and other techniques, developing metallurgical processes to extract metals from ore, designing facilities and planning mining operations. The economic feasibility of a project depends on numerous factors, including the cost of mining and production facilities required to extract the desired minerals, the total mineral deposits that can be mined using a given facility, the proximity of the mineral deposits to refining facilities, and the market price of the minerals at the time of sale. There is no assurance that existing or future exploration programs or acquisitions will result in the identification of deposits that can be mined profitably.
Mining operations and exploration activities are subject to various federal, provincial and local laws and regulations. Laws and regulation govern the development, mining, production, importing and exporting of minerals, taxes, labour standards, occupational health, waste disposal, protection of the environment, mine safety, toxic substances, and other matters. In many cases, licenses and permits are required to conduct mining operations. Amendments to current laws and regulations governing operations and activities of mining companies or more stringent implementation thereof could have a substantial adverse impact on the Company. Applicable laws and regulations will require the Company to make certain capital and operating expenditures to initiate new operations. Under certain circumstances, the Company may be required to close an operation once it is started until a particular problem is remedied or to undertake other remedial actions.
Operating Hazards and Risks. The operation and development of a mine or mineral property involves many risks which even a combination of experience, knowledge and careful evaluation may not be able to overcome. These risks include:
· | industrial accidents and explosions; |
· | the encountering of unusual or unexpected geological formations; |
· | ground fall and cave-ins; |
· | periodic interruptions due to inclement or hazardous weather conditions. |
These occurrences could result in environmental damage and liabilities, work stoppages and delayed production, increased production costs, damage to, or destruction of, mineral properties or production facilities, personal injury or death, asset write downs, monetary losses and other liabilities. Liabilities that the Company incurs may exceed the policy limits of its insurance coverage or may not be insurable, in which event the Company could incur significant costs that could adversely impact its business, operations or profitability.
Market price is highly speculative. The market price of metals is highly speculative and volatile. Instability in metal prices may affect the interest in mining properties and the development of and production of such properties.
Penny stock rules may make it more difficult to trade the Company’s common shares. The Securities and Exchange Commission (the “SEC”) has adopted regulations which generally define a “penny stock” to be any equity security that has a market price, as defined, less than US$5.00 per share or an exercise price of less than US$5.00 per share, subject to certain exceptions. Our securities may be covered by the penny stock rules, which impose additional sales practice requirements on broker-dealers who sell to persons other than established customers and accredited investors such as institutions with assets in excess of US$5,000,000 or an individual with net worth in excess of US$1,000,000 or annual income exceeding US$200,000 or US$300,000 jointly with his or her spouse. For transactions covered by this rule, the broker-dealers must make a special suitability determination for the purchase and receive the purchaser’s written agreement of the transaction prior to the sale. Consequently, the rule may affect the ability of broker-dealers to sell our securities and also affect the ability of our investors to sell their shares in the secondary market.
Title risks. The validity and ownership of mining property holdings can be uncertain and may be contested. Although the Company’s properties in Canada are currently wholly owned by the Company, there are currently a number of pending and potential native title or traditional land owner claims in Canada. Accordingly, there can be no assurance that the Company’s properties in Canada will not be affected.
Competition for mineral land. There is a limited supply of desirable mineral lands available for acquisition, claim staking or leasing in the areas where the Company contemplates expanding its operations and conducting exploration activities. Many participants are engaged in the mining business, including large, established mining companies. Accordingly, there can be no assurance that the Company will be able to compete successfully for new mining properties.
Competition for recruitment and retention of qualified personnel. We compete with other exploration companies, many of which have greater financial resources than us or are further in their development, for the recruitment and retention of qualified employees and other personnel. Competition for exploration resources at all levels is currently very intense, particularly affecting the availability of manpower, drill rigs and supplies. If we require and are unsuccessful in acquiring additional personnel or other exploration resources, we will not be able to grow at the rate we desire or at all.
Uncertainty of exploration and development programs. The Company’s profitability is significantly affected by the costs and results of its exploration and development programs. As mines have limited lives based on proven and probable mineral reserves, the Company actively seeks to expand its mineral reserves, primarily through exploration, development and strategic acquisitions. Exploration for minerals is highly speculative in nature, involves many risks and is frequently unsuccessful. Among the many uncertainties inherent in any gold and silver exploration and development program are the location of economic ore bodies, the development of appropriate metallurgical processes, the receipt of necessary governmental permits and the construction of mining and processing facilities. Assuming the discovery of an economic deposit, depending on the type of mining operation involved, several years may elapse from the initial phases of drilling until commercial operations are commenced and, during such time, the economic feasibility of production may change. Accordingly, the Company’s exploration and development programs may not result in any new economically viable mining operations or yield new mineral reserves to expand current mineral reserves.
Licenses and permits. The operations of the Company require licenses and permits from various governmental authorities. The Company believes that it holds all necessary licenses and permits under applicable laws and regulations and believes that it is presently complying in all material respects with the terms of such licenses and permits. However, such licenses and permits are subject to change in various circumstances. There can be no guarantee that the Company will be able to obtain or maintain all necessary licenses and permits as are required to explore and develop its properties, commence construction or operation of mining facilities and properties under exploration or development or to maintain continued operations that economically justify the cost.
Political or economic instability or unexpected regulatory change. Certain of our properties are located in countries, provinces and states more likely to be subject to political and economic instability, or unexpected legislative change, than is usually the case in certain other countries, provinces and states. Our mineral exploration activities could be adversely effected by:
· | political instability and violence; |
· | war and civil disturbances; |
· | expropriation or nationalization; |
· | changing fiscal regimes; |
· | fluctuations in currency exchange rates; |
· | high rates of inflation; |
· | underdeveloped industrial and economic infrastructure; |
· | changes in the regulatory environment governing mineral properties; and |
· | unenforceability of contractual rights, |
any of which may adversely affect our business in that country.
We may be adversely affected by fluctuations in foreign exchange rates. We maintain our bank accounts mainly in Canadian and U.S. Dollars. Any appreciation in the currency of Mexico or other countries where we may carryout exploration activities against the Canadian or U.S. Dollar will increase our costs of carrying out operations in such countries. In addition, any decrease in the U.S. Dollar against the Canadian Dollar will result in a loss on our books to the extent we hold funds in U.S. Dollars.
Land reclamation requirements. Although variable depending on location and the governing authority, land reclamation requirements are generally imposed on mineral exploration companies (as well as companies with mining operations) in order to minimize the long term effects of land disturbance. Reclamation may include requirements to control dispersion of potentially deleterious effluents and reasonably re-establish pre-disturbance land forms and vegetation. In order to carry out reclamation obligations imposed on us in connection with our mineral exploration we must allocate financial resources that might otherwise be spent on further exploration programs.
Litigation. Although the Company is not currently subject to litigation, it may become involved in disputes with other parties in the future which may result in litigation. Any litigation could be costly and time consuming and could divert our management from our business operations. In addition, if the Company is unable to resolve any litigation favourably, it may have a material adverse impact on the Company’s financial performance, cash flow and results of operations.
Acquisitions. The Company undertakes evaluations of opportunities to acquire additional gold and silver mining properties. Any resultant acquisitions may be significant in size, may change the scale of the Company’s business, and may expose the Company to new geographic, political, operating, financial and geological risks. The Company’s success in its acquisition activities depends on its ability to identify suitable acquisition candidates, acquire them on acceptable terms, and integrate their operations successfully. Any acquisitions would be accompanied by risks, such as a significant decline in the price of gold or silver, the ore body proving to be below expectations, the difficulty of assimilating the operations and personnel of any acquired companies, the potential disruption of the Company’s ongoing business, the inability of management to maximize the financial and strategic position of the Company through the successful integration of acquired assets and businesses, the maintenance of uniform standards, controls, procedures and policies, the impairment of relationships with customers and contractors as a result of any integration of new management personnel and the potential unknown liabilities associated with acquired mining properties. In addition, the Company may need additional capital to finance an acquisition. Historically, the Company has raised funds through equity financing and the exercise of options and warrants. However, the Company’s ability to raise capital to acquire and explore resource properties may be adversely affected by the market prices for natural resources which are highly speculative and volatile. There can be no assurance that the Company would be successful in overcoming these risks or any other problems encountered in connection with such acquisitions.
Conflict of interest. Certain directors and officers of the Company are officers and/or directors of, or are associated with, other natural resource companies that acquire interests in mineral properties. Such associations may give rise to conflicts of interest from time to time. The directors are required by law, however, to act honestly and in good faith with a view to the best interests of the Company and to disclose any personal interest which they may have in any material transaction which is proposed to be entered into with the Company and to abstain from voting as a director for the approval of any such transaction.
Dependence on management. We are dependent on the services of key executives including our President and Chief Executive Officer and other highly skilled and experienced executives and personnel focused on advancing our corporate objectives as well as the identification of new opportunities for growth and funding. Due to our relatively small size, the loss of these persons or our inability to attract and retain additional highly skilled employees required for our activities may have a material adverse effect on our business and financial condition.
Uncertainty of continuing as a going concern. The continuation of the Company depends upon its ability to develop a self-supporting business and generate cash flow from operations and/or to raise equity capital through the sale of its securities. The Company will be required to raise new financing through the sale of shares or issuance of debt to continue with the exploration and development of its mineral properties. As a result, there is uncertainty about the Company’s ability to continue as a going concern. The Company’s consolidated financial statements do not include the adjustments that would be necessary if the Company were unable to continue as a going concern.
Limited and volatile trading volume. Although the Company’s common shares are listed on the New York Stock Exchange AMEX, referred to as “NYSE-AMEX”, the TSX Venture Exchange, referred to as the “TSX-V” and the Frankfurt Stock Exchange, referred to as the “FSE” and quoted in the United States on the OTC Bulletin Board, referred to as the “OTC BB”, the volume of trading has been limited and volatile in the past and is likely to continue to be so in the future, reducing the liquidity of an investment in the Company’s common shares and making it difficult for investors to readily sell their shares in the open market. Without a liquid market for the Company’s common shares, investors may be unable to sell their shares at favorable times and prices and may be required to hold their shares in declining markets or to sell them at unfavorable prices.
Volatility of share price. In recent years, securities markets in Canada have experienced a high level of price volatility. The market price of many resource companies, particularly those, like the Company, that are considered speculative exploration companies, have experienced wide fluctuations in price, resulting in substantial losses to investors who have sold their shares at a low price point. These fluctuations are based only in part on the level of progress of exploration, and can reflect general economic and market trends, world events or investor sentiment, and may sometimes bear no apparent relation to any objective factors or criteria. During the 20102011 fiscal year, the Company’s common share price fluctuated between a low of $0.65$1.35 and a high of $2.95.$3.47 (TSX.V), $1.99 to $3.60 (USOTCBB – Jan 1 through Aug 1) and $1.30 to $3.36 (AMEX – Aug 2 through Dec 30). Subsequent to the 20102011 fiscal year and as of June 17, 2011,May 11, 2012, the Company’s common share price has fluctuated between a low of $1.93$1.48 and a high of $3.47.$2.52 (TSX.V) and $1.46 to $2.54 (AMEX). Significant fluctuations in the Company’s common share price is likely to continue, and could potentially increase in the future.
Difficulty for United States investors to effect services of process against the Company. The Company is incorporated under the laws of the Province of British Columbia, Canada. Consequently, it will be difficult for United States investors to affect service of process in the United States upon the directors or officers of the Company, or to realize in the United States upon judgments of United States courts predicated upon civil liabilities under the United States Securities Exchange Act of 1934, as amended. The majority of the Company’s directors and officers are residents of Canada and all of the Company’s assets are located outside of the United States. A judgment of a United States court predicated solely upon such civil liabilities would probably be enforceable in Canada by a Canadian court if the United States court in which the judgment was obtained had jurisdiction, as determined by the Canadian court, in the matter. There is substantial doubt whether an original action could be brought successfully in Canada against any of such persons or the Company predicated solely upon such civil liabilities.
Item 4. Information on the Company
Cautionary Note to United States Investors
In Canada, an issuer is required to provide technical information with respect to mineralization, including reserves and resources, if any, on its mineral exploration properties in accordance with Canadian requirements, which differ significantly from the requirements of the Securities and Exchange Commission (the “SEC”) applicable to registration statements and reports filed by United States companies pursuant to the United States Securities Act of 1933, as amended (the “Securities Act”), or the United States Securities Exchange Act of 1934, as amended (the “Exchange Act”). As such, information contained in this annual report concerning descriptions of mineralization under Canadian standards may not be comparable to similar information made public by United States companies subject to the reporting and disclosure requirements of the SEC. In particular, this annual report on Form 20-F includes the terms “mineral resource,” “measured mineral resource,” “indicated mineral resource” and “inferred mineral resource”. Investors are advised that these terms are defined in and required to be disclosed under Canadian rules by National Instrument 43-101 (“NI 43-101”). U.S. Investors are cautioned not to assume that any part of the mineral deposits in these categories will ever be converted into reserves. However, these terms are not defined terms under SEC Industry Guide 7 and are not permitted to be used in reports and registration statements filed with the SEC by U.S. domestic issuers. In addition, NI 43-101 permits disclosure of “contained ounces” of mineralization. In contrast, the SEC only permits issuers to report mineralization as in place tonnage and grade without reference to unit measures.
The definitions of proven and probable reserves used in NI 43-101 differ from the definitions in SEC Industry Guide 7. Under SEC Industry Guide 7 (under the Exchange Act), as interpreted by the staff of the SEC, mineralization may not be classified as a “reserve” for United States reporting purposes unless the determination has been made that the mineralization could be economically and legally produced or extracted at the time the reserve determination is made. Among other things, all necessary permits would be required to be in hand or issuance imminent in order to classify mineralized material as reserves under the SEC standards.
United States investors are cautioned not to assume that any part or all of the mineral deposits identified as an “indicated mineral resource,” “measured mineral resource” or “inferred mineral resource” will ever be converted to reserves as defined in NI 43-101 or SEC Industry Guide 7. Further, “inferred mineral resources” have a great amount of uncertainty as to their existence and economic and legal feasibility. It cannot be assumed that all or any part of an inferred mineral resource will ever be upgraded to a higher category. Under Canadian securities legislation, estimates of inferred mineral resources may not form the basis of feasibility or pre-feasibility studies, or economic studies. U.S. investors are cautioned not to assume that part or all of an inferred mineral resource exists, or is economically or legally mineable.
A. History and Development of the Company
The Company was incorporated by Memorandum of Association under the laws of the Province of British Columbia on May 15, 1969,1968, and on August 22, 1969, by virtue of an amalgamation with Ace Mining Company Ltd., became a public company whose common shares are registered under the United States Securities Exchange Act of 1934, changing its name to Avino Mines & Resources Limited. On April 12, 1995, the Company changed its corporate name to International Avino Mines Ltd. and affected a reverse stock split of one common share for every five common shares outstanding. On August 29, 1997, the Company changed its corporate name to Avino Silver & Gold Mines Ltd., its current name, to better reflect the business of the Company of exploring for and mining silver and gold. In January 2008, the Company announced the change of its financial year end from January 31 to December 31. The change was completed in order to align the Company’s financial statement reporting requirements with its Mexico subsidiaries which operate on a calendar fiscal year.
The Company is a reporting issuer in the Province of British Columbia and Alberta, a foreign issuer with the SEC and trades on the TSX Venture Exchange under the symbol “ASM”, on the OTC Bulletin BoardNYSE-AMEX under the symbol “ASGMF”“ASM” and on the Berlin & Frankfurt Stock Exchange under the symbol “GV6”. In November 2006, the Company’s listing on the TSX Ventures Exchange was elevated to Tier 1 status. Most recently, the Company listed its common shares on the NYSE-AMEX under the symbol “ASM” on August 2, 2011. The principal executive office of the Company is located at Suite 900, 570 Granville Street, Vancouver, British Columbia V6C 3P1, and its telephone number is 604-682-3701.
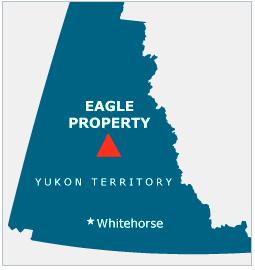
The Company is a natural resource company, primarily engaged in the acquisition, exploration and development of natural resource properties. The Company’s principal business activities have been the exploration of a mineral property located in the State of Durango, Mexico and other mineral properties in Canada, specifically British Columbia and the Yukon Territory.
Significant Acquisitions and Significant Dispositions
On July 17, 2006, the Company completed the acquisition of Compañía Minera Mexicana de Avino, S.A. de C.V. (“Cia Minera”), a Mexican corporation, through the acquisition of an additional 39.25% interest in Cia Minera which combined with the Company’s pre-existing 49% share of Cia Minera, brought the Company’s ownership interest in Cia Minera to 88.25%. The additional 39.25% interest in Cia Minera was obtained though the acquisition of 76.88% of the common shares of Promotora Avino S.A. De C.V., referred to as “Promotora”, which in turn owns 49.75% of Cia Minera’s common shares, and the direct acquisition of 1% of the common shares of Cia Minera.
The July 17, 2006 acquisition was accomplished by a share exchange by which the Company issued 3,164,702 shares as consideration, which we refer to as the “Payment Shares”, for the purchase of the additional 39.25% interest in Cia Minera. The Payment Shares were valued based on the July 17, 2006 closing market price of the Company’s shares on the TSX-V.
The Company acquired a further 1.1% interest in Cia Minera through the acquisition from an estate subject to approval and transfer of the shares to the Company by the trustee for the estate. On December 21, 2007 approval was received and the Company obtained the 1.1% interest from the estate for no additional consideration.
On February 16, 2009, the Company converted existing loans advanced to Cia Minera in to new additional shares of Cia Minera. As a result, the Company’s ownership interest in Cia Minera increased to 99.28%.
The Company has no other significant acquisitions or dispositions of property, except as disclosed in this Annual Report.
B. Business Overview
Operations and Principal Activities
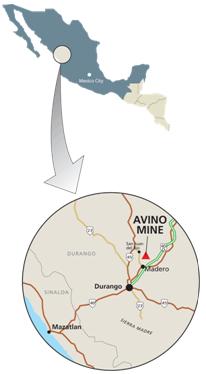
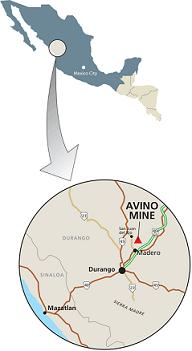
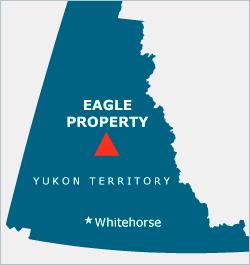
The Company is a Canadian-based resource firm focused on silver and gold exploration. The Company has a long prior history of operation, beginning in 1968 with the development of the Avino Silver Mine, located in the state of Durango, Mexico (the “Avino Mine”). From 1974 to 2001, the Avino Mine produced silver, gold, copper and lead and provided hundreds of jobs for the Durango region before closing due to depressed metal prices and closing of smelter. Beginning in 2002, the Company re-directed its corporate strategy to focus almost entirely on silver and began acquiring silver properties in North America. The Company acquired the Eagle property in Canada’s Yukon Territory and the Aumax silver and gold property in British Columbia. Each property produced positive assays for silver through drilling and sampling.sampling however, in late April 2012, the Company relinquished its interest in the Aumax silver and gold property to focus on its property in Mexico. The Avino Mine in Mexico and surrounding mineral leases continue to hold silver potential. These properties, along with other silver and gold projects, will remain the Company’s principal focus for the foreseeable future.
Presently, the Company is an “exploration stage company”, as all of the Company’s properties are currently in the exploratory stage of development. In order to determine if a commercially viable mineral deposit exists in any of the Company’s properties, further geological work will need to be done and a final evaluation based upon the results obtained to conclude economic and legal feasibility.
Competition
The mining industry in which the Company is engaged is highly competitive. Competitors include well-capitalized mining companies, independent mining companies and other companies having financial and other resources far greater than those of the Company. The Company competes with other mining companies in connection with the acquisition of gold, silver and other precious metal properties. In general, properties with a higher grade of recoverable mineral and/or which are more readily mined afford the owners a competitive advantage in that the cost of production of the final mineral product is lower. In 2010, demand for silver exceeded supply and worldwide demand is expected to increase through 2011. This, in part, has fueled the increases in silver prices over the same period. Thus, a degree of competition exists between those engaged in the mining industry to acquire the most valuable properties. As a result, the Company may eventually be unable to acquire attractive gold or silver mining properties.
Seasonality
Certain of our operations are conducted in British Columbia and the Yukon Territory. The weather during the colder seasons in these areas can be extreme and can cause interruptions or delays in our operations. As a result, the preferable time for activities in these regions is the spring and summer when costs are more reasonable and access to the properties is easier. In the summer months, however, if the weather has been unusually hot and dry, access to the Company’s properties may be limited as a result of access restrictions being imposed to monitor the risks of forest fires.
Governmental Regulation
The current and anticipated future operations of the Company, including development activities and commencement of production on its properties, require permits from various federal, territorial and local governmental authorities and such operations are and will be governed by laws and regulations governing prospecting, development, mining, production, exports, taxes, labor standards, occupational health, waste disposal, toxic substances, land use, environmental protection, mine safety and other matters. Companies engaged in the development and operation of mines and related facilities generally experience increased costs and delays in production and other schedules as a result of the need to comply with applicable laws, regulations and permits. Such operations and exploration activities are also subject to substantial regulation under these laws by governmental agencies and may require that the Company obtain permits from various governmental agencies. The Company believes it is in substantial compliance with all material laws and regulations which currently apply to its activities. There can be no assurance, however, that all permits which the Company may require for construction of mining facilities and conduct of mining operations will be obtainable on reasonable terms or that such laws and regulations, or that new legislation or modifications to existing legislation, would not have an adverse effect on any exploration or mining project which the Company might undertake.
Mineral exploration and mining in Mexico is covered under the Mining Law as first published in June 1992, and amended in April 2005. Mining operations in Mexico are administered by the Ministry of Economy. Environmental regulations are covered under “Ley General del Equilibrio Ecológio y la Protección al Ambiente” (General Law of Ecological Balance and Environmental Protection) and its regulations. Certain other environmental laws, including “Ley de Aguas Nacionales” (Law of National Waters) and “Ley Forestal” (Forestry Law) and their associated regulations may also cover certain operations. The kind of permits or authorizations required to conduct mining or mineral exploration operations in Mexico depend upon the type of operation. Common exploration activities do not require prior environmental authorization or licenses, but it is advisable to request a confirmation from the National Water Commission that planned operations will not affect the water table. It is also necessary to confirm that any planned operations will not be conducted in protected natural areas.
The Company believes it has obtained all necessary permits and authorizations required for its current exploration. The Company has had no material costs related to compliance and/or permits in recent years, and anticipates no material costs in the next year. Unfavorable amendments to current laws, regulations and permits governing operations and activities of resource exploration companies, or more stringent implementation thereof, could have a materially adverse impact on the Company and cause increases in capital expenditures which could result in a cessation of operations by the Company.
Failure to comply with applicable laws, regulations and permitting requirements may result in enforcement actions thereunder, including orders issued by regulatory or judicial authorities causing operations to cease or be curtailed, and may include corrective measures requiring capital expenditures, installation of additional equipment or remedial actions. Parties engaged in exploration and mining operations may be required to compensate those suffering loss or damage by reason of the mining activities and may have civil or criminal fines or penalties imposed for violation of applicable laws or regulations.
The enactment of new laws or amendments to current laws, regulations and permits governing operations and activities of mining companies, or more stringent implementation thereof, could have a material adverse impact on the Company and cause increases in capital expenditures or production costs or reduction in levels of production at producing properties or require abandonment or delays in the development of new mining properties.
C. Organizational Structure
The Company’s Mexican subsidiaries are the wholly owned subsidiary of Oniva Silver and Gold Mines S.A. de C.V., referred to as “Oniva”, Promotora, in which the Company has direct ownership of 79.09%, and Cia Minera in which the Company has a 96.6% direct ownership and an additional 2.68% of Cia Minera is held through Promotora. The Company’s total effective ownership interest in Cia Minera is 99.28%.
All of the above subsidiaries are incorporated under the laws of Mexico.
D. Property, Plants and Equipment
The Company is exploring five silver and gold projects in Canada and Mexico. All of the Company’s mineral property interests in Canada are wholly-owned by the Company. In Mexico, the Company has a 99.28% interest in Cia Minera, a Mexican company which is involved in the mining of commercial ores and resource exploration and development, including the operation of the Avino Mine. Cia Minera is not involved with any exploration activities in Canada. The Company owns and manages these properties. Exploration in Canada has in recent years, been limited to prospecting, trenching and drill programs on our Eagle, Olympic-Kelvin, Minto, and Aumax properties. However, as disclosed above, the Company relinquished its interest in the Aumax property to focus on its property in Mexico.
The Company uses detailed sampling to provide the basis for quality estimates and grades of its mineral discoveries. Samples are collected under the supervision of a qualified person who then follows procedures for the collection, sample preparation and chain of custody guidelines for the shipment of the samples to a certified commercial laboratory as set out in National Instrument 43-101. These commercial labs have standard Quality Assurance/Quality Control protocols in place for the various assaying methods that are being used on the samples. In addition, blanks, standards and duplicates are generally used to confirm the validity of the results before they are reported.
Avino Property, Durango, Mexico
Ownership.
The Company has a 99.28% ownership interest in Cia Minera, a company incorporated under the laws of Mexico. Cia Minera owns the Avino Property. The Company acquired its initial 49% interest in Cia Minera in 1968, an additional interest of 39.25% in July 2006, 1.1% interest in December 2007 and most recently 9.93% in February 2009.
In addition to its wholly owned claims, Cia Minera leases four core mineral claims in consideration for royalties. While the mine was producing from 1974 until 2001, we operated under a lease which expired October 31, 2010. In February 2012, Cia Minera re-negotiated and entered into a new agreement with Minerales de Avino, S.A. de C.V. (“Minerales”) to acquire mineral rights on the four core mineral claims, whereby Cia Minera will have the exclusive right to explore these claims for an initial period of 15 years, with the option to extend the agreement for another 5 years. In consideration of the grant of these rights, the Company must pay Minerales a deemed sum of US$250,000, by the issuance of 135,189 common shares of the Company at a deemed price of $1.85 per share. The Company will have a period of 24 months for the development of mining facilities. The Company has agreed to pay to Minerales a royalty equal to 3.5% of net smelter returns (the “NSR Royalty”), at the commencement of commercial production from the property. In addition, after the development period, if the minimum monthly processing rate of the mine facilities is currently negotiatingless than 15,000 tonnes, then the renewal.Company must pay to Minerales in any event a minimum royalty equal to the applicable NSR Royalty based on processing at a minimum monthly rate of 15,000 tonnes. Minerales has also granted to the Company the exclusive right to purchase a 100% interest in the property at any time during the term of the agreement (or any renewal thereof), upon payment of US$8 million within 15 days of the Company’s notice of election to acquire the property. The purchase would be completed under a separate purchase agreement for the legal transfer of the property.
Property Description and Location.
The Avino Property is located approximately 74 km’s to the NE of the city of Durango and covers approximately 4,364 hectares. The property is accessible via a paved public road. The Avino Mine had been an open pit operation until March 1993, at which time Cia Minera commenced underground operations. Mineralized rock was broken by ripping, drilling and blasting and trucked to the processing plant, approximately 400 meters from the pit, where it was processed. The Avino Mine was an underground operation at the time of closure in November 2001.
History.The Avino Mine operated from 1974 to 2001, producing about 497 tons of silver, three tons of gold, and 11,000 tons of copper until the suspension of mining operations in November 2001.
The Avino Mine and processing plant were historically serviced by a heavy equipment repair shop, mechanical and electrical shops, assay office, metallurgical laboratory, warehouse and other auxiliary facilities. Electric power was supplied by the government-owned Federal Electricity Commission.
Water for use at the mill is obtained from: (i) the Galeana Well; (ii) the El Caracol Reservoir.Reservoir (iii) Tailings Reclaim Water.
The property was dormant from 2002 to 2006, largely due to low copper and silver prices. As stated above, Avino gained control of the property in July 2006 and exploration resumed that year; this lead to the discovery of new mineralization at the San Gonzalo and resulting productionin underground development and bulk sample testing to firm up the grade and metallurgy in the fall of 2010.
Processing Plant
In September 2006, the Company commissioned an independent plant audit by Herb Osborne and Associates to conduct a full review of the plant, including the condition of all equipment, capacity of each circuit, and efficiency of the plant. The report was an order of magnitude cost estimate for putting the processing plant.plant back into operation at the rate of 1,000 tpd.
The Company’s processing plant was built initially in the 1970’s and was refurbished and capacity increased in 1993. Most of the infrastructure was in place for both a 250 tpd and 1,000 tpd operation. At the time of shutdown in 2001 with low commodity prices and closure of smelter, the mill was operating at an average rate of 1,130 tpd.
The report concluded that the process plant can be brought back into operation in as little as three months contingent upon the availability of operators and mechanics for about US $1 million at 1000 tpd for an operating life of 5 to 10 years.
The 250 tpd circuit in the mill was subsequently renovated in the last few years in order to process ore from the San Gonzalo bulk sample.
Geophysical Surveys: Induced Polarization (IP)
In December 2006, Avino contracted Peter E. Walcott & Associates to carry out an 80 km line deep penetrating IP Survey at the property. IP geophysics helps identify drill targets. The IP Survey was completed in 2007 and the final report was received from Peter E. Walcott & Associates in 2008. Avino did follow-up soil geochemical, satellite imagery and other surveys to better define targets in the covered areas.
Tailings
In April 2006, Wardrop Engineering Inc. (“Wardrop Engineering”), completed a study on “Tailings Retreatment Process Options for the Avino Tailings Project in Durango, Mexico”. The report concluded the oxide tailing is amenable to cyanidation with agglomerated heap leach as the method of choice followed by Merril Crowe precipitation of the silver and gold. The sulphide tailing would require sampling and further metallurgical test work before a proper assessment can be made.
The preliminary evaluation of the oxide tailings suggested the capital cost for a 500,000 ton per year, 4 year operation of US$1.62m and the cost to operate per ton of tailings is US$8.64. Capital costs for a plant twice the size and half the life was US$22.7m. The internal rate of return and the net present value favoured the 4 year operation.
The disclosure of the implied values is preliminary in nature and includes inferred mineral resources that are considered to be too speculative geologically to have the economic considerations applied to them that would enable them to be categorized as mineral reserves, and there is no certainty that the preliminary assessment will be realized.
Mr. Rick Alexander P. Eng., an independent qualified person as defined by applicable Canadian rules prepared the capital cost estimate and co-coordinated Wardrop Engineering’s work on the Avino Tailings Project.
In 2011, Avino engaged Wardrop Engineering to update the 2006 Tailings Scoping Study where the cost estimates were based on a heap leach operation. The updated study will utilize the continuous vat leach technology (CVL) in the revised cost estimates for comparative purposes. Samples of oxide and sulphide tailings were collected to determine if the tailings characteristics would be amenable in a CVL system.
Drilling & Programs 20072008 – 20112012
In 2008After taking control of the Company drilled seven holesproperty in 2006, Avino commenced a regional drill program that continues into 2012. Exploration initially focused on the Elena Tolosa area of the main Avino vein as well as on a new area known as San Gonzalo. Both areas produced favorable results and are now the company’s focus for further development. Ongoing exploration on the property is focused on expanding the San Gonzalo zone as well as outlining the remainder of the Avino Vein and to define new targets on the property such as the Guadalupe, La Potasina, Los Angeles, Aguila Mexicana structure, two at La Blanca, six holes at San Jose, and four at Santa Ana of which two holes at Aquila Mexicana intersected significant mineralization..
Details are as follows:
AM-08-02
Intersected 5.05 metres @ 0.49 g/t gold 75.38 g/t silver.
Detailed intersections
From (m) | To (m) | Length (m) | Au (g/t) | Ag (g/t) | Cu (ppm) | Pb (ppm) | Zn (ppm) |
| 195.05 | 195.90 | .85 | .221 | 189.4 | 155 | 238 | 438 |
| 195.90 | 196.80 | .90 | .100 | 19.1 | 139 | 155 | 384 |
| 196.80 | 197.90 | 1.10 | .245 | 82,6 | 738 | 14400 | 34000 |
| 197.90 | 199.10 | 1.20 | .905 | 42.1 | 467 | 13800 | 46500 |
| 199.10 | 200.10 | 1.00 | 1.046 | 77.1 | 1552 | 3977 | |
AM-08-04
Intersected 3.30 metres grading 0.34 g/t gold and 151 g/t silver.
Detailed intersections
From (m) | To (m) | Length (m) | Au (g/t) | Ag (g/t) | Cu (ppm) | Pb (ppm) | Zn (ppm) |
| 205.10 | 206.15 | 1.05 | 0.309 | 85.4 | 1092 | 4672 | 4835 |
| 206.15 | 207.15 | 1.00 | 0.259 | 132.7 | 3278 | 6780 | 1116 |
| 207.15 | 207.80 | .65 | 0.600 | 277.4 | 1017 | 1979 | 1020 |
| 207.80 | 208.40 | .60 | 0.243 | 159.4 | 693 | 786 | 693 |
AM-08-02 and AM-08-04 generated the first good drill values from the Aguila Mexicana zone, and they represent viable targets for follow up.
Avino Main Vein (Veta Avino) Elena Tolosa Area (ET(“ET”)
During 2007 and 2008 Avino drilled 18 holes to explore the ET area of the main Avino deposit below level 11.5 where mining had ended in November 2001. Holes ET07-01 through ET-07-10 were in 2007 and ET-08-01 through ET-08-08 were drilled in 2008.
The programs were explored in the vein system below the original workings to ensure that vein widths and copper/silver values continued at depth. Location of the 2007 and 2008 holes on map and section can be seen on the Avino website.
Details are as follows:
ET-07-01 (Bearing 001 - Dip 69 - Length 298.6m)
Total vein intersection: 216.35 – 293.65m (77.3m)
Significant intersection: 284.90 – 290.0m (5.1m), 0.055 g/t gold, 114 g/t silver (0.002oz/t gold, 3.32oz/ton silver), 8385 ppm copper.
Detailed intersections
From (m) | To (m) | Length (m) | Description | Au (g/t) | Ag (g/t) | Cu (ppm) |
| 284.90 | 285.85 | 0.95 | Avino vein. Silicified quartz with diss-cpy-py-specularite | 0.068 | 201.7 | 3149 |
| 285.85 | 286.80 | 0.95 | 0.025 | 35.4 | 969 |
| 286.80 | 287.00 | 0.20 | 0.226 | 808.8 | 100200 |
| 287.00 | 288.50 | 1.50 | 0.045 | 27.3 | 2540 |
| 288.50 | 290.00 | 1.50 | 0.052 | 101.6 | 10000 |
ET-07-02 (Bearing 358 - Dip 75 - Length 311.9m)
Intersected Avino vein: 243.45 – 300.7m (57.25m)
No significant assays.
ET-07-03 (Bearing 336 – Dip 71 – Length 349.5m)
Intersected Avino vein: 280.75 – 331.75m (51.0m)
Detailed intersections
From (m) | To (m) | Length (m) | Description | Au (g/t) | Ag (g/t) | Cu (ppm) |
| 280.75 | 282.25 | 1.50 | Avino vein. Oxidized material | 7.680 | 121.9 | 6048 |
| 282.25 | 283.75 | 1.50 | 6.034 | 196.3 | 5034 |
| 283.75 | 285.25 | 1.50 | 1.692 | 69.9 | 10400 |
| 285.25 | 286.75 | 1.50 | 13.988 | 295.3 | 19600 |
| 286.75 | 288.25 | 1.50 | 4.731 | 104.7 | 16100 |
| 288.25 | 289.75 | 1.50 | 2.158 | 103.7 | 3948 |
| 289.75 | 291.25 | 1.50 | 0.158 | 31.5 | 3789 |
| 291.25 | 292.75 | 1.50 | 2.411 | 60.0 | 2683 |
| 292.75 | 294.25 | 1.50 | 2.733 | 27.5 | 2793 |
| 294.25 | 295.75 | 1.50 | 0.548 | 89.6 | 7268 |
| 295.75 | 297.25 | 1.50 | 3.086 | 161.8 | 5934 |
| 297.25 | 298.75 | 1.50 | 7.954 | 75.7 | 1476 |
| 298.75 | 300.25 | 1.50 | 2.265 | 97.0 | 10500 |
| 300.25 | 301.75 | 1.50 | 1.057 | 60.4 | 1486 |
| 301.75 | 303.25 | 1.50 | 1.911 | 42.0 | 3258 |
ET-07-04 (Bearing 331 – Dip 56 – Length 318.7m)
Intersected Avino vein: 271.45 – 304.45m (33.0m)
Detailed intersections
From (m) | To (m) | Length (m) | Description | Au (g/t) | Ag (g/t) | Cu (ppm) |
| 271.45 | 272.95 | 1.50 | Avino vein. Wh qtz veining w/ fine grain diss cpy-py | 0.155 | 44.1 | 3618 |
| 272.95 | 274.45 | 1.50 | 0.397 | 106.1 | 2842 |
| 274.45 | 275.95 | 1.50 | 1.080 | 76.1 | 3862 |
| 275.95 | 277.45 | 1.50 | 1.314 | 126.9 | 4010 |
| 277.45 | 278.95 | 1.50 | 0.874 | 53.0 | 381 |
| 278.95 | 280.45 | 1.50 | 0.534 | 61.4 | 675 |
| 280.45 | 281.95 | 1.50 | 0.436 | 97.3 | 2649 |
| 287.95 | 289.45 | 1.50 | 0.250 | 63.5 | 7555 |
| 289.45 | 290.95 | 1.50 | 0.101 | 31.4 | 5156 |
| 290.95 | 292.45 | 1.50 | 1.115 | 138.6 | 3558 |
| 292.45 | 293.95 | 1.50 | 0.151 | 86.3 | 4162 |
| 293.95 | 295.45 | 1.50 | 0.161 | 34.9 | 3521 |
| 295.45 | 296.95 | 1.50 | 0.568 | 41.6 | 5047 |
| 296.95 | 298.45 | 1.50 | 0.115 | 29.1 | 10000 |
| 298.45 | 300.10 | 1.65 | 0.080 | 29.8 | 8408 |
ET-07-05 (Bearing 333 – Dip 66 – Length 351.5m)
Intersected Avino vein: 271.45 – 304.45m (33.0m)
Detailed intersections
From (m) | To (m) | Length (m) | Description | Au (g/t) | Ag (g/t) | Cu (ppm) |
| 271.45 | 272.95 | 1.50 | Avino vein. Wh qtz veining w/ fine grain diss cpy-py | 0.155 | 44.1 | 3618 |
| 272.95 | 274.45 | 1.50 | 0.397 | 106.1 | 2842 |
| 274.45 | 275.95 | 1.50 | 1.080 | 76.1 | 3862 |
| 275.95 | 277.45 | 1.50 | 1.314 | 126.9 | 4010 |
| 277.45 | 278.95 | 1.50 | 0.874 | 53.0 | 381 |
| 278.95 | 280.45 | 1.50 | 0.534 | 61.4 | 675 |
| 280.45 | 281.95 | 1.50 | 0.436 | 97.3 | 2649 |
| 287.95 | 289.45 | 1.50 | 0.250 | 63.5 | 7555 |
| 289.45 | 290.95 | 1.50 | 0.101 | 31.4 | 5156 |
| 290.95 | 292.45 | 1.50 | 1.115 | 138.6 | 3558 |
| 292.45 | 293.95 | 1.50 | 0.151 | 86.3 | 4162 |
| 293.95 | 295.45 | 1.50 | 0.161 | 34.9 | 3521 |
| 295.45 | 296.95 | 1.50 | 0.568 | 41.6 | 5047 |
| 296.95 | 298.45 | 1.50 | 0.115 | 29.1 | 10000 |
| 298.45 | 300.10 | 1.65 | 0.080 | 29.8 | 8408 |
ET-07-05(Bearing 333 – Dip 66 – Length 351.5m)
Intersected Avino vein: 292.75 – 342.45m (49.7m)
Detailed intersections
Detailed intersections
From (m) | To (m) | Length (m) | Description | Au (g/t) | Ag (g/t) | Cu (ppm) |
| 301.95 | 303.45 | 1.50 | Avino vein. Wh qtz stkwk-veining w/diss f.g. cpy+py+spec | 1.152 | 83.0 | 1971 |
| 303.45 | 304.95 | 1.50 | 1.483 | 26.7 | 683 |
| 304.95 | 306.45 | 1.50 | 2.119 | 36.9 | 2030 |
| 312.45 | 312.95 | 0.50 | 1.752 | 10.7 | 533 |
| 312.95 | 315.45 | 2.50 | 1.015 | 119.7 | 1268 |
| 315.45 | 316.95 | 1.50 | 0.195 | 204.2 | 8565 |
| 316.95 | 318.45 | 1.50 | 0.075 | 123.6 | 2212 |
| 319.95 | 321.45 | 1.50 | 0.155 | 86.2 | 20300 |
| 321.45 | 322.95 | 1.50 | 0.120 | 30.4 | 13000 |
| 322.95 | 324.45 | 1.50 | 0.115 | 45.2 | 15400 |
| 324.45 | 325.95 | 1.50 | 0.075 | 40.2 | 18400 |
| 325.95 | 327.45 | 1.50 | 0.070 | 27.5 | 10200 |
| 327.45 | 328.95 | 1.50 | 0.050 | 48.1 | 17500 |
| 328.95 | 330.45 | 1.50 | 0.053 | 38.2 | 16700 |
| 330.45 | 331.95 | 1.50 | 0.095 | 61.9 | 20200 |
| 331.95 | 333.45 | 1.50 | 0.144 | 75.2 | 18900 |
| 333.45 | 334.95 | 1.50 | 0.130 | 45.7 | 15800 |
| 337.95 | 339.45 | 1.50 | 0.328 | 69.0 | 12200 |
| 339.45 | 340.95 | 1.50 | 0.236 | 41.0 | 12200 |
ET-07-06 (Bearing 336 – Dip 55 – Length 320.05m)
Intersected Avino vein: 289.00 – 309.6m (19.6m)
Detailed intersections
From (m) | To (m) | Length (m) | Description | Au (g/t) | Ag (g/t) | Cu (ppm) |
| 289.00 | 290.50 | 1.50 | Avino vein. Wh qtz stockwork veining textures w’diss py-cpy | 0.950 | 228.9 | 23200 |
| 298.00 | 299.50 | 1.50 | 0.165 | 72.3 | 14800 |
| 299.50 | 301.00 | 1.50 | 0.485 | 54.6 | 8401 |
| 301.00 | 302.50 | 1.50 | 0.090 | 40.8 | 11500 |
| 302.50 | 304.00 | 1.50 | 0.147 | 55.6 | 14400 |
| 304.00 | 305.50 | 1.50 | 0.093 | 55.8 | 8321 |
| 305.50 | 307.00 | 1.50 | 1.590 | 90.4 | 15100 |
| 307.00 | 308.60 | 1.60 | 0.150 | 73.8 | 8729 |
| 308.60 | 310.10 | 1.50 | 0.040 | 54.6 | 5962 |
| 310.10 | 311.60 | 1.50 | 0.075 | 98.0 | 6217 |
| 311.60 | 313.10 | 1.50 | 0.075 | 81.9 | 10800 |
| 313.10 | 314.60 | 1.50 | 0.040 | 97.9 | 7765 |
ET-07-07 (Bearing 330 – Dip 59 – Length 304.85m)
Intersected Avino vein: 272.30 – 295.15m (22.85m), 0.11 g/t gold, 115 g/t silver (0.003 oz/t gold 3.35 oz/t silver), 13810 ppm copper
Detailed intersections
From (m) | To (m) | Length (m) | Description | Au (g/t) | Ag (g/t) | Cu (ppm) |
| 272.30 | 273.80 | 1.50 | Avino vein. Wh qtz veining w/moderate diss cpy and strong py. | 0.615 | 80.6 | 2199 |
| 273.80 | 275.30 | 1.50 | 0.148 | 160.9 | 20500 |
| 275.30 | 276.80 | 1.50 | 0.118 | 203.5 | 19700 |
| 276.80 | 278.30 | 1.50 | 0.280 | 172.8 | 17800 |
| 278.30 | 279.80 | 1.50 | 0.368 | 441.4 | 24600 |
| 279.80 | 281.30 | 1.50 | 0.220 | 327.0 | 12600 |
| 281.30 | 282.80 | 1.50 | 0.081 | 110.8 | 3002 |
| 282.80 | 284.30 | 1.50 | 0.065 | 184.6 | 3317 |
| 284.30 | 285.80 | 1.50 | 0.070 | 89.2 | 8786 |
| 285.80 | 287.30 | 1.50 | 0.070 | 209.3 | 54400 |
| 287.30 | 288.80 | 1.50 | 0.035 | 32.8 | 13200 |
| 288.80 | 290.30 | 1.50 | 0.047 | 76.1 | 29300 |
| 290.30 | 291.80 | 1.50 | 0.126 | 339.7 | 44300 |
| 291.80 | 293.30 | 1.50 | 0.060 | 20.8 | 6361 |
| 293.30 | 295.15 | 1.85 | 0.202 | 166.9 | 55500 |
ET-07-08 (Bearing 346 – Dip 69 – Length 399.7m)
Intersected Avino vein: 346.65 – 366.7m (20.05m)
Detailed intersections
From (m) | To (m) | Length (m) | Description | Au (g/t) | Ag (g/t) | Cu (ppm) |
| 355.85 | 357.35 | 1.50 | Avino vein. Moderate diss cpy-py | 0.111 | 257.5 | 6959 |
| 357.35 | 359.15 | 1.80 | 0.125 | 170.0 | 9341 |
ET-07-09 (Bearing 336 – Dip 62 – Length 328.6m)
Intersected Avino vein: 272.80 – 319.10m (46.3m)
Detailed intersections
From (m) | To (m) | Length (m) | Description | Au (g/t) | Ag (g/t) | Cu (ppm) |
| 290.80 | 292.30 | 1.50 | Avino vein with massive chalcopyrite | 0.040 | 101.9 | 12100 |
| 292.30 | 293.80 | 1.50 | 0.160 | 23.7 | 11500 |
| 295.30 | 296.80 | 1.50 | 0.146 | 32.3 | 11200 |
| 299.80 | 301.30 | 1.50 | 0.070 | 51.2 | 6327 |
| 301.30 | 302.80 | 1.50 | 0.360 | 40.4 | 14600 |
| 302.80 | 304.30 | 1.50 | 0.015 | 18.1 | 8029 |
| 304.30 | 305.80 | 1.50 | 0.020 | 28.2 | 8475 |
ET-07-10 (Bearing 336 – Dip 63 – Length 308.7m)
Intersected Avino vein: 243.80 – 299.10m (55.3m)
Detailed intersections
From (m) | To (m) | Length (m) | Description | Au (g/t) | Ag (g/t) | Cu (ppm) |
| 257.30 | 258.80 | 1.50 | Avino quartz vein with sulphides | 0.160 | 85.3 | 15700 |
| 258.80 | 260.30 | 1.50 | 0.080 | 86.6 | 23400 |
| 260.30 | 261.80 | 1.50 | 0.125 | 27.7 | 14100 |
| 261.80 | 263.30 | 1.50 | 0.101 | 21.8 | 15400 |
| 263.30 | 264.80 | 1.50 | 0.098 | 20.3 | 13500 |
| 266.30 | 267.80 | 1.50 | 0.574 | 43.4 | 6613 |
| 267.80 | 269.30 | 1.50 | 0.457 | 39.8 | 4211 |
| 269.30 | 270.80 | 1.50 | 0.089 | 19.3 | 15200 |
| 282.80 | 284.30 | 1.50 | 0.020 | 9.3 | 16000 |
| 284.30 | 285.80 | 1.50 | 0.010 | 10.2 | 19300 |
| 285.80 | 287.30 | 1.50 | 0.035 | 27.0 | 31600 |
| 287.30 | 288.80 | 1.50 | 0.070 | 37.4 | 21500 |
| 288.80 | 290.30 | 1.50 | 0.049 | 27.1 | 34200 |
| 290.30 | 291.80 | 1.50 | 0.065 | 51.3 | 72600 |
| 291.80 | 293.30 | 1.50 | 0.020 | 14.8 | 33300 |
| 293.30 | 294.80 | 1.50 | 0.335 | 28.8 | 15000 |
| 294.80 | 295.80 | 1.00 | 0.035 | 23.2 | 17200 |
| 295.80 | 297.30 | 1.50 | 1.310 | 37.9 | 16100 |
| 297.30 | 299.10 | 1.80 | 0.510 | 51.5 | 7570 |
A further eight holes ET-08-01 through ET-08-08 on the ET zone were released in November 2008.
ET-08-01
Drilled on the eastern side of the ET shoot below level 9. The hole intersected the Avino vein but gold and silver values are low.
Avino vein 196.90 – 213.40m (16.5m).
Detailed intersections
From (m) | To (m) | Length (m) | Description | g/t | Ppm |
| Au | Ag | Cu | Pb | Zn |
| 196.90 | 198.40 | 1.50 | Avino Vein | 0.322 | 3.6 | 259 | 149 | 719 |
| 198.40 | 199.90 | 1.50 | 0.020 | 7.8 | 97 | 68 | 554 |
| 199.90 | 201.40 | 1.50 | 0.054 | 5.2 | 331 | 180 | 665 |
| 201.40 | 202.90 | 1.50 | <0.005 | 2.4 | 306 | 45 | 2079 |
| 202.90 | 204.40 | 1.50 | 0.090 | 1.6 | 271 | 54 | 5950 |
| 204.40 | 205.90 | 1.50 | 0.005 | 0.6 | 456 | 25 | 2784 |
| 205.90 | 207.40 | 1.50 | <0.005 | 0.8 | 168 | 16 | 4381 |
| 207.40 | 208.90 | 1.50 | <0.005 | 0.8 | 229 | 18 | 2361 |
| 208.90 | 210.40 | 1.50 | 0.040 | 1.3 | 178 | 34 | 3494 |
| 210.40 | 211.90 | 1.50 | 0.015 | 0.3 | 320 | 23 | 2502 |
| 211.90 | 213.40 | 1.50 | 0.005 | 3.0 | 621 | 29 | 3957 |
ET-08-02
Drilled on west side of ET shoot 50 m west of workings on level 10.
The hole intersected gold values in the hanging wall of the main Avino vein, 189.75 – 194.25m (4.50m) 2.66 g/t gold 19.7 g/t silver. The overall vein was intersected 189.75 – 213.50m (23.75m).
Detailed intersections
From (m) | To (m) | Length (m) | Description | g/t | Ppm |
| Au | Ag | Cu | Pb | Zn |
| 189.75 | 191.25 | 1.50 | Avino Vein | 2.635 | 19.4 | 692 | 724 | 817 |
| 191.25 | 192.75 | 1.50 | 3.225 | 12.0 | 113 | 95 | 612 |
| 192.75 | 194.25 | 1.50 | 2.080 | 27.7 | 224 | 125 | 595 |
| 194.25 | 195.75 | 1.50 | <0.005 | 40.5 | 1734 | 454 | 847 |
| 195.75 | 197.25 | 1.50 | <0.005 | 3.4 | 28 | 184 | 1074 |
| 197.25 | 198.75 | 1.50 | <0.005 | 4.0 | 42 | 168 | 690 |
| 198.75 | 200.25 | 1.50 | <0.005 | 4.9 | 201 | 352 | 1042 |
| 200.25 | 201.75 | 1.50 | <0.005 | 10.6 | 276 | 162 | 670 |
| 201.75 | 203.25 | 1.50 | 0.035 | 20.3 | 68 | 320 | 1091 |
| 203.25 | 204.75 | 1.50 | <0.005 | 12.7 | 228 | 413 | 871 |
| 204.75 | 206.25 | 1.50 | <0.005 | 32.2 | 751 | 317 | 530 |
| 206.25 | 207.75 | 1.50 | <0.005 | 8.5 | 1200 | 83 | 410 |
| 207.75 | 209.25 | 1.50 | <0.005 | 10.3 | 957 | 134 | 660 |
| 209.25 | 210.75 | 1.50 | <0.005 | 25.5 | 1180 | 185 | 522 |
| 210.75 | 212.25 | 1.50 | <0.005 | 22.9 | 2220 | 423 | 3806 |
| 212.25 | 213.50 | 1.25 | <0.005 | 36.9 | 400 | 473 | 2021 |
ET-08-03
Also drilled on the west side of ET workings approximately 50m beyond end of level 11 ½. Intersected a mineralized breccia in the hanging wall rock 80.40 – 84.50m (4.1m) 3.82 g/t gold, 103 g/t silver. The main vein was intersected 214.55 – 257.85m (43.3m) 0.52 g/t gold, 43 g/t silver.
Detailed intersections
From (m) | To (m) | Length (m) | Description | g/t | Ppm | To (m) | Length (m) | Description | g/t | Ppm |
| Au | Ag | Cu | Pb | Zn | Au | Ag | Cu | Pb | Zn |
| 79.75 | 80.40 | 0.65 | Breccia Zone | 0.020 | 14.7 | 409 | 40 | 2080 | 80.40 | 0.65 | Breccia Zone | 0.020 | 14.7 | 409 | 40 | 2080 |
| 80.40 | 81.90 | 1.50 | 1.396 | 48.0 | 2641 | 148 | 435 | 81.90 | 1.50 | 1.396 | 48.0 | 2641 | 148 | 435 |
| 81.90 | 83.20 | 1.30 | 6.720 | 174.4 | 2456 | 327 | 21 | 83.20 | 1.30 | 6.720 | 174.4 | 2456 | 327 | 21 |
| 83.20 | 84.50 | 1.30 | 3.703 | 96.4 | 1815 | 818 | 94 | 84.50 | 1.30 | 3.703 | 96.4 | 1815 | 818 | 94 |
| 214.55 | 216.05 | 1.50 | Main Avino Vein | 0.135 | 21.2 | 315 | 241 | 217 | 216.05 | 1.50 | Main Avino Vein | 0.135 | 21.2 | 315 | 241 | 217 |
| 216.05 | 217.55 | 1.50 | 0.109 | 40.6 | 257 | 618 | 318 | 217.55 | 1.50 | 0.109 | 40.6 | 257 | 618 | 318 |
| 217.55 | 219.05 | 1.50 | 3.017 | 113.2 | 5264 | 177 | 123 | 219.05 | 1.50 | 3.017 | 113.2 | 5264 | 177 | 123 |
| 219.05 | 220.55 | 1.50 | 0.096 | 7.9 | 1528 | 298 | 330 | 220.55 | 1.50 | 0.096 | 7.9 | 1528 | 298 | 330 |
| 220.55 | 222.05 | 1.50 | 0.025 | 8.8 | 405 | 253 | 275 | 222.05 | 1.50 | 0.025 | 8.8 | 405 | 253 | 275 |
| 222.05 | 223.66 | 1.50 | 0.128 | 11.9 | 520 | 687 | 391 | 223.66 | 1.50 | 0.128 | 11.9 | 520 | 687 | 391 |
| 223.56 | 225.05 | 1.50 | 0.049 | 9.6 | 1592 | 5318 | 570 | 225.05 | 1.50 | 0.049 | 9.6 | 1592 | 5318 | 570 |
| 225.05 | 226.55 | 1.50 | 0.105 | 8.4 | 631 | 331 | 750 | 226.55 | 1.50 | 0.105 | 8.4 | 631 | 331 | 750 |
| 226.55 | 228.05 | 1.50 | 0.084 | 21.1 | 432 | 167 | 487 | 228.05 | 1.50 | 0.084 | 21.1 | 432 | 167 | 487 |
| 226.05 | 229.55 | 1.50 | 0.100 | 21.7 | 517 | 1910 | 584 | 229.55 | 1.50 | 0.100 | 21.7 | 517 | 1910 | 584 |
| 229.55 | 231.05 | 1.50 | 0.723 | 82.3 | 484 | 4282 | 3006 | 231.05 | 1.50 | 0.723 | 82.3 | 484 | 4282 | 3006 |
| 231.05 | 232.55 | 1.50 | 1.310 | 94.9 | 3753 | 565 | 674 | 232.55 | 1.50 | 1.310 | 94.9 | 3753 | 565 | 674 |
From (m) | | To (m) | Length (m) | Description | g/t | Ppm |
| Au | Ag | Cu | Pb | Zn |
| 232.55 | | 234.05 | 1.50 | Main Avino Vein | 1.890 | 58.4 | 574 | 474 | 619 |
| 234.05 | | 235.55 | 1.50 | 1.658 | 69.1 | 1117 | 412 | 687 |
| 235.55 | | 237.05 | 1.50 | 2.756 | 53.0 | 2590 | 396 | 711 |
| 237.05 | | 238.55 | 1.50 | 1.065 | 28.7 | 1816 | 280 | 410 |
| 238.55 | | 240.05 | 1.50 | 0.219 | 66.5 | 1263 | 916 | 416 |
| 240.05 | | 241.55 | 1.50 | 0.185 | 45.3 | 369 | 191 | 424 |
| 241.55 | | 243.05 | 1.50 | 0.167 | 42.0 | 1220 | 482 | 438 |
| 243.05 | | 244.55 | 1.50 | 0.382 | 48.1 | 8097 | 525 | 2111 |
| 244.55 | | 246.05 | 1.50 | 0.648 | 60.7 | 1638 | 766 | 716 |
| 246.05 | | 247.55 | 1.50 | 0.506 | 49.7 | 1311 | 549 | 415 |
| 247.55 | | 249.05 | 1.50 | 0.125 | 39.7 | 1343 | 911 | 475 |
| 249.05 | | 250.55 | 1.50 | 0.160 | 78.1 | 3430 | 790 | 737 |
| 250.55 | | 252.05 | 1.50 | 0.135 | 92.9 | 3617 | 551 | 506 |
| 252.05 | | 253.55 | 1.50 | 0.130 | 44.4 | 5739 | 351 | 603 |
| 253.55 | | 255.05 | 1.50 | 0.070 | 42.6 | 3395 | 796 | 357 |
| 255.05 | | 256.55 | 1.50 | 0.045 | 30.0 | 2971 | 365 | 374 |
| 256.55 | | 257.85 | 1.30 | 0.025 | 31.4 | 5772 | 1510 | 686 |
From (m) | To (m) | Length (m) | Description | g/t | Ppm |
| Au | Ag | Cu | Pb | Zn |
| 232.55 | 234.05 | 1.50 | Main Avino Vein | 1.890 | 58.4 | 574 | 474 | 619 |
| 234.05 | 235.55 | 1.50 | 1.658 | 69.1 | 1117 | 412 | 687 |
| 235.55 | 237.05 | 1.50 | 2.756 | 53.0 | 2590 | 396 | 711 |
| 237.05 | 238.55 | 1.50 | 1.065 | 28.7 | 1816 | 280 | 410 |
| 238.55 | 240.05 | 1.50 | 0.219 | 66.5 | 1263 | 916 | 416 |
| 240.05 | 241.55 | 1.50 | 0.185 | 45.3 | 369 | 191 | 424 |
| 241.55 | 243.05 | 1.50 | 0.167 | 42.0 | 1220 | 482 | 438 |
| 243.05 | 244.55 | 1.50 | 0.382 | 48.1 | 8097 | 525 | 2111 |
| 244.55 | 246.05 | 1.50 | 0.648 | 60.7 | 1638 | 766 | 716 |
| 246.05 | 247.55 | 1.50 | 0.506 | 49.7 | 1311 | 549 | 415 |
| 247.55 | 249.05 | 1.50 | 0.125 | 39.7 | 1343 | 911 | 475 |
| 249.05 | 250.55 | 1.50 | 0.160 | 78.1 | 3430 | 790 | 737 |
| 250.55 | 252.05 | 1.50 | 0.135 | 92.9 | 3617 | 551 | 506 |
| 252.05 | 253.55 | 1.50 | 0.130 | 44.4 | 5739 | 351 | 603 |
| 253.55 | 255.05 | 1.50 | 0.070 | 42.6 | 3395 | 796 | 357 |
| 255.05 | 256.55 | 1.50 | 0.045 | 30.0 | 2971 | 365 | 374 |
| 256.55 | 257.85 | 1.30 | 0.025 | 31.4 | 5772 | 1510 | 686 |
ET-08-04
Hit the Avino vein 75m below the lowest working level 12 of the mine, it intersected the Avino vein from 321.00 - 341.10m (20.1m) which includes 327.00 – 330.00m 3m 1.17 g/t gold, 133 g/t silver.
337.50 – 341.10m (3.6m) 0.04 g/t gold, 128 g/t silver and 327.00 – 341.10m (14.1m) 81 g/t silver, 0.726 copper.
Detailed intersections
From (m) | To (m) | Length (m) | Description | g/t | Ppm |
| Au | Ag | Cu | Pb | Zn |
| 321.00 | 322.50 | 1.50 | Main Avino Vein | 0.501 | 34.2 | 2378 | 264 | 426 |
| 322.50 | 324.00 | 1.50 | 1.146 | 71.0 | 3147 | 421 | 496 |
| 324.00 | 325.50 | 1.50 | 0.904 | 55.2 | 4652 | 230 | 288 |
| 325.50 | 327.00 | 1.50 | 0.262 | 54.9 | 1395 | 230 | 236 |
| 327.00 | 328.50 | 1.50 | 2.174 | 165.0 | 8408 | 509 | 286 |
| 328.50 | 330.00 | 1.50 | 0.173 | 101.9 | 7194 | 8582 | 3727 |
| 330.00 | 331.50 | 1.50 | 0.053 | 56.0 | 4926 | 5923 | 18300 |
| 331.50 | 333.00 | 1.50 | 0.095 | 54.9 | 4081 | 2559 | 561 |
| 333.00 | 334.50 | 1.50 | 0.080 | 23.1 | 1089 | 1199 | 301 |
| 334.50 | 336.00 | 1.50 | 0.052 | 56.6 | 11000 | 536 | 597 |
| 336.00 | 337.50 | 1.50 | 0.030 | 49.7 | 10900 | 170 | 618 |
| 337.50 | 339.00 | 1.50 | 0.032 | 156.6 | 14700 | 395 | 853 |
| 339.00 | 340.00 | 1.00 | 0.025 | 48.4 | 6149 | 174 | 595 |
| 340.00 | 341.10 | 1.10 | 0.064 | 161.8 | 8252 | 2170 | 1765 |
ET-08-05
Drilled approximately 80m east of hole ET-08-04 intersected the Avino vein 293.35 – 302.70 (9.35m). It is well off the ET shoot and did not intersect significant gold or silver values but copper values are of interest:
Detailed intersections
From (m) | To (m) | Length (m) | Description | g/t | Ppm |
| Au | Ag | Cu | Pb | Zn |
| 290.95 | 292.30 | 1.35 | Main Avino Vein | 0.172 | 16.7 | 533 | 3964 | 643 |
| 292.30 | 293.35 | 1.05 | 0.096 | 0.5 | 581 | 5078 | 2842 |
| 293.35 | 294.85 | 1.50 | 0.379 | 30.8 | 2116 | 8000 | 559 |
| 294.85 | 296.35 | 1.50 | 0.050 | 12.3 | 2654 | 7063 | 582 |
| 296.35 | 297.60 | 1.25 | 0.568 | 67.3 | 3564 | 3688 | 164 |
| 297.60 | 299.10 | 1.50 | 0.062 | 42.4 | 5360 | 1771 | 688 |
| 299.10 | 300.60 | 1.50 | 0.020 | 31.8 | 14900 | 896 | 3473 |
| 300.60 | 301.70 | 1.10 | 0.060 | 34.4 | 11300 | 282 | 1743 |
| 301.70 | 302.70 | 1.00 | 0.130 | 44.2 | 10000 | 469 | 1265 |
ET-08-06
Intersects the Avino vein 60m east of final working face on level 11 ½. The Avino vein is wide: 237.60 – 288.70m (51.10m) but gold and silver values are low although some high copper grades were intersected on the foot wall side of the vein:
Detailed intersections
From (m) | To (m) | Length (m) | Description | g/t | Ppm |
| Au | Ag | Cu | Pb | Zn |
| 237.60 | 238.25 | 0.65 | Main Avino Vein | 0.140 | 74.2 | 3526 | 7260 | 909 |
| 238.25 | 239.75 | 1.50 | 0.065 | 22.4 | 2260 | 344 | 383 |
| 239.75 | 241.25 | 1.50 | 0.020 | 8.7 | 883 | 43 | 528 |
| 241.25 | 242.75 | 1.50 | 0.115 | 10.1 | 2249 | 374 | 1981 |
| 242.75 | 244.25 | 1.50 | 0.045 | 8.7 | 2641 | 40 | 631 |
| 244.25 | 245.75 | 1.50 | 0.105 | 14.4 | 3472 | 87 | 651 |
| 245.75 | 247.25 | 1.50 | 0.072 | 17.1 | 4780 | 41 | 876 |
| 247.25 | 248.75 | 1.50 | 0.053 | 20.5 | 6107 | 100 | 950 |
| 248.75 | 250.25 | 1.50 | 0.100 | 11.0 | 4619 | 191 | 1044 |
| 250.25 | 251.75 | 1.50 | 0.120 | 10.4 | 4869 | 282 | 784 |
| 251.75 | 253.25 | 1.50 | 0.035 | 4.0 | 1261 | 45 | 662 |
| 253.25 | 254.75 | 1.50 | 0.163 | 14.9 | 2553 | 78 | 835 |
| 254.75 | 256.25 | 1.50 | 0.045 | 25.4 | 6483 | 95 | 734 |
| 256.25 | 257.75 | 1.50 | 0.015 | 12.0 | 5544 | 40 | 871 |
| 257.75 | 259.25 | 1.50 | 0.025 | 39.8 | 5758 | 217 | 521 |
| 259.25 | 260.75 | 1.50 | 0.025 | 20.6 | 6136 | 89 | 465 |
| 260.75 | 262.25 | 1.50 | 0.015 | 10.5 | 3202 | 74 | 327 |
| 262.25 | 263.75 | 1.50 | 0.059 | 24.0 | 3670 | 105 | 533 |
| 263.75 | 265.25 | 1.50 | 0.049 | 28.7 | 3252 | 183 | 718 |
| 265.25 | 266.75 | 1.50 | 0.053 | 14.2 | 6129 | 112 | 584 |
| 266.75 | 268.25 | 1.50 | 0.156 | 47.3 | 7192 | 217 | 399 |
| 268.25 | 269.75 | 1.50 | 0.102 | 19.8 | 3342 | 125 | 326 |
| 269.75 | 271.25 | 1.50 | 0.030 | 9.1 | 4101 | 38 | 414 |
| 271.25 | 272.75 | 1.50 | 0.010 | 9.3 | 2611 | 94 | 455 |
| 272.75 | 274.25 | 1.50 | 0.020 | 7.9 | 3355 | 41 | 391 |
| 274.25 | 275.75 | 1.50 | 0.020 | 16.5 | 4405 | 58 | 496 |
| 275.75 | 277.25 | 1.50 | 0.076 | 82.7 | 4570 | 422 | 979 |
| 277.25 | 278.75 | 1.50 | 0.084 | 58.4 | 5545 | 956 | 593 |
| 278.75 | 280.25 | 1.50 | 0.010 | 16.6 | 5749 | 74 | 659 |
| 280.25 | 281.75 | 1.50 | 0.020 | 18.7 | 4592 | 68 | 575 |
| 281.75 | 283.25 | 1.50 | 0.015 | 16.1 | 4219 | 74 | 651 |
| 283.25 | 284.75 | 1.50 | 0.038 | 23.6 | 3526 | 7260 | 909 |
| 284.75 | 286.25 | 1.50 | Main Avino Vein | <0.005 | 6.7 | 2841 | 22 | 1225 |
| 286.25 | 287.75 | 1.50 | 0.092 | 49.4 | 25700 | 44 | 2712 |
| 287.75 | 288.70 | 0.95 | 0.105 | 62.5 | 27200 | 57 | 2669 |
ET-08-08
Drilled approximately 100m east of the ET-08-01 it intersected the main Avino vein 192.95 – 203.25m (10.3m)
Detailed intersections
From (m) | To (m) | Length (m) | Description | g/t | Ppm |
| Au | Ag | Cu | Pb | Zn |
| 192.95 | 194.45 | 1.50 | Main Avino Vein | 1.456 | 4.6 | 318 | 57 | 508 |
| 194.45 | 195.95 | 1.50 | 0.431 | 4.4 | 329 | 256 | 502 |
| 195.95 | 197.10 | 1.15 | 0.325 | 13.5 | 1523 | 2446 | 3813 |
| 197.10 | 198.60 | 1.50 | 0.100 | 2.5 | 133 | 355 | 1688 |
| 198.60 | 199.70 | 1.10 | 0.048 | 4.4 | 101 | 36 | 1206 |
| 199.70 | 200.80 | 1.10 | 0.046 | 5.7 | 69 | 72 | 896 |
| 200.80 | 201.75 | 0.95 | 0.203 | 27.2 | 120 | 301 | 627 |
| 201.75 | 203.25 | 1.50 | 0.030 | 6.5 | 431 | 43 | 1048 |
Guadalupe
In March 2011, as part of a regional exploration program, Avino drilled an initial 5 holes on the Guadalupe vein (for locations please see website). These holes explored higher grade areas along the Guadalupe structure which had been identified by previous surface sampling programs and a coincident IP chargeability anomaly. Results from the first five holes were as follows:
| Hole# | Bearing | Dip | From (m) | To (m) | Down Hole Intersection (m) | Gold (g/t) | Silver (g/t) | Copper (ppm) | Lead (ppm) | Zinc (ppm) |
| GPE-11-01 | 205 | 45 | 54.80 | 55.40 | 1.10 | 0.167 | 44.25 | 13700 | | |
| GPE 11-02 | 207 | 43 | 52.40 | 56.00 | 3.10 | 0.80 | 47.70 | 2372 | 2959 | 1435 |
Following up on these promising results, Avino drilled a further 21 holes (GPE 11-03 through GPE-11-23) at Guadalupe
Assay results as follows:
Hole# | Bearing | Dip | From (m) | To (m) | Down Hole Intersection (m) | Gold (g/t) | Silver (g/t) | Copper (ppm) | Lead (ppm) | Zinc (ppm) |
| GPE-11-03 | 207 | 42 | 47.2 | 50.68 | 3.45 | 0.2 | 156.3 | N/A | N/A | N/A |
| GPE-11-05 | 359 | 44 | 20.75 | 22.55 | 1.8 | 2.88 | 163 | N/A | N/A | N/A |
| GPE-11-06 | 211 | 48 | 62.4 | 67.65 | 5.25 | 1.53 | 36 | 3844 | 3145 | 846 |
| GPE-11-07 | 210 | 58 | 72.1 | 74.25 | 2.15 | 1.695 | 52.5 | 2284 | 2125 | 1216 |
| GPE-11-09 | 219 | 49 | 66.15 | 67.15 | 1 | 0.1 | 248 | N/A | N/A | N/A |
| GPE-11-10 | 5 | 41 | 109.1 | 109.7 | 0.6 | 1.37 | 240 | 13100 | 1680 | 4065 |
| GPE-11-12 | 4 | 61 | 15.2 | 15.4 | 0.2 | 0.18 | 223 | 6583 | 908 | 1186 |
| GPE-11-13 | 333 | 54 | 76.95 | 77.2 | 0.25 | 0.007 | 216 | N/A | 96800 | 167000 |
| includes: | | 80.1 | 80.6 | 0.5 | 0.42 | 102 | N/A | 1140 | 8431 |
| GPE-11-14 | 334 | 76 | 119.85 | 122.15 | 2.3 | 0.24 | 199 | N/A | N/A | N/A |
| includes: | | | 121.2 | 122.15 | 0.95 | 0.31 | 363 | N/A | 81530 | 106363 |
| GPE-11-15 | 19 | 60 | 98.75 | 100.1 | 1.35 | 0.12 | 451 | N/A | 64244 | 115433 |
| GPE-11-16 | 25 | 70 | 100.6 | 102 | 1.4 | 0.84 | 3 | N/A | 26 | 158 |
| GPE-11-17 | 18 | 40 | 70.65 | 71.95 | 1.3 | 1.34 | 79 | N/A | 3555 | 1410 |
| GPE-11-19 | 350 | 69 | 104.75 | 106.4 | 1.65 | 0.1 | 21 | N/A | 2427 | 9148 |
| GPE-11-23 | 321 | 62 | 170.55 | 171.75 | 1.2 | 0.24 | 296 | N/A | 17800 | 24300 |
San Gonzalo Deposit
During 2006 and 2007, Avino drilled 82 holes totaling approximately 18,000 m to explore targets across the Avino property. The Company decided to focus on the San Gonzalo vein system. The San Gonzalo structure strikes NW/SE and dips very steeply (85-90°) to SW. During 2007, Avino drilled 40 holes totaling 9,204 meters to explore San Gonzalo. Results of these holes were released as assays became available (See Avino’s website for news releases). The 2007 drill results were compiled into the “Resource Estimate on the San Gonzalo vein” by David Gunning P.Eng, of Orequest Consultants, August 31, 2009.
NI 43-101 Resource Calculation
An NI 43-101 resource calculation for San Gonzalo, completed by Orequest Consultants, estimates that the zone contains 4.75 million ounces of silver and 37,300 ounces of gold, calculated as follows:
Tonnes Ag g/t Au g/t Zinc % Lead %444,250 332 2.61 1.5 1.0| Tonnes | Ag g/t | Au g/t | Zinc % | Lead % |
| 444,250 | 332 | 2.61 | 5 | 1.0 |
These figures were compiled from 2007 surface drilling at San Gonzalo (January to December 2007, 40 holes, 9,204 metres), which produced some significant silver intersections.
In 2008, Avino drilled a further 8 holes at San Gonzalo as follows:
Hole SG-08-01 on the San Gonzalo vein intersected a 2.75-metre zone 1.13 g/t gold and 155 g/t silver of gold and silver mineralization with the following values:
SG-08-01
Detailed intersections
From (m) | To (m) | Length (m) | Au (g/t) | Ag (g/t) | Cu (ppm) | Pb (ppm) | Zn (ppm) |
| 143.05 | 144.40 | 1.35 | 1.330 | 168.6 | 309 | 530 | 3598 |
| 144.40 | 145.80 | 1.40 | 0.930 | 142.1 | 131 | 560 | 1540 |
Hole SG-08-02 intersected two zones of mineralization. The first zone, located above the San Gonzalo vein in the hanging wall, measured 1.60 metres grading 1.72 g/t gold and 704 g/t silver. The second zone, located within the vein, measured 3.0 metres grading 10.28 g/t gold and 545 g/t silver. Intersection and grade details were as follows:
SG-08-02
Detailed intersections
From (m) | To (m) | Length (m) | Au (g/t) | Ag (g/t) | Cu (ppm) | Pb (ppm) | Zn (ppm) |
| 257.50 | 258.05 | .55 | .420 | 150.2 | 318 | 2832 | 5393 |
| 258.05 | 258.70 | .65 | 3.840 | 1564.4 | 264 | 13100 | 13900 |
| 258.70 | 259.10 | .40 | 0.075 | 68.1 | 79 | 266 | 502 |
| | | | | | | | |
| 263.05 | 263.75 | .70 | 10.765 | 1275.6 | 7394 | 106000 | 146000 |
| 263.75 | 263.95 | .20 | 0.115 | 62.3 | 364 | 4916 | 31000 |
| 263.95 | 264.70 | .75 | 2.606 | 587.4 | 4327 | 76200 | 200000 |
| 264.70 | 265.30 | .60 | 7.337 | 224.1 | 2363 | 146000 | 355000 |
| 264.30 | 266.05 | .75 | 22.560 | 204.2 | 917 | 80000 | 126000 |
SG-08-02 was drilled to explore a gap between previous holes SG-07-14 (5.40 m @ 1.52 g/t gold and 774 g/t silver) and hole SG-07-22 (2.26 m. @ 1.497 g/t gold 152g/t silver).
Aguila Mexicana: Seven holes – AM-08-01 thru 07
SG-08-03
Intersected San Gonzalo vein 322.20-325.7m (3.7m) 0.41 g/t gold 119 g/t silver which includes 322.00-323.70 m (1.7m) 0.2 g/t gold 74.7 g/t silver and 323.70 – 325.7m (2.0m) 0.58 g/t gold 156 g/t silver.
Detailed intersections
Detailed intersections
From (m) | To (m) | Length (m) | Description | g/t | ppm |
| Au | Ag | Cu | Pb | Zn |
| 321.40 | 322.00 | 0.60 | Andesite volcanic with quartz veins | 0.016 | 1.6 | 33 | 126 | 423 |
| 322.00 | 322.85 | 0.65 | 0.215 | 74.1 | 409 | 11500 | 2725 |
| 322.85 | 323.70 | 0.85 | 0.195 | 75.2 | 389 | 2665 | 3405 |
| 323.70 | 324.10 | 0.40 | 0.109 | 221.0 | 3668 | 65000 | 3569 |
| 324.10 | 324.90 | 0.80 | San Gonzalo vein with quartz breccia | 0.925 | 55.0 | 264 | 6449 | 3610 |
| 324.90 | 325.70 | 0.80 | 0.457 | 223.5 | 729 | 15500 | 4012 |
| 325.70 | 327.00 | 1.30 | 0.288 | 31.8 | 483 | 2241 | 2408 |
SG-08-04
Intersected San Gonzalo vein 261.25-264.6m (3.35m) 0.5 g/t gold 59 g/t silver.
Detailed intersections
From (m) | To (m) | Length (m) | Description | g/t | ppm |
| Au | Ag | Cu | Pb | Zn |
| 261.25 | 261.75 | 0.50 | San Gonzalo Vein | 0.802 | 81.0 | 145 | 754 | 1251 |
| 261.75 | 262.75 | 1.00 | 0.331 | 61.4 | 234 | 1014 | 2002 |
| 262.75 | 263.15 | 0.40 | 0.040 | 11.2 | 39 | 109 | 353 |
| 263.15 | 263.70 | 0.55 | 0.990 | 85.0 | 119 | 396 | 794 |
| 263.70 | 264.60 | 0.90 | 0.424 | 49.7 | 208 | 440 | 702 |
SG-08-05
Did not intersect the San Gonzalo vein but hit a breccia zone which may be part of the vein system. Values were low:
Detailed intersections
From (m) | To (m) | Length (m) | Description | g/t | ppm |
| Au | Ag | Cu | Pb | Zn |
| 437.75 | 438.50 | 0.75 | Breccia Zone | 0.030 | 0.1 | 5 | 33 | 32 |
| 438.50 | 438.90 | 0.40 | <0.005 | <0.1 | 6 | 22 | 76 |
| 438.90 | 439.55 | 0.65 | 0.015 | <0.1 | 7 | 18 | 65 |
| 439.55 | 440.35 | 0.80 | 0.010 | <0.1 | 8 | 14 | 30 |
SG-08-06
Intersected San Gonzalo 214.05 – 219.70m (5.65m) 0.88 g/t gold, 235 g/t silver.
Detailed intersections
From (m) | To (m) | Length (m) | Description | g/t | ppm |
| Au | Ag | Cu | Pb | Zn |
| 214.05 | 214.85 | 0.80 | San Gonzalo vein with Sulphide Minerals | 0.729 | 204.0 | 2944 | 21400 | 17600 |
| 214.85 | 215.95 | 1.10 | 0.523 | 95.0 | 1189 | 5264 | 6417 |
| 215.95 | 216.80 | 0.65 | 0.335 | 47.5 | 398 | 1486 | 2918 |
| 216.80 | 218.00 | 1.20 | 0.360 | 87.3 | 1960 | 5342 | 7772 |
| 218.00 | 218.85 | 0.85 | 3.228 | 758.9 | 3731 | 18500 | 19000 |
| 218.85 | 219.70 | 0.85 | 0.402 | 316.1 | 7094 | 17500 | 14800 |
San Gonzalo Bulk Sample Program:
In 2011, Avino drilled a further 11 holes at San Gonzalo the 2011 program was designed to determine the feeder systems for the San Gonzalo deposit, select results are as follows:
San Gonzalo Bulk Sample Program
In 2009 and the early part of 2010, Avino’s main focus was to lay the ground work for a bulk sampling program to firm up the grade and the metallurgy of the San Gonzalo deposit. The sampling program was also to provide the needed concentrate material for further evaluation by various smelters and trading companies and for on-site processing if deemed feasible.
Applications for permits to the various regulatory agencies were submitted early in 2009 and the permits were granted within 8 to 12 weeks after the applications were filed.
A major portion of the work and investment over the last couple of years has centered on improving and upgrading the existing mill and equipment.
In December 2009, the Company announced that contract terms had been finalized with Desarrollo Minero Guadalupe S.A. de C.V. (“DMG”) for the mining of the 10,000 tonne bulk sample from the San Gonzalo deposit.
The mining contract included collaring of the portal, driving 1,000 meters of development consisting of a decline, crosscuts and raises and the extraction of 10,000 tonnes of mineralized vein material.
In January 2010, DMG began driving the first decline to the 2,260 m elevation for development work and extraction of the bulk sample. The San Gonzalo vein was intersected in May 2010 and a smaller splay vein was intersected two months later. A second decline was driven to the 2,306m level.
By July 2010 both levels had intersected the San Gonzalo vein. The Upper Level 1 has been driven northwest along the San Gonzalo Vein and broke in to the old San Gonzalo workings. The exploration drift on the Lower Level 2 (2260 m) along the San Gonzalo vein was also advanced to the northwest towards the old San Gonzalo workings.
On October 6, 2010, the two levels were connected with the completion of the first raise allowing the start of stoping (cut and fill) for the bulk sample. Within four days an initial 731 tonnes had been produced from the block of ground which was estimated to contain approximately 11,000 tonnes. The rock was stockpiled for approximately 6 to 8 weeks while the mill completed its program of flotation concentration of the stockpiled ore from the ET zone of the main Avino vein. By mid-November, approximately 2,000 tonnes of mineralized vein rock had been broken from the first stope and assays confirmed a calculated average grade of 1.9g/t gold and 340 g/t silver.
Samples from channels cut across the San Gonzalo vein were as follows: (from west to east)
| Length along vein (metres) | Width (metres) | Gold (g/t) | Silver (g/t) | Lead (ppm) | Zinc (ppm) | Copper (ppm) |
| 21.04 | 2.83 | 1.146 | 394 | 3580 | 3112 | 502 |
| 27.24 | 2.41 | 1.231 | 342 | 4999 | 2202 | 442 |
| 11.37 | 1.61 | 1.752 | 532 | 9651 | 11438 | 1605 |
In November, 2010, assays from initial sampling in the eastern raise were received. Samples are as follows:
| Line | Width (m) | Gold g/t | Silver g/t | Lead g/t | Zinc g/t | Copper g/t |
| 1 | 0.75 | 1.112 | 227 | 4012 | 1772 | 930 |
| 2 | 1.10 | 3.621 | 508 | 7007 | 4295 | 657 |
| 3 | 1.05 | 2.243 | 384 | 4817 | 718 | 1263 |
| 4 | 1.25 | 6.120 | 216 | 2563 | 1206 | 2398 |
| 5 | 1.15 | 2.221 | 380 | 5712 | 1330 | 1689 |
| 6 | 1.25 | 1.436 | 260 | 3921 | 1925 | 852 |
| 7 | 1.30 | 1.391 | 727 | 5667 | 1305 | 448 |
| 8 | 1.15 | 0.670 | 313 | 1656 | 1339 | 667 |
| 9 | 1.10 | 1.413 | 344 | 4322 | 904 | 1394 |
| 10 | 1.25 | 2.078 | 276 | 12255 | 1762 | 891 |
| 11 | 1.60 | 1.077 | 315 | 2339 | 482 | 815 |
| 12 | 1.30 | 3.642 | 514 | 5893 | 698 | 745 |
| 13 | 1.35 | 1.698 | 707 | 3323 | 610 | 372 |
| 14 | 1.65 | 1.493 | 422 | 4202 | 896 | 258 |
| 15 | 1.10 | 1.518 | 588 | 2304 | 610 | 173 |
| 16 | 1.60 | 1.122 | 366 | 3234 | 824 | 334 |
| 17 | 1.30 | 4.030 | 171 | 10609 | 633 | 509 |
| 18 | 1.25 | 1.769 | 224 | 12334 | 1161 | 1091 |
| Average: | 1.25 | 2.135 | 389 | 5313 | 1197 | 831 |
The samples were assayed by Inspectorate Labs. Samples were crushed and ground in Durango with pulps assayed in Richmond, British Columbia using fire assay and AA finish for gold, four acid digestions, AA for most silver with fire assay and gravimetric finish for silver, and Aqua Regia digestion and ICP for base metals.
Developmentsample.By January 2011, development for the extraction of the 10,000 tonne bulk sample was completed by the mining contractor DMG in early January 2011.DMG; processing of the bulk sample began shortly afterwards.
San Gonzalo Bulk Sample Results
In July, the results from the 10,000 tonne bulk sample program at San Gonzalo were announced. The processingbulk sample was intended to allow the Company to assess the economics of the zone by confirming mineral grades obtained through earlier diamond drilling. The results were released after a comprehensive review of the data and discussions with Wardrop, a Tetra Tech Company. The bulk sample program was completed during the first quarter of 2011 and the Company sold 188 tonnes of the San Gonzales bulk concentrate for net proceeds of US$1,831,477. In April 2012, the Company sold the balance of the San Gonzalo concentrate.
The results are based on the metallurgical balance provided below:
| | Weight | Assay (g/t) | Contents (kg) | Contents (oz’s) | Recovery (%) |
| | Tonnes | Au | Ag | AAu | Ag | Au | Ag | Au | AAg |
| Feed | 10,519* | 0.9 | 261 | 9.35 | 2,746.75 | 300.9 | 88,311.7 | 100 | 100 |
| Concentrate | 232 | 23.8* | 8,998* | 5.52 | 2,087.53 | 177.5 | 67,116.9 | 59 | 76 |
| Tail | 10,287 | 0.4 | 64 | 3.83 | 659.22 | 123.4 | 21,194.8 | 41 | 24 |
*These figures have been reconciled to the weighed feed tonnage and the final concentrate assays of the paid shipment. They also have been rounded for clarity.
The overall bulk sample beganfeed grade was 261g/t Ag and 0.9g/t Au. Silver and gold recoveries were 76% and 59% respectively and 232 dry tonnes of flotation concentrate were produced of which 188 tonnes were sold for net proceeds of US$1.83 million. If the entire production were sold under the same contract terms, the net proceeds would have been US$2.26 million.
Evaluation costs relating to mining, milling, and overhead for the bulk sample program US$567,045 or US$7.62 per ounce silver equivalent. Included in these amounts are costs for the raises and stopes. Cost per tonne produced were $53.91 and proceeds on January 18, 2011. Monthly totals to February 11, 2011 were 1,550 tonnes milled for production of 47188 tonnes of concentrate grading 8.4kg/sold of US $1.83 million. (The contract prices per ounce of silver and gold were US$36.75 and US$1,511.31 respectively)
The net proceeds of the bulk sample program yielded a positive result and demonstrate the viability of the San Gonzalo Project. On the basis of this result, we are proceeding with our mine plan to develop the 3rd, 4th and 5th levels and to provide mill feed at the rate of 250 tonne per day on a sustained basis. Once this throughput has been achieved and is on a sustainable basis, the Company will look at improving and optimizing the economics of the San Gonzalo deposit based on the Wardrop findings.
Tailings
In April 2006, Wardrop Engineering Inc. (“Wardrop Engineering”) completed a study on “Tailings Retreatment Process Options for the Avino Tailings Project in Durango, Mexico”. The report concluded the oxide tailing is amenable to cyanidation with agglomerated heap leach as the method of choice followed by Merril Crowe precipitation of the silver and gold. The sulphide tailing would require sampling and further metallurgical test work before a proper assessment can be made.
The preliminary evaluation of the oxide tailings suggested the capital cost for a 500,000 ton per year, 4 year operation of US$1.62 million and the cost to operate per ton of tailings is US$8.64. Capital costs for a plant twice the size and half the life was US$22.7 million. The internal rate of return and the net present value favoured the 4 year operation.
The disclosure of the implied values is preliminary in nature and includes inferred mineral resources that are considered to be too speculative geologically to have the economic considerations applied to them that would enable them to be categorized as mineral reserves, and there is no certainty that the preliminary assessment will be realized.
Mr. Rick Alexander P. Eng., an independent qualified person as defined by applicable Canadian rules prepared the capital cost estimate and co-coordinated Wardrop Engineering’s work on the Avino Tailings Project.
In 2011, Avino engaged Wardrop Engineering to update the 2006 Tailings Scoping Study where the cost estimates were based on a heap leach operation. The updated study will utilize the continuous vat leach technology (CVL) in the revised cost estimates for comparative purposes. Samples of oxide and sulphide tailings were collected to determine if the tailings characteristics would be amenable in a CVL system.
In March 2012, Avino announced the results from an updated Preliminary Economic Assessment (“PEA”) examining Tailings Retreatment Process Options for the Avino mine tailings. The PEA was completed by Tetra Tech Wardrop ("Tetra Tech"). The oxide tailings were the focus of the updated PEA.
A NI 43-101 resource estimate on the oxide tailings was completed by Bryan Slim, MBA, P.Eng, of MineStart Management Inc. in July, 2005. This estimate identified an indicated resource of 2 million tonnes of 95 g/t silver. Average monthsilver and 0.5 g/t gold for the oxide portion of the Avino mine tailings. The oxide tailings were produced between 1974 and 1993 from open pit mining of the main Avino vein. Cyanide heap leach tests during the PEA produced recoveries of: 68% for silver, 82% for gold and 78% for silver, 87% for gold after being re-ground in the mill.
In 1993, mining of the Avino vein shifted from open pit to date silver feed gradeunderground and operated in this fashion until 2001. In that span it is estimated that 3 million tonnes of ore was mined and processed creating the sulphide tailings resource. Since the sulphide tailings material was not a part of this technical study, no values have been assigned except in a section where a conceptual economic value was required for February was 329g/t at 77% recovery. The feed grade result was similar topurposes of demonstration. In the estimated resourcemodel, a head grade of 332g/37.78 g/t silver and 0.34 g/t gold was used. Further studies are required to determine if the metal contained in the NI 43-101 report by Orequest 2009.sulphide tailings is recoverable.
The 2012 PEA is focused on the oxide tailings only; further work is required to analyze the economics of the sulphide tailings resource.
Financial Results of the Tetra Tech Technical Report
Tetra Tech’s long-term consensus metal prices (as of January 27, 2012) used in the base case were as follows:
The pre-tax financial results were as follows:
| 60% internal rate of return (IRR) |
| US$38.2 million net present value (NPV) at 8% discount rate. |
Metal Production: The life-of-project average tonnages, grades and metal production are indicated in the following table.
Table 1 Metal Production from the Avino Mine Tailings
| Description | Value |
| Total Tonnes to Mill | 2,091,000 |
| Annual Tonnes to Mill | 523,000 |
| Mine Life (Years) | 4 |
| Average Grades |
| Gold (g/t) | 0.53 |
| Silver (g/t) | 95.5 |
| Total Production |
| Gold (oz) | 27,000 |
| Silver (oz) | 4,499,000 |
| Average Annual Production |
| Gold ( oz) | 6,750 |
| Silver ( oz) | 1,124,860 |
Operating Cost Summary
Silver recovery of 77% was an improvement over January results of 70% when 1793 tonnes were processedTable 2 gives the overall estimated cost summary for the productionprocessing facility and the G&A costs, and is based on 1,370 tons per day (“tpd”) with an availability of 72 tonnes92% and 365 operating days per year. The annual operating cost for the process facilities is estimated to be US$6.3 million or US$12.74/t of concentrate grading 5 Kg/tailings treated at the processing rate of 1,370 tpd. An incremental increase in G&A operating cost is estimated to be US$750,000, or US$1.5/t silver and 28.3 g/t gold. of tailings treated.
Table 2 Operating Cost Summary
| Description | Personnel | Annual Cost (US$) | Unit Cost (US$/t Treated) |
| Maintenance Labour | 7 | 175,104 | 0.35 |
| Operations Labour | 35 | 545,832 | 1.09 |
| Laboratory | 7 | 139,536 | 0.279 |
| Sub-total | 49 | 860,472 | 1.72 |
| Operating Supplies | - | 4,582,421 | 9.16 |
| Maintenance Supplies | - | 450,000 | 0.9 |
| Power Supply | - | 479,947 | 0.96 |
| Sub-total | - | 5,512,368 | 11.02 |
| Total Process Operating Costs | 49 | 6,372,840 | 12.74 |
| G&A Staff | 11 | 262,656 | 0.53 |
| G&A Expenses | - | 490,000 | 0.98 |
| Total G&A Costs | 11 | 752,656 | 1.51 |
Initial Capital Cost Estimate Summary
The mineralized zone wherecapital cost for the bulk sampleAvino Mines Tailings Retreatment-Heap Leach Project has been extracted is partially oxidized and near the surface. Effortsassessed at US$29.1 million. The capital costs are continuing to be made at the plant to improve the recovery. With the extraction of the bulk sample complete, Wardrop mining engineers visited San Gonzalo underground workingssummarized in late March. Wardrop Engineering has recommended development by a 12% ramp (decline) in the foot wall approximately 40m from and parallel with the San Gonzalo vein. The vein can then be drilled in detail by close spaced underground drilling from cross cuts off the ramp. This will permit stope design. Wardrop's engineers believe that the planned production of 250 tonnes per day is achievable and requires three active stopes at all times.Table 3.
The Company is mining a new stope and two sets of back (ie roof) sample results have been received from Inspectorate Labs. The values are as follows:Table 3 Capital Cost Estimate – Summary
| Assay Values (ppm) |
| | | Width | Gold | Silver | Lead | Zinc | Copper |
| Line 2 | | 1.15 | 0.977 | 423 | 1137 | 3928 | 509 |
| Line 3 | | 1.50 | 0.513 | 333 | 1471 | 4066 | 767 |
| Line 4 | | 1.40 | 0.828 | 402 | 1340 | 1931 | 522 |
| | Average | 1.35 | 0.754 | 383 | 1331 | 3289 | 609 |
| | | | | | | | |
| Line 5 | | 1.50 | 0.459 | 176 | 2612 | 2889 | 392 |
| Line 6 | | 1.00 | 0.219 | 91 | 3786 | 4630 | 513 |
| Line 7 | | 1.25 | 0.679 | 223 | 737 | 1341 | 131 |
| Line 8 | | 1.85 | 1.301 | 178 | 1188 | 1316 | 240 |
| Line 9 | | 1.80 | 0.904 | 274 | 2204 | 774 | 230 |
| Line 10 | | 2.35 | 1.551 | 392 | 2819 | 1238 | 397 |
| | Average | 1.63 | 0.968 | 244 | 2197 | 1782 | 313 |
| | | | | | | | |
| II Line 1 | | 2.60 | 0.778 | 165 | 1261 | 1483 | 135 |
| II Line 2 | | 2.00 | 0.518 | 238 | 1635 | 1830 | 222 |
| | | | | | | | |
| II Line 3 | | 2.10 | 1.692 | 536 | 2566 | 2875 | 276 |
| Includes Sample 158328 | 0.5 | 3.156 | 1151.6 | 3914 | 6096 | 540 |
| | | | | | | | |
| II Line 4 | | 1.80 | 1.841 | 397 | 1051 | 601 | 374 |
| Includes Sample 158332 | 0.6 | 3.384 | 761.2 | 2310 | 886 | 725 |
| | | | | | | | |
| II Line 5 | | 2.50 | 0.546 | 191 | 692 | 1981 | 356 |
| | Average | 2.20 | 1.026 | 293 | 1415 | 1780 | 267 |
| Item/Description | Total Cost (US$) |
| Mining, Agglomeration, and Pad Loading | 3,293,320 |
| Process Facilities | 3,905,528 |
| Reagents/Auxiliary Services | 501,750 |
| Buildings | 932,763 |
| Leach Pad and Infrastructure | 7,414,974 |
| Power Supply and Distribution | 1,457,296 |
| Total Direct Costs | 17,505,632 |
| EPCM, QA and Vendor Representatives | 2,658,728 |
| Freight and Construction Indirects | 3,146,235 |
| Contingency | 5,828,000 |
| Total Indirect Costs | 11,632,964 |
| Total Project Capital Cost Estimate | 29,138,596 |
Summary of Financial Results
Tetra Tech evaluated the base case using consensus gold and silver prices of US$1,271.00/oz and US$20.59/oz, respectively. The San Gonzalo veinpre-tax financial model was established on a 100% equity basis, excluding debt financing and loan interest charges. The financial results for the base case and for an alternative case based on spot metal prices as of February 23, 2012 are presented in the new stope 2-200 shows strong valuesTable 4.
Table 4 Summary of gold, silver, lead and zinc over mineable widths. These support the assays from the adjoining raise (L1 through L19) taken in meter intervals over a 19 meter length. The average width was 1.23m, 2.071 g/t gold, 381 g/t silver, 5349 ppm lead, 1182 ppm zinc.Pre-Tax Financial Results
2011 Drill Program.| Description | Base case | Spot prices case |
| Gold Price (US$/oz) | 1,271.00 | 1,770.00 |
| Silver Price (US$/oz) | 20.59 | 34.00 |
| Total Payable Metal Value (‘000 US$) | 121,971 | 192,624 |
| Refining (‘000 US$) | 4,488 | 4,488 |
| Total NIV (‘000 US$) | 117,483 | 188,136 |
| Transportation, Insurance (‘000 US$) | 176 | 282 |
| At-mine Revenue (‘000 US$) | 117,306 | 187,854 |
| Royalties (‘000 US$) | 0 | 0 |
| Operating Costs (‘000 US$) | 32,156 | 32,156 |
| Operating Cash Flow (‘000 US$) | 85,150 | 155,698 |
| Capital Expenditure, Including Reclamation and Salvage (‘000 US$) | 28,765 | 28,765 |
| Net Cash Flow (‘000 US$) | 56,386 | 126,933 |
| DCF NPV (‘000 US$) at: | | |
| 0.00% | 56,386 | 126,933 |
| 5.00% | 44,181 | 103,742 |
| 8.00% | 38,199 | 92,288 |
| 10.00% | 34,669 | 85,493 |
| Payback (years) | 1.5 | 0.8 |
| IRR | 60% | 125% |
Recommendations
It was recommended that the following tasks could be executed for making a production decision for the Avino Tailings Retreatment Project:
| · | Drill the tailings resource to increase confidence and move to reserve category. |
| · | Run assay and metallurgical test works to confirm the deposit and the recoveries for silver and gold. |
| · | Prepare an economic analysis for the treatment of both oxide and sulphide tailings material. |
Note on Mineral Resources
Mineral resources that are not mineral reserves do not have demonstrated economic viability. This assessment is preliminary in nature as it includes inferred mineral resources that are considered too speculative geologically to have the economic considerations applied to them that would enable to them to be categorized as mineral reserves. At this time there is no certainty that the preliminary assessment and economics will be realized. The Technical Report was prepared by Hassan Ghaffari, P.Eng, a qualified person (QP) under National Instrument 43-101.
Avino Vein (Elena Tolosa)
Avino produced from the Avino Vein from 1974 to 2001 producing approximately 5 million tons, containing 16 million ounces silver, 96,000 ounces gold and 24 million pounds of copper. The mine was closed in November 2001 due to low metal prices (Silver US$4.37/oz, Gold US$283/oz, Copper US$0.65/lb) and the closure of a key smelter.
Production from 1976 to 1992 was from the Tolosa open pit. Subsequent production was mostly from a 4x4 meter ramp access underground operation using sub-level stoping with a sub-vertical increment restricted from 11 to 15m to counter mine dilution arising from an occasional, semi-incompetent hanging-wall. From 1997 - 2001, the mine operated six days per week, three shifts per day, averaging 1000 tons per day and achieved up to 1300 tpd.
Mineral rights on the concessions, Unification La Platosa, totaling an area of 98.83 hectares which cover 1300 metres along the main Avino deposit were held under an option agreement with a private company (Minerales de Avino SA de SV "Minerales"). That agreement required Avino to pay a 3.5% royalty to Minerales, which expired on October 31, 2010. This new agreement replaces the original expired deal.
In February 2012, Avino, through it’s wholly owned Mexican subsidiary entered into a new agreement with Minerales whereby Minerales has indirectly granted to the Company the exclusive right to explore and mine the La Platosa property known as the "ET zone".
Terms of the New Agreement
Pursuant to the new agreement, the Company will have the exclusive right to explore and mine the property for an initial period of 15 years, with the option to extend the agreement for another 5 years. In consideration of the grant of these rights, the Company must pay to Minerales a deemed sum of US$250,000, by the issuance of 135,189 common shares of the Company. The Company startedwill have a period of 24 months (the "Development Period") for the development of mining facilities.
The Company has agreed to pay to Minerales a royalty equal to 3.5% of net smelter returns (the "NSR Royalty"), at the commencement of commercial production from the property. In addition, after the Development Period, if the minimum monthly processing rate of the mine facilities is less than 15,000 tonnes, then the Company must pay to Minerales in any event a minimum royalty equal to the applicable NSR Royalty based on processing at a minimum monthly rate of 15,000 tonnes.
Minerales has also granted to the Company the exclusive right to purchase a 100% interest in the property at any time during the term of the new regional exploration drill program on January 27, 2011 andagreement (or any renewal thereof), upon payment of US$8 million within 15 days of the first hole SG-11-01 was finished January 30, 2011.Company's notice of election to acquire the property. The program is expected to cover over seven thousand meters through 56 core holes. The program is designed to both increase resources at San Gonzalo and explore new targets on other areaspurchase would be completed under a separate purchase agreement for the legal transfer of the property. A commercial production decision will be made pending the outcome of this economic analysis. Mining and milling operations will continue during the economic analysis process.
The proposed in house mine plan options are currently undergoing review. The aim is to select the most cost effective plan to mine the entire San Gonzalo orebody and to provide a sustained mill production rate of 250 tonnes per day. A development schedule together with the selected mining method will be made once the review has been completed.
Eagle Property
Ownership. The wholly owned Eagle property was acquired in 2003 when Avino purchased a 100% interest in 14 quartz leases by issuing 200,000 common shares at a price of $0.50 per share for total consideration of $100,000. The property was written down to a nominal value of $1 in fiscal 2006 by a charge to operations of $103,242 and currently has a deferred value of $2,504.
Property Description and Location. The 516 ha property is located in the Yukon Territory approximately kilometers west of Keno City. It is currently in its Phase I stage of exploration. The property is accessed by a road. Whitehorse, the nearest major city, is approximately 380 kilometres to the south of the village of Mayo. The village of Mayo is 60 kilometers to the southeast of Keno City. The Eagle property lies on the south-east facing slope of Galena Hill where the elevations range from about 1350 to 1540 m. Permafrost, while thin to non-existent in places, is reported to be found under accumulations of surface rubble left from glaciation.
History. The Eagle property has produced positive assays for silver since exploration first occurred there in 1964. The initial drill program, consisting of 29 holes, encountered assays of 6,900 grams per tonne of silver over 1.2 metres in hole #23 and 1,708 grams per tonne of silver over 2.1 metres in hole JB1. Follow-up drilling in 1978 was designed to expand on the discoveries of hole #23. This discovery became known as the Eagle vein. The Eagle property is part of the historic Keno Hill mining camp.
The Eagle Property includes historic surface trenches that expose a section of the Eagle vein, a strong transverse vein-fault hosted in Keno Hill Quartzite. The Eagle vein varies from 0.6 to 4.9 metres wide with mineralized lenses of galena, tetrahedrite and sphalerite. A Yukon Government files report thatsurvey (Deklerk and Traynor, 2005) reports a total of 33 holes totalling 3,075.5 metres have been drilled along 300 metres of vein strike on the property in two programs (1964 and 1978/79). The best intercepts are reported in the following table.
EAGLE VEIN – HISTORIC REPORTED DRILLING (YTG MinFile 105M 021)
EAGLE VEIN – HISTORIC REPORTED DRILLING (YTG MinFile 105M 021) | |
| Year | Operator | Reported Structure | Reported Intercept (m) | Silver g/t | Lead % | Zinc % | Operator | Reported Structure | Reported Intercept (m) | Silver g/t | Lead % | Zinc % |
| 1964 | Jersey Yukon Mines Ltd. | Branch Vein | 2.1 | 1,885.7 | 12.8 | 4.2 | Jersey Yukon Mines Ltd. | Branch Vein | 2.1 | 1,885.7 | 12.8 | 4.2 |
| | | Main Vein (parallel intercepts) | 0.15 | 7,624.9 | 1.2 | | | Main Vein (parallel intercepts) | 0.15 | 7,624.9 | 1.2 | |
| | | | 0.4 | 682.3 | 11.6 | | | | 0.4 | 682.3 | 11.6 | |
| 1978/79 | Teck Corporation | Main Vein (DDH JB3) | 1.5 | 366.6 | 5.4 | 6.8 | Teck Corporation | Main Vein (DDH JB3) | 1.5 | 366.6 | 5.4 | 6.8 |
Soil sampling conducted in 1971 by United Keno Hill Mines Ltd. outlined a strong 300 metre long Pb-Ag anomaly across the southern boundary of Mega Silver Inc.’s (“Mega Silver”, now known as “Mega Precious Metals”) adjoining Manmain claim that apparently represents the untested northeast extension of the Eagle vein.
On November 12, 2008 and amended April 1, 2009, the Company entered into an option agreement (the “Option Agreement”) with Mega Silver, whereby Mega Silver can earn the exclusive right and option to acquire a 100% title and interest in the Eagle Property located in the Yukon Territory. In October 2009, Mega Silver returned the Eagle property to the Company due to a change in its corporate exploration objective.
During 2008, the Company received $25,000 upon execution of the Option Agreement which was recorded in income.
During 2009, Mega Silver completed six NTW diamond drill holes on the Eagle property totalling 1,897.1 metres. The work program was successful in indentifying strong silver-gold-indium enriched zinc and lead mineralization hosted in the Eagle vein fault, a known and proven host of significant intercepts of Pb-Zn-Ag mineralization, including a reported 7,624.9 g/t Ag, 1.2% Pb and 1.5% Zn over 0.15metres (hole E64-23). The work has also established that indium, used in plasma screens, is present in significant concentrations in the sphalerite enriched Eagle vein.
Hole D09EE-02 intersected three vein structures within a 23.7m wide zone assaying 47.1 g/t Ag, 0.38 % Pb, 3.85% Zn and 37.7 g/t In, and includes the upper vein which assayed 0.3g/t Au, 284.3 g/t Ag, 3.16% Pb, 7.11% Zn and 57.9 g/t In. In addition, hole D09EE-01 intercepted possible replacement-style disseminated arsenopyrite and pyrite mineralization that assayed 1.26 g/t Au over 1.5m (351.0-352.5m), indicating a possible new gold exploration target in the camp similar to the skarns of the Newry (Aurex) gold prospect roughly 13 km to the west-southwest.
The 2009 Eagle Project work program was successful in identifying strong silver-gold-indium enriched zinc and lead mineralization hosted in the Eagle vein fault, a known and proven host of significant intercepts of Pb-Zn-Ag mineralization, including a reported 7,624.9 g/t Ag, 1.2% Pb and 1.5% Zn over 0.15metres (hole E64-23). The 2009 work has also established that indium, used in plasma screens, is present in significant concentrations of up to 285.4 g/t indium (In) over 1.8m (Hole D09EE-11) in the sphalerite enriched Eagle vein.
EAGLE PROPERTY - DIAMOND DRILL RESULTS SUMMARY |
| Hole Number | Intercept | Analytical Results* |
| Target | Drill Section | From (m) | To (m) | Width (m) | Au (ppb) | Ag (g/t) | Pb (ppm) | Zn (ppm) | In (g/t) |
| D09EE-01 | Eagle Vein | L40+00E | | 328.6 | 332.7 | 4.1 | 16 | 15.1 | 554 | 1.16% | 11.3 |
| | 346.3 | 352.5 | 6.2 | 425 | 12.2 | 489 | 1.86% | 22.9 |
| Incl. | 351.0 | 352.5 | 1.5 | 1263 | 15.7 | 138 | 797 | 0.1 |
| D09EE-02 | Eagle Vein | L40+00E | | 272.9 | 296.6 | 23.7 | 60 | 47.1 | 3750 | 3.85% | 37.1 |
| Incl. | 272.9 | 274.2 | 1.3 | 312 | 284.3 | 3.16% | 7.11% | 57.9 |
| Incl. | 283.7 | 284.8 | 1.1 | 222 | 110.8 | 1.90% | 12.01% | 89.4 |
| Incl. | 288.3 | 296.0 | 7.7 | 46 | 20.9 | 1008 | 4.89% | 65.8 |
| D09EE-03 | Eagle / McLeod | L33+50E | | 267.7 | 268.4 | 0.7 | 8 | 29.4 | 3120 | 5262 | n/a |
| D09EE-04 | McLeod Fault | n/a | | - | - | - | No significant results. |
| D09EE-10 | Eagle Vein | L39+00E | | 305.1 | 305.9 | 0.8 | 160 | 28.1 | 0.35% | 3.23% | n/a |
| D09EE-11 | Eagle Vein | L42+00E | | 232.7 | 241.1 | 8.4 | 181 | 10.3 | 668 | 1.09% | n/a |
| Incl. | 232.7 | 234.1 | 1.4 | 934 | 18.6 | 482 | 2.53% | n/a |
| | 244.5 | 265.5 | 19.0 | 58 | 29.1 | 2805 | 2.79% | n/a |
| Incl. | 252.5 | 254.5 | 2.0 | 112 | 145.0 | 1.03% | 3.17% | 20.3 |
| And | 262.8 | 264.6 | 1.8 | 230 | 31.9 | 626 | 18.52% | 285.4 |
* Analytical results reported in ppb (Au) and ppm (Pb, Zn) and g/t (In) unless otherwise indicated.
Mega Silver has returned the Eagle property to the Company due to a change in its corporate exploration objective which is now focused in the Red Lake gold camp in northwest Ontario.
In 2010, the Company commissioned Jean Pautler, a qualified person to review all historic data from previous work done on the property and make a recommendation for future work program. Pautler’s recommendations are based on a property visit on June 28, 2008, previous experience in the Keno silver mining camp, a review of the historical data and a review of the 2009 work program carried out by Mega Silver while the property was under option from the Company.
The assessment produced the following recommendation: Ore shoots need to be delineated within the Eagle Vein. The best intercept to date is the 7625 g/t Ag, 1.2% Pb over a 1.2m interval from DDH 64-23 which was drilled in 1964. The best silver intersections in drilling occur within 125m of this intercept. It is recommended to attempt to duplicate this hole and to drill systematic step outs from this intersection. In addition it was recommended to drill the exposed vein in trenching on the Alexandra, which may represent the strike extension of the Eagle Vein. The Eagle Vein should be targeted at depth here in an attempt to intersect the vein within the favourable quartzite host. The depth extent of the Eagle Vein intersection in D09EE-10 should be targeted for the same reason.
Additional sampling of the 2009 drill core was also recommended due to incomplete sampling into the footwall.
In January 2012,, Avino entered into an option agreement with Avaron Mining Corp. (“Avaron”), whereby Avaron can earn the exclusive right and option to acquire a 100% title and interest in the Eagle Property.
To earn a 75% interest in the Eagle Property, Avaron must:
·Proposed Work Program. Incur Exploration Costs totaling $7.1 million over five years.The 2009 work program identified strong results which
·Make total cash payments of $375,000 over five years to Avino.
·Issue a total 800,000 common shares of Avaron over five years to Avino.
After earning a 75% interest, Avaron may either elect to form a Joint Venture with Avino, or has the company believes warrant further exploration. The Company is currently evaluating other possibilities.following two options to earn the remaining 25% interest:
Aumax PropertyOption #1
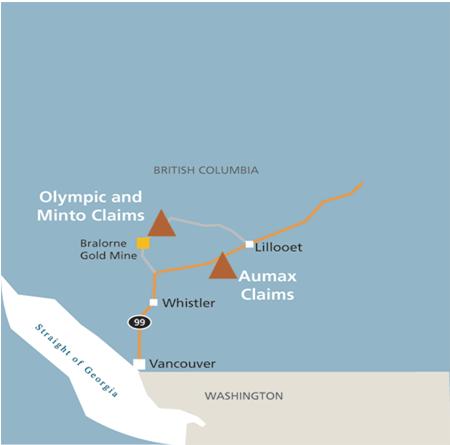
Option #2
Ownership. The Aumax Property is wholly owned byIf Avaron does not elect to place the Company. In 2003, the Company acquired a 100% interest in six Crown granted mineral claims, located in the Lillooet Mining Division of British Columbia, Canada by issuing 200,000property into production, Avaron must pay $100,000 annual advance royalty payments and 250,000 common shares at a price of $0.50 per share and paying $4,000 in cash for total consideration of $104,000. During the fiscal year ended January 31, 2007, these mineral claims were converted into one claim encompassing allto Avino on or before each of the original claims. Duringsixth and seventh anniversaries of January 3, 2012 and at its sole expense, complete drilling of an additional 10,000 metres in depth on the fiscal year ended December 31, 2009, the Company wrote down the value of theseProperty or incur an additional $2,000,000 in exploration costs to a nominal valuein lieu of $1 by an impairment charge to operations of $187,852.
Property Description and Location. The property is located in southern British Columbia approximately 16 kilometers southwestsuch drilling on or before the seventh anniversary of the town of Lillooet. The property can be accessed from Lillooet by a logging road. The upper zone of the Aumax property can be accessed by hiking a further 1.5 km to the southwest. The property covers approximately 975 hectares and is located between Cayoosh Creek and Phair Creek. The showings were discovered in 1999. The showings have economically interesting gold and silver values.
History. Cayoosh Creek has a history of limited placer gold production starting in the 1860’s. Some of this production occurred immediately downstream of the property, near the mouth of Downtown Creek.
A limited exploration program of prospecting, rock and soil sampling and mechanized trenching was carried out in October of 1999. Trenching on the Aumax showing was inconclusive. Many highly anomalous quartz-carbonate boulders were excavated but bedrock was not reached in critical areas. Chip samples of veins exposed in the trenches were highly anomalous, generally in the hundreds of parts per billion gold. Further prospecting and soil sampling of the southeast (upslope) of the Aumax showing was recommended.
Limited soil sampling and prospecting in 1999 on the Upper Zone returned extremely anomalous soil samples. A grid geochemical sampling and further prospecting in this area was recommended.
The Company has placed a reclamation bond of $1,500 at December 31, 2010 (December 31, 2009:$1,500), registered in the name of the Ministry of Finance of British Columbia, as security for estimated future reclamation costs.January 3, 2012.
Proposed Work Program. Geological studies conducted late in 2002 concluded that the discoveries to date lie downslope of the mineral source. A subsequent report in November 2004 recommended a Phase 1 program of more prospecting, geological mapping and additional soil sampling to determine the source of the mineralization. Based on the results of this program, Phase 2 exploration would include trenching and possible diamond drilling but to date, noProposed work program will depend on Avaron’s plans for the property as it has been proposed.optioned off.
Olympic-Kelvin Property
Ownership. The Olympic-Kelvin property is wholly owned by the Company and was acquired in 1987 when it acquired a 100% interest in 20 reverted Crown granted mineral claims, one located mineral claim and three fractions located in the Lillooet Mining Division of British Columbia. The property was written down entirely in fiscal 2002. During the fiscal year ended January 31, 2007, these original mineral claims and fractions were converted into six claims encompassing all of the original claims. The Company recommenced exploration of the property in fiscal 2004 and ceased exploration activities in fiscal 2006. During the fiscal year ended December 31, 2009, the Company wrote down the value of these exploration costs to a nominal value of $1 by an impairment charge to operations of $163,466. The Company will maintain these claims in good standing and may decide to commence exploration again on the Olympic-Kelvin Property. However, the current focus of the Company is its exploration activities in Mexico.
Property Description and Location. The Olympic-Kelvin property totals approximately 662.5 hectares and is located on the south side of Carpenter Lake, five kilometers northeast of Goldbridge in the Lillooet Mining Division, British Columbia.
The Olympic-Kelvin property is easily accessible by the all-weather, publicly maintained, Gray Rock logging road which runs northeast from Goldbridge. Access on the Olympic-Kelvin property is possible on a number of cat trails built by the Company and previous operators.
The Olympic-Kelvin property covers rocks of the Pioneer Formation and Bridge River Terrane. These rocks are cut by northwest trending regional scale structures sub-parallel to the Ferguson and Cadwallader Structures. The structures on the Olympic-Kelvin property are roughly the same distance from the Upper Cretaceous-Tertiary granitic Bendor Intrusions as the Bralorne/Pioneer mines. A similar flexure is present in the northwest trending structures on the Olympic-Kelvin property. These structures on the property are mineralized with gold and silver and have received considerable past work, including at least four adits.
History. The Company recommenced exploration on the Olympic-Kelvin property in January 2004, following up on work completed in 1988 that outlined two prospective areas for gold and silver, the Margarita Zone and the Enigma Zone.
In the Margarita Zone, hole OLY 88-4 returned 24 grams per tonne of gold over 0.85 metres within a much wider intersection of 8.2 grams per tonne of gold over 3.48 metres. The true width of this zone is estimated to be 1.47 metres. A large part of the zone is listwanite, indicating the potential for better grade mineralization immediately below this intersection. Hole OLY 88-6 cut the same zone 75 metres to the northwest and returned 4.26 grams per tonne of gold over 1.34 metres within an eight metre section (5.6 m true width) of mainly listwanite. The area of these intersections is approximately 50 metres off of the Gray Rock Road and could be accessed for mining purposes by an underground ramp from the road.
The Enigma Zone is a colour anomaly on the south shore of Carpenter Lake on Lot 6280, approximately 700 metres east, north-east of the Margarita Zone. Trenching revealed a quartz stock work zone with areas of abundant stibnite. Sampling returned 1.7 grams per tonne of gold over 21 metres within a 75 metre mineralized zone. This is a very wide zone for the Bridge River Camp and, if the zone has significant strike length, it could be amenable to open pit mining. Hole 04-0k-04 was drilled 154 metres under the Enigma Zone and returned highly anomalous gold values. Detailed geological mapping and geochemical sampling has been recommended.
Drilling in January of 2005 was unsuccessful in intersecting the Margarita Zone. One hole was drilled from the east to attempt to intersect the zone. This hole was abandoned at 21.3 metres because of bad ground conditions. No values of economic interest were returned from samples taken from the hole.
The Company has placed a reclamation bond deposit of $1,500 at December 31, 2010 (December 31, 2009: $1,500), registered in the name of the Ministry of Finance of British Columbia, as security for estimated future reclamation costs.
Proposed Work Program. No further work is proposed at this time.
Minto Property
Ownership. The Minto Property is wholly owned by the Company and was acquired in early 1985 when it acquired its 100% interest in eight Crown granted mineral claims, eight reverted Crowncrown government granted mineral claims and one located mineral claim, situated in the Lillooet Mining Division of British Columbia. During the January 31, 2007 year end these mineral claims were converted into one claim encompassing all of the original claims. The property was written down to a nominal value of $1 in fiscal 2002. The Company recommenced exploration of the property in fiscal 2006 and ceased exploration activities in fiscal 2007 and during the 2009 year end wrote down the value to a nominal amount of $1 by an impairment charge to operations of $256,800. The Company will maintain these claims in good standing and may decide to commence exploration again on the Minto Property. However, the current focus of the Company is its exploration activities in Mexico.
Property Description and Location. The Minto Property is situated about ten kilometers east of Goldbridge in the Bridge River gold district of British Columbia and adjoins the Olympic-Kelvin Property. The property covers approximately 204 hectares. The claims occupy the lake bed and north side of Carpenter Lake. Access from Goldbridge is made via an all-weather gravel road which skirts the north shore of Carpenter Lake.
Gold Bridge can be reached from Vancouver via Hope and Lillooet, a distance of 445 kilometers, or via Pemberton using the four-wheel-drive Hurley Pass route, a distance of 225 km.
The terrain is rugged, typical of the eastern margin of the Coast Range Mountains. The claim group ranges in elevation from 650 meters on Carpenter Lake to a maximum of 1020 meters.
The climate of the Bridge River District is transitional between humid coastal belt and more arid interior plateau. Annual precipitation is modest with a significant proportion falling as snow in the winter. Summers tend to be warm to hot depending on the altitude, and winters are moderately cold.
History. The claim group has been explored intermittently for over sixty years and several gold-bearing structures are known on the property. Production from the Minto mine between 1934 and 1940 amounted to 88,900 tons of ore returning 17,558 ounces of gold and 50,582 ounces of silver. During 1985, geological, geochemical, and geophysical (VLF-EM) surveys were conducted and trenches were excavated in anomalous areas. In-fill soil geochemistry and further trenching were undertaken in 1987.
A mechanized trenching program was carried out on the Minto Property in June, 2005 to test the Minto North and Jumper Zones. Seven trenches were excavated, sampled, mapped and reclaimed, usually in a one day period. Chip samples from all the trenches returned values from anomalous to economic levels in gold.
In December 2006, the Company announced the results of the 2006 drilling program on the Minto Property. The four diamond core holes were drilled to explore down dip extensions of gold bearing structures originally discovered in trench 827 on the Minto North Zone.
Holes MO-06-01 and 02 were drilled from a site approximately 10 metres west of trench 827. Hole MO-06-03 was drilled from a site approximately 2 metres north and 7 metres east of MO-06-01 and 02. Hole MO-06-04 was drilled from the same set-up.
The gold bearing structures consist of sets of parallel narrow (1-2 mm) fractures containing quartz, carbonate, grey sulphide veinlets. Assay samples from the four holes drilled conveyed from 1.04 grams per ten to 45.4 grams per tonne.
The Company has placed a reclamation bond deposit of $2,500 at December 31, 2010 (December 31, 2009: $2,500), registered in the name of the Ministry of Finance of British Columbia, as security for estimated future reclamation costs.
Proposed Work Program. No further work program has been proposed.
Item 4A. Unresolved Staff Comments
Not Applicable.
Item 5. Operating and Financial Review and Prospects
The following discussion and analysis of thefinancial condition and results of operations results and financial position of the Company for the year ended December 31, 2010, and December 31, 2009, should be read in conjunction with the Company’s Consolidated Financial Statementsinformation contained in the annual audited consolidated financial statements and the notes thereto.
Thethereto included in this annual report on Form 20-F. Such discussion and analysis is based upon our annual audited consolidated financial statements are prepared in accordance with International Financial Reporting Standards (‘‘IFRS’’).
For all periods up to and including the year ended December 31, 2010, we prepared our consolidated financial statements in accordance with Canadian generally accepted accounting principles (‘‘Canadian GAAP’’). The annual audited consolidated financial statements for the year ended December 31, 2011 are our first annual consolidated financial statements that have been prepared in accordance with IFRS as issued by the International Accounting Standards Board (‘‘IASB’’) and IFRS 1, First Time Adoption of International Financial Reporting Standards.
We have prepared the annual audited consolidated financial statements that comply with IFRS as described in the accounting policies in Note 2 of our annual audited consolidated financial statements. In preparing the annual audited consolidated financial statements, our opening statement of financial position was prepared as of January 1, 2010, our date of transition to IFRS. Note 20 in the annual audited consolidated financial statements explains the principal adjustments we made in restating our Canadian GAAP which has notable differences from US GAAP.statements of financial position as of January 1, 2010 and December 31, 2010 and our previously published Canadian GAAP permitsconsolidated statements income and comprehensive income for the deferral of acquisition and exploration costs, subject to periodic adjustments for impairment, whereas US GAAP requires that such costs be expensed in the period incurred. In addition, US GAAP requires the recognition of a stock-based compensation expense associated with the extension of the expiry date of outstanding warrants whereas Canadian GAAP has no clear guidance on non-service orientated equity awards. See Note 20 to the financial statements which sets out a reconciliation between Canadian and US GAAP.year ended December 31, 2010.
A. Operating Results
Developments for 20102011
Bulk Sampling to Confirm Grades and Recoveries
The ongoing 10,000 tonneIn April 2011, Avino completed the bulk sample program onat the San Gonzalo will allow the Company to assess the economicsdeposit after more than two years of the zone and confirm mineral grades and metallurgical recoveries obtained from earlier diamond drilling. With positive results fromdevelopment work. The highly anticipated program produced very encouraging conclusions. Avino's production costs for the bulk sample Company will move into full production.
Mill Rehabilitation Complete
were just $7.62 per ounce of silver equivalent, demonstrating the robust nature of the project. The overall bulk sample feed grade was 261g/t Ag and 0.9g/t Au. Silver and gold recoveries improved over the course of the bulk sample and averaged 76% and 59% respectively. During the program, 232 dry tonnes of flotation concentrate were produced of which 188 tonnes were sold for net proceeds of US$1.83 million. The remaining concentrate was not sold at this time due to the Earthquake situation in Japan which forced the closure of numerous smelters, thus significantly driving up smelting costs. Instead, Avino stored the remaining concentrate until the concentrate markets improved and better terms could be reached for the sale of the product. As a result of the positive outcome, Avino is proceeding with its mine plan to develop the 3rd, 4th and 5th levels in order to provide mill feed a the rate of 250 tpd on a sustained basis. In 2010,April 2012, the Company completed a three year program that brought extensive modernization to our mill. The upgrades include a new 250 t/day circuit to accommodate high grade ore fromsold the balance of the San Gonzalo zone. This facility now has a new electrical system that meets the electrical code, an upgraded crushing plant that included major repairs to the cone crusher, vibrating screens and conveyors. In addition, the on-site assay lab was put into service along with a new AAS unit to provide on-site control assays. The water supply system from the tailings pond and la Caricol were completed and are now fully functional.concentrate.
Exploration
Following a complete overhaul of Avino's Longyear 44 drill and a new drill contract for personnel and materials, Avino started its regional exploration drill program on January 27, 2011. The drill spent the early part of the year at San Gonzalo further outlining the resource before being moved to various zones around the property. In total 69 holes totaling 9943 metres were drilled principally in the following locations: San Gonzalo (18 holes), La Potosina (9 holes), Guadalupe (23 holes), San Juventino (3 holes), San Lucero (5 holes), Mercedes (1 hole), San Jorge (3 holes), Yolanda (2 holes). The drill crew ended the year back at San Gonzalo exploring for the feeder system of the San Gonzalo Deposit.
Aggressive exploration is also scheduled to continue in 2012 with 10 holes planned for the Elena Tolosa area which are intended to confirm internal estimates of the remaining tonnage of the Avino vein and help prepare for a new NI 43-101 resource estimate later in the year. Drilling at San Gonzalo will also continue but will shift from surface to underground drilling with 10 holes planned using the company’s recently purchased underground drill. Extensive drilling will also be undertaken on the tailings resource to provide material for metallurgical test work as well as to upgrade oz’s from the inferred to the measured and indicated categories; 1985 meters of drilling through 95 holes using a sonic drill are planned. A further 44 holes are also set to be drilled as part of Avino’s ongoing regional drill program in areas including: La Potosina, Aranguez, Gran Luccero, Guadalupe and La Estela.
Milling Operations
In the second half of the year the Company tested the newly re-furbished mill by processing stockpiled ore left behind from previous mining of the ET Zone. This was doneperiods leading up to fine tune the mill for the San Gonzalo bulk sample. By the end of October, the mill had processed over 17,500 tonnes of material to produce approximately 600 tonnes of concentrate. This concentrate was shipped to Manzanillo and sold to MRI trading AG. The mineral at San Gonzalo is silver, gold, lead, and zinc; while the ET stockpile on the main vein is silver, copper, and gold. The rock from ET, while harder than the San Gonzalo material, served as a trial run for the bulk sample.
In November, following the processing of 17,500 tonnes of stockpiled ore left behind from previous mining of the ET zone, relining of the ball mill and the changeover of several conveyor belts in the crushing plant was undertaken. Following the tune up, processing of the San Gonzalo developmentbulk sample, we have used our mill to process stock piled material began with a daily treatment rate ofleft from our past mining operation on the main Avino Vein. The mill has been processing the stock piles at approximately 180 tpd with feed grades highly variable depending on the location of the stockpiles. Typical silver feed grade ranges from 60 to 120 g/t and gold from 0.6 to 1.5 g/t. Copper values are low and ranges from 0.1 to 0.2%. The concentrate produced grades about 2 kg/t silver and 30 g/t gold. Over the course of 2011, approximately 550 tonnes per day. This rateof this concentrate was maintained until the development materialsold to a trading firm in Mexico. An additional 284 tonnes was finishedshipped to Manzanillo, Mexico, in January 2011. During this period, a total of 5,896 tonnes of development ore2012. The sale was processed for the production of 192 tonnes of concentrate grading 11.54g/t gold, 3.617kg/t silver with minor amounts of copper, lead and zinc. Feed grade averaged 205g/t Ag and 0.78g/t Au.completed in January 2012.
Underground Mining
In January 2010, ourSince the completion of the bulk sample, mining and development of the San Gonzalo zone has continued. Stope, 2-200 which was not included in the 2008 NI 43-101 resource calculation by Orequest consultants, and stope 2-080 were mined. Work on stope 2-200 was completed in late November. The calculated tonnage of this stope was 3723 tonnes with an estimated grade of 300 g/t and 1.2 g/t silver and gold respectively. Work on stope 2-080 towards the old mine workings slowed in September due to a different mining method being required. The average grade of this stope is 216g/t silver and 0.9 g/t gold; plans to continue mining this stope have been put on hold due to its proximity to the old workings.
To obtain sufficient feed for a sustained 250 tonne per day operation, Avino’s mining contractor DMG began drivinghas been completing the first declinenecessary underground work to develop the 3rd, 4th and 5th levels of the mine. This work has been accelerated through the purchase several new pieces of underground mining equipment by Avino. By the end of 2011, the ramp to level 3 and the cross cut to the vein had been completed, drifting on the vein at the 2260 mlevel 3 elevation for developmentwas in progress and work and extraction ofon the bulk sample. ramp to level 4 continues.
The proposed in house mine plan options are currently undergoing review. The aim is to select the most cost effective plan to mine the entire San Gonzalo vein was intersected in May.orebody and to provide a sustained mill production rate of 250 tonnes per day. A second decline was driven to the 2306m level. The two declines are known as San Gonzalo vein 1 and San Gonzalo. By July both levels had intersected the San Gonzalo vein. On October 13 the two levels were connecteddevelopment schedule together with the completion of two raises allowingselected mining method will be made once the start of stoping (cut and fill) for the bulk sample. By mid-November, approximately 2000 tonnes of mineralized vein rock hadreview has been broken from the first stope and assays confirmed a calculated and average grade of 1.9g/t gold and 340 g/t silver. This compared well with the original inferred resource, which estimated 444,250 tonnes at San Gonzalo grading 2.61 g/t gold, 322 g/t silver, 1% lead and 1.5% zinc. (Orequest August 31, 2009 NI 43-101 compliant report)completed.
FinancingNYSE/AMEX Listing
In late 2010, Sprott Asset Management LP completed two financingsAugust 2011, Avino's common shares began trading on the NYSE/AMEX under the trading symbol ASM. We are excited about the increased exposure from this listing and hope that it will bring additional value to aidAvino's broadening shareholder base as well as to introduce Avino to a wider audience of investors as our company profile expands. On January 23, 2012, Avino rang the Company’s ongoing development. The financings raised more than $8 million foropening bell at the Company and helped elevate its profile inNew York stock exchange to commemorate the investment community. Sprott participated in the financings on behalf of certain funds and managed accounts including investors introduced by Sprott Private Wealth LP. Sprott has been instrumental in the development of many successful mining ventures and is a leading independent asset manager dedicated to achieving long-term superior returns for its clients.listing.
Results of Operations
The resultsreview of operationsfinancial results are based on the fiscal years ended December 31, 2011, 2010 2009 and 2008..
Twelve months ended December 31, 20102011 compared with the twelve months ended December 31, 2009.2010.
Operating and administrative expenses
Operating and administrative expenses were $1,130,679 for year ended December 31, 2010 as compared with $669,178$4,042,647 for the year ended December 31, 2009, which is2011 as compared with of $1,110,643 for the year ended December 31, 2010, an increase of $461,501.The main$2,932,004. The increase was primarily due to share-based payments to employees, directors, and consultants which increased by $2,187,872 during the year. The increase in share-based payments is due to more options being granted in the current year. Other increases were $113,941include $105,786 in office and miscellaneous due to a re-allocation of mineral property costsan increase in one ofmining activity at the Company’s Mexican subsidiaries,subsidiary and higher occupancy costs incurred by the parent company. There were also increases in management fees of $200,260 due to a one-time bonus paid to the CEO, and an increase in stock-based compensation expenseinvestor relation expenses of $123,897 due to additional options being granted in 2010 and at higher fair value than in 2009. The Company also recorded a provision of $42,478 for uncollectible IVA sales tax whereas in 2009 a recovery of $181,456 was recorded. The fluctuation in the provision for uncollectible IVA sales tax is$195,432 due to the timing of payments from Mexican Government. TravelNYSE-Amex listing and promotion expenses increased by $16,097 due to an increase in travel to Mexico.promotional media.
Loss for the periodyear
The loss for the year ended December 31, 20102011 was $1,490,194$4,184,351 compared with a loss of $987,759$790,840 for the twelve month periodyear ended December 31, 2009,2010, an increase of $502,435. As discussed above, there was$3,393,511. The significant differences include an increase in operatinggeneral and administrative expenses of $461,501. The Company also recorded a future income tax expense of $332,141$2,932,004 as compared to a recovery in 2009 of $239,562. These increases were offset by a decrease of $608,118 in an impairment charge to mineral properties in 2009. No impairment charge was recorded in 2010.
Twelve months ended December 31, 2009 compared with the twelve months ended December 31, 2008.
Operating and administrative expenses
Operating and administrative expenses were $669,178 for the twelve month period ended December 31, 2009 as compared with of $1,575,913 for the twelve months ended December 31, 2008, which is a decrease of $906,735. The primary differences are attributable to decreases of $368,113 in stock-based compensation, $82,961 in investor relations and $395,108 in recovery of sales tax. Other decreases include $10,815 in travel and promotion, $8,529 in general exploration, $16,805 in office and miscellaneous, and $27,194 in salaries. The Company recorded $181,456 as a recovery to the Mexican Value-Added Tax (“VAT”) that was written off during the year end December 31, 2008. The Company received the majority of this tax back in cash refunds. The stock based compensation was lower as a result of fewer stock options granted in 2009. The lower expense in investor relations is due to a reduction in research reports and publications. The decline in travel expenses is a result of attending fewer trade shows.
Loss for the period
The loss for the twelve month period ended December 31, 2009 was $987,759 compared with a loss of $1,538,876 for the twelve month period ended December 31, 2008, a difference of $551,117. The decrease of $906,735 in operating and administrative expensesdiscussed above. This was offset by a reductionan increase in interest income of $78,162, a reduction$64,651 and an increase in gain on foreign exchange of $25,000$48,453 due to fluctuations in option revenuethe Mexican Peso and a write down on British Columbia mineral properties of $608,118.US Dollar. The Company also recorded a future income tax recoveryincurred an unrealized loss on investments in related companies of $239,562 as$212,966 compared to an expenseunrealized gain of $313,323 in 2008 of $98,653, a difference of $338,215. These were offset by a reductionthe prior year which resulted in foreign exchangean increase in unrealized loss of $17,447, the difference between the loss of $18,249 in 2009 and $38,481 in 2008.
B. Liquidity and Capital Resources
The Company entered into a cost sharing agreement dated October 1, 1997, and amended November 1, 2003 to reimburse Oniva for a percentage of its overhead expenses, to reimburse 100% of its out-of-pocket expenses incurred on behalf of the Company, and to pay a percentage fee based on the total overhead and corporate expenses. The agreement may be terminated with one-month notice by either party. Transactions and balances with Oniva, which is a related company, are disclosed in the transactions with related parties section.
During the year ended December 31, 2010,2011, the Company incurred expenditures that increased its mineral property carrying value onrelating to its Mexican properties by $728,055, net$3,831,493 which was offset by the sale of $1,046,005 copper concentrate sales.of $3,114,552. The Company also incurred expenditures that increasedhad had non-cash additions to Mexican properties of $232,821, $292,000, and $137,749 relating to deferred depreciation on property, plant, and equipment, by $334,705.future reclamation costs, and movements in foreign exchange respectively. The net increase to mineral properties at the Company’s Mexican properties was $1,371,511. The Company also acquired property, plant and equipment of $1,307,431 net of depreciation of $235,566 and foreign exchange movements of $53,544. At this time the Company has no operating revenues but earned interest and other income of $14,206$89,356 during the year ended December 31, 2010.2011. As the Company’s cash and cash equivalents will continue to be drawn down by operations therefore interest income is expected to decrease in future periods.
At December 31, 2010,2011, the Company had working capital of $8,794,042$5,723,398 and cash equivalents of $9,051,456.$5,282,464. The Company is continuing its exploration and drilling program and mine development in Mexico. The Company has no immediate plans for the British Columbia properties at this time. In 2011, the
The Company entered into an agreement for the sale of bulk concentrate which the Company believes will generate additional cash.
The Company’s mineral properties arecontinues in the exploration stage until such time that the Avino Mine is re-opened. The investment in and expenditures for the mineral properties comprise most of the Company’s assets along with a lesser asset amount in regards to the Avino Mine facilities and equipment. The recoverability of amounts shown for its mineral property interest and related deferred costs is dependent upon the discovery of economically recoverable reserves and the ability of the Company to obtain the financing necessary to complete development and the achievementachieve profitable operations in the future. The outcome of these matters cannot be predicted at this time.
Mineral exploration and development is capital extensive, and in order to re-commence operations at the Avino Mine, the Company may be obliged to raise new equity capital in the future. There is no assurance that the Company will be successful in raising additional new equity capital.
C. Research and Development, Patents and Licenses, etc.
As the Company is a mineral exploration company with no research and development, the information required by this section is not applicable.
D. Trend Information
As at the time of filing this Annual Report and as otherwise disclosed in this Annual Report, the Company is not aware of any specific trends, uncertainties, demands, commitments or events that are reasonably likely to have a material effect on the Company’s net sales or revenues, income from continuing operations, profitability, liquidity or capital resources, or that would cause reported financial information not necessarily to be indicative of future operating results or financial condition. Many factors that are beyond the control of the Company can affect the Company’s operations, including, but not limited to, the price of minerals, the economy on a global scale, land and exploration permitting, and the appeal of investments in exploration companies. The appeal of exploration companies as investment alternatives could effect the liquidity of the Company and thus future exploration, development and financial conditions of the Company. Other factors such as retaining qualified mining personnel and contractor availability and costs could also impact the Company’s operations.
E. Off-Balance Sheet Arrangements
The Company has no off-balance sheet arrangements.
F. Tabular Disclosure of Contractual Obligations
As at December 31, 2010,2011, the Company had the following contractual obligations:
| | | Payment due by period | |
| | | Total | | | <1 year | | | 1-3 Years | | | 3-5 Years | | | More than 5 years | |
| Drilling Contract | | $ | 302,358 | | | $ | 302,358 | | | | - | | | | - | | | | - | |
| Future Income Tax Liabilities | | | 2,026,148 | | | | - | | | | - | | | | - | | | | 2,026,148 | |
| Total | | $ | 2,328,506 | | | $ | 302,358 | | | | - | | | | - | | | $ | 2,026,148 | |
| | | Payment due by period | |
| | | Total | | | <1 year | | | 1-3 Years | | | 3-5 Years | | | More than 5 years | |
| Trade payables and other payables | | $ | 600,977 | | | $ | 600,977 | | | | | | | - | | | | - | |
| Minimum rental and lease payments | | | 1,152,257 | | | | 243,301 | | | | 486,377 | | | | 338,533 | | | | 84,046 | |
| Deferred Income Tax Liabilities | | | 2,105,356 | | | | - | | | | | | | | - | | | | 2,105,356 | |
| Total | | $ | 3,858,590 | | | $ | 844,278 | | | | 486,377 | | | $ | 338,533 | | | $ | 2,2,189,402 | |
G. Safe Harbor
Certain statements in this Annual Report, including those appearing under this Item 5, constitute "forward-looking statements" within the meaning of the United States Private Securities Litigation Reform Act of 1995, Section 21E of the United States Securities Exchange Act of 1934, as amended, and Section 27A of the United States Securities Act of 1933, as amended. Additionally, forward-looking statements may be made orally or in press releases, conferences, reports, on our website or otherwise, in the future, by us or on our behalf. Such statements are generally identifiable by the terminology used such as "plans", "expects", "estimates", "budgets", "intends", "anticipates", "believes", "projects", "indicates", "targets", "objective", "could", "may", or other similar words.
The forward-looking statements are subject to known and unknown risks and uncertainties and other factors that may cause actual results, levels of activity and achievements to differ materially from those expressed or implied by such statements. Such factors include, among others: market prices for metals; the results of exploration and development drilling and related activities; economic conditions in the countries and provinces in which we carry on business, especially economic slowdown; actions by governmental authorities including increases in taxes, changes in environmental and other regulations, and renegotiations of contracts; political uncertainty, including actions by insurgent groups or other conflict; the negotiation and closing of material contracts; and the other factors discussed in Item 3 Key Information – "Risk Factors", and in other documents that we file with the SEC. The impact of any one factor on a particular forward-looking statement is not determinable with certainty as such factors are interdependent upon other factors; our course of action would depend upon our assessment of the future considering all information then available. In that regard, any statements as to future production levels; capital expenditures; the allocation of capital expenditures to exploration and development activities; sources of funding of our capital program; drilling; expenditures and allowances relating to environmental matters; dates by which certain areas will be developed or will come on-stream; expected finding and development costs; future production rates; ultimate recoverability of reserves; dates by which transactions are expected to close; cash flows; uses of cash flows; collectability of receivables; availability of trade credit; expected operating costs; expenditures and allowances relating to environmental matters; debt levels; and changes in any of the foregoing are forward-looking statements, and there can be no assurances that the expectations conveyed by such forward-looking statements will, in fact, be realized.
Although we believe that the expectations conveyed by the forward-looking statements are reasonable based on information available to us on the date such forward-looking statements were made, no assurances can be given as to future results, levels of activity, achievements or financial condition.
Readers should not place undue reliance on any forward-looking statement and should recognize that the statements are predictions of future results, which may not occur as anticipated. Actual results could differ materially from those anticipated in the forward-looking statements and from historical results, due to the risks and uncertainties described above, as well as others not now anticipated. The foregoing statements are not exclusive and further information concerning us, including factors that could materially affect our financial results, may emerge from time to time. We do not intend to update forward-looking statements to reflect actual results or changes in factors or assumptions affecting such forward-looking statements.
Item 6. Directors, Senior Management and Employees
A. Directors and Senior Management
The following is a list of the Company’s directors and senior management as at June 30, 2011May 11, 2012. The directors are elected for a term of one year at the annual meeting of shareholders. This year’s annual meeting waswill be held on June 23, 2011.22, 2012.
Name and Present Position with the Company | | | | |
Michael Baybak Director | | A business consultant. | | June 1990 |
Gary Robertson Director | | |
Gary Robertson | Certified Financial Planner, Director of Bralorne Gold Mines Ltd., Coral Gold Resources Ltd., Levon Resources Ltd., Mill Bay Ventures Inc. and Sage Gold Inc. | | August 2005 |
Director | | |
David Wolfin(1) Director/President/CEO | | Director and VP Finance of Berkley Resources Inc., Director and VP Finance, of Levon Resources Ltd., President and Director of Coral Gold Resources Ltd. and Gray Rock Resources Ltd. and Director of Bralorne Gold Mines Ltd., Mill Bay Ventures Ltd. and Cresval Capital Corp. | | October 1995 |
Director/President/CEOAndrew Kaplan Director | | A business consultant | | September 2011 |
Jasman Yee Director | | Metallurgical Engineer | | January 2011 |
DirectorDorothy Chin Corporate Secretary | | |
Dorothy Chin | Corporate Secretary of Bralorne Gold Mines Ltd., Coral Gold Resources Ltd., Gray Rock Resources Ltd., and Levon Resources Ltd. | | September 2008 |
Corporate SecretaryMalcolm Davidson* Chief Financial Officer | | |
Lisa Sharp | Chief Financial Officer of Bralorne Gold Mines Ltd., Coral Gold Resources Ltd., Gray Rock Resources Ltd., Levon Resources Ltd., Mill Bay Ventures Inc. and Venerable Ventures Ltd. | June 2008 |
Chief Financial OfficerAvaron Mining Corporation | | March 2012 |
_________
* Ms. Lisa Sharp resigned as CFO on March 5, 2012 and Mr. Malcolm Davidson was appointed as CFO on the same date.
B. Compensation
During the last completed fiscal year of the Company, the Company had threetwo executive officers, namely, its CEO, David Wolfin, its former CEO, Louis Wolfin, and its CFO, Lisa Sharp. At the Company’s Annual General Meeting on June 24, 2010, Louis Wolfin resigned as CEO and a Director. David Wolfin was appointed CEO and President of the Company.
| 1) | Compensation Discussion and Analysis |
The Company does not have a compensation program other than paying base salaries, incentive bonuses, and incentive stock options to its executive officers. The Company recognizes the need to provide compensation package that will attract and retain qualified and experienced executives, as well as align the compensation level of each executive to that executive’s level of responsibility. The three components of the compensation package are included to enable the Company to meet different objectives. The objectives of base salary are to recognize market pay, and acknowledge the competencies and skills of individuals. The objectivesobjective of incentive bonuses (paid in the form of cash payments are designedpayments) is to add a variable component of compensation based onto recognize corporate and individual performances for executive officers and employees. No incentive bonuses were paid to executive officers and employees during the most recently completed fiscal year. The objectives of the stock option awards are to reward achievement of long-term financial and operating performance and focus on key activities and achievements critical to the ongoing success of the Company. Implementation of a new incentive stock option planplans and amendments to the existing stock option plan are the responsibility of the Company’s Compensation Committee.
The Company has no other forms of compensation, although payments may be made from time to time to individuals or companies they control for the provision of consulting services. Such consulting services are paid for by the Company at competitive industry rates for work of a similar nature by reputable arm’s length services providers.
The process for determining executive compensation relies solely on discussions amongst the board of directors of the Company (the “Board”) with the input from and upon the recommendations of the Compensation Committee, without any formal objectives criteria and analysis.
Actual compensation will vary based on the performance of the executives relative to the achievement of goals and the price of the Company’s securities.
| Compensation Element | Description | Compensation Objectives |
| Annual Base Salary | Salary is market-competitive, fixed level of compensation | Retain qualified leaders, motivate strong business performance. |
| Incentive Bonuses | CashDiscretionary cash payment to add variable component to compensation | Based onReward individual performance in achieving corporate and individual performances of key personnel.goals |
| Incentive Stock Option | Equity grants are made in the form of stock options. The amount of grant will be dependent on individual and corporate performance. | Retain qualified leaders, motivate strong business performance.Reward long-term financial and operating performance and align interests of key employees with those of shareholders |
| 2) | Summary Compensation Table |
The following table sets forth particulars concerning the compensation paid or accrued for services rendered to the Company in all capacities during the most recently completed financial year ended December 31, 20102011 of the Company to its executive officers:
| Name and principal position | Year | Salary ($) | Share-based awards ($)1 | Option-based awards ($)2 | Non-equity incentive plan compensation ($)3 | Pension value ($)3 | All other compensation ($) | Total compensation ($) |
| Annual incentive plans | Long-term incentive plans |
DAVID Wolfin(4) President , CEO & Director | 2010 | $96,000 | NIL | $65,300 | NIL | NIL | NIL | NIL | $161,300 |
| 2009 | $96,000 | NIL | NIL | NIL | NIL | NIL | NIL | $96,000 |
| 2008 | $96,000 | NIL | $72,150 | NIL | NIL | NIL | NIL | $168,150 |
LOUIS Wolfin(4) Former CEO & Director | 2010 | NIL | NIL | $31,750 | NIL | NIL | NIL | NIL | $31,750 |
| 2009 | NIL | NIL | NIL | NIL | NIL | NIL | NIL | NIL |
| 2008 | NIL | NIL | $72,150 | NIL | NIL | NIL | NIL | $72,150 |
Lisa Sharp CFO | 2010 | $20,992 | NIL | $18,300 | NIL | NIL | NIL | NIL | $39,292 |
| 2009 | $19,800 | NIL | $19,500 | NIL | NIL | NIL | NIL | $39,300 |
| 2008 | $11,106 | NIL | NIL | NIL | NIL | NIL | NIL | $11,106 |
| Name and principal position | Year | Salary ($) | Share-based awards ($)1 | Option-based awards ($)2 | Non-equity incentive plan compensation ($)3 | Pension value ($)4 | All other compensation ($) | Total compensation ($) |
DAVID Wolfin(5) President, CEO & Director | 2011 | $145,500 | NIL | $1,058,200 | 150,000 | NIL | NIL | $1,353,700 |
| 2010 | $96,000 | NIL | $65,300 | NIL | NIL | NIL | $161,300 |
| 2009 | $96,000 | NIL | NIL | NIL | NIL | NIL | $96,000 |
Lisa Sharp CFO* | 2011 | $27,521 | NIL | $124,600 | NIL | NIL | NIL | $152,121 |
| 2010 | $20,992 | NIL | $18,300 | NIL | NIL | NIL | $39,292 |
| 2009 | $19,800 | NIL | $19,500 | NIL | NIL | NIL | $39,300 |
511 The Company does not currently have any share-based award plans.
2 The methodology used to calculate the grant date fair value is based on the Black-Scholes Option Pricing Model. The Company used the following weighted average assumptions in the model to determine the award recorded above: Dividend Yield – Nil; Expected Life – 5 years; Volatility – 76.17%; Risk Free Interest Rate – 2.05%.4 The Company does not have any pension plans.
1 | The Company does not currently have any share-based award plans. |
5On June 24, 2010, Mr. Louis Wolfin resigned as CEO and director and Mr. David Wolfin was appointed CEO. Mr. David Wolfin’s salary was paid to Intermark Capital Corp., a private BC corporation controlled by David Wolfin.2 | The methodology used to calculate the grant date fair value is based on the Black-Scholes Option Pricing Model. The Company used the following weighted average assumptions in the model to determine the award recorded above: Dividend Yield – Nil; Expected Life – 5 years; Volatility – 77.47%; Risk Free Interest Rate – 2.19%. |
3 | The Company does not have any non-equity incentive plans or any pension plans |
4 | On June 24, 2010, Mr. Louis Wolfin resigned as CEO and director and Mr. David Wolfin was appointed CEO. Mr. David Wolfin’s salary was paid to Intermark Capital Corp., a private BC corporation controlled by David Wolfin. |
*Ms.Lisa Sharp resigned as CFO on March 5, 2012 and Mr. Malcolm Davidson was appointed as CFO on the same date.
Annual Base Salary
Base Salary for the executive officers is determined by the Board upon the recommendation of the Compensation Committee and its recommendations are reached primarily by informal comparison of the remuneration paid by other reporting issuers with the same size and industry and with publicly available information on remuneration that the Compensation Committee feels is suitable.
The Annual Base Salary paid to the executive officers shall,is, for the purpose of establishing appropriate increases, be reviewed annually by the Board upon the recommendation of the Compensation Committee thereof as part of the annual review of executive officers. The decision on whether to grant an increase to the executive’s base salary and the amount of any such increase shall be in the sole discretion of the Board and Compensation Committee thereof.
Long TermNon-Equity Incentive Plan (LTIP)Compensation
One of the three components of the Company’s compensation package is a discretionary annual cash bonus, paid to recognize individual performance in attaining corporate goals and objectives. The Company does not have a LTIP, pursuant to which cash or non-cash compensation intended to serve as anlong-term incentive for performance (whereby performance is measured by reference to financial performance or the price of the Company’s securities), was paid or distributed to the executive officers during the most recently completed financial year ended December 31, 2010.plan.
Option Based Award
An Option Based Award is in the form of the grant of an incentive stock option. The objective of the incentive stock option is to reward executive officers, employees and directors’ individual performance at the discretion of the Board upon the recommendation of the Compensation Committee. The plan currently used by the Company is the 20102011 Stock Option Plan.
The Company currently maintains a formal stock option plan (the “Plan”), under which stock options have been granted and may be granted to purchase a number equal to 10% of the Company’s issued capital from time to time. For details of the Plan please refer to “Particulars of Matters to be Act Upon” in the Information Circular.
The 2010 Stock Option Plan is administered by the Compensation Committee pursuant to the 2010 Stock Option Plan.Committee. The process the Company uses to grant option-based awards to executive officers is upon the recommendations of the Compensation Committee to the Board of Directors.
The role of the Compensation Committee is to recommend to the Board the compensation of the Company’s directors and the executive officersNEOs which the Committee believesfeels is suitable.
As of December 31, 2010,2011, stock options to purchase a total of up to 1,605,0002,622,000 shares have been granted and remain outstanding under the Plan, leaving 1,010,72369,023 options available for issuance.new grants. All previous grants of option-based awards are taken into account when considering new grants.
Outstanding share-based awards and option-based awards
The following table sets forth the options granted to the executive officers to purchase or acquire securities of the Company outstanding at the end of the most recently completed financial year ended December 31, 2010:2011:
| | Option-based Awards | | | | Share-based Awards | |
| Name | Number of securities underlying unexercised options (#) | Option exercise price ($) | Option expiration date | Value of unexercised in-the-money options ($)1 | Number of shares or units of shares that have not vested (#) | Market or payout value of share-based awards that have not vested ($)1 |
David Wolfin President, CEO & Director | 65,000 | $0.75 | Feb. 27, 2013 | $131,300 | Nil | Nil |
| 15,000 | $0.81 | Jan 14, 2015 | $29,400 | Nil | Nil |
| 95,000 | $1.05 | Sept 15, 2015 | $163,400 | Nil | Nil |
| Louis Wolfin, Former CEO & Director | 65,000 | $0.75 | Feb. 27, 2013 | $131,300 | Nil | Nil |
| 15,000 | $0.81 | Jan 14, 2015 | $29,400 | Nil | Nil |
| 40,000 | $1.05 | Sept 15, 2015 | $68,800 | Nil | Nil |
Lisa Sharp CFO | 40,000 | $0.75 | Sept. 22, 2014 | $80,800 | Nil | Nil |
| 30,000 | $1.05 | Sep 10, 2015 | $51,600 | Nil | Nil |
| | Option-based Awards | Share-based Awards |
| Name | Number of securities underlying unexercised options (#) | Option exercise price ($) | Option expiration date | Value of unexercised in-the-money options ($)1 | Number of shares or units of shares that have not vested (#) | Market or payout value of share-based awards that have not vested ($)1 |
David Wolfin President, CEO & Director | 65,000 | $0.75 | Feb. 27, 2013 | $43,550 | Nil | Nil |
| 15,000 | $0.81 | Jan 14, 2015 | $9,150 | Nil | Nil |
| 95,000 | $1.05 | Sept 15, 2015 | $35,150 | Nil | Nil |
| 410,000 | $2.30 | Jan 18, 2016 | N/A | Nil | Nil |
| 360,000 | $2.00 | Sept 30, 2016 | N/A | Nil | Nil |
Lisa Sharp CFO* | 35,000 | $0.75 | Sept. 22, 2014 | $23,450 | Nil | Nil |
| 30,000 | $1.05 | Sep 10, 2015 | $11,100 | Nil | Nil |
| 50,000 | $2.30 | Jan 18, 2016 | N/A | Nil | Nil |
| 40,000 | $2.00 | Sept 30, 2016 | N/A | Nil | Nil |
1 In-the-Money Options isare the difference between the market value of the underlying securities at December 31, 20102011 and the exercise price of the option. The closing market price of the Company's common shares as at December 31, 20102011 was $2.77$1.42 per common share.
*Ms.Lisa Sharp resigned as CFO on March 5, 2012 and Mr. Malcolm Davidson was appointed as CFO on the same date.
Incentive plan awards – value vested or earned during the year
The following table sets forth the value vested or earned during the year of option-based awards, share-based awards and non-equity incentive plan compensation paid to executive officers during the most recently completed financial year ended December 31, 2010:2011:
| Name | Option-based awards – Value vested during the year ($) (1) | Share-based awards – Value vested during the year($year ($) | Non-equity incentive plan compensation – Value earned during the year ($) |
David Wolfin(2) President, CEO and Director | Nil$65,600 | Nil | Nil |
Louis Wolfin(2)
Former CEO and Director
| Nil | Nil | Nil |
Lisa Sharp(3) CFO | Nil$8,000 | Nil | Nil |
| (1) | The aggregate dollar value that would have been realized if the options have no value sincegranted during the exercise price was higher thanyear had been exercised on the market price at the grantvesting date. |
| (2) | On June 24, 2010 Louis Wolfin resigned as CEO and director, and David Wolfin was appointed President and CEO. |
| (3) | On March 5, 2012 Lisa Sharp resigned as CFO, and Malcolm Davidson was appointed CFO. |
No pension plan or retirement benefit plans have been instituted by the Company and none are proposed at this time.
| 5) | Termination and Change of Control Benefits |
The Company doesdid not have, at the end of its most recently completed fiscal year, any employment contracts with the executive officers andunder which there are no contractualany specified provisions for termination of employment or change in responsibilities.
The following table sets forth the value of all compensation paid to the directors in their capacity as directors during the most recently completed financial year ended December 31, 2010:2011:
Name | Fees earned ($) | Share-based awards ($) | Option-based awards ($)(1) | Non-equity incentive plan compensation ($) | Pension value ($) | All other compensation ($) | Total ($) |
| Michael Baybak* | $3,000 | NIL | $19,550 | NIL | NIL | NIL | $22,550 |
| Gary Robertson* | $6,000 | NIL | $25,650 | NIL | NIL | NIL | $31,650 |
| David Wolfin | NIL | NIL | NIL | NIL | NIL | NIL | NIL |
| Louis Wolfin | NIL | NIL | NIL | NIL | NIL | NIL | NIL |
| Name | Fees earned ($) | Share-based awards ($) | Option-based awards ($)(1) | Non-equity incentive plan compensation ($) | Pension value ($) | All other compensation ($) | Total ($) |
Michael Baybak* | $6,000 | NIL | $203,600 | NIL | NIL | NIL | $209,600 |
Gary Robertson* | $6,000 | NIL | $226,400 | NIL | NIL | NIL | $232,400 |
David Wolfin(2) | NIL | NIL | NIL | NIL | NIL | NIL | NIL |
Jasman Yee (3)* | $6,000 | NIL | $226,400 | NIL | NIL | NIL | $232,400 |
Andrew Kaplan (4)* | $750 | NIL | $45,600 | NIL | NIL | NIL | $46,350 |
*Independent & Non-Employee Directors
(1) The methodology used to calculate the grant date fair value is the last closing price of the Company’s shares beforeon the date of the stock option grant less the exercise price.
The Company pays its independent directors $750 per quarter. Each independent director is also paid $250 per quarter for each committee he serves as a member. (2) CEO’s, see Summary Compensation Table.
Incentive stock options have been granted to non-NEO directors(3) Mr. Jasman Yee was appointed director on January 18, 2011.
(4) Mr. Andrew Kaplan was appointed director on September 27, 2011.
No director of the Company as follows:who is not a Named Executive Officer has received, during the most recently completed financial year, compensation pursuant to:
| Name | Number of options | Option exercise price ($) | Option expiration date | Option Exercised | Balance of Option Un-Exercised |
| Michael Baybak | 25,000 | $0.75 | Feb 27, 2013 | Nil | 25,000 |
| 15,000 | $0.81 | Jan 14, 2015 | Nil | 15,000 |
| 20,000 | $1.05 | Sep 10, 2015 | Nil | 20,000 |
| Gary Robertson | 25,000 | $0.75 | Feb 27, 2013 | Nil | 25,000 |
| 15,000 | $0.81 | Jan 14, 2015 | Nil | 15,000 |
| 30,000 | $1.05 | Sep 10, 2015 | Nil | 30,000 |
| TOTAL: | 130,000 | | | - | 130,000 |
| (a) | any standard arrangement for the compensation of directors for their services in their capacity as Directors, including any additional amounts payable for committee participation or special assignments; |
| (b) | any other arrangement, in addition to, or in lieu of, any standard arrangement, for the compensation of Directors in their capacity as Directors except for the granting of stock options; or |
| (c) | any arrangement for the compensation of directors for services as consultants or experts. |
The Company may grant incentive stock options to Directors of the Company from time to time pursuant to the stock option plan of the Company and in accordance with the policies of the TSX Venture Exchange (the "TSX-V").
Outstanding share-based awards and option-based awards
The following table sets forth the options granted to the directors to purchase or acquire securities of the Company outstanding at the end of the most recently completed financial year ended December 31, 2011:
| Option-based Awards | Share-based Awards |
| Name | Number of securities underlying unexercised options (#) | Option exercise price ($) | Option expiration date | Value of unexercised in-the-money options ($)(1) | Number of shares or units of shares that have not vested (#) | Market or payout value of share-based awards that have not vested ($)(1) |
| Michael Baybak | 25,000 15,000 20,000 100,000 40,000 | $0.75 $0.81 $1.05 $2.30 $2.00 | Feb. 27, 2013 January 14, 2015 Sept 10, 2015 Jan 18, 2016 Sept 30, 2016 | $16,750 $9,150 $7,400 Nil Nil | Nil Nil Nil Nil Nil | Nil Nil Nil Nil Nil |
| Gary Robertson | 25,000 15,000 30,000 100,000 60,000 | $0.75 $0.81 $1.05 $2.30 $2.00 | Feb. 27, 2013 January 14, 2015 Sept 10, 2015 Jan 18, 2016 Sept 30, 2016 | $16,750 $9,150 $11,100 Nil Nil | Nil Nil Nil Nil Nil | Nil Nil Nil Nil Nil |
| Jasman Yee* | 15,000 30,000 100,000 60,000 | $0.75 $1.05 $2.30 $2.00 | Feb. 27, 2013 Sept 10, 2015 Jan 18, 2016 Sept 30, 2016 | $10,050 $11,100 Nil Nil | Nil Nil Nil Nil | Nil Nil Nil Nil |
| Andrew Kaplan** | 20,000 5,000 40,000 | $2.00 $2.30 $2.00 | Dec 9, 2013 Jan 18, 2016 Sept 30, 2016 | Nil Nil Nil | Nil Nil Nil | Nil Nil Nil |
| (1) | In-the-Money Options is the difference between the market value of the underlying securities at December 31, 2011 and the exercise price of the option. The closing market price of the Company's common shares as at December 31, 2011 was $1.42 per common share. |
* Mr. Jasman Yee was appointed director on January 18, 2011.
** Mr. Andrew Kaplan was appointed director on September 27, 2011.
Incentive plan awards – value vested or earned during the year
An “incentive plan” is any plan providing compensation that depends on achieving certain performance goals or similar conditions within a specific period. An “incentive plan award” means compensation awarded, earned, paid or payable under an incentive plan.
The following table sets forth the value vested or earned during the year of option-based awards, share-based awards and non-equity incentive plan compensation paid to directors during the most recently completed financial year ended December 31, 2011:
| Name | Option-based awards – Value vested during the year ($) (1) | Share-based awards – Value vested during the year ($) | Non-equity incentive plan compensation – Value earned during the year ($) |
| Michael Baybak | $16,000 | Nil | Nil |
| Gary Robertson | $16,000 | Nil | Nil |
| Jasman Yee* | $16,000 | Nil | Nil |
| Andrew Kaplan** | Nil | Nil | Nil |
| (1) | The aggregate dollar value that would have been realized if the options granted during the year had been exercised on the vesting date. |
* Mr. Jasman Yee was appointed director on January 18, 2011.
** Mr. Andrew Kaplan was appointed director on September 27, 2011.
Termination of Employment, Changes in Responsibilities and Employment Contracts
There are no employment contracts between the Company and its executive officers and the Company has no compensatory plan or arrangement with respect to its executive officers in the event of the resignation, retirement or any other termination of the executive officers’ employment with the Company or in the event of a change of control of the Company or in the event of a change in the executive officers’ responsibilities following a change in control, where in respect of the executive officers the value of such compensation exceeds $100,000.
C. Board Practices
The Board is currently comprised of fourfive directors. The size and experience of the Board is important for providing the Company with effective governance in the mining industry. The Board’s mandate and responsibilities can be effectively and efficiently administered at its current size. The Board has functioned, and is of the view that it can continue to function, independently of management as required. Directors are elected for a term of one year at the annual general meeting. At the Annual General Meeting, held on June 23, 2011, the shareholders elected Messrs. Michael Baybak, Gary Robertson, David Wolfin, and Jasman Yee as directors.directors and Mr. Andrew Kaplan was appointed on September 27, 2011.
The Board has considered the relationship of each director to the Company and currently considers threefour of the fourfive directors to be “unrelated” (Messrs. Baybak, Robertson, Yee and Yee)Kaplan). “Unrelated director” means a director who is independent of management and free from any interest and any business or other relationship which could reasonably be perceived to materially interfere with the director’s ability to act with a view to the best interest of the Company, other than interests and relationships arising solely from shareholdings.
Procedures are in place to allow the Board to function independently. At the present time, the Board has experienced directors that have made a significant contribution to the Company’s success, and are satisfied that it is not constrained in its access to information, in its deliberations or in its ability to satisfy the mandate established by law to supervise the business and affairs of the Company. Committees meet independent of management and other directors.
Mandate of the Board of Directors, its Committees and Management
The role of the Board is to oversee the conduct of the Company’s business, including the supervision of management, and determining the Company’s strategy. Management is responsible for the Company’s day to day operations, including proposing its strategic direction and presenting budgets and business plans to the Board for consideration and approval. The strategic plan takes into account, among other things, the opportunities and risks of the Company’s business. Management provides the Board with periodic assessments as to those risks and the implementation of the Company’s systems to manage those risks. The Board reviews the personnel needs of the Company from time to time, having particular regard to succession issues relating to senior management. Management is responsible for the training and development of personnel. The Board assesses how effectively the Company communicates with shareholders, but has not adopted a formal communications policy. Through the Audit Committee, and in conjunction with its auditors, the Board assesses the adequacy of the Company’s internal control and management information systems. The Board looks to management to keep it informed of all significant developments relating to or effecting the Company’s operations. Major financings, acquisitions, dispositions and investments are subject to board approval. A formal mandate for the BoardCode of Directors, the Chief Executive OfficerEthics (“Code”) has been adopted and the Chief Financial Officer has not been considered necessary since the relative allocation of responsibility is well understood by both managementapplies to all directors, officers and the Board.employees. The Board meets as required. The Board and committees may take action at these meetings or at a meeting by conference call or by written consent.
Committees
Audit Committee
The Audit Committee assists the Board in its oversight of the Company’s financial statements and other related public disclosures, the Company’s compliance with legal and regulatory requirements relating to financial reporting, the external auditors, qualifications and independence and the performance of the internal audit function and the external auditors. The Audit Committee has direct communications channels with the Company’s auditors. The Audit Committee reviews the Company’s financial statements and related management’s discussion and analysis of financial and operating results. The Audit Committee can retain legal, accounting or other advisors.
The Audit Committee currently consists of three directors (Messrs. Jasman Yee, Michael Baybak, and Gary Robertson). All of the members are independent and all of whom are financially literate, and have accounting or related financial expertise. “Financially literate” means the ability to read and understand a balance sheet, an income statement, and a cash flow statement. “Accounting or related financial expertise” means the ability to analyze and interpret a full set of financial statements, including the notes attached thereto, in accordance with Canadian GAAP.GAAP and International Financial Reporting Standards (“IFRS).
The Board has adopted a charter for the Audit Committee which is reviewed annually and sets out the role and oversight responsibilities of the Audit Committee with respect to:
· | its relationship with and expectation of the external auditors, including the establishment of the independence of the external auditor and the approval of any non-audit mandates of the external auditor; |
· | determination of which non-audit services the external auditor is prohibited from providing; |
· | the engagement, evaluation, remuneration, and termination of the external auditors; |
· | appropriate funding for the payment of the auditor’s compensation and for any advisors retained by the audit committee; |
· | its relationship with and expectation of the internal auditor; |
· | its oversight of internal control; |
· | disclosure of financial and related information; and |
· | any other matter that the audit committee feels is important to its mandate or that which the board chooses to delegate to it. |
Compensation Committee
The Compensation Committee recommends to the Board the compensation of the Company’s Directors and the Chief Executive Officer which the Compensation Committee feels is suitable. Its recommendations are reached primarily by comparison of the remuneration paid by the Company with publicly available information on remuneration paid by other reporting issuers that the Compensation Committee feels are similarly placed within the same business of the Company.
The Compensation Committee consists of three directors, Messrs. Yee, Robertson and Baybak, all are unrelated.
Corporate The charter of the Compensation Committee is available at the Company’s website at www.avino.com
Governance and Nominating Committee
The Corporate Governance and Nominating Committee assists the Board in establishing the Company’s corporate governance policies and practices generally, identifying individuals qualified to become members of the Board, reviewing the composition and functioning of the Board and its committees and making recommendationsreview/recommend matters to the Board as appropriate. When considering nomineeswith respect to the Board,governance and nominating matters. In this regard, the Corporate Governance Committee’s mandate requires that it consider the current compositionpurpose of the Board and give consideration to candidates having experience in the industry, life experience and background. The Corporate Governance Committee is also responsible for the Company’s corporate governance guidelines. The Corporate Governance Committee may retain legal or other advisors.to:
| i. | manage the corporate governance system for the Board; |
| ii. | assist the Board to fulfill its duty to meet the applicable legal, regulatory and (self-regulatory) business principles and 'codes of best practice' of corporate behaviour and conduct; |
| iii. | assist in the creation of a corporate culture and environment of integrity and accountability; |
| iv. | monitor the quality of the relationship between the Board and management of the Company; |
| v. | review the Chief Executive Officer's succession plan; |
| vi. | recommend to the Board nominees for appointment of the Board; |
| vii. | lead the Board's annual review of the Chief Executive Officer's performance; and |
| viii. | annually review and set an agenda of the Board on an ongoing basis. |
The Corporate Governance and Nominating Committee currently consists of three directors, Messrs. Yee, Robertson and Baybak, all are unrelated.
The charter of the Governance and Nominating Committee is available at the Company’s website at www.avino.com
D. Employees
As at December 31, 2010,2011, the Company has 4069 employees located in Mexico. The Company’s senior management as well as administrative and corporate services are located in Canada; however, these people are not considered employees of the Company in a legal sense. Senior management and administrative staff are contracted by the Company through their companies or through the Company’s cost sharing agreement for overhead and corporate services with Oniva International Services Corp.
As at December 31, 2010, the Company had 40 employees located in Mexico, and as at December 31, 2009, the Company had 17 employees located in Mexico and as at December 31, 2008, the Company had 11 employees located in Mexico.
E. Share Ownership
The following table sets forth the share ownership of the individuals referred to in “Compensation” as of June 30, 2011:May 11, 2012:
| | | | | | |
| | | | | | |
Michael Baybak | | | 102,400 | | | | * | |
Gary Robertson | | | 75,000 | | | | * | |
David Wolfin | | | 303,084 | | | | * | |
Louis Wolfin(1)
| | | 4,345 | | | | * | |
Jasman Yee | | | 22,500 | | | | * | |
Lisa Sharp | | Nil | | | | N/A | |
| | | | | | | | |
| | | | | | |
| | | | | | | |
| Michael Baybak | | | 39,700 | | | | * | |
| Gary Robertson | | | 92,900 | | | | * | |
| David Wolfin | | | 303,084 | | | | 1 | % |
| Jasman Yee | | | 22,500 | | | | * | |
| Andrew Kaplan | | Nil | | | | N/A | |
| Malcolm Davidson | | Nil | | | | N/A | |
| Lisa Sharp | | Nil | | | | N/A | |
*Less than one percent
(1) LouisOutstanding Options
The following information, as of May 11, 2012, reflects outstanding options held by the individuals referred to in “Compensation”:
| | | | |
David Wolfin President, CEO and Director | 65,000 15,000 95,000 410,000 360,000 | Feb 27, 2008 Jan 14, 2010 Sept 10, 2010 Jan 18, 2011 Sept 30, 2011 | $0.75 $0.81 $1.05 $2.30 $2.00 | Feb 27, 2013 Jan 14, 2015 Sept 10, 2015 Jan 18, 2016 Sept 30, 2016 |
Malcolm Davidson CFO | 20,000 40,000 | Jan 18, 2011 Sept 30, 2011 | $2.30 $2.00 | Jan 18, 2016 Sept 30, 2016 |
Lisa Sharp* Former CFO | 20,000 30,000 50,000 40,000 | Sept 22, 2009 Sept 10, 2010 Jan 18, 2011 Sept 30, 2011 | $0.75 $1.05 $2.30 $2.00 | Sept 22, 2014 Sept 10, 2015 Jan 18, 2016 Sept 30, 2016 |
Michael Baybak Director | 25,000 15,000 20,000 100,000 40,000 | Feb 27, 2008 Jan 14, 2010 Sept 10, 2010 Jan 18, 2011 Sept 30, 2011 | $0.75 $0.81 $1.05 $2.30 $2.00 | Feb 27, 2013 Jan 14, 2015 Sept 10, 2015 Jan 18, 2016 Sept 30, 2016 |
Gary Robertson Director | 25,000 15,000 30,000 100,000 60,000 | Feb 27, 2008 Jan 14, 2010 Sept 10, 2010 Jan 18, 2011 Sept 30, 2011 | $0.75 $0.81 $1.05 $2.30 $2.00 | Feb 27, 2013 Jan 14, 2015 Sept 10, 2015 Jan 18, 2016 Sept 30, 2016 |
Jasman Yee Director | 15,000 30,000 100,000 60,000 | Sept 22, 2009 Sept 10, 2010 Jan 18, 2011 Sept 30, 2011 | $0.75 $1.05 $2.30 $2.00 | Feb 27, 2013 Sept 10, 2015 Jan 18, 2016 Sept 30, 2016 |
Andrew Kaplan Director | 20,000 5,000 40,000 | Dec 09, 2010 Jan 18, 2011 Sept 30, 2011 | $2.00 $2.30 $2.00 | Dec 09, 2013 Jan 18, 2016 Sept 30, 2016 |
*On March 5, 2012 Lisa Sharp resigned as a directorCFO, and CEO on June 24, 2010Malcolm Davidson was appointed CFO.
Outstanding Options
The following information, as of June 30, 2011, reflects outstanding options held by the individuals referred to in “Compensation”:
| | | | | |
| | | | | |
| David Wolfin | 65,000 | Feb. 27, 2008 | $0.75 | Feb. 27, 2013 |
| President, CEO and Director | 15,000 | January 14, 2010 | $0.81 | January 14, 2015 |
| | 95,000 | Sept 10, 2010 | $1.05 | Sept 10, 2015 |
| | 410,000 | Jan 18, 2011 | $2.30 | Jan 18, 2016 |
| | | | | |
| Louis Wolfin | 65,000 | Feb. 27, 2008 | $0.75 | Feb. 27, 2013 |
| Former CEO & Director | 15,000 | January 14, 2010 | $0.81 | January 14, 2015 |
| | 40,000 | Sept 10, 2010 | $1.05 | Sept 10, 2015 |
| | | | | |
| Lisa Sharp | 40,000 | Sept. 22, 2009 | $0.75 | Sept. 22, 2014 |
| CFO | 30,000 | Sept 10, 2010 | $1.05 | Sept 10, 2015 |
| | 50,000 | Jan 18, 2011 | $2.30 | Jan 18, 2016 |
| | | | | |
| Michael Baybak | 25,000 | Feb. 27, 2008 | $0.75 | Feb. 27, 2013 |
| Director | 15,000 | January 14, 2010 | $0.81 | January 14, 2015 |
| | 20,000 | Sept 10, 2010 | $1.05 | Sept 10, 2015 |
| | 100,000 | Jan 18, 2011 | $2.30 | Jan 18, 2016 |
| | | | | |
| Gary Robertson | 25,000 | Feb. 27, 2008 | $0.75 | Feb. 27, 2013 |
| Director | 15,000 | January 14, 2010 | $0.81 | January 14, 2015 |
| | 30,000 | Sept 10, 2010 | $1.05 | Sept 10, 2015 |
| | 100,000 | Jan 18, 2011 | $2.30 | Jan 18, 2016 |
| | | | | |
| Jasman Yee | 15,000 | Sept. 22, 2009 | $0.75 | Feb. 27, 2013 |
| Director | 30,000 | Sept 10, 2010 | $1.05 | Sept 10, 2015 |
| | 100,000 | Jan 18, 2011 | $2.30 | Jan 18, 2016 |
Item 7. Major Shareholders and Related Party Transactions
To the knowledge of the Company, it is not directly or indirectly owned or controlled by any other corporation or by the Canadian Government, or any foreign government, or by any other natural or legal person.
As of June 30, 2011,May 11, 2012, to the knowledge of the Company, no person who owned more than five (5%) percent of the outstanding shares of each class of the Company’s voting securities.securities other than:
| Name | Number of Voting Securities | Percentage |
Sprott Inc. Sprott Inc. & Sprott Canadian Equity Fund | 2,951,200 2,874,200 | 10.90% 10.61% |
As of June 23, 2011,May 11, 2012, there were 26,888,72727,068,416 common shares issued and outstanding. Of those common shares issued and outstanding, 21,886,74321,924,823 common shares were held by 6563 shareholders whose addresses were in Canada.
B. Related Party Transactions
B. | Related Party TransactionsDuring the year ended December 31, 2011, the Company paid, or made provision for the future payment of the following amounts to related parties: |
During the year ended December 31, 2010, the Company paid, or made provision for the future payment of the following amounts to related parties:
| i) | $168,527 (2009392,751 (2010 - $148,754; 2008 - $188,158)$168,527) for administrative expenses (rent, salaries, office supplies and other miscellaneous disbursements) to Oniva International Services Corp (“Oniva”), a private company beneficially owned by the Company and a number of other public companies related through common directors; |
| ii) | $96,000 (2009 - $96,000; 2008295,500 (2010 - $96,000) to a private company controlled by a Director for management fees; |
| iii) | $30,000 (2009 - $30,000; 2008(2010 - $30,000) to a private company controlled by a director of a related company for consulting fees; |
| iv) | $24,954 (200944,027 (2010 - $10,344; 2008 - $34,698)$24,954) to a private company controlled by a director of a related company for geological consulting services; |
| v) | $13,500 (200918,750 (2010 - $15,000; 2008 - $15,000)$13,500) to Directors for Directors fees. |
The amounts due to related parties consist of $153,289$179,338 (December 31, 20092010 - $145,120)$153,289) due to Oniva; $10,500$19,624 (December 31, 20092010 - $18,000)$10,500) due to Directors for Directors fees; $789$4,800 (December 31, 20092010 - $1,054)$789) due to a private company controlled by a Director of a related company for geological services; and $4,687Nil (December 31, 20092010 - $516)$4,687) due to a private company controlled by a Director for an expense reimbursement.
All related party transactions are recorded at the value agreed upon by the Company and the related party. The amounts due from and due to related parties are non-interest bearing, non-secured and with no stated terms of repayment.
| C. | Interests of Experts and Counsel |
Not Applicable.
Item 8. Financial Information
| A. | Consolidated Financial Statements and Other Financial Information |
The following financial statements of the Company are attached to this Annual Report:
| · | Audit Report of Independent Registered Public Accounting Firm; |
· | Consolidated Balance Sheets as at December 31, 2010 and December 31, 2009; |
· | Consolidated Statements of Operations and Comprehensive LossSee ‘‘Item 17. Financial Statements’’ for the years ended December 31, 2010, December 31, 2009 and 2008; |
· | Consolidated Statements of Shareholders’ Equity for the years ended December 31, 2010, 2009 and 2008; |
· | Consolidated Statements of Cash Flows for the years ended December 31, 2010, 2009 and 2008; and |
· | Notes to theour Annual Audited Consolidated Financial Statements, for the years ended December 31, 2010, 2009related notes and 2008.other financial information filed with this annual report on Form 20-F. |
Dividend Policy
The Company has never paid any dividends and does not intend to in the near future.
None.Except as otherwise disclosed in this annual report, there have been no material changes in our financial position, operations or cash flows since December 31, 2011.
Item 9. | Item 9. The Offer and Listing |
| A. | Offer and Listing Details |
The following sets forth the high and low prices expressed in Canadian Dollars on the TSX-V for the Company’s common shares for the past five years, for each quarter for the last two fiscal years, and for the last sixfour months.
| | | TSX-V | | | OTCBB | |
| | | | | | | | | | | | |
| June 2011 | | | 2.57 | | | | 1.93 | | | | 2.63 | | | | 1.99 | |
| May 2011 | | | 2.82 | | | | 2.20 | | | | 2.95 | | | | 2.27 | |
| April 2011 | | | 3.46 | | | | 2.30 | | | | 3.60 | | | | 2.48 | |
| March 2011 | | | 3.47 | | | | 2.27 | | | | 3.55 | | | | 2.27 | |
| February 2011 | | | 3.31 | | | | 2.51 | | | | 3.38 | | | | 2.57 | |
| January 2011 | | | 2.95 | | | | 2.00 | | | | 2.95 | | | | 2.20 | |
| | | | | | | | | | | | |
| Fourth Quarter ended December 31, 2010 | | | 2.95 | | | | 1.10 | | | | 2.89 | | | | 1.10 | |
| Third Quarter ended September 30, 2010 | | | 1.30 | | | | 0.71 | | | | 1.27 | | | | 0.68 | |
| Second Quarter ended June 30, 2010 | | | 0.86 | | | | 0.66 | | | | 0.878 | | | | 0.63 | |
| First Quarter ended March 31, 2010 | | | 0.88 | | | | 0.67 | | | | 0.84 | | | | 0.64 | |
| | | | | | | | | | | | | | | | | |
| | | | | | | | | | | | |
| Fourth Quarter ended December 31, 2009 | | | 0.99 | | | | 0.57 | | | | 0.95 | | | | 0.52 | |
| Third Quarter ended September 30, 2009 | | | 0.71 | | | | 0.49 | | | | 0.69 | | | | 0.44 | |
| Second Quarter ended June 30, 2009 | | | 0.82 | | | | 0.38 | | | | 0.75 | | | | 0.30 | |
| First Quarter ended March 31, 2009 | | | 0.83 | | | | 0.50 | | | | 0.70 | | | | 0.50 | |
| | | | | | | | | | | | | | | | | |
| | | | | | | | | | | | |
| | | | | | | | | | | | | |
| 2010 | | | 2.95 | | | | 0.66 | | | | 2.89 | | | | 0.63 | |
2009 2008 2007 II | | | 0.99 1.78 2.75 | | | | 0.38 0.18 1.46 | | | | 0.95 1.79 2.42 | | | | 0..30 0.20 1.44 | |
| 2007 | | | 4.48 | | | | 1.50 | | | | 4.00 | | | | 1.32 | |
| | | TSX-V | | | OTCBB/AMEX* | |
| | | | | | | | | | | | |
| April 2012 | | | 2.07 | | | | 1.72 | | | | 2.07 | | | | 1.70 | |
| March 2012 | | | 2.40 | | | | 2.02 | | | | 2.45 | | | | 2.05 | |
| February 2012 | | | 2.25 | | | | 1.74 | | | | 2.27 | | | | 1.76 | |
| January 2012 | | | 1.87 | | | | 1.66 | | | | 1.86 | | | | 1.42 | |
| | | | | | | | | | | | |
| Fourth Quarter ended December 31, 2011 | | | 2.14 | | | | 1.42 | | | | 2.16 | | | | 1.39 | |
| Third Quarter ended September 30, 2011 | | | 2.90 | | | | 1.66 | | | | 2.94 | * | | | 1.61 | * |
| Second Quarter ended June 30, 2011 | | | 3.42 | | | | 2.04 | | | | 3.56 | | | | 2.02 | |
| First Quarter ended March 31, 2011 | | | 3.47 | | | | 2.23 | | | | 3.54 | | | | 2.26 | |
| | | | | | | | | | | | | | | | | |
| | | | | | | | | | | | |
| Fourth Quarter ended December 31, 2010 | | | 2.95 | | | | 1.10 | | | | 2.89 | | | | 1.10 | |
| Third Quarter ended September 30, 2010 | | | 1.30 | | | | 0.71 | | | | 1.27 | | | | 0.68 | |
| Second Quarter ended June 30, 2010 | | | 0.86 | | | | 0.66 | | | | 0.87 | | | | 0.63 | |
| First Quarter ended March 31, 2010 | | | 0.88 | | | | 0.67 | | | | 0.84 | | | | 0.64 | |
| | | | | | | | | | | | | | | | | | | | | | | | | | | | 2011 | | | 3.47 | | | | 1.42 | | | | 2.94 | * | | | 1.39 | * | | 2010 | | | 2.95 | | | | 0.66 | | | | 2.89 | | | | 0.63 | | | 2009 | | | 0.99 | | | | 0.38 0.18 | | | | 0.95 | | | | 0..30 | | | 2008 | | | 1.78 | | | | | | | | 1.79 | | | | 0.20 | | | 2007 II | | | 2.75 | | | | 1.46 | | | | 2.42 | | | | 1.44 | | | | | | | | | | | | | | | | | | | |
*The Company listed on the NYSE-AMEX on August 2, 2011 under the symbol “ASM”. B. | Plan of Distribution |
Not Applicable.
The common shares of the Company are listed on the TSX-V under the symbol “ASM”, on the FSEBerlin & Frankfurt Stock Exchange under the symbol “GV6” and quoted in the United Stateslisted on the OTCBB,NYSE-AMEX, under the symbol “ASGMF”“ASM”. The Company is currently inIn November 2006, the process of applying for aCompany’s listing of its common shares on the NYSE Amex. There is no guarantee thatTSX Venture Exchange was elevated to Tier 1 status. On August 2, 2011, the Company’s application will be successful.Company listed on the NYSE-AMEX.
Not Applicable.
Not Applicable.
Not Applicable.
Item 10. Additional Information
Not Applicable.
| B. | Memorandum and Articles of Association |
Common Shares
All issued and outstanding common shares are fully paid and non-assessable. Each holder of record of common shares is entitled to one vote for each common share so held on all matters requiring a vote of shareholders, including the election of directors. The holders of common shares will be entitled to dividends on a pro-rata basis, if and when as declared by the board of directors. There are no preferences, conversion rights, preemptive rights, subscription rights, or restrictions or transfers attached to the common shares. In the event of liquidation, dissolution, or winding up of the Company, the holders of common shares are entitled to participate in the assets of the Company available for distribution after satisfaction of the claims of creditors.
Powers and Duties of Directors
The directors shall manage or supervise the management of the affairs and business of the Company and shall have authority to exercise all such powers of the Company as are not, by the British Columbia Business Corporations Act or by the Memorandum or the Articles, required to be exercised by the Company in a general meeting.
Directors will serve as such until the next annual meeting. In general, a director who is, in any way, directly or indirectly interested in an existing or proposed contract or transaction with the Company whereby a duty or interest might be created to conflict with his duty or interest as a director, shall declare the nature and extent of his interest in such contract or transaction or the conflict or potential conflict with his duty and interest as a director. Such director shall not vote in respect of any such contract or transaction with the Company in which he is interested and if he shall do so, his vote shall note be counted, but he shall be counted in the quorum present at the meeting at which such vote is taken. However, notwithstanding the foregoing, directors shall have the right to vote on determining the remuneration of the directors.
The directors may from time to time on behalf of the Company: (a) borrow money in such manner and amount from such sources and upon such terms and conditions as they think fit; (b) issue bonds, debentures and other debt obligations; and (c) mortgage, charge or give other security on the whole or any part of the property and assets of the Company.
The directors of the Company must be persons of the full age of 18 years. There is no minimum share ownership to be a Director. No person shall be a director of the Company who is not capable of managing their own affairs; is an undischarged bankrupt; convicted of an offense in connection with the promotion, formation or management of a corporation or involved in fraud within the last five years; or a person that has had a registration in any capacity under the British Columbia Securities Act or the British Columbia Mortgage Brokers Act canceled within the last five years.
Shareholders
An annual general meeting shall be held once in every calendar year at such time and place as may be determined by the directors. A quorum at an annual general meeting and special meeting shall be two shareholders or one or more proxy holders representing two shareholders, or one shareholder and a proxy holder representing another shareholder. There is no limitation imposed by the laws of Canada or by the charter or other constituent documents of the Company on the right of a non-resident to hold or vote the common shares, other than as provided in the Investment Canada Act, referred to as the “Investment Act”, discussed below under “Item 10. Additional Information, D. Exchange Controls.”
In accordance with British Columbia law, directors shall be elected by an “ordinary resolution” which means: (a) a resolution passed by the shareholders of the Company at a general meeting by a simple majority of the votes cast in person or by proxy; or (b) a resolution that has been submitted to the shareholders of the Company who would have been entitled to vote on it in person or by proxy at a general meeting of the Company and that has been consented to in writing by such shareholders of the Company holding shares carrying not less than the requisite majority of the votes entitled to be cast on it.
Under British Columbia law certain items such as an amendment to the Company’s articles or entering into a merger requires approval by a special resolution which means: (a) a resolution passed by a majority of not less than the requisite majority of the votes cast by the shareholders of the Company who, being entitled to do so, vote in person or by proxy at a general meeting of the company; or (b) a resolution consented to in writing by every shareholder of the Company who would have been entitled to vote in person or by proxy at a general meeting of the Company, and a resolution so consented to is deemed to be a special resolution passed at a general meeting of the Company.
The Company has a commitment related to the exploration of its mineral properties in Durango, Mexico, from an agreement signed in January 2011 that requires drilling a minimum of 4,000 meters.
In February 2011, the Company entered into a lease agreement for office space for its Canadian operations. The term of the lease is for five years, commencing in April 2011, with a five year renewal option.
In March 2011, the Company entered into an agreement with Wardrop Engineering to provide a tailings study and review of the San Gonzalo project. The total estimated cost is approximately $190,000. At December 31, 2011 the majority of this work had been completed.
Please refer to Note 1315 of the financial statements included elsewhere in this Annual Report (Item 17) for further disclosure regarding material commitments.
Canada has no system of exchange controls. There are no Canadian restrictions on the repatriation of capital or earnings of a Canadian public company to non-resident investors. There are no laws in Canada or exchange restrictions affecting the remittance of dividends, profits, interest, royalties and other payments to non-resident holders of the Issuer’s securities, except as discussed below under “Item 10. Additional Information, E. Taxation.”
There are no limitations under the laws of Canada or in the organizing documents of the Company on the right of foreigners to hold or vote securities of the Company, except that the Investment Canada Act may require review and approval by the Minister of Industry (Canada) of certain acquisitions of “control” of the Company by a “non-Canadian”. The threshold for acquisitions of control is generally defined as being one-third or more of the voting shares of the Company. “Non-Canadian” generally means an individual who is not a Canadian citizen, or a corporation, partnership, trust or joint venture that is ultimately controlled by non-Canadians.
Canadian Federal Income Tax Consequences
The following summarizes the principal Canadian federal income tax consequences applicable to the holding and disposition of common shares in the capital of the Company by a United States resident, and who holds common shares solely as capital property, referred to as a “U.S. Holder”. This summary is based on the current provisions of the Income Tax Act (Canada), referred to as the “Tax Act”, the regulations thereunder, all amendments thereto publicly proposed by the government of Canada, the published administrative practices of Revenue Canada, Customs, Excise and Taxation, and the current provisions of the Canada-United States Income Tax Convention, 1980, as amended, referred to as the “Treaty”. Except as otherwise expressly provided, this summary does not take into account any provincial, territorial or foreign (including without limitation, any United States) tax law or treaty. It has been assumed that all currently proposed amendments will be enacted substantially as proposed and that there is no other relevant change in any governing law or practice, although no assurance can be given in these respects.
Each U.S. Holder is advised to obtain tax and legal advice applicable to such U.S. Holder’s particular circumstances.
Every U.S. Holder is liable to pay a Canadian withholding tax on every dividend that is or is deemed to be paid or credited to the U.S. Holder on the U.S. Holder’s common shares. The statutory rate of withholding tax is 25% of the gross amount of the dividend paid. The Treaty reduces the statutory rate with respect to dividends paid to a U.S. Holder for the purposes of the Treaty. Where applicable, the general rate of withholding tax under the Treaty is 15% of the gross amount of the dividend, but if the U.S. Holder is a company that owns at least 10% of the voting stock of the Company and beneficially owns the dividend, the rate of withholding tax is 5% for dividends paid or credited after 1996 to such corporate U.S. Holder. The Company is required to withhold the applicable tax from the dividend payable to the U.S. Holder, and to remit the tax to the Receiver General of Canada for the account of the U.S. Holder.
Pursuant to the Tax Act, a U.S. Holder will not be subject to Canadian capital gains tax on any capital gain realized on an actual or deemed disposition of a common share, including a deemed disposition on death, provided that the U.S. Holder did not hold the common share as capital property used in carrying on a business in Canada, and that neither the U.S. Holder nor persons with whom the U.S. Holder did not deal at arms length (alone or together) owned or had the right or an option to acquire 25% or more of the issued shares of any class of the Company at any time in the five years immediately preceding the disposition.
United States Federal Income Tax Consequences
Passive Foreign Investment Company
The Company believes that it is a passive foreign investment company, referred to as a “PFIC” for United States federal income tax purposes with respect to a United States Investor. The Company will be a PFIC with respect to a United States Investor if, for any taxable year in which such United States Investor held the Company’s shares, either (i) at least 75 % of the gross income of the Company for the taxable year is passive income, or (ii) at least 50% of the Company’s assets are attributable to assets that produce or are held for the production of passive income. In each case, the Company must take into account a pro-rata share of the income and the assets of any company in which the Company owns, directly or indirectly, 25% or more of the stock by value (the “look-through” rules). Passive income generally includes dividends, interest, royalties, rents (other than rents and royalties derived from the active conduct of a trade or business and not derived from a related person), annuities and gains from assets that produce passive income. As a publicly traded corporation, the Company would apply the 50% asset test based on the value of the Company’s assets.
Because the Company believes it qualifies as a PFIC, unless a United States Investor who owns shares in the Company (i) elects (a section 1295 election) to have the Company treated as a “qualified electing fund”, referred to as a “QEF” (described below), or (ii) marks the stock to market (described below), the following rules apply:
| | 1. | Distributions made by the Company during a taxable year to a United States Investor who owns shares in the Company that are an “excess distribution” (defined generally as the excess of the amount received with respect to the shares in any taxable year over 125% of the average received in the shorter of either the three previous years or such United States Investor’s holding period before the taxable year) must be allocated ratably to each day of such shareholder’s holding period. The amount allocated to the current taxable year and to years when the corporation was not a PFIC must be included as ordinary income in the shareholder’s gross income for the year of distribution. The remainder is not included in gross income but the shareholder must pay a deferred tax on that portion. The deferred tax amount, in general, is the amount of tax that would have been owed if the allocated amount had been included in income in the earlier year, plus interest. The interest charge is at the rate applicable to deficiencies in income taxes. |
| | 2. | The entire amount of any gain realized upon the sale or other disposition of the shares will be treated as an excess distribution made in the year of sale or other disposition and as a consequence will be treated as ordinary income and, to the extent allocated to years prior to the year of sale or disposition, will be subject to the interest charge described above. |
A shareholder that makes a section 1295 election will be currently taxable on his or her pro-rata share of the Company’s ordinary earnings and net capital gain (at ordinary income and capital gain rates, respectively) for each taxable year of the Company, regardless of whether or not distributions were received. The shareholder’s basis in his or her shares will be increased to reflect taxed but undistributed income. Distributions of income that had previously been taxed will result in a corresponding reduction of basis in the shares and will not be taxed again as a distribution to the shareholder.
A shareholder may make a section 1295 election with respect to a PFIC for any taxable year of the shareholder (shareholder’s election year). A section 1295 election is effective for the shareholder’s election year and all subsequent taxable years of the shareholder. Procedures exist for both retroactive elections and filing of protective statements. Once a section 1295 election is made it remains in effect, although not applicable, during those years that the Company is not a PFIC. Therefore, if the Company re-qualifies as a PFIC, the section 1295 election previously made is still valid and the shareholder is required to satisfy the requirements of that election. Once a shareholder makes a section 1295 election, the shareholder may revoke the election only with the consent of the Commissioner.
If the shareholder makes the section 1295 election for the first tax year of the Company as a PFIC that is included in the shareholder’s holding period, the PFIC qualifies as a pedigreed QEF with respect to the shareholder. If a QEF is an unpedigreed QEF with respect to the shareholder, the shareholder is subject to both the non-QEF and QEF regimes. Certain elections are available which enable shareholders to convert an unpedigreed QEF into a pedigreed QEF thereby avoiding such dual application.
A shareholder making the section 1295 election must make the election on or before the due date, as extended, for filing the shareholder’s income tax return for the first taxable year to which the election will apply. A shareholder must make a section 1295 election by completing Form 8621, attaching said Form to its federal income tax return, and reflecting in the Form the information provided in the PFIC Annual Information Statement, or if the shareholder calculated the financial information, a statement to that effect. The PFIC Annual Information Statement must include the shareholder’s pro-rata shares of the ordinary earnings and net capital gain of the PFIC for the PFIC’s taxable year or information that will enable the shareholder to calculate its pro-rata shares. In addition, the PFIC Annual Information Statement must contain information about distributions to shareholders and a statement that the PFIC will permit the shareholder to inspect and copy its permanent books of account, records, and other documents of the PFIC necessary to determine that the ordinary earnings and net capital gain of the PFIC have been calculated according to federal income tax accounting principles. A shareholder may also obtain the books, records and other documents of the foreign corporation necessary for the shareholder to determine the correct earnings and profits and net capital gain of the PFIC according to federal income tax principles and calculate the shareholder’s pro-rata shares of the PFIC’s ordinary earnings and net capital gain. In that case, the PFIC must include a statement in its PFIC Annual Information Statement that it has permitted the shareholder to examine the PFIC’s books of account, records, and other documents necessary for the shareholder to calculate the amounts of ordinary earnings and net capital gain. A shareholder that makes a Section 1295 election with respect to a PFIC held directly or indirectly for each taxable year to which the Section 1295 election applies must comply with the foregoing submissions.
Because the Company’s stock is “marketable” under section 1296(e), a United States Investor may elect to mark the stock to market each year. In general, a PFIC shareholder who elects under section 1296 to mark the marketable stock of a PFIC includes in income each year an amount equal to the excess, if any, of the fair market value of the PFIC stock as of the close of the taxable year over the shareholder’s adjusted basis in such stock. A shareholder is also generally allowed a deduction for the excess, if any, of the adjusted basis of the PFIC stock over the fair market value as of the close of the taxable year. Deductions under this rule, however, are allowable only to the extent of any net mark to market gains with respect to the stock included by the shareholder for prior taxable years. While the interest charge regime under the PFIC rules generally does not apply to distributions from and dispositions of stock of a PFIC where the United States Investor has marked to market, coordination rules for limited application will apply in the case of a United States Investor that marks to market PFIC stock later than the beginning of the shareholder’s holding period for the PFIC stock.
Special rules apply with respect to the calculation of the amount of the foreign tax credit with respect to excess distributions by a PFIC or inclusions under a QEF.
Controlled Foreign Corporations
Sections 951 through 964 and Section 1248 of the Internal Revenue Code, referred to as the “Code”, relate to controlled foreign corporations, referred to as “CFCs”. A foreign corporation that qualifies as a CFC will not be treated as a PFIC with respect to a shareholder during the portion of the shareholder’s holding period after December 31, 1997, during which the shareholder is a 10% United States shareholder and the corporation is a CFC. The PFIC provisions continue to apply in the case of a PFIC that is also a CFC with respect to shareholders that are less than 10% United States shareholders.
The 10% United States shareholders of a CFC are subject to current United States tax on their pro-rata shares of certain income of the CFC and their pro-rata shares of the CFC’s earnings invested in certain United States property. The effect is that the CFC provisions may impute some portion of such a corporation’s undistributed income to certain shareholders on a current basis and convert into dividend income some portion of gains on dispositions of stock, which would otherwise qualify for capital gains treatment.
The Company does not believe that it will be a CFC. It is possible that the Company could become a CFC in the future. Even if the Company were classified as a CFC in a future year, however, the CFC rules referred to above would apply only with respect to 10% shareholders.
Personal Holding Company/Foreign Personal Holding Company/Foreign Investment Company
A corporation will be classified as a personal holding company, or a “PHC”, if at any time during the last half of a tax year (i) five or fewer individuals (without regard to their citizenship or residence) directly or indirectly or by attribution own more than 50% in value of the corporation’s stock and (ii) at least 60% of its ordinary gross income, as specially adjusted, consists of personal holding company income (defined generally to include dividends, interest, royalties, rents and certain other types of passive income). A PHC is subject to a United States federal income tax of 39.6% on its undistributed personal holding company income (generally limited, in the case of a foreign corporation, to United States source income).
A corporation will be classified as a foreign personal holding company, or an “FPHC”, and not a PHC if at any time during a tax year (i) five or fewer individual United States citizens or residents directly or indirectly or by attribution own more than 50% of the total combined voting power or value of the corporation’s stock and (ii) at least 60% of its gross income consists of foreign personal holding company income (defined generally to include dividends, interest, royalties, rents and certain other types of passive income). Each United States shareholder in a FPHC is required to include in gross income, as a dividend, an allocable share of the FPHC’s undistributed foreign personal holding company income (generally the taxable income of the FPHC, as specially adjusted).
A corporation will be classified as a foreign investment company, or an “FIC”, if for any taxable year it: (i) is registered under the Investment Company Act of 1940, as amended, as a management company or share investment trust or is engaged primarily in the business of investing or trading in securities or commodities (or any interest therein); and (ii) 50% or more of the value or the total combined voting power of all the corporation’s stock is owned directly or indirectly (including stock owned through the application of attribution rules) by United States persons. In general, unless an FIC elects to distribute 90% or more of its taxable income (determined under United States tax principles as specially adjusted) to its shareholders, gain on the sale or exchange of FIC stock is treated as ordinary income (rather than capital gain) to the extent of such shareholder’s ratable share of the corporation’s earnings and profits for the period during which such stock was held.
The Company believes that it is not and will not be a PHC, FPHC or FIC. However, no assurance can be given as to the Company’s future status.
United States Information Reporting and Backup Withholding
Dividends are generally subject to the information reporting requirements of the Code. Dividends may be subject to backup withholding at the rate of 31% unless the holder provides a taxpayer identification number on a properly completed Form W-9 or otherwise establishes an exemption.
The amount of any backup withholding will not constitute additional tax and will be allowed as a credit against the United States Investor’s federal income tax liability.
Filing of Information Returns
Under a number of circumstances, a United States Investor acquiring shares of the Company may be required to file an information return. In particular, any United States Investor who becomes the owner, directly or indirectly, of 10% or more of the shares of the Company will be required to file such a return. Other filing requirements may apply and United States Investors should consult their own tax advisors concerning these requirements.
F. | Dividends and Paying Agents |
Not Applicable.
Not Applicable.
The Company files annual reports and furnishes other information with the SEC. You may read and copy any document that we file at the SEC’s Public Reference Room at 450 Fifth Street, N.W., Room 1024, Washington, D.C. 20549 or by accessing the Commission’s website (http://www.sec.gov). The Company also files its annual reports and other information with the Canadian Securities Administrators via SEDAR (www.sedar.com).
Copies of the Company’s material contracts are kept in the Company’s administrative headquarters.
| I. | Subsidiary Information |
None.
Item 11. Quantitative and Qualitative Disclosures about Market Risk
The Audit Committee of our board of directors regularly reviews foreign exchange and interest rates. Our policy prohibits the use of financial instruments for speculative purposes. See Note 16 in our annual audited consolidated Financial Statements contained in this annual report on Form 20-F for quantitative and qualitative disclosure of market risk.
Not Applicable.
Item 12. Description of Securities Other than Equity Securities
Not Applicable.
Part II
Item 13. Defaults, Dividend Arrearages and Delinquencies
None.
Item 14. Material Modifications to the Rights of Security Holders and Use of Proceeds
None.
Item 15. Controls and Procedures
Disclosure Controls and Procedures
As required by paragraph (b) of Rules 13a-15 or 15d-15 under the Exchange Act, our principal executive officer and principal financial officer evaluated our company’s disclosure controls and procedures (as defined in rules 13a-15(e) and 15d-15(e) of the Exchange Act) as of the end of the period covered by this annual report on Form 20-F. Based on the evaluation, these officers concluded that as of the end of the period covered by this Annual Report on Form 20-F, our disclosure controls and procedures were not effective to ensure that the information required to be disclosed by our company in reports it files or submits under the Exchange Act is recorded, processed, summarized and reported within the time period specified in the rules and forms of the Securities and Exchange Commission. These disclosure controls and procedures include controls and procedures designed to ensure that such information is accumulated and communicated to our company’s management, including our company’s principal executive officer and principal financial officer, to allow timely decisions regarding required disclosure. The conclusion that our disclosure controls and procedures were not effective was due to the presence of material weaknesses in internal control over financial reporting as identified below under the heading “Management’s Report on Internal Control Over Financial Reporting.”
Management anticipates that such disclosure controls and procedures will not be effective until the material weaknesses are remediated. Our company intends to remediate the material weaknesses as set out below.
Because of the inherent limitations in all control systems, no evaluation of controls can provide absolute assurance that all control issues, if any, within our company have been detected.
Management’s Report on Internal Control Over Financial Reporting
Our company’s management is responsible for establishing and maintaining adequate internal control over financial reporting (as defined in Rules 13a-15(f) and 15d-15(f) of the Exchange Act) for our company. Our company’s internal control over financial reporting is designed to provide reasonable assurance, not absolute assurance, regarding the reliability of financial reporting and the preparation of financial statements for external purposes in accordance with Canadian generally accepted accounting principles. Internal control over financial reporting includes those policies and procedures that: (i) pertain to the maintenance of records that, in reasonable detail, accurately and fairly reflect the transactions and dispositions of our company’s assets; (ii) provide reasonable assurance that transactions are recorded as necessary to permit preparation of financial statements in accordance with Canadian generally accepted accounting principles, and that our company’s receipts and expenditures are being made only in accordance with authorizations of our management and directors; and (iii) provide reasonable assurance regarding prevention or timely detection of unauthorized acquisition, use or disposition of assets that could have a material effect on our financial statements.
Because of its inherent limitations, internal control over financial reporting may not prevent or detect misstatements. In addition, projections of any evaluation of effectiveness to future periods are subject to the risk that controls may become inadequate because of changes in conditions and that the degree of compliance with the policies or procedures may deteriorate.
Our management, including our principal executive officer and principal financial officer, along with an independent consultant, conducted an evaluation of the design and operation of our internal control over financial reporting as of December 31, 20102011 based on the criteria set forth in Internal Control – Integrated Framework issued by the Committee of Sponsoring Organizations of the Treadway Commission. This evaluation included review of the documentation of controls, evaluation of the design effectiveness of controls, testing of the operating effectiveness of controls and a conclusion on this evaluation. Based on this evaluation, our management concluded our internal control over financial reporting was not effective as at December 31, 20102011 due to the following material weaknesses: (i) inadequate segregation of duties and effective risk assessment; (ii) insufficient written policies and procedures for accounting, financial reporting and corporate governance; and (iii) insufficient disaster recovery plans.
Our company has taken steps to enhance and improve the design of our internal controls over financial reporting, however these steps were not complete as of December 31, 2010.2011. During the period covered by this annual report on Form 20-F, we have not been able to remediate the material weaknesses identified above. To remediate such weaknesses, we plan to implement the following changes during our fiscal year ending December 31, 2011: (i) address inadequate segregation of duties and ineffective risk management; (ii) adopt sufficient written policies and procedures for accounting, financial reporting and corporate governance; and (iii) implement a disaster recovery plan.
This annual report does not include an attestation report of the Company’s independent registered public accounting firm regarding internal control over financial reporting. Management’s report was not subject to attestation by the Company’s independent registered public accounting firm pursuant to the rules of the Securities and Exchange Commission that permit us to provide only management’s report in this annual report.
Because of the inherent limitations in all control systems, no evaluation of controls can provide absolute assurance that all control issues, if any, within our company have been detected. These inherent limitations include the realities that judgments in decision-making can be faulty and that breakdowns can occur because of simple error or mistake.
Changes in Internal Control Over Financial Reporting
There wereDuring the period covered by this annual report, there have been no changes in internal control over financial reporting in the year ended December 31, 2010. However, as a result of the evaluation of our internal control over financial reporting asthat have materially affected, or are reasonably likely to materially affect, our internal control over financial reporting. However, with the transition to IFRS on January 1, 2011, additional internal controls over financial reporting were developed and implemented to ensure completeness over the identification of December 31, 2010, conducted by our principal executive officer, principal financial officer and an independent consultant, we expect to make such changes in the year ended December 31, 2011.all IFRS differences.
Item 16A. Audit Committee Financial Expert
The Board determined that Mr. Gary Robertson is qualified as an Audit Committee Financial Expert. Mr. Robertson is independent as determined by the NASDAQ listing rules.
The Company has not currently adopted a codeCode of ethics but is evaluating its internal proceduresEthics (“Code”) that applies to determineall directors, officers and employees of the necessity of same. In the event that it is determined a code of ethics is necessary, an appropriate code will be implemented.Company.
This Code covers a wide range of financial and non-financial business practices and procedures. This Code does not cover every issue that may arise, but it sets out basic principles to guide all Executive and Staff of the Company. If a law or regulation conflicts with a policy in this Code, then personnel must comply with the law or regulation. If any person has any questions about this Code or potential conflicts with a law or regulation, they should contact the Company's Board of Directors or Audit Committee.
All Executive and Staff should recognize that they hold an important role in the overall corporate governance and ethical standards of the Company. Each person is capable and empowered to ensure that the Company's, its shareholders' and other stakeholders' interests are appropriately balanced, protected and preserved. Accordingly, this Code provides principles to which all personnel are expected to adhere and advocate. The Code embodies rules regarding individual and peer responsibilities, as well as responsibilities to the Company, the shareholders, other stakeholders, and the public generally.
A copy of the Code is available at the Company’s website at www.avino.com.
Item 16C. Principal Accountant Fees and Services
The independent auditor for the years ended December 31, 2010,2011, December 31, 20092010 and December 31, 20082009 was Manning Elliott LLP.
Audit Fees
The aggregate fees billed by Manning Elliott LLP for professional services rendered for the audit of the Company’s year ended December 31, 20102011 were $59,000 (2009: $69,000; 2008: $64,500)$75,000 (2010: $59,000; 2009: $69,000).
Audit-Related Fees
The audit-related fees billed by Manning Elliott LLP for the year ended December 31, 20102011 were $4,000 (2009:$5,000 (2010: $4,000; 2008: $2,880)2009: $4,000).
Tax Fees
The tax fees billed by Manning Elliott LLP for the year ended December 31, 20102011 are estimated to be $3,500 (2009:(2010: $3,500; 2008: $3,200)2009: $3,500).
All Other Fees
The aggregate fees billed by Manning Elliott LLP for advisory and review services relating to the Company’s annual report on Form 20-F for the year ended December 31, 20102011 are estimated to be $5,000 (2009$4,000 (2010 $5,000; 2008:2009: $5,000).
The Audit Committee approved 100% of the fees paid to the principal accountant for audit-related, tax and other fees in the fiscal year 2010.2011. The Audit Committee pre-approves all non-audit services to be performed by the auditor in accordance with the Audit Committee Charter. There were no hours expended on the principal accountant’s engagement to audit the Company’s financial statements for the most recent fiscal year that were attributed to work performed by persons other than the principal accountant’s full-time, permanent employees.
Item 16D. Exemptions from the Listing Standards for Audit Committees
Not applicable.
Item 16E. Purchases of Equity Securities by the Issuer and Affiliated Purchasers
None.
Item 16F. Changes in Registrants Certifying Accountant
None.
Item 16G. Corporate Governance
The Company has adopted a Code of Ethical Conduct that applies to all directors, officers and employees. The Company has also established Audit Committee, Governance & Nominating Committee and Compensation Committee. Please refer to “Committee” under “Board Practice” in this Form 20F. The charters of these Committees are available at the Company’s website at www.avino.com under Corporate Governance.
Item 16H. Mine Safety Disclosure
Not applicable.Under Section 1503(a) of the Dodd-Frank Wall Street Reform and Consumer Protection Act and under the SEC's recently adopted Item 104 of Regulation S-K, each operator of a coal or other mine is required to include disclosures regarding certain mine safety results in its periodic reports filed with the SEC. The operation of the our quarries is subject to regulation by the federal Mine Safety and Health Administration (MSHA) under the Federal Mine Safety and Health Act of 1977. We do not own any mines in the United States and as a result, this information is not required.
Part III
Item 17. Financial Statements
The following financial statements pertaining to the Company are filed as part of this Annual Report: | 75 |
| |
Audit Report of Independent Registered Public Accounting Firm | 76 |
| |
Consolidated Balance Sheets as at December 31, 2010 and December 31, 2009 | 77 |
| |
Consolidated Statements of Operations and Comprehensive Loss for the years ended December 31, 2010, 2009 and 2008 | 78 |
| |
Consolidated Statements of Shareholders’ Equity for the years ended December 31, 2010, 2009 and 2008 | 79 |
| |
Consolidated Statements of Cash Flows for the years ended December 31, 2010, 2009 and 2008 | 80 |
| |
Notes to the Consolidated Financial Statements for the years ended December 31, 2010, 2009 and 2008 70 thru | 81 |
The following financial statements pertaining to the Company are filed as part of this Annual Report:
Managements Responsibility for Financial Reporting..........72
Audit Report of Independent Registered Public Accounting Firm..........73
Consolidated Statements of Financial Position as at December 31, 2011, December 31, 2010, and January 1, 2010..........74
Consolidated Statements of Operations and Comprehensive Loss for the years ended December 31, 2011, and 2010..........75
Consolidated Statements of Changes in Equity for the years ended December 31, 2011 and 2010..........76
Consolidated Statements of Cash Flows for the years ended December 31, 2011, and 2010..........77
Notes to the Consolidated Financial Statements..........78 thru 107
Item 18. Financial Statements
See Item 17.
Item 19. | Item 19. Exhibits |
| Exhibit Number | | Name |
| | | |
| 1.1 | | Memorandum of Avino Silver & Gold Mines Ltd.* |
| 1.2 | | Articles of Avino Silver & Gold Mines Ltd.* |
| 4.1 | | Share Purchase Agreement dated March 22, 2004* |
| 8.1 | | List of Subsidiaries |
| 12.1 | | Certification of the Principal Executive Officer |
| 12.2 | | Certification of the Principal Financial Officer |
| 13.1 | | Certificate under the Sarbanes-Oxley Act of the Principal Executive Officer |
| 13.2 | | Certificate under the Sarbanes-Oxley Act of the Principal Financial Officer |
| 13.3 | | Consent of Expert |
___________________________
* Previously filed.

AVINO SILVER & GOLD MINES LTD.
Consolidated Financial Statements
For the years ended December 31, 2011 and 2010 December 31, 2009 and
December 31, 2008
The consolidated financial statements of Avino Silver & Gold Mines Ltd. (the “Company”) are the responsibility of the Company’s management. The financial statements are prepared in accordance with International Accounting Standards Board and reflect management’s best estimates and judgment based on information currently available.
Management has developed and is maintaining a system of internal controls to ensure that the Company’s assets are safeguarded, transactions are authorized and properly recorded and financial information is reliable.
The Board of Directors is responsible for ensuring management fulfills its responsibilities. The Audit Committee reviews the results of the audit and the annual financial statements prior to their submission to the Board of Directors for approval.
The consolidated financial statements as at December 31, 2011 and 2010 and for the years then ended have been audited by Manning Elliott LLP, Chartered Accountants, and their report outlines the scope of their examination and gives their opinion on the consolidated financial statements.
REPORT OF INDEPENDENT REGISTERED PUBLIC ACCOUNTING FIRM“David Wolfin” David Wolfin President & CEO April 30, 2012 | “Malcolm Davidson” Malcolm Davidson Chief Financial Officer April 30, 2012 |
REPORT OF INDEPENDENT REGISTERED PUBLIC ACCOUNTING FIRM
To the Shareholders of
Avino Silver & Gold Mines Ltd.
We have audited the accompanying consolidated financial statements of Avino Silver & Gold Mines Ltd. which comprise the consolidated balance sheetsstatements of financial position as at December 31, 2011, December 31, 2010 and 2009,January 1, 2010, and the consolidated statements of operations, comprehensive loss, shareholders’changes in equity and cash flows for the years ended December 31, 2010, 20092011 and 2008,2010, and the related notes comprising a summary of significant accounting policies and other explanatory information.
Management’s Responsibility for the Consolidated Financial Statements
Management is responsible for the preparation and fair presentation of these consolidated financial statements in accordance with Canadian generally accepted accounting principles,International Financial Reporting Standards as issued by the International Accounting Standards Board, and for such internal control as management determines is necessary to enable the preparation of consolidated financial statements that are free from material misstatement, whether due to fraud or error.
Auditors’ Responsibility
Our responsibility is to express an opinion on these consolidated financial statements based on our audits. We conducted our audits in accordance with Canadian generally accepted auditing standards and the standards of the Public Company Accounting Oversight Board (United States). Those standards require that we comply with ethical requirements and plan and perform the audit to obtain reasonable assurance about whether the consolidated financial statements are free from material misstatement.
An audit involves performing procedures to obtain audit evidence about the amounts and disclosures in the consolidated financial statements. The procedures selected depend on our judgment, including the assessment of the risks of material misstatement of the consolidated financial statements, whether due to fraud or error. In making those risk assessments, we consider internal control relevant to the Company’s preparation and fair presentation of the consolidated financial statements in order to design audit procedures that are appropriate in the circumstances, but not for the purpose of expressing an opinion on the effectiveness of the Company’s internal control. The Company is not required to have, nor were we engaged to perform, an audit of the Company’s internal control over financial reporting; accordingly we express no such opinion. An audit also includes evaluating the appropriateness of accounting policies used and the reasonableness of accounting estimates made by management, as well as evaluating the overall presentation of the consolidated financial statements.
We believe that the audit evidence we have obtained in our audits is sufficient and appropriate to provide a basis for our audit opinion.
Opinion
In our opinion, the consolidated financial statements present fairly, in all material respects, the financial position of Avino Silver & Gold Mines Ltd. as at December 31, 2011 and December 31, 2010, and 2009,January 1, 2010, and the results of its operations and its cash flows for the years ended December 31, 2010, 20092011 and 20082010 in accordance with Canadian generally accepted accounting principles.International Financial Reporting Standards as issued by the International Accounting Standards Board.
/s/ “Manning Elliott LLP”LLP“
CHARTERED ACCOUNTANTS
Vancouver, British Columbia
April 29, 201130, 2012
AVINO SILVER & GOLD MINES LTD.
Consolidated Statements of Financial Position
(Expressed in Canadian dollars)
| | | Note | | | December 31, 2011 | | | December 31, 2010 | | | January 1, 2010 | |
| | | | | | | | | (Note 20) | | | (Note 20) | |
| ASSETS | | | | | | | | | | | | |
| Current assets | | | | | | | | | | | | |
| Cash and cash equivalents | | | | | $ | 5,282,464 | | | $ | 9,051,848 | | | $ | 2,830,093 | |
| Interest receivable | | | | | | 53,643 | | | | 4,142 | | | | 146 | |
| Sales taxes recoverable | | | 6 | | | | 228,820 | | | | 233,688 | | | | 89,077 | |
| Amounts receivable | | | | | | | 876,946 | | | | 118,108 | | | | - | |
| Prepaid expenses and other assets | | | | | | | 86,265 | | | | 30,490 | | | | 49,800 | |
| | | | | | | | 6,528,138 | | | | 9,438,276 | | | | 2,969,116 | |
| | | | | | | | | | | | | | | | | |
| Mineral Properties and Exploration Costs | | | 7 | | | | 16,274,354 | | | | 14,894,843 | | | | 14,416,841 | |
| Property, Plant and Equipment | | | 8 | | | | 3,023,969 | | | | 1,722,538 | | | | 1,424,971 | |
| Investment in Related Companies | | | 9 | | | | 304,394 | | | | 517,360 | | | | 204,036 | |
| Reclamation Bonds | | | | | | | 5,500 | | | | 5,500 | | | | 5,500 | |
| | | | | | | $ | 26,136,355 | | | $ | 26,578,517 | | | $ | 19,020,464 | |
| | | | | | | | | | | | | | | | | |
| LIABILITIES | | | | | | | | | | | | | | | | |
| Current liabilities | | | | | | | | | | | | | | | | |
| Accounts payable and accrued liabilities | | | | | | $ | 600,977 | | | $ | 474,605 | | | $ | 383,693 | |
| Amounts due to related parties | | | 13b | | | | 203,763 | | | | 169,265 | | | | 164,690 | |
| | | | | | | | 804,740 | | | | 643,870 | | | | 548,383 | |
| | | | | | | | | | | | | | | | | |
| Reclamation Provision | | | 10 | | | | 292,000 | | | | - | | | | - | |
| Deferred Tax Liability | | | 19 | | | | 2,105,356 | | | | 2,018,857 | | | | 1,991,180 | |
| Total liabilities | | | | | | | 3,202,096 | | | | 2,662,727 | | | | 2,539,563 | |
| | | | | | | | | | | | | | | | | |
| EQUITY | | | | | | | | | | | | | | | | |
| Share Capital | | | 11 | | | | 41,720,083 | | | | 39,193,299 | | | | 33,173,022 | |
| Equity Reserves | | | | | | | 9,898,186 | | | | 9,508,838 | | | | 7,349,978 | |
| Treasury Shares (14,180 Shares, at cost) | | | | | | | (101,869 | ) | | | (101,869 | ) | | | (101,869 | ) |
| Accumulated Other Comprehensive Loss | | | | | | | (262,400 | ) | | | (345,089 | ) | | | - | |
| Accumulated Deficit | | | | | | | (28,319,741 | ) | | | (24,339,389 | ) | | | (23,940,230 | ) |
| Total Equity | | | | | | | 22,934,259 | | | | 23,915,790 | | | | 16,480,901 | |
| | | | | | | $ | 26,136,355 | | | $ | 26,578,517 | | | $ | 19,020,464 | |
Subsequent Events – Note 21
Approved by the Board of Directors on April 30, 2012:
| /s/ Gary Robertson | Director | /s/ David Wolfin | Director |
The accompanying notes are an integral part of the consolidated financial statements
AVINO SILVER & GOLD MINES LTD.
Consolidated Balance Sheets
As atFor the years ended December 31, 20102011 and 20092010
Consolidated Statements of Operations and Comprehensive Loss
(Expressed in Canadian dollars)
| | | 2010 | | | 2009 | |
| | | | | | | |
| ASSETS | | | | | | |
| Current | | | | | | |
| Cash and cash equivalents | | $ | 9,051,456 | | | $ | 2,829,605 | |
| Interest receivable | | | 4,142 | | | | 146 | |
| Sales taxes recoverable (Note 8) | | | 233,378 | | | | 88,725 | |
| Amounts receivable (Note 6) | | | 117,940 | | | | - | |
| Prepaid expenses and other assets | | | 30,463 | | | | 49,614 | |
| | | | 9,437,379 | | | | 2,968,090 | |
| | | | | | | | | |
| Property, Plant & Equipment (Note 5) | | | 1,786,017 | | | | 1,455,146 | |
| Reclamation Bonds | | | 5,500 | | | | 5,500 | |
| Mineral Properties (Note 6) | | | 15,302,311 | | | | 14,573,506 | |
| Investments in Related Companies (Note 7) | | | 517,360 | | | | 204,036 | |
| | | $ | 27,048,567 | | | $ | 19,206,278 | |
| | | | | | | | | |
| LIABILITIES | | | | | | | | |
| Current | | | | | | | | |
| Accounts payable and accrued liabilities | | $ | 474,072 | | | $ | 382,482 | |
| Amounts due to related parties (Note 11(a)) | | | 169,265 | | | | 164,690 | |
| | | | 643,337 | | | | 547,172 | |
| | | | | | | | | |
| Future Income Tax Liability (Note 16) | | | 2,026,148 | | | | 1,694,007 | |
| | | | 2,669,485 | | | | 2,241,179 | |
| SHAREHOLDERS' EQUITY | | | | | | | | |
| Share Capital (Note 9) | | | 39,132,349 | | | | 33,112,072 | |
| Contributed Surplus | | | 10,702,206 | | | | 8,131,629 | |
| Treasury Shares (14,180 Shares, at cost) | | | (101,869 | ) | | | (101,869 | ) |
| | | | 49,732,686 | | | | 41,141,832 | |
| | | | | | | | | |
| Accumulated Other Comprehensive Loss | | | 307,274 | | | | (6,049 | ) |
| Deficit | | | (25,660,878 | ) | | | (24,170,684 | ) |
| | | | (25,353,604 | ) | | | (24,176,733 | ) |
| | | | 24,379,082 | | | | 16,965,099 | |
| | | $ | 27,048,567 | | | $ | 19,206,278 | |
| | | Note | | | 2011 | | | 2010 | |
| | | | | | | | | (Note 20) | |
| Operating and Administrative Expenses | | | | | | | | | |
| Depreciation | | | | | $ | 803 | | | $ | 3,834 | |
| Investor relations | | | | | | 294,882 | | | | 99,450 | |
| Management fees | | | | | | 296,260 | | | | 96,000 | |
| Office and miscellaneous | | | | | | 324,275 | | | | 218,489 | |
| Professional fees | | | | | | 189,459 | | | | 127,711 | |
| Regulatory and compliance fees | | | | | | 121,591 | | | | 26,028 | |
| Salaries and benefits | | | | | | 152,312 | | | | 109,873 | |
| Sales tax write-down | | | | | | - | | | | 42,478 | |
| Share-based payments | | | 12 | | | | 2,529,620 | | | | 341,748 | |
| Travel and promotion | | | | | | | 133,445 | | | | 45,032 | |
| | | | | | | | 4,042,647 | | | | 1,110,643 | |
| | | | | | | | | | | | | |
| Loss before other items and income tax | | | | | | | (4,042,647 | ) | | | (1,110,643 | ) |
| | | | | | | | | | | | | |
| Other Income | | | | | | | | | | | | |
| Interest income | | | | | | | 78,857 | | | | 14,206 | |
| Other revenue | | | | | | | 10,499 | | | | - | |
| Unrealized (loss) gain on investments in related companies | | | | | | | (212,966 | ) | | | 313,323 | |
| Foreign exchange gain | | | | | | | 68,404 | | | | 19,951 | |
| LOSS BEFORE INCOME TAX | | | | | | | (4,097,853 | ) | | | (763,163 | ) |
| | | | | | | | | | | | | |
| Deferred income tax expense | | | | | | | (86,498 | ) | | | (27,677 | ) |
| | | | | | | | | | | | | |
| NET LOSS | | | | | | | (4,184,351 | ) | | | (790,840 | ) |
| | | | | | | | | | | | | |
| | | | | | | | | | | | | |
| Other Comprehensive Income (Loss) | | | | | | | | | | | | |
| Foreign currency translation differences for foreign operations | | | | | | | 82,689 | | | | (345,089 | ) |
| COMPREHENSIVE LOSS | | | | | | $ | (4,101,662 | ) | | $ | (1,135,929 | ) |
| | | | | | | | | | | | | |
| Loss per Share - Basic and Diluted | | | | | | $ | (0.16 | ) | | $ | (0.04 | ) |
| | | | | | | | | | | | | |
| Weighted Average Number of Shares Outstanding | | | | | | | 26,795,632 | | | | 20,059,008 | |
Subsequent Events – Note 18
Approved by the Board of Directors:
| | | | |
/s/ Gary Robertson | Director | | /s/ David Wolfin | Director |
| | | | |
The accompanying notes are an integral part of thesethe consolidated financial statements
AVINO SILVER & GOLD MINES LTD.
Consolidated Statements of Operations and Comprehensive LossChanges in Equity
Years ended December 31, 2010, 2009 and 2008
(Expressed in Canadian dollars)
| | | 2010 | | | 2009 | | | 2008 | |
| | | | | | | | | | |
| Operating and Administrative Expenses | | | | | | | | | |
| Amortization | | $ | 3,834 | | | $ | 2,328 | | | $ | 2,869 | |
| General exploration | | | - | | | | 294 | | | | 8,823 | |
| Investor relations | | | 99,450 | | | | 90,031 | | | | 172,992 | |
| Management fees | | | 96,000 | | | | 96,000 | | | | 96,000 | |
| Office and miscellaneous | | | 218,489 | | | | 104,548 | | | | 121,353 | |
| Professional fees | | | 127,711 | | | | 183,911 | | | | 179,299 | |
| Regulatory and compliance fees | | | 26,028 | | | | 24,540 | | | | 25,821 | |
| Salaries and benefits | | | 109,873 | | | | 82,160 | | | | 109,354 | |
| Sales tax write-down (recovery) (Note 8) | | | 42,478 | | | | (181,456 | ) | | | 213,652 | |
| Stock-based compensation (Note 10) | | | 361,784 | | | | 237,887 | | | | 606,000 | |
| Travel and promotion | | | 45,032 | | | | 28,935 | | | | 39,750 | |
| | | | 1,130,679 | | | | 669,178 | | | | 1,575,913 | |
| | | | | | | | | | | | | |
| Loss before other items and income tax | | | (1,130,679 | ) | | | (669,178 | ) | | | (1,575,913 | ) |
| | | | | | | | | | | | | |
| Other Income (Expenses) | | | | | | | | | | | | |
| Interest income | | | 14,206 | | | | 68,224 | | | | 146,386 | |
| Foreign exchange loss | | | (41,580 | ) | | | (18,249 | ) | | | (35,696 | ) |
| Impairment of mineral properties (Note 6) | | | - | | | | (608,118 | ) | | | - | |
| Mineral property option revenue (Note 6) | | | - | | | | - | | | | 25,000 | |
| | | | | | | | | | | | | |
| LOSS BEFORE INCOME TAX | | | (1,158,053 | ) | | | (1,227,321 | ) | | | (1,440,223 | ) |
| Future income tax (expense) recovery (Note 16) | | | (332,141 | ) | | | 239,562 | | | | (98,653 | ) |
| NET LOSS | | | (1,490,194 | ) | | | (987,759 | ) | | | (1,538,876 | ) |
| | | | | | | | | | | | | |
| Other Comprehensive Income (Loss) | | | | | | | | | | | | |
| Unrealized gain (loss) on investments in related companies (Note 7) | | | 313,323 | | | | 97,517 | | | | (108,196 | ) |
| | | | | | | | | | | | | |
| COMPREHENSIVE LOSS | | $ | (1,176,871 | ) | | $ | (890,242 | ) | | $ | (1,647,072 | ) |
| | | | | | | | | | | | | |
| Loss per Share - Basic and Diluted | | $ | (0.07 | ) | | $ | (0.05 | ) | | $ | (0.07 | ) |
| | | | | | | | | | | | | |
| Weighted Average Number of Shares Outstanding | | | 21,059,008 | | | | 20,584,727 | | | | 20,584,727 | |
| | | Note | | | Number of Common Shares | | | Share Capital Amount | | | Equity Reserves | | | Treasury Shares | | | Accumulated Other Comprehensive Loss | | | Accumulated Deficit | | | Total Equity | |
| Balance, January 1, 2010 | | | 20 | | | | 20,584,727 | | | $ | 33,173,022 | | | $ | 7,349,978 | | | $ | (101,869 | ) | | $ | - | | | $ | (23,940,230 | ) | | $ | 16,480,901 | |
| Net loss for the year | | | | | | | - | | | | - | | | | - | | | | - | | | | - | | | | (790,840 | ) | | | (790,840 | ) |
| Common shares issued for cash: | | | | | | | | | | | | | | | | | | | | | | | | | | | | | | | | |
| Private placement | | | 11 | | | | 5,100,000 | | | | 5,107,614 | | | | 3,202,468 | | | | - | | | | - | | | | - | | | | 8,310,082 | |
| Share issuance costs | | | | | | | - | | | | (435,387 | ) | | | - | | | | - | | | | - | | | | - | | | | (435,387 | ) |
| Exercise of stock options | | | | | | | 472,500 | | | | 354,375 | | | | - | | | | - | | | | - | | | | - | | | | 354,375 | |
| Share-based payments | | | 12 | | | | - | | | | - | | | | 341,748 | | | | - | | | | - | | | | - | | | | 341,748 | |
| Fair value of stock options exercised | | | | | | | - | | | | 993,675 | | | | (993,675 | ) | | | - | | | | - | | | | - | | | | - | |
| Options and warrants cancelled / expired | | | | | | | - | | | | - | | | | (391,681 | ) | | | - | | | | - | | | | 391,681 | | | | - | |
| Cumulative translation adjustments | | | | | | | - | | | | - | | | | - | | | | - | | | | (345,089 | ) | | | - | | | | (345,089 | ) |
| | | | | | | | | | | | | | | | | | | | | | | | | | | | | | | | | |
| Balance, December 31, 2010 | | | | | | | 26,157,227 | | | $ | 39,193,299 | | | $ | 9,508,838 | | | $ | (101,869 | ) | | $ | (345,089 | ) | | $ | (24,339,389 | ) | | $ | 23,915,790 | |
| Balance, December 31, 2010 | | | 20 | | | | 26,157,227 | | | $ | 39,193,299 | | | $ | 9,508,838 | | | $ | (101,869 | ) | | $ | (345,089 | ) | | $ | (24,339,389 | ) | | $ | 23,915,790 | |
| Net loss for the year | | | | | | | - | | | | - | | | | - | | | | - | | | | - | | | | (4,184,351 | ) | | | (4,184,351 | ) |
| Common shares issued for cash: | | | | | | | | | | | | | | | | | | | | | | | | | | | | | | | | |
| Exercise of stock options | | | | | | | 753,000 | | | | 592,050 | | | | - | | | | - | | | | - | | | | - | | | | 592,050 | |
| Share issuance costs | | | | | | | - | | | | (1,539 | ) | | | - | | | | - | | | | - | | | | - | | | | (1,539 | ) |
| Fair value of stock options exercised | | | | | | | - | | | | 1,936,273 | | | | (1,936,273 | ) | | | - | | | | - | | | | - | | | | - | |
| Share-based payments | | | 12 | | | | - | | | | - | | | | 2,529,620 | | | | - | | | | - | | | | - | | | | 2,529,620 | |
| Options and warrants cancelled / expired | | | | | | | - | | | | - | | | | (203,999 | ) | | | - | | | | - | | | | 203,999 | | | | - | |
| Cumulative translation adjustments | | | | | | | - | | | | - | | | | - | | | | - | | | | 82,689 | | | | - | | | | 82,689 | |
| | | | | | | | | | | | | | | | | | | | | | | | | | | | | | | | | |
| Balance, December 31, 2011 | | | | | | | 26,910,227 | | | $ | 41,720,083 | | | $ | 9,898,186 | | | $ | (101,869 | ) | | $ | (262,400 | ) | | $ | (28,319,741 | ) | | $ | 22,934,259 | |
The accompanying notes are an integral part of thesethe consolidated financial statements
AVINO SILVER & GOLD MINES LTD.
Consolidated Statements of Shareholders’ Equity
For the years ended December 31, 2010, 20092011 and 20082010
Consolidated Statements of Cash Flows
(Expressed in Canadian dollars)
| | | Number of Common Shares | | | Share Capital | | | Treasury Shares | | | Contributed Surplus | | | Deficit | | | Accumulated Other Comprehensive Income (Loss) | | | Total Shareholders’ Equity | |
| | | | | | | | | | | | | | | | | | | | | | |
| Balance, December 31, 2007 | | | 20,584,727 | | | $ | 33,112,072 | | | $ | (101,869 | ) | | $ | 7,287,742 | | | $ | (21,644,049 | ) | | $ | 4,630 | | | $ | 18,658,526 | |
| | | | | | | | | | | | | | | | | | | | | | | | | | | | | |
| Stock based compensation (Note 10) | | | - | | | | - | | | | - | | | | 606,000 | | | | - | | | | - | | | | 606,000 | |
| Net loss for year | | | - | | | | - | | | | - | | | | - | | | | (1,538,876 | ) | | | - | | | | (1,538,876 | ) |
| Unrealized loss on investments | | | - | | | | - | | | | - | | | | - | | | | - | | | | (108,196 | ) | | | (108,196 | ) |
| | | | | | | | | | | | | | | | | | | | | | | | | | | | | |
| Balance, December 31, 2008 | | | 20,584,727 | | | | 33,112,072 | | | | (101,869 | ) | | | 7,893,742 | | | | (23,182,925 | ) | | | (103,566 | ) | | | 17,617,454 | |
| | | | | | | | | | | | | | | | | | | | | | | | | | | | | |
| Stock based compensation (Note 10) | | | - | | | | - | | | | - | | | | 237,887 | | | | - | | | | - | | | | 237,887 | |
| Net loss for year | | | - | | | | - | | | | - | | | | - | | | | (987,759 | ) | | | - | | | | (987,759 | ) |
| Unrealized gain on investments | | | - | | | | - | | | | - | | | | - | | | | - | | | | 97,517 | | | | 97,517 | |
| | | | | | | | | | | | | | | | | | | | | | | | | | | | | |
| Balance, December 31, 2009 | | | 20,584,727 | | | | 33,112,072 | | | | (101,869 | ) | | | 8,131,629 | | | | (24,170,684 | ) | | | (6,049 | ) | | | 16,965,099 | |
| | | | | | | | | | | | | | | | | | | | | | | | | | | | | |
| Common shares issued for cash: | | | | | | | | | | | | | | | | | | | | | | | | | | | | |
| Private placement (Note 9) | | | 5,100,000 | | | | 5,107,614 | | | | - | | | | 3,202,468 | | | | - | | | | - | | | | 8,310,082 | |
| Share issuance costs | | | - | | | | (435,387 | ) | | | - | | | | - | | | | - | | | | - | | | | (435,387 | ) |
| Exercise of stock options | | | 472,500 | | | | 354,375 | | | | - | | | | - | | | | - | | | | - | | | | 354,375 | |
| Fair value of stock options exercised | | | - | | | | 993,675 | | | | - | | | | (993,675 | ) | | | - | | | | - | | | | - | |
| Stock-based compensation (Note 10) | | | - | | | | - | | | | - | | | | 361,784 | | | | - | | | | - | | | | 361,784 | |
| Net loss for the year | | | - | | | | - | | | | - | | | | - | | | | (1,490,194 | ) | | | - | | | | (1,490,194 | ) |
| Unrealized gain on investments | | | - | | | | - | | | | - | | | | - | | | | - | | | | 313,323 | | | | 313,323 | |
| | | | | | | | | | | | | | | | | | | | | | | | | | | | | |
| Balance, December 31, 2010 | | | 26,157,227 | | | $ | 39,132,349 | | | $ | (101,869 | ) | | $ | 10,702,206 | | | $ | (25,660,878 | ) | | $ | 307,274 | | | $ | 24,379,082 | |
| | | Note | | | 2011 | | | 2010 | |
| | | | | | | | | (Note 20) | |
| CASH PROVIDED BY (USED IN): | | | | | | | | | |
| | | | | | | | | | |
| OPERATING ACTIVITIES | | | | | | | | | |
| Net loss | | | | | $ | (4,184,351 | ) | | $ | (790,840 | ) |
| Adjustments for non-cash items: | | | | | | | | | | | |
| Depreciation | | | | | | 803 | | | | 3,834 | |
| Sales tax write-down provision | | | | | | - | | | | 42,478 | |
| Share-based payments | | | | | | 2,529,620 | | | | 341,748 | |
| Unrealized loss (gain) on investments | | | | | | 212,966 | | | | (313,323 | ) |
| Deferred income tax expense | | | | | | 86,499 | | | | 27,677 | |
| | | | | | | | | | | | |
| | | | | | | (1,354,463 | ) | | | (688,426 | ) |
| | | | | | | | | | | | |
| Net change in non-cash working capital | | | 14 | | | | 60,462 | | | | (76,289 | ) |
| | | | | | | | | | | | | |
| | | | | | | | (1,294,001 | ) | | | (764,715 | ) |
| | | | | | | | | | | | | |
| | | | | | | | | | | | | |
| FINANCING ACTIVITIES | | | | | | | | | | | | |
| Shares issued for cash, net of issuance costs | | | | | | | 590,511 | | | | 8,229,069 | |
| | | | | | | | | | | | | |
| INVESTING ACTIVITIES | | | | | | | | | | | | |
| Mineral property exploration expenditures | | | | | | | (1,475,779 | ) | | | (824,826 | ) |
| Acquisition of property, plant and equipment | | | | | | | (1,483,453 | ) | | | (324,360 | ) |
| | | | | | | | | | | | | |
| | | | | | | | (2,959,232 | ) | | | (1,149,186 | ) |
| | | | | | | | | | | | | |
| Increase (decrease) in cash and cash equivalents | | | | | | | (3,662,722 | ) | | | 6,315,168 | |
| | | | | | | | | | | | | |
| Effect of exchange rate changes on cash and cash equivalents | | | | | | | (106,662 | ) | | | (93,413 | ) |
| | | | | | | | | | | | | |
CASH AND CASH EQUIVALENTS, Beginning | | | | | | | 9,051,848 | | | | 2,830,093 | |
| | | | | | | | | | | | | |
CASH AND CASH EQUIVALENTS, Ending | | | | | | $ | 5,282,464 | | | $ | 9,051,848 | |
The accompanying notes are an integral part of thesethe consolidated financial statements
AVINO SILVER & GOLD MINES LTD.
Notes to the Consolidated Financial Statements of Cash Flows
For the years ended December 31, 2010, 20092011 and 20082010
(Expressed in Canadian dollars)
1. NATURE OF OPERATIONS
Avino Silver & Gold Mines Ltd. (the “Company” or “Avino”) was incorporated in 1968 under the laws of the Province of British Columbia, Canada. The Company’s principal business activities include the acquisition, exploration and evaluation of mineral properties. The Company owns interests in mineral properties located in Durango, Mexico and in British Columbia and the Yukon, Canada. The Company’s head office and principal place of business is Suite 900, 570 Granville Street, Vancouver, BC, Canada. The Company is a reporting issuer in Canada and the United States and trades on the TSX-V, NYSE Amex and the Frankfurt Stock Exchange.
| | | 2010 | | | 2009 | | | 2008 | |
| | | | | | | | | | |
| CASH PROVIDED BY (USED IN): | | | | | | | | | |
| | | | | | | | | | |
| OPERATING ACTIVITIES | | | | | | | | | |
| Net loss | | $ | (1,490,194 | ) | | $ | (987,759 | ) | | $ | (1,538,876 | ) |
| Adjustments for non-cash items: | | | | | | | | | | | | |
| Amortization | | | 3,834 | | | | 2,328 | | | | 2,869 | |
| Sales tax write-down provision | | | 42,478 | | | | 8,873 | | | | 213,652 | |
| Stock-based compensation | | | 361,784 | | | | 237,887 | | | | 606,000 | |
| Impairment of mineral properties | | | - | | | | 608,118 | | | | - | |
| Future income tax expense (recovery) | | | 332,141 | | | | (239,562 | ) | | | 98,653 | |
| | | | | | | | | | | | | |
| | | | (749,957 | ) | | | (370,115 | ) | | | (617,702 | ) |
| | | | | | | | | | | | | |
| Net change in non-cash working capital (Note 12) | | | (75,811 | ) | | | 226,040 | | | | (291,327 | ) |
| | | | | | | | | | | | | |
| | | | (825,768 | ) | | | (144,075 | ) | | | (909,029 | ) |
| | | | | | | | | | | | | |
| | | | | | | | | | | | | |
| FINANCING ACTIVITIES | | | | | | | | | | | | |
| Shares issued for cash, net of issuance costs | | | 8,229,069 | | | | - | | | | - | |
| | | | | | | | | | | | | |
| INVESTING ACTIVITIES | | | | | | | | | | | | |
| Mineral property exploration expenditures | | | (846,745 | ) | | | (320,100 | ) | | | (1,764,719 | ) |
| Property, plant and equipment purchases | | | (334,705 | ) | | | (281,461 | ) | | | (93,492 | ) |
| | | | | | | | | | | | | |
| | | | (1,181,450 | ) | | | (601,561 | ) | | | (1,858,211 | ) |
| | | | | | | | | | | | | |
| Increase (decrease) in cash and cash equivalents | | | 6,221,851 | | | | (745,636 | ) | | | (2,767,240 | ) |
| | | | | | | | | | | | | |
CASH AND CASH EQUIVALENTS, Beginning | | | 2,829,605 | | | | 3,575,241 | | | | 6,342,481 | |
| | | | | | | | | | | | | |
CASH AND CASH EQUIVALENTS, Ending | | $ | 9,051,456 | | | $ | 2,829,605 | | | $ | 3,575,241 | |
| | | | | | | | | | | | | |
| | | | | | | | | | | | | |
| SUPPLEMENTARY CASH FLOW DISCLOSURES | | | | | | | | | | | | |
| Cash paid for: | | | | | | | | | | | | |
| Interest expense | | $ | - | | | $ | - | | | $ | - | |
| Income taxes | | | - | | | | - | | | | - | |
The Company is in the exploration stage and is in the process of determining whether its key properties in Durango, Mexico contain these properties contain ore reserves which are economically recoverable.
2. BASIS OF PRESENTATION
Statement of compliance and conversion to International Financial Reporting Standards
These financial statements have been prepared in accordance with International Financial Reporting Standards (“IFRS”) as issued by the International Accounting Standards Board. These are the Company’s first IFRS annual consolidated financial statements to be presented in accordance with IFRS and IFRS 1 First-time adoption of International Financial Reporting Standards has been applied. Previously the Company prepared its consolidated annual and interim financial statements in accordance with Canadian generally accepted accounting principles. Note 20 contains reconciliations and descriptions of the effect of the transition from Canadian GAAP to IFRS on equity, operations and comprehensive loss along with reconciliations of the statements of financial position as at January 1, 2010 and December 31, 2010 and the statements of operations and comprehensive loss and cash flows for the year ended December 31, 2010.
Basis of presentation
These consolidated financial statements are expressed in Canadian dollars and have been prepared on a historical cost basis except for financial instruments that have been measured at fair value. In addition, these consolidated financial statements have been prepared using the accrual basis of accounting on a going concern basis. The accounting policies set out below have been applied consistently to all years presented in these consolidated financial statements as if the policies have always been in effect, subject to certain IFRS transition elections described in Note 20.
Foreign Currency Translation
The accompanying notesfunctional and presentation currency of the Company is the Canadian dollar. The functional currency of the Company’s subsidiaries is the U.S. dollar which is determined to be the currency of the primary economic environment in which the subsidiaries operate.
| b) | Foreign currency transactions |
Transactions in currencies other than the functional currency are an integral partrecorded at the rates of these consolidatedexchange prevailing on the dates of the transactions. At each financial statementsposition reporting date, monetary assets and liabilities that are denominated in foreign currencies are translated at the rates prevailing at the date of the statement of financial position. Non-monetary items that are measured in terms of historical cost in a foreign currency are not re-translated.
AVINO SILVER & GOLD MINES LTD.
Notes to the Consolidated Financial Statements
For the years ended December 31, 2011 and 2010
(Expressed in Canadian dollars)
2. BASIS OF PRESENTATION (continued)
Subsidiaries that have functional currencies other than Canadian dollars translate their statement of operations items to Canadian dollars at the average rate during the year. Assets and liabilities are translated at exchange rates prevailing at the end of each reporting period. Exchange variations resulting from the retranslation at closing rate of the net investment in such subsidiaries, together with differences between their statement of operations items translated at actual and average rates, are recognized in the accumulated other comprehensive income/loss.
Significant Accounting Judgements and Estimates
The preparation of these consolidated financial statements requires management to make estimates and judgments that affect the reported amounts of assets and liabilities at the date of the consolidated financial statements and reported amounts of expenses during the reporting period. Actual outcomes could differ from these estimates under different assumptions and conditions.
Significant assumptions about the future and other sources of estimation uncertainty that management has made at the statement of financial position date, that could result in a material adjustment to the carrying amounts of assets and liabilities, in the event that actual results differ from assumptions made, relate to, but are not limited to, the following:
| · | the recoverability of amounts receivable which are included in the consolidated statement of financial position; |
| · | the carrying value and recoverable amount of mineral properties and exploration; |
| · | the recoverability and estimated useful lives of property, plant and equipment; |
| · | the recognition and measurement of deferred tax assets and liabilities; |
| · | provisions including the estimated reclamation provisions; and |
| · | the valuation inputs used in accounting for share-based payments. |
3. SIGNIFICANT ACCOUNTING POLICIES
Basis of Consolidation
The consolidated financial statements include the accounts of the Company and its Mexican subsidiaries.
| | Ownership Interest | | Jurisdiction | | Nature of Operations |
| Oniva Silver and Gold Mines S.A., (“Oniva Silver”) | | 100% | | Mexico | | Mexican operations administration |
| Promotora Avino, S.A. De C.V. (“Promotora”) | | 79.09% | | Mexico | | Holding Company |
Compania Minera Mexicana de Avino, S.A. de C.V. (“Cia Minera”) | | 96.60% direct 2.68% indirect (Promotora) | | Mexico | | Exploration Company |
| | 99.28% effective | | | | |
Inter-company balances and transactions, including unrealized income and expenses arising from intercompany transactions, are eliminated in preparing the consolidated financial statements.
AVINO SILVER & GOLD MINES LTD.
Notes to the Consolidated Financial Statements
For the years ended December 31, 2010, 20092011 and 20082010
(Expressed in Canadian dollars)
1. NATURE OF OPERATIONS
3. SIGNIFICANT ACCOUNTING POLICIES (continued)
Avino Silver & Gold Mines Ltd. (the “Company”Financial Instruments
All financial assets are initially recorded at fair value and classified into one of four categories: held to maturity, available for sale, loans and receivable or “Avino”fair value through profit or loss (“FVTPL”) was incorporated in 1969 under the laws of the Province of British Columbia, Canada. The Company’s principal business activities include the acquisition, exploration. All financial liabilities are initially recorded at fair value and development of mineral properties. classified as either FVTPL or other financial liabilities. Financial instruments comprise cash and cash equivalents, marketable securities and accounts payable. At initial recognition management has classified financial assets and liabilities as follows:
The Company owns interestshas classified its cash and cash equivalents, interest receivable, and investments in mineral properties locatedrelated companies as FVTPL. Amounts receivable are classified as loans and receivables. Accounts payable and amounts due to related parties are classified as other liabilities.
Cash and cash equivalents
Cash and cash equivalents in Durango, Mexicothe statement of financial position comprise cash at banks and in British Columbiaon hand, and the Yukon, Canada.short term deposits with an original maturity of three months or less, which are readily convertible into a known amount of cash.
Exploration and evaluation assets
The Company is in the exploration stage with respect to its mineral properties and capitalizes all costs relating to the acquisition, exploration and evaluation of mineral claims and recognizes any proceeds received as a reduction of the cost of the related claims. The Company’s capitalized mineral properties costs are considered exploration and evaluation assets and are classified as intangibles assets. Such costs include, but are not exclusive to, geological, geophysical studies, exploratory drilling and sampling. At such time as commercial production commences, these costs will be charged to operations on a unit-of-production method based on proven and probable reserves. The aggregate costs related to abandoned mineral claims are charged to operations at the time of any abandonment, or when it has been determined that there is evidence of a permanent impairment. An impairment charge relating to a mineral property is subsequently reversed when new exploration results or actual or potential proceeds on sale or farm out of the property result in a revised estimate of the processrecoverable amount, but only to the extent that this does not exceed the original carrying value of determining whether these properties contain ore reserves which are economically recoverable.the property that would have resulted if no impairment had been recognized.
The recoverability of amounts recorded as mineral propertiesshown for exploration and related deferred costsevaluation assets is dependent upon the discovery of economically recoverable reserves, maintenancethe ability of the Company’s legal interestsCompany to obtain financing to complete development of the properties, and on future production or proceeds of disposition.
Incidental revenues and operating costs are included in its mineral claims, obtaining further financing forproperties and exploration costs prior to commercial production.
Once the technical feasibility and commercial viability of the extraction of mineral resources in an area of interest are demonstrable, exploration and evaluation assets attributable to that area of interest are first tested for impairment and then reclassified to mine development properties, and then amortized over the life of its mineral claims, re-developmentthe resources associated with the area of itsinterest once mining operations have commenced.
All capitalized exploration and processing operations and commencementevaluation expenditures are monitored for indications of future profitable production, or receiving proceeds fromimpairment. Where a potential impairment is indicated, assessments are performed for each area of interest. To the saleextent that exploration expenditure is not expected to be recovered, it is charged to the results of all or an interest in its mineral properties.operations.
AVINO SILVER & GOLD MINES LTD.
Notes to the Consolidated Financial Statements
For the years ended December 31, 2011 and 2010
(Expressed in Canadian dollars)
3. SIGNIFICANT ACCOUNTING POLICIES
(continued)
i) | Basis of presentationThese consolidated financial statements are expressed in Canadian dollars and prepared in accordance with Canadian generally accepted accounting principles (“Canadian GAAP”) and include the accounts of the Company and its Mexican subsidiaries. A summary of the differences between accounting principles generally accepted in Canada and those generally accepted in the United States are contained in Note 20. All significant inter-company balances and transactions have been eliminated on consolidation. The Company’s Mexican subsidiaries are Oniva Silver and Gold Mines S.A., (“Oniva Silver”) which is wholly-owned, Promotora Avino, S.A. De C.V. (“Promotora”) in which the Company has a direct 79.09% ownership, and Compania Minera Mexicana de Avino, S.A. de C.V. (“Cia Minera”) in which the Company has a 96.60% direct ownership and an additional 2.68% indirect effective ownership held through Promotora. The ownership interests in Cia Minera combine for an effective 99.28% held by the Company as at December 31, 2010 and 2009 (see Note 3).
|
Property, plant and equipment
ii) | Cash and cash equivalents
The Company considers all highly liquid instruments with original maturities of three months or less on the date of purchase to be cash equivalents. Cash equivalents are carried at cost, plus accrued interest, which approximates fair value.
|
iii) | Property, plant and equipmentProperty, plant and equipment is stated at cost less accumulated amortization. Amortization is recorded over the estimated useful lives of the assets on the declining balance basis at the following annual rates:
|
Office equipment, furniture and fixtures | 20% |
Computer equipment | 30% |
Mine facilities and equipment | 20% |
The mine mill, machinery, plant facilities and certain equipment are notrecorded at historical cost less accumulated depreciation. Historical costs include expenditures that are directly attributable to bringing the asset to a location and condition necessary to operate in activea manner intended by management. Such costs are accumulated as construction in progress until the asset is available for use, at which point the asset is classified as the Company is in the process of refurbishing these assets. Accordingly, these assets are considered to be under reconstructionplant and no amortization has been recorded on them.equipment. Once commercial production has commenced, mine, mill, machinery, plant facilities, and certain equipment are depreciated using the units of production method, if sufficient reserve information is available or the straight-line method over their estimated useful lives, not to exceed the life of the mine to which the assets relate.related. In 2010 the mine, mill, machinery, plant facilities and certain equipment was not in active use and was considered to be under reconstruction and no amortization was recorded. In 2011 active use began incidental with exploration activities and depreciation was recorded.
Property, plant and equipment are depreciated annually at the following rates: AVINO SILVER & GOLD MINES LTD.
Notes to the Consolidated Financial Statements
For the years ended December 31, 2010, 2009 and 2008
(Expressed in Canadian dollars)
2. SIGNIFICANT ACCOUNTING POLICIES (Continued)
iv)Office equipment, furniture and fixtures | Mineral properties, deferred exploration20% declining balance
|
| Computer equipment | 30% declining balance |
Mine machinery and development expendituresThe Company follows CICA Accounting Guideline 11, Enterprises in the Development Stage. Mineral property acquisition, explorationtransportation equipment
| 20% declining balance |
Mill machinery and development costs are deferred until the property to which they relate is placed into production, sold, allowed to lapse or abandoned. Mineral property acquisition costs include the cash considerationprocessing equipment | 20 years straight line |
Buildings and the fair value of common shares issued for mineral property interests based on the observed trading price of the shares. Mineral exploration costs such as field labour and consultants, geology and assaying, and mining claims are capitalized and carried at cost until the properties to which they relate are placed into production, sold or management determines a permanent impairment in value. Development costs incurred to access ore bodies identified in the current mining plan will be expensed as incurred after production has commenced.Development costs necessary to extend a mine beyond those areas identified in the current mining plan and which are incurred to access additional reserves are deferred until the incremental reserves are mined. Mineral properties and development costs, including the mineral acquisition and direct mineral exploration costs relating to the current mining plan, will be depleted and amortized using the units-of-production method over the estimated life of the ore body based on proven and probable reserves once commercial production commences. Incidental revenues and operating costs are included in mineral properties and development costs prior to commercial production.
constructions | 20 years straight line |
v) | InvestmentsInvestments in shares of public companies traded on an active market over which Avino does not have control or exercises significant influence are classified as available-for-sale and accounted for at fair market value, based upon quoted market share prices at the consolidated balance sheet date. Unrealized gains or losses on these investments are recorded as other comprehensive income or loss, unless a decline in value is considered to be other than temporary. Purchases and sales of investments are measured on a settlement date basis.
|
Impairment
vi) | Translation of foreign currencies and foreign subsidiariesThe Company’s integrated Mexican foreign subsidiaries are financially and operationally dependent on the Company. The Company uses the temporal method to translate the accounts of its integrated foreign operations into Canadian dollars. Monetary assets and liabilities are translated at the exchange rates in effect at the balance sheet date. Non-monetary assets and liabilities are translated at historical rates. Revenues and expenses are translated at rates in effect during the period, except for amortization, which is translated on the same basis as the related assets. The resulting exchange gains or losses are recognized in income.
|
At each financial position reporting date, the carrying amounts of the Company’s assets are reviewed to determine whether there is any indication that those assets are impaired. If any such indication exists, the recoverable amount of the asset is estimated in order to determine the extent of the impairment, if any. Where the asset does not generate cash flows that are independent from other assets, the Company estimates the recoverable amount of the cash-generating unit to which the asset belongs.
vii) | Comprehensive lossComprehensive loss is comprised of the sum of the net loss and other comprehensive income or loss which includes unrealized gains or losses from changes in the fair market value of available-for-sale investments, changes in the fair market value of derivative instruments designated as cash flow hedges and currency translation adjustments on self-sustaining foreign operations. The Company does not have any derivative instruments or self-sustaining foreign operations and currently the Company’s other comprehensive income (loss) is comprised only of changes in the fair value of the Company’s available-for-sale investments.
|
An asset’s recoverable amount is the higher of fair value less costs to sell and value in use. Fair value is determined as the amount that would be obtained from the sale of the asset in an arm’s length transaction between knowledgeable and willing parties. In assessing value in use, the estimated future cash flows are discounted to their present value using a pre-tax discount rate that reflects current market assessments of the time value of money and the risks specific to the asset. If the recoverable amount of an asset or cash generating unit is estimated to be less than its carrying amount, the carrying amount of the asset is reduced to its recoverable amount and the impairment loss is recognized in the profit or loss for the period.
Where an impairment loss subsequently reverses, the carrying amount of the asset (or cash-generating unit) is increased to the revised estimate of its recoverable amount, but so that the increased carrying amount does not exceed the carrying amount that would have been determined had no impairment loss been recognized for the asset (or cash-generating unit) in prior years. A reversal of an impairment loss is recognized immediately in profit or loss.
AVINO SILVER & GOLD MINES LTD.Revenue recognition
Notes
Revenue is recognized to the Consolidated Financial Statements
Forextent that it is probable that the years ended December 31, 2010, 2009economic benefits will flow to the Company and 2008
(Expressed in Canadian dollars)
2. SIGNIFICANT ACCOUNTING POLICIES (Continued)
the revenue can be reliably measured. Revenue is measured at the fair value of the consideration received, excluding discounts, rebates and other sales tax or duty.
viii) | Financial instruments |
Concentrate sales(a) | Classification
Financial instruments are classified into one of five categories: held-for-trading, held-to-maturity investments, loans and receivables, available-for-sale financial assets or other financial liabilities. All financial instruments are measured at fair value except for loans and receivables, held-to-maturity investments and other financial liabilities which are measured at amortized cost. Subsequent measurement and accounting for changes in the value of these investments will depend on their initial classification as follows: held-for-trading financials assets are measured at fair value with changes in fair value recognized in operations. Available-for-sale financial instruments are measured at fair value with changes in fair value recorded in other comprehensive income until the change in value is realized or the instrument is derecognized or permanently impaired.
|
(b) | Transaction costsTransaction costs attributable to the acquisition or issue of financial assets or financial liabilities, other than those classified as held-for-trading, are added to the initial fair value amount to match the costs with the related transactions.
|
ix) | Use of estimates
The preparation of financial statements in accordance with Canadian GAAP requires management to make estimates and assumptions that affect the reported amounts of assets and liabilities and disclosures of contingent assets and liabilities at the date of the financial statements and the reported amounts of revenues and expenses during the reported periods. Significant areas requiring the use of estimates relate to the recoverability or valuation of sales taxes recoverable, property, plant, equipment, and mineral properties, the valuation of asset retirement obligations, useful lives for amortization, recognition and disclosure of future income tax assets and liabilities, and stock-based compensation. Actual results could differ from those estimates.
|
x) | Income taxesThe Company follows the asset and liability method of accounting for income taxes. Future income tax assets and liabilities are determined based on temporary differences between the accounting and taxes bases for existing assets and liabilities, and are measured using the tax rates expected to apply when these differences reverse. A valuation allowance is recorded against any future income tax asset if it is more likely than not that the asset will not be realized.
The Company follows CICA Emerging Issues Committee Abstract 146 Flow-Through Shares. Canadian tax legislation permits a company to issue securities referred to as flow-through shares whereby the Company assigns the tax deductions arising from the related resource expenditures, to the shareholders. When resource expenditures are renounced to the investors and the Company has reasonable assurance that the expenditures will be completed, a future income tax liability is recognized for the net tax effect of the deductions renounced, and share capital is reduced.
If the Company has sufficient unrecognized tax losses carried forward or other unrecognized future income tax assets to offset all or part of this future income tax liability, a portion of such unrecognized future income tax assets is recorded as a future income tax recovery up to the amount of the future income tax liability that would otherwise be recognized.
|
AVINO SILVER & GOLD MINES LTD.
Notes to the Consolidated Financial Statements
For the years ended December 31, 2010, 2009 and 2008
(Expressed in Canadian dollars)
2. SIGNIFICANT ACCOUNTING POLICIES (Continued)
xi) Revenue Recognition
The Company recognizes revenue from the sale of concentrate is recognized upon delivery when persuasive evidence of a sale agreement exists, the risks of ownership are transferred to the customer, collection is reasonably assured, and price is readily determinable. Revenue is based on quoted market prices during the quotation period published in the metal bulletin less treatment, refining charges, and penalties.
Prior to commercial production concentrate sales incidental to the exploration of mineral properties is recorded net of production costs as a reduction of deferredcapitalized mineral property exploration costs.
xii) Stock-based compensation
The Company recognizes stock-based compensation expense for the estimated fair value of stock-based payments. Compensation costs attributable to stock options or similar equity instruments granted to employees are measured at the fair value at the grant date using the Black-Scholes option pricing model, and are expensed over the expected vesting period. Transactions in which goods or services are received from non-employees in exchange for the issuance of equity instruments are accounted for based on the fair value of the consideration received or the fair value of the equity instruments issued, whichever is more reliably measurable. Consideration received on the exercise of stock options is recorded as share capital with a corresponding reduction in the contributed surplus related to the options exercised.
xiii) Loss per share
Basic loss per share is calculated using the weighted average number of common shares outstanding during the year. Diluted loss per share is calculated giving effect to the potential dilution that would occur if securities or other contracts to issue common shares were exercised or converted to common shares using the treasury method. The treasury method assumes that proceeds received from the exercise of stock options and warrants are used to repurchase common shares at the prevailing market rate. Stock options and warrants are dilutive when the average market prices of the common shares during the year exceed the exercise prices of the options and warrants.
For the years ended December 31, 2010, 2009 and 2008, the existence of warrants and options affects the calculation of loss per share on a fully diluted basis. As the affect of this dilution is to reduce the reported loss per share (anti-dilutive), fully diluted loss per share information has not been shown.
xiv) Asset retirement obligations
The Company recognizes the fair value of its liability for asset retirement obligations (“ARO”), including site restoration costs in the period in which such liabilities are incurred and can be reasonably estimated. Upon recognition of an ARO, the site restoration costs are capitalized as a part of the mineral property. In periods subsequent to initial measurement, the ARO is adjusted for both the passage of time and revisions to the original estimates. If the obligation is settled for other than the carrying amount of the liability, a gain or loss on the settlement is recognized. The Company estimated its site restoration costs as at December 31, 2010 to be $nil (2009 - $nil).
AVINO SILVER & GOLD MINES LTD.
Notes to the Consolidated Financial Statements
For the years ended December 31, 2010, 20092011 and 20082010
(Expressed in Canadian dollars)
2.3. SIGNIFICANT ACCOUNTING POLICIES (Continued)(continued)
xv) ImpairmentShare capital
Common shares
Common shares are classified as equity. Transaction costs directly attributable to the issue of long-lived assetscommon shares and share options are recognized as a deduction from equity, net of any tax effects.
Repurchase of share capital (treasury shares)
When share capital recognized as equity is repurchased, the amount of the consideration paid, which includes directly attributable costs, net of any tax effects, is recognized as a deduction from equity. Repurchased shares are classified as treasury shares and are presented as a deduction from total equity. When treasury shares are sold or reissued subsequently, the amount received is recognized as an increase in equity, and the resulting surplus or deficit on the transaction is transferred to/from retained earnings.
Share-based payment transactions
The recoverabilityshare option plan allows Company employees and consultants to acquire shares of long-lived assets,the Company. All options granted are measured at fair value and are recognized in expenses as share-based payments with a corresponding increase in equity reserves. An individual is classified as an employee when the individual is an employee for legal or tax purposes (direct employee) or provides services similar to those performed by a direct employee.
The fair value of employee options is measured at grant date, and each tranche is recognized using the graded vesting method over the period during which includes property, plant, equipment,the options vest. The fair value of the options granted is measured using the Black-Scholes option pricing model taking into account the terms and conditions upon which the options were granted. Share options granted to non-employees or consultants are measured at the fair value of goods or services received. At each financial position reporting date, the amount recognized as an expense is adjusted to reflect the actual number of share options that are expected to vest.
Provisions
Provisions are recognized where a legal or constructive obligation has been incurred as a result of past events; it is probable that an outflow of resources embodying economic benefit will be required to settle the obligation; and a reliable estimate of the amount of the obligation can be made. If material, provisions are measured at the present value of the expenditures expected to be required to settle the obligation. The increase in any provision due to passage of time is recognized as accretion expense.
Reclamation provision
The Company records the present value of estimated costs of legal and constructive obligations required to restore mineral properties are assessed for impairment annually or whenever events or changes in circumstances indicate that the carrying amount may not be recoverable. Recoverabilityperiod in which the obligation is based on factors such as future asset utilizationincurred. The nature of these restoration activities includes dismantling and the future undiscounted cash flows expected to result from the use or saleremoving structures, rehabilitating mines and restoration, reclamation and re-vegetation of affected areas.
The fair value of the related assets. An impairment lossliability for a rehabilitation provision is recorded when it is incurred. When the liability is initially recognized, when the carrying amountpresent value of an asset thatthe estimated cost is held and used exceeds the projected undiscounted future net cash flows expected from its use and disposal less costs to sell, and is measured as the amountcapitalized by whichincreasing the carrying amount of the asset exceeds its fairrelated mineral property. Over time, the discounted liability is increased for the change in present value based on the discount rates that reflect current market assessments and the risks specific to the liability, which is measuredaccreted over time through periodic charges to income or loss. Additional disturbances or changes in rehabilitation costs will be recognized as additions or charges to the corresponding assets and rehabilitation liability when they occur.
Loss per Share
The Company presents basic and diluted loss per share data for its common shares, calculated by dividing the loss attributable to common shareholders of the Company by the weighted average number of common shares outstanding during the year. Diluted loss per share is determined by adjusting the loss attributable to common shareholders and the weighted average number of common shares outstanding for the effects of all dilutive potential common shares.
AVINO SILVER & GOLD MINES LTD.
Notes to the Consolidated Financial Statements
For the years ended December 31, 2011 and 2010
(Expressed in Canadian dollars)
3. SIGNIFICANT ACCOUNTING POLICIES (continued)
Income taxes
Income tax on the profit or loss for the years presented comprises current and deferred tax. Income tax is recognized in profit or loss except to the extent that it relates to items recognized directly in equity, in which case it is recognized as equity.
Deferred tax is provided using the statement of financial position asset and liability method, providing for temporary differences between the carrying amounts of assets and liabilities for financial reporting purposes and the amounts used for taxation purposes. The amount of deferred tax provided is based on discounted cash flows when quoted market pricesthe expected manner of realization or settlement of the carrying amount of assets and liabilities, using tax rates enacted or substantively enacted at the statement of financial position date.
A deferred tax asset is recognized only to the extent that it is probable that future taxable profits will be available against which the asset can be utilized. To the extent that the Company does not consider it probable that a future tax asset will be recovered, it provides a valuation allowance against that excess.
New accounting standards and interpretations not yet adopted
Certain new standards, interpretations and amendments to existing standards have been issued by the IASB or the International Financial Reporting Interpretations Committee (“IFRIC”) that are mandatory for accounting periods beginning after January 1, 2011, or later periods. Some updates that are not available.applicable or are not consequential to the Company may have been excluded from the list below.
ImpairmentNew accounting standards effective January 1, 2012
Amendments to IFRS 7 Financial Instruments: Disclosures - In October 2010, the IASB issued amendments to IFRS 7 that improve the disclosure requirements in relation to transferred financial assets. The amendments are effective for annual periods beginning on or after July 1, 2011, with early adoption permitted. The Company does not anticipate this amendment to have a significant impact on its consolidated financial statements.
IAS 12 Income taxes - In December 2010, the carrying valueIASB issued an amendment to IAS 12 that provides a practical solution to determining the recovery of non-producing mineralinvestment properties may occuras it relates to the accounting for deferred income taxes. This amendment is effective for annual periods beginning on or after July 1, 2011, with early adoption permitted. The Company does not anticipate this amendment to have a significant impact on its consolidated financial statements.
New accounting standards effective January 1, 2013
IFRS 10 Consolidated Financial Statements - IFRS 10 requires an entity to consolidate an investee when oneit is exposed, or has rights, to variable returns from its involvement with the investee and has the ability to affect those returns through its power over the investee. Under existing IFRS, consolidation is required when an entity has the power to govern the financial and operating policies of an entity so as to obtain benefits from its activities. IFRS 10 replaces SIC-12 Consolidation - Special Purpose Entities and parts of IAS 27 Consolidated and Separate Financial Statements.
IFRS 11 Joint Arrangements - IFRS 11 requires a venturer to classify its interest in a joint arrangement as a joint venture or joint operation. Joint ventures will be accounted for using the equity method of accounting whereas for a joint operation the venturer will recognize its share of the following conditions exists:
(a) | the Company's work program on a property has significantly changed, so that previously identified resource targets or work programs are no longer being pursued; |
(b) | exploration results are not promising and no more work is being planned in the foreseeable future on the property; or |
(c) | the remaining lease terms for the property are insufficient to conduct necessary studies, exploration work, or mineral extraction. |
Once impairment has been determinedassets, liabilities, revenue and expenses of the joint operation. Under existing IFRS, entities have the choice to proportionately consolidate or equity account for interests in the carrying value of a mineral property, it will be written-down to fair value. Amounts shown for mineral properties reflect costs incurred to date, less impairments,joint ventures. IFRS 11 supersedes IAS 31 Interests in Joint Ventures and are not intended to reflect present or future values.
xvi) Recent Accounting Pronouncements
(a) SIC-13 Jointly Controlled Entities - Non-monetary Contributions by Venturers.
| In February 2008, the CICA announced that Canadian GAAP for publicly accountable enterprises will be replaced by International Financial Reporting Standards as issued by the International Accounting Standards Board (“IFRS”) for interim and annual financial statements for fiscal years beginning on or after January 1, 2011. The pronouncement also requires that comparative figures for 2010 be based on IFRS. The Company has completed the planning and diagnostic stages to identify the impact of adopting IFRS and will continue to invest in training and necessary resources to complete the conversion. The Company continues to monitor and assess the impact of convergence of Canadian GAAP and IFRS. The Company will adopt IFRS commencing with the first quarter of fiscal 2011.
|
AVINO SILVER & GOLD MINES LTD.
Notes to the Consolidated Financial Statements
For the years ended December 31, 2010, 20092011 and 20082010
(Expressed in Canadian dollars)
2.3. SIGNIFICANT ACCOUNTING POLICIES (Continued)(continued)
xvi) Recent Accounting PronouncementsIFRS 12 Disclosure of Interests in Other Entities - IFRS 12 establishes disclosure requirements for interests in other entities, such as joint arrangements, associates, special purpose vehicles and off balance sheet vehicles. The standard carries forward existing disclosures and also introduces significant additional disclosure requirements that address the nature of, and risks associated with, an entity’s interests in other entities.
IFRS 13 Fair Value Measurement - IFRS 13 is a comprehensive standard for fair value measurement and disclosure requirements for use across all IFRS standards. The new standard clarifies that fair value is the price that would be received to sell an asset, or paid to transfer a liability in an orderly transaction between market participants, at the measurement date. It also establishes disclosures about fair value measurement. Under existing IFRS, guidance on measuring and disclosing fair value is dispersed among the specific standards requiring fair value measurements and in many cases does not reflect a clear measurement basis or consistent disclosures.
Amendments to IAS 1 Presentation of Financial Statements - The IASB has amended IAS 1 to require entities to separate items presented in other comprehensive income (“OCI”) into two groups, based on whether or not items may be reclassified into profit or loss in the future. Entities that choose to present OCI items before tax will be required to show the amount of tax related to the two groups separately.
IFRIC 20 Stripping Costs in the Production Phase of a Surface Mine - IFRIC 20 addresses the accounting for overburden waste removal (stripping) costs in the production phase of a surface mine. Stripping activity may result in two types of benefits: i) inventory produced and ii) improved access to ore that will be mined in the future. Stripping costs associated with inventory production should be accounted for as a current production cost in accordance with IAS 2 Inventories, and those associated with improved access to ore should be accounted for as an addition to, or enhancement of, an existing asset.
Amendments to other standards - In addition, there have been other amendments to existing standards, including IAS 27 Separate Financial Statements and IAS 28 Investments in Associates and Joint Ventures. IAS 27 addresses accounting for subsidiaries, jointly controlled entities and associates in non-consolidated financial statements. IAS 28 has been amended to include joint ventures in its scope and to address the changes in IFRS 10 to IFRS 13.
Each of the new standards, IFRS 10 to 13, IFRIC 20 and the amendments to other standards, is effective for the Company beginning on January 1, 2013 with early adoption permitted. The Company has not yet begun the process of assessing the impact that the new standards will have on its consolidated financial statements or whether to early adopt any of the new requirements.
New accounting standards effective January 1, 2015
IFRS 9 Financial Instruments - IFRS 9 was issued in November 2009 and contained requirements for financial assets. This standard addresses classification and measurement of financial assets and replaces the multiple category and measurement models in IAS 39 for debt instruments with a new mixed measurement model having only two categories: Amortized cost and fair value through profit or loss. IFRS 9 also replaces the models for measuring equity instruments and such instruments are either recognized at the fair value through profit or loss or at fair value through other comprehensive income. Where such equity instruments are measured at fair value through other comprehensive income, dividends are recognized in profit or loss to the extent not clearly representing a return of investment; however, others gains and losses (including impairments) associated with such instruments remain in accumulated other comprehensive income indefinitely.
Requirements for financial liabilities were added in October 2010 and they largely carried forward existing requirements in IAS 39, Financial Instruments – Recognition and Measurement, except that fair value changes due to credit risk for liabilities designated at fair value through profit and loss would generally be recorded in other comprehensive income.
AVINO SILVER & GOLD MINES LTD.
Notes to the Consolidated Financial Statements
For the years ended December 31, 2011 and 2010
(Expressed in Canadian dollars)
3. SIGNIFICANT ACCOUNTING POLICIES (continued)
New accounting standards effective January 1, 2015 (continued)
(b)
| CICA Section 1582 Business Combinations, which replaces Section 1581, Business Combinations; CICA Section 1601 Consolidated Financial Statement and Section 1602 Non-Controlling Interests, which replace Section 1600, Consolidated Financial Statements. These new standards are based on the International Financial Reporting Standard 3, Business Combinations. These new standards replace the existing guidance on business combination and consolidated financial statements. These new standards require that most assets acquired and liabilities assumed, including contingent liabilities, to be measured at fair value and all acquisition costs to be expensed. These new standards also require non-controlling interests to be recognized as a separate component of equity and net earnings to be calculated without a deduction for non-controlling interests. The objective of these new standards is to harmonize Canadian accounting for business combinations with the International and United States accounting standards. The new standards are to be applied prospectively to business combinations for which the acquisition date is on or after the beginning of the first annual reporting period beginning on or after January 1, 2011, with earlier application permitted. This standard is effective for the Company for interim and annual financial statements beginning on January 1, 2011. The Company does not expect a significant impact on the adoption of this standard on its consolidated financial statements.
|
IFRS 9 is effective for annual periods beginning on or after January 2015 with early adoption permitted. The Company has not yet begun the process of assessing the impact that the new and amended standards will have on its consolidated financial statements or whether to early adopt any of the new requirements.
3.4. SUBSIDIARY COMPANIA MINERA MEXICANA DE AVINO, S.A. DE C.V.
On February 16, 2009 the Company converted existing loans advanced to its subsidiary Compania Minera Mexicana de Avino, S.A. de C.V. (“Cia Minera”) into new additional shares, resulting in the Company’s ownership increasing by 9.93% to an effective 99.28%. The inter-company loans and the investment in shares of Cia Minera have been eliminated upon consolidation of the financial statements. The Company had a pre-existing effective ownership interest of 89.35% in Cia Minera prior to the 9.93% increase. The issuance of shares to the Company by Cia Minera on February 16, 2009 resulted in a reduction in the non-controlling interest from 10.65% to 0.72% (see Note 4)5).
The historic operations of Cia Minera involved the mining of commercial grade ores which produced silver, gold and copper. This plant and mine ceased operations in November 2001 due to low metal prices and the closure of a smelter. The Company is evaluating the re-activation of the mine and has commenced exploration activities on Cia Minera’s mineral properties in the state of Durango, Mexico (see Note 6)7).
4.5. NON-CONTROLLING INTEREST
As at December, 31, 20102011 the Company has an effective 99.28% interest in its subsidiary Cia Minera, and the remaining 0.72% portion is a non-controlling interest, reflecting a change in ownership interests resulting from the shares that Cia Minera issued to the Company on February 16, 2009 (the “Cia Minera Share Transaction”) as described in Note 3.4. In fiscal 2008 the non-controlling interest of Cia Minera was 10.65% and the 9.93% change in the fiscal 2009 ownership resultsresulted in a reduction of the non-controlling interest.
Prior to the Company’s transition to IFRS on January 1, 2010 Cia Minera’s operations have generated recurring losses since the Company acquired control of Cia Minera on July 17, 2006 and thelosses. The owners of the minority interest havehad not funded and are not required(nor were they required) to fund their share of Cia Minera’s net losses and havehad not demonstrated any commitment for funding. Accordingly, the non-controlling interest in Cia Minera operating losses are not recognized as a recoverable asset in these financial statements and there is no allocation of consolidated net losses to the minority interests.non-controlling interest was recognised.
AVINO SILVER & GOLD MINES LTD.
NotesIFRS requires that total comprehensive income be attributed to non-controlling interests even if this results in the Consolidated Financial Statements
Fornon-controlling interests having a deficit balance. However, IFRS also stipulated that this provision only be applied from the years ended December 31, 2010, 2009date of transition and 2008
(Expressed in Canadian dollars)
4. NON-CONTROLLING INTEREST (Continued)
The Cia Minera Share Transaction is accountedtherefore no adjustment has been made for as a capital transaction and the fundslosses incurred prior to transition that were previously advancednot allocated to Cia Minera are consolidated in the financial statements as assets, expenditures or deficit according to the full use of the funds in 2009 or past years. The minority interest has not contributed any assets or funds for Cia Minera’s operations and no past losses have been attributed as recoverable from the minority interest, therefore upon the reduction of the minority interest in fiscal 2009 there were no adjustments affecting the balances presented in the consolidated financial statements.
5. PROPERTY, PLANT AND EQUIPMENT
| | | Cost | | | Accumulated Amortization | | | 2010 Net Book Value | | | 2009 Net Book Value | |
| Office equipment, furniture and fixtures | | $ | 6,482 | | | $ | 4,796 | | | $ | 1,686 | | | $ | 955 | |
| Computer equipment | | | 27,642 | | | | 7,853 | | | | 19,789 | | | | 21,055 | |
| Mine mill, machinery and processing plant | | | 1,706,542 | | | | - | | | | 1,706,542 | | | | 1,387,082 | |
| Mine facilities and equipment | | | 62,691 | | | | 4,691 | | | | 58,000 | | | | 46,054 | |
| | | $ | 1,803,357 | | | $ | 17,340 | | | $ | 1,786,017 | | | $ | 1,455,146 | |
6. MINERAL PROPERTIES
| | | | | | British | | | | | | | |
| | | Durango | | | Columbia | | | Yukon | | | | |
| | | Mexico | | | Canada | | | Canada | | | Total | |
| | | | | | | | | | | | | |
| Balance, December 31, 2008 | | $ | 14,251,649 | | | $ | 608,121 | | | $ | 1,754 | | | $ | 14,861,524 | |
| | | | | | | | | | | | | | | | | |
| Exploration costs incurred during year: | | | | | | | | | | | | | | | | |
| Assays | | | 9,480 | | | | - | | | | - | | | | 9,480 | |
| Assessment and taxes | | | 40,948 | | | | - | | | | - | | | | 40,948 | |
| Drilling | | | 156,612 | | | | - | | | | - | | | | 156,612 | |
| Geological | | | 143,149 | | | | - | | | | - | | | | 143,149 | |
| Sale of concentrate | | | (30,089 | ) | | | - | | | | - | | | | (30,089 | ) |
| Less write down on properties | | | - | | | | (608,118 | ) | | | - | | | | (608,118 | ) |
| Balance, December 31, 2009 | | $ | 14,571,749 | | | $ | 3 | | | $ | 1,754 | | | $ | 14,573,506 | |
| | | | | | | | | | | | | | | | | |
| Exploration costs incurred during year: | | | | | | | | | | | | | | | | |
| Assays | | | 56,032 | | | | - | | | | - | | | | 56,032 | |
| Assessment and taxes | | | 45,893 | | | | - | | | | - | | | | 45,893 | |
| Drilling and exploration | | | 1,470,996 | | | | - | | | | - | | | | 1,470,996 | |
| Geological | | | 201,139 | | | | - | | | | 750 | | | | 201,889 | |
| Sale of concentrate | | | (1,046,005 | ) | | | - | | | | - | | | | (1,046,005 | ) |
| | | | | | | | | | | | | | | | | |
| Balance, December 31, 2010 | | $ | 15,299,804 | | | $ | 3 | | | $ | 2,504 | | | $ | 15,302,311 | |
AVINO SILVER & GOLD MINES LTD.
Notes to the Consolidated Financial Statements
For the years ended December 31, 2010, 20092011 and 20082010
(Expressed in Canadian dollars)
6. SALES TAXES RECOVERABLE
The Company’s sales tax recoverable consists of the Mexican I.V.A. a Value-Added Tax (“VAT”) and the Canadian Harmonized Sales Tax (“HST”) recoverable.
| | | December 31, 2011 | | | December 31, 2010 | |
| | | | | | | |
| VAT recoverable | | $ | 252,621 | | | $ | 267,466 | |
| Write-down provision | | | (46,640 | ) | | | (50,959 | ) |
| | | | | | | | | |
| VAT net carrying amount | | | 205,981 | | | | 216,507 | |
| HST recoverable | | | 22,839 | | | | 17,181 | |
| | | | | | | | | |
| Sales tax recoverable | | $ | 228,820 | | | $ | 233,688 | |
The Company records the VAT net of a write-down provision, reflecting an estimate of the amount of VAT recoverable based on past collection history and the length of time amounts are outstanding.
7. MINERAL PROPERTIES AND EXPLORATION COSTS
The Company has accumulated the following acquisition and exploration expenditures:
| | | | | | British | | | | | | | |
| | | Durango | | | Columbia | | | Yukon | | | | |
| | | Mexico | | | Canada | | | Canada | | | Total | |
| | | | | | | | | | | | | |
| Balance, January 1, 2010 | | $ | 14,415,084 | | | $ | 3 | | | $ | 1,754 | | | $ | 14,416,841 | |
| | | | | | | | | | | | | | | | | |
| Exploration costs incurred during year: | | | | | | | | | | | | | | | | |
| Assays | | | 54,334 | | | | - | | | | - | | | | 54,334 | |
| Assessment and taxes | | | 44,500 | | | | - | | | | - | | | | 44,500 | |
| Drilling and exploration | | | 1,426,367 | | | | - | | | | - | | | | 1,426,367 | |
| Geological | | | 195,037 | | | | - | | | | 750 | | | | 195,787 | |
| Sale of concentrate | | | (1,014,270 | ) | | | - | | | | - | | | | (1,014,270 | ) |
| Effect of movement in exchange rates | | | (228,716 | ) | | | - | | | | - | | | | (228,716 | ) |
| Balance, December 31, 2010 | | $ | 14,892,336 | | | $ | 3 | | | $ | 2,504 | | | $ | 14,894,843 | |
| | | | | | | | | | | | | | | | | |
| Exploration costs incurred during the year: | | | | | | | | | | | | | | | | |
| Assays | | | 89,147 | | | | - | | | | - | | | | 89,147 | |
| Assessment and taxes | | | 30,759 | | | | - | | | | - | | | | 30,759 | |
| Drilling and exploration | | | 3,248,382 | | | | - | | | | - | | | | 3,248,382 | |
| Geological | | | 460,565 | | | | - | | | | 2,640 | | | | 463,205 | |
| Sale of concentrate | | | (3,114,552 | ) | | | - | | | | - | | | | (3,114,552 | ) |
| Depreciation of property, plant, and equipment | | | 232,821 | | | | - | | | | - | | | | 232,821 | |
| Reclamation provision | | | 292,000 | | | | - | | | | - | | | | 292,000 | |
| Effect of movement in exchange rates | | | 137,749 | | | | - | | | | - | | | | 137,749 | |
| | | | | | | | | | | | | | | | | |
| Balance, December 31, 2011 | | $ | 16,269,207 | | | $ | 3 | | | $ | 5,144 | | | $ | 16,274,354 | |
AVINO SILVER & GOLD MINES LTD.
Notes to the Consolidated Financial Statements
For the years ended December 31, 2011 and 2010
(Expressed in Canadian dollars)
6.7. MINERAL PROPERTIES (Continued)AND EXPLORATION COSTS (continued)
The Company is in the exploration stage and therefore proceeds from the sale of concentrate are recorded as a reduction in mineral properties. The Company’s concentrate sales are based on quoted market prices less treatment and refining charges and penalties. During the year ended December 31, 2010, the Company recorded concentrate sales of $1,046,005 (2009 - $30,089). At December 31, 2010, $117,940 (2009 - $Nil) of the total sales amount was receivable from the customer. The receivable was collected in January 2011.
Additional information on the Company’s mineral properties by region is as follows:
(a) Durango, Mexico
The Company’s subsidiary Cia Minera owns 42 mineral claims and leases 4 mineral claims under leased concessions in the state of Durango, Mexico. In addition fourThe Company’s mineral claims in Mexico are underdivided into the following four groups:
| (i) | Avino mine area property |
The Avino mine property is situated around the towns of Panuco de Coronado and San Jose de Avino and surrounding the formerly producing Avino mine. There are four exploration concessions covering 154.4 hectares, 24 exploitation concessions covering 1,284.7 hectares and one leased exploitation concession covering 98.83 hectares.
| (ii) | Gomez Palacio property |
The Gomez Palacio property is located near the town of Gomez Palacio, Durango, Mexico. There are nine exploration concessions –covering 2,549 hectares.
The Papas Quiero property is located near the village of Papas Quiero, Durango, Mexico. There are four exploration concessions covering 2,552.6 hectares and one exploitation rightsconcession covering 602.9 hectares.
| (iv) | Unification Las Platosa properties |
The Unification Las Platosa properties are situated with the Avino property around the towns of Panuco de Coronado and San Jose de Avino and surrounding the formerly producing Avino mine. Under a royalty agreement covering three mineral concessions, Cia Minera shall pay to Minerales de Avino royalties of 3.5% on mineral extracted, processed and forsold from the Unification La Platosa, San Carlos, and San Jose concessions. The royalties are granted byto be calculated on a lease agreement, to Cia Minera from Minerales de Avino SA de CV. The twobase of net sales (net smelter payment less the cost of sales) less the process costs at the mine. Two of the leased concessions Primer Rey and Avino y Emma, are included in the lease agreement, but are discrete and lie under the town of San Jose de Avino. The lease agreement expired onis valid until October 31, 2010 and2010. The Company renegotiated the Company is currently renegotiating the agreement.agreement in February 2012, refer to Note 21 (b).
(b) British Columbia, Canada
The Company’s mineral claims in Mexico are summarized inBritish Columbia encompass the following property groups:three properties:
| (i) | Avino mine areaAumax propertyThe Avino mine property is situated around the towns of Panuco de Coronado and San Jose de Avino and surrounding the formerly producing Avino mine. There are four exploration concessions covering 154.4 hectares, 24 exploitation concessions covering 1,284.7 hectares and one leased exploitation concession covering 98.83 hectares.
|
The Company owns a 100% interest in a Crown granted mineral claim, located in the Lillooet Mining Division of British Columbia, Canada.
| (ii) | Gomez PalacioMinto propertyThe Gomez Palacio property is located near the town of Gomez Palacio, Durango, Mexico. There are nine exploration concessions covering 2,549 hectares.
|
The Company has a 100% interest in a Crown granted mineral claim situated in the Lillooet Mining Division of British Columbia.
| (iii) | Papas QuieroOlympic-Kelvin property
The Papas Quiero property is located near the village of Papas Quiero, Durango, Mexico. There are four exploration concessions covering 2,552.6 hectares and one exploitation concession covering 602.9 hectares.
|
(ix) | Stackpole area propertyThe Company has a 100% interest in six Crown granted mineral claims located in the Lillooet Mining Division of British Columbia.
The Stackpole area property is situated with the Avino mine property around the towns of Panuco de Coronado and San Jose de Avino and surrounding the formerly producing Avino mine. Under a royalty agreement covering three mineral concessions, Cia Minera shall pay to Minerales de Avino royalties of 3.5% on mineral extracted, processed and sold from the Unification La Platosa, San Carlos and San Jose concessions. The royalties are to be calculated on a base of net sales (net smelter payment less the cost of sales) less other commercialization and transportation costs. The lease agreement expired on October 31, 2010 and is currently under renegotiation.
|
The Company owns 100% interest in 14 quartz leases located in the Mayo Mining Division of the Yukon, Canada.
AVINO SILVER & GOLD MINES LTD.
Notes to the Consolidated Financial Statements
For the years ended December 31, 2011 and 2010
(Expressed in Canadian dollars)
8. PROPERTY, PLANT AND EQUIPMENT
| | | Office equipment, furniture and fixtures | | | Computer equipment | | | Mine machinery and transportation equipment | | | Mill machinery and processing equipment | | | Buildings and construction | | | TOTAL | |
| | | $ | | | $ | | | $ | | | $ | | | $ | | | $ | |
| COST | | | | | | | | | | | | | | | | | | | | | | | | |
| Balance at January 1, 2010 | | | 5,513 | | | | 27,068 | | | | 146,103 | | | | 1,127,911 | | | | 131,697 | | | | 1,438,292 | |
| Additions | | | 749 | | | | - | | | | 70,877 | | | | 57,159 | | | | 195,575 | | | | 324,360 | |
| Effect of movement in exchange rates | | | (13 | ) | | | (361 | ) | | | (15,800 | ) | | | (2,893 | ) | | | (4,365 | ) | | | (23,432 | ) |
| Balance at December 31, 2010 | | | 6,249 | | | | 26,707 | | | | 201,180 | | | | 1,182,177 | | | | 322,907 | | | | 1,739,220 | |
| Additions | | | 7,855 | | | | 5,174 | | | | 970,763 | | | | 499,661 | | | | - | | | | 1,483,453 | |
| Effect of movement in exchange rates | | | 76 | | | | 578 | | | | 21,274 | | | | 30,176 | | | | 5,862 | | | | 57,966 | |
| Balance at December 31, 2011 | | | 14,180 | | | | 32,459 | | | | 1,193,217 | | | | 1,712,014 | | | | 328,769 | | | | 3,280,639 | |
| | | | | | | | | | | | | | | | | | | | | | | | | |
| ACCUMULATED DEPRECIATION | | | | | | | | | | | | | | | | | | | | | |
| Balance at January 1, 2010 | | | 4,558 | | | | 6,450 | | | | 2,313 | | | | - | | | | - | | | | 13,321 | |
| Additions | | | 50 | | | | 1,226 | | | | 2,256 | | | | - | | | | - | | | | 3,532 | |
| Effect of movement in exchange rates | | | (8 | ) | | | (102 | ) | | | (61 | ) | | | - | | | | - | | | | (171 | ) |
| Balance at December 31, 2010 | | | 4,600 | | | | 7,574 | | | | 4,508 | | | | - | | | | - | | | | 16,682 | |
| Additions | | | 1,305 | | | | 6,594 | | | | 139,558 | | | | 71,745 | | | | 16,364 | | | | 235,566 | |
| Effect of movement in exchange rates | | | 7 | | | | 256 | | | | 2,582 | | | | 1,285 | | | | 292 | | | | 4,422 | |
| Balance at December 31, 2011 | | | 5,912 | | | | 14,424 | | | | 146,648 | | | | 73,030 | | | | 16,656 | | | | 256,670 | |
| | | | | | | | | | | | | | | | | | | | | | | | | |
| NET BOOK VALUE | | | | | | | | | | | | | | | | | | | | | | | | |
| | | | | | | | | | | | | | | | | | | | | | | | | |
| At December 31, 2011 | | | 8,268 | | | | 18,035 | | | | 1,046,569 | | | | 1,638,984 | | | | 312,113 | | | | 3,023,969 | |
| At January 1, 2010 | | | 955 | | | | 20,618 | | | | 143,790 | | | | 1,127,911 | | | | 131,697 | | | | 1,424,971 | |
| At December 31, 2010 | | | 1,649 | | | | 19,133 | | | | 196,672 | | | | 1,182,177 | | | | 322,907 | | | | 1,722,538 | |
AVINO SILVER & GOLD MINES LTD.
Notes to the Consolidated Financial Statements
For the years ended December 31, 2010, 20092011 and 20082010
(Expressed in Canadian dollars)
6. MINERAL PROPERTIES (Continued)
(b) British Columbia, Canada
The Company’s mineral claims in British Columbia encompass the following three properties:
(i) | Aumax property
The Company owns a 100% interest in a Crown granted mineral claim, located in the Lillooet Mining Division of British Columbia, Canada that was acquired in 2003 by issuing 200,000 common shares at a price of $0.50 per share and paying $4,000 in cash for total consideration of $104,000.
|
(ii) | Minto property
The Company has a 100% interest in a Crown granted mineral claim situated in the Lillooet Mining Division of British Columbia.
|
(iii) | Olympic-Kelvin property
The Company has a 100% interest in six Crown granted mineral claims located in the Lillooet Mining Division of British Columbia.
|
In 2009, the Company wrote down the value of the three British Columbia properties to a nominal value of $1 each. The Company is keeping all claims in good standing however no exploration is currently planned for these properties.
(a) Yukon, Canada
In 2003 the Company acquired a 100% interest in 14 quartz leases, located in the Mayo Mining Division of the Yukon, Canada by issuing 200,000 common shares at a price of $0.50 per share for total consideration of $100,000. The property was written down to a nominal value of $1 in fiscal 2006.
On November 12, 2008 and amended April 1, 2009, the Company entered into an option agreement with Mega Silver Inc. (“Mega Silver”), whereby Mega Silver can earn the excusive right and option to acquire a 100% title and interest in the Eagle Property located in the Yukon Territory. During 2008 the Company received $25,000 upon execution of the agreement which was recorded in income. In 2009 the Company received a notice from Mega Silver which terminated the option agreement.
AVINO SILVER & GOLD MINES LTD.
Notes to the Consolidated Financial Statements
For the years ended December 31, 2010, 2009 and 2008
(Expressed in Canadian dollars)
7.9. INVESTMENTS IN RELATED COMPANIES
Investments in related companies comprise the following:
| | | | | | Accumulated | | | Fair | | | Fair | | |
| | | | | | Unrealized | | | Value | | | Value | | | | | | Accumulated Unrealized | | | Fair Value December 31, | | | Fair Value December 31, | | | Fair Value January 1, | |
| | | Cost | | | Gains | | | 2010 | | | 2009 | | | Cost | | | Gains (Losses) | | | 2011 | | | 2010 | | | 2010 | |
| | | | | | | | | | | | | | | | | | | | | | | | | | | | |
| (a) Bralorne Gold Mines Ltd. | | $ | 205,848 | | | $ | 23,463 | | | $ | 229,311 | | | $ | 143,319 | | | $ | 205,848 | | | $ | (55,363 | ) | | $ | 150,485 | | | $ | 229,311 | | | $ | 143,319 | |
| (b) Levon Resources Ltd. | | | 4,236 | | | | 283,812 | | | | 288,048 | | | | 60,716 | | | | 4,236 | | | | 149,672 | | | | 153,908 | | | | 288,048 | | | | 60,716 | |
(c) Oniva InternationalServices Corp. | | | 1 | | | | - | | | | 1 | | | | 1 | | |
| (c) Oniva International Services Corp. | | | | 1 | | | | - | | | | 1 | | | | 1 | | | | 1 | |
| | | | | | | | | | | | | | | | | | | | | | | | | | | | | | | | | | | | | |
| | | $ | 210,085 | | | $ | 307,275 | | | $ | 517,360 | | | $ | 204,036 | | | $ | 210,085 | | | $ | 94,309 | | | $ | 304,394 | | | $ | 517,360 | | | $ | 204,036 | |
During 2010the year, the Company recorded a $212,966 (2010 - $313,324 (2009 - $97,517)gain) unrealized gainloss on investments in related companies, classified as available-for-sale in other comprehensive income, representing the increasechange in fair value during the year.
(a) Bralorne Gold Mines Ltd. (“Bralorne”)
The Company’s investment in Bralorne consists of 179,149 common shares with a quoted market value of $229,311$150,485 as at December 31, 2011 (December 31, 2010 (2009- $229,311; January 1, 2010 - $143,319). Bralorne is a public company with common directors.
(b) Levon Resources Ltd. (“Levon”)
The Company’s investment in Levon consists of 141,200 common shares with a quoted market value of $288,048$153,908 as at December 31, 2011 (December 31, 2010 (2009- $288,048; January 1, 2010 - $60,716). Levon is a public company with common directors.
(c) Oniva International Services Corp. (“Oniva”)
The Company owns a 16.67% interest in Oniva, a private company with common management, which provides office and administration services to the Company. The remaining 83.33% is shared equally between five other companies that are related by some common directors and management. See Note 1315 for disclosure on the Company’s commitment to Oniva.
8. SALES TAXES RECOVERABLE10. RECLAMATION PROVISION
Management has estimated that the present value of its reclamation provision at December 31, 2011 is $292,000 (December 31, 2010 - nil). On December 31, 2011 this cost was recognized and added to the capitalized cost of mineral properties. The Company’s sales tax recoverable consistspresent value of the Mexican I.V.A.obligation was calculated using a Value-Added Tax (“VAT”)risk-free interest rate of 7% and the Canadian Harmonized Sales Tax (“HST”) recoverable.
| | | | | | | |
| | | 2010 | | | 2009 | |
| | | | | | | |
| VAT recoverable | | $ | 267,084 | | | $ | 92,706 | |
| Write-down provision | | | (50,887 | ) | | | (8,873 | ) |
| | | | | | | | | |
| VAT net carrying amount | | | 216,197 | | | | 83,833 | |
| HST recoverable | | | 17,181 | | | | 4,892 | |
| | | | | | | | | |
| Sales tax recoverable | | $ | 233,378 | | | $ | 88,725 | |
an inflation rate of 4%. Reclamation activities are estimated to occur over a one-year period beginning in 2018. The Company records the VAT net of a write-down provision, reflecting an estimateundiscounted value of the amount of the VAT recoverable based on past collection history and the length of time amounts are outstanding. During 2010 the Company received VAT refunds including interest totalling $147,462 for past claims included in the December 31, 2010 and December 31, 2009 balances of VAT recoverable.obligation is $355,200 (2010 - $nil).
AVINO SILVER & GOLD MINES LTD.
Notes to the Consolidated Financial Statements
For the years ended December 31, 2010, 20092011 and 20082010
(Expressed in Canadian dollars)
9.11. SHARE CAPITAL
| (a) | Authorized: Unlimited common shares without par value |
| (i) | On December 20, 2010, the Company closed a non-brokered private placement issuing 2,700,000 units at a price of $1.90 per unit for gross proceeds of $5,130,000. Each unit is comprised of one common share and one non-transferrable share purchase warrant. Each share purchase warrant is exercisable for a term for a term of three years into one common share at a price of $2.50 per share until December 22, 2013. The Company paid a cash commission equal to 5% of the applicable gross proceeds from units sold to such investors ($210,900) and compensation warrants to purchase common shares of the Company equal to 5% of the units sold under the offering (111,000 units).
The fair value of the warrants and compensation warrants have been estimated using the Black-
ScholesBlack-Scholes option pricing model using the following assumptions: risk-free interest rate of 1.90%, dividend yield of nil, volatility of 84.87%, and an expected life of three years. Of the $5,130,000 total aggregate proceeds raised $3,252,285 was attributed to common shares and the residual amount of $1,877,715 was attributed to the common share purchase warrants, which has been recorded in contributed surplus.equity reserve. The fair value of the compensation warrants were valued at $180,082.
|
| (ii) | On November 10, 2010, the Company closed a non-brokered private placement issuing 2,400,000 units at a price of $1.25 per unit for gross proceeds of $3,000,000. Each unit is comprised of one common share and one non-transferrable share purchase warrant. Each share purchase warrant is exercisable for a term for a term of three years into one common share at a price of $1.52 per share until November 10, 2013. The fair value of the warrants has been estimated using the Black-Scholes option pricing model using the following assumptions: risk-free interest rate of 1.94%, dividend yield of nil, volatility of 83.86%, and an expected life of three years. Of the $3,000,000 total aggregate proceeds raised $1,855,329 was attributed to common shares and the residual amount of $1,144,671 was attributed to common share purchase warrants, which has been recorded in contributed surplus. |
| | | Underlying Shares | | | Weighted Average Exercise Price | |
| Balance, December 31, 2009 and 2008 | | | 2,498,750 | | | $ | 2.50 | |
| | | | | | | | | |
| Issued | | | 5,211,000 | | | $ | 2.05 | |
| Expired | | | (2,498,750 | ) | | $ | 2.50 | |
| | | | | | | | | |
| Balance, December 31, 2010 | | | 5,211,000 | | | $ | 2.05 | |
During the year ended December, 2011 there were no warrants issued or exercised. Details of share purchase warrants outstanding are:
| | | Underlying Shares | | | Weighted Average Exercise Price | |
| Balance, December 31, 2009 | | | 2,498,750 | | | $ | 2.50 | |
| | | | | | | | | |
| Issued | | | 5,211,000 | | | $ | 2.05 | |
| Expired | | | (2,498,750 | ) | | $ | 2.50 | |
| Balance, December 31, 2010 | | | 5,211,000 | | | $ | 2.05 | |
| Balance, December 31, 2011 | | | 5,211,000 | | | $ | 2.05 | |
AVINO SILVER & GOLD MINES LTD.
Notes to the Consolidated Financial Statements
For the years ended December 31, 2010, 20092011 and 20082010
(Expressed in Canadian dollars)
9.11. SHARE CAPITAL (Continued)
(c) Warrants (continued)
Details of share purchase warrants outstanding as of December 31, 20102011 and 2009December 31, 2010 are:
| Number of Warrants Outstanding and Exercisable | | | | | |
| 2010 | | 2009 | | | Exercise Price per Share | | Expiry Date |
| | | | | | | | |
| | 2,400,000 | | | | - | | | $ | 1.52 | | November 10, 2013 |
| | 2,811,000 | | | | - | | | $ | 2.50 | | December 22, 2013 |
| | - | | | | 2,498,750 | | | $ | 2.50 | | March 10, 2010 |
| | | | | | | | | | | | |
| | 5,211,000 | | | | 2,498,750 | | | | | | |
| | | | | | | |
| | | | | | Warrants Outstanding and Exercisable | |
| Expiry Date | | | | | December 31, 2011 | | December 31, 2010 | |
| | | | | | | | | |
November 10, 2013 | | $ | 1.52 | | | | 2,400,000 | | | | 2,400,000 | |
December 22, 2013 | | $ | 2.50 | | | | 2,811,000 | | | | 2,811,000 | |
| | | | | | | | 5,211,000 | | | | 5,211,000 | |
(d) | Stock optionsThe Company has a stock option plan under which it may grant stock options up to 10% of the Company’s total number of shares issued and outstanding on a non-diluted basis. The stock option plan provides for the granting of stock options to regular employees and persons providing investor-relation or consulting services up to a limit of 5% and 2% respectively of the Company’s total number of issued and outstanding shares per year. The stock options vest on the date of grant, except for those issued to persons providing investor-relation or consulting services, which vest over a period of one year. The option price must be greater or equal to the discounted market price on the grant date and the option term cannot exceed five years from the grant date.
|
| | | Underlying Shares | | | Weighted Average Exercised Price | |
| | | | | | | |
| Stock options outstanding, December 31, 2008 | | | 1,854,500 | | | $ | 2.85 | |
| Granted | | | 160,000 | | | $ | 0.75 | |
| Expired or cancelled | | | (195,000 | ) | | $ | 2.49 | |
| | | | | | | | | |
| Stock options outstanding, December 31, 2009 | | | 1,819,500 | | | $ | 0.88 | * |
| Granted | | | 520,000 | | | $ | 1.05 | |
| Expired or cancelled | | | (262,000 | ) | | $ | 0.85 | |
| Exercised | | | (472,500 | ) | | $ | 0.75 | |
| | | | | | | | | |
| Stock options outstanding, December 31, 2010 | | | 1,605,000 | | | $ | 0.97 | * |
AVINO SILVER & GOLD MINES LTD.
Notes to the Consolidated Financial Statements
For the years ended December 31, 2010, 2009 and 2008
(Expressed in Canadian dollars)
9. SHARE CAPITAL (Continued)
DetailsThe Company has a stock option plan under which it may grant stock options up to 10% of the Company’s total number of shares issued and outstanding on a non-diluted basis. The stock option plan provides for the granting of stock options to regular employees and persons providing investor-relation or consulting services up to a limit of 5% and 2% respectively of the Company’s total number of issued and outstanding are:shares per year. The stock options vest on the date of grant, except for those issued to persons providing investor-relation or consulting services, which vest over a period of one year. The option price must be greater or equal to the discounted market price on the grant date and the option term cannot exceed five years from the grant date.
| Expiry Date | | Exercise Price | | | 2010 Stock Options Outstanding | | | 2009 Stock Options Outstanding | |
| | | | | | | | | | |
| April 5, 2010 | | $ | 1.35 | | | | - | | | | 42,500 | |
| April 5, 2010 | | $ | 0.75 | * | | | - | | | | 219,500 | |
| September 26, 2010 | | $ | 0.75 | * | | | - | | | | 52,500 | |
| April 26, 2011 | | $ | 3.99 | | | | 60,000 | | | | 60,000 | |
| April 26, 2011 | | $ | 0.75 | * | | | 600,000 | | | | 865,000 | |
| February 26, 2013 | | $ | 1.65 | | | | 10,000 | | | | 10,000 | |
| February 26, 2013 | | $ | 0.75 | * | | | 340,000 | | | | 410,000 | |
| December 9, 2013 | | $ | 2.00 | | | | 20,000 | | | | - | |
| September 22, 2014 | | $ | 0.75 | | | | 75,000 | | | | 160,000 | |
| January 14, 2015 | | $ | 0.81 | | | | 75,000 | | | | - | |
| September 10, 2015 | | $ | 1.05 | | | | 425,000 | | | | - | |
| | | | | | | | | | | | | |
| | | | | | | | 1,605,000 | | | | 1,819,500 | |
| | | Underlying Shares | | | Weighted Average Exercised Price | |
| | | | | | | |
| Stock options outstanding, December 31, 2009 | | | 1,819,500 | | | $ | 0.88 | * |
| Granted | | | 520,000 | | | $ | 1.05 | |
| Expired or cancelled | | | (262,000 | ) | | $ | 0.85 | |
| Exercised | | | (472,500 | ) | | $ | 0.75 | |
| | | | | | | | | |
| Stock options outstanding, December 31, 2010 | | | 1,605,000 | | | $ | 0.97 | |
| Granted | | | 1,840,000 | | | $ | 2.16 | |
| Expired or cancelled | | | (70,000 | ) | | $ | 3.53 | |
| Exercised | | | (753,000 | ) | | $ | 0.79 | |
| | | | | | | | | |
| Stock options outstanding, December 31, 2011 | | | 2,622,000 | | | $ | 1.80 | |
| | * Repriced during the year ended December 31, 2009, the Company’s shareholders and the TSX Venture Exchange approved a re-pricingre pricing of options for directors and employees. See Note 10. |
AVINO SILVER & GOLD MINES LTD.
Notes to the Consolidated Financial Statements
For the years ended December 31, 2011 and 2010
(Expressed in Canadian dollars)
11. SHARE CAPITAL (continued)
| (d) | Stock options (continued) |
AsDetails of December 31, 2010, 1,605,000 stock options (2009 – 1,819,500) were exercisable with a weighted average remaining contractual life of 2.24 years (2009 – 1.87 years).outstanding are:
10. STOCK-BASED COMPENSATION| | | | | | Stock Options Outstanding | |
| Expiry Date | | Exercise Price | | | December 31, 2011 | | | December 31, 2010 | |
| | | | | | | | | | |
| April 26, 2011 | | $ | 3.99 | | | | - | | | | 60,000 | |
| April 26, 2011 | | $ | 0.75 | | | | - | | | | 600,000 | |
| February 27, 2013 | | $ | 1.65 | | | | 10,000 | | | | 10,000 | |
| February 27, 2013 | | $ | 0.75 | | | | 295,000 | | | | 340,000 | |
| December 9, 2013 | | $ | 2.00 | | | | 20,000 | | | | 20,000 | |
| September 22, 2014 | | $ | 0.75 | | | | 60,000 | | | | 75,000 | |
| January 14, 2015 | | $ | 0.81 | | | | 60,000 | | | | 75,000 | |
| September 10, 2015 | | $ | 1.05 | | | | 337,000 | | | | 425,000 | |
| January 18, 2016 | | $ | 2.30 | | | | 1,010,000 | | | | - | |
| September 30, 2016 | | $ | 2.00 | | | | 830,000 | | | | - | |
| | | | | | | | | | | | | |
| | | | | | | | 2,622,000 | | | | 1,605,000 | |
12. SHARE-BASED PAYMENTS
During 2010the year ended December 31, 2011, the Company granted stock options to various directors, officers, employees, consultants, and investor relations of the Company to purchase up to a total of 520,0001,840,000 common shares at a weighted average exercise price of $1.05$2.16 per share pursuant to the Company’s stock option plan. The options vest on dates ranging from the grant date to September 30, 2011.2012. The options are exercisable on or before September 10, 2015. The Company recorded stock-based compensation expense of $361,784 for these stock options.30, 2016.
The Company recorded total amount of stock based compensationshare-based payment expense in the amount of $361,784 (2009$2,529,620 (2010 - $237,887; 2008 - $606,000)$341,748).
Investor relations expenses consist of expenses relating to disseminated publications and other communications with shareholders, required by regulatory or other authorities. During 2010, investor relations consultants were granted 25,000 options (2009 - Nil, 2008 - 20,000). The fair value of these investor relations options are $28,880 (2009 – $Nil, 2008 - $20,200) which have been included in stock-based compensation expense.
AVINO SILVER & GOLD MINES LTD.
Notes to the Consolidated Financial Statements
For the years ended December 31, 2010, 2009 and 2008
(Expressed in Canadian dollars)
10. STOCK-BASED COMPENSATION (Continued)The fair value of stock options vesting to investor relations consultants were calculated using the following assumptions: risk-free rate ranging from 2.56% to 2.41%, dividend yield rate of nil, volatility of 79% and an expected life ranging from 4.7 years to 4.75 years.
During 2009, the TSX Venture Exchange approved an amendment to the terms of 1,547,000 outstanding options held by directors and employees by adjusting the exercise price to $0.75 per share. The options previously had exercise prices ranging from $1.35 to $3.99. There were no adjustments to the life of the options. Additional stock based compensation of $175,487 in 2009 relates to the re-pricing of the options.
Option-pricing requires the use of highly subjective estimates and assumptions including the expected stock price volatility. Changes in the underlying assumptions can materially affect the fair value estimates. The fair value of the options re-priced and granted to officers, directors, consultants, and employees was calculated using the Black-Scholes model with following weighted average assumptions and resulting grant date fair value:
| | | 2010 | | | 2009 | | | 2008 | |
| Weighted average assumptions: | | | | | | | | | |
| Risk-free interest rate | | | 2.08 | % | | | 1.38 | % | | | 3.32 | % |
| Expected dividend yield | | | – | | | | – | | | | - | |
| Expected option life (years) | | | 4.83 | | | | 2.27 | | | | 5 | |
| Expected stock price volatility | | | 74.95 | % | | | 94.84 | % | | | 78.23 | % |
| Weighted average fair value at grant date | | $ | 0.67 | | | $ | 0.16 | | | $ | 1.01 | |
11. RELATED PARTY TRANSACTIONS AND BALANCES
In the normal course of operations the Company transacts with companies related to Avino’s directors or officers. The balances and transactions with related parties not disclosed elsewhere in these financial statements are as follows:
(a) | Amounts due to related parties: |
| | | 2010 | | | 2009 | |
| Directors | | $ | 10,500 | | | $ | 18,000 | |
| Frobisher Securities Ltd. | | | 4,687 | | | | 516 | |
| Oniva International Services Corp. | | | 153,289 | | | | 145,120 | |
| Sampson Engineering Inc. | | | 789 | | | | 1,054 | |
| | | $ | 169,265 | | | $ | 164,690 | |
The amounts due to related parties are non-interest bearing, unsecured and due on demand.
(b) | The Company recorded the following amounts for management and consulting services provided by the following companies: |
| | | 2010 | | | 2009 | | | 2008 | |
| | | | | | | | | | |
| Intermark Capital Corp | | $ | 96,000 | | | $ | 96,000 | | | $ | 96,000 | |
| Wear Wolfin Design Ltd. | | | 30,000 | | | | 30,000 | | | | 30,000 | |
| | | $ | 126,000 | | | $ | 126,000 | | | $ | 126,000 | |
| | | December 31, 2011 | | | December 31, 2010 | |
| Weighted average assumptions: | | | | | | |
| Risk-free interest rate | | | 2.05 | % | | | 2.08 | % |
| Expected dividend yield | | | - | | | | – | |
| Expected option life (years) | | | 4.99 | | | | 4.83 | |
| Expected stock price volatility | | | 76.17 | % | | | 74.95 | % |
| Weighted average fair value at grant date | | $ | 1.38 | | | $ | 0.67 | |
AVINO SILVER & GOLD MINES LTD.
Notes to the Consolidated Financial Statements
For the years ended December 31, 2010, 20092011 and 20082010
(Expressed in Canadian dollars)
11.13. RELATED PARTY TRANSACTIONS AND BALANCES (Continued)
| (a) | Management transactions |
The Company has identified its directors and certain senior officers as its key management personnel. The compensation costs for key management personnel for the years ended December 31, 2011 and 2010 are as follows:
| | | December 31, 2011 | | | December 31, 2010 | |
| Salaries and benefits | | $ | 362,173 | | | $ | 149,542 | |
Share‐based payments | | | 2,009,400 | | | | 186,200 | |
| | | $ | 2,371,573 | | | $ | 335,742 | |
| (b) | In the normal course of operations the Company transacts with companies related to Avino’s directors or officers. At December 31, 2011 and December 31, 2010 the following amounts are due from related parties: |
| | | December 31, 2011 | | | December 31, 2010 | |
| Directors | | $ | 19,625 | | | $ | 10,500 | |
| Frobisher Securities Ltd. | | | - | | | | 4,687 | |
| Oniva International Services Corp. | | | 179,338 | | | | 153,289 | |
| Sampson Engineering Inc. | | | 4,800 | | | | 789 | |
| | | $ | 203,763 | | | $ | 169,265 | |
| (c) | The Company recorded the following amounts for other services provided by the following companies:Other related party transactions |
| | | 2010 | | | 2009 | | | 2008 | |
| | | | | | | | | | |
| Chevillon Exploration Consulting | | $ | - | | | $ | 4,331 | | | $ | 16,789 | |
| Sampson Engineering Inc. | | | 24,954 | | | | 10,344 | | | | 34,698 | |
| | | $ | 24,954 | | | $ | 14,675 | | | $ | 51,487 | |
(d) | The Company recorded the following amounts for administrative services and expenses provided by Oniva International Services Corp.: |
| | | 2010 | | | 2009 | | | 2008 | |
| | | | | | | | | | |
| Salaries and benefits | | $ | 108,086 | | | $ | 81,841 | | | $ | 109,354 | |
| Office and miscellaneous | | | 60,441 | | | | 66,913 | | | | 78,804 | |
| | | | | | | | | | | | | |
| | | $ | 168,527 | | | $ | 148,754 | | | $ | 188,158 | |
All related party transactions are recorded at the exchange amount, representing the value agreed upon by the Company and the related party, which management believes approximates fair value.
12. SUPPLEMENTARY CASH FLOW INFORMATION
| | | 2010 | | | 2009 | | | 2008 | |
| Net change in non-cash working capital items: | | | | | | | | | |
| Interest receivable | | $ | (3,995 | ) | | $ | 2,793 | | | $ | 16,244 | |
| Sales taxes recoverable | | | (187,131 | ) | | | 289,409 | | | | (206,110 | ) |
| Prepaid expenses | | | 19,151 | | | | (38,127 | ) | | | 20,830 | |
| Accounts payable and accrued liabilities | | | 91,589 | | | | (21,925 | ) | | | (116,303 | ) |
| Due to related parties | | | 4,575 | | | | (6,110 | ) | | | (5,988 | ) |
| | | $ | (75,811 | ) | | $ | 226,040 | | | $ | 291,327 | |
| | | December 31, 2011 | | | December 31, 2010 | |
| Salaries and benefits | | $ | 151,941 | | | $ | 108,086 | |
| Office and miscellaneous | | | 240,810 | | | | 60,441 | |
| | | | | | | | | |
| | | $ | 392,751 | | | $ | 168,527 | |
AVINO SILVER & GOLD MINES LTD.
Notes to the Consolidated Financial Statements
For the years ended December 31, 2010, 20092011 and 20082010
(Expressed in Canadian dollars)
13.14. SUPPLEMENTARY CASH FLOW INFORMATION
| | | December 31, 2011 | | | December 31, 2010 | |
| Net change in non-cash working capital items: | | | | | | |
| Interest receivable | | $ | (49,501 | ) | | $ | (3,996 | ) |
| Sales taxes recoverable | | | 4,868 | | | | (187,089 | ) |
| Prepaid expenses | | | (55,775 | ) | | | 19,310 | |
| Accounts payable and accrued liabilities | | | 126,372 | | | | 90,912 | |
| Due to related parties | | | 34,498 | | | | 4,574 | |
| | | $ | 60,462 | | | $ | (76,289 | ) |
15. COMMITMENTS
The Company has a cost sharing agreement to reimburse Oniva for a percentage of its overhead expenses, to reimburse 100% of its out-of-pocket expenses incurred on behalf of the Company, and to pay a percentage fee based on the total overhead and corporate expenses. The agreement may be terminated with one-month notice by either party. Transactions and balances with Oniva are disclosed in Note 11.13.
The Company and its subsidiary have various lease agreements for their office premises, use of land, drilling and equipment at the mine site.equipment.
The Company has commitments over the next five yearsin respect of these lease agreements as follows:
| | | Amount | |
| | | | |
| 2011 | | $ | 750,793 | |
| 2012 | | | 238,046 | |
| 2013 | | | 242,040 | |
| 2014 | | | 246,234 | |
| 2015 | | | 250,638 | |
| | | $ | 1,727,751 | |
| | | December 31, 2011 | | | December 31, 2010 | |
| Not later than one year | | $ | 243,301 | | | $ | 659,747 | |
| Later than one year and no later than five years | | | 824,910 | | | | 974,453 | |
| Later than 5 years | | | 84,046 | | | | 97,008 | |
| | | $ | 1,152,257 | | | $ | 1,731,208 | |
14.16. FINANCIAL INSTRUMENTS
The fair values of the Company’s cash and cash equivalents, amounts receivable, due to related party and accounts payables and accrued liabilities approximate their carrying values because of the short-term nature of these instruments. The investment in related companies are based on quoted market prices.
The Company’s financial instruments are exposed to certain financial risks, credit risk, liquidity risk and market risk.
Credit risk is the risk that one party to a financial instrument will cause a financial loss for the other party by failing to discharge an obligation. The Company’s cash is exposed to credit risk. The Company is not exposed to significant credit risk on amounts receivable.
The Company manages credit risk, in respect of cash, by maintaining the majority of cash at high credit rated Canadian financial institutions. However, as at December 31, 2011 cash and cash equivalents substantially exceed the amounts covered under federal deposit insurance
Concentration of credit risk exists with respect to the Company’s cash as the majority of the amounts are held with a single Canadian financial institution.
AVINO SILVER & GOLD MINES LTD.
Notes to the Consolidated Financial Statements
For the years ended December 31, 2011 and 2010
(Expressed in Canadian dollars)
16. FINANCIAL INSTRUMENTS (continued)
Liquidity risk is the risk that the Company will encounter difficulty in satisfying financial obligations as they become due. The Company manages its liquidity risk by forecasting cash flows required by operations and anticipated investing and financing activities. The Company has cash at December 31, 2011 in the amount of $5,282,464 (2010 - $9,051,848) in order to meet short-term business requirements. At December 31, 2011, the Company had current liabilities of $804,740 (2010 - $643,870). Accounts payable have contractual maturities of approximately 30-90 days or are due on demand and are subject to normal trade terms. Amounts due to related parties are without stated terms of interest or repayment.
Market risk consists of interest rate risk, foreign currency risk and other price risk. These are discussed further below.
Interest Rate Risk
Interest rate risk consists of two components:
| (i) To the extent that payments made or received on the Company’s monetary assets and liabilities are affected by changes in the prevailing market interest rates, the Company is exposed to interest rate cash flow risk. |
| (ii) To the extent that changes in prevailing market rates differ from the interest rate in the Company’s monetary assets and liabilities, the Company is exposed to interest rate price risk. |
In management’s opinion, the Company is not exposed to significant interest rate risk as the Company has no interest bearing debt.
Foreign Currency Risk
Foreign currency risk is the risk that the fair value or future cash flows of a financial instrument will fluctuate due to changes in foreign exchange rates. The Company is exposed to foreign currency risk to the extent that monetary assets and liabilities are denominated in foreign currency with respect to the following assets and liabilities, as a portion of these amounts are denominated in Mexican Pesos and US dollars as follows:
| | | December 31, 2011 | | | December 31, 2010 | |
| | | MXN | | | USD | | | MXN | | | USD | |
| Cash and cash equivalents | | $ | 935,096 | | | $ | 496,186 | | | $ | 1,303,039 | | | $ | 169,932 | |
| Sales taxes recoverable | | | 2,789,015 | | | | - | | | | 2,683,020 | | | | - | |
| Amounts receivable | | | - | | | | 862,287 | | | | - | | | | 117,940 | |
| Accounts payable and accrued liabilities | | | (6,214,511 | ) | | | - | | | | (4,638,874 | ) | | | - | |
| Amounts due to related parties | | | - | | | | - | | | | - | | | | - | |
| Net exposure | | | (2,490,400 | ) | | | 1,358,473 | | | | (652,815 | ) | | | 287,872 | |
| Canadian dollar equivalent | | $ | (183,877 | ) | | $ | 1,381,567 | | | $ | (52,617 | ) | | $ | 287,872 | |
AVINO SILVER & GOLD MINES LTD.
Notes to the Consolidated Financial Statements
For the years ended December 31, 2011 and 2010
(Expressed in Canadian dollars)
16. FINANCIAL INSTRUMENTS (continued)
| (c) | Market Risk (continued) |
Foreign Currency Risk (continued)
Based on the net Canadian dollar denominated asset and liability exposures as at December 31, 2011, a 10% fluctuation in the Canadian/Mexican and Canadian/US exchange rates will impact the Company’s earnings by approximately $119,769 (2010 -$23,525).
The Company has not entered into any foreign currency contracts to mitigate this risk
Other Price Risk
Other price risk is the risk that the fair value or future cash flows of a financial instrument will fluctuate due to changes in market prices, other than those arising from interest rate risk or foreign currency risk. The Company is exposed to other price risk with respect to its investment in related parties as they are carried at fair value based on quoted market prices.
The Company’s ability to raise capital to fund mineral resource exploration is subject to risks associated with fluctuations in mineral resource prices. Management closely monitors commodity prices, individual equity movements, and the stock market to determine the appropriate course of action to be taken by the Company.
| (d) | Classification of Financial instruments |
IFRS 7 ‘Financial Instruments: Disclosures’ establishes a fair value hierarchy that prioritizes the input to valuation techniques used to measure fair value as follows:
Level 1 – quoted prices (unadjusted) in active markets for identical assets or liabilities;
Level 2 – inputs other than quoted prices included in Level 1 that are observable for the asset or liability, either directly (i.e., as prices) or indirectly (i.e., derived from prices); and
Level 3 – inputs for the asset or liability that are not based on observable market data (unobservable inputs).
The following table sets forth the Company’s financial assets measured at fair value by level within the fair value hierarchy as at December 31, 2011
| | | Level 1 | | | Level 2 | | | Level 3 | |
| Cash and cash equivalents | | $ | 5,282,464 | | | | - | | | | - | |
| Investments in related parties | | | 304,394 | | | | - | | | | - | |
| | | $ | 5,586,858 | | | | - | | | | - | |
17. CAPITAL MANAGEMENT
The Company’s objectives when managing capital are to safeguard the Company’s ability to continue as a going concern in order to pursue the exploration and development of its properties and to maintain flexible capital structure for its projects for the benefit of its stakeholders. In the management of capital, the Company includes the components of shareholders’ equity as well as cash and cash equivalents.
The Company manages the capital structure and makes adjustments to it in light of changes in economic conditions and the risk characteristics of the underlying assets. To maintain or adjust the capital structure, the Company may attempt to issue new shares or adjust the amount of cash and cash equivalents. Management reviews the capital structure on an ongoing basis and believes that this approach, given the relative size of the Company, is reasonable. The Company is not subject to externally imposed capital requirements.
15. SEGMENTED INFORMATION
The Company’s operations are limited to one industry segment, being the acquisition, exploration and development of mineral properties. Regional geographic information pertaining to the Company’s mineral properties is disclosed in Note 6.
AVINO SILVER & GOLD MINES LTD.
Notes to the Consolidated Financial Statements
For the years ended December 31, 2010, 20092011 and 20082010
(Expressed in Canadian dollars)
18. SEGMENTED INFORMATION
The Company operates in one reportable operating segment, being the acquisition, exploration and development of mineral properties.
16.The Company has non-current assets in the following geographic locations:
| | | December 31, 2011 | | | December 31, 2010 | |
| Canada | | $ | 319,334 | | | $ | 526,130 | |
| Mexico | | $ | 19,288,883 | | | $ | 16,614,111 | |
| | | | | | | | | |
| | | $ | 19,608,217 | | | $ | 17,140,241 | |
19. INCOME TAXES
The components of the income tax provision including, the statutory tax rate, effective tax rate and the effect of the valuation allowance are as follows:
| | | 2010 | | | 2009 | | | 2008 | | | 2011 | | | 2010 | |
| | | | | | | | | | | | | | | | |
| Statutory rate | | | 28.5 | % | | | 30.00 | % | | | 31.00 | % | | | 26.5 | % | | | 28.5 | % |
| | | | | | | | | | | | | | | | | | | | | |
| Income taxes recovered at the Canadian statutory rate | | $ | 330,045 | | | $ | 368,196 | | | $ | 446,469 | | | $ | 1,116,093 | | | $ | 213,686 | |
| | | | | | | | | | | | | | | | | | | | | |
| Less permanent differences: | | | | | | | | | | | | | | | | | | | | |
| Stock-based compensation | | | (103,108 | ) | | | (71,366 | ) | | | (181,598 | ) | |
| Investor relations expense for stock options granted | | | - | | | | - | | | | (6,262 | ) | |
| Stock-based payment | | | | (670,349 | ) | | | (95,689 | ) |
| Reduction for effect of lower Mexican tax rates | | | 3,736 | | | | 1,394 | | | | (7,160 | ) | | | 9,933 | | | | 3,736 | |
| Other non-tax deductible expenses | | | (758 | ) | | | (363 | ) | | | (762 | ) | | | (1,902 | ) | | | (758 | ) |
| | | | | | | | | | | | | | | | | | | | | |
| Non-capital losses expired | | | (489,600 | ) | | | (271,284 | ) | | | - | | | | - | | | | (489,600 | ) |
| Effect of difference between functional and tax reporting currency | | | | (328,855 | ) | | | 304,464 | |
| Change in enacted rates | | | (102,398 | ) | | | (206,652 | ) | | | - | | | | (21,016 | ) | | | (102,398 | ) |
| Change in unrecognized benefit of tax losses | | | | (273,033 | ) | | | (62,595 | ) |
| Benefit of tax attributes recognized and other items | | | | 82,631 | | | | 201,477 | |
| | | | | | | | | | | | | | | | | | | | | |
| Valuation allowance on benefit of tax loss | | | (62,595 | ) | | | 180,075 | | | | (301,758 | ) | |
| | | | | | | | | | | | | | |
| Benefit of tax attributes not recognized (recognized) and other items | | | 92,537 | | | | 239,694 | | | | (47,582 | ) | |
| | | | | | | | | | | | | | |
| Income tax (expense) recovery recognized in the year | | $ | (332,141 | ) | | $ | 239,694 | | | $ | (98,653 | ) | |
| Income tax expense recognized in the year | | | $ | (86,498 | ) | | $ | (27,677 | ) |
AVINO SILVER & GOLD MINES LTD.
Notes to the Consolidated Financial Statements
For the years ended December 31, 2010, 20092011 and 20082010
(Expressed in Canadian dollars)
16.19. INCOME TAXES (Continued)(continued)
The approximate tax effects of each type of temporary difference that gives rise to potential futuredeferred income tax assets are as follows:
| | | 2010 | | | 2009 | | | 2011 | | | 2010 | |
| | | | | | | | | | | | | |
| Expected tax recovery rate | | | 25 | % | | | 26 | % | | | 25 | % | | | 26 | % |
| | | | | | | | | | | | | | | | | |
| Non-capital tax losses carried forward | | $ | 1,239,395 | | | $ | 1,141,325 | | | $ | 1,558,068 | | | $ | 1,239,395 | |
| | | | | | | | | | | | | | | | | |
| Capital losses carried forward | | | 184,026 | | | | 191,387 | | | | 184,026 | | | | 184,026 | |
| | | | | | | | | | | | | | | | | |
| Canadian exploration expenses, Canadian development expenses and foreign exploration, and development expenses in excess of book value of Canadian mineral properties | | | 507,015 | | | | 540,234 | | | | 485,737 | | | | 507,015 | |
| | | | | | | | | | | | | | | | | |
| Share issuance costs | | | 51,061 | | | | 42,833 | | | | 38,296 | | | | 51,061 | |
| | | | | | | | | | | | | | | | | |
| Tax basis of investments in related companies in excess of book value | | | 27,125 | | | | 28,210 | | | | 15,337 | | | | 27,125 | |
| | | | | | | | | | | | | | | | | |
| Undeducted capital cost allowance in excess of book value of Canadian equipment | | | 52,187 | | | | 54,225 | | | | 52,378 | | | | 52,187 | |
| | | | | | | | | | | | | | | | | |
| Future income tax assets | | | 2,060,809 | | | | 1,998,214 | | |
| Deferred income tax assets | | | | 2,333,842 | | | | 2,060,809 | |
| | | | | | | | | | | | | | | | | |
| Less: valuation allowance | | | (2,060,809 | ) | | | (1,998,214 | ) | |
| Unrecognized deferred tax assets | | | | (2,333,842 | ) | | | (2,060,809 | ) |
| | | | | | | | | | | | | | | | | |
| Net tax assets | | $ | – | | | $ | – | | | $ | – | | | $ | – | |
The potential benefit of Canadian net operating tax loss carry-forwards and other Canadian futuredeferred income tax assets has not been recognized in the financial statements since the Company cannot be assured that it is more likely than not that such benefit will be utilized in future years.
The futuredeferred income tax liability presented in these consolidated financial statements is due to the difference in the carrying amounts and tax bases of the Mexican mineral properties, mine plant and equipment, which were acquired in the purchase of Cia Minera. The carrying values of the Mexican mineral properties, mine plant and equipment includes an estimated fair value adjustment recorded upon the July 17, 2006 acquisition of control of Cia Minera that was based on a share exchange, while the tax bases of these assets are historical undeducted tax amounts that were nil on acquisition. The futuredeferred tax liability is attributable to assets in the tax jurisdiction of Mexico and is presented net of Mexican tax losses carried forward. The approximate tax effects of each type of temporary difference that gives rise to futuredeferred income tax liabilities are as follows:
| | | 2010 | | | 2009 | | | 2011 | | | 2010 | |
| | | | | | | | | | | | | |
| Mexican statutory rate | | | 28 | % | | | 28 | % | | | 28 | % | | | 28 | % |
| | | | | | | | | | | | | | | | | |
| Book value of mineral properties in excess of tax bases | | $ | 3,676,031 | | | $ | 3,472,175 | | | $ | 3,818,183 | | | $ | 3,419,266 | |
| Book value of plant and equipment in excess of tax bases | | | 366,045 | | | | 333,676 | | | | 408,219 | | | | 345,089 | |
| Less: Mexican tax losses carried forward | | | (2,015,928 | ) | | | (2,111,844 | ) | | | (2,121,046 | ) | | | (1,745,498 | ) |
| | | | | | | | | | | | | | | | | |
| Future income tax liability | | $ | 2,026,148 | | | $ | 1,694,007 | | |
| | | | | | | | | | |
| Deferred income tax liability | | | $ | 2,105,356 | | | $ | 2,018,857 | |
AVINO SILVER & GOLD MINES LTD.
Notes to the Consolidated Financial Statements
For the years ended December 31, 2010, 20092011 and 20082010
(Expressed in Canadian dollars)
16.19. INCOME TAXES (Continued)(continued)
The Company has capital losses of $1,472,210 carried forward and $4,957,581$6,232,272 in non-capital tax losses carried forward available to reduce future Canadian taxable income. The capital losses can be carried forward indefinitely unless used. Additionally, the Company has $7,199,744$7,575,164 (denominated in MXN$77,252,750)102,832,738) in tax losses which are available to reduce future Mexican taxable income. The Company’s Canadian non-capital tax losses and Mexican tax losses, if unused, expire as follows:
| Year of Expiry | | Canada | | | Mexico | | | Canada | | | Mexico | |
| | | | | | | | | | | | | |
| 2014 | | $ | 568,450 | | | $ | – | | | $ | 568,450 | | | $ | – | |
| 2018 | | – | | | 5,220,380 | | | | – | | | | 4,200,425 | |
| 2019 | | – | | | 1,078,275 | | | | – | | | | 1,007,459 | |
| 2020 | | – | | | 901,089 | | | | – | | | | 870,739 | |
| 2021 | | | | – | | | | 1,496,541 | |
| 2025 | | 799,044 | | | – | | | | 799,044 | | | | - | |
| 2026 | | 646,331 | | | – | | | | 646,331 | | | | – | |
| 2027 | | 643,498 | | | – | | | | 643,498 | | | | – | |
| 2028 | | 774,118 | | | – | | | | 774,118 | | | | – | |
| 2029 | | 727,183 | | | – | | | | 727,183 | | | | – | |
| 2030 | | | 798,957 | | | | – | | | | 804,957 | | | | | |
| 2030 | | | | 1,268,691 | | | | – | |
| | | | | | | | | | | | | | | | | |
| | | $ | 4,957,581 | | | $ | 7,199,744 | | | $ | 6,232,272 | | | $ | 7,575,164 | |
20. FIRST TIME ADOPTION OF INTERNATIONAL FINANCIAL REPORTING STANDARDS
17. FINANCIAL INSTRUMENTS AND RISKS
(a) Classification
Transition to IFRS
The Company has classifiedadopted IFRS effective January 1, 2011 with a transition date of January 1, 2010 (the “Transition Date”). Prior to the adoption of IFRS the Company prepared its cashconsolidated financial statements in accordance with Canadian GAAP.
The comparative information presented in these first annual consolidated financial statements for the year ended December 31, 2010 and cash equivalentsthe opening financial position as held-for-trading. Investmentsat January 1, 2010 have been prepared in related companies are classified as available-for-sale. Accounts payableaccordance with the accounting policies referenced in Note 3 and amounts due to related parties are classified as other liabilities. Interest receivable is classified as held for trading.IFRS 1, First-Time Adoption of International Financial Reporting Standards (“IFRS 1”).
Initial elections upon adoption
The following table summarizes information regardingCompany adopted IFRS in accordance with IFRS 1 which requires the carrying valuesretrospective application of IFRS at the Company’s financial instruments:
| | | | | | | |
| | | | | | | |
| | $ | 9,055,598 | | | $ | 2,829,751 | |
Loan and receivables (ii) | | | 117,940 | | | | - | |
| | | 517,360 | | | | 204,036 | |
Other financial liabilities (iv) | | | 566,337 | | | | 465,172 | |
(i) | Cash and cash equivalents and interest receivable |
(iii) | Investments in related companies |
(iv) | Accounts payable and amounts due to related parties |
(i) Share-based payments – The Company elected under IFRS 1 to apply IFRS 2, Share-Based Payments only to equity instruments that were issued after November 7, 2002 and had not vested by the Transition Date.
(ii) Business combinations – The Company elected under IFRS 1 to not to apply IFRS 3, Business Combinations retrospectively to any business combinations that may have occurred prior to its Transition Date and such business combinations have not been restated.
The Company’s(iii) Compound financial instruments consist– The Company has elected under IFRS 1 not to retrospectively separate the liability and equity components of cash and cash equivalents, amounts receivable, interest receivable investments in related companies, accounts payable and amounts due to related parties. The carrying amounts of these short-term financialany compound instruments are a reasonable estimate of their fair value because of their current nature, andfor which the investments in related companies are carriedliability component is no longer outstanding at fair values based on quoted market prices.the Transition Date.
AVINO SILVER & GOLD MINES LTD.
Notes to the Consolidated Financial Statements
For the years ended December 31, 2010, 20092011 and 20082010
(Expressed in Canadian dollars)
17.20. FIRST TIME ADOPTION OF INTERNATIONAL FINANCIAL INSTRUMENTS AND RISKS (Continued)REPORTING STANDARDS (continued)
(b) | Fair valuesInitial elections upon adoption (continued) |
(iv) Foreign currency translation - The Company classifies its fair value measurementshas elected to deem all foreign currency translation differences that arose prior to the Transition Date in accordance with an established hierarchy that prioritizesrespect of all foreign operations to be nil at the inputs in valuation techniques used to measure fair value as follows:
Level 1 – Unadjusted quoted prices in active markets for identical assets or liabilities;
Level 2 – Inputs other than quoted prices that are observable for the asset or liability either directly (i.e. as prices) or indirectly (i.e. derived from prices); and
Level 3 – Inputs that are not based on observable market date.date of transition.
(v) Designation of financial instruments – The following table sets forthCompany has elected to designate its investment in related companies as fair value through profit or loss that was previously designated as available for sale under Canadian GAAP, and that was initially classified as available for sale in the first interim consolidated financial statement for 2011.
Estimates
IFRS 1 does not permit changes to estimates previously made. Accordingly, estimates used at the Transition Date are consistent with estimates made at the same date under Canadian GAAP.
Reconciliation between Canadian GAAP and IFRS
IFRS employs a conceptual framework that is similar to Canadian GAAP. However, some differences exist in certain matters of recognition, measurement and disclosure. While adoption of IFRS has not changed the Company’s actual cash flows, it has resulted in changes to the Company’s reported consolidated financial assets measuredposition. In order to allow the users of the consolidated financial statements to better understand these changes, the Company’s Canadian GAAP consolidated statements of financial position as at fair value by level withinJanuary 1, 2010 and December 31, 2010 and operations and comprehensive income, and statement of cash flows for the fair value hierarchy:
| | | | | | | | | | | | Total | |
| | | Level 1 | | | Level 2 | | | Level 3 | | | 2010 | |
| | | | | | | | | | | | | |
| Cash and cash equivalents | | $ | 9,051,456 | | | $ | - | | | $ | - | | | $ | 9,051,456 | |
| Investments in related companies | | | 517,360 | | | | - | | | | - | | | | 517,360 | |
| | | $ | 9,568,816 | | | $ | - | | | $ | - | | | $ | 9,568,816 | |
(c) | Interest rate risk
In management’s opinion, the Company is not exposed to significant interest rate risk as the Company has no interest bearing debt.
|
(d) | Foreign exchange rate risk
The operations and financial instruments of the Company’s subsidiaries are denominated in Mexican pesos (“MXN”) and are converted into Canadian dollars as the reporting currency in these financial statements. Fluctuations in the exchange rates between the Mexican peso and the Canadian dollar could have a material effect on the Company’s business and on the reported amounts of the Company’s financial instruments. The Company is exposed to foreign exchange rate risk relating to cash denominated in Mexican pesos totalling $273,867 (MXN$3,398,701), and accounts payable denominated in pesos totalling $374,067 (MXN$4,642,180). The Company does not utilize any financial instruments or cash management policies to mitigate the risks arising from changes in foreign currency rates.
|
(e) | Credit risk
The Company's cash and equivalents are primarily held in bank accounts with Canadian financial institutions, and as at December 31, 2010 cash and cash equivalents substantially exceed the amounts covered under federal deposit insurance. To minimize the credit risk on cash and cash equivalents the Company uses high quality financial institutions. As at December 31, 2010 the Company has no financial assets that are past due or impaired due to credit risk defaults.
|
(f) | Liquidity risk
The Company ensures its holding of cash and cash equivalents is sufficient to meet its operational requirements. The Company handles its liquidity risk through the management of its capital structure. All of the Company’s financial liabilities have contractual maturities of approximately 30 days or are due on demand and are subject to normal trade terms.
|
year ended December 31, 2010 have been reconciled to IFRS, with the resulting differences explained as follows.
AVINO SILVER & GOLD MINES LTD.
Notes to the Consolidated Financial Statements
For the years ended December 31, 2010, 20092011 and 20082010
(Expressed in Canadian dollars)
17.20. FIRST TIME ADOPTION OF INTERNATIONAL FINANCIAL INSTRUMENTS AND RISKS (Continued)REPORTING STANDARDS (continued)
(g) | Market risk Reconciliation of Statements of Financial Position Market risk is the risk that the fair value of, or future cash flows from, the Company’s financial instruments will significantly fluctuate due to changes in market prices. The sale of the financial instruments can be affected by changes in interest rates, foreign exchange rates, and equity prices. The Company is exposed to market risk in trading its investments, and unfavourable market conditions could result in dispositions of investments at less than favourable prices. The Company’s investments are accounted for at estimated fair values and are sensitive to changes in market prices, such that changes in market prices result in a proportionate change in the carrying value of the Company’s investments. The Company’s ability to raise capital to fund mineral resource exploration is subject to risks associated with fluctuations in mineral resource prices. Management closely monitors commodity prices, individual equity movements, and the stock market to determine the appropriate course of action to be taken by the Company.
|
(h) | Sensitivity analysis
The Company has completed a sensitivity analysis to estimate the impact on net loss for the year which a change in foreign exchange rates would have had. A change of +/- 10% in MXN$ foreign exchange rate would have an impact of approximately +/- $25,000 on the Company’s net loss. This impact results from the Company’s MXN$ based balances of monetary assets and liabilities.
|
18. SUBSEQUENT EVENTS
On January 18, 2011, the Company granted 1,010,000 stock options to directors, officers, employees, and consultants at an exercise price of $2.30 per share. The options expire on January 18, 2016.
On March 11, 2011, the Company entered into an agreement with a consulting firm to provide a tailings retreatment scoping study and a review of the San Gonzales project. The expected costs and outlays relating to this project are $190,960.
Subsequent to year end, 725,000 options were exercised for gross proceeds of $564,150.| | | | January 1, 2010 | | | December 31, 2010 | |
| | Note | | Canadian GAAP | | | Effect of Transition to IFRS | | | IFRS | | | Canadian GAAP | | | Effect of Transition to IFRS | | | IFRS | |
| | | | | | | | | | | | | | | | | | | | |
| ASSETS | | | | | | | | | | | | | | | | | | | |
| Current | | | | | | | | | | | | | | | | | | | |
| Cash and cash equivalents | (a) | | $ | 2,829,605 | | | $ | 488 | | | $ | 2,830,093 | | | $ | 9,051,456 | | | $ | 392 | | | $ | 9,051,848 | |
| Interest receivable | | | | 146 | | | | - | | | | 146 | | | | 4,142 | | | | - | | | | 4,142 | |
| Sales taxes recoverable | (a) | | | 88,725 | | | | 352 | | | | 89,077 | | | | 233,378 | | | | 310 | | | | 233,688 | |
| Amounts receivable | (a) | | | - | | | | - | | | | - | | | | 117,940 | | | | 168 | | | | 118,108 | |
| Prepaid expenses and other assets | (a) | | | 49,614 | | | | 186 | | | | 49,800 | | | | 30,463 | | | | 27 | | | | 30,490 | |
| | | | | 2,968,090 | | | | 1,026 | | | | 2,969,116 | | | | 9,437,379 | | | | 897 | | | | 9,438,276 | |
| Non- Current | | | | | | | | | | | | | | | | | | | | | | | | | |
| Property, Plant and Equipment | (a) | | | 1,455,146 | | | | (30,175 | ) | | | 1,424,971 | | | | 1,786,017 | | | | (63,479 | ) | | | 1,722,538 | |
| Reclamation Bonds | | | | 5,500 | | | | - | | | | 5,500 | | | | 5,500 | | | | - | | | | 5,500 | |
| Mineral Properties and Exploration Costs | (a) | | | 14,573,506 | | | | (156,665 | ) | | | 14,416,841 | | | | 15,302,311 | | | | (407,468 | ) | | | 14,894,843 | |
| Investments in Related Companies | | | | 204,036 | | | | - | | | | 204,036 | | | | 517,360 | | | | - | | | | 517,360 | |
| TOTAL ASSETS | | | $ | 19,206,278 | | | $ | (185,814 | ) | | $ | 19,020,464 | | | $ | 27,048,567 | | | $ | (470,050 | ) | | $ | 26,578,517 | |
AVINO SILVER & GOLD MINES LTD.
Notes to the Consolidated Financial Statements
For the years ended December 31, 2010, 20092011 and 20082010
(Expressed in Canadian dollars)
20. FIRST TIME ADOPTION OF INTERNATIONAL FINANCIAL REPORTING STANDARDS (continued)
Reconciliation of Statements of Financial Position
19. COMPARATIVE FIGURES
Certain prior year comparative figures have been reclassified to conform to the financial statements presentation adopted for fiscal 2010.
20. DIFFERENCES BETWEEN CANADIAN AND UNITED STATES GENERALLY ACCEPTED ACCOUNTING PRINCIPLES
The consolidated financial statements of the Company have been prepared in accordance with Canadian generally accepted accounting principles (“Canadian GAAP”), which in most respects conform to accounting principals generally accepted in the United States (“US GAAP”). There are certain material differences between Canadian and US GAAP and if these consolidated financial statements were prepared in accordance with US GAAP, the impact would be as follows:
| | | 2010 | | | 2009 | |
| Balance sheets | | | | | | |
| Total assets under Canadian GAAP | | $ | 27,048,567 | | | $ | 19,206,278 | |
| Deferred exploration expenditures and mineral property acquisition costs (ii) | | | (15,302,311 | ) | | | (14,573,506 | ) |
| Total assets under US GAAP | | $ | 11,746,256 | | | $ | 4,632,772 | |
| | | | | | | | | |
| Total liabilities under Canadian GAAP | | $ | 2,669,485 | | | $ | 2,241,179 | |
| Future income taxes related to mineral properties (ii) | | | (2,026,148 | ) | | | (1,694,007 | ) |
| Total liabilities under US GAAP | | $ | 643,337 | | | $ | 547,172 | |
| | | | | | | | | |
| Total shareholders’ equity under Canadian GAAP | | $ | 24,379,082 | | | $ | 16,965,099 | |
| Future income taxes related to mineral properties (ii) | | | 2,026,148 | | | | 1,694,007 | |
| Deferred exploration expenditures (ii) | | | (15,302,311 | ) | | | (14,573,506 | ) |
| Total shareholders’ equity under US GAAP | | $ | 11,102,919 | | | $ | 4,085,600 | |
| | | | January 1, 2010 | | | December 31, 2010 | |
| | Note | | Canadian GAAP | | | Effect of Transition to IFRS | | | IFRS | | | Canadian GAAP | | | Effect of Transition to IFRS | | | IFRS | |
| | | | | | | | | | | | | | | | | | | | |
| LIABILITIES | | | | | | | | | | | | | | | | | | | |
| Current | | | | | | | | | | | | | | | | | | | |
| Accounts payable and accrued liabilities | (a) | | $ | 382,482 | | | $ | 1,211 | | | $ | 383,693 | | | $ | 474,072 | | | $ | 533 | | | $ | 474,605 | |
| Amounts due to related parties | | | | 164,690 | | | | - | | | | 164,690 | | | | 169,265 | | | | - | | | | 169,265 | |
| | | | | 547,172 | | | | 1,211 | | | | 548,383 | | | | 643,337 | | | | 533 | | | | 643,870 | |
| Non-Current | | | | | | | | | | | | | | | | | | | | | | | | | |
| Deferred Income Tax Liability | (c) | | | 1,694,007 | | | | 297,173 | | | | 1,991,180 | | | | 2,026,148 | | | | (7,291 | ) | | | 2,018,857 | |
| | | | | 2,241,179 | | | | 297,173 | | | | 2,539,563 | | | | 2,669,485 | | | | (7,291 | ) | | | 2,662,727 | |
| SHAREHOLDERS' EQUITY | | | | | | | | | | | | | | | | | | | | | | | | | |
| Share Capital | (e) | | | 33,112,072 | | | | (60,950 | ) | | | 33,173,022 | | | | 39,132,349 | | | | 60,950 | | | | 39,193,299 | |
| Equity Reserves (Previously Contributed Surplus) | (b) | | | 8,131,629 | | | | (781,651 | ) | | | 7,349,978 | | | | 10,702,206 | | | | (1,193,368 | ) | | | 9,508,838 | |
| Treasury Shares (14,180 Shares, at cost) | | | | (101,869 | ) | | | - | | | | (101,869 | ) | | | (101,869 | ) | | | - | | | | (101,869 | ) |
| | | | | | | | | | | | | | | | | | | | | | | | | | |
| Accumulated Other Comprehensive Loss | (c)(f) | | | (6,049 | ) | | | 6,049 | | | | - | | | | 307,274 | | | | (652,363 | ) | | | (345,089 | ) |
| Deficit | (a)(b)(c)(d)(e) | | | (24,170,684 | ) | | | 230,454 | | | | (23,940,230 | ) | | | (25,660,878 | ) | | | 1,321,489 | | | | (24,339,389 | ) |
| | | | | 16,965,099 | | | | (484,198 | ) | | | 16,480,901 | | | | 24,379,082 | | | | (463,292 | ) | | | 23,915,790 | |
| TOTAL EQUITY AND LIABILITIES | | | $ | 19,206,278 | | | $ | (185,814 | ) | | $ | 19,020,464 | | | $ | 27,048,567 | | | $ | (470,050 | ) | | $ | 26,578,517 | |
AVINO SILVER & GOLD MINES LTD.
Notes to the Consolidated Financial Statements
For the years ended December 31, 2010, 2009 and 2008
(Expressed in Canadian dollars)
20. DIFFERENCES BETWEEN CANADIAN AND UNITED STATES GENERALLY ACCEPTED ACCOUNTING PRINCIPLES (Continued)
| | | 2010 | | | 2009 | | | 2008 | |
| Consolidated statements of operations | | | | | | | | | |
| Loss for year under Canadian GAAP | | $ | (1,490,194 | ) | | $ | (987,759 | ) | | $ | (1,538,876 | ) |
| Future income taxes related to mineral properties (i) | | | 332,141 | | | | (239,562 | ) | | | 98,653 | |
| Current period exploration costs (i) | | | (728,805 | ) | | | (320,100 | ) | | | (1,764,719 | ) |
| Addback of impairment in mineral properties | | | - | | | | 608,118 | | | | - | |
| Stock based compensation expense (ii) | | | - | | | | (143,564 | ) | | | (185,165 | ) |
| Net loss for the year under US GAAP (ii) | | $ | (1,886,858 | ) | | $ | (1,082,867 | ) | | $ | (3,390,107 | ) |
| Loss per share under US GAAP - basic and diluted | | $ | (0.09 | ) | | $ | (0.05 | ) | | $ | (0.17 | ) |
| | | 2010 | | | 2009 | | | 2008 | |
| Statements of cash flows | | | | | | | | | |
| Cash flows used in operating activities under Canadian GAAP | | $ | (825,768 | ) | | $ | (144,075 | ) | | $ | (909,029 | ) |
| Mineral properties expenditures (i) | | | (846,745 | ) | | | (320,100 | ) | | | (1,764,719 | ) |
| Cash flows used in operating activities under US GAAP | | $ | (1,672,513 | ) | | $ | (464,175 | ) | | $ | (2,673,748 | ) |
| | | | | | | | | | | | | |
| Cash flows used in investing activities under Canadian GAAP | | $ | (1,181,450 | ) | | $ | (601,561 | ) | | $ | (1,858,211 | ) |
| Mineral properties expenditures (ii) | | | 846,745 | | | | 320,100 | | | | 1,764,719 | |
| Cash flows used in investing activities under US GAAP | | $ | (334,705 | ) | | $ | (281,461 | ) | | $ | (93,492 | ) |
i) | Mineral properties and deferred exploration expenditures |
Canadian GAAP permits the deferral of costs for the acquisition of mineral properties and exploration expenditures subject to periodic assessments for impairment. US GAAP requires that mineral exploration costs relating to unproven mineral properties be expensed. Under US GAAP the acquisition costs of mineral properties are initially capitalized with an assessment for impairment under ASC 360 performed at each reporting period. For US GAAP cash flow statement purposes, mineral property exploration expenditures would be shown under operating activities rather than investing activities.
Once commercial production has commenced, mine mill, machinery, plant facilities and certain equipment are depreciated using the units of production method, if sufficient reserve information is available or the straight line method over their useful lives, not to exceed the life of the mine to which the assets relate. Under US GAAP, the Company expects to use the units of production method based on reserves as defined under SEC Industry Guide 7 once such reserve amounts are determinable.
AVINO SILVER & GOLD MINES LTD.
Notes to the Consolidated Financial Statements
For the years ended December 31, 2010, 20092011 and 20082010
(Expressed in Canadian dollars)
20. | DIFFERENCES BETWEEN CANADIAN AND UNITED STATES GENERALLY ACCEPTED ACCOUNTING PRINCIPLES (Continued) |
20. FIRST TIME ADOPTION OF INTERNATIONAL FINANCIAL REPORTING STANDARDS (continued)
ii) | Stock-based compensation |
Reconciliation of Statements of Operations and Comprehensive Loss
Under ASC 718 US GAAP requires the recognition of a stock-based compensation expense associated with the extension of the expiry date of outstanding warrants whereas Canadian GAAP has no clear guidance on non-service orientated equity awards. During the year ended December 31, 2010, there were no warrants modified, in 2009 the Company calculated this expense using the Black-Scholes option pricing model with the following assumptions for the fair value of the original warrants at the date of amendment and the fair value of the amended warrants at the date of the amendment respectively: risk-free interest rates 1.27% (2008 - 3.05%), dividend yield of nil and nil, volatility of 104% and 155% (2008 –26.61% and 44.12%) and an expected life of 0.06 years and 1.06 years (2008 - 0.05 years and 1.05 years).
iii) | Recently adopted accounting standards |
a) | Accounting for Transfer of Financial AssetsIn December 2009, the FASB issued ASU 2009-16, “Transfers and Servicing (Topic 860), and Amendment of the Accounting Transfers of Financial Assets” (formerly SFAS 166, Accounting for Transfers of Financial Assets”). This ASU significantly changes how companies account for transfers of financial assets. The ASU provides revised guidance in a number of areas including the elimination of the qualifying special purpose entity concept, the introduction of a new “participating interest” definition that must be met for transfers of portions of financial assets to be eligible for sale accounting, clarification and amendments to the derecognition criteria for a transfer accounted for as a sale when beneficial interests are received by the transferor, and extensive new disclosures.
The provisions of this ASU are to be applied to transfers of financial assets occurring in years beginning after November 15, 2009. The adoption of this ASU did not impact our financial results or disclosures as at December 31, 2010
|
b) | Consolidation of Variable Interest EntitiesIn December 2009, the FASB issued ASU 2009-17, “Consolidations (Topic 810), Improvements to Financial Reporting Enterprises Involved with Variable Interest Entities” (formerly SFAS 167, “Amendments to FASB Interpretation No 46 (R)”) which amends the consolidation guidance for variable interest entities. (“VIE”) The changes include the elimination of the exemption for qualifying special purpose entities and a new approach for determining who should consolidate a VIE. In addition, the changes to when it is necessary to reassess who should consolidate a VIE have also been made.
In determining the primary beneficiary, or entity required to consolidate a VIE, quantitative analysis of who absorbs the majority of the expected losses or receives a majority of the expected residual returns or both of the VIE is no longer required. Under ASU 2009-17, an entity is required to assess whether its variable interest or interests in an entity give it a controlling financial interest in the VIE, which involves more qualitative analysis.
Additional disclosures will be required under this ASU to provide more transparent information regarding an entity’s involvement with a VIE. The provisions of this ASU are to be applied for years beginning after November 15, 2009, for interim periods within those years, and for interim annual reporting periods thereafter. The adoption of this ASU did not impact our financial results or disclosures as at December 31, 2010.
|
| | | | For the year ended December 31, 2010 | |
| | Note | | Canadian GAAP | | | Effect of Transition to IFRS | | | IFRS | |
| | | | | | | | | | | |
| Operating and Administrative Expenses | | | | | | | | | | |
| Depreciation | | | $ | 3,834 | | | $ | - | | | $ | 3,834 | |
| General exploration | | | | - | | | | - | | | | - | |
| Investor relations | | | | 99,450 | | | | - | | | | 99,450 | |
| Management fees | | | | 96,000 | | | | - | | | | 96,000 | |
| Office and miscellaneous | | | | 218,489 | | | | - | | | | 218,489 | |
| Professional fees | | | | 127,711 | | | | - | | | | 127,711 | |
| Regulatory and compliance fees | | | | 26,028 | | | | - | | | | 26,028 | |
| Salaries and benefits | | | | 109,873 | | | | - | | | | 109,873 | |
| Sales tax write-down | | | | 42,478 | | | | - | | | | 42,478 | |
| Share-based payments | (e) | | | 361,784 | | | | (20,036 | ) | | | 341,748 | |
| Travel and promotion | | | | 45,032 | | | | - | | | | 45,032 | |
| | | | | 1,130,679 | | | | (20,036 | ) | | | 1,110,643 | |
| | | | | | | | | | | | | | |
| Loss before other items and income tax | | | | (1,130,679 | ) | | | 20,036 | | | | (1,110,643 | ) |
| | | | | | | | | | | | | | |
| Other Income (Expenses) | | | | | | | | | | | | | |
| Interest income | | | | 14,206 | | | | - | | | | 14,206 | |
Unrealized gain (loss) on investments in related companies | (f) | | | - | | | | 313,323 | | | | 313,323 | |
| Foreign exchange gain (loss) | (a) | | | (41,580 | ) | | | 61,531 | | | | 19,951 | |
| | | | | | | | | | | | | | |
| LOSS BEFORE INCOME TAX | | | | (1,158,053 | ) | | | 394,890 | | | | (763,163 | ) |
| Deferred income tax expense | (c) | | | (332,141 | ) | | | 304,464 | | | | (27,677 | ) |
| NET LOSS | | | | (1,490,194 | ) | | | 699,354 | | | | (790,840 | ) |
| Other Comprehensive Income (Loss) | | | | | | | | | | | | | |
Unrealized gain (loss) on investments in related companies | (f) | | | 313,323 | | | | (313,323 | ) | | | - | |
| Foreign currency translation differences for foreign operations | (a) | | | - | | | | (345,089 | ) | | | (345,089 | ) |
| | | | | | | | | | | | | | |
| TOTAL COMPREHENSIVE (LOSS) GAIN | | | $ | (1,176,871 | ) | | $ | 40,942 | | | $ | (1,135,929 | ) |
AVINO SILVER & GOLD MINES LTD.
Notes to the Consolidated Financial Statements
For the years ended December 31, 2011 and 2010
(Expressed in Canadian dollars)
20. FIRST TIME ADOPTION OF INTERNATIONAL FINANCIAL REPORTING STANDARDS (continued)
| | | | For the year ended December 31, 2010 | |
| | Note | | Canadian GAAP | | | Effect of Transition to IFRS | | | IFRS | |
| | | | | | | | | | | |
| CASH PROVIDED BY (USED IN): | | | | | | | | | | |
| | | | | | | | | | | |
| OPERATING ACTIVITIES | | | | | | | | | | |
| Net loss | (a)(c) (f) | | $ | (1,490,194 | ) | | | 699,354 | | | $ | (790,840 | ) |
| Adjustments for non-cash items: | | | | | | | | | | | | | |
| Depreciation | | | | 3,834 | | | | - | | | | 3,834 | |
| Deferred income tax expense | (c) | | | 332,141 | | | | (304,464 | ) | | | 27,677 | |
| Sales tax write-down provision | | | | 42,478 | | | | - | | | | 42,478 | |
| Share-based payments | (e) | | | 361,784 | | | | (20,036 | ) | | | 341,748 | |
| Unrealized gain on investments | (f) | | | - | | | | (313,323 | ) | | | (313,323 | ) |
| | | | | (749,957 | ) | | | 61,531 | | | | (688,426 | ) |
| | | | | | | | | | | | | | |
| Net change in non-cash working capital | (a) | | | (75,811 | ) | | | (478 | ) | | | (76,289 | ) |
| | | | | | | | | | | | | | |
| | | | | (825,768 | ) | | | 61,053 | | | | (764,715 | ) |
| | | | | | | | | | | | | | |
| FINANCING ACTIVITIES | | | | | | | | | | | | | |
| Shares issued for cash, net of issuance costs | (a) | | | 8,229,069 | | | | - | | | | 8,229,069 | |
| | | | | | | | | | | | | | |
| INVESTING ACTIVITIES | | | | | | | | | | | | | |
| Mineral property exploration expenditures | (a) | | | (846,745 | ) | | | 21,919 | | | | (824,826 | ) |
| Property, plant and equipment purchases | (a) | | | (334,705 | ) | | | 10,345 | | | | (324,360 | ) |
| | | | | | | | | | | | | | |
| | | | | (1,181,450 | ) | | | 32,264 | | | | (1,149,186 | ) |
| | | | | | | | | | | | | | |
Increase in cash and cash equivalents | (a) | | | 6,221,851 | | | | 93,317 | | | | 6,315,168 | |
| | | | | | | | | | | | | | |
CASH AND CASH EQUIVALENTS, Beginning | (a) | | | 2,829,605 | | | | 488 | | | | 2,830,093 | |
| Effect of exchange rate fluctuations on cash held | (a) | | | - | | | | (93,413 | ) | | | (93,413 | ) |
| | | | | | | | | | | | | | |
CASH AND CASH EQUIVALENTS, Ending | | | $ | 9,051,456 | | | $ | 392 | | | $ | 9,051,848 | |
AVINO SILVER & GOLD MINES LTD.
Notes to the Consolidated Financial Statements
For the years ended December 31, 2010, 20092011 and 20082010
(Expressed in Canadian dollars)
20. FIRST TIME ADOPTION OF INTERNATIONAL FINANCIAL REPORTING STANDARDS (continued)
Notes on reconciliations between Canadian GAAP and IFRS
20.(a) | DIFFERENCES BETWEEN CANADIAN AND UNITED STATES GENERALLY ACCEPTED ACCOUNTING PRINCIPLES (Continued) |
iii) Recently adopted accounting standardIFRS requires each entity consolidated within the financial statements to assess its functional currency. It was determined that the functional currency of the Parent Company is Canadian Dollars, which is consistent with its functional currency under Canadian GAAP. However, it was determined that the functional currency of the Company’s Mexican subsidiaries, which was Canadian Dollars under Canadian GAAP, to be United States Dollars under IFRS.
c) | Fair Value Measurement and DisclosuresIn contrast to Canadian GAAP, in which an integrated foreign operation’s non-monetary assets are translated at historical rates, IFRS requires that where an entity’s presentation currency differs from its functional currency, the financial position of the entity be translated into the presentation currency at the closing rate on the date of the statement of financial position. In addition, all exchange differences arising on the translation from functional to presentation currency are recognized in other comprehensive income.
In January 2010,accordance with IFRS 1, the FASB issued ASU 2010-16, “Fair Value Measurements and Disclosures (Topic 810) “Improving Disclosures About Fair Value Measurements.” This ASU provides further disclosure requirements for recurring and non-recurring fair value measurements. These disclosure requirements include transfers in and outCompany elected to deem all foreign currency translation differences that arose prior to the date of Level 1 and 2 and additional information relatingtransition to activity in Level 3 fair value measurements. The ASU also provides clarificationbe nil at that date. However, several adjustments were required to effect the translation of the subsidiaries’ financial position at the exchange rates on the leveldate of disaggregation for disclosurethe statements of fair value measurement. The new disclosurefinancial position, and clarifications are effective for interimtranslation of the statements of operations and annual periods beginning after December 31, 2009, except for disclosures about activity in Level 3 fair value measurements, which are effective for fiscal years beginning after December 15, 2010 and for interim periods within those fiscal years. The adoption of this ASU did not impact our financial results or disclosures as at December 31, 2010.cash flow from the functional to presentation currency.
|
iv) Recently issued accounting standards| (b) | IFRS requires an entity to present, for each component of equity, a reconciliation between the carrying amount at the beginning and end of the period, separately disclosing each change. The Company examined its “contributed surplus” account and concluded that as at the January 1, 2010 Transition Date and December 31, 2010, part of the contributed surplus relates to “Equity settled employee benefit reserve” and part to “Reserves for warrants”. IFRS also permits a transfer of reserves arising from share-based transactions, within equity. At January 1, 2010 $781,651 of total reserves related to options and compensation warrants no longer outstanding and was therefore transferred to Deficit, in order that the balance of equity reserve reflect only the fair value of options and compensation warrants outstanding on that date and also warrants issued with private placements. During the year ended December 31, 2010, some options outstanding at January 1, 2010 were cancelled, and therefore a further transfer, of the fair value attributed to these cancelled options, of $391,681 was made to Deficit. During the year ended December 31, 2011, 70,000 options expired unexercised and therefore a further transfer, of the fair value attributed to these cancelled options, of $203,999 was made to Deficit. |
We will transition to International Financial Reporting Standards as issued by the International Accounting Standards Board (“IFRS”) on January 1, 2011 and will no longer be required to prepare a reconciliation to US GAAP. Accordingly, we have not assessed the impact of adopting recent US accounting pronouncements with an application date of January 1, 2011 or beyond on our financial statements and disclosures.| (c) | The Company has certain non-monetary assets and liabilities for which the tax reporting currency (Mexican peso) is different from its functional currency. Any translation gains or losses on the remeasurement of these items at current exchange rates versus historic exchange rates that give rise to a temporary difference is recorded as a deferred tax asset or liability. The Company set up a deferred tax liability with a corresponding charge to deficit account in the amount of $297,173 at January 1, 2010 plus subsequent charge of $304,464 at December 31, 2010. Under IFRS, all deferred income tax liabilities are considered as non-current irrespective of the classification of the underlying assets and liabilities, or the expected reversal of the temporary difference. |
AVINO SILVER & GOLD MINES LTD.
Notes to the Consolidated Financial Statements
For the years ended December 31, 2011 and 2010
(Expressed in Canadian dollars)
20. FIRST TIME ADOPTION OF INTERNATIONAL FINANCIAL REPORTING STANDARDS (continued)
Notes on reconciliations between Canadian GAAP and IFRS (continued)
| (d) | Previously, under Canadian GAAP, the Company classified a consultant as a non-employee, whereas under IFRS, the consultant is classified as an employee and others providing similar services. The fair value of options granted employee and others providing similar services is measured at grant date, and each tranche is recognized using the graded vesting method over the period during which the options vest. Under Canadian GAAP, transactions in which goods or services are received from non-employees in exchange for the issuance of equity instruments are accounted for based on the fair value of the consideration received or the fair value of the equity instruments issued, whichever is more reliably measurable. An adjustment is required for the options granted to this consultant and the share-based compensation recognized during the year ended December 31, 2010. At December 31, 2010, a decrease of $20,036 was recorded to share-based payments with a corresponding increase to deficit for the same amount. |
| (e) | Under Canadian GAAP, when flow-through shares are issued, they are initially recorded in share capital at their issue price less the deferred tax liability related to the renounced expenditures. Under IFRS, flow-through shares are recognized in share capital based on the fair value attributed to common shares without a flow-through feature on the date the Company and the investors agree to the transaction. The difference (“premium”) between the amount recognized in common shares and the amount the investors pay for the flow-through shares is recognized as a flow-through share related liability which is reversed into the statement of loss within other income when the renounced expenditures are incurred. The cumulative premium and renunciation adjustment as at January 1, 2010 related to flow-through shares issued before January 1, 2010 is $60,950. |
| (f) | In accordance with IFRS 1, the Company has elected to classify its investment in related companies as fair value through profit or loss, that was previously classified as available for sale. The Company reclassified $6,049 from accumulated other comprehensive loss to deficit as at January 1, 2010 and reclassified a $313,323 unrealized gain on investments in related companies from other comprehensive loss to net loss for the year ended December 31, 2010. |
AVINO SILVER & GOLD MINES LTD.
Notes to the Consolidated Financial Statements
For the years ended December 31, 2011 and 2010
(Expressed in Canadian dollars)
| (a) | On January 3, 2012, the Company entered into an option agreement with Avaron Mining Corp. (“Avaron”) whereby Avaron can earn the exclusive right and option to acquire a 100% title and interest in the Company’s Eagle Property located in the Yukon Territory. Avaron can earn a 75% interest by making a total cash payment of $375,000, issue 800,000 common shares, incurring exploration costs of $100,000 and also drilling 35,000 meters (or incur exploration costs of up to $7,100,000). The remaining 25% interest can be earned by making a total of cash payment of $1,000,000 as advance royalty payments. Alternatively, the 25% interest can be earned with a cash payment o net smelter return royalty. The royalty can be purchased by paying $2,000,000 adjusted for the price of silver (capped at $4,000,000) and 375,000 common shares. |
| (b) | In February 2012, the Company’s wholly-owned Mexican subsidiary entered into a new agreement with Minerales de Avino, S.A. de C.V. ("Minerales") whereby Minerales has indirectly granted to the Company the exclusive right to explore and mine the La Platosa property known as the "ET zone". Under the agreement, the Company will have the exclusive right to explore and mine the property for an initial period of 15 years, with the option to extend the agreement for another 5 years. In consideration of the grant of these rights, the Company must pay to Minerales US$250,000, by the issuance of 135,189 common shares of the Company. The Company will have a period of 24 months for the development of mining facilities. The Company has agreed to pay to Minerales a royalty equal to 3.5% of net smelter returns at the commencement of commercial production from the property. In addition, after the Development Period, if the minimum monthly processing rate of the mine facilities is less than 15,000 tonnes, then the Company must pay to Minerales in any event a minimum royalty equal to the applicable NSR Royalty based on processing at a minimum monthly rate of 15,000 tonnes. Minerales has also granted to the Company the exclusive right to purchase a 100% interest in the property at any time during the term of the agreement (or any renewal thereof), upon payment of US$8 million within 15 days of the Company's notice of election to acquire the property. The purchase would be subject to a separate purchase agreement for the legal transfer of the property. |
| (c) | In February 2012, the Company’s wholly-owned subsidiary extended its contract with its drill contractor which is valued at US$410,000. |
| (d) | Subsequent to year end, 26,000 options were exercised for gross proceeds of $22,800. |
SIGNATURE
The registrant hereby certifies that it meets all of the requirements for filing on Form 20-F and that it has duly caused and authorized the undersigned to sign this Annual Report on its behalf.
| | AVINO SILVER & GOLD MINES LTD. | |
| | | | |
Date: July 7, 2011 May 11, 2012 | By: | /s/ David Wolfin | |
| | | David Wolfin, Chief Executive Officer | |
| | (Principal Executive Officer) | |
| | | |
| Exhibit Number | | Name |
| | | |
| 1.1 | | Memorandum of Avino Silver & Gold Mines Ltd.* |
1.21.2. | | Articles of Avino Silver & Gold Mines Ltd.* |
| 4.1 | | Share Purchase Agreement dated March 22, 2004* |
| 8.1 | | List of Subsidiaries |
| 12.1 | | Certification of the Principal Executive Officer |
| 12.2 | | Certification of the Principal Financial Officer |
| 13.1 | | Certificate under the Sarbanes-Oxley Act of the Principal Executive Officer |
| 13.2 | | Certificate under the Sarbanes-Oxley Act of the Principal Financial Officer |
| 13.3 | | Consent of Expert |
___________________________
* Previously filed.