UNITED STATES
SECURITIES AND EXCHANGE COMMISSION
WASHINGTON, D.C. 20549
FORM 20-F
| ¨ | REGISTRATION STATEMENT PURSUANT TO SECTION 12(b) OR (g) OF THE SECURITIES EXCHANGE ACT OF 1934 |
or
or | |
x | ANNUAL REPORT PURSUANT TO SECTION 13 OR 15(d) OF THE SECURITIES EXCHANGE ACT OF 1934 |
For the fiscal year ended January 31, |
or
or | |
¨ | TRANSITION REPORT PURSUANT TO SECTION 13 OR 15 (d) OF THE SECURITIES EXCHANGE ACT OF 1934 |
or
or | |
¨ | SHELL COMPANY REPORT PURSUANT TO SECTION 13 OR 15(d) OF THE SECURITIES EXCHANGE ACT OF 1934 |
Date of event requiring this shell company report______________ | |
| |
For the transition period from ___________________ to ___________________ |
Commission File Number 0-15688
CORAL GOLD RESOURCES LTD. |
(Exact name of Registrant as specified in its charter) |
Not Applicable
(Translation of Registrant'sRegistrant’s name into English)
British Columbia, Canada
(Jurisdiction of incorporation or organization)
570 Granville Street, Suite 900, Vancouver, British Columbia V6C 3P1, Canada
(Address of principal executive offices)
David Wolfin, Tel: 604 682-3701, Email: dwolfin@coralgold.com
570 Granville Street, Suite 900, Vancouver, British Columbia V6C 3P1, Canada
(Name, Telephone, E-mail and/or Facsimile number and Address of Company Contact Person)
Securities registered or to be registered pursuant to Section 12(b) of the Act:
Not Applicable | Not Applicable | |
Title of Each Class | Name of each exchange on which registered |
Securities registered or to be registered pursuant to Section 12(g) of the Act:
Common Shares, without Par Value
(Title of Class)
Securities for which there is a reporting obligation pursuant to Section 15(d) of the Act:
Not Applicable
(Title of Class)
Indicate the number of outstanding shares of each of the issuer'sissuer’s classes of capital or common stock as of the close of the period covered by the annual report.
There were 47,825,33748,043,337 common shares, without par value, issued and outstanding as of January 31, 2016.2019.
Indicate by check mark if the registrant is a well-known seasoned issuer, as defined in Rule 405 of the Securities Act. ¨ Yes x No
If this report is an annual or transition report, indicate by check mark if the registrant is not required to file reports pursuant to Section 13 or 15(d) of the Securities Exchange Act of 1934. ¨ Yes x No
Indicate by check mark whether the registrant (1) has filed all reports required to be filed by Section 13 or 15(d) of the Securities Exchange Act of 1934 during the preceding 12 months (or for such shorter period that the registrant was required to file such reports), and (2) has been subject to such filing requirements for the past 90 days. x Yes ¨ No
Indicate by check mark whether the registrant has submitted electronically and posted on its corporate web site, if any, every Interactive Data File required to be submitted and posted pursuant to Rule 405 of Regulation S-T (§232.405 of this chapter) during the preceding 12 months (or for such shorter period that the registrant was required to submit and post such files). [Not applicable to the registrant]¨x Yes ¨ No
Indicate by check mark whether the registrant is a large accelerated filer, an accelerated filer, or a non-accelerated filer.filer, or an emerging growth company. See definition of “large accelerated filer”, "accelerated filer,” and large accelerated filer""emerging growth company" in Rule 12b-2 of the Exchange Act. (Check one):
Large Accelerated File | ¨ |
| |
Non-Accelerated Filer | x | ||
Accelerated Filer | ¨ | Emerging Growth Company | ¨ |
If an emerging growth company that prepares its financial statements in accordance with U.S. GAAP, indicate by check mark if the registrant has elected not to use the extended transition period for complying with any new or revised financial accounting standards provided pursuant to Section 13(a) of the Exchange Act. ¨
Indicate by check mark which basis of accounting the registrant has used to prepare the financial statements included in this filing:
U.S. GAAP¨ | International Financial Reporting Standards as issued by the International Accounting Standards Boardx | Other¨ |
If "Other"“Other” has been checked in response to the previous question, indicate by check mark which financial statement item the registrant has elected to follow. Item 17 ¨ Item 18 ¨
If this is an annual report, indicate by check mark whether the registrant is a shell company (as defined in Rule 12b-2 of the Exchange Act). Yes ¨ No x
(APPLICABLE ONLY TO ISSUERS INVOLVED IN BANKRUPTCY PROCEEDINGS DURING THE PAST FIVE YEARS)
Indicate by check mark whether the registrant has filed all documents and reports required to be filed by Sections 12, 13 or 15(d) of the Securities Exchange Act of 1934 subsequent to the distribution of securities under a plan confirmed by a court. Yes ¨ No ¨
Item |
| ||||
Page | |||||
|
| ||||
|
| ||||
|
| ||||
3 | |||||
| |||||
EXPLANATORY NOTE REGARDING PRESENTATION OF FINANCIAL INFORMATION |
| ||||
|
| ||||
|
| 4 | |||
| 4 | ||||
| |||||
| |||||
| |||||
| |||||
| |||||
|
| ||||
| |||||
| |||||
| |||||
| |||||
| |||||
| |||||
| |||||
| |||||
|
| 37 | |||
| |||||
| |||||
| |||||
| |||||
Material Modifications to the Rights of Security Holders and Use of Proceeds |
| ||||
| |||||
| |||||
| |||||
| |||||
| |||||
| |||||
Purchases of Equity Securities by the Issuer and Affiliated Purchasers |
| ||||
|
|
| |||
|
|
| |||
|
|
| |||
|
| 40 | |||
40 | |||||
40 | |||||
40 | |||||
41 | |||||
41 | |||||
42 | |||||
| 2 | ||||
|
|
| ||
|
|
| ||
|
|
|
Nomenclature
In this Annual Report on Form 20-F, which we refer to as the "Annual Report"“Annual Report”, except as otherwise indicated or as the context otherwise requires, the "Company"terms “Company”, "Coral"“we”, "we", "our"“our” or "us"“us” refers to Coral Gold Resources Ltd. and its subsidiaries.
You should rely only on the information contained in this Annual Report. We were organized under the Company Act of the Province of British Columbia, Canada on January 22, 1981 under the name of Carol Energy Corporation, which name was changedhave not authorized anyone to Coral Energy Corporation on March 3, 1982, and to Coral Gold Corp. on September 9, 1987. On September 14, 2004, we changed our name to Coral Gold Resources Ltd. in conjunctionprovide you with a 10 to 1 share consolidation and transitioned to the British Columbia Business Corporations Act on July 15, 2004. The principal executive office of the Companyinformation that is located at 570 Granville Street, Suite 900, Vancouver, British Columbia, V6C 3P1, and its telephone number is 604-682-3701.
different. The information in this Annual Report may only be accurate on the date of this Annual Report or on or as at any other date provided with respect to specific information herein.information.
Unless otherwise indicated in this Annual Report, all references to "Canadian Dollars"“Canadian Dollars”, "CDN$"“CDN$”, "dollars"“dollars” or "$"“$” are to the lawful currency of Canada and all references to "U.S. Dollars"“U.S. Dollars”, or "US$"“US$” are to the lawful currency of the United States.
Certain statements in this Annual Report, including those appearing under Item 5, constitute "forward-looking statements"“forward-looking statements”, including, without limitation, those concerning the economic outlook for the mining industry, expectations regarding mineral prices, potential production, cash costs and other operating results, growth prospects and outlook of the Company'sCompany’s operations, individually or in the aggregate, including the completion and commencement of commercial operations of certain of the Company'sCompany’s exploration and production projects, the Company'sCompany’s liquidity and capital resources and capital expenditures, the outcome and consequences of any potential or pending litigation or regulatory proceedings, and the Company'sCompany’s plan to conduct drilling operations. Additionally, forward-looking statements are generally identifiable by the terminology used such as "plans"“plans”, "expects"“expects”, "estimates"“estimates”, "budgets"“budgets”, "intends"“intends”, "anticipates"“anticipates”, "believes"“believes”, "projects"“projects”, "indicates"“indicates”, "targets"“targets”, "objective"“objective”, "could"“could”, "may"“may”, or other similar words.
The forward-looking statements are subject to known and unknown risks and uncertainties and other factors that may cause actual results, levels of activity and achievements to differ materially from those expressed or implied by such statements. Such factors include, among others: market prices for metals; the results of exploration and development drilling and related activities; economic conditions in the countries and provinces in which we carry on business, especially economic slowdown; actions by governmental authorities including increases in taxes, changes in environmental and other regulations, and renegotiations of contracts; political uncertainty, including actions by insurgent groups or other conflict; the negotiation and closing of material contracts; and the other factors discussed in Item 3 Key Information – "Risk Factors"“Risk Factors”, and in other documents that we file with the SEC. The impact of any one factor on a particular forward-looking statement is not determinable with certainty as such factors are interdependent upon other factors; our course of action would depend upon our assessment of the future considering all information then available. In that regard, any statements as to future production levels, if any; capital expenditures; the allocation of capital expenditures to exploration and development activities; sources of funding of our capital program; drilling; expenditures and allowances relating to environmental matters; anticipated dates by which certain areas will be developed or will come on-stream; expected finding and development costs; future production rates; ultimate recoverability of reserves; dates by which transactions are expected to close; cash flows; uses of cash flows; collectability of receivables; availability of trade credit; expected operating costs; expenditures and allowances relating to environmental matters; debt levels; and changes in any of the foregoing are forward-looking statements, and theret There can be no assurances that the expectations conveyed by such forward-looking statements will, in fact, be realized.
Although we believe that the expectations conveyed by the forward-looking statements are reasonable based on information available to us on the date such forward-looking statements were made, no assurances can be given as to future results, levels of activity, achievements or financial condition.
Readers should not place undue reliance on any forward-looking statement and should recognize that the statements are predictions of future results, which may not occur as anticipated. Actual results could differ materially from those anticipated in the forward-looking statements and from historical results, due to the risks and uncertainties described above, as well as others not now anticipated. The foregoing statements are not exclusive and further information concerning the Company, including factors that could materially affect its financial results, may emerge from time to time. The Company does not intend to update forward-looking statements to reflect actual results or changes in factors or assumptions affecting such forward-looking statements.
| 3 |
| Table of Contents |
In Canada, an issuer is required to provide technical information with respect to mineralization, including reserves and resources, if any, on its mineral exploration properties in accordance with Canadian requirements, which differ significantly from the requirements of the Securities and Exchange Commission (the "SEC"“SEC”) applicable to registration statements and reports filed by United States companies pursuant to the United States Securities Act of 1933, as amended (the "Securities Act"“Securities Act”), or the United States Securities Exchange Act of 1934, as amended (the "Exchange Act"“Exchange Act”). As such, information contained in this annual reportAnnual Report concerning descriptions of mineralization under Canadian standards may not be comparable to similar information made public by United States companies subject to the reporting and disclosure requirements of the SEC. In particular, this annual report on Form 20-F includes the terms "mineral resource," "measured mineral resource," "indicated mineral resource" and "inferred mineral resource". Investors are advised that these terms are defined under Canadian rules under National Instrument 43-101 ("NI 43-101"). Investors are cautioned not to assume that any part of the mineral deposits in these categories will ever be converted into reserves. However, these terms are not defined terms under SEC Industry Guide 7 and are not permitted to be used in reports and registration statements filed with the SEC by U.S. domestic issuers. In addition, NI 43-101 permits disclosure of "contained ounces" of mineralization. In contrast, the SEC only permits issuers to report mineralization as in place tonnage and grade without reference to unit measures.
The definitions of proven and probable reserves used in NI 43-101 differ from the definitions in SEC Industry Guide 7. Under SEC Industry Guide 7 (under the Exchange Act), as interpreted by the staff of the SEC, mineralization may not be classified as a "reserve" for United States reporting purposes unless the determination has been made that the mineralization could be economically and legally produced or extracted at the time the reserve determination is made. Among other things, all necessary permits would be required to be in hand or issuance imminent in order to classify mineralized material as reserves under the SEC standards.
Investors are cautioned not to assume that any part or all of the mineral deposits identified as an "indicated mineral resource," "measured mineral resource" or "inferred mineral resource" will ever be converted to reserves as defined in NI 43-101 or SEC Industry Guide 7. Further, "inferred mineral resources" have a great amount of uncertainty as to their existence and economic and legal feasibility. It cannot be assumed that all or any part of an inferred mineral resource will ever be upgraded to a higher category. Under Canadian securities legislation, estimates of inferred mineral resources may not form the basis of feasibility or pre-feasibility studies, or economic studies. Investors are cautioned not to assume that part or all of an inferred mineral resource exists, or is economically or legally mineable.
EXPLANATORY NOTE REGARDING PRESENTATION OF FINANCIAL INFORMATION
The annual audited consolidated financial statements contained in this annual report on Form 20-F are reported in Canadian dollars. For the years ended January 31, 20122019 through January 31, 20162015, inclusive we have prepared our consolidated financial statements in accordance with International Financial Reporting Standards ("IFRS"(“IFRS”) as issued by the International Accounting Standards Board ("IASB"(“IASB”).
GLOSSARY OF TECHNICAL TERMS
| ||
| The elemental symbol for gold. | |
|
| |
|
| |
|
| |
|
| |
|
| |
|
| |
|
| |
|
| |
| A fracture in a rock where there has been displacement of the two sides. | |
| The concentration of each ore metal in a rock sample, usually given as weight percent. Where extremely low concentrations are involved, the concentration may be given in grams per tonne (g/t or gpt) or ounces per ton (oz/t). The grade of an ore deposit is calculated, often using sophisticated statistical procedures, as an average of the grades of a very large number of samples collected from throughout the deposit. | |
|
| |
|
| |
|
| |
|
| |
|
| |
|
| |
|
| |
|
| |
|
|
|
|
| Usually implies minerals of value occurring in rocks. |
| Payment of a percentage of net mining profits after deducting applicable smelter charges. |
|
|
|
|
| A natural aggregate of one or more minerals which may be mined and sold at a profit, or from which some part may be profitably separated. |
|
|
|
|
|
|
|
|
|
|
|
|
|
|
|
|
|
|
|
|
|
|
| Imperial measurement of weight equivalent to 2,000 pounds. |
| Metric measurement of weight equivalent to 1,000 kilograms (or 2,204.6 pounds). |
|
A long, narrow excavation dug through overburden, or blasted out of rock, to expose a vein or ore structure.
veins
The mineral deposits that are found filling openings in rocks created by faults or replacing rocks on either side of faults.
wenban limestone
Devonian limestones best exposed on the western flank of Wenban Peak south of the town of Cortez, Nevada.
| 4 |
| Table of Contents |
Item 1. Identity of Directors, Senior Management and Advisers
Not applicable.
Item 2. Offer Statistics and Expected Timetable
Not applicable.
| A. Selected Financial Data For the years ended January 31, 2019, 2018, 2017, 2016 and 2015, we have prepared our consolidated financial statements in accordance with IFRS, as issued by the IASB.
|
The selected historical consolidated financial information set forth below has been derived from our annual audited consolidated financial statements for each of the years in the five-year period ended January 31, 2016.
For the years ended January 31, 2016, 2015, 2014, 2013, and 2012 we have prepared our consolidated financial statements in accordance with IFRS, as issued by the IASB.2019.
The selected historical consolidated financial information presented below is condensed and may not contain all of the information that you should consider. This selected financial data should be read in conjunction with our annual audited consolidated financial statements, the notes thereto and the section entitled ''Item 5 — Operating‘‘Item 5-Operating and Financial Review and Prospects.''’’
|
| Years Ended January 31, |
| |||||||||||||||||
| 2019 |
|
| 2018 |
|
| 2017 |
|
| 2016 |
| 2015 |
| |||||||
Operations |
|
|
|
|
|
|
|
|
|
|
|
|
|
|
| |||||
Revenue |
| $ | - |
|
| $ | - |
|
| $ | - |
|
| $ | - |
|
| $ | - |
|
Expense |
|
|
|
|
|
|
|
|
|
|
|
|
|
|
|
|
|
|
|
|
Operating and Administrative |
|
| 878,566 |
|
|
| 1,375,982 |
|
|
| 580,066 |
|
|
| 642,193 |
|
|
| 538,469 |
|
Net Income (Loss) |
|
| 704,296 |
|
|
| 2,015,340 |
|
|
| (981,139 | ) |
|
| 50,521 |
|
|
| 527 |
|
Earnings (Loss) Per Share - Basic |
|
| 0.01 |
|
|
| 0.04 |
|
|
| (0.02 | ) |
|
| 0.00 |
|
|
| 0.00 |
|
Earnings (Loss) Per Share – Diluted |
|
| 0.01 |
|
|
| 0.04 |
|
|
| (0.02 | ) |
|
| 0.00 |
|
|
| 0.00 |
|
|
|
|
|
|
|
|
|
|
|
|
|
|
|
|
|
|
|
|
|
|
Weighted Average Number of Shares Outstanding - Basic |
|
| 48,672,608 |
|
|
| 47,570,158 |
|
|
| 48,396,734 |
|
|
| 44,200,953 |
|
|
| 42,016,049 |
|
Weighted Average Number of Shares Outstanding – Diluted |
|
| 49,826,429 |
|
|
| 50,519,282 |
|
|
| 48,396,734 |
|
|
| 44,200,953 |
|
|
| 42,741,915 |
|
In accordance with IFRS
|
| As at January 31, |
| |||||||||||||||||
Balance Sheet |
| 2019 |
|
| 2018 |
|
| 2017 |
|
| 2016 |
|
| 2015 |
| |||||
Working Capital (deficit) |
|
| 15,094,434 |
|
| $ | 15,296,877 |
|
| $ | (117,528 | ) |
| $ | 470,078 |
|
| $ | 11,324 |
|
Total Assets |
|
| 22,222,757 |
|
|
| 21,937,782 |
|
|
| 19,641,035 |
|
|
| 20,088,148 |
|
|
| 20,275,844 |
|
Liabilities |
|
| 2,966,800 |
|
|
| 2,881,168 |
|
|
| 1,793,502 |
|
|
| 1,413,790 |
|
|
| 2,011,063 |
|
Equity |
|
| 19,255,957 |
|
|
| 19,056,614 |
|
|
| 17,837,213 |
|
|
| 18,674,358 |
|
|
| 18,264,781 |
|
The tables below set forth selected consolidated financial data under IFRS for the years ended January 31, 2016, 2015, 2014, 2013B. Capitalization and 2012. The information has been derived from our annual audited consolidated financial statements.Indebtedness
Years Ended January 31, 2016 2015 2014 2013 2012 Operations Revenue Expense Operating and Administrative Net Income (loss) Net Earnings (loss) Per Share Weighted Average Number of Shares Outstanding $ - $ - $ - $ - $ - 642,193 538,469 860,517 1,365,288 772,587 50,521 527 (50,871 ) (1,542,564 ) (773,813 ) 0.00 0.00 (0.00 ) (0.05 ) (0.02 ) 44,200,953 42,016,049 36,024,532 33,563,649 33,483,650
|
| As at January 31, |
| |||||||||||||||||
| 2016 |
|
| 2015 |
|
| 2014 |
|
| 2013 |
|
| 2012 |
| ||||||
Balance Sheet | ||||||||||||||||||||
Working Capital (deficit) |
| $ | 470,078 |
|
| $ | 11,324 |
|
| $ | (486,109 | ) |
| $ | (539,814 | ) |
| $ | 1,166,663 |
|
Total Assets |
|
| 20,088,148 |
|
|
| 20,275,844 |
|
|
| 19,856,395 |
|
|
| 20,330,548 |
|
|
| 20,756,599 |
|
Liabilities |
|
| 1,413,790 |
|
|
| 2,011,063 |
|
|
| 2,750,713 |
|
|
| 3,435,002 |
|
|
| 2,719,920 |
|
Equity |
|
| 18,674,358 |
|
|
| 18,264,781 |
|
|
| 17,105,682 |
|
|
| 16,895,546 |
|
|
| 18,036,679 |
|
Exchange Rates
The following table sets forth information as to the period end, average, the high and the low exchange rate for Canadian Dollars and U.S. Dollars for the periods indicated based on the noon buying rate in New York City for cable transfers in Canadian Dollars as certified for customs purposes by the Federal Reserve Bank of New York (Canadian dollar = US$1).
Year Ended January 31, |
| Average |
|
| Period End |
|
| High |
|
| Low |
| ||||
2012 |
|
| 0.9970 |
|
|
| 1.0052 |
|
|
| 1.0604 |
|
|
| 0.9449 |
|
2013 |
|
| 0.9978 |
|
|
| 0.9973 |
|
|
| 1.0299 |
|
|
| 0.9599 |
|
2014 |
|
| 1.0389 |
|
|
| 1.1138 |
|
|
| 1.1178 |
|
|
| 0.9955 |
|
2015 |
|
| 1.1151 |
|
|
| 1.2711 |
|
|
| 1.2711 |
|
|
| 1.0639 |
|
2016 |
|
| 1.2964 |
|
|
| 1.4080 |
|
|
| 1.4223 |
|
|
| 1.2185 |
|
The following table sets forth the high and low exchange rate for the past six months based on the noon buying rate. As of June 9, 2016, the exchange rate was CDN$1.2731 for each US$1.
Month |
| High |
|
| Low |
| ||
December 2015 |
|
| 1.3990 |
|
|
| 1.3360 |
|
January 2016 |
|
| 1.4589 |
|
|
| 1.3969 |
|
February 2016 |
|
| 1.4040 |
|
|
| 1.3523 |
|
March 2016 |
|
| 1.3468 |
|
|
| 1.2962 |
|
April 2016 |
|
| 1.3170 |
|
|
| 1.2544 |
|
May 2016 |
|
| 1.3136 |
|
|
| 1.2548 |
|
|
Not Applicable.
|
| Table of |
C. Reasons for the Offer and Use of Proceeds
Not Applicable.
| D. Risk Factors
|
In addition to the other information presented in this Annual Report, the following should be considered carefully in evaluating the Company and its business. This Annual Report contains forward forward‑looking statements that involve risks and uncertainties. The Company'sCompany’s actual results may differ materially from the results discussed in the forward forward‑looking statements. Factors that might cause such a difference include, but are not limited to, those discussed below and elsewhere in this Annual Report.
WeAlthough the Company recognized net income for the years ended January 31, 2018 and 2019, the Company does not anticipate any revenues in the near future and will be requiredincur losses.During the year ended January 31, 2019, the Company recognized net income from positive movements in foreign exchange, which fluctuates from period to raise additional capitalperiod based on the value of the Canadian dollar in relation to mine our properties.the US dollar. The Company is currentlyCompany’s remaining properties are in the exploration stage of its properties. Ifstage. Therefore until such properties can develop or the Company determines, based on its most recent information,can acquire properties that it is feasible to begin operations on its properties,can be development and revenues can be derived therefrom, the Company will incur losses.
As of January 31, 2019, our internal controls over financial reporting were ineffective, and if we continue to fail to improve such controls and procedures, investors could lose confidence in our financial and other reports, the price of our shares of common stock may decline, and we may be requiredsubject to raise additional capital in orderincreased risks and liabilities.As a public company, we are subject to developthe reporting requirements of the United States Securities Exchange Act of 1934, as amended, and bring the properties into production.Sarbanes-Oxley Act of 2002. The Company's abilityExchange Act requires, among other things, that we file annual reports with respect to raise funds will depend on several factors, including, butour business and financial condition. Section 404 of the Sarbanes-Oxley Act requires, among other things, that we include certifications of our management regarding the effectiveness of our disclosure controls and procedures. For the year ended January 31, 2019, our management has concluded that our disclosure controls and procedures were not limitedeffective to current economic conditions, its properties, its prospects, metal prices, businesses competing for financingprovide reasonable assurance that material information relating to the Company and its consolidated subsidiaries is made known to management and disclosed in accordance with applicable securities regulations. Further, management concluded the Company’s internal control over financial condition. Thereporting was not effective as at January 31, 2019, due to the following material weaknesses: (i) due to the limited number of staff resources, the Company believes there are instances where a lack of segregation of duties exist to provide effective controls; and (ii) due to the limited number of staff resources, the Company may not be ablehave the necessary in-house knowledge to raise funds, oraddress complex accounting and tax issues that may arise. If we cannot effectively and efficiently improve our controls and procedures, we could suffer material misstatements in our financial statements and other information we report and fail to raise funds on commercially reasonable terms. Ifmeet our reporting obligations, which would likely cause investors to lose confidence in our reported financial and other information. This could lead to a decline in the Company is unable to raise additional funds, it may not be able to develop its properties or any of its business plans as described in this Annual Report.trading price for our common shares.
The commercial quantities of ore cannot be accurately predicted. Whether an ore body will be commercially viable depends on a number of factors including the particular attributes of the deposit, such as size, grade and proximity to infrastructure, as well as mineral prices and government regulations, including regulations relating to prices, taxes, royalties, land tenure, land use, importing and exporting of minerals and environmental protection. The exact effect of these factors cannot be accurately predicted, but the combination of these factors may result in a mineral deposit being unprofitable.
The mining industry is highly speculative and involves substantial risks. The mining industry, from exploration, development and production is a speculative business, characterized by a number of significant risks including, among other things, unprofitable efforts resulting not only from the failure to discover mineral deposits but from finding mineral deposits which, though present, are insufficient in quantity and quality to return a profit from production. The marketability of minerals acquired or discovered by the Company may be affected by numerous factors which are beyond the control of the Company and which cannot be accurately predicted, such as market fluctuations, the proximity and capacity of milling facilities, mineral markets and processing equipment, and government regulations, including regulations relating to royalties, allowable production, importing and exporting of minerals, and environmental protection. The combination of such factors may result in the Company not receiving any or an adequate return on investment capital.
The Company'sCompany’s properties are all at the exploration stage and have no proven reserves. All of the Company'sCompany’s properties are in the exploration stage only and are without a known body of ore. If the Company does not discover a body of ore in its properties, the Company will search for other properties where it can continue similar work.
| 6 |
| Table of Contents |
The Company'sCompany’s mineral exploration efforts may be unsuccessful. Despite exploration work on its mineral claims, no known bodies of commercial ore or economic deposits have been established on any of the Company's properties. In addition, theThe Company is at the exploration stage on all of its properties and substantial additional work will be required in order to determine if any economic deposits occur on the Company'sCompany’s properties. Even in the event commercial quantities of minerals are discovered, the exploration properties might not be brought into a state of commercial production. Finding mineral deposits is dependent on a number of factors, including the technical skill of exploration personnel involved. The commercial viability of a mineral deposit once discovered is also dependent on a number of factors, some of which are particular attributes of the deposit, such as size, grade and proximity to infrastructure, as well as metal prices.
Competition for mineral land. There is a limited supply of desirable mineral lands available for acquisition, claim staking or leasing in the areas where the Company contemplates expanding its operations and conducting exploration activities. Many participants are engaged in the mining business, including large, established mining companies. Accordingly, there can be no assurance that the Company will be able to compete successfully for new mining properties.
Uncertainty of exploration and development programs. The Company'sCompany’s results of operations are significantly affected by the costs and results of its exploration and development programs. Exploration for minerals is highly speculative in nature, involves many risks and is frequently unsuccessful. Among the many uncertainties inherent in any gold and silver exploration and development program are the location of economic ore bodies, the development of appropriate metallurgical processes, the receipt of necessary governmental permits and the construction of mining and processing facilities. Assuming the discovery of an economic deposit, depending on the type of mining operation involved, several years may elapse from the initial phases of drilling until commercial operations are commenced and, during such time, the economic feasibility of production may change. Accordingly, the Company'sCompany’s exploration and development programs may not result in any new economically viable mining operations or yield new mineral reserves to expand current mineral reserves.
Licenses and permits. The operations of the Company require licenses and permits from various governmental authorities. The Company believes that it holds all necessary licenses and permits required under applicable laws and regulations and believes that it is presently complying in all material respects with the terms of such licenses and permits. However, such licenses and permits are subject to change in various circumstances. There can be no guarantee that the Company will be able to obtain or maintain all necessary licenses and permits as are required to explore and develop its properties, commence construction or operation of mining facilities and properties under exploration or development or to maintain continued operations that economically justify the cost.
Litigation. Although the Company is not currently subject to litigation, it may become involved in disputes with other parties in the future which may result in litigation. Any litigation could be costly and time consuming and could divert the Company's management from the Company's business operations. In addition, if the Company is unable to resolve any litigation favorably, it may have a material adverse impact on the Company's financial performance, cash flow and results of operations.
Acquisitions. The Company undertakes evaluations of opportunities to acquire additional mining properties. Any resultant acquisitions may be significant in size, may change the scale of the Company's business, and may expose the Company to new geographic, political, operating, financial and geological risks. The Company's success in its acquisition activities depends on its ability to identify suitable acquisition candidates, acquire them on acceptable terms, and integrate their operations successfully. Any acquisitions would be accompanied by risks, such as a significant decline in the price of gold or silver, the ore body proving to be below expectations, the difficulty of assimilating the operations and personnel of any acquired companies, the potential disruption of the Company's ongoing business, the inability of management to maximize the financial and strategic position of the Company through the successful integration of acquired assets and businesses, the maintenance of uniform standards, controls, procedures and policies, the impairment of relationships with customers and contractors as a result of any integration of new management personnel and the potential unknown liabilities associated with acquired mining properties. In addition, the Company may need additional capital to finance an acquisition. Historically, the Company has raised funds through equity financing and the exercise of options and warrants. However, the market prices for natural resources are highly speculative and volatile. Accordingly, instability in prices may affect interest in resource properties and the development of and production from such properties that may adversely affect the Company's ability to raise capital to acquire and explore resource properties. There can be no assurance that the Company would be successful in overcoming these risks or any other problems encountered in connection with such acquisitions.
Conflict of interest. Certain directors and officers of the Company are officers and/or directors of, or are associated with, other natural resource companies that acquire interests in mineral properties. Such associations may give rise to conflicts of interest from time to time. The directors are required by law, however, to act honestly and in good faith with a view to the best interests of the Company and its shareholders and to disclose any personal interest which they may have in any material transaction which is proposed to be entered into with the Company and to abstain from voting as a director for the approval of any such transaction.
Uncertainty of continuing as a going concern. The continuation of the Company and the recoverability of mineral property costs depends upon its ability to discover economically recoverable mineral reserves, attain profitable operations and generate cash flow from operations and/or to raise equity capital through the sale of its securities. The Company's consolidated financial statements do not include the adjustments that would be necessary if the Company were unable to continue as a going concern.
Limited and volatile trading volume.volume. Although the Company'sCompany’s common shares are listed on the TSX Venture Exchange (the "TSX-V"“TSX-V”), the Frankfurt Stock Exchange (the "FSE"“FSE”), and the Berlin-Bremen Stock Exchange and quoted in the United States on the OTCPink,OTCQX, the volume of trading has been limited and volatile in the past and is likely to continue to be so in the future, reducing the liquidity of an investment in the Company'sCompany’s common shares and making it difficult for investors to readily sell their shares in the open market. Without a liquid market for the Company'sCompany’s common shares, investors may be unable to sell their shares at favorable times and prices and may be required to hold their shares in declining markets or to sell them at unfavorable prices.
Volatility of share price.price. In recent years, securities markets in Canada have experienced a high level of price volatility. The market price of many resource companies, particularly those, like the Company, that are considered speculative exploration companies, have experienced wide fluctuations in price, resulting in substantial losses to investors who have sold their shares at a low price point. These fluctuations are based only in part on the level of progress of exploration, and can reflect general economic and market trends, world events or investor sentiment, and may sometimes bear no apparent relation to any objective factors or criteria. During the 20162019 fiscal year, the Company'sCompany’s common share price fluctuated on the TSX-V between a low of $0.06$0.32 and a high of $0.18.$0.44. Significant fluctuations in the Company'sCompany’s common share price isare likely to continue, and could potentially increase in the future.
| 7 |
| Table of Contents |
Difficulty for United States investors to effect service of process against the Company.Company. The Company is incorporated under the laws of the Province of British Columbia, Canada. Consequently, it will be difficult for United States investors to effect service of process in the United States upon the directors or officers of the Company, or to realize in the United States uponCanada judgments of United States courts predicated upon civil liabilities under the Exchange Act. The majority of the Company'sCompany’s directors and officers are residents of Canada. A judgment of a United States court predicated solely upon such civil liabilities would likely be enforceable in Canada by a Canadian court if the United States court in which the judgment was obtained had jurisdiction, as determined by the Canadian court, in the matter. There is substantial doubt whether an original action could be brought successfully in Canada against any of such persons or the Company predicated solely upon such civil liabilities.
The Company is subject to foreign currency fluctuations. The Company operates in more than one country and the Company's functional currency is the Canadian Dollar. The Company's offices are located in Canada, all of its mining exploration properties are located in United States, and the Company's financial results are reported in Canadian Dollars. The Company's currency fluctuation exposure is primarily to the U.S. Dollar and the Canadian Dollar. The Company reported a foreign exchange loss of $9,714 during the year ended January 31, 2016. The Company does not use derivative financial instruments for speculative trading purposes, nor does the Company hedge its foreign currency exposure to manage the Company's foreign currency fluctuation risk. Fluctuations in and among the various currencies in which the Company operates could have a material effect on the Company's operations and its financial results.
The Company has incurred net losses since its inception and expects losses to continue. The Company has not been profitable since its inception. For the fiscal year ended January 31, 2016, the Company had net income of $50,521 due to deferred income tax recovery and an accumulated deficit on January 31, 2016 of $27,829,911. As the Company is currently at the exploration stage and has no reserves of precious metals, there is no assurance that the Company will be profitable in the future.
There are no assurances that we will discover minerals on a commercially viable basis. The Company'sCompany’s ability to generate revenues and profits is expected to occur through exploration, development and production of its existing properties as well as through acquisitions of interests in new properties. Substantial expenditures will be incurred in an attempt to establish the economic feasibility of mining operations by identifying mineral deposits and establishing ore reserves through drilling and other techniques, developing metallurgical processes to extract metals from ore, designing facilities and planning mining operations. The economic feasibility of a project depends on numerous factors, including the cost of mining and production facilities required to extract the desired minerals, the total mineral deposits that can be mined using a given facility, the proximity of the mineral deposits to a user of the minerals, and the market price of the minerals at the time of sale. There is no assurance that existing or future exploration programs or acquisitions will result in the identification of deposits that can be mined profitably.
The Company'sCompany’s exploration activities are subject to various federal, state and local laws and regulations. Laws and regulations govern various aspects of the Company'sCompany’s business including the following: taxes; labor standards; occupational health; waste disposal; protection of the environment; mine safety; toxic substances; and the exploration, development, mining, production, importing and exporting of minerals. In many cases, licenses and permits are required to conduct mining operations. Amendments to current laws and regulations governing operations and activities of mining companies or more stringent implementation thereof could have a substantial adverse impact on the Company. Applicable laws and regulations will require the Company to make certain capital and operating expenditures to initiate new operations. Under certain circumstances, the Company may be required to stop its exploration activities once it is started until a particular problem is remedied or to undertake other remedial actions.
Market price is highly speculative.speculative. The market prices of metals are highly speculative and volatile. Instability in metal prices may affect the interest in mining properties and the exploration, development and production of such properties. If gold prices substantially decline, this may adversely affect the Company'sCompany’s ability to raise capital to explore for existing and new mineral properties.
The Company operates in a highly competitive industry. The Company competes with other developmental resource companies which have similar operations, and many competitors have operations and financial resources and industry experience greater than those of the Company. The Company may encounter increasing competition from other mining companies in its efforts to acquire mineral properties and hire experienced resource industry professionals. Increased competition in the Company'sCompany’s business could adversely affect its ability to attract necessary capital funding or acquire suitable producing properties or prospects for mineral exploration in the future.
Penny stock rules may make it more difficult to trade the Company'sCompany’s common shares. The SEC has adopted regulations which generally define a "penny stock"“penny stock” to be any equity security that has a market price of less than US$5.00 per share or an exercise price of less than US$5.00 per share, subject to certain exceptions. The Company'sCompany’s securities may be covered by the penny stock rules, which impose additional sales practice requirements on broker-dealers who sell to persons other than established customers and accredited investors such as institutions with assets in excess of US$5,000,000 or an individual with net worth in excess of US$1,000,000 or annual income exceeding US$200,000 or US$300,000 jointly with his or her spouse. For transactions covered by this rule, the broker-dealers must make a special suitability determination for the purchase and receive the purchaser'spurchaser’s written agreement of the transaction prior to the sale. Consequently, the rule may affect the ability of broker-dealers to sell the Company'sCompany’s securities and also affect the ability of its investors to sell their shares in the secondary market.
| 8 |
| Table of Contents |
FINRA rules will make it more difficult to trade the Company'sCompany’s common shares.shares. The Financial Industry Regulatory Authority, or FINRA, has adopted sales practice requirements which may limit a stockholder'sstockholder’s ability to buy and sell our stock. In addition to the "penny stock"“penny stock” rules described above, FINRA has adopted rules that require that in recommending an investment to a customer, a broker-dealer must have reasonable grounds for believing that the investment is suitable for that customer. Prior to recommending speculative low priced securities to their non-institutional customers, broker-dealers must make reasonable efforts to obtain information about the customer'scustomer’s financial status, tax status, investment objectives and other information. Under interpretations of these rules, FINRA believes that there is a high probability that speculative low priced securities will not be suitable for at least some customers. FINRA requirements make it more difficult for broker-dealers to recommend that their customers buy our common stock, which may limit your ability to buy and sell our stock and have an adverse effect on the market for our shares.
Item 4. Information on the Company
| A. History and Development of the Company
|
The Company was incorporated under the Company Act of the Province of British Columbia, Canada on January 22, 1981 under the name of Carol Energy Corporation, which name was changed to Coral Energy Corporation on March 3, 1982, and to Coral Gold Corp. on September 9, 1987. On September 14, 2004, the Company changed its name to Coral Gold Resources Ltd. in conjunction with a 10 to 1 share consolidation. On July 17, 2007, the shareholders of the Company amended the share structure by subdividing the Company'sCompany’s issued share capital of 8,267,360 common shares into 24,802,080 common shares, every one common share being subdivided into three common shares. On July 15, 2004, the Company transitioned to the British Columbia Business Corporations Act. The principal executive office of the Company is located at 570 Granville Street, Suite 900, Vancouver, British Columbia V6C 3P1, and its telephone number is 604-682-3701.
The Company is a natural resource company primarily engaged in the exploration and development of natural resource properties. Its principal business activities have been the exploration of certain mineral properties located in the statesstate of Nevada and California in the United States. The carrying value of the Company's mineral property acquisition and exploration expenditures at January 31, 2016 is $19,192,353.
Please refer to Note 46 of the financial statements (Item 18) for information regarding the Company's principal expenditures on its mineral properties.Company’s exploration and evaluation assets.
B. Business Overview |
Operations and Principal Activities
Presently, the Company'sCompany’s principal business activity is the care and maintenance, and, where warranted, the exploration thereof, three mineral properties consisting of the Norma Sass claims, JDN claims and development of mineral properties.Ludlow property. The Company is in the process of exploring itsthese mineral properties and has not yet determined whether its mineral properties contain ore reserves that are economically recoverable. There is no assurance that a commercially viable mineral deposit exists on any of the Company'sCompany’s properties, and future exploration will be required before final evaluation as to the economic and legal feasibility is determined.
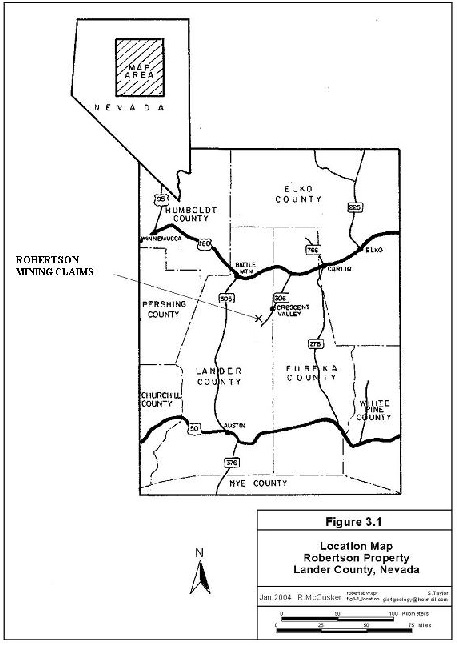
The Company's mining claims are located in the states of Nevada and California in the United States. The Company's present principal exploration activities have been focusedCompany also has a net smelter returns royalty on its former property, the Robertson Mining Claims located in Crescent Valley, Nevada.claims, sold to Barrick Cortez Gold Corp. on June 8, 2017.
Competition
The mining industry in which the Company is engaged and is highly competitive. Competitors include well-capitalized mining companies, independent mining companies and other companies having financial and other resources far greater than those of the Company. The companies competeCompany competes with other mining companies in connection with the acquisition of gold and other precious metal properties. In general, properties with a higher grade of recoverable mineral and/or which are more readily minable afford the owners a competitive advantage in that the cost of production of the final mineral product is lower. Thus, a degree of competition exists between those engaged in the mining industries to acquire the most valuable properties. As a result, the Company may eventually be unable to acquire attractive gold mining properties.
Seasonality
Due to the climate in the States of Nevada, and California, the Company is generally not affected by seasonality.
Dependence on Customers and Suppliers
The Company is not dependent upon a single or few customers or suppliers for revenues or its operations.
Government Regulation
We are subject to various federal and state laws and regulations including environmental laws and regulations. Environmental regulations impose, among other things, restrictions, liabilities and obligations in connection with the generation, handling, use, storage, transportation, treatment and disposal of hazardous substances and waste and in connection with spills, releases and emissions of various substances to the environment. Environmental regulation also requires that facility sites and other properties associated with our operations be operated, maintained, abandoned and reclaimed to the satisfaction of applicable regulatory authorities. In addition, certain types of operations, including exploration and development projects and changes to certain existing projects, may require the submission and approval of environmental impact assessments or permit applications. Compliance with environmental regulation can require significant expenditures, including expenditures for clean up costs and damages arising out of contaminated properties and failure to comply with environmental regulations may result in the imposition of fines and penalties. We believe that we are in substantial compliance with such laws and regulations; however, such laws and regulations may change in the future in a manner which will increase the burden and cost of compliance.
Certain laws and governmental regulations may impose liability on us for personal injuries, clean-up costs, environmental damages and property damages, as well as administrative, civil and criminal penalties. We maintain limited insurance coverage for sudden and accidental environmental damages, but do not maintain insurance coverage for the full potential liability that could be caused by sudden and accidental environmental damage. Accordingly, we may be subject to liability or may be required to cease production from properties in the event of such damages.
Environmental Regulations
The Company'sCompany’s exploration programs in Nevada and California are subject to state and federal regulations regarding environmental considerations. All operations involving the exploration for the production of minerals are subject to existing laws and regulations relating to exploration procedures, safety precautions, employee health and safety, air quality standards, pollution of streams and fresh water sources, odor, noise, dust and other environmental protection controls adopted by federal, state and local governmental authorities as well as the rights of adjoining property owners. The Company may be required to prepare and present to federal, state or local authorities data pertaining to the effect or impact that any proposed exploration for or production of minerals may have upon the environment. All requirements imposed by any such authorities may be costly, time consuming and may delay commencement or continuation of exploration or production operations. Future legislation may significantly emphasize the protection of the environment, and, as a consequence, the activities of the Company may be more closely regulated to further the cause of environmental protection. Such legislation, as well as further interpretation of existing laws in the United States, may require substantial increases in equipment and operating costs to the Company and delays, interruptions, or a termination of operations, the extent of which cannot be predicted. Environmental problems known to exist at this time in the United States may not be in compliance with regulations that may come into existence in the future. This may have a substantial impact upon the capital expenditures required of the Company in order to deal with such problem and could substantially reduce earnings. At the present time, the Company'sCompany’s exploration activities in Nevada and California are in compliance with all known environmental requirements.
The primary regulatory bodies that directly regulate the Company'sCompany’s activities are the Bureau of Land Management (Federal), Lander County and the Lander County Recorder’s Office and the Nevada Department of Environmental Protection (State).Protection.
|
| Table of Contents |
C. Organizational Structure
The Company has two wholly-owned subsidiaries: Coral Energy Corporation of California, a California corporation which holdspreviously held title to the Company'sproperty in California, property, and Coral Resources, Inc., a Nevada corporation, which holds title to the Company'sCompany’s mining claims located in Nevada. In the 2006 fiscal year, theThe Company completed the purchase of 1,391,860 shares, representingalso owns 98.49% of the issued shares, of
Marcus Corporation, which is a Nevada Corporation that owns the Marcus mining claims, consisting of 39 unpatented lode claims and two placer claims, and which comprise a portion of the Company's Robertson Property.corporation.
| D. Property, Plant and Equipment
|
Presently, the Company is an "exploration“exploration stage company"company”, as all of the Company'sCompany’s properties are currently in the exploratory stage of development. In order to determine if a commercially viable mineral deposit exists in any of the Company'sCompany’s properties, further geological work will need to be done and a final evaluation based upon the results obtained to conclude economic and legal feasibility.
The Company's primary focus has been on the Robertson Mining Claims, in Nevada, United States.
Prior Property - Robertson Mining Claims, Nevada, U.S.A.
Completed Sale of Robertson Properties
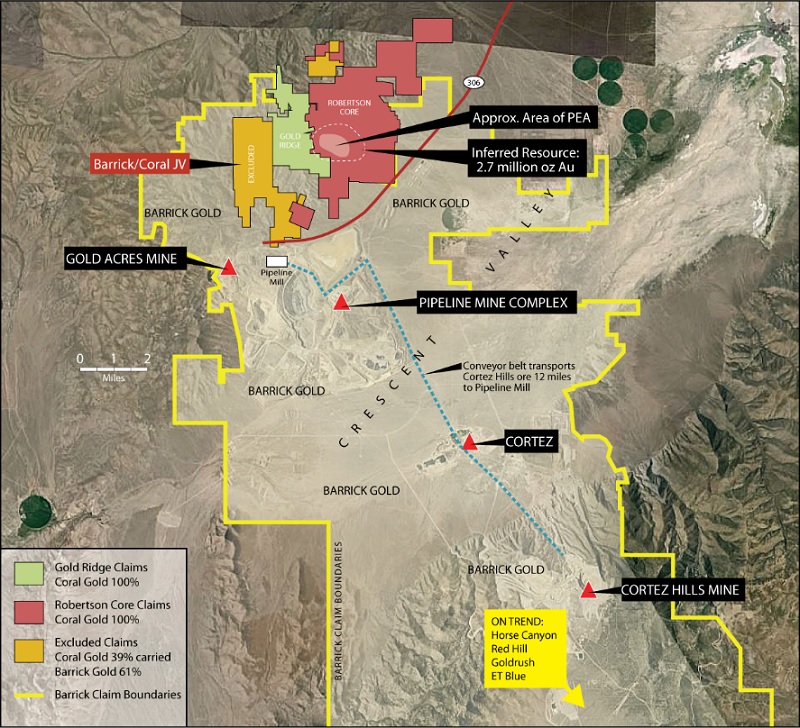
On June 8, 2017, Coral completed the purchase and sale agreement with Barrick Cortez Inc. (“Barrick”), a subsidiary of Barrick Gold Corp., for the sale of the Robertson Property in Lander County, Nevada, to Barrick in consideration of:
| 1. | The payment to Coral of US$15.75 million (Cdn $21.84 million based on the closing exchange rate) in cash ; | |
| 2. | The return of 4,150,000 common shares of Coral held by Barrick (which represent approximately 8.5% of the Company’s basic common shares outstanding as of June 8, 2017) for cancellation by the Company ; and | |
| 3. | A sliding scale 1% to 2.25% net smelter returns royalty (the “NSR”) on the Robertson Property, payable quarterly, subject to potential advance royalty payments as outlined below, as well as a right of first refusal enabling Barrick to acquire the NSR in the event that the Company wishes to sell the NSR to any third party . |
The sliding scale NSR rate will be determined based on the observed gold price during each quarterly period based on the average LBMA Gold Price PM during the quarterly period, as follows:
Average Gold Price/Oz During the Quarter (USD) | Applicable NSR Royalty Rate |
Up to and including $1,200.00 $1,200.01 to $1,400.00 $1,400.01 to $1,600.00 $1,600.01 to $1,800.00 $1,800.01 to $2,000.00 Over $2,000.00 | 1.00% 1.25% 1.50% 1.75% 2.00% 2.25% |
Pursuant to the agreement, as amended, and due to the delay in closing, in the event that the Robertson Property is not placed into production by Barrick by December 31, 2024, then beginning on January 1, 2025, and continuing on an annual basis thereafter until the earlier of (i) the date commercial production commences and (ii) January 2, 2034, Barrick will make advance royalty payments to Coral Gold of US$0.5M, which will be non-refundable and fully credited against any future obligations under the NSR. These dates have all been extended by one year from the dates in Coral’s earlier announcement.
Barrick will also assume all liabilities relating to the Robertson Property, and will provide replacement security for the reclamation bond.
The Robertson Mining Claims areProperty includes the properties also known as the Core, Gold Ridge, Excluded and the Ruf mining claims, but does not include the properties known as the Norma Sass, Eagle, and JDN mining claims. The Robertson Property is located in Crescent Valley, Nevada on the western flanks of the Shoshone Range, 28 miles to the southeast of Battle Mountain, Nevada, which lies approximately 230 miles northeast of Reno, Nevada. The Robertson Mining Claims comprise approximately 9,200 acres in the Bullion Mining District,eastern Lander County, Nevada, and currently include 435 unpatented Federal claims and 9 patented lode claims.sixty miles southwest of Elko.
As a result of the sale, the Company recorded a gain of $5,871,719, net of transaction costs during the fiscal year ended January 31, 2018.
| 11 |
| Table of Contents |
These mining claims have been acquired over a period of several years from different sources. The entire Robertson Mining Claims are subject to a 3% net smelter royalty to Geomex Development Eighth Partnership ("Geomex 8"), which royalty shall cease at such time as the sum of US$1,250,000 has been paid to Geomex 8, and various mining leases requiring minimum annual advanced royalties ranging from 4% to 10% of net smelter returns.
There is no underground or surface plant or equipment located on the Robertson Mining Claims and the following figures provide location details with respect to the Robertson Mining Claims.
|
The Robertson Property is the subject of four technical reports dated January 15, 2004, April 25, 2006, January 27, 2008 and January 18, 2012. The first two technical reports were prepared by Robert McCusker, P.Geol. in accordance with NI 43-101 ("McCusker Reports"). The third and fourth reports were prepared by Beacon Hill Consultants (1988) Ltd. ("Beacon Hill") of Vancouver, British Columbia (the "Beacon Hill Report"). The first Beacon Hill report was a NI 43-101 resource estimate that included the zones located within the Robertson's Core claims only. The Company's other claim blocks, including Norma Sass, Lander Ranch, Ruf, Blue Nugget and the Excluded (Carve Out) claims (joint ventured with Cortez Gold Mines ("Cortez"), a joint venture owned by Barrick Gold Corporation), were not part of the estimate. The 2012 report was an NI 43-101 compliant preliminary economic assessment of the advanced stage Altenburg Hill, Porphyry and Gold Pan zones analyzing a combination of open pit mining methods and cyanide heap leach.Existing Properties
Property Description and Location(i) Norma Sass Claims, Nevada
The Robertson Property is an advanced-stage gold exploration project located in eastern Lander County, Nevada, 60 miles southwest of Elko. Coral Resources, Inc., a wholly owned subsidiary of the Company, acquired control of the Robertson Property in 1986. The core property consists of 300 unpatented federal lode claims, mill sites, and nine patented lode claims covering over 6,200 acres of public lands administered by the U.S. Bureau of Land Management (the "BLM"). The Company controls an additional 31 claims through a series of mineral leases and option agreements.
In 2001, a boundary agreement between the Company and Cortez resolved claim boundary overlaps and seniority issues along the east and southwest sides of the Robertson claim block. This agreement required both parties to amend and/or abandon certain claims in order to achieve the agreed upon boundary. This was completed during the 2002-2003 assessment year.
Approximately 31 of the 300 of the claims that comprise the Robertson Property are controlled by the Company through 4 mining leases and option agreements. The Core Claims held by the Company under lease or option agreements require minimum advance royalty payments and production royalties in the event of production. Total annual payments for the various leases and minimum advance royalties are approximately US$51,600.
A summary compilation of the terms of these agreements are presented in the table below:
Mining Lease and Option Agreements
Company/Date |
| Number of Claims |
| Option Payment |
| Production Royalty | Advance Royalty Payment | |||||||
Core: Tenabo Gold Mining Co. Nov. 30, 1975 |
| 13 |
| US$ | 2,000,000 |
| 8% NSR | US$ | 12,000/yr | |||||
Northern Nevada Au, Inc. Sept. 30, 1986 |
| 12 |
| US$ | - |
| 4% GSR | US$ | 9,600/yr | |||||
Albany Gold Corp. (Geomex) |
| All |
| US$ | 1,250,000 |
| 3% NSR |
| Nil | |||||
Filippini/Breckon (June Claims) |
| 6 |
| US$ | 1,000,000 |
| 3% NSR | US$ | 30,000/yr | |||||
Annual federal rental fees of US$82,305 payable to the BLM, and Notice of Intent to Hold Mining Claims have been filed for the 2015-2016 assessment year.
History and Exploration
The Robertson Property is located in the Tenabo area, a sub-district of the Bullion mining district in Lander County, Nevada. Historic lode mining in this district dates from 1905 and placer gold was discovered in many of the dry washes in the Tenabo area in 1916. Between 1937 and 1939, a small dragline dredge and washing plant operated in the district, and a dredge was reported by Humphrey to be operating in lower Mill Gulch in 1945.
During 1966 through 1970, a number of companies explored the district in search of porphyry copper-style mineralization. In 1968, while drilling a series of shallow rotary holes near the Gold Pan mine, Superior Oil discovered a small, but relatively high-grade zone of gold at shallow depths in what is now known as the Gold Pan zone; however, with additional drilling, Superior Oil lost interest in the district. They were followed by a number of mining companies, including Placer Development (1974-75), Teck Corporation (1977), Aaron Mining Ltd. (1975-86), and E & B Exploration Ltd. (1980-81), all of which sporadically explored the Tenabo area with limited success.
Modern open pit mining and heap leaching began in 1974, when Aaron Mining Ltd. ("Aaron"), initiated a pilot leach operation on the Robertson Property. From 1978 through 1980, Aaron expanded its leaching operations and continued exploration and acquiring claims in the district.
In 1986, the Company acquired Aaron's interest in the Robertson Property and immediately began a series of major drilling programs beginning in 1986 and continuing until 1989. Mining operations on the Robertson Property commenced in 1988, but were suspended less than one year later. During the operating life of the Robertson Property mine approximately 350,000 tons of low-grade material was placed on leach pads from which about 6,200 ounces of gold were recovered.
During 1986 through 1989, the Company completed approximately 380 reverse circulation drill holes and seven diamond drill holes, totaling about 109,377 feet. Much of this drilling was focused in four resources areas: Gold Pan, Gold Quartz, Gold Quartz extension (also called Gold Quartz West) and the Triplet Gulch areas. The purpose of this drilling was to determine the limits and continuity of mineralization within these zones. Nearly all of the reverse circulation holes were drilled vertically to an average depth of about 300 feet.
In 1990, the Company and Amax Gold Exploration Inc. ("Amax") entered into an amended and restated option and earn-in agreement in which Amax could earn a 60% interest in the Robertson Property by producing a bankable feasibility study. Amax completed an exploration program that included drilling 338 reverse circulation holes and 62 diamond drill holes, totaling over 176,000 feet. As the feasibility study did not meet the requirements of the agreement, Amax returned the property to the Company in 1996.
During the fiscal year ended January 31, 1999, the Company entered into an option agreement dated October 8, 1998 (the "Option Agreement"), with Placer Dome U.S. Inc. ("Placer"), which was later assigned by Placer to Cortez. Under the agreement, Cortez could earn a 70% interest in the Robertson Property by producing a bankable feasibility study. The focus of Cortez's exploration was to expand the 39A zone and test a number of outlying targets. During 1999, Cortez completed 46 reverse circulation drill holes and a single flood rotary hole, totaling 57,000 feet. Of the 13 holes directed at expanding the 39A zone, only two holes, 99401 and 99413, encountered significant mineralization. This drilling program did little to expand the resource. Of the remaining holes drilled by Cortez, only two holes (99406 and 99419) encountered significant mineralization. Both holes were designed to offset and/or follow up existing drill intersections and surface gold anomalies.
After completing this drilling program, Cortez declared its interest in renegotiating the terms of the Option Agreement with the Company. When the Company declined, Cortez terminated the Option Agreement on December 30, 1999, and did not earn an interest in the Robertson Property.
During 2004 and 2005, the Company conducted three drilling programs consisting of 32 reverse circulation holes totaling 24,020 feet on the Robertson Property. The focus of this exploration was to expand and further define the 39A Zone, test the "deep" Gold Pan Zone for extensions of the 39A Zone and offset previous ore-grade intersections in the "distal target area".
A report entitled "Update of the Geological Report on the Robertson Property" April 25, 2006 on gold resources at the Robertson Property was submitted by Robert McCusker, Consulting Geologist, a "qualified person" in accordance with the requirements of NI 43-101.
During fiscal 2006, the Company completed a major drilling program on the Robertson Property. Drilling was completed in two phases. The drilling program totaled 35,615 feet of reverse circulation drilling in 46 holes. Depths ranged from 450 feet to 1,500 feet. Due to the relatively flat-lying nature of mineralization at the Robertson Property, all holes were drilled vertically. Phase Iconsisted of 14 reverse circulation (RC) drill holes, CR06-2 through CR06-15, totaling 11,355 feet which were completed in the immediate vicinity of the existing 39A Zone indicated mineral resource. Phase IIconsisted of 32 RC holes, CR06-16 through CR06-48A, totaling 24,260 feet which were completed in (1) the Distal Zone; (2) on the northeast flank of Altenburg Hill; (3) in the gravel-covered area between the Altenburg Hill and the Porphyry Zone mineral resource; and (4) along a northeast-striking structural zone in the Porphyry Zone. Drilling operations during Phase I and Phase II drilling were directly supervised by Robert McCusker.
In February 2008, the Company received an NI 43-101 compliant resource estimate titled Mineral Resource Estimate for the Robertson Property, Lander County, Nevada report dated January 27, 2008, prepared by Beacon Hill, Robert McCusker and Jasman Yee (updated in October 2009). This resource estimate is no longer considered current.
Later in 2008, the Company commissioned Beacon Hill to not only update the Robertson Property resource estimate but to also outline a program for continued development of the Core Claims in 2008 and beyond. Beacon Hill recommended a three-pronged development approach:
| ||
| ||
|
Beacon Hill recommended the following drilling on the Core Claims:
Phase I: 52 RC holes ranging in depth from 500 feet to 1,200 feet and totaling 37,600 feet, to focus on:
|
| |
|
| |
|
| |
|
|
Phase II: would consist of 21 diamond core holes (HQ diameter) ranging from 300 feet to 1,000 feet-deep and totaling 11,900 feet. The purpose of core drilling is to provide geological data on the controls of mineralization, acquire geotechnical data (RQD and specific gravity), confirm grade and continuity and provide material for metallurgical testing. Drilling has been recommended as follows:
|
| |
|
| |
|
| |
|
|
In March 2008, the Company announced that it had entered into a contract for 37,600 feet of reverse circulation drilling on Robertson Property. The agreement, signed with Lang Exploratory Drilling of Salt Lake City, Utah, began in April following permit approval from the BLM. Robert McCusker supervised the drill program as the "qualified person" under NI 43-101.
In September 2008, the Company completed its reverse circulation drilling program at Robertson. The program totaled 22,835 feet of drilling in 33 vertical holes which ranged in depth from 500 to 1200 feet. The holes were located on the Altenburg Hill, South Porphyry, 39A and Distal zones in order to increase the gold resource in these zones.
Both Phase I and Phase II were aimed at expanding and upgrading the Robertson Property inferred resource.
The planned 21 diamond drill holes of Phase II ranged from 300 to 1,000 feet in depth. It was anticipated that Phase II drilling would:
| ||
| ||
| ||
|
To help derive exploration priorities to expand the current resource with the 2008 drilling campaign, a series of in-house, draft open pit shapes were modeled around the 2008 NI 43-101 compliant inferred resource.
During the fiscal year ending January 31, 2008, the Company purchased 100% interest in the 72 claims comprising the Fanny Komp/Elwood Wright lease which forms part of the core area of the Robertson Property for US$250,000.
In October 2009, the Company received a revised resource for the Robertson Property from Beacon Hill utilizing lower cut-off grades to reflect the positive movement in the price of gold over the previous three years. The revised values were based on the NI 43-101 report titled Mineral Resource Estimate for the Robertson Property, Lander County, Nevada prepared by Beacon Hill in January 2008; this report is no longer considered current.
Despite the permitting setback, 12 RC holes at Triplet Gulch that were previously permitted under the 2007 PO were drilled in 2010.
A limited diamond drilling program at the Gold Pan and Altenburg Hill zones was also permitted under the 2007 PO. A program totaling 6,700 feet was conducted that represents the first phase of the diamond core drill program announced in the company's 2010 work plan and budget. The program was designed to verify the 2008 RC drilling assay results and provide material for metallurgical test work. The Gold Pan, Altenburg Hill and Porphyry zones represent near surface resources that could potentially be developed as an open pit/heap leach operation. Past metallurgical testing of Porphyry Zone mineralization returned favorable gold recoveries from the oxide material.
Also in 2010, Coral commissioned Beacon Hill to commence a Preliminary Economic Assessment ("PEA") that would meet the NI 43-101 standard on the Gold Pan, Altenburg Hill and Porphyry zones. The report was finalized and made public in late January 2012 and outlined steps to move the project towards pre-feasibility. (see section below titled Preliminary Economic Assessment for details)
In June 2011, the BLM accepted the fifth submission of the APO and a kick off meeting was held on July 20th, 2011. The meeting outlined the need for a new EA. In particular, the various categories to be studied in the EA including cultural, wild life, native religions, hazmat, paleontology, range management, noxious weeds, air quality, hydrology, riparian zones, migratory birds, environmental justice and socio economic issues.
Studies had been in progress since November 2010 but the EA did not officially start until July 2011. The cultural studies were done by Kautz and Co. of Reno, Nevada. Most of the other studies are by SRK out of Elko, Nevada who have overseen the entire environmental assessment.
As Coral anticipated, the work did not locate native religious sites or burial grounds etc. but the ghost mining town of Tenabo required detailed study.
Coral's cultural and wildlife surveys were sufficiently completed by the end of 2011 to allow the Company to demonstrate to the BLM that 13 proposed diamond core holes on the Porphyry zone would not impact on cultural or wildlife areas. The program consisted of 13 diamond drill core holes that twinned existing Amax Gold Inc. ("Amax") holes (circa 1990 -- 1996) and provided core for leach tests at McClelland Laboratories Inc. ("McClelland Labs") in Reno, Nevada. The holes were part of the Phase 1 drill program as proposed in the January 2012 PEA Assessmentand were designed to verify Amax's historic drilling data, and to upgrade the level of confidence in resources contained in the oxidized zones. The Phase 1 drill program represented Coral's first step towards pre-feasibility as defined by the PEA.
By July 13th, 2012 the baseline vegetation and wildlife field work had been completed and the baseline studies report was submitted to the BLM.
The BLM's response to Corals Baseline Studies was received July 27th and delivered to SRK Consultants who then supplied a response to the modifications to the Baseline Studies required by the BLM.
On September 24, 2012, Coral announced thatSRK had completed and submitted the EA to the BLM.
Compliance with the EA process was mandatory. The various categories studied were the subject of numerous Nevada State and US Federal laws. Fortunately not all are applicable to the Robertson property.
In September 2013, Coral received a notice from the BLM, which included the Decision on the Robertson Project Amendment to the Exploration Plan of Operations and Reclamation Permit Application and also the Finding of No Significant Impact ("FONSI").
On January 13, 2014, Coral announced that its US subsidiary, Coral Resources Inc. had received notice from the Bureau of Mining Regulation and Reclamation (BMRR) of the State of Nevada that it had approved the Plan of Amendment for Coral Resources Inc.'s Robertson Project.
The Amended Plan of Operations ("APO") was originally approved by the federal Bureau of Land Management (see news release dated Sept 16, 2013). Now that the APO has been approved by the State of Nevada (NDEP and subsidiary BMRR) Coral can proceed with drilling and other programs at Robertson.
Reclamation Activities
Following the dissolution of the option agreement with Cortez in 1999, Coral was required to post its own security for the reclamation bond for the Robertson Property and obtain a full release of Placer's guarantee of the original reclamation bond. In order to satisfy its obligations under the Option Agreement, the Company spent a large portion of fiscal year 2003 conducting reclamation on the Robertson Property to reduce its US$2,000,000 reclamation bond that Placer had guaranteed for the Company. Coral was able to obtain a release of Placer's guarantee by conducting sufficient reclamation work to reduce the bonding requirement, and by raising sufficient funds to provide satisfactory alternative security of the reclamation bond. The reclamation bond was reduced to US$786,100 during the fiscal year ended 2003, for which the Company posted cash.
In fiscal year ended 2006, with more reclamation work having been completed and accounted for, the reclamation bond was further reduced to US$228,205. In fiscal year ended 2007, with further drilling activities being proposed and performed, the required reclamation bond was increased to US$282,268. In fiscal year ended 2008, additional planned exploration activities in Nevada were approved and the required reclamation bond was increased to US$319,400 and then again in fiscal year ended 2009 up to US$389,387.
In August 2008, SRK Consulting prepared an "Aerial Survey Ground Truthing and Revised Cost Estimate" report for the Company, which following amendments and revisions were submitted to the BLM and NDEP in October 2008. The report outlined and updated results of reclamation done by the Company at the Robertson Property up to 2008.
The BLM and NDEP replied with required changes and updates in April 2009 and a revised "Aerial Survey Ground Truthing and Revised Cost Estimate" was prepared by SRK Consulting on June 10, 2009 and submitted to the BLM and NDEP.
In the Try/View area of the Robertson Property, the Company renewed the Notice of Intent to allow further deep drilling.
In the core area of the Robertson Property, the Company also submitted a new "Storm Water Pollution Prevention Plan" and technical report which was approved by the BLM and NDEP in June 2009.
In addition the Company authorized SRK Consulting to prepare:
| ||
|
The Company spent approximately $12,750 on reclamation and maintenance in fiscal 2011, reclaiming past mining and exploration related disturbances to public lands as required by the BLM and the NDEP.
In fiscal 2012 the Company increased the reclamation bonds by US$34,600. During fiscal 2013 the Company was required to increase its reclamation bonds by a further US$58,937 as the result of receiving approval to drill 13 holes. During fiscal 2015, the Company received approval for its amended plan of operations, which required that the reclamation bonds are further increased by US$40,149.
Environmental Liabilities
In 1988-89, the Company operated a small open pit gold mining operation and heap leach facility on the Robertson Property. The resulting disturbances include three small open pit mines, waste dumps, haul roads, drill roads, open drill holes, and a 350,000 ton heap leach facility and related recovery plant. In 1994, a reclamation plan was prepared by Amax and submitted to the Battle Mountain office of the BLM. The cost to perform the reclamation of the mine site was estimated at that time to be US$2,000,000. In 2001, the Company began reclamation activities which were accelerated in 2002, with the re-contouring of waste dumps, reclamation of the leach pad, haul roads and the filling of all open drill holes. As a result of this activity, in June 2003, the BLM reduced the bonding requirements for the project to US$406,000.
In March 2003, on behalf of the Company, SRK Consulting submitted a final plan for permanent closure of the mine with the BLM and NDEP. The closure plan was approved by both agencies. As a result of this work, during 2004 the BLM lowered the bonding requirements to US$226,205.
Permitting
In 2002, the Company submitted and was granted a five year renewal of Water Pollution Control Permit (NEV60035) by the NDEP for the Robertson Property. This permit is now renewed annually and reports are submitted quarterly. In addition, the Company has a storm water pollution control permit which is also renewed annually.
The Company continues to conduct reclamation and exploration activities under a Plan of Operation (NV067688) approved in 1989 by the BLM, which was subsequently updated to the 2007 PO. In April 2010, SRK Consulting, submitted the APO to the BLM and NDEP to allow the Company to carry out its 2010 work plan. A setback occurred when the BLM declined the drilling permit application because the Company's existing EA was out of date. The BLM suggested that the APO be withdrawn and to revert back to a previous 2007 PO that allowed drilling on certain areas of the property without any amendments. In June 2010, the APO was withdrawn. SRK Consulting was immediately commissioned to commence work on the new EA. SRK finalized the EA and re-filed it in June 2013 which then went out for public comment which resulted in no significant challenges.
From 2000 to 2003, no exploration activity was conducted on the Robertson Property; however, during that period a significant amount of surface reclamation was completed on the property. As a result, any new exploration activities in reclaimed areas will require submission and approval of an Amendment to the Plan of Operation. Additionally, the National Historic Preservation Act requires that all operators on public lands conduct an archeological survey of the proposed sites of new disturbance. Much of the Robertson Property has been previously cleared under various surveys conducted by Amax. Recent and planned future exploration activities by the Company have moved outside the area covered by previous archeological surveys. It is possible that future exploration will experience delays in receiving approval because additional surveys will be required by state and federal agencies.
Geological Setting
Geologically, the Robertson Property consists of a series of relatively flat-lying, vertically stacked thrust sheets that form part of the Roberts Mountain allochthon, which is composed of siliciclastic rocks from Ordovician to the Devonian age. The district is dominated by a very thick sequence of middle to late Devonian Slaven Chert composed mainly of argillite, chert, lesser siltstone and shale, and minor intermediate volcanic rocks. Structurally overlying the Slaven Chert along the north and east sides of the district are a sequence of rusty brown weathering siltstone, sandstone and very minor limestone of the Silurian Elder Sandstone.
Intruding the thick Paleozoic sequence is an elliptical-shaped, composite granodiorite stock (or lacolith) of Eocene age. The orientation of the principal axis of the stock is approximately east-west. Associated with it are numerous dikes, sills and plugs that vary in composition from diorite, the earliest known intrusion, to rhyolite, the latest. Most of the identified gold resources, including the Porphyry, Gold Pan and 39A zones, lie along or near the northern contact of the composite stock. A series of narrow and laterally continuous (up to 1,600 feet) intrusive "pebble" dikes extend northward from the northern contact of the granodiorite stock. Near contacts with the Tertiary intrusions, many of the sedimentary and volcanic rocks, and early phases of the stock, have undergone significant thermal metamorphism, intense recrystallization, bleaching and pervasive metasomatism. Many of these rocks have been converted to layered sequences of biotite, "quartz" and calc-silicate hornfels, marble, exoskarn and endoskarn.
Mineralization at the Robertson Property is strongly controlled by a system of low and high-angle faults and related fracture zones. Brecciation associated with axial plane shear zones developed in isoclinal folds are also important hosts for mineralization. Although individual structures host ore-grade gold, higher grades commonly occur where one or more structures intersect.
Deposit Types and Mineralization
The Company has been focusing its exploration activities on four zones localized along the northern and eastern contacts of the Tenabo stock forming the general east-west trend, the Porphyry, Gold Pan, Altenburg Hill and 39A zones. The Porphyry, Gold Pan and Altenburg Hill zones occur in highly fractured hornfels and skarn units at the contact of the granodiorite stock, whereas the 39A zone is localized at the intersection of two high-angle faults in retrograde-altered hornfels.
Preliminary Economic Assessment
In 2010, Coral commissioned Beacon Hill to commence a Preliminary Economic Assessment ("PEA") that would meet the NI 43-101 standard on three of its gold deposits located on the Robertson Property. The report was finalized and made public in late January 2012 (See news release dated January 18, 2012).
The results of the evaluation are as follows:
Resources and Mining
|
| |||
|
| |||
|
| |||
|
| |||
|
| |||
|
| |||
|
| |||
|
| |||
|
|
Note: Mineral resources which are not mineral reserves do not have demonstrated economic viability. The estimate of mineral resources may be materially affected by environmental, permitting, legal, title, taxation, sociopolitical, marketing, or other relevant issues. The quantity and grade of reported Inferred resources in this estimation are uncertain in nature and there has been insufficient exploration to define these Inferred resources as an Indicated or Measured mineral resource and it is uncertain if further exploration will result in upgrading them to the Indicated or Measured mineral resource category.
Economics
Two alternatives were reviewed, owner operated and contractor operated. The results shown are after tax. Taxes are considered indicative only.
Description |
| Owner Operated ($US millions) |
|
| Contractor Operated ($US millions) |
| ||
Development Cost |
|
| 16.5 |
|
|
| 16.5 |
|
Initial Capital Cost |
|
| 122.1 |
|
|
| 97.0 |
|
Ongoing Capital Cost |
|
| 54.2 |
|
|
| 26.1 |
|
Average Operating Cost US$/ton mined |
|
| 5.28 |
|
|
| 6.45 |
|
Results of Economic Analysis at Various Gold Prices (Owner Operated)
Gold Price US$/oz |
|
| IRR % |
|
| NPV undiscounted US$ million |
|
| NPV discounted 5% US$ million |
|
| Payback Period Years |
| ||||
| 1350 |
|
|
| 15.44 |
|
|
| 180.6 |
|
|
| 96.2 |
|
|
| 5.91 |
|
| 1500 |
|
|
| 20.13 |
|
|
| 247.2 |
|
|
| 147.1 |
|
|
| 4.72 |
|
| 1750 |
|
|
| 27.40 |
|
|
| 358.3 |
|
|
| 230.7 |
|
|
| 3.91 |
|
Results of Economic Analysis at Various Gold Prices (Contactor Operated)
Gold Price US$/oz |
|
| IRR % |
|
| NPV undiscounted US$ million |
|
| NPV discounted 5% US$ million |
|
| Payback Period Years |
| ||||
| 1350 |
|
|
| 15.43 |
|
|
| 159.4 |
|
|
| 85.4 |
|
|
| 5.94 |
|
| 1500 |
|
|
| 20.96 |
|
|
| 226.4 |
|
|
| 135.9 |
|
|
| 4.86 |
|
| 1750 |
|
|
| 29.18 |
|
|
| 337.8 |
|
|
| 219.7 |
|
|
| 3.82 |
|
Note: It should be noted that the economic analysis of this deposit is based upon the expenditures from the time a construction decision is taken and that all development costs to that point have been considered as sunk costs whether they have been expended or not at this time.
The PEA is considered preliminary in nature and includes inferred mineral resources that are considered too speculative geologically to have the economic considerations applied to them that would enable them to be categorized as mineral reserves. Mineral resources that are not mineral reserves have not yet demonstrated economic viability. Due to the uncertainty that may be attached to inferred mineral resources, it cannot be assumed that all or any part of an inferred mineral resource will be upgraded to an indicated or measured mineral resource as a result of continued exploration or mineral reserves once economic considerations are applied. Therefore there is no certainty that the production profile concluded in the PEA will be realized.
The PEA indicates that the Robertson Property is one of merit that warrants further development. The first phase of this development is recommended to be exploration drilling, metallurgical test work, environmental studies and permitting and completion of a prefeasibility study. The cost of this work is estimated to be US$7.9 million as shown below.
Summary of Expenditures to Completion of Prefeasibility:
|
| |||
| ||||
| ||||
| ||||
| ||||
| ||||
| ||||
| ||||
Exploration and definition drilling consists of the following:
The Phase I should consist of drilling 40 HQ diameter diamond core holes and 42 RC holes having an average depth of 400-500 ft and totaling about 40,000 ft in the;
| ||
| ||
| ||
|
The proposed metallurgical test work consists of variability testing and will be performed on samples obtained both spatially and at depth for the oxide and transition to sulfide ore zones. This work will encompass;
|
| |
|
| |
|
| |
|
| |
|
| |
|
| |
|
| |
|
|
Note also that the PEA concerns only the relatively shallow portions of these three deposits: Gold Pan, Porphyry and Altenburg Hill. Other deposits such as Distal, 39A, Triplet Gulch and a zone to the east of Gold Pan were not part of this study. However, all deposits form part of the 2011 calculation of the resources by Beacon Hill using a base case of US$1,350 per ounce. (Inferred mineral resource of 191 million tonnes @ 0.0143 oz Au/ton containing a total of 2.741 million ounces). It should be noted the resources are reported with consideration for their reasonable expectation of economic extraction as defined using an optimized pit shell.
The PEA also shows the logistical advantages of the Robertson Property, namely:
|
| |
|
| |
|
| |
|
| |
|
|
Mineral Resource Estimates
In 2007, Beacon Hill was commissioned by the Company to update the resource estimate on the Robertson Property. The purpose of the study was to incorporate additional drilling completed in 2006 in an updated resource estimate and to establish a program for continued development and provide a basis for a subsequent technical report. The final NI 43-101 compliant report, Mineral Resource Estimate for the Robertson Property, Lander County, Nevada report was received by the Company in February 2008.
Coral's current NI 43-101 compliant inferred resource estimate at the Robertson property was calculated in the 2012 PEA Report by Coral's independent engineering firm, Beacon Hill Consultants (1988) Ltd. ("Beacon Hill"). Gold ounces were calculated on the basis of US$1,350/oz Au and 70% Au recovery. The 0.0067 ozAu/t cut-off grade utilized to report the resource was derived from a mining cost of US$1.02/ton, process cost of US$5.00/ton and waste cost of US$1.14/ton. The mineral resources in the table below were estimated using the CIM Standards on Mineral Resources and Reserves:
Zone |
|
| Tons |
|
| Ounces per Ton |
|
| Ounces of Au (Inferred) |
| |||
| 39 A |
|
| 26,779,714 |
|
|
| 0.023 |
|
|
| 615,933 |
| |
GP Oxide |
|
|
| 21,939,550 |
|
|
| 0.0127 |
|
|
| 278,632 |
|
GP Sulphide |
|
|
| 48,759,224 |
|
|
| 0.0119 |
|
|
| 580,235 |
|
Porphyry Oxide |
|
|
| 59,707,994 |
|
|
| 0.0137 |
|
|
| 818,000 |
|
Porphyry Sulphide |
|
|
| 9,817,623 |
|
|
| 0.0132 |
|
|
| 129,593 |
|
Altenburg Hill Oxide |
|
|
| 23,170,083 |
|
|
| 0.0131 |
|
|
| 303,528 |
|
Altenburg Hill Sulphide |
|
|
| 178,279 |
|
|
| 0.0087 |
|
|
| 1,551 |
|
Triplett Gulch Sulphide |
|
|
| 678,279 |
|
|
| 0.0152 |
|
|
| 10,310 |
|
East Zone Sulphide |
|
|
| 694,672 |
|
|
| 0.0171 |
|
|
| 11,879 |
|
Total |
|
|
| 191,725,418 |
|
|
| 0.0143 |
|
|
| 2,741,673 |
|
Note: Mineral resources which are not mineral reserves do not have demonstrated economic viability. The estimate of mineral resources may be materially affected by environmental, permitting, legal, title, taxation, sociopolitical, marketing, or other relevant issues. The quantity and grade of reported Inferred resources in this estimation are uncertain in nature and there has been insufficient exploration to define these Inferred resources as an Indicated or Measured mineral resource and it is uncertain if further exploration will result in upgrading them to the Indicated or Measured mineral resource category.
Proposed Exploration
The Company believes that there is a potential for discovery of additional mineral resources on the Robertson Property. The Company plans to continue to explore the Robertson Property or seek third party partners for further exploration.
|
Property Description and Location
The Gold Ridge Property consists of 135 claims covering approximately 2.5 square miles, and is adjacent to the western side of the Robertson claim block located in North Central Nevada on the Cortez Gold Trend. The property was initially comprised of 107 claims but was partly re-staked following the 2014 agreement with Barrick that is outlined below.
There is no underground or surface plant or equipment located on the Gold Ridge Property, nor any known body of commercial ore.
History and Exploration
Follow up mapping, rock sampling, and infill gravity surveys in 2008 lead to the Company's identification of a new lower plate target zone that extends from the Company's deep hole, 2 km to the south.
In March 2014, Coral entered into an option, joint venture and private placement agreement with Barrick Gold Corporation ("Barrick") pursuant to which Barrick was granted an option to earn up to an undivided 60% interest on the Company's Gold Ridge Property in consideration for Barrick incurring US$12,000,000 in exploration expenditures over a five year period. In addition, Barrick had the option to increase its interest by an additional 15% for an aggregate undivided 75% interest by preparing and delivering to the Company a scoping study. The Option Agreement also provided that upon Barrick exercising its option, a 60%/40% or a 75%/25% joint venture between the parties would have been established in order to further explore the Gold Ridge Property.
During 2014, Barrick drilled 3 holes at Gold Ridge, however, in May 2015, Coral announced that it had received notice of termination from Barrick on the Gold Ridge Exploration and Option to Joint Venture agreement due to budgetary constraints.
The purpose of the 2014 drilling at Gold Ridge was to test a strong surface gold (up to 9.4 ppm) and Carlin-type trace element anomaly located 4.5 km north of the Pipeline mine. It was proposed that this anomaly (Ridge anomaly), defined by soil and rock chip samples, represented the surface expression of a Carlin-type system hosted by favorable carbonate rocks in the lower plate of the Roberts Mountains Thrust Fault. The second was a structural target defined by intersecting sets of west-northwest and north-northwest striking dikes and a surface gold anomaly (up to 6.06 ppm), located 1.5 km west of the Tenabo granodiorite stock.
Three vertical diamond core holes, RGR-0001D through RGR-0003D, were completed to depths of between 955 m and 1,255 m, for a total of 3,191 m. Selected analytical results for the three holes are reported in the table below.
Two holes, RGR-0001D and RGR-0003D were designed to test the Ridge anomaly. RGR-0001D was collared on Gold Ridge along the north edge of a significant surface rock chip and soil anomaly (Ridge anomaly) and drilled to a depth of 981 m. RGR-0003D was offset 451 m southwest of RGR-0001D and completed to a depth of 955 m. Both holes returned scattered anomalous Au value up to 0.698 ppm and 0.573 ppm, respectively, along with several narrow intervals exhibiting Carlin-type geochemical signatures. The holes encountered a mostly siliciclastic sequence dominated by mudstone and chert and disrupted by major west dipping thrust faults in the upper 450 m. All of the intervals exhibiting a Carlin-type geochemistry are spatially associated with thrust faults. Neither hole intersected significant gold values or lower plate carbonate rocks.
Hole RGR-0002D was collared about 1.6 km north of RGR-0001D and 1.16 km south of TV07-2, a deep hole drilled by Coral in 2007. The hole was drilled to a depth of 1,255 m and was located near the structural intersection between west-northwest and north-west striking dike swarms. RGR-0002 encountered a significant number of anomalous gold intercepts including one 5-ft-thick interval that returned 36.3 ppm (1.06 oz Au/t). Most of the higher grade Au values (>0.34 ppm), including the high-grade intercept, are hosted by retrograde-altered calc-silicate hornfels replacing calcareous strata of the Ordovician Valmy Fm. Accompanying gold are anomalous levels of Se (up to 35 ppm), Bi (up to 114 ppm), Te (up to 34.8 ppm), Co (up to 119.5 ppm) as well as Ag (62.9 ppm), Cu (6,490) and As (978 ppm). The strong association of gold in RGR-0002D with zones of retrograde-altered hornfels, as well as the overall metal association (Au-As-Cu, Fe, Bi-Se-Te, Co and Ag) is strongly suggestive of distal skarn-type mineralization. The upper 900 m of RGR-0002D are dominated by an interbedded sequence of mudstone, chert and minor limestone intruded by numerous dikes ranging from granodiorite to rhyolite. Beginning at a depth of about 1,067 m and continuing to at least 1,130 m, RGR-0002D encountered a major shear zone interpreted to be the Roberts Mountains Thrust Fault. From about 1,090 m, rocks within the shear zone become increasingly calcareous and are thought to represent lower plate carbonate rocks. This interpretation is supported by a single conodont fossil age determination.
RGR-0001D
From |
|
| To |
|
| Length |
|
| Au |
|
| Ag |
|
| As |
|
| Sb |
|
| Hg |
|
| Tl |
|
| Cu |
|
| Pb |
|
| Zn |
| |||||||||||
1.6 |
|
|
| 4 |
|
|
| 2.4 |
|
|
| 0.259 |
|
|
| 1.24 |
|
|
| 677 |
|
|
| 35.8 |
|
|
| 0.89 |
|
|
| 0.25 |
|
|
| 39.1 |
|
|
| 16.3 |
|
|
| 137 |
|
10.1 |
|
|
| 11.6 |
|
|
| 1.5 |
|
|
| 0.504 |
|
|
| 1.39 |
|
|
| 341 |
|
|
| 132 |
|
|
| 7.07 |
|
|
| 0.64 |
|
|
| 26.2 |
|
|
| 18.2 |
|
|
| 35 |
|
673 |
|
|
| 681.4 |
|
|
| 8.4 |
|
|
| 0.343 |
|
|
| 2.25 |
|
|
| 962 |
|
|
| 7.3 |
|
|
| 0.096 |
|
|
| 0.23 |
|
|
| 141 |
|
|
| 18.9 |
|
|
| 222 |
|
931.4 |
|
|
| 932.4 |
|
|
| 1.1 |
|
|
| 0.625 |
|
|
| 13.4 |
|
|
| 830 |
|
|
| 30.5 |
|
|
| 0.59 |
|
|
| 0.83 |
|
|
| 215 |
|
|
| 3170 |
|
|
| 4910 |
|
942.1 |
|
|
| 943.7 |
|
|
| 1.6 |
|
|
| 0.541 |
|
|
| 1.84 |
|
|
| 1.7 |
|
|
| 2.2 |
|
|
| 0.02 |
|
|
| 0.23 |
|
|
| 848 |
|
|
| 68 |
|
|
| 225 |
|
RGR-0002D
From |
|
| To |
|
| Length |
|
| Au |
|
| Ag |
|
| As |
|
| Sb |
|
| Hg |
|
| Tl |
|
| Cu |
|
| Pb |
|
| Zn |
| |||||||||||
185.4 |
|
|
| 186.9 |
|
|
| 1.5 |
|
|
| 3.8 |
|
|
| 2.59 |
|
|
| 5,320 |
|
|
| 43.2 |
|
|
| 0.32 |
|
|
| 0.72 |
|
|
| 112 |
|
|
| 82 |
|
|
| 598 |
|
638.72 |
|
|
| 644.82 |
|
|
| 6.1 |
|
|
| 10.71 |
|
|
| 1.67 |
|
|
| 13.86 |
|
|
| 1.48 |
|
|
| 0.01 |
|
|
| 0.17 |
|
|
| 231 |
|
|
| 21 |
|
|
| 155 |
|
Including |
|
|
|
|
|
|
|
|
|
|
|
|
|
|
|
|
|
|
|
|
|
|
|
|
|
|
|
|
|
|
|
|
|
|
|
|
|
|
|
|
|
|
|
|
|
643.29 |
|
|
| 644.82 |
|
|
| 1.53 |
|
|
| 36.3 |
|
|
| 2.58 |
|
|
| 1.4 |
|
|
| 1.21 |
|
|
| 0.038 |
|
|
| 0.11 |
|
|
| 171 |
|
|
| 61.1 |
|
|
| 45 |
|
650.9 |
|
|
| 658.5 |
|
|
| 7.6 |
|
|
| 0.168 |
|
|
| 16.31 |
|
|
| 83.6 |
|
|
| 3.46 |
|
|
| 0.035 |
|
|
| 1.02 |
|
|
| 1971 |
|
|
| 36.7 |
|
|
| 156 |
|
780.5 |
|
|
| 783.5 |
|
|
| 3 |
|
|
| 1.5 |
|
|
| 1.74 |
|
|
| 24 |
|
|
| 1.5 |
|
|
| 0.008 |
|
|
| 1.1 |
|
|
| 491 |
|
|
| 18.8 |
|
|
| 53 |
|
910.1 |
|
|
| 913.1 |
|
|
| 3 |
|
|
| 1.32 |
|
|
| 1.24 |
|
|
| 1,265 |
|
|
| 6.7 |
|
|
| 0.014 |
|
|
| 1.8 |
|
|
| 263 |
|
|
| 13.4 |
|
|
| 295 |
|
1,057.8 |
|
|
| 1,070.1 |
|
|
| 12.3 |
|
|
| 0.306 |
|
|
| 2.66 |
|
|
| 1,019 |
|
|
| 2.71 |
|
|
| 0.12 |
|
|
| 0.96 |
|
|
| 573 |
|
|
| 15.7 |
|
|
| 117 |
|
1,109.8 |
|
|
| 1,114.3 |
|
|
| 4.6 |
|
|
| 0.363 |
|
|
| 0.38 |
|
|
| 961 |
|
|
| 2.04 |
|
|
| 0.007 |
|
|
| 1.56 |
|
|
| 34.6 |
|
|
| 13.7 |
|
|
| 76.3 |
|
RGR-0003D
From |
|
| To |
|
| Length |
|
| Au |
|
| Ag |
|
| As |
|
| Sb |
|
| Hg |
|
| Tl |
|
| Cu |
|
| Pb |
|
| Zn |
| |||||||||||
377.4 |
|
|
| 417.1 |
|
|
| 39.6 |
|
|
| 0.079 |
|
|
| 0.79 |
|
|
| 230 |
|
|
| 23.3 |
|
|
| 0.37 |
|
|
| 1.44 |
|
|
| 36 |
|
|
| 14.9 |
|
|
| 96 |
|
Including |
|
|
|
|
|
|
|
|
|
|
|
|
|
|
|
|
|
|
|
|
|
|
|
|
|
|
|
|
|
|
|
|
|
|
|
|
|
|
|
|
|
|
|
|
|
395.6 |
|
|
| 414.0 |
|
|
| 18.4 |
|
|
| 0.046 |
|
|
| 0.33 |
|
|
| 465 |
|
|
| 49.2 |
|
|
| 0.8 |
|
|
| 1.93 |
|
|
| 35.8 |
|
|
| 6.6 |
|
|
| 57 |
|
578.7 |
|
|
| 584.8 |
|
|
| 6.1 |
|
|
| 0.19 |
|
|
| 0.73 |
|
|
| 48 |
|
|
| 3.5 |
|
|
| 0.007 |
|
|
| 1.13 |
|
|
| 214 |
|
|
| 11.3 |
|
|
| 175 |
|
Proposed Exploration
In May 2015, Coral received a report summarizing the results of the 2014 Barrick Drilling Program prepared by Robert T. McCusker, P. Geol., Coral's Qualified Person for this project. Mr. McCusker makes the following recommendations for further exploration of the Gold Ridge property:
Ridge Anomaly
At the Ridge Anomaly, Hole RGR-0003D intersected a 130-ft.-thick zone of weakly anomalous gold values (up to 0.4ppm) from 1,238 ft., accompanied by locally anomalous levels for As (up to 745 ppm), Sb (up to 89 ppm), Hg (up to 1 ppm), and correspondingly low levels for Cu-Pb-Zn. This weakly mineralized zone is partly hosted by calcareous rocks in the Valmy Fm in the immediate footwall of a west-dipping imbricate fault in the hanging wall of the Abyss fault.
Recommendations as follow-up to the 2014 Ridge anomaly drilling:
|
| |
|
| |
|
| |
|
|
June Gulch Area
In the June Gulch area, drill hole RGR-0002D returned numerous significant gold intercepts including a single five-foot-thick interval that assayed 34.4 ppm gold. Most of the higher anomalous gold values (>0.34 ppm) occur in retrograde-altered calc-silicate hornfels suggesting both a spatial and genetic relation to the Tenabo porphyry system. Additionally, dike-filled segments of the Try fault zone transect the entire district from the western edge of Crescent Valley to Indian Creek, creating a major conduit for hydrothermal fluids.
Recommendations as follow-up to the 2014 June Gulch drilling:
|
| |
|
| |
|
|
Lower Plate Exploration
The 2014 Gold Ridge deep drilling did not include offsetting the intercept in Coral's 2007 hole, TV07-2, which encountered strongly anomalous Au values up to 2.19 ppm, accompanied by Carlin-type geochemistry in lower plate carbonate rocks. It is recommended that the mineralized zone intersected in TV07-2 be offset by two diamond core holes. This should include re-entry of TV07-2 and deflecting a hole to the southwest from a depth of about 1,500 ft. A second pre-collared vertical hole should be located 1,200 ft. south of TV07-2 and drilled to a depth of at least 3,500 ft. The purpose of the two holes is to test the potential for higher grade Carlin-type mineralization in the lower plate rocks closer to dike-filled high-angle fault segments in the Try fault zone.
|
| |
|
| |
|
| |
|
|
|
Property Description and Location
The excluded claims consist of 161 claims covering 2700 acres and are located 4,000 feet north of Barrick's pipeline mine and are connected to the Gold Ridge Property along their north east boundary.
History and Exploration
Under the terms of an Exploration and Mining Venture Agreement dated July 11, 1997, Barrick Cortez Gold Mines, ("Barrick Cortez") formerly Placer, holds an undivided 61% interest and the Company has a 39% interest carried to production in the Excluded Claims.
Beginning in 1997 and continuing through 1998, Barrick Cortez conducted a series of exploratory drilling programs on the Carve-Out Claims with limited success. In 2002, the Company conducted a drilling program on the Excluded Claims with follow-up drilling in the immediate vicinity of existing drill holes with mixed results. To date, no significant mineral resources have been discovered on the Excluded Claims. However, the wide-space deep drilling has established the presence of scattered significant gold values, anomalous levels of Carlin-type trace elements, key structural components and the occurrence of a preferred host strata.
The Company plans to rely on Barrick Cortez to further explore the property for mineral resources and no further work on the Carve-Out Claims is proposed at this time.
There is no underground or surface plant or equipment located on the Excluded Claims, nor any known body of commercial ore.
|
Property Description and Location
The Norma Sass claims are an exploration-stage project located immediately south of the Gold Acres open pit mine and west of the Pipeline open pit mine. Drilling at Norma Sass, which is comprised of 36 claims covering 740 acres, has encountered gold hosted by favorable, lower-plate carbonate strata.
History and Exploration
Effective December 31, 1999, the Company and Levon Resources Ltd. ("Levon"(“Levon”), entered into a fourth amending agreement whereby Levon could earn an undivided 50% interest in the Norma Sass and Ruf Claims upon completion of certain terms. This agreement was further amended effective December 31, 2001 (but signed on October 3, 2002), whereby Levon was transferred a 33.3% interest in the Company'sCompany’s interest in the Norma Sass and Ruf claims, in consideration of 300,000 common shares of Levon previously issued to the Company and the prior payment of $350,294 for exploration work. Following the execution of a fifth amending agreement with Levon in December 2001 the Company secured a 66.6 % ownership in the Norma Sass and Ruf Claims
In January 2005, the Company announced the formation of an exploration agreement with Agnico-Eagle Mines Limited ("Agnico-Eagle"(“Agnico-Eagle”). The agreement covered the Norma Sass, Blue Nugget and Lander Ranch claims and also included the partnership with Levon. Under the agreement, Agnico-Eagle could earn a 51% interest in the Norma Sass, Blue Nugget and Lander Ranch claims by completing at least 45,000 feet of exploration drilling and paying certain advance royalties.
Agnico-Eagle mobilized a reverse circulation drill supplied by Lang Exploratory Drilling of Elko, Nevada to the Norma Sass property on May 15, 2006. Drilling commenced on the lander ranch target area and Agnico-Eagle drilled 15,000 feet in 12 to 15 holes on the Norma Sass and related properties. In February 2007, Agnico-Eagle notified the Company that it would not be continuing its option on the Company'sCompany’s Norma Sass, Lander Ranch and Blue Nugget properties because of other corporate priorities. The Company was pleased with the work done by Agnico-Eagle as they successfully showed depths to the lower plate sequence across the Norma Sass ground and extended the area of gold mineralization at Lander Ranch.
In September 2008, the Company entered into an exploration, development and mine operating agreement with Barrick Cortez wherein Barrick Cortez granted the option to acquire up to a 75% interest in the Company'sCompany’s and Levon interests in the Norma Sass Property, Nevada.
In May 2009, Barrick Cortez announced plans to do target delineation work in the second quarter followed by deep drilling in the third quarter on the Norma Sass property.
In October 2009, Barrick commenced drilling hole NS 09-01 targeting the lower plate carbonate sequence. This hole was drilled at 70 degree dip on a northwesterly azimuth across a SW-NE striking fault which trends into Barrick'sBarrick’s Gold Acres pit one mile to the northeast and is thought to be related to mineralization at Gold Acres. The hole was started using a reverse circulation drill which encountered recovery problems at a depth of 1,680 feet and was replaced by a core drill which completed the hole to a final depth of 2,586 feet. The lower plate and wenban limestone were intersected starting at a depth of 1,330 feet and Roberts Mountain Formation was encountered from 1,830 feet to the bottom of the hole. These formations are the major host rocks for the gold deposits at the Pipeline, Gold Acres and Cortez Hills mines.
On November 3, 2010, Barrick Cortez notified the Company that it had terminated its option on the Norma Sass property.
On January 22, 2016, the Company announced that it had acquired 100% ownership of the Norma Sass, Ruf, and Eagle claims from Levon. In consideration for the transfer of Levon's interest in the properties, the Company cancelled US$53,258 in exploration expenditures which remained owing to the Company from the former joint venture.
| 12 |
| Table of Contents |
On August 7, 2017, Coral Resources Inc., the Company’s wholly owned subsidiary entered into a mining lease agreement with Mauzy et al, who is the owner of the Norma/Sass property.
The Company continues to keep itsthe Norma Sass claims under care and maintenance and to keep such claims in good standing.
(ii)
| JDN Claims, Nevada, U.S.A. (formerly known as the JD Mining Claim)
|
Property Description and Location
The JDN claims are located approximately 10 miles northwest of the Robertson property near Barrick'sBarrick’s Hilltop deposit. The property is comprised of 27 claims covering roughly 550 acres. Access to the JDN Claims from Elko, Nevada, a regional mining supply center, is via Highways 80 and 306, a distance of approximately 64 miles to the community of Crescent Valley and then an additional 11 miles on a gravel access road from Crescent Valley. A four-wheel drive vehicle is usually necessary to access all roads on the property. As of fiscal year 2001, the Company has written down the JDN Claims to a nominal value. There is no underground or surface plant or equipment located on the JDN Claims, nor any known body of commercial ore.
History and Exploration
On December 16, 1986, the Company acquired six mining claims on 550 acres of land near Crescent Valley Lander County, Nevada for US$10,000. Several claims were added in 1987 (from the JD Group). The JDN claims consisting of 27 potential lode mining claims totaling 560 acres are a re-staking of the original JD claims. The JDN Claims are located approximately threeten miles north of the Robertson Mining Claims. In 1987, geological mapping was conducted. In fiscal year 1994, the Company optioned a 50% interest in the JDN claims to Mill Bay Ventures Inc., formerly First International Metals Corp., referred to as "Mill Bay"“Mill Bay”, a company with two directors in common to the Company, for $10,000 and an initial installment of 50,000 common shares of Mill Bay. On February 5, 1997, Mill Bay exercised the option by issuing to the Company an additional 50,000 common shares and completion of specified exploration work.
| (iii) Eagle Claims, Nevada, U.S.A.
|
Property Description and Location
The Eagle Claims consist of 45 lode mineral claims, and are located at Corral Canyon, in Lander County, Nevada, approximately 10 kilometers7 miles north-northwest of Barrick'sBarrick’s Cortez gold mine and comprise a total of approximately 646 acres. The Eagle Claims are approximately three miles west of Crescent Valley, Nevada, and approximately 18 miles southeast of Battle Mountain, Nevada. Access to the Eagle Claims from Elko, Nevada, a regional mining supply center, is via Highways 80 and 306, a distance of approximately 56 miles and then an additional 8 miles on a gravel access road from the community of Crescent Valley. A four-wheel drive vehicle is usually necessary to access all roads on the property.
The Eagle Claims are subject to a 3% net smelter royalty to Geomex 8, which royalty shall cease at such time as the sum of US$1,250,000 has been paid to Geomex 8.
History and Exploration
In fiscal year 1994, the Company optioned a 50% interest in these claims to Levon for $10,000 and $100,000 Levon common shares. During 1996, Levon exercised its option to earn a 50% interest in the Eagle Claims. On January 22, 2016, the Company announced that it had acquired 100% ownership of the Norma, Sass, Ruf, and Eagle claims from Levon. In consideration for the transfer of Levon's interest in the properties, the Company cancelled US$53,258 in exploration expenditures which remained owing to the Company from the former joint venture. The Company has written down the Eagle Claims to a nominal value. There is no underground or surface plant or equipment on the Eagle Claims, or any known body of commercial ore.
|
Property DescriptionThe Company continues to keep the Eagle Claims under care and Locationmaintenance and to keep such claims in good standing.
The
| 13 |
| Table of Contents |
Properties Disposed of:
Ludlow Property, California, U.S.A.
Through its subsidiary, the Company owns certainpreviously owned mining properties consisting of approximately 128 acres in San Bernardino County, California, referred to as the "Ludlow Property"“Ludlow Property”. The property is located approximately six miles south of Ludlow, California, and is readily accessible by dirt road from Ludlow. Ludlow lies atCompany let the western junction of U.S. Highway 40 and Route 66. Old wagon roads allow any part of the property to be reached by an easy walk. The Ludlow property has previously been explored as evidenced by trenches, pitslapse and shallow shafts and adits. The only recorded data relating to previous exploration applies to the Baghdad-Chase Mine which lies approximately two kilometers to the south of the Ludlow Property.
History and Exploration
There has been no underground exploration or development work doneit was sold under auction on the claims by the Company other than geochemical soil sampling and, to the Company's knowledge, there is no record of the previous work carried out on the claims as indicated by the evidence of trenches, pits and shallow shafts and adits that are located thereon. No exploration work has been performed on the property for the past five fiscal years. In order to keep the mining title to the Ludlow Property in good standing, the Company is required to pay property taxes.December 17, 2018. The Company has written downreceived no proceeds from the Ludlow Property to a nominal value. There is no surface or underground plant or equipment on the Ludlow Property, nor any known body of commercial ore.sale.
Item 4A. Unresolved Staff Comments
Not Applicable.
ItemItem 5. Operating and Financial Review and Prospects
The following discussion and analysis of financial condition and results of operations should be read in conjunction with the information contained in the annual audited consolidated financial statements and the notes thereto included in this annual report on Form 20-F. Such discussion and analysis is based upon our annual audited consolidated financial statements prepared in accordance with IFRS.
A.
| Operating Results
|
Year ended January 31, 20162019 compared to the year ended January 31, 20152018
Operating and administrative expenses
Operating and administrative expenses were $642,193$878,566 for the year ended January 31, 20162019, compared to $538,469$1,375,982 for the year ended January 31, 2015, an increase of $103,724. Increases in administrative and operating costs compared to the year ended January 31, 2016 include $212,519 in impairment of exploration and evaluation assets, and $26,867 in salaries and benefits. Decreases in administrative and operating costs compared to the year ended January 31, 2015 include a comparatively lower number of stock options granted resulting in2018, a decrease to the relatedof $497,416. This is a result of lower share-based payments of $102,021,$270,818 due to stock options vesting over a one year period under the current year option plan, whereas stock options vested immediately in previous years under the previous. As well, the decrease is driven by lower consulting fees, managements fees and salaries and benefits, with a total decrease of $26,827$160,771. The decrease relates to lower corporate activity as a result of the completion of the sale of the Robertson Property in officethe previous year, as well as one-time bonus payments made to key management and miscellaneous, and a decreaseemployees on completion of $16,068 in consulting fees.the transaction.
IncomeIncome/Loss for the year
The netNet income for the year ended January 31, 20162019, was $50,521$704,296, compared to net income of $527$2,015,340 for the year ended January 31, 2015, an increase2018, a change of $1,311,044. The change between the two years relates primarily to the gain recorded in net income of $49,994. The increase was primarily due to a deferred income tax recovery which was $193,280 higher than the previous year lessof $5,871,719 for the effectssale of higher operating and administrative expenses described above. Duringthe Robertson Property, whereas there is no comparable transaction in the current year. This was offset primarily by a foreign exchange gain during the year ended January 31, 2016,2019 of $1,150,371 compared to a loss of $907,286 in the previous year, a total difference of $2,057,657.
Further, the Company recorded a loss on foreign exchange of $9,714, as compared to a gain of $28,798 in the previous year. Deferredcurrent income tax recovery was $476,720 forof $309,024 in the year ended January 31, 20152019, compared to an expense of $2,751,000 in the previous year, a difference of $3,060,024. The movement in current tax expense is a direct result of income taxes payable as a result of the gain on the sale of the Robertson Property during the year ended January 31, 2018, with no comparable transaction in the current year.
The Company also recorded a deferred income tax expense of $13,000 during the year ended January 31, 2019, compared to a recovery of $670,000 for$1,001,000 during the current year.previous year, a change of $1,014,000. This movement is also a direct result of the future tax impact of the sale of the Robertson Property. Deferred tax recovery arises due to differences in the carrying values of assets and liabilities and their tax values and the Company'sCompany’s ability to utilize any of its deferred income tax assets to offset the deferred income liability. During the year ended January 31, 2015, the Company recognized a gain on sale of investment of $7,130 on the sale of 20,000 shares of a related party company, compared to a gain on sale of investment of $27,059 in 2016 on the sale of 79,071 shares of the related party company. During the prior year ended January 31, 2015, the Company recognized a gain on settlement of debt of $25,719, and in the current year recognized gain on forgiveness of debt of $5,250.
| 14 |
| Table of Contents |
Year ended January 31, 20152018 compared to the year ended January 31, 20142017
Operating and administrative expenses
Operating and administrative expenses were $538,469$1,375,982 for the year ended January 31, 20152018 compared to $860,517$580,066 for the year ended January 31, 2014, a decrease2017, an increase of $322,048. Decreases$795,916. Increases in administrative and operating costs compared to the year ended January 31, 2014,2017 include decreasesa comparatively higher number of $498,000stock options granted during the year ended January 31, 2018, resulting in impairment of exploration and evaluation assets, $24,705 in investor relations and shareholder information costs, and $48,970 in salaries and benefits. Additionally, the decrease of corporate activity resulted in decreases in most other expenses. An option grant andan increase to the related share-based payments of $259,163$557,385. Increases in other administrative and operating costs compared to the year ended January 31, 2017 include an increase of $79,585 in consulting fees, $124,500 in management fees, $46,343 in listing and filing fees, and $67,987 in salaries and benefits. The increases above are a result of increased corporate activity due to the otherwise significantly reduced operatingsale of the Robertson Properties, and administrative expenses.
IncomeIncome/Loss for the year
TheNet income for the year ended January 31, 20152018 was $527$2,015,340 compared to anet loss of $50,871$981,139 for the year ended January 31, 2014,2017, a decrease in losschange of $51,398.$2,996,479. The decreasemovement was primarily due to a decrease inthe gain on sale of exploration and evaluation assets, and the related current and deferred income tax expense, less the effects of lower operating and administrative expenses of $322,048described above, as noted above.well as movements in foreign exchange throughout the year. During the year ended January 31, 2015,2018, the Company recorded a gain on sale of exploration and evaluation assets of $5,871,719, finance income relating to the Company’s royalty receivable of $117,379, a gain on sale of investments of $93,693, and a loss on sale of fixed assets of $34,183, with no comparable transactions in the previous year. During the year ended January 31, 2018 the Company recorded a foreign exchange loss of $28,798 as$907,286, compared to a gain of $7,903$21,927 during the year ended January 31, 2017. The movements in foreign exchange are directly related to the changes in the previous year. DeferredCanadian dollar to US dollar rate from the closing of the sale of the Robertson property, to the Company’s reporting period end of January 31, 2018. Current income tax recoveryexpense was $647,855$2,751,000 for the year ended January 31, 20142018, compared to a$Nil in the year ended January 31, 2017. The movement in current income tax relates directly to the sale of exploration and evaluation assets. Deferred income tax recovery of $476,720was $1,001,000 for the current year. A deferredyear ended January 31, 2018, compared to an expense of $423,000 for the year ended January 31, 2017, a movement of $1,424,000 reflecting changes in temporary differences, and the sale of exploration and evaluation assets during the period. Deferred tax recovery or expense arises due to differences in the carrying values of assets and liabilities and their tax values and the Company'sCompany’s ability to utilize any of its deferred income tax assets to offset the deferred income liability. During the year ended January 31, 2014, the Company recognized a gain on sale of investment of $107,300 on the sale of 370,000 shares of a related party compared to a gain on sale of investment of $7,130 in 2015 on the sale of 20,000 shares of a related party.
Currency Fluctuations
The Company'sCompany’s currency fluctuation exposure is primarily due to the U.S. Dollar. The Company does not use derivative financial instruments for speculative trading purposes, nor does the Company hedge its foreign currency exposure to manage the Company'sCompany’s foreign currency fluctuation risk. Fluctuations in and among the currencies in which the Company operates could have a material effect on the Company'sCompany’s operations and its financial results.
B. Liquidity and Capital Resources |
Currently, the Company has no operating income, but is earning interest income on its entire cash holdings. Historically, the Company has funded its operations through equity financings and the exercise of stock options and warrants.
At January 31, 2016,2019, the Company had working capital of $470,078$15,094,434 and cash and cash equivalents of $599,964.$8,308,884. The Company also holds term deposits of $9,656,320, with maturity dates within one year.
During the year ended January 31, 2016,2019, the Company received $250,000 for$570,774 from the issuance of 5,000,000 units in non-brokered private placements, each unit consistingcommon shares from the exercise of one common shareoptions and one non-transferable share purchase warrant exercisable at $0.10 for a period of two years.warrants. These funds will be used to maintain the Company's existing operations and for general working capital requirements. The Company is in the exploration stage. The investment in and expenditures on the mineral property comprise substantially all of the Company'sCompany’s assets. The recoverability of amounts shown for its mineral property interest and related deferred costs are dependent upon the continued support of its directors, the discovery of economically recoverable reserves, and the ability of the Company to obtain the financing necessary to complete development and achieve profitable operations in the future. The outcome of these matters cannot be predicted at this time.
| 15 |
| Table of Contents |
Mineral exploration and development is capital intensive, and in order to maintain its interest the Company will be required to raise new equity capital in the future. There is no assurance that the Company will be successful in raising additional new equity capital.
C.
| Research and Development, Patents and Licenses, etc.
|
The Company is a mineral exploration company with no research and development policies. Refer to Part I Business overview for a summary of our exploration activities.
|
As at the time of filing this Annual Report and as otherwise disclosed in this Annual Report, the Company is not aware of any specific trends, uncertainties, demands, commitments or events that are reasonably likely to have a material effect on the Company's net sales or revenues, income from continuing operations, profitability,Company’s liquidity or capital resources, or that would cause reported financial information not necessarily to be indicative of future operating results or financial condition. Many factors that are beyond the control of the Company can affect the Company'sCompany’s operations, including, but not limited to, the price of minerals, the economy on a global scale, land and exploration permitting, and the appeal of investments in exploration companies. The appeal of exploration companies as investment alternatives could affect the liquidity of the Company and thus future exploration, development and financial conditions of the Company. Other factors such as retaining qualified mining personnel and contractor availability and costs could also impact the Company'sCompany’s operations.
E.
|
The Company has no off-balance sheet arrangements.
| F. Tabular Disclosure of Contractual Obligations
|
As at January 31, 2016,2019, the Company had the following contractual obligations:
|
| Payment due by period |
| |||||||||||||||||||||||||||||||||||||
|
| Total |
|
| <1 year |
|
| 1-3 Years |
|
| 3-5 Years |
|
| More than 5 years |
|
| Payment due by period |
| ||||||||||||||||||||||
| Total |
|
| <1 year |
|
| 1-3 Years |
|
| 3-5 Years |
|
| More than 5 years |
| ||||||||||||||||||||||||||
Trade payables and other payables |
| $ | 148,637 |
| $ | 148,637 |
| $ | - |
| $ | - |
| $ | - |
|
| $ | 77,523 |
| $ | 77,523 |
| $ | - |
| $ | - |
| $ | - |
| ||||||||
Reclamation Provision |
| 645,153 |
|
| - |
|
| 645,153 |
|
| - |
|
| - |
| |||||||||||||||||||||||||
Current Tax Liability |
| 2,834,277 |
| 2,834,277 |
| - |
| - |
| - |
| |||||||||||||||||||||||||||||
Deferred Tax Liability |
|
| 620,000 |
|
|
| - |
|
|
| - |
|
|
| - |
|
|
| 620,000 |
|
|
| 55,000 |
|
|
| - |
|
|
| - |
|
|
| - |
|
|
| 55,000 |
|
Total |
| $ | 1,413,790 |
|
| $ | 148,637 |
|
| $ | 645,153 |
|
| $ | - |
|
| $ | 620,000 |
|
| $ | 2,966,800 |
|
| $ | 2,911,800 |
|
| $ | - |
|
| $ | - |
|
| $ | 55,000 |
|
The Company has a cost-sharing agreement to reimburse a related company, Oniva International Services Corp. ("Oniva"(“Oniva”), for a percentage of its overhead expenses, to reimburse 100% of its out-of-pocket expenses incurred on behalf of the Company, and to pay a percentage fee based on the total overhead and corporate expenses. The agreement may be terminated with one-month notice by either party.
As of January 31, 2016,2019, the Company had no other contractual obligations.
|
All information that
The Company is not historicalinvolved in nature disclosed under "Item 5 – Operatingany legal or arbitration proceedings, including those relating to bankruptcy, receivership or similar proceedings and Financial Review and Prospects" is deemedthose involving any third party, which may have, or had in the recent past, significant effects on the Company’s financial position or profitability, including governmental proceedings pending or known to be a forward looking statement. See "Forward-Looking Statements" for additional information.contemplated.
| 16 |
| Table of Contents |
Dividend Policy
The Company has never paid any dividends and does not intend to in the near future.
Item 6. Directors, Senior Management and Employees
| A. Directors and Senior Management
|
The following is a list of the Company'sCompany’s directors and senior management as at June 8, 2016.May 27, 2019. The directors are elected for a term of one year at the annual meeting of shareholders. This year'syear’s annual meeting will be held on July 22, 2016.
Name | Position Held | Principal Occupation | Director/Officer Since | |||
Ronald Andrews | Director | Director of | January 2010 | |||
|
|
|
| |||
David Wolfin | Director, President & Chief Executive Officer | Director, President and CEO of the Company, Gray Rock Resources Ltd. and Avino Silver & Gold Mines Ltd.;, and | September 1997 | |||
Gary Robertson | Chairman and Director | Certified Financial Planner, Director of the Company and Director of Avino Silver & Gold Mines Ltd., | July 2003 | |||
Andrew Kaplan | Director | Business Consultant | July 2012 | |||
| Director | Senior Account Executive and Resource Specialist at Nelson Securities Inc., and licensed professional geologist. | July 2018 | |||
Dorothy Chin | Corporate Secretary | Corporate Secretary of the Company, and of Avino Silver & Gold Mines, and Gray Rock Resources Ltd. | July 2015 | |||
| Chief Financial Officer | CPA, Chief Financial Officer of the Company and of Avino Silver & Gold Mines Ltd., and Gray Rock Resources Ltd. |
|
____________
*On July 17, 2015, Ms. Pamela Saulnier resigned as Corporate Secretary and Ms. Dorothy Chin was appointed Corporate Secretary.B. Compensation
|
During the last completed fiscal year, the Company had twothree executive officers, namely its Chief Executive Officer ("CEO"(“CEO”), David Wolfin and itsWolfin; Nathan Harte, Chief Financial Officer ("CFO"),(appointed on November 21, 2018); and Malcolm Davidson.Davidson, former Chief Financial Officer (employment relationship ended on November 21, 2018).
| 17 |
| Table of Contents |
1) Compensation Discussion and Analysis
The Company does not have a compensation program other than paying base salaries, incentive bonuses, and incentive stock options to its executive officers. The Company recognizes the need to provide compensation package that will attract and retain qualified and experienced executives, as well as align the compensation level of each executive to that executive'sexecutive’s level of responsibility. The three components of the compensation package are included to enable the Company to meet different objectives. The objectives of base salary are to recognize market pay, and acknowledge the competencies and skills of individuals. The objective of incentive bonuses (paid in the form of cash payments) is to add a variable component of compensation to recognize corporate and individual performances for executive officers and employees. The objectives of stock option awards are to reward achievement of long-term financial and operating performance and focus on key activities and achievements critical to the ongoing success of the Company. Implementation of new incentive stock option plans and amendments to the existing stock option plan are the responsibility of the Company'sCompany’s Compensation Committee.
The Company has no other forms of compensation, although payments may be made from time to time to individuals or companies they control for the provision of consulting services. Such consulting services are paid for by the Company at competitive industry rates for work of a similar nature by reputable arm'sarm’s length services providers.
The processCompany relies on the discretion and judgment of the directors in establishing and amending contracts for determining executiveall forms of compensation, relies solely on discussions amongstincluding stock options to be granted to the boardCEO and the directors, and for reviewing the CEO’s recommendations respecting compensation of directorsthe other officers of the Company, (the "Board")to ensure such arrangements reflect the responsibilities and risks associated with the input from and upon the recommendations of the Compensation Committee, without anyeach position. There is no formal process using objectives, criteria, and analysis.or analysis, for determining compensation.
Actual compensation will vary based on the performance of the executives relative to the achievement of goals and the price of the Company'sCompany’s securities.
Compensation Element | Description |
| Compensation Objectives | |
Annual Base Salary | Salary is market-competitive, fixed level of compensation | Retain qualified leaders, motivate strong business performance. | ||
Incentive Bonuses | Discretionary cash payment | Reward individual performance in achieving corporate goals | ||
Incentive Stock Option | Equity grants are made in the form of stock options. The amount of grant will be dependent on individual and corporate | Reward long-term financial and operating performance and align interests of key employees with those of shareholders |
| 18 |
| Table of Contents |
2) Summary Compensation Table
The following table sets forth particulars concerning the compensation paid or accrued for services rendered to the Company in all capacities during the last three most recently completed financial yearyears ended January 31, 20162017, 2018 and 2019 of the Company to its executive officers:
Name and principal position |
| Year |
| Salary ($) |
|
| Share-based awards ($)1 |
| Option-based awards ($)2 |
| Non-equity incentive plan compensation ($)3 |
|
| Pension value ($)3 |
|
| All other compensation ($) |
|
| Total compensation ($) |
| |||||
David Wolfin President, CEO & Director |
| 2016 |
|
| 30,000 |
|
| NIL |
| NIL |
|
| - |
|
|
| - |
|
|
| - |
|
|
| 30,000 |
|
Malcolm Davidson CFO |
| 2016 |
|
| 15,140 |
|
| NIL |
| NIL |
|
| - |
|
|
| - |
|
|
| - |
|
|
| 15,140 |
|
Name and principal position Year Salary ($) Share-based awards ($)1 Option-based awards ($)2 Non-equity incentive plan compensation ($)3 Pension value ($)4 All other compensation ($)5 Total compensation ($) David Wolfin President, CEO & Director(6) 2019 NIL 109,624 NIL NIL NIL 181,624 2018 NIL NIL NIL 2017 NIL NIL NIL NIL NIL Malcolm Davidson FORMER CFO(7) 2019 NIL 16,444 NIL NIL NIL 33,696 2018 NIL NIL NIL 2017 NIL NIL NIL NIL NIL Nathan Harte, CFO(7) 2019 NIL 5,074 NIL NIL NIL 10,256 _______________72,000 $ $ $ 54,500 $ 192,000 $ 100,000 $ 346,500 $ 30,000 $ 30,000 $ 17,252 $ $ 21,420 $ 40,000 $ 10,000 $ 71,420 $ 21,702 $ 21,702 $ 5,182 $ $
1 ____________
(1) The Company does not currently have any share-based award plans.
2(2) The methodology used to calculate the grant-date fair value is based on the Black-Scholes Option Pricing Model. No stockDuring the year ended January 31, 2019, 1,545,000 options were granted to officers, directors, employees, and consultants. The fair value was estimated using the Company's executive officers in fiscal 2016.following weighted-average assumptions: risk-free interest rate of 2.15%, expected dividend yield of 0%, expected option life of 5 years, and expected share price volatility of 117%.
3 (3) The Company does not have a non-equity incentive plan.
4 (4) The Company does not have any pension plans.
5(5) Discretionary cash payment of incentive bonuses.
6 (6) Mr. Wolfin's salaryWolfin’s compensation was paid to Intermark Capital Corp., a private BC corporation controlled by Mr. Wolfin.
(7) The employment relationship with Malcolm Davidson, former Chief Financial Officer ended on November 21, 2018 and Mr. Nathan Harte, Chief Financial Officer was appointed on the same date.
Annual Base Salary
Base Salary for the executive officers is determined by the Board upon the recommendation of the Compensation Committee, and its recommendations are reached primarily by informal comparison of the remuneration paid by other reporting issuers with the same size and industry and with publicly available information on remuneration that the Compensation Committee feels is suitable.
The Annual Base Salary paid to the executive officers is, for the purpose of establishing appropriate increases, reviewed annually by the Board upon the recommendation of the Compensation Committee thereof as part of the annual review of executive officers. The decision on whether to grant an increase to the executive'sexecutive’s base salary and the amount of any such increase shall be in the sole discretion of the Board and Compensation Committee thereof.Committee.
Non-Equity Incentive Plan Compensation
One of the three components of the Company'sCompany’s compensation package is a discretionary annual cash bonus, paid to recognize individual performance in attaining corporate goals and objectives. The Company does not have a long-term incentive plan.
Option Based AwardIncentive Awards
An Option Based Incentive Award is in the form of an incentive stock option plan. The objective of the incentive stock option is to reward executive officers, employees'employees’ and directors'directors’ individual performance at the discretion of the Board upon the recommendation of the Compensation Committee.
The Company currently maintains a formal stock option plan currently used by the Company is 2015 Stock Option Plan (the "Plan"“Plan”), under which stock options have been granted and may be granted to purchase a number equal to up to 10% of the Company'sCompany’s issued capital from time to time. For details of the Plan please refer to “Particulars of Matters to be Act Upon” in the Information Circular.
The Plan is administered by the Compensation Committee. The process the Company uses to grant option-based awards to executive officers is upon the recommendations of the Compensation Committee to the Board of Directors.Committee.
| 19 |
| Table of Contents |
The role of the Compensation Committee is to recommend to the Board the compensation of the Company'sCompany’s directors and the executive officers which the Committee feels is suitable.
3) Incentive Plan Awards
Outstanding share-based awards and option-based awards
The following table sets forth the options granted to the executive officers to purchase or acquire securities of the Company outstanding at the end of the most recently completed financial year ended January 31, 2016:2019:
|
| Option-based Awards |
| Share-based Awards |
| ||||||||||||||
Name |
| Number of securities underlying unexercised options (#) |
|
| Option exercise price ($) |
|
| Option expiration date |
| Value of unexercised in-the-money options ($)1 |
| Number of shares or units of shares that have not vested (#) |
| Market or payout value of share-based awards that have not vested ($) |
| Market or payout value of vested share-based awards not paid out or distributed ($) | |||
David Wolfin |
|
| 300,000 |
|
| $ | 0.40 |
|
| Feb 22, 2017 |
| Nil |
| Nil |
| Nil |
| Nil | |
President, CEO |
|
| 220,000 |
|
| $ | 0.30 |
|
| Oct 12, 2017 |
| Nil |
| Nil |
| Nil |
| Nil | |
and Director |
|
| 600,000 |
|
| $ | 0.24 |
|
| Mar 14, 2019 |
| Nil |
| Nil |
| Nil |
| Nil | |
Malcolm Davidson |
|
| 75,000 |
|
| $ | 0.40 |
|
| Feb 22, 2017 |
| Nil |
| Nil |
| Nil |
| Nil | |
CFO |
|
| 40,000 |
|
| $ | 0.30 |
|
| Oct 12, 2017 |
| Nil |
| Nil |
| Nil |
| Nil | |
|
|
| 100,000 |
|
| $ | 0.24 |
|
| Mar 14, 2019 |
| Nil |
| Nil |
| Nil |
| Nil | |
|
| Option-based Awards |
|
| Share-based Awards | ||||||||||||||||
Name |
| Number of securities underlying unexercised options (#) |
|
| Option exercise price ($) |
|
| Option expiration date |
| Value of unexercised in-the-money options ($)(1) |
|
| Number of shares or units of shares that have not vested (#) |
| Market or payout value of share-based awards that have not vested ($) |
| Market or payout value of vested share-based awards not paid out or distributed ($) | ||||
David Wolfin President, CEO and Director |
|
| 500,000 |
|
| $ | 0.380 |
|
| Sept. 4, 2023 |
| Nil |
|
| Nil |
| Nil |
| Nil | ||
|
|
| 600,000 |
|
| $ | 0.355 |
|
| July 5, 2022 |
|
| 15,000 |
|
| Nil |
| Nil |
| Nil | |
|
|
| 600,000 |
|
| $ | 0.24 |
|
| Mar 14, 2019 |
|
| 84,000 |
|
| Nil |
| Nil |
| Nil | |
|
|
|
|
|
|
|
|
|
|
|
|
|
|
|
|
|
|
|
|
|
|
Malcolm Davidson Former CFO(2) |
|
| 75,000 |
|
| $ | 0.380 |
|
| Sept. 4, 2023 |
| Nil |
|
| Nil |
| Nil |
| Nil | ||
|
|
| 125,000 |
|
| $ | 0.355 |
|
| July 5, 2022 |
|
| 3,125 |
|
| Nil |
| Nil |
| Nil | |
|
|
| 40,000 |
|
| $ | 0.24 |
|
| Mar 14, 2019 |
|
| 5,600 |
|
| Nil |
| Nil |
| Nil | |
|
|
|
|
|
|
|
|
|
|
|
|
|
|
|
|
|
|
|
|
|
|
Nathan Harte CFO(2) |
|
| 40,000 |
|
| $ | 0.380 |
|
| Sept. 4, 2023 |
| Nil |
|
| Nil |
| Nil |
| Nil | ||
|
|
| 25,000 |
|
| $ | 0.355 |
|
| July 5, 2022 |
|
| 625 |
|
| Nil |
| Nil |
| Nil | |
___________________________
1 (1) In-the-Money Options are the difference between the market value of the underlying securities at January 29, 201631, 2019 and the exercise price of the option. The closing market price for the Company's common shares as at January 29, 201631, 2019 was $0.08$0.38 per common share.
(2) The employment relationship with Malcolm Davidson, former Chief Financial Officer ended on November 21, 2018 and Mr. Nathan Harte, Chief Financial Officer was appointed on the same date.
Incentive plan awards – value vested or earned during the year
An “incentive plan” is any plan providing compensation that depends on achieving certain performance goals or similar conditions within a specific period. An “incentive plan award” means compensation awarded, earned, paid or payable under an incentive plan.
| 20 |
| Table of Contents |
The following table sets forth the value vested or earned during the year of option-based awards, share-based awards and non-equity incentive plan compensation paid to executive officers during the most recently completed financial year ended January 31, 2016:2019:
Name |
| Option-based awards – Value vested during the year ($) |
|
| Share-based awards – the year ($) |
| Non-equity
compensation – earned during the year ($) | ||
David Wolfin President, CEO and Director |
|
|
| ||||||
|
| Nil |
|
| Nil |
| Nil | ||
______________
Malcolm Davidson Former CFO(1) | Nil | Nil | Nil | ||||||
Nathan Harte CFO(1) | |||||||||
Nil | Nil | Nil |
_____________
(1) The employment relationship with Malcolm Davidson, former Chief Financial Officer ended on November 21, 2018 and Mr. Nathan Harte, Chief Financial Officer was appointed on the same date.
4) Pension Plan Benefits
No pension plan or retirement benefit plans have been instituted by the Company and none are proposed at this time.
Use of Financial Instruments
The Company does not have in place policies which restrict the ability of directors or executive officers to purchase financial instruments, such as prepaid variable forward contracts, equity swaps, collars, or units of exchange funds, that are designed to hedge or offset a decrease in market value of equity securities granted as compensation or held, directly or indirectly, by a director or executive officers. Any such purchases would be subject to applicable insider reporting requirements.
5) Termination and Change of Control Benefits
On February 1, 2015, the Company entered into a consulting agreement with Intermark Capital Corporation (the “Consultant”), a company owned by David Wolfin ("Consultant"). Theand on July 1, 2017, the Company further amended the consulting agreement which contains certain provisions in connection with termination of employmentengagement or change of control.
This AgreementThe consulting agreement can be terminated at any time as follows:
| (a) | by the Consultant electing to give the Company not less than 3 months prior notice of such termination; | |
| (b) | by the Company electing to give the Consultant 3 months prior notice of such termination along with a termination payment equal to the annual Consulting | |
| (c) | by the Consultant electing to give the Company notice, in the event that there occurs a Change of Control (as defined below) within six (6) months of the effective date of such Change of Control, and if the Consultant so elects to terminate |
On FebruaryJanuary 1, 2015,2014, the Company entered into a Change Control Agreementan employment agreement with Malcolm Davidson, the named executive officer of the Company. The agreement contains Changecertain provisions in connection with termination of Control provisionsemployment or change of control.
This Agreement may be terminated at any time as follows:
In the event of a change of control by means of a hostile takeover or a change in ownership Coral will pay
(a) | by the Executive electing to give the Company not less than 1 month’s prior notice of such termination for which Executive will be paid his salary, accrued bonuses, if any, and vacation earned and other amounts due to him up to the termination date; | |
(b) | by the Company upon 1 month’s prior notice of such termination along with a termination payment equal to the Executive’s salary and accrued bonus earned during the preceding 12 months prior to the month notice of termination was given, plus any accrued vacation and other amounts due to him up to the termination date; or | |
(c) | (1) by the Executive electing to give the Company notice, in the event that there occurs a Change of Control (as defined below) within 6 months of the effective date of such Change of Control, and if the Executive so elects to terminate this Agreement, or (2) by the Company upon notice to the Executive within 3 months prior to or within 6 months after a Change of Control is announced by the Company, then the Executive will be entitled receive on the date of termination a termination payment equal to 3 times the Executive’s salary and accrued bonus earned during the preceding 12 months prior to the month notice of termination was given, plus any accrued vacation and other amounts due to him up to the termination date. |
The employment relationship with Mr. Malcolm Davidson a one time feeended on November 21, 2018, and in connection with the ending of $50,000, for which Malcolmhis employment and settling all issues, Mr. Davidson will be responsible for any taxes. This fee will be cancelled without payment in the event that Malcolm Davidson stops performing his current duties, or should voluntarily leave the company. This Agreement is for a period 36 monthsreceived C$12,000 from the date of this Agreement and can be extended by a decision of Coral's Board of Directors.Company.
A Change of Control for purposes of Mr. Wolfin’s agreement shall be deemed to have occurred when:
| (i) | any person, entity or group becomes the beneficial owner of 20% or more of the combined voting power of the Company's then outstanding voting securities entitled to vote generally in the election of directors, and such person, entity or group uses such effective voting control to change a majority of the Board of Directors of the Company, either all at once or through any series of elections and appointments when considered together; or | |
| (ii) | completion of the sale or other disposition by the Company of all or substantially all of the Company's assets or a reorganization or merger or consolidation of the Company with any other entity or corporation, other than: |
| 21 | ||
| Table of Contents |
| (A) | a reorganization or merger or consolidation that would result in the voting securities of the Company outstanding immediately prior thereto continuing to represent, either by remaining outstanding or by being converted into voting securities of another entity, more than 50.1% of the combined voting power of the voting securities of the Company or such other entity outstanding immediately after such reorganization or merger or consolidation; or | |
| (B) |
|
6) Director Compensation
The Company pays its independent directors $750Effective July 1, 2017 the Independent Directors and Committee Members received combined Independent Directors and Committee Members fees of $15,000 per quarter and an additional $750 per quarter for being a member of three or more committees.annum.
The following table sets forth the value of all compensation paid to the non-officer directors during the most recently completed financial year ended January 31, 2016:2019:
Name |
| Fees earned ($) |
| Share-based awards1 ($) |
| Option-based awards2 ($) |
| Non-equity incentive plan compensation3 ($) |
| Pension value4 ($) |
| All other compensation ($) |
| Total ($) |
|
| Fees earned ($) |
| Share-based awards(1) ($) |
| Option-based awards(2) ($) |
| Non-equity incentive plan compensation(3)($) |
| Pension value(4) ($) |
| All other compensation ($) |
| Total ($) |
| ||||||||||||||||||
|
|
|
|
|
|
|
|
|
|
|
|
|
|
|
| |||||||||||||||||||||||||||||||||
Gary Robertson* |
| $ | 6,000 |
| NIL |
| NIL |
| NIL |
|
| NIL |
|
| NIL |
| $ | 6,000 |
|
| 15,000 |
| NIL |
| 21,925 |
| NIL |
| NIL |
| NIL |
| 36,925 |
| ||||||||||||||
Chris Sampson |
| $ | 16,359 |
| NIL |
| NIL |
| NIL |
|
| NIL |
|
| NIL |
| $ | 16,359 |
| |||||||||||||||||||||||||||||
Ronald Andrews* |
| $ | 6,000 |
| NIL |
| NIL |
| NIL |
|
| NIL |
|
| NIL |
| $ | 6,000 |
|
| 15,000 |
| NIL |
| 21,925 |
| NIL |
| NIL |
| NIL |
| 36,925 |
| ||||||||||||||
Andrew Kaplan* |
| $ | 6,000 |
| NIL |
| NIL |
| NIL |
|
| NIL |
|
| NIL |
| $ | 6,000 |
|
| 15,000 |
| NIL |
| 21,925 |
| NIL |
| NIL |
| NIL |
| 36,925 |
| ||||||||||||||
Russell Price*(5) |
| 7,500 |
| NIL |
| 43,850 |
| NIL |
| NIL |
| NIL |
| 51,350 |
| |||||||||||||||||||||||||||||||||
_______________________
*Independent and Non-Employee Directors
1 (1) The Company does not currently have any share-based award plans.
2 (2) The methodology used to calculate the grant-date fair value is based on the Black-Scholes Option Pricing Model. There were a total of 500,000 new option-based awards issued duringDuring the year ended January 31, 2019, 1,545,000 options were granted to officers, directors, employees, and theconsultants. The fair value was estimated using the following weighted-average assumptions: risk-free interest rate of 0.42%2.15%, expected dividend yield of 0%, expected option life of 3.205 years, and expected share price volatility of 100.07%.117%
3 (3) The Company does not have a non-equity incentive plan
4 (4) The Company does not have any pension plans.
(5) Mr. Russell Price was appointed as a Director on July 23, 2018.
No director of the Company who is not a named executive officer has received, during the most recently completed financial year, compensation pursuant to:
| (a) | any standard arrangement for the compensation of directors for their services in their capacity as directors, including any additional amounts payable for committee participation or special assignments; | |
| (b) | any other arrangement, in addition to, or in lieu of, any standard arrangement, for the compensation of directors in their capacity as directors except for the granting of stock options; or | |
| (c) | any arrangement for the compensation of directors for services as consultants or experts. |
The Company may grant incentive stock options to directors of the Company from time to time pursuant to the stock option plan of the Company and in accordance with the policies of the TSX-V.
| 22 |
| Table of Contents |
Outstanding share-based awards and option-based awards
The following table sets forth the options granted to the directors to purchase or acquire securities of the Company outstanding at the end of the most recently completed financial year ended January 31, 2016:2019:
|
| Option-based Awards |
| Share-based Awards |
|
| Option-based Awards |
| Share-based Awards | |||||||||||||||||||||||||||||||
Name (1) |
| Number of securities underlying unexercised options (#) |
|
| Option exercise price ($) |
|
| Option expiration date |
| Value of unexercised in-the-money options ($)(2) |
| Number of shares or units of shares that have not vested (#) |
| Market or payout value of share-based awards that have not vested ($) |
| Market or payout value of share-based awards not paid out or distributed ($) |
|
| Number of securities underlying unexercised options (#) |
| Option exercise price ($) |
| Option expiration date |
| Value of unexercised in-the-money options ($)2 |
| Number of shares or units of shares that have not vested (#) |
| Market or payout value of share-based awards that have not vested ($) |
| Market or payout value of vested share-based awards not paid out or distributed ($) | |||||||||
|
|
|
|
|
|
|
|
|
|
|
|
|
|
| ||||||||||||||||||||||||||
Gary Robertson |
| 75,000 |
|
| $ | 0.40 |
|
| Feb 22, 2017 |
| Nil |
| Nil |
| Nil |
| Nil |
| 100,000 |
| $ | 0.38 |
| Sept 4, 2023 |
| Nil |
| Nil |
| Nil |
| Nil | ||||||||
|
| 75,000 |
| $ | 0.30 |
| Oct 12, 2017 |
| Nil |
| Nil |
| Nil |
| Nil | |||||||||||||||||||||||||
|
| 100,000 |
| $ | 0.24 |
| Mar 14, 2019 |
| Nil |
| Nil |
| Nil |
| Nil | |||||||||||||||||||||||||
|
|
|
|
|
|
|
|
|
|
|
|
|
|
| ||||||||||||||||||||||||||
Chris Sampson |
| 75,000 |
|
| $ | 0.40 |
|
| Feb 22, 2017 |
| Nil |
| Nil |
| Nil |
| Nil | |||||||||||||||||||||||
|
| 40,000 |
| $ | 0.30 |
| Oct 12, 2017 |
| Nil |
| Nil |
| Nil |
| Nil |
| 250,000 |
| $ | 0.355 |
| July 5, 2022 |
| 6,250 |
| Nil |
| Nil |
| Nil | ||||||||||
|
| 50,000 |
| $ | 0.24 |
| Mar 14, 2019 |
| Nil |
| Nil |
| Nil |
| Nil |
| 100,000 |
| $ | 0.24 |
| Mar 14, 2019 |
| 14,000 |
| Nil |
| Nil |
| Nil | ||||||||||
|
|
|
|
|
|
|
|
|
|
|
|
|
|
|
| |||||||||||||||||||||||||
Ronald Andrews |
| 75,000 |
|
| $ | 0.40 |
|
| Feb 22, 2017 |
| Nil |
| Nil |
| Nil |
| Nil |
| 100,000 |
| $ | 0.38 |
| Sept 4, 2023 |
| Nil |
| Nil |
| Nil |
| Nil | ||||||||
|
| 40,000 |
| $ | 0.30 |
| Oct 12, 2017 |
| Nil |
| Nil |
| Nil |
| Nil |
| 200,000 |
| $ | 0.355 |
| July 5, 2022 |
| 5,000 |
| Nil |
| Nil |
| Nil | ||||||||||
|
| 100,000 |
| $ | 0.24 |
| Mar 14, 2019 |
| Nil |
| Nil |
| Nil |
| Nil |
| 100,000 |
| $ | 0.24 |
| Mar 14, 2019 |
| 14,000 |
| Nil |
| Nil |
| Nil | ||||||||||
|
|
|
|
|
|
|
|
|
|
|
|
|
|
|
| |||||||||||||||||||||||||
Andrew Kaplan |
| 20,000 |
| $ | 0.40 |
|
| Feb 22, 2017 |
| Nil |
| Nil |
| Nil |
| Nil |
| 100,000 |
| $ | 0.38 |
| Sept 4, 2023 |
| Nil |
| Nil |
| Nil |
| Nil | |||||||||
|
| 75,000 |
| $ | 0.30 |
| Oct 12, 2017 |
| Nil |
| Nil |
| Nil |
| Nil |
| 200,000 |
| $ | 0.355 |
| July 5, 2022 |
| 5,000 |
| Nil |
| Nil |
| Nil | ||||||||||
|
| 100,000 |
| $ | 0.24 |
| Mar 14, 2019 |
| Nil |
| Nil |
| Nil |
| Nil |
| 100,000 |
| $ | 0.24 |
| Mar 14, 2019 |
| 14,000 |
| Nil |
| Nil |
| Nil | ||||||||||
|
| |||||||||||||||||||||||||||||||||||||||
Russell Price |
| 200,000 |
| $ | 0.38 |
| Sept 4, 2023 |
| Nil |
| Nil |
| Nil |
| Nil | |||||||||||||||||||||||||
_________________________
| |
(2) The in-the-money option value is the difference between the market value of the underlying securities as at January 31, 2019 and the exercise price of the option. The closing market price of the Company’s common shares as at January 31, 2019 was $0.38 per common share. |
Incentive plan awards – value vested or earned during the year
An "incentive plan"“incentive plan” is any plan providing compensation that depends on achieving certain performance goals or similar conditions within a specific period. An "incentive“incentive plan award"award” means compensation awarded, earned, paid or payable under an incentive plan.
The following table sets forth the value vested or earned during the year of option-based awards, share-based awards and non-equity incentive plan compensation paid to directors during the most recently completed financial year ended January 31, 2016:2019:
Name(1) |
| Option-based awards – Value vested during the year ($) |
|
| Share-based awards – Value vested during the year ($) |
| Non-equity incentive plan compensation – Value earned during the year ($) | |||||
Gary Robertson |
|
|
| Nil |
|
| Nil |
| Nil | |||
|
| Nil |
|
| Nil |
| Nil | |||||
|
| |||||||||||
| Nil |
|
| Nil |
| Nil | ||||||
|
| |||||||||||
| Nil |
|
| Nil |
| Nil | ||||||
____________________________
(1) For the compensation of Mr. Wolfin, the named executive officer of the Company, see “Incentive Plan Awards” above.
(2) The aggregate dollar value that would have been realized if the options granted during the year had been exercised on the vesting date
| |
| 23 | |
|
Termination of Employment, Changes in Responsibilities and Employment Contracts
On February 1, 2015, the Company entered into a consulting agreement with Intermark Capital Corporation (the “Consultant”), a company wholly owned by David Wolfin, and on July 1, 2017 the named executive officerCompany further amended the consulting agreement which contains certain provisions in connection with termination of the Company. engagement or change of control.
On February 1, 2015, the Company entered into an executive agreement with Malcolm Davidson, the named executive officer of the Company.
Please see "“Termination and Change of Control Benefits"Benefits” above for details.
C. Board Practices
The Board is currently comprised of five directors. The size and experience of the Board is important for providing the Company with effective governance in the mining industry. The Board'sBoard’s mandate and responsibilities can be effectively and efficiently administered at its current size. The Board has functioned, and is of the view that it can continue to function, independently of management as required. Directors are elected for a term of one year at the annual general meeting. At the Company'sCompany’s previous annual general meeting, held on September 2, 2015,July 19, 2018, the shareholders elected Ronald Andrews, Gary Robertson, Chris Sampson, David Wolfin, and Andrew Kaplan as directors.directors and Russell Price was appointed to the Board on July 23, 2018.
The Board has considered the relationship of each director to the Company and considers threefour of the five directors to be "unrelated"“unrelated” (Messrs. Andrews, Robertson, Kaplan and Kaplan)Price). "Unrelated director"“Unrelated director” means a director who is independent of management and free from any interest and any business or other relationship which could reasonably be perceived to materially interfere with the director'sdirector’s ability to act with a view to the best interest of the Company, other than interests and relationships arising solely from shareholdings.
David Wolfin is President and Chief Executive Officer of the Company and is not independent. Chris Sampson is also the Vice-President of Exploration of the Company and is not independent.
The Board has addressed the related directorship issues and intends, given a transitional period, to eventually be comprised of a majority of unrelated directors. Procedures are in place to allow the Board to function independently. At the present time, the Board has experienced directors that have made a significant contribution to the Company'sCompany’s success, and are satisfied that it is not constrained in its access to information, in its deliberations or in its ability to satisfy the mandate established by law to supervise the business and affairs of the Company. The Company'sCompany’s chairman and independent directors meet in the absence of managing directors.management. Committees meet independent of management and other directors. Committees appoint a chairman from their number who presides over the committee meetings.
Mandate of the Board of Directors, its Committees and Management
The role of the Board is to oversee the conduct of the Company'sCompany’s business, including the supervision of management, and determining the Company'sCompany’s strategy. Management is responsible for the Company'sCompany’s day to day operations, including proposing its strategic direction and presenting budgets and business plans to the Board for consideration and approval. The strategic plan takes into account, among other things, the opportunities and risks of the Company'sCompany’s business. Management provides the Board with periodic assessments as to those risks and the implementation of the Company'sCompany’s systems to manage those risks. The Board reviews the personnel needs of the Company from time to time, having particular regard to succession issues relating to senior management. Management is responsible for the training and development of personnel. The Board assesses how effectively the Company communicates with shareholders, but has not adopted a formal communications policy. Through the audit committee, and in conjunction with its auditors, the Board assesses the adequacy of the Company'sCompany’s internal control and management information systems. The Board looks to management to keep it informed of all significant developments relating to or effecting the Company'sCompany’s operations. Major financings, acquisitions, dispositions and investments are subject to Board approval. A formal mandate for the Board and the Chief Executive Officer has not been considered necessary since the relative allocation of responsibility is well understood by both management and the Board.
The Board and committees may take action at regularly held meetings or at a meeting by conference call or by written consent.
Committees
Corporate Governance & Nominating Committee
The Governance and Nominating Committee assists the Board in establishing the Company'sCompany’s corporate governance policies and practices generally identifying individuals qualified to become members of the Board, reviewing the composition and functioning of the Board and its committees and making recommendations to the Board as appropriate. When considering nominees to the Board the Governance and Nominating Committee'sCommittee’s mandate requires that it consider the current composition of the Board and give consideration to candidates having experience in the industry, life experience and background. The Governance and Nominating Committee is also responsible for the Company'sCompany’s corporate governance guidelines. The Governance and Nominating Committee may retain legal or other advisors.
The Governance and Nominating Committee currently consists of three directors, Andrew Kaplan, Ronald Andrews Andrew Kaplan, and Chris Sampson, twoGary Robertson, all of the three directorswhom are considered independent (Messrs. Andrews and Kaplan).independent.
Audit Committee
The Audit Committee assists the Board in its oversight of the Company'sCompany’s financial statements and other related public disclosures, the Company'sCompany’s compliance with legal and regulatory requirements relating to financial reporting, the external auditors, qualifications and independence and the performance of the internal audit function and the external auditors. The Audit Committee has direct communications channels with the Company'sCompany’s auditors. The Audit Committee reviews the Company'sCompany’s financial statements and related management'smanagement’s discussion and analysis of financial and operating results. The Audit Committee can retain legal, accounting or other advisors.
The Audit Committee consists of Gary Robertson, Ronald Andrews and Chris Sampson,Andrew Kaplan, all of whom are financially literate. Currently, the Audit Committee has at least one member with accounting or related financial management expertise. "Financially literate"“Financially literate” means the ability to read and understand a balance sheet, an income statement, and a cash flow statement. "Accounting“Accounting or related financial expertise"expertise” means the ability to analyze and interpret a full set of financial statements, including the notes attached thereto, in accordance with IFRS. Gary Robertson and Ronald AndrewsAll of the Audit Committee Members are both independent, having no direct or indirect material relationship with the Company which could, in the view of the Board, reasonably interfere with the exercise of a member'smember’s independent judgment.
It is intended that this Audit Committee eventually will be comprised solely of unrelated directors.
The Board has adopted a charter for the Audit Committee which is reviewed annually and sets out the role and oversight responsibilities of the Audit Committee with respect to:
| · | its relationship with and expectation of the external auditors, including the establishment of the independence of the external auditor and the approval of any non-audit mandates of the external auditor; |
| · | determination of which non-audit services the external auditor is prohibited from providing; |
| · | the engagement, evaluation, remuneration, and termination of the external auditors; |
| · | appropriate funding for the payment of the |
| · | its relationship with and expectation of the internal auditor; |
| · | its oversight of internal control; |
| · | disclosure of financial and related information; and |
| · | any other matter that the Audit Committee feels is important to its mandate or that which the Board chooses to delegate to it. |
Compensation Committee
The Compensation Committee recommends to the Board the compensation of the Company'sCompany’s directors and the Chief Executive Officer which the Compensation Committee feels is suitable. Its recommendations are reached primarily by comparison of the remuneration paid by the Company with publicly available information on remuneration paid by other reporting issuers that the Compensation Committee feels are similarly placed within the same business of the Company.
The Compensation Committee consists of three directors (Messrs. Robertson, Andrews and Kaplan), all of whom are considered independent.
D. Employees
As at January 31, 2016,2019, the Company hashad no employees. The Company'sCompany’s senior management as well as administrative and corporate services are located in Canada; however, these people are not considered employees of the Company in a legal sense.Company. Senior management and administrative staff are contracted by the Company through their companies or through the Company'sCompany’s cost sharing agreement for overhead and corporate services with Oniva.
E. Share Ownership
The following table sets out the share ownership of the individuals referred to in "Compensation"“Compensation” as of June 8, 2016:May 27, 2019:
Name of Beneficial Owner |
| Number of Shares |
| Percent |
|
| Number of Shares |
| Percent |
| ||||||
Chris Sampson |
| 266,300 |
| * |
| |||||||||||
|
|
|
|
|
| |||||||||||
Ronald Andrews |
| 179,500 |
| * |
|
| 821,500 |
| 1.72 | % | ||||||
Gary Robertson |
| 1,051,100 |
| 2.20 | % |
| 1,603,550 |
| 3.36 | % | ||||||
Russell Price |
| Nil |
| * |
| |||||||||||
David Wolfin |
| 4,315,300 |
| 9.02 | % |
| 16,789,984 |
| 35.20 | % | ||||||
Andrew Kaplan |
| 200,000 |
| * |
|
| 575,000 |
| 1.20 | % | ||||||
Malcolm Davidson |
| - |
| N/A |
| |||||||||||
Nathan Harte |
| 5,000 |
| * |
| |||||||||||
__________________
*Less than one percent
Outstanding Options
The following information, as of June 8, 2016,May 27, 2019, reflects outstanding options held by the individuals referred to in "Compensation"“Compensation”:
|
| No. of Shares |
| Date of Grant |
| Exercise Price |
| Expiration Date |
|
| No. of Shares |
|
| Date of Grant |
| Exercise Price |
|
| Expiration Date | |||||||
|
|
|
|
|
|
|
|
|
|
|
|
|
|
|
|
| ||||||||||
David Wolfin |
| 300,000 |
| Feb 22, 2012 |
| $ | 0.40 |
| Feb 22, 2017 |
| 500,000 |
| Sept 4, 2018 |
| $ | 0.38 |
| Sept 4, 2023 | ||||||||
President, CEO and Director |
| 220,000 |
| Oct. 12, 2012 |
| $ | 0.30 |
| Oct. 12, 2017 |
| 600,000 |
| July 5, 2017 |
| $ | 0.355 |
| July 5, 2022 | ||||||||
|
| 600,000 |
| Mar. 14, 2014 |
| $ | 0.24 |
| Mar. 14, 2019 |
|
|
|
|
|
|
|
| |||||||||
|
|
|
|
|
|
|
|
| ||||||||||||||||||
Malcolm Davidson |
| 75,000 |
| Feb 22, 2012 |
| $ | 0.40 |
| Feb 22, 2017 | |||||||||||||||||
Nathan Harte |
| 40,000 |
| Sept 4, 2018 |
| $ | 0.38 |
| Sept 4, 2023 | |||||||||||||||||
CFO |
| 40,000 |
| Oct. 12, 2012 |
| $ | 0.30 |
| Oct. 12, 2017 |
| 25,000 |
| July 5, 2017 |
| $ | 0.355 |
| July 5, 2022 | ||||||||
|
| 100,000 |
| Mar. 14, 2014 |
| $ | 0.24 |
| Mar. 14, 2019 | |||||||||||||||||
|
|
|
|
|
|
|
|
| ||||||||||||||||||
Chris Sampson |
| 75,000 |
| Feb 22, 2012 |
| $ | 0.40 |
| Feb 22, 2017 | |||||||||||||||||
Director |
| 40,000 |
| Oct. 12, 2012 |
| $ | 0.30 |
| Oct. 12, 2017 | |||||||||||||||||
|
| 50,000 |
| Mar. 14, 2014 |
| $ | 0.24 |
| Mar. 14, 2019 | |||||||||||||||||
|
|
|
|
|
|
|
|
|
|
|
|
|
|
|
|
| ||||||||||
Ronald Andrews |
| 75,000 |
| Feb 22, 2012 |
| $ | 0.40 |
| Feb 22, 2017 |
| 100,000 |
| Sept 4, 2018 |
| $ | 0.38 |
| Sept 4, 2023 | ||||||||
Director |
| 40,000 |
| Oct. 12, 2012 |
| $ | 0.30 |
| Oct. 12, 2017 |
| 200,000 |
| July 5, 2017 |
| $ | 0.355 |
| July 5, 2022 | ||||||||
|
| 100,000 |
| Mar. 14, 2014 |
| $ | 0.24 |
| Mar. 14, 2019 |
|
|
|
|
|
|
|
| |||||||||
|
|
|
|
|
|
|
|
| ||||||||||||||||||
Gary Robertson |
| 75,000 |
| Feb 22, 2012 |
| $ | 0.40 |
| Feb 22, 2017 |
| 100,000 |
| Sept 4, 2018 |
| $ | 0.38 |
| Sept 4, 2023 | ||||||||
Director |
| 75,000 |
| Oct. 12, 2012 |
| $ | 0.30 |
| Oct. 12, 2017 |
| 250,000 |
| July 5, 2017 |
| $ | 0.355 |
| July 5, 2022 | ||||||||
|
| 100,000 |
| Mar. 14, 2014 |
| $ | 0.24 |
| Mar. 14, 2019 | |||||||||||||||||
|
|
|
|
|
|
|
|
|
|
|
|
|
|
|
|
| ||||||||||
Andrew Kaplan |
| 20,000 |
| Feb 22, 2012 |
| $ | 0.40 |
| Feb 22, 2017 |
| 100,000 |
| Sept 4, 2018 |
| $ | 0.38 |
| Sept 4, 2023 | ||||||||
Director |
| 75,000 |
| Oct. 12, 2012 |
| $ | 0.30 |
| Oct. 12, 2017 |
| 200,000 |
| July 5, 2017 |
| $ | 0.355 |
| July 5, 2022 | ||||||||
|
| 100,000 |
| Mar. 14, 2014 |
| $ | 0.24 |
| Mar. 14, 2019 |
|
|
|
|
|
|
|
| |||||||||
Russell Price Director |
| 200,000 |
| Sept 4, 2018 |
| $ | 0.38 |
| Sept 4, 2023 | |||||||||||||||||
| 26 |
| Table of Contents |
Item 7. Major Shareholders and Related Party Transactions
A. Major Shareholders
To the knowledge of the Company, it is not directly or indirectly owned or controlled by any other corporation or by the Canadian Government, or any foreign government, or by any other natural or legal person.
As of June 8, 2016,May 27, 2019, to the knowledge of the Company, no person owned more than five (5%) per cent of the outstanding shares of each class of the Company'sCompany’s voting securities other than:
Name |
| Number of Voting Securities |
| Percentage |
|
| Number of Voting Securities |
|
| Percentage |
| |||||
|
|
|
|
|
| |||||||||||
Barrick Gold Corporation |
|
| 4,150,000 |
|
|
| 8.68 | % | ||||||||
|
|
|
|
|
| |||||||||||
David Wolfin |
|
| 4,315,300 |
|
|
| 9.02 | % |
| 16,789,984 |
|
| 35.20 | % | ||
|
Related party transactions are measured at the estimated fair values of the services provided or goods received. Related party transactions not disclosed elsewhere are as follows:
a) Management transactions
Key management personnel include the members of the Board of Directors and officers of the Company, who have the authority and responsibility for planning, directing and controlling the activities of the Company. The remuneration of directors and officers during the years ended January 31, was2019, 2018, and 2017 are as follows:
|
| 2016 |
| 2015 |
| 2014 |
| |||||||||||||||||
|
|
|
|
|
|
|
|
| 2019 |
|
| 2018 |
|
| 2017 |
| ||||||||
Salaries, bonuses, fees and benefits |
|
|
|
|
|
|
|
|
|
|
|
|
|
| ||||||||||
Members of the Board of Directors |
| $ | 64,359 |
| $ | 62,835 |
| $ | 66,000 |
|
| $ | 124,500 |
| $ | 191,575 |
| $ | 72,019 |
| ||||
Other members of key management |
| 27,531 |
| 24,067 |
| 43,707 |
|
| 37,801 |
| 55,071 |
| 34,581 |
| ||||||||||
|
|
|
|
|
|
|
| |||||||||||||||||
Share-based payments |
|
|
|
|
|
|
|
|
|
|
|
|
|
| ||||||||||
Members of the Board of Directors |
| - |
| 161,500 |
| - |
|
| 219,248 |
| 400,000 |
| - |
| ||||||||||
Other members of key management |
|
| - |
|
|
| 34,000 |
|
|
| - |
|
|
| 32,480 |
|
|
| 72,000 |
|
|
| - |
|
|
| $ | 91,890 |
|
| $ | 282,402 |
|
| $ | 109,707 |
|
| $ | 414,029 |
|
| $ | 718,646 |
|
| $ | 106,600 |
|
b) In the normal course of operations the Company transacts with companies related to its directors or officers. The following amounts are receivable from a related party:
|
| January 31, 2016 |
|
| January 31, 2015 |
| ||
|
|
|
|
|
|
| ||
Levon Resources Ltd. |
| $ | - |
|
| $ | 58,903 |
|
|
| $ | - |
|
| $ | 58,903 |
|
c) In the normal course of operations, the Company transacts with companies related to its directors or officers. The following amounts are payable to related parties:
|
| January 31, 2016 |
|
| January 31, 2015 |
| ||
Directors |
| $ | 70,500 |
|
| $ | 52,500 |
|
Oniva International Services Corp. (i) |
|
| 8,401 |
|
|
| 5,514 |
|
Sampson Engineering Inc. (ii) |
|
| 1,212 |
|
|
| 1,200 |
|
Wear Wolfin Designs Inc. (iii) |
|
| - |
|
|
| 5,250 |
|
Saulnier Capital Consulting Corp.(iv) |
|
| - |
|
|
| 1,103 |
|
Frobisher Securities Ltd. (v) |
|
| 4,200 |
|
|
| 4,200 |
|
Intermark Capital Corp. (vi) |
|
| - |
|
|
| 13,125 |
|
|
| $ | 84,313 |
|
| $ | 82,892 |
|
|
| January 31, 2019 |
|
| January 31, 2018 |
| ||
Directors |
| $ | 11,250 |
|
| $ | 29,250 |
|
Oniva International Services Corp. (i) |
|
| 20,217 |
|
|
| 10,615 |
|
|
| $ | 31,467 |
|
| $ | 39,865 |
|
_________________________
| |
| |
| |
| |
| |
|
d)c) Other related party transactions
The Company has a cost-sharing agreement to reimburse Oniva International Services Corp. ("Oniva"(“Oniva”), as described in Note 1113 of the audited consolidated financial statements. The transactions with Oniva during the years ended January 31, 2019, 2018, and 2017 are summarized below:
|
| 2016 |
| 2015 |
| 2014 |
| |||||||||||||||||
|
|
|
|
|
|
|
|
| 2019 |
|
| 2018 |
|
| 2017 |
| ||||||||
Salaries and benefits |
| $ | 72,747 |
| $ | 40,640 |
| $ | 77,785 |
|
| $ | 118,361 |
| $ | 105,344 |
| $ | 91,346 |
| ||||
Office and miscellaneous |
|
| 24,176 |
|
|
| 26,035 |
|
|
| 48,489 |
|
|
| 77,443 |
|
|
| 66,663 |
|
|
| 38,260 |
|
|
| $ | 96,923 |
|
| $ | 66,675 |
|
| $ | 126,274 |
|
| $ | 195,804 |
|
| $ | 172,007 |
|
| $ | 129,606 |
|
| 27 |
| Table of Contents |
The Company has entered into a cost-sharing agreement to reimburse Oniva for a variable percentage of its overhead expenses, to reimburse 100% of its out-of-pocket expenses incurred on behalf of the Company, and to pay a percentage fee based on the total overhead and corporate expenses referred to above. David Wolfin, President & CEO, and a director of the Company, is the sole owner of Oniva. The cost sharing agreement may be terminated with one month'sone-month notice by either party.party without penalty.
Amounts receivable from a related party as at January 31, 2016 is comprisedC. Interests of $ Nil ((US$ Nil) (January 31, 2015 - US$85,453)) less an allowance for non-collection of $Nil ((US$ Nil) (January 31, 2015 - US$39,113)) due from a company related by common directors. Experts and Counsel
Amounts due are without stated terms of interest or repayment.
|
Not Applicable.
A. Consolidated Statements and Other Financial Information
|
The following financial statements of the Company are included under Item 18 to this Annual Report and include the following:
| · | Independent Auditors’ Report; |
|
| |
| · | Consolidated Statements of Financial Position as at January 31, |
| · | Consolidated Statements of Operations and Comprehensive Income (Loss) for the years ended January 31, |
| · | Consolidated Statements of Equity for the years ended January 31, |
| · | Consolidated Statements of Cash Flows for the years ended January 31, |
| · | Notes to the Consolidated Financial Statements. |
Legal Proceedings
The Company is not involved in any legal or arbitration proceedings, including those relating to bankruptcy, receivership or similar proceedings and those involving any third party, which may have, or had in the recent past, significant effects on the Company's financial position or profitability, including governmental proceedings pending or known to be contemplated.B. Significant Changes
Dividend Policy
The Company has never paid any dividends and does not intend to in the near future.
|
Except as otherwise disclosed in this annual report, there have been no material changes in our financial position, operations or cash flows since January 31, 2016.2019.
A. Offer and Listing Details
|
The following table sets forth the high and low prices expressed in Canadian dollars on the TSX-V and in United States dollars on the OTCPinkOTCQX for the Company'sCompany’s common shares for the past five years, for each quarter for the lastpast two fiscal years, and for the last six months.years.
|
| TSX-V (Canadian Dollars) |
|
| OTCPink (United States Dollars) |
| ||||||||||
Last Six Months |
| High |
|
| Low |
|
| High |
|
| Low |
| ||||
May 2016 |
|
| 0.23 |
|
|
| 0.14 |
|
|
| 0.18 |
|
|
| 0.11 |
|
April 2016 |
|
| 0.15 |
|
|
| 0.09 |
|
|
| 0.12 |
|
|
| 0.07 |
|
March 2016 |
|
| 0.12 |
|
|
| 0.08 |
|
|
| 0.09 |
|
|
| 0.05 |
|
February 2016 |
|
| 0.08 |
|
|
| 0.05 |
|
|
| 0.06 |
|
|
| 0.05 |
|
January 2016 |
|
| 0.09 |
|
|
| 0.06 |
|
|
| 0.06 |
|
|
| 0.04 |
|
December 2015 |
|
| 0.09 |
|
|
| 0.05 |
|
|
| 0.07 |
|
|
| 0.03 |
|
|
|
|
|
|
|
|
|
|
|
|
|
|
|
|
|
|
2015-2016 Quarters |
| High |
|
| Low |
|
| High |
|
| Low |
| ||||
Fourth Quarter ended January 31, 2016 |
|
| 0.10 |
|
|
| 0.06 |
|
|
| 0.08 |
|
|
| 0.03 |
|
Third Quarter ended October 31, 2015 |
|
| 0.13 |
|
|
| 0.06 |
|
|
| 0.10 |
|
|
| 0.05 |
|
Second Quarter ended July 31, 2015 |
|
| 0.13 |
|
|
| 0.06 |
|
|
| 0.10 |
|
|
| 0.04 |
|
First Quarter ended April 30, 2015 |
|
| 0.18 |
|
|
| 0.08 |
|
|
| 0.15 |
|
|
| 0.09 |
|
|
|
|
|
|
|
|
|
|
|
|
|
|
|
|
|
|
2014-2015 Quarters |
| High |
|
| Low |
|
| High |
|
| Low |
| ||||
Fourth Quarter ended January 31, 2015 |
|
| 0.20 |
|
|
| 0.11 |
|
|
| 0.15 |
|
|
| 0.10 |
|
Third Quarter ended October 31, 2014 |
|
| 0.26 |
|
|
| 0.11 |
|
|
| 0.23 |
|
|
| 0.10 |
|
Second Quarter ended July 31, 2014 |
|
| 0.26 |
|
|
| 0.17 |
|
|
| 0.24 |
|
|
| 0.15 |
|
First Quarter ended April 30, 2014 |
|
| 0.31 |
|
|
| 0.12 |
|
|
| 0.27 |
|
|
| 0.13 |
|
Last Five Fiscal Years |
| High |
|
| Low |
|
| High |
|
| Low |
| ||||
2016 |
|
| 0.18 |
|
|
| 0.05 |
|
|
| 0.15 |
|
|
| 0.03 |
|
2015 |
|
| 0.31 |
|
|
| 0.11 |
|
|
| 0.27 |
|
|
| 0.10 |
|
2014 |
|
| 0.23 |
|
|
| 0.07 |
|
|
| 0.22 |
|
|
| 0.06 |
|
2013 |
|
| 0.46 |
|
|
| 0.20 |
|
|
| 0.43 |
|
|
| 0.20 |
|
2012 |
|
| 1.09 |
|
|
| 0.30 |
|
|
| 1.13 |
|
|
| 0.35 |
|
|
| TSX-V (Canadian Dollars) |
|
| OTCQX (United States Dollars) |
| ||||||||||
For the Quarter Ended |
| High |
|
| Low |
|
| High |
|
| Low |
| ||||
January 31, 2019 |
|
| 0.44 |
|
|
| 0.34 |
|
|
| 0.34 |
|
|
| 0.26 |
|
October 31, 2018 |
|
| 0.40 |
|
|
| 0.32 |
|
|
| 0.31 |
|
|
| 0.24 |
|
July 31, 2018 |
|
| 0.40 |
|
|
| 0.34 |
|
|
| 0.31 |
|
|
| 0.16 |
|
April 30, 2018 |
|
| 0.42 |
|
|
| 0.35 |
|
|
| 0.33 |
|
|
| 0.28 |
|
|
|
|
|
|
|
|
|
|
|
|
|
|
|
|
|
|
For the Quarter Ended |
| High |
|
| Low |
|
| High |
|
| Low |
| ||||
January 31, 2018 |
|
| 0.42 |
|
|
| 0.33 |
|
|
| 0.34 |
|
|
| 0.25 |
|
October 31, 2017 |
|
| 0.37 |
|
|
| 0.34 |
|
|
| 0.30 |
|
|
| 0.26 |
|
July 31, 2017 |
|
| 0.40 |
|
|
| 0.30 |
|
|
| 0.30 |
|
|
| 0.21 |
|
April 30, 2017 |
|
| 0.38 |
|
|
| 0.29 |
|
|
| 0.29 |
|
|
| 0.22 |
|
| B. Plan of Distribution
|
Not Applicable.
|
| Table of Contents |
C. Markets
The common stockshares of the Company isare listed on the TSX-V under the symbol "CLH"“CLH”, in the United States quoted on the OTCPinkOTCQX under the symbol "CLHRF"“CLHRF” and on the FSE under the symbol "GV8"“GV8”.
| D. Selling Shareholders
|
Not applicable.
| E. Dilution
|
Not applicable.
| F. Expenses of the Issue
|
Not applicable.
Item 10. Additional Information
|
Not applicable.
| A. Share Capital Not applicable. B. Memorandum and Articles of Association
|
Carol Energy Corporation was incorporated on January 22, 1981 under the Company Act of the Province of British Columbia, which changed its name to Coral Energy Corporation on March 3, 1981. On September 9, 1987, Coral Energy Corporation changed its name to the Coral Gold Corp. On September 13, 2004, the Company changed its name to Coral Gold Resources Ltd. in conjunction with a 10:1 share consolidation.
Common Shares
All issued and outstanding common shares are fully paid and non-assessable. Each holder of record of common shares is entitled to one vote for each common share so held on all matters requiring a vote of shareholders, including the election of directors. The holders of common shares will be entitled to dividends on a pro-rata basis, if and when as declared by the board of directors. There are no preferences, conversion rights, preemptive rights, subscription rights, or restrictions or transfers attached to the common shares. In the event of liquidation, dissolution, or winding up of the Company, the holders of common shares are entitled to participate in the assets of the Company available for distribution after satisfaction of the claims of creditors.
Powers and Duties of Directors
The directors shall manage or supervise the management of the affairs and business of the Company and shall have authority to exercise all such powers of the Company as are not, by the British Columbia Business Corporations Act or by the Memorandum or Articles, required to be exercised by the Company in a general meeting.
Directors will serve as such until the next annual meeting. In general, a director who is, in any way, directly or indirectly interested in an existing or proposed contract or transaction with the Company whereby a duty or interest might be created to conflict with his duty or interest as a director, that director shall declare the nature and extent of his interest in such contract or transaction or the conflict or potential conflict with his duty and interest as a director. Such director shall not vote in respect of any such contract or transaction with the Company in which he is interested and if he shall do so, his vote shall not be counted, but he shall be counted in the quorum present at the meeting at which such vote is taken. However, notwithstanding the foregoing, directors shall have the right to vote on determining the remuneration of the directors.
| 29 |
| Table of Contents |
The directors may from time to time on behalf of the Company: (a) borrow money in such manner and amount from such sources and upon such terms and conditions as they think fit; (b) issue bonds, debentures and other debt obligations; and/or (c) mortgage, charge or give other security on the whole or any part of the property and assets of the Company.
The majority of the directors of the Company must be persons ordinarily resident in Canada and one director of the Company must be ordinarily resident in British Columbia and be of the full age of 18 years. There is no minimum share ownership to be a director. No person shall be a director of the Company who is not capable of managing their own affairs, is an un-discharged bankrupt, convicted of an offense in connection with the promotion, formation or management of a corporation or involved in fraud within the last five years, or a person that has had a registration in any capacity under the "British“British Columbia Securities Act"” or the "British“British Columbia Mortgage Brokers Act"” canceled within the last five years.
Shareholders
An annual general meeting shall be held once in every calendar year at such time and place as may be determined by the directors. A quorum at an annual general meeting and special meeting shall be two shareholders or one or more proxy holder representing two shareholders, or one shareholder and a proxy holder representing another shareholder. There is no limitation imposed by the laws of Canada or by the charter or other constituent documents of the Company on the right of a non-resident to hold or vote the common shares, other than as provided in the Investment Canada Act, (the "Investment Act"“Investment Act”) discussed below under "Item“Item 10. Additional Information, D. Exchange Controls."”
In accordance with British Columbia law, directors shall be elected by an "ordinary resolution"“ordinary resolution” which means: (a) a resolution passed by the shareholders of the Company at a general meeting by a simple majority of the votes cast in person or by proxy: or (b) a resolution that has been submitted to the shareholders of the Company who would have been entitled to vote on it in person or by proxy at a general meeting of the Company and that has been consented to in writing by such shareholders of the Company holding shares carrying not less than the requisite majority of the votes entitled to be cast on it.
Under British Columbia law certain items such as an amendment to the Company'sCompany’s Articles or entering into a merger requires approval by a special resolution which means: (a) a resolution passed by a majority of not less than the requisite majority of the votes cast by the shareholders of the Company who, being entitled to do so, vote in person or by proxy at a general meeting of the company; or (b) a resolution consented to in writing by every shareholder of the Company who would have been entitled to vote in person or by proxy at a general meeting of the Company, and a resolution so consented to is deemed to be a special resolution passed at a general meeting of the Company.
| The Company entered into an Asset Purchase Agreement dated June 20, 2016 with Barrick Cortez Inc., a subsidiary of Barrick Gold Corp., for the sale of the Robertson Property in Lander County, Nevada, to Barrick. A copy of the Agreement was filed on “SEDAR” on June 21, 2016 and is discussed in more details under the Property, Plant, and Equipment section above.
|
The Company entered into a cost sharing agreement dated October 1, 1997 and amended November 1, 2003 to reimburse Oniva International for a variable percentage of Oniva'sOniva’s overhead expenses, to reimburse 100% of Oniva'sOniva’s out-of-pocket expenses incurred on behalf of the company, and to pay to Oniva a percentage fee based on the total overhead and corporate expenses. The agreement may be terminated with one month notice by either party.
| D. Exchange Controls
|
Canada has no system of exchange controls. There are no Canadian restrictions on the repatriation of capital or earnings of a Canadian public company to non-resident investors. There are no laws in Canada or exchange restrictions affecting the remittance of dividends, profits, interest, royalties and other payments to non-resident holders of the Issuer'sIssuer’s securities, except as discussed below under "Item“Item 10. Additional Information, E. Taxation."”
| 30 |
| Table of Contents |
There are no limitations under the laws of Canada or in the organizing documents of the Company on the right of foreigners to hold or vote securities of the Company, except that the Investment Canada Act may require review and approval by the Minister of Industry (Canada) of certain acquisitions of "control"“control” of the Company by a "non-Canadian"“non-Canadian”. The threshold for acquisitions of control is generally defined as being one-third or more of the voting shares of the Company. "Non-Canadian"“Non-Canadian” generally means an individual who is not a Canadian citizen, or a corporation, partnership, trust or joint venture that is ultimately controlled by non-Canadians.
| E. Taxation Canadian Federal Income Tax Consequences
|
The following summarizes the principal Canadian federal income tax consequences applicable to the holding and disposition of common shares in the capital of the Company by a United States resident, and who holds common shares solely as capital property, referred to as a "U.S. Holder"“U.S. Holder”. This summary is based on the current provisions of the Income Tax Act (Canada) (the "Tax Act"“Tax Act”), the regulations thereunder, all amendments thereto publicly proposed by the government of Canada, the published administrative practices of Revenue Canada, Customs, Excise and Taxation, and on the current provisions of the Canada Canada‑United States Income Tax Convention, 1980, as amended, referred to as the "Treaty"“Treaty”. Except as otherwise expressly provided, this summary does not take into account any provincial, territorial or foreign (including without limitation, any U.S.) tax law or treaty. It has been assumed that all currently proposed amendments will be enacted substantially as proposed and that there is no other relevant change in any governing law or practice, although no assurance can be given in these respects.
Each U.S. Holder is advised to obtain tax and legal advice applicable to such U.S. Holder'sHolder’s particular circumstances.
Every U.S. Holder is liable to pay a Canadian withholding tax on every dividend that is or is deemed to be paid or credited to the U.S. Holder on the U.S. Holder'sHolder’s common shares. The statutory rate of withholding tax is 25% of the gross amount of the dividend paid. The Treaty reduces the statutory rate with respect to dividends paid to a U.S. Holder for the purposes of the Treaty. Where applicable, the general rate of withholding tax under the Treaty is 15% of the gross amount of the dividend, but if the U.S. Holder is a company that owns at least 10% of the voting stock of the Company and beneficially owns the dividend, the rate of withholding tax is 5% for dividends paid or credited after 1996 to such corporate U.S. Holder. The Company is required to withhold the applicable tax from the dividend payable to the U.S. Holder, and to remit the tax to the Receiver General of Canada for the account of the U.S. Holder.
Pursuant to the Tax Act, a U.S. Holder will not be subject to Canadian capital gains tax on any capital gain realized on an actual or deemed disposition of a common share, including a deemed disposition on death, provided that the U.S. Holder did not hold the common share as capital property used in carrying on a business in Canada, and that neither the U. S. Holder nor persons with whom the U.S. Holder did not deal at arm'sarm’s length (alone or together) owned or had the right or an option to acquire 25% or more of the issued shares of any class of the Company at any time in the five years immediately preceding the disposition.
United States Federal Income Tax Consequences
The following is a general summary of certain material U.S. federal income tax considerations applicable to a U.S. Holder (as defined below) arising from the ownership and disposition of the common shares. This summary applies only to U.S. Holders who hold common shares as capital assets (generally, property held for investment).
This summary is for general information purposes only and does not purport to be a complete analysis or listing of all potential U.S. federal income tax considerations that may apply to a U.S. Holder as a result of the ownership and disposition of common shares. In addition, this summary does not take into account the individual facts and circumstances of any particular U.S. Holder that may affect the U.S. federal income tax consequences to such U.S. Holder, including specific tax consequences to a U.S. Holder under an applicable tax treaty. Accordingly, this summary is not intended to be, and should not be construed as, legal or U.S. federal income tax advice with respect to any particular U.S. Holder. In addition, this summary does not address the U.S. federal alternative minimum, U.S. federal estate and gift, U.S. Medicare contribution, U.S. state and local, or non-U.S. tax consequences of the acquisition, ownership or disposition of common shares. Except as specifically set forth below, this summary does not discuss applicable tax reporting requirements. Each U.S. Holder should consult its own tax advisor regarding all U.S. federal, U.S. state and local and non-U.S. tax consequences of the ownership and disposition of common shares.
| 31 |
| Table of Contents |
No opinion from U.S. legal counsel or ruling from the Internal Revenue Service (the “IRS”) has been requested, or will be obtained, regarding the U.S. federal income tax consequences of the ownership or disposition of common shares. This summary is not binding on the IRS, and the IRS is not precluded from taking a position that is different from, and contrary to, any position taken in this summary. In addition, because the authorities upon which this summary is based are subject to various interpretations, the IRS and the U.S. courts could disagree with one or more of the positions taken in this summary.
Passive Foreign InvestmentScope of This Disclosure
Authorities This summary is based on the Internal Revenue Code of 1986, as amended (the “Code”), Treasury Regulations (whether final, temporary, or proposed), published rulings of the IRS, published administrative positions of the IRS, the Convention Between Canada and the United States of America with Respect to Taxes on Income and on Capital, signed September 26, 1980, as amended (the “Canada-U.S. Tax Convention”), and U.S. court decisions that are applicable and, in each case, as in effect and available, as of the date hereof. Any of the authorities on which this summary is based could be changed in a material and adverse manner at any time, and any such change could be applied on a retroactive or prospective basis which could affect the U.S. federal income tax considerations described in this summary. This summary does not discuss the potential effects, whether adverse or beneficial, of any proposed legislation that, if enacted, could be applied on a retroactive or prospective basis.
U.S. Holders. For purposes of this summary, the term “U.S. Holder” means a beneficial owner of common shares that is for U.S. federal income tax purposes:
· | An individual who is a citizen or resident of the U.S.; | |
· | A corporation (or other entity taxable as a corporation for U.S. federal income tax purposes) created or organized in or under the laws of the U.S., any state thereof or the District of Columbia; | |
· | An estate the income of which is subject to U.S. federal income taxation regardless of its source; or | |
· | A trust that (a) is subject to the primary supervision of a court within the U.S. and the control of one or more U.S. persons for all substantial decisions or (b) has a valid election in effect under applicable Treasury Regulations to be treated as a U.S. person. |
Non-U.S. Holders. For purposes of this summary, a “non-U.S. Holder” is a beneficial owner of common shares that is not a partnership (or other “pass-through” entity) for U.S. federal income tax purposes and is not a U.S. Holder. This summary does not address the U.S. federal income tax considerations applicable to non-U.S. Holders arising from the ownership or disposition of common shares.
Accordingly, a non-U.S. Holder should consult its own tax advisor regarding all U.S. federal, U.S. state and local, and non-U.S. tax consequences (including the potential application of and operation of any income tax treaties) relating to the purchase of the common shares pursuant to the Offering and the ownership or disposition of common shares.
U.S. Holders Subject to Special U.S. Federal Income Tax Rules Not Addressed
This summary does not address the U.S. federal income tax considerations of ownership or disposition of common shares by U.S. Holders that are subject to special provisions under the Code, including, but not limited to, the following: (a) tax-exempt organizations, qualified retirement plans, individual retirement accounts, or other tax-deferred accounts; (b) financial institutions, underwriters, insurance companies, real estate investment trusts, or regulated investment companies; (c) broker-dealers, dealers, or traders in securities or currencies that elect to apply a “mark-to-market” accounting method; (d) U.S. Holders that have a “functional currency” other than the U.S. dollar; (e) U.S. Holders that own common shares as part of a straddle, hedging transaction, conversion transaction, constructive sale, or other arrangement involving more than one position; (f) U.S. Holders that acquire common shares in connection with the exercise of employee stock options or otherwise as compensation for services; (g) U.S. Holders that hold common shares other than as a capital asset within the meaning of Section 1221 of the Code (generally, property held for investment purposes); (h) U.S. Holders that own directly, indirectly, or by attribution, 10% or more, by voting power or value, of the outstanding stock of the Company; and (i) U.S. Holders subject to Section 451(b) of the Code. This summary also does not address the U.S. federal income tax considerations applicable to U.S. Holders who are: (a) U.S. expatriates or former long-term residents of the U.S.; (b) persons that have been, are, or will be a resident or deemed to be a resident in Canada for purposes of the Tax Act; (c) persons that use or hold, will use or hold, or that are or will be deemed to use or hold common shares in connection with carrying on a business in Canada; (d) persons whose common shares constitute “taxable Canadian property” under the Tax Act; or (e) persons that have a permanent establishment in Canada for purposes of the Canada-U.S. Tax Convention. U.S. Holders that are subject to special provisions under the Code, including U.S. Holders described immediately above, should consult their own tax advisors regarding all U.S. federal, U.S. state and local, and non-U.S. tax consequences (including the potential application and operation of any income tax treaties) relating to the acquisition, ownership, or disposition of common shares.
| 32 |
| Table of Contents |
If an entity or arrangement that is classified as a partnership (or other “pass-through” entity) for U.S. federal income tax purposes holds common shares, the U.S. federal income tax consequences to such partnership and the partners (or other owners) of such partnership of the ownership, or disposition of the common shares generally will depend on the activities of the partnership and the status of such partners (or other owners). This summary does not address the U.S. federal income tax consequences for any such partner or partnership (or other “pass-through” entity or its owners). Owners of entities and arrangements that are classified as partnerships (or other “pass-through” entities) for U.S. federal income tax purposes should consult their own tax advisors regarding the U.S. federal income tax consequences of the ownership or disposition of common shares.
Sale or Other Taxable Disposition of Common Shares
Subject to the PFIC rules discussed below, upon the sale or other taxable disposition of common shares, a U.S. Holder generally will recognize a capital gain or loss in an amount equal to the difference between the amount of cash plus the fair market value of any property received and such U.S. Holder’s tax basis in the common shares sold or otherwise disposed of. Such capital gain or loss will generally be a long-term capital gain or loss if, at the time of the sale or other taxable disposition, the U.S. Holder’s holding period for the common shares is more than one year. Preferential tax rates apply to long-term capital gains of non-corporate U.S. Holders. Deductions for capital losses are subject to significant limitations under the Code. A U.S. Holder’s tax basis in common shares generally will be such U.S. Holder’s U.S. dollar cost for such common shares.
PFIC Status of the Company
The Company believes thathas not performed an analysis of whether or not it will be deemed a PFIC for its current taxable year. If the Company is or becomes a passive foreign investment company (a "PFIC") for United StatesPFIC, the foregoing description of the U.S. federal income tax purposes with respectconsequences to a United States Investor. The CompanyU.S. Holders of the acquisition, ownership and disposition of Common Shares will be different. The U.S. federal income tax consequences of owning and disposing of common shares if the Company is or becomes a PFIC with respect toare described below under the heading “Tax Consequences if the Company is a United States Investor if,PFIC.”
A non-U.S. corporation is a PFIC for any taxableeach tax year in which such United States Investor held the Company's shares, either (i) at least 75 %75% or more of theits gross income of the Company for the taxable year is passive income (as defined for U.S. federal income tax purposes) (the “income test”) or (ii) at least 50% or more (by value) of its assets (based on an average of the Company'squarterly values of the assets are attributable to assets thatduring such tax year) either produce or are held for the production of passive income. In each case, the Company must take into account a pro rata shareincome (the “asset test”). For purposes of the PFIC provisions, “gross income” generally includes sales revenues less cost of goods sold, plus income from investments and the assets of any company in which the Company owns, directlyfrom incidental or indirectly, 25%other operations or more of the stock by value (the "look-through" rules). Passive incomesources, and “passive income” generally includes dividends, interest, royalties, rents (other thancertain rents and royalties, derivedcertain gains from commodities or securities transactions and the excess of gains over losses from the active conductdisposition of certain assets which product passive income. If a non-U.S. corporation owns at least 25% (by value) of the stock of another corporation, the non-U.S. corporation is treated, for purposes of the income test and asset test, as owning its proportionate share of the assets of the other corporation and as receiving directly its proportionate share of the other corporation’s income.
Under certain attribution and indirect ownership rules, if the Company is a PFIC, U.S. Holders will generally be deemed to own their proportionate share of the Company’s direct or indirect equity interest in any company that is also a PFIC (a “Subsidiary PFIC”), and will be subject to U.S. federal income tax on their proportionate share of (a) any “excess distributions,” as described below, on the stock of a tradeSubsidiary PFIC and (b) a disposition or business and not derived fromdeemed disposition of the stock of a related person), annuities, and gains from assets that produce passive income. As a publicly traded corporation,Subsidiary PFIC by the Company would applyor another Subsidiary PFIC, both as if such U.S. Holders directly held the 50% asset test basedshares of such Subsidiary PFIC. In addition, U.S. Holders may be subject to U.S. federal income tax on any indirect gain realized on the valuestock of a Subsidiary PFIC on the sale or disposition of common shares. Accordingly, U.S. Holders should be aware that they could be subject to tax even if no distributions are received and no redemptions or other dispositions of the Company's assets.
Because the Company believes it qualifies as a PFIC, unless a United States Investor who ownsCompany’s common shares in the Company (i) elects (a section 1295 election) to have the Company treated as a "qualified electing fund", referred to as a "QEF" (described below), or (ii) marks the stock to market (described below), the following rules apply:are made.
| Table of Contents |
The determination of PFIC status is inherently factual, is subject to a number of uncertainties, and can be determined only annually at the close of the tax year in question. Additionally, the analysis depends, in part, on the application of complex U.S. federal income tax rules, which are subject to differing interpretations. There can be no assurance that the Company will or will not be determined to be a PFIC for the current tax year or any prior or future tax year, and no opinion of legal counsel or ruling from the IRS concerning the status of the Company as a PFIC has been obtained or will be requested. U.S. Holders should consult their own U.S. tax advisors regarding the PFIC status of the Company.
Tax Consequences if the Company is a PFIC
If the Company is a PFIC for any tax year during which a U.S. Holder holds common shares, special rules may increase such U.S. Holder’s U.S. federal income tax liability with respect to the ownership and disposition of such common shares. If the Company is a PFIC for any tax year during which a U.S. Holder owns common shares, the Company will be treated as a PFIC with respect to such U.S. Holder for that tax year and for all subsequent tax years, regardless of whether the Company meets the income test or the asset test for such subsequent tax years, unless the U.S. Holder makes a “deemed sale” election with respect to the common shares. If the election is made, the U.S. Holder will be deemed to sell the common shares it holds at their fair market value on the last day of the last taxable year in which we qualified as a PFIC, and any gain recognized from such deemed sale would be taxed under the PFIC excess distribution regime. After the deemed sale election, the U.S. Holder’s common shares would not be treated as shares of a PFIC unless the Company subsequently becomes a PFIC. U.S. Holders should consult their own U.S. tax advisors regarding the availability and desirability of a deemed sale election.
Under the default PFIC rules:
| Any gain realized on the | |
· | The | |
· | The amount allocated to each of the other tax years | |
· | An interest charge |
A U.S. Holder that makes a timely and effective “mark-to-market” election under Section 1296 of the Code (a “Mark-to-Market Election”) or a timely and effective election to treat the Company and each Subsidiary PFIC as a “qualified electing fund” (a “QEF”) under Section 1295 of the Code (a “QEF Election”) may generally mitigate or avoid the default PFIC rules described above with respect to common shares U.S. Holders should be aware that there can be no assurance that the Company has satisfied or will satisfy the recordkeeping requirements that apply to a QEF or that the Company has supplied or will supply U.S. Holders with information such U.S. Holders require to report under the QEF rules in the event that the Company is a PFIC for any tax year.
| 34 |
| Table of Contents |
A shareholder that makestimely and effective QEF Election requires a section 1295 election will beU.S. Holder to include currently taxable on his or herin gross income each year its pro rata share of the Company'sCompany’s ordinary earnings and net capital gain (at ordinary income and capital gains, rates, respectively) for each taxable year of the Company, regardless of whether such earnings and gains are actually distributed. Thus, a U.S. Holder could have a tax liability with respect to such ordinary earnings or not distributions were received. The shareholder'sgains without a corresponding receipt of cash from the Company. If the Company is a QEF with respect to a U.S. Holder, the U.S. Holder’s basis in his or herthe common shares will be increased to reflect the amount of the taxed but undistributed income. Distributions of income that had previously been taxed will result in a corresponding reduction of basis in the common shares and will not be taxed again as a distribution to a U.S. Holder. Taxable gains on the shareholder.
disposition of common shares by a U.S. Holder that has made a timely and effective QEF Election are generally capital gains. A shareholder mayU.S. Holder must make a section 1295 election with respect to a PFIC for any taxable year of the shareholder (a "shareholder's election year"). A section 1295 election is effectiveQEF Election for the shareholder's electionCompany and each Subsidiary PFIC if it wishes to have this treatment. To make a QEF Election, a U.S. Holder will need to have an annual information statement from the Company setting forth the ordinary earnings and net capital gains for the year and all subsequent taxable years of the shareholder. Procedures exist for both retroactive elections and filing of protective statements. Once a section 1295 election is made it remains in effect, although not applicable, during those years that the Company ismay not a PFIC. Therefore, if the Company re qualifies as a PFIC, the section 1295 election previously made is still valid and the shareholder is required to satisfy the requirements of that election. Once a shareholder makes a section 1295 election, the shareholder may revoke the election only with the consent of the Commissioner.
If the shareholder makes the section 1295 election for the first tax year of the Company as a PFIC that is includedprovide this statement, in the shareholder's holding period, the PFIC qualifies as a pedigreed QEF with respect to the shareholder. Ifwhich case a QEF is an unpedigreed QEF with respect to the shareholder, the shareholder is subject to both the non-QEF and QEF regimes. Certain elections are available which enable shareholders to convert an unpedigreed QEF intoElection cannot be made. In general, a pedigreed QEF thereby avoiding such dual application.
A shareholder making the section 1295 electionU.S. Holder must make the electiona QEF Election on or before the due date as extended, for filing the shareholder'sits income tax return for the first taxable year to which the electionQEF Election will apply. A shareholderUnder applicable Treasury Regulations, a U.S. Holder will be permitted to make retroactive elections in particular, but limited, circumstances, including if it had a reasonable belief that the Company was not a PFIC and did not file a protective election. If a U.S. Holder owns PFIC stock indirectly through another PFIC, separate QEF Elections must make a section 1295 election by completing Form 8621, attaching said Form to its federal income tax return, and reflecting in the Form the information provided inbe made for the PFIC Annual Information Statement or ifin which the U.S. Holder is a direct shareholder calculatedand the financial information, a statement to that effect. The PFIC Annual Information Statement must include the shareholder's pro rata shares of the ordinary earnings and net capital gain of theSubsidiary PFIC for the PFIC's taxableQEF rules to apply to both PFICs.
Each U.S. Holder should consult its own tax advisor regarding the availability and desirability of, and procedure for, making a timely and effective QEF Election (including a “pedigreed” QEF election where necessary) for the Company and any Subsidiary PFIC.
Alternatively, a Mark-to-Market Election may be made with respect to “marketable stock” in a PFIC if which is stock that is “regularly traded” on a “qualified exchange or other market” (within the meaning of the Code and the applicable U.S. Treasury Regulations). A class of stock that is traded on one or more qualified exchanges or other markets is considered to be “regularly traded” for any calendar year or information thatduring which such class of stock is traded in other than de minimis quantities on at least 15 days during each calendar quarter. If the common shares are considered to be “regularly traded” within this meaning, then a U.S. Holder generally will enable the shareholderbe eligible to calculatemake a Mark-to-Market Election with respect to its pro ratacommon shares. In addition, the PFIC Annual Information Statement must contain information about distributions to shareholders and a statementHowever, there is no assurance that the PFICcommon shares will permitbe or remain “regularly traded” for this purpose. A Mark-to-Market Election may not be made with respect to the shareholderstock of any Subsidiary PFIC. Hence, a Mark-to-Market Election will not be effective to inspect and copy its permanent books of account, records, and other documentseliminate the application of the default PFIC necessaryrules, described above, with respect to determine that the ordinary earnings and net capital gaindeemed dispositions of theSubsidiary PFIC have been calculated according to federal income tax accounting principles. A shareholder may also obtain the books, records and other documents of the foreign corporation necessary for the shareholder to determine the correct earnings and profits and net capital gain of the PFIC according to federal income tax principles and calculate the shareholder's pro rata shares of the PFIC's ordinary earnings and net capital gain. In that case, the PFIC must include a statement in its PFIC Annual Information Statement that it has permitted the shareholder to examine the PFIC's books of account, records, and other documents necessary for the shareholder to calculate the amounts of ordinary earnings and net capital gain. A shareholder that makes a Section 1295 electionstock, or excess distributions with respect to a PFIC held directly or indirectly, forSubsidiary PFIC.
A U.S. Holder that makes a timely and effective Mark-to-Market Election with respect to common shares generally will be required to recognize as ordinary income in each taxabletax year toin which the Section 1295 election applies, must comply with the foregoing submissions.
Because the Company's stockCompany is "marketable" under section 1296(e), a U.S. Investor may elect to mark the stock to market each year. In general, a PFIC shareholder who elects under section 1296 to mark the marketable stock of a PFIC includes in income each year an amount equal to the excess, if any, of the fair market value of the PFIC stocksuch shares as of the close of thesuch taxable year over the shareholder'sU.S. Holder’s adjusted tax basis in such stock. A shareholder is also generally allowed a deduction for the excess, if any, of the adjusted basis of the PFIC stock over the fair market valueshares as of the close of thesuch taxable year. Deductions under this rule, however, are allowableA U.S. Holder’s adjusted tax basis in the common shares generally will be increased by the amount of ordinary income recognized with respect to such shares. If the U.S. Holder’s adjusted tax basis in the common shares as of the close of a tax year exceeds the fair market value of such shares as of the close of such taxable year, the U.S. Holder generally will recognize an ordinary loss, but only to the extent of net mark-to-market income recognized with respect to such shares for all prior taxable years. A U.S. Holder’s adjusted tax basis in its common shares generally will be decreased by the amount of ordinary loss recognized with respect to such shares. Any gain recognized upon a disposition of the common shares generally will be treated as ordinary income, and any loss recognized upon a disposition generally will be treated as an ordinary loss to the extent of net markmark-to-market income recognized for all prior taxable years. Any loss recognized in excess thereof will be taxed as a capital loss. Capital losses are subject to market gainssignificant limitations under the Code.
Each U.S. Holder should consult its own tax advisor regarding the availability and desirability of, and procedure for, making a timely and effective Mark-to-Market Election with respect to the stock included by the shareholder for prior taxable years. While the interest charge regime under the PFIC rules generally does not apply to distributions from and dispositions of stock of a PFIC where the U.S. Investor has marked to market, coordination rules for limited application will apply in the case of a U.S. Investor that marks to market PFIC stock later than the beginning of the shareholder's holding period for the PFIC stock.
Special rules apply with respect to the calculation of the amount of the foreign tax credit with respect to excess distributions by a PFIC or inclusions under a QEF.
Controlled Foreign Corporation.
Sections 951 through 964 and Section 1248 of the Internal Revenue Code (the "Code") relate to controlled foreign corporations, referred to as "CFCs". A foreign corporation that qualifies as a CFC will not be treated as a PFIC with respect to a shareholder during the portion of the shareholder's holding period after December 31, 1997, during which the shareholder is a 10% United States shareholder and the corporation is a CFC. The PFIC provisions continue to apply in the case of PFIC that is also a CFC with respect to shareholders that are less than 10% United States shareholders.
The 10% United States shareholders of a CFC are subject to current United States tax on their pro rata shares of certain income of the CFC and their pro rata shares of the CFC's earnings invested in certain United States property. The effect is that the CFC provisions may impute some portion of such a corporation's undistributed income to certain shareholders on a current basis and convert into dividend income some portion of gains on dispositions of stock, which would otherwise qualify for capital gains treatment.
The Company does not believe that it is not and will not be a CFC. It is possible that the Company could become a CFC in the future. Even if the Company were classified as a CFC in a future year, however, the CFC rules referred to above would apply only with respect to 10% shareholders.common shares.
| 35 |
| Table of Contents |
Personal Holding Company/Foreign Personal Holding Company/Foreign Investment CompanyTax Credit
A corporation will be classified as a personal holding company (a "PHC") if at any time during the last half of a tax year (i) five or fewer individuals (without regard to their citizenship or residence)U.S. Holder that pays (whether directly or indirectlythrough withholding) Canadian income tax in connection with the ownership or by attribution own more than 50% in valuedisposition of common shares may (under certain circumstances) be entitled to receive either a deduction or a credit for such Canadian income tax paid generally at the corporation's stock and (ii) at least 60%election of its ordinary gross income, as specially adjusted, consists of personal holding company income (defined generally to include dividends, interest, royalties, rents and certain other types of passive income). A PHC is subject tosuch U.S. Holder. Generally, a United Statescredit will reduce a U.S. Holder’s U.S. federal income tax of 39.6%liability on its undistributed personal holding companya dollar-for-dollar basis, whereas a deduction will reduce a U.S. Holder’s income (generally limited, insubject to U.S. federal income tax. This election is made on a year-by-year basis and applies to all creditable foreign taxes paid (whether directly or through withholding) by a U.S. Holder during a year.
Complex limitations apply to the caseforeign tax credit, including the general limitation that the credit cannot exceed the proportionate share of a foreign corporation,U.S. Holder’s U.S. federal income tax liability that such U.S. Holder’s “foreign source” taxable income bears to United States source income).
A corporation willsuch U.S. Holder’s worldwide taxable income. In applying this limitation, a U.S. Holder’s various items of income and deduction must be classified, under complex rules, as either “foreign source” or “U.S. source.” Generally, dividends paid by a non-U.S. corporation should be treated as foreign personal holding company (an "FPHC")source for this purpose, and not a PHC if at any time during a tax year (i) five or fewer individual United States citizens or residents directly or indirectly or by attribution own more than 50% of the total combined voting power or value of the corporation's stock and (ii) at least 60% of its gross income consists of foreign personal holding company income (defined generally to include dividends, interest, royalties, rents and certain other types of passive income). Each United States shareholder in a FPHC is required to include in gross income, as a dividend, an allocable share of the FPHC's undistributed foreign personal holding company income (generally the taxable income of the FPHC, as specially adjusted).
A corporation will be classified as a foreign investment company (an "FIC") if for any taxable year it: (i) is registered under the Investment Company Act of 1940, as amended, as a management company or share investment trust or is engaged primarily in the business of investing or trading in securities or commodities (or any interest therein); and (ii) 50% or more of the value or the total combined voting power of all the corporation's stock is owned directly or indirectly (including stock owned through the application of attribution rules) by United States persons. In general, unless an FIC elects to distribute 90% or more of its taxable income (determined under United States tax principles as specially adjusted) to its shareholders, gaingains recognized on the sale or exchange of FIC stocksecurities of a non-U.S. corporation by a U.S. Holder should be treated as U.S. source for this purpose, except as otherwise provided in an applicable income tax treaty and if an election is properly made under the Code. However, the amount of a distribution with respect to the common shares that is treated as ordinarya “dividend” may be lower for U.S. federal income (rathertax purposes than capital gain)it is for Canadian federal income tax purposes, resulting in a reduced foreign tax credit allowance to a U.S. Holder. In addition, this limitation is calculated separately with respect to specific categories of income. The foreign tax credit rules are complex, and each U.S. Holder should consult its own U.S. tax advisor regarding the foreign tax credit rules.
Special rules apply to the extentamount of foreign tax credit that a U.S. Holder may claim on a distribution, including a constructive distribution, from a PFIC. Subject to such shareholder's ratable sharespecial rules, non-U.S. taxes paid with respect to any distribution in respect of the corporation's earnings and profitsstock in a PFIC are generally eligible for the period during which such stock was held.
foreign tax credit. The Company believes that it is notrules relating to distributions by a PFIC and will not betheir eligibility for the foreign tax credit are complicated, and a PHC, FPHC or FIC. However, no assurance can be given asU.S. Holder should consult its own tax advisor regarding their application to the Company's future status.U.S. Holder.
U.S. Information Reporting and Backup Withholding
Dividends are generally subject to the information reporting requirementsReceipt of the Code. Dividends may be subject to backup withholding at the rate of 31% unless the holder provides a taxpayer identification number on a properly completed Form W-9 or otherwise establishes an exemption.Foreign Currency
The amount of any distribution or proceeds paid in Canadian dollars to a U.S. Holder in connection with the ownership of common shares, or on the sale or other taxable disposition of common shares will be included in the gross income of a U.S. Holder as translated into U.S. dollars calculated by reference to the exchange rate prevailing on the date of actual or constructive receipt of the payment, regardless of whether the Canadian dollars are converted into U.S. dollars at that time. If the Canadian dollars received are not converted into U.S. dollars on the date of receipt, a U.S. Holder will have a basis in the Canadian dollars equal to their U.S. dollar value on the date of receipt. Any U.S. Holder who receives payment in Canadian dollars and engages in a subsequent conversion or other disposition of the Canadian dollars may have a foreign currency exchange gain or loss that would generally be treated as ordinary income or loss, and generally will be U.S. source income or loss for foreign tax credit purposes. Different rules apply to U.S. Holders who use the accrual method with respect to foreign currency.
Each U.S. Holder should consult its own U.S. tax advisor regarding the U.S. federal income tax consequences of receiving, owning, and disposing of Canadian dollars.
Information Reporting; Backup Withholding
Under U.S. federal income tax law, certain categories of U.S. Holders must file information returns with respect to their investment in, or involvement in, a non-U.S. corporation. For example, U.S. return disclosure obligations (and related penalties) are imposed on individuals who are U.S. Holders that hold certain specified foreign financial assets in excess of certain threshold amounts. The definition of “specified foreign financial assets” includes not only financial accounts maintained in non-U.S. financial institutions, but also, if held for investment and not in an account maintained by certain financial institutions, any stock or security issued by a non-U.S. person, any financial instrument or contract that has an issuer or counterparty other than a U.S. person and any interest in a non-U.S. entity. A U.S. Holder may be subject to these reporting requirements unless such U.S. Holder’s common shares are held in an account at certain financial institutions. Penalties for failure to file certain of these information returns are substantial. U.S. Holders should consult with their own tax advisors regarding the requirements of filing information returns on IRS Form 8938, and, if applicable, filing obligations relating to the PFIC rules, including possible reporting on an IRS Form 8621.
Payments made within the U.S. or by a U.S. payor or U.S. middleman of (a) distributions on the common shares, and (b) proceeds arising from the sale or other taxable disposition of common shares generally will be subject to information reporting. In addition, backup withholding, willcurrently at a rate of 24%, may apply to such payments if a U.S. Holder (a) fails to furnish such U.S. Holder’s correct U.S. taxpayer identification number (generally on IRS Form W-9), (b) furnishes an incorrect U.S. taxpayer identification number, (c) is notified by the IRS that such U.S. Holder has previously failed to properly report items subject to backup withholding, or (d) fails to certify, under penalty of perjury, that such U.S. Holder has furnished its correct U.S. taxpayer identification number and that the IRS has not constitutenotified such U.S. Holder that it is subject to backup withholding. Certain exempt persons generally are excluded from these information reporting and backup withholding rules. Backup withholding is not an additional tax andtax. Any amounts withheld under the U.S. backup withholding rules will be allowed as a credit against the United States Investor'sa U.S. Holder’s U.S. federal income tax liability.
Filing of Information Return.
| 36 |
|
The discussion of reporting requirements set forth above is not intended to constitute an exhaustive description of all reporting requirements that may apply to a U.S. Holder. A failure to satisfy certain reporting requirements may result in an extension of the time period during which the IRS can assess a tax, and, under certain circumstances, such an extension may apply to assessments of amounts unrelated to any unsatisfied reporting requirement. Each U.S. Holder should consult its own tax advisor regarding the information reporting and backup withholding rules.
The Effect Of Comprehensive U.S. Tax Reform Legislation On The Company, Whether Adverse Or Favorable, Is Uncertain.
On December 22, 2017, President Trump signed into law H.R. 1, “An Act to provide for reconciliation pursuant to titles II and V of the concurrent resolution on the budget for fiscal year 2018” (informally titled the “Tax Cuts and Jobs Act”). Among a number of significant changes to the U.S. federal income tax rules, the Tax Cuts and Jobs Act reduces the marginal U.S. corporate income tax rate from 35% to 21%, limits the deduction for net interest expense, shifts the United States toward a more territorial tax system, and imposes new taxes to combat erosion of the U.S. federal income tax base. The effect of the Tax Cuts and Jobs Act on the Company and its subsidiaries, whether adverse or favorable, is uncertain, and may not become evident for some period of time. Each U.S. Holder is urged to consult its own tax adviser regarding the implications of the Tax Cuts and Jobs Act of holding of our common shares.
THE ABOVE SUMMARY IS NOT INTENDED TO CONSTITUTE A COMPLETE ANALYSIS OF ALL U.S. TAX CONSIDERATIONS APPLICABLE TO U.S. HOLDERS WITH RESPECT TO THE OWNERSHIP, EXERCISE OR DISPOSITION OF COMMON SHARES. U.S. HOLDERS SHOULD CONSULT THEIR OWN TAX ADVISORS AS TO THE TAX CONSIDERATIONS APPLICABLE TO THEM IN THEIR PARTICULAR CIRCUMSTANCES.
F. Dividends and Paying Agents
Not applicable.
| G. Statement by Experts
|
Not applicable.
| H. Documents on Display
|
The Company is required to file financial statements and other information with the Securities Commission in the Provinces of British Columbia, Ontario and Alberta, electronically through the Canadian System for Electronic Document Analysis and Retrieval ("SEDAR"(“SEDAR”) which can be viewed at www.sedar.com.
The Company files annual reports and furnishes other information with the SEC. You may read and copy any document that we file at the SEC'sSEC’s Public Reference Room at 450 Fifth Street, N.W., Room 1024, Washington, D.C. 20549 or by accessing the Commission'sCommission’s website (http://www.sec.gov).
Copies of the Company'sCompany’s material contracts are kept in the Company'sCompany’s administrative headquarters.
| I. Subsidiary Information
|
Not applicable.
Item 11. Quantitative and Qualitative Disclosures About Financial InstrumentMarket Risks
We are exposed to various risks including currency risks, credit risks, liquidity risks and interest rate risks, which may affect our results of operations and financial condition and, consequently, the value of our company.
a) Credit risk
Credit risk is the risk that one party to a financial instrument will cause a financial loss for the other party by failing to discharge an obligation. The Company's cash and cash equivalents is exposed to credit risk. The Company is not exposed to significant credit risk on amounts receivable.
Concentration of credit risk exists with respect to the Company's cash and cash equivalents and reclamation deposits as the majority of the amounts are held with a single Canadian and US financial institution. The Company's concentration of credit risk, and maximum exposure thereto, is as follows:
|
| January 31, 2016 |
|
| January 31, 2015 |
| ||
|
|
|
|
|
|
| ||
Cash and cash equivalents held at major financial institutions |
|
|
|
|
|
| ||
Canada – cash |
| $ | 199,934 |
|
| $ | 103,470 |
|
US – cash |
|
| 400,030 |
|
|
| 44,105 |
|
|
|
| 599,964 |
|
|
| 147,575 |
|
Reclamation deposits held at major financial inst. |
|
| 89,638 |
|
|
| 655,209 |
|
|
|
|
|
|
|
|
|
|
Total cash and equivalents and reclamation deposits |
| $ | 689,602 |
|
| $ | 802,784 |
|
b) Liquidity risk
Liquidity risk is the risk that the Company will encounter difficulty in satisfying financial obligations as they become due.
The Company manages its liquidity risk by forecasting cash flows required by operations and anticipated investing and financing activities. The Company had a working capitalAudit Committee of $470,078 at January 31, 2016 and $11,324 at January 31, 2015. The Company has cash at January 31, 2016 in the amountour board of $599,964 (2015 - $147,575) in order to meet short-term business requirements. At January 31, 2016, the Company had current liabilities of $148,637 (2015 - $154,653). Accounts payable have contractual maturities of approximately 30 days and are subject to normal trade terms. Amounts due to related parties are without stated terms of interest or repayment
The Company will require significant cash funding to conduct its planned exploration programs, meet its administrative overhead costs, and maintain its mineral properties in 2017. This will require the Company to continue to monitor its financing requirements
c) Market risk
Market risk consists of interest rate risk, foreign currency risk and other price risk. These are discussed further below.
Interest rate risk
Interest rate risk consists of two components:
| |
|
|
Foreign currency risk
Foreign currency risk is the risk that the fair value or future cash flows of a financial instrument will fluctuate due to changes indirectors regularly reviews foreign exchange and interest rates. The Company is exposed to foreign currency risk toOur policy prohibits the extent that monetary assets and liabilities are denominated in foreign currency.
The Company is exposed to foreign currency risk with respect to cash, other amounts receivable, accounts payable and accrued liabilities, and amounts payable to related parties, as a portion of these amounts are denominated in US dollars as follows:
|
| January 31, |
|
| January 31, |
| ||
|
|
|
|
|
|
| ||
Cash |
| US$ | 285,613 |
|
| US$ | 34,698 |
|
Other amounts receivable |
|
| 149 |
|
|
| 2,343 |
|
Amounts receivable from a related parties |
|
| - |
|
|
| 46,340 |
|
Reclamation bonds |
|
| 64,000 |
|
|
| 515,466 |
|
Accounts payable |
|
| (3,317 | ) |
|
| (15,945 | ) |
|
|
|
|
|
|
|
|
|
Net exposure |
| US$ | 346,445 |
|
| US$ | 582,902 |
|
|
|
|
|
|
|
|
|
|
Canadian dollar equivalent |
| $ | 485,231 |
|
| $ | 740,927 |
|
Based on the net Canadian dollar denominated asset and liability exposures as at January 31, 2016, a 10% (2015 – 10%) fluctuation in the Canadian/US exchange rates will impact the Company's net income and comprehensive income by approximately $48,523 (2015 - $74,093).
The Company manages foreign currency risk by minimizing the valueuse of financial instruments denominatedfor speculative purposes. See Note 14 in foreign currency. The Company has not entered into any foreign currency contracts to mitigateour annual audited consolidated Financial Statements contained in this Annual Report for quantitative and qualitative disclosure of market risk.
Other price risk
Other price risk is the risk that the fair value or future cash flows of a financial instrument will fluctuate due to changes in market prices, other than those arising from interest rate risk or foreign currency risk. The Company is exposed to other price risk with respect to its investment securities, as they are carried at fair value based on quoted market prices.
The Company's ability to raise capital to fund mineral resource exploration is subject to risks associated with fluctuations in mineral resource prices. Management closely monitors commodity prices, individual equity movements and the stock market to determine the appropriate course of action to be taken by the Company.
Item 12. Description of Securities Other than Equity Securities
Not applicable.
| 37 |
| Table of Contents |
Item 13. Defaults, Dividend Arrearages and Delinquencies
Not Applicable.
Item 14. Material Modifications to the Rights of Security Holders and Use of Proceeds
Not Applicable.
Item 15. Controls and Procedures
Disclosure Controls and Procedures
As required by paragraph (b) of Rules 13a-15 or 15d-15 under the Exchange Act, the Company'sCompany’s principal executive officer and principal financial officer evaluated the Company'sCompany’s disclosure controls and procedures (as defined in rulesRules 13a-15(e) and 15d-15(e) of the Exchange Act) as of the end of the period covered by this Annual Report.Report on Form 20-F. Based on the evaluation, these officers concluded that as of the end of the period covered by this Annual Report on Form 20-F, our disclosure controls and procedures were not effective to ensure that the information required to be disclosed by the Company in reports it files or submits under the Exchange Act is recorded, processed, summarized and reported within the time period specified in the rules and forms of the SEC. These disclosure controls and procedures include controls and procedures designed to ensure that such information is accumulated and communicated to the Company'sCompany’s management, including the Company'sCompany’s principal executive officer and principal financial officer, to allow timely decisions regarding required disclosure. The conclusion that our disclosure controls and procedures were not effective was due to the presence of material weaknesses in internal control over financial reporting as identified below under the heading "Management's“Management’s Report on Internal Control Over Financial Reporting."”
Management anticipates that such disclosure controls and procedures will not be effective until the material weaknesses are remediated. The Company intends to remediate the material weaknesses as set out below.
Because of the inherent limitations in all control systems, no evaluation of controls can provide absolute assurance that all control issues, if any, within the Company have been detected.
Management'sManagement’s Annual Report on Internal Control Over Financial Reporting
The Company'sCompany’s management is responsible for establishing and maintaining adequate internal control over financial reporting (as defined in Rules 13a-15(f) and 15d-15(f) of the Exchange Act) for the Company. The Company'sCompany’s internal control over financial reporting is designed to provide reasonable assurance, not absolute assurance, regarding the reliability of financial reporting and the preparation of financial statements for external purposes in accordance with International Financial Reporting Standards. Internal control over financial reporting includes those policies and procedures that: (i) pertain to the maintenance of records that, in reasonable detail, accurately and fairly reflect the transactions and dispositions of the Company'sCompany’s assets; (ii) provide reasonable assurance that transactions are recorded as necessary to permit preparation of financial statements in accordance with International Financial Reporting Standards, and that the Company'sCompany’s receipts and expenditures are being made only in accordance with authorizations of the Company'sCompany’s management and directors; and (iii) provide reasonable assurance regarding prevention or timely detection of unauthorized acquisition, use or disposition of assets that could have a material effect on the Company'sCompany’s consolidated financial statements.
Because of its inherent limitations, internal control over financial reporting may not prevent or detect misstatements. In addition, projections of any evaluation of effectiveness to future periods are subject to the risk that controls may become inadequate because of changes in conditions and that the degree of compliance with the policies or procedures may deteriorate.
| 38 |
| Table of Contents |
The Company'sCompany’s management, including the Company'sCompany’s principal executive officer and principal financial officer, along with an independent consultant, conducted an evaluation of the design and operation of the Company'sCompany’s internal control over financial reporting as of January 31, 20162019 based on the criteria set forth in Internal Control – Integrated Framework issued by the Committee of Sponsoring Organizations of the Treadway Commission in 2013. This evaluation included review of the documentation of controls, evaluation of the design effectiveness of controls, testing of the operating effectiveness of controls and a conclusion on this evaluation. Based on this evaluation, the Company'sCompany’s management concluded the Company'sCompany’s internal control over financial reporting was not effective as at January 31, 20162019 due to the following material weaknesses: (i) inadequatedue to the limited number of staff resources, the Company believes there are instances where a lack of segregation of duties exist to provide effective controls; and effective risk assessment; (ii) insufficient written policiesdue to the limited number of staff resources, the Company may not have the necessary in-house knowledge to address complex accounting and procedures for accounting, financial reporting and corporate governance; and (iii) insufficient disaster recovery plans.
The Company has taken steps to enhance and improve the design of the Company's internal controls over financial reporting, however these steps were not complete as of January 31, 2016.tax issues that may arise. During the period covered by this annual report on Form 20-F,we have not been able to remediate the material weaknesses identified above. To remediate such weaknesses, we plan to implement the following changes during the Company's fiscal year ending January 31, 2016: (i) address inadequate segregation of duties and ineffective risk management; (ii) adopt sufficient written policies and procedures for accounting, financial reporting and corporate governance; and (iii) implement a disaster recovery plan.
The Company'sCompany’s internal control over financial reporting was not subject to attestation by the Company'sCompany’s independent registered public accounting firm pursuant to the rules of the SEC that permit us to provide only management'smanagement’s report in this annual report.
Because of the inherent limitations in all control systems, no evaluation of controls can provide absolute assurance that all control issues, if any, within the Company have been detected. These inherent limitations include the realities that judgments in decision-making can be faulty and that breakdowns can occur because of simple error or mistake.
Attestation Report of the Registered Public Accounting Firm
Not Applicable.
Changes in Internal Control over Financial Reporting
There were no changes in internal control over financial reporting in the year ended January 31, 2016; however, as a result of the evaluation of the Company's internal control over financial reporting as of January 31, 2016, conducted by the Company's principal executive officer, principal financial officer and an independent consultant, we expect to make such changes during the year ending January 31, 2017.2019.
Not Applicable.
Item 16A. Audit Committee Financial Expert
The Board determined that Mr. Gary Robertson is an "audit“audit committee financial expert"expert” as defined in Item 16A of Form 20-F under the Exchange Act, and that Mr. Robertson is independent as defined in the NASDAQ listing rules.
The Company has not currently adopted a code of ethics but is evaluating its internal procedures to determine the necessity of same. In the event that it is determined that a code of ethics is necessary, an appropriate code will be implemented.
Item 16C. Principal Accountant Fees and Services
The independent auditor for the years ended January 31, 2016, 20152019 and 20142018 was Manning Elliott LLP.
Audit Fees
The aggregate fees billed by Manning Elliott LLP for the audit of the Company'sCompany’s annual financial statements for the fiscal year ended January 31, 2016 were $32,000.2019 are estimated to be $42,500. The aggregate fees billed by Manning Elliott LLP for the fiscal year ended January 31, 20152018 were $36,000.$37,500.
Audit-Related Fees
The audit related fees billed by Manning Elliott LLP for the year ended January 31, 20162019 are estimated to be $4,000.$2,000. The audit related fees billed by Manning Elliott for the year ended January 31, 20152018 were $4,000.$2,000. These fees relate to the advisory services provided with respect to the Company'sCompany’s Form 20-F.
Tax Fees
The tax fees billed by Manning Elliott LLP for the year ended January 31, 20162019 are estimated to be $3,000.$3,250. The tax fees billed by Manning Elliott LLP for the year ended January 31, 20152018 were $3,000.$3,250. The services comprising these fees include compliance service with respect to Canadian tax filings.
All Other Fees
The aggregate fees billed for all other professional services rendered by the Company'sCompany’s independent registered public accounting firm were nil$Nil for the fiscal years ended January 31, 20162019 and 2015.2018, respectively.
The Audit Committee approved 100% of the fees paid to the principal accountant for audit-related, tax and other fees in the year ended January 31, 2016.2019 and 2018. The Audit Committee pre-approves all non-audit services to be performed by the auditor in accordance with the Audit Committee Charter. The percentage of hours expended on the principal accountant'saccountant’s engagement to audit the Company'sCompany’s financial statements for the most recent fiscal year that were attributed to work performed by persons other than the principal accountant'saccountant’s full-time, permanent employees was 0%.
Item 16D. Exemptions from the Listing Standards for Audit Committees
Not applicable.
Item 16E. Purchases of Equity Securities by the Issuer and Affiliated Purchasers
None.
Item 16F. Change in Registrant'sRegistrant’s Certifying Accountant
Not applicable
Item 16G. Corporate Governance
Not applicable.
Item 16H. Mine Safety Disclosure
Each of the Dodd-Frank Wall Street Reform and Consumer Protection Act and under the SEC's recently adopted Item 104 of Regulation S-K, each operator of a coal or other mineCompany’s properties is required to include disclosures regarding certain mine safety results in its periodic reports filed with the SEC. The operation of the our quarries is subject to regulation by the federal Mine Safety and Health Administration (MSHA) under the Federal Mine Safety and Health Act of 1977. We do not own any operating mines in the United States and as a result, this information is not required.
| 40 |
| Table of Contents |
Item 17. Financial StatementsPART III
See Item 18.
Item 18.17. Financial Statements
The following Consolidated Financial Statements pertaining to the Company are filed as part of this annual report:See Item 18.
| ||||
| ||||
| ||||
| ||||
| ||||
|
| |||
The following Consolidated Financial Statements pertaining to the Company are filed as part of this annual report:
Pages | |||
46 | |||
47 | |||
Consolidated Statements of Operations and Comprehensive Income (Loss) | 48 | ||
49 | |||
50 | |||
51 |
| 41 |
| Table of Contents |
Exhibit Number | Name | |
1.1 | Memorandum of Coral Gold Resources Ltd.* | |
1.2 | Articles of Coral Gold Resources Ltd.* | |
Certificate of Principal Executive Officer under the Sarbanes-Oxley Act | ||
Certificate of Principal Financial Officer under the Sarbanes-Oxley Act | ||
|
| |
|
|
_____________ ________________
* Incorporated by reference from a previous filing.
| 42 |
| Table of Contents |


CORAL GOLD RESOURCES LTD.
(an Exploration Stage Company)
Consolidated financial statementsFinancial Statements
For the years endedYears Ended January 31, 2016, 2015,2019, 2018, and 20142017
(Expressed in Canadian Dollars)
| 43 |
| Table of Contents |
| Page | |||
| ||||
| 45 | |||
|
| |||
| 46 | |||
| ||||
Consolidated Financial Statements | ||||
| 47 | |||
| ||||
| ||||
| ||||
Consolidated Statements of Operations and Comprehensive Income (Loss) |
| 48 | ||
| ||||
| 49 | |||
| ||||
| 50 | |||
| ||||
| ||||
|
|
| 44 |
��
MANAGEMENT'SMANAGEMENT’S RESPONSIBILITY FOR FINANCIAL REPORTING
The consolidated financial statements of Coral Gold Resources Ltd. (the "Company"“Company”) are the responsibility of the Company'sCompany’s management. The consolidated financial statements are prepared in accordance with International Financial Reporting Standards as issued by the International Accounting Standards Board, and reflect management'smanagement’s best estimates and judgment based on information currently available.
Management has developed and is maintaining a system of internal controls to ensure that the Company'sCompany’s assets are safeguarded, transactions are authorized and properly recorded and financial information is reliable.
The Board of Directors is responsible for ensuring management fulfills its responsibilities. The Audit Committee reviews the results of the audit and the annual consolidated financial statements prior to their submission to the Board of Directors for approval.
The consolidated financial statements as at January 31, 20162019 and 20152018 and for the years ended January 31, 2016, 2015,2019, 2018, and 20142017 have been audited by Manning Elliott LLP, an independent registered public accounting firm, and their report outlines the scope of their examination and gives their opinion on the consolidated financial statements.
“David |
| ||
David Wolfin |
| ||
President & CEO | Chief Financial Officer | ||
May | May |
| 45 |
| Table of Contents |


REPORT OF INDEPENDENT REGISTERED PUBLIC ACCOUNTING FIRM
To the Shareholders and the Board of Directors of
Coral Gold Resources Ltd.
Opinion on the Consolidated Financial Statements
We have audited the accompanying consolidated financial statements of Coral Gold Resources Ltd. and its subsidiaries (the “Company”), which comprise the consolidated statements of financial position as at January 31, 20162019 and 20152018, and the consolidated statements of operations and comprehensive income (loss), consolidated statements of changes in equity and consolidated statements of cash flows for the years ended January 31, 2016, 2015,2019, 2018 and 2014,2017, and the related notes, comprisingincluding a summary of significant accounting policies and other explanatory information.
Management's Responsibility forinformation (collectively referred to as the ConsolidatedFinancial Statements
Management is responsible for the preparation and fair presentation of these consolidated“consolidated financial statements in accordance with International Financial Reporting Standards as issued by the International Accounting Standards Board, and for such internal control as management determines is necessary to enable the preparation of consolidated financial statements that are free from material misstatement, whether due to fraud or error.
Auditors' Responsibility
Our responsibility is to express an opinion on these consolidated financial statements based on our audits. We conducted our audits in accordance with Canadian generally accepted auditing standards and the standards of the Public Company Accounting Oversight Board (United States)statements”). Those standards require that we comply with ethical requirements and plan and perform the audits to obtain reasonable assurance about whether the consolidated financial statements are free from material misstatement.
An audit involves performing procedures to obtain audit evidence about the amounts and disclosures in the consolidated financial statements. The procedures selected depend on our judgment, including the assessment of the risks of material misstatement of the consolidated financial statements, whether due to fraud or error. In making those risk assessments, we consider internal control relevant to the Company's preparation and fair presentation of the consolidated financial statements in order to design audit procedures that are appropriate in the circumstances, but not for the purpose of expressing an opinion on the effectiveness of the Company's internal control. The Company is not required to have, nor were we engaged to perform, an audit of the Company's internal control over financial reporting; accordingly we express no such opinion. An audit also includes evaluating the appropriateness of accounting policies used and the reasonableness of accounting estimates made by management, as well as evaluating the overall presentation of the consolidated financial statements.
We believe that the audit evidence we have obtained in our audits is sufficient and appropriate to provide a basis for our audit opinion.
Opinion
In our opinion, the consolidated financial statements present fairly, in all material respects, the financial position of Coral Gold Resources Ltd.the Company as at January 31, 20162019 and 20152018, and the results of its financial performance and its cash flows for the years ended January 31, 2016, 20152019, 2018 and 20142017 in accordance with International Financial Reporting Standards as issued by the International Accounting Standards Board.
Emphasis of MatterBasis for Opinion
Without qualifying ourThese consolidated financial statements are the responsibility of the Company’s management. Our responsibility is to express an opinion we draw attention to Note 1 toon these consolidated financial statements which describes the existence ofbased on our audits. We are a material uncertainty that may cast significant doubt about the ability of Coral Gold Resources Ltd. to continue as a going concern.
/s/ Manning Elliott LLP
CHARTERED PROFESSIONAL ACCOUNTANTS
Vancouver, British Columbia
May 30, 2016
Comments by independent registered public accounting firm on Canada – United States reporting differences
The standards ofregistered with the Public Company Accounting Oversight Board (United States) require the auditors' conclusion(PCAOB) and are required to be expressed using an unconditional statement of "substantial doubt" about the ability of Coral Gold Resources Ltd. (the "Company") to continue as a going concern. Our Reportindependent with respect to the Shareholders dated May 30, 2016 is expressedCompany in accordance with Canadian reporting standards that do not require the specific wording "substantial doubt" or to stateU.S. federal securities laws and the conditionsapplicable rules and events that were considered in reaching this conclusion.regulations of the Securities and Exchange Commission and the PCAOB.
InWe conducted our audits in accordance with the standards of the Public Company Accounting Oversight Board (United States)PCAOB. Those standards require that we state thatplan and perform the accompanying consolidated financial statements have been prepared assuming the Company will continue as a going concern. As discussed in Note 1audits to obtain reasonable assurance about whether the consolidated financial statements are free of material misstatement, whether due to error or fraud. The Company is not required to have, nor were we engaged to perform, an audit of its internal control over financial reporting. As part of our audits we are required to obtain an understanding of internal control over financial reporting but not for the Company has a working capital deficit, has accumulated losses since inception and has not generated any revenues. These factors raise substantial doubt aboutpurpose of expressing an opinion on the Company's abilityeffectiveness of the Company’s internal control over financial reporting. Accordingly, we express no such opinion.
Our audits included performing procedures to continue as a going concern. Management's plans in regard to these matters are also discussed in Note 1. Theassess the risks of material misstatement of the consolidated financial statements, do not include any adjustmentswhether due to error or fraud, and performing procedures that might result fromrespond to those risks. Such procedures included examining, on a test basis, evidence regarding the outcomeamounts and disclosures in the consolidated financial statements. Our audits also included evaluating the accounting principles used and significant estimates made by management, as well as evaluating the overall presentation of this uncertainty. Our opinion is not modified with respect to this matter.the consolidated financial statements. We believe that our audits provide a reasonable basis for our opinion.
/s/ Manning ElliottMANNING ELLIOTT LLP
CHARTERED PROFESSIONAL ACCOUNTANTS
Vancouver, British Columbia
May 30, 2016
We have served as the Company’s auditor since 2013.
| 46 |
| Table of Contents |
CORAL GOLD RESOURCES LTD.
Consolidated Statements of Financial Position
|
| Note |
|
| As at |
|
| As at |
| ||
|
|
|
|
|
|
|
|
|
| ||
Assets |
|
|
|
|
|
|
|
|
| ||
Current assets |
|
|
|
|
|
|
|
|
| ||
Cash and cash equivalents |
|
|
|
| $ | 599,964 |
|
| $ | 147,575 |
|
Other amounts receivable |
|
|
|
|
| 4,887 |
|
|
| 17,954 |
|
Prepaid expenses |
|
|
|
|
| 13,864 |
|
|
| 448 |
|
|
|
|
|
|
| 618,715 |
|
|
| 165,977 |
|
|
|
|
|
|
|
|
|
|
|
|
|
Exploration and Evaluation Assets |
| 4 |
|
|
| 19,192,353 |
|
|
| 19,152,737 |
|
Property and Equipment |
| 6 |
|
|
| 94,696 |
|
|
| 96,986 |
|
Investments in Marketable Securities |
| 7 |
|
|
| 92,746 |
|
|
| 146,032 |
|
Reclamation Bonds |
| 8 |
|
|
| 89,638 |
|
|
| 655,209 |
|
Amounts Receivable from a Related Party |
| 11b |
|
| - |
|
|
| 58,903 |
| |
Total Assets |
|
|
|
| $ | 20,088,148 |
|
| $ | 20,275,844 |
|
|
|
|
|
|
|
|
|
|
|
|
|
Liabilities |
|
|
|
|
|
|
|
|
|
|
|
Current liabilities |
|
|
|
|
|
|
|
|
|
|
|
Accounts payable and accrued liabilities |
|
|
|
| $ | 64,324 |
|
| $ | 71,761 |
|
Amounts payable to related parties |
| 11c |
|
| 84,313 |
|
|
| 82,892 |
| |
|
|
|
|
|
| 148,637 |
|
|
| 154,653 |
|
|
|
|
|
|
|
|
|
|
|
|
|
Reclamation Provision |
| 12 |
|
|
| 645,153 |
|
|
| 566,410 |
|
Deferred Tax Liability |
| 17 |
|
|
| 620,000 |
|
|
| 1,290,000 |
|
Total liabilities |
|
|
|
|
| 1,413,790 |
|
|
| 2,011,063 |
|
|
|
|
|
|
|
|
|
|
|
|
|
Equity |
|
|
|
|
|
|
|
|
|
|
|
Share Capital |
| 9 |
|
|
| 45,367,275 |
|
|
| 45,205,901 |
|
Equity Reserves |
|
|
|
|
| 1,086,046 |
|
|
| 2,684,849 |
|
Accumulated Other Comprehensive Income |
|
|
|
|
| 40,628 |
|
|
| 87,588 |
|
Accumulated Deficit |
|
|
|
|
| (27,829,911 | ) |
|
| (29,723,877 | ) |
Equity Attributable to Equity Holders of the Company |
|
|
|
|
| 18,664,038 |
|
|
| 18,254,461 |
|
Equity Attributable to Non-Controlling Interests |
|
|
|
|
| 10,320 |
|
|
| 10,320 |
|
Total Equity |
|
|
|
|
| 18,674,358 |
|
|
| 18,264,781 |
|
Total Liabilities and Equity |
|
|
|
| $ | 20,088,148 |
|
| $ | 20,275,844 |
|
Nature and continuance of operations – Note 1
CORAL GOLD RESOURCES LTD. Consolidated Statements of Financial Position (Expressed in Canadian dollars) |
Note January 31, January 31, ASSETS Current assets Cash and cash equivalents Term deposits Other amounts receivable Prepaid expenses Total current assets Exploration and evaluation assets 6 Property and equipment 7 Royalty receivable 8 Investments 9 Total assets LIABILITIES Current liabilities Accounts payable and accrued liabilities Amounts payable to related parties 11b Current income tax liability 16 Total current liabilities Deferred tax liability 16 Total liabilities EQUITY Share capital 10 Equity reserves Accumulated other comprehensive income Accumulated deficit Equity Attributable to Shareholders of the Company Equity Attributable to Non-Controlling Interests Total Equity Total Liabilities and Equity
2019
2018$ 8,308,884 $ 14,321,433 9,656,320 3,694,415 7,064 87,960 33,966 32,237 18,006,234 18,136,045 236,887 199,848 - 1,079 3,969,356 3,540,753 10,280 60,057 $ 22,222,757 $ 21,937,782 $ 46,056 $ 48,303 31,467 39,865 2,834,277 2,751,000 2,911,800 2,839,168 55,000 42,000 2,966,800 2,881,168 43,833,127 44,356,316 1,192,691 1,182,299 4,611 23,808 (25,784,792 ) (26,516,129 ) 19,245,637 19,046,294 10,320 10,320 19,255,957 19,056,614 $ 22,222,757 $ 21,937,782
Commitments – Note 1312
Approved by the Board of Directors on May 30, 2016:23, 2019:
/s/ David Wolfin | Director | /s/ Gary Robertson | Director |
The accompanying notes are an integral part of the consolidated financial statements
| 47 |
| Table of Contents |
CORAL GOLD RESOURCES LTD.
CORAL GOLD RESOURCES LTD. Consolidated Statements of Operations and Comprehensive Income (Loss) For the years ended January 31, 2019, 2018, and 2017 (Expressed in Canadian dollars) |
Consolidated Statements of Operations and Comprehensive Income (Loss)
For the years ended January 31, 2016, 2015, and 2014
|
| Note |
| 2016 |
| 2015 |
| 2014 |
|
| Note |
| 2019 |
| 2018 |
| 2017 |
| |||||||||||||
|
|
|
|
|
|
|
|
|
|
|
|
|
|
|
|
|
|
|
|
|
| ||||||||||
Operating and Administrative Expenses |
|
|
|
|
|
|
|
|
|
|
|
|
|
|
|
|
|
| |||||||||||||
Consulting fees |
|
|
| $ | 2,663 |
| $ | 18,731 |
| $ | 18,836 |
|
|
|
| $ | 60,000 |
| $ | 97,500 |
| $ | 17,915 |
| |||||||
Depreciation |
|
|
| 2,290 |
| 2,397 |
| 6,975 |
|
|
|
| 1,079 |
| 1,670 |
| 2,207 |
| |||||||||||||
Directors' fees |
|
|
| 18,000 |
| 18,000 |
| 18,000 |
| ||||||||||||||||||||||
Directors’ fees |
|
|
| 52,500 |
| 33,750 |
| 18,000 |
| ||||||||||||||||||||||
Finance costs |
| 12 |
| 17,389 |
| 14,519 |
| 11,850 |
|
| 10 |
| - |
| 6,786 |
| 18,240 |
| |||||||||||||
Impairment of exploration and evaluation assets |
| 5 |
| 212,519 |
| - |
| 498,528 |
| ||||||||||||||||||||||
Investor relations |
|
|
| 7,698 |
| 14,982 |
| 10,305 |
|
|
|
| 49,670 |
| 60,603 |
| 97,977 |
| |||||||||||||
Management fees |
|
|
| 30,000 |
| 30,000 |
| 30,000 |
|
|
|
| 72,000 |
| 154,500 |
| 30,000 |
| |||||||||||||
Office and miscellaneous |
|
|
| 10,632 |
| 37,459 |
| 44,426 |
|
|
|
| 55,001 |
| 28,123 |
| 40,029 |
| |||||||||||||
Professional fees |
|
|
| 67,295 |
| 62,964 |
| 87,669 |
|
|
|
| 66,702 |
| 169,845 |
| 215,740 |
| |||||||||||||
Regulatory and compliance fees |
|
|
| 39,491 |
| 29,324 |
| 23,603 |
| ||||||||||||||||||||||
Listing and filing fees |
|
|
| 56,237 |
| 69,670 |
| 23,327 |
| ||||||||||||||||||||||
Salaries and benefits |
|
|
| 73,031 |
| 46,164 |
| 95,134 |
|
|
|
| 118,686 |
| 159,457 |
| 91,470 |
| |||||||||||||
Share-based payments |
| 10 |
| 157,142 |
| 259,163 |
| 9,350 |
|
| 10 |
| 294,432 |
| 565,250 |
| 7,865 |
| |||||||||||||
Travel |
|
|
|
| 4,043 |
|
|
| 4,766 |
|
|
| 5,841 |
|
|
|
|
| 52,259 |
|
|
| 28,828 |
|
|
| 17,296 |
| |||
|
|
|
|
| 642,193 |
|
|
| 538,469 |
|
|
| 860,517 |
|
|
|
|
| 878,566 |
|
|
| 1,375,982 |
|
|
| 580,066 |
| |||
|
|
|
|
|
|
|
|
|
|
|
|
|
|
|
|
|
|
| |||||||||||||
Loss before other items and tax |
|
|
| (642,193 | ) |
| (538,469 | ) |
| (860,517 | ) | ||||||||||||||||||||
Loss Before Other Items and Income Taxes |
|
|
| (878,566 | ) |
| (1,375,982 | ) |
| (580,066 | ) | ||||||||||||||||||||
|
|
|
|
|
|
|
|
|
|
|
|
|
|
|
|
|
|
| |||||||||||||
Other items |
|
|
|
|
|
|
|
|
| ||||||||||||||||||||||
Interest and other income |
|
|
| 119 |
| 629 |
| 248 |
| ||||||||||||||||||||||
Other Items |
|
|
|
|
|
|
|
|
| ||||||||||||||||||||||
Interest income |
|
|
| 233,671 |
| - |
| - |
| ||||||||||||||||||||||
Other income |
|
|
| 3,784 |
| - |
| - |
| ||||||||||||||||||||||
Gain on sale of exploration and evaluation assets |
| 5 |
| - |
| 5,871,719 |
| - |
| ||||||||||||||||||||||
Finance income |
|
|
| 189,154 |
| 117,379 |
| - |
| ||||||||||||||||||||||
Gain on sale of investments |
| 7 |
| 27,059 |
| 7,130 |
| 107,300 |
|
| 9 |
| 14,635 |
| 93,693 |
| - |
| |||||||||||||
Gain on forgiveness of debt |
|
|
| 5,250 |
| - |
| - |
| ||||||||||||||||||||||
Gain on settlement of debt |
| 9b |
| - |
| 25,719 |
| 46,340 |
| ||||||||||||||||||||||
Foreign exchange gain (loss) |
|
|
|
| (9,714 | ) |
|
| 28,798 |
|
|
| 7,903 |
|
|
|
| 1,150,371 |
| (907,286 | ) |
| 21,927 |
| |||||||
Loss Before Income Tax |
|
|
| (619,479 | ) |
| (476,193 | ) |
| (698,726 | ) | ||||||||||||||||||||
Deferred income tax recovery |
| 17 |
|
| 670,000 |
|
|
| 476,720 |
|
|
| 647,855 |
| |||||||||||||||||
Loss on sale of fixed assets |
|
|
| (15,641 | ) |
| (34,183 | ) |
| - |
| ||||||||||||||||||||
Other expenses |
|
| (289,136 | ) |
|
| - |
|
| - |
| ||||||||||||||||||||
Income (Loss) Before Income Taxes |
|
|
|
| 408,272 |
|
| 3,765,340 |
|
| (558,139 | ) | |||||||||||||||||||
Income Tax Recovery (Expense) |
|
|
|
|
|
|
|
|
| ||||||||||||||||||||||
Current income tax recovery (expense) |
| 16 |
| 309,024 |
| (2,751,000 | ) |
| - |
| |||||||||||||||||||||
Deferred income tax recovery (expense) |
| 16 |
|
| (13,000 | ) |
|
| 1,001,000 |
|
|
| (423,000 | ) | |||||||||||||||||
|
|
|
| 296,024 |
|
|
| (1,750,000 | ) |
|
| (423,000 | ) | ||||||||||||||||||
Net Income (Loss) |
|
|
| 50,521 |
| 527 |
| (50,871 | ) |
|
|
|
| 704,296 |
|
| 2,015,340 |
|
| (981,139 | ) | ||||||||||
Other Comprehensive Income (Loss) – Items that may be reclassified subsequently to income or loss |
|
|
|
|
|
|
|
|
|
|
|
|
|
|
|
|
|
| |||||||||||||
Unrealized gain (loss) on available for sale securities |
| 7 |
|
| (46,960 | ) |
|
| 7,127 |
|
|
| (197,176 | ) |
| 9 |
|
| (19,197 | ) |
|
| (57,269 | ) |
|
| 40,449 |
| |||
COMPREHENSIVE INCOME (LOSS) |
|
|
| $ | 3,561 |
|
| $ | 7,654 |
|
| $ | (248,047 | ) | |||||||||||||||||
|
|
|
|
|
|
|
|
|
| ||||||||||||||||||||||
Income (Loss) per Share - Basic and Diluted |
|
|
| $ | 0.00 |
|
| $ | 0.00 |
|
| $ | (0.00 | ) | |||||||||||||||||
Comprehensive Income (Loss) |
|
|
| $ | 685,099 |
|
| $ | 1,958,071 |
|
| $ | (940,690 | ) | |||||||||||||||||
Earnings (Loss) per Share - Basic and Diluted |
|
|
| $ | 0.01 |
|
| $ | 0.04 |
|
| $ | (0.02 | ) | |||||||||||||||||
|
|
|
|
|
|
|
|
|
|
|
|
|
|
|
|
|
|
| |||||||||||||
Weighted Average Number of Common Shares Outstanding |
|
|
|
| 44,200,953 |
|
|
| 42,016,049 |
|
|
| 36,024,532 |
|
| 3 |
|
|
|
|
|
|
| ||||||||
Basic |
|
|
| 48,672,608 |
| 47,570,158 |
| 48,396,734 |
| ||||||||||||||||||||||
Diluted |
|
|
|
| 49,826,429 |
|
|
| 50,509,282 |
|
|
| 48,396,734 |
| |||||||||||||||||
The accompanying notes are an integral part of the consolidated financial statements
| 48 |
| Table of Contents |
CORAL GOLD RESOURCES LTD.
CORAL GOLD RESOURCES LTD. Consolidated Statements of Changes in Equity (Expressed in Canadian dollars) |
Consolidated Statements of Equity
For the years ended January 31, 2016, 2015, and 2014
|
| Note |
| Number of Common Shares |
| Share Capital Amount |
| Reserve for Stock Options |
| Reserve for Warrants |
| Total Reserves |
| Accumulated Other Comprehensive Income |
| Accumulated Deficit |
| Non-Controlling Interest |
| Total |
|
| Note |
|
| Number of Common Shares |
|
| Share Capital Amount |
|
| Reserve for Stock Options |
|
| Reserve for Warrants |
|
| Total Reserves |
|
| Accumulated Other Comprehensive Income |
|
| Accumulated Deficit |
|
| Non-Controlling Interest |
|
| Total |
| ||||||||||||||||||||||||||||
Balance, January 31, 2016 |
|
|
| 47,825,337 |
| $ | 45,367,275 |
| $ | 663,720 |
| $ | 422,326 |
| $ | 1,086,046 |
| $ | 40,628 |
| $ | (27,829,911 | ) |
| $ | 10,320 |
| $ | 18,674,358 |
| |||||||||||||||||||||||||||||||||||||||||||||||||
|
|
|
|
|
|
|
|
|
|
|
|
|
|
|
|
|
|
|
|
|
|
|
|
|
|
|
|
|
|
|
|
|
|
|
|
|
|
|
|
|
|
| |||||||||||||||||||||||||||||||||||||
Balance, January 31, 2013 |
|
|
| 33,563,649 |
| 43,954,422 |
| $ | 903,316 |
| $ | 1,798,602 |
| $ | 2,701,918 |
| $ | 277,637 |
| $ | (30,048,751 | ) |
| $ | 10,320 |
| $ | 16,895,546 |
| ||||||||||||||||||||||||||||||||||||||||||||||||||
Common shares issued for cash: |
|
|
|
|
|
|
|
|
|
|
|
|
|
|
|
|
|
|
|
|
|
|
|
|
|
|
|
|
|
|
|
|
|
|
|
|
|
|
|
|
|
| |||||||||||||||||||||||||||||||||||||
Private Placements |
| 9 |
| 3,694,500 |
| 278,190 |
| - |
| 91,260 |
| 91,260 |
| - |
| - |
| - |
| 369,450 |
| ||||||||||||||||||||||||||||||||||||||||||||||||||||||||||
Exercise of stock options |
| 10 |
| 25,000 |
| 10,250 |
| (4,250 | ) |
| - |
| (4,250 | ) |
| - |
| - |
| - |
| 6,000 |
| ||||||||||||||||||||||||||||||||||||||||||||||||||||||||
Exercise of warrants and compensation options |
|
|
| 1,000,000 |
| 117,857 |
| - |
| (17,857 | ) |
| (17,857 | ) |
| - |
| - |
| - |
| 100,000 |
| ||||||||||||||||||||||||||||||||||||||||||||||||||||||||
Share-based payments |
| 10 |
| - |
| - |
| 7,865 |
| - |
| 7,865 |
| - |
| - |
| - |
| 7,865 |
| ||||||||||||||||||||||||||||||||||||||||||||||||||||||||||
Unrealized gain on investment in securities, net of tax |
| 9 |
| - |
| - |
| - |
| - |
| - |
| 40,449 |
| - |
| - |
| 40,449 |
| ||||||||||||||||||||||||||||||||||||||||||||||||||||||||||
Net loss for 2017 |
|
|
|
| - |
|
|
| - |
|
|
| - |
|
|
| - |
|
|
| - |
|
|
| - |
|
|
| (981,139 | ) |
|
| - |
|
|
| (981,139 | ) | |||||||||||||||||||||||||||||||||||||||||
Balance, January 31, 2017 |
|
|
|
| 48,850,337 |
|
| $ | 45,495,382 |
|
| $ | 667,335 |
|
| $ | 404,469 |
|
| $ | 1,071,804 |
|
| $ | 81,077 |
|
| $ | (28,811,050 | ) |
| $ | 10,320 |
|
| $ | 17,847,533 |
| |||||||||||||||||||||||||||||||||||||||||
Common shares issued for cash: |
|
|
|
|
|
|
|
|
|
|
|
|
|
|
|
|
|
|
|
|
| ||||||||||||||||||||||||||||||||||||||||||||||||||||||||||
Exercise of stock options |
| 10 |
| 510,000 |
| 249,209 |
| (98,609 | ) |
| - |
| (98,609 | ) |
| - |
| - |
| - |
| 150,600 |
| ||||||||||||||||||||||||||||||||||||||||||||||||||||||||
Exercise of warrants and compensation options |
|
|
| 3,965,000 |
| 481,315 |
| - |
| (76,565 | ) |
| (76,565 | ) |
| - |
| - |
| - |
| 404,750 |
| ||||||||||||||||||||||||||||||||||||||||||||||||||||||||
Less: Share issuance costs |
|
|
| - |
| (3,000 | ) |
| - |
| - |
| - |
| - |
| - |
| - |
| (3,000 | ) |
|
|
| - |
| (5,850 | ) |
| - |
| - |
| - |
| - |
| - |
| - |
| (5,850 | ) | |||||||||||||||||||||||||||||||||||
Common shares issued for debt |
| 9 |
| 514,892 |
| 82,383 |
| - |
| - |
| - |
| - |
| - |
| - |
| 82,383 |
| ||||||||||||||||||||||||||||||||||||||||||||||||||||||||||
Share-based payments |
| 10 |
| - |
| - |
| 2,629 |
| 6,721 |
| 9,350 |
| - |
| - |
| - |
| 9,350 |
| ||||||||||||||||||||||||||||||||||||||||||||||||||||||||||
Transfer of expired/cancelled options |
|
|
| - |
| - |
| (64,334 | ) |
| - |
| (64,334 | ) |
| - |
| 64,334 |
| - |
| - |
| ||||||||||||||||||||||||||||||||||||||||||||||||||||||||
Unrealized loss on investment in securities, net of tax |
| 7 |
| - |
| - |
| - |
| - |
| - |
| (197,176 | ) |
| - |
| - |
| (197,176 | ) | |||||||||||||||||||||||||||||||||||||||||||||||||||||||||
Net loss for 2014 |
|
|
|
| - |
|
|
| - |
|
|
| - |
|
|
| - |
|
|
| - |
|
|
| - |
|
|
| (50,871 | ) |
|
| - |
|
|
| (50,871 | ) | |||||||||||||||||||||||||||||||||||||||||
Balance, January 31, 2014 |
|
|
| 37,773,041 |
| $ | 44,311,995 |
| $ | 841,611 |
| $ | 1,896,583 |
| $ | 2,738,194 |
| $ | 80,461 |
| $ | (30,035,288 | ) |
| $ | 10,320 |
| $ | 17,105,682 |
| |||||||||||||||||||||||||||||||||||||||||||||||||
Common shares issued for cash: |
|
|
|
|
|
|
|
|
|
|
|
|
|
|
|
|
|
|
|
|
| ||||||||||||||||||||||||||||||||||||||||||||||||||||||||||
Private Placements |
| 9 |
| 4,150,000 |
| 705,500 |
| - |
| - |
| - |
| - |
| - |
| - |
| 705,500 |
| ||||||||||||||||||||||||||||||||||||||||||||||||||||||||||
Exercise of warrants and compensation options |
|
|
| 45,000 |
| 8,374 |
| - |
| (1,624 | ) |
| (1,624 | ) |
| - |
| - |
| - |
| 6,750 |
| ||||||||||||||||||||||||||||||||||||||||||||||||||||||||
Common shares issued for debt |
| 9 |
| 857,296 |
| 180,032 |
| - |
| - |
| - |
| - |
| - |
| - |
| 180,032 |
| ||||||||||||||||||||||||||||||||||||||||||||||||||||||||||
Share-based payments |
| 10 |
| - |
| - |
| 237,547 |
| 21,616 |
| 259,163 |
| - |
| - |
| - |
| 259,163 |
| ||||||||||||||||||||||||||||||||||||||||||||||||||||||||||
Transfer of expired/cancelled options |
|
|
| - |
| - |
| (310,884 | ) |
| - |
| (310,884 | ) |
| - |
| 310,884 |
| - |
| - |
| ||||||||||||||||||||||||||||||||||||||||||||||||||||||||
Unrealized gain on investment in securities, net of tax |
| 7 |
| - |
| - |
| - |
| - |
| - |
| 7,127 |
| - |
| - |
| 7,127 |
| ||||||||||||||||||||||||||||||||||||||||||||||||||||||||||
Net income for 2015 |
|
|
|
| - |
|
|
| - |
|
|
| - |
|
|
| - |
|
|
| - |
|
|
| - |
|
|
| 527 |
|
|
| - |
|
|
| 527 |
| |||||||||||||||||||||||||||||||||||||||||
Balance, January 31, 2015 |
|
|
| 42,825,337 |
| $ | 45,205,901 |
| $ | 768,274 |
| $ | 1,916,575 |
| $ | 2,684,849 |
| $ | 87,588 |
| $ | (29,723,877 | ) |
| $ | 10,320 |
| $ | 18,264,781 |
| |||||||||||||||||||||||||||||||||||||||||||||||||
Common shares issued for cash: |
|
|
|
|
|
|
|
|
|
|
|
|
|
|
|
|
|
|
|
|
| ||||||||||||||||||||||||||||||||||||||||||||||||||||||||||
Private Placements |
| 9 |
| 5,000,000 |
| 162,500 |
| - |
| 87,500 |
| 87,500 |
| - |
| - |
| - |
| 250,000 |
| ||||||||||||||||||||||||||||||||||||||||||||||||||||||||||
Less: Share issuance costs |
|
|
| - |
| (1,126 | ) |
| - |
| - |
| - |
| - |
| - |
| - |
| (1,126 | ) | |||||||||||||||||||||||||||||||||||||||||||||||||||||||||
Common shares returned to treasury and cancelled |
| 10 |
| (4,150,000 | ) |
| (1,411,000 | ) |
| - |
| - |
| - |
| - |
| - |
| - |
| (1,411,000 | ) | ||||||||||||||||||||||||||||||||||||||||||||||||||||||||
Common shares repurchased and cancelled |
|
|
| (911,500 | ) |
| (320,431 | ) |
| - |
| - |
| - |
| - |
| - |
| - |
| (320,431 | ) | ||||||||||||||||||||||||||||||||||||||||||||||||||||||||
Common shares repurchased in treasury |
|
|
| (432,500 | ) |
| (132,309 | ) |
| - |
| - |
| - |
| - |
| - |
| - |
| (132,309 | ) | ||||||||||||||||||||||||||||||||||||||||||||||||||||||||
Share-based payments |
| 10 |
| - |
| - |
| 13,446 |
| 143,696 |
| 157,142 |
| - |
| - |
| - |
| 157,142 |
|
| 10 |
| - |
| - |
| 565,250 |
| - |
| 565,250 |
| - |
| - |
| - |
| 565,250 |
| |||||||||||||||||||||||||||||||||||||
Transfer of expired/cancelled options and warrants |
|
|
| - |
| - |
| (118,000 | ) |
| (1,725,445 | ) |
| (1,843,445 | ) |
| - |
| 1,843,445 |
| - |
| - |
|
|
|
| - |
| - |
| (269,581 | ) |
| (10,000 | ) |
| (279,581 | ) |
| - |
| 279,581 |
| - |
| - |
| |||||||||||||||||||||||||||||||
Unrealized loss on investment in securities, net of tax |
| 7 |
| - |
| - |
| - |
| - |
| - |
| (46,960 | ) |
| - |
| - |
| (46,960 | ) |
| 9 |
| - |
| - |
| - |
| - |
| - |
| (57,269 | ) |
| - |
| - |
| (57,269 | ) | |||||||||||||||||||||||||||||||||||
Net income for 2016 |
|
|
|
| - |
|
|
| - |
|
|
| - |
|
|
| - |
|
|
| - |
|
|
| - |
|
|
| 50,521 |
|
|
| - |
|
|
| 50,521 |
| |||||||||||||||||||||||||||||||||||||||||
Balance, January 31, 2016 |
|
|
|
| 47,825,337 |
|
| $ | 45,367,275 |
|
| $ | 663,720 |
|
| $ | 422,326 |
|
| $ | 1,086,046 |
|
| $ | 40,628 |
|
| $ | (27,829,911 | ) |
| $ | 10,320 |
|
| $ | 18,674,358 |
| |||||||||||||||||||||||||||||||||||||||||
Net income for 2018 |
|
|
|
| - |
|
|
| - |
|
|
| - |
|
|
| - |
|
|
| - |
|
|
| - |
|
|
| 2,015,340 |
|
|
| - |
|
|
| 2,015,340 |
| |||||||||||||||||||||||||||||||||||||||||
Balance, January 31, 2018 |
|
|
|
| 47,831,337 |
|
| $ | 44,356,316 |
|
| $ | 864,395 |
|
| $ | 317,904 |
|
| $ | 1,182,299 |
|
| $ | 23,808 |
|
| $ | (26,516,129 | ) |
| $ | 10,320 |
|
| $ | 19,056,614 |
| |||||||||||||||||||||||||||||||||||||||||
Common shares issued for cash: |
|
|
|
|
|
|
|
|
|
|
|
|
|
|
|
|
|
|
|
|
| ||||||||||||||||||||||||||||||||||||||||||||||||||||||||||
Exercise of stock options |
| 10 |
| 205,000 |
| 86,700 |
| (36,350 | ) |
| - |
| (36,350 | ) |
| - |
| - |
| - |
| 50,350 |
| ||||||||||||||||||||||||||||||||||||||||||||||||||||||||
Exercise of warrants and compensation options |
|
|
| 3,469,500 |
| 741,073 |
| - |
| (220,649 | ) |
| (220,649 | ) |
| - |
| - |
| - |
| 520,424 |
| ||||||||||||||||||||||||||||||||||||||||||||||||||||||||
Common shares returned to treasury and cancelled |
| 10 |
| (3,462,500 | ) |
| (1,350,962 | ) |
| - |
| - |
| - |
| - |
| - |
| - |
| (1,350,962 | ) | ||||||||||||||||||||||||||||||||||||||||||||||||||||||||
Share-based payments |
| 10 |
| - |
| - |
| 294,432 |
| - |
| 294,432 |
| - |
| - |
| - |
| 294,432 |
| ||||||||||||||||||||||||||||||||||||||||||||||||||||||||||
Transfer of expired/cancelled options and warrants |
|
|
| - |
| - |
| (26,500 | ) |
| (541 | ) |
| (27,041 | ) |
| - |
| 27,041 |
| - |
| - |
| |||||||||||||||||||||||||||||||||||||||||||||||||||||||
Unrealized loss on investment in securities, net of tax |
| 9 |
| - |
| - |
| - |
| - |
| - |
| (19,197 | ) |
| - |
| - |
| (19,197 | ) | |||||||||||||||||||||||||||||||||||||||||||||||||||||||||
Net income for 2019 |
|
|
|
| - |
|
|
| - |
|
|
| - |
|
|
| - |
|
|
| - |
|
|
| - |
|
|
| 704,296 |
|
|
| - |
|
|
| 704,296 |
| |||||||||||||||||||||||||||||||||||||||||
Balance, January 31, 2019 |
|
|
|
| 48,043,337 |
|
| $ | 43,833,127 |
|
| $ | 1,095,977 |
|
| $ | 96,714 |
|
| $ | 1,192,691 |
|
| $ | 4,611 |
|
| $ | (25,784,792 | ) |
| $ | 10,320 |
|
| $ | 19,255,957 |
| |||||||||||||||||||||||||||||||||||||||||
The accompanying notes are an integral part of the consolidated financial statements
| 49 |
| Table of Contents |
CORAL GOLD RESOURCES LTD.
CORAL GOLD RESOURCES LTD. Consolidated Statements of Cash Flows For the years ended January 31, 2019, 2018, and 2017 (Expressed in Canadian dollars) |
Consolidated Statements of Cash Flows
For the years ended January 31, 2016, 2015, and 2014
|
| Note |
| 2016 |
| 2015 |
| 2014 |
|
| Note |
|
| 2019 |
|
| 2018 |
|
| 2017 |
| ||||||||||
|
|
|
|
|
|
|
|
|
|
|
|
|
|
|
|
|
|
| |||||||||||||
CASH PROVIDED BY (USED IN): |
|
|
|
|
|
|
|
|
|
|
|
|
|
|
|
|
|
| |||||||||||||
|
|
|
|
|
|
|
|
|
|
|
|
|
|
|
|
|
|
| |||||||||||||
Operating Activities |
|
|
|
|
|
|
|
|
|
|
|
|
|
|
|
|
|
| |||||||||||||
Net income (loss) |
|
|
| $ | 50,521 |
| $ | 527 |
| $ | (50,871 | ) |
|
|
| $ | 704,296 |
| $ | 2,015,340 |
| $ | (981,139 | ) | |||||||
Adjustments for non-cash items: |
|
|
|
|
|
|
|
|
|
|
|
|
|
|
|
|
|
| |||||||||||||
Current income tax expense (recovery) |
|
|
| (309,024 | ) |
| 2,751,000 |
| - |
| |||||||||||||||||||||
Deferred income tax expense (recovery) |
|
|
| 13,000 |
| (1,001,000 | ) |
| 423,000 |
| |||||||||||||||||||||
Depreciation |
|
|
| 2,290 |
| 2,397 |
| 6,975 |
|
|
|
| 1,079 |
| 1,670 |
| 2,207 |
| |||||||||||||
Finance costs |
|
|
| - |
| 6,786 |
| 18,240 |
| ||||||||||||||||||||||
Finance income |
|
|
| (189,154 | ) |
| - |
| - |
| |||||||||||||||||||||
Foreign exchange gain |
|
|
| (1,225,704 | ) |
| (507,302 | ) |
| (37,713 | ) | ||||||||||||||||||||
Gain on sale of investments |
|
|
| (14,635 | ) |
| (93,693 | ) |
| - |
| ||||||||||||||||||||
Gain on sale of exploration and evaluation assets |
|
|
| - |
| (5,871,719 | ) |
| - |
| |||||||||||||||||||||
Other expenses |
|
|
| 289,136 |
| - |
| - |
| ||||||||||||||||||||||
Share-based payments |
|
|
| 157,142 |
| 259,163 |
| 9,350 |
|
|
|
|
| 294,432 |
|
|
| 565,250 |
|
|
| 72,398 |
| ||||||||
Gain on sale of investments |
|
|
| (27,059 | ) |
| (7,130 | ) |
| (107,300 | ) | ||||||||||||||||||||
Gain on forgiveness of debt |
|
|
| (5,250 | ) |
| - |
| - |
| |||||||||||||||||||||
Gain on settlement of debt |
|
|
| - |
| (25,719 | ) |
| (46,340 | ) | |||||||||||||||||||||
Foreign exchange gain (loss) |
|
|
| 55,070 |
| (14,363 | ) |
| (25,400 | ) | |||||||||||||||||||||
Finance costs |
|
|
| 17,389 |
| 14,519 |
| 11,850 |
| ||||||||||||||||||||||
Impairment of exploration and evaluation assets |
|
|
| 212,519 |
| - |
| 498,528 |
| ||||||||||||||||||||||
Deferred income tax recovery |
|
|
|
| (670,000 | ) |
|
| (476,720 | ) |
|
| (647,855 | ) | |||||||||||||||||
|
|
|
|
|
|
|
|
|
|
|
|
|
|
|
|
|
|
| |||||||||||||
|
|
|
| (207,378 | ) |
| (247,326 | ) |
| (351,063 | ) |
|
|
| (436,574 | ) |
| (2,133,668 | ) |
| (503,007 | ) | |||||||||
Net change in non-cash working capital |
| 16 |
|
| (2,668 | ) |
|
| (60,766 | ) |
|
| 59,374 |
|
| 15 |
|
| 76,312 |
|
|
| (113,747 | ) |
|
| 44,324 |
| |||
|
|
|
|
| (210,046 | ) |
|
| (308,092 | ) |
|
| (291,689 | ) |
|
|
|
|
|
|
|
|
| ||||||||
|
|
|
|
|
|
|
|
|
|
|
|
|
| (360,262 | ) |
|
| (2,247,415 | ) |
|
| (458,683 | ) | ||||||||
|
|
|
|
|
|
|
|
|
| ||||||||||||||||||||||
Investing Activities |
|
|
|
|
|
|
|
|
|
|
|
|
|
|
|
|
|
| |||||||||||||
Expenditures on exploration and evaluation assets |
|
|
| (191,679 | ) |
| (229,840 | ) |
| (218,352 | ) |
|
|
| (45,879 | ) |
| (265,059 | ) |
| (126,658 | ) | |||||||||
Proceeds on sale of mineral property |
|
|
| - |
| 20,184,056 |
| - |
| ||||||||||||||||||||||
Proceeds on sale of investments |
|
|
| 33,385 |
| 8,730 |
| 136,899 |
|
|
|
| 27,488 |
| 109,562 |
| - |
| |||||||||||||
Decrease (increase) in reclamation bond |
|
|
|
| 571,497 |
|
|
| (43,982 | ) |
|
| - |
| |||||||||||||||||
Increase in term deposits |
|
|
| (5,961,905 | ) |
| (3,694,415 | ) |
|
|
| ||||||||||||||||||||
Decrease in reclamation bond |
|
|
|
| - |
|
|
| 83,277 |
|
|
| - |
| |||||||||||||||||
|
|
|
|
|
|
|
|
|
| ||||||||||||||||||||||
|
|
|
|
| 413,203 |
|
|
| (265,092 | ) |
|
| (81,453 | ) |
|
|
|
| (5,980,296 | ) |
|
| 16,417,421 |
|
|
| (126,658 | ) | |||
|
|
|
|
|
|
|
|
|
|
|
|
|
|
|
|
|
|
| |||||||||||||
Financing Activities |
|
|
|
|
|
|
|
|
|
|
|
|
|
|
|
|
|
| |||||||||||||
Issuance of shares for cash, net |
|
|
|
| 248,874 |
|
|
| 712,250 |
|
|
| 366,450 |
| |||||||||||||||||
Issuance (repurchase) of shares for cash, net |
|
|
|
| (780,188 | ) |
|
| 96,760 |
|
|
| 41,467 |
| |||||||||||||||||
|
|
|
|
|
|
|
|
|
|
|
|
|
|
|
|
|
|
| |||||||||||||
Effect of exchange rate fluctuations on cash and equivalents |
|
|
|
| 358 |
|
|
| 435 |
|
|
| 316 |
| |||||||||||||||||
Effect of exchange rate fluctuations on cash and cash equivalents |
|
|
|
| 1,108,197 |
|
|
| (180 | ) |
|
| (1,243 | ) | |||||||||||||||||
|
|
|
|
|
|
|
|
|
|
|
|
|
|
|
|
|
|
| |||||||||||||
Change in cash and equivalents |
|
|
| 452,389 |
| 139,501 |
| (6,376 | ) |
|
|
| (6,012,549 | ) |
| 14,266,586 |
| (545,117 | ) | ||||||||||||
Cash and cash equivalents, beginning of year |
|
|
|
| 147,575 |
|
|
| 8,074 |
|
|
| 14,450 |
|
|
|
|
| 14,321,433 |
|
|
| 54,847 |
|
|
| 599,964 |
| |||
|
|
|
|
|
|
|
|
|
|
|
|
|
|
|
|
|
|
| |||||||||||||
Cash and cash equivalents, end of year |
|
|
| $ | 599,964 |
|
| $ | 147,575 |
|
| $ | 8,074 |
|
|
|
| $ | 8,308,884 |
|
| $ | 14,321,433 |
|
| $ | 54,847 |
| |||
|
|
|
|
|
|
|
|
|
|
|
|
|
|
|
|
|
|
| |||||||||||||
Supplementary Cash Flow Disclosures |
|
|
|
|
|
|
|
|
| ||||||||||||||||||||||
Cash paid during the year for: |
|
|
|
|
|
|
|
|
| ||||||||||||||||||||||
Interest expense |
|
|
| $ | - |
| $ | - |
| $ | - |
| |||||||||||||||||||
Income taxes |
|
|
| $ | - |
| $ | - |
| $ | - |
| |||||||||||||||||||
Expenditures on exploration and evaluation assets included in amounts payable to related parties |
|
|
| $ | (1,212 | ) |
| $ | (17,741 | ) |
| $ | (4,829 | ) | |||||||||||||||||
Expenditures on exploration and evaluation assets in the amount of forgiven debt (Note 4 a (4)) |
|
|
| $ | (69,030 | ) |
| $ | - |
|
| $ | - |
| |||||||||||||||||
Cash and cash equivalents consists of: |
|
|
|
|
|
|
|
|
| ||||||||||||||||||||||
Cash |
|
|
| $ | 4,592,134 |
| $ | 5,722,848 |
| $ | 54,847 |
| |||||||||||||||||||
Term deposits maturing in less than 90 days |
|
|
|
| 3,716,750 |
|
|
| 8,598,585 |
|
|
| - |
| |||||||||||||||||
|
|
|
|
|
|
|
|
|
| ||||||||||||||||||||||
|
|
|
| $ | 8,308,884 |
|
| $ | 14,321,433 |
|
| $ | 54,847 |
| |||||||||||||||||
Supplementary cash flow disclosures – Note 15
The accompanying notes are an integral part of the consolidated financial statements
| 50 |
| Table of Contents |
CORAL GOLD RESOURCES LTD.
Notes to the Consolidated Financial Statements
For the years ended January 31, 2016, 2015, and 2014
1. NATURE AND CONTINUANCE OF OPERATIONS
CORAL GOLD RESOURCES LTD. Notes to the Consolidated Financial Statements For the years ended January 31, 2019, 2018, and 2017 (Expressed in Canadian dollars)
1. NATURE OF OPERATIONS
Coral Gold Resources Ltd. (the "Company"“Company”) was incorporated in 1988 under the Company Act of British Columbia and is primarily involved in the exploration and development of its mineral properties.properties and holds a royalty interest in a mineral property owned by a third party. The Company'sCompany’s head office and principal place of business is Suite 900, 570 Granville Street, Vancouver, BC, Canada. The Company'sCompany’s common shares are traded on the TSX-V, OTCBB,OTCQX, and the Frankfurt Stock Exchange.
The business of mining and exploring for minerals involves a high degree of risk and there can be no assurance that current exploration programs will result in profitable mining operations. The recoverability of the carrying value of exploration and evaluation assets and the Company's ability to continue as a going concern is dependent upon the preservation of its interest in the underlying properties, the discovery of economically recoverable reserves, the achievement of profitable operations, or alternatively the ability of the Company to raise financing.
These consolidated financial statements have been prepared on a going concern basis, which assumes that the Company will be able to realize its assets and discharge its liabilities in the normal course of business. As at January 31, 2016, the Company has not yet generated any revenues from its operations and accumulated losses of $27,829,911. The Company is required to raise new financing through the sale of shares or issuance of debt to continue with its operations and to develop its mineral properties. Although management intends to secure additional financing, there is no assurance that management will be successful in its efforts to secure additional financing or that it will ever develop a self-supporting business. These factors together form a material uncertainty which may raise substantial doubt about the Company's ability to continue as a going concern. These consolidated financial statements do not include any adjustments that might result from the outcome of this uncertainty.
2. BASIS OF PRESENTATION
Statement of compliance
These consolidated financial statements have been prepared in accordance with International Financial Reporting Standards ("IFRS"(“IFRS”) as issued by the International Accounting Standards Board ("IASB"(“IASB”).
Basis of consolidation
The consolidated financial statements include the accounts of the Company and its US subsidiaries as follows:
Ownership Interest | Jurisdiction | Nature of Operations | |||||||
Coral Resources, Inc. | 100 | % | Nevada, USA | Exploration Company | |||||
Coral Energy Corporation | 100 | % | California, USA | Holding Company | |||||
Marcus Corporation | 98.49 | % | Nevada, USA | Holding Company | |||||
Intercompany balances and transactions, including unrealized income and expenses arising from intercompany transactions are eliminated in preparing the consolidated financial statements.
Basis of presentation
These consolidated financial statements are expressed in Canadian dollars, the Company's functionalCompany’s presentation currency, and have been prepared on a historical cost basis, except for financial instruments that have been measured at fair value. The accounting policies in Note 3 have been applied consistently to all periods presented.
Approval of the consolidated financial statements
These consolidated financial statements were reviewed by the Audit Committee and approved and authorized for issue by the Board of Directors on May 30, 2016.23, 2019.
| 51 |
| Table of Contents |
CORAL GOLD RESOURCES LTD. Notes to the Consolidated Financial Statements For the years ended January 31, 2019, 2018, and 2017 (Expressed in Canadian dollars) |
2. BASIS OF PRESENTATION (continued)
Foreign Currency Translationcurrency translation
The functional and reporting currency of the Company and its subsidiaries is the Canadian dollar. Transactions in currencies other than the Company's functional currency are recorded at the rates of exchange prevailing on the dates of the transactions. At each financial position reporting date, monetary assets and liabilities that are denominated in foreign currencies are translated at the rates prevailing at the date of the consolidated statement of financial position. Non-monetary items that are measured in terms of historical cost in a foreign currency are not retranslated. Foreign currency translation differences are recognized in net income or loss for the year.
Significant accounting judgements and estimates
The preparation of these consolidated financial statements requires management to make estimates and judgments that affect the reported amounts of assets and liabilities at the date of the consolidated financial statements and reported amounts of expenses during the reporting period. Actual outcomes could differ from these estimates under different assumptions and conditions.
CORAL GOLD RESOURCES LTD.
Notes to the Consolidated Financial Statements
For the years ended January 31, 2016, 2015, and 2014
2. BASIS OF PRESENTATION (continued)
Significant Accounting Judgements and Estimates
Significant assumptions about the future and other sources of estimation uncertainty that management has made at the consolidated statement of financial position date, that could result in a material adjustment to the carrying amounts of assets and liabilities, in the event that actual results differ from assumptions made, relate to, but are not limited to, the following:
| a) |
| |
| ||
Impairment of | ||
Management considers both external and internal sources of information in assessing whether there are any indications that the |
| b) | Valuation of share-based payments | ||
| |||
| |||
The Company uses the Black Scholes Option Pricing Model for valuation of share-based payments. Option pricing models require the input of subjective assumptions including expected price volatility, interest rate and forfeiture rate. Changes in the input assumptions can materially affect the fair value estimate and the |
CORAL GOLD RESOURCES LTD.
Notes to the Consolidated Financial Statements
For the years ended January 31, 2016, 2015, and 2014
2. BASIS OF PRESENTATION (continued)
Significant Accounting Judgements and Estimates (continued)
Recognition and measurement of deferred tax assets and liabilities | ||
Estimates of future taxable income are based on forecasted cash flows from operations and the application of existing tax laws in each jurisdiction. Weight is attached to tax planning opportunities that are within the |
3. SIGNIFICANT ACCOUNTING POLICIES
Basis of Consolidation
The consolidated financial statements include the accounts of the Company and its US subsidiaries.
|
|
| |
| d) | Measurement of royalty receivable and royalty interest | ||
|
|
| |
|
|
| 52 | |||||||||
|
|
| |||||||
|
|
| |||||||
|
|
| Table of Contents | ||||||
Intercompany balances and transactions, including unrealized income and expenses arising from intercompany transactions are eliminated in preparing the consolidated financial statements.
CORAL GOLD RESOURCES LTD. Notes to the Consolidated Financial Statements For the years ended January 31, 2019, 2018, and 2017 (Expressed in Canadian dollars)
3. SIGNIFICANT ACCOUNTING POLICIES
Financial Instruments
Measurement – initial recognition
All financial assets and financial liabilities are initially recorded at fair value and classified into oneon the Company’s consolidated statement of four categories: heldfinancial position when the Company becomes a party to maturity, available for sale, loans and receivable or fair value through profit or loss ("FVTPL").the contractual provisions of the instrument. All financial asset and liabilities are initially recorded at fair value, andnet of attributable transaction costs, except for those classified as eitherfair value through profit or loss (“FVTPL”). Subsequent measurement of financial assets and financial liabilities depends on the classifications of such assets and liabilities.
Classification – financial assets
Amortized cost:
Financial assets that are held within a business model whose objective is to hold financial assets in order to collect contractual cash flows, and that the contractual terms of the financial assets give rise on specified date to cash flows that are solely payments of principal and interest on the principal amount outstanding, are measured subsequent to initial recognition at amortized cost.
The amortized cost of a financial asset is the amount at which the financial asset is measured at initial recognition minus the principal repayments, plus the cumulative amortization using the effective interest method of any difference between that initial amount and the maturity amount, adjusted for any loss allowance. Interest income is recognized using the effect interest method, and is recognized in interest and other income, on the consolidated statements of operations and comprehensive income (loss).
The Company’s financial assets at amortized cost includes royalty receivable.
Fair value through other comprehensive income (“FVTOCI”)
Financial assets that are held within a business model whose objective is to hold financial assets in order to both collect contractual cash flows and selling financial assets, and that the contractual terms of the financial assets give rise on specified date to cash flows that are solely payments of principal and interest on the principal amount outstanding.
Upon initial recognition of equity securities, the Company may make an irrevocable election (on an instrument-by-instrument basis) to designate its equity securities that would otherwise be measured at FVTPL to present subsequent changes in fair value in other comprehensive income. Designation at FVTOCI is not permitted if the equity investment is held for trading or if it is contingent consideration recognized by an acquirer in a business combination. Investments in equity instruments at FVTOCI are initially measured at fair value plus transaction costs. Subsequently, they are measured at fair value with gains and losses arising from changes in fair value recognized in other OCI. The cumulative gain or loss is not reclassified to profit or loss on disposal of the instrument; instead, it is transferred to retained earnings.
The Company has designated all of its investments in equity securities as FVTOCI.
| 53 |
| Table of Contents |
CORAL GOLD RESOURCES LTD. Notes to the Consolidated Financial Statements For the years ended January 31, 2019, 2018, and 2017 (Expressed in Canadian dollars) |
3. SIGNIFICANT ACCOUNTING POLICIES (continued)
Financial Instruments (continued)
Fair value through profit or loss (“FVTPL”)
By default, all other financial liabilities. Financial instruments compriseassets are measured subsequently at FVTPL. The Company’s financial assets at FVTPL includes cash and cash equivalents investmentsand term deposits.
Classification – financial liabilities
Financial liabilities that are not contingent consideration of an acquirer in related companies, amounts due from a related party,business combination, held for trading or designated as at FVTPL, are measured at amortized cost using the effective interest method.
Financial liabilities at amortized cost include accounts payable, and amounts due to related parties. At
Financial liabilities classified FVTPL include financial liabilities held for trading and financial liabilities designated upon initial recognition management hasas FVTPL. Fair value changes on financial liabilities classified financial assets and liabilities as follows:
CORAL GOLD RESOURCES LTD.
Notes toFVTPL are recognized in the Consolidated Financial Statements
For the years ended January 31, 2016, 2015, and 2014
3. SIGNIFICANT ACCOUNTING POLICIES (continued)
Financial Instruments (continued)consolidated statements of operations.
The Company has classified its cashno hedging arrangements and cash equivalents as FVTPL. Investments in related companies are classified as available for sale and amounts due from a related party are classified as loans and receivables. Accounts payable and amounts due to related parties are classified as other liabilities.does not apply hedge accounting.
Fair value hierarchyImpairment
Fair value measurementsThe Company recognizes a loss allowance for expected credit losses on its financial assets when necessary. The amount of financial instruments are requiredexpected credit losses is updated at each reporting period to be classified using a fair value hierarchy that reflects the significance of inputsreflect changes in making the measurements. The levelscredit risk since initial recognition of the fair value hierarchy are defined as follows:respective financial instruments.
Level 1 – Quoted prices (unadjusted) in active markets for identical assets or liabilities.
Level 2 – Inputs other than quoted prices included within Level 1 that are observable for the asset or liability, either directly or indirectly.
Level 3 – Inputs for the asset or liability that are not based on observable market data.
Cash and cash equivalents
Cash and cash equivalents in the consolidated statements of financial position comprise cash at banks and on hand, and short termshort-term deposits with an original maturity of three months or less, which are cashable readily convertible into a known amounts of cash.
CORAL GOLD RESOURCES LTD. Notes to the Consolidated Financial Statements For the years ended January 31, 2019, 2018, and 2017 (Expressed in Canadian dollars) |
3. SIGNIFICANT ACCOUNTING POLICIES (continued)
Exploration and evaluation assets
The Company is in the exploration stage with respect to its mineral properties and capitalizes all costs relating to the acquisition, exploration and evaluation of mineral claims and recognizes any proceeds received as a reduction of the cost of the related claims. At such time as commercial production commences, these costs will be charged to operations on a unit-of-production method based on proven and probable reserves. The aggregate costs related to abandoned mineral claims are charged to operations at the time of any abandonment. All capitalized exploration and evaluation expenditures are monitored for indications of impairment. Where a potential impairment is indicated, assessments are performed for each area of interest. To the extent that exploration expenditure is not expected to be recovered, it is charged to the results of operations. An impairment charge relating to a mineral property is subsequently reversed when new exploration results or actual or potential proceeds on sale or farm out of the property result in a revised estimate of the recoverable amount, but only to the extent that this does not exceed the original carrying value of the property that would have resulted if no impairment had been recognized.
The recoverability of amounts shown for exploration and evaluation assets is dependent upon the discovery of economically recoverable reserves, the ability of the Company to obtain financing to complete development of the properties, and on future production or proceeds of disposition.
Incidental revenues and operating costs are included in exploration and evaluation assets prior to commercial production.
Once the technical feasibility and commercial viability of the extraction of mineral resources in an area of interest are demonstrable, exploration and evaluation assets attributable to that area of interest are first tested for impairment and then reclassified to mine development properties, and subsequently amortized over the life of the resources associated with the area of interest once mining operations have commenced.
CORAL GOLD RESOURCES LTD.
Notes to the Consolidated Financial Statements
For the years ended January 31, 2016, 2015, and 2014
3. SIGNIFICANT ACCOUNTING POLICIES (continued)
Property and equipment
Property and equipment are recorded at historical cost less accumulated depreciation and impairment. Historical costs include expenditures that are directly attributable to bringing the asset to a location and condition necessary to operate in a manner intended by management. Such costs are accumulated as construction in progress until the asset is available for use, at which point the asset is classified as plant and equipment. Once commercial production has commenced, certain equipment are depreciated using the units of production method, if sufficient reserve information is available or the straight-line method over their estimated useful lives, not to exceed the life of the mine to which the assets related.
Property and equipment are depreciated annually using the following methods and rates:
Buildings | 10% declining balance | ||
Computer hardware | 20% declining balance | ||
Equipment | 20% declining balance | ||
Vehicles | 5 years straight line |
An item of property and equipment is derecognized upon disposal or when no future economic benefits are expected to arise from the continued use of the asset. Any gain or loss arising on disposal of the asset, determined as the difference between the net disposal proceeds and the carrying amount of the asset, is recognized in profit or loss in the consolidated statements of comprehensive income or loss.
Where an item of property and equipment comprises major components with different useful lives, the components are accounted for as separate items of property and equipment. Expenditures incurred to replace a component of an item of plant and equipment that is accounted for separately, including major inspection and overhaul expenditures, are capitalized.
CORAL GOLD RESOURCES LTD. Notes to the Consolidated Financial Statements For the years ended January 31, 2019, 2018, and 2017 (Expressed in Canadian dollars) |
3. SIGNIFICANT ACCOUNTING POLICIES (continued)
Royalty interests
Royalty interests consist of royalty agreements. These interests are recorded at cost and capitalized as tangible assets with finite lives. They are subsequently measured at cost less accumulated depletion and accumulated impairment losses, if any. Project evaluation costs that are not related to a specific agreement are expensed in the period incurred.
Producing royalty interests are depleted using the units-of-production method over the life of the property to which the interest relates, which is estimated using available information of proven and probable reserves and the portion of resources expected to be classified as mineral reserves at the mine corresponding to the specific agreement.
On acquisition of royalty interests, an allocation of its fair value is attributed to the exploration potential of the interest and is recoded as an asset on the acquisition date. The value of the exploration potential is accounted for in accordance with IFRS 6 Exploration and Evaluation of Mineral Resources and is not depleted until such time as the technical feasibility and commercial viability have been established at which point the value of the asset is accounted for in accordance with IAS 16 Property, Plant and Equipment.
Impairment
At each financial reporting date, the carrying amounts of the Company'sCompany’s assets are reviewed to determine whether there is any indication that those assets are impaired. If any such indication exists, the recoverable amount of the asset is estimated in order to determine the extent of the impairment, if any. Where the asset does not generate cash flows that are independent from other assets, the Company estimates the recoverable amount of the cash-generating unit to which the asset belongs.
An asset'sasset’s recoverable amount is the higher of fair value less costs to sell and value in use. Fair value is determined as the amount that would be obtained from the sale of the asset in an arm'sarm’s length transaction between knowledgeable and willing parties. In assessing value in use, the estimated future cash flows are discounted to their present value using a pre-tax discount rate that reflects current market assessments of the time value of money and the risks specific to the asset. If the recoverable amount of an asset or cash generating unit is estimated to be less than its carrying amount, the carrying amount of the asset is reduced to its recoverable amount and the impairment loss is recognized in the profit or loss for the year.
Where an impairment loss subsequently reverses, the carrying amount of the asset (or cash-generating unit) is increased to the revised estimate of its recoverable amount, but so that the increased carrying amount does not exceed the carrying amount that would have been determined had no impairment loss been recognized for the asset (or cash-generating unit) in prior years. A reversal of an impairment loss is recognized immediately in profit or loss.
Share capital
Share capital is classified as equity. Incremental costs directly attributable to the issue of shares and share options are recognized as a deduction from equity. When share capital is repurchased, the amount of the consideration paid, included directly attributable costs is recognized as a deduction from equity. Repurchased shares are classified as treasury shares and are presented as a deduction from equity. When treasury shares are subsequently reissued, the amount received is recognized as an increase in equity, and the resulting surplus or deficit on the transaction is transferred to or from accumulated deficit.
Accounting for equity units
Proceeds received on the issuance of units, comprised of common shares and warrants,are allocated based on the relative fair value approach which considers the value determined by the Black-Scholes option pricing model for the warrants.
| 56 |
| Table of Contents |
CORAL GOLD RESOURCES LTD.
CORAL GOLD RESOURCES LTD. Notes to the Consolidated Financial Statements For the years ended January 31, 2019, 2018, and 2017 (Expressed in Canadian dollars) |
Notes to the Consolidated Financial Statements
For the years ended January 31, 2016, 2015, and 2014
3. SIGNIFICANT ACCOUNTING POLICIES (continued)
Share-based payment transactions
The share option plan allows Company employees, directors and consultants to acquire shares of the Company. All options granted are measured at fair value and are recognized in expenses as share-based payments with a corresponding increase in equity reserves. An individual is classified as an employee when the individual is an employee for legal or tax purposes (direct employee) or provides services similar to those performed by a direct employee.
The fair value of employee options is measured at grant date, and each tranche is recognized using the graded vesting method over the period during which the options vest. The fair value of the options granted is measured using the Black-Scholes option pricing model taking into account the terms and conditions upon which the options were granted. For non-employees, share-based payments are measured at the fair value goods and services received or the fair value or the fair value of the equity instruments issued, if it is determined the fair value cannot be reliably measured, and are recorded at the date the goods or services are received. The fair value of the options is accrued and charged either to operations or exploration and evaluation assets, with the offset credit to equity reserves. This includes a forfeiture estimate, which is revised for actual forfeitures in subsequent periods. Upon the expiration or cancellation of unexercised stock options, the Company will transfer the value attributed to those stock options from equity reserves to accumulated deficit.
Revenue recognition
Revenue, when earned, is expected to be comprised of revenue from contracts with customers under its royalty interests. The Company has determined that each unit of a commodity that is delivered to a customer under a royalty interest arrangement is a performance obligation for the delivery of a good that is separate from each other unit of the commodity to be delivered under the same arrangement. In accordance with IFRS 15, the Company recognizes revenue to depict the transfer of the relevant commodity to customers in an amount that reflects the consideration to which the Company expects to be entitled in exchange for those commodities.
For royalty interests, revenue recognition occurs when the relevant commodity is transferred to the end customer by the operator of the royalty property. Revenue is measured at the fair value of the consideration received or receivable when management can reliably estimate the amount, pursuant to the terms of the royalty agreement. In some instances, the Company will not have access to sufficient information to make a reasonable estimate of consideration to which it expects to be entitled and, accordingly, revenue recognition is deferred until management can make a reasonable estimate. Differences between estimates and actual amounts are adjusted and recorded in the period that the actual amounts are known.
Provisions
Provisions are recognized where a legal or constructive obligation has been incurred as a result of past events, it is probable that an outflow of resources embodying economic benefit will be required to settle the obligation and a reliable estimate of the amount of the obligation can be made. If material, provisions are measured at the present value of the expenditures expected to be required to settle the obligation. The increase in any provision due to passage of time is recognized as accretion expense.
CORAL GOLD RESOURCES LTD. Notes to the Consolidated Financial Statements For the years ended January 31, 2019, 2018, and 2017 (Expressed in Canadian dollars) |
3. SIGNIFICANT ACCOUNTING POLICIES (continued)
Reclamation provision
The Company records the present value of estimated costs of legal and constructive obligations required to restore mineral properties in the period in which the obligation is incurred. The nature of these restoration activities includes dismantling and removing structures, rehabilitating mines and restoration, reclamation and re-vegetation of affected areas. The reclamation provisions are initially recorded with corresponding increase to the carrying amount of related mineral properties.
When the liability is initially recognized, the present value of the estimated cost is capitalized by increasing the carrying amount of the related mineral property. Over time, the discounted liability is increased for the change in present value based on the risk-free interest rate applicable to the future cash outflows, which is accreted over time through periodic charges to income or loss.
IncomeEarnings (loss) per share
The Company presents basic and diluted income (loss) per share data for its common shares, calculated by dividing the income (loss) attributable to common shareholders of the Company by the weighted average number of common shares outstanding during the period. Diluted income (loss) per share is determined by adjusting the income (loss) attributable to common shareholders and the weighted average number of common shares outstanding for the effects of all dilutive potential common shares. In the Company's case,
The calculations for basic and diluted incomeearnings (loss) per share is the sameare as basic income (loss) per share as the effects of including all outstanding options and warrants would be anti-dilutive.follows:
CORAL GOLD RESOURCES LTD.
Notes to the Consolidated Financial Statements
For the years ended January 31, 2016, 2015, and 2014
3. SIGNIFICANT ACCOUNTING POLICIES (continued)
|
| 2019 |
|
| 2018 |
|
| 2017 |
| |||
Net income (loss) for the period |
| $ | 704,296 |
|
| $ | 2,015,340 |
|
| $ | (981,139 | ) |
Basic weighted average number of shares outstanding |
|
| 48,672,608 |
|
|
| 47,570,158 |
|
|
| 48,396,734 |
|
Dilutive stock options |
|
| 700,150 |
|
|
| 606,119 |
|
|
| - |
|
Dilutive warrants |
|
| 453,671 |
|
|
| 2,333,005 |
|
|
| - |
|
Diluted weighted average number of shares outstanding |
|
| 49,826,429 |
|
|
| 50,509,282 |
|
|
| 48,396,734 |
|
Basic earnings per share |
| $ | 0.01 |
|
| $ | 0.04 |
|
| $ | (0.02 | ) |
Diluted earnings per share |
| $ | 0.01 |
|
| $ | 0.04 |
|
| $ | (0.02 | ) |
Income taxes
Income tax on the profit or loss for the years presented comprises current and deferred tax. Income tax is recognized in profit or loss, except to the extent that it relates to items recognized directly in equity, in which case it is recognized as equity.
Deferred tax is provided using the liability method, providing for temporary differences between the carrying amounts of assets and liabilities for financial reporting purposes and the amounts used for taxation purposes.
The amount of deferred tax provided is based on the expected manner of realization or settlement of the carrying amount of assets and liabilities, using tax rates enacted or substantively enacted at the consolidated statement of financial position date.
A deferred tax asset is recognized only to the extent that it is probable that future taxable profits will be available against which the asset can be utilized.
New accounting standards adopted by the Company
| 58 |
| Table of Contents |
CORAL GOLD RESOURCES LTD. Notes to the Consolidated Financial Statements For the years ended January 31, 2019, 2018, and 2017 (Expressed in Canadian dollars)There were no
4. RECENT ACCOUNTING PRONOUNCEMENTS
Application of new orand revised accounting standards applicable to the Company scheduled for mandatory adoption on February 1, 2016, and thus no standards were adopted in the current year. standards:
IFRS 15 – Revenue from Contracts with Customers
Accounting Standards and Amendments Issued But Not Yet Effective
The following accounting standards were issued but not yet effective as of January 31, 2016:
IFRS 10 Consolidated Financial Statements
The amendments to IFRS 10 require a full gain or loss to be recognized when a transaction involves a business (whether it is housed in a subsidiary or not), while a partial gain or loss would be recognized when a transaction involves assets that do not constitute a business, even if the assets are housed in a subsidiary. The amendments have been adopted byOn February 1, 2018, the Company effective January 1, 2016adopted the requirements of IFRS 15. IFRS 15 covers principles that an entity shall apply to report useful information to users of the financial statements about the nature, amount, timing, and uncertainty of revenue and cash flows arising from a contract with a customer. The Company currently has no significantrevenues, and there was no impact on its consolidated financial statements.
IFRS 159 – Revenue from Contracts with CustomersFinancial Instruments
In MayJuly 2014, the IASB issued the final version of IFRS 159 – Revenue from Contracts with Customers ("Financial Instruments (“IFRS 15"9”) which supersedesto replace IAS 1139 – Construction Contracts, IAS 18 – Revenue, IFRIC 13 – Customer Loyalty Programmes, IFRIC 15 – AgreementsFinancial Instruments: Recognition and Measurement in its entirety. IFRS 9 provides a revised model for the Construction of Real Estate, IFRIC 18 – Transfers of Assets from Customers, and SIC 31 – Revenue – Barter Transactions Involving Advertising Services. IFRS 15 establishes a comprehensive five-step framework for the timingrecognition and measurement of revenue recognition.financial instruments and a single, forward-looking ‘expected-loss’ impairment model, as well as a substantially reformed approach to hedge accounting. The standard is effective for annual periods beginning on or after January 1, 2018. Application of the expected credit loss model at the date of adoption did not have a significant impact on the Company’s financial assets because the Company determined that the expected credit losses on its financial assets were nominal. There were no impairment losses recognized on financial assets during the years ended January 31, 2019 and January 31, 2018. The Company is currently evaluating thestandard did not impact the final standard may have on its consolidated financial statements.
IFRS 9 – Financial Instruments
The IASB intends to replace IAS 39 – Financial Instruments: Recognition and Measurement in its entirety with IFRS 9 – Financial Instruments ("IFRS 9") which is intended to reduce the complexity in theCompany’s classification and measurement of financial instruments. In February 2014,assets and liabilities except for royalty receivable which was reclassified from loans and receivables to amortized costs. There was no significant impact on the IASB tentatively determined thatcarrying amounts of the revised effective date for IFRS 9 would be January 1, 2018. The Company is currently evaluatingCompany’s financial instruments at the impact the final standard may have on its consolidated financial statements.transition date.
Changes in accounting standards not yet effective:
IFRS 7 Financial instruments: Disclosure16 Leases
IFRS 7 was amended to require additional disclosures on transition from IAS 39 to IFRS 9. The standard is effective on adoption of IFRS 9, which is effective for annual periods commencing on or after January 1, 2018. The Company is currently evaluating the impact this standard is expected to have on its consolidated financial statements.
CORAL GOLD RESOURCES LTD.
Notes to the Consolidated Financial Statements
For the years ended January 31, 2016, 2015, and 2014
3. SIGNIFICANT ACCOUNTING POLICIES (continued)
In January 2016, the IASB issued IFRS 16 – Leases
(“IFRS 16 was issued on January 13, 2016,16”) which replaces IAS 17 – Leases and its associated interpretative guidance, and will be effective for accounting periods beginning on or after January 1, 2019. Early adoption is permitted, provided the Company has adopted IFRS 15. This standard sets out a new model for lease accounting. A lessee can choose to apply IFRS 16 using either a full retrospective approach or a modified retrospective approach. The Company plans to apply IFRS 16 at the date it becomes effective and has not yet selected a transition approach.
The Company has identified existing agreements that may contain right-of-use assets. At this time, the Company does not believe that the new standard will give rise to a material change, and is currently evaluatingfinalizing the expected impact on the finalconsolidated financial statements.
| 59 |
| Table of Contents |
CORAL GOLD RESOURCES LTD. Notes to the Consolidated Financial Statements For the years ended January 31, 2019, 2018, and 2017 (Expressed in Canadian dollars) |
4. RECENT ACCOUNTING PRONOUNCEMENTS (continued)
IFRS 3 – Definition of a Business
In October 2018, the IASB issued amendments to IFRS 3 – Definition of a Business which:
| · | Clarify that to be considered a business, an acquired set of activities and assets must include, at a minimum, an input and a substantive process that together significantly contribute to the ability to create outputs; | |
| · | Narrow the definitions of a business and of outputs by focusing on goods and services provided to customers and by removing the reference to an ability to reduce costs; | |
| · | Add guidance and illustrative examples to help entities assess whether a substantive process has been acquired; | |
| · | Remove the assessment of whether market participants are capable of replacing any missing inputs or processes and continuing to produce outputs; and | |
| · | Add an option concentration test that permits a simplified assessment of whether an acquired set of activities and assets is not a business. |
The amendments are effective for business combinations for which the acquisition date is on or after the beginning of the first annual reporting period beginning on or after January 1, 2020, and to asset acquisitions that occurred on or after the beginning of that period. Earlier application is permitted. The Company does not expect the application of the standard is expected towill have a significant impact on itsthe Company’s consolidated financial statements.
IFRIC 23 - Uncertainty over Income Tax Treatments
IFRIC 23 (the "Interpretation") sets out how to determine the accounting tax position when there is uncertainty over income tax treatments. The Interpretation requires an entity to determine whether uncertain tax positions are assessed separately or as a group; and assess whether it is probable that a tax authority will accept an uncertain tax treatment used, or proposed to be used, by an entity in its income tax filings. If yes, the entity should determine its accounting tax position consistently with the tax treatment used or planned to be used in its income tax filings. If no, the entity should reflect the effect of uncertainty in determining its accounting tax position. The Interpretation is effective for annual periods beginning on or after January 1, 2019. Entities can apply the Interpretation with either full retrospective application or modified retrospective application without restatement of comparatives retrospectively or prospectively. The Company does not expect the application of the Interpretation will have a significant impact on the Company’s consolidated financial statements.
4.Annual Improvements 2015-2017 Cycle
In December 2017, the IASB issued the Annual Improvements 2015-2017 cycle, containing amendments to IFRS 3 - Business Combinations ("IFRS 3"), IFRS 11 - Joint Arrangements, IAS 12 - Income Taxes, and IAS 23 - Borrowing Costs. These amendments are effective for annual periods beginning on or after January 1, 2019 and are not expected to have a significant impact on the Company's consolidated financial statements
| 60 |
| Table of Contents |
CORAL GOLD RESOURCES LTD. Notes to the Consolidated Financial Statements For the years ended January 31, 2019, 2018, and 2017 (Expressed in Canadian dollars) |
5. DISPOSITION OF EXPLORATION AND EVALUATION ASSETS
On June 8, 2017, the Company announced that it has closed the previously announced purchase and sale agreement (the “Agreement”) with Barrick Cortez Inc. (“Barrick”), a subsidiary of Barrick Gold Corp., for the sale of the Robertson Property in Lander County, Nevada, to Barrick. The Robertson Property sold to Barrick includes four contiguous claim groups known as the Core, Gold Ridge, Excluded, and the RUF mining claims, but does not include the portions of mining claims known as the Norma, Sass, Eagle, and JDN, which will remain owned by the Company.
The sale consideration is as follows:
| · | Payment to the Company of US$15.75 million (approximately Cdn $21.84 million based on foreign exchange rates) in cash; | |
| · | The return of 4,150,000 common shares of the Company held by Barrick (which represented approximately 8.5% of the Company’s basic common shares outstanding as of June 8, 2017) for cancellation by the Company; and | |
| · | A sliding scale 1% to 2.25% net smelter returns royalty (the “NSR”) on the Robertson Property, payable quarterly, subject to potential advance royalty payments as outlined below, as well as a right of first refusal enabling Barrick to acquire the NSR in the event that the Company wishes to sell the NSR to any third party. |
The sliding scale NSR rate will be determined based on the observed gold price during each quarterly period based on the average LBMA Gold Price PM during the quarterly period, as follows:
Average Gold Price/Oz During the Quarter (USD) | Applicable NSR Royalty Rate | |||
Up to and including $1,200.00 | 1.00 | % | ||
$1,200.01 to $1,400.00 | 1.25 | % | ||
$1,400.01 to $1,600.00 | 1.50 | % | ||
$1,600.01 to $1,800.00 | 1.75 | % | ||
$1,800.01 to $2,000.00 | 2.00 | % | ||
Over $2,000.00 | 2.25 | % | ||
Pursuant to the Agreement, as amended, and due to the delay in closing, in the event that the Robertson Property is not placed into production by December 31, 2024, then beginning on January 1, 2025, and continuing on an annual basis thereafter until the earlier of (i) the date commercial production commences and (ii) January 2, 2034, Barrick will make advance royalty payments to the Company of US$0.5 million, which will be non-refundable and fully credited against any future obligations under the NSR.
The fair value of the royalty receivable (Note 8) was estimated based on the present value of the advance royalty payments, using a discount rate of 5.04%. A value of $1 was allocated to the royalty interest above the estimated fair value of the non-refundable advanced royalty payments.
Barrick will also assume liabilities relating to the Robertson Property, and will provide replacement security for the reclamation bond.
As a result of the transaction, the Company recorded a gain of $5,871,719, net of transaction costs, which has been included in Other Items on the consolidated statements of operations and comprehensive income (loss).
| 61 |
| Table of Contents |
CORAL GOLD RESOURCES LTD. Notes to the Consolidated Financial Statements For the years ended January 31, 2019, 2018, and 2017 (Expressed in Canadian dollars) |
6. EXPLORATION AND EVALUATION ASSETS
The Company has accumulated the following acquisition and exploration expenditures:
|
| Robertson |
|
| Ruf and Norma |
|
| Other |
|
| Total |
| ||||
|
|
|
|
|
|
|
|
|
|
|
|
| ||||
Balance, January 31, 2014 |
| $ | 18,974,552 |
|
| $ | 52,489 |
|
| $ | 3 |
|
| $ | 19,027,044 |
|
|
|
|
|
|
|
|
|
|
|
|
|
|
|
|
|
|
Exploration costs during 2015: |
|
|
|
|
|
|
|
|
|
|
|
|
|
|
|
|
Consulting |
|
| 42,269 |
|
|
| - |
|
|
| - |
|
|
| 42,269 |
|
Lease payments |
|
| 13,376 |
|
|
| - |
|
|
| - |
|
|
| 13,376 |
|
Taxes, licenses and permits |
|
| 62,910 |
|
|
| 7,138 |
|
|
| - |
|
|
| 70,048 |
|
|
|
|
|
|
|
|
|
|
|
|
|
|
|
|
|
|
Balance, January 31, 2015 |
| $ | 19,093,107 |
|
| $ | 59,627 |
|
| $ | 3 |
|
| $ | 19,152,737 |
|
Acquisition costs |
|
| 37,157 |
|
|
| 31,873 |
|
|
| - |
|
|
| 69,030 |
|
Exploration costs during 2016: |
|
|
|
|
|
|
|
|
|
|
|
|
|
|
|
|
Consulting |
|
| 44,880 |
|
|
| - |
|
|
| - |
|
|
| 44,880 |
|
Lease payments |
|
| 27,997 |
|
|
| - |
|
|
| - |
|
|
| 27,997 |
|
Taxes, licenses and permits |
|
| 101,927 |
|
|
| 8,301 |
|
|
| - |
|
|
| 110,228 |
|
Impairment write-down |
|
| (212,519 | ) |
|
| - |
|
|
| - |
|
|
| (212,519 | ) |
|
|
|
|
|
|
|
|
|
|
|
|
|
|
|
|
|
Balance, January 31, 2016 |
| $ | 19,092,549 |
|
| $ | 99,801 |
|
| $ | 3 |
|
| $ | 19,192,353 |
|
|
| Robertson Property |
|
| Ruf & Norma Sass Claims |
|
| Eagle & JDN Claims |
|
| Robertson Royalty Interest |
|
| Total |
| |||||
|
|
|
|
|
|
|
|
|
|
|
|
|
|
|
| |||||
Balance, January 31, 2017 |
| $ | 19,111,111 |
|
| $ | 132,554 |
|
| $ | 14,692 |
|
| $ | 1 |
|
| $ | 19,258,358 |
|
|
|
|
|
|
|
|
|
|
|
|
|
|
|
|
|
|
|
|
|
|
Exploration costs during the year: |
|
|
|
|
|
|
|
|
|
|
|
|
|
|
|
|
|
|
|
|
Consulting |
|
| 25,717 |
|
|
| - |
|
|
| - |
|
|
| - |
|
|
| 25,717 |
|
Drilling |
|
| - |
|
|
| - |
|
|
| 8,143 |
|
|
| - |
|
|
| 8,143 |
|
Lease payments |
|
| 5,168 |
|
|
| - |
|
|
| - |
|
|
| - |
|
|
| 5,168 |
|
Royalties |
|
| - |
|
|
| 22,664 |
|
|
| - |
|
|
| - |
|
|
| 22,664 |
|
Taxes, licenses and permits |
|
| 7,129 |
|
|
| 7,377 |
|
|
| 14,417 |
|
|
| - |
|
|
| 28,923 |
|
Proceeds from sale of mineral property (Note 5) |
|
| (19,149,126 | ) |
|
| - |
|
|
| - |
|
|
| 1 |
|
|
| (19,149,125 | ) |
|
|
|
|
|
|
|
|
|
|
|
|
|
|
|
|
|
|
|
|
|
Balance, January 31, 2018 |
| $ | - |
|
| $ | 162,595 |
|
| $ | 37,252 |
|
| $ | 1 |
|
| $ | 199,848 |
|
|
|
|
|
|
|
|
|
|
|
|
|
|
|
|
|
|
|
|
|
|
Exploration costs during the year: |
|
|
|
|
|
|
|
|
|
|
|
|
|
|
|
|
|
|
|
|
Drilling |
|
| - |
|
|
| 8,823 |
|
|
| - |
|
|
| - |
|
|
| 8,823 |
|
Royalties |
|
| - |
|
|
| 4,695 |
|
|
| - |
|
|
| - |
|
|
| 4,695 |
|
Taxes, licenses and permits |
|
| - |
|
|
| 7,836 |
|
|
| 15,685 |
|
|
| - |
|
|
| 23,521 |
|
|
|
|
|
|
|
|
|
|
|
|
|
|
|
|
|
|
|
|
|
|
Balance, January 31, 2019 |
| $ | - |
|
| $ | 183,949 |
|
| $ | 52,937 |
|
| $ | 1 |
|
| $ | 236,887 |
|
The Company has certain interests in 688108 patented and unpatented lode mining claims located in Lander County, Nevada, subject to net smelter returns ("NSR"(“NSR”) on production ranging from 4% to 10%, and which certain leases provide for advanced royalty payments.
| a) |
|
|
|
|
|
|
CORAL GOLD RESOURCES LTD.
Notes to the Consolidated Financial Statements
For the years ended January 31, 2016, 2015, and 2014
4. EXPLORATION AND EVALUATION ASSETS (continued)
|
| |
| ||
The Company holds
|
(i) Chachas/Moore Lease
The Company assumed an option-to-purchase agreement dated November 30, 1975 related to 13 mineral claims, which form part of the Core claims of the Robertson Property. The total purchase price of the claims is US$2,000,000, which is payable in installments of US$1,000 per month until paid in full.
The property is subject to an 8% NSR. Any NSR royalty payments paid to the lessors are credited against the minimum monthly payments for a period equal to the value of the royalties paid at a rate of US$1,000 per month.
(ii) Blue Nugget, Lander Ranch, and Norma Sass Claims
The Company entered a mineral lease and option-to-purchase agreement with respect to 9 Blue Nugget claims, 27 Lander Ranch claims, 24 Norma claims, and 11 Sass claims, of which the Blue Nugget and Lander Ranch claims form part of the Core claims of the Robertson Property, and the Norma and Sass claims form part of the Norma Sass Property (Note 4b). Pursuant to the fifth amending agreement, the term of the lease was extended to April 21, 2013 and was left to expire. The total purchase price of the claims is US$1,500,000, which is payable in annual installments of $500 per claim until paid in full.
In October 2015, the Company entered into a revised mining lease agreement to lease 9 Blue Nugget claims and 27 Lander Ranch claims (the "Property") for a term of ten years, which replaces the agreement above. In consideration of the lease, the Company agreed to keep the claims in good standing by paying the annual federal and local claim maintenance fees, commencing with the 2015-2016 assessment year. The Company also has the option to purchase all of the owner's right, title, and interest in the Property, including owner's reserved royalty, for the sum of US$108,000 within twelve months of the agreement date. In each year thereafter, the option price will be increased by 10% or US$10,800. The owner reserves the right to continue exploration, development, mining, and sale of turquoise on the Property, and agrees to defend, indemnify, and hold the Company harmless from all claims, demands, and liabilities arising from these activities.
(iii) Northern Nevada Lease
The Company entered a mineral lease with respect to 12 claims, which form part of the Core claims of the Robertson Property with an indefinite term. The claims are subject to a 4% NSR for which the Company is required to make minimum annual advanced royalty payments in the amount of $9,600 per year throughout the term of the lease. Of these 12 claims, 5 are part of the Core claims and 7 are part of Gold Ridge claims.
CORAL GOLD RESOURCES LTD.
Notes to the Consolidated Financial Statements
For the years ended January 31, 2016, 2015, and 2014
4. EXPLORATION AND EVALUATION ASSETS (continued)
|
| |
| ||
|
(i) Breckon Lease June Claims
The Company entered a mineral lease and option-to-purchase agreement granting it the exclusive rights to explore, develop, and exploit six lode mining claims, which form part of the Gold Ridge claims of the Robertson Property. The agreement is for an initial term of four years expiring on March 22, 2012 in consideration of the payment of an annual rent of US$25,000, renewable in successive four-year terms, provided that the rent will increase by US$5,000 every four years. The agreement was renewed in March 2012 until March 2016, with annual rent of US$30,000.
The property is subject to a 3% NSR royalty, subject to the Company's exclusive right to purchase the NSR for US$1,000,000 per percentage point. The Company also has the exclusive right to purchase the property, subject to the NSR, for US$1,000,000.
In March 2016, the Company determined that the six lode mining claims that were leased under the Breckon Lease June Claims were insignificant to the property and did not warrant additional expenditure for lease payments and claims maintenance. The Company concluded that these claims were not required to maintain the value of the other claims and therefore the costs incurred to date on those claims should be written off. The value attributed to the claims that were written off was $212,519.
(ii) Northern Nevada Lease
7 of the 12 lease claims are included in the Gold Ridge claims.
| ||
CORAL GOLD RESOURCES LTD.
Notes to the Consolidated Financial Statements
For the years ended January 31, 2016, 2015, and 2014
4. EXPLORATION AND EVALUATION ASSETS (continued)
| ||
| |||
| b) | |||
| |||
JDN Hilltop Crest – 100% interest | |||
The Company holds a 100% interest in 27 claims in the Hilltop District, Lander County, Nevada. Expenditures incurred on the Ruf claims have been classified to JDN and Eagle claims in the exploration expenditure table. | |||
| c) | |||
Eagle Claims – 100% interest | |||
The Company holds a 100% interest in 45 claims in the Eagle Claims situated in the Shoshone Range, Lander County, Nevada. Expenditures incurred on the Ruf claims have been classified to JDN and Eagle claims in the exploration expenditure table. |
| 62 |
| Table of Contents |
CORAL GOLD RESOURCES LTD. Notes to the Consolidated Financial Statements For the years ended January 31, 2019, 2018, and 2017 (Expressed in Canadian dollars) |
6. EXPLORATION AND EVALUATION ASSETS (continued)
| d) | Robertson Property – Royalty | |
| The Company has an interest in a NSR royalty on the Robertson Property. Refer to Note 5 for details. |
Realization of Exploration and Evaluation Assets
The investment in and expenditures on exploration and evaluation assets comprise a significant portion of the Company'sCompany’s assets. Realization of the Company'sCompany’s investment in these assets is dependent upon the establishment of legal ownership, the attainment of successful production from the properties or from the proceeds of their disposal. Resource exploration and development is highly speculative and involves inherent risks. While the rewards can be substantial if an ore body is discovered, few properties that are explored are ultimately developed into producing mines. There can be no assurance that current exploration programs will result in the discovery of economically viable quantities of ore.
The amounts shown for acquisition costs and deferred exploration expenditures represent costs incurred to date and do not necessarily reflect present or future values.
Title to Exploration and Evaluation Assets Interests
Although the Company has taken steps to verify the title to exploration and evaluation assets in which it has an interest, in accordance with industry standards for the current stage of exploration of such properties, these procedures do not guarantee the Company'sCompany’s title. Property title may be subject to unregistered prior agreements or transfers and title may be affected by undetected defects.
CORAL GOLD RESOURCES LTD.
Notes to the Consolidated Financial Statements
For the years ended January 31, 2016, 2015, and 2014
4. EXPLORATION AND EVALUATION ASSETS (continued)
Environmental
The Company is subject to the laws and regulations relating to environmental matters in all jurisdictions in which it operates, including provisions relating to property reclamation, discharge of hazardous material, and other matters. The Company may also be held liable should environmental problems be discovered that were caused by former owners and operators of its properties and properties in which it has previously had an interest. The Company conducts its mineral exploration activities in compliance with applicable environmental protection legislation. The Company is not aware of any existing environmental problems related to any of its current or former properties that may result in material liability to the Company other than the amount presented and disclosed as a reclamation provision in these consolidated financial statements.
Environmental legislation is becoming increasingly stringent and costs and expenses of regulatory compliance are increasing. The impact of new and future environmental legislation on the Company'sCompany’s operations may cause additional expenses and restrictions. If the restrictions adversely affect the scope of exploration and development on the mineral properties, the potential for production on the property may be diminished or negated.
5. IMPAIRMENT OF EXPLORATION AND EVALUATION ASSETS
| 63 |
| Table of Contents |
The Company reviews the carrying amounts of its longterm assets at each statement of financial position date to determine whether there is any indication that those assets are impaired.
CORAL GOLD RESOURCES LTD. Notes to the Consolidated Financial Statements For the years ended January 31, 2019, 2018, and 2017 (Expressed in Canadian dollars) |
7. PROPERTY AND EQUIPMENT
|
| Land |
|
| Buildings |
|
| Vehicles |
|
| Computer Hardware |
|
| Equipment |
|
| TOTAL |
| |||||||
|
| $ |
|
| $ |
|
| $ |
|
| $ |
|
| $ |
|
| $ |
| |||||||
COST |
|
|
|
|
|
|
|
|
|
|
|
|
|
|
|
|
|
| |||||||
Balance at January 31, 2017 |
|
| 84,127 |
|
|
| 18,708 |
|
|
| 6,920 |
|
|
| 5,926 |
|
|
| 3,459 |
|
|
| 119,140 |
| |
Additions (Disposals) |
|
| (84,127 | ) |
|
| (18,708 | ) |
|
| - |
|
|
| - |
|
|
| - |
|
|
| (102,835 | ) | |
Balance at January 31, 2018 |
|
| - |
|
|
| - |
|
|
| 6,920 |
|
|
| 5,926 |
|
|
| 3,459 |
|
|
| 16,305 |
| |
Additions (Disposals) |
|
| - |
|
|
| - |
|
|
| - |
|
|
| - |
|
|
| - |
|
|
| (102,835 | ) | |
Balance at January 31, 2019 |
|
| - |
|
|
| - |
|
|
| 6,920 |
|
|
| 5,926 |
|
|
| 3,459 |
|
|
| 16,305 |
| |
|
|
|
|
|
|
|
|
|
|
|
|
|
|
|
|
|
|
|
|
|
|
|
|
| |
ACCUMULATED DEPRECIATION |
|
|
|
|
|
|
|
|
|
|
|
|
|
|
|
|
|
|
|
|
|
|
|
| |
Balance at January 31, 2017 |
|
| - |
|
|
| 11,694 |
|
|
| 6,920 |
|
|
| 5,632 |
|
|
| 2,406 |
|
|
| 26,652 |
| |
Depreciation |
|
| - |
|
|
| (11,694 | ) |
|
| - |
|
|
| 57 |
|
|
| 211 |
|
|
| (11,426 | ) | |
Balance at January 31, 2018 |
|
| - |
|
|
| - |
|
|
| 6,920 |
|
|
| 5,689 |
|
|
| 2,617 |
|
|
| 15,226 |
| |
Depreciation |
|
| - |
|
|
| - |
|
|
| - |
|
|
| 237 |
|
|
| 842 |
|
|
| (1,079 | ) | |
Balance at January 31, 2019 |
|
| - |
|
|
| - |
|
|
| 6,920 |
|
|
| 5,926 |
|
|
| 3,459 |
|
|
| 16,305 |
| |
|
|
|
|
|
|
|
|
|
|
|
|
|
|
|
|
|
|
|
|
|
|
|
|
| |
|
|
|
|
|
|
|
|
|
|
|
|
|
|
|
|
|
|
|
|
|
|
|
|
| |
CARRYING VALUE |
|
|
|
|
|
|
|
|
|
|
|
|
|
|
|
|
|
|
|
|
|
|
|
| |
At January 31, 2018 |
|
| - |
|
|
| - |
|
|
| - |
|
|
| 237 |
|
|
| 842 |
|
|
| 1,079 |
| |
At January 31, 2019 |
|
| - |
|
|
| - |
|
|
| - |
|
|
| - |
|
|
| - |
|
|
| - |
| |
| 64 |
| Table of Contents |
CORAL GOLD RESOURCES LTD. Notes to the Consolidated Financial Statements For the years ended January 31, 2019, 2018, and 2017 (Expressed in Canadian dollars)As at
8. ROYALTY RECEIVABLE
A reconciliation of the royalty receivable balance is as follows:
|
| January 31, 2019 |
|
| January 31, 2018 |
| ||
|
|
|
|
|
|
| ||
Beginning balance |
| $ | 3,540,753 |
|
| $ | - |
|
Royalty received for exploration and evaluation asset (Note 5) |
|
| - |
|
|
| 3,603,680 |
|
Finance income |
|
| 189,154 |
|
|
| 117,379 |
|
Change in foreign exchange rate |
|
| 239,449 |
|
|
| (180,306 | ) |
|
| $ | 3,969,356 |
|
| $ | 3,540,753 |
|
9. INVESTMENTS
At January 31, 2016,2019, the Company determined that the six lode mining claims that were leased under the Breckon Lease June Claims (note 4 (a) 2 (i)) were insignificant to the property and did not warrant additional expenditure for lease payments and claims maintenance. The value attributed to the claims of $212,519 was written-offheld shares as a charge to operations and is included in net loss in 2016. follows:
|
| Number of Shares |
|
| Cost |
|
| Accumulated Unrealized Gain (Loss) |
|
| Fair Value |
| ||||
|
|
|
|
|
|
|
|
|
|
|
|
| ||||
Available-for-sale shares: |
|
|
|
|
|
|
|
|
|
|
|
| ||||
Levon Resources Ltd. |
|
| 37,000 |
|
| $ | 1,957 |
|
| $ | 3,778 |
|
| $ | 5,735 |
|
VBI Vaccines Inc. |
|
| 2,000 |
|
|
| 4,232 |
|
|
| 150 |
|
|
| 4,382 |
|
Great Thunder Gold Corp. |
|
| 10,819 |
|
|
| 866 |
|
|
| (703 | ) |
|
| 163 |
|
|
|
|
|
|
|
|
|
|
|
|
|
|
|
|
|
|
|
|
|
|
|
| $ | 7,055 |
|
|
| 3,225 |
|
| $ | 10,280 |
|
There were no impairments or write-offs during 2015.
At January 31, 2018, the Company held shares as follows:
|
| Number of Shares |
|
| Cost |
|
| Accumulated Unrealized Gain (Loss) |
|
| Fair Value |
| ||||
|
|
|
|
|
|
|
|
|
|
|
|
| ||||
Available-for-sale shares: |
|
|
|
|
|
|
|
|
|
|
|
| ||||
Levon Resources Ltd. |
|
| 40,000 |
|
| $ | 2,116 |
|
| $ | 17,684 |
|
| $ | 19,800 |
|
VBI Vaccines Inc. |
|
| 8,000 |
|
|
| 16,927 |
|
|
| 22,033 |
|
|
| 38,960 |
|
Great Thunder Gold Corp. |
|
| 10,819 |
|
|
| 866 |
|
|
| 431 |
|
|
| 1,297 |
|
|
|
|
|
|
|
|
|
|
|
|
|
|
|
|
|
|
|
|
|
|
|
| $ | 19,909 |
|
| $ | 40,148 |
|
| $ | 60,057 |
|
During the year ended January 31, 2014, the Company determined that 184 claims were insignificant to the core property and did not warrant additional expenditures for claims maintenance. The 184 claims were previously part of the core claims – 100% and described in note 4 (a). The Company concluded that these claims were not required to maintain the value of the other core claims and therefore the costs incurred to date on those claims should be written off. The Company acquired these claims between 1986 and 1991. The $498,528 carrying value of the claims disposed was recorded as a charge to operations and is included in net loss in 2014.
CORAL GOLD RESOURCES LTD.
Notes to the Consolidated Financial Statements
For the years ended January 31, 2016, 2015, and 2014
6. PROPERTY AND EQUIPMENT
|
| Land |
|
| Buildings |
|
| Vehicles |
|
| Computer Hardware |
|
| Equipment |
|
| Total |
| ||||||
|
| $ |
|
| $ |
|
| $ |
|
| $ |
|
| $ |
|
| $ |
| ||||||
COST |
|
|
|
|
|
|
|
|
|
|
|
|
|
|
|
|
|
| ||||||
Balance at January 31, 2014 |
|
| 84,127 |
|
|
| 18,708 |
|
|
| 6,920 |
|
|
| 5,926 |
|
|
| 3,459 |
|
|
| 119,140 |
|
Additions |
|
| - |
|
|
| - |
|
|
| - |
|
|
| - |
|
|
| - |
|
|
| - |
|
Balance at January 31, 2015 |
|
| 84,127 |
|
|
| 18,708 |
|
|
| 6,920 |
|
|
| 5,926 |
|
|
| 3,459 |
|
|
| 119,140 |
|
Additions |
|
| - |
|
|
| - |
|
|
| - |
|
|
| - |
|
|
| - |
|
|
| - |
|
Balance at January 31, 2016 |
|
| 84,127 |
|
|
| 18,708 |
|
|
| 6,920 |
|
|
| 5,926 |
|
|
| 3,459 |
|
|
| 119,140 |
|
|
|
|
|
|
|
|
|
|
|
|
|
|
|
|
|
|
|
|
|
|
|
|
|
|
ACCUMULATED DEPRECIATION |
|
|
|
|
|
|
|
|
|
|
|
|
|
|
|
|
|
|
|
|
|
|
|
|
Balance at January 31, 2014 |
|
| - |
|
|
| 6,080 |
|
|
| 6,920 |
|
|
| 5,354 |
|
|
| 1,403 |
|
|
| 19,757 |
|
Depreciation |
|
| - |
|
|
| 1,872 |
|
|
| - |
|
|
| 114 |
|
|
| 411 |
|
| �� | 2,397 |
|
Balance at January 31, 2015 |
|
| - |
|
|
| 7,952 |
|
|
| 6,920 |
|
|
| 5,468 |
|
|
| 1,814 |
|
|
| 22,154 |
|
Depreciation |
|
| - |
|
|
| 1,870 |
|
|
| - |
|
|
| 91 |
|
|
| 329 |
|
|
| 2,290 |
|
Balance at January 31, 2016 |
|
| - |
|
|
| 9,822 |
|
|
| 6,920 |
|
|
| 5,559 |
|
|
| 2,143 |
|
|
| 24,444 |
|
|
|
|
|
|
|
|
|
|
|
|
|
|
|
|
|
|
|
|
|
|
|
|
|
|
CARRYING VALUE |
|
|
|
|
|
|
|
|
|
|
|
|
|
|
|
|
|
|
|
|
|
|
|
|
At January 31, 2015 |
|
| 84,127 |
|
|
| 10,756 |
|
|
| - |
|
|
| 458 |
|
|
| 1,645 |
|
|
| 96,986 |
|
At January 31, 2016 |
|
| 84,127 |
|
|
| 8,886 |
|
|
| - |
|
|
| 367 |
|
|
| 1,316 |
|
|
| 94,696 |
|
CORAL GOLD RESOURCES LTD.
Notes to the Consolidated Financial Statements
For the years ended January 31, 2016, 2015, and 2014
7. INVESTMENT IN MARKETABLE SECURITIES
At January 31, 2016, the Company held shares as follows:
|
| Number of |
|
| Cost |
|
| Accumulated Unrealized Gain (Loss) |
|
| Fair |
| ||||
|
|
|
|
|
|
|
|
|
|
|
|
| ||||
Available-for-sale shares: |
|
|
|
|
|
|
|
|
|
|
|
| ||||
Levon Resources Ltd. |
|
| 220,000 |
|
| $ | 11,637 |
|
| $ | 19,163 |
|
| $ | 30,800 |
|
SciVac Therapeutics Inc. |
|
| 440,000 |
|
|
| 23,274 |
|
|
| 38,326 |
|
|
| 61,600 |
|
Great Thunder Gold Corp. |
|
| 17,291 |
|
|
| 1,297 |
|
|
| (951 | ) |
|
| 346 |
|
|
|
|
|
|
|
|
|
|
|
|
|
|
|
|
|
|
|
|
|
|
|
| $ | 36,208 |
|
| $ | 56,538 |
|
| $ | 92,746 |
|
At January 31, 2015, the Company held shares as follows:
|
| Number of |
|
| Cost |
|
| Accumulated Unrealized Gain (Loss) |
|
| Fair |
| ||||
|
|
|
|
|
|
|
|
|
|
|
|
| ||||
Available-for-sale shares: |
|
|
|
|
|
|
|
|
|
|
|
| ||||
Levon Resources Ltd. |
|
| 519,071 |
|
| $ | 41,237 |
|
| $ | 104,103 |
|
| $ | 145,340 |
|
Great Thunder Gold Corp. |
|
| 17,291 |
|
|
| 1,297 |
|
|
| (605 | ) |
|
| 692 |
|
|
|
|
|
|
|
|
|
|
|
|
|
|
|
|
|
|
|
|
|
|
|
| $ | 42,534 |
|
| $ | 103,498 |
|
| $ | 146,032 |
|
During the year ended January 31, 2016,2019, the Company recorded an unrealized pre-tax loss of $46,960 (2015$19,197 (2018 – loss of $57,269; 2017 – gain of 7,127; 2014 – loss of $226,639)$40,449) on investments in marketable securities, representing the change in fair value during the year.
Certain directors of Great Thunder Gold Corp. are also directors of the Company. During the year ended January 31, 2016,2019, the Company sold 3,000 (2018 – 180,000, 2017 - Nil) shares of Levon Resources Ltd. for gross proceeds of $935 (2018 - $79,070, 2017 - $Nil) and Levon ceased to be related after changes to Levon management and6,000 (2018 – 3,000, 2017 - Nil) shares of VBI Vaccines Inc. for gross proceeds of $26,553 (2018 - $23,061, 2017 - $Nil). As a result, the terminationCompany recorded a gain on sale of shared administrative services.
Duringinvestments of $14,635 for the year ended January 31, 2016, the Company sold 79,071 (20152019 (2018 – 20,000; 2014$93,693, 2017 – 370,000) Levon shares and realized a gain of $27,059 (2015 – $7,130; 2014 - $107,300)$Nil).
During the year ended January 31, 2016, Levon completed a transaction with SciVac Therapeutics Inc. ("SciVac") resulting in the exchange of 0.5 of a common share of Levon for each previous Levon common share held, and the issuance of one new SciVac common share for each previous Levon common share held.
| 65 |
| Table of Contents |
CORAL GOLD RESOURCES LTD.
Notes to the Consolidated Financial Statements
For the years ended January 31, 2016, 2015, and 2014
8. RECLAMATION BONDS
Under the Bureau of Land Management of the United States (the "Bureau"), the Company is required to hold reclamation bonds that cover the estimated cost to reclaim the ground disturbed.
CORAL GOLD RESOURCES LTD. Notes to the Consolidated Financial Statements For the years ended January 31, 2019, 2018, and 2017 (Expressed in Canadian dollars) |
During the year ended January 31, 2015, at the request of the Bureau the Company increased the bonds by US$40,149.10. SHARE CAPITAL AND SHARE-BASED PAYMENTS
During the year ended January 31, 2016, the Company recovered $571,497 (US$452,172) in reclamation bonds. Instead of the bonds, the Company obtained a surety bond in the amount of US$452,172. Based on the nature of the surety bond, no amount is held until settlement.
As at January 31, 2016, the total reclamation deposits were $89,638 (US$64,000) (2015 – $655,209 (US$515,466)). Interest is accrued on the reclamation deposit at a monthly weighted average rate of 0.05% (2015 - 0.05%).
9. SHARE CAPITAL
| a) | Authorized | ||
| |||
Unlimited common shares without par value. All shares outstanding are fully paid. | |||
| b) | Issued during 2019 and 2018 | ||
| |||
| |||
| During the year ended January 31, 2019, the Company issued 3,469,500 common shares upon the exercise of warrants for gross proceeds of | |||
| During the year ended January 31, 2018, the Company issued 510,000 common shares upon the exercise of stock options for gross proceeds of $150,600. | |||
| During the year ended January 31, 2018, the Company issued 3,965,000 common shares upon the exercise of warrants for gross proceeds of $404,750. | |||
| c) | Share repurchases and cancellations | ||
Normal Course Issuer Bids (“NCIB”) 2018-2019 NCIB
On July Pursuant to the NCIB, the Company may purchase up to 3,938,462 common shares up until July 30, 2019, which represents approximately 10% of the total current public float (being total issued shares, less shares held by insiders, and their associates and affiliates). During the year ended January 31, 2019, the Company purchased and cancelled 2,781,000 common shares (year ended January 31, 2018 - Nil) pursuant to 2017-2018 NCIB On June 26, 2017, the Company announced that the TSX-V had accepted the Company’s Notice for its NCIB. Pursuant to the NCIB, the Company may purchase up to 3,844,000 common shares up until June 26, 2018, which represents approximately 10% of During the year ended January 31, 2019, the Company purchased 681,500 common shares (year ended January 31, 2018 – 1,344,000) and cancelled 1,114,000 common shares (year ended January 31, 2018 – 911,500) pursuant to this NCIB. As at January 31, 2019, this NCIB was completed and the Company
During the |
During
| 66 |
| Table of Contents |
CORAL GOLD RESOURCES LTD. Notes to the Consolidated Financial Statements For the years ended January 31, |
| (Expressed in Canadian dollars) |
CORAL GOLD RESOURCES LTD.
Notes to the Consolidated Financial Statements
For the years ended January 31, 2016, 2015, and 2014
9.10. SHARE CAPITAL AND SHARE-BASED PAYMENTS (continued)
Share purchase warrants | ||
A summary of the share purchase warrants |
|
| Number of Warrants |
|
| Weighted Average |
| ||
Balance, January 31, 2014 |
|
| 10,158,620 |
|
| $ | 0.53 |
|
Exercised |
|
| (45,000 | ) |
| $ | 0.15 |
|
Balance, January 31, 2015 |
|
| 10,113,620 |
|
| $ | 0.53 |
|
Issued |
|
| 5,000,000 |
|
| $ | 0.10 |
|
Expired |
|
| (6,464,120 | ) |
| $ | 0.75 |
|
Balance, January 31, 2016 |
|
| 8,649,500 |
|
| $ | 0.12 |
|
CORAL GOLD RESOURCES LTD.
Notes to the Consolidated Financial Statements
For the years ended January 31, 2016, 2015, and 2014
|
| Number of Warrants |
|
| Weighted Average Exercise Price |
| ||
Balance, January 31, 2017 |
|
| 7,649,500 |
|
| $ | 0.12 |
|
Exercised |
|
| (3,965,000 | ) |
| $ | 0.10 |
|
Expired |
|
| (200,000 | ) |
| $ | 0.10 |
|
Balance, January 31, 2018 |
|
| 3,484,500 |
|
| $ | 0.15 |
|
Exercised |
|
| (3,469,500 | ) |
| $ | 0.15 |
|
Expired |
|
| (15,000 | ) |
| $ | 0.15 |
|
Balance, January 31, 2019 |
|
| - |
|
|
| - |
|
| ||
Details of share purchase warrants outstanding are as |
|
|
|
|
| Warrants Outstanding and Exercisable |
| ||||||
Expiry Date |
| Exercise Price per Share |
|
| January 31, |
|
| January 31, |
| |||
|
|
|
|
|
|
|
|
|
| |||
April 1, 2015 |
| $ | 0.75 |
|
|
| - |
|
|
| 4,709,120 |
|
April 23, 2015 |
| $ | 0.75 |
|
|
| - |
|
|
| 1,755,000 |
|
September 10, 2017 |
| $ | 0.10 |
|
|
| 3,500,000 |
|
|
| - |
|
July 17, 2018 |
| $ | 0.15 |
|
|
| 3,649,500 |
|
|
| 3,649,500 |
|
January 14, 2018 |
| $ | 0.10 |
|
|
| 1,500,000 |
|
|
| - |
|
|
|
|
|
|
|
| 8,649,500 |
|
|
| 10,113,620 |
|
|
| Exercise |
|
| Warrants Outstanding and Exercisable |
| ||||||
Expiry Date |
| Price per Share |
|
| January 31, 2019 |
|
| January 31, 2018 |
| |||
|
|
|
|
|
|
|
|
|
| |||
July 17, 2018 |
| $ | 0.15 |
|
|
| - |
|
|
| 3,484,500 |
|
|
|
|
|
|
|
| - |
|
|
| 3,484,500 |
|
| Stock options | ||
| ||
The | ||
| Stock option activity is summarized as follows: |
|
| Number of Options |
|
| Weighted Average Exercise Price |
| ||
Stock options outstanding and exercisable, January 31, 2017 |
|
| 3,145,000 |
|
| $ | 0.28 |
|
Granted |
|
| 1,775,000 |
|
| $ | 0.36 |
|
Exercised |
|
| (510,000 | ) |
| $ | 0.30 |
|
Cancelled |
|
| (115,000 | ) |
| $ | 0.29 |
|
Expired |
|
| (900,000 | ) |
| $ | 0.39 |
|
Stock options outstanding and exercisable, January 31, 2018 |
|
| 3,395,000 |
|
| $ | 0.28 |
|
Granted |
|
| 1,545,000 |
|
| $ | 0.38 |
|
Exercised |
|
| (205,000 | ) |
| $ | 0.25 |
|
Cancelled |
|
| (85,000 | ) |
| $ | 0.29 |
|
Stock options outstanding, January 31, 2019 |
|
| 4,650,000 |
|
| $ | 0.32 |
|
| 67 |
| Table of Contents |
CORAL GOLD RESOURCES LTD. Notes to the Consolidated Financial Statements For the years ended January 31, (Expressed in Canadian dollars) |
|
| Number of |
|
| Weighted Average |
| ||
Stock options outstanding, January 31, 2014 |
|
| 3,155,000 |
|
| $ | 0.50 |
|
Granted |
|
| 1,420,000 |
|
| $ | 0.24 |
|
Cancelled |
|
| - |
|
|
| - |
|
Expired |
|
| (605,000 | ) |
| $ | 0.71 |
|
Stock options outstanding, January 31, 2015 |
|
| 3,970,000 |
|
| $ | 0.38 |
|
Granted |
|
| 500,000 |
|
| $ | 0.18 |
|
Cancelled |
|
| (355,000 | ) |
| $ | 1.19 |
|
Expired |
|
| (945,000 | ) |
| $ | 0.27 |
|
Stock options outstanding, January 31, 2016 |
|
| 3,170,000 |
|
| $ | 0.28 |
|
Stock options exercisable, January 31, 2016 |
|
| 2,670,000 |
|
| $ | 0.31 |
|
CORAL GOLD RESOURCES LTD.
Notes to the Consolidated Financial Statements
For the years ended January 31, 2016, 2015, and 2014
9. SHARE CAPITAL (continued)
10. SHARE CAPITAL AND SHARE-BASED PAYMENTS (continued)
| Stock options (continued) | ||
| ||
A summary of stock options outstanding as at January 31, |
Number Outstanding |
|
| Exercise Price |
|
| Weighted Average Remaining Contractual Life (years) |
|
| Expiry Date | |||
| 800,000 |
|
| $ | 0.400 |
|
|
| 1.06 |
|
| February 22, 2017 | |
| 600,000 |
|
| $ | 0.300 |
|
|
| 1.70 |
|
| October 12, 2017 | |
| 1,270,000 |
|
| $ | 0.240 |
|
|
| 3.12 |
|
| March 14, 2019 | |
| 100,000 |
|
| $ | 0.125 |
|
|
| 4.68 |
|
| October 6, 2020 | |
| 100,000 |
|
| $ | 0.150 |
|
|
| 4.68 |
|
| October 6, 2020 | |
| 100,000 |
|
| $ | 0.175 |
|
|
| 4.68 |
|
| October 6, 2020 | |
| 100,000 |
|
| $ | 0.200 |
|
|
| 4.68 |
|
| October 6, 2020 | |
| 100,000 |
|
| $ | 0.225 |
|
|
| 4.68 |
|
| October 6, 2020 | |
|
|
|
|
|
|
|
|
|
|
|
| |
| 3,170,000 |
|
| $ | 0.281 |
|
|
| 2.58 |
|
|
| |
10. SHARE-BASED PAYMENTS
On October 6, 2015, the Company granted incentive stock options for the purchase of up to 500,000 common shares to a consultant. These 500,000 stock options have the following prices and vesting terms, and are exercisable on or before October 6, 2020:
|
|
|
| Outstanding |
|
| Exercisable |
| ||||||||||||
Expiry Date |
| Price |
|
| Options Outstanding |
|
| Weighted Average Remaining Contractual Life (Years) |
|
| Options Outstanding |
|
| Weighted Average Remaining Contractual Life (Years) |
| |||||
March 14, 2019 |
| $ | 0.240 |
|
|
| 905,000 |
|
|
| 0.12 |
|
|
| 905,000 |
|
|
| 0.12 |
|
July 10, 2019 |
| $ | 0.355 |
|
|
| 25,000 |
|
|
| 0.44 |
|
|
| 25,000 |
|
|
| 0.44 |
|
October 6, 2020 |
| $ | 0.125 |
|
|
| 100,000 |
|
|
| 1.68 |
|
|
| 100,000 |
|
|
| 1.68 |
|
October 6, 2020 |
| $ | 0.150 |
|
|
| 100,000 |
|
|
| 1.68 |
|
|
| 100,000 |
|
|
| 1.68 |
|
October 6, 2020 |
| $ | 0.175 |
|
|
| 100,000 |
|
|
| 1.68 |
|
|
| 100,000 |
|
|
| 1.68 |
|
October 6, 2020 |
| $ | 0.200 |
|
|
| 100,000 |
|
|
| 1.68 |
|
|
| 100,000 |
|
|
| 1.68 |
|
October 6, 2020 |
| $ | 0.225 |
|
|
| 100,000 |
|
|
| 1.68 |
|
|
| 100,000 |
|
|
| 1.68 |
|
July 5, 2022 |
| $ | 0.355 |
|
|
| 15,000 |
|
|
| 3.43 |
|
|
| 15,000 |
|
|
| 3.43 |
|
September 4, 2023 |
| $ | 0.380 |
|
|
| 1,335,000 |
|
|
| 4.59 |
|
|
| 333,750 |
|
|
| 4.59 |
|
January 25, 2024 |
| $ | 0.390 |
|
|
| 200,000 |
|
|
| 4.99 |
|
|
| - |
|
|
| 4.99 |
|
|
|
|
|
|
|
| 4,650,000 |
|
|
| 2.98 |
|
|
| 3,448,750 |
|
|
| 2.40 |
|
| ||
| ||
| ||
| ||
|
On March 14, 2014, the Company granted incentive stock options for the purchase of up to 1,420,000 common shares at a price of $0.24 per share to directors, officers, consultants, and employees of the Company. Of these, 50,000 stock options are exercisable on or before March 14, 2015, and 1,370,000 stock options are exercisable on or before March 14, 2019.
No stock options were granted during the year ended January 31, 2014.
|
| 2019 |
|
| 2018 |
|
| 2017 |
| |||
Weighted average assumptions: |
|
|
|
|
|
|
|
|
| |||
Risk-free interest rate |
|
| 2.12 | % |
|
| 1.42 | % |
|
| 0.71 | % |
Expected dividend yield |
|
| - |
|
|
| - |
|
|
| - |
|
Expected option life (years) |
|
| 5.00 |
|
|
| 4.96 |
|
|
| 4.13 |
|
Expected stock price volatility |
|
| 112.34 | % |
|
| 129.96 | % |
|
| 104.02 | % |
Forfeiture rate |
|
| - |
|
|
| - |
|
|
| - |
|
Weighted average fair value at grant date |
| $ | 0.31 |
|
| $ | 0.32 |
|
| $ | 0.05 |
|
The Company recorded total share-based payments of $157,142 for the grant and vesting of stock options and for the extension of the expiry date of warrants during the year ended January 31, 2016 (2015 - $259,163; 2014 - $9,350) as follows:
|
| 2016 |
|
| 2015 |
|
| 2014 |
| |||
|
|
|
|
|
|
|
|
|
| |||
Directors, officers and employees |
| $ | - |
|
| $ | 214,200 |
|
| $ | - |
|
Investor relations |
|
| - |
|
|
| 11,447 |
|
|
| 2,629 |
|
Consultants |
|
| 13,445 |
|
|
| 11,900 |
|
|
| - |
|
Extension of warrants |
|
| 143,697 |
|
|
| 21,616 |
|
|
| 6,721 |
|
|
| $ | 157,142 |
|
| $ | 259,163 |
|
| $ | 9,350 |
|
| 68 |
| Table of Contents |
CORAL GOLD RESOURCES LTD.
Notes to the Consolidated Financial Statements
For the years ended January 31, 2016, 2015, and 2014
Option pricing requires the use of highly subjective estimates and assumptions including the expected stock price volatility. Changes in the underlying assumptions can materially affect the fair value estimates. The fair value of the options re-valued and granted to officers, directors, consultants and employees was calculated using the Black-Scholes model with following weighted average assumptions:
|
| 2016 |
|
| 2015 |
|
| 2014 |
| |||
Weighted average assumptions: |
|
|
|
|
|
|
|
|
| |||
Risk-free interest rate |
|
| 0.42 | % |
|
| 1.39 | % |
|
| - |
|
Expected dividend yield |
|
| - |
|
|
| - |
|
|
| - |
|
Expected option life (years) |
|
| 3.20 |
|
|
| 4.86 |
|
|
| - |
|
Expected stock price volatility |
|
| 100.07 | % |
|
| 96.63 | % |
|
| - |
|
Forfeiture rate |
|
| - |
|
|
| - |
|
|
| - |
|
Weighted average fair value at grant date |
| $ | 0.04 |
|
| $ | 0.17 |
|
|
| - |
|
Expected volatility was forecasted based on the historical volatility of the Company.
CORAL GOLD RESOURCES LTD. Notes to the Consolidated Financial Statements For the years ended January 31, 2019, 2018, and 2017 (Expressed in Canadian dollars)
11. RELATED PARTY TRANSACTIONS AND BALANCES
Related party transactions are measured at the estimated fair values of the services provided or goods received. Related party transactions not disclosed elsewhere in these financial consolidated statements are as follows:
| a) | Key management personnel |
| The Company has identified its directors and certain senior officers of the Company, who have the authority and responsibility for planning, directing and controlling the activities of the |
|
| 2016 |
| 2015 |
| 2014 |
|
| 2019 |
|
| 2018 |
|
| 2017 |
| ||||||||
|
|
|
|
|
|
|
|
|
|
|
|
|
|
| ||||||||||
Salaries, bonuses, fees and benefits |
|
|
|
|
|
|
|
|
|
|
|
|
|
| ||||||||||
Members of the Board of Directors |
| $ | 64,359 |
| $ | 62,835 |
| $ | 66,000 |
|
| $ | 124,500 |
| $ | 191,575 |
| $ | 72,019 |
| ||||
Other members of key management |
| 27,531 |
| 24,067 |
| 43,707 |
|
| 37,801 |
| 55,071 |
| 34,581 |
| ||||||||||
|
|
|
|
|
|
|
|
|
|
|
|
|
|
| ||||||||||
Share-based payments |
|
|
|
|
|
|
|
|
|
|
|
|
|
| ||||||||||
Members of the Board of Directors |
| - |
| 161,500 |
| - |
|
| 219,248 |
| 400,000 |
| - |
| ||||||||||
Other members of key management |
|
| - |
|
|
| 34,000 |
|
|
| - |
|
|
| 32,480 |
|
|
| 72,000 |
|
|
| - |
|
|
| $ | 91,890 |
|
| $ | 282,402 |
|
| $ | 109,707 |
|
| $ | 414,029 |
|
| $ | 718,646 |
|
| $ | 106,600 |
|
| b) |
|
|
| January 31, |
|
| January 31, |
| ||
Levon Resources Ltd. |
| $ | - |
|
| $ | 58,903 |
|
Total |
| $ | - |
|
| $ | 58,903 |
|
| relates parties | |
CORAL GOLD RESOURCES LTD.
Notes to the Consolidated Financial Statements
For the years ended January 31, 2016, 2015, and 2014
11. RELATED PARTY TRANSACTIONS AND BALANCES (continued)
In the normal course of operations the Company transacts with companies with directors or officers in common. | ||
| The following amounts are payable to related parties: |
|
| January 31, |
|
| January 31, |
| ||
Directors |
| $ | 70,500 |
|
| $ | 52,500 |
|
Oniva International Services Corp. |
|
| 8,401 |
|
|
| 5,514 |
|
Sampson Engineering Inc. |
|
| 1,212 |
|
|
| 1,200 |
|
Wear Wolfin Designs Inc. |
|
| - |
|
|
| 5,250 |
|
Saulnier Capital |
|
| - |
|
|
| 1,103 |
|
Frobisher Securities Ltd. |
|
| 4,200 |
|
|
| 4,200 |
|
Intermark Capital Corp. |
|
| - |
|
|
| 13,125 |
|
|
| $ | 84,313 |
|
| $ | 82,892 |
|
|
| January 31, 2019 |
|
| January 31, 2018 |
| ||
Directors |
|
| 11,250 |
|
|
| 29,250 |
|
Oniva International Services Corp. |
|
| 20,217 |
|
|
| 10,615 |
|
Sampson Engineering Inc. |
|
| - |
|
|
| - |
|
Intermark Capital Corp. |
|
| - |
|
|
| - |
|
|
| $ | 31,467 |
|
| $ | 39,865 |
|
The amounts included above | ||
| c) | ||
Other related party transactions | ||
The Company has a cost-sharing agreement to reimburse Oniva International Services Corp. |
|
| 2016 |
|
| 2015 |
|
| 2014 |
| |||
Salaries and benefits |
| $ | 72,747 |
|
| $ | 40,640 |
|
| $ | 77,785 |
|
Office and miscellaneous |
|
| 24,176 |
|
|
| 26,035 |
|
|
| 48,489 |
|
|
|
|
|
|
|
|
|
|
|
|
|
|
|
| $ | 96,923 |
|
| $ | 66,675 |
|
| $ | 126,274 |
|
|
| 2019 |
|
| 2018 |
|
| 2017 |
| |||
Salaries and benefits |
| $ | 118,361 |
|
| $ | 105,344 |
|
| $ | 91,346 |
|
Office and miscellaneous |
|
| 77,443 |
|
|
| 66,663 |
|
|
| 38,260 |
|
|
|
|
|
|
|
|
|
|
|
|
|
|
|
| $ | 195,804 |
|
| $ | 172,007 |
|
| $ | 129,606 |
|
| Salaries and benefits above includes |
12. RECLAMATON PROVISION
The Company's reclamation provision relates to the reclamation work required by the Bureau to be performed on the Robertson Property.
Management estimates the total undiscounted inflation-adjusted amount of cash flows required to settle its reclamation provision to be approximately $633,312 (US$452,172) (2015 – $574,756 (US$452,172)), which is expected to be incurred during 2018. The risk-free rate of 3% (2015 – 3%) was used to calculate the present value of the reclamation provision.
A reconciliation of the reclamation provision is as follows:
|
| January 31, |
|
| January 31, |
| ||
|
|
|
|
|
|
| ||
Beginning balance |
| $ | 566,410 |
|
| $ | 484,000 |
|
Unwinding of discount |
|
| 17,389 |
|
|
| 14,519 |
|
Change in estimates |
|
| - |
|
|
| - |
|
Change in foreign exchange rate |
|
| 61,354 |
|
|
| 67,891 |
|
|
| $ | 645,153 |
|
| $ | 566,410 |
|
| 69 |
| Table of Contents |
CORAL GOLD RESOURCES LTD.
CORAL GOLD RESOURCES LTD. Notes to the Consolidated Financial Statements For the years ended January 31, 2019, 2018, and 2017 (Expressed in Canadian dollars) |
Notes to the Consolidated Financial Statements
For the years ended January 31, 2016, 2015, and 2014
13.12. COMMITMENTS
The Company has a cost-sharing agreement to reimburse Oniva for a percentage of its overhead expenses, to reimburse 100% of its out-of-pocket expenses incurred on behalf of the Company, and to pay a percentage fee based on the total overhead and corporate expenses. The agreement may be terminated with one-months'one-months’ notice by either party. Transactions and balances with Oniva are disclosed in Note 11.
14.13. FINANCIAL INSTRUMENTS
The estimated fair values of the Company'sCompany’s cash and cash equivalents, amounts receivable from a related party,term deposits, accounts payable, and amounts payable to related parties approximate their carrying values due to the short-term nature of these instruments. Investment securities are accounted for at fair value based on quoted market prices. The estimated fair value of the royalty receivable approximates its carrying value based on current market rates for similar instruments.
The Company'sCompany’s financial instruments are exposed to certain financial risk, credit risk, liquidity risk, and market risk.
| a) | Credit risk | |
| ||
Credit risk is the risk that one party to a financial instrument will cause a financial loss for the other party by failing to discharge an obligation. The | ||
| ||
| The Company manages this credit risk | ||
| ||
| Concentration of credit risk also exists with respect to the |
|
| January 31, |
|
| January 31, |
| ||
|
|
|
|
|
|
| ||
Cash held at major financial institutions |
|
|
|
|
|
| ||
Canada – cash |
| $ | 199,934 |
|
| $ | 103,470 |
|
US - cash |
|
| 400,030 |
|
|
| 44,105 |
|
|
|
|
|
|
|
|
|
|
|
|
| 599,964 |
|
|
| 147,575 |
|
Reclamation deposits held at major financial institutions |
|
| 89,638 |
|
|
| 655,209 |
|
|
|
|
|
|
|
|
|
|
Total cash and reclamation deposits |
| $ | 689,602 |
|
| $ | 802,784 |
|
|
| January 31, 2019 |
|
| January 31, 2018 |
| ||
|
|
|
|
|
|
| ||
Cash and cash equivalents |
| $ | 8,308,884 |
|
| $ | 14,321,433 |
|
Term deposits |
|
| 9,656,320 |
|
|
| 3,694,415 |
|
Royalty receivable |
|
| 3,969,356 |
|
|
| 3,540,753 |
|
|
|
|
|
|
|
|
|
|
Total |
| $ | 21,934,560 |
|
| $ | 21,556,601 |
|
| 70 |
| Table of Contents |
CORAL GOLD RESOURCES LTD.
CORAL GOLD RESOURCES LTD. Notes to the Consolidated Financial Statements For the years ended January 31, 2019, 2018, and 2017 (Expressed in Canadian dollars) |
Notes to the Consolidated Financial Statements
For the years ended January 31, 2016, 2015, and 2014
13. FINANCIAL INSTRUMENTS (continued)
| b) | Liquidity risk | ||
| |||
Liquidity risk is the risk that the Company will encounter difficulty in satisfying financial obligations as they become due. | |||
| |||
The Company manages its liquidity risk by forecasting cash flows required by operations and anticipated investing and financing activities. | |||
At January 31, | |||
|
| ||
| c) | Market risk | ||
| |||
Market risk consists of interest rate risk, foreign currency risk, and other price risk. These are discussed further below. | |||
| |||
| Interest rate risk | |||
| |||
| Interest rate risk consists of two components: |
| (i) | To the extent that payments made or received on the | |
| (ii) | To the extent that changes in prevailing market rates differ from the interest rate in the |
The Company is exposed to interest rate price risk with respect to | ||
| 71 |
| Table of Contents |
CORAL GOLD RESOURCES LTD.
CORAL GOLD RESOURCES LTD. Notes to the Consolidated Financial Statements For the years ended January 31, 2019, 2018, and 2017 (Expressed in Canadian dollars) |
Notes to the Consolidated Financial Statements
For the years ended January 31, 2016, 2015, and 2014
14.13. FINANCIAL INSTRUMENTS (continued)
| c) | Market risk (continued) | |
Foreign currency risk | ||
| ||
| Foreign currency risk is the risk that the fair value or future cash flows of a financial instrument will fluctuate due to changes in foreign exchange rates. The Company is exposed to foreign currency risk to the extent that monetary assets and liabilities are denominated in foreign currency. | ||
| ||
| The Company is exposed to foreign currency risk with respect to cash, |
|
| January 31, |
|
| January 31, |
| ||
|
|
|
|
|
|
| ||
Cash |
| US$ | 285,613 |
|
| US$ | 34,698 |
|
Other amounts receivable |
|
| 149 |
|
|
| 2,343 |
|
Amounts receivable from related parties |
|
| - |
|
|
| 46,340 |
|
Reclamation bonds |
|
| 64,000 |
|
|
| 515,466 |
|
Accounts payable |
|
| (3,317 | ) |
|
| (15,945 | ) |
|
|
|
|
|
|
|
|
|
Net exposure |
| US$ | 346,445 |
|
| US$ | 582,902 |
|
|
|
|
|
|
|
|
|
|
Canadian dollar equivalent |
| $ | 485,231 |
|
| $ | 740,927 |
|
|
| January 31, 2019 |
|
| January 31, 2018 |
| ||
|
|
|
|
|
| |||
Cash and cash equivalents |
| US$ | 5,842,116 |
|
| US$ | 10,125,183 |
|
Term deposits |
|
| 7,360,000 |
|
|
| 3,005,300 |
|
Royalty receivable |
|
| 2,988,169 |
|
|
| 2,880,300 |
|
Accounts payable |
|
| (65 | ) |
|
| - |
|
Current income tax liability |
|
| (2,160,272 | ) |
|
| - |
|
|
|
|
|
|
|
|
|
|
Net exposure |
| US$ | 14,029,948 |
|
| US$ | 16,010,783 |
|
|
|
|
|
|
|
|
|
|
Canadian dollar equivalent |
| $ | 18,407,291 |
|
| $ | 19,682,055 |
|
| Based on the net Canadian dollar denominated asset and liability exposures as at January 31, | |
| ||
| The Company manages foreign currency risk by minimizing the value of financial instruments denominated in foreign currency. The Company has not entered into any foreign currency contracts to mitigate this risk. | ||
| ||
| Other price risk | ||
| ||
| Other price risk is the risk that the fair value or future cash flows of a financial instrument will fluctuate due to changes in market prices, other than those arising from interest rate risk or foreign currency risk. The Company is exposed to other price risk with respect to its investment securities, as they are carried at fair value based on quoted market prices. | ||
| ||
| The |
| 72 |
| Table of Contents |
CORAL GOLD RESOURCES LTD. Notes to the Consolidated Financial Statements For the years ended January 31, 2019, 2018, and 2017 (Expressed in Canadian dollars) |
CORAL GOLD RESOURCES LTD.
Notes to the Consolidated Financial Statements
For the years ended January 31, 2016, 2015, and 2014
14.13. FINANCIAL INSTRUMENTS (continued)
| d) | Classification of Financial instruments | ||
IFRS 7
Level 1 – quoted prices (unadjusted) in active markets for identical assets or liabilities; Level 2 – inputs other than quoted prices included in Level 1 that are observable for the asset or liability, either directly (i.e., as prices) or indirectly (i.e., derived from prices); and Level 3 – inputs for the asset or liability that are not based on observable market data
The following table sets forth the |
|
| Level 1 |
|
| Level 2 |
|
| Level 3 |
| |||
Cash and cash equivalents |
| $ | 599,964 |
|
| $ | - |
|
| $ | - |
|
Investments in marketable securities |
|
| 92,746 |
|
|
| - |
|
|
| - |
|
|
| $ | 692,710 |
|
| $ | - |
|
| $ | - |
|
|
| Level 1 |
|
| Level 2 |
|
| Level 3 |
| |||
Cash and cash equivalents |
| $ | 8,308,884 |
|
| $ | - |
|
| $ | - |
|
Term deposits |
|
| 9,656,320 |
|
|
| - |
|
|
| - |
|
Investments |
|
| 10,280 |
|
|
| - |
|
|
| - |
|
|
| $ | 17,975,484 |
|
| $ | - |
|
| $ | - |
|
15.14. CAPITAL MANAGEMENT
The Company'sCompany’s objectives when managing capital are to safeguard the Company'sCompany’s ability to continue as a going concern in order to pursue the exploration and development of its properties and to maintain flexible capital structure for its projects for the benefit of its stakeholders. The Board of Directors does not establish quantitative returns on capital criteria for management. The Company considers its capital structure to consist of the components of shareholders'shareholders’ equity.
The Company manages the capital structure and makes adjustments to it in light of changes in economic conditions and the risk characteristics of the underlying assets. To maintain or adjust the capital structure, the Company may attempt to issue new shares or adjust the amount of cash and cash equivalents. Management reviews the capital structure on an ongoing basis and believes that this approach, given the relative size of the Company, is reasonable. The Company is not subject to externally imposed capital requirements. There were no changes to the Company'sCompany’s capital management during the year ended January 31, 2016.2019.
| 73 |
| Table of Contents |
CORAL GOLD RESOURCES LTD.
CORAL GOLD RESOURCES LTD. Notes to the Consolidated Financial Statements For the years ended January 31, 2019, 2018, and 2017 (Expressed in Canadian dollars) |
Notes to the Consolidated Financial Statements
For the years ended January 31, 2016, 2015, and 2014
16. ADDITIONAL15. SUPPLEMENTARY CASH FLOW DISCLOSURES
The net change in non-cash working capital is comprised of the following:
|
| 2016 |
| 2015 |
|
| 2019 |
|
| 2018 |
|
| 2017 |
| ||||||
|
|
|
|
|
|
|
|
|
|
|
|
| ||||||||
Amounts receivable from related parties |
| $ | - |
| $ | (12,732 | ) | |||||||||||||
Other amounts receivable |
| 13,067 |
| (12,144 | ) | |||||||||||||||
Amounts receivable |
| $ | 80,896 |
| $ | 7,473 |
| $ | (806 | ) | ||||||||||
Prepaid expenses |
| (13,416 | ) |
| (448 | ) |
| (1,729 | ) |
| (19,060 | ) |
| 688 |
| |||||
Accounts payable and accrued liabilities |
| (3,728 | ) |
| (67,252 | ) |
| 5,543 |
| (28,621 | ) |
| 31,541 |
| ||||||
Amounts payable to related parties |
|
| 1,409 |
|
|
| 31,810 |
|
|
| (8,398 | ) |
|
| (73,539 | ) |
|
| 12,901 |
|
|
| $ | (2,668 | ) |
| $ | (60,766 | ) |
| $ | 76,312 |
|
| $ | (113,747 | ) |
| $ | 44,324 |
|
Supplementary Cash Flow Disclosures: |
|
|
|
|
|
|
|
|
| |||
Cash paid during the year for: |
|
|
|
|
|
|
|
|
| |||
Interest expense |
| $ | - |
|
| $ | - |
|
| $ | - |
|
Income taxes |
| $ | 81,238 |
|
| $ | - |
|
| $ | - |
|
17.
16. INCOME TAXES
Income tax recovery (expense) differs from the amount that would result from applying the Canadian federal and provincial statutory income tax rates to income (loss) before future income taxes. For the year ended January 31, 2016,2019, the Canadian statutory rate is 27% (2018 - 26% (2015 -, 2017 – 26%).
|
| 2016 |
| 2015 |
| 2014 |
|
| 2019 |
|
| 2018 |
|
| 2017 |
| ||||||||
|
|
|
|
|
|
|
|
|
|
|
|
|
|
| ||||||||||
Expected income tax recovery |
| $ | 161,065 |
| $ | 123,811 |
| $ | 181,670 |
| ||||||||||||||
Expected income tax recovery (expense) |
| $ | (110,000 | ) |
| $ | (982,000 | ) |
| $ | 145,000 |
| ||||||||||||
Permanent differences |
| (35,857 | ) |
| (53,714 | ) |
| 10,760 |
|
| (113,000 | ) |
| 100,000 |
| (46,000 | ) | |||||||
Changes in timing differences and other |
| (3,792 | ) |
| (108,612 | ) |
| 9,659 |
|
| 336,000 |
| 459,000 |
| (11,000 | ) | ||||||||
Effect of foreign exchange changes on U.S. loss carry-forwards |
| 559,063 |
| 663,891 |
| 492,885 |
|
| (17,000 | ) |
| (52,000 | ) |
| (412,000 | ) | ||||||||
Expired losses |
| - |
| (123,653 | ) |
| (20,428 | ) |
| - |
| - |
| - |
| |||||||||
Changes in unrecognized deferred income tax assets |
| (50,115 | ) |
| (62,588 | ) |
| (135,099 | ) |
| 200,000 |
| (758,000 | ) |
| (108,000 | ) | |||||||
Adjustments due to effective tax rate attributable to U.S. tax on subsidiaries |
| 39,636 |
| 37,585 |
| 37,513 |
|
|
| - |
|
|
| (517,000 | ) |
|
| 9,000 |
| |||||
Changes in income tax rates and other exchange |
|
| - |
|
|
| - |
|
|
| 70,895 |
| ||||||||||||
Total deferred income tax recovery |
| $ | 670,000 |
|
| $ | 476,720 |
|
| $ | 647,855 |
| ||||||||||||
Total deferred and current income tax recovery (expense) |
| $ | 296,000 |
|
| $ | (1,750,000 | ) |
| $ | (423,000 | ) | ||||||||||||
CORAL GOLD RESOURCES LTD. Notes to the Consolidated Financial Statements For the years ended January 31, 2019, 2018, and 2017 (Expressed in Canadian dollars) |
16. INCOME TAXES (continued)
The approximate tax effects of each type of temporary difference that gives rise to potential deferred income tax assets and liabilities are as follows:
|
| January 31, |
|
| January 31, |
| ||
Non-capital losses carried forward |
| $ | 6,078,677 |
|
| $ | 5,345,044 |
|
Exploration and evaluation assets |
|
| (6,716,579 | ) |
|
| (6,648,222 | ) |
Equipment and other |
|
| 17,902 |
|
|
| 13,178 |
|
Net deferred income tax liabilities |
| $ | (620,000 | ) |
| $ | (1,290,000 | ) |
CORAL GOLD RESOURCES LTD.
Notes to the Consolidated Financial Statements
For the years ended January 31, 2016, 2015, and 2014
January 31, 2019 January 31, 2018 Non-capital losses carried forward Reclamation provision Exploration and evaluation assets Equipment and other Net deferred income tax assets (liabilities) 17. INCOME TAXES (continued)$ - $ - - - (55,000 ) (42,000 ) - - $ (55,000 ) $ (42,000 )
Temporary differences and tax losses arising in Canada have not been recognized as deferred income tax assets due to the fact that management has determined it is not probable that sufficient future taxable profits will be earned in Canada to recover such assets. Unrecognized deductible temporary differences are summarized as follows:
|
| January 31, |
| January 31, |
| |||||||||||
| January 31, 2019 |
|
| January 31, 2018 |
| |||||||||||
Non-capital losses carried forward |
| $ | 1,900,326 |
| $ | 1,856,564 |
|
| $ | 2,539,000 |
| $ | 2,741,000 |
| ||
Equipment and other |
| 3,163 |
| 2,929 |
|
| 4,000 |
| 2,000 |
| ||||||
Investments |
| 2,439 |
| (2,680 | ) |
| - |
| - |
| ||||||
Exploration and evaluation assets |
|
| 706,460 |
|
|
| 706,460 |
|
|
| 734,000 |
|
|
| 734,000 |
|
Unrecognized deductible temporary differences |
| $ | 2,612,388 |
|
| $ | 2,563,273 |
|
| $ | 3,277,000 |
|
| $ | 3,477,000 |
|
At January 31, 2016,2019, the Company had, for Canadian tax purposes, non-capital losses aggregating approximately $7,308,945.$9,402,000. These losses are available to reduce taxable income earned by the Canadian operations of future years and expire as follows between 2026 and 2036.2038.
At January 31, 2016, the Company had, for US tax purposes, net operating losses aggregating approximately US$12,401,000. The net operating losses are available to offset taxable income earned by the US operations of future years and expire as follows between 2020 and 2036.
18.17. SEGMENTED INFORMATION
The Company operates one operating segment, mineral exploration and development activities. The Company is in the exploration stage and, accordingly, has no reportable revenues for the yearyears ended January 31, 2016, 2015,2019, 2018, and 2014.2017.
The Company has non-current assets other than financial instruments and deferred tax assets in the following geographic locations:
|
| January 31, |
| January 31, |
|
| January 31, 2019 |
|
| January 31, 2018 |
| |||||
|
|
|
|
|
| |||||||||||
Canada |
| $ | 94,431 |
| $ | 148,139 |
|
| $ | - |
| $ | 1,079 |
| ||
USA |
|
| 19,375,002 |
|
|
| 19,902,825 |
|
|
| 236,887 |
|
|
| 199,848 |
|
|
| $ | 19,469,433 |
|
| $ | 20,050,964 |
|
| $ | 236,887 |
|
| $ | 200,927 |
|
18. SUBSEQUENT EVENTS
Subsequent to January 31, 2019, the Company issued 810,000 common shares upon the exercise of stock options for gross proceeds of $194,400.
Subsequent to January 31, 2019, pursuant to the 2018-2019 NCIB (see Note 10(c)), the Company repurchased and cancelled 1,157,000 common shares for proceeds of $430,076.
| 75 |
| Table of Contents |
SIGNATURE
The registrant hereby certifies that it meets all of the requirements for filing on Form 20-F20‑F and that it has duly caused and authorized the undersigned to sign this annual report on its behalf.
CORAL GOLD RESOURCES LTD. | |||
Dated: June | By: | /s/ David Wolfin | |
|
| David Wolfin | |
Chief Executive Officer | |||
| (Principal Executive Officer) | |||
Exhibit Index
|
| |
| ||
| ||
| ||
| ||
| ||
| ||
| ||
| ||
|
|
- 101 -