Securities for which there is a reporting obligation pursuant to Section 15(d) of the Act:
US$ 205,881,000 |
| 7.875% | Notes due February 1, 2027 | |
US$ 70,780,000 |
| 7.325% | Notes due February 1, 2037 | |
US$ 40,416,000 |
| 8.125% | Notes due February 1, 2097 | |
US$ 400,000,000 |
| 4.250% | Notes due April 15, 2024 | |
(Title of Class) | ||||
(Title of Class)
Indicate by check mark if the registrant is a well-known seasoned issuer, as defined in Rule 405 of the Securities Act.
☒x Yes ☐o No
If this report is an annual or transition report, indicate by check mark if the registrant is not required to file reports pursuant to Section 13 or 15(d) of the Securities Exchange Act of 1934.
☐o Yes ☒x No
Indicate by check mark whether the registrant (1) has filed all reports required to be filed by Section 13 or 15(d) of the Securities Exchange Act of 1934 during the preceding 12 months (or for such shorter period that the registrant was required to file such reports), and (2) has been subject to such filing requirements for the past 90 days:
☒x Yes ☐o No
Indicate by check mark whether the registrant has submitted electronically and posted on its corporate Web site, if any, every Interactive Data File required to be submitted and posted pursuant to Rule 405 of Regulation S-T during the preceding 12 months (or for such shorter period that the registrant was required to submit and post such files).
☐x Yes ☐o No
Indicate by check mark whether the registrant is a large accelerated filer, an accelerated filer, a non-accelerated filer, or an emerging growth company. See the definitions of “large accelerated filer,” “accelerated filer,” and “emerging growth company” in Rule 12b-2 of the Exchange Act.
Large accelerated filer x | Accelerated filer o | Non-accelerated filer o | Emerging growth company o |
Large accelerated filer ☒ Accelerated filer ☐ Non-accelerated filer ☐ Emerging growth company ☐
If an emerging growth company that prepares its financial statements in accordance with U.S. GAAP, indicate by check mark if the registrant has elected not to use the extended transition period for complying with any new or revised financial accounting standards † provided pursuant to Section 13(a) of the Exchange Act. ☐o
† The term “new or revised financial accounting standard” refers to any update issued by the Financial Accounting Standards Board to its Accounting Standards Codification after April 5, 2012.
Indicate by check mark which basis of accounting the registrant has used to prepare the financial statements included in this filing:
U.S. GAAP | International Financial Reporting Standards as issued
|
| Other |
If “Other” has been checked in response to the previous question, indicate by check mark which financial statement item the registrant has elected to follow
☐o Item 17 ☐o Item 18
If this is an annual report, indicate by check mark whether the registrant is a shell company (as defined in Rule 12b-2 of the Exchange Act).
☐o Yes ☒x No
Indicate the number of outstanding shares of each of the issuer’s classes of capital or common stock as of the close of the period covered by the annual report.
Shares of Common Stock: | 8,201,754,580 |
Enel Generation Chile’s Organizational Chart (1)

2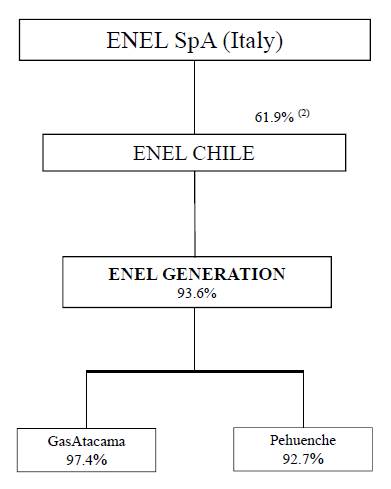
(1) Only principal operating subsidiaries are presented here. The percentage listed in the box for each of Enel Generation’s consolidated subsidiaries represents its economic interest in such consolidated subsidiary.
(2) Excluding treasury stock.
|
| Page | |||
4 | |||||
7 | |||||
8 | |||||
10 | |||||
|
| ||||
| |||||
11 | |||||
11 | |||||
21 | |||||
47 | |||||
47 | |||||
64 | |||||
71 | |||||
73 | |||||
75 | |||||
78 | |||||
93 | |||||
96 | |||||
|
| ||||
| |||||
| |||||
|
| ||||
|
| ||||
|
| ||||
|
| ||||
|
| ||||
|
| ||||
|
| ||||
|
| ||||
|
| ||||
|
| ||||
|
| ||||
|
| ||||
|
| ||||
|
| ||||
| Material Modifications to the Rights of Security Holders and Use of Proceeds |
| |||
|
| ||||
98 | |||||
| |||||
|
| ||||
|
| ||||
|
| ||||
|
| ||||
| Purchases of Equity Securities by the Issuer and Affiliated Purchasers |
| |||
99 | |||||
99 | |||||
100 | |||||
|
| ||||
101 | |||||
101 | |||||
101 | |||||
AFP |
|
| ||
|
| |||
|
| |||
|
| |||
|
| |||
|
|
3
| Administradora de Fondos de Pensiones |
| A legal entity that manages a Chilean pension fund. | |
|
|
|
|
|
CDEC |
| Centro de Despacho Económico de Carga |
|
|
|
|
|
|
|
Celta |
| Compañía Eléctrica |
| Celta was a former Chilean generation subsidiary of Enel |
|
|
|
|
|
|
| Coordinador Eléctrico Nacional | An autonomous entity in charge of coordinating the efficient operation of the SEN, dispatching generation units to satisfy demand and known as the National Electricity Coordinator. It replaced the CDEC for both the SIC and SING in November 2017. | |
Chilean Stock Exchanges | Chilean Stock Exchanges |
| The | |
|
|
|
|
|
|
| Comisión para el Mercado Financiero | Chilean Financial Market Commission, the governmental authority that supervises the financial markets. Formerly known as the Chilean Superintendence of Securities and Insurance or SVS in its Spanish acronym. | |
CNE | Comisión Nacional de Energía |
| Chilean National Energy Commission, governmental entity with responsibilities under the Chilean regulatory framework. | |
|
|
|
|
|
DCV |
| Depósito Central de Valores S.A. |
| Chilean Central Securities Depositary. |
|
|
|
|
|
|
|
|
| |
| Enel S.p.A. |
| An Italian energy company with multinational operations in the power and gas markets. A | |
|
|
|
|
|
Enel Américas |
| Enel Américas S.A. |
|
|
|
|
|
|
|
Enel Chile |
| Enel Chile S.A. |
| Our parent company, a Chilean publicly held limited liability stock corporation, |
Enel Distribution |
| Enel Distribución Chile S.A. |
| |
|
| An affiliated Chilean | ||
|
|
|
|
|
Enel |
| Enel Generación Chile S.A. |
| Our company, a Chilean publicly held limited liability stock corporation, |
|
|
|
|
|
|
| Enel |
| A |
|
|
|
|
|
|
|
|
|
|
|
|
| ||
4
OSM |
| |||
|
|
| ||
| Ordinary Shareholders’ Meeting |
| Ordinary Shareholders’ Meeting. | |
|
|
|
|
|
Pehuenche |
| Empresa Eléctrica Pehuenche S.A. |
| A Chilean publicly held limited liability |
|
|
|
|
|
SEF |
| Superintendencia de Electricidad y Combustible |
| Chilean Superintendence of Electricity and Fuels, the governmental authority that supervises the Chilean electricity industry. |
|
|
|
|
|
|
| Sistema |
| The National Electricity System is the Chilean |
|
|
|
|
|
|
| Sistema Interconectado |
| Chilean central interconnected |
|
|
|
|
|
|
|
|
| Chilean |
|
|
|
|
|
UF |
| Unidad de Fomento |
| Chilean inflation-indexed, Chilean peso-denominated monetary unit equivalent to Ch$ |
|
|
|
|
|
UTA |
| Unidad Tributaria Anual |
| Chilean annual tax unit. One UTA equals 12 580,236. |
As used in this Report on Form 20-F (the “Report”), first person personal pronouns such as “we,” “us” or “our”, as well as “Enel Generación Chile”, “Enel Generation” or the “Company”, refer to Enel Generación Chile S.A. and our consolidated subsidiaries unless the context indicates otherwise. Unless otherwise noted, our interest in our principal subsidiaries, and jointly-controlled entities and associates is expressed in terms of our economic interest as of December 31, 2016.2018.
We are a Chilean company engaged in the electricity generation business in Chile directly and through our subsidiaries and jointly-controlled entities and are the surviving company spun off from Empresa Nacional de Electricidad S.A. (“Endesa Chile”).
We are a publicly held limited liability stock corporation originally organized on December 1, 1943 under the laws of the Republic of Chile. During 2016, we completed a corporate reorganization to separate our Chilean businesses from our non-Chilean businesses. On October 18, 2016, and as part of this process, (i) Endesa Chile changed its name to Enel Generación Chile S.A.; (ii) Chilectra Chile S.A. changed its name to Enel Distribución Chile S.A.; and (iii) Enersis Chile S.A. changed its name to Enel Chile S.A. For additional information relating the company and the corporate reorganization completed in 2016, please see “Item 4. Information on the Company — A. History and Development of the Company” and “— The 2016 Reorganization”.
As of the date of this Report and after giving effect to the 2018 Reorganization, (i) our direct controlling entity, Enel Chile S.A. (“Enel Chile”), owns 60.0%93.6% of our shares.
shares and (ii) Enel S.p.A. (“Enel”), an Italian energy company with multinational operations in the power and gas markets, beneficially owns 60.6%61.9% of Enel Chile as of December 31, 2018, and is our ultimate controlling shareholder. Enel hasshareholder with an economic interest of 36.4%57.9% in our Company.
During 2016, Enersis S.A. (now known as Enel Américas S.A.) and certain of its subsidiaries including Endesa Chile carried out a reorganization process, which, among other things, involved the separation of their Chilean and non-Chilean electricity businesses in South America. The separation of the businesses was effective on March 1, 2016, resulting, in among other things, the Company spinning off its non-Chilean businesses, resulting in the Company holding the Chilean generation business. For additional information relating to the reorganization,2018 Reorganization, see “Item 4. Information on the Company — A. History and Development of the Company — The 2016 Reorganization.”2018 Reorganization”.
6
Financial Information
In this Report, unless otherwise specified, references to “U.S. dollars” or “US$”, are to dollars of the United States of America (“United States”); references to “pesos” or “Ch$” are to Chilean pesos, the legal currency of Chile; and references to “UF” are to Unidades de Fomento. The UF is a Chilean inflation-indexed, peso-denominated monetary unit that is adjusted daily to reflect changes in the official Consumer Price Index (“CPI”) of the Chilean National Institute of Statistics (Instituto Nacional de Estadísticas or “INE”). The UF is adjusted in monthly cycles. Each day in the period beginning on the tenth day of the current month through the ninth day of the succeeding month, the nominal peso value of the UF is indexed in order to reflect a proportionate amount of the change in the Chilean CPI during the prior calendar month. As of December 31, 2016,2018, one UF was equivalent to Ch$ 26,347.98.27,565.79. The U.S. dollar equivalent of one UF was US$ 39.3639.68 as of December 31, 2016,2018, using the Observed Exchange Rate reported by the Central Bank of Chile (Banco Central de Chile) as of December 31, 20162018 of Ch$ 669.47694.77 per US$ 1.00. The U.S. dollar observed exchange rate (dólar observado) (the “Observed Exchange Rate”), which is reported by the Central Bank of Chile and published daily on its webpage, is the weighted average exchange rate of the previous business day’s transactions in the Formal Exchange Market. Unless the context specifies otherwise, all amounts translated from Chilean pesos to U.S. dollars or vice versa, or from UF to Chilean pesos, have been carried out at the rates applicable foras of December 31, 2016.2018.
The Central Bank of Chile may intervene by buying or selling foreign currency on the Formal Exchange Market to maintain the Observed Exchange Rate within a desired range.
As of April 25, 2017, one UF was equivalent to Ch$ 26,543.75. The U.S. dollar equivalent of one UF was US$ 40.22 as of the same date, using the Observed Exchange Rate reported by the Central Bank of Chile as of such date of Ch$ 660.04 per US$ 1.00.
Our consolidated financial statements and, unless otherwise indicated, other financial information concerning us included in this Report are presented in Chilean pesos. We have prepared our consolidated financial statements in accordance with International Financial Reporting Standards (“IFRS”), as issued by the International Accounting Standards Board (“IASB”).
All of our subsidiaries are integrated and all their assets, liabilities, income, expenses and cash flows are included in the consolidated financial statements after making the adjustments and eliminations related to intra-group transactions. InvestmentsOur participation in associated companies over which we exercise significant influence are included in our consolidated financial statements using the equity method. For detailed information regarding consolidated entities, jointly-controlled entities and associated companies, see Appendices 1, 2 and 3 to the consolidated financial statements.
Since the conditions established under IFRS were met by December 31, 2016, in the financial statements included in this Report, all operations regarding the former Chilean businesses have been presented as discontinued operations. Therefore, the financial statements
Solely for the year ended as of December 31, 2016 include discontinued operations for two months while the financial statements for the years ended December 31, 2015 and 2014 include discontinued operations for twelve months.
For the convenience of the reader, this Report contains translations of certain Chilean peso amounts into U.S. dollars at specified rates. Unless otherwise indicated, the U.S. dollar equivalent for information in Chilean pesos is based on the Observed Exchange Rate for December 31, 2016,2018, as defined in “Item 3. Key Information — A. Selected Financial Data — Exchange Rates.”Rates”. The Federal Reserve Bank of New York does not report a noon buying rate for Chilean pesos. No representation is made that the Chilean peso or U.S. dollar amounts shown in this Report could have been or could be converted into U.S. dollars or Chilean pesos, as the case may be, at such rate or at any other rate. See “Item 3. Key Information — A. Selected Financial Data — Exchange Rates.”Rates”.
During 2016, we completed a corporate reorganization, which involved the separation of our Chilean and non-Chilean electricity businesses in South America, resulting in our retaining only the Chilean electricity businesses, effective as of March 1, 2016. All operations regarding the former non-Chilean businesses in South America have been presented as discontinued operations. In order to comply with conditions established under IFRS, the financial statements for the year ended as of December 31, 2016 include discontinued operations for two months. The financial statements subsequent to December 31, 2016 do not include discontinued operations. For additional information relating to the corporate reorganization, please see “Item 4. Information on the Company — A. History and Development of the Company — The 2016 Reorganization”.
Technical Terms
References to “TW” are to terawatts (1012 watts or a trillion watts); references to “GW” and “GWh” are to gigawatts (109 watts or a billion watts) and gigawatt hours, respectively; references to “MW” and “MWh” are to megawatts (106 watts or a million watts) and megawatt hours, respectively; references to “kW” and “kWh” are to kilowatts (103watts or a thousand watts) and kilowatt hours, respectively; references to “kV” are to kilovolts, and references to “MVA” are to megavolt amperes. References to “BTU” and “MBTU” are to British thermal unit and million British thermal units, respectively. A “BTU” is an energy unit equal to approximately 1,055 joules. References to “Hz” are to hertz; and references to “mtpa” are to metric tons per annum. Unless otherwise indicated, statistics provided in this Report with respect to the installed capacity of electricity generation facilities are expressed in MW. One
TW equals 1,000 GW, one GW equals 1,000 MW and one MW equals 1,000 kW.The installed capacity we are presenting in this Report corresponds to the gross installed capacity, without considering the MW that each power plant consumes for its own operation.
Statistics relating to aggregate annual electricity production are expressed in GWh and based on a year of 8,760 hours, except for leap years, which are based on 8,784 hours. Statistics relating to installed capacity and production of the electricity industry do not include electricity of self-generators.
7
Energy losses experienced by generation companies during transmission are calculated by subtracting the number of GWh of energy sold from the number of GWh of energy generated (excluding their own energy consumption and losses on the part of the power plant), within a given period. Losses are expressed as a percentage of total energy generated.
Calculation of Economic Interest
References are made in this Report to the “economic interest” of Enel Generación ChileGeneration in its related companies. We could have direct and indirect interest is such companies. In circumstances where we do not directly own an interest in a related company, our economic interest in such ultimate related company is calculated by multiplying the percentage of economic interest in a directly held related company by the percentage of economic interest of any entity in the ownership chain of such related company. For example, if we directly own a 6% equity stake in an associatedassociate company and 40% is directly held by our 60%-owned subsidiary, our economic interest in such associate would be 60% times 40% plus 6%, orequal to 30%.
Rounding
Certain figures included in this Report have been rounded for ease of presentation. Because of this rounding, it is possible that amounts in tables may not add up to exactly the same amounts as the sum of the entries.
8
This Report contains statements that are or may constitute forward-looking statements within the meaning of Section 27A of the Securities Act of 1933, as amended, and Section 21E of the Securities Exchange Act of 1934, as amended (the “Exchange Act”). These statements appear throughout this Report and include statements regarding our intent, belief or current expectations, including, but not limited to, any statements concerning:
·our capital investment program;
·trends affecting our financial condition or results from operations;
·our dividend policy;
·the future impact of competition and regulation;
·political and economic conditions in the countries in which we or our related companies operate or may operate in the future;
·any statements preceded by, followed by or that include the words “believes,” “expects,” “predicts,” “anticipates,” “intends,” “estimates,” “should,” “may” or similar expressions; and
·other statements contained or incorporated by reference in this Report regarding matters that are not historical facts.
Because such statements are subject to risks and uncertainties, actual results may differ materially from those expressed or implied by such forward-looking statements. Factors that could cause actual results to differ materially include, but are not limited to:
·demographic developments, political events, economic fluctuations and interventionist measures by authorities in Chile;
hydrology,
· water supply, droughts, flooding and other weather conditions;
·changes in the Chilean environmental regulations and the regulatory framework of the electricity industry;
·our ability to implement proposed capital expenditures, including our ability to arrange financing where required;
·the nature and extent of future competition in our principal markets; and
·the factors discussed below under “Risk Factors.”
You should not place undue reliance on such statements, which speak only as of the date that they were made. Our independent registered public accounting firm has not examined or compiled the forward-looking statements and, accordingly, does not provide any assurance with respect to such statements. You should consider these cautionary statements together with any written or oral forward-looking statements that we may issue in the future. We do not undertake any obligation to release publicly any revisions to forward-looking statements contained in this Report to reflect later events or circumstances or to reflect the occurrence of unanticipated events.events, except as required by law.
For all these forward-looking statements, we claim the protection of the safe harbor for forward-looking statements contained in the Private Securities Litigation Reform Act of 1995.
9
Item 1.Identity of Directors, Senior Management and Advisers
Not applicable.
Item 2.Offer Statistics and Expected Timetable
Not applicable.
A.InformationSelected Financial Data.
|
|
The following selected consolidated financial data should be read in conjunction with our consolidated financial statements included in this Report. The selected consolidated financial data as of December 31, 20162018, and 20152017 and for each of the years in the three-year period ended December 31, 20162018, are derived from our audited consolidated financial statements included in this Report. The selected consolidated financial data as of December 31, 20142016, 2015 and 2013,2014, and for the yearyears ended December 31, 20132015, and 2014 are derived from our consolidated financial statements not included in this Report. Our consolidated financial statements were prepared in accordance with IFRS, as issued by the IASB. Pursuant to transitional relief granted by
Amounts in the SEC, selected consolidated financial data as of and for the year ended December 31, 2012 have been omitted as such information cannot be provided on a restated basis to reflect the spin-off of Endesa Américas without unreasonable effort or expense.
Amountstables are expressed in millions, except for ratios, operating data and data for shares and American Depositary Shares (“ADS”). For the convenience of the reader, all data presented in U.S. dollars in the following summary, as of and for the year ended December 31, 2016,2018, has been converted at the U.S. dollar Observed Exchange Rate (dólar observado) for that date of Ch$ 669.47694.77 per US$ 1.00. The Observed Exchange Rate, which is reported and published daily on the Central Bank of Chile’s web page, corresponds to the weighted average exchange rate of the previous business day’s transactions in the Formal Exchange Market. For more information concerning historical exchange rates, see “Item 3. Key Information — A. Selected Financial Data — Exchange Rates” below.
10
The following tables set forth our selected consolidated financial data and operating data for the years indicated:
|
| As of and for the year ended December 31, |
|
| As of and for the year ended December 31, |
| |||||||||||||||||||||||||||
|
| 2016(1) |
|
| 2016 |
|
| 2015 |
|
| 2014 |
|
| 2013 |
|
| 2018(1) |
| 2018 |
| 2017 |
| 2016 |
| 2015 |
| 2014 |
| |||||
|
| (US$ millions) |
|
| (Ch$ millions) |
|
| (US$ millions) |
|
|
| (Ch$ millions) |
| ||||||||||||||||||||
Consolidated Statement of Comprehensive Income Data |
|
|
|
|
|
|
|
|
|
|
|
|
|
|
|
|
|
|
|
|
|
|
|
|
|
|
|
|
|
|
|
|
|
Revenues and other operating income |
|
| 2,479 |
|
|
| 1,659,727 |
|
|
| 1,543,810 |
|
|
| 1,230,975 |
|
|
| 970,037 |
|
| 2,189 |
| 1,521,054 |
| 1,634,937 |
| 1,659,727 |
| 1,543,810 |
| 1,230,975 |
|
Operating costs(2) |
|
| (1,835 | ) |
|
| (1,228,341 | ) |
|
| (1,141,991 | ) |
|
| (978,713 | ) |
|
| (700,715 | ) |
| (1,521 | ) | (1,056,671 | ) | (1,171,077 | ) | (1,228,341 | ) | (1,141,991 | ) | (978,713 | ) |
Operating income from continuing operations |
|
| 644 |
|
|
| 431,386 |
|
|
| 401,819 |
|
|
| 252,262 |
|
|
| 269,322 |
| |||||||||||||
Operating income |
| 668 |
| 464,383 |
| 463,860 |
| 431,386 |
| 401,819 |
| 252,262 |
| ||||||||||||||||||||
Financial results(3) |
|
| (53.3 | ) |
|
| (35,679 | ) |
|
| (114,252 | ) |
|
| (77,345 | ) |
|
| (73,995 | ) |
| (69 | ) | (47,947 | ) | (36,610 | ) | (35,679 | ) | (114,252 | ) | (77,345 | ) |
Other gains |
|
| 181 |
|
|
| 121,491 |
|
|
| 4,015 |
|
|
| 42,652 |
|
|
| 2,514 |
|
| 5 |
| 3,435 |
| 113,089 |
| 121,491 |
| 4,015 |
| 42,652 |
|
Share of profit (loss) of associates and joint ventures accounted for using the equity method |
|
| 12 |
|
|
| 7,878 |
|
|
| 8,905 |
|
|
| (54,353 | ) |
|
| 24,309 |
|
| 5 |
| 3,281 |
| (2,697 | ) | 7,878 |
| 8,905 |
| (54,353 |
|
|
|
|
|
|
|
|
|
|
|
|
|
|
|
|
|
|
|
|
|
|
|
|
|
|
|
|
|
|
|
|
|
|
|
Income from continuing operations before income taxes |
|
| 784 |
|
|
| 525,077 |
|
|
| 300,487 |
|
|
| 163,216 |
|
|
| 222,150 |
| |||||||||||||
Income tax expense, from continuing operations |
|
| (124 | ) |
|
| (83,217 | ) |
|
| (76,656 | ) |
|
| (94,058 | ) |
|
| (36,995 | ) | |||||||||||||
Net income from continuing operations |
|
| 660 |
|
|
| 441,860 |
|
|
| 223,831 |
|
|
| 69,158 |
|
|
| 185,155 |
| |||||||||||||
Income before income taxes |
| 609 |
| 423,152 |
| 537,642 |
| 525,077 |
| 300,487 |
| 163,216 |
| ||||||||||||||||||||
Income tax expense |
| (151 | ) | (104,947 | ) | (112,100 | ) | (83,217 | ) | (76,656 | ) | (94,058 | ) | ||||||||||||||||||||
Net income |
| 458 |
| 318,205 |
| 425,542 |
| 441,860 |
| 223,831 |
| 69,158 |
| ||||||||||||||||||||
Profit after tax from discontinued operations |
|
| 119 |
|
|
| 79,572 |
|
|
| 411,190 |
|
|
| 489,919 |
|
|
| 378,351 |
|
| — |
| — |
| — |
| 79,572 |
| 411,190 |
| 489,919 |
|
Net income for the year |
|
| 779 |
|
|
| 521,432 |
|
|
| 635,021 |
|
|
| 559,077 |
|
|
| 563,506 |
|
| 458 |
| 318,205 |
| 425,542 |
| 521,432 |
| 635,021 |
| 559,077 |
|
|
|
|
|
|
|
|
|
|
|
|
|
|
|
|
|
|
|
|
|
|
|
|
|
|
|
|
|
|
|
|
|
|
|
Net income attributable to the parent Company |
|
| 706 |
|
|
| 472,558 |
|
|
| 392,868 |
|
|
| 276,027 |
|
|
| 353,927 |
|
| 445 |
| 309,029 |
| 418,454 |
| 472,558 |
| 392,868 |
| 276,027 |
|
Net income attributable to non-controlling interests |
|
| 73 |
|
|
| 48,874 |
|
|
| 242,153 |
|
|
| 283,050 |
|
|
| 209,579 |
|
| 13 |
| 9,176 |
| 7,088 |
| 48,874 |
| 242,153 |
| 283,050 |
|
Basic and diluted earnings per share from continuing operations (Ch$/US$ per share) |
|
| 0.08 |
|
|
| 52.77 |
|
|
| 25.89 |
|
|
| 6.81 |
|
|
| 21.11 |
| |||||||||||||
Basic and diluted earnings per share from continuing operations (Ch$/US$ per share) |
|
| 2.36 |
|
|
| 1,583.10 |
|
|
| 776.70 |
|
|
| 204.30 |
|
|
| 633.30 |
| |||||||||||||
Basic and diluted earnings per share (Ch$/US$ per share) |
| 0.05 |
| 37.7 |
| 51.0 |
| 52.8 |
| 25.9 |
| 6.8 |
| ||||||||||||||||||||
Basic and diluted earnings per share (Ch$/US$ per ADS) |
| 1.63 |
| 1,130 |
| 1,531 |
| 1,583 |
| 777 |
| 204 |
| ||||||||||||||||||||
Total Basic and diluted earnings per share (Ch$/US$ per share) |
|
| 0.09 |
|
|
| 57.62 |
|
|
| 47.90 |
|
|
| 33.49 |
|
|
| 43.15 |
|
| 0.05 |
| 37.7 |
| 51.0 |
| 57.6 |
| 47.9 |
| 33.5 |
|
Total Basic and diluted earnings per ADS (Ch$/US$ per ADS) |
|
| 2.58 |
|
|
| 1,728.50 |
|
|
| 1,437.00 |
|
|
| 1,004.70 |
|
|
| 1,294.50 |
|
| 1.63 |
| 1,130 |
| 1,531 |
| 1,729 |
| 1,437 |
| 1,005 |
|
Cash dividends per share (Ch$/US$ per share) |
|
| 0.02 |
|
|
| 14.58 |
|
|
| 20.39 |
|
|
| 21.58 |
|
|
| 14.29 |
|
| 0.03 |
| 22.6 |
| 28.1 |
| 14.6 |
| 20.4 |
| 21.6 |
|
Cash dividends per ADS (Ch$/US$ per ADS) |
|
| 0.65 |
|
|
| 437.4 |
|
|
| 611.7 |
|
|
| 647.4 |
|
|
| 428.7 |
|
| 0.98 |
| 678 |
| 864 |
| 437 |
| 612 |
| 647 |
|
Number of shares of common stock (millions) |
|
|
|
|
|
| 8,202 |
|
|
| 8,202 |
|
|
| 8,202 |
|
|
| 8,202 |
|
| 8,202 |
| 8,202 |
| 8,202 |
| 8,202 |
| 8,202 |
| 8,202 |
|
|
|
|
|
|
|
|
|
|
|
|
|
|
|
|
|
|
|
|
|
|
|
|
|
|
|
|
|
|
|
|
|
|
|
Consolidated Statement of Financial Position Data |
|
|
|
|
|
|
|
|
|
|
|
|
|
|
|
|
|
|
|
|
|
|
|
|
|
|
|
|
|
|
|
|
|
Non-current assets and disposal groups held for sale or distribution to owners |
|
| 19.4 |
|
|
| 12,993 |
|
|
| 3,889,706 |
|
|
| 7,979 |
|
|
| — |
|
| — |
| — |
| 4,205 |
| 12,993 |
| 3,889,706 |
| 7,979 |
|
Total assets |
|
| 5,078 |
|
|
| 3,399,682 |
|
|
| 7,278,770 |
|
|
| 7,237,672 |
|
|
| 6,762,125 |
|
| 5,281 |
| 3,669,228 |
| 3,554,462 |
| 3,399,682 |
| 7,278,770 |
| 7,237,672 |
|
Non-current liabilities |
|
| 1,664.2 |
|
|
| 1,114,145 |
|
|
| 1,207,005 |
|
|
| 2,321,048 |
|
|
| 1,935,919 |
|
| 1,551 |
| 1,077,856 |
| 1,022,092 |
| 1,114,145 |
| 1,207,005 |
| 2,321,048 |
|
Liabilities associated with disposal groups held for sale or distribution to owners |
|
| — |
|
|
| — |
|
|
| 1,851,784 |
|
|
| 5,490 |
|
|
| — |
|
| — |
| — |
| — |
| — |
| 1,851,784 |
| 5,490 |
|
Equity attributable to the parent company |
|
| 2,541 |
|
|
| 1,700,962 |
|
|
| 2,648,190 |
|
|
| 2,700,280 |
|
|
| 2,651,968 |
|
| 2,836 |
| 1,970,521 |
| 1,961,518 |
| 1,700,962 |
| 2,648,190 |
| 2,700,280 |
|
Equity attributable to non-controlling interests |
|
| 43 |
|
|
| 28,798 |
|
|
| 895,700 |
|
|
| 823,606 |
|
|
| 935,846 |
|
| 39 |
| 26,970 |
| 27,496 |
| 28,798 |
| 895,700 |
| 823,606 |
|
Total equity |
|
| 2,584 |
|
|
| 1,729,760 |
|
|
| 3,543,890 |
|
|
| 3,523,886 |
|
|
| 3,587,814 |
|
| 2,875 |
| 1,997,491 |
| 1,989,014 |
| 1,729,760 |
| 3,543,890 |
| 3,523,886 |
|
Capital stock |
|
| 953 |
|
|
| 638,289 |
|
|
| 1,537,723 |
|
|
| 1,537,723 |
|
|
| 1,537,723 |
|
| 919 |
| 638,289 |
| 638,289 |
| 638,289 |
| 1,537,723 |
| 1,537,723 |
|
Other Consolidated Financial Data |
|
|
|
|
|
|
|
|
|
|
|
|
|
|
|
|
|
|
|
|
|
|
|
|
|
|
|
|
|
|
|
|
|
Capital expenditures (CAPEX) |
|
| 291 |
|
|
| 194,880 |
|
|
| 537,805 |
|
|
| 421,314 |
|
|
| 292,017 |
|
| 320 |
| 222,327 |
| 206,776 |
| 194,880 |
| 537,805 |
| 421,314 |
|
Depreciation, amortization and impairment losses |
|
| 244 |
|
|
| 163,386 |
|
|
| 115,042 |
|
|
| 113,766 |
|
|
| 92,577 |
|
| 170 |
| 117,866 |
| 117,282 |
| 163,386 |
| 115,042 |
| 113,766 |
|
(1) Solely for the convenience of the reader, Chilean peso amounts have been converted into U.S. dollars at the exchange rate of Ch$ 694.77 per U.S. dollar, as of December 31, 2018. (2) Operating costs represent raw materials and supplies used, other work performed by the entity, employee benefits expenses, depreciation and amortization expenses, impairment losses recognized in the period’s profit or loss and other expenses. (3) Financial results represent (+) financial income, (-) financial costs, (+/-) foreign currency exchange differences and net gains/losses from indexed assets and liabilities. (4) Please refer to Note 31 of the Notes to our consolidated financial statements. (5) One ADS = 30 shares of common stock. Please refer to Item 9. (6) Capital stock represents issued capital plus share premium. (7) CAPEX figures represent cash flows used for purchases of property, plant and equipment and intangible assets for each year. (8) For further detail please refer to Notes 27 and 29 of the Notes to our consolidated financial statements. |
|
|
|
|
|
|
|
|
|
|
|
|
| As of and for the year ended December 31, |
| |||||||||||||||||
|
| 2016 |
|
| 2015 |
|
| 2014 |
|
| 2013 |
|
| 2012 |
| |||||
OPERATING DATA |
|
|
|
|
|
|
|
|
|
|
|
|
|
|
|
|
|
|
|
|
Installed capacity (MW)(1) |
|
| 6,351 |
|
|
| 6,351 |
|
|
| 6,351 |
|
|
| 5,571 |
|
|
| 5,571 |
|
Generation (GWh)(1) |
|
| 17,564 |
|
|
| 18,294 |
|
|
| 18,063 |
|
|
| 19,438 |
|
|
| 19,194 |
|
|
|
11
As of and for the year ended December 31, 2018 2017 2016 2015 2014 OPERATING DATA Installed capacity (MW)(1) 6,274 6,351 6,351 6,351 6,351 Generation (GWh)(1) 17,373 17,073 17,564 18,294 18,063
Exchange Rates
Fluctuations in the exchange rate between the Chilean peso and the U.S. dollar will affect the U.S. dollar equivalent of the peso price of our shares of common stock on the Santiago Stock Exchange (Bolsa de Comercio de Santiago),Santiago) and the Chilean Electronic Stock Exchange (Bolsa Electrónica de Chile) and the Valparaíso Stock Exchange (Bolsa de Corredores de Valparaíso)Chile). These exchange rate fluctuations affect the price of our American Depositary Shares (“ADSs”) and the conversion of cash dividends relating to the common shares represented by ADSs from Chilean pesos to U.S. dollars. In addition, to the extent that significant financial liabilities of the Company are denominated in foreign currencies, exchange rate fluctuations may have a significant impact on earnings.
In Chile, there are two currency markets, the Formal Exchange Market (Mercado Cambiario Formal)Formal) and the Informal Exchange Market (Mercado Cambiario Informal)Informal). The Formal Exchange Market is comprised of banks and other entities authorized by the Central Bank of Chile. The Informal Exchange Market is comprised of entities that are not expressly authorized to operate in the Formal Exchange Market, such as certain foreign currency exchange houses and travel agencies, among others. The Central Bank of Chile has the authority to require that certain purchases and sales of foreign currencies be carried out on the Formal Exchange Market. Both the Formal and Informal Exchange Markets are driven by free market forces. Current regulations require that the Central Bank of Chile be informed of certain transactions that must be carried out through the Formal Exchange Market.
The U.S. dollar Observed Exchange Rate, which is reported by the Central Bank of Chile and published daily on its web page, is the weighted average exchange rate of the previous business day’s transactions in the Formal Exchange Market. Nevertheless, the Central Bank of Chile may intervene by buying or selling foreign currency on the Formal Exchange Market to attempt to maintain the Observed Exchange Rate within a desired range.
The Informal Exchange Market reflects transactions carried out at an informal exchange rate (the “Informal Exchange Rate”). There are no limits imposed on the extent to which the rate of exchange in the Informal Exchange Market can fluctuate above or below the Observed Exchange Rate. Foreign currency for payments and distributions with respect to the ADSs may be purchased either in the Formal or the Informal Exchange Market, but such payments and distributions must be remitted through the Formal Exchange Market.
The Federal Reserve Bank of New York does not report a noon buying rate for Chilean pesos. As of December 31, 2016,2018, the U.S. dollar Observed Exchange Rate was Ch$ 669.47694.77 per US$ 1.00.
The following table sets forth the low, high, average and period-end Observed Exchange Rate for U.S. dollars for the periods set forth below, as reported by the Central Bank of Chile:
|
| Daily Observed Exchange Rate (Ch$ per US$)(1) |
| |||||||||||||
|
| Low(2) |
|
| High(2) |
|
| Average(3) |
|
| Period-end |
| ||||
Year ended December 31, |
|
|
|
|
|
|
|
|
|
|
|
|
|
|
|
|
2016 |
|
| 645.22 |
|
|
| 730.31 |
|
|
| 676.67 |
|
|
| 669.47 |
|
2015 |
|
| 597.10 |
|
|
| 715.66 |
|
|
| 654.66 |
|
|
| 710.16 |
|
2014 |
|
| 527.53 |
|
|
| 621.41 |
|
|
| 570.34 |
|
|
| 606.75 |
|
2013 |
|
| 466.50 |
|
|
| 533.95 |
|
|
| 498.83 |
|
|
| 524.61 |
|
2012 |
|
| 469.65 |
|
|
| 519.69 |
|
|
| 486.31 |
|
|
| 479.96 |
|
Month ended |
|
|
|
|
|
|
|
|
|
|
|
|
|
|
|
|
March 2017 |
|
| 650.98 |
|
|
| 669.52 |
|
| n.a. |
|
|
| 663.97 |
| |
February 2017 |
|
| 638.35 |
|
|
| 648.88 |
|
| n.a. |
|
|
| 648.88 |
| |
January 2017 |
|
| 646.19 |
|
|
| 673.36 |
|
| n.a. |
|
|
| 646.19 |
| |
December 2016 |
|
| 649.40 |
|
|
| 677.11 |
|
| n.a. |
|
|
| 669.47 |
| |
November 2016 |
|
| 650.72 |
|
|
| 679.24 |
|
| n.a. |
|
|
| 673.54 |
| |
October 2016 |
|
| 651.18 |
|
|
| 670.88 |
|
| n.a. |
|
|
| 651.18 |
| |
Source: Central Bank of Chile.
|
|
|
|
|
|
As of April 25, 2017,22, 2019, the U.S. dollar Observed Exchange Rate was Ch$ 660.04663,91 per US$ 1.00.
Calculation of the appreciation or devaluation of the Chilean peso against the U.S. dollar in any given period is made by determining the percent change between the reciprocals of the Chilean peso equivalent of US$ 1.00 at the end of the preceding period
12
and the end of the period for which the calculation is being made. For example, to calculate the appreciationdevaluation of the year-end Chilean peso in 2016,2018, one determines the percentpercentage of change between the reciprocal of Ch$ 710.16,694.77, the value of one U.S. dollar as of December 31, 2015,2018, or 0.001408,0.001439, and the reciprocal of Ch$ 669.47,614.75, the value of one U.S. dollar as of December 31, 2016,2017, or 0.001494.0.001627. In this example, the percentage change between the two periods is 6.1%-11.5%, which represents the 20162018 year-end appreciationdevaluation of the Chilean peso against the 20152017 year-end U.S. dollar. A positive percentage change means that the Chilean peso appreciated against the U.S. dollar, while a negative percentage change means that the Chilean peso devaluated against the U.S. dollar.
The following table sets forth the period-end rates for U.S. dollars for the years ended December 31, 20122014 through December 31, 2016,2018, based on information published by the Central Bank of Chile.
|
| Ch$ per US$(1) |
|
| Ch$ per US$(1) |
| |||||||
|
| Period End |
|
| Appreciation (Devaluation) |
|
| Period End |
| Appreciation (Devaluation) |
| ||
|
| (in Ch$) |
|
| (in %) |
|
| (in Ch$) |
| (in %) |
| ||
Year ended December 31, |
|
|
|
|
|
|
|
|
|
|
|
|
|
2018 |
| 694.77 |
| (11.5 | ) | ||||||||
2017 |
| 614.75 |
| 8.9 |
| ||||||||
2016 |
|
| 669.5 |
|
|
| 6.1 |
|
| 669.47 |
| 6.1 |
|
2015 |
|
| 710.2 |
|
|
| (14.6 | ) |
| 710.16 |
| (14.6 | ) |
2014 |
|
| 606.8 |
|
|
| (13.5 | ) |
| 606.75 |
| (13.5 | ) |
2013 |
|
| 524.6 |
|
|
| (8.5 | ) | |||||
2012 |
|
| 480.0 |
|
|
| 8.2 |
| |||||
Source: Central Bank of Chile.
(1) Calculated based on the variation of period-end exchange rates. B.Capitalization and Indebtedness. |
|
|
|
Not applicable.
C.Reasons for the Offer and Use of Proceeds. |
|
Not applicable.
|
|
D.Risk Factors.
Chilean economic fluctuations, as well as certain economic interventionist measures by governmental authorities as well as political events or financial or other crises in any region worldwide may affect our results of operations, and financial condition and liquidity as well as the value of our securities.
All of our operations are located in Chile. Accordingly, our consolidated revenues may beare affected by the performance of the Chilean economy. If local, regional or worldwide economic trends adversely affect the Chilean economy, our financial condition and results from operations could be adversely affected. Insufficient cash flows could result in the inability to meet our debt obligations and the need to seek waivers to comply with restrictive debt covenants and increasing costs for subsequent financings.
The Chilean government has exercised in the past, and continues to exercise, a substantial influence over many aspects of the private sector, which may result in changes to economic or other policies. For example, in 2014 and 2016, the Chilean government approved Law 20,780, a tax reform law, and Law 20,940, a labor reform law, both of which may have a negative effect upon non-Chilean holders of shares or ADSs. For further details regarding Chilean tax considerations, please refer to “Item 10. Additional Information — E. Taxation.” Other governmental actions could involve wage, price and tariff rate controls, increase strikes and give workers greater collective bargaining power and other interventionist measures, such as expropriation or nationalization.
Future adverse developments in Chile or changes in policies regarding tariffs, water rights, exchange controls, regulations and taxation may impair our ability to execute our strategic plans,business plan, which could adversely affect our results of operations and financial condition. Inflation, devaluation, social instability and other political, economic or diplomatic developments including the response by governments in the region to these circumstances, could also reduce our profitability. In addition, Chilean financial and securities markets are influenced by economic and market conditions in other countries, and may be affected by events in other countries, which could adversely affect the value of our securities.
13
Because our businesses dependOur business depends heavily on hydrology, droughts, flooding and other weather conditions may adversely affect our operations and profitabilityhydrological conditions..
Approximately 55% of our consolidated installed generation capacity in 20162018 was hydroelectric. Accordingly, extremely dry hydrological conditions could adversely affect our business, results of operations and financial condition. Our results have been adversely affected when hydrological conditions in Chile have been significantly below their historical average.
In addition, the below-average hydrological conditions not only reduce our ability to operate our hydroelectric plants at full capacity, but also may result in increased water transportation costs for the operation of the San Isidro thermal power plant for cooling purposes. While Enel Generación Chile has
We have entered into certain agreements with the Chilean government and local irrigators regarding the use of water for hydroelectric generation purposes, especially during periods of low water levels, if drought conditionsdroughts persist, or become worse, we may face increased pressure by the Chilean government or other third parties to further restrict our water use.use further.
Thermal plant operating costs can be considerably higher than those of hydroelectric plants.
Our operating expenses increase during these drought periods when thermal plants, which have higher operating costs relative to hydroelectric plants, are useddispatched more frequently. In addition, depending on our commercial obligations, weWe may need to buy electricity at higher spot prices in order to comply with our contractual supply obligations and the cost of these electricity purchases may exceed our contracted electricity sale prices, thus potentially producing losses from those contracts. For further information with respect to the effect of hydrology on our business and financial results, please refer to “Item 5. Operating and Financial Review and Prospects—Prospects — A. Operating Results—1.Results —1. Discussion of Main Factors Affecting Operating Results and Financial Condition of the Company —a. Hydrological Conditions.Generation Business.”
Droughts also indirectly affect the operation of our thermal plants, including our facilities that use natural gas, fuel oil or coal, as fuel, in the following manner:
·Our thermal plants require water for cooling and droughts not onlyin extreme situations may reduce the availability of water but alsoand increase the concentrationcost of chemicals, such as sulfates in the water. The high concentration of chemicals in the water that we use for cooling increases the risk of damaging the equipment at our thermal plants as well as the risk of violating environmental regulations.transportation. As a result, we have had to purchase water for our San Isidro power plant from agricultural areas that are also experiencing water shortages. These water purchases may increase our operating costs and alsomay require us to further negotiate with the local communities.
|
|
The
· Thermal power plants that burn natural gas generate emissions such as nitrogen oxide (NO), carbon dioxide (CO2) and carbon monoxide (CO) gases. When operating with diesel they release NO, sulfur dioxide (SO2) and particulate matter into the atmosphere. Coal fired plants generate SO2 and NO emissions. Therefore, greater thermal plant use during droughts generally increases the risk of producing higher levels of greenhouse gas emissions, which also decreases our operating income due to the payment of so-called “green taxes.”
A full recovery from the drought that has been affecting the regions where most of our hydroelectric plants are located may last for an extended period andbut new drought periods may recur in the future. A prolonged drought may exacerbate the risks described above and have a further adverse effect upon our business, results of operations and financial condition.
Governmental regulations may adversely affect our business.businesses, cause delays, impede the development of new projects, or increase the costs of operations and capital expenditures.
Our businessbusinesses and the tariffs that we charge to our customers are subject to extensive regulation and these regulations may adversely affect our profitability. For example, governmental authorities might impose material rationing policies during droughts or prolonged failures of power facilities, which may adversely affect our business, results of operations and financial condition.
Our operating subsidiaries are also subject to environmental regulations that, among other things, require us to perform environmental impact studies for future projects and obtain construction and operating permits from both local and national regulators. The governmental authorities may withhold the approval of these environmental impact studies and therefore their processing time may be longer than expected. Similarly, electricity regulations issued by governmental authorities in Chile may affect the ability of our generation companies to collect revenues sufficient to offsetcover their operating costs.
In addition, changes
Environmental regulations for existing and future generation capacity have become stricter and require increased capital investments. Any delay in meeting the standards constitutes a violation of the regulations. Failure to certify the original implementation and ongoing emission standard requirements of such monitoring system may result in significant penalties and sanctions or legal claims for damages. We expect that even more restrictive emission limits will be established in the future. We are also subject to an annual green tax, based on our emission of pollutants in the previous year, and such taxes may increase in the future, and discourage thermal electricity generation.
Changes in the regulatory framework are often submitted to the legislators and administrative authorities and, some of these changes could have a material adverse impact on our business, results of operations and financial condition. For instance, in 2005 there was a change in the water rights law in Chile that requires us to pay for unused water rights, increasing the annual cost to maintain unused water rights for hydroelectric projects that are neither economically nor technically feasible. In August 2016, Enel Generación Chile waived its unused water rights and recorded a write-off of Ch$ 35.4 billion.
Regulatory authorities may impose fines on our subsidiaries due to operational failures or any breachbreaches of regulations.
Our electricity businesses may beare subject to regulatory fines for any breach of current regulations, including energy supply failures.
14
In Chile, such Such fines may be imposed for a maximum of 10,000 Annual Tax Units (“UTA” in its Spanish acronym), or Ch$ 5.55.8 billion using the UTA as of December 31, 2016.2018. Our electricity generation subsidiaries are supervised by local regulatory entitiesauthorities and may beare subject to these fines in cases where, in the opinion of the regulatory entity,authority, operational failures affecting the regular energy supply to the system, including coordination issues, are the fault of the company such as when agents are not coordinated with the system operator. In addition, the new transmission law establishesgenerator. Regulations establish a compensation fee to end customers when the energy supply is interrupted more than the standard allowed time. The compensationtime due to events or failures affecting transmission facilities. Compensation is a proportion of the energy not supplied with a minimum value between 20,000 UTA (Ch$ 11.111.6 billion) and the previous year'syear’s energy sales revenues in the case of generators. Fines may also be associated with breach of regulations.
In 2015, the CDEC-SING audited GasAtacama Chile’sGasAtacama’s thermal power plant and reported its findings to the Superintendence of Electricity and Fuels (“SEF”). In, which in August 2016 the SEF fined GasAtacama Chile Ch$ 5.5 billion10,000 UTA (Ch$ 5.8 billion) for allegedly providing inaccurate information to the CDEC-SING relatedCDEC-SING. In 2017, Gener and Engie, both competitors, demanded that Enel Generation pay US$ 65.8 million and US$ 160 million, respectively, as compensation for the alleged additional costs attributed to certain technical operating parameters that implied higher operating costs toGasAtacama in the system. These costs were associated with the technical minimum capacity reported by GasAtacama at 310 MW, with a 30-hour minimum operating time that the CEN later estimated to be only 118 MW and a 2-hour minimum operating time. Further compensation claims from other market players may arise in the future and further fines to any of our plants could adversely affect our business, results of operations and financial condition.
We depend in part on payments from our subsidiaries and jointly-controlled entitiesassociates to meet our payment obligations.
In order to pay our obligations, we may rely on cash from dividends, loans, interest payments, capital reductions and other distributions from our subsidiaries. The ability of our subsidiaries to pay dividends, interestSuch payments loans and other distributions to us isare subject to legal constraints such as dividend restrictions and fiduciary duties and contractual limitations that may be imposed by the authorities.obligations.
Dividend Limits and Other Legal Restrictions
Contractual Constraints. The ability of any of our subsidiaries that are not wholly-owned to distribute cash to us may be limited by the directors’ fiduciary duties of such subsidiaries to their minority shareholders. Furthermore, someDistribution restrictions included in certain credit agreements of our subsidiaries may be forced by law,prevent dividends and other distributions to shareholders if they are not in accordancecompliance with applicable regulation, to diminish or eliminate dividend payments. As a consequencecertain financial ratios. Our credit agreements typically prohibit any type of such restrictions, our subsidiaries could, under certain circumstances, be impeded from distributing cash to us.distribution if there is an ongoing default.
Operating Results of Our Subsidiaries. The ability of our subsidiaries to pay dividends or make loan payments or other distributions to us is limited by their operating results. To the extent that the cash requirements of any of our subsidiaries exceed their available cash, the subsidiary will not be able to make cash available to us.
Any of the situations described above could adversely affect our business, results of operations and financial condition.
We are involved in litigation proceedings.
We are currently involved in various litigation proceedings, which could result in unfavorable decisions or financial penalties against us. We will continue to be subject to future litigation proceedings, which could cause material adverse consequences to our business.
Our financial condition or results of operations could be adversely affected if we are unsuccessful in defending lawsuits and proceedings against us. For further information on litigation proceedings, please see “Item 8. Financial Information — A. Consolidated Statements and Other Financial Information — Legal Proceedings” and Note 3835.3 of the Notes to our consolidated financial statements.
Environmental regulations
Construction and other factorsoperation of power plants may cause encounter significant delays impede the developmentor halt and cost over-runs, as well as stakeholder opposition, which may damage our reputation and result in impairment of newour goodwill with stakeholders.
Our power plant projects or increase the costs of operations and capital expenditures.
We and our operating subsidiaries are subject to environmental regulations which, among other things, require us to perform environmental impact studies for future projects and obtain permits from both local and national regulators. The approval of these environmental impact studies may be withheld by governmental authoritiesdelayed in obtaining regulatory approvals, or may face shortages and therefore their processing time may be longer than expected.
The projects that require consultation with local stakeholdersincreases in their evaluation process may be rejectedthe price of equipment, materials or their development may be impeded or slowed down. Our stakeholders may also seek injunctive or other relief, which could negatively impact us iflabor, and they are successful. Moreover, projects that do not require consultation with local stakeholders may be subject to intervention or suffer continuous resistance, delaying their approval process or development.construction delays, strikes, adverse weather conditions, natural disasters, civil unrest, accidents, and human error. Any such event could adversely impact our business, results of operations and financial condition.
Environmental regulations for existing
Market conditions at the time when the projects are initially approved may differ significantly from those that prevail when the projects are completed, which in some cases make such projects commercially unfeasible. This has been the case with many of our former projects, which were initially planned under very different market conditions with higher energy prices prevailing in the market and future generation capacity may become stricter, requiring increased capital investments. For example, Decree13/2011less competition. Deviations in these assumptions, including the estimates of the Chilean Ministry of the Environment, published in June 2011, established stricter emission standards for existing thermoelectric plants that were requiredtiming and expenditures related to be met between 2014these projects, may lead to cost over-runs and 2016, and stricter standards for new facilities or additional capacity. This regulation also required the establishment of a system of continuous emission monitoring, pursuant to which thermoelectric plants must implement a monitoring system in accordance with the guidelines and protocols issued by the Chilean Superintendence of the Environment. In compliance with these Chilean environmental regulations, all thermal plants
15
made incremental investments to comply with the new regulations by installing abatement systems to control pollutant emissions. For example, we are improvingcompletion time widely exceeding our Tarapacá thermal plant through the installation of a desulphurizer to reduce sulfur oxides (SO2) and implementation of measures to improve combustion to reduce emissions of nitrogen oxide (NOx). As of December 31, 2016, the amount accrued in connection with such investments was Ch$ 65,718 million.
Any delay in meeting the standards constitutes a violation of the regulations which established emission limits effective June 23, 2015 or June 23, 2016 depending on the plant’s location and failure to certify the implementation of such monitoring system may result in penalties and sanctions.
In addition, any deviation from the environmental license to operate could result in severe sanctions from authorities. For example, during 2016 Enel Generación Chile paid fines of Ch$ 1.1 billion for non-compliance with the requirements under the environmental licenses and failing to send the monitoring reports for our Bocamina, Huasco and Diego de Almagro thermal plants in past years.
Currently, the Chilean Ministry of Environment is working on new prevention and decontamination plans in polluted areas and the Chilean Ministry of Energy is also preparing new mitigation plans to reduce carbon dioxide emissions and comply with the Paris Agreement under the United Nations Framework Convention on Climate Change. Such plans may modify Decree 13/2011 and even further restrict the emission standards for thermoelectric plants, which in turn may require additional investments in the future.
In September 2014, the Chilean government enacted Law 20,780, a tax reform law, which will come into effect in 2018, and thereby established an annual tax on stationary power generators, such as thermal generators, based on their emission of pollutants for the previous year. In December 2016, the Chilean Ministry of Environment published the list of thermal generators that are affected by this tax, and the list included all of our thermal plants. These plants will have to report their emissions during 2017 and will have an additional tax liability in 2018. It is possible that the tax expense might increase in the future, discouraging thermal generation given the increasing cost of operation.
In December 2016, Enel Generación Chile recorded a write-off of Ch$ 1.1 billion for the Tames 2 and Totoralillo thermal projects, due to their technology (steam turbine/coal), which is becoming more expensive because of stricter regulation and its uncertain profitability, among other reasons.
We may have to incur additional costs to remediate and implement our asbestos control and sanitation policy, or be subject to legal actions against us,initial estimates, which in turn may have a material adverse effect on our business, results of operation and financial condition.
In addition to environmental considerations, there are other factors that
The operation of our coal-fired thermal power plants may adversely affect our abilitygoodwill with stakeholders, due to build new facilities or to complete projects currently under development on time, including delays in obtaining regulatory approvals, shortages or increases in the price of equipment, materials or labor, constructions delays, strikes, adverse weather conditions, natural disasters, civil unrest, accidents, or other unforeseen events. For example, many of our power plants have been delayed by years in relation to their original planning and design. Any such event could adversely impact our results of operations and financial condition.
Delays or modifications to any proposed project and laws or regulations may change or be interpreted in a manner thatgreenhouse gas emissions, which could adversely affect our operationsthe environment and local residents. In addition, communities might have their own interests and different perceptions of the company, or our plans for companies in which we hold investments,be influenced by other stakeholders or motivations unrelated to the project. Therefore, if the company fails to engage with its relevant stakeholders, it might face opposition, which could adversely affect our business, results ofreputation, stall operations and financial condition.
Our business may be adversely affected by judicial decisions on environmental qualification resolutions for electricity projects in Chile.
The amount of time necessary to obtain an environmental qualification resolution for electricity generation or transmission projects in Chile has materially increased, primarily due to judicial decisions against such projects, environmental opposition, social criticism and government delays. This can cast doubt on the ability of a project to obtain such approval and increase the uncertainty for investing in electricity generation and transmission projects in Chile. The uncertainty is forcing companies to reassess their business strategies.
Our power plant projects may encounter significant opposition from different groups that may delay their development, increase costs, damage our reputation and potentially result in impairment of our goodwill with stakeholders.
a lawsuit. Our reputation is the foundation of our relationship with key stakeholders. If we are unable to effectively manage real or perceived issues that could impactaffect us negatively, our business, results of operations and financial condition could be adversely affected.
16
In 2015, the Chilean Ministry of Environment enacted Law 20,500, setting the procedures for stakeholder participation in the preliminary phase of the evaluation process to avoid risk of conflict and minimize the project impacts. Plants built before this adoption of these rules that were not submitted to local consultation may face opposition from several stakeholders, such as ethnic groups, environmental groups, land owners, farmers, local communities and political parties, among others, any of whom may impact the sponsoring company’s reputation and goodwill. For example, since December 2013, the Bocamina II power plant has encountered substantial opposition from local fishermen’s unions that claim that our facility negatively affects marine life and causes pollution, which resulted in the interruption of the operation of the power plant for more than a year. On July 1, 2015, the Bocamina II power plant resumed operations, after the approval of a new RCA in April 2015. Also, between November 23, 2015 and January 7, 2016, a second group of fishermen illegally occupied the first high-tension pylon which supports the 154 kV and 220 kV circuits owned by Transelec S.A. and serve the Bocamina I and II power plants. As a consequence, both Bocamina I and II power plants were temporarily shut down. This second group claimed that they should receive the same benefits that Enel Generación Chile granted to the first group of fishermen in the zone. The financial effects of this illegal occupation and electricity transmission interruption amounted to Ch$ 2.8 billion of losses between November 23, 2015 and January 7, 2016. At the level of the electrical system, this situation increased the spot prices and the anticipated use of hydroelectric reserves. Such groups and other similar groups may have the ability to block our power plants and directly affect our results.
The operation of our current thermal power plants may also affect our goodwill with stakeholders, due to emissions such as particulate matter, sulfur dioxide (SO2) and nitrogen oxide (NO), which could adversely affect the environment.
Damage to our reputation may exert considerable pressure on regulators, creditors, and other stakeholders and ultimately lead to projects and operations that may be abandoned, causing our share prices to drop and hindering our ability to attract and retain valuable employees, any of which could result in an impairment of our goodwill with stakeholders.
Political events or financial or other crises in any region worldwide can have a significant impact in Chile, and consequently, may adversely affect our operations as well as our liquidity.
Chile is vulnerable to external shocks, including financial and political events, which could cause significant economic difficulties and affect growth. If the Chilean economyChile experiences lower than expected economic growth or a recession, it is likely that our customers will demand less electricity and that some of our customers may experience difficulties paying their electric bills, possibly increasing our uncollectible accounts. Any of these situations could adversely affect our results of operations and financial condition.
Financial and political events in other parts of the world could also adversely affect our business. For example, the 2016 presidential electionsince 2018, U.S. and China have been involved in the United States considerablya trade war involving protectionist measures, which increased the volatility of financial markets worldwide based ondue to the uncertainty of political decisions. New United States policies could affect world markets and global trade and result in renewed volatility, especially in commodity prices. Moreover, instabilityInstability in the Middle East or in any other major oil producingoil-producing region could also result in higher fuel prices worldwide, which in turn could increaseincreasing the operating cost of fuel for our thermal generation plants and adversely affectaffecting our results of operations and financial condition.
In addition, an
The U.S. federal government has experienced shutdowns in recent times, including the 2018-2019 U.S. government shutdown, which affected the SEC among many other federal agencies, and extended for 35 days, the longest federal government shutdown in
U.S. history. Even temporary or threatened U.S. government shut-downs could have a material adverse effect on the timing, execution and increased expense associated with our international financings and our M&A activities.
An international financial crisis and its disruptive effects on the financial industry could adversely impact our ability to obtain new bank financings on the same historical terms and conditions that we have benefited from to date.
Political events or financial or other crises could also diminish our ability to access the Chilean and international capital markets or increase the interest rates available to us. Reduced liquidity, could, in turn, could adversely affect our capital expenditures, our long-term investments and acquisitions, our growth prospects and our dividend payout policy.
We may be unable to enter into suitable acquisitions.acquisitions or successfully integrate businesses that we acquire.
On an ongoing basis, we review acquisition prospects that may increase our market coverage or supplement our existing businesses, though there can be no assurance that we will be able to identify and consummate suitable acquisition transactions in the future. The acquisition and integration of independent companies that we do not control is generally a complex, costly and time-consuming process and requires significant efforts and expenditures. If we consummate an acquisition, it could result in the incurrence of substantial debt and assumption of unknown liabilities, the potential loss of key employees, amortization of expenses related to tangible assets and the diversion of management’s attention from other business concerns. In addition, anyintegrating acquired businesses may be difficult, expensive, time-consuming and a strain on our resources and our relationships with our employees and customers and ultimately may not be successful or achieve the benefits expected. Any delays or difficulties encountered in connection with acquisitions and the integration of multiple operationstheir businesses could have a material adverse effect on our business, financial condition or results of operations.
17
Our business and profitability could be adversely affected if water rights are denied or if water concessions are granted with limited duration.
We own water rights granted by the Chilean Water Authority (Dirección General de Aguas)Aguas) for the supply of water from rivers and lakes near our production facilities. Under current law, these water rights are (i) for unlimited duration, (ii) absolute and unconditional property rights and (iii) not subject to further challenge. Chilean generation companies must pay an annual license fee for unused water rights. New hydroelectric facilities are required to obtain water rights, the conditions of which may impactaffect design, timing or profitability of a project.
In addition, the Chilean Congress is currently discussinghas discussed amendments to the Water Code since 2014 in order to prioritize the use of water by defining its access as a basic human rightneed that must be guaranteed by the State. The amendment will establish that water use for human consumption, domestic subsistence and sanitation will always take precedence, in both the granting and limiting the exercise of rights of exploitation. Under the proposal: (i) new water use concessions would be limitedRestrictions enacted to 30 years, which would be extendable with respect to water rights actually used during the 30-year period, unless the Chilean Water Authority demonstrates the water rights have not been used effectively; (ii) new non-consumptive water rights would expire if the holder does not exercise the rights within eight years; (iii) existing non-consumptive water rights which have not been used would expire within eight years from the date of enactment of the new Water Code; and (iv) the preservation of waterpreserve environmental flows to protect the ecosystem for future water rights was added for both consumptive and non-consumptive water use and empowers the Chilean Water Authority to mandate an enviromental flow requirement for existing water rights. This last point would reduce water availability for generation purposes.
Any limitations on our current water rights, our need for additional water rights, or our current unlimited duration of water concessions could have a material adverse effect on our hydroelectric development projects and our profitability. Any limitations on our current water rights, our need for additional water rights, or our current unlimited durationAs of water concessions couldthe date of this Report, no resolutions have a material adverse effect on our hydroelectric development projectsbeen adopted and our profitability.the uncertainty remains.
Foreign exchange risks may adversely affect our results and the U.S. dollar value of dividends payable to ADS holders.
The Chilean peso has been subject to devaluations and appreciations against the U.S. dollar and may be subject to significant fluctuations in the future. Historically, a significant portion of our consolidated indebtedness has been denominated in U.S. dollars. Although a substantial portion of our operating cash flows is linked to the U.S. dollars,dollar (primarily coming from the generation business), we generally have been and will continue to be materially exposed to fluctuations of the Chilean peso against the U.S. dollar, because ofwhich is due to time lags and other limitations to pegpegging our tariffs to the U.S. dollar and the eventualpotential difficulty of incurring debtobtaining loans in the same currency as our operating cash flow.
Because of this exposure, the value of cash generated by our subsidiaries in U.S. dollars can decrease substantially due to peso devaluations against the U.S. dollar. Future volatility in the exchange rate of the currency in which we receive revenues or incur expenditures may adversely affect our business, results of operations and financial condition.
Our long-term energyelectricity sale contracts are subject to fluctuations in the market prices of certain commodities, energy and other factors.
In our generation business, we
We have economic exposure to fluctuations in the market prices of certain commodities as a result of the long-term energyelectricity sales contracts into which we have entered, and the fact that currently 83.0% of our expected annual generation is sold under contracts with terms of at least five years.entered. We have material obligations as selling parties under long-term fixed-price electricity sales contracts. Prices in these contracts are indexed according to different commodities, the exchange rate, inflation,rates and the market price of electricity.inflation. Adverse changes to these indices would reduce the rates we charge under our long-term fixed-price electricity sales contracts, which could adversely affect our business, results of operations and financial condition.
Our controlling shareholder may exert influence over us and may have a different strategic view for our development than that of our minority shareholders.
Enel beneficiallyChile owns 60.6%93.6% of our share capital.shares and Enel’s economic interest in us is 57.9%. Through its control of Enel our ultimate controlling shareholder,Chile, Enel has the power to determine the outcome of substantially all material matters that require shareholdershareholders’ votes, in accordance with Chilean corporate law, such as the election of the majority of our board members and, subject to contractual and legal restrictions, the adoption of our dividend policy. Enel also exercises significant influence over our business strategy and operations. Its interests, may in some cases, may differ from those of our minority shareholders. For example, Enel conducts its business operations in the field of renewable energy in Chile through Enel Green Power S.p.A. in which we have no equity interest. Certain conflicts of interest affecting Enel in these matters may be resolved in a manner that is different from interests of our company or of our minority shareholders.
18
After giving effect to the 2018 Reorganization, the ownership interest of our minority shareholders was considerably reduced, from 40% to 6.4% and their ability to influence the outcome of any matter that is or can be subject to shareholder approval, including the appointment of directors, acquisitions or disposition of substantial assets, the issuance of capital stock and other securities and the payment of dividends on our securities, will be very limited. However, as long as there are minority shareholders, potential conflicts of interests may continue to arise. The increase in the controlling interest may not necessarily eliminate the potential conflicts of interests between us and the business formerly held by EGPL that are now owned by Enel Chile, through EGP Chile.
Our electricity business is subject to risks arising from natural disasters, catastrophic accidents and acts of terrorism whichthat could adversely affect our operations, earnings and cash flow.
Our primary facilities include power plants assets.plants. Our facilities may be damaged by earthquakes, flooding, fires and other catastrophic disasters arising from natural or accidental human causes, as well as acts of protest, vandalism, riot, and terrorism. A catastrophic event could cause prolonged unavailability of our assets, disruptions in our business, significant decreases in revenues due to lower demand or significant additional costs to us not covered by our business interruption insurance. There may be lags between a major accident or catastrophic event and the final reimbursement from our insurance policies, which typically carry a deductible and are subject to per event policy maximum amounts.
We are subject to financing risks, such as those associated with funding our new projects and capital expenditures, and risks related to refinancing our maturing debt; we are also subject to debt covenant compliance, all of which could adversely affect our liquidity.
As of December 31, 2016,2018, our consolidated interest-bearing debt totaled Ch$ 820841 billion.
Our consolidated interest-bearing debt had the following maturity profile:
Ch$ 18 billion in 2017;
Ch$ 16 billion from 2018 to 2019;
Ch$ 15 billion from 2020 to 2021; and
Ch$ 771 billion thereafter.
Some of our debt agreements are subject to (1) financial covenants, (2) affirmative and negative covenants, (3) events of default and (4) mandatory prepayments for contractual breaches, among other provisions. A significant portion of our financial indebtedness is subject to cross default provisions, which have varying definitions, criteria, materiality thresholds and applicability with respect to subsidiaries that could give rise to such a cross default.
In the event that we breach any of these material contractual provisions, our creditors and bondholdersdebtholders may demand immediate repayment, and a significant portion of our indebtedness could become due and payable. We may be unable to refinance our indebtedness or obtain such refinancing on terms acceptable to us. In the absence of such refinancing, we could be forced to dispose of assets in order to make the payments due on our indebtedness under circumstances that might not be favorable to obtaining the best price for such assets. Furthermore, we may be unable to sell our assets quickly enough, or at sufficiently high prices, to enable us to make such payments.
We may also be unable to raise the necessary funds required to finish our projects under development or under construction. Market conditions prevailing at the moment we require these funds or other unforeseen project costs can compromise our ability to finance these projects and expenditures.
Our inability to finance new projects or capital expenditures or to refinance our existing debt could adversely affect our results of operation and financial condition.
We rely on electricity transmission facilities that we do not own or control. If these facilities do not provide us with an adequate transmission service, we may not be able to deliver the power we sell to our final customers.
We depend on transmission facilities owned and operated by other unaffiliated power companies to deliver the electricity we sell. This dependence exposes us to several risks. If transmission is disrupted, or transmission capacity is inadequate, we may be unable to sell and deliver our electricity. If a region’s power transmission infrastructure is inadequate, our recovery of sales costs and profits may be insufficient. If restrictive transmission price regulation is imposed, transmission companies upon whom we rely may not have sufficient incentives to invest in expansion of their transmission infrastructure, which could adversely affect our operations and financial results. Currently, theThe construction of new transmission lines is takingmay take longer than in the past, mainly because of new social and environmental requirements that are creating uncertainty aboutas to the probabilitytiming of completingproject completion.
There have been blackout events in the projects.
In addition, the increase of new NCRE projects is congesting the current transmission system as these projects can be built relatively quickly, while new transmission projects may take longer to be built. In May 2014, the Chilean government’s Energy Agenda established a long-term energy policy. In 2016, a new transmission law called for the interconnection between the Chilean Central Interconnected System (“SIC” in its Spanish acronym) and the Northern Interconnected System (“SING” in its Spanish acronym) by 2019.
19
On September 24, 2011, nearly 10 million people located in central Chile experienced a blackout (affecting more than half of the Chilean population),past due to the failure of Transelec’s 220 kV Ancoa substation. The failure led to the disruption of two 500 kV transmission lines, in the SIC and the subsequent failure of the remote recovery computer software used by the independent entity that coordinates generators, transmission companies and large customers (“CDEC” in its Spanish acronym) to operate the grid. This blackout, which lasted two hours, exposed weaknesses in the transmission grid and its need for expansion and technological improvements to increase the reliability of the transmission grid.its reliability. Additional failures of lesser magnitude have occurredtransmission lines may occur in the recent past.future.
Any such disruption or failure of transmission facilities could interrupt our business, which could adversely affect our results of operations and financial condition.
Our business may experience adverse consequences if we are unable to reach satisfactory collective bargaining agreements with our unionized employees or if we are unable to retain key employees.
A large percentage of our employees areis members of unions and havehas collective bargaining agreements that must be renewed on a regular basis. Our business, financial condition and results of operations could be adversely affected by a failure to reach agreement with any labor union representing such employees or by an agreement with a labor union that contains terms we view as unfavorable. Chilean law provides legal mechanisms for judicial authorities to impose a collective bargaining agreement if the parties are unable to come to an agreement, which may materially increase our costs beyond what we have budgeted.
In addition, we employ many highly-specializedhighly specialized employees, and certain actions such as strikes, walk-outswalkouts or work stoppages by these employees, could adversely impactaffect our business, results of operations and financial condition as well as our reputation.
The price and liquidity of our common stock and ADSs may be adversely affected by the small minority interest remaining after completion of the 2018 Reorganization, the limited market for our ADSs since they were delisted from the NYSE and now trade in the over-the-counter market in the U.S. and the relative illiquidity and volatility of the Chilean securities markets and its dependence on economic conditions in Latin America and other partsmarkets.
Following completion of the world could adversely affect the price2018 Reorganization, only 6.4% of our common stock is held by minority shareholders. As of the end of 2018, ADSs comprised only approximately 0.64% of the total outstanding shares of our common stock. Accordingly, our common stock and ADS.ADSs are not widely held and the volume of trading has been relatively low and sporadic. As a result, the market for our shares of common stock and ADSs has become more limited and our common stock and ADSs are subject to increased price volatility and reduced liquidity. In addition, the lack of market liquidity could also increase the difficulty of selling our securities in large blocks without adversely affecting their price. There can be no assurance that an active trading market for our common stock or ADSs can be sustained in Chile or the U.S.
At the end of 2018, we voluntarily delisted our ADSs from trading on the NYSE and our ADSs are now quoted in the over-the-counter market on the OTC Pink, an inter-dealer electronic quotation and trading system for equity securities operated by OTC Markets, Inc. Quotation of our ADSs on the OTC Pink may limit the liquidity and price of our ADSs more than if our ADSs were listed and traded on the NYSE or another national securities exchange. Trading in securities quoted in the over-the-counter markets is often thin, volatile, and characterized by wide fluctuations in trading prices due to many factors that may have little to do with our operations or business prospects. In addition, the over-the-counter markets are not a stock exchange and trading of securities in the over-the-counter markets is often more sporadic than trading of securities listed on the NYSE or other national securities exchanges. Some investors may perceive our ADSs to be less attractive because they are traded in the over-the-counter market. In addition, as an OTC Pink company, we may not have the analyst coverage that accompanies companies listed on national securities exchanges. Furthermore, institutional and other investors may have investment guidelines that restrict or prohibit investing in securities quoted on the OTC Pink. These factors may have an adverse impact on the trading, liquidity and price of our ADSs and holders of ADSs may have difficulty selling their ADSs.
Following the 2018 Reorganization, the primary market for our shares of common stock is now the Santiago Stock Exchange. However, we cannot assure you that our shares will continue to meet the criterial for continued listing on the Chilean Stock Exchanges and our common stock may be delisted from one or both of the Chilean Stock Exchanges. Our common stock may also lose the “sufficient stock market liquidity” (presencia bursátil) status on the Chilean Stock Exchanges, which would result in loss of a capital gains tax exemption for certain holders of our shares under Chilean law.
Chilean securities markets are substantially smaller and less liquid than the major securities markets in the United States or other developed countries. The low liquidity of the Chilean market may impair the ability of shareholders to sell shares, or holders of ADSs to sell shares of our common stock withdrawn from the ADS program, into the Chilean market in the amount and at the price and time they wish to do so. Also,In addition, the liquidity and the market for our shares orand ADSs may be affected by a number of factors including variations in exchange and interest rates, the deterioration and volatility of the markets for similar securities and any changes in our liquidity, financial condition, creditworthiness, results and profitability.
In addition, the Chilean securities markets may be affected to varying degrees by economic and market conditions and developments in Latin American countries, other emerging markets and elsewhere in the world. Although economic conditions in such countries may differ significantly from economic conditions in Chile, investors’ reactions to developments in any of these other countries may have an adverse effect on the market value and the liquidity of securities for Chilean issuers. An increase in the perceived risks associated with investing in South American countries and elsewhere in the world could lessendecrease capital flows to Chile andChile. Such a decrease would adversely affect the general Chilean economy in general, and the interestsinterest of investors in our shares or ADSs in particular.
We cannot give assurance that the
The price or the liquidity of our shares orand ADSs will notmay be negatively affected by events in Latin American markets or the global economy in general.
Lawsuits against us brought outside Chile or complaints against us based on foreign legal concepts may be unsuccessful.
All of our investmentsoperations are located outside of the United States. All of our directors and officers reside outside of the United States and mostsubstantially all of their assets are located outside the United States as well.States. If any investor were to bring a lawsuit against our directors, officers or experts in the United States, it may be difficult for them to effect service of legal process within the United States upon these persons, or to enforce against them, in United States or Chilean courts, judgments obtained in United States courts based upon the civil liability provisions of the federal securities laws of the United States.States, against them in United States or Chilean courts. In addition, there is doubt as to whether an action could be brought successfully in Chile on the basis of liability based solely upon the civil liability provisions of the United States federal securities laws.
Interruption or failure of our information technology and communications systems or external attacks to or breaches of these systems could have an adverse effect on our operations and results.
We depend onoperate in an industry that requires the continued operation of sophisticated information technology, communicationcontrol and processingcommunications systems (“IT Systems”) and network infrastructure. In addition, we use our IT Systems and infrastructure to operatecreate, collect, use, disclose, store, dispose of and otherwise process sensitive information, including company data, customer data, and personal information regarding customers, employees and their dependents, contractors, shareholders and other individuals. In our businesses, the failure of which could adversely affect ourgeneration business, results of operations and financial condition.
20
IT Systems are vital to our ability to monitorcritical in controlling and monitoring our power plants’ operations, maintainmaintaining generation and network performance, adequately generategenerating invoices to bill customers, achieveachieving operating efficiencies and meetmeeting our service targets and standards. Temporary or long-lasting operational failuresThe operation of anyour generation system is dependent not only on the physical interconnection of theseour facilities with the electricity network infrastructure, but also on communications among the various parties connected to the network. The reliance on IT Systems to manage the information and communication among and between those parties has increased significantly since the deployment of intelligent grids.
Our generation facilities, IT Systems and other infrastructure, as well as the information processed in our IT Systems could havebe affected by cybersecurity incidents, including those caused by human error. Our industry has begun to see an increase in the volume and sophistication of cyber security incidents from international activist organizations, nation states and individuals, being among the emerging risks identified in our planning process. Cybersecurity incidents could harm our businesses by limiting our generating capabilities, delaying our development and construction of new facilities or capital improvement projects to existing facilities, disrupting our customer operations or exposing us to liability. Our generation system is part of an interconnected system. Therefore, a material adverse effect ondisruption caused by the impact of a cybersecurity incident in the electric transmission grid, network infrastructure, fuel sources or our third party service providers’ operations could also negatively impact our business.
In addition, our business requires the collection and retention of personally identifiable information of our customers, employees and shareholders, who expect that we will adequately protect the privacy of such information. Cybersecurity breaches may expose us to a risk of loss or misuse of confidential and proprietary information. A significant theft, loss, or fraudulent use of personally identifiable information may lead to potentially large costs associated with notifying and protecting affected persons. This could cause us to become subject to significant litigation, costs, liability, fines, or penalties, any of which could materially and adversely affect our results of operations. Additionally, cyber-attacksoperations, as well as our reputation with customers, shareholders and regulators, among others. In addition, we may be required to incur significant costs associated with governmental actions in response to such intrusions or to strengthen our information and electronic control systems. The cybersecurity threat is dynamic and evolves continually and, in the electricity industry, is increasing in sophistication, magnitude and frequency. There can have an adverse effectbe no assurance that we can implement adequate preventative measures or accurately assess the likelihood of a cyber-incident. We are unable to quantify the potential impact of cybersecurity incidents on our imagebusiness and our relationship with the community. In the last few years, global cyber-attacks on security systems, treasury operations,reputation. These potential cybersecurity incidents and IT Systems have intensified worldwide. We are exposed to cyber- attacks aimed at damaging our assets through computer networks, cyber spying involving strategic information that may be beneficial for third parties and cyber-theft of proprietary and confidential information, including information of our customers. We are exposed to several types of cyber-attacks, including denial-of-service attacks that may affect the accessibility of our services to our users and attacks that may affect our domain name systems, preventing the use of certain useful web pages.
We have suffered cyber-attackscorresponding regulatory action could result in the past. Further cyber-attacks may occura material decrease in revenues and may affect us adverselyresult in significant additional costs, including penalties, third party claims, repair costs, additional insurance expense, litigation costs, notification and remediation costs, security costs and compliance costs. While we maintain property and casualty insurance, there can be no assurance that liabilities or losses we may incur, including as a result of cybersecurity litigation, will be covered under such policies or that the future.amount of insurance will be adequate.
Item 4.InformationInformation on the Company
A.History and Development of the Company. |
|
We are a publicly held limited liability stock corporation originally organized on December 1, 1943 under the laws of the Republic of Chile. Since 1943, we have been registered in Santiago with the SVSCMF under Registration No. 0114. We have also been registered with the SEC under the commission file number 001-13240 since 1994. We are legally referred to by ourOur full name is Enel Generación Chile S.A. and we are also known commercially as well as by the abbreviated name “Enel Generación Chile.”
Chile” or “Enel Generación”. Our shares are listed and traded on the Chilean Stock Exchanges and our ADSs arewere listed and traded on the NYSE.NYSE until December 28, 2018. Following the 2018 Reorganization (described below), Enel Chile now owns 93.6% of our shares of common stock and ADSs, which by the end of 2018 comprised only approximately 0.64% of the total outstanding shares of common stock. We determined that the costs associated with continuing the listing of our ADSs on the NYSE exceed the benefits received by us, as our primary market for the shares is now the Santiago Stock Exchange. As a result, we decided to file an application for voluntary delisting from the NYSE as part of our effort to reduce operational expenses.
Our contact information in Chile is:
Contact Person: |
| Nicolás Billikopf |
Street Address: |
| Santa Rosa 76, Santiago, Código Postal 8330099, Chile |
Email: | nicolas.billikopf@enel.com | |
Telephone: |
| (56-2) 2353-4628 |
Web site: |
| www.enelgeneracion.cl |
The information contained on or linked from our internet website is not included as part of, or incorporated by reference into, this Report. The SEC maintains an internet website that contains reports, proxy and information statements, and other information regarding issuers that file electronically with the SEC, such as our company, at http://www.sec.gov.
We are an electricityelectric utility company engaged, directly and through our subsidiaries and affiliates, in the generation businesses in Chile. As of December 31, 2016,2018, we had 6,3516,274 MW of installed capacity, with 28 generation facilities and a total of 111 generation units. Of our total installed capacity, 54.6%55% consists of hydroelectric power plants and includes, among others, Ralco with 690689 MW, Pehuenche with 570568 MW, El Toro with 450449 MW, Rapel with 377376 MW, and Antuco with 320319 MW. 77% of our thermoelectric installed capacity is gas/fuel oil power plants (2,104 MW), and the remaining is coal-fired steam power plants.plants (636 MW). As of December 31, 2016,2018, we had consolidated assets ofamounting to Ch$ 3,399.73,669 billion and operating revenues of Ch$ 1,659.7 1,521 billion.
The Chilean government owned Enel Generación ChileGeneration from our incorporation in 1943 until 1987, when the Chilean government commenced a privatization process through a series of public offerings.offerings commenced. The privatization process was completed in 1989.
During
The 2018 Reorganization
On August 25, 2017, Enel Chile proposed a corporate reorganization (the “2018 Reorganization”) to consolidate Enel’s conventional and non-conventional renewable energy businesses in Chile under one company, Enel Chile, which will become Enel’s only vehicle to invest in Chile. The 2018 Reorganization involved the 1990’s, we began an international expansion programfollowing transactions:
· a cash tender offer by Enel Chile of all outstanding shares of our common stock, including ADS. The tender offer was subject to the condition that the tendering holders of Enel Generation shares and ADSs use Ch$236 of the Ch$590 tender offer consideration for each Enel Generation share and Ch$7,080 of the Ch$17,700 tender offer consideration for each Enel Generation ADS to subscribe for shares of our common stock at a subscription price of Ch$82 per Enel Chile share (or Ch$2,460 per Enel Chile ADS) (the “Enel Chile U.S. Share/ADS Subscription Condition”);
· a capital increase to make available a sufficient number of shares of common stock of Enel Chile to deliver to tendering holders of Enel Generation shares and ADSs to satisfy all conditions precedent; and
· a merger pursuant to which Enel Green Power Latin América S.A. (“EGPL”) merged into Enel Chile. EGPL was a closely held stock corporation organized under the laws of the Republic of Chile. Before the 2018 Reorganization, EGPL was a member of the Enel Green Power group of companies. Enel Green Power is a transnational company dedicated to electricity generation with renewable resources, which in turn is controlled by Enel. EGPL was a renewable energy generation holding company engaged, through its wholly owned subsidiary Enel Green Power Chile Ltda. (“EGP Chile”), in the electricity generation business in Chile.
The different steps of the 2018 Reorganization were approved by the respective shareholders of Enel Chile, Enel Generation and EGPL at their extraordinary shareholders’ meetings held on December 20, 2017. The tender offer occurred between February 16, 2018, and March 22, 2018, the preemptive rights offering in connection with the acquisitioncapital increase took place between February 15, 2018, and March 16, 2018, and the 2018 Reorganization, in the aggregate, was completed and effective on April 2, 2018.
As a result of several companies in Argentina (Costanera in 1992the consummation of the 2018 Reorganization, Enel Chile remains as our major shareholder. Currently, Enel Chile consolidates the Chilean electricity generation business through us, the Chilean electricity distribution business through Enel Distribution and El Chocón in 1993), Peru (Edegel, currently knownthe Chilean non-conventional renewable electricity generation business through EGP Chile. Enel remains as the majority shareholder of Enel Generación Perú, in 1995), Colombia (Emgesa in 1996)Chile, owning 61.9% (excluding treasury stock) of the company, and, Brazil (Cachoeira Dourada in 1997through its majority ownership of Enel Chile, also remains as our majority owner and Cien in 1998), among other companies.
Since June 2009, our ultimate parent company has been the Italian company Enel, which currently holds a beneficial ownership of 60.6% of our shares. Enel is an energy company with multinational operations in the power and gas markets, with a focus on Europe and Latin America. Enel operates in over 30 countries across four continents, produces energy through a net installed capacity of 84 GW and distributes electricity and gas through a network covering 1.9 million kilometers. With over 61 million customers worldwide, Enel has the largest customer base among European competitors and figures among Europe’s leading power companies in terms of installed capacity and reported EBITDA. Enel publicly trades on the Milan Stock Exchange.company.
During the 2000’s we have focused on increasing our installed capacity in Chile to satisfy the growing electricity demand by constructing power plants. For example, in October 2012, the Bocamina II thermal power plant, in the Bio Bío Region, started commercial operations with an installed capacity of 350 MW. The power plant benefits from harbor services as well as some ancillary facilities of the first unit built, Bocamina I, which started operations in the 1970’s.
During the last few years, we haveour business strategy has focused on our core-business, the generation of electricity, by increasing our shareholdings in subsidiaries, related to electricity generation, selling certain non-strategic assets and reducing the number of companies by simplifying our corporate structure, mainly through mergers, which should leadmergers.
We have conducted the following sales of non-core assets over the past few years:
· On September 14, 2016, we sold our 20% equity interest in GNL Quintero S.A. (“GNL Quintero”), to operational efficiencies.
21
|
On January 9, 2015, we and our subsidiary Central Eléctrica de Tarapacá S.A. (“Celta”) sold 100% of the shares that were jointly held in Sociedad Concesionaria Túnel El Melón S.A. (“Túnel El Melón) to Independencia S.A., a Chilean private fund. Túnel El Melón is a 2.5 kilometer two-lane highway tunnel, located between the provinces of Petorca and Quillota in the Valparaíso Region, Chile.
In May 2007, as part of a consortium we formed along with ENAP, Metrogas and British Gas in which we participated with a 20% stake in GNL Quintero S.A (“GNL Quintero”), we constructedto build the LNG regasification facility in the Quintero Bay. Partial commercial operations of the facility began in September 2009 and full commercial operations began on January 1, 2011.On September 14, 2016, we sold our 20% equity interest in GNL Quintero to Enagás Chile S.p.A. The sale amounted to US$ 197 million (Ch$ 133 billion at that time), including the discounts pursuant to the terms and conditions of the sales contract.
In November 2016,· we finalized a corporate simplification process with the merger of Celta, GasAtacama Chile, GasAtacama Holding, Gasoducto Taltal, GNL Norte and Progas into GasAtacama Chile, the surviving company. Celta was our investment vehicle through which we had an interest in the GasAtacama companies, Central Eólica Canela S.A., our wind farm company, and Transquillota Ltda., our associate and a 220 kV transmission line. This transaction was part of a simplification process that started in 2013, when San Isidro merged into Endesa Eco and Endesa Eco merged into Celta, the surviving company.
On December 16, 2016,, we sold our 42.5% equity interest in Electrogas S.A. (“Electrogas”). Electrogas is a company dedicated to the transportation of natural gas and other fuels, which serves our San Isidro and Quintero power plants, among others. We received the proceeds of this sale, amounting to US$ 180 million (Ch$ 115 billion at that time) on February 7, 2017.
In order to simplify our corporate structure, we have continued to reduce the number of our companies over the last three years:
· During 2016, Inversiones GasAtacama Holding Ltda. merged into Celta, which in turn merged into GasAtacama, the surviving company, on November 1, 2016. Celta was our investment vehicle through which we owned the San Isidro thermal plants, the Pangue hydroelectric plant and the Tarapacá thermal generation facility in addition to our interest in Central Éolica Canela S.A, that owned the Canela wind farms.
· On November 9, 2017, GasAtacama purchased the 25% minority interest of Central Éolica Canela S.A., which was later dissolved on December 22, 2017. Our economic interest in GasAtacama was 97.4% as of December 31, 2018.
The 2016 Reorganization
During 2016, our shareholders carried outwe completed a corporate reorganization process to separate theour Chilean businesses from theour non-Chilean businesses (the “2016 Reorganization”).
The first phase of the 2016 Reorganization involved the separation of the respective Chilean and non-Chilean electricity generation, transmission and distribution businesses of Endesa Chile, Chilectra S.A. (“Chilectra”) and Enersis S.A. (“Enersis”) by
means of a “demerger” under Chilean law and the subsequent distribution of the shares of the newly created entities to each company’s respective shareholders (collectively, the “Spin-Offs”). Following the approvals of the Spin-Offs by the shareholders of Enersis, Endesa Chile and Chilectra at their extraordinary shareholders’ meetings held on December 18, 2015, theThe “demerger” or separation of the businesses occurred on March 1, 2016, and the Spin-Offs were completedeffective in April 2016, with the creation and public listing of the shares of the newly incorporated entities: (i) Enersis Chile S.A. (“, which held the Chilean businesses of Enersis, Chile”),(ii) Endesa Américas S.A. (“Endesa Américas”) and Chilectra Américas S.A. (“Chilectra Américas”). As a result of the Spin-Offs: (i) Endesa Chile spun-off Endesa Américas,, which held the non-Chilean businesses of Endesa Chile, (ii) Chilectra spun-offand (iii) Chilectra Américas S.A., which held the non-Chilean businesses of Chilectra and (iii) Enersis spun-off Enersis Chile, which holds the Chilean businesses of Enersis.
Chilectra. The second phase of the 2016 Reorganization also involved the merger between the companies holding the non‑Chileannon-Chilean assets. On September 28, 2016, the respective shareholders of Enersis Américas S.A., Endesa Américas and Chilectra Américas approved the merger of Endesa Américas and Chilectra Américas with and into Enersis Américas S.A., with Enersis Américas S.A. continuing as the surviving company. The merger combined the non-Chilean generation, transmission and distribution businesses under a single holding company, with the aim of contributing to the simplification of the corporate structure of the group and providing benefits such as subsidiary cash leakage reduction, strategic interest alignment and increased decision-making and operational efficiencies. The merger became effective on December 1, 2016.2016, and merged Endesa Américas S.A. and Chilectra Américas S.A. with and into Enersis Américas S.A. (currently Enel Américas S.A.), with the latter continuing as the surviving company.
As part of this process, Enersiswe changed its name to Enersis Américas S.A. on March 1, 2016 and subsequently to Enel Américas S.A. on December 1, 2016, and on October 18, 2016 (i) Endesa Chile changed itsour name to Enel Generación Chile S.A.; (ii) on October 18, 2016. That same date, (i) Chilectra changed its name to Enel Distribución Chile S.A.; and (iii)(ii) Enersis Chile S.A. changed its name to Enel Chile S.A.
Capital Investments, Capital Expenditures and Divestitures
We coordinate our overall financing strategy, including the terms and conditions of loans and intercompany advances entered into by our subsidiaries in order to optimize debt and liquidity management. Generally, our operating subsidiaries independently plan capital expenditures financed by internally generated funds or direct financings. Although we have considered how these investments
22
will be financed as part of our budget process, we have not committed to any particular financing structure, and investments will depend on the prevailing market conditions at the time the cash flows are needed.
Our investment plan is flexible enough to adapt to changing circumstances by giving different priorities to each project in accordance with profitability and strategic fit. Investment priorities are currently focused on developing additional hydroelectric and thermal capacity to guarantee adequate levels of reliable supply while remaining focused on the environment.
For the 2017-20192019-2021 period, we expect to make capital expenditures of Ch$ 452367 billion, related to investments currently in progress, maintenance of existing generation plants and in the studies required to develop other potential generation projects. For further detail regarding these projects, please see “Item 4. Information on the Company — D. Property, PlantsPlant and Equipment—Equipment — Projects Under Development.”
The table below sets forth the expected capital expenditures for the 2017-20192019-2021 period and the capital expenditures incurred in 2016, 20152018, 2017 and 2014:2016:
|
| Estimated 2017-2019 |
|
| 2016 |
|
| 2015 |
|
| 2014 |
| ||||
|
| (in millions of Ch$) |
| |||||||||||||
Capital Expenditure(1) |
|
| 452,442 |
|
|
| 194,880 |
|
|
| 537,805 |
|
|
| 421,314 |
|
|
| Estimated |
| 2018 |
| 2017 |
| 2016 |
|
|
| (in millions of Ch$) |
| ||||||
Capital Expenditure(1) |
| 367,252 |
| 222,327 |
| 206,776 |
| 194,880 |
|
|
|
In the past, we reported a five‑(1) Capex amounts represent effective payments for each year, estimate ofexcept for future capital expenses. However, whileprojections.
While our planned investments go beyond the three years highlighted in this table, we are now reporting three years to be aligned with Enel’s three-year industrial plan that was disclosed in November 2016.2018. For further information, please refer to “Item 4. Information on the Company — D. Property, PlantsPlant and Equipment. — Project Investments” and “Item 5. Operating and Financial Review and Prospects — F. Tabular Disclosure of Contractual Obligations.”Obligations”.
Capital Expenditures forin 2018, 2017 and 2016 2015 and 2014
Our capital expenditures in the last three years were principally related to the optimization of the 350 MW Bocamina II power plant, improvements to the Tarapacá coal-fired power plant, the construction of the 150 MW Los Cóndores power plant and maintenance of our current power plants. TheInvestments related to the Bocamina II and Tarapacá power plant suspended operations in December 2013 dueplants focused on making improvements to reduce environmental impact. These improvements were the consequence of environmental injunctions in the case of Bocamina II and resumed operationsnew environmental regulations in July 2015. On April 2, 2016, the Environmental Qualifications Resolutions for “optimization” (environmental improvements)case of Tarapacá. The improvements to Bocamina II were approved. We expect to complete the improvementscompleted in 2018.
Investments currently2018, while those of Tarapacá in progress2017.
Our material plans in progress include:include Los Cóndores project, which began construction in 2014 with completion expected during 2020. For further detail of the Los Cóndores project, please see “Item 4. Information on the Company — D. Property, Plant and Equipment. — Projects Under Construction.”
|
|
|
|
|
A portion of our capital expenditures is reserved for maintenance, and for the assurance of quality and operational standards of our facilities. Projects in progress will be financed with resources provided by external financing as well as internally generated funds.
B.Business Overview. |
|
We are a publicly held limited liability stock corporation with operationsthat operates in Chile. Our core business is electricity generation. We also participate in other activities whichbut that are not part of our core business. Since these non-core activitiesbusinesses and represent less than 1% of our 2016 revenues, we2018 revenues. We do not report them as separate business segment in this Report ornor in our consolidated financial statements.
23
The table below presents our revenues:
|
| Year ended December 31, |
|
| Change |
|
| Year ended December 31, |
| Change |
| ||||||||||||||
Revenues |
| 2016 |
|
| 2015 |
|
| 2014 |
|
| 2016 vs. 2015 |
|
| 2018 |
| 2017 |
| 2016 |
| 2018 vs. 2017 |
| ||||
|
| (in millions of Ch$) |
|
| (in %) |
|
| (in millions of Ch$) |
| (in %) |
| ||||||||||||||
Generation |
|
| 1,659,727 |
|
|
| 1,543,810 |
|
|
| 1,220,555 |
|
|
| 7.51 |
|
| 1,521,054 |
| 1,634,937 |
| 1,659,727 |
| (7.0 | )% |
Other businesses and intercompany transaction adjustments |
|
| — |
|
|
| — |
|
|
| 10,420 |
|
| n.a. |
|
| — |
| — |
| — |
| n.a. |
| |
Total revenues |
|
| 1,659,727 |
|
|
| 1,543,810 |
|
|
| 1,230,975 |
|
|
| 7.51 |
|
| 1,521,054 |
| 1,634,937 |
| 1,659,727 |
| (7.0 | )% |
For further financial information related to our revenues, see “Item 5. Operating and Financial Review and Prospects — A. Operating Results” and Note 3839 of the Notes to our consolidated financial statements.
We own and operate 111are a generation unitscompany in Chile with an aggregatethe SEN, representing 32.8% of the electricity market share in 2018.
As of December 31, 2018, we accounted for 26.5% of SEN’s total generation capacity, measured by the installed capacity, of 6,351 MW as of both December 31, 2016according to figures published by the National Electricity Coordinator (“CEN” in its Spanish acronym). Hydroelectric, thermal and December 31, 2015.
Our consolidated electricity sales in 2016 were 23,689 GWhwind power represent 55%, 44% and our production was 17,564 GWh, a 0.6% increase and a 4.0% decrease, respectively, compared to 2015. Our hydroelectric installed capacity represents 54.6%1% of our total installed capacity in Chile, our thermoelectric capacity represents 44.2% and our wind power capacity represents 1.2%. respectively.
For additional detail on our historical capacity, see “Item 4. Information on the Company — D. Property, PlantsPlant and Equipment.”
The following tables summarize the information relating to our capacity, electricity generation and energy sales:
ELECTRICITY DATA
|
| Year ended December 31, |
| ||||
|
| 2018 |
| 2017 |
| 2016 |
|
Number of generating units(1) |
| 111 |
| 111 |
| 111 |
|
Installed capacity (MW)(2)(3) |
| 6,274 |
| 6,351 |
| 6,351 |
|
Electricity generation (GWh) |
| 17,373 |
| 17,073 |
| 17,564 |
|
Energy sales (GWh) |
| 23,343 |
| 23,356 |
| 23,689 |
|
|
| Year ended December 31, |
| |||||||||
|
| 2016 |
|
| 2015 |
|
| 2014 |
| |||
Number of generating units(1) |
| 111 |
|
|
| 111 |
|
|
| 111 |
| |
Installed capacity (MW)(2) |
|
| 6,351 |
|
|
| 6,351 |
|
|
| 6,351 |
|
Electricity generation (GWh) |
|
| 17,564 |
|
|
| 18,294 |
|
|
| 18,063 |
|
Energy sales (GWh) |
|
| 23,689 |
|
|
| 23,558 |
|
|
| 21,157 |
|
|
|
|
|
(1) For details on generation facilities, see “Item 4. Information on the Company — D. Property, Plant and Equipment.”
(2) Total installed capacity is defined as the maximum capacity (MW), under specific technical conditions and characteristics. In most cases, installed capacity is confirmed by satisfaction guarantee tests performed by equipment suppliers. Figures may differ from installed capacity declared to governmental authorities and customers, according to criteria defined by such authorities and relevant contracts.
(3) The 2018-installed capacity differs from previous years since the CEN reviewed the capacity of each generation unit and adjusted their capacity.
Our consolidated electricity generation in 2018 were 17,373 GWh and our energy sales was 23,343 GWh, which represents a 1.8% increase and a 0.1% decrease, respectively, when compared to 2017, respectively.
Dividing the electricity industry, it is common to divide thegeneration business into hydroelectric, thermoelectric and other generation is customary in the electricity industry, because each generation type of generation has significantly different variable costs. Thermoelectric generation, for instance, requires the
purchase of fuel, which generally leads to higher variable costs than the hydroelectric generation from reservoirs or rivers that normally has minimal variable costs. Of our total consolidated generation in 2016, 51.7%2018, 63% was from hydroelectric sources, 47.7%36% was from thermal sources, and less than 1% was from wind energy, which is generated by the Canela I and Canela II wind farms, which are subsidiaries of GasAtacama Chile (the continuing company of Celta after their merger on November 1, 2016).GasAtacama.
The following table summarizes our consolidated generation by type of energy:
GENERATION BY TYPE OF ENERGY (GWh)
|
| Year ended December 31, |
| |||||||||||||||||||||
|
| 2016 |
|
| 2015 |
|
| 2014 |
| |||||||||||||||
|
| Generation |
|
| % |
|
| Generation |
|
| % |
|
| Generation |
|
| % |
| ||||||
Hydroelectric |
|
| 9,078 |
|
|
| 51.7 |
|
|
| 11,842 |
|
|
| 64.7 |
|
|
| 11,561 |
|
|
| 64.0 |
|
Thermal |
|
| 8,379 |
|
|
| 47.7 |
|
|
| 6,314 |
|
|
| 34.5 |
|
|
| 6,344 |
|
|
| 35.1 |
|
Other generation(1) |
|
| 107 |
|
|
| 0.6 |
|
|
| 138 |
|
|
| 0.8 |
|
|
| 158 |
|
|
| 0.9 |
|
Total generation |
|
| 17,564 |
|
|
| 100 |
|
|
| 18,294 |
|
|
| 100 |
|
|
| 18,063 |
|
|
| 100 |
|
|
| Year ended December 31, |
| ||||||||||
|
| 2018 |
| 2017 |
| 2016 |
| ||||||
|
| Generation |
| % |
| Generation |
| % |
| Generation |
| % |
|
Hydroelectric generation |
| 10,681 |
| 63.2 |
| 9,392 |
| 55.0 |
| 8,815 |
| 50.2 |
|
Thermal generation |
| 6,268 |
| 36.1 |
| 7,292 |
| 42.7 |
| 8,379 |
| 47.7 |
|
Wind generation — NCRE (1) |
| 131 |
| 0.8 |
| 129 |
| 0.8 |
| 107 |
| 0.6 |
|
Mini-hydro generation — NCRE (2) |
| 293 |
| 1.7 |
| 260 |
| 1.5 |
| 263 |
| 1.5 |
|
Total generation |
| 17,373 |
| 100 |
| 17,073 |
| 100 |
| 17,564 |
| 100 |
|
|
|
The potential for contracting electricity is generally related to electricity demand. Customers identified as small volume regulated customers, including residential customers, are subject to government regulated electricity tariffs(1) Electricity generated by the Canela I and must purchaseCanela II wind farms.
24
electricity directly from a distribution company. These distribution companies, which purchase large amounts of electricity for small volume residential customers, generally enter into contractual agreements with generators at a regulated tariff price. Those identified as large volume industrial customers also enter into contractual agreements with energy suppliers. However, such large volume industrial customers are not subject to(2) Electricity generated by the regulated tariff price. Instead, these customers are allowed to negotiatePalmucho and the energy price with generators based on the characteristics of the service required. Finally, the pool market, where energy is normally sold at the spot price, is not carried out through contracted pricing.Ojos de Agua mini-hydroelectric plants.
The following table contains information regarding our consolidated sales of electricity by type of customer for each of the periods indicated:
ELECTRICITY SALES BY CUSTOMER TYPE (GWh)
|
| Year ended December 31, |
|
| Year ended December 31, |
| |||||||||||||||||||||||||||||||
|
| 2016 |
|
| 2015 |
|
| 2014 |
|
| 2018 |
| 2017 |
| 2016 |
| |||||||||||||||||||||
|
| Sales |
|
| % of Sales Volume |
|
| Sales |
|
| % of Sales Volume |
|
| Sales |
|
| % of Sales Volume |
|
| Sales |
| % of Sales |
| Sales |
| % of Sales |
| Sales |
| % of Sales |
| ||||||
Regulated customers |
|
| 18,516 |
|
|
| 78.2 |
|
|
| 17,622 |
|
|
| 74.8 |
|
|
| 15,838 |
|
|
| 74.9 |
|
| 15,254 |
| 65.3 |
| 17,029 |
| 72.9 |
| 18,516 |
| 78.2 |
|
Unregulated customers |
|
| 4,321 |
|
|
| 18.2 |
|
|
| 4,319 |
|
|
| 18.3 |
|
|
| 4,065 |
|
|
| 19.2 |
|
| 7,338 |
| 31.4 |
| 5,586 |
| 23.9 |
| 4,321 |
| 18.2 |
|
Total contracted sales(1) |
|
| 22,838 |
|
|
| 96.4 |
|
|
| 21,940 |
|
|
| 93.1 |
|
|
| 19,903 |
|
|
| 94.1 |
| |||||||||||||
Total contracted sales(1) |
| 22,592 |
| 96.8 |
| 22,615 |
| 96.8 |
| 22,838 |
| 96.4 |
| ||||||||||||||||||||||||
Electricity pool market sales |
|
| 852 |
|
|
| 3.6 |
|
|
| 1,618 |
|
|
| 6.9 |
|
|
| 1,254 |
|
|
| 5.9 |
|
| 752 |
| 3.2 |
| 742 |
| 3.2 |
| 852 |
| 3.6 |
|
Total electricity sales |
|
| 23,689 |
|
|
| 100 |
|
|
| 23,558 |
|
|
| 100 |
|
|
| 21,157 |
|
|
| 100 |
|
| 23,343 |
| 100 |
| 23,356 |
| 100 |
| 23,689 |
| 100 |
|
|
|
Specific energy consumption limits (measured(1) Includes sales to distribution companies not backed by contracts.
Dividing sales by customer type in GWh) forterms of regulated and unregulated customer is useful in managing and understanding the business. We sell electricity to regulated customers through distribution companies and to unregulated customers directly. The sales to distribution companies to supply the distributors’ regulated customers, that is, either residential, commercial or others, are classified as regulated sales and are subject to government regulated electricity tariffs. The sales of generation companies to distribution companies to supply the distributors’ unregulated customers are established. Moreover,also classified as unregulated sales and are also governed by contracts at a freely negotiated prices and terms. We directly sell to large commercial and industrial customers and other generators are classified as unregulated sales and are generally governed by contracts with freely negotiated prices and terms. Finally, pool market sales are the sales that take place when generation companies are dispatched by the CEN in excess of their contractual obligations and therefore must sell their surplus electricity in the pool market, or when the generators electricity dispatched is less than their contractual commitments with their customers and therefore must purchase the deficit in the pool market. These purchase and sale transactions among electricity companies are normally carried out in the pool market at the spot price, and do not require a contractual agreement.
The regulatory frameworksframework often requirerequires that regulatedelectricity distribution companies have contracts to support their commitments to small volume customers andcustomers. Chilean regulations also determine which customers can purchase energy directly in the electricity pool markets.market.
We attempt to minimize the risk of electricity generation deficits resulting from poor hydrological conditions in any given year by limiting our contractual sales requirements to a quantity that does not exceed our estimated electricity production in a dry year. We
consider the available statistical information concerning rainfall, mountain snow and ice, when they are expected to melt, hydrological levels and the capacity of key reservoirs to determine our estimated production for a dry year. In addition to limiting contracted sales, we may adopt other strategies including installing temporary thermal capacity, negotiating lower consumption levels with unregulated customers, negotiating with other water users and including pass-through cost clauses in contracts with customers to cover the cost of spot market purchases.
In 2022, distribution company contracts awarded in the August 2016 auction will come into effect and therefore the tariffs of our regulated contracts will decrease by 6% as a consequence of the lower prices offered by NCRE providers in the energy auction for distribution companies. In 2024, contracts awarded in the November 2017 auction will come into effect with an average price of US$ 32.5 per MWh, which is 31.7% lower than the average price of the previous tender process. We routinely participate in energy bids and we have been awarded long-term energy sale contracts that incorporate the expected variable costs considering changes to the most relevant variables. These contracts secure the sale of our current and expected new capacity and allow us to stabilize our income.
In November 2017, the outcome of the latest bidding process was announced. This process tendered 2,200 GWh per year to be delivered between 2024 and 2043. The total amount of energy tendered was based on renewable energy offers, thus representing a milestone in the industry. We were awarded 54% of the tender, corresponding to 1.2 TWh at an average price of US$ 34.7 per MWh with a mix of wind, solar and geothermal generation. These prices are 6.8% higher than the average price.
In terms of expenses, the primary variable costs involved in the electricity generation business, in addition to the direct variable cost of generating hydroelectric or thermal electricity such as fuel costs, are energy purchases and transportation costs. During periods of relatively low rainfall conditions,hydrology, the amount of our thermal generation increases. This involves an increase in the amount of the total fuel costfuels required and the costs of its transportation to the thermal generation power plants. Under droughtdry conditions, electricity that we have contractually agreed to provide may exceed the amount of electricity that we are able to generate, which requires usgenerate. Therefore, to satisfy our contractual commitments, we may be required to purchase electricity in the pool market at spot prices in order to satisfy our contractual commitments.market prices. The cost of these purchases at spot prices, may, under certain circumstances, may exceed the price at which we sell electricity under contracts and, therefore, may result in a loss. We attempt to minimize the effect of poor hydrological conditions on our operations in any given year by limiting our contractual sales requirements to a quantity that does not exceed theour estimated electricity production in a dry year. To determine an estimated production in a dry year, we take into considerationWe consider the available statistical information concerning rainfall, mountain snow and ice which isand when they are expected to melt, hydrological levels and the capacity of key reservoirs.reservoirs to determine our estimated production for a dry year. In addition to limiting contracted sales, we may adopt other strategies including installing temporary thermal capacity, negotiating lower consumption levels with unregulated customers, negotiating with other water users and including pass-through cost clauses in contracts with customers.
Seasonality
While our core business is subject to weather patterns, generally only extreme events such as prolonged droughts, which may adversely affect our generation capacity, rather than seasonal weather variations, materially affect our operating results and financial condition.
The generation business is affected by seasonal changes throughout the year. During normal hydrological years, snow meltssnowmelts typically occur during the warmer months of October through March. These snow meltssnowmelts increase the level of water in our reservoirs. The months with most precipitation are typically May through August.
When there is more precipitation, hydroelectric generating facilities can accumulate additional water to be used for generation. The increased level of our reservoirs allows us to generate more electricity with hydro power plants during months in which marginal electricity costs are lower.
In general, hydrological conditions such as droughts and insufficient rainfall adversely affect our generation capacity. For example, severe prolonged drought conditions or reduced rainfall levels in Chile caused by El Niño phenomenon reduces the amount of water that can be accumulated in reservoirs, thereby curtailing our hydroelectric generation capacity. In order to mitigate
25
hydrological risk, hydroelectric generation may be substituted with thermal generation (natural gas, LNG, coal or diesel) and energy purchases on the spot market, both of which could result in higher costs, in order to meet our obligations under contracts with both regulated and unregulated customers.
Operations
We own and operate a total of 111 generation units in Chile both directly and through our subsidiaries GasAtacama Chile and Pehuenche. Of these generation units, 38 are hydroelectric, with a total installed capacity of 3,465 MW. This represents 54.6%3,456 MW, representing 55% of our total installed
capacity in Chile. There are 22 thermal generation units that operate with gas, coal or oil with a total installed capacity of 2,8082,740 MW, representing 44.2%44% of our total installed capacity in Chile. There are 51 wind powered generation units with an aggregate installed capacity of 78 MW, representing 1.2%1% of our total installed capacity in Chile. AllOn November 21, 2017, the integration of our generation units are connected to the SIC except for eight of GasAtacama Chile’s thermoelectric generation units which are connected toand the SING into one interconnected system was completed and resulted in northernthe creation of the SEN, a new national interconnected system that extends from Arica in the north of Chile to Chiloé in the south of Chile.
For information on the installed generation capacity for each of our subsidiaries, see “Item 4. Information on the Company —D. — D. Property, PlantsPlant and Equipment.”
Our total gross electricity generation in Chile (including the SIC and the SING) accounted for 23.9%23.2 % of total gross electricity generation in Chile during 2016.2018.
The following table sets forth the electricity generation by each of our generation companies:
ELECTRICITY GENERATION BY COMPANY (GWh)
|
| Year ended December 31, |
| |||||||||
|
| 2016 |
|
| 2015(1) |
|
| 2014(1) |
| |||
Enel Generación Chile |
|
| 11,538 |
|
|
| 10,450 |
|
|
| 10,092 |
|
Pehuenche |
|
| 2,369 |
|
|
| 2,959 |
|
|
| 2,902 |
|
Celta(1) |
|
| — |
|
|
| 3,614 |
|
|
| 4,553 |
|
GasAtacama Chile(1) |
|
| 3,657 |
|
|
| 1,270 |
|
|
| 516 |
|
Total |
|
| 17,564 |
|
|
| 18,294 |
|
|
| 18,063 |
|
|
| Year ended December 31, |
| ||||
|
| 2018 |
| 2017 |
| 2016 |
|
Enel Generation |
| 11,314 |
| 10,976 |
| 11,538 |
|
Pehuenche |
| 2,794 |
| 2,443 |
| 2,369 |
|
GasAtacama |
| 3,265 |
| 3,654 |
| 3,657 |
|
Total |
| 17,373 |
| 17,073 |
| 17,564 |
|
|
|
In 2016, Chilean reservoirs reached 3,049 GWh of energy equivalent, a 1,360 GWh decrease, or 30.8%, compared to 4,409 GWh in 2015. In 2014, the energy equivalent was 3,886 GWh.
The following table sets forth the electricity generation by type:
ELECTRICITY GENERATION BY TYPE (GWh)
|
| Year ended December 31, |
|
| Year ended December 31, |
| |||||||||||||||||||||||||||||||
|
| 2016 |
|
| 2015 |
|
| 2014 |
|
| 2018 |
| 2017 |
| 2016 |
| |||||||||||||||||||||
|
| Generation |
|
| % |
|
| Generation |
|
| % |
|
| Generation |
|
| % |
|
| Generation |
| % |
| Generation |
| % |
| Generation |
| % |
| ||||||
Hydroelectric generation |
|
| 8,815 |
|
|
| 50.2 |
|
|
| 11,557 |
|
|
| 63.2 |
|
|
| 11,272 |
|
|
| 62.4 |
|
| 10,974 |
| 55.0 |
| 9,392 |
| 55.0 |
| 8,815 |
| 50.2 |
|
Thermal generation |
|
| 8,379 |
|
|
| 47.7 |
|
|
| 6,314 |
|
|
| 34.5 |
|
|
| 6,344 |
|
|
| 35.1 |
|
| 6,268 |
| 42.7 |
| 7,292 |
| 42.7 |
| 8,379 |
| 47.7 |
|
Wind generation – NCRE(1) |
|
| 107 |
|
|
| 0.6 |
|
|
| 138 |
|
|
| 0.8 |
|
|
| 158 |
|
|
| 0.9 |
| |||||||||||||
Mini-hydro generation – NCRE(2) |
|
| 263 |
|
|
| 1.5 |
|
|
| 285 |
|
|
| 1.6 |
|
|
| 289 |
|
|
| 1.6 |
| |||||||||||||
Wind generation — NCRE(1) |
| 131 |
| 0.8 |
| 129 |
| 0.8 |
| 107 |
| 0.6 |
| ||||||||||||||||||||||||
Mini-hydro generation — NCRE(2) |
| 293 |
| 1.5 |
| 260 |
| 1.5 |
| 263 |
| 1.5 |
| ||||||||||||||||||||||||
Total generation |
|
| 17,564 |
|
|
| 100 |
|
|
| 18,294 |
|
|
| 100 |
|
|
| 18,063 |
|
|
| 100 |
|
| 17,373 |
| 100 |
| 17,073 |
| 100 |
| 17,564 |
| 100 |
|
|
|
|
|
(1) Electricity generated by the Canela I and Canela II wind farms.
(2) Electricity generated by the Palmucho and the Ojos de Agua mini-hydroelectric plants.
Water Agreements
Water agreements refer to the right of a user to useutilize water from a waterparticular source, such as a river, stream, pond or groundwater. In times of good hydrological conditions, water agreements are generally not complicated or contentious. However, in times of poor hydrological conditions, water agreements protect our abilityright to use water resources for hydroelectric generation.
26
WeThrough our subsidiaries, we have three agreements in force with the purpose of utilizing water for both irrigation and hydroelectric generation more efficiently. Two of them are agreements between usEnel Generation and the Chilean Water Works Authority (“DOH” in its Spanish acronym) and are related to the water consumption during the most intense irrigation period (normally from September to April) from Laja Lake and Maule Lagoon, both located in southern Chile. WeEnel Generation signed the first agreementsagreement with the DOH with respectrelated to Laja Lake and Maule Lagoon on October 24, 1958, and September 9, 1947, respectively. Both basins have been severely impacted by drought conditions
After four years of studies and high consumption over the past several years. As a result, during recent years, the Company and the DOH signed supplementary agreements that apply for special irrigation periods depending on hydrological conditions. These agreements will allowdialogue with different sectors making use of water from the Laja Lake, on November 16, 2017, the Operation and Maule Lagoon reservoirsRecovery of Laja Lake Agreement was signed, which complements the agreement signed with the DOH in 1958. This agreement provides reasonable irrigation security to recoverirrigators in the area, giving priority to extractions for irrigation when the reservoir is at low levels, which are also used by generation. It also contemplates the use of a certain volume of water to maintain the scenic beauty of Salto del Laja, a well-known tourist attraction in the area. It also significantly improves the flexibility in the use of water, eliminating most of the restrictions that existed in the form of water extraction, replacing it by annual volumes that will manage
irrigation and generation according to their accumulated water levels and to preserve water use for future years. The thirdneeds. Another agreement was signed in September 2016October 2018 between our subsidiary Pehuenche and the Canal Melado irrigators inof the Maule basinLagoon Monitoring Board to optimize the use of the water during the drought periods. These agreements allow us to use the water more efficiently and to avoid further litigation with the local community, especially with farmers.
Thermal Generation
Our thermal electricelectricity generation facilities mainly use mostly LNG, coal and to a lesser extent, diesel. This mix allows us to use other fuels if the price of LNG iswere to be relatively too high, if there iswere to be a shortage of supply, or if there is another circumstance that makeswere to make LNG unavailable. In order toTo satisfy our natural gas and transportation requirements, we signed a long-term gas contractssupply contract with suppliers that establishestablishes maximum supply amounts and prices, as well as long-term gas transportation agreements with the pipeline companies. Currently, we use Gasoducto GasAndes S.A. (an unaffiliated entity) and Electrogas S.A. (our associate until February 2017) asare our suppliers.current gas transportation providers. Since March 2008, all of our natural gas units can operate using either natural gas or diesel and since December 2009, San Isidro, San Isidro 2 and Quintero power plants operate using LNG.
Our
The LNG contract for LNG is the largest supply contract and it is based on long-term agreements with thebetween us and Quintero LNG Terminal (“GNLQ terminal”) for regasification services and British Gas for supply. In July 2013, we renegotiated ourOur LNG Sale and Purchase Agreement with British Gas and modified some conditions of the original contract. Our current LNG Sale and Purchase Agreement with British Gas runsis in force through 2030 and is indexed to the Henry Hub/Brent commodity prices. We receive 29.7 TBtu of gas annually, andDuring 2018, the contract provides the flexibilityQuintero LNG Terminal unloaded 44 shipments, with a content equivalent to purchase an additional amount between 23.6 TBtu and 24.6 TBtu. There are contingencies in the contract that would allow cancellations (for a fee), and deviations, under certain conditions. We are not dependent on any one particular source of LNG, as long as the LNG meets the contracted specifications.
Our Terminal Use Agreement, through the GNLQ terminal, is the most relevant for our LNG supply and is sufficient to meet our current needs. This contract runs through 2035, has a fixed pricing structure of 10% return on assets plus a marketing fee and allows us, through GNL Chile, to access additional supply from the spot market, if needed.
These contracts allow us to secure its long-term LNG supply at competitive prices, with significant flexibility and the addition of new capacity sufficient for our current and potential needs.
We also exercised a priority right to purchase additional regasification capacity as part of an expansion of the GNLQ terminal. This allowed us to increase our regasification capacity from 3.2 million cubic meters per day to 5.4 million cubic meters per day since first quarter of 2015. This additional capacity allows our San Isidro and Quintero facilities to provide additional thermal generation, to secure the regasification for future power plants, as well as develop new businesses, such as the lease agreement signed with Gener in 2015, which has allowed us to generate energy utilizing our additional capacity of LNG in Gener’s Nueva Renca combined-cycle power plant.
In September 2016, we completed the sale of our 20% equity interest in GNL Quintero S.A. to Enagás Chile S.p.A., but retained our contracted capacity for LNG supply.
In 2016, Enel Generación Chile, together with ENAP and Metrogas exported 2743,523 million cubic meters of natural gas, fromof which 1,096 million cubic meters corresponded to our generation and commercialization requirements.
Regarding the GNLQ terminal to Argentinasupply of natural gas, a milestone was achieved during the winter through an existing transport infrastructure, which includeslast quarter of 2018. In a new environment of cooperation and promotion of energy integration by governments and private actors in Argentina and Chile, and after eleven years of interrupted gas supply, it was possible to reactivate the LNG satellite stationsimport of natural gas from Argentina. In this context, we signed interruptible supply agreements for natural gas with YPF and Total Austral and the pipeline network used to transport gas fromcorresponding export permits were obtained in Argentina, to Chile fromallowing the late 1990’s until 2006. Enel Generación Chile contributed 57%supply of the gas volume. This export was unprecedented and considered a milestone in natural gas commercialization.
We also contracted capacity in the LNG truck loading facility (“TLF”) in the GNLQ terminal, which has allowed us to sell natural gas to industrial customers since August 2014. During 2014, a 20-yearbegin on December 28, 2018, to be used in the operation of the San Isidro power plant.
The agreement of the Nueva Renca thermal power plant that was signed with GasValpo (a gas distribution company) to distributeentered into by AES Gener and subsequently by Empresa Eléctrica Santiago (currently known as Empresa de Mercado Eléctrico S.A.), allowed natural gas usingto be available to Nueva Renca. With this availability, the TLFelectrical energy produced by Nueva Renca, which was approximately 0.5 TWh, accounted for new customersour electrical energy balance and helped to reduce our spot energy purchases.
From the point of view of gas commercialization, during 2018, we had five LNG shipment sales transactions, including the sale to Enel Trade of two LNG shipments with delivery to the United Kingdom, continuing the international trading transactions for shipments under the contract with BG Global Energy Ltda. in various cities in Chile. The first stage began operations in August 2015 to supply the cityrelevant international markets outside of Talca (270 km south of Santiago) Latin America.
In addition, we, together with ENAP and later in 2015 to supply the cities of Coquimbo and La Serena (both approximately 475 km north of Santiago) and Los Andes (84 km south of Santiago). In May 2016, we began to operateAgesa, implemented a new satellite stationagreement for the export of natural gas from the Quintero LNG Terminal to supply Intergas, Argentina with Empresa Nacional de Energía distributorArgentina in 2018. Gas shipments totaled 90.6 million cubic meters, of which we contributed 55% of the city of Temuco (700 km south of Santiago). Other plants are currently in construction and will start to operate in 2017, which will strengthen our position in the LNG distribution business to industrial customers.total exported volume.
During 2016, we signed
In 2018, the Terminal Use Agreement signed with GNL Mejillones a port located in northern Chile, to discharge allowed the unloading of an LNG becoming one of the main suppliers in the zone.shipment at this terminal. This agreement allowed us to renewthe renewal of gas purchase contractsagreements with important mining and industrial customers andin the north of Chile, making us the main industrial gas trader in the north of Chile, in addition to supplyhaving volumes of this gas available to our thermal plantsunits connected to the northern gas pipeline network (Taltal and GasAtacama).
In relation to the commercialization of LNG by trucks, 2018 was marked by an increase in operations, with a 30% increase compared to the 2017. During 2018, new agreements were reached that are partwill allow the distribution of the SING.natural gas to two new cities by truck.
27
During 2016, 1,263With respect to coal-based power plant operations, during 2018, 1,037 kilotons of coal were consumed by the Tarapacá and Bocamina power plants, an increaseplants. This consumption was equivalent of 540 kilotons compared to 2015. The higher coal consumption is mainly due to the return2.3 TWh of theenergy generated by Bocamina I2, 0.6 TWh generated by Bocamina and II units to normal operating conditions in 2016, after they were stopped for 8 and 18 months, respectively, until July 2015, due to judicial issues affecting the power plants. 0.01 TWh generated by Tarapacá.
Generation from NCRE sources
Under Chilean law, powerelectricity generation companies must derive a minimum amount of their energy sales from NCRE. This minimum amount depends on the date of execution of the sale contract and ranges from zero, for those signed prior to 2007, to 20%
for those signed starting in July 2013. Currently, our Canela wind farms, Ojos de Agua mini-hydroelectric plant and 40% of the installed capacity of our Palmucho mini-hydroelectric plant qualify as NCRE facilities. We have fully complied with the applicable NCRE generation requirements since the promulgation of the law. The additional cost of generating electricity using NCRE facilities is being charged as a pass-through costs in our new contracts, which mitigates the impact to our operating income.
Electricity sales and generation
The total industrySEN’s electricity sales increased 1.6%4.3% during 2016 as2018 compared to 2015, with a sales increase of 1.9% in the SIC and of 0.4% in the SING,2017, as set forth in the following table:
ELECTRICITY SALES PER SYSTEM (GWh)
|
| Year ended December 31, |
| ||||
|
| 2018 |
| 2017(1) |
| 2016 |
|
Electricity sales in the SIC |
|
|
|
|
| 50,516 |
|
Electricity sales in the SING |
|
|
|
|
| 16,960 |
|
Total electricity sales (SEN) |
| 71,179 |
| 68,256 |
| 67,476 |
|
|
| Year ended December 31, |
| |||||||||
|
| 2016 |
|
| 2015 |
|
| 2014 |
| |||
Electricity sales in the SIC |
|
| 50,516 |
|
|
| 49,581 |
|
|
| 49,066 |
|
Electricity sales in the SING |
|
| 16,960 |
|
|
| 16,887 |
|
|
| 15,785 |
|
Total electricity sales |
|
| 67,476 |
|
|
| 66,468 |
|
|
| 64,851 |
|
(1) On November 21, 2017, the SIC and the SING were integrated into one interconnected system and resulted in the creation of SEN.
Our electricity sales reached 23,343 GWh in 2018, 23,356 GWh in 2017 and 23,689 GWh in 2016, 23,558 GWh in 2015 and 21,157 GWh in 2014, which represented a 35.1%32.8%, 35.4%34.2% and 32.6%35.1% market share, respectively. The percentage of the energy purchases to comply with our contractual obligations to third parties increaseddecreased by 16.4%5% in 20162018 when compared to 20152017, primarily due to more sales to regulated customers.lower energy available under the contract with Nueva Renca, which is included in this total.
The following table sets forth our electricity generation and purchases:
ELECTRICITY GENERATION AND PURCHASES (GWh)
|
| Year ended December 31, |
|
| Year ended December 31, |
| |||||||||||||||||||||||||||||||
|
| 2016 |
|
| 2015 |
|
| 2014 |
|
| 2018 |
| 2017 |
| 2016 |
| |||||||||||||||||||||
|
| (GWh) |
|
| % of Volume |
|
| (GWh) |
|
| % of Volume |
|
| (GWh) |
|
| % of Volume |
|
| (GWh) |
| % of |
| (GWh) |
| % of |
| (GWh) |
| % of |
| ||||||
Electricity generation |
|
| 17,564 |
|
|
| 74.1 |
|
|
| 18,294 |
|
|
| 77.7 |
|
|
| 18,063 |
|
|
| 85.4 |
|
| 17,373 |
| 74.4 |
| 17,073 |
| 73.1 |
| 17,564 |
| 74.1 |
|
Electricity purchases |
|
| 6,125 |
|
|
| 25.9 |
|
|
| 5,264 |
|
|
| 22.3 |
|
|
| 3,094 |
|
|
| 14.6 |
|
| 5,970 |
| 25.6 |
| 6,283 |
| 26.9 |
| 6,125 |
| 25.9 |
|
Total |
|
| 23,689 |
|
|
| 100 |
|
|
| 23,558 |
|
|
| 100 |
|
|
| 21,157 |
|
|
| 100 |
|
| 23,343 |
| 100 |
| 23,356 |
| 100 |
| 23,689 |
| 100 |
|
We supply electricity to the major regulated electricity distribution companies, large unregulated industrial firms (primarily in the mining, pulp and steel sectors) and the pool market. Commercial relationships with our customers are usually governed by contracts. Supply contracts with distribution companies must be auctioned, and are generally standardized with an average term of ten years.
Supply contracts with unregulated customers (large industrial customers) are specific to the needs of each customer, and the conditions are agreed between both parties, reflecting competitive market conditions.
In 2016, 20152018, 2017 and 2014,2016, we had 46, 41294, 152 and 46 customers, respectively. This significant increase in 2018 is mainly due the increase in the number of unregulated customers. Regulated customers of a certain size may exercise their option to become unregulated customers in order to benefit from the current market situation, which offers lower prices than would be paid as regulated customers. In 2016,2018, our customers included 23 distribution companies in the SIC20 regulated customers and 23272 unregulated customers.
In addition, through our subsidiary, GasAtacama Chile, we began electricity exports to Argentina in February 2016. During 2016, 103.9 GWh were exported to Argentina using the AES Gener S.A. (“Gener”) transmission line that connects Mejillones, Chile and Salta, Argentina. The most significant supply contracts with regulated customers are with Enel Distribución Chile S.A. (a subsidiary of Enel Chile) and with Compañía General de Electricidad S.A. (“CGE”), an unaffiliated entity. These are the two largest electricity distribution companies in Chile in terms of sales.
28
The following table sets forth our public contracts with electricity distribution companies in the SIC for their regulated customers as of December 31, 2016:
|
| Year ended December 31, |
| |||||||||||||||||||||||||||||||||||||||||||||||||||||
|
| (in GWh) |
|
|
|
|
| |||||||||||||||||||||||||||||||||||||||||||||||||
Company |
|
| 2017 |
|
|
| 2018 |
|
|
| 2019 |
|
|
| 2020 |
|
|
| 2021 |
|
|
| 2022 |
|
|
| 2023 |
|
|
| 2024 |
|
|
| 2025 |
|
|
| 2026 |
|
|
| 2027 |
|
|
| 2028 |
|
|
| 2029 |
|
|
| 2030 |
|
Enel Distribución Chile |
|
| 7,601 |
|
|
| 7,824 |
|
|
| 7,971 |
|
|
| 8,018 |
|
|
| 6,851 |
|
|
| 7,682 |
|
|
| 6,426 |
|
|
| 6,427 |
|
|
| 5,592 |
|
|
| 3,937 |
|
|
| 3,937 |
|
|
| 2,452 |
|
|
| 2,452 |
|
|
| 2,452 |
|
CGE |
|
| 7,075 |
|
|
| 6,973 |
|
|
| 6,814 |
|
|
| 5,951 |
|
|
| 6,067 |
|
|
| 6,558 |
|
|
| 6,778 |
|
|
| 6,524 |
|
|
| 2,432 |
|
|
| 2,055 |
|
|
| 2,055 |
|
|
| 2,055 |
|
|
| 2,055 |
|
|
| 2,055 |
|
Chilquinta |
|
| 1,792 |
|
|
| 1,856 |
|
|
| 1,913 |
|
|
| 1,941 |
|
|
| 1,915 |
|
|
| 2,183 |
|
|
| 2,135 |
|
|
| 1,739 |
|
|
| 967 |
|
|
| 933 |
|
|
| 548 |
|
|
| 548 |
|
|
| 548 |
|
|
| 548 |
|
Saesa |
|
| 2,552 |
|
|
| 2,368 |
|
|
| 2,322 |
|
|
| 735 |
|
|
| 761 |
|
|
| 1,950 |
|
|
| 1,684 |
|
|
| 1,607 |
|
|
| 987 |
|
|
| 863 |
|
|
| 863 |
|
|
| 863 |
|
|
| 863 |
|
|
| 863 |
|
Total |
|
| 19,020 |
|
|
| 19,021 |
|
|
| 19,020 |
|
|
| 16,645 |
|
|
| 15,594 |
|
|
| 18,373 |
|
|
| 17,023 |
|
|
| 16,297 |
|
|
| 9,978 |
|
|
| 7,788 |
|
|
| 7,403 |
|
|
| 5,918 |
|
|
| 5,918 |
|
|
| 5,918 |
|
Our generation contracts with unregulated customers are generally on a long-term basis and typically range from five to fifteen years. Such contracts are usually automatically extended at the end of the applicable term, unless terminated by either party upon prior notice. Some include a price adjustment mechanism in the case of high marginal costs, and therefore, reduces the hydrological risk. Contracts with unregulated customers may also include specifications regarding power sources and equipment, which may be provided at special rates, as well as provisions for technical assistance to the customer. We have not experienced any supply interruptions under our contracts. If we experienced a force majeure event, as defined in the contract, we are allowed to reject purchases and we have no obligation to supply electricity to our unregulated customers. Disputes are typically subject to binding arbitration between the parties, with limited exceptions.
For the year ended December 31, 2016,2018, our principal distribution customers were (ordered alphabetically)(in alphabetical order): CGE, Chilquinta, Emel group, Enel Distribución ChileDistribution. Grupo CGE, Grupo Chilquinta and Grupo Saesa group. .
Our principal unregulated customers were (ordered alphabetically)(in alphabetical order): Caserones, Compañíia Minera Doña Minera CarmenInés de Andacollo, Compañía Minera Collahuasi and SCM, Enel Distribution, Empresa CMPC S.A., Minera Valle Central.Central S.A. and SCM Minera Lumina Copper Chile.
We compete in the SICSEN primarily with twothree generation companies, AES Gener, and Colbún S.A. (“Colbún”). According to the CDEC-SIC in 2016, in the SIC, Colbún had an installed capacity of 3,301 MW, of which approximately 53.2% was thermoelectric and Gener and its subsidiaries had an installed capacity of 2,756 MW, of which 89% was thermoelectric. In addition, there are a number of smaller entities with an aggregate installed capacity of 5,999 MW that generate electricity in the SIC.Engie.
As of December 31, 2016, our primary competitors in the SING were Engie (formerly named GDF Suez Group) and Gener, which have 1,971.7 MW and 1,405 MW of installed capacity, respectively. Our direct participation in the SING includes our 182 MW Tarapacá thermal plant and the 780 MW GasAtacama Chile thermal plant.
Electricity generation companies compete largely based on the basis of price, technical experience and reliability. In addition, because 64.3%55% of our installed capacity inconnected to the SICSEN is from hydroelectric, power plants, we have lower marginal production costs than companies generating electricity through thermal plants.whose installed capacity is primarily thermal. Our installed thermal capacity benefits from access to gas from the GNLQ terminal.Quintero LNG Terminal. However, during periods of extended droughts, we may be forced to buy more expensive electricity from thermoelectricthermal generators at spot prices in order to comply with our contractual obligations.
Directly
ELECTRICITY INDUSTRY STRUCTURE AND REGULATORY FRAMEWORK
1. Overview and through our subsidiaries, we are the principal generation operator in the SIC, with 32.3% of the total installed capacity and 42.7% of the electricity energy sales in this system in 2016.Industry Structure
In the SING, our subsidiary GasAtacama Chile, accounted for 18.4%Chilean Electricity Market, there are four categories of the total installed capacitylocal agents: generators, transmitters, distributors and 12.4% of the electricity energy sales in this system in 2016.
ELECTRICITY INDUSTRY REGULATORY FRAMEWORK
The following chart shows a summary of the main characteristics of the Chilean electricity regulatory framework by business segment.large customers.
|
|
| |
|
|
| |
|
| ||
|
|
| |
|
|
| |
|
| ||
|
| ||
|
|
| |
|
|
29
|
|
|
|
Industry Overview and Structure
The Chilean electricity industry is divided into three business segments: generation, transmission and distribution. These business segments are carried out by publicly listed private sector companies, in which generators can also trade energy with unregulated customers. The state’s role is limited to regulation, supervision and indicative investment planning through non-binding recommendations in the case of generation. In the transmission segment, investment planning and construction bidding processes are binding.
The following chart shows the relationships among the various participants in the Chilean electricity market:


The Chilean electricity sector is physically divided into three main networks, the SEN and two smaller isolated networks (Aysén and Magallanes). The SEN was created after the integration of the SIC and the SING that took place in November 2017 and extends from Arica in the north to Chiloé in the south. The CEN (Coordinador Eléctrico Nacional), a centralized dispatch center, coordinates the SEN’s operation. Until the interconnection of the SIC and SING in 2017, each system was coordinated by its respective dispatch center, the CDEC-SIC and the CDEC-SING.
The industry’s three business segments: generation, transmission and distribution, must operate in an interconnected and coordinated manner in order to supply electricity to final customers at the minimum cost and within the standards of quality and security required by the industry’s rules and regulations.
i)Generators:
Generators supply electricity to end customers using the lines and substations that belong to transmission and distribution companies. The generation segment is comprised ofoperates competitively and does not require a group of electricity companies that own generating plants, whose energy is transmitted and distributed to end customers. This segment is characterizedconcession granted by being a competitive market, which operates under market-driven conditions. Generation plantsthe authority. Generators may sell their energy through contracts to distribution companies, who in turn serve the regulated market, to unregulated customers, and to other generation companies. Generatorscompanies through contracts at freely negotiated prices, or they may sell surpluses onto distribution companies to supply regulated customers through contracts governed by bids.
The operation of electricity generation companies is coordinated by the CEN, with an efficiency criterion in which the lowest cost producer available is usually required to satisfy demand at any moment in time. Any differences between electricity production and generators’ contracted sales are sold in the spot market. The transmission segment is comprisedmarket at a price equal to the hourly marginal cost of the system.
ii)Transmitters:
Transmission companies own lines and substations with a combination of lines, substations and equipment for the transmission of electricityvoltage above 23 kV flowing from generators’ production points to the centers of consumption or distribution. In Chile,distribution, charging a regulated toll for the use of their installations. The transmission segment is defined as the conveying ofa natural monopoly subject to special industry regulations, including antitrust legislation. Tariffs are regulated, and access must be open and guaranteed under nondiscriminatory conditions.
iii)Distributors:
Distribution companies supply electricity over lines or substationsto end customers using electricity infrastructure with a voltage or tension higherless than 23 kV. The transmission system operates underdistribution segment is a natural monopoly subject to special industry regulations as well, including antitrust legislation. The electricity network is open access and transmission companies may impose rightstariffs of way over the available transmission capacity through the payment of tolls.
The distribution segment is defined for regulatory purposes as the electricity supplied to end customers at a voltage no higher than 23 kV.are regulated. Distribution companies operate under a public utilityhave the obligation to provide electricity to the regulated customers within their concession regime, with service obligationsarea and at regulated tariffs for supplying regulated customers.prices. They may sell to unregulated customers through contracts at freely negotiated prices.
Customers
Furthermore, customers are classified according to their capacity,demand as follows: (i) new“regulated” or “unregulated”. Certain customers have the choice to be either regulated or unregulated, customers as of 2016 with connected capacity of over 5,000 kW (existing customers who were formerlyand therefore subject to the lower 2,000 kW threshold priorrespective price regime. Demand requirements to 2016 will be grandfatheredqualify as of 2019); (ii) regulated customers with connected capacity up to 500 kW;or unregulated customer are described below under “— 3. Generation Segment — Dispatch, Customers and (iii) customers that choose either a regulated tariff or an unregulated regime for a minimum period of four years, available to customers whose connected capacity falls in the range of 500 kW to 5,000 kW.Pricing”.
2. Electricity Law and Authorities
The distribution companies supply regulated customers, a segment for which the price and supply conditions are the result of tender processes regulated by the CNE (“Comisión Nacional de Energía”), and unregulated customers that have agreements with generators or distributors, which terms are freely negotiated and agreed upon.
In Chile, there are four separate interconnected electricity systems. The main systems in Chile are the SIC and the SING. The SIC services the central and south central part of the country, where 92.2%goal of the Chilean population lives. The SING, which operates
30
Electricity Law is to provide incentives to maximize efficiency and to provide a simplified regulatory scheme and tariff-setting process that limits the discretionary role of the government. This goal is achieved by establishing objective criteria for setting prices that provide a competitive rate of return on investment to stimulate private investment, while ensuring the availability of electricity in the northern partsystem to all who request it.
Since its inception, the Chilean electricity industry has been developed primarily by private sector companies. However, nationalization by the government was carried out between 1970 and 1973. During the 1980s, the sector was reorganized through the Chilean Electricity Law, known as Decreto con Fuerza de Ley DFL 1 (“DFL 1”), allowing for the renewed participation of the countryprivate sector.
The industry is currently governed by the electricity law Ley General de Servicios Eléctricos No. 20,018 and where mostits modifications, under the Electricity Law, known as Decreto con Fuerza de Ley DFL 4 (“DFL 4”), the restated DFL 1, published in 2006 by the Ministry of Economy and its respective Regulations included in Decreto Supremo D.S. No. 327/1998.
The Ministry of Energy is the main authority in the energy industry since February 1, 2010. The Ministry of Energy elaborates and coordinates plans, policies and standards for the proper operation of the mining industry is located, is where 6.3%sector and the development of the Chilean population lives (accordingindustry in Chile.
The National Energy Commission (“CNE”, in its Spanish acronym) and the Superintendence of Electricity and Fuel, “SEF,” are also relevant industry authorities. They report to the 2015 CDEC-SICMinistry of Energy.
The CNE is the entity in charge of approving the annual report)transmission expansion plans, elaborating the indicative plan for the construction of new electricity generation facilities and proposing regulated tariffs to the Ministry of Energy for approval. The SEF inspects and oversees compliance with the law, rules regulations and technical norms applicable to electricity generation, transmission and distribution, liquid fuels and gas.
The Energy Sustainability Agency was created in 2018 and replaced the Energy Efficiency Agency that is in charge of promoting energy efficiency.
Additionally, the law provides for a “Panel of Experts,” whose main responsibility is to acts as a court, issuing enforceable resolutions in disputes related to subjects referred to by DFL 4, and other electricity related laws. This panel is comprised of professional experts, all of whom are elected every six years by the antitrust government agency, Tribunal de la Libre Competencia (“TDLC” in its Spanish acronym).
The CEN is an independent entity in charge of coordinating the operation of the electricity system with the following objectives:
i) maintain service security;
ii) guarantee the efficient operation of the facilities connected to the system; and
iii) guarantee open access to all transmission networks.
The CEN’S main activities include:
a) coordination of electricity market operations;
b) authorization of connections;
c) ancillary services management, implementation of information systems available for the public; and
d) monitor competition and payments, among others.
The CEN performs the calculation of market balances (energy injections and withdrawals), determines the transfers among generation companies and calculates the hourly marginal cost, which is the price at which energy transfers are carried out in the spot market. However, the CEN does not calculate the prices of generation capacity. Such prices are calculated by the National Energy Commission or CNE.
Limits on Integration and Concentration
The antitrust legislation established in DFL 211 (modified by Law No. 20,945 in 2016) and the regulations applicable to the electricity industry stated in DFL 4 and Law No. 20,018, have established the criteria to avoid economic concentration and abusive market practices in Chile.
Companies can participate in the different market segments (generation, distribution, transmission) to the extent that they are appropriately separated, both from an accounting perspective and a corporate perspective according to the requirements established in DFL 4 and Law No. 20,018 and the antitrust law DL 211 referred to above, in addition to complying with the conditions established in Resolution No 667/2002, listed below.
The transmission sector is subject to the greatest restrictions, mainly because of its open access requirements. DFL 4 sets limits to the shareholdings of generation and distribution companies in companies that participate in the national transmission segment of the transmission system.
The owners of the National Transmission System (“STN” in its Spanish acronym) must be constituted as limited liability stock corporations. Individual interests in the STN by companies operating in another electricity or unregulated customer segment cannot exceed, directly or indirectly, 8% of the total investment value of the STN. The aggregate interest of all such agents in the STN cannot exceed 40% of the total investment value.
According to the Electricity Law, there are no restrictions on market concentration for generation and distribution activities. However, Chilean antitrust authorities have imposed certain measures to increase transparency associated with us and our subsidiaries, through Resolution 667 issued by the TDLC.
Resolution 667 states that:
· electricity generation and distribution activities cannot be merged. For instance, Enel Chile must continue to keep both business segments separate and manage them as independent business units; and
· we, Enel Generation and Enel Distribution are registered with the CMF and must remain subject to the regulatory authority of the CMF and comply with the regulations applicable to publicly held stock corporations, even if any of these companies should lose such designation;
· members of the Board of Director must be elected from different and independent groups;
· the external auditors of the companies must be different for local statutory purposes.
In addition, the Water Utility Services Law also sets restrictions on the overlapping of different utility concessions in the same area, setting restrictions on the ownership of the property for water and sewage service concessions and utilities that are natural monopolies, such as electricity distribution, gas or home telephone networks. By way of example, an electricity distribution company and a water utility company that belong to the SIC andsame owner cannot operate in the SING, there are two isolated systems in southern Chilesame concession area.
3. Generation Segment
The generation segment is comprised of companies that provideown electricity generation power plants. They operate under market-driven conditions delivering their electricity to remote areas, where 1.5%end customers through transmission and distribution networks. Generation companies freely determine whether to sell their energy and capacity to regulated or unregulated customers, but the operation of their power plants is determined by the population lives.
In January 2014, Law No 20,726 approved the interconnectionCEN. The surplus or deficit between the SICgeneration company’s electricity sales and production is sold or purchased, as the SING. The interconnection is being builtcase may be, to other generators at the spot market price.
Law No. 20,257 was issued in 2008 to promote the development of NCRE generation. In Chile, NCRE refers to power from wind, solar, geothermal, biomass, ocean (movement of tides, waves and currents, as well as the ocean’s thermal gradient) and mini-hydro plants under 20 MW.
Law No. 20,257 required generators, between 2010 and 2014, to supply at least 5% of their total contracted sales with NCRE sources and progressively increases that percentage by GDF SUEZ0.5% a year beginning in 2015 with the aim of reaching 10% by 2024. In 2013, Law No. 20,698, modified the previously defined NCRE source minimum requirements, establishing a mandatory 20% share of NCRE source as a percentage of total contracted energy sales by 2025, but allowing contracts signed between 2007 and is expected2013 to be completedmaintain the 10% target by 2019. Once in place, energy generated in one system will be able2024.
Dispatch, Customers and Pricing
Generation companies may sell to cover a portion of any shortfalls in thedistribution companies, unregulated end customers or to other system.
The operation ofgeneration companies through contracts. Generation companies satisfy their contractual sales requirements with dispatched electricity, whether produced by them or purchased from other generation companies in eachthe spot market or through contracts. They balance their contractual obligations with their dispatch by trading deficit and surplus electricity at the spot market price, which is set hourly by the CEN, based on the lowest cost of production of the two major interconnectedlast kWh dispatched.
The CEN operates the electricity systems is coordinatedsystem with an approach that minimizes operating costs, while monitoring the quality of the service provided by their respective dispatch centers, the CDEC-SICgeneration and the CDEC-SING, independent entities that coordinate generators, transmission companies and large customers. Each CDEC coordinates the operation of its system withcompanies. To minimize operating costs, it applies an efficiency criterion in which the lowest cost producer available is usually required to satisfy demand at any moment in time. As a result, at any specific level of demand, the appropriate supply will be provided at the lowest possible production cost available in the system. TheThis marginal cost usedon an hourly basis is the price at which generators trade energy on an hourly basis, involvingin the spot market, both their injections into the system(sales) and their withdrawals or purchases for supplying(purchases) to balance their customers.contracted customer sales to their production determined by the CEN.
The Energy Agenda
In May 2014, the Chilean government announced the Energy Agenda, establishing a plan to create and execute a long-term energy policy. The Energy Agenda presents several linescustomers of action and goals to achieve in the short, medium and long term. These objectivesgeneration companies are lower energy prices, the incorporation of non-conventional renewable energy sources (“NCRE”) and promotion of the efficient use of energy. In Chile, NCRE refers to power from wind, solar, geothermal, biomass, ocean (tides, waves and currents, as well as the ocean’s thermal gradient) and mini-hydro plants under 20 MW.
The Energy Agenda includes a program of legal initiatives to achieve those goals. Among the subjects to be addressedclassified by the program are: “Amendmentselectricity capacity demand required, explained as follows:
i) Unregulated customers: Customers who demand over 5,000 kW of capacity, mainly industrial and mining companies. These customers freely negotiate their electricity supply prices with generators and/or distributors. This customer category also includes those who demand between 500 and 5,000 kW of capacity that have the option to choose between the legal framework for procurement of electricity forunregulated regime and the regulated customers” (January 2015), “Amendmentsregime and choose the unregulated regime.
ii) Distribution companies: Distributors distinguishing between the energy they require to satisfy their regulated customers from their unregulated customers. In the legal framework offormer case, distributors purchase energy from generation companies through an open bid process regulated by the CNE, while they freely negotiated bilateral contracts with unregulated customers.
iii) Generation companies trading on the spot or short-term market: The energy and capacity transactions between generation companies arise from the difference between the electricity transmission systems” (July 2016), and “Energy Efficiency Law” (expected to be enacted during 2017).
As part of the Energy Agenda, Decree 148 (“Energíproduced by a 2050 Política Energética de Chile”) was signed on December 30, 2015. Decree 148 approves the new long-term strategy for the electricity sector, which aims to (i) improve electricity service for the impoverished, (ii) have 70% of national electricity generation come from NCRE and (iii) ensure that all new construction will incorporate energy control systems and smart energy management by 2050.
Principal Regulatory Authorities
The Chilean Ministry of Energy develops and coordinates plans, policies and standards for the proper operation of the sector, approves tariffs and node prices setgenerator, as determined by the CNE, and regulates the grantingcontractual obligations of concessions to electricity generation, transmission and distribution companies.that generator with its customers. The CNEprice of energy traded on the spot market is the technical entity in chargehourly marginal cost of defining prices, technical standards and regulatory requirements.
The SEF monitors the proper operation of electricity, gas and fuel sectors in compliance with the law in terms of safety, quality, and technical standards.
The Chilean Ministry of Environment is responsible for the development and application of regulatory and policy instruments that provide for the protection of natural resources, the promotion of environmental educationsystem and the controlprice of pollution, among other matters. It is also responsible for administeringcapacity traded on the environmental impact assessment systemspot market at a certain node.
Each generator receives a capacity payment set by the national level, coordinatingCEN based on the preparationgeneration capacity of environmental standards and establishing the programs for compliance with those standards.
Chilean antitrust authorities are responsible for preventing, investigating and correcting any threats to free market competition and any anti-competitive practices by potentially monopolistic companies. These authorities include:
Free Market Competition Tribunal (“TDLC” in its Spanish acronym). This is a special and independent jurisdictional entity, subject to the directive, correctional and economic authority of the Chilean Supreme Court, which functions to prevent, correct and sanction threats to free market competition.
National Economic Prosecutor (“FNE” in its Spanish acronym). This is the attorney general responsible for economic matters and for investigating and prosecuting all antitrust conduct before the FNE’s regulatory commission and other tribunals.
The Panel of Experts acts as a tribunal in electricity matters arising from disputes between participants in the electricity market and between participants in the electricity marketeach power plant and the regulatory authority in certain tariff processes.available primary resource. This capacity payment replaces the previous “firm capacity” concept. It issues enforceable
31
resolutions and is composed of experts in industry matters, five engineers or economists and two lawyers, all of whom are elected every six years by the TDLC.
There are also other entities relatedcontinues to the energy sector: the Chilean Nuclear Energy Commission is in charge of research, development, use and control of nuclear energy, the Chilean Energy Efficiency Agency is in charge of promoting energy efficiency, and the Center for Innovation and Promotion of Sustainable Energies is in charge of strategic programs and projects with public financing for innovation and promotion of sustainable energies.
The Electricity Law
General
Since its inception, the Chilean electricity industry has been developed by private sector companies. Nationalization had been carried out during the period from 1970 to1973. During the 1980s, the sector was reorganized through the Chilean Electricity Law, known as DFL 1, allowing participation of private sector capital in the electricity sector. By the end of the 1990s, foreign companies had a majority participation in the Chilean electricity system.
The goal of the Chilean Electricity Law is to provide incentives to maximize efficiency and to provide a simplified regulatory scheme and tariff-setting process that limits the discretionary role of the government by establishing objective criteria for setting prices. The goal is an economically efficient allocation of resources. The regulatory system is designed to provide a competitive rate of returndepend primarily on investment to stimulate private investment, while ensuring the availability of electricitysuch facility, the type of power plant technology, and the resources used to all who request it.
DFL 1 was published in 1982 and has had few important changes since then to deal with droughts, encourage investments in transmission lines and to create long-term contracts between generation and distribution companies as part of a bid process. The present law was restated as DFL 4 of 2006, and has been supplemented with a series of regulations and standards.
In January 2015, the Chilean Congress approved amendments to the legal framework for procurement of electricity by regulated customers. Among the principal changes introduced in these amendments, were:
Increased CNE participation in the development of tenders.
Additional time to call for tenders: five years in advance.
Allocation mechanism: Will be awarded to the lowest prices offered. These prices will be limited by a capped price that will be deemed as a reserve price and keep private until the bid pricegenerate. It is public.
Reduced risk: Providers of electricity have the ability to postpone delivery of electricity in the event there are delays due to well-founded reasons not attributable to the tenderer and to request a price review, indexed to the conditions prevalent at the time at which the energy is delivered.
Short-term contracts: Short-term procurement contracts (up to three years), with an advance of one year, have a minimum price equal to the average market price plus 50%. Additionally, within specified ranges from the average marginal cost price, marginal cost will be used.
Non-contracted energy: All generators within a particular system will be required to offset energy supply contract deficits in proportion to the energy they inject into the system. Each generator will receive the higher of the short-term node price or variable cost of the plant. When energy without contracts exceeds 5% of the total regulated supply, the excess will be paid by distribution companies at a price equal to marginal cost. In turn, these marginal costs will be passed on to end customers.
Customers are classified according to their capacity, as follows: (i) new unregulated customers as of 2016 with connected capacity of over 5,000 kW (existing customers who were formerly subject to the lower 2,000 kW threshold prior to 2016 will be grandfathered as of 2019); (ii) regulated customers with connected capacity up to 500 kW; and (iii) customers that choose either a regulated tariff or an unregulated regime for a minimum period of four years, available to customers whose connected capacity falls in the range of 500 kW to 5,000 kW.
In 2016, transmission Law No 20,936 restructured the electricity transmission system operation. The main provisions included are:
Functional redefinition of Transmission Systems, which will now be classified into National Transmission Systems, Zonal, Dedicated Systems, development poles and international interconnections. The creation of a single independent national coordinator, who will replace the current CDEC-SING and CDEC-SIC dispatching operators as of January 2017;
A new remuneration mechanism for assets with a progressive shift of all costs from generators to the end customers; and
32
Limits and Restrictions
The owners of the main transmission system must be constituted as limited liability stock corporations and cannot take part in the electricity generation or distribution businesses.
Individual interest in the Main Transmission System (“STT” in its Spanish acronym) by companies operating in another electricity or unregulated customer segment cannot exceed, directly or indirectly, 8% of the total investment value of the STT. The aggregate interest of all such agents in the STT must never exceed 40% of the investment value.
According to the Chilean Electricity Law, there are no restrictions on market concentration for generation and distribution activities. However, Chilean antitrust authorities have imposed certain measures to increase transparency associated with Enel Chile and its subsidiaries, us and Enel Distribución Chile. The TDLC’s Resolution 667 requires that for all three of these companies:
board members must be elected from different and independent groups;
the external auditors must be different for local statutory purposes;
electricity generation and distribution activities cannot be merged; instead, Enel Chile must continue to keep separate both business segments and manage them as independent business units; and
all three companies must remain subject to the regulatory authority of the SVS and comply with the regulations applicable to publicly held stock corporations, even if they should lose such designation.
Enel Américas, as the continuing company following the spin-off of Enel Chile in 2016, is also subject to the restrictions of Resolution 667. However, these antitrust restrictions are not applicable between Enel Chile and Enel Américas.
Additionally, in October 2012, FNE Official Letter 1479 imposed additional antitrust restrictions which have the following implications for the current Enel Generación Chile:
the controlling shareholders of Enel Generación Chile should refrain from designating as directors any persons who may have been directors of Enel Distribución Chile during the prior term; and
Enel Generación Chile’s management should refrain from designating employees in first and second level positions who may have held the same positions in Enel Distribución Chile during the six months prior to their designation.
In addition, the Water Utility Services Law also sets restrictions on the overlapping of concessions in the same area, setting restrictions on the ownership of the property for water and sewage service concessions and utilities that are natural monopolies, such as electricity distribution, gas or home telephone networks.
Regulation of Generation Companies Concessions
Chilean law permits generation activity without a concession. However, companies may apply for a concession to facilitate access to third-party properties. Third-party property owners are entitled to compensation, which may be agreed to by the parties or, if there is no agreement, it may be determined by an administrative proceeding that may be appealed in the Chilean courts.
Dispatch and Pricing
In each of the two major electric systems, the pertinent CDEC coordinates the operations of generation companies, in order to minimize the operating costs in the electricity system and monitor the quality of service provided by the generation and transmission companies. Generation companies satisfy their contractual sales requirements with dispatched electricity, whether produced by them or purchased from other generation companies in the spot market. As of January 2017, a single independent national coordinator replaced the two CDECs.
33
Sales by Generation Companies to Unregulated Customers
Sales by generation companies may be made to distribution companies, unregulated end customers or to other generation companies under freely negotiated contracts. To balance their contractual obligations with their dispatch, generators have to trade deficit and surplus electricity at the spot market price, which is set hourly by each CDEC based on the lowest cost of production of the last kWh dispatched.
Sales to Distribution Companies and Certain Regulated Customers
Under Law 20,018 (Ley Corta II), enacted on May 19, 2005, all new contracts between generation and distribution companies to supply electricity to regulated customers must arise from international bids. In January 2015, Law 20,805 amended the bidding process for supplying electricity to regulated customers. These amendments, among others, changed the anticipation required for the bidding process from three to five years, extended the maximum contract period from 15 to 20 years, adopted a capped price known as “reserve price” that is kept private until the bid price is made public, and allowed for the possibility to review the price awarded during the supply period, setting new procedures to assign energy without contracts and to regulate the short-term bidding process.
Sales of Capacity to Other Generation Companies
Each CDEC determines a firm capacity for each power plant on an annual basis. Firm capacity is the highest capacity which a generator may supply to the system at certain peak hours, taking into considerationconsidering statistical information, and accounting for maintenance time out of service for maintenance purposes and for extremely dry conditions infor hydroelectric power plants, but differs from firm capacity because it does not consider the case of hydroelectric plants.
A generation company may be required to purchase or sell capacity in the spot market, depending upon its contractual requirements in relationpower plants’ contribution to the amount of electricity to be dispatched from such company and to its firm capacity.
Promotion of Generation from Renewable Energy Sources
On April 1, 2008, Law 20,257 amended the General Electric Services Law. The purposesecurity of the amendment wasentire system.
Generation costs are passed on to promotedistributors’ regulated end consumers through the development“average node price,” which corresponds to a single price determined for each distributor by the CNE, considering the weighted average prices of NCRE. This law definestheir current supply contracts for regulated customers. The average node price is adjusted in three instances: (1) every six months, in January and July of each year, based on local and international indexes; (2) upon the different types of technologies that qualify as NCRE and establishes the obligation for generators, between 2010 and 2014, to supply at least 5% of the total energy contracted as of August 31, 2007 to beentry of a certain type,new supply contract with any distribution company; and to progressively increase this percentage by 0.5% annually up to(3) upon indexation of a minimum ofsupply contract in more than 10% by 2024..
On October 22, 2013, Law 20,698 was adopted to promote the use of NCRE and modify the previously defined NCRE minimum requirements. This law establishes a mandatory share of renewable energy sources in 2025, calculated as a percentage of the total contracted energy of each generator. For contracts signed between 2007 and 2013, the target is 10% by 2024, while for contracts beyond 2013 the target is 20% by 2025.
Incentives and PenaltiesRationing
If a rationing decree is enacted in response to prolonged periods of electricity shortages, strict penalties may be imposed on generation companies that contravene the decree. A severe drought is not considered a force majeure event under our service agreements.
Generation companies may also be required to pay fines to the regulatory authorities, as well as compensate electricity customers affected by shortages of electricity. The fines are related to system blackouts due to an electricity generator’s operational problems, including failures related to the coordination duties of all system agents. If generation companies cannot satisfy their contractual commitments to deliver electricity during periods when a rationing decree is in effect and there is no energy available to purchase in the system, the generation company must compensate the customers at a rate known as the “failure cost” determined by the authority in each node price setting. This failure cost, which is updated semiannually by the CNE, is a measurement of how much end customers would pay for one extra MWh under rationing conditions.
Water Rights
Companies in Chile must pay an annual fee for unused water rights. License fees already paid may be recovered through monthly tax credits, commencing on the start-up date of the project associated with the water right. The maximum license fees that may be recovered are those paid during the eight years before the start-up date.
The Chilean Constitution considers water as a national public good onin which real utilization rights are defined. ThatIt is similar to holding the private property rights over water, as set forth in article 19, paragraph 24: “The rights of individuals over water,
34
recognized or constituted in accordance with the law, grant their holders ownership over such rights.” Notwithstanding the foregoing, paragraph 24 also specifies legal limitations to those water rights.
The Chilean Congress is currently discussing amendments to the Water Code with the objective of making water use for human consumption, household subsistence and sanitation a high priority.
On November 22, 2016, the Chilean House of Representatives approved an amendment whichthat is currently being evaluated by the Water Resources, Desertification and Drought Commission of the Chilean Senate. The main aspects of the amendments are as follows:
·Granting of new water rights, which would be limited to a maximum period of 30 years, and extendable over future terms, unless the Chilean Water Authority proves the ineffective usenon-use of the resources. The extension shallwould be effective only for used water rights.
·The expiration of new non-consumptive water rights that were granted by law, if the holder does not exercise the right of use within eight years.
·The expiration of new non-consumptive water rights already granted, if the user does not effectively use the rights within a period of eight years from the date of enactment of the new Water Code. The term can be extended for up to four years only in justified cases such as delays in obtaining permits or environmental approvals.
In April 2017,January 2019, the President modified this amendment statingto state that the preservation of water environmental flows to protect the ecosystem only applies to future water rights have an unlimited duration.
4. Transmission Segment
The transmission segment supplies electricity over lines or substations with a voltage or tension higher than 23 kV from generators’ production points to the centers of consumption or distribution. Transmission systems are comprised of the electricity lines and substations that are not considered part of the distribution network.
Given the structural characteristics of the transmission segments, it is subject to special electricity industry regulation. Tariffs are regulated, and access must be open guaranteed under nondiscriminatory conditions.
Law No. 20,936 published in July 2016 established a new regulatory framework for all electricity transmission systems in Chile, redefining the system into the following segments: National, Development Poles, Zonal, Dedicated, and International.
National and Zonal Transmission Systems planning is a centralized, regulated process carried out by the CEN that annually issues an expansion plan to be approved by the CNE.
The expansion of both consumptivesystems is granted through an open tender process that distinguishes new installations from enlargement of existing installations. The tenders carried out for new installations grant the winner ownership of the installation to be built. The expansion of existing installations, on the other hand, belongs to the owner of the original installation, who is obliged to tender the construction of the required expansion.
The remuneration of existing national and non-consumptive water use, which would reducezonal transmission installations is determined by a tariff setting process performed every four years. This process determines the water availabilityAnnual Transmission Value that considers efficient operation and maintenance costs and an annual valuation of investments that is based on a discount rate determined by the authority every four years (minimum 7% after tax) and the useful life of the installations.
The remuneration of expansions is the value resulting from the respective bid of such expansion for generation purposes. the first 20 years of operations. From year 21 on, such expansion is considered an existing installation and remunerated accordingly.
Regulation currently in force states that transmission remuneration is the sum of tariff revenue and usage charge revenue, received for use by the transmission system defined as $/kWh by the CNE.
Finally, in the case of a failure in electricity transmission, Law No. 20,936 defines the penalty conditions for the responsible company (transmission, generation or other).
Transmission Tariffs
Law No. 20,936 introduced changes to the transmission tariff setting process. In transitioning to the implementation of the new law, the current zonal transmission tariff setting process continued as stated by transitory Article No. 20 of Law No. 20,936. The tariff setting process for the 2018-2019 period concluded in October 2018 and has been effective retrospectively since January 1, 2018. The 2020-2023 tariff setting process is now in progress.
5. Distribution CompaniesSegment
Concessions
The distribution segment is comprised of electricity infrastructure with a voltage lower than 23 kV to supply electricity to end customers. Electricity distribution is considered a natural monopoly and companies therefore operate under a public utility concession regime, with service obligations and regulated tariffs for supplying regulated customers. They may sell to unregulated customers at negotiated prices.
Customers are classified according to their demand as regulated or unregulated. Regulated customers are those whose connected capacity is below or equal to 5,000 kW and unregulated customers are those whose connected capacity is at least 5,000 kW. Customers with connected capacity between 500 kW and 5,000 kW may choose to be regulated or unregulated, subject to the respective price regime. Clients who choose one category must remain at least four years in the option chosen.
Customers subject to the unregulated price regime may negotiate their electricity supply with any generator or distributor, although they must pay a regulated toll for using the distribution network.
Regulated customers with residential generation can sell their surpluses to the distribution company, under certain conditions (regulation of net billing). Since November 2018, Law No. 21,118 permits customers with connected capacity up to 300kW to sell their surpluses.
Distribution service concessions give the right to use public areas for building distribution lines. The concessions are given by the Chilean Ministry of Energy for an undefined period.period and give the right to use public areas for building distribution lines. Distribution companies have the obligation to serve and connect thesupply electricity to regulated customers that makerequest service within their concession area, except for customers that have chosen the requirement in theunregulated regime. A concession area. The president of Chile can declare a concessionmay be declared expired if the quality of service does not meet certain minimum standards.
Energy Purchases
Since 2005, withRegarding the enactmentsupply of the law “Ley Corta II,” energy sales between generation andelectricity to regulated customers, DFL 4 establishes that distribution companies must permanently have been made by an international auction process. After the last modification of the law (Law 20,805 – 2015), the auctions of all distribution companieselectricity supply available. They must contract their energy supply through open, non-discriminatory and transparent public tenders. These bidding processes are managed by the CNE. The auctionsCNE and are based on distribution companies’ projections of energy demand fordemand. They are carried out at least five years in advance from the coming years. The resultexpected effective date of the processenergy supply contract, which has a 20-year term. In case of unforeseen deviations in the projections of demand, the regulator has the authority to carry out short term tenders. There is also a “pay as bid” contract, with an extension up to 20 years. In addition, the modifications of the law establish aregulated mechanism to remunerate supply the excess demand that is not covered by a contract if this were to take place.
The latest tender was carried out in 2017. A total 2,200 GWh/year were awarded for the contract.period from January 1, 2024, to December 31, 2043, at an average price of 32.5 US$/MWh, which must be completely sourced from NCRE. For further detail on the outcome of tenders, please see “Item 4. Information on the Company — B. Business overview.”
Distribution Tariffs to End Customers
The Chilean distribution tariff model has gone through nine tariff setting process since its privatization in the 1980s.
Tariffs charged by distribution companies to end regulated customers are set every four years. Tariffs are determined by the sum of the cost of electricity purchased by the distribution company, a transmission charge and the value addedValue Added from distributionDistribution of electricity (“VAD”), which allows distribution companies to recover their investment and operating costs, including a return on investment, which is set by law. The price for both generation and distribution capacity sold to customers includes a factor which reflects the simultaneous contribution of each customer to peak capacity demand of the system as a whole. The transmission charge reflects the cost paid for electricity transmission and transformation.
The VAD is based on a so-called “efficient model company,” whichcompany” within a Typical Distribution Area (“TDA”). It considers the cost of building and operating the company at the minimum cost, fulfilling quality and safety standards. It includes the annualized investment in distribution assets, the company’s operation, administration, and maintenance costs, and an expected return on investment, before taxes of 10% per year in real terms, based on the replacement cost of assets used for the distribution business.
Generation costs are passed on to distributors end consumers through the “Average Node Price” stated in government’s price decrees. The Average Node Price is adjusted in three instances: (1) every six months, in January and July of each year, based on local and international indexes; (2) upon the entrystandards of a new supply contract with any distribution company; and (3) upon indexation of a supply contract in excess of 10%.
Regulatory Charges and Subsidies
The Chilean law deemscompany within that transitory subsidies can be granted, ifTDA. Therefore, the residential customer tariff increased by 5% or more within a six-month period. The application of this subsidy is optional and the last one was granted in 2009.
35
Distribution Tariff-Setting Process
The VAD is set every four years. The CNE classifies all distribution companies into groups called Typical Distribution Areas (“TDA”) based on economic factors that group companies with similar distribution costs, which in turn determines the equipment requirements of the network. The CNEaccording to their TDA, then selects one distribution company for every groupfrom each TDA and estimates its cost under the concept ofas an efficient model company. At the same time, distributionDistribution companies also carry out their own studies whichto determine the costs of such company as the efficient model company. Cost estimates include fixed costs, average energy and capacity losses, standard investment costs, and operation and maintenance costs. The annual investment costs are basedcalculated considering the Replacement Cost (“VNR” in its Spanish acronym) of the installations, useful life and a 10% return on the same one company selected by the CNE for each TDA. assets associated with electricity investments.
The VAD of each TDA is determined inas a weighted manneraverage with one third of the value estimated by the study of the companies and two thirds by the CNE. Preliminary tariffs, as a result ofwith the resulting VAD, are tested to ensure that they provide aan industry aggregate rate of return between 6% and 14% on distribution assets..
The real return on investment for a distribution company depends on its actual performance relative to the standards chosen by the CNE for the efficient model company. The tariff system allows for a greater return to distribution companies that are more efficient than the model company.
At
Electricity regulation establishes tariff equality mechanisms for electrical services. Law No. 20,928 states that the endmaximum tariff that distribution companies may charge residential customers must not exceed the average national tariff by more than 10%. The differences arising from the application of 2015,this mechanism will be progressively absorbed by the CNE setremaining customers subject to regulated prices that are under the typical distribution areas, and startedmentioned average, except for those residential users whose monthly average consumption of energy in the process for setting distribution tariffs for 2016-2020. In March 2016, Enel Distribución Chile engagedprior calendar year is lower than or equal to 200 kWh.
Additionally, Chilean law provides that transitory subsidies can be granted if the residential customer tariff increases by 5% or more within a consultant to calculatesix-month period. This subsidy is conferred by the state, its one-third weightingapplication is a faculty of the VAD, whilegovernment and the CNE must provide its value for its two-thirds weighting. The studylast one was delivered to the CNE on September 5, 2016.granted in 2009.
Associated Electrical Services
In 2013, the CNE concluded theThe tariff setting process for 25 regulated associated services (which include meter rental, disconnection2016-2020 concluded in August 2017 and reconnectionhad been in effect, retroactively, since November 4, 2016. On December 18, 2017, CNE published a resolution that set the Technical Standard of Quality of Service for Distribution Systems. The Distribution System Technical Service Quality Standards established higher technical and commercial standards, including electricity supply reliability indicators, such as the System Average Interruption Frequency Index (SAIFI), which measures the average number of times a customer’s supply is interrupted in a year; and the System Average Interruption Duration Index (SAIDI), which measures the total number of minutes, on average, that a customer is without electricity in a year, among others. This resolution also refers to product quality, metering, monitoring and controlling and commercial service among others). These new prices were applied starting March 14, 2014quality. In this context, in September 2018, there was an extraordinary tariff update process. This updated tariff is non-retroactive and will remain in effectbe effective until the publication of a new decree, which was initially expected in November 2016. Currently, thisnext tariff setting process is not concluded and it is expected to be completed in 2017.process.
Incentives and Penalties
Distribution companies may be required to compensate end customers in the case of electricity shortages that exceed the authorized standards. These compensatory payments are equal to double the amount of electricity the distribution company failed to provide, using a rate equal to the so-called “failure cost.” In addition, distribution companies are subject to the provisions of the SEF, in particular to in its articles 15 and 16 of the Law No. 18,410, in which different infractions are listed and classified according to their severity and associated fines.
Transmission Regulation
Distribution-Related Services
Distribution-related services are services identified by the TDLC as subject to regulation, such as meter rentals and meter verification, among others. The main transmission system consiststariffs of 220 kV or higher voltage lines thatthese services are used by generators and customers. Everyset every four years a study is carried out to evaluateby the existing system and to defineCNE along with the expansion plan.VAD calculation. On July 31, 2015,March 14, 2014, the last study was delivered to the CNE. In February 2016, the Chilean Ministry of Energy promulgated Decree 23T,published the prices for distribution-related services, which defines the current value of the existing lines to be remuneratedare currently still effective.
The tariff setting process for the period from 2016 to 2019. The main transmission system is paid for generators and customers.
According to the General Electricity Services Law, the transportation of electricity by main transmission systems and sub-transmission systems are defined as a public service. Therefore, the transmitter has a service obligation and is responsibledistribution related services for the maintenance and improvement of its facilities.
In2016-2020 period concluded in July 2016, Transmission Law No 20,936 restructured electrical transmission system operations, introducing a single independent national coordinator that replaces the current CDECs (notwithstanding the existence of some intermediate and isolated electrical systems). In addition, the government assumes the main role in the planning of the transmission system, including the tender process. Among other aspects of the law, open access is extended to all transmission facilities. It unites the process of the transmission facility qualification process of each segment into a single process, and modifies the remuneration mechanism by means of the application of a stamped rate of charge of the demand.2018. The new independent national coordinator will take the CDECs’ responsibilitiestariff is non-retroactive and assume its new functions dated prior to July 2018, by which time the process will be fully operative.
Zonal Transmission System Regulation
The Transmission Law redefines the previous subtransmission system as the Zonal Transmission System. The Zonal Transmission Systems are defined as voltage lines exceeding 23 kV and are grouped geographically. There are six zonal systems defined by decree. The zonal systems are paid mainly by customers according to the tariffs fixed by decree of the Chilean Ministry of Energy. Zonal tariffs remunerate the Zonal Transmission Annual Value, which is calculated every four years in a process carried out by the government. The annual value of each system includes efficient operation, maintenance, administration costs and annual valuation of real investments, which are valued as new, and uses a discount rate determined by the CNE. The discount rate is
36
calculated using a CAPM model with a minimum value of 7% after tax. If major discrepancies are discovered between the government and zonal companies, an expert panel will resolve them based on technical aspects.
In April 2013, Decree 14 was promulgated, which established a tariff schedule for 2011 through 2014. During 2014, studies were developed to set tariffs for zonal systems. The results of these studies should have been applied at the beginning of 2015. However, the authority ruled that the current values will remain in effect for an additional year. Subsequently, withuntil the application of Law 20,936, the current values will remain in effect for another two additional years, until 2018.next tariff setting process.
On September 30, 2016, in accordance with the definitions of the Transmission Law, Enel Distribución Chile delivered the updated and supplemented list of zonal assets as of December 31, 2015 of the Stx-D system (the zonal system that includes the Enel Distribución Chile assets) and the summary report valuation of the annual investments and costs of operation, maintenance and administration of these installations, for their consideration in the determination of the annual value of the zonal transmission systems for the 2018 – 2019 period. Currently, the CNE is reviewing this information to prepare a technical document.
6. Environmental Regulation
The Chilean constitution grants citizens the right to live in a pollution-free environment. It further provides that certain other constitutional rights may be limited in order to protect the environment.
Chile has numerous laws, regulations, decrees and municipal ordinances that address environmental considerations. Among them are regulations relating to waste disposal (including the discharge of liquid industrial wastes), the establishment of industries in areas that may affect public health, and the protection of water for human consumption.
Environmental Law No. 19,300 was enacted in 1994 and has been amended by several regulations, including the Environmental Impact Assessment System Rule issued in 1997 and modified in 2001. This law establishes a general framework of regulation of the right to live in a pollution-free environment, the protection of the environment, the preservation of nature and the conservation of environmental heritage. It also regulates environmental management instruments such as the Strategic Environmental Assessment, the Environmental Impact Assessment System and Access to Environmental Information, the Environmental Damage Liability, the Enforcement and the Environmental Protection Fund and the environmental institutional framework of Chile. This law requires companies to conduct an environmental impact study (“EIA” in its Spanish acronym) and a declaration of any future generation or transmission projects.
In January 2010, Law No. 19,300 was modified by Law No. 20,417, whichand introduced changes to the environmental assessment process and in the public institutions involved, principally creating the Chilean Ministry of Environment and the Superintendence of Environment. Environmental assessment processes are coordinated by this entity and by the Environmental Assessment Service. Service (SEA).
The Ministry of the Environment is in charge of the management, protection and application of policies in environmental matters, whose mission is to lead sustainable development, through the generation of efficient public policies and regulations, by promoting good practices that improve citizen environmental education. This Ministry works in the recovery of air quality in urban centers, the management of natural resources and biodiversity, the proper final disposal of solid waste, climate change and protection of water resources, and environmental education and citizen participation.
The SEA is in charge of guarding the regulatory integrity within the framework of the environmental impact assessment of the projects, while the Superintendence of Environment monitors compliance with the environmental qualification, standards and plans.
In June 2011, the Ministry of Environment published Decree 13, which establishes emission standards for thermoelectric plants applicable to generation units of at least 50 MW. The objective of this regulation is to control atmospheric emissions of particulate matter (MP), nitrogen oxides (NOx)(NOx), sulfur dioxide (SO2) and mercury (Hg), in order to prevent and protect the health of the population and
protect the environment. Existing emission sources are required to meet emission limits as established in the regulation for MP emissions and for SO2 and NOxNOx emissions by June 2015 in highly polluted areas and by June 2016 elsewhere.
In June 2012, Law No. 20,600 created the Environmental Courts, special jurisdictional courts subject to the control of the Chilean Supreme Court. Their primary function is to resolve environmental disputes within their jurisdiction and look intoinvestigate other matters that are submitted for their attention under the law. The law created three such courts, all of which are in operation.
On December 28, 2012, the Superintendence of Environment was formally created and began to exercise its powers of enforcement and sanctions pursuant to Chilean environmental regulations.
On September 10, 2014, Law No. 20,780 was enacted and included charges for the emission of MP, NOx,NOx, SO2 and CO2 into the atmosphere. For CO2 emissions, the charge is US$ 5 per emitted ton (not applicable to renewable biomass generation). MP, NOxNOx and SO2 emissions will be charged the equivalent of US$ 0.10 per emitted ton, multiplied by the result of a formula based on the population of the municipality where the generation plant is located and an additional fee of US$ 0.90 per ton of MP emitted, US$ 0.01 per ton of SO2SO2 emitted and US$ 0.025 per ton of NOx emitted. This tax will be in effect beginningbecame effective in 2018, taking into accountwith the amount due calculated based on the previous year’s emissions.
As
In 2017, authorities published Exempt Resolution No. 659 related to the implementation of December 30, 2016, allArticle No. 8 of Law No. 20,780 regarding taxes on thermal electric power plant emissions as a result of the country’s latest tax reform.
All our thermal plants of Enel Generación Chile and itsour subsidiary GasAtacama Chile have established methodologies to measure emissions during 2017 and pay related taxes, in line with the requirements of the Environmental Superintendence of Chile.
Regarding biodiversity, on January 5, 2018, the Chilean Sustainable Development Board approved the 2017-2030 National Biodiversity Strategy. This strategy replaces the existing national strategy adopted in 2003. The new strategy identifies five objectives related to the sustainable use of biodiversity, and the development of the institutions and regulation required for the sustainable management of ecosystems.
7. Raw Materials
For information regarding our raw materials, please see “Item 11. Quantitative and Qualitative Disclosures Aboutabout Market Risk — Commodity Price Risk.”
C.Organizational Structure.
37
Principal Subsidiaries and Affiliates
We are part of an electricity group controlled by Enel, an Italian company and our Italian ultimate controlling shareholder. Enel Chile, our controlling shareholder, owns 60.0%owned 93.6% of our shares, and Enel beneficially owns 60.6%owned 61.9% of Enel Chile.Chile as of December 31, 2018. Enel is an energy company with multinational operations in the power and gas markets, with a focus on Europe and Latin America. Enel operates in over 3035 countries across fourfive continents, produces energy through a netmanaged installed capacity over 89 GW, which includes 43 GW of 84 GWrenewable sources, and distributes electricity and gas through a network covering 1.92.2 million kilometers. With over 6173 million users worldwide, Enel has the largest customer base among European competitors and figures among Europe’s leading power companies in terms of installed capacity and reported EBITDA. Enel publicly tradesshares trade on the Milan Stock Exchange.
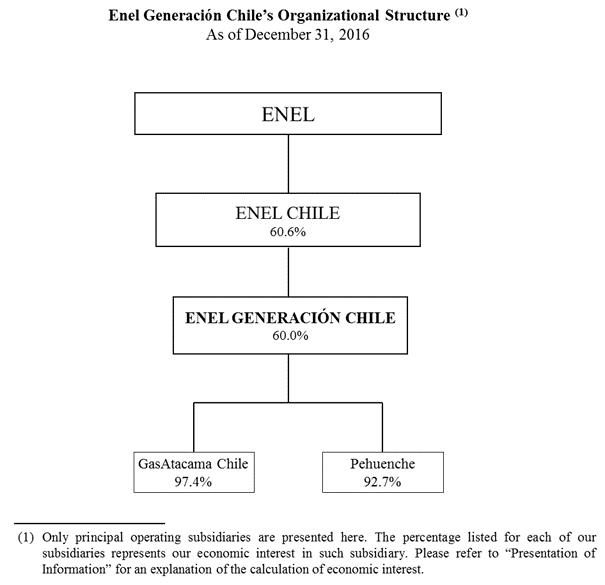
As of December 31, 2018
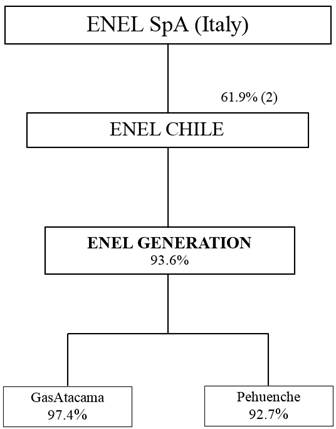
(1) Only principal operating subsidiaries are presented here. The percentage listed in the box for each of Enel Generation’s consolidated subsidiaries represents its economic interest in such consolidated subsidiary.
38(2) Excluding treasury stock.
We consolidated the companies listed in the following table Thewere consolidated by us as of December 31, 2016.2018. In the case of subsidiaries, our economic interest is calculated by multiplying our percentage of economic interest in a directly held subsidiary by the percentage economic interest of any entity in the chain of ownership of such ultimate subsidiary.
Principal Companies |
| % Economic Ownership of Each Main Subsidiary by Enel Generación Chile |
|
| Consolidated Assets of Each Main Subsidiary on a Stand-alone Basis |
|
| Revenues and Other Operating Income of Each Main Subsidiary on a Stand-alone Basis |
|
| % Economic |
| Consolidated Assets |
| Revenues and |
| |||
|
| (in %) |
|
| (in billions of Ch$) |
|
|
|
|
|
| (in%) |
| (in billions of Ch$) |
|
|
| ||
Pehuenche |
|
| 92.7 |
|
|
| 229.2 |
|
|
| 155.6 |
|
| 92.7 |
| 231 |
| 163 |
|
GasAtacama Chile(1) |
|
| 97.4 |
|
|
| 857.9 |
|
|
| 598.4 |
| |||||||
GasAtacama(1) |
| 97.4 |
| 757 |
| 271 |
| ||||||||||||
|
|
(1) Includes Central Eólica Canela S.A and Gasoducto Atacama Argentina S.A. On November 1, 2016, Celta was merged into GasAtacama, which was the surviving company. GasAtacama has been fully consolidated since May 2014.
Principal Subsidiaries
GasAtacama
GasAtacama Chile
GasAtacama Chile is a generation company located northern Chile, which containsowns and operate a four-unit combined-cycle power plant with a total installed capacity of 780732 MW and a gas pipeline, which connects to Argentina. In April 2014, we acquired a 50% ownership interest in Inversiones GasAtacama Holding Ltda. (“GasAtacama Holding”). As and as a result, we owned a controlling equity interest in GasAtacama Holding, andHolding.
Since the second half of 2016, we have been carrying out a corporate simplification process, which mainly involved mergers. During 2016, GasAtacama Holding merged into Celta, which later merged into GasAtacama, Chile, the surviving company, on November 1, 2016 through Celta. Since May 1, 2014, we have fully consolidated2016. On November 9, 2017, GasAtacama Chile in our consolidated financial statements.purchased the 25% minority interest of Central Éolica Canela S.A. On December 22, 2017, Central Éolica Canela S.A. was dissolved subsequent to the sale of its assets to GasAtacama on November 21, 2017.
During the second half of 2016, we carried out a corporate simplification process, which involved several mergers, including the merger of Celta into GasAtacama Chile, the legal surviving company.
As of December 31, 2016,2018, GasAtacama Chile also ownsowned the following power plants: Tarapacá, San Isidro, Pangue, Canela I and II and Ojos de Agua, which have an aggregate capacity of 1,115 MW as of December 31, 2016. 1,110 MW.
We hold 97.4% of the economic interest in GasAtacama Chile.and since May 1, 2014, we have consolidated GasAtacama in our consolidated financial statements.
Pehuenche
Pehuenche, a generation company connected to the SIC,SEN, owns three hydroelectric facilities located in the hydrological basin of the Maule River, south of Santiago, with a total installed capacity of 699697 MW. The 570568 MW Pehuenche plant began operations in 1991, the 89 MW Curillinque plant began operations in 1993, and the 40 MW Loma Alta plant began operations in 1997. We hold 92.7% of the economic interest in Pehuenche.Pehuenche and consolidate Pehuenche in our consolidated financial statements.
Selected Related
D.Property, Plant and Jointly-Controlled CompaniesEquipment.
HidroAysén
HidroAysén was incorporatedOur property, plant and equipment are concentrated on electricity generation assets in March 2007 to developChile.
We conduct our generation business through Enel Generation and exploit a hydroelectric project in the Aysén Region in southern Chile. Enel Generación Chile owns 51.0% of HidroAysén,its subsidiaries, Pehuenche and Colbún, an unaffiliated entity, owns the remaining 49.0%. In the fourth quarter of 2014, we recorded an impairment loss of Ch$ 69,067 million, related to the uncertainty of recovering the investment carried out in HidroAysén.
Transquillota
Transquillota was formed by San Isidro and Colbún for the joint development of a 220 kV transmission line to dispatch the energy produced and to connect both the San Isidro generation plant (currently owned by GasAtacama, Chile) and Nehuenco generation plant (a subsidiary of Colbún) to the SIC. The 220 kV transmission line is 8 kilometers long. The property is equally divided between us and Nehuenco. Our economic interest in Transquillota is 48.7%.
|
|
Wewhich together own 28 generation power plants, all located in Chile. Chile, of which 16 are hydroelectric (3,456 MW installed capacity), ten are thermal (2,738 MW installed capacity) and two are wind powered (78 MW installed capacity). The description for our generation subsidiaries, and their businesses is included in this “Item 4. Information on the Company.”
A substantial portion of our generating subsidiaries’ cash flow and net income is derived from the sale of electricity produced by our electricity generation facilities. Significant damage to one or more of our main electricity generation facilities or interruption in the production of electricity, whether as a result ofresulting from an earthquake, flood, volcanic activity, severe and extended droughts or any other such natural disasters, could have a material adverse effect on our operations.
The following table identifies the power plants that we own, all located in Chile, at the end of each year, by company and their basic characteristics:
39
Property, Plant and Equipment of Generation Companies
|
|
|
|
|
| Installed Capacity(1) As of December 31, |
| |||||||||
Company |
| Power Plant Name |
| Power Plant Type(2) |
| 2016 |
|
| 2015 |
|
| 2014 |
| |||
|
|
|
|
|
| (in MW) |
| |||||||||
Enel Generación Chile |
| Rapel |
| Reservoir |
|
| 377 |
|
|
| 377 |
|
|
| 377 |
|
|
| Cipreses |
| Reservoir |
|
| 106 |
|
|
| 106 |
|
|
| 106 |
|
|
| El Toro |
| Reservoir |
|
| 450 |
|
|
| 450 |
|
|
| 450 |
|
|
| Los Molles |
| Pass-through |
|
| 18 |
|
|
| 18 |
|
|
| 18 |
|
|
| Sauzal |
| Pass-through |
|
| 77 |
|
|
| 77 |
|
|
| 77 |
|
|
| Sauzalito |
| Pass-through |
|
| 12 |
|
|
| 12 |
|
|
| 12 |
|
|
| Isla |
| Pass-through |
|
| 70 |
|
|
| 70 |
|
|
| 70 |
|
|
| Antuco |
| Pass-through |
|
| 320 |
|
|
| 320 |
|
|
| 320 |
|
|
| Abanico |
| Pass-through |
|
| 136 |
|
|
| 136 |
|
|
| 136 |
|
|
| Ralco |
| Reservoir |
|
| 690 |
|
|
| 690 |
|
|
| 690 |
|
|
| Palmucho |
| Pass-through |
|
| 34 |
|
|
| 34 |
|
|
| 34 |
|
|
| Total hydroelectric |
|
|
|
| 2,290 |
|
|
| 2,290 |
|
|
| 2,290 |
|
|
| Bocamina |
| Steam Turbine/Coal |
|
| 478 |
|
|
| 478 |
|
|
| 478 |
|
|
| Diego de Almagro |
| Gas Turbine/ Diesel Oil |
|
| 24 |
|
|
| 24 |
|
|
| 24 |
|
|
| Huasco |
| Gas Turbine |
|
| 64 |
|
|
| 64 |
|
|
| 64 |
|
|
| Taltal |
| Gas Turbine/Natural Gas+Diesel Oil |
|
| 245 |
|
|
| 245 |
|
|
| 245 |
|
|
| San Isidro 2 |
| Combined Cycle /Natural Gas+Diesel Oil |
|
| 399 |
|
|
| 399 |
|
|
| 399 |
|
|
| Quintero |
| Gas Turbine/Natural Gas |
|
| 257 |
|
|
| 257 |
|
|
| 257 |
|
|
| Total thermal |
|
|
|
| 1,467 |
|
|
| 1,467 |
|
|
| 1,467 |
|
|
| Total |
|
|
|
| 3,757 |
|
|
| 3,757 |
|
|
| 3,757 |
|
Pehuenche |
| Pehuenche |
| Reservoir |
|
| 570 |
|
|
| 570 |
|
|
| 570 |
|
|
| Curillinque |
| Pass-through |
|
| 89 |
|
|
| 89 |
|
|
| 89 |
|
|
| Loma Alta |
| Pass-through |
|
| 40 |
|
|
| 40 |
|
|
| 40 |
|
|
| Total |
|
|
|
| 699 |
|
|
| 699 |
|
|
| 699 |
|
Celta(3) |
| Tarapacá |
| Steam Turbine/Coal |
|
| — |
|
|
| 158 |
|
|
| 158 |
|
|
| Tarapacá |
| Gas Turbine/Diesel Oil |
|
| — |
|
|
| 24 |
|
|
| 24 |
|
|
| San Isidro |
| Combined Cycle /Natural Gas+Diesel Oil |
|
| — |
|
|
| 379 |
|
|
| 379 |
|
|
| Pangue |
| Reservoir |
|
| — |
|
|
| 467 |
|
|
| 467 |
|
|
| Canela I |
| Wind Farm |
|
| — |
|
|
| 18 |
|
|
| 18 |
|
|
| Canela II |
| Wind Farm |
|
| — |
|
|
| 60 |
|
|
| 60 |
|
|
| Ojos de Agua |
| Pass-through |
|
| — |
|
|
| 9 |
|
|
| 9 |
|
|
| Total |
|
|
|
| — |
|
|
| 1,115 |
|
|
| 1,115 |
|
GasAtacama Chile(4) |
| Atacama |
| Combined Cycle /Natural Gas+Diesel Oil |
|
| 781 |
|
|
| 781 |
|
|
| 781 |
|
|
| Tarapacá |
| Steam Turbine/Coal |
|
| 158 |
|
|
| — |
|
|
| — |
|
|
| Tarapacá |
| Gas Turbine/Diesel Oil |
|
| 24 |
|
|
| — |
|
|
| — |
|
|
| San Isidro |
| Combined Cycle /Natural Gas+Diesel Oil |
|
| 379 |
|
|
| — |
|
|
| — |
|
|
| Pangue |
| Reservoir |
|
| 467 |
|
|
| — |
|
|
| — |
|
|
| Canela I |
| Wind Farm |
|
| 18 |
|
|
| — |
|
|
| — |
|
|
| Canela II |
| Wind Farm |
|
| 60 |
|
|
| — |
|
|
| — |
|
|
| Ojos de Agua |
| Pass-through |
|
| 9 |
|
|
| — |
|
|
| — |
|
|
|
|
| Total |
|
| 1,896 |
|
|
| 781 |
|
|
| 781 |
|
|
|
|
| Total Capacity |
|
| 6,351 |
|
|
| 6,351 |
|
|
| 6,351 |
|
|
|
|
|
|
| Installed Capacity(1) |
| ||||
Company |
| Power Plant Name |
| Power Plant Type(2) |
| 2018 (3) |
| 2017 |
| 2016 |
|
|
|
|
|
|
| (in MW) |
| ||||
Enel Generation |
| Rapel |
| Reservoir |
| 376 |
| 377 |
| 377 |
|
|
| Cipreses |
| Reservoir |
| 106 |
| 106 |
| 106 |
|
|
| El Toro |
| Reservoir |
| 449 |
| 450 |
| 450 |
|
|
| Los Molles |
| Run-of-the-river |
| 18 |
| 18 |
| 18 |
|
|
| Sauzal |
| Run-of-the-river |
| 77 |
| 77 |
| 77 |
|
|
| Sauzalito |
| Run-of-the-river |
| 12 |
| 12 |
| 12 |
|
|
| Isla |
| Run-of-the-river |
| 70 |
| 70 |
| 70 |
|
|
| Antuco |
| Run-of-the-river |
| 319 |
| 320 |
| 320 |
|
|
| Abanico |
| Run-of-the-river |
| 136 |
| 136 |
| 136 |
|
|
| Ralco |
| Reservoir |
| 689 |
| 690 |
| 690 |
|
|
| Palmucho |
| Run-of-the-river |
| 34 |
| 34 |
| 34 |
|
|
| Total hydroelectric |
|
|
| 2,284 |
| 2,290 |
| 2,290 |
|
|
| Bocamina |
| Steam Turbine/Coal |
| 478 |
| 478 |
| 478 |
|
|
| Diego de Almagro |
| Gas Turbine/ Diesel Oil |
| 24 |
| 24 |
| 24 |
|
|
| Huasco |
| Gas Turbine |
| 64 |
| 64 |
| 64 |
|
|
| Taltal |
| Gas Turbine/Natural Gas+Diesel Oil |
| 240 |
| 245 |
| 245 |
|
|
| San Isidro 2 |
| Combined Cycle /Natural Gas+Diesel Oil |
| 388 |
| 399 |
| 399 |
|
|
| Quintero |
| Gas Turbine/Natural Gas |
| 257 |
| 257 |
| 257 |
|
|
| Total thermal |
|
|
| 1,451 |
| 1,467 |
| 1,467 |
|
|
| Total |
|
|
| 3,735 |
| 3,757 |
| 3,757 |
|
Pehuenche |
| Pehuenche |
| Reservoir |
| 568 |
| 570 |
| 570 |
|
|
| Curillinque |
| Run-of-the-river |
| 89 |
| 89 |
| 89 |
|
|
| Loma Alta |
| Run-of-the-river |
| 40 |
| 40 |
| 40 |
|
|
| Total |
|
|
| 697 |
| 699 |
| 699 |
|
GasAtacama |
| Atacama |
| Combined Cycle /Natural Gas+Diesel Oil |
| 732 |
| 781 |
| 781 |
|
|
| Tarapacá |
| Steam Turbine/Coal |
| 158 |
| 158 |
| 158 |
|
|
| Tarapacá |
| Gas Turbine/Diesel Oil |
| 20 |
| 24 |
| 24 |
|
|
| San Isidro |
| Combined Cycle /Natural Gas+Diesel Oil |
| 379 |
| 379 |
| 379 |
|
|
| Pangue |
| Reservoir |
| 466 |
| 467 |
| 467 |
|
|
| Canela I |
| Wind Farm |
| 18 |
| 18 |
| 18 |
|
|
| Canela II |
| Wind Farm |
| 60 |
| 60 |
| 60 |
|
|
| Ojos de Agua |
| Run-of-the-river |
| 9 |
| 9 |
| 9 |
|
|
| Total |
|
|
| 1,842 |
| 1,896 |
| 1,896 |
|
Total capacity |
|
|
|
|
| 6,274 |
| 6,351 |
| 6,351 |
|
|
|
40(1) The installed capacity corresponds to the gross installed capacity, without considering the MW that each power plant consumes for its own operation.
|
|
|
|
Insurance
(3) The 2018 installed capacity differs from previous years since the CEN has reviewed the capacity of each generation unit and adjusted their capacity.
Insurance
Our electricity generation facilities are insured against damage due tocaused by natural disasters such as earthquakes, fires, floods, other acts of god (but not for droughts, which are not considered force majeure risks, and are not covered by insurance) and from damage due to third-party actions, based on the appraised value of the facilities as determined from time to time by an independent appraiser. Based on geological, hydrological and engineering studies, management believes that the risk of the previously described events resulting in a material adverse effect on our generation facilities is remote. Claims under our subsidiaries’ insurance policies are subject to customary deductibles and other conditions. We also maintain business interruption insurance providing coverage for the failure of any of our facilities for a period of up to 24 months, including the deductible period. Insurance policies include liability clauses, which protect our companies from claims made by third parties. The insurance coverage taken for our property is approved by each company’s management, taking into account the quality of the insurance companies and the needs, conditions and risk evaluations of each facility, and is based on general corporate guidelines. All insurance policies are purchased from reputable international insurers. We continuously monitor and meet with the insurance companies in order to obtain what we believe is the most commercially reasonable insurance coverage.
Project Investments
The total investment for each project described below was translated into Chilean pesos at the exchange rate of Ch$ 669.47 per U.S. dollar, the U.S. dollar Observed Exchange Rate as of December 31, 2016. Budgeted amounts include connecting lines that could be owned by third parties and paid as tolls, unless otherwise indicated.
Projects under Construction
Los Cóndores Hydroelectric Project
The Los Cóndores project is located in the Maule region, in the San Clemente area. It consists of a 150 MW run-of-the river hydroelectric power plant, with two Pelton water turbine vertical units, which will use water from the Maule Lagoon reservoir through a 12 km penstock. The power plant will be connected to the SIC at the Ancoa substation (220 kV) through an 87 km transmission line and will consist of two power units.
The basic engineering and the Environmental Impact Statement (“DIA” in its Spanish acronym) of the Los Cóndores optimized project were concluded in early 2011. The Environmental Qualifications Resolution (“RCA” in its Spanish acronym) for the power plant was obtained in November 2011 and the RCA of the transmission line project was granted in May 2012. In November 2014, the General Water Authority approved the waterworks permit.
By the end of 2016, we entered into easement agreements for 93.2% of the total structures required for connecting the project to the SIC. In addition, the process for obtaining the definitive concession for electricity, which relates to the authorization of a legal easement by the competent authority for access to carry out works of generation, transmission or distribution of energy, is progressing in case it needs to be applied in situations or locations where a voluntary easement agreement has not been reached.
The main developments in 2016 were:
In March 2016, the raise borer machine started the first stage of excavation on vertical shaft.
In May 2016, we started the excavation of the headrace tunnel downstream from the intake area.
In June 2016, we received the distributor and lining of Unit 1.
In July 2016, we started the construction of Unit 1, with the placement of the lining and distributor.
In September 2016, we started the construction of the structures for the transmission line.
41
|
|
Since November 2016, the overhead construction crane has been in operation.
Construction is expected to be completed by the end of 2018. This project is being financed primarily with internally generated funds. The estimated total investment is Ch$ 407,928 million, of which Ch$ 172,479 million was accrued as of December 31, 2016.
Bocamina Optimization Project
Bocamina is a coal-fired power plant, located in Coronel in the Bío region in southern Chile composed of two units: 128 MW (Bocamina I) and 350 MW (Bocamina II). Bocamina II started its commercial operations in July 2013 but suspended operations in December 2013 due to environmental injunctions. We submitted several documents, studies and mitigation plans to the authorities, and in December 2013, we presented a new EIA regarding the technical optimization of the plant, which was approved on March 16, 2015. On April 2, 2015, the Chilean Court approved the new RCA and after complying with the conditions established in the new RCA, the plant resumed operations in July 2015.
The scope of work of the optimization plan is as follows: (i) installation of Johnson filters in both units; (ii) installation of domes for the north and south coal fields; (iii) improvement of the ash dump in operation; (iv) studies of a new ash dump, and (v) construction of a water treatment plant.
The main developments in 2016 were:
In January 2016, the installation of the Johnson filter for Bocamina II was completed.
|
|
In June 2016, completion of the improvements to zone 3 of the current dump and in July 2016 to zone 2 of the current dump.
In December 2016, the construction of the dome for the north coal field was completed.
On January 27, 2017, the Municipal Works Department of Coronel granted the construction permit for the dome for the south coal field.
Construction is expected to be completed in 2018. This project is being financed with internally generated funds. The estimated total investment is Ch$ 62,644 million, of which Ch$ 42,483 million was accrued as of December 31, 2016.
Tarapacá Environmental Retro-fitting Project
Tarapacá is a 158 MW coal-fired power plant of located in the Tarapacá region in northern Chile, with an annual average generation of 1,100 GWh supplied to the SING.
Decree 13/2011 regulates the emissions of thermal power plants, and requires the reduction of SO2 and NOx emissions effective as of June 23, 2016. In order to comply with this decree, we are improving Tarapacá through the installation of a desulfurizers and implementation of measures to reduce emissions of NOx.
The project is in the final stage of commissioning, pending the termination of some tests since the power plant was limited to generating no more than 70 MW of power due to the unavailability of water supply pumps.
The scope of work of the project is as follows: (i) execution of preliminary works and activities (elimination of the electrostatic precipitator, demolition of its foundations, and demolition and construction of a new electromechanical workshop); (ii) construction and commissioning of desulfurizers; (iii) change and installation of low NOx burners, improvement in the coal mills and installation of an Over-Fire Air system, a system that also will reduce NOx emissions; (iv) construction and start-up of lime storage silos; (v) construction and commissioning of a seawater desalination system, and (vi) modification of the ash discharge site to improve the handling and disposal of waste resulting from the desulfurization process.
The main developments in 2016 were:
In June 2016, the desalination plant started operations and the ash handling system and the electrical system were delivered for the operation of the power plant.
42
|
|
In November 2016, the performance test of the desalination plant was completed, with positive results.
In December 2016, the CDEC reported that the unit was commercially operable.
Commissioning is expected to be completed within the first half of 2017. This project is being financed with internally generated funds. The estimated total investment is Ch$ 68,350 million, of which Ch$ 65,718 million was accrued as of December 31, 2016.
Projects Under Development
We are continuously analyze different growthanalyzing potential opportunities in Chile. Wefor growth. The study and assessprofitability assessment of our project portfolio focusing recently on constructingis an ongoing effort. Industry technology is allowing for smaller, less environmentally invasivedamaging power plants. These plants are constructed faster,can be built quicker, allow greater flexibility to activate or deactivate according to system needs, and are generally more acceptable to area residents. An additional focus will be placed onpreferred by the development ofcommunity. We are favoring renewable energy technologies. In the thermal generation business, wetechnology for our new power plant investments. We seek new opportunities, either by building new greenfield projects or by modernizing existing brownfield assets and improving (operationally and / and/or environmentally) in the performance of such assets.performance. The expected start-up for each project is assessed and is defined based on the commercial opportunities and our financing capacity to fund these projects. TheAll of our projects are financed with internally generated funds. Below we list our most important projects under development; however, any decision related to construction will depend on commercial opportunities foreseen in the upcoming years, including future tenders for supplying the regulated market, and the evolution of the regulatory framework (mainly associated with ancillary services).
Budgeted amounts include connecting lines that could be owned by third parties and paid as tolls, unless otherwise indicated.
1.Generation Business Projects
A.Projects completed during 2018
Bocamina Optimization Project
Bocamina is a 478 MW coal-fired power plant located in Coronel in the Bíobío Region in southern Chile, which consists of two units, Bocamina I (128 MW) and Bocamina II (350 MW). Bocamina II started commercial operations in July 2013 but suspended its operations in December 2013 due to environmental injunctions. A new Environmental Impact Statement was approved in March 2015 and included a new technical optimization plan. On April 2, 2015, the Chilean Court approved the new RCA, and the plant resumed operations in July 2015, after complying with all requested conditions established in the new RCA.
The technical optimization plan involves the following: (i) installation of Johnson filters for seawater intake in both units; (ii) installation of domes over the north and south coalfields; (iii) improvement of the ash dump in operation; and (iv) construction of a water treatment plant. After we finished the dome over the north coalfield, we proceeded to the construction and completion of the south dome in June 2018, achieving a storage capacity of 270,000 tons of coal.
The latest progress includes:
· On June 15, 2018, we delivered to Major Contractor the Provisional Acceptance Certificate of South Dome.
· On October 17, 2018, we received from Municipality the certificate of definitive reception of the building works for the south dome.
The estimated total investment is Ch$ 62,103 million, of which Ch$ 61,357 million was incurred as of December 31, 2018.
B.Projects under Construction
B.1 Enel Generation
Los Cóndores Hydroelectric Project
The Los Cóndores project is located in the Maule Region, in the San Clemente area. It consists of a 150 MW run-of-the-river hydroelectric power plant, with two Pelton vertical water turbine units, which will use water from the Maule Lagoon reservoir through a pressure tunnel. The power plant will be connected to the SEN at the Ancoa substation (220 kV) through an 87 km transmission line.
On September 14, 2018, our Board of Directors approved an updated construction plan, with a total project investment of US$ 957.3 million, excluding contingencies. The construction activities will continue until 2020. After that, the power plant commissioning phase will follow as well as commercial operations.
As of December 31, 2018, 65.6% of the project was completed and 86.8% of the transmission lines were completed and assembled, according to the last approved construction plan. We expect that the estimated total investment will be Ch$ 665,986 million, of which Ch$ 419,022 million was incurred as of December 31, 2018. This project is being financed primarily with internally generated funds.
Sauzal Repowering
The Sauzal Repowering project is to be implemented within the Sauzal power plant, located in the Libertador General Bernando O’Higgins Region of central Chile. The power plant uses the water of the Cachapoal and Claro Rivers and is a run-of-the-river hydroelectric power plant with three Francis vertical units.
The project involves replacing two turbines with a target efficiency rate of 95%, obtaining up to 3MW of new capacity and 13.7 GWh per year. The contract was signed in July 2018 with Voith. During 2018, detailed engineering was carried out and the manufacturing of the runner parts, shaft and seals of the first unit commenced, with an overall progress of 37% as of December 2018.
The estimated total investment is US$ 10.5 million, of which US$ 2 million has been incurred as of December 31, 2018. This project is being financed primarily with internally generated funds.
Bocamina closure plan of the landfill
The project considers the application of the best practices for closure of similar ash dumpsite facilities. In a first stage, there will be infrastructure and operation improvements in two sectors. We expect to satisfy the environmental standard established in the Environmental Impact Assessment approved in March 2015.
The project is composed of two stages:
· Stage 1: Closure works of sectors one and two and a lateral one (the total area is around 48,000 m2), which we expect to complete during the second quarter of 2020.
· Stage 2: Closure works for the remaining sector 3 at the end of the life of the power plant. This second stage does not have a commissioning date defined since it depends on several factors such as the operation of the plant and the sale of ashes.
Currently, the basic design is completed and the bidding process of major works is ongoing.
We estimate a total investment of Ch$ 6,555 million, of which Ch$ 1,668 million was incurred as of December 31, 2018.
C.Projects Under Development
We are currently evaluating the development areof the following projects, which we classify as follows:“under development”. We will finally decide whether to proceed or not with each project depending on the commercial and other opportunities foreseen in upcoming years, and in particular, future tender prices for supplying the energy requirements of the regulated market and/or negotiations with existing or new unregulated customers.
C.1 Enel Generation
Vallecito Hydroelectric Project
The Vallecito hydroelectric project is located in the Maule region,Region, in the upper part of the Maule riverRiver basin. It consists of a run-of-the-river hydroelectric plant with an installed capacity of 7055 MW. TheWe expect to deliver energy produced is expected to be delivered to the SICSEN through the transmission line of the Los Cóndores hydroelectric plant, which iswe are also currently under constructionbuilding (see above).
The
We have developed the Vallecito project has been developedbased on the basis of a sustainable development plan which consiststhat requires the development of defining activities to be developed in the technical-economic, environmental and hydroelectric social scope of the project.activities. We have established lines of action by localitycommunity-specific actions to be carried out with nine communities of the Pehuenche Route in order to incorporate their aspirations, capacitiessocial stakeholder considerations, capacity and projects.local projects in the hydro project development plan.
During 2016, the technical feasibility studies of the project were carried out2017, we developed complete basic design and a series of field studiesenvironmental base line campaigns (drilling, paving, geophysical prospecting, etc.) were culminated. We also started the environmental baseline campaigns, as well as the implementation ofand implemented a sustainable development plan. plan after several meetings with local communities aimed to jointly design the best-shared use for the hydro project and to obtain agreements with local communities that will be integrated in the Environmental Impact Study (“EIA” in its Spanish acronym).
The next steps are to complete the technical designsfinalize and the environmental baseline studies, prepare the EIA and initiatethat will include collaborative processesagreements with the communities that are directly related to the project. The Vallecito project is part of our renewable energy projects.
Based on current market conditions and future commercial options, we expectwill eventually decide whether to continue to undertake the development of this project. The current plan contemplates commencing construction to start during 2020 and commissioning is expectedto take place in 2023. This project is being financed primarily with internally generated funds. The estimatedWe estimate a total investment isof Ch$ 129,542127,357 million, of which Ch$ 6,8699,159.6 million was accruedincurred as of December 31, 2016.2018.
Smart Repowering Projects
Within the context of projects under development, we are analyzing the following three Smart Repowering projects to increase the installed capacity or electricity generation, or both, of power plants already in operations by upgrading some components or improving the hydraulic potential of the plant, or both.
Antuco Repowering
The Antuco Repowering project is to be implemented within the Antuco operating power plant, located in Biobío Region in southern Chile. The project involves replacing one turbine installed in 1981 with an 88% load factor, with a new turbine with a target efficiency rate of 94%, obtaining 21 GWh of new energy. We estimate total investments of US$ 14.5 million, none of which has been incurred as of December 31, 2018, and we expect to begin operations in the second half of 2020.
Quintero Combined-Cycle Project
The Quintero project is located in the Valparaíso regionRegion and consists of an energy efficiency project that takes advantage of the heat of the gases emitted by the existing turbines to produce steam. This is accomplishedsteam through the installation of a steam turbine and a generator, which allows converting the existing open cycle plant into a combined-cycle gas plant. Currently, the Quintero plant has two gas turbines with a total capacity of 257 MW. With the addition of a steam turbine unit of 130 MW capacity, the Quintero plant would reach a total capacity of 387 MW. TheWe would deliver the produced energy produced would be delivered to the SICSEN through the existing Quintero-San Luis line, a simple 220 kV circuit built to evacuate the energy of the combined-cycle power plant.
During 2016, technical feasibility studies
In 2017, we started the preparation of the environmental impact study and the implementation of the sustainability plan. However, during August 2018, the Quintero and Puchuncaví areas suffered an environmental crisis leaving more than 300 people suffering the toxic effects allegedly associated with gas emissions of other industries. As a result, the project was indefinitely postponed and the environmental baseline campaigns were carried out and the sustainable development plan was implemented.impact study has been suspended.
We expect construction to start during 2019 and commissioning is expected in 2022, based on current market conditions. This project is being financed primarily with internally generated funds.
The estimated total investment for the project is Ch$ 147,685150,651 million, of which Ch$ 2,4742,858 million was accruedincurred as of December 31, 2016.2018.
Ttanti Combined-Cycle Project
The Ttanti project is located in the Antofagasta region,Region, on land adjacent to the existing Atacama power plant that is located in the industrial zone of the city of Mejillones. The project consists of the construction of a natural gas combined-cycle power plant with an
43
aggregate installed capacity of 1,290 MW (430 MW for each of the three units), and one unit would be able to use diesel oil as a backup in case of scarcitya shortage of natural gas for one unit with 430 MW of capacity.gas. The power plant would be connectedconnect to the SINGSEN through a 0.5 km 220 kV double circuit transmission line to the Atacama substation, which would be expanded for this purpose.
Currently,
The environmental permit, requested through an Environmental Impact Assessment, was approved in December 2017 by the Environmental Evaluation Service (“SEA” in its Spanish acronym) of the Antofagasta Region. Any decision related to the construction of the project iswill depend primarily on the commercial opportunities foreseen in the environment assessment phase. On December 22, 2015, we registered Addendum 1, which responded to the inquiries carried out by the SEA. On February 4, 2016, the SEA issued ICSARA 2, which contains new inquiries and clarification requests for the project. We submitted our response on March 14, 2017.upcoming years (prices in future tenders and/or negotiations with unregulated customers, among other factors).
We expect to receive the RCA during the second quarter of 2017. If the RCA is favorable and we have successful participation in energy auctions, we expect construction to start during 2021 and completion in 2024.
The estimated total investment offor the first unit is Ch$ 234,984251,078 million, of which Ch$ 1,1851,319 million was accruedincurred as of December 31, 2016.2018.
Taltal Combined-Cycle Project
The Taltal project consists of the construction of a steam turbine for converting the existing Taltal gas-fired open cycle plant to a combined-cycle plant by adding a turbine in the vapor phase, which would use the steam generated by the gas turbines’ heat emissions to produce energy, which will considerably improve its efficiency. The Taltal power plant is located in the Antofagasta region.Region. Currently, the existing Taltal power plant has two gas turbines ofwith 120 MW installed capacity each. The extra power to be added by the steam turbine would beadd 130 MW and therefore, the Taltal power plant would achievereach a total capacity of 370 MW. TheWe will supply the produced energy produced will be supplied to the SICSEN through the existing 220 kV double circuit Diego de Almagro –— Paposo transmission line.
In
The environmental permit, requested through an Environmental Impact Statement submitted in December 2013, a DIA was submittedapproved in January 2017. Any decision related to the SEA for approval, in order to optimizeconstruction of the project. The main modification relates to a changeproject will depend primarily on the commercial opportunities foreseen in the cooling system, which was originally designed as a wet system (using sea water) and is being modified to a dry cooling system (using air condensers). During the second quarter of 2015, Addendum 2 was submitted which responded to the second round of observations formulated by the SEA. During the third quarter of 2015, the SEA formulated its third round of observations and we responded at the end of 2016. We postponed the response so as to improve our dialog and workupcoming years (prices in partnershipfuture tenders and/or negotiations with the local community (Paposo)unregulated customers, among others). After the submission of additional requirements requested by the authority, the DIA was approved on January 19, 2017.
Based on current market conditions, we expect construction to start during 2020 and commissioning for 2022. This project is being financed primarily with internally generated funds.
The estimated total investment is Ch$ 132,555136,998 million, of which Ch$ 2,9422,873 million was accruedincurred as of December 31, 2016.2018.
Neltume Hydroelectric Project
Taltal Battery Energy Storage System
The Neltume project is expectedconsists of the installation of a battery energy storage system (BESS) in the Taltal power plant to be locatedprovide ancillary services in Los Ríos region,upcoming years.
The project would reach an installed capacity of 12 MW and 12 MWh of energy storage, connected to the 15 kV bar of one of the existing 120 MW turbines installed in the Taltal power plant.
In May 2018, the Antofagasta Region SEA issued the resolution waiving the obligation to submit the project to environmental assessment before its construction. Any decision related to the construction of the project will depend primarily on the upper partcommercial opportunities foreseen in the upcoming years and, particularly, on the evolution of the Valdivia River basin. regulatory framework for the provision and remuneration of the ancillary services, currently under elaboration by the authority.
The futureestimated total investment is Ch$ 8,119 million, of thiswhich Ch$ 15.1 million was incurred as of December 31, 2018.
Tarapacá Battery Energy Storage System
The project is uncertain. If completed, it would consistconsists of the installation of a 490BESS in the Tarapacá power plant to provide ancillary services in upcoming years. The BESS has about 14 MW of installed capacity run-of-the-river hydro power plant. It wouldand 14 MWh of energy storage, and will be connected to the SIC through a 42 kilometer 22011.5 kV transmission line from Neltume to Pullinque.bar of the existing 23 MW turbine installed in the Tarapacá power plant.
In December 2017, the fourth quarterSEA of 2016, we recorded an impairment loss of Ch$ 20.5 billionthe Tarapacá Region issued the resolution waiving the obligation to submit the project to environmental assessment before its construction. Any decision related to the Neltume project due to the fact that under current electricity market conditions, the project’s profitability is less than the capitalized investment. In addition, considering our new focus on investing in more manageable projects with shorter construction periods and shorter paybacks,of the project will need to be redesigned in order to be economically and technically feasible.
Our indigenous community inquiry process, which was completed atdepend on the end of 2015, revealed that there were some significant social and environmental controversiescommercial opportunities foreseen in the land associated withupcoming years and particularly on the Neltume project. Therefore,evolution of the original 2010 EIA was likely to be rejected givenregulatory framework for the official announcementsprovision and remuneration of various publicthe ancillary services, issued in late 2015 as well as several meetings withcurrently under elaboration by the authorities and the concerns of residents living near Lake Neltume. We decided to study new design alternatives in order to redesign the discharge to the lake. As a consequence of this decision, we recorded a write-off of Ch$ 2.7 billion in the fourth quarter of fiscal year 2015, associated with some assets related to the 2010 EIA, which was withdrawn on December 29, 2015, and other studies directly related to the original design.authority.
The project does not have any defined dates for the beginningestimated total investment is Ch$ 9,427 million, of construction and commercial start-up. To date, Neltume has been financed primarily with internally generated funds. The accrued investmentwhich Ch$ 80.5 million was incurred as of December 31, 2016 was Ch$ 20,356 million, including the impairment loss and write-off mentioned above.2018.
44
Piruquina Hydroelectric Project
The Piruquina hydroelectric project is expected to be located in Los Lagos region, on Chiloé Island, and would use water from the Carihueico River. The future of this project is uncertain. If completed, it would consist of an 8 MW installed capacity mini hydroelectric power plant and would be connected to the SIC at the Pid-Pid substation, through a 6 kilometer 23 kV transmission line.
This project has all the engineering studies and principal permits required, as well as the favorable RCA issued on November 10, 2009 and the Hydraulic Work Permit granted on August 6, 2014 that approves and authorizes the construction of hydraulic works for the power plant.
However, we have placed Piruquina on hold mainly due to the drop in energy prices in the market. This project has been financed primarily with internally generated funds. The accrued investment as of December 31, 2016 was Ch$ 2,823 million.
Major Encumbrances
As of December 31, 2016,2018, we have full ownership of our assets and they are not subject to material encumbrances.
Climate Change
In recent years, Chile and the region have seen an increase of developments related to NCRE and strategies to combat climate change. This has required both the public and private sectors to adopt strategies in order to comply with the new environmental requirements, as evidenced by legal obligations at the local level, commitments assumed by countries at the international level, and the demanding requirements of the international markets.
NCRE plants provide energy with minimal environmental impact and without CO2 emissions. They are therefore considered technological options that strengthen sustainable energy development as they supplement the production of traditional generators.
Enel, our ultimate controlling shareholder, announced in October 2015 that it will no longer build coal power plants because it considers the technology to be counterproductive to its goal of being carbon neutral by 2050. Closures of existing coal power plants are scheduled at the end of their life cycles. The lost capacity will be substituted with more environmentally friendly types of generation, focusing on NCRE. This announcement is aligned with the Energy Agenda that the Chilean government released in May 2014. Among its objectives are facilitating the incorporation of NCRE sources and promoting the efficient use of energy.
Our NCRE facilities are: (i) Canela I wind farm with 18 MW of installed capacity and 11 self-generators, which has been in operation since 2007, (ii) Canela II wind farm with 60 MW of installed capacity and 40 self-generators, which has been in operation since 2009, and (iii) Ojos de Agua pass-through mini-hydro power plant with 9 MW of installed capacity, which has been in operation since 2008. In addition, we are constructing Los Cóndores project (see above), a run-of-the river hydroelectric power plant, which will displace thermal units in the SIC, and we are improving the efficiency of some of our power plants.
Item 4A.UnresolvedUnresolved Staff Comments
None.
Item 5.OperatingOperating and Financial Review and Prospects
|
|
A. Operating Results.
General
The following discussion should be read in conjunction with our audited consolidated financial statements and the notes thereto, included in Item 18 in this Report, and “Selected Financial Data,” included in Item 3 herein. Our consolidated financial statements as of December 31, 20162018, and 20152017 and for each of the years in the three-year period ended December 31, 2016,2018, have been prepared in accordance with IFRS, as issued by the IASB.
1. Discussion of Main Factors Affecting Operating Results and Financial Condition of the Company |
|
We own and operate electricity generation plants in Chile. Our consolidated revenues, income and cash flows primarily come from our core business, electricity generation. In 2016 and 2015, all of our consolidated revenues came from the generation business, while in 2014, 99.2% of our consolidated revenues came from the generation business.
Factors such as (i) hydrological conditions, (ii) fuel prices, (iii) regulatory developments, (iv) exceptional actions adopted by governmental authorities and (v) changes in economic conditions may materially affect our financial results. In addition, our results
45
from operations and financial condition are affected by variations in the exchange rate between the Chilean peso and the U.S. dollar. We have certain critical accounting policies that affect our consolidated operating results. The impact of these factors on us, for the years covered by this Report, is discussed below.
a. Hydrological Conditions |
|
A substantial part of our generation capacity is hydroelectric and depends on the prevailing hydrological conditions. Our installed capacity as of December 31, 2018, 2017 and 2016 2015was 6,274 MW, 6,351 MW and 2014 was 6,351 MW, of which 54.6%55% was hydroelectric for the three years. See “Item 4. Information on the Company — D. Property, Plant and Equipment.”
Hydroelectric generation was 10,974 GWh, 9,652 GWh and 9,078 GWh 11,842 GWhin 2018, 2017 and 11,561 GWh in 2016, 2015 and 2014, respectively. Our 20162018 hydroelectric generation was lowergreater than 20152017, showing similar path of what occurred in 2017 and 2016. The increase was mainly due to slightly drierthe slight increase in total fluvial energy and rainfalls. Although there was little rain, hydrological conditions. In addition,conditions were more humid and intense, especially during the last quarter of 2017. Additionally, some important reservoirs are stillhave been at low levels since 2010 due to several years of drought, since 2010, characterized by low rainfalls and a poor snowmelt.
Hydrological conditions in Chile can range from very wet, as a result of several years of abundant rainfall and lakes at their peak capacity, to extremely dry, as a consequence of prolonged droughts lasting for several years, the partial or material depletion of water reservoirs and the significant reduction of snow and ice in the mountains, which in turn leads to materially lower levels of hydrologyavailable water as a consequence of lower melts. In between these two extremes, there is a wide range of possible hydrological conditions.conditions and their final effect on us may depend on the accumulated hydrology. For instance, a new year with drought conditions has less of drought has very different impactsan impact on our business, depending on whetherus if it follows several years of drought or a periodperiods of abundant rainfall. On the other hand,rainfall instead of exacerbating a prolonged drought. Likewise, a good hydrological year has less marginal impact if it comes after several wet years than after a prolonged drought. In Chile, the monthsperiod of the year that typically havehas the most precipitation areis from May through August, and the months whenperiod in which snow and ice melts typically arein the mountains melt more is during the warmer months, from October through March, providing water flow to our lakes, reservoirs and rivers, which supply our hydroelectric plants, most of them concentratedlocated in southern Chile. For purposes of discussing the impact of hydrological conditions on our business, we generally categorize our hydrological conditions as either dry wet or normal,wet, although there are manyseveral other possibleintermediate scenarios. Extreme hydrological conditions materially affect our operating results and financial conditions.condition. However, it is difficult to indicate the effects of hydrology on our operating income, without concurrently taking into accountconsidering other factors, because our operating income can only be explained by looking at a combination of factors and not each one on a stand-alone basis.
Hydrological conditions affect electricity market prices, generation costs, spot prices, tariffs and the mix of hydroelectric, thermal and NCRE generation, which is constantly being defineddetermined by the CDECCEN to minimize the operating costcosts of the entire system. Pass-throughAccording to the current regulatory framework, the price at which energy is traded on the spot market (known as spot price) is determined by the marginal cost of the system. The marginal cost is the cost of the most expensive power plant in operation given an efficiency-based dispatch. Regulation also considers capacity payments to generators, which remunerates each power plant’s installed capacity according to its availability and contribution to the system’ safety. This capacity payment is determined by the regulator every six months. Run of the river hydroelectric and NCRE generation isare almost always the least expensive method to generate electricitygeneration technology and normally hashave a marginal cost close to zero. InWater from reservoirs used to generate electricity, on the case of reservoirs, Chilean authorities assign aother hand, is assigned an opportunity cost for the use of water, which may lead to hydroelectric generation not necessarily being the lowest marginal cost. This is the case of Laja Lake, which is used asusing water from reservoirs having a reference for the SIC.significant cost in extended drought conditions. The cost of thermal generation does not depend on hydrological conditions but instead on international commodity prices for LNG, coal, diesel and fuel oil.Solar and wind sources are currently the NCRE technologies most widely used. NCRE facilities are able to dispatch energy to the system at very low marginal costs, but they depend on the blowing of the wind or the shining of the sun.
Spot prices primarily depend on hydrological conditions and commodity prices.prices and, to a lesser extent, on NCRE availability. Under most circumstances, abundant hydrological conditions lower spot prices while dry conditions normally increase spot prices. Spot market prices affect our results sincebecause we must purchase electricity in the spot market in the case that we have deficits betweenwhen our contracted energy sales andare greater than our generation, and we sell electricity in the spot market ifwhen we have electricity surpluses.
There are many other factors that may affect our operating income, including the level of contracted sales, purchases/purchases and sales in the spot electricity market, commodity prices, energy demand and supply, technical and unforeseen problems that can affect the availability of our thermal plants, plant locations in relation to urban demand centers, and transmission system conditions, among others.
To illustrate the effects of hydrology on our operating results, the following table describes certain hydrological conditions, their expected effects on spot prices and generation, and the expected impact on our operating income, assuming that other factors remain
unchanged. In all cases, hydrological conditions do not have an isolated effect but need to be evaluated in conjunctionalong with other factors to better understand the impact on our operating results.
46
| Expected effects on spot prices
| Expected impact on our operating results | ||
Dry |
| Higher spot prices | Positive: if our generation is higher than our contracted energy sales, energy surpluses are sold in the spot market at
| |
|
|
|
| |
| Reduced hydro generation | Negative: less energy available to sell in the spot market. | ||
| ||||
Increased thermal generation |
| Positive: increases our energy available for sale and either reduces purchases in the spot market or increases sales in the spot market at | ||
| ||||
Wet |
| Lower spot prices | Positive: if our generation is | |
| ||||
| Increased hydroelectric generation |
| Positive: more energy available to sell in the spot market | |
| ||||
| Reduced thermal generation | Negative: less energy available to sell in the spot market. |
If factors other than those described above apply, the expected impact of hydrological conditions on operating results will be different thanfrom those shown above. For example,instance, in a dry year with lower commodity prices, spot prices may decrease, or in a wet year if the demand grows,increases, or generation plants are not available for technical or other reasons, the spot price may increase, altering the impact of hydrological conditions discussed in the table above.
In the last few years, hydrological conditions in Chile have been below the historical average.
|
|
The regulatory framework governing our business has a material effect on our operating results. In particular, regulators set not only energy prices, taking into consideration factors such as fuel costs, reservoir levels, exchange rates, future investments in installed capacity and demand growth, but also technical standards based on environmental, health and social considerations, among others.
For additional information relating to the regulatory framework, see “Item 4. Information on the Company — B. Business Overview — Electricity Industry Regulatory Framework.”b. Economic Conditions
|
|
Macroeconomic conditions, such as changes in employment levels and inflation or deflation may have a significant effect on our operating results. Macroeconomic factors, such as the variation of the Chilean peso against the U.S. dollar may impact our operating results, as well as our assets and liabilities, depending on the amounts denominated in U.S. dollars. For example, a devaluation of the Chilean peso against the U.S. dollar increases the cost of capital expenditure plans.plans depending on the level at which our revenues are denominated in Chilean pesos. For additional information, see “Item 3. Key Information — D. Risk Factors — Foreign exchange risks may adversely affect our results and the U.S. dollar value of dividends payable to ADS holders” and “Item 3. Key Information — D. Risk Factors — Chilean economic fluctuations as well as, certain economic interventionist measures by governmental authorities as well as political events or financial or other crises in any region worldwide may affect our results of operations and, financial condition and liquidity as well as the value of our securities.”
47
Variations in the parity of the U.S. dollar and the Chilean peso may have an impact on our operating results and overall financial position. The impact will depend on the level at which tariffs are pegged to the U.S. dollar, costs for purchases of energy and fuels in the international markets, costs or revenues from buying and selling in the spot market and U.S. dollar-denominated assets and liabilities.
The following table sets forth the closing and average Chilean pesos per U.S. dollar exchange rates for the years indicated:
|
| Local Currency U.S. Dollar Exchange Rates |
| |||||||||||||||||||
|
| 2016 |
| 2015 |
|
| 2014 |
| ||||||||||||||
|
| Average |
|
| Year End |
| Average |
|
| Year End |
|
| Average |
|
| Year End |
| |||||
Chilean pesos per U.S. dollar |
|
| 676.67 |
|
| 669.47 |
|
| 654.66 |
|
|
| 710.16 |
|
|
| 570.40 |
|
|
| 606.75 |
|
|
| Local Currency U.S. Dollar Exchange Rates |
| ||||||||||
|
| 2018 |
| 2017 |
| 2016 |
| ||||||
|
| Average |
| Year End |
| Average |
| Year End |
| Average |
| Year End |
|
Chilean pesos per U.S. dollar |
| 640.95 |
| 694.77 |
| 649.11 |
| 614.75 |
| 676.67 |
| 669.47 |
|
Source: Central Bank of Chile
c. Critical Accounting Policies |
|
Critical accounting policies are defined as those that reflect significant judgments and uncertainties whichthat would potentially result in materially different results under different assumptions and conditions. We believe that our most critical accounting policies with reference to the preparation of our consolidated financial statements under IFRS are those described below.
For further detail of the accounting policies and the methods used in the preparation of the consolidated financial statements, see Notes 2 and 3 of the Notes to our consolidated financial statements.
Impairment of Long-Lived Assets
During the year,
From time to time, and principally at the end of any year, end, we evaluate whether there is any indication that an asset has been impaired. Should any such indication exist, we estimate the recoverable amount of that asset to determine, where appropriate, the amount of impairment. In the case of identifiable assets that do not generate cash flows independently, we estimate the recoverability of the cash generating unit to which the asset belongs, which is understood to be the smallest identifiable group of assets that generates independent cash inflows.
Notwithstanding the preceding paragraph, in the case of cash generating units to which goodwill or intangible assets with an indefinite useful life have been allocated, a recoverability analysis is performed routinely at each period end.
The recoverable amount is the greater of (i) the fair value less the cost needed to sell and (ii) the value in use, which is defined as the present value of the estimated future cash flows. In order to calculate the recoverable value of property, plant and equipment, goodwill and intangible assets that form part of a cash generating unit, we use value in use criteria in nearly all cases.
To estimate the value in use, we prepare future pre-tax cash flow projections based on the most recent budgets available. These budgets incorporate management’s best estimates of cash generating units, revenues and costs using sector projections, past experience and future expectations.
In general, these projections cover the next five years, with estimates ofestimating cash flows for future years based onand applying a reasonable growth rate of 4.6% for 2016 and 4.5% for each of 2015 and 2014, and a unique growth rate applied for the entire forecasted period that is alsorates, which in line withno case are increasing nor exceed the average long-term growth rates for the Chilean electricity sector. At the end of December 2018, projected cash flows were extrapolated using an annual growth rate of 3.1%.
These future cash flows are discounted at a given pre-tax rate in order to calculate their present value. This rate reflects the cost of capital of the business in Chile. The discount rate is calculated taking into account the current time value of money and the risk premiums generally used by market participants for the specific business activity.
The pre-tax nominal discount rates applied in 2016, 20152018, 2017 and 20142016 are as follows:
|
|
|
| Year ended December 31, |
| |||||||||||||
|
|
|
| 2016 |
| 2015 |
| 2014 |
| |||||||||
Country |
| Currency |
| Minimum |
| Maximum |
| Minimum |
| Maximum |
| Minimum |
|
| Maximum |
| ||
Chile |
| Chilean peso |
| 12.2% |
| 12.7% |
|
| 9.6% |
|
|
| 13.0% |
| ||||
|
|
|
| Year ended December 31, |
| ||||
|
|
|
| 2018 |
| 2017 |
| 2016 |
|
Chile |
|
|
| 10.6 | % | 10.7 | % | 12.2 | % |
48
If the recoverable amount is less than the net carrying amount of the cash cash–generating unit, the corresponding impairment loss provision is recognized for the difference, and charged to “Reversal of impairment loss (impairment loss) recognized in profit or loss” in the consolidated statement of comprehensive income.
Impairment losses recognized for an asset other than goodwill in prior periods are reversed when its estimated recoverable amount changes, increasing the asset’s value with a credit to earnings, limited to the asset’s carrying amount if no adjustment had occurred. Impairment adjustments to goodwill are not reversible.
Litigation and Contingencies
We are currently involved in certain legal and tax proceedings. As discussed in Note 2223 of the Notes to our consolidated financial statements as of December 31, 2016,2018, we recognized provisions for legal and tax proceedings in an aggregate amount of Ch$ 4.73.9 billion as of December 31, 2016.2018. This amount was based on consultations with our legal and tax advisors, who are carrying out our defense in these matters and an analysis of potential results, assuming a combination of litigation and settlement strategies.
Hedge Cash Revenues Directly Linked to the U.S. Dollar
We have established a policy to hedge the portion of our revenues directly linked to the U.S. dollar by obtaining financing in U.S. dollars. Exchange differences related to this debt, as they are cash flow hedge transactions, are charged net of taxes to an equity reserve account that forms part of Other“Other Comprehensive IncomeIncome” and recorded as income during the period in which the hedged cash flows are realized. This term has been estimated at ten years.
This policy reflects a detailed analysis of our future revenues directly linked to the U.S. dollar, revenue streams.with the purpose of confirming that hedge accounting is applicable. Such analysis may change in the future due to new electricity regulations limiting the amount of cash flows tied to the U.S. dollar.
Pension and Post-Employment Benefit Liabilities
We have various defined benefit plans for our employees. These plans pay benefits to employees at retirement and use formulas based on years of service and employee compensations. We also offer certain additional benefits for some retired employees in particular.
The liabilities shown for the pensions and post-employment benefits reflect our best estimate of the future cost of meeting our obligations under these plans. The accounting applied to these defined benefit plans involves actuarial calculations which contain key assumptions that include employee turnover, life expectancy, retirement age, discount rates, the future level of employee compensations and benefits, the claims rate under medical plans, and future medical costs. These assumptions change as economic and market conditions vary and any change in any of these assumptions could have a material effect on the reported results from operations.
The effect of an increase of 100 basis points in the discount rate used to determine the present value of the post-employment defined benefits would decrease the liability by Ch$ 1.0 billion and Ch$ 0.9 billion as of December 31, 2016 and 2015, respectively, and the effect of a decrease of 100 basis points in the rate used to determine the present value of the post-employment defined benefits would increase the liability by Ch$ 1.2 billion and Ch$ 1.1 billion as of December 31, 2016 and 2015, respectively.
Recent Accounting Pronouncements
Please see Note 2.22.2. of the Notes to our consolidated financial statements for additional information regarding recent accounting pronouncements.
2. |
|
I. Analysis of Results from Continuingof Operations
In 2016, hydrological conditions were slightly drier than in 2015 and adversely affected our hydroelectric generation. However, our Bocamina and San Isidro thermal plants generated during for the full year 2016, compared to 2015 during which they only operated partially, which helped to offset our lower hydroelectric generation. In 2015, Bocamina operated for only five months due to legal issues and San Isidro generated at half of its capacity due to the lack of water needed to produce energy as a combined-cycle power plant.
49
In 2016, despite the drought that especially affected southern Chile, where most of our plants are located, the marginal cost of electricity decreased mainly as a consequence of: (i) higher thermal generation, and a greater reliance on coal, with its lower marginal cost in relation to LNG; (ii) low international prices, and (iii) the commissioning of new NCRE plants into the system.
As result, we were able to cover our energy deficit in the spot market at lower prices, partially offsetting our higher physical purchases, and to reduce our fuel consumption cost. The combination of these factors, among others, contributed to increase our operating income in 2016 compared to 2015. Please refer to “Operating Income and Operating Margin from Continuing Operations” below.
Revenues from Continuing Operations
For the years endedYears Ended December 31, 20162018, and 2015, all of our consolidated revenues from continuing operations originated from our core generation business.2017
Consolidated Revenues
The following tables set forth our total revenues from continuing operations, physical energy sales and generation (expressed in GWh), and the corresponding changeschange for the years ended December 31, 20162018, and 2015:2017:
|
| Year ended December 31, |
| |||||||||||||
|
| 2016 |
|
| 2015 |
|
| Change |
|
| Change |
| ||||
|
| (in millions of Ch$) |
|
| (in %) |
| ||||||||||
Revenues |
|
| 1,659,727 |
|
|
| 1,543,810 |
|
|
| 115,917 |
|
|
| 7.5 |
|
|
| Year ended December 31, |
| |||||||||||||
|
| 2016 |
|
| 2015 |
|
| Change |
|
| Change |
| ||||
|
| (in GWh) |
|
| (in %) |
| ||||||||||
Energy Sales |
|
| 23,689 |
|
|
| 23,558 |
|
|
| 131 |
|
|
| 0.6 |
|
|
| Year ended December 31, |
| |||||||||||||
|
| 2016 |
|
| 2015 |
|
| Change |
|
| Change |
| ||||
|
| (in GWh) |
|
| (in %) |
| ||||||||||
Generation |
|
| 17,564 |
|
|
| 18,294 |
|
|
| (730 | ) |
|
| (4.0 | ) |
|
| Year ended December 31, |
| ||||||
|
| 2018 |
| 2017 |
| Change |
| Change |
|
|
| (in millions of Ch$) |
| (in %) |
| ||||
Revenues |
| 1,521,054 |
| 1,634,937 |
| (113,883 | ) | (7.0 | ) |
Revenues increased by Ch$ 115.9 billion, or 7.5%,decreased in 20162018 compared to 2015, primarily2017 despite the level of generation and the stable level of physical sales. The decrease was mainly due to (i) Ch$ 53.188.3 billion lower revenues from energy sales, which was primarily attributable due to (a) Ch$ 46.1 billion associated with lower energy average sales price due to the lower average exchange rate for the period; (b) Ch$ 22.3 billion of lower physical sales as a result of the shift in our customer mix between regulated and unregulated customers; and (c) Ch$ 21.9 billion of lower revenues as a 3.6% increaseresult of settlements performed by the CEN associated with price and quantity adjustments registered in average energy sale prices, (ii)2017. The decrease was also the result of Ch$ 40.635.4 billion of less toll revenues partially offset by Ch$ 9.3 billion of higher naturalother sales, mainly due to Ch$ 12.1 billion of higher gas sales mainly related to exports to Argentina, (iii)offset by Ch$ 15.92.8 billion increase in other income mainly related to better results in commodity hedges in Enel Generación Chile (Ch$ 9.0 billion) and insurance indemnification for damage to the Tarapacá power plant (Ch$ 6.5 billion), and (iv) Ch$ 8.2 billion from increased physical sales of 131 GWh, an increase of 0.6%, mostly to regulated customers.lower coal sales.
Total Operating Costs from Continuing Operations
Total
Our total operating costs from continuing operations consistare primarily of energy purchases from third parties, fuel purchases, depreciation, amortization and impairment losses, maintenance costs, tolls paid to transmission companies, employee salaries and administrative and selling expenses.
The following table sets forth ourthe principal items for consolidated operating costs from continuing operations in Chilean pesos and as a percentage of total consolidated operating costs from continuing operations for the years ended December 31, 20162018, and 2015:2017:
|
| Year ended December 31, |
|
| Year ended December 31, |
| |||||||||||||||||||
|
| 2016 |
|
| 2015 |
|
| 2018 |
| 2017 |
| ||||||||||||||
|
| (in millions of Ch$) |
|
| (in %) |
|
| (in millions of Ch$) |
|
| (in %) |
|
| (in millions |
| (in %) |
| (in millions |
| (in %) |
| ||||
Energy purchases |
|
| 335,732 |
|
|
| 27.3 | % |
|
| 320,732 |
|
|
| 28.1 | % |
| 326,366 |
| 40.3 |
| 346,955 |
| 38.4 |
|
Fuel consumption |
|
| 295,149 |
|
|
| 24.0 | % |
|
| 327,503 |
|
|
| 28.7 | % |
| 230,994 |
| 28.5 |
| 280,739 |
| 31.1 |
|
Transportation costs |
|
| 192,503 |
|
|
| 15.7 | % |
|
| 179,691 |
|
|
| 15.7 | % |
| 141,551 |
| 17.5 |
| 152,870 |
| 16.9 |
|
Depreciation, amortization and impairment losses(1) |
|
| 163,386 |
|
|
| 13.3 | % |
|
| 115,042 |
|
|
| 10.1 | % | |||||||||
Other expenses(1) |
|
| 119,303 |
|
|
| 9.7 | % |
|
| 90,340 |
|
|
| 7.9 | % | |||||||||
Employee benefit expense and others(1) |
|
| 50,592 |
|
|
| 4.1 | % |
|
| 55,719 |
|
|
| 4.9 | % | |||||||||
Other variable procurement and services |
|
| 71,676 |
|
|
| 5.8 | % |
|
| 52,965 |
|
|
| 4.6 | % |
| 111,063 |
| 13.7 |
| 123,414 |
| 13.7 |
|
Total Operating Cost from Continuing Operations |
|
| 1,228,341 |
|
|
| 100 | % |
|
| 1,141,991 |
|
|
| 100 | % | |||||||||
Depreciation, amortization and impairment losses(1) |
| 117,867 |
| 14.6 |
| 117,282 |
| 13.0 |
| ||||||||||||||||
Other expenses(1) |
| 82,479 |
| 10.2 |
| 102,821 |
| 11.4 |
| ||||||||||||||||
Employee benefit expense and others(1) |
| 46,351 |
| 5.7 |
| 46,996 |
| 5.2 |
| ||||||||||||||||
Total Operating Cost |
| 809,974 |
| 100 |
| 903,978 |
| 100 |
| ||||||||||||||||
|
|
50
The following table sets forth our consolidatedOur operating costs (excluding selling and administrative expenses) from continuing operations for the years ended December 31, 2016 and 2015:decreased in 2018 compared to 2017, mainly due to:
|
| Year ended December 31, |
| |||||||||||||
|
| 2016 |
|
| 2015 |
|
| Change |
|
| Change |
| ||||
|
| (in millions of Ch$) |
|
| (in %) |
| ||||||||||
Operating costs (excluding selling and administrative expenses) from continuing operations |
|
| 895,060 |
|
|
| 880,891 |
|
|
| 14,169 |
|
|
| 1.6 | % |
(i) a Ch$ 49.7 billion decrease in fuel consumption, of which Ch$ 30.5 billion corresponded to lower gas consumption, Ch$ 9.2 billion to lower coal consumption, and Ch$ 9.9 billion to lower fuel oil costs, primarily responding to the lower level of thermal dispatch;
Operating costs (excluding selling and administrative expenses) from continuing operations, increased(ii) a Ch$ 20.6 billion decrease in energy purchases primarily explained by lower physical energy purchases of 313 GWh, mainly 935 GWh of lower contracted energy purchases that were partially compensated by 622 GWh higher spot market purchases;
(iii) a Ch$ 14.212.4 billion or 1.6%,decrease in 2016 compared to 2015, mainly due to (i) Ch$ 18.7 billion of higher other variable procurement and services costs, which in turn was mostly attributable to (a) Ch$ 31.98.3 billion of higher costs in the gas commercialization business, (ii) increased purchases of energy of Ch$ 15.0 billion due to higher physical purchases of 861 GWh, an increase of 16.3%, mostly in the spot market, and (iii) Ch$ 12.8 billion of higher transportation costs due to higher tolls. This increase was partially offset by (i) Ch$ 32.4 billion of lower fuel consumption costs mainly due to lower average prices, given the decrease of international commodity prices, which accounted for Ch$ 93.9 billion of the decrease, partially offset by Ch$ 69.3 billion related to higher thermal generation and by (ii) Ch$ 15.9 billion lower costs related to the lease agreement with GenerEléctrica Santiago S.A., an unrelated company, to use its
Nueva Renca combined-cycle power plant, allowing us to use our available LNG, which directly compensates other variable procurementLNG; (b) Ch$ 3.7 billion of lower thermal emissions taxes; (c) Ch$ 1.7 billion of lower commodity derivative costs; and services(d) Ch$ 1.1 billion of lower water consumption costs. These cost decreases were partly offset by higher costs of Ch$ 4.8 billion in the gas commercialization business; and
(iv) a Ch$ 11.3 billion decease in transportation costs, primarily in lower toll expenses amounting to Ch$ 11.9 billion offset by Ch$ 0.6 billion of higher gas transportation and regasification costs.
Consolidated Selling and Administrative Expenses from Continuing Operations
Selling
Our selling and administrative expenses from continuing operations relate toare salaries, compensation, administrative expenses, depreciation, amortization and impairment losses, and office materials and supplies.
The following table sets forth our consolidated selling and administrative expenses from continuing operations in Chilean pesos, and as a percentage of total selling and administrative expenses from continuing operations, for the years ended December 31, 20162018, and 2015:2017:
|
| Year ended December 31, |
|
| Year ended December 31, |
| |||||||||||||||||||
|
| 2016 |
|
| 2015 |
|
| 2018 |
| 2017 |
| ||||||||||||||
|
| (in millions of Ch$) |
|
| (in %) |
|
| (in millions of Ch$) |
|
| (in %) |
|
| (in millions |
| (in %) |
| (in millions |
| (in %) |
| ||||
Depreciation, amortization and impairment losses |
|
| 163,386 |
|
|
| 49.0 | % |
|
| 115,042 |
|
|
| 44.1 | % |
| 117,867 |
| 47.8 |
| 117,282 |
| 43.9 |
|
Other expenses |
|
| 119,303 |
|
|
| 35.8 | % |
|
| 90,340 |
|
|
| 34.6 | % |
| 82,479 |
| 33.4 |
| 102,821 |
| 38.5 |
|
Employee benefit expense and others |
|
| 50,592 |
|
|
| 15.2 | % |
|
| 55,719 |
|
|
| 21.3 | % |
| 46,351 |
| 18.8 |
| 46,996 |
| 17.6 |
|
Total Selling and Administrative Expenses from Continuing Operations |
|
| 333,281 |
|
|
| 100 | % |
|
| 261,100 |
|
|
| 100 | % |
| 246,697 |
| 100 |
| 267,099 |
| 100 |
|
The following table sets forth a comparison of our consolidatedConsolidated selling and administrative expenses from continuing operations betweendecreased in 2018 compared to 2017 primarily due to Ch$ 20.3 billion of lower other fixed costs primarily attributable to the years ended December 31, 2016impairment charges of Ch$ 25.1 billion. This loss was recognized in 2017 in connection with our decision to abandon the Neltume and 2015:
|
| Year ended December 31, |
| |||||||||||||
|
| 2016 |
|
| 2015 |
|
| Change |
|
| Change |
| ||||
|
| (in millions of Ch$) |
|
| (in %) |
| ||||||||||
Total Selling and Administrative Expenses from Continuing Operations |
|
| 333,281 |
|
|
| 261,100 |
|
|
| 72,181 |
|
|
| 27.6 |
|
SellingChoshuenco projects as being economically unfeasible and reducing the net book value of the associated assets to zero. Otherwise, our selling and administrative expenses from continuing operations increased by Ch$ 72.2 billion, or 27.6%, in 2016 compared to 2015, mainly due to (i) higher impairment losses of property, plant and equipment of Ch$ 40.6 billion related to a recognition in 2016 of Ch$ 24.2 billion of impairment charges related to the Neltume (Ch$ 20.5 billion) and Choshuenco (Ch$ 3.7 billion) projects and an increase of Ch$ 4.1 billion impairment of capitalized investments in NCRE projects between 2016 and 2015, compared to income in 2015 of Ch$ 12.6 billion due to the reversal of impairment charges associated with the Tarapacá power plant; and (ii) higher other fixed costs of Ch$ 29.0 billion mostly attributable to the write-off of Ch$ 32.8 billion of property, plant and equipment related to the waiver of water rights associated with the Bardón, Chillán 1 and 2, Futaleufú, Hechún, Puelo, Tames 2 and Totoralillo hydroelectric projects, which was partially offset by Ch$ 4.1 billion in lower expenses of outsourced services, compared to 2015 in which we incurred higher costs related to the corporate reorganization.were remained stable.
51
Consolidated Operating Income and Operating Margin from Continuing Operations
The following table sets forth our operating income, and operating margin from continuing operations, for the years ended December 31, 20162018, and 2015:2017:
|
| Year ended December 31, |
| |||||||||||||
|
| 2016 |
|
| 2015 |
|
| Change |
|
| Change |
| ||||
|
| (in millions of Ch$) |
|
| (in %) |
| ||||||||||
Operating income from continuing operations |
|
| 431,386 |
|
|
| 401,819 |
|
|
| 29,568 |
|
|
| 7.4 | % |
Operating margin from continuing operations(1) |
|
| 26.0 | % |
|
| 26.0 | % |
|
| — |
|
|
| — |
|
|
| Year ended December 31, |
| ||||||
|
| 2018 |
| 2017 |
| Change |
| Change |
|
|
| (in millions of Ch$) |
| (in %) |
| ||||
Operating income |
| 464,383 |
| 463,860 |
| 523 |
| 0.1 |
|
Operating margin (1) |
| 30.5 | % | 28.4 | % | — |
| — |
|
|
|
(1) Operating margin, a measure of efficiency, represents operating income as a percentage of revenues.
Our operating income in 2018 remained relatively stable in when compared to 2017 as a result of:
· Hydrological conditions in Chile have been below the historical average since 2010. However, in 2018 hydrological conditions were more humid than in 2017. This allowed us to produce more electricity through hydroelectric generation rather than through thermal generation, which is more expensive, which helped slightly reduce our operating costs. In addition, the commissioning of new NCRE plants reduced the impact of dry conditions and the interconnection between the SIC and SING also helped to reduce or stabilize marginal costs. Therefore, the marginal cost of electricity generation decreased in 2018 when compared to 2017 notwithstanding higher prices for our fuels. As a result, we were able to cover our energy deficit in the spot market at lower prices.
· However, despite the level of generation and the stable level of physical sales, our operating revenues decreased mainly as a consequence of a shift in our customer mix and the lower average sales price. Our selling and administrative expenses considerably decreased in 2018, mainly due to write-offs we booked in 2017.
The 7.5% increase in revenues from continuing operations offset a slight increase1.0% decrease in operating costs (excluding selling and administrative expenses) from continuing operations of 1.6% and a 27.6% increaseoffset the 7.0% decrease in revenues. However, the 7.6% decrease in selling and administrative expenses from continuing operations andwas the main factor that contributed to a 7.4%the 2.2% increase in our operating income in 20162018 when compared to 2015, while keeping2017, increasing our operating margin steady at 26%from 28.4% to 30.5%.
Consolidated Financial and Other Results from Continuing Operations
The following table sets forth our financial and other results from continuing operations for the years ended December 31, 20162018, and 2015:2017:
|
| Year ended December 31, |
|
| Year ended December 31, |
| |||||||||||||||||||
|
| 2016 |
|
| 2015 |
|
| Change |
|
| Change |
|
| 2018 |
| 2017 |
| Change |
| Change |
| ||||
|
| (in millions of Ch$) |
|
| (in %) |
|
| (in millions of Ch$) |
| (in %) |
| ||||||||||||||
Financial results from continuing operations |
|
|
|
|
|
|
|
|
|
|
|
|
|
|
|
| |||||||||
Financial results |
|
|
|
|
|
|
|
|
| ||||||||||||||||
Financial income |
|
| 6,151 |
|
|
| 235 |
|
|
| 5,916 |
|
| n.a. |
|
| 5,778 |
| 5,274 |
| 504 |
| 9.6 |
| |
Financial costs |
|
| (55,702 | ) |
|
| (64,207 | ) |
|
| 8,505 |
|
|
| (13.2 | )% |
| (48,189 | ) | (50,852 | ) | 2,663 |
| (5.2 | ) |
Gains from indexed assets and liabilities, net |
|
| 606 |
|
|
| 3,600 |
|
|
| (2,994 | ) |
|
| (83.2 | )% |
| (2,480 | ) | 146 |
| (2,626 | ) | n.a |
|
Foreign currency exchange differences |
|
| 13,266 |
|
|
| (53,880 | ) |
|
| 67,147 |
|
| n.a. |
|
| (3,056 | ) | 8,822 |
| (11,878 | ) | (134.6 | ) | |
Total financial results from continuing operations |
|
| (35,679 | ) |
|
| (114,252 | ) |
|
| 78,574 |
|
|
| (68.8 | )% | |||||||||
Total financial results |
| (47,947 | ) | (36,610 | ) | (11,337 | ) | 31.0 |
| ||||||||||||||||
|
|
|
|
|
|
|
|
|
|
|
|
|
|
|
|
|
|
|
|
|
|
|
|
|
|
Other results from continuing operations |
|
|
|
|
|
|
|
|
|
|
|
|
|
|
|
| |||||||||
Other results |
|
|
|
|
|
|
|
|
| ||||||||||||||||
Share of the profit (loss) of associates and joint ventures accounted for using the equity method |
|
| 7,878 |
|
|
| 8,905 |
|
|
| (1,027 | ) |
|
| (11.5 | )% |
| 3,281 |
| (2,697 | ) | 5,978 |
| n.a |
|
Gain from other investments |
|
| 121,457 |
|
|
| 4,309 |
|
|
| 117,148 |
|
| n.a. |
|
| 410 |
| 105,463 |
| (105,053 | ) | (99.6 | ) | |
Loss from sales of assets |
|
| 34 |
|
|
| (294 | ) |
|
| 327 |
|
| n.a. |
|
| 3,025 |
| 7,626 |
| (4,601 | ) | (60.3 | ) | |
Total other results from continuing operations |
|
| 129,369 |
|
|
| 12,920 |
|
|
| 116,449 |
|
| n.a. |
| ||||||||||
Total financial and other results from continuing operations |
|
| 93,691 |
|
|
| (101,332 | ) |
|
| 195,022 |
|
|
| (192.5 | )% | |||||||||
Total other results |
| 6,716 |
| 110,392 |
| (103,676 | ) | (93.9 | ) | ||||||||||||||||
Total Consolidated Financial and Other Results |
| (41,231 | ) | 73,782 |
| (115,013 | ) | n.a |
| ||||||||||||||||
Financial Results from Continuing Operations
Our
We recorded a higher net financial results from continuing operationsexpense for the year ended December 31, 2016 was an expense of Ch$ 35.7 billion, an increase of Ch$ 78.6 billion, or 68.8%,2018, compared to 2015.2017. This increase iswas primarily due to lower charges for foreign currency exchange differences ofamounting to Ch$ 67.1 billion,11.9 billion. This was mainly as a result of the lower Chilean peso valuepositive exchange differences on cash and cash equivalents of the U.S. dollar intercompany debt owed to Enel Américas for Ch$ 48.03.2 billion, and the higher gain ina greater negative exchange difference on forward contracts forof Ch$ 14.45.1 billion, which was offset by a lower negative exchange difference on suppliers’ accounts of Ch$ 3.6 billion.
Other Results from Continuing Operations
Our share of the profit (loss) of associates and joint ventures accounted for using the equity method for the year ended December 31, 2016 was2018, increased compared to 2017, primarily due to the greater profit from our former associate Centrales Hidroeléctricas de Aysén S.A.
We had a lower gain from other investments in 2018 when compared to 2017, primarily explained by the sale of Electrogas in February 2017 for Ch$ 7.9105.3 billion.
Consolidated Income Tax Expense
Consolidated income tax expenses totaled Ch$ 104.9 billion in 2018, a decrease of Ch$ 1.0 billion, or 11.5%, as compared to 2015, primarily because we sold our former associate GNL Quintero in September 2016, while in 2015 we recognized a full year of operations of GNL Quintero.
Gain from other investments was Ch$ 121.5 billion in 2016, an increase of Ch$ 117.17.2 billion compared to 2015. This increase2017.
The decrease in consolidated income tax expenses was primarily due to a Ch$ 13.5 billion decrease in tax expenses related to the gaindissolution of Central Canela S.A. in 2017; a Ch$ 27.7 billion of lower tax expenses related to the sale of Electrogas in February 2017, partially offset by Ch$ 5.8 billion of higher expense due to the increase in the statutory corporate income tax rate from 25.5% in 2017 to 27% in 2018; along with a lower income of Ch$ 121.329.6 billion related to the liquidation process of Centrales Hidroeléctricas de Aysén S.A. The decrease in income tax expenses resulted in the increase of the effective income tax rate.
The effective tax rate was 24.8% in 2018 compared to 20.9% in 2017. For further details, please refer to Note 33 of the Notes to our consolidated financial statements.
Consolidated Net Income
The following table sets forth our consolidated income before income taxes, income tax expenses and net income for the years ended December 31, 2018, and 2017:
|
| Year ended December 31, |
| ||||||
|
| 2018 |
| 2017 |
| Change |
| Change |
|
|
| (in millions of Ch$) |
| (in %) |
| ||||
Operating income |
| 464,383 |
| 463,860 |
| 523 |
| 0.1 | % |
Total financial and Other results |
| (41,231 | ) | 73,782 |
| (115,013 | ) | (155.9 | )% |
Income before income taxes |
| 423,152 |
| 537,642 |
| (114,490 | ) | (21.3 | )% |
Income tax expense |
| (104,947 | ) | (112,100 | ) | 7,153 |
| (6.4 | )% |
Consolidated Net Income |
| 318,205 |
| 425,542 |
| (107,337 | ) | (25.2 | )% |
Net income attributable to the parent company |
| 309,029 |
| 418,454 |
| (109,425 | ) | (26.1 | )% |
Net income attributable to non-controlling interest |
| 9,176 |
| 7,088 |
| 2,088 |
| 29.5 | % |
3.Analysis of Results of Operations for the years ended December 31, 2017, and 2016
Consolidated Revenues from Continuing Operations
The following tables set forth our total revenues from continuing operations and the corresponding change for the years ended December 31, 2017, and 2016:
|
| Year ended December 31, |
| ||||||
|
| 2017 |
| 2016 |
| Change |
| Change |
|
|
| (in millions of Ch$) |
| (in %) |
| ||||
Revenues |
| 1,634,937 |
| 1,659,727 |
| (24,790 | ) | (1.5 | ) |
Revenues decreased in 2017 compared to 2016. The decrease was mainly due to Ch$ 59.0 billion lower revenues from energy sales, which was primarily attributable due to (i) Ch$ 41.2 billion associated with lower energy average sales price, (ii) lower physical sales of Ch$ 39.6 billion as a result of an 8% decrease in sales to regulated clients, and (iii) partially offset by Ch$ 21.9 billion of higher revenues as a result of settlements performed by the CEN associated with price and quantity adjustments. The decrease was partially offset by Ch$28.4 billion in higher natural gas sales.
Total Operating Costs from continuing operations
Our total operating costs from continuing operations are primarily energy purchases from third parties, fuel purchases, depreciation, amortization and impairment losses, maintenance costs, tolls paid to transmission companies, employee salaries and administrative and selling expenses.
The following table sets forth the principal items for consolidated operating cost by category for the years ended December 31, 2017, and 2016:
|
| Year ended December 31, |
| ||||||
|
| 2017 |
| 2016 |
| Change |
| Change |
|
|
| (in millions |
| (in%) |
| ||||
Energy purchases |
| 346,955 |
| 335,732 |
| 11,223 |
| 3.3 |
|
Fuel consumption |
| 280,739 |
| 295,149 |
| (14,409 | ) | (4.9 | ) |
Transmission costs |
| 152,870 |
| 192,503 |
| (39,633 | ) | (20.6 | ) |
Other variable procurement and services |
| 123,414 |
| 71,676 |
| 51,738 |
| 72.2 |
|
Total Operating Cost from Continuing Operations (excluding Selling, General and Administrative Expenses) |
| 903,978 |
| 895,060 |
| 8,918 |
| 1.0 |
|
Our operating costs increased in 2017 compared to 2016, mainly due to Ch$ 51.7 billion higher other variable procurement and services costs, which in turn were mostly attributable to (i) Ch$ 29.5 billion higher costs in the gas commercialization business, (ii) Ch$ 17.3 billion higher thermal emissions taxes and (iii) Ch$ 7.6 billion higher commodity derivative costs and increased purchases of Ch$ 11.2 billion due to higher physical purchases to comply with our contractual sales obligations. Such increases were
partially offset by Ch$ 39.6 billion lower transportation costs due to lower tolls and Ch$ 14.4 billion lower fuel consumption costs mainly due to better hydrology in southern Chile during the fourth quarter of 2017, which allowed us to reduce our thermal generation during such quarter.
Selling and Administrative Expenses from Continuing Operations
Our selling and administrative expenses are salaries, compensation, administrative expenses, depreciation, amortization and impairment losses, and office materials and supplies.
The following table sets forth our consolidated selling and administrative expenses for the years ended December 31, 2017, and 2016:
|
| Year ended December 31, |
| ||||||
|
| 2017 |
| 2016 |
| Change |
| Change |
|
|
| (in millions of Ch$) |
| (in %) |
| ||||
Depreciation, amortization and impairment losses |
| 117,282 |
| 163,386 |
| (46,104 | ) | (28.2 | ) |
Other expenses |
| 102,821 |
| 119,303 |
| (16,482 | ) | (13.8 | ) |
Employee benefit expense and others |
| 46,996 |
| 50,592 |
| (3,596 | ) | (7.1 | ) |
Total Selling and Administrative Expenses from Continuing Operations |
| 267,099 |
| 333,281 |
| (66,182 | ) | (19.9 | ) |
Consolidated selling and administrative expenses from continuing operations decreased in 2017 compared to 2016. This reduction is primarily due to (i) lower impairment losses of property, plant and equipment of Ch$ 30.8 billion due to the non-recurring impairment charges of Ch$ 24.2 billion booked in 2016 related to NCRE projects and the Neltume and Choshuenco projects (see “— 2. Analysis of Result of operations for the year ended December 31, 2016 and 2015 — Consolidated Selling and Administrative Expenses”); (ii) lower other fixed costs of Ch$ 16.5 billion primarily attributable to the non-recurring impairment charges of Ch$ 35.4 billion related to the waiver of water rights of the Bardón, Chillán 1 and 2, Futaleufú, Huechún and Puelo hydroelectric projects recorded in 2016 compared with the Ch$ 25.1 billion loss recognized in 2017 in connection with our decision to abandon the Neltume and Choshuenco projects for being economically unfeasible to reduce the net book value of the associated assets to zero; and (iii) lower depreciation and amortization of Ch$ 15.3 billon primarily due to the modification of the remaining useful life of fixed assets applied to Property, Plant, and equipment in 2017.
Operating Income and Operating Margin from Continuing Operations
The following table sets forth our operating income and operating margin for the years ended December 31, 2017, and 2016:
|
| Year ended December 31, |
| ||||||
|
| 2017 |
| 2016 |
| Change |
| Change |
|
|
| (in millions of Ch$) |
| (in %) |
| ||||
Operating income from continuing operations |
| 463,860 |
| 431,386 |
| 32,474 |
| 7.5 |
|
Operating margin from continuing operations (1) |
| 28.4 | % | 26.0 | % | — |
| — |
|
(1) Operating margin from continuing operations, a measure of efficiency, represents operating income from continuing operations as a percentage of revenues from continuing operations.
The combination of the following factors, among others, contributed to an increase of our operating income in 2017 when compared to 2016:
· Hydrological conditions in Chile have been below the historical average since 2010. However, in 2017, hydrological conditions were slightly more humid than in 2016, mainly during the fourth quarter of 2017. This allowed us to produce more electricity through hydroelectric generation rather than thermal generation, which is more expensive. In addition, the commissioning of new NCRE plants reduced the impact of dry conditions. Therefore, the marginal cost of electricity
decreased in 2017 when compared to 2016. As a result, we were able to cover our energy deficit in the spot market at lower prices.
· Our physical sales decreased when compared to 2016 and our customer mix changed because a portion of our former regulated clients chose the unregulated regime instead. Our selling and administrative expenses decreased considerably in 2017, mainly due to the impairments and write-offs we booked in 2016.
The 1.0% increase in operating costs (excluding selling and administrative expenses) from continuing operations offset a slight 1.5% increase in revenues from continuing operations. However, the 19.9% decrease in selling and administrative expenses from continuing operations was the main factor that contributed to the 7.5% increase in our operating income in 2017 when compared to 2016, increasing our operating margin from 26% to 28.4%.
Financial and Other Results from Continuing Operations
The following table sets forth our financial and other results from continuing operations for the years ended December 31, 2017, and 2016:
|
| Year ended December 31, |
| ||||||
|
| 2017 |
| 2016 |
| Change |
| Change |
|
|
| (in millions of Ch$) |
| (in %) |
| ||||
Financial results from continuing operations |
|
|
|
|
|
|
|
|
|
Financial income |
| 5,274 |
| 6,151 |
| (877 | ) | (14.3 | ) |
Financial costs |
| (50,852 | ) | (55,702 | ) | 4,850 |
| (8.7 | ) |
Gains from indexed assets and liabilities, net |
| 146 |
| 606 |
| (460 | ) | (76.0 | ) |
Foreign currency exchange differences |
| 8,822 |
| 13,266 |
| (4,444 | ) | (33.5 | ) |
Total financial results from continuing operations |
| (36,610 | ) | (35,679 | ) | (932 | ) | 2.6 |
|
|
|
|
|
|
|
|
|
|
|
Other results |
|
|
|
|
|
|
|
|
|
Share of the profit (loss) of associates and joint ventures accounted for using the equity method |
| (2,697 | ) | 7,878 |
| (10,575 | ) | n.a |
|
Gain from other investments |
| 105,463 |
| 121,457 |
| (15,995 | ) | (13.2 | ) |
Loss from sales of assets |
| 7,626 |
| 34 |
| 7,593 |
| n.a |
|
Total Other results from continuing operations |
| 110,392 |
| 129,369 |
| (18,977 | ) | (14.7 | ) |
Total Financial and Other Results from continuing operations |
| 73,782 |
| 93,691 |
| (19,909 | ) | (21.2 | ) |
Financial Results from Continuing Operations
We recorded a net financial expense from continuing operations for the year ended December 31, 2017, in an amount greater compared to 2016. This decrease is primarily due to lower charges for foreign currency exchange differences amounting to Ch$ 4.5 billion, mainly as a result of the lower Chilean peso value of the U.S. dollar intercompany debt we owed Enel Américas for Ch$ 10.1 billion that was offset by greater income on cash and cash equivalents in U.S. dollars for Ch$ 5.7 billion. This variation was completely compensated by the Ch$ 4.9 billion lower financial costs mainly due to lower interest expenses on structured loans for Ch$ 1.5 billion with Enel Américas that expired in September 2016, and to lower interest expenses on bank loans and bonds for Ch$ 4.8 billion mainly due to the lower level of average debt in 2017, offset by a Ch$1.4 billion increase in bank fees. The reduction of our financial result was also the consequence of Ch$ 0.9 billion lower financial income due to an agreement with YPF we settled in 2016 for Ch$ 2.0 billion offset by higher income from temporary investments in fixed income securities for Ch$ 1.1 billion.
Other Results from Continuing Operations
Our share of the profit (loss) of associates and joint ventures accounted for using the equity method for the year ended December 31, 2017, decreased compared to 2016, primarily due to the sale of our former associate Electrogas in February 2017 and GNL Quintero in September 2016, accounting for a Ch$ 5.2 billion and Ch$ 2.8 billion decrease in equity investment profits, respectively. In addition, the loss from our associate HydroAysén increased by Ch$ 2.0 billion. For further details regarding the termination of HydroAysén, please refer to “Item 4. Information on the Company — C. Organizational Structure. — Selected Related and Jointly-Controlled Companies — HydroAysén.”
Due to the sale of Electrogas in 2017 and GNL Quintero in 2016, we also registered a lower gain from other investments in 2017 when compared to 2016. In 2017 we recorded a Ch$ 105.3 billion gain from the gainssale of Electrogas and the sale of a land owned by GasAtacama for Ch$ 7.6 billion, while in 2016 we recognized in 2015 ofa Ch$ 4.2121.3 billion gain arising from the sale of our former associate Túnel El Melón in January 2015.GNL Quintero.
52
Income Tax Expense from Continuing Operations
Total income tax expenses from continuing operations totaled Ch$ 83.2112 billion in 2016,2017, an increase of Ch$ 6.628.9 billion compared to 2015.2016.
The increase in total income tax expenses from continuing operations was mainlyprimarily due to (i) Ch$ 4.513.5 billion higher expense due to the reversal of the deferred income tax related to the dissolution of Central Canela S.A., (ii) Ch$ 6.3 billion related to the increase of the statutory tax rate from 22.5%24% to 24%25.5% and Ch$ 53.9 billion higher(iii) greater income from continuing operations effect for the year ended December 31, 2016, including Ch$ 28.1 billion of higher taxes due to the effect generated by the sale of our former associate GNL Quintero. These increases were partially offset by Ch$ 18.8 billion of tax benefits gained as part of the corporate simplification process related to generating companieslower exchange rate and price-level restatement losses for Ch$ 8.4 billion. The increase in Chile, Ch$ 10.8 billion of lower taxes on taxable price-level readjustment of investments, Ch$ 5.6 billion lower deferred taxes associated with our investments in Peru and Ch$ 16.4 lower income taxes due to other different concepts of non-taxable revenues. These decreasestax expenses resulted in the decreaseincrease of the effective income tax rate.
The effective tax rate was 20.9% in 2017 compared to 15.9% in 2016 compared to 25.5% in 2015.2016. For further details, please refer to note 32Note 31 of the Notes to our consolidated financial statements.
Income from Continuing Operations and Net Income
The following table sets forth our consolidated income from continuing operations before income taxes, income tax expenses, from continuing operations, income after tax for the year from discontinued operations and net income for the years ended December 31, 20162017, and 2015:2016:
|
| Year ended December 31, |
|
| Year ended December 31, |
| |||||||||||||||||||
|
| 2016 |
|
| 2015 |
|
| Change |
|
| Change |
|
| 2017 |
| 2016 |
| Change |
| Change |
| ||||
|
| (in millions of Ch$) |
|
| (in %) |
|
| (in millions of Ch$) |
| (in %) |
| ||||||||||||||
Operating income from continuing operations |
|
| 431,386 |
|
|
| 401,819 |
|
|
| 29,568 |
|
|
| 7.4 | % | |||||||||
Total financial and Other results from continuing operations |
|
| 93,691 |
|
|
| (101,332 | ) |
|
| 195,022 |
|
| n.a. |
| ||||||||||
Income from continuing operations before income taxes |
|
| 525,077 |
|
|
| 300,487 |
|
|
| 224,590 |
|
|
| 74.7 | % | |||||||||
Income tax expense, continuing operations |
|
| (83,217 | ) |
|
| (76,656 | ) |
|
| (6,561 | ) |
|
| 8.6 | % | |||||||||
Operating income |
| 463,860 |
| 431,386 |
| 32,474 |
| 7.5 | % | ||||||||||||||||
Total financial and Other results |
| 73,782 |
| 93,691 |
| (19,909 | ) | n.a. |
| ||||||||||||||||
Income before income taxes |
| 537,642 |
| 525,077 |
| 12,565 |
| 2.4 | % | ||||||||||||||||
Income tax expense |
| (112,100 | ) | (83,217 | ) | (28,883 | ) | 34.7 | % | ||||||||||||||||
Net Income from continuing operations |
|
| 441,860 |
|
| �� | 223,831 |
|
|
| 218,029 |
|
|
| 97.4 | % |
| 425,542 |
| 441,860 |
| (16,318 | ) | (3.7 | )% |
Net Income from discontinued operations |
|
| 79,572 |
|
|
| 411,190 |
|
|
| (331,617 | ) |
|
| (80.6 | )% |
| — |
| 79,572 |
| (79,572 | ) | (100.0 | )% |
Net income |
|
| 521,432 |
|
|
| 635,021 |
|
|
| (113,588 | ) |
|
| (17.9 | )% |
| 425,542 |
| 521,432 |
| (95,890 | ) | (18.4 | )% |
Net income attributable to the parent company |
|
| 472,558 |
|
|
| 392,868 |
|
|
| 79,690 |
|
|
| 20.3 | % |
| 418,454 |
| 472,558 |
| (54,105 | ) | (11.4 | )% |
Net income attributable to non-controlling interest |
|
| 48,874 |
|
|
| 242,153 |
|
|
| (193,279 | ) |
|
| (79.8 | )% |
| 7,088 |
| 48,874 |
| (41,786 | ) | (85.5 | )% |
The decrease in net income attributable to non-controlling interests of Ch$ 193.2 billion in 20162017 compared to 20152016 is primarily due to the decrease of the net income attributable to the non-controlling interests from discontinued operations as a result of the separation of businesses that occurred on March 1, 2016, which resulted in only two months of discontinued operations results for 2016 compared to a full year for 2015.2016. On that date, we transferred all of our ownershipinterests in foreign companies to a newly formed company Endesa Américas, which in December 2016 merged with and into Enel Américas. See “Item 4. Information on the Company — A. History and Development of the Company —the— the 2016 Reorganization.” Therefore, our consolidated statement of comprehensive income for 2016 includes only two months of contribution from foreign companies, compared to twelve months includedwhile in 2015.2017 we did not include discontinued operations. The details of non-controlling interests is listed onin Note 24.625.2 of the Notes to our consolidated financial statements.
II. Analysis of Results from Discontinued Operations
Net income from discontinued operations decreased by Ch$ 332 billion in 2016 compared to 2015. The decrease is a direct result of the separation of businesses that occurred on March 1, 2016. On that date, we transferred all of our ownership in foreign companies to a newly formed company, Endesa Américas. See “Item 4. Information on the Company — A. HistoryB.Liquidity and Development of the Company — The 2016 Reorganization.”
In 2016, the Ch$ 80 billion net income after taxes from discontinued operations represents the results of the non-Chilean generation business for only the two-month period ended February 29, 2016, while in 2015 the Ch$ 411 billion net income after tax from discontinued operations represents results of the non-Chilean generation business for the twelve months ended December 31, 2015.
The following table sets forth the breakdown by nature of the line item “Net Profit after tax from discontinued operations” for the two-month period ended February 29, 2016 and the year ended December 31, 2015:
53
For the two months ended February 29, 2016 |
|
| For the year ended December 31, 2015 |
| |||
| (In millions of Ch$) |
| |||||
|
|
|
|
|
|
|
|
Revenues |
| 229,075 |
|
|
| 1,238,466 |
|
Other operating income |
| 6,648 |
|
|
| 64,649 |
|
Total Revenue and Other Operating Income |
| 235,723 |
|
|
| 1,303,115 |
|
|
|
|
|
|
|
|
|
Raw materials and consumables used |
| (95,954 | ) |
|
| (481,747 | ) |
Contribution Margin |
| 139,770 |
|
|
| 821,368 |
|
|
|
|
|
|
|
|
|
Other work performed by the entity and capitalized |
| 1,188 |
|
|
| 11,938 |
|
Employee benefits expense |
| (11,609 | ) |
|
| (85,229 | ) |
Depreciation and amortization expense |
| — |
|
|
| (108,406 | ) |
Impairment losses |
| (907 | ) |
|
| (4,813 | ) |
Other expenses |
| (16,296 | ) |
|
| (73,277 | ) |
Operating income |
| 112,146 |
|
|
| 561,581 |
|
|
|
|
|
|
|
|
|
Other gains, net |
| 42 |
|
|
| (509 | ) |
Financial income |
| 2,780 |
|
|
| 59,300 |
|
Financial costs |
| (21,057 | ) |
|
| (87,794 | ) |
Share of profit of investments accounted for using the equity method |
| 6,376 |
|
|
| 38,680 |
|
Foreign currency exchange gain (losses), net |
| 25,485 |
|
|
| 96,181 |
|
Profit before income taxes |
| 125,772 |
|
|
| 667,439 |
|
Income tax expense, discontinued operations |
| (46,200 | ) |
|
| (256,249 | ) |
NET PROFIT FROM DISCONTINUED OPERATIONS |
| 79,572 |
|
|
| 411,190 |
|
|
|
|
|
|
|
|
|
Net profit from discontinued operations attributable to: |
|
|
|
|
|
|
|
Shareholders of Enel Generación Chile |
| 39,759 |
|
|
| 180,546 |
|
Non-controlling interests |
| 39,813 |
|
|
| 230,643 |
|
NET PROFIT FROM DISCONTINUED OPERATIONS |
| 79,572 |
|
|
| 411,190 |
|
|
|
I. Analysis of Results from Continuing Operations
For the first seven months of 2015, hydrological conditions were less favorable than average. During this period, we reduced our thermal generation due to the shutdown of Bocamina I and II. In the spot market, prices were higher than normal despite lower commodity prices. Our generation was lower than our contracted sales and we covered our physical energy deficit in the spot market, resulting in higher energy purchase costs. As of July 2015, Bocamina I and II were in service again, and in August 2015 hydrological conditions improved. Therefore, in the last five months of 2015, we generated at normal levels, and experienced better operating income compared to the same period in 2014. Please refer to “Operating Income and Operating Margin from Continuing Operations” below.
Revenues from Continuing Operations
The following table sets forth the revenues by business, as a percentage of total consolidated revenues from continuing operations, for the years ended December 31, 2015 and 2014:Capital Resources.
|
| Year ended December 31, |
| |||||
|
| 2015 |
|
| 2014 |
| ||
|
| (as a % of total) |
| |||||
Generation |
|
| 100 | % |
|
| 99.2 | % |
Other businesses and intercompany transaction adjustments(1) |
|
| — |
|
|
| 0.8 | % |
Total consolidated revenues from continuing operations |
|
| 100 | % |
|
| 100 | % |
|
|
54
The following tables set forth our total revenues from continuing operations, physical energy sales and generation (expressed in GWh), and the corresponding changes for the years ended December 31, 2015 and 2014:
|
| Year ended December 31, |
| |||||||||||||
|
| 2015 |
|
| 2014 |
|
| Change |
|
| Change |
| ||||
|
| (in millions of Ch$) |
|
| (in %) |
| ||||||||||
Revenues |
|
| 1,543,810 |
|
|
| 1,230,975 |
|
|
| 312,835 |
|
|
| 25.4 | % |
|
| Year ended December 31, |
| |||||||||||||
|
| 2015 |
|
| 2014 |
|
| Change |
|
| Change |
| ||||
|
| (in GWh) |
|
| (in %) |
| ||||||||||
Energy sales |
|
| 23,558 |
|
|
| 21,156 |
|
|
| 2,402 |
|
|
| 11.4 | % |
|
| Year ended December 31, |
| |||||||||||||
|
| 2015 |
|
| 2014 |
|
| Change |
|
| Change |
| ||||
|
| (in GWh) |
|
| (in %) |
| ||||||||||
Generation |
|
| 18,294 |
|
|
| 18,063 |
|
|
| 231 |
|
|
| 1.3 | % |
Revenues increased by Ch$ 312.8 billion, or 25.4%, in 2015 compared to 2014, mainly due to (i) Ch$153.6 billion as a result of a 16.0% increase in average energy sale prices, (ii) Ch$ 88.9 billion as a result of increased physical sales of 2,402 GWh, an increase of 11.3%, due to both increased contractual sales, especially to distributors, and increased sales in the spot market, and (iii) Ch$69.9 billion of higher revenues contributed by GasAtacama Chile, a consolidated entity since May 2014.
Total Operating Costs from Continuing Operations
Total operating costs from continuing operations consist primarily of energy purchases from third parties, fuel purchases, depreciation, amortization and impairment losses, maintenance costs, tolls paid to transmission companies, employee salaries and administrative and selling expenses.
The following table sets forth our consolidated operating costs from continuing operations in Chilean pesos, and as a percentage of total consolidated operating costs from continuing operations for the years ended December 31, 2015 and 2014:
|
| Year ended December 31, |
| |||||||||||||
|
| 2015 |
|
| 2014 |
| ||||||||||
|
| (in millions of Ch$) |
|
| (in %) |
|
| (in millions of Ch$) |
|
| (in %) |
| ||||
Energy purchases |
|
| 320,732 |
|
|
| 28.1 | % |
|
| 288,443 |
|
|
| 29.5 | % |
Fuel consumption |
|
| 327,503 |
|
|
| 28.7 | % |
|
| 305,479 |
|
|
| 31.2 | % |
Transportation costs |
|
| 179,691 |
|
|
| 15.7 | % |
|
| 142,831 |
|
|
| 14.6 | % |
Depreciation, amortization and impairment losses(1) |
|
| 115,042 |
|
|
| 10.1 | % |
|
| 113,766 |
|
|
| 11.6 | % |
Other expenses(1) |
|
| 90,340 |
|
|
| 7.9 | % |
|
| 66,336 |
|
|
| 6.8 | % |
Employee benefit expense and others(1) |
|
| 55,719 |
|
|
| 4.9 | % |
|
| 48,394 |
|
|
| 4.9 | % |
Other variable procurement and services |
|
| 52,965 |
|
|
| 4.6 | % |
|
| 13,464 |
|
|
| 1.4 | % |
Total Operating Cost from Continuing Operations |
|
| 1,141,991 |
|
|
| 100 | % |
|
| 978,712 |
|
|
| 100 | % |
|
|
The following table sets forth our consolidated operating costs (excluding selling and administrative expenses) from continuing operations for the years ended December 31, 2015 and 2014:
|
| Year ended December 31, |
| |||||||||||||
|
| 2015 |
|
| 2014 |
|
| Change |
|
| Change |
| ||||
|
| (in millions of Ch$) |
|
| (in %) |
| ||||||||||
Operating costs (excluding selling and administrative expenses) from continuing operations |
|
| 880,891 |
|
|
| 750,217 |
|
|
| 130,675 |
|
|
| 17.4 | % |
Operating costs (excluding selling and administrative expenses) from continuing operations, increased by Ch$ 130.7 billion, or 17.4%, in 2015 compared to 2014, mainly due to (i) Ch$ 39.5 billion of higher other variable procurement and services costs mostly attributable to (a) Ch$ 23.7 billion related to the cost of the agreement with Gener’s Nueva Renca combined-cycle power plant, that allow us to use our available LNG and (b) Ch$ 9.4 billion of higher water transportation costs for the operation of the San Isidro
55
power plant, (ii) Ch$ 36.9 billion of higher gas transportation costs related to additional energy purchases, (iii) Ch$ 22.0 billion of higher fuel consumption costs mainly due to higher coal consumption costs of Ch$ 16.0 billion, and (iv) increased purchases of energy on the spot market of Ch$ 32.2 billion due to higher sales.
Selling and Administrative Expenses from Continuing Operations
Selling and administrative expenses from continuing operations relate to salaries, compensation, administrative expenses, depreciation, amortization and impairment losses, and office materials and supplies.
The following table sets forth our consolidated selling and administrative expenses from continuing operations in Chilean pesos, and as a percentage of total selling and administrative expenses from continuing operations, for the years ended December 31, 2015 and 2014:
|
| Year ended December 31, |
| |||||||||||||
|
| 2015 |
|
| 2014 |
| ||||||||||
|
| (in millions of Ch$) |
|
| (in %) |
|
| (in millions of Ch$) |
|
| (in %) |
| ||||
Depreciation, amortization and impairment losses |
|
| 115,042 |
|
|
| 44.1 | % |
|
| 113,766 |
|
|
| 49.8 | % |
Other expenses |
|
| 90,340 |
|
|
| 34.6 | % |
|
| 66,336 |
|
|
| 29.0 | % |
Employee benefit expense and others |
|
| 55,719 |
|
|
| 21.3 | % |
|
| 48,394 |
|
|
| 21.2 | % |
Total Selling and Administrative Expenses from Continuing Operations |
|
| 261,100 |
|
|
| 100 | % |
|
| 228,496 |
|
|
| 100 | % |
The following table sets forth a comparison of our consolidated selling and administrative expenses from continuing operations between the years ended December 31, 2015 and 2014:
|
| Year ended December 31, |
| |||||||||||||
|
| 2015 |
|
| 2014 |
|
| Change |
|
| Change |
| ||||
|
| (in millions of Ch$) |
|
| (in %) |
| ||||||||||
Total Selling and Administrative Expenses from Continuing Operations |
|
| 261,100 |
|
|
| 228,496 |
|
|
| 32,605 |
|
|
| 14.3 |
|
Total selling and administrative expenses from continuing operations increased by Ch$ 32.6 billion, or 14.3%, in 2015 compared to 2014, mainly due to (i) higher other fixed costs of Ch$ 24.0 billion mostly attributable to increased costs related to the corporate reorganization and higher fines for sanctions and litigations and (ii) higher charges for depreciation of Ch$ 2.8 billion from the full consolidation of GasAtacama Chile.
Operating Income and Operating Margin from Continuing Operations
The following table sets forth our operating income and operating margin from continuing operations, for the years ended December 31, 2015 and 2014:
|
| Year ended December 31, |
| |||||||||||||
|
| 2015 |
|
| 2014 |
|
| Change |
|
| Change |
| ||||
|
| (in millions of Ch$) |
|
| (in%) |
| ||||||||||
Operating income from continuing operations |
|
| 401,819 |
|
|
| 252,262 |
|
|
| 149,556 |
|
|
| 59.3 | % |
Operating margin from continuing operations(1) |
|
| 26.0 | % |
|
| 20.5 | % |
|
| — |
|
|
| — |
|
|
|
The 25.4% increase in revenues from continuing operations offset the 17.4% increase in operating costs (excluding selling and administrative expenses) from continuing operations and a 14.3% increase in selling and administrative expenses from continuing operations and contributed to a 59.3% increase in our operating income in 2015 compared to 2014 and an increase in operating margin from 20.5% to 26.0%.
56
Financial and Other Results from Continuing Operations
The following table sets forth our financial and other results from continuing operations for the years ended December 31, 2015 and 2014:
|
| Year ended December 31, |
| |||||||||||||
|
| 2015 |
|
| 2014 |
|
| Change |
|
| Change |
| ||||
|
| (in millions of Ch$) |
|
| (in%) |
| ||||||||||
Financial results from continuing operations |
|
|
|
|
|
|
|
|
|
|
|
|
|
|
|
|
Financial income |
|
| 235 |
|
|
| 1,586 |
|
|
| (1,351 | ) |
|
| (85.2 | )% |
Financial costs |
|
| (64,207 | ) |
|
| (71,617 | ) |
|
| 7,411 |
|
|
| 10.3 | % |
Gain from indexed assets and liabilities |
|
| 3,600 |
|
|
| 13,926 |
|
|
| (10,326 | ) |
|
| (74.1 | )% |
Foreign currency exchange differences |
|
| (53,880 | ) |
|
| (21,240 | ) |
|
| (32,640 | ) |
| n.a. |
| |
Total financial results from continuing operations |
|
| (114,252 | ) |
|
| (77,345 | ) |
|
| (36,907 | ) |
|
| 47.7 | % |
|
|
|
|
|
|
|
|
|
|
|
|
|
|
|
|
|
Other results from continuing operations |
|
|
|
|
|
|
|
|
|
|
|
|
|
|
|
|
Share of the profit (loss) of associates and joint ventures accounted for using the equity method |
|
| 8,905 |
|
|
| (54,353 | ) |
|
| 63,258 |
|
| n.a. |
| |
Gain from other investments |
|
| 4,309 |
|
|
| 42,652 |
|
|
| (38,342 | ) |
|
| (89.9 | )% |
Loss from sales of assets |
|
| (294 | ) |
|
| — |
|
|
| (294 | ) |
| n.a. |
| |
Total other results from continuing operations |
|
| 12,920 |
|
|
| (11,702 | ) |
|
| 24,622 |
|
| n.a. |
| |
Total financial and other results from continuing operations |
|
| (101,332 | ) |
|
| (89,047 | ) |
|
| (12,285 | ) |
|
| 13.8 | % |
Financial Results from Continuing Operations
Our financial results from continuing operations for the year ended December 31, 2015 was an expense of Ch$ 114.3 billion, an increase of Ch$ 36.9 billion, or 47.7%, compared to 2014. This increase was primarily due to higher charges for foreign currency exchange differences of Ch$ 32.6 billion, mainly as a result of the devaluation of the Chilean peso against the U.S. dollar that affected the valuation of intercompany debt owed to Enel Américas.
Other Results from Continuing Operations
Our share of the profit (loss) of associates and joint venture investments accounted for using the equity method for the year ended December 31, 2015 was Ch$ 8.9 billion, an increase of Ch$ 63.3 billion compared to 2014, primarily due to the non-recurring impairment loss of Ch$ 69.1 billion recorded in December 2014 in connection with HidroAysén project, due to our decision not to proceed with this project. This decision was based on the uncertainty of recovering the investment made in the project, mainly as a consequence of the long judicial process in order to obtain environmental approvals.
Gain from other investments was Ch$ 4.3 billion in 2015, a Ch$ 38.3 billion decrease, or 89.9%, compared to 2014. This decrease was primarily due to the non-recurring gain of Ch$ 42.6 billion recorded in 2014 arising from the revaluation of the 50% pre-existing investments in GasAtacama Chile and the recognition of its accumulated currency exchange differences.
Income Tax Expense from Continuing Operations
Total income tax expense from continuing operations totaled Ch$ 76.7 billion in 2015, a decrease of Ch$ 17.4 billion compared to 2014. The effective tax rate was 25.5% in 2015 compared to 57.6% in 2014.
The decrease in total income tax expense from continuing operations and the effective tax rate was mainly due to the absence in 2015 of an adjustment recognized as a net deferred tax liability of Ch$ 60.0 billion in 2014, following the tax reform enacted in Chile on September 29, 2014, partially offset by an increase in income tax expense from continuing operations in 2015 of Ch$ 42.6 billion, related to the improvement of our financial results. The 2014 tax reform established a gradual increase in the taxation rate until 2018 and is expected to slightly affect our results in the future, considering that the main impacts on deferred taxes have been already recognized.
57
Income from Continuing Operations and Net Income
The following table sets forth our consolidated income from continuing operations before income taxes, income tax expenses from continuing operations, income after tax from discontinued operations, and net income for the years ended December 31, 2015 and 2014:
|
| Year ended December 31, |
| |||||||||||||
|
| 2015 |
|
| 2014 |
|
| Change |
|
| Change |
| ||||
|
| (in millions of Ch$) |
|
| (in %) |
| ||||||||||
Operating income from continuing operations |
|
| 401,819 |
|
|
| 252,262 |
|
|
| 149,556 |
|
|
| 59.3 | % |
Total financial and other results from continuing operations |
|
| (101,332 | ) |
|
| (89,047 | ) |
|
| (12,285 | ) |
|
| (13.8 | )% |
Income from continuing operations before income taxes |
|
| 300,487 |
|
|
| 163,215 |
|
|
| 137,272 |
|
|
| 84.1 | % |
Income tax expense, continuing operations |
|
| (76,656 | ) |
|
| (94,058 | ) |
|
| 17,402 |
|
|
| 18.5 | % |
Net income from continuing operations |
|
| 223,831 |
|
|
| 69,157 |
|
|
| 154,674 |
|
| n.a. |
| |
Net income from discontinued operations |
|
| 411,190 |
|
|
| 489,916 |
|
|
| (78,726 | ) |
|
| (16.1 | )% |
Net income |
|
| 635,021 |
|
|
| 559,073 |
|
|
| 75,948 |
|
|
| 13.6 | % |
Net income after tax from continuing operations attributable to the Parent Company |
|
| 392,868 |
|
|
| 276,027 |
|
|
| 116,841 |
|
|
| 42.3 | % |
Net income after taxes from continuing operations attributable to non-controlling interest |
|
| 242,153 |
|
|
| 283,050 |
|
|
| (40,897 | ) |
|
| (14.4 | )% |
The decrease in net income after tax from continuing operations attributable to non-controlling interests of Ch$ 40.9 billion in 2015 compared to 2014 is primarily due to discontinued operations due to the Ch$ 56.3 billion decrease of net income after tax from discontinued operations attributable to the non-controlling interests of Emgesa as well as to the Ch$ 11.3 billion decrease of net income after tax from discontinued operations attributable to the non-controlling interests of Costanera in 2015. This was partially offset by a Ch$ 32.2 billion increase of net income after tax from discontinued operations attributable to the non-controlling interests of El Chocón in 2015, mainly due to corresponding increases and decreases in net income of our subsidiaries that were contributed to Endesa Américas in the spin-off. The controlling and economic interest of these subsidiaries is the same in both years.
II. Analysis of Results from Discontinued Operations
The following table sets forth the revenues by geographical location, as a percentage of our total consolidated revenues from discontinued operations years ended December 31, 2015 and 2014:
|
| Year ended December 31, |
| |||||
|
| 2015 |
|
| 2014 |
| ||
|
| (as a % of total) |
| |||||
Argentina |
| 10.8 |
|
|
| 8.7 |
| |
Colombia |
| 59.8 |
|
|
| 62.0 |
| |
Peru |
| 29.3 |
|
|
| 29.1 |
| |
Chile |
| 0.3 |
|
|
| 0.4 |
| |
Intercompany transaction adjustments(1) |
|
| (0.2 | ) |
|
| (0.2 | ) |
Total revenues from discontinued operations |
|
| 100 |
|
|
| 100 |
|
|
|
The following tables set forth our revenues from discontinued operations, physical energy sales and generation (expressed in GWh) by geographical location, in each case for the years ended December 31, 2015 and 2014:
|
| Year ended December 31, |
| |||||||||||||
Revenues |
| 2015 |
|
| 2014 |
|
| Change |
|
| Change |
| ||||
|
| (in millions of Ch$) |
|
| (in %) |
| ||||||||||
Argentina |
|
| 140,399 |
|
|
| 105,265 |
|
|
| 35,134 |
|
|
| 33.4 | % |
Colombia |
|
| 778,756 |
|
|
| 753,373 |
|
|
| 25,383 |
|
|
| 3.4 | % |
Peru |
|
| 382,452 |
|
|
| 353,795 |
|
|
| 28,657 |
|
|
| 8.1 | % |
Chile |
|
| 4,082 |
|
|
| 5,161 |
|
|
| (1,079 | ) |
|
| (20.9 | )% |
Consolidation adjustment foreign entities |
|
| (2,574 | ) |
|
| (2,035 | ) |
|
| (539 | ) |
|
| (26.5 | )% |
Total revenues from discontinued operations |
|
| 1,303,115 |
|
|
| 1,215,559 |
|
|
| 87,556 |
|
|
| 7.2 | % |
58
|
| Year ended December 31, |
| |||||||||||||
Energy Sales |
| 2015 |
|
| 2014 |
|
| Change |
|
| Change |
| ||||
|
| (in GWh) |
|
| (in %) |
| ||||||||||
Argentina |
|
| 11,968 |
|
|
| 10,442 |
|
|
| 1,526 |
|
|
| 14.6 | % |
Colombia |
|
| 16,886 |
|
|
| 15,773 |
|
|
| 1,113 |
|
|
| 7.1 | % |
Peru |
|
| 8,633 |
|
|
| 9,320 |
|
|
| (687 | ) |
|
| (7.4 | )% |
Total sales from discontinued operations |
|
| 37,487 |
|
|
| 35,535 |
|
|
| (1,952 | ) |
|
| (5.5 | )% |
|
| Year ended December 31, |
| |||||||||||||
Generation |
| 2015 |
|
| 2014 |
|
| Change |
|
| Change |
| ||||
|
| (in GWh) |
|
| (in %) |
| ||||||||||
Argentina |
|
| 11,405 |
|
|
| 9,604 |
|
|
| 1,801 |
|
|
| 18.8 | % |
Colombia |
|
| 13,705 |
|
|
| 13,559 |
|
|
| 146 |
|
|
| 1.1 | % |
Peru |
|
| 8,218 |
|
|
| 8,609 |
|
|
| (391 | ) |
|
| (4.5 | )% |
Total generation from discontinued operations |
|
| 33,328 |
|
|
| 31,772 |
|
|
| 1,556 |
|
|
| 4.9 | % |
Revenues from operations in Argentina grew by 33.4%, or Ch$ 35.1 billion, in 2015. This increase was explained by Ch$ 25.7 billion greater revenues in Costanera compared to 2014, comprised of Ch$ 8.8 billion due to tariff increases related to Resolution 482/2015, Ch$ 5.6 billion due to 1,195 GWh higher thermal dispatch, and Ch$ 3 billion related to its combined-cycle availability contracts executed with the Secretary of Energy. In addition, El Chocón’s revenues increased by Ch$ 9.8 billion, mostly due to Ch$ 7.6 billion related to 607 GWh higher hydroelectric dispatch because of improved hydrological conditions and Ch$ 2.6 billion attributable to higher tariffs related to Resolution 482/2015.
Revenues from operations in Colombia grew by 3.4%, or Ch$ 25.4 billion in 2015, due to Ch$ 60.2 billion higher physical sales of 1,113 GWh, mainly contracted sales, and Ch$ 90.2 billion increase related to higher sales prices on the spot market as a result of drought caused by El Niño phenomenon. These increases were partially offset by a Ch$ 124.1 billion loss due to the devaluation of the Colombian peso in relation to the Chilean peso, which resulted in a 16.5% decline in terms of Chilean peso in 2015 as compared to 2014.
Revenues from operations in Peru grew by 8.1%, or Ch$ 28.7 billion in 2015, due to the appreciation of Peruvian sol in relation to the Chilean peso resulted in a 2.4% increase in revenues, or Ch$ 52.8 billion compared to 2014. This was partly offset by a Ch$ 19.1 billion decrease from 687 GWh lower physical sales by primarily to distribution companies, and a Ch$ 4.8 billion decrease due to lower spot prices because of lower demand.
Operating Costs from Discontinued Operations
Operating costs from discontinued operations consist primarily of energy purchases from third parties, fuel purchases, depreciation, amortization and impairment losses, maintenance costs, tolls paid to transmission companies, employee salaries and administrative and selling expenses.
The following table sets forth our operating costs from discontinued operations in Chilean pesos, and as a percentage of our consolidated operating costs from discontinued operations for the years ended December 31, 2015 and 2014:
|
| Year ended December 31, |
| |||||||||||||
|
| 2015 |
|
| 2014 |
| ||||||||||
|
| (in millions of Ch$) |
|
| (in %) |
|
| (in millions of Ch$) |
|
| (in %) |
| ||||
Energy purchases |
|
| 181,642 |
|
|
| 24.5 | % |
|
| 108,349 |
|
|
| 18.3 | % |
Fuel consumption |
|
| 140,546 |
|
|
| 19.0 | % |
|
| 100,755 |
|
|
| 17.0 | % |
Transportation costs |
|
| 104,202 |
|
|
| 14.1 | % |
|
| 103,553 |
|
|
| 17.5 | % |
Other raw materials and combustibles |
|
| 55,357 |
|
|
| 7.5 | % |
|
| 56,584 |
|
|
| 9.5 | % |
Other expenses(1) |
|
| 73,291 |
|
|
| 9.9 | % |
|
| 60,036 |
|
|
| 10.1 | % |
Employee benefit expense and other(1) |
|
| 73,291 |
|
|
| 9.9 | % |
|
| 57,341 |
|
|
| 9.7 | % |
Depreciation amortization expense and impairment losses(1) |
|
| 113,219 |
|
|
| 15.3 | % |
|
| 105,894 |
|
|
| 17.9 | % |
Total Operating Costs from discontinued operations |
|
| 741,548 |
|
|
| 100.0 | % |
|
| 592,512 |
|
|
| 100.0 | % |
|
|
59
The table below sets forth our total consolidated operating costs (excluding selling and administrative expenses) from discontinued operations by geographical location for the years ended December 31, 2015 and 2014:
|
| Year ended December 31, |
| |||||||||||||
|
| 2015 |
|
| 2014 |
|
| Change |
|
| Change |
| ||||
|
| (in millions of Ch$) |
|
| (in %) |
| ||||||||||
Argentina |
|
| 9,172 |
|
|
| 15,204 |
|
|
| (6,032 | ) |
|
| (39.7 | )% |
Colombia |
|
| 321,529 |
|
|
| 220,303 |
|
|
| 101,226 |
|
|
| 45.9 | % |
Peru |
|
| 151,046 |
|
|
| 133,735 |
|
|
| 17,311 |
|
|
| 12.9 | % |
Total operating cost (excluding selling and administrative expenses) from discontinued operations |
|
| 481,747 |
|
|
| 369,242 |
|
|
| 112,505 |
|
|
| 30.5 | % |
In Argentina, total operating costs (excluding selling and administrative expenses) from discontinued operations decreased by Ch$ 6.0 billion, or 39.7%, in 2015 as compared to 2014. This decline was comprised of Ch$ 2.3 billion in Costanera and Ch$ 2.2 billion in El Chocón due to lower energy purchases because of the termination of sales contracts, which were not renewed based on current regulations.
In Colombia, total operating costs (excluding selling and administrative expenses) from discontinued operations increased by Ch$ 101.2 billion, or 45.9%, in 2015 as compared to 2014, mainly attributable to Ch$ 95.2 billion higher energy purchases due to higher spot prices, which in turn were a result of the drought, and Ch$ 35.4 billion related to 550 MWh higher thermal generation. These increases were partially offset by a Ch$ 36.5 billion gain due to the devaluation of the Colombian peso in relation to the Chilean peso.
In Peru, total operating costs (excluding selling and administrative expenses) from discontinued operations increased by Ch$17.3 billion, or 12.9%, in 2015 as compared to 2014, mainly due to a Ch$ 20.0 billion higher cost related to the appreciation of the Peruvian sol in relation to the Chilean peso. This increase was partially offset by a Ch$ 2.8 billion decrease related to lower spot prices.
Selling and Administrative Expenses from Discontinued Operations
Selling and administrative expenses from discontinued operations relate to salaries, compensation, administrative expenses, depreciation, amortization and impairment losses and office materials and supplies.
The following table sets forth our selling and administrative expenses from discontinued operations in Chilean pesos and as a percentage of our consolidated total selling and administrative expenses from discontinued operations, for the years ended December 31, 2015 and 2014:
|
| Year ended December 31, |
| |||||||||||||
|
| 2015 |
|
| 2014 |
| ||||||||||
|
| (in millions of Ch$) |
|
| (in %) |
|
| (in millions of Ch$) |
|
| (in %) |
| ||||
Other expenses |
|
| 73,291 |
|
|
| 28.2 | % |
|
| 60,036 |
|
|
| 26.9 | % |
Employee benefit expense and other |
|
| 73,291 |
|
|
| 28.2 | % |
|
| 57,341 |
|
|
| 25.7 | % |
Depreciation amortization expense and impairment losses |
|
| 113,219 |
|
|
| 43.6 | % |
|
| 105,894 |
|
|
| 47.4 | % |
Total selling and administrative expenses from discontinued operations |
|
| 259,800 |
|
|
| 100.0 | % |
|
| 223,271 |
|
|
| 100.0 | % |
60
The following table sets forth our selling and administrative expenses from discontinued operations by geographical location for the years ended December 31, 2015 and 2014:
|
| Year ended December 31, |
| |||||||||||||
|
| 2015 |
|
| 2014 |
|
| Change |
|
| Change |
| ||||
|
| (in millions of Ch$) |
|
| (in %) |
| ||||||||||
Selling and administrative expenses from discontinued operations |
|
|
|
|
|
|
|
|
|
|
|
|
|
|
|
|
Argentina |
|
| 83,942 |
|
|
| 62,106 |
|
|
| 21,836 |
|
|
| 35.2 | % |
Colombia |
|
| 84,362 |
|
|
| 83,538 |
|
|
| 824 |
|
|
| 1.0 | % |
Peru |
|
| 91,750 |
|
|
| 78,902 |
|
|
| 12,848 |
|
|
| 16.3 | % |
Chile |
|
| 2,320 |
|
|
| 760 |
|
|
| 1,560 |
|
| n.a. |
| |
Consolidation adjustments |
|
| (2,574 | ) |
|
| (2,035 | ) |
|
| (539 | ) |
|
| 26.5 | % |
Total selling and administrative expense from discontinued operations |
|
| 259,800 |
|
|
| 223,271 |
|
|
| 36,529 |
|
|
| 16.4 | % |
Selling and administrative expenses from discontinued operations increased by Ch$ 36.5 billion, or 16.4%, during 2015 compared to 2014, mainly as explained below.
In Argentina, selling and administrative expenses from discontinued operations increased by Ch$ 21.8 billion, or 35.2%, primarily due to higher payroll expenses of Ch$ 12.8 billion following increases in the workforce and in wages and benefits during 2015 and higher depreciation and amortization expenses of Ch$ 5.5 billion.
In Peru, selling and administrative expenses from discontinued operations increased by Ch$ 12.8 billion, or 16.3%, mainly due to higher depreciation and amortization expenses of Ch$ 3.8 billion and Ch$ 3.5 billion of impairment losses due to Ch$ 4.7 billion attributable to the impairment of debt in 2015.
Operating Margin from Discontinued Operations
The following table sets forth our operating margin from discontinued operations by geographical location for the years ended December 31, 2015 and 2014:
|
| Year ended December 31, |
| |||||
|
| 2015 |
|
| 2014 |
| ||
|
| (in %) |
| |||||
Operating margin from discontinued operations |
|
|
|
|
|
|
|
|
Argentina |
|
| 33.7 | % |
|
| 26.6 | % |
Colombia |
|
| 47.9 | % |
|
| 59.7 | % |
Peru |
|
| 36.5 | % |
|
| 39.9 | % |
Total operating margin from discontinued operations |
|
| 43.1 | % |
|
| 51.3 | % |
Our operating margin from discontinued operations, or operating income from discontinued operations as a percentage of our revenues from discontinued operations, decreased to 43.1% as of December 31, 2015 as compared to 51.3% for 2014.
This was due to lower operating margins from discontinued operations in Colombia and Peru, partially offset by higher operating margins from discontinued operations in Argentina. Operating margin from discontinued operations in Argentina improved from 26.6% to 33.7% mainly as a consequence of higher tariffs related to Resolution 482/2015 and higher dispatch. The lower operating margin from discontinued operations in Colombia was due to the higher increase of operating costs of 33.6% in comparison to an increase of 3.4% of revenues, mainly related to devaluation of the Colombian peso in relation to the Chilean peso. The operating margin from discontinued operations in Peru decreased from 39.9% to 36.5% mainly due to a 14.2% increase in total operating costs in contrast with an increase in revenues of 8.1%.
61
Operating Income from Discontinued Operations
The following table sets forth our operating income from discontinued operations by geographical location for the years 2015 and 2014:
|
| Year ended December 31, |
| |||||||||||||
|
| 2015 |
|
| 2014 |
|
| Change |
|
| Change |
| ||||
|
| (in millions of Ch$) |
|
| (in %) |
| ||||||||||
Operating income from discontinued operations |
|
|
|
|
|
|
|
|
|
|
|
|
|
|
|
|
Argentina |
|
| 47,284 |
|
|
| 27,955 |
|
|
| 19,329 |
|
|
| 69.1 | % |
Colombia |
|
| 372,865 |
|
|
| 449,533 |
|
|
| (76,668 | ) |
|
| (17.1 | )% |
Peru |
|
| 139,656 |
|
|
| 141,158 |
|
|
| (1,502 | ) |
|
| (1.1 | )% |
Chile |
|
| 1,762 |
|
|
| 4,401 |
|
|
| (2,639 | ) |
|
| (60.0 | )% |
Total operating income from discontinued operations |
|
| 561,567 |
|
|
| 623,047 |
|
|
| (61,480 | ) |
|
| (9.9 | )% |
Financial and Other Results from Discontinued Operations
The following table shows our financial and other results from discontinued operations for the years ended December 31, 2015 and 2014:
|
| Year ended December 31, |
| |||||||||||||
|
| 2015 |
|
| 2014 |
|
| Change |
|
| Change |
| ||||
|
| (in millions of Ch$) |
|
| (in %) |
| ||||||||||
Financial results from discontinued operations |
|
|
|
|
|
|
|
|
|
|
|
|
|
|
|
|
Financial income |
|
| 59,300 |
|
|
| 93,968 |
|
|
| (34,668 | ) |
|
| (36.9 | )% |
Financial costs |
|
| (87,794 | ) |
|
| (65,211 | ) |
|
| (22,583 | ) |
|
| 34.6 | % |
Foreign currency exchange gains (losses), net |
|
| 96,181 |
|
|
| (20,193 | ) |
|
| 116,374 |
|
| n.a. |
| |
Total financial results from discontinued operations |
|
| 67,687 |
|
|
| 8,564 |
|
|
| 59,123 |
|
| n.a. |
| |
|
|
|
|
|
|
|
|
|
|
|
|
|
|
|
|
|
Other results from discontinued operations |
|
|
|
|
|
|
|
|
|
|
|
|
|
|
|
|
Share of the profit of associates and joint ventures accounted for using the equity method |
|
| 38,680 |
|
|
| 61,598 |
|
|
| (22,918 | ) |
|
| (37.2 | )% |
Gain from other investments |
|
| — |
|
|
| 668 |
|
|
| (668 | ) |
| n.a. |
| |
Gain (loss) from the sale of assets |
|
| (509 | ) |
|
| 82 |
|
|
| (591 | ) |
| n.a. |
| |
Total other results from discontinued operations |
|
| 38,171 |
|
|
| 62,348 |
|
|
| (24,177 | ) |
|
| (38.8 | )% |
Total financial and other results from discontinued operations |
|
| 105,858 |
|
|
| 70,912 |
|
|
| 34,946 |
|
|
| 49.3 | % |
Financial Results from Discontinued Operations
Our financial results from discontinued operations for the year ended December 31, 2015 was a profit of Ch$ 67.7 billion, a Ch$ 59.1 billion increase compared to 2014. This result was mainly explained by a Ch$ 116.4 billion gain mainly due to positive foreign currency exchange differences related to accounts receivable denominated in U.S. dollars from the Vuelta de Obligado thermal plant (“VOSA”) of Ch$ 124.8 billion. This plant was financed through the contribution of outstanding debts of CAMMESA owed to our Argentine consolidated entities. These contributions were returned with interest according to the agreement (recorded as a financial income as explained below) and recognized in U.S. dollars, based on the exchange rate as of the date on which the agreement was signed. In December 2015, a technical report confirmed that the gas plant passed all operational tests. Therefore, we accounted for the effects of the dollarization of the receivables based on the current exchange rate between the Argentine peso and the U.S. dollar.
This was partially offset by (i) Ch$ 34.7 billion lower financial income mainly due to Ch$ 84.5 billion non-recurring income recognized in 2014 because of the renegotiation of the terms of Costanera’s debt with Mitsubishi Corporation in October 2014, partially offset by Ch$ 41.6 billion higher interest accrued in accounts receivable from VOSA and (ii) Ch$ 22.6 billion higher financial costs because of greater debt of Costanera with CAMMESA of Ch$ 14.8 billion.
Other Results from Discontinued Operations
Our share of the net profits (loss) of associates and joint ventures accounted for using the equity method totaled Ch$ 38.7 billion for the year ended December 31, 2015, a 37.2% or Ch$ 22.9 billion decrease compared to 2014. This decrease was mainly a result of Ch$ 25.7 billion reduction in net profit from Enel Brasil primarily related to the distribution business.
62
Income Tax Expenses from Discontinued Operations
Income tax expenses from discontinued operations was Ch$ 256.3 billion in 2015, a Ch$ 52.2 billion increase compared to 2014, mainly explained by Ch$ 53.1 billion higher expense in El Chocón due to improved financial results compared to the previous year due to the dollarization of the accounts receivable from VOSA.
The effective tax rate from discontinued operations was 38.4% in 2015 and 29.4% in 2014, mainly as result of higher taxes due to the devaluation of the Chilean peso in terms of U.S. dollar and in corporate tax rate in Colombia.
Income and Net Income from Discontinued Operations
The following table sets forth our consolidated income from discontinued operations before income tax expenses, income tax expenses from discontinued operations and net income from discontinued operations for the year ended December 31, 2015 and 2014:
|
| Year ended December 31, |
| |||||||||||||
|
| 2015 |
|
| 2014 |
|
| Change |
|
| Change |
| ||||
|
| (in millions of Ch$) |
|
| (in %) |
| ||||||||||
Income from discontinued operations before income taxes |
|
| 667,425 |
|
|
| 693,959 |
|
|
| (26,534 | ) |
|
| (3.8 | )% |
Income tax expense from discontinued operations |
|
| (256,249 | ) |
|
| (204,051 | ) |
|
| (52,198 | ) |
|
| (25.6 | )% |
Net Income after taxes from discontinued operations |
|
| 411,176 |
|
|
| 489,908 |
|
|
| (78,732 | ) |
|
| (16.1 | )% |
Net income after tax from discontinued operations attributable to the parent company |
|
| 180,532 |
|
|
| 220,155 |
|
|
| (39,623 | ) |
|
| (18.0 | )% |
Net income after tax from discontinued operations attributable to non-controlling interests |
|
| 230,643 |
|
|
| 269,753 |
|
|
| (39,110 | ) |
|
| (14.5 | )% |
|
|
The following discussion of cash sources and uses reflects the key drivers of our cash flow.
We have a direct ownership interest in GasAtacama Chile (97.4%) and Pehuenche, (92.7 %), our main consolidated subsidiaries. On a stand-alone basis, we receive cash inflows from our own operating assets, from our subsidiaries, as well as from related companies. Our subsidiariessubsidiaries’ and associates’ cash flows may not always be available to satisfy our own liquidity needs mainly because they are not wholly-owned, and because there ismay be a time lag before we have effective access to those funds through dividends or capital reductions.
At December 31, 2016, However, we had a working capital deficit (i.e., total current liabilities exceeded total current assets) of Ch$ 12 billion. As of December 31, 2015, our current assets were Ch$ 1,885 higher than our current liabilities. The 2016 working capital deficit did not represent a material amount, andbelieve that cash flow generated from our business operations, as well as cash balances, borrowings from commercial banks, and related companies,short-term intercompany loans and ample access to the Chilean and international capital markets werewill be sufficient to satisfy all of our needs for working capital, needs,expected debt service, dividends and routineplanned capital expenditures. We believe this will continue to be the case forexpenditures in the foreseeable future.
Our statement of cash flows for 2016 includes cash flows for two months from the discontinued non-Chilean generation businesses as the result of the separation of businesses that occurred on March 1, 2016, compared to the 2015 and 2014 statementsstatement of cash flow thatfor 2017 and 2018, which do not include 12 months of cash flows from the discontinued non-Chilean generation businesses. On March 1, 2016, we transferred all of our ownership in the non-Chilean generation businesses (see Note 4 of the Notesto a newly formed company, Endesa Américas S.A., which was spun off to our consolidated financial statements).shareholders in April 2016 and merged with and into Enel Américas S.A. in December 2016.
Set forth below is a summary of our consolidated cash flow information (including both continued and discontinued operations) for the years ended December 31, 2016, 20152018, 2017, and 2014:2016:
|
| Year ended December 31, |
|
| Year ended December 31, |
| |||||||||||||
|
| 2016 |
|
| 2015 |
|
| 2014 |
|
| 2018 |
| 2017 |
| 2016 |
| |||
|
| (in billions of Ch$) |
|
| (in billions of Ch$) |
| |||||||||||||
Net cash flows provided by operating activities |
|
| 559 |
|
|
| 901 |
|
|
| 817 |
|
| 465 |
| 488 |
| 559 |
|
Net cash flows used in investing activities |
|
| (61 | ) |
|
| (488 | ) |
|
| (327 | ) |
| (228 | ) | (92 | ) | (61 | ) |
Net cash flows used in financing activities |
|
| (520 | ) |
|
| (606 | ) |
|
| (452 | ) |
| (292 | ) | (302 | ) | (520 | ) |
Net increase (decrease) in cash and cash equivalents before effect of exchange rate changes |
|
| (21 | ) |
|
| (193 | ) |
|
| 37 |
|
| (55 | ) | 94 |
| (21 | ) |
Effect of exchange rate changes on cash and cash equivalents |
|
| (14 | ) |
|
| 6 |
|
|
| (24 | ) |
| (4 | ) | 2 |
| (14 | ) |
Cash and cash equivalents at beginning of period |
|
| 150 |
|
|
| 337 |
|
|
| 324 |
|
| 211 |
| 114 |
| 150 |
|
Cash and cash equivalents at end of period |
|
| 114 |
|
|
| 150 |
|
|
| 337 |
|
| 152 |
| 211 |
| 114 |
|
Set forth below is a summary of the net cash flow attributable to discontinued operations for the two months ended February 29, 2016 and for the years ended December 31, 2015 and 2014:2016:
|
| Two months ended February 29, |
|
| Year ended December 31, (12 months) |
| ||||||
|
| 2016 |
|
| 2015 |
|
| 2014 |
| |||
|
| (in billions of Ch$) |
| |||||||||
Net cash provided by operating activities |
|
| 69 |
|
|
| 473 |
|
|
| 568 |
|
Net cash flows used in investing activities |
|
| (26 | ) |
|
| (233 | ) |
|
| (137 | ) |
Net cash flows provided by (used in) financing activities |
|
| 80 |
|
|
| (431 | ) |
|
| (394 | ) |
Net increase (decrease) in cash and cash equivalents before effect of exchange rates changes |
|
| 123 |
|
|
| (191 | ) |
|
| 38 |
|
Effects of exchange rate changes on cash and cash equivalents |
|
| (24 | ) |
|
| 5 |
|
|
| (25 | ) |
Cash and cash equivalents at beginning of period |
|
| 112 |
|
|
| 298 |
|
|
| 286 |
|
Cash and cash equivalents at end of period |
|
| 211 |
|
|
| 112 |
|
|
| 298 |
|
Two months ended | |||
2016 | |||
(in billions of Ch$) | |||
Net cash provided by operating activities | 69 | ||
Net cash flows used in investing activities | (26 | ) | |
Net cash flows provided by (used in) financing activities | 80 | ||
Net increase (decrease) in cash and cash equivalents before effect of exchange rates changes | 123 | ||
Effects of exchange rate changes on cash and cash equivalents | (24 | ) | |
Cash and cash equivalents at beginning of period | 112 | ||
Cash and cash equivalents at end of period | 211 |
For the year ended December 31, 2016,2018, net cash flowflows provided by operating activities from continuing and discontinued operations was Ch$ 559 billion, a decrease of Ch$ 342 billion, or 38%decreased 4.7%, compared to Ch$ 901 billion for the same period in 2015.2017. The main drivers of this change are described below.
The changes
(i) A decrease of Ch$ 189 billion in net cash flow provided by operating activities from continuing operations were primarily due to Ch$ 158 billion higher collections fromon the sale of goods and services mainly compriseddue to:
a. a decrease of Ch$ 221161 billion mainlyin collections from Enel Generation, on a stand-alone basis and excluding intercompany transactions, due to ana lower average sales price and lower sales to regulated customers;
b. a decrease of Ch$ 42 billion in collections from GasAtacama, excluding intercompany transactions, due to lower physical sales mainly in the spot market; and
c. the decrease was offset by Ch$ 43 increase inof physical gas sales collection, compensated by Ch$ 60 billion decrease of physical sales to regulated customerscustomers.
(ii) A decrease in income tax payments of Ch$ 62 billion, mainly as a result of Ch$ 45 billion in tax refunds for recognition of tax losses in Celta and gas export to Argentina,higher monthly payments made by GasAtacama in 2017.
This was partially offset by a decrease of Ch$ 52113 billion in lower collections from the sale of goods and services from GasAtacama Chile related to lower energy sales. This Ch$ 158 billion net cash increase provided by operating activities from continuing operations was offset by a Ch$ 616 billion decrease in net cash inflows related to collections from the sale and payments to suppliers of goods and services from discontinued operations from non-Chilean companies, which ascompared to the same period in 2017, mainly due to a resultdecrease of the spin-off of Endesa Américas are no longer consolidated by us since March 1, 2016.Ch$ 52 billion in fuel costs to Enel Generation.
Other changes from operating activities from continuing and discontinued operations, which decreased the cash provided by operating activities were as follows:
|
|
|
|
|
For the year ended December 31, 2015,2017, net cash flowflows provided by operating activities decreased 12.7%, compared to the same period in 2016 primarily due to the inclusion of Ch$ 69 billion of cash provided by operating activities from continuing and discontinued operations was Ch$ 901 billion, an increase of Ch$ 84 billion, or 10.3%, compared to Ch$ 817 billion for the same period in 2014. The increase was primarily the result of an increase in collections from the sale of goods and services of Ch$ 438 billion comprised of:2016.
|
|
|
|
|
This increase was partially offset by:
|
|
|
|
|
|
64
|
|
|
|
For further information regarding our operationaloperating results in 2016, 20152018, 2017 and 2014,2016, please see “Item 5. Operating and Financial Review and Prospects —“— A. Operating Results. — 2. Analysis of Results of Operations for the Years Ended December 31, 20162018 and 2015”2017” and “Item 5. Operating and Financial Review and Prospects —“— A. Operating Results. — 3. Analysis of Results of Operations for the Years Ended December 31, 20152017 and 2014.2016.”
For the year ended December 31, 2016,2018, net cash flows used inby investing activities from continuing and discontinued operations wasincreased Ch$ 61136 billion, mostly explained byor 148% compared to the same period in 2017, primarily due to an increase of Ch$ 16 billion invested in the acquisition of property, plantfixed assets, mainly in Enel Generation, on an individual basis, and equipmentthe recognition in 2017 of Ch$ 195115 billion of which Ch$ 172 billion was related to our continuing operations, specifically to the 150 MW Los Cóndores project, partially offset by other collections of Ch$ 133 billion from continuing operations related to the sale of equity or debt instruments belonging to other entities, specifically related to the sale of GNL Quintero.Electrogas sale.
For the year ended December 31, 2015,2017, net cash flows used inby investing activities from continuing and discontinued operations wasincreased Ch$ 48831 billion, mostly explained byor 34% compared to the same period in 2016, primarily due to Ch$ 207 billion invested in the acquisition of property, plant and equipmentfixed assets, of which Ch$ 538108 billion including Enel Generación Chile’s (on a stand-alone basis) construction of the 150 MWwas invested in Los Cóndores project, Ch$ 24 billion in the Bocamina II project and Emgesa’s constructionCh$ 31 billion in various expansion plans of El Quimbo power plant.our subsidiary GasAtacama. This was partially offset by (i) proceeds received from investments in time deposits with a maturity greater than 90 days of Ch$ 20115 billion (ii) proceeds received from dividends classified as investment cash flow of Ch$ 11 billion, (iii) Ch$ 9 billion of interest received and (iv) proceeds receivedother collections from the sale of all of our ownership interest in Túnel El Melón of Ch$ 7 billion.equity or debt instruments belonging to other entities, specifically related to the Electrogas sale.
For further information regarding the acquisition of fixed assets in 20162018 and 2015,2017, please see “Item 4. Information of the Company — A. History and Development of the Company — Capital Investments, Capital Expenditures and Divestitures.”
For the year ended December 31, 2016,2018, net cash flows used in financing activities from continuing and discontinued operations wasdecreased Ch$ 52010 billion, or 3.3%, compared to the same period in 2017, mainly due to a decrease of Ch$ 865 billion or 14%, comparedin dividend payments to third parties and an increase of Ch$ 6063 billion for the same period in 2015. The main drivers of the cash used are described below.net collections of loans from related entities
The aggregate cash outflows from financing activities from continuing operationsin 2018 were primarily due to:
·Ch$ 138 billion of payments of loans and bonds by us.
Ch$ 167239 billion in net payments of loans from related entities mainly by us, on a stand-alone basis.
Ch$ 127 billion in dividenddividends payments to third parties, excluding dividends paid to us (includingreceived, of which, Ch$ 117230 billion was paid by us, on a stand-alone basis, and Ch$ 86 billion was paid by Pehuenche among others).
and Ch$ 493 billion of interestwas paid by us.GasAtacama; and
·Ch$ 22147 billion of other outflows ofin interest expenses payments.
For the year ended December 31, 2017, net cash includingflows used in financing activities decreased Ch$ 218 billion, or 42 %, compared to the same period in 2016, mainly due to a non-recurring cash distribution of Ch$ 211 billion as a result of the separation of the Chilean and non-Chilean businesses which took place on March 1, 2016.
These outflows were2016, net payments of loans from related entities in 2016 and a decrease of payments on loans and bonds by us, partially offset by cash inflows from financing activities from continuing operations primarily due to:
Ch$ 137 billionan increase in loans received in connection with our own operations.
For the year ended December 31, 2015, net cash used in financing activities from continuing and discontinued operations increaseddividend payments to Ch$ 606 billion from Ch$ 452 billion in 2014. The main drivers are described below.third parties.
The aggregate cash outflows usedfrom financing activities in financing activities2017 were primarily due to:
·Ch$ 460 billion of loan and bond payments (including Ch$ 140 in loan and bond payments by us, Ch$ 207245 billion in loan and bond payments by Emgesa and Ch$ 67 billion in loan payments by Enel Generación Perú, among others).
Ch$ 400 billion in dividenddividends payments to third parties, excluding dividends paid to us (includingreceived, of which, Ch$ 164236 billion in dividend payments madewas paid by us, Ch$ 1916 billion was paid by Pehuenche and Ch$ 3 billion was paid by GasAtacama;
· Ch$ 44 billion in dividend payments made by Emgesa andinterest expenses payments;
· Ch$ 34 billion dividend payments made by Generandes Perú, including Enel Generación Perú and Chinango, among others).
Ch$ 153 billion of interest paid (including Ch$ 60 billion paid by us and Ch$ 80 billion paid by Emgesa, among others).
65
These outflows were partially offset by cash inflows primarily due to:
Ch$ 796 billion in payments of loans granted to usand bonds by related entities.us; and
·Ch$ 2905 billion in loans granted to Emgesa.are from derivative instrument payments.
Ch$ 29 billion in loans granted to Enel Generación Perú.
Ch$ 18 billion in loans granted to Chinango.
For a description of liquidity risks resulting from the inability of our subsidiaries to transfer funds, please see “Item 3. Key Information — D. Risk Factors — We depend in part on payments from our subsidiaries jointly-controlled entities and associates to meet our payment obligations.”
We coordinate the overall financing strategy of our subsidiaries. However, our subsidiaries independently develop their capital expenditure plans and finance their capital expansion programs through internally generated funds or financings, if necessary. We
have no legal obligations or other commitments to financially support our subsidiaries.subsidiaries financially. In some cases, we may finance our subsidiaries may be financed by us through intercompany loans. For information regarding our commitments for capital expenditures, see “Item 4. Information on the Company — A. History and Development of the Company — Capital Investments, Capital Expenditures and Divestitures” and our contractual obligations table set forth below under “Item 5. Operating and Financial Review and Prospects —“— F. Tabular Disclosure of Contractual Obligations.”
As of December 31, 2018, our consolidated interest-bearing debt totaled Ch$ 841 billion and had the following maturity profile:
· Ch$ 44 billion in 2019;
· Ch$ 66 billion from 2020 to 2021;
· Ch$ 69 billion from 2022 to 2023; and
· Ch$ 662 billion thereafter.
We have accessed the international equity capital markets, with an SEC-registered ADS issuance on August 3, 1994. We have also issued bonds in the United States (“Yankee Bonds”). Since 1996, we and our subsidiary Pehuenche and we have issued a total of US$ 2.8 billion in Yankee Bonds.
The following table lists the Yankee Bonds issued by us outstanding as of December 31, 2016.2018. The weighted average annual coupon interest rate for such bonds is 5.8%, without giving effect to each bond’s duration, or put options.
|
|
|
|
|
|
|
|
|
| Aggregate Principal Amount |
| |||||
Issuer |
| Term |
| Maturity |
| Coupon |
|
| Issued |
|
| Outstanding |
| |||
|
|
|
|
|
| (%) |
|
| (in millions of US$) |
| ||||||
Enel Generación Chile |
| 10 years |
| April 2024 |
|
| 4.250 |
|
|
| 400 |
|
|
| 400 |
|
Enel Generación Chile(1) |
| 30 years |
| February 2027 |
|
| 7.875 |
|
|
| 230 |
|
|
| 206 |
|
Enel Generación Chile(2) |
| 40 years |
| February 2037 |
|
| 7.325 |
|
|
| 220 |
|
|
| 71 |
|
Enel Generación Chile(1) |
| 100 years |
| February 2097 |
|
| 8.125 |
|
|
| 200 |
|
|
| 40 |
|
Total |
|
|
|
|
| 5.813 (3) |
|
|
| 1,050 |
|
|
| 717 |
| |
|
|
|
|
|
|
|
| Aggregate Principal Amount |
| ||
Issuer |
| Term |
| Maturity |
| Coupon |
| Issued |
| Outstanding |
|
|
|
|
|
|
| (%) |
| (in millions of US$) |
| ||
Enel Generation |
| 10 years |
| April 2024 |
| 4.250 |
| 400 |
| 400 |
|
Enel Generation(1) |
| 30 years |
| February 2027 |
| 7.875 |
| 230 |
| 206 |
|
Enel Generation(2) |
| 40 years |
| February 2037 |
| 7.325 |
| 220 |
| 71 |
|
Enel Generation(1) |
| 100 years |
| February 2097 |
| 8.125 |
| 200 |
| 40 |
|
Total |
|
|
|
|
| 5.813 | (3) | 1,050 |
| 717 |
|
(1)Enel Generación Chile We repurchased some of these bonds in 2001.
(2) Holders of our 7.325% Yankee Bonds due 2037 exercised a put option on February 1, 2009, for a total amount of US$ 149.2 million. The remaining US$ 70.8 million principal amount of the Yankee Bonds mature in February 2037.
(3) Weighted-average coupon by outstanding amount. |
|
|
|
We also have access to the Chilean domestic capital markets where we have issued debt instruments including commercial paper and medium and long-term bonds that are primarily sold to Chilean pension funds, life insurance companies and other institutional investors.
The following table lists UF-denominated Chilean bonds issued by us, outstanding as of December 31, 2016.2018.
|
|
|
|
|
| Coupon |
|
|
|
|
|
|
| ||||||||||||||||||||||||||||||||||
|
|
|
|
|
|
|
|
|
| Aggregate Principal Amount |
|
|
|
|
|
| (inflation- |
| Aggregate Principal Amount |
| |||||||||||||||||||||||||||
Issuer |
| Term |
| Maturity |
| Coupon (inflation- adjusted rate) |
|
| Issued |
|
| Outstanding |
|
| Term |
| Maturity |
| adjusted rate) |
| Issued |
| Outstanding |
| |||||||||||||||||||||||
|
|
|
|
|
| ( %) |
|
| (in millions of UF) |
|
| (in millions of UF) |
|
| (in billions of Ch$) |
|
|
|
|
|
| (%) |
| (in millions of UF) |
| (in millions of UF) |
| (in billions of Ch$) |
| ||||||||||||||||||
Enel Generación Chile Series H |
| 25 years |
| October 2028 |
|
| 6.20 |
|
|
| 4.0 |
|
|
| 2.5 |
|
|
| 67 |
| |||||||||||||||||||||||||||
Enel Generación Chile Series M |
| 21 years |
| December 2029 |
|
| 4.75 |
|
|
| 10.0 |
|
|
| 10.0 |
|
|
| 263 |
| |||||||||||||||||||||||||||
Enel Generation Series H |
| 25 years |
| October 2028 |
| 6.20 |
| 4.0 |
| 2.1 |
| 59 |
| ||||||||||||||||||||||||||||||||||
Enel Generation Series M |
| 21 years |
| December 2029 |
| 4.75 |
| 10.0 |
| 10.0 |
| 276 |
| ||||||||||||||||||||||||||||||||||
Total |
|
|
|
|
| 5.04 (1) |
|
|
| 14.0 |
|
|
| 12.5 |
|
|
| 331 |
|
|
|
|
|
| 5.00 | (1) | 14.0 |
| 12.1 |
| 334 |
| |||||||||||||||
(1) Weighted-average coupon by outstanding amount. |
|
For a full description of the local bonds issued by us, see “ — Unsecured liabilities detailed by currency and maturity” and “ — Secured liabilities breakdown by currency and maturity” in Note 1821 of the Notes to our consolidated financial statements.
66
We frequently participate in the international commercial bank markets through syndicated senior unsecured loans. As of December 31, 2016,2018, the amounts outstanding or available for these bank loans are listed below. The syndicated revolving loan due in July 2019 was voluntarily terminated in February 2017, before its due date.
Borrower | Type | Maturity | Facility Amount | Amount Drawn |
| |||||||
(in millions of US$) | (in millions of US$) | |||||||||||
Enel |
|
|
|
| ||||||||
|
| Syndicated revolving loan |
| February 2020 |
| 200 |
| — |
| |||
Total |
|
|
|
|
|
|
| — |
| |||
Both undrawnThis revolving credit facilities arefacility is governed by the laws of the State of New York and dodoes not contain a condition precedent requirement regarding the non-occurrence of a “Material Adverse Effect” (or MAE, as defined contractually) prior to a disbursement, allowing us full flexibility to draw on it for up to US$ 400200 million in the aggregate as of December 31, 2016 and US$ 200 million as of the date of this Report2018, from such committed revolving facilitiesfacility under any circumstances, including situations involving a MAE.
We also borrow from banks in Chile under fully committed facilities under which a potential MAE would not be an impediment to this source of liquidity. In 2016, we entered into a 3-year bilateral revolving loan for an aggregate amount of UF 2.8 million (Ch$ 7579 billion as of December 31, 2016)2018) as set forth in the table below.
Borrower | Type | Maturity | Facility Amount | Amount Drawn |
| |||||||
(in millions of UF) | (in millions of UF) | |||||||||||
Enel |
| Bilateral revolving loan |
| March 2019 |
|
| 2,8 |
| — |
| ||
This facility matured in March 2019 and was not renewed.
As a result of the foregoing, we have access to fully committed undrawn revolving loans, both international and domestic, for up to Ch$ 343217 billion in the aggregate as of December 31, 2016.2018, and up to Ch$ 139 billion as of the date of this Report.
We also borrow routinely from uncommitted Chilean bank facilities with approved lines of credit for approximately Ch$ 23 billion in the aggregate, none of which are currently drawn. Unlike the committed lines described above, which are not subject to MAE conditions precedent prior to disbursements, these facilities are subject to greater risk of not being disbursed in the event of a MAE, and therefore could limit our liquidity under such circumstances.
We may also access the Chilean commercial paper market under programs that have beenneed to be registered with the Chilean SVS for a maximum of US$ 200 million.CMF. Finally, we also have access to other types of financing, including supplier credits, leasing, among others.
Except for the SEC-registered Yankee Bonds, which are not subject to financial covenants, our outstanding debt facilities include financial covenants. The types of financial covenants, and their respective limits, vary from one type of debt to another. As of December 31, 2016,2018, the most restrictive financial covenant affecting usEnel Generation was the leverage ratio in connection with the bilateral revolving loan facility that maturesmatured in March 2019, and boththe syndicated senior unsecured loansloan that maturematures in July 2019 and February 2020, respectively.2020. Under such covenants, the maximum additional debt that could be incurred without a breach is Ch$ 1,6021,956 billion. As of December 31, 20162018, and as of the date of this Report, weour subsidiaries and our subsidiarieswe are in compliance with the financial covenants contained in our debt instruments.
As is customary for certain credit and capital market debt facilities, a significant portion of our financial indebtedness is subject to cross default provisions. Each of the revolving credit facilities described above, as well as our Yankee Bonds, have cross default provisions with different definitions, criteria, materiality thresholds, and applicability as to the subsidiaries that could give rise to a cross default.
The cross default provisions for our revolving credit facilitiesfacility that areis due in July 2019 and in February 2020, governed by the laws of the State of New York, referrefers to defaults of the borrower, without reference to any of our subsidiaries. Under such credit facilities,facility, only matured defaults exceeding US$ 50 million qualify for a potential cross default when the principal exceeds US$ 50 million, or its equivalent in other currencies, although our subsidiaries do not have any financial obligation. In the case of a matured default above the materiality threshold, the revolving credit facility’s lenders would have the option to accelerate if the lenders representing more than 50% of the aggregate debt of a particularthe outstanding facility choose to do so. All of our Yankee Bonds are unsecured and not subject to any guarantees by any of our subsidiaries or parent companies.
Our local facility due in March 2019 does not have cross default provisions to debt other than the respective borrower’s own indebtedness.
67
The Yankee Bonds’ cross default provisions may be triggered by our or our subsidiaries’ debt. A matured default ofby either us or any of our subsidiaries could result in a cross default to our Yankee Bonds if such matured default, on an individual basis, has a principal exceeding US$ 30 million, or its equivalent in other currencies. In the case of the Yankee Bond issued by us in April 2014, due in 2024, the threshold is US$ 50 million, or its equivalent in other currencies. In the case of a matured default above the materiality
threshold, holders of Yankee Bonds would have the option to accelerate if either the trustee or bondholders representing no less than 25% of the aggregate debt of a particular series then outstanding choose to do so.
Our local bonds have no subsidiary cross default provisions.debt facility matured was due in March 2019 and was not renewed.
The payment of dividends and distributions by certain subsidiaries and affiliates are potentially subject to legal restrictions, such as legal reserve requirements, and capital and retained earnings criteria, and other contractual restrictions. We are currently in compliance with the legal restrictions, and therefore, they currently do not affect the payment of dividends or distributions to us. For a description of liquidity risks resulting from our company status, see “Item 3. Key Information — D. Risk Factors — We depend in part on payments from our subsidiaries jointly-controlled entities and associates to meet our payment obligations.”
Our estimated capital expenditures for 20172019 through 20192021 are expected to amount to Ch$ 452367 billion, of which Ch$ 424 billion are considered non-discretionary investments. Maintenanceincludes maintenance capital expenditures, is considered non-discretionary because we need to maintain the quality and operation standards required for our facilities, but we do have some flexibility regarding the timing for these investments. We consider the investment in expansion projects under execution, as non-discretionary expenditures, such as those for Los Cóndores project, as well as water rights. We consider the remaining Ch$ 28 billion as discretionary capital expenditures. The latter includesrights, and expansion projects that are still under evaluation, in which case we would undertake them only if deemed profitable.
We do not currently anticipate liquidity shortfalls affecting our ability to satisfy the material obligations described in this Report. We expect to be able to refinance our indebtedness as it becomes due, fund our purchase obligations outlined previously with internally generated cash and fund capital expenditures with a mixture of internally generated cash and borrowings.
C.Research and Development, Patents and Licenses, etc. |
|
None.
D.Trend Information. |
|
Our subsidiaries are engaged in the generation of electricity in Chile.Chile, which is undergoing changes including more restrictive government regulations, the introduction of new technologies and business models, and more competition. Our business is subject to a wide range of conditions that may result in significant variability in our earnings and cash flows from year to year. We seek to establish a conservative and well-balanced commercial policy, which aims at controlling relevant variables, reducing risks and providing stability into our results of operations.
Our net income is principally the result of operating income from our generation business, and non-operating income, which consists primarily of income arising from related companies accounted for under the equity method, interest expense and tax expense.
In our generation business, ourOur operating income is impactedaffected by the combined effect of several factors including our contracted electricity prices, prevailing hydrological conditions, the price of fuels used to generate thermal electricity, contracted obligations, generation mix, and the electricity prices prevailing in the spot market, among others. The combined effect of many,
Sales prices and sometimes all, of these factors impact our operating income.
Amongenergy costs are among the main drivers of our results of operations of our electricity generation business are our sale prices and energy costs.business. The quantity of electricity sold has been generally stable over time, with increases reflecting economic and demographic growth. Our profits from contracted sales are driven by therely on our ability to generate or buy electricity at a cost lower than the contracted price. However, the applicable price for electricity sales and purchases for electricity sold and purchased in the spot market is much harder to predict because the spot generation price is influenced by many factors. Abundantseveral factors, including hydrology and fuel prices. Thus, abundant hydrological conditions generally lower spot prices, while dry conditions increase them. However, ourthem, although this effect on prices may be partly mitigated with NCRE generation.
Our operating income might not be impacted adversely even when we are required to buy electricity at high prices in the spot market if our commercial policy is appropriately managed. Our goal is to have a conservative and well balancedwell-balanced commercial policy which aims at controllingthat controls relevant variables, provides stability to profits, and mitigates our exposure to the volatility of the spot market by contracting sales of a significant portion of our expected electricity generation through long-term electricity supply contracts. OurThe optimal level of electricity supply commitments is one that allowsprotects us to protect ourselves against low marginal cost conditions, such as those existing during thea rainy season, while still taking advantage of high marginal cost conditions, such as higher spot market prices, during dry years. In order to determine the optimal mix of long-term contracts and sales in the spot market we: (i)we project our aggregate generation taking into consideration our diversified generation mix and the incorporation of new projects under construction and a dry hydrology scenario, (ii)scenario. We then create demand estimates using standard economic theory and (iii) forecast the system’s marginal cost using proprietary stochastic models. We also participate in the energy forward derivatives market, which allows us to negotiate volume and future price, in order to ensure demand and avoid buying in the spot market, which has high volatility and risk.
68
Currently, our contractedOur sales contracts to customers not subject to regulated prices are not standardized and the contractual terms and conditions of these sale contracts are individually negotiated. Typically, when we negotiateWhen negotiating these sale contracts, we try to set the price at a premium over future expected spot prices so as to mitigate the risk of future increases in future spot prices. However, the premium can vary substantially depending on a varietyseveral conditions such
as node values, load profile and the term of conditions. The proportion ofthe contract. Our contracted sales with regulated customers (distributors) has increased in relation to the non-regulated customers. This allowsrepresent on average more than 68% of our sales, allowing us to have consistentmaintain steady prices for longer periods, normally between 10 to 2015 years, which combined with our conservativebalanced commercial policy, generally provides for a stable profit. Most of our profitability. Mostcurrent regulated tariffs are composed of 70% U.S. consumer price index (“CPI”) and 30% commodities prices. Recently,indexed to the tariff components have been 25% of U.S. CPI 25% Henry Hub prices, 25% Brent prices and, 25% coal prices, in order to better reflect highera lesser extent, to commodity dependence.prices. We expect that during the next three years, regulated tariff rates in Chile willtariffs to remain fairly stable, without material changes.changes before 2021, with a downward trend as a result of the full integration of the two electricity systems, the former SIC (central and southern Chile) and SING (northern Chile), into one interconnected system, the SEN, since November 2017. This integration is expected to increase system generation efficiency, especially under extreme situations, and improve investment and commercialization opportunities in both markets, mainly allowing for a higher dispatch of solar and wind power plants located in northern areas. We expect that Los Cóndores will be completed during 2020, adding an average 600 GWh of annual generation to our consolidated generation capacity. In 2022 and 2024, we expect significant price decreases, mainly due to the start of operations of projects tendered in 2016 and 2017, respectively.
In 2022, distribution company contracts awarded to us in the August 2016 auction will come into effect and, therefore, the tariffs of our regulated contracts will decrease as a consequence of the lower prices offered by NCRE providers. In 2024, contracts awarded in the November 2017 auction, the last such process, will come into effect with an average price of the total awarded energy of US$ 32.5 per MWh, 32% lower than the average price of the previous tender process. The total amount of energy tendered was based on NCRE offers, representing a milestone in the industry. We were awarded 54% of the total tender of 2,200 GWh per annum, corresponding to 1,180 GWh per annum at an average price of US$ 34.7 per MWh with a mix of wind, solar and geothermal generation, which will be provided through NCRE projects backed up by conventional energy.
We routinelyregularly participate in energy bids and we have been awarded long-term energy sale contracts. These contracts that incorporate the expected variable costcosts considering changes to the changes in the main variables,most relevant variables. These contracts secure the sale of our current and expected new capacity and allow us to stabilize our income. Currently, 30.6 %Considering the results of our expected annual generation is sold under contracts with terms ofthe last two tenders for regulated customers, we expect NCRE market competitiveness to continue increasing. As a result, offered prices will probably continue to decrease, but at least ten years and 83.0 % is sold under contracts with terms of at least fivea lower rate compared to previous years.
Spot prices could also be affected by international prices forof fuel commodities such as fuel oil, coal and LNG, since Chile does not produce coal or hydrocarbonsthose fuels in any significant quantities. Fuel prices directly affect our results since commodity prices directly affectthermal generation costs, which as of December 31, 2018, represented 44% of our thermal power plants.installed capacity. Commodity prices, mainly oil, materially decreasedhave significantly increased since the second half of 2014 reaching their lowest level in Februarythe first quarter of 2016, and increasing slightly during 2016, but still remaining lower than 2015 prices. Itcharacterized by a high volatility. The trend is expected that fuel prices willto continue into 2019.
The government also established a regulated tender framework, which allows the energy market to increase during 2017 and, therefore our costs would correspondingly increase. Our costs also depend on other factors such as spot prices, generation mix, hydrology conditions and our contractual surpluses/deficits. As described above, our contracted sales prices are indexed to coal, Brent and Henry Hub prices; therefore, sales prices will also be affected by variations of commodity prices, impacting in part our results. Commodities are contracted for long-term periods (10-15 years) and we try to determine the indexation formula based on our cost forecasts. The indexation of long-term sale prices tries to hedge revenues and operating costs, which are also constantly monitored and analyzed to reach favorable hedge positionsaccess this price reduction in the short-term as well.
In order to mitigate the risk of fuel cost increases, we have entered into supply contracts to cover part of the fuel needed to operate the thermal generation units, which operate with natural gas among other types of fuel. In July 2013, we renegotiated a LNG salemedium and purchase agreement with British Gas through 2030, allowing us to secure our long-term LNG supply at competitive prices, with significant flexibility and at capacities sufficient for our current and future needs. This enhances our position to manage fuel supply risks, especially when facing increasing fuel costs scenarios. This is becoming more important as there is an increasing trend to penalize fuel intensive technologies, such as coal and diesel, which have greater environmental impacts.
In 2016, we signed a Terminal Use Agreement with GNL Mejillones, a port located in northern Chile, to discharge LNG, becoming one of the main suppliers in the zone. This agreement allowed us to renew gas purchase contracts with industrial customers and to supply our thermal plants that are part of the SING.
During 2016, the average marginal costs in the SIC decreased by 37% compared to the previous year, mainly due to a decrease in commodity prices, an increase in NCRE generation and a greater availability of thermal electricity generation despite the drought that has affected southern Chile. This decrease could continue depending on the availability of water for generation. The lower marginal cost partially offset ourlong term. A higher energy purchase costs due to higher physical energy purchases in the spot market in 2016 compared to 2015. Also, we increased our thermal generation given the higher availability of the Bocamina and San Isidro thermal power plants. The combination of these factors had a positive effect on our operating income.
Other factors that affect operating income include transmission costs incurred when delivering electricity from its source to end consumers. The transmission charge is set by the Chilean regulator, and has tended to remain stable over time and with the recent regulations, the costs will be progressively transferred to the customers.
NCRE energy generation will increase in the upcoming years. According to the “Study of Integration of NCRE into the National Interconnected System” published by the CDEC -SIC in December 2016, itgrowth rate is expected that NCRE capacity will increase from the current 12.9% of the aggregate capacity of the SIC and the SING to 30% of the estimated capacity of the National Interconnected System (“SIN” in its Spanish acronym, that has replaced and combined the SIC and the SING since January 2017) in 2025. This growth tendency is a direct consequence of several initiatives that the Chilean government is promoting withupcoming years, as required by the Energy Agenda program, which aim to have by 2050 70% ofProgram and the national generation of electricity to be produced by NCRE. The government is also promoting a new transmission law, with which it introduced the “Development Poles” concept to encourage the development of new projects in zones that might have high potential to generate NCRE, using the same transmission system. For more detail, see “Item 4. Information on the Company— B. Business Overview — Electricity Industry Regulatory Framework.”country’s de-carbonization target.
With respect to the development of new projects to increase our installed capacity, the costour strategy is to focus in creating synergies with plants in operation and obtaining economies of developing conventional energy projects has increased over time duescale. We expect to growing environmental restrictions, scarcity of places to locate plants coupled with significant
69
opposition from different groups that delay development and increase costs. On the other hand,continue competing in the last couplefuture through PPA contracts, in part associated with the migration of years,regulated customers from the cost of NCRE has decreased as a result of technological improvements, enabling smaller projects to become profitable while simultaneously facing less environmental restrictionsdistribution business, mainly mining and minor opposition. Inlarge industries. The continuous addition NCRE sources have a shorter construction period and their smaller size provides more flexibility to address changes in demand. The emergence of NCRE power plants to the grid will require that markets be more flexiblefurther market flexibility and focus on operational efficiency to combine the different technologies.
Enel, our ultimate controlling shareholder, announcedtechnologies while maintaining the security and the system’s supply reliability, which is typically a NCRE weakness. Wind and solar sources, the NCRE sources most widely used, have higher intermittency than other non-NCRE facilities since they can only generate electricity when the wind blows or the sun shines. Battery energy solutions will likely play a key role in October 2015 that it will no longer build coal power plants because it considers the technology to be counterproductive considering its desire to be carbon neutral by 2050. Closures of these existing coal power plants are scheduled at the end of their life cycles. The lost capacity will most likely be substituted with NCRE generation.
For more detail on how factors impact the net income of our electricity generation business and 2016 results compared with those recorded in previous periods, see “Item 5. Operating and Financial Review and Prospects — A. Operating Results — 1. Discussion of Main Factors Affecting Operating Results and Financial Condition of the Company” and “Item 5. Operating and Financial Review and Prospects — A. Operating Results — 2. Analysis of Results of Operations for the Years Ended December 31, 2016 and 2015.”
We expect reasonably good operating performance during the coming years given the macroeconomic perspective for Chile. Despite current uncertainties concerning the global economy, there is favorable expectation for Chile’s growth during the next five years, including an expected 1.8% growth in GDP in 2017, based on Latin American Consensus Forecasts published by Consensus Economics Inc. on March 20, 2017,decade, providing a crucial solution for frequency control and an expected 4% growthgrid stability in the annual electricity demand over the next five years.context of significant wind and solar penetration.
E.Off-balance Sheet Arrangements.
We are not a party to any off-balance sheet arrangements
The table below sets forth our cash payment obligations as of December 31, 2016:2018:
|
| Payments due by Period |
|
| Payments due by Period |
| |||||||||||||||||||||||||
Ch$ billion |
| Total |
|
| 2017 |
|
| 2018-2019 |
|
| 2020-2021 |
|
| After 2021 |
|
| Total |
| 2019 |
| 2020-2021 |
| 2022-2023 |
| After 2024 |
| |||||
Purchase obligations(1) |
|
| 7,017 |
|
|
| 399 |
|
|
| 723 |
|
|
| 728 |
|
|
| 5,167 |
|
| 3,796 |
| 1,519 |
| 1,416 |
| 811 |
| 50 |
|
Interest expense(2) |
|
| 494 |
|
|
| 53 |
|
|
| 103 |
|
|
| 101 |
|
|
| 237 |
|
| 565 |
| 53 |
| 106 |
| 95 |
| 311 |
|
Yankee bonds |
|
| 480 |
|
|
| 0 |
|
|
| 0 |
|
|
| 0 |
|
|
| 480 |
|
| 498 |
| — |
| — |
| — |
| 498 |
|
Local bonds |
|
| 354 |
|
|
| 5 |
|
|
| 59 |
|
|
| 59 |
|
|
| 231 |
|
| 357 |
| 53 |
| 62 |
| 62 |
| 180 |
|
Financial leases |
|
| 21 |
|
|
| 3 |
|
|
| 5 |
|
|
| 5 |
|
|
| 8 |
|
| 14 |
| 2 |
| 7 |
| 5 |
| — |
|
Pension and post-retirement obligations(4) |
|
| 17 |
|
|
| 3 |
|
|
| 2 |
|
|
| 2 |
|
|
| 9 |
|
| 15 |
| 3 |
| 2 |
| 2 |
| 8 |
|
Total contractual obligations |
|
| 8,383 |
|
|
| 464 |
|
|
| 893 |
|
|
| 895 |
|
|
| 6,132 |
|
| 5,245 |
| 1,631 |
| 1,593 |
| 975 |
| 1,047 |
|
|
|
|
|
|
|
| (1) Of the total contractual obligations of Ch$ 3.796 billion, 50% corresponds primarily to fuel supply, 21% corresponds to tolls services and the remaining 29% corresponds to miscellaneous services. (2) Interest expense includes the interest payments for all outstanding financial obligations, calculated as principal multiplied by the interest rate, as of the date when each interest payment comes due. (3) Hedging instruments might substantially affect the outstanding amount of debt. (4)We have funded and unfunded pension and post-retirement benefit plans. Our funded plans have contractual annual commitments for contributions, which do not change based on funding status. Cash flow estimates in the table are based on such annual contractual commitments including certain estimable variable factors such as interest. Cash flow estimates in the table relating to our unfunded plans are based on future discounted payments necessary to meet all of our pension and post-retirement obligations. |
G.Safe Harbor. |
|
The information contained in Items 5.E and 5.F contains statements that may constitute forward-looking statements. See “Forward-Looking Statements” in the “Introduction” of this information statement, for safe harbor provisions.
70
Item 6.Directors, Senior Management and Employees
A.Directors and Senior Management.
|
|
Directors
Our Board of Directors consists of nine members who are elected for a three-year term at an Ordinary Shareholders’ Meeting (“OSM”). If a vacancy occurs in the interim, the Board of Directors elects a temporary director to fill the vacancy until the next OSM, at which time the entire Board of Directors will be elected.up for election. Our Executive Officers are appointed and hold office at the discretion of the Board of Directors.
The business address
In the Extraordinary Shareholders’ Meeting of our directors is c/o Enel Generación Chile S.A., Santa Rosa 76, Santiago, Chile.
Our BoardSA, held on April 24, 2018, the amendment of Directors is as follows:article seven of the Company´s bylaws, which would reduce the number of directors from 9 to 5, was approved. The amendment was agreed to take effect at the time of the constitution of the OSM held on April 26, 2019. This amendment seeks to simplify the Company’s
administration after the 2018 Reorganization, and for economy and corporate efficiency, given the new shareholding structure of the Company.
|
|
| ||
|
|
| ||
|
|
| ||
|
|
| ||
|
|
| ||
|
|
| ||
|
|
| ||
|
|
| ||
|
|
| ||
|
|
|
Set forth below are brief biographical descriptions of theThe members of our Board of Directors of whom four reside in Chile and the rest in Europe, as of December 31, 2016.2018, were as follows:
Giuseppe Conti
Chairman of the Board of Directors
Mr. Conti has been Head of Legal &Corporate Affairs of Enel Green Power S.p.A. since 2014 and has held several positions within Enel since he joined the company in 2003. Between 2012 and 2013, he served as Head of Significant Litigation and Legal Coordination for Enel. Between 2009 and 2012, he served as Head of Legal Coordination and Research and Development for Endesa, S.A. (Spain), an Enel subsidiary. Previously, he worked as an in -house lawyer for Enel and Enel Green Power North America Inc. Mr. Conti holds a law degree from Università degli Studi di Messina (Messina, Italy).
(1) As of April 30, 2019.
Messrs Atton, Cibié, Di Carlo and Magrini resigned from their positions as Directors in 2018. As required by Chilean law, the entire Board of Directors was up for election at the OSM held on April 26, 2019, for a new three-year term ending in April 2022
The five members of the Board of Directors as of the date of this Report are:
· Giuseppe Conti (Chairman)
· Maria Soledad Arellano S.
· Fabrizio Barderi
· Cristiano Bussi
· Julio Pellegrini V.
Set forth below are brief biographical descriptions of the members of our Board of Directors, of whom five reside outside Chile and four reside in Chile, as of December 31, 2018:
Giuseppe Conti
Mr. Conti has headed Legal & Corporate Affairs of Enel S.p.A. since 2017 and has held several managerial positions within Enel including heading Legal and Corporate Affairs of Enel Green Power S.p.A. (2014-2017), Enel Litigation and Legal Coordination (2012-2013), and Legal Coordination and Research and Development of Endesa, S.A., an Enel subsidiary in Spain (2009-2012). Mr. Conti holds a law degree from Università degli Studi di Messina.
Maria Soledad Arellano S.
Ms. Arellano is the Academic Vice Rector of the Universidad Adolfo Ibáñez. In addition, she is Director of the Caja de Compensación La Araucana and the Ecert Chile. Previously, she assumed the position of Sub secretary of Planning and the position of Sub Secretary of Social Evaluation (2010-2014). Ms. Arellano holds a bachelor’s degree in commercial engineering, with mention in economics, a master’s degree in economics from the Pontificia Universidad Católica de Chile and a Ph.D. in economics from Massachusetts Institute Technology.
Fabrizio Barderi
Mr. Barderi heads Planning and Control within the Global Trading Business and Latin America Regional Energy Management for Enel S.p.A. He headed Generation Fleet Management in Enel Produzione S.p.A, and Power Origination and Wholesale position in Enel Trade S.P.A. (2008-2013). Mr. Barderi holds a bachelor’s degree in electrical engineering from the Università di Pisa and a master’s degree in economics and energy and environmental management from the Scuola Superiore Enrico Mattei.
Cristiano Bussi
Mr. Bussi heads the Global Thermal Generation Planning & Control department of Enel since September 2018. Previously, he headed several managerial position in Enel: Head of the Operational Performance Optimization (January 2018 — September 2018), Head of the Operational Control in the Planning and Control department (2015-2017), Head of the Planning and Control Generation Italy (2014-2015). Mr. Bussi holds a degree in chemical engineering from the Università di Pisa.
Hernán Cheyre V.
Mr. Cheyre is a director of Telefónica Chile, Inversiones Aguas Metropolitanas, and Molymet, among others. In 1985, he founded the consulting company Econsult, and served as Chairman. He was Executive VP of Corfo, the state agency, between 2010-2014. He was CEO of the risk-rating agency Duff and Phelps Chile (1990-2000), and Fitch Chile (2000-2004). Mr. Cheyre holds bachelor’s degrees in economic sciences and commercial engineering from the Pontificia Universidad Católica de Chile, and a master’s degree in economics from the University of Chicago.
Francesco Giorgianni
Mr. Giorgianni has been the Data Protection Officer of Enel S.p.A. since June 2017. He was the Institutional Affairs Officer for Enel Américas since 2014 and the Head of Enel’s Institutional Affairs worldwide since 2011. In 2007-2011, he headed Enel’s European and Italian Institutional Affairs in Rome. Mr. Giorgianni holds a degree in law from Università di Roma La Sapienza, and graduate degrees from the Scuola Nazionale dell’Amministrazione, and the London Business School.
Luca Noviello
Mr. Noviello has been the Head of Operations & Maintenance at Enel’s Global Thermal Generation since June 2016. He also headed Human Resources at Global Generation (2014-2016). In the past, he headed Oil & Gas Power Generation (2011-2014). He was Head of Generation & Engineering Procurement (2007-2011) and Internal Audit Department for Generation and International Division (2003-2006). Mr. Noviello holds a bachelor’s degree in mechanical engineering from Università degli Studi di Roma La Sapienza and a master’s degree in economics and energy management from LUISS Scuola di Management.
Julio Pellegrini V.
Mr. Pellegrini is a partner at Pellegrini & Cía., a Chilean law firm specialized in commercial litigation, arbitration, regulation and antitrust. He has been a member of the Consejo Consultivo del Centro de Libre Competencia, an antitrust advisory committee of the Pontificia Universidad Católica de Chile since 2012, where he has also taught civil law, antitrust and economics law since 2003. Since 2011, he has been a board member of the Chilean Bar Association and Chairman of its Antitrust Commission. Mr. Pellegrini holds a law degree from Pontificia Universidad Católica de Chile and a master’s degree in law from the University of Chicago.
Antonio Scala
Mr. Scala is the Head of South America at Enel Green Power S.p.A. He joined Enel in 2009 as Head of Risk Management for Energy Management Italy where he also served as Head of Industrial Development until 2013, when he moved to Enel Energia to become Head of Energy Service Mass Market. He was also the Head of Planning and Control of Global Trading. Mr. Scala holds a degree in business administration in Roma.
Executive Officers
Set forth below are our Executive Officers as of December 31, 2018.
The business address of our Executive Officers is c/o Enel Generación Chile S.A., Santa Rosa 76, Santiago, Chile.
Executive Officers |
| Position |
| Age (2) |
| First joined Enel or |
| Current Position |
Valter Moro |
| Chief Executive Officer |
| 52 |
| 1996 |
| 2014 |
Raúl Arteaga E. |
| Chief Financial Officer |
| 60 |
| 1985 |
| 2016 |
Bernardo Canales F. |
| Engineering & Construction Officer |
| 49 |
| 1996 |
| 2016 |
Juan Candia N.(1) |
| Planning and Control Officer |
| 42 |
| 2007 |
| 2017 |
Carlo Carvallo A. |
| Chilean Hydroelectric Generation Officer |
| 56 |
| 1989 |
| 2016 |
Humberto Espejo P. |
| Trading & Marketing Officer |
| 49 |
| 1996 |
| 2015 |
Claudio Órdenes T. |
| Thermal Engineering & Construction Officer |
| 50 |
| 1996 |
| 2016 |
Ignacio Quiñones S. |
| General Counsel |
| 56 |
| 1989 |
| 2013 |
Michele Siciliano |
| Chilean Thermal Generation Officer |
| 45 |
| 2001 |
| 2016 |
Luis Alberto Vergara A. |
| Human Resources Officer |
| 47 |
| 1996 |
| 2016 |
(1) Mr. Valter Moro is also the Interim Business Development Officer and the Interim Regulation Officer.
(2) As of April 30, 2019.
Set forth below are brief biographical descriptions of our Executive Officers, all of whom reside in Chile:
Valter Moro: Mr. Moro was headed La Spezia Power Plant in Italy (2009-2014), and served in managerial capacities in Generation and Energy Management (2008-2009), Energy Management of Enel Viesgo in Spain (2006-2008) and Production Optimization Officer of the power generation at Enel’s Energy Management in Italy (2003-2006). Mr. Moro holds a mechanical engineering degree and a Ph.D. in energy engineering from Università Politécnica delle Marche.
Raúl Arteaga E.: Mr. Arteaga has served in various managerial positions in finance, treasury and investor relations in Enel affiliates in Chile and Argentina. Mr. Arteaga has also been Chairman of Pehuenche S.A. and GasAtacama, two of our Chilean generation subsidiaries, since 2016. Mr. Arteaga holds a degree in industrial civil engineering from the Universidad de Chile.
Juan Candia N.: Mr. Candia is currently Chairman of Almeyda Solar SpA and Director of Pehuenche. From 2015-2017, he was responsible for P&C Market Chile. Mr. Candia has held several managerial positions in planning and control and finance for our affiliates. Mr. Candia holds a civil engineering degree from Pontificia Universidad Católica de Valparaíso and Universidad Técnica Federico Santa María (both in Valparaíso, Chile) and an MBA from the Pontificia Universidad Católica de Chile.
Bernardo Canales F.: Mr. Canales held the positions of Regional Engineering Officer since November 2010 and director of Canela and HidroAysén. From 2006-2010, he was the Chief Technical Officer of HidroAysén. From 2004-2006, he was CEO of Enel Generación Piura (Peru). From 2000-2004, he was Head of Production Projects in Chile and South America. Mr. Canales holds a degree in mechanical engineering from Universidad de Chile.
Carlo Carvallo A.: Mr. Carvallo has been the CEO of Pehuenche since 2015, and is the director of Canela and HidroAysén. He has served as Deputy Hydroelectric Generation Officer (2013-2016), Deputy Technical Service Officer (2011-2013), Deputy Southern Hydroelectric Plants Officer (2009-2011) and Deputy Maintenance Officer (2005-2009). Mr. Carvallo holds a degree in industrial engineering from Universidad de Chile.
Humberto Espejo P.: Mr. Espejo has held managerial positions in business development, regulatory and commercial areas, including serving on the boards of our affiliates. Mr. Espejo served on the board of the CDEC-SIC, the former operator of the principal Chilean electricity grid. He holds a bachelor’s degree in industrial engineering and a master’s of science in engineering from Pontificia Universidad Católica de Chile and a master’s of science degree in economic policy from the University of Illinois.
Claudio Órdenes T.: Mr. Órdenes was Head of Thermal Projects in 2015-2016 and Deputy Thermal Project Officer for the previous four years. He was Head of Mechanical Engineering (2007-2010) of the Thermal Mechanical Engineering Department (2007). He was Project Manager of the Ventanilla Thermal Power Plant Conversion (2004-2006). He was Head of Commissioning of Fortaleza, Brazil (2001-2004). Mr. Órdenes holds a degree in mechanical engineering from Universidad de Santiago de Chile.
Ignacio Quiñones S.: Mr. Quiñones is a director of several affiliates. He was Chilean General Counsel for Anglo American Chile Ltda., a mining company (2005-2013). He was Head of the Legal Area in Gasoducto del Pacífico S.A., a natural gas transportation company (2004-2005). He worked as a lawyer for Placer Dome Latin America, a mining company (1996-2004), and then as Legal Advisor for Compañía Minera Zaldívar. Mr. Quiñones holds a degree in law from Universidad Diego Portales.
Michele Siciliano: Mr. Siciliano has held several generation and energy management positions including heading Generation Brazil (2015-2016), Central Maintenance in Italy Generation (2015), Sulcis Business Unit (2009-2014), Piombino Business Unit (2008-2009), Bari Business Unit (2006-2007), and Maintenance at the Brindisi Business Unit (2003-06). Mr. Siciliano holds a degree in mechanical engineering from Università degli Studi della Calabria.
Luis Alberto Vergara A.: Mr. Vergara was previously the Head of Generation and Energy Management Development of Enel for four years. Mr. Vergara worked for Enel Américas as Head of Organization and Planning of Human Resources at the regional level (2007-2012). Mr. Vergara holds a degree in electronic civil engineering from Universidad Técnica Federico Santa María and an MBA from the Pontificia Universidad Católica de Chile.
B.Compensation.
At the OSM held on April 24, 2018, our shareholders approved the current compensation policy for our Board of Directors. Director compensation consists of a monthly fixed compensation of UF 174 per month and an additional fee of UF 84 per meeting, up to a maximum of 15 meetings in total, including ordinary and extraordinary meetings, within the respective fiscal year. The Chairman of the Board is entitled to double the compensation compared to other directors.
The members of our Directors’ Committee are paid a monthly fee of UF 58 and an additional fee of UF 28 per meeting, up to a maximum of 15 meetings in total, including ordinary and extraordinary meetings.
If a director serves on one or more Boards of Directors of the subsidiaries and/or related companies or serves as director of other companies or corporations in which the economic group holds an interest, whether directly or indirectly, the director can only receive compensation from one of these Boards of Directors.
Executive Officers of our Company and/or of our subsidiaries or related companies will not receive compensation in the case that they serve as director of any subsidiary, related company or are affiliated in any way to our Company.
In 2018, the total compensation paid to each of our directors, including fees for attending Directors’ Committee meetings, was as follows:
|
| Year ended December 31, 2018 |
| ||||||||||
Director |
| Fixed |
| Ordinary and |
| Directors’ |
| Ordinary and |
| Variable |
| Total |
|
|
| (in Th Ch$) |
| ||||||||||
Giuseppe Conti (1) |
| — |
| — |
| — |
| — |
| — |
| — |
|
Francesco Giorgianni (1) |
| — |
| — |
| — |
| — |
| — |
| — |
|
Francesco Buresti (1) |
| — |
| — |
| — |
| — |
| — |
| — |
|
Mauro Di Carlo (1) |
| — |
| — |
| — |
| — |
| — |
| — |
|
Umberto Magrini (1) |
| — |
| — |
| — |
| — |
| — |
| — |
|
Luca Noviello (1) |
| — |
| — |
| — |
| — |
| — |
| — |
|
Enrique Cibié B. |
| 14,043 |
| 9,038 |
| 4,681 |
| 2,259 |
| — |
| 30,021 |
|
Hernán Cheyre V. |
| 42,724 |
| 25,189 |
| 14,241 |
| 8,396 |
| — |
| 90,550 |
|
Jorge Atton P. |
| 47,181 |
| 29,600 |
| 15,727 |
| 9,113 |
| — |
| 101,621 |
|
Julio Pellegrini V. |
| 56,767 |
| 34,228 |
| 18,922 |
| 10,656 |
| — |
| 120,573 |
|
Total |
| 160,715 |
| 98,055 |
| 53,571 |
| 30,424 |
| — |
| 342,765 |
|
(1) Messrs. Conti, Giorganni, Buresti, Di Carlo, Magrini, Noviello, Bussi and Scala waived their compensation due to their current position as Directors of the Company.
We do not disclose, to our shareholders or otherwise, any information about an individual Executive Officer’s compensation. Executive Officers are eligible for variable compensation under a bonus plan. The annual bonus plan is paid to our Executive Officers for achieving company-wide objectives and for their individual contribution to our results and objectives. The annual bonus plan provides for a range of bonus amounts according to seniority level and consists of a certain multiple of gross monthly salaries. For the year ended December 31, 2018, the aggregate gross compensation, paid or accrued, for all of our Executive Officers, attributable to fiscal year 2018, was Ch$ 2,614 million in fixed compensation and Ch$ 476 million in variable compensation and benefits.
We entered into severance indemnity agreements with all of our Executive Officers, pursuant to which we will pay a severance indemnity in the event of voluntary resignation or termination by mutual agreement among the parties. The severance indemnity does not apply if the termination is due to willful misconduct, prohibited negotiations, unjustified absences or abandonment of duties, among other causes, as defined in Article 160 of the Chilean Labor Code. All of our employees are entitled to legal severance pay if terminated due to our needs, as defined in Article 161 of the Chilean Labor Code.
No severance indemnity was paid to our Executive Officers in 2018. There are no other amounts set aside or accrued to provide for pension, retirement or similar benefits for our Executive Officers.
C.Board Practices.
Our Board of Directors in office as of December 31, 2018, was elected at the OSM held on April 24, 2018, for a three-year term. However, vacancies occurred due to resignations in November 2018 and therefore, the entire Board of Directors will again be up for election at the OSM to be held in April, 2019. For information about each of the directors and the year that they began their service on the Board of Directors, see “Item 6. — A. Directors and Senior Management” above. Members of the Board of Directors do not have service contracts with us or with any of our subsidiaries that provide them benefits upon termination of their service.
Corporate Governance
Until the OSM held on April 26, 2019, we were managed by a Board of Directors, in accordance with our bylaws, consisting of nine directors who were elected by our shareholders at the 2018 OSM. Subsequent to the April 26, 2019 OSM, we are now managed by a Board of Directors consisting of five directors elected by our shareholders, each of whom serves for a three-year term. Following the end of their terms, they may be re-elected indefinitely or replaced. Staggered terms are not permitted under Chilean law. If a vacancy occurs on the Board of Directors during the three-year term, the Board may appoint a temporary director to fill the vacancy. A vacancy triggers an election for every seat on the Board of Directors at the next OSM.
Chilean corporate law provides that a company’s Board of Directors is responsible for the management and representation of a company in all matters concerning its corporate purpose, subject to the provisions of the company’s bylaws and the shareholders’ resolutions. In addition to the bylaws, our Board of Directors has adopted regulations and policies that guide our corporate governance principles.
Our corporate governance policies are included in the following policies or procedures: the Charter Governing Executives, the Employee Code of Conduct, the Manual for the Management of Information of Interest to the Market (the “Manual”), the Human Rights Policy (Política de Derechos Humanos), the Code of Ethics and a Zero Tolerance Anti-Corruption Plan (the “ZTAC Plan”), the Penal Risk Prevention Model, the “Guidelines 231: Guidelines applicable to non-Italian subsidiaries in accordance with Legislative Decree 231 of June 8, 2001” (the “Guidelines 231”) and procedures issued in compliance with General Regulation 385 issued by the CMF.
The Charter Governing Executives and the Employee Code of Conduct explain our principles and ethical values, establish rules governing our contact with customers and suppliers, and establish the principles that should be followed by employees, including ethical conduct, professionalism and confidentiality. They also impose limitations on the activities that our executives and other employees may undertake outside the scope of their employment with us.
In order to ensure compliance with Securities Market Law 18,045 and CMF regulations, our Board of Directors approved the Manual at its meeting held on May 29, 2008. This document addresses applicable standards regarding the information in connection with transactions of our securities and those of our affiliates, entered into by directors, management, principal executives, employees and other related parties, the existence of blackout periods for such transactions undertaken by directors, principal executives and other related parties, the existence of mechanisms for the continuous disclosure of information that is of interest to the market and
mechanisms that provide protection for confidential information. The Manual was released to the public in 2008 and is posted on our website at www.enelgeneracion.cl. In 2010, the Manual was modified in order to comply with the provisions of Law 20,382 (Corporate Governance Improvement Law). The provisions of this Manual apply to the members of our Board, as well as our executives and employees who have access to confidential information, and especially those who work in areas related to the securities markets.
Our Board of Directors approved a procedure for relationships between Politically Exposed People (Procedimiento Personas Políticamente Expuestas y Conexas) and our Company, which established a specific regulation for their commercial and contractual relationships.
The Human Rights Policy incorporates and adapts the United Nations’ general principles related to human rights into the corporate reality.
In order to supplement the aforementioned corporate governance regulations, our Board of Directors approved a Code of Ethics and the ZTAC Plan at its meeting held on June 24, 2010. The Code of Ethics is based on general principles such as impartiality, honesty, integrity and other ethical standards of similar importance, all of which are expected from our employees. The ZTAC Plan reinforces the principles included in the Code of Ethics, but with special emphasis on avoiding corruption in the form of bribes, preferential treatment, and other similar matters. At its meeting held on January 25, 2017, our Board of Directors approved the amendment to the Code of Ethics and ZTAC Plan to eliminate the reference to Law 19,885 in connection with political donations and to forbid political donations altogether.
At its meeting held on March 31, 2011, our Board approved the Penal Risk Prevention Model in order to comply with Chilean Law 20,393 of December 2, 2009, which imposes criminal responsibility on legal entities for the crimes of asset laundering, financing of terrorism and bribing of public officials. The law encourages companies to adopt this model, whose implementation involves compliance with managerial and supervision duties. The adoption of the Penal Risk Prevention Model mitigates, and in some cases relieves, the effects of criminal responsibility even when a crime is committed.
On October 27, 2010, our Board of Directors approved the Guidelines 231. The Guidelines 231 is defined by Italian Legislative Decree 231, which was enacted on June 8, 2001. It establishes a compliance program that identifies the behaviors expected of related parties for the non-Italian subsidiaries of Enel. Given that our ultimate controlling shareholder, Enel, complies with Italian Legislative Decree 231, which establishes management responsibility for Italian companies as a consequence of certain crimes committed in Italy or abroad, in the name of or for the benefit of such entities, including those crimes described in Chilean Law 20,393, these guidelines set a group of measures, with standards of behavior expected from all employees, advisers, auditors, officials, directors as well as consultants, contractors, commercial partners, agents and suppliers. Legislative Decree 231 includes various activities of a preventive nature that are coherent with and integral to the requirements and compliance with Chilean Law 20,393, which deals with the criminal responsibility of legal entities. These guidelines are supplementary to the standards included in the Code of Ethics and the ZTAC Plan.
On November 29, 2012, the CMF issued General Regulation 341, which established regulations for the disclosure of information with respect to the standards of corporate governance compliance adopted by publicly held limited liability corporations and set the procedures, mechanisms and policies that are indicated in the Appendix to the regulation. The objective of this regulation is to provide credible information to investors with respect to good corporate governance policies and practices adopted by publicly held limited liability corporations, which include us, and permit entities like stock exchanges to produce their own analyses to help the various market participants to understand and evaluate the commitment of companies. General Regulation 341 was substituted by General Regulation 385, issued by the CMF on June 8, 2015. This regulation has similar objectives than the former General Regulation 341, but includes additional issues, by the way of separating each policy into several more detailed policies. Subjects such as non-discrimination, inclusion and sustainability are particularly important in this new regulation. The Appendix of General Regulation 385 is divided into the following four sections with respect to which companies must report the corporate practices that have been adopted: (i) the functioning and composition of the board, (ii) relations between the company, shareholders and the general public, (iii) risk management and control, and (iv) assessment by a third party. Publicly held limited liability corporations should send the information with respect to corporate governance practices to the CMF no later than March 31 of each year, using the contents of the Appendix to this regulation as criteria. If none of them is adopted, the company must explain its reasons to the CMF. The information should refer to December 31 of the calendar year prior to its dispatch. At the same time, such information should also be at the public’s disposal on the company’s website and must be sent to the stock exchanges.
Compliance with the New York Stock Exchange Listing Standards on Corporate Governance
On December 31, 2018, the Company delisted from the NYSE and therefore does not need to comply with the NYSE listing standards.
D.Employees.
The following table sets forth the total number of our personnel (permanent and temporary employees), in Enel Generation and in our subsidiaries as of December 31, 2018, 2017 and 2016:
Company |
| 2018 |
| 2017 |
| 2016 |
|
Enel Generation |
| 678 |
| 753 |
| 790 |
|
Pehuenche |
| 2 |
| 2 |
| 2 |
|
GasAtacama (1) |
| 87 |
| 93 |
| 91 |
|
Total personnel (2) |
| 767 |
| 848 |
| 883 |
|
(1) Includes GasAtacama Argentina S.A.
(2) The total number of temporary employees was not significant.
All Chilean employees who are dismissed for reasons other than misconduct are entitled by law to severance payment. According to Chilean law, permanent employees are entitled to a payment of one-month’s salary for each year (or a six-month portion thereof) worked, subject to a limit of a total payment of no more than 11 months’ pay for employees hired after August 14, 1981. Severance payments to employees hired prior to that date consist of one-month’s salary for each full year worked, not subject to any limitation on the total amount payable. Under our collective bargaining agreements, we are obligated to make severance payments to all covered employees in cases of voluntary resignation or death in specified amounts that increase according to seniority and may exceed the amounts required under Chilean law.
We have the following collective bargaining agreements:
|
| Year ended December 31, 2016 |
| |||||||||||||
Director |
| Fixed Compensation |
|
| Variable Compensation |
|
| Directors’ Committee |
|
| Total |
| ||||
|
| (in Ch$) |
| |||||||||||||
Giuseppe Conti(1) |
|
| — |
|
|
| — |
|
|
| — |
|
|
| — |
|
Francesco Giorgianni(1) |
|
| — |
|
|
| — |
|
|
| — |
|
|
| — |
|
Jorge Aton P. |
|
| 98,102 |
|
|
| — |
|
|
| 29,796 |
|
|
| 127,898 |
|
Francesco Buresti(1) |
|
| — |
|
|
| — |
|
|
| — |
|
|
| — |
|
Enrique Cibié B. |
|
| 98,102 |
|
|
| — |
|
|
| 29,796 |
|
|
| 127,898 |
|
Mauro Di Carlo(1) |
|
| — |
|
|
| — |
|
|
| — |
|
|
| — |
|
Umberto Magrini (1) |
|
| — |
|
|
| — |
|
|
| — |
|
|
| — |
|
Luca Noviello(1) |
|
| — |
|
|
| — |
|
|
| — |
|
|
| — |
|
Julio Pellegrini V. |
|
| 73,865 |
|
|
|
|
|
|
| 23,162 |
|
|
| 97,027 |
|
Felipe Lamarca C.(2) |
|
| 28,744 |
|
|
| — |
|
|
| 6,634 |
|
|
| 35,378 |
|
Isabel Marshall L.(2) |
|
| 28,744 |
|
|
| — |
|
|
| — |
|
|
| 28,744 |
|
Total |
|
| 327,557 |
|
|
| — |
|
|
| 89,388 |
|
|
| 416,945 |
|
In Force | |||||
Company | From | To | |||
Enel Generation - Collective Bargaining Agreement 1 | January 2018 | June 2020 | |||
Enel Generation - Collective Bargaining Agreement 2 | January 2018 | June 2020 | |||
Enel Generation - Collective Bargaining Agreement 3 | January 2018 | December 2020 | |||
Enel Generation - Collective Bargaining Agreement 4 | July 2015 | June 2019 | |||
Enel Generation - Collective Bargaining Agreement 5 | January 2016 | December 2019 | |||
Enel Generation - Collective Bargaining Agreement 6 | July 2016 | June 2020 | |||
GasAtacama | January 2018 | December 2020 | |||
E.Share Ownership.
To the best of our knowledge, none of our directors or officers owns any of our shares nor any stock options. It is not possible to confirm whether any of our directors or officers has a beneficial, rather than direct, interest in our shares. To the best of our knowledge, any share ownership by all of our directors and officers, in the aggregate, amounts to significantly less than 10% of our outstanding shares.
Item 7.Major Shareholders and Related Party Transactions
A.Major Shareholders.
We have only one class of capital stock and Enel Chile, our controlling shareholder, has no different voting rights than our other shareholders. As of March 31, 2019, 13,926 stockholders of record held our 8,201,754,580 shares of common stock outstanding. Enel Chile owned 7,672,584,961 shares of our total common stock, representing a 93.6% direct ownership interest in us. There were three record holders of our ADSs, as of such date.
In connection with analyzing our eligibility to deregister under the Exchange Act, we determined, with the assistance of Nasdaq, that as of March 31, 2019, the number of our ADSs and our shares of common stock beneficially owned in the United States were
1,620,922 ADS and 48,627,660 shares. Except as described above, we cannot readily determine the domicile of any of our foreign shareholders who hold our common stock, either directly or indirectly.
As of March 31, 2019, Chilean stockbrokers, mutual funds, insurance companies, foreign equity funds, and other Chilean institutional investors collectively held 2.75% of our shares, ADS holders owned 0.59% of our shares and the remaining 3.1% of our shares were held by 13,875 minority shareholders.
The following table sets forth certain information concerning ownership of the common stock as of March 31, 2019, with respect to each stockholder known by us to own more than 5% of the outstanding shares of common stock:
|
| Number of Shares |
| Percentage of |
|
Enel Chile |
| 7,672,584,961 |
| 93.6 | % |
Enel Chile is a company primarily engaged, through its subsidiaries and related companies, in the generation and distribution of electricity in Chile. Since June 25, 2009, Enel has been our ultimate parent company and continues to be our ultimate controlling shareholder, and such control is exercised through Enel Chile.
Enel is an energy company with multinational operations in the power and gas markets, with a focus on Europe and Latin America. Enel operates in 34 countries across five continents, produces energy through a managed installed capacity of almost 90 GW, which includes 43 GW of renewable sources, and distributes electricity and gas through a network covering 2.2 million kilometers. With over 73 million users worldwide, Enel has the largest customer base among European competitors and figures among Europe’s leading power companies in terms of installed capacity and reported EBITDA. Enel shares trade on the Milan Stock Exchange.
B.Related Party Transactions.
Article 146 of Law No. 18,046 (the “Chilean Corporations Act”) defines related-party transactions as all transactions involving a company and any entity belonging to the corporate group, its parent companies, controlling companies, subsidiaries or related companies, board members, managers, administrators, senior officers or company liquidators, including their spouses, some of their relatives and all entities controlled by them, in addition to individuals who may appoint at least one member of the company’s board of directors or who control 10% or more of voting capital, or companies in which a board member, manager, administrator, senior officer or company liquidator has been serving in the same position within the last 18 months. The law establishes that in the event that these persons fulfill the requirements established by Article 146, such persons must immediately inform the Board of Directors of their related-party nature, or such other group as the Board of Directors may appoint for that purpose. As required by law, “related-party transactions” must comply with corporate interests, as well as prices, terms and conditions prevailing in the market at the time of their approval. They must also meet all legal requirements, including acknowledgement by the Directors’ Committee and approval of the transaction by the Board of Directors (excluding the affected directors), by the ESM (in some cases, with requisite majority approval) and by any applicable regulatory procedures.
The aforementioned law, which also applies to our affiliates, also provides for some exceptions, stating that in certain cases, Board of Directors approval would suffice for “related-party transactions,” pursuant to certain related-party transaction thresholds and when such transactions are conducted in compliance with the related-party policies defined by the company’s board. At its meetings held on December 17, 2009, and April 23, 2010, our Board of Directors approved a related-party transaction policy (“política de habitualidad”) effective as of January 1, 2010. This policy, which was previously amended by our Board of Directors on April 25, 2012, was newly amended at the Board of Directors held on April 24, 2018. The related-party transaction policy is available on our website at www.enelgeneracion.cl.
If a transaction does not comply with Article 146 of the Chilean Corporations Act, this would not affect the transaction’s validity, but we or our shareholders may demand compensation from the individual associated with the infringement as provided under law, and compensation for damages.
Our largest electricity distribution customer is Enel Distribution, a subsidiary of Enel Chile. The terms of our contracts with Enel Distribution are regulated in accordance with the DFL 4.
Our internal procedure contemplates that all of our subsidiaries’ cash inflows and outflows are managed through our centralized cash management mechanism. It is a common practice in Chile to transfer surplus funds from one company to another affiliate that has a cash deficit. These transfers are executed through either short-term transactions or structured inter-company loans. Under Chilean laws and regulations, such transactions must be carried out on an arm’s-length basis. All of these transactions are subject to the supervision of our Directors’ Committee. As of March 31, 2019, the peso-denominated transactions were priced at TAB 1m (a Chilean interbank interest rate published on a daily basis) plus 1.10% when borrowing and TAB 1m plus 0.00% when lending. The US-dollar denominated transactions were priced at Libor plus 0.90% when borrowing and Libor plus 0.15% when lending.
Our subsidiaries Empresa Eléctrica Pehuenche S.A. and Gas Atacama Chile S.A. and we granted short-term intercompany loans to Enel Chile. As of March 31, 2019, the total outstanding balance of the loans amounted Ch$ 58 million.
We granted short-term intercompany loans to Enel Chile. As of March 31, 2019, the total outstanding balance of the loans amounted Ch$ 5,011 million.
Our subsidiary Gas Atacama Chile S.A. granted short-term intercompany loan to its subsidiary, GasAtacama Argentina (domiciled in Chile). As of March 31, 2019, the total outstanding balance of the loan amounted Ch$ 1,429 million.
All these abovementioned intercompanies loans have the purpose to meet the working capital needs.
Starting from January 1, 2019, all intercompany operating lease contracts began to be considered as financial debt between related parties to comply with the new IFRS16 standards. As of March 31, 2019, the intercompany operating lease agreements amounted to Ch$ 8,468 million.
There are various contractual relationships between Enel Chile and us to provide for intercompany services for us and for our subsidiaries. We entered into intercompany agreements with Enel Chile under which Enel Chile provides a variety of services to us. The services rendered by Enel Chile include certain corporate functions, such as legal, finance, treasury, insurance services, capital markets, financial compliance, accounting, human resources, communications, security, relations with contractors, purchases, IT services, tax services, corporate affairs and other corporate support and administrative services. These services are provided and charged at market prices if there is a comparable service. If there are no comparable services in the market, they will be provided at cost plus a specified percentage. The intercompany services contracts are valid for five years with renewable terms since January 1, 2017.
As of the date of this Report, the abovementioned transactions have not experienced material changes. For more information regarding transactions with related parties, refer to Note 11 of the Notes to our consolidated financial statements.
C.Interests of Experts and Counsel.
Not applicable.
A.Consolidated Statements and Other Financial Information.
See “Item 18. Financial Statements.”
Legal Proceedings
Our subsidiaries and we are parties to legal proceedings arising in the ordinary course of business. We believe it is unlikely that any loss associated with pending lawsuits will significantly affect the normal development of our business.
For detailed information as of December 31, 2018, on the status of the material pending lawsuits that have been filed against us and our subsidiaries, please refer to Note 35.3 of the Notes to our consolidated financial statements. Please note that between March 1, 2016, and December 1, 2016, Endesa Americas was the defendant instead of us for all legal proceedings originating from our former non-Chilean businesses. Since December 1, 2016, and as a consequence of the merger of Endesa Americas with and into Enel Americas, Enel Americas appears as the defendant instead of Endesa Americas for current legal proceedings or those that may arise from our former non-Chilean businesses in South América.
In relation to the legal proceedings reported in the Notes to our consolidated financial statements, we use the criteria of disclosing lawsuits above a minimum threshold of US$ 10 million of potential impact to us and, in some cases, qualitative criteria according to the materiality of the plausible impact in the conduct of our business. The lawsuit status includes a general description, the process status and the estimate of the amount involved in each lawsuit.
Dividend Policy
Our Board of Directors proposes annually to the OSM for approval a definitive dividend payable each year, which is accrued in the prior year and cannot be less than the legal minimum of 30% of annual net income, and informs a dividend policy for the current fiscal year. Additionally, our Board of Directors generally establishes an interim dividend for the current fiscal year, to be paid in January of the following year and which is deducted from the definitive dividend to be paid in May of the following year. The interim dividend is established by the Board of Directors and it is not subject to any restrictions under the Chilean law.
For dividends corresponding to fiscal year 2017, the interim and definitive dividend were paid on January 26, 2018, and May 18, 2018, respectively. The interim dividend of Ch$ 4.93614 per share of common stock was paid as part of the definitive dividend and amounted to 15% of consolidated net income as of September 30, 2017. At the OSM held on April 24, 2018, our shareholders approved the definitive dividend equivalent to Ch$ 28.06102 per share of common stock, but only Ch$ 23.12488 was effectively distributed since the interim dividend paid in January 2018 was deducted from it. The definitive dividend amounted to a payout ratio of 55% based on annual consolidated net income for fiscal year 2017.
For dividends corresponding to fiscal year 2018, on November 29, 2018, the Board of Directors agreed to distribute an interim dividend of Ch$ 11.19557 per share of common stock on January 11, 2019, accrued in fiscal year 2018, amounting to 50% of consolidated net income as of September 30, 2018. At the OSM held on April 26, 2019, our shareholders voted to approve a definitive dividend equivalent to Ch$ 22.60707 per share of common stock for fiscal year 2018, but only Ch$ 11.41150 per share will be effectively distributed on May 17, 2019, after deducting the interim dividend paid in January 2019. The definitive dividend amounts to a payout ratio of 60% based on annual net income for fiscal year 2018.For dividends corresponding to fiscal year 2019, our Board of Directors informed to the OSM held on April 26, 2019, the following Dividend Policy:
· An interim dividend, accrued in fiscal year 2019 and amounting to 15% of consolidated net income as of September 30, 2019, to be paid in January 2020.
· A definitive dividend payout equal to 65% of the annual net income for fiscal year 2019, to be paid in May 2020.
This dividend policy is conditional to net profits obtained in each period, as well as to expectations of future profit levels and other conditions that may exist at the time of such dividend declaration. The proposed dividend policy is subject to our Board of Director’s right to change the amount and timing of the dividends under the circumstances at the time of the payment.
The payment of dividends is potentially subject to legal restrictions, such as the requirement to pay dividends either from the net income or from retained earnings of the fiscal year. There may be also other contractual restrictions such as the non-default on credit agreements. However, these potential legal and contractual restrictions do not currently affect our ability or any of our subsidiaries’ ability to pay dividends. For additional information, see “Item 5. Operating and Financial Review and Prospects — B. Liquidity and Capital Resources.”
Shareholders at each subsidiary and affiliate agree on the definitive dividend payments. Dividends are paid to shareholders of record as of midnight of the fifth business day prior to the payment date. Holders of ADS on the applicable record dates will be entitled to participate in dividends.
Dividends
The table below sets forth, for each of the years indicated, the per share dividend amounts distributed by us in Chilean pesos and the amount of dividends distributed per ADS (one ADS = 30 shares of common stock) in U.S. dollars for income attributable to 2018. For additional information, see “Item 10. Additional Information — D. Exchange Controls”
|
| Dividends distributed(1) |
| ||
Year |
| Nominal Ch$ |
| US$ |
|
2018 |
| 28.06 |
| 1.21 |
|
2017 |
| 28.81 |
| 1.41 |
|
2016(3) |
| 14.58 |
| 0.65 |
|
2015 |
| 20.39 |
| 0.86 |
|
2014 |
| 21.58 |
| 1.07 |
|
2013 |
| 14.29 |
| 0.82 |
|
|
|
|
|
We do not disclose, to our shareholders or otherwise, any information about an individual Executive Officer’s compensation.
For the year ended December 31, 2016, the aggregate gross compensation, paid or accrued, for all of our Executive Officers, attributable to fiscal year 2016, was Ch$ 2,671 million in fixed compensation and Ch$ 347 million in variable compensation. Executive Officers are eligible for variable compensation under a bonus plan. The annual bonus plan is paid to our Executive Officers for achieving company-wide objectives and for their individual contribution to our results and objectives. The annual bonus plan provides for a range of bonus amounts according to seniority level and consists of a certain multiple of gross monthly salaries.
We entered into severance indemnity agreements with all of our Executive Officers, pursuant to which we will pay a severance indemnity in the event of voluntary resignation or termination by mutual agreement among the parties. The severance indemnity does not apply if the termination is due to willful misconduct, prohibited negotiations, unjustified absences or abandonment of duties, among other causes, as defined in Article 160 of the Chilean Labor Code. All of our employees are entitled to legal severance pay if terminated due to our needs, as defined in Article 161 of the Chilean Labor Code.
The total amounts accrued as of the end of 2016 to provide severance indemnity to our Executive Officers totaled Ch$ 878 million, of which Ch$ 150 million was accrued during 2016. There are no other amounts set aside or accrued to provide for pension, retirement or similar benefits for our Executive Officers.
|
|
Our Board of Directors in office as of December 31, 2016 was elected at the OSM held on April 27, 2016, for a three-year term which ends in April 2019. For information about each of the directors and the year that they began their service on the Board of Directors, see “Item 6. — A. Directors and Senior Management” above. Members of the Board of Directors do not have service contracts with us or with any of our subsidiaries that provide them benefits upon termination of their service.
Corporate Governance
We are managed by a Board of Directors, in accordance with our by-laws, consisting of nine directors who are elected by our shareholders at an OSM. Each director serves for a three-year term. Following the end of their term, they may be re-elected or replaced. Directors can be re-elected indefinitely. Staggered terms are not permitted under Chilean law. If a vacancy occurs on the Board of Directors during the three-year term, the Board of Directors may appoint a temporary director to fill the vacancy. Any vacancy triggers an election for every seat on the Board of Directors at the next OSM.
Chilean corporate law provides that a company’s Board of Directors is responsible for the management and representation of a company in all matters concerning its corporate purpose, subject to the provisions of the company’s by-laws and the shareholders’
75
resolutions. In addition to the by-laws, our Board of Directors has adopted regulations and policies that guide our corporate governance principles.
Our corporate governance policies are included in the following policies or procedures: the Charter Governing Executives, the Employee Code of Conduct, the Manual for the Management of Information of Interest to the Market (the “Manual”), the Human Rights Policy (Política de Derechos Humanos), the Code of Ethics and a Zero Tolerance Anti-Corruption Plan (the “ZTAC Plan”), the Penal Risk Prevention Model, the “Guidelines 231: Guidelines applicable to non-Italian subsidiaries in accordance with Legislative Decree 231 of June 8, 2001” (the “Guidelines 231”) and procedures issued in compliance with General Regulation 385 issued by the SVS.
The Charter Governing Executives and the Employee Code of Conduct, explain our principles and ethical values, establish rules governing our contact with customers and suppliers, and establish the principles that should be followed by employees, including ethical conduct, professionalism and confidentiality. They also impose limitations on the activities that our executives and other employees may undertake outside the scope of their employment with us.
In order to ensure compliance with Securities Market Law 18,045 and SVS regulations, our Board of Directors approved the Manual at its meeting held on May 29, 2008. This document addresses applicable standards regarding the information in connection with transactions of our securities and those of our affiliates, entered into by directors, management, principal executives, employees and other related parties, the existence of blackout periods for such transactions undertaken by directors, principal executives and other related parties, the existence of mechanisms for the continuous disclosure of information that is of interest to the market and mechanisms that provide protection for confidential information. The Manual was released to the public in 2008 and is posted on our website at www.enelgeneracion.cl. In 2010, the Manual was modified in order to comply with the provisions of Law 20,382 (Corporate Governance Improvement Law). The provisions of this Manual apply to the members of our Board, as well as our executives and employees who have access to confidential information, and especially those who work in areas related to the securities markets.
Our Board of Directors approved a procedure for relationship between People Politically Exposed (Procedimiento Personas Políticamente Expuestas y Conexas) and our Company, which established a specific regulation for their commercial and contractual relationships.
The Human Rights Policy incorporates and adapts the United Nations’ general principles related to human rights into the corporate reality.
In order to supplement the aforementioned corporate governance regulations, our Board of Directors approved a Code of Ethics and the ZTAC Plan at its meeting held on June 24, 2010. The Code of Ethics is based on general principles such as impartiality, honesty, integrity and other ethical standards of similar importance, all of which are expected from our employees. The ZTAC Plan reinforces the principles included in the Code of Ethics, but with special emphasis on avoiding corruption in the form of bribes, preferential treatment, and other similar matters. At its meeting held on January 25, 2017, our Board of Directors approved the amendment to the Code of Ethics and ZTAC Plan to eliminate the reference to Law 19,885 in connection with political donations and to forbid political donations altogether.
At its meeting held on March 31, 2011, our Board approved the Penal Risk Prevention Model in order to comply with Chilean Law 20,393 of December 2, 2009, which imposes criminal responsibility on legal entities for the crimes of asset laundering, financing of terrorism and bribing of public officials. The law encourages companies to adopt this model, whose implementation involves compliance with managerial and supervision duties. The adoption of the Penal Risk Prevention Model mitigates, and in some cases relieves, the effects of criminal responsibility even when a crime is committed.
At its meeting held on October 27, 2016, our Board approved “The Global Compliance Program on Corporate Penal Liability”, which was incorporated into the Penal Risk Prevention Model to reflect the current standards and also appointed Mr. Rafael Cutrignelli as current Penal Risk Prevention and Global Compliance Program for Corporate Penal Liability Officer, as required by the Penal Risk Prevention Model. Mr. Cutrignelli also serves as Internal Audit Officer for both of Enel Américas and Enel Chile.
On October 27, 2010, our Board of Directors approved the Guidelines 231. The Guidelines 231 is defined by Italian Legislative Decree 231, which was enacted on June 8, 2001. It establishes a compliance program that identifies the behaviors expected of related parties for the non-Italian subsidiaries of Enel. Given that our ultimate controlling shareholder,, Enel, complies with Italian Legislative Decree 231, which establishes management responsibility for Italian companies as a consequence of certain crimes committed in Italy or abroad, in the name of or for the benefit of such entities, including those crimes described in Chilean Law 20,393, these guidelines set a group of measures, with standards of behavior expected from all employees, advisers, auditors, officials, directors as well as consultants, contractors, commercial partners, agents and suppliers. Legislative Decree 231 includes various activities of a preventive nature that are coherent with and integral to the requirements and compliance with Chilean Law 20,393, which deals with the criminal responsibility of legal entities. These guidelines are supplementary to the standards included in the Code of Ethics and the ZTAC Plan.
76
On November 29, 2012, the SVS issued General Regulation 341 which established regulations for the disclosure of information with respect to the standards of corporate governance compliance adopted by publicly held limited liability corporations and set the procedures, mechanisms and policies that are indicated in the Appendix to the regulation. The objective of this regulation is to provide credible information to investors with respect to good corporate governance policies and practices adopted by publicly held limited liability corporations, which include us, and permit entities like stock exchanges to produce their own analyses to help the various market participants to understand and evaluate the commitment of companies. General Regulation 341 was substituted by General Regulation. 385, issued by the SVS on June 8, 2015. This regulation has similar objectives than the former General Regulation 341, but includes additional issues, by the way of separating each policy in several more detailed policies. Subjects such as non-discrimination, inclusion and sustainability are particularly important in this new regulation. The Appendix of General Regulation 385 is divided into the following four sections with respect to which companies must report the corporate practices that have been adopted: (i) the functioning and composition of the board, (ii) relations between the company, shareholders and the general public, (iii) risk management and control, and (iv) assessment by a third party. Publicly held limited liability corporations should send the information with respect to corporate governance practices to the SVS no later than March 31 of each year, using the contents of the Appendix to this regulation as criteria. If none of them is adopted, the company must explain its reasons to the SVS. The information should refer to December 31 of the calendar year prior to its dispatch. At the same time, such information should also be at the public’s disposal on the company’s website, and must be sent to the stock exchanges.
Compliance with the New York Stock Exchange Listing Standards on Corporate Governance
The following is a summary of the significant differences between our corporate governance practices and those applicable to U.S. domestic issuers under the corporate governance rules of the NYSE.
Independence and Functions of the Directors’ Committee (Audit Committee)
Chilean law requires that at least two thirds of the Directors’ Committee be independent directors. According to Chilean law, a member would not be considered independent if, at any time, within the last 18 months he: (i) maintained any relationship of a relevant nature and amount with the company, with other companies of the same group, with its controlling shareholder or with the principal officers of any of them or has been a director, manager, administrator or officer of any of them; (ii) maintained a family relationship with any of the members described in (i) above; (iii) has been a director, manager, administrator or principal officer of a non-profit organization that has received contributions from (i) above; (iv) has been a partner or a shareholder that has controlled, directly or indirectly, 10% or more of the capital stock or has been a director, manager, administrator or principal officer of an entity that has provided consulting or legal services for a relevant consideration or external audit services to the persons listed in (i) above; and (v) has been a partner or a shareholder that has controlled, directly or indirectly, 10% or more of the capital stock or has been a director, manager, administrator or principal officer of the principal competitors, suppliers or customers. In case there are not sufficient independent directors on the Board to serve on the Directors’ Committee, Chilean law determines that the independent director nominates the rest of the members of the Directors’ Committee among the remaining Board members that do not meet the Chilean law independence requirements. Chilean law also requires that all publicly held limited liability stock corporations that have a market capitalization of at least UF 1,500,000 (Ch$ 39.5 billion as of December 31, 2016) and at least 12.5% of its voting shares are held by shareholders that individually control or own less than 10% of such shares, must have at least one independent director and a Directors’ Committee.
Under the NYSE corporate governance rules, all members of the Audit Committee must be independent. The Audit Committee of a U.S. company must perform the functions detailed in, and otherwise comply with the requirements of NYSE Listed Company Manual Rules 303A.06 and 303A.07. As of July 31, 2005, non-U.S. companies have been required to comply with Rule 303A.06, but not with Rule 303A.07. Since July 31, 2005, we have complied with the independence and the functional requirement of Rule 303A.06.
On June 29, 2005, our Board of Directors created an Audit Committee, composed of three directors who were also members of the Board of Directors, as required by the Sarbanes-Oxley Act (“SOX”) and the NYSE corporate governance rules. On April 22, 2010, at an Extraordinary Shareholders’ Meeting (“ESM”), our by-laws were amended and the Audit Committee was merged with the Directors’ Committee.
Pursuant to our by-laws, all members of the Directors’ Committee must satisfy the requirements of independence as stipulated by the NYSE. The Directors’ Committee is composed of three members of the Board and complies with Chilean law, as well as with the criteria and requirements of independence prescribed by the SOX, the SEC and the NYSE. As of the date of this Report, the Directors’ Committee complies with the conditions of the Audit Committee as required by the SOX, the SEC and the NYSE corporate governance rules. As a result, we have a single Committee, the Directors’ Committee, which includes among its functions the duties performed by the Audit Committee.
77
Our Directors’ Committee performs the following functions:
review of financial statements and the reports of the external auditors prior to their submission for shareholders’ approval;
present proposals to the Board of Directors, which will make its own proposals to shareholders’ meetings, for the selection of external auditors and private rating agencies;
review of information related to our transactions with related parties and reports the opinion of the Directors’ Committee to the Board of Directors;
the examination of the compensation framework and plans for managers, executive officers and employees;
the preparation of an Annual Management Report, including its main recommendations to shareholders;
provide information to the Board of Directors about the convenience of recruiting external auditors to provide non-auditing services, when such services are not prohibited by law, depending on whether such services might affect the external auditors’ independence;
oversee the work of external auditors;
review and approval of the annual auditing plan by the external auditors;
evaluate the qualifications, independence and quality of the auditing services;
elaborate on policies regarding employment of former members of the external auditing firm;
review and discuss problems or disagreements between management and external auditors regarding the auditing process;
establish procedures for receiving and dealing with complaints regarding accounting, internal control and auditing matters;
any other function mandated to the committee by the by-laws, our Board of Directors or our shareholders.
Corporate Governance Guidelines
The NYSE’s corporate governance rules require U.S.-listed companies to adopt and disclose corporate governance guidelines. Chilean law provides for this practice through the disclosure of the procedures related to General Resolution 385 and the Manual. We have also adopted the codes of conduct described above, and at our ESM held in March 2006, we approved the inclusion of provisions in our by-laws that govern the creation, composition, attributions, functions and compensation of both Directors’ and Audit Committees described above.
|
|
The following table sets forth the total number of our personnel (both permanent and temporary employees) and the number of personnel (both permanent and temporary employees) of each of our consolidated subsidiaries as of December 31, 2016, 2015 and 2014, assuming that the Spin-Offs had been completed as of December 31, 2015:
Company |
| 2016 |
|
| 2015 |
|
| 2014 |
| |||
Enel Generación Chile |
|
| 790 |
|
|
| 919 |
|
|
| 1,137 |
|
Pehuenche |
|
| 2 |
|
|
| 2 |
|
|
| 3 |
|
Celta(1) |
|
| — |
|
|
| — |
|
|
| 1 |
|
Túnel El Melón(2) |
|
| — |
|
|
| — |
|
|
| 15 |
|
GasAtacama Chile (1)(3) |
|
| 0 |
|
|
| 99 |
|
|
| 134 |
|
Total personnel |
|
| 792 |
|
|
| 1,020 |
|
|
| 1,290 |
|
(1) This chart details dividends paid and not the dividends accrued. These amounts do not reflect reduction for any applicable Chilean withholding tax.
(2) The U.S. dollar per ADS amount has been calculated by applying the exchange rates as of December 31 of each year. One ADS = 30 shares of common stock.
(3) The current company is not necessarily comparable to its predecessor before the 2016 Reorganization.
For a discussion of Chilean withholding taxes and access to the formal currency market in Chile in connection with the payment of dividends and sales of ADSs and the underlying common stock, see “Item 10. Additional Information — E. Taxation” and “Item 10. Additional Information — D. Exchange Controls”.
B.Significant Changes.
None.
A.Offer and Listing Details.
The shares of our common stock and our ADSs currently trade on the Chilean Stock Exchanges and the OTC Pink, respectively, under the trading symbols “ENELGXCH” and “EOCCY”, respectively. Until December 28, 2018, when we voluntarily delisted from the NYSE, our ADSs were listed and traded on the NYSE under the trading symbol “EOCC”.
B.Plan of Distribution.
Not applicable.
C.Markets.
In Chile, our common stock is traded on the following stock exchanges: the Santiago Stock Exchange, the Electronic Stock Exchange, and, until October 8, 2018, the Valparaíso Stock Exchange. The Santiago Stock Exchange, the largest exchange in the country, was established in 1893 as a private company. As of December 31, 2018, more than 200 companies had shares listed on the Santiago Stock Exchange. For 2018, the Santiago Stock Exchange accounted for 98.8% of our total equity traded in Chile and amounted to 1,852,206,276,369 shares. In addition, 1.2% of our equity trading was conducted on the Electronic Stock Exchange, an electronic trading market that was created by banks and non-member brokerage houses, and finally, less than 0.1% was traded on the Valparaíso Stock Exchange.
On October 5, 2018, the Board of the Financial Market Commission (“CMF”) made public its resolution to revoke the existence authorization of the Valparaíso Stock Exchange, after 126 years of operations. The CMF explained that this was the result of the breach of the requirement of having a minimum number of 10 brokers as established in No. 4 of Article 40 of the Securities Market Law No. 18,045. Therefore, since October 8, 2018, the Valparaiso Stock Exchange stopped its operations.
Equities, closed-end funds, fixed-income securities, short-term and money market securities, gold and U.S. dollars are traded on the Santiago Stock Exchange. The Santiago Stock Exchange also trades U.S. dollar futures and stock index futures. The Santiago Stock Exchange also trades U.S. dollar futures and stock index futures. The Santiago Stock Exchange operates on business day from 9:30 a.m. to 4:00 p.m., during winter period from March to October, and from 9:30 a.m. to 5:00 p.m. during the summer period, from November to February, which may differ from New York City time by up to two hours, depending on the season.
Until early August 2018, there were two main stock price indexes on the Santiago Stock Exchange, the General Shares Price Index, or IGPA, and the Selective Shares Price Index, or IPSA. The IGPA was calculated using the prices of the shares traded during at least 25% of the days of the year, with a total of annual transactions exceeding UF 10,000 (approximately US$ 396,761 as of December 31, 2018) and a free float representing at least 5%. The IGPA index is rebalanced annually, after the close of the third Friday in March, and also, the number of shares per component of the index is updated quarterly after the close of the third Friday of the months of June, September and December. The IPSA was calculated using the prices of the 30 shares with the highest volume of quarterly transactions, with market presence of at least 90% and with a market capitalization above Ch$ 200,000 million. The IPSA index is rebalanced every six months, after the closing of the third Friday of March and September, and also, the index is re-weighted quarterly after the close of the third Friday of the months of June and December. The shares included in the IPSA and IGPA were weighted according to the weighted value of the shares traded. Either we or Enersis, from whom we spun off in 2016, have been included in the IPSA since 1988.
In August 2016, the Santiago Stock Exchange and the S&P Dow Jones Indices (“S&P DJI”) signed an Operating Agreement and Index Licensing. The alliance between the Santiago Stock Exchange and S&P DJI, the main global provider of concepts, data and research on indexes, includes the implementation of international methodological standards, as well as the integration of operational processes and business strategies, enhancing the visibility, governance and transparency of the existing indexes. The agreement also enables the development, granting of licenses, distribution and administration of current and future indexes, which will be developed as innovative and practical tools at the service of local and international investors. The indexes of the Santiago Stock Exchange, both new and existing, will use the shared brand “S&P/CLX” and may be used as underlying liquid financial products, thereby contributing to the expansion and depth of the Chilean capital markets. Under this agreement, S&P DJI assumed the tasks of calculation, production, maintenance, licensing and distribution of the indexes on Monday, August 6, 2018. Since that date the IGPA and the IPSA are referred to as the SPCLXIGPA and the SPCLXIPSA, respectively.
The SPCLXIGPA is calculated considering, among other things, the prices of the shares traded during at least 25% of the days of the year, with a total of annual transactions exceeding UF 10,000 (approximately US$ 396,761 as of December 31, 2018) and a free float representing at least 5%. The SPCLXIGPA index is rebalanced annually, after the close of the third Friday in March, and also, the number of shares per component of the index is updated quarterly after the close of the third Friday of the months of June, September and December. The SPCLXIGPA index at the close of December 2018 was 25,949.84 points.
Shares of our common stock traded in the United States in the form of ADSs on the NYSE and over-the—counter from 1994 until the completion of the spin-off under our predecessor’s ticker symbol “EOC.” From the completion of the spin-off of Endesa Américas in April 2016 until December 28, 2018, our ADSs traded on the NYSE under the ticker symbol “EOCC”. We voluntarily delisted our ADS from the NYSE and since December 31, 2018, our ADSs have been quoted on the OTC Pink under the ticker symbol “EOCCY”. Each ADS represents 30 shares of common stock, with the ADSs in turn evidenced by American Depositary Receipts (“ADRs”). The ADRs were issued under the Amended and Restated Deposit Agreement dated as of September 30, 2010, among us, Citibank, N.A. as Depositary (the “Depositary”), and the holders and beneficial owners from time to time of ADRs issued thereunder (the “Deposit Agreement”). Only persons in whose names ADRs are registered on the books of the Depositary are treated by the Depositary as owners of ADRs.
As of March 31, 2019, ADRs evidencing 1,159,940 ADSs (equivalent to 34,798,200 shares of common stock) were outstanding, representing 0.42% of the total number of outstanding shares. Other than as described under “Item 7. Major Shareholders and Related Party Transaction — A. Major Shareholders”, it is not practicable for us to determine the proportion of ADSs beneficially owned by U.S. final beneficial holders. Trading volume of our shares on the NYSE and other exchanges during 2018 amounted to 18.1 million ADSs, equivalent to US$ 451.1 million.
Following the corporate reorganization transaction by our parent company, Enel Chile S.A. in 2018, Enel Chile now owns 93.6% of our shares of common stock and our ADSs currently comprise only approximately 0.64% of the total outstanding shares of common stock. We believe that the costs associated with continuing the listing of our ADSs on the NYSE exceed the benefits received by us, as the primary market for our shares not owned by Enel Chile is now the Santiago Stock Exchange. As a result, we decided to file an application for voluntary delisting from the NYSE as part of our effort to reduce operational expenses.
We filed a Form 25 with the SEC on December 31, 2018, to delist our ADSs from the NYSE. As a result, our ADS program has become a Level I — Over-The-Counter ADS Program and is quoted on the OTC Markets. Citibank, N.A. will continue to act as our Depositary pursuant to the existing Deposit Agreement.
The following table contains information regarding the amount of total traded shares of common stock and the corresponding percentage traded per market during 2018:
|
| Number of common |
| Percent |
|
Market |
|
|
|
|
|
Chile(1) |
| 3,275,619,785 |
| 86 | % |
United States (One ADS = 30 shares of common stock)(2) |
| 543,955,680 |
| 14 | % |
Total |
| 3,819,575,465 |
| 100 | % |
|
|
|
|
|
|
78
The following table sets forth the total number of our temporary employees and the number of temporary employees of each of our consolidated subsidiaries as of December 31, 2016, 2015, and 2014 and the average during the most recent financial year, assuming that the Spin-Offs had been completed as of December 31, 2015:
Company |
| Average 2016 |
|
| 2016 |
|
| 2015 |
|
| 2014 |
| ||||
Enel Generación Chile |
|
| 46 |
|
|
| 29 |
|
|
| 51 |
|
|
| 119 |
|
GasAtacama Chile(1)(2) |
|
| — |
|
|
| — |
|
|
| — |
|
|
| 1 |
|
Total temporary personnel in Chile |
|
| 46 |
|
|
| 29 |
|
|
| 51 |
|
|
| 120 |
|
(1) Includes Santiago Stock Exchange, Electronic Stock Exchange and, until October 8, 2018, Valparaíso Stock Exchange.
(2) Includes the New York Stock Exchange and over-the-counter trading.
D.Selling Shareholders.
Not applicable.
E.Dilution.
Not applicable.
F.Expenses of the Issue.
Not applicable.
Item 10.Additional Information
A.Share Capital.
Not applicable.
B.Memorandum and Articles of Association.
Description of Share Capital
Set forth below is certain information concerning our share capital and a brief summary of certain significant provisions of Chilean law and our bylaws.
General
Shareholders’ rights in Chilean companies are governed by the company’s bylaws (estatutos), which have the same purpose as the articles or the certificate of incorporation and the bylaws of a company incorporated in the United States, and by the Chilean Corporations Act, Law No. 18,046. In addition, D.L. 3500, or the Pension Funds’ System Law, which permits the investment by Chilean pension funds in stock of qualified companies, indirectly affects corporate governance and prescribes certain rights of shareholders. In accordance with the Chilean Corporations Act, legal actions by shareholders to enforce their rights as shareholders of the company must be brought in Chile in arbitration proceedings or, at the option of the plaintiff, before Chilean courts. Members of the Board of Directors, managers, officers and principal executives of the company, or shareholders that individually own shares with a book value or stock value higher that UF 5,000 (Ch$ 138 million as of December 31, 2018) do not have the option to bring the procedure to the courts.
The Chilean securities markets are principally regulated by the CMF under Securities Market Law (Law No. 18,045), and the Chilean Corporations Act. These two laws state the disclosure requirements, restrictions on insider trading and price manipulation, and provide protection to minority shareholders. The Securities Market Law sets forth requirements for public offerings, stock exchanges and brokers, and outlines disclosure requirements for companies that issue publicly offered securities. The Chilean Corporations Act and the Securities Market Law, both as amended, state rules regarding takeovers, tender offers, transactions with related parties, qualified majorities, share repurchases, directors’ committees, independent directors, stock options and derivative actions.
Public Register
We are a publicly held stock corporation incorporated under the laws of Chile. We were incorporated by public deed issued on December 1, 1943, by the Santiago Notary Public, Mr. Luciano Hiriart C. Our existence and bylaws were approved by Decree 97 of the Ministry of Finance on January 3, 1944. An excerpt of the bylaws was registered on page 61, and the Decree was registered on page 65 of the Commercial Register (Registro de Comercio del Conservador de Bienes Raíces y Comercio de Santiago), on January 17, 1944. We are registered with the CMF under the entry number 0114. We are also registered with the United States Securities and Exchange Commission under the commission file number 001-13240 on July 26, 1994.
Reporting Requirements Regarding Acquisition or Sale of Shares
Under Article 12 of the Securities Market Law and General Rule No. 269 of the CMF, certain information regarding transactions in shares of a publicly held stock corporation or in contracts or securities whose price or financial results depend on, or are conditioned in whole or in part on the price of such shares, must be reported to the CMF and the Chilean Stock Exchanges. Since ADSs are deemed to represent the shares of common stock underlying the ADRs, transactions in ADRs will be subject to these reporting requirements and those established in Circular No. 1375 of the CMF. Shareholders of publicly held stock corporations are required to report to the CMF and the Chilean Stock Exchanges:
· any direct or indirect acquisition or sale of shares made by a holder who owns, directly or indirectly, at least 10% of a publicly held stock corporation’s subscribed capital;
· any direct or indirect acquisition or sale of contracts or securities whose price or financial results depend on or are conditioned in whole or in part on the price of shares made by a holder who owns, directly or indirectly, at least 10% of a publicly held stock corporation’s subscribed capital;
· any direct or indirect acquisition or sale of shares made by a holder who, due to an acquisition of shares of such publicly held stock company, results in the holder acquiring, directly or indirectly, at least 10% of a publicly held stock company’s subscribed capital; and
· any direct or indirect acquisition or sale of shares in any amount, made by a director, receiver, principal executive, general manager or manager of a publicly held stock corporation.
In addition, majority shareholders of a publicly held stock corporation must inform the CMF and the Chilean stock exchanges if such transactions are entered into with the intention of acquiring control of the company or if they are making a passive financial investment instead.
Under Article 54 of the Securities Market Law and General Rule No. 104 enacted by the CMF, any person who directly or indirectly intends to take control of a publicly held stock corporation must disclose this intent to the market at least ten business days in advance of the proposed change of control and, in any event, as soon as the negotiations for the change of control have taken place or reserved information of the publicly held stock corporation has been provided.
Corporate Objectives and Purposes
Article 4 of our bylaws states that our corporate objectives and purposes are, among other things, to engage in the production, transportation, distribution and supply of electric power, as well as to provide engineering consulting services, whether directly or through other companies, in Chile and abroad.
Board of Directors
As of December 31, 2018, our Board of Directors consisted of nine members who were appointed by shareholders at an OSM and are elected for a three-year term, at the end of which they will be re-elected or replaced. However, at the ESM held on April 24, 2018, our bylaws were amended and since the date of our OSM held on April 26, 2019, the Board of Directors has consisted of five members appointed by the shareholders at the OSM for a three-year term.
The five directors elected at the OSM are the five individual nominees who receive the highest majority of the votes. Each shareholder may vote his shares in favor of one nominee or may apportion his shares among any number of nominees.
The effect of these voting provisions is to ensure that a shareholder owning more than 16.67% of our shares is guaranteed to be able to elect a member of the Board, although depending on the distribution of the rest of the votes at the OSM, a director may in some cases be elected with the votes of less than 16.67% of our shares. This number is derived from the reciprocal of the number of directors plus one. In our case, there are five directors, and the reciprocal of six is equal to 16.67%.
The compensation of the directors is established annually at the OSM. See “Item 6. Directors, Senior Management and Employees — B. Compensation”.
Agreements entered into by us with related parties can only be executed when such agreements serve our interest, and their price, terms and conditions are consistent with prevailing market conditions at the time of their approval and comply with all the requirements and procedures indicated in Article 147 of the Chilean Corporations Act.
Certain Powers of the Board of Directors
Our bylaws do not contain provisions relating to:
· the directors’ power, in the absence of an independent quorum, to vote on compensation for themselves or any members of their body;
· borrowing powers exercisable by the directors and how such borrowing powers can be changed;
· retirement or non-retirement of directors under an age limit requirement; or
· number of shares, if any, required for directors’ qualification.
Certain Provisions Regarding Shareholder Rights
As of the date of the filing of this Report, our capital is comprised of only one class of shares, all of which are common shares and have the same rights.
Our bylaws do not contain any provisions relating to:
· redemption provisions;
· sinking funds; or
· liability for capital reductions by us.
Under Chilean law, the rights of our shareholders may only be modified by an amendment to the bylaws that complies with the requirements explained below under “Item 10. Additional Information — B. Memorandum and Articles of Association — Shareholders’ Meetings and Voting Rights”.
Capitalization
Under Chilean law, only the shareholders of a company acting at an ESM have the power to authorize a capital increase. When an investor subscribes shares, these are officially issued and registered under his name, and the subscriber is treated as a shareholder for all purposes, except receipt of dividends and for return of capital in the event that the shares have been subscribed but not paid for. The subscriber becomes eligible to receive dividends only for the shares that he has actually paid for or, if the subscriber has paid for only a portion of such shares, the pro rata portion of the dividends declared with respect to such shares unless the company’s bylaws provide otherwise. If a subscriber does not fully pay for shares for which the subscriber has subscribed on or prior to the date agreed upon for payment, notwithstanding the actions intended by the company to collect payment, the company is entitled to auction the shares on the stock exchange where such shares are traded, for the account and risk of the debtor, the number of shares held by the debtor necessary for the company to pay the outstanding balances and disposal expenses. However, until such shares are sold at auction, the subscriber continues to hold all the rights of a shareholder, except the right to receive dividends and return of capital. The Chief Executive Officer, or the person replacing him, will reduce in the shareholders’ register the number of shares in the name of the debtor shareholder to the number of shares that remain, deducting the shares sold by the company and settling the debt in the amount necessary to cover the result of such disposal after the corresponding expenses. When there are authorized and issued shares for which full payment has not been made within the period fixed by shareholders at the same ESM at which the subscription was authorized (which in no case may exceed three years from the date of such meeting), these shall be reduced in the non-subscribed amount until that date. With respect to the shares subscribed and not paid following the term mentioned above, the Board must proceed to collect payment, unless the shareholders’ meeting authorizes (by two thirds of the voting shares) a reduction of the company’s capital to the amount effectively collected, in which case the capital shall be reduced by force of law to the amount effectively paid. Once collection actions have been exhausted, the Board should propose to the shareholders’ meeting the approval by simple majority of the write-off of the outstanding balance and the reduction of capital to the amount effectively recovered.
As of December 31, 2018, our subscribed and fully paid capital totaled Ch$ 553 billion and consisted of 8,201,754,580 shares.
Preemptive Rights and Increases of Share Capital
The Chilean Corporations Act requires Chilean companies to grant shareholders preemptive rights to purchase a sufficient number of shares to maintain their existing ownership percentage of such company whenever such company issues new shares.
Under Chilean law, preemptive rights are exercisable or freely transferable by shareholders during a 30-day period. The options to subscribe for shares in capital increases of the company or of any other securities convertible into shares or that confer future rights over these shares, should be offered, at least once, to the shareholders pro rata to the shares held registered in their name at midnight on the fifth business day prior to the date of the start of the preemptive rights period. The preemptive rights offering and the start of the 30-day period for exercising them shall be communicated through the publication of a prominent notice, at least once, in the newspaper that should be used for notifications of shareholders’ meetings. During such 30-day period, and for an additional period of up to 30-days immediately following the initial 30-day period, publicly held stock corporations are not permitted to offer any unsubscribed shares to third parties on terms that are more favorable than those offered to their shareholders. At the end of the second 30-day period, a Chilean publicly held stock corporation is authorized to sell non-subscribed shares to third parties on any terms, provided they are sold on one of the Chilean Stock Exchanges.
Shareholders’ Meetings and Voting Rights
An OSM must be held within the first four months following the end of our fiscal year. Our OSM was held on April 26, 2019. An ESM may be called by the Board of Directors when deemed appropriate, or when requested by shareholders representing at least 10% of the issued shares with voting rights, or by the CMF. Our last ESM was held on April 26, 2019. To convene an OSM or an ESM, notice must be given three times in a newspaper located in our corporate domicile. The newspaper designated by our shareholders is El Mercurio. The first notice must be published not less than 15-days and no more than 20-days in advance of the scheduled meeting. Notice must also be mailed to each shareholder, to the CMF and to the Chilean Stock Exchanges.
The OSM shall be held on the day stated in the notice and should remain in session until having exhausted all the matters stated in the notice. However, once constituted, upon the proposal of the chairman or shareholders representing at least 10% of the shares with voting rights, the majority of the shareholders present may agree to suspend it and to continue it within the same day and place, with no new constitution of the meeting or qualification of powers being necessary, recorded in one set of minutes. Only those shareholders who were present or represented may attend the recommencement of the meeting with voting rights.
Under Chilean law, a quorum for a shareholders’ meeting is established by the presence, in person or by proxy, of shareholders representing at least a majority of the issued shares with voting rights of a company. If a quorum is not present at the first meeting, a reconvened meeting can take place at which the shareholders present are deemed to constitute a quorum regardless of the percentage of the shares represented. This second meeting must take place within 45-days following the scheduled date for the first meeting. Shareholders’ meetings adopt resolutions by the affirmative vote of a majority of those shares present or represented at the meeting. An ESM must be called to take the following actions:
· a transformation of the company into a form other than a publicly held stock corporation under the Chilean Corporations Act, a merger or split-up of the company;
· an amendment to the term of duration or early dissolution of the company;
· a change in the company’s domicile;
· a decrease of corporate capital;
· an approval of capital contributions in kind and non-monetary assessments;
· a modification of the authority reserved to shareholders or limitations on the Board of Directors;
· a reduction in the number of members of the Board of Directors;
· a disposition of 50% or more of the assets of the company, whether it includes disposition of liabilities or not, as well as the approval or the amendment of the business plan which contemplates the disposition of assets in an amount greater that such percentage;
· the disposition of 50% or more of the assets of a subsidiary, as long as such subsidiary represents at least 20% of the assets of the corporation, as well as any disposition of its shares that results in the parent company losing its position as controlling shareholder;
· the form of distributing corporate benefits;
· issue of guarantees for third-party liabilities which exceed 50% of the assets, except when the third party is a subsidiary of the company, in which case approval of the Board of Directors is deemed sufficient;
· the purchase of the company’s own shares;
· other actions established by the bylaws or the laws;
· certain remedies for the nullification of the company’s bylaws;
· inclusion in the bylaws of the right to purchase shares from minority shareholders, when the controlling shareholders reaches 95% of the company’s shares by means of a tender offer for all of the company’s shares, where at least 15% of the shares have been acquired from unrelated shareholders; and
· approval or ratification of acts or contracts with related parties.
Regardless of the quorum present, the vote required for any of the actions above is at least two-thirds of the outstanding shares with voting rights.
Bylaw amendments for the creation of a new class of shares, or an amendment to or an elimination of those classes of shares that already exist, must be approved by at least two-thirds of the outstanding shares of the affected series.
Chilean law does not require a publicly held stock corporation to provide its shareholders the same level and type of information required by the U.S. securities laws regarding the solicitation of proxies. However, shareholders are entitled to examine the financial statements and corporate books of a publicly held stock corporation within the 15-day period before its scheduled shareholders meetings. Under Chilean law, a notice of a shareholders meeting listing matters to be addressed at the meeting must be mailed at least 15 days prior to the date of such meeting, and, an indication of the way complete copies of the documents that support the matters submitted for voting can be obtained, which must also be made available to shareholders on our website. In the case of an OSM, our annual report of activities, which includes audited financial statements, must also be made available to shareholders and published on our website at: www.enelgeneracion.cl.
The Chilean Corporations Act provides that, upon the request by the Directors’ Committee or by shareholders representing at least 10% of the issued shares with voting rights, a Chilean company’s annual report must include, in addition to the materials provided by the Board of Directors to shareholders, such shareholders’ comments and proposals in relation to the company’s affairs. In accordance with Article 136 of the Chilean Corporations Regulation (Reglamento de Sociedades Anónimas), the shareholder(s) holding or representing at least of the shares issued with voting rights, may:
· make comments and proposals relating to the progress of the corporate businesses in the corresponding year, no shareholder being able to make individually or jointly more than one presentation. These observations should be presented in writing to the company concisely, responsibly and respectfully, and the respective shareholder(s) should state their willingness for these to be included as an appendix to the annual report. The Board shall include in an appendix to the annual report of the year a faithful summary of the pertinent comments and proposals the interested parties had made, provided they are presented during the year or within 30-days after its ending; or
· make comments and proposals on matters that the Board submits for the knowledge or voting of the shareholders. The Board shall include a faithful summary of those comments and proposals in all information it sends to shareholders, provided the shareholders’ proposal is received at the offices of the company at least 10-days prior to the date of dispatch of the information by the company. The shareholders should present their comments and proposals to the company, expressing their willingness for these to be included in the appendix to the respective annual report or in information sent to shareholders, as the case may be. The observations referred to in Article 136 may be made separately by each shareholder holding at least 10% of the shares issued with voting rights or shareholders who together hold that percentage, who should act as one.
Similarly, the Chilean Corporations Act provides that whenever the Board of Directors of a publicly held stock corporation convenes an OSM and solicits proxies for the meeting, or circulates information supporting its decisions or other similar material, it is obligated to include the pertinent comments and proposals that may have been made by the Directors’ Committee or by shareholders owning at least 10% of the shares with voting rights who request that such comments and proposals be so included.
Only shareholders registered as such with us as of midnight on the fifth business day prior to the date of a meeting are entitled to attend and vote their shares. A shareholder may appoint another individual, who does not need to be a shareholder, as his proxy to attend the meeting and vote on his behalf. Proxies for such representation shall be given for all the shares held by the owner. The proxy may contain specific instructions to approve, reject, or abstain with respect to any of the matters submitted for voting at the meeting and which were included in the notice. Every shareholder entitled to attend and vote at a shareholders’ meeting shall have one vote for every share subscribed.
There are no limitations imposed by Chilean law or our bylaws on the right of nonresidents or foreigners to hold or vote shares of common stock. However, the registered holder of the shares of common stock represented by ADSs, and evidenced by outstanding ADSs, is the custodian of the Depositary, currently Banco Santander-Chile, or any successor thereto. Accordingly, holders of ADSs are not entitled to receive notice of meetings of shareholders directly or to vote the underlying shares of common stock represented by ADS directly. The Deposit Agreement contains provisions pursuant to which the Depositary has agreed to request instructions from registered holders of ADSs as to the exercise of the voting rights pertaining to the shares of common stock represented by the ADSs. Subject to compliance with the requirements of the Deposit Agreement and receipt of such instructions, the Depositary has agreed to endeavor, insofar as practicable and permitted under Chilean law and the provisions of the bylaws, to vote or cause to be voted (or grant a discretionary proxy to the Chairman of the Board of Directors or to a person designated by the Chairman of the Board of Directors to vote) the shares of common stock represented by the ADSs in accordance with any such instruction. The Depositary shall not itself exercise any voting discretion over any shares of common stock underlying ADSs. If no voting instructions are received by the Depositary from a holder of ADSs with respect to the shares of common stock represented by the ADSs, on or before the date
established by the Depositary for such purpose, the shares of common stock represented by the ADS, may be voted in the manner directed by the Chairman of the Board, or by a person designated by the Chairman of the Board, subject to limitations set forth in the Deposit Agreement.
Dividends and Liquidation Rights
According to the Chilean Corporations Act, unless otherwise decided by unanimous vote of its issued shares eligible to vote, all companies must distribute a cash dividend in an amount equal to at least 30% of their consolidated net income, unless and except to the extent we have carried forward losses. The law provides that the Board of Directors must agree to the dividend policy and inform such policy to the shareholders at the OSM.
Any dividend in excess of 30% of net income may be paid, at the election of the shareholders, in cash, or in our shares, or in shares of publicly held corporations owned by us. Shareholders who do not expressly elect to receive a dividend other than in cash are legally presumed to have decided to receive the dividend in cash.
Dividends, which are declared but not paid within the appropriate time period set forth in the Chilean Corporations Act (as to minimum dividends, 30-days after declaration; as to additional dividends, the date set for payment at the time of declaration), are adjusted to reflect the change in the value of UF, from the date set for payment to the date such dividends are actually paid. Such dividends also accrue interest at the then-prevailing rate for UF-denominated deposits during such period. The right to receive a dividend lapses if it is not claimed within five years from the date such dividend is payable. Payments not collected in such period are transferred to the volunteer fire department.
In the event of our liquidation, the shareholders would participate in the assets available in proportion to the number of paid-in shares held by them, after payment to all creditors.
Approval of Financial Statements
The Board of Directors is required to submit our consolidated financial statements to the shareholders annually for their approval. If the shareholders by a vote of a majority of shares present (in person or by proxy) at the shareholders’ meeting reject the financial statements, the Board of Directors must submit new financial statements no later than 60-days from the date of such meeting. If the shareholders reject the new financial statements, the entire Board of Directors is deemed removed from office and a new board is elected at the same meeting. Directors who individually approved such financial statements are disqualified for reelection for the following period. Our shareholders have never rejected the financial statements presented by the Board of Directors.
Change of Control
The Capital Markets Law establishes a comprehensive regulation related to tender offers. The law defines a tender offer as the offer to purchase shares of companies which publicly offer their shares or securities convertibles into shares and which offer is made to shareholders to purchase their shares under conditions that allow the bidder to reach a certain percentage of ownership of the company within a fixed period. These provisions apply to both voluntary and hostile tender offers.
Acquisition of Shares
No provision in our bylaws discriminates against any existing or prospective holder of shares as a result of such shareholder owning a substantial number of shares. However, as established in our bylaws in force until March 24, 2018; no person may directly or indirectly own more than 65% of the outstanding shares of our stock (the foregoing restriction did not apply to the depositary as record owner of shares represented by ADRs, but it did apply to each beneficial ADS holder); And (ii) no shareholder could exercise voting power with respect to more than 65% of the common stock owned by such shareholder or on behalf of others representing more than 65% of the outstanding issued shares with voting rights. Once the 2018 Reorganization was declared success on March 25, 2018, and as agreed in our ESM held on December 20, 2017, on that same date our bylaws were amended and the limitations and restrictions set forth under Title XII of DL 3,500 (see “Investments by AFPs” below) were removed, including among other things, the 65% stock ownership limit applicable to any shareholder and any other related restrictions.
Right of Dissenting Shareholders to Tender Their Shares
The Chilean Corporations Act provides that upon the adoption of any of the resolutions enumerated below at a meeting of shareholders, dissenting shareholders acquire the right to withdraw from the company and to compel the company to repurchase their shares, subject to the fulfillment of certain terms and conditions. In order to exercise such withdrawal rights, holders of ADRs must first withdraw the shares represented by their ADRs pursuant to the terms of the Deposit Agreement.
“Dissenting” shareholders are defined as those who at a shareholders’ meeting vote against a resolution that results in the withdrawal right, or who if absent from such meeting, state in writing their opposition to the respective resolution, within the 30-days following the shareholders’ meeting. Shareholders present or represented at the meeting and who abstain in exercising their voting rights shall not be considered as dissenting. The right to withdraw should be exercised for all the shares that the dissenting shareholder had registered in their name on the date on which the right is determined to participate in the meeting at which the resolution is adopted that motivates the withdrawal and which remains on the date on which their intention to withdraw is communicated to the company. The price paid to a dissenting shareholder of a publicly held stock corporation whose shares are quoted and actively traded on one of the Chilean stock exchanges is the weighted average of the sales prices for the shares as reported on the Chilean stock exchanges on which the shares are quoted for the two-month period between the ninetieth and the thirtieth day before the shareholders’ meeting giving rise to the withdrawal right. If, because of the volume, frequency, number and diversity of the buyers and sellers, the CMF determines that the shares are not actively traded on a stock exchange, the price paid to the dissenting shareholder shall be the book value. Book value for this purpose shall equal paid capital plus reserves and profits, less losses, divided by the total number of subscribed shares, whether entirely or partially paid. For the purpose of making this calculation, the last consolidated statements of financial position is used, as adjusted to reflect inflation up to the date of the shareholders’ meeting which gave rise to the withdrawal right.
Article 126 of the Chilean Corporations Act Regulations establishes that in cases where the right to withdraw arises, the company shall be obliged to inform the shareholders of this situation, the value per share that will be paid to shareholders exercising their right to withdraw and the term for exercising it. Such information should be given to shareholders at the same meeting at which the resolutions are adopted giving rise to the right of withdrawal, prior to its voting. A special communication should be given to the shareholders with rights, within two days following the date on which the rights to withdraw are born. In the case of publicly held companies, such information shall be communicated by a prominent notice in a newspaper with a wide national circulation and on its website, plus a written communication addressed to the shareholders with rights at the address they have registered with the company. The notice of the shareholders meeting that should pronounce on a matter that could originate withdrawal rights should mention this circumstance.
The resolutions that result in a shareholder’s right to withdraw include, among others, the following:
· the transformation of the company into an entity which is not a publicly held stock corporation governed by Chilean Corporations Act;
· the merger of the company with another company;
· disposition of 50% or more of the assets of the company, whether it includes disposition of liabilities or not, as well as the approval or the amendment of the business plan which contemplates the disposition of assets in an amount greater than such percentage;
· the disposition of 50% or more of the assets of a subsidiary, as long as such subsidiary represents at least 20% of the assets of the company, as well as any disposition of its shares that results in the parent company losing its position of controlling shareholder;
· issue of guarantees for third parties’ liabilities which exceed 50% of the assets (if the third party is a subsidiary of the company, the approval of the Board of Directors is sufficient);
· the creation of preferential rights for a class of shares or an amendment to the existing ones. In this case the right to withdraw only accrues to the dissenting shareholders of the class or classes of shares adversely affected;
· certain remedies for the nullification of the corporate bylaws; and
· such other causes as may be established by the law or by the company’s bylaws.
Investments by AFPs
The Pension Funds’ System Law permits AFPs to invest their funds in companies that are subject to Title XII of DL 3,500 and these companies are subject to greater restrictions than other companies. The determination of which stocks may be purchased by AFPs is made by the Risk Classification Committee. The Risk Classification Committee establishes investment guidelines and is empowered to approve or disapprove those companies that are eligible for AFP investments. We were a Title XII Company and we approved by the Risk Classification Committee between 1987 and March 24, 2018. As previously indicated, since March 25, 2018, when the amendments to the bylaws came in force in connection with the 2018 Reorganization, we are no longer subject to the limitations and restrictions set forth under Title XII of DL 3,500.
Registrations and Transfers
Shares issued by us are registered with an administrative agent, which is DCV Registros S.A. This entity is also responsible for our shareholders registry. In case of jointly-owned shares, an attorney-in-fact must be appointed to represent the joint owners in dealing with us.
C.Material Contracts.
None.
D.Exchange Controls.
The Central Bank of Chile is responsible for, among other things, monetary policies and exchange controls in Chile. Currently applicable foreign exchange regulations are set forth in the Compendium of Foreign Exchange Regulations (the “Compendium”) approved by the Central Bank of Chile in 2002. Appropriate registration of a foreign investment in Chile permits the investor access to the Formal Exchange Market. Foreign investments can be registered with the Foreign Investment Committee under D.L. 600 of 1974 or can be registered with the Central Bank of Chile under the Central Bank Act, Law No. 18,840 of October 1989.
a)Foreign Investments Contracts and Chapter XXVI
In connection with our initial public offering of ADSs in 1994, we entered into a foreign investment contract (the “Foreign Investment Contract”) with the Central Bank of Chile and the Depositary, pursuant to Article 47 of the Central Bank Act and Chapter XXVI of the former Compendium of Foreign Exchange Regulations (“Chapter XXVI”), which governed the issuance of ADSs by a Chilean company. Pursuant to the Foreign Investment Contract, the foreign exchange for payments and distributions with respect to ADSs could be purchased in either the Formal Exchange Market or the Informal Exchange Market, but such payments needed to be remitted through the Formal Exchange Market.
As of April 19, 2001, Chapter XXVI was eliminated and new investments in ADSs by non-residents of Chile are now governed instead by Chapter XIV of the Compendium. This change was made with the purpose of simplifying and facilitating the flow of capital to and from Chile. As a result of the elimination of Chapter XXVI, access to the Formal Exchange Market is no longer assured. However, because our Foreign Investment Contract was entered into pursuant to Chapter XXVI, the terms of Chapter XXVI still apply. Foreign investors who have purchased their shares under a Foreign Investment Contract pursuant to Chapter XXVI continue to have access to the Formal Exchange Market for the purpose of converting pesos to U.S. dollars and repatriating from Chile amounts received with respect to the deposited shares of common stock or shares of common stock withdrawn from deposit on surrender of ADRs (including amounts received as cash dividends and proceeds from the sale in Chile of the underlying shares of common stock and any rights with respect thereto). However, foreign investors who have not deposited the shares of common stock into our ADS facility will not have the benefits of our Foreign Investment Contract with the Central Bank of Chile but instead will be subject to the normal foreign investment rules.
The following is a summary of certain provisions which were contained in Chapter XXVI and the Foreign Investment Contract, and which therefore remain relevant. This summary does not intend to be complete and is qualified in its entirety by reference to Chapter XXVI and the Foreign Investment Contract.
Under Chapter XXVI and the Foreign Investment Contract, the Central Bank of Chile agreed to grant to the depositary, on behalf of ADR holders, and to any investor not residing or domiciled in Chile who withdraws common stock upon delivery of ADRs
(such shares of common stock being referred to herein as Withdrawn Shares) access to the Formal Exchange Market to convert pesos into U.S. dollars (and to remit such U.S. dollars outside of Chile), including amounts received as:
· cash dividends;
· proceeds from the sale in Chile of Withdrawn Shares subject to receipt by the Central Bank of Chile of a certificate from the holder of the Withdrawn Shares (or from an institution authorized by the Central Bank of Chile) that such holder’s residence and domicile are outside Chile and a certificate from a Chilean stock exchange (or from a brokerage or securities firm established in Chile) that such Withdrawn Shares were sold on a Chilean stock exchange;
· proceeds from the sale in Chile of rights to subscribe for additional shares of Common Stock;
· proceeds from our liquidation, merger or consolidation; and
· other distributions, including, without limitation, those resulting from any recapitalization, as a result of holding shares of Common Stock represented by ADS or Withdrawn Shares.
Transferees of Withdrawn Shares were not entitled to any of the foregoing rights under Chapter XXVI. Investors receiving Withdrawn Shares in exchange for ADRs had the right to redeposit such shares in exchange for ADRs, provided that certain conditions relating to redeposit were satisfied.
Chapter XXVI stated that access to the Formal Exchange Market in connection with dividend payments was conditioned upon certification by us to the Central Bank of Chile that a dividend payment has been made and any applicable tax has been withheld. Chapter XXVI also stated that the access to the Formal Exchange Market in connection with the sale of Withdrawn Shares or distributions thereon was conditioned upon receipt by the Central Bank of Chile of certification by the Depositary (or the Custodian on its behalf) that such shares have been withdrawn in exchange for ADRs and receipt of a waiver of the benefit of the Foreign Investment Contract with respect thereto until such Withdrawn Shares were redeposited.
The Foreign Investment Contract states that a person who brings foreign currency into Chile to purchase shares of common stock with the benefit of the Foreign Investment Contract must convert it into pesos on the same day and has five banking business days within which to invest in shares of common stock in order to receive the benefits of the Foreign Investment Contract. If such person decides within such period not to acquire shares of common stock, such person can access the Formal Exchange Market to reacquire U.S. dollars, provided that the applicable request is presented to the Central Bank of Chile within seven banking business days of the initial conversion into pesos. Shares acquired as described above may be deposited for ADRs and receive the benefits of the Foreign Investment Contract, subject to receipt by the Central Bank of Chile of a certificate from the Depositary (or the Custodian on its behalf) that such deposit has been effected, that the related ADRs have been issued and receipt of a declaration from the person making such deposit waiving the benefits of the Foreign Investment Contract with respect to the deposited shares of common stock.
Access to the Formal Exchange Market under any of the circumstances described above is not automatic. Such access requires approval of the Central Bank of Chile based on a request presented through a banking institution established in Chile. The Foreign Investment Contract states that if the Central Bank of Chile has not acted on such request within seven banking days, the request will be deemed approved.
The Compendium and International Bond Issuances
Chilean issuers may offer bonds issued by the Central Bank of Chile internationally under Chapter XIV of the Compendium.
E. Taxation.
Chilean Tax Considerations
The following discussion summarizes material Chilean income and withholding tax consequences to foreign holders arising from the ownership and disposition of shares and ADSs. The summary that follows does not purport to be a comprehensive description of all of the tax considerations that may be relevant to a decision to purchase, own or dispose of shares or ADSs, if any, and does not purport to deal with the tax consequences applicable to all categories of investors, some of which may be subject to special rules. Holders of shares and ADSs are advised to consult their own tax advisors concerning the Chilean and other tax consequences of the ownership of shares or ADSs.
The summary that follows is based on Chilean law, in effect on the date hereof, and is subject to any changes in these or other laws occurring after such date, possibly with retroactive effect. Under Chilean law, provisions contained in statutes such as tax rates
applicable to foreign investors, the computation of taxable income for Chilean purposes and the manner in which Chilean taxes are imposed and collected may be amended only by another law. In addition, the Chilean tax authorities enact rulings and regulations of either general or specific application and interpret the provisions of the Chilean Income Tax Law. Chilean tax may not be assessed retroactively against taxpayers who act in good faith relying on such rulings, regulations and interpretations, but Chilean tax authorities may change their rulings, regulations and interpretations in the future. The discussion that follows is also based, in part, on representations of the depositary, and assumes that each obligation in the Deposit Agreement and any related agreements will be performed in accordance with its terms. As of this date, there is currently no applicable income tax treaty in effect between the United States and Chile. However, in 2010 the United States and Chile signed an income tax treaty that will enter into force once the treaty is ratified by both countries, which has not happened as of the date of this Report. There can be no assurance that the treaty will be ratified by either country. The following summary assumes that there is no applicable income tax treaty in effect between the United States and Chile.
As used in this Report, the term “foreign holder” means either:
· In the case of an individual holder, a person who is not a resident of Chile. For purposes of Chilean taxation, (a) an individual is a Chilean resident if he has resided in Chile for more than six months in one calendar year, or a total of more than six months in two consecutive fiscal years; or (b) an individual is domiciled in Chile if he resides in Chile and has the intention of remaining in Chile (such intention to be evidenced by circumstances such as the acceptance of employment in Chile or the relocation of the individual’s family to Chile), or
· In the case of a legal entity holder, an entity that is not organized under the laws of Chile, unless the shares or ADSs are assigned to a branch, agent, representative or permanent establishment of such entity in Chile.
Taxation of Shares and ADSs
Taxation of Cash Dividends and Property Distributions
Cash dividends paid with respect to the shares or ADSs held by a foreign holder will be subject to Chilean withholding tax, which is withheld and paid by the company. The amount of the Chilean withholding tax is determined by applying a 35% rate to a “grossed-up” distribution amount (such amount equal to the sum of the actual distribution amount and the correlative Chilean corporate income tax (“CIT”), paid by the issuer), and then subtracting as a credit 65% of such Chilean CIT paid by the issuer, in case the residence country of the holder of shares or ADSs does not have a tax treaty with Chile. If there is a tax treaty between both countries (in force or signed prior to January 1, 2017) the Foreign Holder can apply 100% of the CIT as a credit. For 2018, the Chilean CIT applicable to us is a rate of 27%, and depending on the circumstances mentioned above, the Foreign Holder may apply 100% or 65% of the CIT as a credit.
There are two alternative mechanisms of shareholder-level income taxation in effect since January 1, 2017: a) accrued income basis (known as attributed-income system in Chile) shareholder taxation and b) cash basis (known as partially-integrated system in Chile) shareholder taxation.
Under the current Chilean Income Tax Law, publicly held limited liability stock companies, such as we, are subject to the latter regime.
Under the cash basis regime (or partially-integrated regime), a company pays CIT on its annual income tax result. Foreign and local individual shareholders will only pay in Chile the relevant tax on effective profit distributions and will be allowed to use the CIT paid by the distributing company as credit, with certain limitations. Only 65% of the CIT is creditable against the 35% shareholder-level tax (as opposed to 100% under the accrued income basis regime). However, in those cases where tax treaties between Chile and the jurisdiction of the shareholder’s residence are signed prior to January 1, 2019 (even if not yet in effect), the CIT is fully creditable against the 35% withholding tax. This is the case with the tax treaty signed between Chile and the United States, which was signed prior to this date, but which is not in effect as of the time of this Report. In the case of treaties signed prior to January 1, 2019, but not enacted as of December 31, 2021, the shareholder may apply 100% of the CIT as a credit if a dividend distribution is made before December 31, 2021, on a transitional basis. Under the Chilean Tax Law in force at the time of this Report, the transitional treatment of applying the full 100% of the CIT as a credit against withholding tax of the U.S. Holders in case of dividend distributions will terminate on December 31, 2021, if the tax treaty between the United States and Chile is not ratified by that date. In that particular case, effective January 1, 2022, only 65% of the CIT will be creditable against the 35% U.S. Holders’ tax. On the other hand, if a tax treaty with a foreign jurisdiction is enacted by December 31, 2021, shareholders from that particular jurisdiction can continue to apply 100% of the CIT as a credit beyond such date.
The example below illustrates the effective Chilean withholding tax burden on a cash dividend received by a Foreign Holder, assuming a Chilean withholding tax base rate of 35%, an effective Chilean CIT rate of 27% (the CIT rate for 2018 for companies that elected the cash basis regime) and a distribution of 50% of the net income of the company distributable after payment of the Chilean CIT:
Line |
| Concept and calculation assumptions |
| Amount Tax |
| Amount Non- |
|
1 |
| Company taxable income (based on Line 1 = 100) |
| 100 |
| 100.0 |
|
2 |
| Chilean corporate income tax : 27% x Line 1 |
| 27 |
| 27 |
|
3 |
| Net distributable income: Line 1—Line 2 |
| 73 |
| 73 |
|
4 |
| Dividend distributed (50% of net distributable income): 50% of Line 3 |
| 36.5 |
| 36.5 |
|
5 |
| Withholding tax: (35% of (the sum of Line 4 and 50% of Line 2)) |
| 17.5 |
| 17.5 |
|
6 |
| Credit for 50% of Chilean corporate income tax : 50% of Line 2 |
| 13.5 |
| 13.5 |
|
7 |
| CIT partial restitution (Line 6 x 35%)(1) |
| — |
| 4.7 |
|
8 |
| Net withholding tax: Line 5 - Line 6 + Line 7 |
| 4 |
| 8.7 |
|
9 |
| Net dividend received: Line 4 - Line 8 |
| 32.5 |
| 27,8 |
|
10 |
| Effective dividend withholding rate : Line 8 / Line 4 |
| 11.0 |
| 23.9 |
|
|
|
|
|
All Chilean employees who are dismissed for reasons other than misconduct are entitled by law to a severance payment. According to Chilean law, permanent employees are entitled to a basic payment of one-month’s salary for each year (or a six-month portion thereof) worked, subject to a limit of a total payment of no more than 11 months’ pay for employees hired after August 14, 1981. Severance payments to employees hired prior to that date consist of one-month’s salary for each full year worked, not subject to any limitation on the total amount payable. Under our collective bargaining agreements, we are obligated to make severance payments to all covered employees in cases of voluntary resignation or death in specified amounts that increase according to seniority and may exceed the amounts required under Chilean law.
Enel Generación Chile has four collective bargaining agreements, which will expire between 2017 and 2020.
|
|
To the best of our knowledge, none of our directors or officers owns more than 0.1% of our shares or owns any stock options. It is not possible to confirm whether any of our directors or officers has a beneficial, rather than direct, interest in our shares. To the best of our knowledge, any share ownership by all of our directors and officers, in the aggregate, amounts to significantly less than 10% of our outstanding shares.
Item 7.Major Shareholders and Related Party Transactions
|
|
We have only one class of capital stock and Enel Chile, our controlling shareholder, has no different voting rights than our other shareholders. As of April 25, 2017, our 8,201,754,580 shares of common stock outstanding were held by 15,392 stockholders of record. There were three record holders of our ADSs, as of such date.
It is not practicable for us to determine the number of our ADSs or our common shares beneficially owned in the United States, as the depositary for our ADSs only has knowledge of the record holders, including the Depositary Trust Company and its nominees. As such, we are not able to ascertain the domicile of the final beneficial holders represented by the official ADS record holders in the United States. Likewise, we cannot readily determine the domicile of any of our foreign stockholders who hold our common stock, either directly or indirectly.
On April 26, 2016, we distributed the shares of Endesa Américas to our shareholders as part of the spin-off of Endesa Américas from Endesa Chile. For further details related to the reorganization process, please refer to “Item 4. Information on the Company — A. History — The 2016 Reorganization.”
In addition, as of March 31, 2017, Enel Chile beneficially owned 60.0% of our shares, Chilean private pension funds (“AFPs”) in the aggregate owned 16.0% of our shares, Chilean stockbrokers, mutual funds, insurance companies, foreign equity funds, and other Chilean institutional investors collectively held 15.8% of our equity, ADS holders owned 3.3% of our equity, and the remaining 4.9% of our equity was held by 15,255 minority shareholders.
The following table sets forth certain information concerning ownership of our common stock as of April 25, 2017, with respect to each stockholder known by us to own more than 5% of our outstanding shares of common stock:
|
| Number of Shares Owned |
|
| Percentage of Shares Outstanding |
| ||
Enel Chile |
|
| 4,919,488,794 |
|
|
| 60.0 | % |
79
Enel Chile is a company primarily engaged, through its subsidiaries and related companies, in the generation and distribution of electricity in Chile. Enel Chile is ultimately controlled by Enel, which beneficially owns 60.6% of Enel Chile’s outstanding capital stock. Since June 25, 2009, Enel has been our ultimate parent company and continues to be our ultimate controlling shareholder, and such control is exercised through Enel Chile.
Enel is an Italian energy company with multinational operations in the power and gas markets, with a focus on Europe and Latin America. Enel operates in over 30 countries across four continents, produces energy through a net installed capacity of 84 GW and distributes electricity and gas through a network covering 1.9 million kilometers. With over 61 million users worldwide, Enel has the largest customer base among European competitors and figures among Europe’s leading power companies in terms of installed capacity and reported EBITDA. Enel publicly trades on the Milan Stock Exchange.
|
|
Article 146 of Law 18,046 (the “Chilean Companies Act”) defines related-party transactions as all transactions involving a company and any entity belonging to the corporate group, its parent companies, controlling companies, subsidiaries or related companies, board members, managers, administrators, senior officers or company liquidators, including their spouses, some of their relatives and all entities controlled by them, in addition to individuals who may appoint at least one member of the company’s board of directors or who control 10% or more of voting capital, or companies in which a board member, manager, administrator, senior officer or company liquidator has been serving in the same position within the last 18 months. The law establishes that in the event that these persons fulfill the requirements established by Article 146, such persons must immediately inform the Board of Directors of their related-party nature, or such other group as the Board may appoint for that purpose. As required by law, “related-party transactions” must comply with corporate interests, as well as prices, terms and conditions prevailing in the market at the time of their approval. They must also meet all legal requirements, including acknowledgement and approval of the transaction by the Board of Directors (excluding the affected directors), by the ESM (in some cases, with requisite majority approval) and by any applicable regulatory procedures.
The aforementioned law, which also applies to our affiliates, also provides for some exceptions, stating that in certain cases, Board approval would suffice for “related-party transactions,” pursuant to certain related-party transaction thresholds and when such transactions are conducted in compliance with the related-party policies defined by the company’s board. At its meetings held on December 17, 2009 and April 23, 2010, our Board of Directors approved a related-party transaction policy (política de habitualidad) effective as of January 1, 2010. This policy, amended by our Board of Directors on April 25, 2012, is available on our website at www.enelgeneracion.cl.
If a transaction is not in compliance with Article 146 of the Chilean Companies Act, this would not affect the transaction’s validity, but we or our shareholders may demand compensation from the individual associated with the infringement as provided under law, and reparation for damages.
Our largest electricity distribution customer is Enel Distribución Chile, a subsidiary of Enel Chile. The terms of our contracts with Enel Distribución Chile are regulated in accordance with the Chilean Electricity Law.
It is our policy that all of our and our Chilean subsidiaries’ cash inflows and outflows are managed through our centralized cash management policy in coordination with Enel Chile. It is a common practice in Chile to transfer surplus funds from one company to another affiliate that has a cash deficit. These transfers are carried out through either short-term transactions or structured inter-company loans. Under Chilean laws and regulations, such transactions must be carried out on an arm’s-length basis. All of these transactions are subject to the supervision of our Directors’ Committee. As of April 25, 2017, these transactions were priced at TIP (a Chilean variable interest rate) plus 0.05% per month.
We have received short term loans from our related parties in Chile and also granted short term loans to such parties, primarily to satisfy reciprocal working capital needs. As of March 31, 2017, the outstanding balance of the loan received from GasAtacama Chile was Ch$ 65,569 million and the outstanding balance of the loan received from Pehuenche was Ch$ 1,035 million. Our subsidiary GasAtacama Chile has granted short term loans to its subsidiaries, Canela and GasAtacama Argentina, primarily to satisfy working capital needs. As of March 31, 2017, the outstanding balance of the loan granted to Canela was Ch$ 4,209 million and the outstanding balance of the loan granted to GasAtacama Argentina was Ch$ 118 million.
In addition, our subsidiary GasAtacama Chile has granted a structured loan to Canela to satisfy working capital needs. As of March 31, 2017, the outstanding balance was US$ 167 million at a fixed annual interest rate of 5.5%.
During 2016, we repaid in full a structured loan of US$ 250 million from Enel Américas with a fixed annual interest rate of 1.38%.
80
There are various contractual relationships between Enel Chile and us to provide for intercompany services for us and for our subsidiaries. We entered into intercompany agreements with Enel Chile under which Enel Chile provides a variety of services to us. The services rendered by Enel Chile include certain corporate functions, such as legal, finance, treasury, insurance services, capital markets, financial compliance, accounting, human resources, communications, security, relations with contractors, purchases, IT services, tax services, corporate affairs and other corporate support and administrative services. These services are provided and charged at market prices if there is a comparable service. If there are no comparable services in the market, they will be provided at cost plus a specified percentage. The intercompany services contracts are valid for five years with renewable terms.
As of the date of this Report, the transactions described above have not experienced material changes. For more information regarding transactions with related parties, refer to Note 9 of the Notes to our consolidated financial statements.
|
|
Not applicable.
|
|
See “Item 18. Financial Statements.”
Legal Proceedings
We and our subsidiaries are parties to legal proceedings arising in the ordinary course of business. We believe it is unlikely that any loss associated with pending lawsuits will significantly affect the normal development of our business.
For detailed information as of December 31, 2016 on the status of the material pending lawsuits that have been filed against us and our subsidiaries, please refer to Note 34.3 of the Notes to our consolidated financial statements. Please note that between March 1, 2016 and December 1, 2016, Endesa Américas was the defendant instead of us for all legal proceedings originating from our former non-Chilean businesses. Since December 1, 2016, and as a consequence of the merger of Endesa Américas with and into Enel Américas, Enel Américas appears as the defendant instead of Endesa Américas for current legal proceedings or those that may arise from our former non-Chilean businesses.
In relation to the legal proceedings reported in the Notes to our consolidated financial statements, we use the criteria of disclosing lawsuits above a minimum threshold of US$ 25 million of potential impact to us and, in some cases, qualitative criteria according to the materiality of the plausible impact in the conduct of our business. The lawsuit status includes a general description, the process status and the estimate of the amount involved in each lawsuit.
Dividend Policy
Our Board of Directors generally establishes a definitive dividend payable each year, accrued in the prior year, which cannot be less than the legal minimum of 30% of annual net income On November 30, 2015, the Board of Directors agreed to distribute an interim dividend of approximately Ch$ 3.55641 per share on January 29, 2016, accrued in fiscal year 2015. The aforementioned interim dividend was deducted from the total dividend, which was paid on May 24, 2016, after the approval by the OSM on April 27, 2016. The total dividend of Ch$ 196,434 million corresponds to a payout ratio of 50%, based on annual consolidated net income. As a consequence of the spin-off approved at the ESM held on December 18, 2015, the remaining dividend was divided in a determined proportion between our Company and Endesa Américas, which amounted to approximately Ch$ 11.02239 and approximately Ch$ 9.37144 per share, respectively. The payment of dividends for fiscal year 2015 was based on net income in our financial statements as filed with the SVS, which was marginally different from net income based on IFRS.
For the fiscal year 2016, the Board of Directors, in accordance with the current dividend policy, on November 29, 2016, agreed to distribute an interim dividend of Ch$ 7.24787 per share on January 27, 2017, accrued in fiscal year 2016. As in previous years, this interim dividend will be deducted from the total dividend attributable to 2016. The total dividend of approximately Ch$ 236,279 million for 2016 is composed of the interim dividend plus a definitive dividend of Ch$ 176,834 million, equivalent to approximately Ch$ 21,560504 per share, which will be paid on May 2017, as agreed at the OSM that was held on April 25, 2017. This corresponds to a payout ratio of 50%, based on annual consolidated net income.
In accordance with our current dividend policy, the interim dividend corresponds to 15% of liquid net income as of September 30 of each year. Additionally, our Board of Directors will propose a definitive dividend payout equal to 55% of the annual consolidated net income for fiscal year 2017. Actual dividend payments will be subject to net profits obtained in each period, as well as to expectations of future profit levels and other conditions that may exist at the time of such dividend declaration. The fulfillment of
81
the aforementioned dividend policy will depend on actual 2017 consolidated net income. The proposed dividend policy is subject to our Board of Director’s right to change the amount and timing of the dividends under the circumstances at the time of the payment.
Enel, our ultimate controlling shareholder, has stated its interest in modifying our current dividend payment policy progressively as follows: 50% of the annual consolidated net income for fiscal year 2016, 55% for fiscal year 2017, 60% for fiscal year 2018, 65% for fiscal year 2019 and 70% for fiscal year 2020.
The payment of dividends is potentially subject to legal restrictions, such as the requirement to pay dividends either from the net income or from retained earnings of the fiscal year, in both cases from financial statements formally approved by the shareholders. The Board of Directors may approve the distribution of provisional dividends during any given year only in the absence of retained losses. There may be also other contractual restrictions such as the non-default on credit agreements. However, these potential legal and contractual restrictions do not currently affect our ability or any of our subsidiaries’ ability to pay dividends. (See “Item 5. Operating and Financial Review and Prospects — B. Liquidity and Capital Resources” for further detail on our debt instruments).
Stockholders set dividend policies at each subsidiary and affiliate. We pay dividends to shareholders of record as of midnight of the fifth business day prior to the payment date. Holders of ADS on the applicable record dates will be entitled to participate in dividends.
Dividends
The table below sets forth, for each of the years indicated, the per share dividend amounts distributed by us in Chilean pesos and the amount of dividends distributed per ADS (one ADS = 30 shares of common stock) in U.S. dollars. See “Item 10. Additional Information — D. Exchange Controls.”
|
| Dividends distributed(1) |
| |||||
Year |
| Nominal Ch$ per Share |
|
| US$ per ADS(2) |
| ||
2016(3) |
|
| 14.58 |
|
|
| 0.65 |
|
2015 |
|
| 20.39 |
|
|
| 0.86 |
|
2014 |
|
| 21.58 |
|
|
| 1.07 |
|
2013 |
|
| 14.29 |
|
|
| 0.82 |
|
2012 |
|
| 27.24 |
|
|
| 1.70 |
|
(1) Only applicable to non-tax treaty jurisdiction resident. From a practical standpoint, the foregoing means that the CIT is only partially creditable (65%) against the withholding tax (i.e., CIT of 8.7%).
However, for purposes of the foregoing, the tax authority has not clarified whether the taxpayer residence will be the ADS holder’s address or the depository’s address.
Taxation on sale or exchange of ADSs, outside of Chile
Gains obtained by a foreign holder from the sale or exchange of ADSs outside Chile are not be subject to Chilean taxation.
Taxation on sale or exchange of Shares
The Chilean Income Tax Law includes a tax exemption on capital gains arising from the sale of shares of listed companies traded in stock markets. Although there are certain restrictions, in general terms, the law provides that in order to qualify for the capital gain exemption: (i) the shares must be of a publicly held stock corporation with a “sufficient stock market liquidity” status in the Chilean Stock Exchanges; (ii) the sale must be carried out in a Chilean Stock Exchange authorized by the CMF, or in a tender offer subject to Chapter XXV of the Chilean Securities Market Law or as the consequence of a contribution to a fund as regulated in Section 109 of the Chilean Income Tax Law; (iii) the shares which are being sold must have been acquired on a Chilean Stock Exchange, or in a tender offer subject to Chapter XXV of the Chilean Securities Market Law, or in an initial public offering (due to the creation of a company or to a capital increase), or due to the exchange of convertible publicly offered securities, or due to the redemption of a fund’s quota as regulated in Section 109 of the Chilean Income Tax Law; and (iv) the shares must have been acquired after April 19, 2001. For purposes of considering the ADS’s as convertible publicly offered securities, they should be registered in the Chilean foreign securities registry (unless expressly excluded from such registry by the CMF).
Shares are considered to have a “high presence” in the Chilean Stock Exchanges when (i) they have been traded for a certain number of days at or beyond a volume threshold specified under Chilean law and regulations or (ii) in case the issuer has retained a market maker, in accordance with Chilean law and regulations. As of this date, our shares are considered to have a high presence in the Chilean Stock Exchanges and no market maker has been retained by us. Should our shares cease to have a “high presence” in the Chilean Stock Exchanges, a transfer of our shares may be subject to capital gains taxes from which holders of “high presence” securities are exempted, and which will apply at varying levels depending on the time of the transfer in relation to the date of loss of sufficient trading volume to qualify as a “high presence” security. If our shares regain a “high presence,” the tax exemptions will again be available to holders thereof.
If the shares do not qualify for the exemption, capital gains on their sale or exchange of shares (as distinguished from sales or exchanges of ADSs representing such shares of common stock) could be subject to the general tax regime, with a 27% Chilean CIT, the rate applicable during 2018, and a 35% Chilean withholding tax, the former being creditable against the latter.
The date of acquisition of the ADSs is considered to be the date of acquisition of the shares for which the ADSs are exchanged.
Taxation of Share Rights and ADS Rights
For Chilean tax purposes and to the extent we issue any share rights or ADS rights, the receipt of share rights or ADS rights by a Foreign Holder of shares or ADSs pursuant to a rights offering is a nontaxable event. In addition, there are no Chilean income tax consequences to Foreign Holders upon the exercise or the expiration of the share rights or the ADS rights.
Any gain on the sale, exchange or transfer of any ADS rights by a Foreign Holder is not subject to taxes in Chile.
Any gain on the sale, exchange or transfer of the share rights by a Foreign Holder is subject to a 35% Chilean withholding tax.
Other Chilean Taxes
There is no gift, inheritance or succession tax applicable to the ownership, transfer or disposition of ADSs by foreign holders, but such taxes will generally apply to the transfer at death or by gift of the shares by a foreign holder. There is no Chilean stamp, issue, registration or similar taxes or duties payable by holders of shares or ADSs.
Material U.S. Federal Income Tax Considerations
This discussion is based on the U.S. Internal Revenue Code of 1986, as amended (the “Code”), administrative pronouncements, judicial decisions and final, temporary and proposed Treasury regulations, all as of the date of this Report. These authorities are subject to change, possibly with retroactive effect. This discussion assumes that the depositary’s activities are clearly and appropriately defined so as to ensure that the tax treatment of ADSs will be identical to the tax treatment of the underlying shares.
The following are the material U.S. federal income tax consequences to U.S. Holders (as defined herein) of receiving, owning, and disposing of shares or ADSs, but it does not purport to be a comprehensive description of all of the tax considerations that may be relevant to a particular person’s decision to hold such securities and is based on the assumption stated above under “— Chilean Tax Considerations” that there is no applicable income tax treaty in effect between the United States and Chile. The discussion applies only if the beneficial owner holds shares or ADSs as capital assets for U.S. federal income tax purposes and it does not describe all of the tax consequences that may be relevant in light of the beneficial owner’s particular circumstances. For instance, it does not describe all the tax consequences that may be relevant to:
· certain financial institutions;
· insurance companies;
· dealers and traders in securities who use a mark-to-market method of tax accounting;
· persons holding shares or ADSs as part of a “straddle” integrated transaction or similar transaction;
· persons whose functional currency for U.S. federal income tax purposes is not the U.S. dollar;
· partnerships or other entities classified as partnerships for U.S. federal income tax purposes or partners in such partnerships;
· persons liable for the alternative minimum tax;
· tax-exempt organizations;
· persons holding shares or ADSs that own or are deemed to own ten percent or more of our stock; or
· persons holding shares or ADSs in connection with a trade or business conducted outside of the United States.
Persons or entities described above, including partnerships holding shares or ADSs and partners in such partnerships, should consult their tax advisors as to the particular U.S. federal income tax consequences of holding and disposing of shares or ADSs.
You will be a “U.S. Holder” for purposes of this discussion if you become a beneficial owner of our shares or ADSs and if you are, for U.S. federal income tax purposes:
· a citizen or individual resident of the United States; or
· a corporation, or other entity taxable as a corporation, created or organized in or under the laws of the United States or any political subdivision thereof; or
· an estate, the income of which is subject to U.S. federal income taxation regardless of its source; or
· a trust (i) that validly elects to be treated as a U.S. person for U.S. federal income tax purposes or (ii) if (A) a court within the United States is able to exercise primary supervision over the administration of the trust and (B) one or more U.S. persons have the authority to control all substantial decisions of the trust.
For U.S. federal income tax purposes, it is generally expected that a U.S. Holder of ADSs will be treated as the beneficial owner of the underlying shares represented by the ADSs. The remainder of this discussion assumes that a U.S. Holder of our ADSs will be treated in this manner for U.S. federal income tax purposes. Accordingly, deposits or withdrawals of shares for ADSs will generally not be subject to U.S. federal income tax.
The U.S. Treasury has expressed concerns that parties to whom ADSs are released before shares are delivered to the depositary (pre-release) or intermediaries in the chain of ownership between beneficial owners and the issuer of the security underlying the ADSs may be taking actions that are inconsistent with the claiming of foreign tax credits for beneficial owners of depositary shares. Such actions would also be inconsistent with the claiming of the reduced tax rate, described below, applicable to dividends received by certain non-corporate beneficial owners. Accordingly, the analysis of the creditability of Chilean taxes, and the availability of the reduced tax rate for dividends received by certain non-corporate holders, each described below, could be affected by actions taken by such parties or intermediaries.
This discussion assumes that we will not be a passive foreign investment company, as described below. The discussion below does not address the effect of any U.S. state, local, estate or gift tax law or non-U.S. tax law or tax considerations that arise from rules of general application to all taxpayers on a U.S. Holder of the shares or ADSs, including the effects of any future administrative guidance interpreting provisions thereof.
U.S. Holders should consult their tax advisors with respect to their particular tax consequences of owning or disposing of shares or ADSs, including the applicability and effect of state, local, non-U.S. and other tax laws and the possibility of changes in tax laws, including the effects of any future administrative guidance.
Taxation of Distributions
Distributions received by a U.S. Holder on shares or ADSs, including the amount of any Chilean taxes withheld, other than certain pro rata distributions of shares to all shareholders, will constitute foreign-source income to the extent paid out of our current or accumulated earnings and profits (as determined for U.S. federal income tax purposes). Because we do not maintain calculations of our earnings and profits under U.S. federal income tax principles, it is expected that distributions generally will be reported to U.S. Holders as dividends. The amount of dividend income paid in Chilean pesos that a U.S. Holder will be required to include in income will equal the U.S. dollar value of the distributed Chilean peso, calculated by reference to the exchange rate in effect on the date the payment is received, regardless of whether the payment is converted into U.S. dollars on the date of receipt. If the dividend is converted into U.S. dollars on the date of receipt, a U.S. Holder will generally not be required to recognize foreign currency gain or loss in respect of the dividend income. A U.S. Holder may have foreign currency gain or loss if the dividend is converted into U.S. dollars after the date of its receipt, which would be ordinary income or loss and would be treated as income from U.S. sources for foreign tax credit purposes. Dividends will be included in a U.S. Holder’s income on the date of the U.S. Holder’s, or in the case of ADSs, the depositary’s, receipt of the dividend.
Generally, the U.S. dollar amount of dividends received by a noncorporate U.S. Holder in respect of shares or ADSs generally will be subject to taxation at preferential rates if the dividends are “qualified dividends”. Dividends paid on the ADSs generally will be treated as qualified dividends if (i) the ADSs are readily tradable on an established securities market in the United States (ii) we were not, in the year prior to the year in which the dividend was paid, and is not, in the year in which the dividend is paid, a passive foreign investment company (“PFIC”) and (iii) the holder thereof has satisfied certain holding period requirements. Our ADSs ceased trading on the New York Stock Exchange on December 31, 2018, and were delisted and are now quoted and traded in the over-the-counter market on the Pink Market, which, based on existing guidance, generally is not considered an established securities market in the United States for relevant purposes. Accordingly, dividends we pay with respect to our ADSs generally will not be eligible for “qualified dividend” treatment.
The amount of a dividend generally will be treated as foreign-source dividend income to a U.S. Holder for foreign tax credit purposes. As discussed in more detail below under “—Foreign Tax Credits,” it is not free from doubt whether Chilean withholding taxes imposed on distributions on shares or ADSs will be treated as income taxes eligible for a foreign tax credit for U.S. federal income tax purposes. If a Chilean withholding tax is treated as an eligible foreign income tax, subject to generally applicable
limitations, you may claim a credit against your U.S. federal income tax liability for the eligible Chilean taxes withheld from distributions on shares or ADSs. The rules relating to foreign tax credits are complex. U.S. Holders are urged to consult their own tax advisors regarding the treatment of Chilean withholding taxes imposed on distributions on shares or ADSs.
Sale or Other Disposition of Shares or ADSs
If a beneficial owner is a U.S. Holder, for U.S. federal income tax purposes, the gain or loss a beneficial owner realizes on the sale or other disposition of shares or ADSs will be a capital gain or loss, and will be a long term capital gain or loss if the beneficial holder has held the shares or ADSs for more than one year. The amount of a beneficial owner’s gain or loss will equal the difference between the beneficial owner’s tax basis in the shares or ADSs disposed of and the amount realized on the disposition, in each case as determined in U.S. dollars. Such gain or loss will generally be U.S.-source gain or loss for foreign tax credit purposes. In addition, certain limitations exist on the deductibility of capital losses by both corporate and individual taxpayers.
In certain circumstances, Chilean taxes may be imposed upon the sale of shares (but not ADSs). See “Item 10. Additional Information — E. Taxation — Chilean Tax Considerations — Taxation of Shares and ADSs.” If a Chilean tax is imposed on the sale or disposition of shares, a beneficial owner that is a U.S. Holder may be eligible to claim a credit against its U.S. federal income tax liability for the eligible Chilean taxes withheld pursuant to a sale or disposition of shares or ADSs as discussed in “— Foreign Tax Credits” below.
Foreign Tax Credits
Subject to applicable limitations that may vary depending upon a U.S. Holder’s circumstances and subject to the discussion above regarding concerns expressed by the U.S. Treasury, you may be eligible to claim a credit against your U.S. tax liability for Chilean income taxes (or taxes imposed in lieu of an income tax) imposed in connection with distributions on and proceeds from the sale or other disposition of our shares or ADSs. Chilean dividend withholding taxes generally are expected to be income taxes eligible for the foreign tax credit. The Chilean capital gains tax is likely to be treated as an income tax (or a tax paid in lieu of an income tax) and thus eligible for the foreign tax credit; however, you generally may claim a foreign tax credit only after taking into account any available opportunity to reduce the Chilean capital gains tax, such as the reduction for the credit for Chilean corporate income tax that is taken into account when calculating Chilean withholding tax. If a Chilean tax is imposed on the sale or disposition of our shares or ADSs, and a U.S. Holder does not receive significant foreign source income from other sources, such U.S. Holder may not be able to credit such Chilean tax against its U.S. federal income tax liability. If a Chilean tax is not treated as an income tax (or a tax paid in lieu of an income tax) for U.S. federal income tax purposes, a U.S. Holder would be unable to claim a foreign tax credit for any such Chilean tax withheld; however, a U.S. Holder may be able to deduct such tax in computing its U.S. federal income tax liability, subject to applicable limitations. In addition, instead of claiming a credit, a U.S. Holder may, at the U.S. Holder’s election, deduct such Chilean taxes in computing the U.S. Holder’s taxable income, subject to generally applicable limitations under U.S. law. An election to deduct foreign taxes instead of claiming foreign tax credits applies to all taxes paid or accrued in the taxable year to foreign countries and possessions of the U.S. The calculation of foreign tax credits and, in the case of a U.S. Holder that elects to deduct foreign income taxes, the availability of deductions, involves the application of complex rules that depend on such U.S. Holders’ particular circumstances. U.S. Holders are urged to consult their tax advisors regarding the availability of foreign tax credits in their particular circumstances.
Passive Foreign Investment Company Rules
We were not a “passive foreign investment company” or PFIC for U.S. federal income tax purposes for our 2018 taxable year and we do not anticipate being a PFIC for our 2019 taxable year. However, because PFIC status depends upon the composition of a company’s income and assets and the market value of its assets from time to time, and because it is unclear whether certain types of our income constitute passive income for PFIC purposes, there can be no assurance that we will not be considered a PFIC for any current, prior or future taxable year. If we were to become a PFIC for any taxable year during which a beneficial owner held shares or ADSs, certain adverse consequences could apply to the U.S. Holder, including the imposition of higher amounts of tax than would otherwise apply, and additional filing requirements. In addition, if we were treated as a PFIC in a taxable year in which we pay a dividend or in the prior taxable year, the favorable dividend rates discussed above with respect to dividends paid to certain non-corporate U.S. Holders would not apply (see “— Taxation of Distributions” above). U.S. Holders should consult their tax advisors regarding the consequences to them if we were to become a PFIC, as well as the availability and advisability of making any election that might mitigate the adverse consequences of PFIC status.
Required Disclosure with Respect to Foreign Financial Assets
Certain U.S. Holders are required to report information relating to an interest in our shares or ADSs, subject to certain exceptions (including an exception for our shares or ADSs held in accounts maintained by certain financial institutions), by attaching a completed IRS Form 8938, Statement of Specified Foreign Financial Assets, with their tax return for each year in which they hold an interest in our shares or ADSs. U.S. Holders are urged to consult their own U.S. tax advisors regarding information reporting requirements relating to their ownership of our shares or ADSs.
Information Reporting and Backup Withholding
Payments of dividends and sales proceeds that are made within the United States or through certain U.S.- related financial intermediaries generally are subject to information reporting and to backup withholding unless:
(i) the U.S. Holder is an exempt recipient or (ii) in the case of backup withholding, the beneficial owner provides a correct taxpayer identification number and certifies that the U.S. Holder is not subject to backup withholding.
The amount of any backup withholding from a payment to a beneficial owner will be allowed as a credit against the beneficial owner’s U.S. federal income tax liability and may entitle the U.S. Holder to a refund, provided that the required information is furnished in a timely fashion to the U.S. Internal Revenue Service.
Medicare Contribution Tax
Legislation enacted in 2010 generally imposes a tax of 3.8% on the “net investment income” of certain individuals, trusts and estates. Among other items, net investment income generally includes gross income from dividends and net gain attributable to the disposition of certain property, like the shares or ADSs, less certain deductions. A U.S. Holder should consult the holder’s own tax advisor regarding the possible application of this legislation in the beneficial owner’s particular circumstances.
U.S. Holders should consult their tax advisors with respect to the particular consequences to them owning or disposing of shares or ADSs.
F.Dividends and Paying Agents.
Not applicable.
G.Statement by Experts.
Not applicable.
H.Documents on Display.
We are subject to the information requirements of the Exchange Act, except that as a foreign issuer, we are not subject to SEC proxy rules (other than general anti-fraud rules) or the short-swing profit disclosure rules of the Exchange Act. In accordance with these statutory requirements, we file or furnish reports and other information with the SEC. Reports, information statements and other information we file with or furnish to the SEC are available electronically on the SEC’s website, which can be accessed at http://www.sec.gov and on our website www.enelgeneracion.cl.
I.Subsidiary Information.
For information on our principal subsidiaries, see “Item 4. Information on the Company — C. Organizational Structure — Principal Subsidiaries and Affiliates.”
Item 11.Quantitative and Qualitative Disclosures about Market Risk
We are exposed to risks arising from changes in commodity prices, interest rates and foreign exchange rates that affect the generation business in Chile. We monitor and manage these risks in coordination with Enel Chile, our parent company. Our Board of Directors approves risk management policies at all levels.
Commodity Price Risk
In our electricity generation business, we are exposed to market risks arising from the price volatility of electricity, natural gas, diesel oil, and coal. We seek to ensure our fuel supply by securing long-term contracts with our suppliers for periods that are expected to match the lifetime of our generation assets. These contracts generally have provisions that allow us to purchase natural gas with a pricing formula that combines Henry Hub natural gas and Brent diesel oil at market prices prevailing at the time the purchase occurs.
In order to reduce risk under extreme drought conditions, Enel has designed a commercial policy that defines sale commitment levels in line with the capacity of its generating facilities during a dry year, by including risk mitigation clauses with unregulated clients in some contracts. In the case of regulated clients subject to long-term tender processes, indexing polynomials are determined in order to reduce commodity exposure.
Considering the operating conditions faced by the electricity generation market in Chile, drought and volatility of commodity prices in international markets, the Company is constantly evaluating the convenience of contracting hedges to mitigate the impact of price changes on profits.
As of December 31, 2018, the Company held swaps for 432 kTon of Coal API2 to be settled in 2019, for 994 kBbl of Brent oil to be settled in 2019, 225 kTon of BCI7 to be settled in 2019, for 0.2 TBtu of Henry Hub gas to be settled in 2019.
As of December 31, 2017, the Company held swaps for 2.3 million MMBTU of Henry Hub gas to be settled on January 2018.
According to the operating conditions that are constantly being updated, these hedging measures may be modified, or include other commodities.
We are continually analyzing strategies to hedge commodity price risk, including transferring commodity price variations to customers’ contract prices, and permanently adjusting commodity indexed price formulas for new Power Purchase Agreements according to our exposure or analyzing ways to mitigate risk through hydrological insurance in dry years. In the future, we may considerer using price-sensitive instruments.
Interest Rate and Foreign Currency Risk
As of December 31, 2018, the carrying values according to maturity and the corresponding fair value of our interest bearing debt are detailed below. Values do not include derivatives.
|
| Expected maturity date |
| ||||||||||||||
For the year ended December 31, |
| 2019 |
| 2020 |
| 2021 |
| 2022 |
| 2023 |
| Thereafter |
| Total |
| Fair |
|
|
| (in billions of Ch$)(1) |
| ||||||||||||||
Fixed Rate |
|
|
|
|
|
|
|
|
|
|
|
|
|
|
|
|
|
Ch$/UF |
| — |
| — |
| — |
| — |
| — |
| — |
| — |
| — |
|
Weighted average interest rate |
| — |
| — |
| — |
| — |
| — |
| — |
| — |
| — |
|
US$ |
| 2,166 |
| 2,307 |
| 2,457 |
| 2,617 |
| 4,929 |
| 498,204 |
| 512,680 |
| 578,162 |
|
Weighted average interest rate |
| 6.5 | % | 6.5 | % | 6.5 | % | 6.5 | % | 6.5 | % | 13.0 | % | 12.9 | % |
|
|
Total fixed rate |
| 2,166 |
| 2,307 |
| 2,457 |
| 2,617 |
| 4,929 |
| 498,204 |
| 512,680 |
| 578,162 |
|
Weighted average interest rate |
| 6.5 | % | 6.5 | % | 6.5 | % | 6.5 | % | 6.5 | % | 13.0 | % | 12.9 | % | — |
|
Variable Rate |
|
|
|
|
|
|
|
|
|
|
|
|
|
|
|
|
|
Ch$/UF |
| 30,793 |
| 30,793 |
| 30,793 |
| 30,793 |
| 30,793 |
| 180,350 |
| 334,318 |
| 405,181 |
|
Weighted average interest rate |
| 7.9 | % | 7.9 | % | 7.9 | % | 7.9 | % | 7.9 | % | 7.9 | % | 7.9 | % | — |
|
US$ |
| — |
| — |
| — |
| — |
| — |
| — |
| — |
| — |
|
Weighted average interest rate |
| — |
| — |
| — |
| — |
| — |
| — |
| — |
| — |
|
Total variable rate |
| 30,793 |
| 30,793 |
| 30,793 |
| 30,793 |
| 30,793 |
| 180,350 |
| 334,318 |
| 405,181 |
|
Weighted average interest rate |
| 7.9 | % | 7.9 | % | 7.9 | % | 7.9 | % | 7.9 | % | 7.9 | % | 7.9 | % | — |
|
Total |
| 32,960 |
| 33,101 |
| 33,251 |
| 33,410 |
| 35,723 |
| 678,554 |
| 846,998 |
| 983,343 |
|
|
|
|
|
|
|
For a discussion of Chilean withholding taxes and access to the formal currency market in Chile in connection with the payment of dividends and sales of ADSs and the underlying common stock, see “Item 10. Additional Information — E. Taxation” and “Item 10. Additional Information — D. Exchange Controls.”
|
|
None.
|
|
Market Price Information
The shares of our common stock and our ADSs currently trade on Chilean exchanges and the NYSE, respectively.
82
The table below shows, for the periods indicated, high and low prices in Chilean pesos on the Santiago Stock Exchange and high and low closing prices of the ADSs in U.S. dollars as reported by the NYSE. As of April 21, 2016 and April 26, 2016, the price of common stocks and ADSs, respectively, reflect only the value of the Company and its Chilean operations. Before such dates, the stock prices pertain to Endesa Chile, prior to the spin-off of Endesa Américas, which included operations in five countries, including Chile.
|
| Santiago Stock Exchange(1) |
|
| U.S. Stock Exchanges(2) |
| ||||||||||
|
| Ch$ per share |
|
| US$ per ADS |
| ||||||||||
|
| High |
|
| Low |
|
| High |
|
| Low |
| ||||
2017 |
|
| 527.00 |
|
|
| 400.00 |
|
|
| 23.86 |
|
|
| 18.36 |
|
April (up to April 25, 2017) |
|
| 527.00 |
|
|
| 519.44 |
|
|
| 23.86 |
|
|
| 23.50 |
|
March |
|
| 500.00 |
|
|
| 442.00 |
|
|
| 22.66 |
|
|
| 20.03 |
|
February |
|
| 448.10 |
|
|
| 400.00 |
|
|
| 20.88 |
|
|
| 18.36 |
|
January |
|
| 455.00 |
|
|
| 415.50 |
|
|
| 20.68 |
|
|
| 19.19 |
|
|
|
|
|
|
|
|
|
|
|
|
|
|
|
|
|
|
2016 |
|
| 971.89 |
|
|
| 369.22 |
|
|
| 43.03 |
|
|
| 18.35 |
|
December |
|
| 445.00 |
|
|
| 416.00 |
|
|
| 20.69 |
|
|
| 18.37 |
|
November |
|
| 462.00 |
|
|
| 416.00 |
|
|
| 21.31 |
|
|
| 18.35 |
|
October |
|
| 480.00 |
|
|
| 434.98 |
|
|
| 21.52 |
|
|
| 19.74 |
|
September |
|
| 511.43 |
|
|
| 431.00 |
|
|
| 22.83 |
|
|
| 19.75 |
|
4th Quarter |
|
| 480.00 |
|
|
| 416.00 |
|
|
| 21.52 |
|
|
| 18.35 |
|
3rd Quarter |
|
| 620.00 |
|
|
| 431.00 |
|
|
| 27.82 |
|
|
| 19.75 |
|
2nd Quarter |
|
| 893.00 |
|
|
| 369.22 |
|
|
| 41.70 |
|
|
| 25.22 |
|
1st Quarter |
|
| 971.89 |
|
|
| 833.01 |
|
|
| 43.03 |
|
|
| 33.84 |
|
|
|
|
|
|
|
|
|
|
|
|
|
|
|
|
|
|
2015 |
|
| 985.32 |
|
|
| 785.11 |
|
|
| 48.52 |
|
|
| 33.08 |
|
4th Quarter |
|
| 898.00 |
|
|
| 785.11 |
|
|
| 37.84 |
|
|
| 33.08 |
|
3rd Quarter |
|
| 922.40 |
|
|
| 805.00 |
|
|
| 42.89 |
|
|
| 34.24 |
|
2nd Quarter |
|
| 985.32 |
|
|
| 870.00 |
|
|
| 48.52 |
|
|
| 40.31 |
|
1st Quarter |
|
| 960.01 |
|
|
| 895.00 |
|
|
| 47.05 |
|
|
| 42.34 |
|
|
|
|
|
|
|
|
|
|
|
|
|
|
|
|
|
|
2014 |
|
| 948.00 |
|
|
| 698.09 |
|
|
| 48.22 |
|
|
| 37.63 |
|
4th Quarter |
|
| 933.60 |
|
|
| 829.00 |
|
|
| 47.18 |
|
|
| 41.21 |
|
3rd Quarter |
|
| 948.00 |
|
|
| 825.99 |
|
|
| 48.22 |
|
|
| 43.12 |
|
2nd Quarter |
|
| 840.00 |
|
|
| 789.99 |
|
|
| 45.76 |
|
|
| 41.61 |
|
1st Quarter |
|
| 800.00 |
|
|
| 698.09 |
|
|
| 44.43 |
|
|
| 37.63 |
|
|
|
|
|
|
|
|
|
|
|
|
|
|
|
|
|
|
2013 |
|
| 854.00 |
|
|
| 663.04 |
|
|
| 54.02 |
|
|
| 38.26 |
|
|
|
|
|
|
|
|
|
|
|
|
|
|
|
|
|
|
2012 |
|
| 899.00 |
|
|
| 710.00 |
|
|
| 55.96 |
|
|
| 44.05 |
|
(1) Calculated based on the Observed Exchange Rate as of December 31, 2018, which was Ch$ 694.77 per US$ 1.00.
(2) As of December 31, 2018, fair value was calculated based on the discounted value of future cash flows expected to be paid (or received), considering current discount rates that reflect the different risks involved.
As of December 31, 2017, the carrying values according to maturity and the corresponding fair value of our interest bearing debt are detailed below. Values do not include derivatives.
|
| Expected maturity date |
| ||||||||||||||
For the year ended December 31, |
| 2018 |
| 2019 |
| 2020 |
| 2021 |
| 2022 |
| Thereafter |
| Total |
| Fair |
|
|
| (in billions of Ch$)(1) |
| ||||||||||||||
Fixed Rate |
|
|
|
|
|
|
|
|
|
|
|
|
|
|
|
|
|
Ch$/UF |
| — |
| — |
| — |
| — |
| — |
| — |
| — |
| — |
|
Weighted average interest rate |
| — |
| — |
| — |
| — |
| — |
| — |
| — |
| — |
|
US$ |
| 1,800 |
| 1,917 |
| 2,041 |
| 2,174 |
| 2,315 |
| 445,185 |
| 455,432 |
| 555,049 |
|
Weighted average interest rate |
| 6.8 | % | 6.8 | % | 6.8 | % | 6.8 | % | 6.8 | % | 6.1 | % | 6.1 | % |
|
|
Total fixed rate |
| 1,800 |
| 1,917 |
| 2,041 |
| 2,174 |
| 2,315 |
| 445,185 |
| 455,432 |
| 555,049 |
|
Weighted average interest rate |
| 6.8 | % | 6.8 | % | 6.8 | % | 6.8 | % | 6.8 | % | 6.1 | % | 6.1 | % | — |
|
Variable Rate |
|
|
|
|
|
|
|
|
|
|
|
|
|
|
|
|
|
Ch$/UF |
| 5,574 |
| 29,936 |
| 29,936 |
| 29,936 |
| 29,936 |
| 205,264 |
| 330,582 |
| 408,534 |
|
Weighted average interest rate |
| 9.0 | % | 7.0 | % | 7.0 | % | 7.0 | % | 7.0 | % | 6.9 | % | 7.0 | % | — |
|
US$ |
| — |
| — |
| — |
| — |
| — |
| — |
| — |
| — |
|
Weighted average interest rate |
| — |
| — |
| — |
| — |
| — |
| — |
| — |
| — |
|
Total variable rate |
| 5,574 |
| 29,936 |
| 29,936 |
| 29,936 |
| 29,936 |
| 205,264 |
| 330,582 |
| 408,534 |
|
Weighted average interest rate |
| 9.0 | % | 7.0 | % | 7.0 | % | 7.0 | % | 7.0 | % | 6.9 | % | 7.0 | % | — |
|
Total |
| 7,374 |
| 31,853 |
| 31,977 |
| 32,110 |
| 32,251 |
| 650,449 |
| 786,014 |
| 963,582 |
|
|
|
|
|
On the last trading day in 2016, our common stock closed at Ch$ 441.93 per share on the Santiago Stock Exchange and our ADSs closed at US$ 19.44 per ADS on the NYSE.
On April 25, 2017, our common stock closed at Ch$ 523.65 per share on the Santiago Stock Exchange and our ADSs closed at US$ 23.71 per ADS on the NYSE.
|
|
Not applicable.
83
In Chile, our common stock is traded on three stock exchanges: the Santiago Stock Exchange, the Electronic Stock Exchange and the Valparaíso Stock Exchange. The largest exchange in the country, the Santiago Stock Exchange, was established in 1893 as a private company. As of December 31, 2016, 214 companies had shares listed on the Santiago Stock Exchange. For 2016, the Santiago Stock Exchange accounted for 92% of our total equity traded in Chile and amounted to 1,036,839,429 shares. In addition, 7.9% of our equity trading was conducted on the Electronic Stock Exchange, an electronic trading market that was created by banks and non-member brokerage houses, and finally, less than 0.1% was traded on the Valparaíso Stock Exchange.
Equities, closed-end funds, fixed-income securities, short-term and money market securities, gold and U.S. dollars are traded on the Santiago Stock Exchange. The Santiago Stock Exchange also trades U.S. dollar futures and stock index futures. Securities are traded primarily through an open voice auction system; a firm offers system or the daily auction. Trading through the open voice system occurs on each business day from 9:30 a.m. to 4:00 p.m., during local standard time, and from 9:30 a.m. to 5:00 p.m. when daylight savings time is in place (usually from November to March), which may differ from New York City time by up to two hours, depending on the season. The Santiago Stock Exchange has an electronic trading system called Telepregón, which operates continuously from 9:30 a.m. to 4:00 p.m. during local standard time, and from 9:30 a.m. to 5:00 p.m. when daylight savings time in Chile is in place, on each business day. During local standard time, electronic auctions may be conducted at any of four times a day, at 10:30 a.m., 11:30 a.m., 1:30 p.m., and 3:30 p.m. During daylight savings time, there is an additional electronic auction at 4:30 p.m. More than 99% of the auctions and transactions take place electronically.
There are two main share price indexes on the Santiago Stock Exchange, the General Shares Price Index, or IGPA, and the Selected Shares Price Index, or IPSA. The IGPA is calculated using the prices of shares that are traded at least 5% of the trading days of a year, with total annual transactions exceeding UF 10,000 (Ch$ 263 million as of December 31, 2016, equivalent to US$ 393,565) and a free float representing at least 5%. The IPSA is calculated using the prices of the 40 shares with highest trading volume, on a quarterly basis, and with a market capitalization above US$ 200 million. The shares included in the IPSA and IGPA are weighted according to the weighted value of the shares traded. Either we or Endesa Chile, from whom we were spun off in 2016, have been included in the IPSA since 1987.
Shares of our common stock traded in the United States in the form of ADSs on the NYSE and over-the–counter from 1994 until the completion of the spin-off under our predecessor’s ticker symbol “EOC.” Since the completion of the spin-off of Endesa Américas in April 2016, our ADSs trade under the ticker symbol “EOCC.” Each ADS represents 30 shares of common stock, with the ADSs in turn evidenced by American Depositary Receipts (“ADRs”). The ADRs were issued under the Amended and Restated Deposit Agreement dated as of September 30, 2010, among us, Citibank, N.A. as Depositary (the “Depositary”), and the holders and beneficial owners from time to time of ADRs issued thereunder (the “Deposit Agreement”). Only persons in whose names ADRs are registered on the books of the Depositary are treated by the Depositary as owners of ADRs.
As of April 25, 2017, ADRs evidencing 8,984,942 ADSs (equivalent to 269,548,260 shares of common stock) were outstanding, representing 3.3% of the total number of outstanding shares. It is not practicable for us to determine the proportion of ADSs beneficially owned by U.S. final beneficial holders. Trading volume of our shares on the NYSE and other exchanges during 2016 amounted to 34.1 million ADSs, equivalent to US$ 993 million.
The NYSE is open for trading Monday through Friday from 9:30 am to 4:00 pm, with the exception of holidays declared by the NYSE in advance. On the trading floor, the NYSE trades in a continuous auction format, where traders can execute stock transactions on behalf of investors. Specialist brokers act as auctioneers in an open outcry auction market to bring buyers and sellers together and to manage the actual auction. Customers can also send orders for immediate electronic execution or route orders to the floor for trade in the auction market. The NYSE works with U.S. regulators like the SEC and the Commodity Futures Trading Commission to coordinate risk management measures in the electronic trading environment through the implementation of mechanisms like circuit breakers and liquidity replenishment points.
The following table contains information regarding the amount of total traded shares of common stock and the corresponding percentage traded per market during 2016:
|
| Number of common shares traded |
|
| Percent |
| ||
Market |
|
|
|
|
|
|
|
|
Chile(1) |
|
| 1,127,273,928 |
|
|
| 52.4 | % |
United States (One ADS = 30 shares of common stock)(2) |
|
| 1,024,315,530 |
|
|
| 47.6 | % |
Total |
|
| 2,151,589,458 |
|
|
| 100 | % |
|
|
|
|
For further information, see “Item 9. The Offer and Listing — A. Offer and Listing Details — Market Price Information.”
|
|
Not applicable.
|
|
Not applicable.
|
|
Not applicable.
Item 10.Additional Information
|
|
Not applicable.
|
|
Description of Share Capital
Set forth below is certain information concerning our share capital and a brief summary of certain significant provisions of Chilean law and our by-laws.
General
Shareholders’ rights in Chilean companies are governed by the company’s by-laws (estatutos), which have the same purpose as the articles or the certificate of incorporation and the by-laws of a company incorporated in the United States, and by the Chilean Companies Act Law 18,046. In addition, D.L. 3500, or the Pension Funds’ System Law, which permits the investment by Chilean pension funds in stock of qualified companies, indirectly affects corporate governance and prescribes certain rights of shareholders. In accordance with the Chilean Companies Act, legal actions by shareholders to enforce their rights as shareholders of the company must be brought in Chile in arbitration proceedings or, at the option of the plaintiff, before Chilean courts. Members of the Board of Directors, managers, officers and principal executives of the company, or shareholders that individually own shares with a book value or stock value higher that UF 5,000 (Ch$ 132 million as of December 31, 2016) do not have the option to bring the procedure to the courts.
The Chilean securities markets are principally regulated by the SVS under Securities Market Law (Law 18,045), and the Chilean Companies Act. These two laws state the disclosure requirements, restrictions on insider trading and price manipulation, and provide protection to minority shareholders. The Securities Market Law sets forth requirements for public offerings, stock exchanges and brokers, and outlines disclosure requirements for companies that issue publicly offered securities. The Chilean Companies Act and the Securities Market Law, both as amended, state rules regarding takeovers, tender offers, transactions with related parties, qualified majorities, share repurchases, directors’ committees, independent directors, stock options and derivative actions.
Public Register
We are a publicly held stock corporation incorporated under the laws of Chile. We were constituted by public deed issued on December 1, 1943 by the Santiago Notary Public, Mr. Luciano Hiriart C. Our existence and by-laws were approved by Decree 97 of the Ministry of Finance on January 3, 1944. An excerpt of the by-laws was registered on page 61, and the Decree was registered on page 65 of the Commercial Registrar (Registro de Comercio del Conservador de Bienes Raíces y Comercio de Santiago), on January 17, 1944. We are registered with the SVS under the entry number 0114. We are also registered with the United States Securities and Exchange Commission under the commission file number 001-13240 on July 26, 1994.
85
Reporting Requirements Regarding Acquisition or Sale of Shares
Under Article 12 of the Securities Market Law and General Rule 269 of the SVS, certain information regarding transactions in shares of a publicly held stock corporation or in contracts or securities whose price or results depend on, or are conditioned in whole or in part on the price of such shares, must be reported to the SVS and the Chilean stock exchanges. Since ADSs are deemed to represent the shares of common stock underlying the ADRs, transactions in ADRs will be subject to these reporting requirements and those established in Circular 1375 of the SVS. Shareholders of publicly held stock corporations are required to report to the SVS and the Chilean stock exchanges:
any direct or indirect acquisition or sale of shares made by a holder who owns, directly or indirectly, at least 10% of a publicly held stock corporation’s subscribed capital;
any direct or indirect acquisition or sale of contracts or securities whose price or results depend on or are conditioned in whole or in part on the price of shares made by a holder who owns, directly or indirectly, at least 10% of a publicly held stock corporation’s subscribed capital;
any direct or indirect acquisition or sale of shares made by a holder who, due to an acquisition of shares of such publicly held stock company, results in the holder acquiring, directly or indirectly, at least 10% of a publicly held stock company’s subscribed capital; and
any direct or indirect acquisition or sale of shares in any amount, made by a director, receiver, principal executive, general manager or manager of a publicly held stock company.
In addition, majority shareholders of a publicly held stock corporation must inform the SVS and the Chilean stock exchanges if such transactions are entered into with the intention of acquiring control of the company or if they are making a passive financial investment instead.
Under Article 54 of the Securities Market Law and General Rule 104 enacted by the SVS, any person who directly or indirectly intends to take control of a publicly held stock corporation must disclose this intent to the market at least ten business days in advance of the proposed change of control and, in any event, as soon as the negotiations for the change of control have taken place or reserved information of the publicly held stock corporation has been provided.
Corporate Objectives and Purposes
Article 4 of our by-laws states that our corporate objectives and purposes are, among other things, to engage in the production, transportation, distribution and supply of electric power, as well as to provide engineering consulting services, whether directly or through other companies, in Chile and abroad.
Board of Directors
Our Board of Directors consists of nine members who are appointed by shareholders at an OSM and are elected for a three year term, at the end of which they will be re-elected or replaced.
The nine directors elected at the OSM are the nine individual nominees who receive the highest majority of the votes. Each shareholder may vote his shares in favor of one nominee or may apportion his shares among any number of nominees.
The effect of these voting provisions is to ensure that a shareholder owning more than 10% of our shares is able to elect a member of the Board.
The compensation of the directors is established annually at the OSM. See “Item 6. Directors, Senior Management and Employees — B. Compensation.”
Agreements entered into by us with related parties can only be executed when such agreements serve our interest, and their price, terms and conditions are consistent with prevailing market conditions at the time of their approval and comply with all the requirements and procedures indicated in Article 147 of the Chilean Companies Act.
Certain Powers of the Board of Directors
Our by-laws provide that every agreement or contract that we enter into with our controlling shareholder, our directors or executives, or their related parties, must be previously approved by two-thirds of the Board of Directors and be included in the Board meetings, and must comply with the provisions of the Chilean Companies Act.
86
Our by-laws do not contain provisions relating to:
the directors’ power, in the absence of an independent quorum, to vote on compensation for themselves or any members of their body;
borrowing powers exercisable by the directors and how such borrowing powers can be varied;
retirement or non-retirement of directors under an age limit requirement; or
number of shares, if any, required for directors’ qualification.
Certain Provisions Regarding Shareholder Rights
As of the date of the filing of this Report, our capital is comprised of only one class of shares, all of which are ordinary shares and have the same rights.
Our by-laws do not contain any provisions relating to:
redemption provisions;
sinking funds; or
liability for capital reductions by us.
Under Chilean law, the rights of our shareholders may only be modified by an amendment to the by-laws that complies with the requirements explained below under “Item 10. Additional Information — B. Memorandum and Articles of Association. — Shareholders’ Meetings and Voting Rights.”
Capitalization
Under Chilean law, only the shareholders of a company acting at an ESM have the power to authorize a capital increase. When an investor subscribes shares, these are officially issued and registered under his name, and the subscriber is treated as a shareholder for all purposes, except receipt of dividends and for return of capital in the event that the shares have been subscribed but not paid for. The subscriber becomes eligible to receive dividends only for the shares that he has actually paid for or, if the subscriber has paid for only a portion of such shares, the pro rata portion of the dividends declared with respect to such shares unless the company’s by-laws provide otherwise. If a subscriber does not fully pay for shares for which the subscriber has subscribed on or prior to the date agreed upon for payment, notwithstanding the actions intended by the company to collect payment, the company is entitled to auction the shares on the stock exchange where such shares are traded, for the account and risk of the debtor, the number of shares held by the debtor necessary for the company to pay the outstanding balances and disposal expenses. However, until such shares are sold at auction, the subscriber continues to hold all the rights of a shareholder, except the right to receive dividends and return of capital. The Chief Executive Officer, or the person replacing him, will reduce in the shareholders’ register the number of shares in the name of the debtor shareholder to the number of shares that remain, deducting the shares sold by the company and settling the debt in the amount necessary to cover the result of such disposal after the corresponding expenses. When there are authorized and issued shares for which full payment has not been made within the period fixed by shareholders at the same ESM at which the subscription was authorized (which in no case may exceed three years from the date of such meeting), these shall be reduced in the non-subscribed amount until that date. With respect to the shares subscribed and not paid following the term mentioned above, the Board must proceed to collect payment, unless the shareholders’ meeting authorizes (by two thirds of the voting shares) a reduction of the company’s capital to the amount effectively collected, in which case the capital shall be reduced by force of law to the amount effectively paid. Once collection actions have been exhausted, the Board should propose to the shareholders’ meeting the approval by simple majority of the write-off of the outstanding balance and the reduction of capital to the amount effectively recovered.
As of December 31, 2016, our subscribed and fully paid capital totaled Ch$ 553 billion and consisted of 8,201,754,580 shares.
Preemptive Rights and Increases of Share Capital
The Chilean Companies Act requires Chilean companies to grant shareholders preemptive rights to purchase a sufficient number of shares to maintain their existing ownership percentage of such company whenever such company issues new shares.
Under Chilean law, preemptive rights are exercisable or freely transferable by shareholders during a 30-day period. The options to subscribe for shares in capital increases of the company or of any other securities convertible into shares or that confer future rights over these shares, should be offered, at least once, to the shareholders pro rata to the shares held registered in their name at midnight on the fifth business day prior to the date of the start of the preemptive rights period. The preemptive rights offering and the start of the 30-day period for exercising them shall be communicated through the publication of a prominent notice, at least once, in the
87
newspaper that should be used for notifications of shareholders’ meetings. During such 30-day period, and for an additional period of up to 30-days immediately following the initial 30-day period, publicly held stock corporations are not permitted to offer any unsubscribed shares to third parties on terms which are more favorable than those offered to their shareholders. At the end of the second 30-day period, a Chilean publicly held stock corporation is authorized to sell non-subscribed shares to third parties on any terms, provided they are sold on one of the Chilean stock exchanges.
Shareholders’ Meetings and Voting Rights
An OSM must be held within the first four months following the end of our fiscal year. Our last OSM was held on April 25, 2017. An ESM may be called by the Board of Directors when deemed appropriate, or when requested by shareholders representing at least 10% of the issued shares with voting rights, or by the SVS. To convene an OSM or an ESM, notice must be given three times in a newspaper located in our corporate domicile. The newspaper designated by our shareholders is El Mercurio de Santiago. The first notice must be published not less than 15-days and no more than 20-days in advance of the scheduled meeting. Notice must also be mailed to each shareholder, to the SVS and to the Chilean stock exchanges.
The OSM shall be held on the day stated in the notice and should remain in session until having exhausted all the matters stated in the notice. However, once constituted, upon the proposal of the chairman or shareholders representing at least 10% of the shares with voting rights, the majority of the shareholders present may agree to suspend it and to continue it within the same day and place, with no new constitution of the meeting or qualification of powers being necessary, recorded in one set of minutes. Only those shareholders who were present or represented may attend the recommencement of the meeting with voting rights.
Under Chilean law, a quorum for a shareholders’ meeting is established by the presence, in person or by proxy, of shareholders representing at least a majority of the issued shares with voting rights of a company. If a quorum is not present at the first meeting, a reconvened meeting can take place at which the shareholders present are deemed to constitute a quorum regardless of the percentage of the shares represented. This second meeting must take place within 45-days following the scheduled date for the first meeting. Shareholders’ meetings adopt resolutions by the affirmative vote of a majority of those shares present or represented at the meeting. An ESM must be called to take the following actions:
a transformation of the company into a form other than a publicly held stock corporation under the Chilean Companies Act, a merger or split-up of the company;
an amendment to the term of duration or early dissolution of the company;
a change in the company’s domicile;
a decrease of corporate capital;
an approval of capital contributions in kind and non-monetary assessments;
a modification of the authority reserved to shareholders or limitations on the Board of Directors;
a reduction in the number of members of the Board of Directors;
a disposition of 50% or more of the assets of the company, whether it includes disposition of liabilities or not, as well as the approval or the amendment of the business plan which contemplates the disposition of assets in an amount greater that such percentage;
the disposition of 50% or more of the assets of a subsidiary, as long as such subsidiary represents at least 20% of the assets of the corporation, as well as any disposition of its shares that results in the parent company losing its position as controlling shareholder;
the form of distributing corporate benefits;
issue of guarantees for third-party liabilities which exceed 50% of the assets, except when the third party is a subsidiary of the company, in which case approval of the Board of Directors is deemed sufficient;
the purchase of the company’s own shares;
other actions established by the by-laws or the laws;
certain remedies for the nullification of the company’s by-laws;
inclusion in the by-laws of the right to purchase shares from minority shareholders, when the controlling shareholders reaches 95% of the company’s shares by means of a tender offer for all of the company’s shares, where at least 15% of the shares have been acquired from unrelated shareholders; and
approval or ratification of acts or contracts with related parties.
88
Regardless of the quorum present, the vote required for any of the actions above is at least two-thirds of the outstanding shares with voting rights.
By-law amendments for the creation of a new class of shares, or an amendment to or an elimination of those classes of shares that already exist, must be approved by at least two-thirds of the outstanding shares of the affected series.
Chilean law does not require a publicly held stock corporation to provide its shareholders the same level and type of information required by the U.S. securities laws regarding the solicitation of proxies. However, shareholders are entitled to examine the financial statements and corporate books of a publicly held stock corporation within the 15-day period before its scheduled OSM. Under Chilean law, a notice of a shareholders meeting listing matters to be addressed at the meeting must be mailed at least 15 days prior to the date of such meeting, and, an indication of the way complete copies of the documents that support the matters submitted for voting can be obtained, which must also be made available to shareholders on our website. In the case of an OSM, our annual report of activities, which includes audited financial statements, must also be made available to shareholders and published on our website at: www.enelgeneracion.cl.
The Chilean Companies Act provides that, upon the request by the Directors’ Committee or by shareholders representing at least 10% of the issued shares with voting rights, a Chilean company’s annual report must include, in addition to the materials provided by the Board of Directors to shareholders, such shareholders’ comments and proposals in relation to the company’s affairs. In accordance with Article 136 of the Chilean Companies Regulation (Reglamento de Sociedades Anónimas), the shareholder(s) holding or representing 10% or more of the shares issued with voting rights, may:
make comments and proposals relating to the progress of the corporate businesses in the corresponding year, no shareholder being able to make individually or jointly more than one presentation. These observations should be presented in writing to the company concisely, responsibly and respectfully, and the respective shareholder(s) should state their willingness for these to be included as an appendix to the annual report. The board shall include in an appendix to the annual report of the year a faithful summary of the pertinent comments and proposals the interested parties had made, provided they are presented during the year or within 30-days after its ending; or
make comments and proposals on matters that the board submits for the knowledge or voting of the shareholders. The board shall include a faithful summary of those comments and proposals in all information it sends to shareholders, provided the shareholders’ proposal is received at the offices of the company at least 10-days prior to the date of dispatch of the information by the company. The shareholders should present their comments and proposals to the company, expressing their willingness for these to be included in the appendix to the respective annual report or in information sent to shareholders, as the case may be. The observations referred to in this Article may be made separately by each shareholder holding 10% or more of the shares issued with voting rights or shareholders who together hold that percentage, who should act as one.
Similarly, the Chilean Companies Act provides that whenever the Board of Directors of a publicly held stock corporation convenes an OSM and solicits proxies for the meeting, or circulates information supporting its decisions or other similar material, it is obligated to include the pertinent comments and proposals that may have been made by the Directors’ Committee or by shareholders owning 10% or more of the shares with voting rights who request that such comments and proposals be so included.
Only shareholders registered as such with us as of midnight on the fifth business day prior to the date of a meeting are entitled to attend and vote their shares. A shareholder may appoint another individual, who does not need to be a shareholder, as his proxy to attend the meeting and vote on his behalf. Proxies for such representation shall be given for all the shares held by the owner. The proxy may contain specific instructions to approve, reject, or abstain with respect to any of the matters submitted for voting at the meeting and which were included in the notice. Every shareholder entitled to attend and vote at a shareholders’ meeting shall have one vote for every share subscribed.
There are no limitations imposed by Chilean law or our by-laws on the right of nonresidents or foreigners to hold or vote shares of common stock. However, the registered holder of the shares of common stock represented by ADSs, and evidenced by outstanding ADSs, is the custodian of the Depositary, currently Banco Santander-Chile, or any successor thereto. Accordingly, holders of ADSs are not entitled to receive notice of meetings of shareholders directly or to vote the underlying shares of common stock represented by ADS directly. The Deposit Agreement contains provisions pursuant to which the Depositary has agreed to solicit instructions from registered holders of ADSs as to the exercise of the voting rights pertaining to the shares of common stock represented by the ADSs. Subject to compliance with the requirements of the Deposit Agreement and receipt of such instructions, the Depositary has agreed to endeavor, insofar as practicable and permitted under Chilean law and the provisions of the by-laws, to vote or cause to be voted (or grant a discretionary proxy to the Chairman of the Board of Directors or to a person designated by the Chairman of the Board of Directors to vote) the shares of common stock represented by the ADSs in accordance with any such instruction. The Depositary shall not itself exercise any voting discretion over any shares of common stock underlying ADSs. If no voting instructions are received by the Depositary from a holder of ADSs with respect to the shares of common stock represented by the ADSs, on or before the date
89
established by the Depositary for such purpose, the shares of common stock represented by the ADS, may be voted in the manner directed by the Chairman of the Board, or by a person designated by the Chairman of the Board, subject to limitations set forth in the Deposit Agreement.
Dividends and Liquidation Rights
According to the Chilean Companies Act, unless otherwise decided by unanimous vote of its issued shares eligible to vote, all companies must distribute a cash dividend in an amount equal to at least 30% of their consolidated net income, unless and except to the extent we have carried forward losses. The law provides that the Board of Directors must agree to the dividend policy and inform such policy to the shareholders at the OSM.
Any dividend in excess of 30% of net income may be paid, at the election of the shareholders, in cash, or in our shares, or in shares of publicly held corporations owned by us. Shareholders who do not expressly elect to receive a dividend other than in cash are legally presumed to have decided to receive the dividend in cash.
Dividends, which are declared but not paid within the appropriate time period set forth in the Chilean Companies Act (as to minimum dividends, 30-days after declaration; as to additional dividends, the date set for payment at the time of declaration), are adjusted to reflect the change in the value of UF, from the date set for payment to the date such dividends are actually paid. Such dividends also accrue interest at the then-prevailing rate for UF-denominated deposits during such period. The right to receive a dividend lapses if it is not claimed within five years from the date such dividend is payable. Payments not collected in such period are transferred to the volunteer fire department.
In the event of our liquidation, the shareholders would participate in the assets available in proportion to the number of paid-in shares held by them, after payment to all creditors.
Approval of Financial Statements
The Board of Directors is required to submit our consolidated financial statements to the shareholders annually for their approval. If the shareholders by a vote of a majority of shares present (in person or by proxy) at the shareholders’ meeting reject the financial statements, the Board of Directors must submit new financial statements no later than 60-days from the date of such meeting. If the shareholders reject the new financial statements, the entire Board of Directors is deemed removed from office and a new board is elected at the same meeting. Directors who individually approved such financial statements are disqualified for reelection for the following period. Our shareholders have never rejected the financial statements presented by the Board of Directors.
Change of Control
The Capital Markets Law establishes a comprehensive regulation related to tender offers. The law defines a tender offer as the offer to purchase shares of companies which publicly offer their shares or securities convertibles into shares and which offer is made to shareholders to purchase their shares under conditions which allow the bidder to reach a certain percentage of ownership of the company within a fixed period of time. These provisions apply to both voluntary and hostile tender offers.
Acquisition of Shares
No provision in our by-laws discriminates against any existing or prospective holder of shares as a result of such shareholder owning a substantial number of shares. However, no person may directly or indirectly own more than 65% of the outstanding shares of our stock. The foregoing restriction does not apply to the depositary as record owner of shares represented by ADRs, but it does apply to each beneficial ADS holder. Additionally, our by-laws prohibit any shareholder from exercising voting power with respect to more than 65% of the common stock owned by such shareholder or on behalf of others representing more than 65% of the outstanding issued shares with voting rights.
Right of Dissenting Shareholders to Tender Their Shares
The Chilean Companies Act provides that upon the adoption of any of the resolutions enumerated below at a meeting of shareholders, dissenting shareholders acquire the right to withdraw from the company and to compel the company to repurchase their shares, subject to the fulfillment of certain terms and conditions. In order to exercise such withdrawal rights, holders of ADRs must first withdraw the shares represented by their ADRs pursuant to the terms of the Deposit Agreement.
“Dissenting” shareholders are defined as those who at a shareholders’ meeting vote against a resolution that results in the withdrawal right, or who if absent from such meeting, state in writing their opposition to the respective resolution, within the 30-days
90
following the shareholders’ meeting. Shareholders present or represented at the meeting and who abstain in exercising their voting rights shall not be considered as dissenting. The right to withdraw should be exercised for all the shares that the dissenting shareholder had registered in their name on the date on which the right is determined to participate in the meeting at which the resolution is adopted that motivates the withdrawal and which remains on the date on which their intention to withdraw is communicated to the company. The price paid to a dissenting shareholder of a publicly held stock corporation whose shares are quoted and actively traded on one of the Chilean stock exchanges is the weighted average of the sales prices for the shares as reported on the Chilean stock exchanges on which the shares are quoted for the two-month period between the ninetieth and the thirtieth day before the shareholders’ meeting giving rise to the withdrawal right. If, because of the volume, frequency, number and diversity of the buyers and sellers, the SVS determines that the shares are not actively traded on a stock exchange, the price paid to the dissenting shareholder shall be the book value. Book value for this purpose shall equal paid capital plus reserves and profits, less losses, divided by the total number of subscribed shares, whether entirely or partially paid. For the purpose of making this calculation, the last consolidated statements of financial position is used, as adjusted to reflect inflation up to the date of the shareholders’ meeting which gave rise to the withdrawal right.
Article 126 of the Chilean Companies Act Regulations establishes that in cases where the right to withdraw arises, the company shall be obliged to inform the shareholders of this situation, the value per share that will be paid to shareholders exercising their right to withdraw and the term for exercising it. Such information should be given to shareholders at the same meeting at which the resolutions are adopted giving rise to the right of withdrawal, prior to its voting. A special communication should be given to the shareholders with rights, within two days following the date on which the rights to withdraw are born. In the case of publicly held companies, such information shall be communicated by a prominent notice in a newspaper with a wide national circulation and on its website, plus a written communication addressed to the shareholders with rights at the address they have registered with the company. The notice of the shareholders meeting that should pronounce on a matter that could originate withdrawal rights should mention this circumstance.
The resolutions that result in a shareholder’s right to withdraw include, among others, the following:
the transformation of the company into an entity which is not a publicly held stock corporation governed by Chilean Companies Act;
the merger of the company with another company;
disposition of 50% or more of the assets of the company, whether it includes disposition of liabilities or not, as well as the approval or the amendment of the business plan which contemplates the disposition of assets in an amount greater than such percentage;
the disposition of 50% or more of the assets of a subsidiary, as long as such subsidiary represents at least 20% of the assets of the company, as well as any disposition of its shares that results in the parent company losing its position of controlling shareholder;
issue of guarantees for third parties’ liabilities which exceed 50% of the assets (if the third party is a subsidiary of the company, the approval of the Board of Directors is sufficient);
the creation of preferential rights for a class of shares or an amendment to the existing ones. In this case the right to withdraw only accrues to the dissenting shareholders of the class or classes of shares adversely affected;
certain remedies for the nullification of the corporate by-laws; and
such other causes as may be established by the law or by the company’s by-laws.
Investments by AFPs
The Pension Funds’ System Law permits AFPs to invest their funds in companies that are subject to Title XII and these companies are subject to greater restrictions than other companies. The determination of which stocks may be purchased by AFPs is made by the Risk Classification Committee. The Risk Classification Committee establishes investment guidelines and is empowered to approve or disapprove those companies that are eligible for AFP investments. We have been a Title XII Company since 1987 and we are approved by the Risk Classification Committee.
Title XII companies are required to have by-laws that:
limit the ownership of any shareholder to a specified maximum percentage, currently at 65%;
require that certain actions be taken only at a meeting of the shareholders; and
91
Registrations and Transfers
Shares issued by us are registered with an administrative agent, which is DCV Registros S.A. This entity is also responsible for our shareholders registry. In case of jointly-owned shares, an attorney-in-fact must be appointed to represent the joint owners in dealing with us.
|
|
None.
|
|
The Central Bank of Chile is responsible for, among other things, monetary policies and exchange controls in Chile. Currently applicable foreign exchange regulations are set forth in the Compendium of Foreign Exchange Regulations (the “Compendium”) approved by the Central Bank of Chile in 2002. Appropriate registration of a foreign investment in Chile permits the investor access to the Formal Exchange Market. Foreign investments can be registered with the Foreign Investment Committee under D.L. 600 of 1974 or can be registered with the Central Bank of Chile under the Central Bank Act, Law 18840 of October 1989.
|
|
In connection with our initial public offering of ADSs in 1994, we entered into a foreign investment contract (the “Foreign Investment Contract”) with the Central Bank of Chile and the Depositary, pursuant to Article 47 of the Central Bank Act and Chapter XXVI of the former Compendium of Foreign Exchange Regulations (“Chapter XXVI”), which governed the issuance of ADSs by a Chilean company. Pursuant to the Foreign Investment Contract, the foreign exchange for payments and distributions with respect to ADSs could be purchased in either the Formal Exchange Market or the Informal Exchange Market, but such payments needed to be remitted through the Formal Exchange Market.
As of April 19, 2001, Chapter XXVI was eliminated and new investments in ADSs by non-residents of Chile are now governed instead by Chapter XIV of the Compendium. This change was made with the purpose of simplifying and facilitating the flow of capital to and from Chile. As a result of the elimination of Chapter XXVI, access to the Formal Exchange Market is no longer assured. However, because our Foreign Investment Contract was entered into pursuant to Chapter XXVI, the terms of Chapter XXVI still apply. Foreign investors who have purchased their shares under a Foreign Investment Contract pursuant to Chapter XXVI continue to have access to the Formal Exchange Market for the purpose of converting pesos to U.S. dollars and repatriating from Chile amounts received with respect to the deposited shares of common stock or shares of common stock withdrawn from deposit on surrender of ADRs (including amounts received as cash dividends and proceeds from the sale in Chile of the underlying shares of common stock and any rights with respect thereto). However, foreign investors who have not deposited the shares of common stock into our ADS facility will not have the benefits of our Foreign Investment Contract with the Central Bank of Chile but instead will be subject to the normal foreign investment rules.
The following is a summary of certain provisions which were contained in Chapter XXVI and the Foreign Investment Contract, and which therefore remain relevant. This summary does not purport to be complete and is qualified in its entirety by reference to Chapter XXVI and the Foreign Investment Contract.
Under Chapter XXVI and the Foreign Investment Contract, the Central Bank of Chile agreed to grant to the depositary, on behalf of ADR holders, and to any investor not residing or domiciled in Chile who withdraws common stock upon delivery of ADRs (such shares of common stock being referred to herein as Withdrawn Shares) access to the Formal Exchange Market to convert pesos into U.S. dollars (and to remit such U.S. dollars outside of Chile), including amounts received as:
cash dividends;
proceeds from the sale in Chile of Withdrawn Shares subject to receipt by the Central Bank of Chile of a certificate from the holder of the Withdrawn Shares (or from an institution authorized by the Central Bank of Chile) that such holder’s residence and domicile are outside Chile and a certificate from a Chilean stock exchange (or from a brokerage or securities firm established in Chile) that such Withdrawn Shares were sold on a Chilean stock exchange;
proceeds from the sale in Chile of rights to subscribe for additional shares of Common Stock;
92
other distributions, including, without limitation, those resulting from any recapitalization, as a result of holding shares of Common Stock represented by ADS or Withdrawn Shares.
Transferees of Withdrawn Shares were not entitled to any of the foregoing rights under Chapter XXVI. Investors receiving Withdrawn Shares in exchange for ADRs had the right to redeposit such shares in exchange for ADRs, provided that certain conditions relating to redeposit were satisfied.
Chapter XXVI stated that access to the Formal Exchange Market in connection with dividend payments was conditioned upon certification by us to the Central Bank of Chile that a dividend payment has been made and any applicable tax has been withheld. Chapter XXVI also stated that the access to the Formal Exchange Market in connection with the sale of Withdrawn Shares or distributions thereon was conditioned upon receipt by the Central Bank of Chile of certification by the Depositary (or the Custodian on its behalf) that such shares have been withdrawn in exchange for ADRs and receipt of a waiver of the benefit of the Foreign Investment Contract with respect thereto until such Withdrawn Shares were redeposited.
The Foreign Investment Contract states that a person who brings foreign currency into Chile to purchase shares of common stock with the benefit of the Foreign Investment Contract must convert it into pesos on the same day and has five banking business days within which to invest in shares of common stock in order to receive the benefits of the Foreign Investment Contract. If such person decides within such period not to acquire shares of common stock, such person can access the Formal Exchange Market to reacquire U.S. dollars, provided that the applicable request is presented to the Central Bank of Chile within seven banking business days of the initial conversion into pesos. Shares acquired as described above may be deposited for ADRs and receive the benefits of the Foreign Investment Contract, subject to receipt by the Central Bank of Chile of a certificate from the Depositary (or the Custodian on its behalf) that such deposit has been effected, that the related ADRs have been issued and receipt of a declaration from the person making such deposit waiving the benefits of the Foreign Investment Contract with respect to the deposited shares of common stock.
Access to the Formal Exchange Market under any of the circumstances described above is not automatic. Such access requires approval of the Central Bank of Chile based on a request presented through a banking institution established in Chile. The Foreign Investment Contract states that if the Central Bank of Chile has not acted on such request within seven banking days, the request will be deemed approved.
The Compendium and International Bond Issuances
Chilean issuers may offer bonds issued by the Central Bank of Chile internationally under Chapter XIV, as amended, of the Compendium.
|
|
Chilean Tax Considerations
The following discussion summarizes material Chilean income and withholding tax consequences to foreign holders arising from the ownership and disposition of shares and ADSs. The summary that follows does not purport to be a comprehensive description of all of the tax considerations that may be relevant to a decision to purchase, own or dispose of shares or ADSs, if any, and does not purport to deal with the tax consequences applicable to all categories of investors, some of which may be subject to special rules. Holders of shares and ADSs are advised to consult their own tax advisors concerning the Chilean and other tax consequences of the ownership of shares or ADSs.
The summary that follows is based on Chilean law, in effect on the date hereof, and is subject to any changes in these or other laws occurring after such date, possibly with retroactive effect. Under Chilean law, provisions contained in statutes such as tax rates applicable to foreign investors, the computation of taxable income for Chilean purposes and the manner in which Chilean taxes are imposed and collected may be amended only by another law. In addition, the Chilean tax authorities enact rulings and regulations of either general or specific application and interpret the provisions of the Chilean Income Tax Law. Chilean tax may not be assessed retroactively against taxpayers who act in good faith relying on such rulings, regulations and interpretations, but Chilean tax authorities may change their rulings, regulations and interpretations in the future. The discussion that follows is also based, in part, on representations of the depositary, and assumes that each obligation in the Deposit Agreement and any related agreements will be performed in accordance with its terms. As of this date, there is currently no applicable income tax treaty in effect between the United States and Chile. However, in 2010 the United States and Chile signed an income tax treaty that will enter into force once the treaty is ratified by both countries, which has not happened as of the date of this Report. There can be no assurance that the treaty will be ratified by either country. The following summary assumes that there is no applicable income tax treaty in effect between the United States and Chile.
93
As used in this Report, the term “foreign holder” means either:
in the case of an individual holder, a person who is not a resident of Chile; for purposes of Chilean taxation, an individual is resident of Chile if he or she has resided in Chile for more than six months in one calendar year, or a total of more than six months in two consecutive fiscal years; or
in the case of a legal entity holder, an entity that is not organized under the laws of Chile, unless the shares or ADSs are assigned to a branch, agent, representative or permanent establishment of such entity in Chile.
Taxation of Shares and ADSs
Taxation of Cash Dividends and Property Distributions
General Rule: The following taxation of cash dividends and property distributions applies until 2016. Cash dividends paid with respect to the shares or ADSs held by a foreign holder will be subject to Chilean withholding tax, which is withheld and paid by the company. As described in the example below, the amount of the Chilean withholding tax is determined by applying a 35% rate to a “grossed-up” distribution amount (such amount equal to the sum of the actual distribution amount and the correlative Chilean corporate income tax paid by the issuer), and then subtracting as a credit such Chilean corporate income tax paid by the issuer.
In September 2014, a tax reform was enacted (Law 20,780) which, among other topics, progressively increased the corporate income tax (“CIT”). The CIT rate will be adjusted as follows: in 2014 it increased from 20% to 21%; in 2015 it increased to 22.5%; in 2016 it increased to 24%; in 2017, depending on which of the two new alternative systems enacted as part of the 2014 tax reform (discussed below) is chosen, the rate increases to 25% for companies electing the accrued income basis and 25.5% for companies electing the cash basis for shareholders. As of 2018, the CIT rate will remain at 25% for companies that elected the accrued income basis and will increase to 27% for companies that elected the cash basis for shareholders. The example below illustrates the effective Chilean withholding tax burden on a cash dividend received by a foreign holder, assuming a Chilean withholding tax base rate of 35%, an effective Chilean corporate income tax rate of 24% (CIT rate for 2016) and a distribution of 50% of the net income of the company distributable after payment of the Chilean corporate income tax:
Line |
| Concept and calculation assumptions |
| Amount |
| |
1 |
| Company taxable income (based on Line 1 = 100) |
|
| 100.0 |
|
2 |
| Chilean corporate income tax : 24% x Line 1 |
|
| 24 |
|
3 |
| Net distributable income: Line 1 — Line 2 |
|
| 76 |
|
4 |
| Dividend distributed (50% of net distributable income): 50% of Line 3 |
|
| 38 |
|
5 |
| Withholding tax: (35% of (the sum of Line 4 and 50% of Line 2)) |
|
| (17.5 | ) |
6 |
| Credit for 50% of Chilean corporate income tax : 50% of Line 2 |
|
| 12 |
|
7 |
| Net withholding tax : Line 5 + Line 6 |
|
| (5.6 | ) |
8 |
| Net dividend received: Line 4 - Line 7 |
|
| 32.5 |
|
9 |
| Effective dividend withholding rate : Line 7 / Line 4 |
|
| 14.5 |
|
In general, the effective Chilean dividend withholding tax rate, after giving effect to the credit for the Chilean corporate income tax paid by the company, can be computed using the following formula:
(1) Calculated based on the Observed Exchange Rate as of December 31, 2017, which was Ch$ 614.75 per US$ 1.00.
(2) As of December 31, 2017, fair value was calculated based on the discounted value of future cash flows expected to be paid (or received), considering current discount rates that reflect the different risks involved.
Interest Rate Risk
Our policy aims to minimize the average cost of debt and reduce the volatility of our financial results. Depending on our estimates and the debt structure, we sometimes manage interest rate risk through the use of interest rate derivatives.
As of December 31, 2018, and 2017, 93% and 92%, respectively, of our total outstanding debt was denominated in fixed terms and 7% and 8% respectively was subject to variable interest rates. Because the exposure to variable interest rate risk was so low, we did not engage in derivative hedging instruments.
Foreign Currency Risk
Our policy seeks to maintain a balance between the currency in which cash flows are indexed and the currency of the debt of each company. Most of our subsidiaries have access to funding in the same currency as their revenues, therefore reducing the exchange rate volatility impact. In some cases, we cannot fully benefit from this, and therefore, we try to manage the exposure with financial derivatives such as cross currency swaps or currency forwards, among others. However, this may not always be possible under reasonable terms due to market conditions.
As of December 31, 2018, the carrying values for financial accounting purposes and the corresponding fair value of the instruments that hedge the foreign exchange risk of our interest bearing debt were as follows:
|
| Expected Maturity Date |
| ||||||||||||||
For the year ended December 31, |
| 2019 |
| 2020 |
| 2021 |
| 2022 |
| 2023 |
| Thereafter |
| Total |
| Fair |
|
|
| (in billions of Ch$)(1) |
| ||||||||||||||
UF to US$ |
| 534,547 |
| — |
| — |
| — |
| — |
| — |
| 534,547 |
| (18,892 | ) |
US$ to Ch$/UF |
| — |
| — |
| — |
| — |
| — |
| — |
| — |
| — |
|
Ch$ to US$ |
| — |
| — |
| — |
| — |
| — |
| — |
| — |
| — |
|
|
|
|
|
|
|
|
|
|
|
|
|
|
|
|
|
|
|
Total |
| 534,547 |
| — |
| — |
| — |
| — |
| — |
| 534,547 |
| (18,892 | ) |
|
|
| ||
|
|
Using the rates prevailing until 2016, the Effective Dividend Withholding Rate is
(35%-24%) / (100%-24%) = 14.47%
Dividends are generally assumed to have been paid out of our oldest retained profits for purposes of determining the level of Chilean corporate income tax that was paid by us. For information as to our retained earnings for tax purposes and the tax credit available on the distribution of such retained earnings, see Note 17 of the Notes to our consolidated financial statements.
Under Chilean Income Tax Law, dividend distributions made in property are subject to the same Chilean tax rules as cash dividends. Stock dividends that represent free shares distributed to foreign shareholders as a consequence of a capitalization made on the same corporation are not subject to Chilean taxation.
94
Exceptions: Despite the aforementioned general rule, there are special circumstances under which a different tax treatment would apply depending on the source of the income or due to special circumstances existing at the date of the dividend distribution. The most common special cases are briefly described below:
|
|
|
|
|
|
|
|
New System in effect starting in 2017
The tax reform released in September 2014, as amended by Law 20,899 enacted on February 8, 2016, created two alternative mechanisms of shareholder-level income taxation beginning on January 1, 2017: a) accrued income basis (known as attributed-income system in Chile) shareholder taxation and b) cash basis (known as partially-integrated system in Chile and most similar to the current system) shareholder taxation. Since we are a public limited company (“Sociedad Anónima” in Spanish), no election is available to us, and therefore the cash basis system is mandatory for us according to the law.
In addition, the aforementioned Law 20,899 expanded the 100% CIT credit against the Chilean shareholder tax to taxpayers who are residents in countries with which Chile has an effective or signed tax treaty to avoid international double taxation prior to January 1, 2017, even if not in force as of such date. This is currently the status of the treaty signed between Chile and the United States. This temporary rule will be in force from January 1, 2017 through December 31, 2019.
Under the cash basis system, we will pay CIT (at 25% in 2017 and at 27% thereafter) on our annual result. Foreign and local individual shareholders will only pay in Chile the relevant tax (as described below) on effective profit distributions and will be allowed to use the tax paid by the distributing company as credit, with certain limitations. Only 65% of the CIT is creditable against the 35% shareholder- level tax (as opposed to 100% under the current FUT regime and under the accrued income basis). However, if there is an effective or signed tax treaty with Chile before January 1, 2017 (even if not in effect), the CIT is fully creditable against the 35% shareholder tax.
Taxation in two stages:
Company: 27% of accrued profits (using the maximum CIT applicable from 2018 and forward).
Shareholder: 35% of cash disbursement (65% of CIT tax is creditable against the shareholder level tax, resulting in an effective tax rate to the shareholder of 17.5%. However, if the shareholder is a resident of a country with an effective or signed tax treaty with Chile before January 1, 2017 (even if not in effect), CIT tax is fully creditable, resulting in an effective tax rate to the shareholder of 8%).
Total Tax Burden: 44.45% (35% for residents of countries with tax treaties).
Taxation on sale or exchange of ADSs, outside of Chile
Gains obtained by a foreign holder from the sale or exchange of ADSs outside Chile will not be subject to Chilean taxation.
95
Taxation on sale or exchange of Shares
Until December 31, 2016, the Chilean Income Tax Law included a tax exemption on capital gains arising from the sale of shares of listed companies traded in the stock markets. Although there were certain restrictions, in general terms, the amendment provided that in order to qualify for the capital gain exemption: (i) the shares must be of a publicly held stock corporation with a certain minimum level of trading on a stock exchange; (ii) the sale must be carried out in a Chilean stock exchange, or in a tender offer subject to Chapter XXV of the Chilean Securities Market Law; (iii) the shares which were being sold must have been acquired on a Chilean stock exchange, or in a tender offer subject to Chapter XXV of the Chilean Securities Market Law, or in an initial public offering (due to the creation of a company or to a capital increase), or due to the exchange of convertible bonds; and (iv) the shares must have been acquired after April 19, 2001.
If the shares did not qualify for the above exemption, capital gains on their sale or exchange of shares (as distinguished from sales or exchanges of ADSs representing such shares of common stock) could be subject to two alternative tax regimes: (a) the general tax regime, with a 24% Chilean CIT and a 35% Chilean withholding tax, the former being creditable against the latter; or (b) a 24% Chilean CIT as sole tax regime, when all the following circumstances were met: (i) the sale was made between unrelated parties, (ii) the sale of shares was not a recurrent or habitual activity for the seller and (iii) at least one year had elapsed between the acquisition and the sale of the shares.
The date of acquisition of the ADSs was considered to be the date of acquisition of the shares for which the ADSs were exchanged.
Since January 1, 2017, the capital gains obtained in the sales of shares owned by foreign holders are subject to CIT and Chilean withholding tax, and the CIT serves as a credit in Chile to reduce the withholding tax.
Other Chilean Taxes
There is no gift, inheritance or succession tax applicable to the ownership, transfer or disposition of ADSs by foreign holders, but such taxes will generally apply to the transfer at death or by gift of the shares by a foreign holder. There is no Chilean stamp, issue, registration or similar taxes or duties payable by holders of shares or ADSs.
Material U.S. Income Tax Considerations
This discussion is based on the Internal Revenue Code of 1986, as amended (the “Code”), administrative pronouncements, judicial decisions and final, temporary and proposed Treasury regulations, all as of the date hereof. These authorities are subject to change, possibly with retroactive effect. This discussion assumes that the depositary’s activities are clearly and appropriately defined so as to ensure that the tax treatment of ADSs will be identical to the tax treatment of the underlying shares.
The following are the material U.S. federal income tax consequences to U.S. Holders (as defined herein) of receiving, owning, and disposing of shares or ADSs, but it does not purport to be a comprehensive description of all of the tax considerations that may be relevant to a particular person’s decision to hold such securities and is based on the assumption stated above under “Chilean Tax Considerations” that there is no applicable income tax treaty in effect between the United States and Chile. The discussion applies only if the beneficial owner holds shares or ADSs as capital assets for U.S. federal income tax purposes and it does not describe all of the tax consequences that may be relevant in light of the beneficial owner’s particular circumstances. For instance, it does not describe all the tax consequences that may be relevant to:
certain financial institutions;
insurance companies;
dealers and traders in securities who use a mark-to-market method of tax accounting;
persons holding shares or ADSs as part of a “straddle” integrated transaction or similar transaction;
persons whose functional currency for U.S. federal income tax purposes is not the U.S. dollar;
partnerships or other entities classified as partnerships for U.S. federal income tax purposes;
persons liable for the alternative minimum tax;
tax-exempt organizations;
persons holding shares or ADSs that own or are deemed to own ten percent or more of our stock; or
persons holding shares or ADSs in connection with a trade or business conducted outside of the United States.
96
If an entity classified as a partnership for U.S. federal income tax purposes holds shares or ADSs, the U.S. federal income tax treatment of a partner will generally depend on the status of the partner and upon the activities of the partnership. Partnerships holding shares or ADSs and partners in such partnerships should consult their tax advisors as to the particular U.S. federal income tax consequences of holding and disposing of the shares or ADSs.
You will be a “U.S. Holder” for purposes of this discussion if you become a beneficial owner of our shares or ADSs and if you are, for U.S. federal income tax purposes:
a citizen or individual resident of the United States; or
a corporation, or other entity taxable as a corporation, created or organized in or under the laws of the United States or any political subdivision thereof; or
an estate, the income of which is subject to U.S. federal income taxation regardless of its source; or
a trust (i) that validly elects to be treated as a U.S. person for U.S. federal income tax purposes or (ii) if (A) a court within the United States is able to exercise primary supervision over the administration of the trust and (B) one or more U.S. persons have the authority to control all substantial decisions of the trust.
In general, if a beneficial owner owns ADSs, such owner will be treated as the owner of the shares represented by those ADSs for U.S. federal income tax purposes. Accordingly, no gain or loss will be recognized if a beneficial owner exchanges ADSs for the underlying shares represented by those ADSs.
The U.S. Treasury has expressed concerns that parties to whom ADSs are released before shares are delivered to the depositary (pre-release) or intermediaries in the chain of ownership between beneficial owners and the issuer of the security underlying the ADSs may be taking actions that are inconsistent with the claiming of foreign tax credits for beneficial owners of depositary shares. Such actions would also be inconsistent with the claiming of the reduced tax rate, described below, applicable to dividends received by certain non-corporate beneficial owners. Accordingly, the analysis of the creditability of Chilean taxes, and the availability of the reduced tax rate for dividends received by certain non-corporate holders, each described below, could be affected by actions taken by such parties or intermediaries.
This discussion assumes that we will not be a passive foreign investment company, as described below.
Beneficial owners should consult their tax advisors with respect to their particular tax consequences of owning or disposing of shares or ADSs, including the applicability and effect of state, local, non-U.S. and other tax laws and the possibility of changes in tax laws.
Taxation of Distributions
The following discussion is based on the current regime for taxation of cash dividends and distributions applicable in Chile until 2016. For 2017 and later, the U.S. federal income tax treatment will depend on which of the two regimes we elect to adopt. We adopted the cash basis system, which is very similar to the regime that was in effect until 2016. See “Item 10. Additional Information — E. Taxation— Chilean Tax Considerations — Taxation of shares and ADSs — Taxation of Cash Dividends and Property Distributions” above.
Distributions paid on shares or ADSs other than certain pro rata distributions of shares of common stock will be treated as dividends taxable as ordinary income to the extent paid out of our current or accumulated earnings and profits (as determined under U.S. federal income tax principles). Because we do not maintain calculations of our earnings and profits under U.S. federal income tax principles, it is expected that distributions generally will be reported as dividends.
If a beneficial owner is a U.S. Holder, subject to applicable limitations and the discussion above regarding concerns expressed by the U.S. Treasury, dividends paid by qualified foreign corporations to the beneficial owner that is not a corporation are taxable at a maximum rate of 20%. A foreign company is treated as a qualified foreign corporation with respect to dividends paid on stock that is readily tradable on an established securities market in the United States, such as the New York Stock Exchange where our ADSs are traded. Beneficial owners should consult their tax advisors to determine whether the favorable rate will apply to dividends they receive and whether they are subject to any special rules that limit their ability to be taxed at this favorable rate.
The amount of a dividend will include the net amount withheld by us in respect of Chilean withholding taxes on the distribution. The amount of the dividend will be treated as foreign-source dividend income to a beneficial owner and will not be eligible for the dividends-received deduction generally allowed to U.S. corporations under the Code. Dividends will be included in a beneficial owner’s income on the date of the beneficial owner’s, or in the case of ADSs, the Depositary’s receipt of the dividend. The amount of
97
any dividend paid in Chilean pesos will be a U.S. dollar amount calculated by reference to the exchange rate for converting Chilean pesos into U.S. dollars in effect on the date of such receipt regardless of whether the payment is in fact converted into U.S. dollars. If the dividend is converted into U.S. dollars on the date of receipt, a beneficial owner generally should not be required to recognize foreign currency gain or loss in respect of the dividend income. A beneficial owner may have foreign currency gain or loss if the dividend is converted into U.S. dollars on a date after the date of receipt.
Subject to applicable limitations that may vary depending upon a beneficial owner’s circumstances and subject to the discussion above regarding concerns expressed by the U.S. Treasury, the net amount of Chilean withholding tax (after reduction for the credit for Chilean corporate income tax, as discussed above under “Item 10. Additional Information — E. Taxation — Chilean Tax Considerations — Taxation of Shares and ADSs — Taxation of Cash Dividends and Property Distributions”) withheld from dividends on shares or ADSs will be creditable against a beneficial owner’s U.S. federal income tax liability. The rules governing foreign tax credits are complex and, therefore, a beneficial owner should consult the beneficial owner’s tax advisor regarding the availability of foreign tax credits in the beneficial owner’s particular circumstances. Instead of claiming a credit, a beneficial owner may, at the beneficial owner’s election, deduct such Chilean taxes in computing the beneficial owner’s taxable income, subject to generally applicable limitations under U.S. law. An election to deduct foreign taxes instead of claiming foreign tax credits applies to all taxes paid or accrued in the taxable year to foreign countries and possessions of the United States.
Sale or Other Disposition of Shares or ADSs
If a beneficial owner is a U.S. Holder, for U.S. federal income tax purposes, the gain or loss a beneficial owner realizes on the sale or other disposition of shares or ADSs will be a capital gain or loss, and will be a long- term capital gain or loss if the beneficial holder has held the shares or ADSs for more than one year. The amount of a beneficial owner’s gain or loss will equal the difference between the beneficial owner’s tax basis in the shares or ADSs disposed of and the amount realized on the disposition, in each case as determined in U.S. dollars. Such gain or loss will generally be U.S.-source gain or loss for foreign tax credit purposes. In addition, certain limitations exist on the deductibility of capital losses by both corporate and individual taxpayers.
In certain circumstances prior to 2017, and in all circumstances starting in 2017, Chilean taxes may be imposed upon the sale of shares (but not ADSs). See “Item 10. Additional Information — E. Taxation — Chilean Tax Considerations — Taxation of Shares and ADSs.” If a Chilean tax is imposed on the sale or disposition of shares, and a beneficial owner that is a U.S. Holder does not receive significant foreign source income from other sources, such beneficial owner may not be able to credit such Chilean tax against the beneficial owner’s U.S. federal income tax liability.
Passive Foreign Investment Company Rules
We believe that we will not be a “passive foreign investment company” (“PFIC”) for U.S. federal income tax purposes for our 2017 taxable year or for the foreseeable future. However, because PFIC status depends upon the composition of a company’s income and assets and the market value of its assets from time to time, and because it is unclear whether certain types of our income constitute passive income for PFIC purposes, there can be no assurance that we will not be considered a PFIC for any taxable year. If we were to become a PFIC for any taxable year during which a beneficial owner held shares or ADSs, certain adverse consequences could apply to the beneficial owner, including the imposition of higher amounts of tax than would otherwise apply, and additional filing requirements. Beneficial owners should consult their tax advisors regarding the consequences to them if we were to become a PFIC, as well as the availability and advisability of making any election that might mitigate the adverse consequences of PFIC status.
Information Reporting and Backup Withholding
Payments of dividends and sales proceeds that are made within the United States or through certain U.S.-related financial intermediaries generally are subject to information reporting and to backup withholding unless:
(i) the beneficial owner is an exempt recipient or (ii) in the case of backup withholding, the beneficial owner provides a correct taxpayer identification number and certifies that the beneficial owner is not subject to backup withholding.
The amount of any backup withholding from a payment to a beneficial owner will be allowed as a credit against the beneficial owner’s U.S. federal income tax liability and may entitle the beneficial owner to a refund, provided that the required information is furnished in a timely fashion to the Internal Revenue Service.
Medicare Contribution Tax
Legislation enacted in 2010 generally imposes a tax of 3.8% on the “net investment income” of certain individuals, trusts and estates. Among other items, net investment income generally includes gross income from dividends and net gain attributable to the
98
disposition of certain property, like the shares or ADSs, less certain deductions. A beneficial owner should consult the beneficial owner’s tax advisor regarding the possible application of this legislation in the beneficial owner’s particular circumstances.
Beneficial owners should consult their tax advisors with respect to the particular consequences to them of receiving, owning or disposing of shares or ADSs.
|
|
Not applicable.
|
|
Not applicable.
|
|
We are subject to the information requirements of the Exchange Act, except that as a foreign issuer, we are not subject to SEC proxy rules (other than general anti-fraud rules) or the short-swing profit disclosure rules of the Exchange Act. In accordance with these statutory requirements, we file or furnish reports and other information with the SEC. Reports and other information filed or furnished with the SEC may be inspected and copied at the public reference facilities maintained by the SEC at Room 1024, 100 F Street, N.E., Washington, D.C. 20549. Copies of such material may also be inspected at the offices of the New York Stock Exchange, at 11 Wall Street, New York, New York 10005, on which our ADSs are listed. In addition, the SEC maintains a website that contains electronically filed information, which can be accessed at http://www.sec.gov.
|
|
Not applicable.
Item 11.Quantitative and Qualitative Disclosures About Market Risk
We are exposed to risks arising from changes in commodity prices, interest rates and foreign exchange rates that affect the generation business in Chile. These risks are monitored and managed by us in coordination with Enel Chile, our parent company. Our Board of Directors approves risk management policies at all levels.
Commodity Price Risk
In our electricity generation business, we are exposed to market risks arising from the price volatility of electricity, natural gas, diesel oil, and coal. We seek to ensure our fuel supply by securing long-term contracts with our suppliers for periods that are expected to match the lifetime of our generation assets. These contracts generally have provisions that allow us to purchase natural gas with a pricing formula that combines Henry Hub natural gas and Brent diesel oil at market prices prevailing at the time the purchase occurs. As of December 31, 2016, we held contracts classified as derivative financial instruments related to diesel oil (2,928,675 barrels of Brent diesel oil) and natural gas (3,317,491 MMBTU of Henry Hub). As of December 31, 2015, we held contracts classified as financial instruments related to diesel oil (133,058 barrels of Brent diesel oil).
In our thermal power plants, which use coal or petroleum-based liquid fuel, the dispatch or bidding mechanism allows these plants to cover their operating costs. However, under certain circumstances, fuel price fluctuations might affect marginal costs. We transfer commodity prices variations to contracted sale prices according to indexing formulas. Due to the drought conditions in the past several years in Chile and the price volatility of coal, we hedged this risk with commodity instruments available in the international markets. As of December 31, 2016 and 2015, we did not hold any contracts classified as either derivative financial instruments or financial instruments related either to coal or petroleum based liquid fuel.
Additionally, through adequate commercial risk mitigation policies, and a hydro-thermal power plant mix, we seek to naturally protect our operating income from electricity price volatility. As of December 31, 2016 and 2015, we did not hold electricity price-sensitive instruments.
We are continually analyzing strategies to hedge commodity price risk, like transferring commodity price variations to the customers’ contract prices and/or permanently adjusting commodity indexed price formulas for new Power Purchase Agreements according to our exposure and/or analyzing ways to mitigate risk through hydrological insurance in dry years. In the future we may use price-sensitive instruments.
99
Interest Rate and Foreign Currency Risk
As of December 31, 2016, the carrying values according to maturity and the corresponding fair value of our interest bearing debt are detailed below. Values do not include derivatives.
|
| Expected maturity date |
| |||||||||||||||||||||||||||||
For the year ended December 31, |
| 2017 |
|
| 2018 |
|
| 2019 |
|
| 2020 |
|
| 2021 |
|
| Thereafter |
|
| Total |
|
| Fair Value(2) |
| ||||||||
|
| (in millions of Ch$)(1) |
| |||||||||||||||||||||||||||||
Fixed Rate |
|
|
|
|
|
|
|
|
|
|
|
|
|
|
|
|
|
|
|
|
|
|
|
|
|
|
|
|
|
|
|
|
Ch$/UF |
|
| — |
|
|
| — |
|
|
| — |
|
|
| — |
|
|
| — |
|
|
| — |
|
|
| — |
|
|
| — |
|
Weighted average interest rate |
|
| — |
|
|
| — |
|
|
| — |
|
|
| — |
|
|
| — |
|
|
| — |
|
|
| — |
|
|
| — |
|
US$ |
|
| 1,840 |
|
|
| 1,960 |
|
|
| 2,087 |
|
|
| 2,223 |
|
|
| 2,368 |
|
|
| 487,333 |
|
|
| 497,811 |
|
|
| 596,452 |
|
Weighted average interest rate |
|
| 6.5 | % |
|
| 6.5 | % |
|
| 6.5 | % |
|
| 6.5 | % |
|
| 6.5 | % |
|
| 6.1 | % |
|
| 6.1 | % |
|
|
|
|
Total fixed rate |
|
| 1,840 |
|
|
| 1,960 |
|
|
| 2,087 |
|
|
| 2,223 |
|
|
| 2,368 |
|
|
| 487,333 |
|
|
| 497,811 |
|
|
| 596,452 |
|
Weighted average interest rate |
|
| 6.5 | % |
|
| 6.5 | % |
|
| 6.5 | % |
|
| 6.5 | % |
|
| 6.5 | % |
|
| 6.1 | % |
|
| 6.1 | % |
|
| — |
|
Variable Rate |
|
|
|
|
|
|
|
|
|
|
|
|
|
|
|
|
|
|
|
|
|
|
|
|
|
|
|
|
|
|
|
|
Ch$/UF |
|
| 5,480 |
|
|
| 5,480 |
|
|
| 29,433 |
|
|
| 49,433 |
|
|
| 29,433 |
|
|
| 231,249 |
|
|
| 330,509 |
|
|
| 422,604 |
|
Weighted average interest rate |
|
| 9.1 | % |
|
| 9.1 | % |
|
| 7.8 | % |
|
| 7.8 | % |
|
| 7.8 | % |
|
| 7.8 | % |
|
| 7.8 | % |
|
| — |
|
US$ |
|
| — |
|
|
| — |
|
|
| — |
|
|
| — |
|
|
| — |
|
|
| — |
|
|
| — |
|
|
| — |
|
Weighted average interest rate |
|
| — |
|
|
| — |
|
|
| — |
|
|
| — |
|
|
| — |
|
|
| — |
|
|
| — |
|
|
| — |
|
Total variable rate |
|
| 5,480 |
|
|
| 5,480 |
|
|
| 29,433 |
|
|
| 49,433 |
|
|
| 29,433 |
|
|
| 231,249 |
|
|
| 330,509 |
|
|
| 422,604 |
|
Weighted average interest rate |
|
| 9.1 | % |
|
| 9.1 | % |
|
| 7.8 | % |
|
| 7.8 | % |
|
| 7.8 | % |
|
| 7.8 | % |
|
| 7.8 | % |
|
| — |
|
Total |
|
| 7,320 |
|
|
| 7,440 |
|
|
| 31,520 |
|
|
| 51,656 |
|
|
| 31,801 |
|
|
| 718,582 |
|
|
| 828,320 |
|
|
| 1,019,056 |
|
(1) Calculated based on the Observed Exchange Rate as of December 31, 2018, which was Ch$ 694.77 per US$ 1.00.
(2) Fair values were calculated based on the discounted value of future cash flows expected to be paid (or received), considering current discount rates that reflect the different risks involved.
As of December 31, 2017, the carrying values for financial accounting purposes and the corresponding fair value of the instruments that hedge the foreign exchange risk of our interest bearing debt were as follows:
|
| Expected Maturity Date |
| ||||||||||||||
For the year ended December 31, |
| 2018 |
| 2019 |
| 2020 |
| 2021 |
| 2022 |
| Thereafter |
| Total |
| Fair |
|
|
| (in billions of Ch$)(1) |
| ||||||||||||||
UF to US$ |
| — |
| 500,198 |
| — |
| — |
| — |
| — |
| 500,198 |
| 7,696 |
|
US$ to Ch$/UF |
| — |
| — |
| — |
| — |
| — |
| — |
| — |
| — |
|
Ch$ to US$ |
| — |
| — |
| — |
| — |
| — |
| — |
| — |
| — |
|
|
|
|
|
|
|
|
|
|
|
|
|
|
|
|
|
|
|
Total |
| — |
| 500,198 |
| — |
| — |
| — |
| — |
| 500,198 |
| 7,696 |
|
|
|
|
|
As of December 31, 2015, the carrying values according to maturity and the corresponding fair value of our interest bearing debt are detailed below. Values do not include derivatives.
|
| Expected maturity date |
| |||||||||||||||||||||||||||||
For the year ended December 31, |
| 2016 |
|
| 2017 |
|
| 2018 |
|
| 2019 |
|
| 2020 |
|
| Thereafter |
|
| Total |
|
| Fair Value(2) |
| ||||||||
|
| (in millions of Ch$)(1) |
| |||||||||||||||||||||||||||||
Fixed Rate |
|
|
|
|
|
|
|
|
|
|
|
|
|
|
|
|
|
|
|
|
|
|
|
|
|
|
|
|
|
|
|
|
Ch$/UF |
|
| — |
|
|
| — |
|
|
| — |
|
|
| — |
|
|
| — |
|
|
| — |
|
|
| — |
|
|
| — |
|
Weighted average interest rate |
|
| 6.7 | % |
|
| — |
|
|
| — |
|
|
| — |
|
|
| — |
|
|
| — |
|
|
| — |
|
|
| — |
|
US$ |
|
| 1,833 |
|
|
| 1,952 |
|
|
| 2,079 |
|
|
| 2,214 |
|
|
| 2,358 |
|
|
| 519,464 |
|
|
| 529,901 |
|
|
| 594,108 |
|
Weighted average interest rate |
|
| 5.6 | % |
|
| 5.6 | % |
|
| 5.6 | % |
|
| 5.6 | % |
|
| 5.6 | % |
|
| 5.7 | % |
|
| 5.7 | % |
|
|
|
|
Total fixed rate |
|
| 1,833 |
|
|
| 1,952 |
|
|
| 2,079 |
|
|
| 2,214 |
|
|
| 2,358 |
|
|
| 519,464 |
|
|
| 529,901 |
|
|
| 594,108 |
|
Weighted average interest rate |
|
| 5.6 | % |
|
| 5.6 | % |
|
| 5.6 | % |
|
| 5.6 | % |
|
| 5.6 | % |
|
| 5.7 | % |
|
| 5.7 | % |
|
| — |
|
Variable Rate |
|
|
|
|
|
|
|
|
|
|
|
|
|
|
|
|
|
|
|
|
|
|
|
|
|
|
|
|
|
|
|
|
Ch$/UF |
|
| 5,331 |
|
|
| 5,331 |
|
|
| 5,331 |
|
|
| 28,630 |
|
|
| 28,630 |
|
|
| 253,570 |
|
|
| 326,822 |
|
|
| 410,256 |
|
Weighted average interest rate |
|
| 10.6 | % |
|
| 10.6 | % |
|
| 10.6 | % |
|
| 9.0 | % |
|
| 9.0 | % |
|
| 9.0 | % |
|
| 9.1 | % |
|
| — |
|
US$ |
|
| — |
|
| — |
|
|
| — |
|
|
| — |
|
|
| — |
|
|
| — |
|
|
| — |
|
|
| — |
| |
Weighted average interest rate |
|
|
|
|
| — |
|
|
| — |
|
|
| — |
|
|
| — |
|
|
| — |
|
|
| — |
|
|
| — |
| |
Total variable rate |
|
| 5,331 |
|
|
| 5,331 |
|
|
| 5,331 |
|
|
| 28,630 |
|
|
| 28,630 |
|
|
| 253,570 |
|
|
| 326,822 |
|
|
| 410,256 |
|
Weighted average interest rate |
|
| 10.6 | % |
|
| 10.6 | % |
|
| 10.6 | % |
|
| 9.0 | % |
|
| 9.0 | % |
|
| 9.0 | % |
|
| 9.1 | % |
|
| — |
|
Total |
|
| 7,164 |
|
|
| 7,283 |
|
|
| 7,410 |
|
|
| 30,844 |
|
|
| 30,988 |
|
|
| 773,034 |
|
|
| 856,723 |
|
|
| 1,004,364 |
|
|
|
|
|
Interest Rate Risk
Our policy aims to minimize the average cost of debt and reduce the volatility of our financial results. Depending on our estimates and the debt structure, we sometimes manage interest rate risk through the use of interest rate derivatives.
100
At both December 31, 2016 and 2015, 92% of our total outstanding debt was denominated in fixed terms and 8% was subject to variable interest rates. Because the exposure to variable interest rate risk was so low, we did not engage in derivative hedging instruments.
Foreign Currency Risk
Our policy seeks to maintain a balance between the currency in which cash flows are indexed and the currency of the debt of each company. Most of our subsidiaries have access to funding in the same currency as their revenues, therefore reducing the exchange rate volatility impact. In some cases, we cannot fully benefit from this, and therefore, we try to manage the exposure with financial derivatives such as cross currency swaps or currency forwards, among others. However, this may not always be possible under reasonable terms due to market conditions.
As of December 31, 2016, the carrying values for financial accounting purposes and the corresponding fair value of the instruments that hedge the foreign exchange risk of our interest bearing debt were as follows:
|
| Expected Maturity Date |
| |||||||||||||||||||||||||||||
For the year ended December 31, |
| 2017 |
|
| 2018 |
|
| 2019 |
|
| 2020 |
|
| 2021 |
|
| Thereafter |
|
| Total |
|
| Fair Value(2) |
| ||||||||
|
| (in millions of Ch$)(1) |
| |||||||||||||||||||||||||||||
UF to US$ |
|
| — |
|
|
| — |
|
|
| 523,687 |
|
|
| — |
|
|
| — |
|
|
| — |
|
|
| 523,687 |
|
|
| (23,641 | ) |
US$ to Ch$/UF |
|
| — |
|
|
| — |
|
|
| — |
|
|
| — |
|
|
| — |
|
|
| — |
|
|
| — |
|
|
| — |
|
Ch$ to US$ |
|
| — |
|
|
| — |
|
|
| — |
|
|
| — |
|
|
| — |
|
|
| — |
|
|
| — |
|
|
| — |
|
|
|
|
|
|
|
|
|
|
|
|
|
|
|
|
|
|
|
|
|
|
|
|
|
|
|
|
|
|
|
|
|
|
Total |
|
| — |
|
|
| — |
|
|
| 523,687 |
|
|
| — |
|
|
| — |
|
|
| — |
|
|
| 523,687 |
|
|
| (23,641 | ) |
|
|
|
|
As of December 31, 2015, the carrying values for financial accounting purposes and the corresponding fair value of the instruments that hedge the foreign exchange risk of our interest bearing debt were as follows:
|
| Expected Maturity Date |
| |||||||||||||||||||||||||||||
For the year ended December 31, |
| 2016 |
|
| 2017 |
|
| 2018 |
|
| 2019 |
|
| 2020 |
|
| Thereafter |
|
| Total |
|
| Fair Value(2) |
| ||||||||
|
| (in millions of Ch$)(1) |
| |||||||||||||||||||||||||||||
UF to US$ |
|
| — |
|
|
| — |
|
|
| — |
|
|
| 541,153 |
|
|
| — |
|
|
| — |
|
|
| 541,153 |
|
|
| (60,304 | ) |
US$ to Ch$/UF |
|
| — |
|
|
| — |
|
|
| — |
|
|
| — |
|
|
| — |
|
|
| — |
|
|
| — |
|
|
| — |
|
Ch$ to US$ |
|
| — |
|
|
| — |
|
|
| — |
|
|
| — |
|
|
| — |
|
|
| — |
|
|
| — |
|
|
| — |
|
|
|
|
|
|
|
|
|
|
|
|
|
|
|
|
|
|
|
|
|
|
|
|
|
|
|
|
|
|
|
|
|
|
Total |
|
| — |
|
|
| — |
|
|
| — |
|
|
| 541,153 |
|
|
| — |
|
|
| — |
|
|
| 541,153 |
|
|
| (60,304 | ) |
|
|
|
|
For further detail, please refer to Note 19.6 of the Notes to our consolidated financial statements.
|
|
The information in this “Item 11. Quantitative and Qualitative Disclosures About Market Risk,” contains information that may constitute forward-looking statements. See “Forward-Looking Statements” in the Introduction of this Report for safe harbor provisions.
Item 12.Description of Securities Other Than Equity Securities
|
|
Not applicable.
101
Not applicable.
|
|
Not applicable.
|
|
(1) Calculated based on the Observed Exchange Rate as of December 31, 2017, which was Ch$ 614.75 per US$ 1.00.
(2) Fair values were calculated based on the discounted value of future cash flows expected to be paid (or received), considering current discount rates that reflect the different risks involved.
(d)Safe Harbor.
The information in this “Item 11. Quantitative and Qualitative Disclosures About Market Risk,” contains information that may constitute forward-looking statements. See “Forward-Looking Statements” in the Introduction of this Report for safe harbor provisions.
Item 12.Description of Securities Other Than Equity Securities
A.Debt Securities.
Not applicable.
B.Warrants and Rights.
Not applicable.
C.Other Securities.
Not applicable.
D.American Depositary Shares.
Depositary Fees and Charges
Our ADS program’s depositary is Citibank, N.A. The Depositary collects fees for delivery and surrender of ADSs directly from investors depositing shares or surrendering ADSs for the purpose of withdrawal or from intermediaries acting for them. The Depositary fees payable for cash distributions are deducted from the cash being distributed. In the case of distributions other than cash, the Depositary will invoice the applicable ADS record date holders. The Depositary may generally refuse to provide the requested services until its fees for those services are paid. Under the terms of the Deposit Agreement, an ADS holder may have to pay the following service fees to the Depositary:
|
| |
|
| |
|
| |
|
| |
|
| |
|
| |
|
|
Service Fees
The Depositary collects fees for delivery and surrender of ADSs directly from investors depositing shares or surrendering ADSs for the purpose of withdrawal or from intermediaries acting for them. The Depositary fees payable for cash distributions are deducted from the cash being distributed. In the case of distributions other than cash, the Depositary will invoice the applicable ADS record date holders. The Depositary may generally refuse to provide the requested services until its fees for those services are paid.
Depositary Payments for Fiscal Year 2016
The Depositary has agreed to reimburse certain expenses incurred by us in connection with our ADS program. In 2016, the Depositary reimbursed expenses related primarily to investor relations’ activities for a total amount of US$ 0.2 million (after the deduction of applicable U.S. taxes).
Item 13.Defaults, Dividend FeesArrearages and Delinquencies
None.
Item 14.Material Modifications to the Rights of Security Holders and Use of Proceeds
None.
Item 15.Controls and Procedures
102
(a) Disclosure Controls and Procedures
We carried out an evaluation under the supervision and with the participation of our senior management, including the Chief Executive Officer and Chief Financial Officer, of the effectiveness of the design and operation of our “disclosure controls and procedures” (as defined in Rules 13a-15(e) and 15d-15 (e) under the Exchange Act) for the year ended December 31, 2016.
There are inherent limitations to the effectiveness of any system of disclosure controls and procedures, including the possibility of human error, and the circumvention or overriding of the controls and procedures. Accordingly, our disclosure controls and procedures are designed to provide reasonable assurance of achieving their control objectives.
Based upon our evaluation, the Chief Executive Officer and the Chief Financial Officer concluded that the disclosure controls and procedures are effective in providing reasonable assurance that information required to be disclosed in the reports we file and submit under the Exchange Act is recorded, processed, summarized and reported, within the time periods specified in the applicable rules and forms, and that it is gathered and communicated to our management, including the Chief Executive Officer and Chief Financial Officer, as appropriate, to allow timely decisions regarding required disclosure.
Our disclosure controls and procedures are designed to provide reasonable assurance of achieving their objectives, and our principal executive officer and principal financial officer have concluded that our disclosure controls and procedures are effective at that reasonable assurance level.
(b) Management’s Annual Report on Internal Control Over Financial Reporting
As required by Section 404 of the Sarbanes-Oxley Act of 2002, our management is responsible for establishing and maintaining “adequate internal control over financial reporting” (as defined in Rule 13 a-15 (f) under the Exchange Act). Our internal control over financial reporting is designed to provide reasonable assurance regarding the reliability of financial reporting and the preparation of the financial statements for external purposes in accordance with IFRS, as issued by the IASB.
Because of its inherent limitations, internal control over financial reporting may not necessarily prevent or detect some misstatements. It can only provide reasonable assurance regarding financial statement preparation and presentation. Also, projections of any evaluation of effectiveness for future periods are subject to the risk that controls may become inadequate because of changes in conditions or because the degree of compliance with the policies or procedures may deteriorate over time.
Management assessed the effectiveness of its internal control over financial reporting for the year ended December 31, 2016. The assessment was based on criteria established in “Internal Control – Integrated Framework” issued by the Committee of Sponsoring Organizations of the Treadway Commission (“COSO 2013 framework”). Based on the assessment, our management has concluded that as of December 31, 2016, our internal control over financial reporting was effective.
(c) Attestation Report of the Registered Public Accounting Firm
Our independent registered public accounting firm has audited the effectiveness of our internal control over financial reporting as of December 31, 2016. Their attestation report appears on page F-2.
(d) Changes in Internal Control over Financial Reporting
There were no changes in our internal control over financial reporting identified in connection with the evaluation required by Rules 13a-15(d) or 15d-15(d) under the Exchange Act that occurred during 2016 that have materially affected, or are reasonably likely to materially affect, our internal control over financial reporting model.
Item 16A.Audit Committee Financial Expert
As of December 31, 2016, the Directors’ Committee (which performs the functions of the Audit Committee) financial expert was Mr. Enrique Cibié, as determined by the Board of Directors. Mr. Cibié is an independent member of the Directors’ Committee pursuant to the requirement of both Chilean law and NYSE corporate governance rules.
Our standards of ethical conduct are governed by means of the following seven corporate rulings or policies: the Charter Governing Executives (“Estatuto del Directivo”), the Employee Code of Conduct, the Code of Ethics, the Zero Tolerance Anti-
103
Corruption Plan (the “ZTAC Plan”), the Human Rights Policy, the Manual for the Management of Information of Interest to the Market (the “Manual”) and the Diversity Policy.
The Charter Governing Executives was adopted by the Board of Directors in May 2003 and is applicable to all executives contractually related to us or our subsidiaries in which we are the majority shareholder, including the Chief Executive Officer, the Chief Financial Officer and other senior officers of the Company. The objective of this set of rules is to establish standards for the governance of our management’s actions, the behavior of management with respect to the principles governing their actions and the limitations and incompatibilities involved, all within the context of our vision, mission and values. Likewise, the Employee Code of Conduct explains our principles and ethical values, establishes the rules governing our contact with customers and suppliers, and establishes the principles that should be followed by employees, including ethical conduct, professionalism and confidentiality. Both documents also impose limitations on the activities that our executives and other employees may undertake outside the scope of their employment with us.
The Manual, adopted by our Board of Directors in May 2008 and amended in February 2010, addresses the following issues: applicable standards and blackout periods regarding the information in connection with transactions of our securities or those of our affiliates, entered into by directors, management, principal executives, employees and other related parties; the existence of mechanisms for the continuous disclosure of information that is of interest to the market; and mechanisms that provide protection for confidential information.
In addition to the corporate governance rules described above, our Board approved the Code of Ethics and the ZTAC Plan in its meeting held on June 24, 2010. The Code of Ethics is based on general principles such as impartiality, honesty, integrity and other values of similar importance, which are translated into detailed behavioral criteria. The ZTAC Plan reinforces the principles included in the Code of Ethics, but with a special emphasis in avoiding corruption in the form of bribes, preferential treatment, and other similar matters.
On October 30, 2013, the Board approved the Human Rights Policy, which incorporates and adapts the general human rights principles championed by the United Nations into a corporate reality.
The Diversity Policy was approved by the Board of Directors on March 23, 2016. This policy aims to define the key principles required to spread a culture that focuses on diversity and is based on the respect and promotion of the principles of preventing arbitrary discrimination and encouraging equal opportunities and inclusion, which are fundamental values in the development of the Company's activities. In this sense, the Company seeks to improve the work environment and make possible a better quality of life at work. The Company is committed to creating an inclusive work environment where workers can develop their potential and maximize their contribution.
A copy of these documents is available on our webpage at www.enelgeneracion.cl as well as upon request, free of charge, by writing or calling us at:
Enel Generación Chile S.A.
Investor Relations Department
Santa Rosa 76, Piso 15
Santiago, Chile
(56-2) 2353-4682
During fiscal year 2016, there have been no amendments to any provisions of the documents described above. No waivers from any provisions of the Charter Governing Executives, the Employee Code of Conduct, the Code of Ethics, the ZTAC Plan or the Manual, were expressly or implicitly granted to the Chief Executive Officer, the Chief Financial Officer or any other senior financial officers of the Company in fiscal year 2016. However, at its meeting held on January 19, 2017, our Board of Directors approved an amendment to the Code of Ethics and ZTAC Plan to eliminate the reference to Law 19,885, in connection with political donations and to forbid them under all circumstances.
Item 16C.Principal Accountant Fees and Services
The following table provides information on the aggregate fees for approved services billed by our independent registered accounting firm, as well as the other member firms and their respective affiliates, by type of services for the periods indicated.
104
| 2016 |
|
| 2015 |
| |||
|
| (in millions of Ch$) |
| |||||
Audit fees |
|
| 567 |
|
|
| 657 |
|
Audit-related fees(1) (2) |
|
| 101 |
|
|
| 1,099 |
|
Tax fees |
|
| — |
|
|
| — |
|
All other fees(3) |
|
| — |
|
|
| 21 |
|
Total |
|
| 668 |
|
|
| 1,777 |
|
|
|
|
|
|
|
All of the fees disclosed under audit-related fees and all other fees were pre-approved by the Directors’ Committee pre-approval policies and procedures.
Directors’ Committee Pre-Approval Policies and Procedures
Our external auditors are appointed by our shareholders at the OSM. Similarly, the shareholders of our subsidiaries, which are located in countries where applicable law and regulation so require, appoint their own external auditors.
The Directors’ Committee (which performs the functions of the Audit Committee), acting through the CFO, manages appointment proposals, reviews engagement letters, negotiates fees, ensures quality control in respect of the services provided, reviews and controls independence issues, and other related matters.
The Directors’ Committee has a pre-approval policy regarding the contracting of our external auditor, or any affiliate of the external auditor, for professional services. The professional services covered by such policy include audit and non-audit services provided to us.
Fees payable in connection with recurring audit services are pre-approved as part of our annual budget. Fees payable in connection with non-recurring audit services, once they have been analyzed by the CFO, are submitted to the Directors’ Committee for approval or rejection.
The pre-approval policy established by the Directors’ Committee for non-audit services and audit-related fees is as follows:
The business unit that has requested the service and the audit firm expected to perform the service must request that the CFO review the nature of the service to be provided.
The CFO then analyzes the request and requires the selected audit firm to issue a certificate signed by the partner responsible for the audit of our consolidated financial statements confirming such audit firm’s independence.
Finally, the proposal is submitted to the Directors’ Committee for approval or denial.
The Directors’ Committee has designed, approved, and implemented the necessary procedures to fulfill the new requirements described in SEC release number 34-53677, File No. PCAOB-2006-01 (Audit Committee Pre-Approval of Certain Tax Services).
Item 16D.Exemptions from the Listing Standards for Audit Committees
Not applicable.
Item 16E.Purchases of Equity Securities by the Issuer and Affiliated Purchasers
None.
Item 16F.Change in Registrant’s Certifying Accountant
None.
For a summary of the significant differences between our corporate governance practices and those applicable to domestic issuers under the corporate governance rules of the NYSE, see “Item 6. Directors, Senior Management and Employees — C. Board Practices.”
105
Item 16H.Mine Safety Disclosure
Not applicable.
106
Not Applicable.
Enel Generación Chile and Subsidiaries
Index to the Consolidated Financial Statements
| ||
|
| |
|
| |
|
| |
|
| |
|
| |
|
| |
| ||
|
| |
|
| |
|
| |
|
| |
|
| |
|
|
|
(1) Issuance of ADS upon deposit of shares (excluding issuances as a result of distributions described in paragraph (4) below)
Up to US$ 5 per 100 ADSs (or fraction thereof) issued
(2) Delivery of deposited securities against surrender of ADS
Up to US$ 5 per 100 ADSs (or fraction thereof) surrendered
(3) Distribution of cash dividends or other cash distributions (i.e., sale of rights and other entitlements)
Up to US$5 per 100 ADSs (or fraction thereof) held
(4) Distribution of ADS pursuant to (i) stock dividends or other free stock distributions, or (ii) exercise of rights to purchase additional ADS
Up to US$5 per 100 ADSs (or fraction thereof) held
(5) Distribution of securities other than ADS or rights to purchase additional ADS (i.e., spin-off of shares)
Up to US$5 per 100 ADSs (or fraction thereof) held
(6) Depositary services
Up to US$5 per 100 ADSs (or fraction thereof) held on the applicable record date(s) established by the Depositary
The Depositary collects fees for delivery and surrender of ADSs directly from investors depositing shares or surrendering ADSs for the purpose of withdrawal or from intermediaries acting for them. The Depositary fees payable for cash distributions are deducted from the cash being distributed. In the case of distributions other than cash, the Depositary will invoice the applicable ADS record date holders.
Depositary Payments for Fiscal Year 2018
The Depositary has agreed to reimburse certain expenses incurred by us in connection with our ADS program. In 2018, the Depositary reimbursed expenses related primarily to investor relations’ activities for a total amount of US$ 0.2 million (after the deduction of applicable U.S. taxes).
Item 13.Defaults, Dividend Arrearages and Delinquencies
None.
Item 14.Material Modifications to the Rights of Security Holders and Use of Proceeds
None.
Item 15.Controls and Procedures
(a) Disclosure Controls and Procedures
We carried out an evaluation under the supervision and with the participation of our senior management, including the Chief Executive Officer and Chief Financial Officer, of the effectiveness of the design and operation of our “disclosure controls and procedures” (as defined in Rules 13a-15(e) and 15d-15(e) under the Exchange Act) for the year ended December 31, 2018.
There are inherent limitations to the effectiveness of any system of disclosure controls and procedures, including the possibility of human error, and the circumvention or overriding of the controls and procedures. Accordingly, our disclosure controls and procedures are designed to provide reasonable assurance of achieving their control objectives.
Based upon our evaluation, the Chief Executive Officer and the Chief Financial Officer concluded that the disclosure controls and procedures are effective in providing reasonable assurance that information required to be disclosed in the reports we file and submit under the Exchange Act is recorded, processed, summarized and reported, within the time periods specified in the applicable rules and forms, and that it is gathered and communicated to our management, including the Chief Executive Officer and Chief Financial Officer, as appropriate, to allow timely decisions regarding required disclosure.
Our disclosure controls and procedures are designed to provide reasonable assurance of achieving their objectives, and our principal executive officer and principal financial officer have concluded that our disclosure controls and procedures are effective at that reasonable assurance level.
(b) Management’s Annual Report on Internal Control over Financial Reporting
As required by Section 404 of the Sarbanes-Oxley Act of 2002, our management is responsible for establishing and maintaining “adequate internal control over financial reporting” (as defined in Rule 13a-15(f) under the Exchange Act). Our internal control over financial reporting is designed to provide reasonable assurance regarding the reliability of financial reporting and the preparation of the financial statements for external purposes in accordance with IFRS, as issued by the IASB.
Because of its inherent limitations, internal control over financial reporting may not necessarily prevent or detect some misstatements. It can only provide reasonable assurance regarding financial statement preparation and presentation. Also, projections of any evaluation of effectiveness for future periods are subject to the risk that controls may become inadequate because of changes in conditions or because the degree of compliance with the policies or procedures may deteriorate over time.
Management assessed the effectiveness of its internal control over financial reporting for the year ended December 31, 2018. The assessment was based on criteria established in “Internal Control — Integrated Framework” issued by the Committee of Sponsoring Organizations of the Treadway Commission (“COSO 2013 framework”). Based on the assessment, our management has concluded that as of December 31, 2018, our internal control over financial reporting was effective.
(c) Attestation Report of the Registered Public Accounting Firm
Our independent registered public accounting firm has audited the effectiveness of our internal control over financial reporting as of December 31, 2018. Their attestation report appears on page F-2.
(d) Changes in Internal Control over Financial Reporting
There were no changes in our internal control over financial reporting identified in connection with the evaluation required by Rules 13a-15(d) or 15d-15(d) under the Exchange Act that occurred during 2018 that have materially affected, or are reasonably likely to materially affect, our internal control over financial reporting model.
Item 16A.Audit Committee Financial Expert
As of December 31, 2018, the Directors’ Committee (which performs the functions of the Audit Committee) financial expert was Mr. Hernán Cheyre, as determined by the Board of Directors. Mr. Cheyre is an independent member of the Directors’ Committee pursuant to the requirement of both Chilean law and NYSE corporate governance rules.
Our standards of ethical conduct are governed by means of the following seven corporate rulings or policies: the Charter Governing Executives (“Estatuto del Directivo”), the Employee Code of Conduct, the Code of Ethics, the Zero Tolerance Anti-Corruption Plan (the “ZTAC Plan”), the Human Rights Policy, the Manual for the Management of Information of Interest to the Market (the “Manual”) and the Diversity Policy.
The Charter Governing Executives was adopted by the Board of Directors in May 2003 and is applicable to all executives contractually related to us or our subsidiaries in which we are the majority shareholder, including the Chief Executive Officer, the Chief Financial Officer and other senior officers of the Company. The objective of this set of rules is to establish standards for the governance of our management’s actions, the behavior of management with respect to the principles governing their actions and the limitations and incompatibilities involved, all within the context of our vision, mission and values. Likewise, the Employee Code of Conduct explains our principles and ethical values, establishes the rules governing our contact with customers and suppliers, and establishes the principles that should be followed by employees, including ethical conduct, professionalism and confidentiality. Both documents also impose limitations on the activities that our executives and other employees may undertake outside the scope of their employment with us.
The Manual, adopted by our Board of Directors in May 2008 and amended in February 2010, addresses the following issues: applicable standards and blackout periods regarding the information in connection with transactions of our securities or those of our affiliates, entered into by directors, management, principal executives, employees and other related parties; the existence of mechanisms for the continuous disclosure of information that is of interest to the market; and mechanisms that provide protection for confidential information.
In addition to the corporate governance rules described above, our Board approved the Code of Ethics and the ZTAC Plan in its meeting held on June 24, 2010. The Code of Ethics is based on general principles such as impartiality, honesty, integrity and other values of similar importance, which are translated into detailed behavioral criteria. The ZTAC Plan reinforces the principles included in the Code of Ethics, but with a special emphasis on avoiding corruption in the form of bribes, preferential treatment, and other similar matters.
On October 30, 2013, the Board approved the Human Rights Policy, which incorporates and adapts the general human rights principles championed by the United Nations into a corporate reality.
The Diversity Policy was approved by the Board of Directors on March 23, 2016. This policy defines the key principles required to spread a culture that focuses on diversity and is based on the respect and promotion of the principles of preventing arbitrary discrimination and encouraging equal opportunities and inclusion, which are fundamental values in the development of the Company’s activities. In this sense, the Company seeks to improve the work environment and make possible a better quality of life at work. The Company is committed to creating an inclusive work environment where workers can develop their potential and maximize their contribution.
A copy of these documents is available on our webpage at www.enelgeneracion.cl as well as upon request, free of charge, by writing or calling us at:
Enel Generación Chile S.A.
Investor Relations Department
Santa Rosa 76, Piso 15
Santiago, Chile
(56-2) 2353-4682
Section 1.01 At its meeting held on January 19, 2017, our Board of Directors approved an amendment to the Code of Ethics and ZTAC Plan to eliminate the reference to Law 19,885, in connection with political donations and to forbid them under all circumstances. During fiscal year 2017, there have been no other amendments to any provisions of the documents described above. No waivers from any provisions of the Charter Governing Executives, the Employee Code of Conduct, the Code of Ethics, the ZTAC Plan or the Manual, were expressly or implicitly granted to the Chief Executive Officer, the Chief Financial Officer or any other senior financial officers of the Company in fiscal year 2017.
Item 16C.Principal Accountant Fees and Services
The following table provides information on the aggregate fees for approved services billed by our independent registered accounting firm, as well as the other member firms and their respective affiliates, by type of services for the periods indicated.
Services Rendered |
| 2018 |
| 2017 |
|
|
| (in millions of Ch$) |
| ||
Audit fees |
| 571 |
| 534 |
|
Audit-related fees(1) |
| 4 |
| 315 |
|
Tax fees |
| — |
| — |
|
All other fees |
| — |
| — |
|
Total |
| 575 |
| 849 |
|
(1) 2017 audit-related fees are related to the 2018 Reorganization, mainly for the interim review services as of June 30, 2017, and September 30, 2017, and the audit process under Chilean audit standard as of September 30, 2017, for a total of Ch$ 310 million.
All of the fees disclosed under audit-related fees and all other fees were pre-approved by the Directors’ Committee pre-approval policies and procedures.
Directors’ Committee Pre-Approval Policies and Procedures
Our external auditors are appointed by our shareholders at the OSM. Similarly, the shareholders of our subsidiaries appoint their own external auditors according to applicable law and regulation.
Fees payable in connection with recurring audit services are pre-approved as part of our annual budget. Fees payable in connection with non-recurring audit services, once they have been analyzed by the CFO, are submitted to the Board of Directors for approval or rejection.
Item 16D.Exemptions from the Listing Standards for Audit Committees
Not applicable.
Item 16E.Purchases of Equity Securities by the Issuer and Affiliated Purchasers
None.
Item 16F.Change in Registrant’s Certifying Accountant
None.
Not applicable
Item 16H.Mine Safety Disclosure
Not applicable.
Not Applicable.
Enel Generación Chile S.A. and Subsidiaries
Index to the Consolidated Financial Statements
Reports of Independent Registered Public Accounting Firms:
Report of KPMG Auditores Consultores Ltda. — Enel Generación Chile S.A. 2018, 2017 and 2016 | F-1 |
F-2 |
Consolidated Financial Statements:
Consolidated Statements of Financial Position at December 31, 2018, and 2017 | F-7 |
Consolidated Statements of Comprehensive Income for the years ended December 31, 2018, 2017 and 2016 | F-8 |
Consolidated Statements of Changes in Equity for the years ended December 31, 2018, 2017 and 2016 | F-10 |
Consolidated Statements of Cash Flows for the years ended December 31, 2018, 2017 and 2016 | F-12 |
F-13 |
Ch$ | Chilean pesos |
US$ | U.S. dollars |
UF | The UF is a Chilean inflation-indexed, peso-denominated monetary unit that is set daily in advance based on the previous month’s inflation rate. |
ThCh$ | Thousands of Chilean pesos |
ThUS$ | Thousands of U.S. dollars |
|
|
|
|
|
|
Section 1.02 Item 19.ExhibitsItem 19.Exhibits
|
| ||||
|
| ||||
|
| ||||
|
| ||||
|
| ||||
|
| ||||
1.1 |
|
| |||
| |||||
12.1 | Certification of Chief Executive Officer pursuant to Section 302 of the Sarbanes-Oxley Act. | ||||
12.2 | Certification of Chief Financial Officer pursuant to Section 302 of the Sarbanes-Oxley Act. | ||||
13.1 |
101.INS | XBRL Instance Document | |
101.SCH | XBRL Taxonomy Extension Schema Document | |
101.CAL | XBRL Taxonomy Extension Calculation Linkbase Document | |
101.DEF | XBRL Taxonomy Extension Definition Linkbase Document | |
101.LAB | XBRL Taxonomy Extension Label Linkbase Document | |
101.PRE | XBRL Taxonomy Extension Presentation Linkbase Document |
We will furnish to the Securities and Exchange Commission, upon request, copies of any unfiled instruments that define the rights of stakeholders of Enel Generation Chile.
SIGNATURES
The registrant hereby certifies that it meets all of the requirements for filing on Form 20-F and that it has duly caused and authorized the undersigned to sign this annual report on its behalf.
ENEL GENERACION CHILE S.A. | ||
|
|
|
|
| |
|
| |
By: | /s/ Valter Moro | |
Name: | Valter Moro | |
Title: | Chief Executive Officer | |
Date: April 27,30, 2019
Enel Generación Chile S.A. and its Subsidiaries
Consolidated Financial Statements as of December 31, 2018 and 2017
Index to the Audited Consolidated Financial Statements
| |||||||||||||||||||||||||||||||||||||||||||||||||||||||||||||||||||||||||||||||||||||||||||||||||||||||||||||||||||||||||||||||||||||||||||||||||||||||||||||||||||||||||||||||||||||||||||||||||||||||||||||||||||||||||||||||||||||
Report of
KPMG Auditores Consultores Ltda. — Enel Generación Chile S.A. |
| ||||||||||||||||||||||||||||||||||||||||||||||||||||||||||||||||||||||||||||||||||||||||||||||||||||||||||||||||||||||||||||||||||||||||||||||||||||||||||||||||||||||||||||||||||||||||||||||||||||||||||||||||||||||||||||||||||||
F-2 | |||||||||||||||||||||||||||||||||||||||||||||||||||||||||||||||||||||||||||||||||||||||||||||||||||||||||||||||||||||||||||||||||||||||||||||||||||||||||||||||||||||||||||||||||||||||||||||||||||||||||||||||||||||||||||||||||||||
Consolidated Financial Statements: | |||||||||||||||||||||||||||||||||||||||||||||||||||||||||||||||||||||||||||||||||||||||||||||||||||||||||||||||||||||||||||||||||||||||||||||||||||||||||||||||||||||||||||||||||||||||||||||||||||||||||||||||||||||||||||||||||||||
F-4 | |||||||||||||||||||||||||||||||||||||||||||||||||||||||||||||||||||||||||||||||||||||||||||||||||||||||||||||||||||||||||||||||||||||||||||||||||||||||||||||||||||||||||||||||||||||||||||||||||||||||||||||||||||||||||||||||||||||
F-5 | |||||||||||||||||||||||||||||||||||||||||||||||||||||||||||||||||||||||||||||||||||||||||||||||||||||||||||||||||||||||||||||||||||||||||||||||||||||||||||||||||||||||||||||||||||||||||||||||||||||||||||||||||||||||||||||||||||||
| |||||||||||||||||||||||||||||||||||||||||||||||||||||||||||||||||||||||||||||||||||||||||||||||||||||||||||||||||||||||||||||||||||||||||||||||||||||||||||||||||||||||||||||||||||||||||||||||||||||||||||||||||||||||||||||||||||||
Consolidated Statements of
|
| ||||||||||||||||||||||||||||||||||||||||||||||||||||||||||||||||||||||||||||||||||||||||||||||||||||||||||||||||||||||||||||||||||||||||||||||||||||||||||||||||||||||||||||||||||||||||||||||||||||||||||||||||||||||||||||||||||||
F-10 |


Ch$ | Chilean pesos | |
US$ | U. S. dollars | |
UF | The UF is a Chilean inflation-indexed, peso-denominated monetary unit that is set daily in advance based on the previous month’s inflation rate. | |
ThCh$ | Thousands of Chilean | |
ThUS$ | Thousands of U.S. dollars |
| KPMG Auditores Consultores Ltda.
| Teléfono +56 (2) 2997 1000
| ||||||||||||||||||||||||||||||||||||||||||||||||||||||||||||||||||||||||||||||||||||||||||||||||||||||||||||||||||||||||||||||||||||||||||||||||||||||||||||||||||||||||||||||||||||||||||||||||||||||||||||||||||||
Report of Independent Registered Public Accounting Firm
To the Stockholders and Board of Directors
Enel Generación Chile S.A.:
Opinion on the Consolidated Financial Statements
We have audited the accompanying consolidated statements of financial position of Enel Generación Chile S.A. and subsidiaries (the Company) as of December 31, 2018 and 2017, the related consolidated statements of comprehensive income, changes in equity, and cash flows for each of the years in the three-year period ended December 31, 2018, and the related notes (collectively, the consolidated financial statements). In our opinion, the consolidated financial statements present fairly, in all material respects, the financial position of the Company as of December 31, 2018 and 2017, and the results of its operations and its cash flows for each of the years in the three-year period ended December 31, 2018, in conformity with International Financial Reporting Standards as issued by the International Accounting Standards Board.
We also have audited, in accordance with the standards of the Public Company Accounting Oversight Board (United States) (PCAOB), the Company’s internal control over financial reporting as of December 31, 2018, based on criteria established in Internal Control — Integrated Framework (2013) issued by the Committee of Sponsoring Organizations of the Treadway Commission (COSO), and our report dated April 30, 2019, expressed an unqualified opinion on the effectiveness of the Company’s internal control over financial reporting.
Basis for Opinion
These consolidated financial statements are the responsibility of the Company’s management. Our responsibility is to express an opinion on these consolidated financial statements based on our audits. We are a public accounting firm registered with the PCAOB and are required to be independent with respect to the Company in accordance with the U.S. federal securities laws and the applicable rules and regulations of the Securities and Exchange Commission and the PCAOB.
We conducted our audits in accordance with the standards of the PCAOB. Those standards require that we plan and perform the audit to obtain reasonable assurance about whether the consolidated financial statements are free of material misstatement, whether due to error or fraud. Our audits included performing procedures to assess the risks of material misstatement of the consolidated financial statements, whether due to error or fraud, and performing procedures that respond to those risks. Such procedures included examining, on a test basis, evidence regarding the amounts and disclosures in the consolidated financial statements. Our audits also included evaluating the accounting principles used and significant estimates made by management, as well as evaluating the overall presentation of the consolidated financial statements. We believe that our audits provide a reasonable basis for our opinion.
/s/ KPMG |
| ||||||||||||||||||||||||||||||||||||||||||||||||||||||||||||||||||||||||||||||||||||||||||||||||||||||||||||||||||||||||||||||||||||||||||||||||||||||||||||||||||||||||||||||||
KPMG Auditores Consultores Ltda. |
| ||||||||||||||||||||||||||||||||||||||||||||||||||||||||||||||||||||||||||||||||||||||||||||||||||||||||||||||||||||||||||||||||||||||||||||||||||||||||||||||||||||||||||||||||
We have served as the Company’s auditor since 2008.
Santiago, Chile
April 30, 2019
KPMG Auditores Consultores Ltda, a Chilean limited liability partnership and a member firm of the KPMG network of independent member firms affiliated with KPMG International Cooperative (“KPMG International”), a Swiss entity. All rights reserved.
| KPMG Auditores Consultores Ltda.
| Teléfono +56 (2) 2997 1000
|
Report of Independent Registered Public Accounting Firm
To the Stockholders and Board of Directors
Enel Generación Chile S.A.:
Opinion on Internal Control Over Financial Reporting
We have audited Enel Generación Chile S.A. and subsidiaries (the Company) internal control over financial reporting as of December 31, 2018, based on criteria established in Internal Control — Integrated Framework (2013) issued by the Committee of Sponsoring Organizations of the Treadway Commission (COSO). In our opinion, the Company maintained, in all material respects, effective internal control over financial reporting as of December 31, 2018, based on criteria established in Internal Control — Integrated Framework (2013) issued by the Committee of Sponsoring Organizations of the Treadway Commission.
We also have audited, in accordance with the standards of the Public Company Accounting Oversight Board (United States) (PCAOB), the consolidated statements of financial position of the Company as of December 31, 2018 and 2017, the related consolidated statements of comprehensive income, changes in equity, and cash flows for each of the years in the three-year period ended December 31, 2018, and the related notes (collectively, the consolidated financial statements), and our report dated April 30, 2019 expressed an unqualified opinion on those consolidated financial statements.
Basis for Opinion
The Company’s management is responsible for maintaining effective internal control over financial reporting and for its assessment of the effectiveness of internal control over financial reporting, included in the accompanying Management’s Report on Internal Control over Financial Reporting. Our responsibility is to express an opinion on the Company’s internal control over financial reporting based on our audit. We are a public accounting firm registered with the PCAOB and are required to be independent with respect to the Company in accordance with the U.S. federal securities laws and the applicable rules and regulations of the Securities and Exchange Commission and the PCAOB.
We conducted our audit in accordance with the standards of the PCAOB. Those standards require that we plan and perform the audit to obtain reasonable assurance about whether effective internal control over financial reporting was maintained in all material respects. Our audit of internal control over financial reporting included obtaining an understanding of internal control over financial reporting, assessing the risk that a material weakness exists, and testing and evaluating the design and operating effectiveness of internal control based on the assessed risk. Our audit also included performing such other procedures as we considered necessary in the circumstances. We believe that our audit provides a reasonable basis for our opinion.
Definition and Limitations of Internal Control Over Financial Reporting
A company’s internal control over financial reporting is a process designed to provide reasonable assurance regarding the reliability of financial reporting and the preparation of financial statements for external purposes in accordance with generally accepted accounting principles. A company’s internal control over financial reporting includes those policies and procedures that (1) pertain to the maintenance of records that, in reasonable detail, accurately and fairly reflect the transactions and dispositions of the assets of the company; (2) provide reasonable assurance that transactions are recorded as necessary to permit preparation of financial statements in accordance with generally accepted accounting principles, and that receipts and expenditures of the company are being made only in accordance with authorizations of management and directors of the company; and (3) provide reasonable assurance regarding prevention or timely detection of unauthorized acquisition, use, or disposition of the company’s assets that could have a material effect on the financial statements.
KPMG Auditores Consultores Ltda, a Chilean limited liability partnership and a member firm of the KPMG network of independent member firms affiliated with KPMG International Cooperative (“KPMG International”), a Swiss entity. All rights reserved.
Because of its inherent limitations, internal control over financial reporting may not prevent or detect misstatements. Also, projections of any evaluation of effectiveness to future periods are subject to the risk that controls may become inadequate because of changes in conditions, or that the degree of compliance with the policies or procedures may deteriorate.
Statements of Changes in Equity | Issued Capital | Share Premium | Changes in Reserves Other than Retained Earnings | Total Reserves Other than Retained Earnings | Retained Earnings | Equity Attributable to Shareholders of the Parent Company | Non- controlling Interests | Total Equity | |||||
Reserve for Exchange Differences in Foreign Currency Translation | Reserve for Cash Flow Hedges | Reserve for Gains and Losses for Defined Benefit Plans | Reserve for Gains and Losses on Remeasuring Available- for-Sale Financial Assets | Other Miscellaneous Reserves | Other Reserves related to assets held for sale and disposal groups | ||||||||
Equity as of 1-1-2016 | 1,331,714,085 | 206,008,557 | 19,691,866 | (205,691,575) | - | (1,046) | (719,716,306) | (202,189,042) | (1,107,906,103) | 2,218,373,368 | 2,648,189,907 | 895,700,172 | 3,543,890,079 |
Changes in equity |
|
|
|
|
|
|
|
|
|
|
|
|
|
Comprehensive income |
|
|
|
|
|
|
|
|
|
|
|
|
|
Net profit for the year |
|
|
|
|
|
|
|
|
| 472,558,428 | 472,558,428 | 48,873,945 | 521,432,373 |
Other comprehensive loss |
|
| (3,527,400) | 67,731,875 | (1,284,713) | 13 | (11,690,790) | (72,928,764) | (21,699,779) |
| (21,699,779) | (64,982,420) | (86,682,199) |
Total comprehensive income |
|
|
|
|
|
|
|
|
|
| 450,858,649 | (16,108,475) | 434,750,174 |
Dividends |
|
|
|
|
|
|
|
|
| (184,234,740) | (184,234,740) | (7,405,769) | (191,640,509) |
Increase (decrease) from distribution to owners | (778,936,764) | (120,497,065) | - | - | - | - | 776,186,804 | 275,117,804 | 1,051,304,608 | (1,305,983,122) | (1,154,112,343) | (839,096,192) | (1,993,208,535) |
Increase (decrease) from other changes | - | - | 46,375 | 14,460,299 | 1,284,713 | - | (76,967,775) | 2,722,115 | (58,454,273) | (1,284,713) | (59,738,986) | (4,291,974) | (64,030,960) |
Total changes in equity | (778,936,764) | (120,497,065) | (3,481,025) | 82,192,174 | - | 13 | 687,528,239 | 204,911,155 | 971,150,556 | (1,018,944,147) | (947,227,420) | (866,902,410) | (1,814,129,830) |
Equity as of 12-31-2016 | 552,777,321 | 85,511,492 | 16,210,841 | (123,499,401) | - | (1,033) | (32,188,067) | 2,722,113 | (136,755,547) | 1,199,429,221 | 1,700,962,487 | 28,797,762 | 1,729,760,249 |
/s/ KPMG |
| |||||||||||||||||||||||||||||||||||||||||||||||||||||||||||||||||||||||||||||||||||||||||||||||||||||||||||||||||||||||||||||||||||||||||||||||||||||||||||||||||||||||||||||||
KPMG Auditores Consultores Ltda. |
| |||||||||||||||||||||||||||||||||||||||||||||||||||||||||||||||||||||||||||||||||||||||||||||||||||||||||||||||||||||||||||||||||||||||||||||||||||||||||||||||||||||||||||||||
Santiago, Chile |
| |||||||||||||||||||||||||||||||||||||||||||||||||||||||||||||||||||||||||||||||||||||||||||||||||||||||||||||||||||||||||||||||||||||||||||||||||||||||||||||||||||||||||||||||
April 30, 2019 |
| |||||||||||||||||||||||||||||||||||||||||||||||||||||||||||||||||||||||||||||||||||||||||||||||||||||||||||||||||||||||||||||||||||||||||||||||||||||||||||||||||||||||||||||||
ENEL GENERACIÓN CHILE S.A. AND ITS SUBSIDIARIES
Consolidated Statements of Financial Position
As of December 31, 2018 and 2017
(In thousands of Chilean pesos — ThCh$)
|
|
|
| 12-31-2018 |
| 12-31-2017 |
|
|
| Note |
| ThCh$ |
| ThCh$ |
|
ASSETS |
|
|
|
|
|
|
|
CURRENT ASSETS |
|
|
|
|
|
|
|
Cash and cash equivalents |
| 7 |
| 151,989,905 |
| 211,027,141 |
|
Other current financial assets |
| 8 |
| 38,564,527 |
| 20,523,276 |
|
Other current non-financial assets |
| 9 |
| 10,838,242 |
| 13,136,459 |
|
Trade and other current receivables, net |
| 10 |
| 239,425,507 |
| 207,208,820 |
|
Current accounts receivable from related parties |
| 11 |
| 135,105,117 |
| 109,797,820 |
|
Inventories |
| 12 |
| 43,770,781 |
| 31,740,903 |
|
Current taxes receivable |
| 13 |
| 52,773,274 |
| 65,164,708 |
|
TOTAL CURRENT ASSETS |
|
|
| 672,467,353 |
| 658,599,127 |
|
NON-CURRENT ASSETS |
|
|
|
|
|
|
|
Other non-current financial assets |
| 8 |
| 2,362,570 |
| 33,391,398 |
|
Other non-current non-financial assets |
| 9 |
| 12,545,299 |
| 12,853,459 |
|
Trade and other non-current receivables, net |
| 10 |
| 1,156,638 |
| 1,032,923 |
|
Investments accounted for using the equity method |
| 14 |
| 12,826,892 |
| 16,912,454 |
|
Intangible assets other than goodwill, net |
| 15 |
| 23,910,977 |
| 18,607,973 |
|
Goodwill |
| 16 |
| 24,860,356 |
| 24,860,356 |
|
Property, plant and equipment, net |
| 17 |
| 2,919,097,994 |
| 2,788,204,501 |
|
TOTAL NON-CURRENT ASSETS |
|
|
| 2,996,760,726 |
| 2,895,863,064 |
|
TOTAL ASSETS |
|
|
| 3,669,228,079 |
| 3,554,462,191 |
|
|
|
|
|
|
|
|
|
LIABILITIES AND EQUITY |
|
|
|
|
|
|
|
CURRENT LIABILITIES |
|
|
|
|
|
|
|
Other current financial liabilities |
| 19 |
| 125,350,544 |
| 18,815,435 |
|
Trade and other current payables |
| 22 |
| 275,331,618 |
| 309,883,528 |
|
Current accounts payable to related parties |
| 11 |
| 152,932,289 |
| 122,862,944 |
|
Current provisions |
| 23 |
| 5,182,867 |
| 5,296,635 |
|
Current tax liabilities |
| 13 |
| 12,541,174 |
| 66,933,261 |
|
Other current non-financial liabilities |
| 9 |
| 22,542,716 |
| 19,564,698 |
|
TOTAL CURRENT LIABILITIES |
|
|
| 593,881,208 |
| 543,356,501 |
|
NON-CURRENT LIABILITIES |
|
|
|
|
|
|
|
Other non-current financial liabilities |
| 19 |
| 799,813,225 |
| 781,978,145 |
|
Other non-current payables |
| 22 |
| 450,421 |
| 632,643 |
|
Non-current accounts payables to related parties |
| 11 |
| — |
| 318,518 |
|
Non-current provisions, other than for employee benefits |
| 23 |
| 79,493,801 |
| 63,992,567 |
|
Deferred tax liabilities |
| 18 |
| 183,487,402 |
| 160,293,916 |
|
Non-current provisions for employee benefits |
| 24 |
| 14,610,975 |
| 14,875,948 |
|
TOTAL NON-CURRENT LIABILITIES |
|
|
| 1,077,855,824 |
| 1,022,091,737 |
|
TOTAL LIABILITIES |
|
|
| 1,671,737,032 |
| 1,565,448,238 |
|
EQUITY |
|
|
|
|
|
|
|
Issued capital |
| 25 |
| 552,777,321 |
| 552,777,321 |
|
Retained earnings |
|
|
| 1,509,995,045 |
| 1,398,018,155 |
|
Share premium |
| 25 |
| 85,511,492 |
| 85,511,492 |
|
Other reserves |
| 25 |
| (177,763,273 | ) | (74,789,241 | ) |
Equity attributable to Shareholders of the Parent Company |
|
|
| 1,970,520,585 |
| 1,961,517,727 |
|
Non-controlling interests |
|
|
| 26,970,462 |
| 27,496,226 |
|
TOTAL EQUITY |
|
|
| 1,997,491,047 |
| 1,989,013,953 |
|
|
|
|
|
|
|
|
|
TOTAL LIABILITIES AND EQUITY |
|
|
| 3,669,228,079 |
| 3,554,462,191 |
|
ENEL GENERACIÓN CHILE S.A. AND ITS SUBSIDIARIES
Consolidated Statements of Comprehensive Income, by Nature
For the years ended December 31, 2018, 2017 and 2016
(In thousands of Chilean pesos — ThCh$)
|
|
|
| Year ended |
| ||||
|
|
|
| 12-31-2018 |
| 12-31-2017 |
| 12-31-2016 |
|
|
| Note |
| ThCh$ |
| ThCh$ |
| ThCh$ |
|
STATEMENTS OF COMPREHENSIVE INCOME |
|
|
|
|
|
|
|
|
|
Profit (loss) |
|
|
|
|
|
|
|
|
|
Revenues |
| 26 |
| 1,481,554,138 |
| 1,599,032,140 |
| 1,639,959,815 |
|
Other operating income |
| 26 |
| 39,500,045 |
| 35,904,948 |
| 19,767,514 |
|
Revenues and Other Operating Income from continuing operations |
|
|
| 1,521,054,183 |
| 1,634,937,088 |
| 1,659,727,329 |
|
|
|
|
|
|
|
|
|
|
|
Raw materials and consumables used |
| 27 |
| (809,974,152 | ) | (903,978,006 | ) | (895,060,114 | ) |
Contribution Margin from continuing operations |
|
|
| 711,080,031 |
| 730,959,082 |
| 764,667,215 |
|
|
|
|
|
|
|
|
|
|
|
Other work performed by the entity and capitalized |
| 17.4.b |
| 7,449,013 |
| 7,226,484 |
| 9,758,304 |
|
Employee benefits expense |
| 28 |
| (53,800,538 | ) | (54,222,470 | ) | (60,350,072 | ) |
Depreciation and amortization expense |
| 29 |
| (117,765,263 | ) | (117,337,553 | ) | (132,600,381 | ) |
Impairment loss recognized in the period’s profit or loss |
| 29 |
| (100,900 | ) | 55,494 |
| (30,785,531 | ) |
Other expenses |
| 30 |
| (82,478,947 | ) | (102,821,020 | ) | (119,303,215 | ) |
Operating Income from continuing operations |
|
|
| 464,383,396 |
| 463,860,017 |
| 431,386,320 |
|
|
|
|
|
|
|
|
|
|
|
Other gains, net |
| 31 |
| 3,434,503 |
| 113,088,869 |
| 121,490,974 |
|
Financial income |
| 32 |
| 5,778,242 |
| 5,273,672 |
| 6,150,751 |
|
Financial costs |
| 32 |
| (48,189,495 | ) | (50,851,829 | ) | (55,701,778 | ) |
Share of profit (loss) of associates and joint ventures accounted for using the equity method |
| 14 |
| 3,281,453 |
| (2,696,904 | ) | 7,878,201 |
|
Foreign currency exchange differences |
| 32 |
| (3,055,807 | ) | 8,822,301 |
| 13,266,320 |
|
Gains from indexed assets and liabilities, net (*) |
| 32 |
| (2,480,291 | ) | 145,608 |
| 606,075 |
|
Income from continuing operations before income taxes |
|
|
| 423,152,001 |
| 537,641,734 |
| 525,076,863 |
|
Income tax expense, continuing operations |
| 33 |
| (104,946,765 | ) | (112,099,519 | ) | (83,216,935 | ) |
NET INCOME FROM CONTINUING OPERATIONS |
|
|
| 318,205,236 |
| 425,542,215 |
| 441,859,928 |
|
|
|
|
|
|
|
|
|
|
|
Discontinued operations |
|
|
|
|
|
|
|
|
|
Profit after tax for the year from discontinued operations |
| 5.2 |
| — |
| — |
| 79,572,445 |
|
NET PROFIT FOR THE YEAR |
|
|
| 318,205,236 |
| 425,542,215 |
| 521,432,373 |
|
|
|
|
|
|
|
|
|
|
|
Net profit for the year attributable to |
|
|
|
|
|
|
|
|
|
Shareholders of the parent company |
|
|
| 309,029,455 |
| 418,453,814 |
| 472,558,428 |
|
Non-controlling interests |
| 25.7 |
| 9,175,781 |
| 7,088,401 |
| 48,873,945 |
|
NET PROFIT FOR THE YEAR |
|
|
| 318,205,236 |
| 425,542,215 |
| 521,432,373 |
|
|
|
|
|
|
|
|
|
|
|
Basic earnings per share |
|
|
|
|
|
|
|
|
|
Basic earnings per share from continuing operations |
| Ch$ / share |
| 37.68 |
| 51.02 |
| 52.77 |
|
Basic earnings per share from discontinued operations |
| Ch$ / share |
| — |
| — |
| 4.85 |
|
Total Basic earnings per share |
| Ch$ / share |
| 37.68 |
| 51.02 |
| 57.62 |
|
Weighted average number of shares of common stock |
| Thousands |
| 8,201,754.58 |
| 8,201,754.58 |
| 8,201,754.58 |
|
|
|
|
|
|
|
|
|
|
|
Diluted earnings per share |
|
|
|
|
|
|
|
|
|
Diluted earnings per share from continuing operations |
| Ch$ / share |
| 37.68 |
| 51.02 |
| 52.77 |
|
Diluted earnings per share from discontinued operations |
| Ch$ / share |
| — |
| — |
| 4.85 |
|
Total Diluted earnings per share |
| Ch$ / share |
| 37.68 |
| 51.02 |
| 57.62 |
|
Weighted average number of shares of common stock |
| Thousands |
| 8,201,754.58 |
| 8,201,754.58 |
| 8,201,754.58 |
|
(*) This note includes the effect of hyperinflation in Argentina
ENEL GENERACIÓN CHILE S.A. AND ITS SUBSIDIARIES
Consolidated Statements of Comprehensive Income, by Nature (continued)
For the years ended December 31, 2018, 2017 and 2016
(In thousands of Chilean pesos — ThCh$)
|
|
|
| Year ended |
| ||||
|
|
|
| 12-31-2018 |
| 12-31-2017 |
| 12-31-2016 |
|
|
| Note |
| ThCh$ |
| ThCh$ |
| ThCh$ |
|
|
|
|
|
|
|
|
|
|
|
CONSOLIDATED STATEMENTS OF COMPREHENSIVE INCOME |
|
|
|
|
|
|
|
|
|
|
|
|
|
|
|
|
|
|
|
Net income |
|
|
| 318,205,236 |
| 425,542,215 |
| 521,432,373 |
|
|
|
|
|
|
|
|
|
|
|
Components of other comprehensive income (loss) that will not be reclassified subsequently to profit or loss, before income taxes |
|
|
|
|
|
|
|
|
|
Remeasurement losses from defined benefit plans |
| 18/ 24.2 |
| (325,252 | ) | 251,976 |
| (1,757,402 | ) |
Other comprehensive (loss) income that will not be reclassified to income |
|
|
| (325,252 | ) | 251,976 |
| (1,757,402 | ) |
|
|
|
|
|
|
|
|
|
|
Components of other comprehensive income that will be reclassified to income, before taxes |
|
|
|
|
|
|
|
|
|
Foreign currency translation losses, net |
| 18 |
| (5,522,334 | ) | (3,690,798 | ) | (139,529,128 | ) |
Gains (losses) from available-for-sale financial assets, net |
| 18 |
| (15 | ) | 8 |
| 18 |
|
Net losses from cash flow hedges |
| 18 |
| (157,077,145 | ) | 73,333,487 |
| 66,502,675 |
|
Reclassification adjustments on cash flow hedges |
| 18 |
| 18,227,145 |
| 23,976,029 |
| 20,456,663 |
|
Share of other comprehensive income from investments accounted for using the equity method |
|
|
| — |
| — |
| (11,904,709 | ) |
Other comprehensive (loss) income that will be reclassified to income |
|
|
| (144,372,349 | ) | 93,618,726 |
| (64,474,481 | ) |
|
|
|
|
|
|
|
|
|
|
Total other comprehensive loss, before income (loss) taxes |
|
|
| (144,697,601 | ) | 93,870,702 |
| (66,231,883 | ) |
|
|
|
|
|
|
|
|
|
|
Income taxes related to components of other comprehensive income that will not be reclassified to income |
|
|
|
|
|
|
|
|
|
Income tax related to defined benefit plans |
| 18 |
| 87,818 |
| (68,034 | ) | 474,498 |
|
Income tax related to components of other comprehensive income that will not be reclassified to income |
|
|
| 87,818 |
| (68,034 | ) | 474,498 |
|
|
|
|
|
|
|
|
|
|
|
Income taxes related to components of other comprehensive income that will be reclassified to income |
|
|
|
|
|
|
|
|
|
Income tax related to cash flow hedge |
|
|
| 37,616,791 |
| (26,139,149 | ) | (20,924,809 | ) |
Income tax related to available-for-sale financial assets |
| 18 |
| 4 |
| (2 | ) | (5 | ) |
Income taxes related to components of comprehensive income that will be reclassified to income |
|
|
| 37,616,795 |
| (26,139,151 | ) | (20,924,814 | ) |
|
|
|
|
|
|
|
|
|
|
Total other comprehensive (loss) income |
|
|
| (106,992,988 | ) | 67,663,517 |
| (86,682,199 | ) |
TOTAL COMPREHENSIVE INCOME |
|
|
| 211,212,248 |
| 493,205,732 |
| 434,750,174 |
|
|
|
|
|
|
|
|
|
|
|
Comprehensive income (loss) attributable to |
|
|
|
|
|
|
|
|
|
Shareholders of the parent company |
|
|
| 202,172,256 |
| 486,205,094 |
| 450,858,649 |
|
Non-controlling interests |
|
|
| 9,039,992 |
| 7,000,638 |
| (16,108,475 | ) |
TOTAL COMPREHENSIVE INCOME |
|
|
| 211,212,248 |
| 493,205,732 |
| 434,750,174 |
|
ENEL GENERACIÓN CHILE S.A. AND ITS SUBSIDIARIES
Consolidated Statements of Changes in Equity
For the years ended December 31, 2018, 2017 and 2016
(In thousands of Chilean pesos — ThCh$)
|
|
|
|
|
| Changes in Reserves Other than Retained Earnings |
|
|
|
|
|
|
|
|
| ||||||||||||
|
|
|
|
|
| Reserve for |
|
|
|
|
|
|
|
|
| Other |
|
|
|
|
|
|
|
|
|
|
|
|
|
|
|
|
| Exchange |
|
|
| Reserve for |
| Reserve for Gains |
|
|
| Reserves |
|
|
|
|
|
|
|
|
|
|
|
|
|
|
|
|
| Differences |
|
|
| Gains and |
| and Losses on |
|
|
| related to |
|
|
|
|
| Equity |
|
|
|
|
|
|
|
|
|
|
| in |
|
|
| Losses for |
| Remeasuring |
|
|
| assets held for |
| Total Reserves |
|
|
| Attributable to |
|
|
|
|
|
|
|
|
|
|
| Foreign |
| Reserve for |
| Defined |
| Available- |
| Other |
| sale and |
| Other than |
|
|
| Shareholders |
|
|
|
|
|
|
| Issued |
| Share |
| Currency |
| Cash Flow |
| Benefit |
| for-Sale |
| Miscellaneous |
| disposal |
| Retained |
| Retained |
| of the Parent |
| Non-controlling |
|
|
|
|
| Capital |
| Premium |
| Translation |
| Hedges |
| Plans |
| Financial Assets |
| Reserves |
| groups |
| Earnings |
| Earnings |
| Company |
| Interests |
| Total Equity |
|
Statements of Changes in Equity |
| ThCh$ |
| ThCh$ |
| ThCh$ |
| ThCh$ |
| ThCh$ |
| ThCh$ |
| ThCh$ |
| ThCh$ |
| ThCh$ |
| ThCh$ |
| ThCh$ |
| ThCh$ |
| ThCh$ |
|
Equity as of January 1, 2018 |
| 552,777,321 |
| 85,511,492 |
| 12,608,918 |
| (52,329,034 | ) | — |
| (1,027 | ) | (35,068,098 | ) | — |
| (74,789,241 | ) | 1,398,018,155 |
| 1,961,517,727 |
| 27,496,226 |
| 1,989,013,953 |
|
Increase (decrease) from changes in accounting policies (1) |
| — |
| — |
| — |
| — |
| — |
| — |
| — |
| — |
| — |
| 506,760 |
| 506,760 |
| 16,427 |
| 523,187 |
|
Initial Balance Re-expressed |
| 552,777,321 |
| 85,511,492 |
| 12,608,918 |
| (52,329,034 | ) | — |
| (1,027 | ) | (35,068,098 | ) | — |
| (74,789,241 | ) | 1,398,524,915 |
| 1,962,024,487 |
| 27,512,653 |
| 1,989,537,140 |
|
Changes in equity |
|
|
|
|
|
|
|
|
|
|
|
|
|
|
|
|
|
|
|
|
|
|
|
|
|
|
|
Comprehensive income |
| — |
| — |
| — |
| — |
| — |
| — |
| — |
| — |
| — |
| — |
| — |
| — |
| — |
|
Net income |
| — |
| — |
| — |
| — |
| — |
| — |
| — |
| — |
| — |
| 309,029,455 |
| 309,029,455 |
| 9,175,781 |
| 318,205,236 |
|
Other comprehensive loss |
| — |
| — |
| (5,386,947 | ) | (101,233,208 | ) | (237,033 | ) | (11 | ) | — |
| — |
| (106,857,199 | ) | — |
| (106,857,199 | ) | (135,789 | ) | (106,992,988 | ) |
Total comprehensive income |
| — |
| — |
| — |
| — |
| — |
| — |
| — |
| — |
| — |
| — |
| 202,172,256 |
| 9,039,992 |
| 211,212,248 |
|
Dividends |
| — |
| — |
| — |
| — |
| — |
| — |
| — |
| — |
| — |
| (197,322,292 | ) | (197,322,292 | ) | (9,680,615 | ) | (207,002,907 | ) |
Increase (decrease) from other changes |
| — |
| — |
| — |
| — |
| 237,033 |
| — |
| 3,646,134 |
| — |
| 3,883,167 |
| (237,033 | ) | 3,646,134 |
| 98,433 |
| 3,744,567 |
|
Total changes in equity |
| — |
| — |
| (5,386,947 | ) | (101,233,208 | ) | — |
| (11 | ) | 3,646,134 |
| — |
| (102,974,032 | ) | 111,470,130 |
| 8,496,098 |
| (542,191 | ) | 7,953,907 |
|
Equity as of December 31, 2018 |
| 552,777,321 |
| 85,511,492 |
| 7,221,971 |
| (153,562,242 | ) | — |
| (1,038 | ) | (31,421,964 | ) | — |
| (177,763,273 | ) | 1,509,995,045 |
| 1,970,520,585 |
| 26,970,462 |
| 1,997,491,047 |
|
|
|
|
|
|
| Changes in Reserves Other than Retained Earnings |
|
|
|
|
|
|
|
|
| ||||||||||||
|
|
|
|
|
| Reserve for |
|
|
|
|
|
|
|
|
| Other |
|
|
|
|
|
|
|
|
|
|
|
|
|
|
|
|
| Exchange |
|
|
| Reserve for |
| Reserve for Gains |
|
|
| Reserves |
|
|
|
|
|
|
|
|
|
|
|
|
|
|
|
|
| Differences |
|
|
| Gains and |
| and Losses on |
|
|
| related to |
|
|
|
|
| Equity |
|
|
|
|
|
|
|
|
|
|
| in |
|
|
| Losses for |
| Remeasuring |
|
|
| assets held for |
| Total Reserves |
|
|
| Attributable to |
|
|
|
|
|
|
|
|
|
|
| Foreign |
| Reserve for |
| Defined |
| Available- |
| Other |
| sale and |
| Other than |
|
|
| Shareholders |
|
|
|
|
|
|
| Issued |
| Share |
| Currency |
| Cash Flow |
| Benefit |
| for-Sale |
| Miscellaneous |
| disposal |
| Retained |
| Retained |
| of the Parent |
| Non-controlling |
|
|
|
|
| Capital |
| Premium |
| Translation |
| Hedges |
| Plans |
| Financial Assets |
| Reserves |
| groups |
| Earnings |
| Earnings |
| Company |
| Interests |
| Total Equity |
|
Statements of Changes in Equity |
| ThCh$ |
| ThCh$ |
| ThCh$ |
| ThCh$ |
| ThCh$ |
| ThCh$ |
| ThCh$ |
| ThCh$ |
| ThCh$ |
| ThCh$ |
| ThCh$ |
| ThCh$ |
| ThCh$ |
|
Equity as of January 1, 2017 |
| 552,777,321 |
| 85,511,492 |
| 16,210,841 |
| (123,499,401 | ) | — |
| (1,033 | ) | (32,188,067 | ) | 2,722,113 |
| (136,755,547 | ) | 1,199,429,221 |
| 1,700,962,487 |
| 28,797,762 |
| 1,729,760,249 |
|
Changes in equity |
|
|
|
|
|
|
|
|
|
|
|
|
|
|
|
|
|
|
|
|
|
|
|
|
|
|
|
Comprehensive income |
| — |
| — |
| — |
| — |
| — |
| — |
| — |
| — |
| — |
| — |
| — |
| — |
| — |
|
Net income |
| — |
| — |
| — |
| — |
| — |
| — |
| — |
| — |
| — |
| 418,453,814 |
| 418,453,814 |
| 7,088,401 |
| 425,542,215 |
|
Other comprehensive loss |
| — |
| — |
| (3,601,923 | ) | 71,170,367 |
| 182,830 |
| 6 |
| — |
| — |
| 67,751,280 |
| — |
| 67,751,280 |
| (87,763 | ) | 67,663,517 |
|
Total comprehensive income |
| — |
| — |
| — |
| — |
| — |
| — |
| — |
| — |
| — |
| — |
| 486,205,094 |
| 7,000,638 |
| 493,205,732 |
|
Dividends |
| — |
| — |
| — |
| — |
| — |
| — |
| — |
| — |
| — |
| (220,047,710 | ) | (220,047,710 | ) | (8,302,174 | ) | (228,349,884 | ) |
Increase (decrease) from other changes |
| — |
| — |
| — |
| — |
| (182,830 | ) | — |
| (2,880,031 | ) | (2,722,113 | ) | (5,784,974 | ) | 182,830 |
| (5,602,144 | ) | — |
| (5,602,144 | ) |
Total changes in equity |
| — |
| — |
| (3,601,923 | ) | 71,170,367 |
| — |
| 6 |
| (2,880,031 | ) | (2,722,113 | ) | 61,966,306 |
| 198,588,934 |
| 260,555,240 |
| (1,301,536 | ) | 259,253,704 |
|
Equity as of December 31, 2017 |
| 552,777,321 |
| 85,511,492 |
| 12,608,918 |
| (52,329,034 | ) | — |
| (1,027 | ) | (35,068,098 | ) | — |
| (74,789,241 | ) | 1,398,018,155 |
| 1,961,517,727 |
| 27,496,226 |
| 1,989,013,953 |
|
(1)Considers a charge to retained earnings for ThCh$141,284 by IFRS 9 adoption and a credit to retained earnings for ThCh$664,471 by IAS 29 adoption. See notes 2.2.a) impairment of value and 2.7.4 respectively.
ENEL GENERACIÓN CHILE S.A. AND ITS SUBSIDIARIES
Consolidated Statements of Changes in Equity
For the years ended December 31, 2018, 2017 and 2016
(In thousands of Chilean pesos — ThCh$)
|
|
|
|
|
| Changes in Other Reserves |
|
|
|
|
|
|
|
|
| ||||||||||||
|
|
|
|
|
| Reserve for |
|
|
|
|
|
|
|
|
| Other |
|
|
|
|
|
|
|
|
|
|
|
|
|
|
|
|
| Exchange |
|
|
| Reserve for |
| Reserve for Gains |
|
|
| Reserves |
|
|
|
|
|
|
|
|
|
|
|
|
|
|
|
|
| Differences |
|
|
| Gains and |
| and Losses on |
|
|
| related to |
|
|
|
|
| Equity |
|
|
|
|
|
|
|
|
|
|
| in |
|
|
| Losses for |
| Remeasuring |
|
|
| assets held for |
| Total Reserves |
|
|
| Attributable to |
|
|
|
|
|
|
|
|
|
|
| Foreign |
| Reserve for |
| Defined |
| Available- |
| Other |
| sale and |
| Other than |
|
|
| Shareholders |
|
|
|
|
|
|
| Issued |
| Share |
| Currency |
| Cash Flow |
| Benefit |
| for-Sale |
| Miscellaneous |
| disposal |
| Retained |
| Retained |
| of the Parent |
| Non-controlling |
|
|
|
|
| Capital |
| Premium |
| Translation |
| Hedges |
| Plans |
| Financial Assets |
| Reserves |
| groups |
| Earnings |
| Earnings |
| Company |
| Interests |
| Total Equity |
|
Statements of Changes in Equity |
| ThCh$ |
| ThCh$ |
| ThCh$ |
| ThCh$ |
| ThCh$ |
| ThCh$ |
| ThCh$ |
| ThCh$ |
| ThCh$ |
| ThCh$ |
| ThCh$ |
| ThCh$ |
| ThCh$ |
|
Equity as of January 1, 2016 |
| 1,331,714,085 |
| 206,008,557 |
| 19,691,866 |
| (205,691,575 | ) | — |
| (1,046 | ) | (719,716,306 | ) | (202,189,042 | ) | (1,107,906,103 | ) | 2,218,373,368 |
| 2,648,189,907 |
| 895,700,172 |
| 3,543,890,079 |
|
Changes in equity |
|
|
|
|
|
|
|
|
|
|
|
|
|
|
|
|
|
|
|
|
|
|
|
|
|
|
|
Comprehensive income |
| — |
| — |
| — |
| — |
| — |
| — |
| — |
| — |
| — |
| — |
| — |
| — |
| — |
|
Net profit for the year |
| — |
| — |
| — |
| — |
| — |
| — |
| — |
| — |
| — |
| 472,558,428 |
| 472,558,428 |
| 48,873,945 |
| 521,432,373 |
|
Other comprehensive loss |
| — |
| — |
| (3,527,400 | ) | 67,731,875 |
| (1,284,713 | ) | 13 |
| (11,690,790 | ) | (72,928,764 | ) | (21,699,779 | ) | — |
| (21,699,779 | ) | (64,982,420 | ) | (86,682,199 | ) |
Total comprehensive income |
| — |
| — |
| — |
| — |
| — |
| — |
| — |
| — |
| — |
| — |
| 450,858,649 |
| (16,108,475 | ) | 434,750,174 |
|
Dividends |
| — |
| — |
| — |
| — |
| — |
| — |
| — |
| — |
| — |
| (184,234,740 | ) | (184,234,740 | ) | (7,405,769 | ) | (191,640,509 | ) |
Increase (decrease) from distribution to owners |
| (778,936,764 | ) | (120,497,065 | ) | — |
| — |
| — |
| — |
| 776,186,804 |
| 275,117,804 |
| 1,051,304,608 |
| (1,305,983,122 | ) | (1,154,112,343 | ) | (839,096,192 | ) | (1,993,208,535 | ) |
Increase (decrease) from other changes |
| — |
| — |
| 46,375 |
| 14,460,299 |
| 1,284,713 |
| — |
| (76,967,775 | ) | 2,722,115 |
| (58,454,273 | ) | (1,284,713 | ) | (59,738,986 | ) | (4,291,974 | ) | (64,030,960 | ) |
Total changes in equity |
| (778,936,764 | ) | (120,497,065 | ) | (3,481,025 | ) | 82,192,174 |
| — |
| 13 |
| 687,528,239 |
| 204,911,155 |
| 971,150,556 |
| (1,018,944,147 | ) | (947,227,420 | ) | (866,902,410 | ) | (1,814,129,830 | ) |
Equity as of December 31, 2016 |
| 552,777,321 |
| 85,511,492 |
| 16,210,841 |
| (123,499,401 | ) | — |
| (1,033 | ) | (32,188,067 | ) | 2,722,113 |
| (136,755,547 | ) | 1,199,429,221 |
| 1,700,962,487 |
| 28,797,762 |
| 1,729,760,249 |
|
ENEL GENERACIÓN CHILE S.A. AND ITS SUBSIDIARIES
Consolidated Statements of Cash Flow, Direct
For the years ended December 31, 2018, 2017 and 2016
(In thousands of Chilean pesos — ThCh$)
|
|
|
| Year ended |
| ||||
|
|
|
| 12-31-2018 |
| 12-31-2017 |
| 12-31-2016 |
|
Statement of Direct Cash Flow |
| Note |
| ThCh$ |
| ThCh$ |
| ThCh$ |
|
Cash flows from operating activities |
|
|
|
|
|
|
|
|
|
Types of collection from operating activities |
|
|
|
|
|
|
|
|
|
Collections from the sale of goods and services |
|
|
| 1,907,020,342 |
| 2,096,113,174 |
| 2,374,348,805 |
|
Collections from royalties, payments, commissions, and other income from ordinary activities |
|
|
| — |
| — |
| 1,967,684 |
|
Collections from premiums and services, annual payments, and other benefits from policies held |
|
|
| 8,229,203 |
| 6,808,382 |
| 4,108,308 |
|
Other collections from operating activities |
|
|
| 267,291 |
| 12,096,424 |
| 260,080 |
|
Types of payment in cash from operating activities |
|
|
|
|
|
|
|
|
|
Payments to suppliers for goods and services |
|
|
| (1,189,827,156 | ) | (1,302,502,517 | ) | (1,432,187,182 | ) |
Payments to and on behalf of employees |
|
|
| (53,181,080 | ) | (57,204,085 | ) | (70,830,372 | ) |
Payments on premiums and services, annual payments, and other obligations from policies held |
|
|
| (13,217,306 | ) | (14,551,177 | ) | (21,525,259 | ) |
Other payments for operating activities |
|
|
| (97,141,445 | ) | (93,435,079 | ) | (185,124,143 | ) |
Cash generated from operating activities |
|
|
|
|
|
|
|
|
|
Income taxes paid |
|
|
| (96,375,125 | ) | (157,951,053 | ) | (107,229,062 | ) |
Other outflows of cash |
|
|
| (501,449 | ) | (1,206,687 | ) | (4,600,270 | ) |
Net cash provided by operating activities |
|
|
| 465,273,275 |
| 488,167,382 |
| 559,188,589 |
|
Cash flows from investment activities |
|
|
|
|
|
|
|
|
|
Other collections from the sale of equity or debt instruments belonging to other entities |
| 7 |
| — |
| 115,582,806 |
| 133,206,429 |
|
Other payments to acquire stakes in joint ventures |
|
|
| — |
| (1,943,100 | ) | (2,346,000 | ) |
Loans to related parties |
|
|
| (83,414,780 | ) | (6,639,995 | ) | (6,457,077 | ) |
Proceeds from the sale of property, plant and equipment |
|
|
| 4,640,835 |
| 4,274,470 |
| 42,597 |
|
Purchases of property, plant and equipment |
|
|
| (222,327,048 | ) | (206,775,663 | ) | (194,880,395 | ) |
Payments from future, forward, option and swap contracts |
|
|
| (1,210,213 | ) | (7,808,837 | ) | (7,860,258 | ) |
Collections from future, forward, option and swap contracts |
|
|
| 352,734 |
| 835,105 |
| 3,439,049 |
|
Collections of loans to related parties |
|
|
| 68,622,702 |
| 6,639,996 |
| 1,907,339 |
|
Dividends received |
|
|
| 1,527,254 |
| 879,884 |
| 8,682,538 |
|
Interest received |
|
|
| 3,635,059 |
| 3,087,687 |
| 3,686,258 |
|
Other inflows (outflows) of cash |
|
|
| 48,423 |
| — |
| — |
|
Net cash used in investing activities |
|
|
| (228,125,034 | ) | (91,867,647 | ) | (60,579,520 | ) |
Cash flows from financing activities |
|
|
|
|
|
|
|
|
|
Total proceeds from loans |
|
|
| — |
| — |
| 257,661,770 |
|
Proceeds from long-term loans |
|
|
| — |
| — |
| 249,359,440 |
|
Proceeds from short-term loans |
|
|
| — |
| — |
| 8,302,330 |
|
Loans from related parties |
|
|
| 69,204,437 |
| 31,680,253 |
| 37,096,734 |
|
Payments on borrowings |
|
|
| (5,654,112 | ) | (5,534,483 | ) | (182,345,064 | ) |
Payments on financial lease liabilities |
|
|
| (1,889,685 | ) | (2,592,237 | ) | (1,744,003 | ) |
Repayments of loans from related parties |
|
|
| (66,540,959 | ) | (31,680,253 | ) | (204,524,335 | ) |
Dividends paid |
|
|
| (239,385,950 | ) | (244,539,407 | ) | (126,718,920 | ) |
Interest paid |
|
|
| (47,195,320 | ) | (44,320,297 | ) | (76,403,433 | ) |
Other outflows of cash |
|
|
| (478,035 | ) | (4,848,787 | ) | (222,675,977 | ) |
Net cash used in financing activities |
|
|
| (291,939,624 | ) | (301,835,211 | ) | (519,653,228 | ) |
Net (decrease) increase in cash and cash equivalents before the effect of exchange rate changes |
|
|
| (54,791,383 | ) | 94,464,524 |
| (21,044,159 | ) |
Effect of exchange rate changes on cash and cash equivalents |
|
|
|
|
|
|
|
|
|
Effect of exchange rate changes on cash and cash equivalents |
|
|
| (4,245,853 | ) | 2,076,138 |
| (14,207,725 | ) |
Net (decrease) increase in cash and cash equivalents |
|
|
| (59,037,236 | ) | 96,540,662 |
| (35,251,884 | ) |
Cash and cash equivalents at the beginning of the year |
| 7 |
| 211,027,141 |
| 114,486,479 |
| 149,738,363 |
|
Cash and cash equivalents at the end of the year |
| 7 |
| 151,989,905 |
| 211,027,141 |
| 114,486,479 |
|
ENEL GENERACIÓN CHILE S.A. AND ITS SUBSIDIARIES
NOTES TO THE CONSOLIDATED FINANCIAL STATEMENTS
Contents
|
|
| |||||||||||||||||||||||||||||||||||||||||||||||||||||||||||||||||||||||||||||||||||||||||||||||||||||||||||||||||||||||||||||||||||||||||||||||||||||||||||||||||||||||||||||||||||||||||||||||||||||||||||||||||||||||||||||||||||||||||||||||||||||||||||||||||||||||||||||||||||||||||||||||||||||||||||||||||||||||||||||||||||||||||||||||||||||||||||||||||||||||||||||||||||||||||||||||||||||||||||||||||||||||||||||||||||||||||||||||||||||||||||||||||||||||||||||||||||||||||||||||||||||||||||||||||||||||||||||||||||||||||||||||||||||||||||||||||||||||||||||||||||||||||||||||||||||||||||||||||||||||||
|
1.1 | Enel Group Proposed Corporate Reorganization
|
| ||||||||||||||||||||||||||||||||||||||||||||||||||||||||||||||||||||||||||||||||||||||||||||||||||||||||||||||||||||||||||||||||||||||||||||||||||||||||||||||||||||||||||||||||||||||||||||||||||||||||||||||||||||||||||||||||||||||||||||||||||||||||||||||||||||||||||||||||||||||||||||||||||||||||||||||||||||||||||||||||||||||||||||||||||||||||||||||||||||||||||||||||||||||||||||||||||||||||||||||||||||||||||||||||||||||||||||||||||||||||||||||||||||||||||||||||||||||||||||||||||||||||||||||||||||||||||||||||||||||||||||||||||||||||||||||||||||||||||||||||||||||||||||||||||||||||||||||||||||||||
BASIS OF PRESENTATION OF THE CONSOLIDATED FINANCIAL STATEMENTS | F-14 | ||||||||||||||||||||||||||||||||||||||||||||||||||||||||||||||||||||||||||||||||||||||||||||||||||||||||||||||||||||||||||||||||||||||||||||||||||||||||||||||||||||||||||||||||||||||||||||||||||||||||||||||||||||||||||||||||||||||||||||||||||||||||||||||||||||||||||||||||||||||||||||||||||||||||||||||||||||||||||||||||||||||||||||||||||||||||||||||||||||||||||||||||||||||||||||||||||||||||||||||||||||||||||||||||||||||||||||||||||||||||||||||||||||||||||||||||||||||||||||||||||||||||||||||||||||||||||||||||||||||||||||||||||||||||||||||||||||||||||||||||||||||||||||||||||||||||||||||||||||||||||
| |||||||||||||||||||||||||||||||||||||||||||||||||||||||||||||||||||||||||||||||||||||||||||||||||||||||||||||||||||||||||||||||||||||||||||||||||||||||||||||||||||||||||||||||||||||||||||||||||||||||||||||||||||||||||||||||||||||||||||||||||||||||||||||||||||||||||||||||||||||||||||||||||||||||||||||||||||||||||||||||||||||||||||||||||||||||||||||||||||||||||||||||||||||||||||||||||||||||||||||||||||||||||||||||||||||||||||||||||||||||||||||||||||||||||||||||||||||||||||||||||||||||||||||||||||||||||||||||||||||||||||||||||||||||||||||||||||||||||||||||||||||||||||||||||||||||||||||||||||||||||||
| |||||||||||||||||||||||||||||||||||||||||||||||||||||||||||||||||||||||||||||||||||||||||||||||||||||||||||||||||||||||||||||||||||||||||||||||||||||||||||||||||||||||||||||||||||||||||||||||||||||||||||||||||||||||||||||||||||||||||||||||||||||||||||||||||||||||||||||||||||||||||||||||||||||||||||||||||||||||||||||||||||||||||||||||||||||||||||||||||||||||||||||||||||||||||||||||||||||||||||||||||||||||||||||||||||||||||||||||||||||||||||||||||||||||||||||||||||||||||||||||||||||||||||||||||||||||||||||||||||||||||||||||||||||||||||||||||||||||||||||||||||||||||||||||||||||||||||||||||||||||||||
| Responsibility for the information, judgments and estimates provided | F-25 | |||||||||||||||||||||||||||||||||||||||||||||||||||||||||||||||||||||||||||||||||||||||||||||||||||||||||||||||||||||||||||||||||||||||||||||||||||||||||||||||||||||||||||||||||||||||||||||||||||||||||||||||||||||||||||||||||||||||||||||||||||||||||||||||||||||||||||||||||||||||||||||||||||||||||||||||||||||||||||||||||||||||||||||||||||||||||||||||||||||||||||||||||||||||||||||||||||||||||||||||||||||||||||||||||||||||||||||||||||||||||||||||||||||||||||||||||||||||||||||||||||||||||||||||||||||||||||||||||||||||||||||||||||||||||||||||||||||||||||||||||||||||||||||||||||||||||||||||||||||||||
| 2.4 | Consolidated subsidiaries |
| ||||||||||||||||||||||||||||||||||||||||||||||||||||||||||||||||||||||||||||||||||||||||||||||||||||||||||||||||||||||||||||||||||||||||||||||||||||||||||||||||||||||||||||||||||||||||||||||||||||||||||||||||||||||||||||||||||||||||||||||||||||||||||||||||||||||||||||||||||||||||||||||||||||||||||||||||||||||||||||||||||||||||||||||||||||||||||||||||||||||||||||||||||||||||||||||||||||||||||||||||||||||||||||||||||||||||||||||||||||||||||||||||||||||||||||||||||||||||||||||||||||||||||||||||||||||||||||||||||||||||||||||||||||||||||||||||||||||||||||||||||||||||||||||||||||||||||||||||||||||||
| |||||||||||||||||||||||||||||||||||||||||||||||||||||||||||||||||||||||||||||||||||||||||||||||||||||||||||||||||||||||||||||||||||||||||||||||||||||||||||||||||||||||||||||||||||||||||||||||||||||||||||||||||||||||||||||||||||||||||||||||||||||||||||||||||||||||||||||||||||||||||||||||||||||||||||||||||||||||||||||||||||||||||||||||||||||||||||||||||||||||||||||||||||||||||||||||||||||||||||||||||||||||||||||||||||||||||||||||||||||||||||||||||||||||||||||||||||||||||||||||||||||||||||||||||||||||||||||||||||||||||||||||||||||||||||||||||||||||||||||||||||||||||||||||||||||||||||||||||||||||||||
| F-26 | ||||||||||||||||||||||||||||||||||||||||||||||||||||||||||||||||||||||||||||||||||||||||||||||||||||||||||||||||||||||||||||||||||||||||||||||||||||||||||||||||||||||||||||||||||||||||||||||||||||||||||||||||||||||||||||||||||||||||||||||||||||||||||||||||||||||||||||||||||||||||||||||||||||||||||||||||||||||||||||||||||||||||||||||||||||||||||||||||||||||||||||||||||||||||||||||||||||||||||||||||||||||||||||||||||||||||||||||||||||||||||||||||||||||||||||||||||||||||||||||||||||||||||||||||||||||||||||||||||||||||||||||||||||||||||||||||||||||||||||||||||||||||||||||||||||||||||||||||||||||||||
F-27 | |||||||||||||||||||||||||||||||||||||||||||||||||||||||||||||||||||||||||||||||||||||||||||||||||||||||||||||||||||||||||||||||||||||||||||||||||||||||||||||||||||||||||||||||||||||||||||||||||||||||||||||||||||||||||||||||||||||||||||||||||||||||||||||||||||||||||||||||||||||||||||||||||||||||||||||||||||||||||||||||||||||||||||||||||||||||||||||||||||||||||||||||||||||||||||||||||||||||||||||||||||||||||||||||||||||||||||||||||||||||||||||||||||||||||||||||||||||||||||||||||||||||||||||||||||||||||||||||||||||||||||||||||||||||||||||||||||||||||||||||||||||||||||||||||||||||||||||||||||||||||||
F-29 | |||||||||||||||||||||||||||||||||||||||||||||||||||||||||||||||||||||||||||||||||||||||||||||||||||||||||||||||||||||||||||||||||||||||||||||||||||||||||||||||||||||||||||||||||||||||||||||||||||||||||||||||||||||||||||||||||||||||||||||||||||||||||||||||||||||||||||||||||||||||||||||||||||||||||||||||||||||||||||||||||||||||||||||||||||||||||||||||||||||||||||||||||||||||||||||||||||||||||||||||||||||||||||||||||||||||||||||||||||||||||||||||||||||||||||||||||||||||||||||||||||||||||||||||||||||||||||||||||||||||||||||||||||||||||||||||||||||||||||||||||||||||||||||||||||||||||||||||||||||||||||
F-29 | |||||||||||||||||||||||||||||||||||||||||||||||||||||||||||||||||||||||||||||||||||||||||||||||||||||||||||||||||||||||||||||||||||||||||||||||||||||||||||||||||||||||||||||||||||||||||||||||||||||||||||||||||||||||||||||||||||||||||||||||||||||||||||||||||||||||||||||||||||||||||||||||||||||||||||||||||||||||||||||||||||||||||||||||||||||||||||||||||||||||||||||||||||||||||||||||||||||||||||||||||||||||||||||||||||||||||||||||||||||||||||||||||||||||||||||||||||||||||||||||||||||||||||||||||||||||||||||||||||||||||||||||||||||||||||||||||||||||||||||||||||||||||||||||||||||||||||||||||||||||||||
F-30 | |||||||||||||||||||||||||||||||||||||||||||||||||||||||||||||||||||||||||||||||||||||||||||||||||||||||||||||||||||||||||||||||||||||||||||||||||||||||||||||||||||||||||||||||||||||||||||||||||||||||||||||||||||||||||||||||||||||||||||||||||||||||||||||||||||||||||||||||||||||||||||||||||||||||||||||||||||||||||||||||||||||||||||||||||||||||||||||||||||||||||||||||||||||||||||||||||||||||||||||||||||||||||||||||||||||||||||||||||||||||||||||||||||||||||||||||||||||||||||||||||||||||||||||||||||||||||||||||||||||||||||||||||||||||||||||||||||||||||||||||||||||||||||||||||||||||||||||||||||||||||||
F-30 | |||||||||||||||||||||||||||||||||||||||||||||||||||||||||||||||||||||||||||||||||||||||||||||||||||||||||||||||||||||||||||||||||||||||||||||||||||||||||||||||||||||||||||||||||||||||||||||||||||||||||||||||||||||||||||||||||||||||||||||||||||||||||||||||||||||||||||||||||||||||||||||||||||||||||||||||||||||||||||||||||||||||||||||||||||||||||||||||||||||||||||||||||||||||||||||||||||||||||||||||||||||||||||||||||||||||||||||||||||||||||||||||||||||||||||||||||||||||||||||||||||||||||||||||||||||||||||||||||||||||||||||||||||||||||||||||||||||||||||||||||||||||||||||||||||||||||||||||||||||||||||
F-31 | |||||||||||||||||||||||||||||||||||||||||||||||||||||||||||||||||||||||||||||||||||||||||||||||||||||||||||||||||||||||||||||||||||||||||||||||||||||||||||||||||||||||||||||||||||||||||||||||||||||||||||||||||||||||||||||||||||||||||||||||||||||||||||||||||||||||||||||||||||||||||||||||||||||||||||||||||||||||||||||||||||||||||||||||||||||||||||||||||||||||||||||||||||||||||||||||||||||||||||||||||||||||||||||||||||||||||||||||||||||||||||||||||||||||||||||||||||||||||||||||||||||||||||||||||||||||||||||||||||||||||||||||||||||||||||||||||||||||||||||||||||||||||||||||||||||||||||||||||||||||||||
F-32 | |||||||||||||||||||||||||||||||||||||||||||||||||||||||||||||||||||||||||||||||||||||||||||||||||||||||||||||||||||||||||||||||||||||||||||||||||||||||||||||||||||||||||||||||||||||||||||||||||||||||||||||||||||||||||||||||||||||||||||||||||||||||||||||||||||||||||||||||||||||||||||||||||||||||||||||||||||||||||||||||||||||||||||||||||||||||||||||||||||||||||||||||||||||||||||||||||||||||||||||||||||||||||||||||||||||||||||||||||||||||||||||||||||||||||||||||||||||||||||||||||||||||||||||||||||||||||||||||||||||||||||||||||||||||||||||||||||||||||||||||||||||||||||||||||||||||||||||||||||||||||||
F-32 | |||||||||||||||||||||||||||||||||||||||||||||||||||||||||||||||||||||||||||||||||||||||||||||||||||||||||||||||||||||||||||||||||||||||||||||||||||||||||||||||||||||||||||||||||||||||||||||||||||||||||||||||||||||||||||||||||||||||||||||||||||||||||||||||||||||||||||||||||||||||||||||||||||||||||||||||||||||||||||||||||||||||||||||||||||||||||||||||||||||||||||||||||||||||||||||||||||||||||||||||||||||||||||||||||||||||||||||||||||||||||||||||||||||||||||||||||||||||||||||||||||||||||||||||||||||||||||||||||||||||||||||||||||||||||||||||||||||||||||||||||||||||||||||||||||||||||||||||||||||||||||
F-36 | |||||||||||||||||||||||||||||||||||||||||||||||||||||||||||||||||||||||||||||||||||||||||||||||||||||||||||||||||||||||||||||||||||||||||||||||||||||||||||||||||||||||||||||||||||||||||||||||||||||||||||||||||||||||||||||||||||||||||||||||||||||||||||||||||||||||||||||||||||||||||||||||||||||||||||||||||||||||||||||||||||||||||||||||||||||||||||||||||||||||||||||||||||||||||||||||||||||||||||||||||||||||||||||||||||||||||||||||||||||||||||||||||||||||||||||||||||||||||||||||||||||||||||||||||||||||||||||||||||||||||||||||||||||||||||||||||||||||||||||||||||||||||||||||||||||||||||||||||||||||||||
| |||||||||||||||||||||||||||||||||||||||||||||||||||||||||||||||||||||||||||||||||||||||||||||||||||||||||||||||||||||||||||||||||||||||||||||||||||||||||||||||||||||||||||||||||||||||||||||||||||||||||||||||||||||||||||||||||||||||||||||||||||||||||||||||||||||||||||||||||||||||||||||||||||||||||||||||||||||||||||||||||||||||||||||||||||||||||||||||||||||||||||||||||||||||||||||||||||||||||||||||||||||||||||||||||||||||||||||||||||||||||||||||||||||||||||||||||||||||||||||||||||||||||||||||||||||||||||||||||||||||||||||||||||||||||||||||||||||||||||||||||||||||||||||||||||||||||||||||||||||||||||
|
| F-38 | |||||||||||||||||||||||||||||||||||||||||||||||||||||||||||||||||||||||||||||||||||||||||||||||||||||||||||||||||||||||||||||||||||||||||||||||||||||||||||||||||||||||||||||||||||||||||||||||||||||||||||||||||||||||||||||||||||||||||||||||||||||||||||||||||||||||||||||||||||||||||||||||||||||||||||||||||||||||||||||||||||||||||||||||||||||||||||||||||||||||||||||||||||||||||||||||||||||||||||||||||||||||||||||||||||||||||||||||||||||||||||||||||||||||||||||||||||||||||||||||||||||||||||||||||||||||||||||||||||||||||||||||||||||||||||||||||||||||||||||||||||||||||||||||||||||||||||||||||||||||||
F-39 | |||||||||||||||||||||||||||||||||||||||||||||||||||||||||||||||||||||||||||||||||||||||||||||||||||||||||||||||||||||||||||||||||||||||||||||||||||||||||||||||||||||||||||||||||||||||||||||||||||||||||||||||||||||||||||||||||||||||||||||||||||||||||||||||||||||||||||||||||||||||||||||||||||||||||||||||||||||||||||||||||||||||||||||||||||||||||||||||||||||||||||||||||||||||||||||||||||||||||||||||||||||||||||||||||||||||||||||||||||||||||||||||||||||||||||||||||||||||||||||||||||||||||||||||||||||||||||||||||||||||||||||||||||||||||||||||||||||||||||||||||||||||||||||||||||||||||||||||||||||||||||
F-39 | |||||||||||||||||||||||||||||||||||||||||||||||||||||||||||||||||||||||||||||||||||||||||||||||||||||||||||||||||||||||||||||||||||||||||||||||||||||||||||||||||||||||||||||||||||||||||||||||||||||||||||||||||||||||||||||||||||||||||||||||||||||||||||||||||||||||||||||||||||||||||||||||||||||||||||||||||||||||||||||||||||||||||||||||||||||||||||||||||||||||||||||||||||||||||||||||||||||||||||||||||||||||||||||||||||||||||||||||||||||||||||||||||||||||||||||||||||||||||||||||||||||||||||||||||||||||||||||||||||||||||||||||||||||||||||||||||||||||||||||||||||||||||||||||||||||||||||||||||||||||||||
F-40 | |||||||||||||||||||||||||||||||||||||||||||||||||||||||||||||||||||||||||||||||||||||||||||||||||||||||||||||||||||||||||||||||||||||||||||||||||||||||||||||||||||||||||||||||||||||||||||||||||||||||||||||||||||||||||||||||||||||||||||||||||||||||||||||||||||||||||||||||||||||||||||||||||||||||||||||||||||||||||||||||||||||||||||||||||||||||||||||||||||||||||||||||||||||||||||||||||||||||||||||||||||||||||||||||||||||||||||||||||||||||||||||||||||||||||||||||||||||||||||||||||||||||||||||||||||||||||||||||||||||||||||||||||||||||||||||||||||||||||||||||||||||||||||||||||||||||||||||||||||||||||||
F-40 | |||||||||||||||||||||||||||||||||||||||||||||||||||||||||||||||||||||||||||||||||||||||||||||||||||||||||||||||||||||||||||||||||||||||||||||||||||||||||||||||||||||||||||||||||||||||||||||||||||||||||||||||||||||||||||||||||||||||||||||||||||||||||||||||||||||||||||||||||||||||||||||||||||||||||||||||||||||||||||||||||||||||||||||||||||||||||||||||||||||||||||||||||||||||||||||||||||||||||||||||||||||||||||||||||||||||||||||||||||||||||||||||||||||||||||||||||||||||||||||||||||||||||||||||||||||||||||||||||||||||||||||||||||||||||||||||||||||||||||||||||||||||||||||||||||||||||||||||||||||||||||
F-41 | |||||||||||||||||||||||||||||||||||||||||||||||||||||||||||||||||||||||||||||||||||||||||||||||||||||||||||||||||||||||||||||||||||||||||||||||||||||||||||||||||||||||||||||||||||||||||||||||||||||||||||||||||||||||||||||||||||||||||||||||||||||||||||||||||||||||||||||||||||||||||||||||||||||||||||||||||||||||||||||||||||||||||||||||||||||||||||||||||||||||||||||||||||||||||||||||||||||||||||||||||||||||||||||||||||||||||||||||||||||||||||||||||||||||||||||||||||||||||||||||||||||||||||||||||||||||||||||||||||||||||||||||||||||||||||||||||||||||||||||||||||||||||||||||||||||||||||||||||||||||||||
F-41 | |||||||||||||||||||||||||||||||||||||||||||||||||||||||||||||||||||||||||||||||||||||||||||||||||||||||||||||||||||||||||||||||||||||||||||||||||||||||||||||||||||||||||||||||||||||||||||||||||||||||||||||||||||||||||||||||||||||||||||||||||||||||||||||||||||||||||||||||||||||||||||||||||||||||||||||||||||||||||||||||||||||||||||||||||||||||||||||||||||||||||||||||||||||||||||||||||||||||||||||||||||||||||||||||||||||||||||||||||||||||||||||||||||||||||||||||||||||||||||||||||||||||||||||||||||||||||||||||||||||||||||||||||||||||||||||||||||||||||||||||||||||||||||||||||||||||||||||||||||||||||||
F-43 | |||||||||||||||||||||||||||||||||||||||||||||||||||||||||||||||||||||||||||||||||||||||||||||||||||||||||||||||||||||||||||||||||||||||||||||||||||||||||||||||||||||||||||||||||||||||||||||||||||||||||||||||||||||||||||||||||||||||||||||||||||||||||||||||||||||||||||||||||||||||||||||||||||||||||||||||||||||||||||||||||||||||||||||||||||||||||||||||||||||||||||||||||||||||||||||||||||||||||||||||||||||||||||||||||||||||||||||||||||||||||||||||||||||||||||||||||||||||||||||||||||||||||||||||||||||||||||||||||||||||||||||||||||||||||||||||||||||||||||||||||||||||||||||||||||||||||||||||||||||||||||
F-43 | |||||||||||||||||||||||||||||||||||||||||||||||||||||||||||||||||||||||||||||||||||||||||||||||||||||||||||||||||||||||||||||||||||||||||||||||||||||||||||||||||||||||||||||||||||||||||||||||||||||||||||||||||||||||||||||||||||||||||||||||||||||||||||||||||||||||||||||||||||||||||||||||||||||||||||||||||||||||||||||||||||||||||||||||||||||||||||||||||||||||||||||||||||||||||||||||||||||||||||||||||||||||||||||||||||||||||||||||||||||||||||||||||||||||||||||||||||||||||||||||||||||||||||||||||||||||||||||||||||||||||||||||||||||||||||||||||||||||||||||||||||||||||||||||||||||||||||||||||||||||||||
F-43 | |||||||||||||||||||||||||||||||||||||||||||||||||||||||||||||||||||||||||||||||||||||||||||||||||||||||||||||||||||||||||||||||||||||||||||||||||||||||||||||||||||||||||||||||||||||||||||||||||||||||||||||||||||||||||||||||||||||||||||||||||||||||||||||||||||||||||||||||||||||||||||||||||||||||||||||||||||||||||||||||||||||||||||||||||||||||||||||||||||||||||||||||||||||||||||||||||||||||||||||||||||||||||||||||||||||||||||||||||||||||||||||||||||||||||||||||||||||||||||||||||||||||||||||||||||||||||||||||||||||||||||||||||||||||||||||||||||||||||||||||||||||||||||||||||||||||||||||||||||||||||||
F-44 | |||||||||||||||||||||||||||||||||||||||||||||||||||||||||||||||||||||||||||||||||||||||||||||||||||||||||||||||||||||||||||||||||||||||||||||||||||||||||||||||||||||||||||||||||||||||||||||||||||||||||||||||||||||||||||||||||||||||||||||||||||||||||||||||||||||||||||||||||||||||||||||||||||||||||||||||||||||||||||||||||||||||||||||||||||||||||||||||||||||||||||||||||||||||||||||||||||||||||||||||||||||||||||||||||||||||||||||||||||||||||||||||||||||||||||||||||||||||||||||||||||||||||||||||||||||||||||||||||||||||||||||||||||||||||||||||||||||||||||||||||||||||||||||||||||||||||||||||||||||||||||
NON-CURRENT ASSETS OR GROUPS OF ASSETS FOR DISPOSAL CLASSIFIED AS HELD FOR SALE | F-49 | ||||||||||||||||||||||||||||||||||||||||||||||||||||||||||||||||||||||||||||||||||||||||||||||||||||||||||||||||||||||||||||||||||||||||||||||||||||||||||||||||||||||||||||||||||||||||||||||||||||||||||||||||||||||||||||||||||||||||||||||||||||||||||||||||||||||||||||||||||||||||||||||||||||||||||||||||||||||||||||||||||||||||||||||||||||||||||||||||||||||||||||||||||||||||||||||||||||||||||||||||||||||||||||||||||||||||||||||||||||||||||||||||||||||||||||||||||||||||||||||||||||||||||||||||||||||||||||||||||||||||||||||||||||||||||||||||||||||||||||||||||||||||||||||||||||||||||||||||||||||||||
F-49 | |||||||||||||||||||||||||||||||||||||||||||||||||||||||||||||||||||||||||||||||||||||||||||||||||||||||||||||||||||||||||||||||||||||||||||||||||||||||||||||||||||||||||||||||||||||||||||||||||||||||||||||||||||||||||||||||||||||||||||||||||||||||||||||||||||||||||||||||||||||||||||||||||||||||||||||||||||||||||||||||||||||||||||||||||||||||||||||||||||||||||||||||||||||||||||||||||||||||||||||||||||||||||||||||||||||||||||||||||||||||||||||||||||||||||||||||||||||||||||||||||||||||||||||||||||||||||||||||||||||||||||||||||||||||||||||||||||||||||||||||||||||||||||||||||||||||||||||||||||||||||||
F-49 | |||||||||||||||||||||||||||||||||||||||||||||||||||||||||||||||||||||||||||||||||||||||||||||||||||||||||||||||||||||||||||||||||||||||||||||||||||||||||||||||||||||||||||||||||||||||||||||||||||||||||||||||||||||||||||||||||||||||||||||||||||||||||||||||||||||||||||||||||||||||||||||||||||||||||||||||||||||||||||||||||||||||||||||||||||||||||||||||||||||||||||||||||||||||||||||||||||||||||||||||||||||||||||||||||||||||||||||||||||||||||||||||||||||||||||||||||||||||||||||||||||||||||||||||||||||||||||||||||||||||||||||||||||||||||||||||||||||||||||||||||||||||||||||||||||||||||||||||||||||||||||
F-53 | |||||||||||||||||||||||||||||||||||||||||||||||||||||||||||||||||||||||||||||||||||||||||||||||||||||||||||||||||||||||||||||||||||||||||||||||||||||||||||||||||||||||||||||||||||||||||||||||||||||||||||||||||||||||||||||||||||||||||||||||||||||||||||||||||||||||||||||||||||||||||||||||||||||||||||||||||||||||||||||||||||||||||||||||||||||||||||||||||||||||||||||||||||||||||||||||||||||||||||||||||||||||||||||||||||||||||||||||||||||||||||||||||||||||||||||||||||||||||||||||||||||||||||||||||||||||||||||||||||||||||||||||||||||||||||||||||||||||||||||||||||||||||||||||||||||||||||||||||||||||||||
F-54 | |||||||||||||||||||||||||||||||||||||||||||||||||||||||||||||||||||||||||||||||||||||||||||||||||||||||||||||||||||||||||||||||||||||||||||||||||||||||||||||||||||||||||||||||||||||||||||||||||||||||||||||||||||||||||||||||||||||||||||||||||||||||||||||||||||||||||||||||||||||||||||||||||||||||||||||||||||||||||||||||||||||||||||||||||||||||||||||||||||||||||||||||||||||||||||||||||||||||||||||||||||||||||||||||||||||||||||||||||||||||||||||||||||||||||||||||||||||||||||||||||||||||||||||||||||||||||||||||||||||||||||||||||||||||||||||||||||||||||||||||||||||||||||||||||||||||||||||||||||||||||||
F-55 | |||||||||||||||||||||||||||||||||||||||||||||||||||||||||||||||||||||||||||||||||||||||||||||||||||||||||||||||||||||||||||||||||||||||||||||||||||||||||||||||||||||||||||||||||||||||||||||||||||||||||||||||||||||||||||||||||||||||||||||||||||||||||||||||||||||||||||||||||||||||||||||||||||||||||||||||||||||||||||||||||||||||||||||||||||||||||||||||||||||||||||||||||||||||||||||||||||||||||||||||||||||||||||||||||||||||||||||||||||||||||||||||||||||||||||||||||||||||||||||||||||||||||||||||||||||||||||||||||||||||||||||||||||||||||||||||||||||||||||||||||||||||||||||||||||||||||||||||||||||||||||
F-56 | |||||||||||||||||||||||||||||||||||||||||||||||||||||||||||||||||||||||||||||||||||||||||||||||||||||||||||||||||||||||||||||||||||||||||||||||||||||||||||||||||||||||||||||||||||||||||||||||||||||||||||||||||||||||||||||||||||||||||||||||||||||||||||||||||||||||||||||||||||||||||||||||||||||||||||||||||||||||||||||||||||||||||||||||||||||||||||||||||||||||||||||||||||||||||||||||||||||||||||||||||||||||||||||||||||||||||||||||||||||||||||||||||||||||||||||||||||||||||||||||||||||||||||||||||||||||||||||||||||||||||||||||||||||||||||||||||||||||||||||||||||||||||||||||||||||||||||||||||||||||||||
F-57 | |||||||||||||||||||||||||||||||||||||||||||||||||||||||||||||||||||||||||||||||||||||||||||||||||||||||||||||||||||||||||||||||||||||||||||||||||||||||||||||||||||||||||||||||||||||||||||||||||||||||||||||||||||||||||||||||||||||||||||||||||||||||||||||||||||||||||||||||||||||||||||||||||||||||||||||||||||||||||||||||||||||||||||||||||||||||||||||||||||||||||||||||||||||||||||||||||||||||||||||||||||||||||||||||||||||||||||||||||||||||||||||||||||||||||||||||||||||||||||||||||||||||||||||||||||||||||||||||||||||||||||||||||||||||||||||||||||||||||||||||||||||||||||||||||||||||||||||||||||||||||||
F-58 | |||||||||||||||||||||||||||||||||||||||||||||||||||||||||||||||||||||||||||||||||||||||||||||||||||||||||||||||||||||||||||||||||||||||||||||||||||||||||||||||||||||||||||||||||||||||||||||||||||||||||||||||||||||||||||||||||||||||||||||||||||||||||||||||||||||||||||||||||||||||||||||||||||||||||||||||||||||||||||||||||||||||||||||||||||||||||||||||||||||||||||||||||||||||||||||||||||||||||||||||||||||||||||||||||||||||||||||||||||||||||||||||||||||||||||||||||||||||||||||||||||||||||||||||||||||||||||||||||||||||||||||||||||||||||||||||||||||||||||||||||||||||||||||||||||||||||||||||||||||||||||
F-59 | |||||||||||||||||||||||||||||||||||||||||||||||||||||||||||||||||||||||||||||||||||||||||||||||||||||||||||||||||||||||||||||||||||||||||||||||||||||||||||||||||||||||||||||||||||||||||||||||||||||||||||||||||||||||||||||||||||||||||||||||||||||||||||||||||||||||||||||||||||||||||||||||||||||||||||||||||||||||||||||||||||||||||||||||||||||||||||||||||||||||||||||||||||||||||||||||||||||||||||||||||||||||||||||||||||||||||||||||||||||||||||||||||||||||||||||||||||||||||||||||||||||||||||||||||||||||||||||||||||||||||||||||||||||||||||||||||||||||||||||||||||||||||||||||||||||||||||||||||||||||||||
F-62 | |||||||||||||||||||||||||||||||||||||||||||||||||||||||||||||||||||||||||||||||||||||||||||||||||||||||||||||||||||||||||||||||||||||||||||||||||||||||||||||||||||||||||||||||||||||||||||||||||||||||||||||||||||||||||||||||||||||||||||||||||||||||||||||||||||||||||||||||||||||||||||||||||||||||||||||||||||||||||||||||||||||||||||||||||||||||||||||||||||||||||||||||||||||||||||||||||||||||||||||||||||||||||||||||||||||||||||||||||||||||||||||||||||||||||||||||||||||||||||||||||||||||||||||||||||||||||||||||||||||||||||||||||||||||||||||||||||||||||||||||||||||||||||||||||||||||||||||||||||||||||||
| |||||||||||||||||||||||||||||||||||||||||||||||||||||||||||||||||||||||||||||||||||||||||||||||||||||||||||||||||||||||||||||||||||||||||||||||||||||||||||||||||||||||||||||||||||||||||||||||||||||||||||||||||||||||||||||||||||||||||||||||||||||||||||||||||||||||||||||||||||||||||||||||||||||||||||||||||||||||||||||||||||||||||||||||||||||||||||||||||||||||||||||||||||||||||||||||||||||||||||||||||||||||||||||||||||||||||||||||||||||||||||||||||||||||||||||||||||||||||||||||||||||||||||||||||||||||||||||||||||||||||||||||||||||||||||||||||||||||||||||||||||||||||||||||||||||||||||||||||||||||||||
F-66 | |||||||||||||||||||||||||||||||||||||||||||||||||||||||||||||||||||||||||||||||||||||||||||||||||||||||||||||||||||||||||||||||||||||||||||||||||||||||||||||||||||||||||||||||||||||||||||||||||||||||||||||||||||||||||||||||||||||||||||||||||||||||||||||||||||||||||||||||||||||||||||||||||||||||||||||||||||||||||||||||||||||||||||||||||||||||||||||||||||||||||||||||||||||||||||||||||||||||||||||||||||||||||||||||||||||||||||||||||||||||||||||||||||||||||||||||||||||||||||||||||||||||||||||||||||||||||||||||||||||||||||||||||||||||||||||||||||||||||||||||||||||||||||||||||||||||||||||||||||||||||||
F-67 | |||||||||||||||||||||||||||||||||||||||||||||||||||||||||||||||||||||||||||||||||||||||||||||||||||||||||||||||||||||||||||||||||||||||||||||||||||||||||||||||||||||||||||||||||||||||||||||||||||||||||||||||||||||||||||||||||||||||||||||||||||||||||||||||||||||||||||||||||||||||||||||||||||||||||||||||||||||||||||||||||||||||||||||||||||||||||||||||||||||||||||||||||||||||||||||||||||||||||||||||||||||||||||||||||||||||||||||||||||||||||||||||||||||||||||||||||||||||||||||||||||||||||||||||||||||||||||||||||||||||||||||||||||||||||||||||||||||||||||||||||||||||||||||||||||||||||||||||||||||||||||
F-67 | |||||||||||||||||||||||||||||||||||||||||||||||||||||||||||||||||||||||||||||||||||||||||||||||||||||||||||||||||||||||||||||||||||||||||||||||||||||||||||||||||||||||||||||||||||||||||||||||||||||||||||||||||||||||||||||||||||||||||||||||||||||||||||||||||||||||||||||||||||||||||||||||||||||||||||||||||||||||||||||||||||||||||||||||||||||||||||||||||||||||||||||||||||||||||||||||||||||||||||||||||||||||||||||||||||||||||||||||||||||||||||||||||||||||||||||||||||||||||||||||||||||||||||||||||||||||||||||||||||||||||||||||||||||||||||||||||||||||||||||||||||||||||||||||||||||||||||||||||||||||||||
| 14. | F-68 | |||
|
| ||
F-68 |
|
| Additional financial information on investments in associated companies | F-70 | |
Additional financial information on investments in joint ventures | F-70 | |||
F-71 | ||||
F-71 | ||||
F-73 | ||||
F-74 | ||||
F-74 | ||||
F-75 | ||||
F-75 | ||||
F-75 | ||||
F-76 | ||||
F-76 | ||||
F-76 | ||||
F-79 | ||||
F-81 | ||||
F-81 | ||||
F-82 | ||||
F-83 | ||||
F-83 | ||||
F-84 | ||||
F-84 | ||||
F-86 | ||||
F-86 | ||||
F-87 | ||||
F-87 | ||||
F-88 | ||||
F-88 | ||||
F-88 | ||||
F-89 | ||||
F-89 | ||||
F-90 | ||||
F-92 | ||||
F-94 | ||||
F-94 | ||||
F-95 | ||||
F-95 | ||||
F-96 | ||||
F-97 | ||||
F-98 | ||||
F-98 | ||||
F-100 | ||||
F-100 | ||||
Restrictions on subsidiaries transferring funds to the parent | F-100 | |||
F-100 | ||||
F-101 | ||||
F-102 | ||||
F-102 | ||||
F-103 | ||||
F-103 | ||||
F-103 | ||||
F-104 | ||||
F-104 | ||||
| ||||
Annual periods beginning on or after January 1, 2016
F-105 | ||||
F-106 | ||||
F-108 | ||||
THIRD PARTY GUARANTEES, OTHER CONTINGENT ASSETS AND LIABILITIES, AND OTHER COMMITMENTS | F-110 | |||
|
| |||
|
| |||
|
| |||
|
| |||
|
| |||
The new interpretation35.1
F-110
F-110
F-110
| 35.4 | F-111 | |||
As of the date of issue of these consolidated financial statements, the following accounting pronouncements had been issued by the IASB, but their application was not yet mandatory:36.
F-113
F-113
F-113 | ||||
F-114 | ||||
F-115 | ||||
F-116 | ||||
F-117 | ||||
F-118 | ||||
F-119 | ||||
F-120 | ||||
F-121 | ||||
F-123 | ||||
F-125 | ||||
F-127 | ||||
F-128 | ||||
ENEL GENERACIÓN CHILE S.A. AND ITS SUBSIDIARIES
NOTES TO THE CONSOLIDATED FINANCIAL STATEMENTS AS OF AND FOR THE YEAR ENDED DECEMBER 31, 2018
(In thousands of Chilean pesos — ThCh$)
1. THE GROUP’S ACTIVITIES AND FINANCIAL STATEMENTS
Enel Generación Chile S.A (hereinafter the “Parent Company” or the “Company”) and its subsidiaries comprise the Enel Generación Chile Group (hereinafter the Enel Generación Chile or the “Group”).
Enel Generación Chile S.A. is a publicly traded corporation with a registered address and head office located at Avenida Santa Rosa, No. 76, in Santiago, Chile. The Company is registered in the securities register of the Finantial Market Commission of Chile (“Comisión para el Mercado Financiero” or “CMF”, formerly Chilean Superintendence of Securities and Insurance, “Superintendencia de Valores y Seguros” or “SVS”) under number 114. In addition, the Company is registered with the Securities and Exchange Commission of the United States of America (hereinafter U.S. SEC). The Company’s shares have been listed on the New York Stock Exchange in the period between 1994 to December 31, 2018, date in which the Company requested before the SEC the delisting of the issued securities. As of this date, the American Depositary Shares issued by Enel Generación Chile ceased trading on the NYSE.
Enel Generación Chile S.A. is a subsidiary of Enel Chile S.A. (“Enel Chile”) a company which, in turn, is a subsidiary Enel S.p.A. (hereinafter “Enel”).
The Company was initially incorporated by a public deed dated December 1, 1943 under the name Empresa Nacional de Electricidad S.A. The Treasury Department’s Supreme Decree No. 97 of January 3, 1944 authorized the incorporation of the Company and approved its by-laws. The Company changed its name to Enel Generación Chile S.A. effective October 4, 2016, the date its by-laws were amended in connection with the corporate reorganization of the Group (see Note 5.2). For tax purposes, the Company operates under Chilean tax identification number 91.081.000-6.
As of December 31, 2018 the Group had 767 employees. During the year ended December 31, 2018, the Group averaged a total of 795 employees (see Note 36).
The Company’s corporate purpose consists of generating, transporting, producing, and distributing electrical energy. The purpose also includes investing in financial assets, developing projects, carrying out activities in the energy industry and in other fields in which electrical energy is essential, and participating in public civil or hydraulic infrastructure concessions in which it may participate directly or through subsidiaries or associate companies in Chile or abroad.
1.1 Enel Group Proposed Corporate Reorganization
Enel Generación Chile’s Board of Directors at its Extraordinary Session held on September 1, 2017, unanimously resolved to initiate all work and steps necessary to analize the corporate reorganization proposed by our parent Enel Chile, in the terms applicable to Enel Generación Chile.
Enel Chile’s proposal consists of a corporate reorganization within Enel, which is intended to incorporate the renewable energy assets in Chile held through Enel Green Power Latin America S.A. (“EGPL”) with Enel Chile. EGPL is a subsidiary of Enel.
The proposal also implies that the merger is contingent on the success of a Public Tender Offer (“Tender Offer”) to be carried out by Enel Chile for all of the shares of its subsidiary Enel Generación Chile held by non-controlling interests.
The Reorganization involved two principal phases, each of which is conditional on the implementation of the other, as follows:
(i) Public tender offer
Enel Chile presented a public tender offer (the “Tender Offer”) for all of the shares of its subsidiary Enel Generación Chile S.A. (“Enel Generación Chile”) held by non-controlling interests (equivalent to approximately 40% of the share capital). The Tender Offer consideration was paid in cash, subject to the condition that tendering Enel Generación Chile shareholders will have agreed to use a specified portion of the cash consideration to subscribe for shares or American Depositary Shares (“ADSs”) of Enel Chile (the “Share/ADS Subscription Condition”).
(ii) Merger
Once the Tender Offer declared successful, EGPL merged into Enel Chile (the “Merger.”) which was subject to approval by Enel Chile shareholders and the unanimous written consent of the shareholders of EGPL. Consequently, the renewable assets held by EGPL was integrated into Enel Chile.
On December 20, 2017, the Extraordinary Shareholder’s Meeting of Enel Generación Chile, for fulfilling one of the conditions of success of the Tender Offer, approved the amendment of the company’s bylaws to eliminate the limitations and restrictions established in Section XII of Decree No. 3.500.
Finally, on March 25, 2018, the amendments to Enel Chile’s by-laws were approved to reflect the agreements related to the merger, capital increase and expansion of Enel Chile’s corporate purpose, among other provisions. The Tender Offer took place between February 16 and March 22, 2018; the preferred shares were subscribed between February 15 and March 16, 2018 to cover the capital increase; and the reorganization of renewable assets (including the Merger) was completed and became effective as of April 2, 2018 and resulted in an increase of Enel Chile’s ownership in Enel Generación Chile from 59.98% to 93.55% and the merger of Enel Chile with EGPL effective as from this date.
2. BASIS OF PRESENTATION OF THE CONSOLIDATED FINANCIAL STATEMENTS
The consolidated financial statements as of December 31, 2018 of the Group, approved for issuance by the Company’s Board of Directors at its meeting held on April 26, 2019, have been prepared in accordance with the International Financial Reporting Standards (“IFRS”) as issued by the International Accounting Standards Board (“IASB”).
These consolidated financial statements reflect the financial position of Enel Generación Chile and its subsidiaries at December 31, 2018 and 2017, and the results of its operations, changes in equity and cash flows for the year ended December 31, 2018, 2017, and 2016.
These consolidated financial statements present the figures for 2016 of the consolidated statement of comprehensive income, statement of consolidated cash flows, statement of changes in consolidated equity, and their corresponding notes.
These consolidated financial statements have been prepared under going concern assumptions on a historical cost basis except, in accordance with IFRS, those assets and liabilities that are measured at a fair value.
These consolidated financial statements are presented in thousands of Chilean pesos (unless expressly stated otherwise), as the Chilean peso is the functional currency of the Company and the presentation currency of the Group. Foreign operations are incorporated in accordance with the accounting policies stated in Notes 2.7.3 and 3.m.
2.2 New accounting pronouncements
a)The following accounting pronouncements have been adopted by the Group effective as of January 1, 2018:
Effective date
Standards and Interpretations Mandatory Effective date IFRS 9: Financial Instruments Annual periods beginning on or after January 1, 2018 IFRS 15: Revenue from Contracts with Customers Annual periods beginning on or after January 1, 2018 IFRIC 22 Foreign Currency Transactions and Advance Consideration. Annual periods beginning on or after January 1, 2018 IFRS 9 Financial Instruments IFRS 9 entered into force effective as of January 1, 2018, replacing IAS 39 “Financial Instruments: Recognition and Measurement .” This standard contains requirements in regards to the recognition, classification and measurement of financial assets, financial liabilities and certain purchase or sale contracts of non-financial items. The Group adopted retrospectively whitout restaing prior periods for transition in the first time application of this standard. The accumulated effect of this application was accounted for as an adjustment to the opening balance of retained earnings as of the initial application date. The Group has applied prospectively the hedge accounting requirements of IFRS 9. Management conducted a detailed evaluation of the three aspects of the standard and its impact on the consolidated financial statements. of the Group, which is summarized as follows: Classification and measurement. IFRS 9 introduces a new classification approach for financial assets, based on two concepts: the characteristics of the contractual cash flows of the financial assets and the business model of the entity. Under this new approach, the four classification categories of IAS 39 are replaced by the following three categories: · amortized cost; if the financial assets are held within a business model whose objective is to collect contractual cash flows; · fair value through other comprehensive income, if the financial assets are held within a business model whose objective is achieved by both collecting contractual cash flows and selling financial assets; or · fair value through profit or loss, a residual category which consists of financial instruments that are not held within any of the two business models previously discussed, including those held for trading and those designated at fair value on initial recognition. For financial liabilities, IFRS 9 retains largely the existing requirements in IAS 39, with certain specific modifications, under which most of the financial liabilities are measured at amortized cost, and allowing the designation of a financial liability to be measured at fair value through profit or loss, if certain criteria are met. However, IFRS 9 introduces new requirements for financial liabilities designated at fair value through profit or loss, which states that under certain circumstances, changes in fair value originated by the variation of an entity’s own credit risk will be recognized in other comprehensive income. Based on the business model and the characteristics of the contractual cash flows, the Group determined that the new classification requirements for financial assets did not have an impact on the consolidate statements. Most of the Group’s financial instruments, i.e. loans and trade receivables amortized cost under IFRS 9. Except for equity instruments measured at fair value through other comprehensive income and derivative instruments measured at fair value through profit or loss (general treatment) or through other comprehensive income (hedge accounting), as appropriate. Impairment. The new impairment model in IFRS 9 is based on expected credit losses, as opposed to the incurred loss model in IAS 39. Consequently, under IFRS 9 impairment losses will be recognized, as a general rule, earlier than previous practice. The new impairment model will be applied to financial assets measured at amortized cost and those measured at fair value through other comprehensive income, except for investments in equity instruments. Under IFRS 9, the allowance for impairment losses will be measured based on: · 12 months expected credit losses; or · Lifetime expected credit losses if the credit risk of a financial asset at the reporting date has increased significantly since initial recognition. The standard allows the application of a simplified approach for trade receivables, contract assets and lease receivables so that the impairment is always recognized in reference to the lifetime expected credit losses for the asset. The Group has chosen to apply this policy for the designated financial assets. As of January 1, 2018, as a result of the application of the new impairment model, the Group recognized a charge, net of taxes, of ThCh$141,284 to retained earnings. Hedge accounting. IFRS 9 introduces a new model for hedge accounting in order to more closely align the accounting treatment with risk management activities of the entities and to establish a new principle-based approach. The new model will enable entities to better reflect risk management activities in the financial statements, and allow more items to be eligible as hedged items, such as: non-financial risk components, net positions, and aggregated exposures (i.e., a combination of derivative and non-derivative exposure). The most significant changes in relation to hedging instruments compared to hedge accounting methodology in IAS 39, is the possibility to defer in other comprehensive income the time value of options, forward points in forward contracts, and foreign currency basis spread, until the hedged item impacts profit or loss. IFRS 9 eliminates the current quantitative requirement for hedge effectiveness test, under which the results must be within a range of 80-125 percent. This will allow aligning hedge effectiveness with risk management by demonstrating the existence of an economic relationship between the hedging instrument and the hedged item, and enables the rebalancing of a hedging relationship if the risk management objective remains unchanged. However, retrospective ineffectiveness should continue to be valued and recognized in profit or loss. When initially applying IFRS 9, the Group may choose as its accounting policy to continue to apply the hedge accounting requirements of IAS 39 instead of the requirements in IFRS 9, until the time the new requirements on macro-hedging are published and adopted. The Group has chosen to apply the new requirements of IFRS 9 on the date of its adoption. The Group implemented changes in the systems, internal control, policies and procedures in order to comply with the new disclosures and accounting requirements of IFRS 9. The application of the new hedge accounting model has not had an impact on the Group’s consolidated financial statements. IFRS 15 Revenue from Contracts with Customers In May 2014, the IASB published IFRS 15 which is applicable to all contracts with customers, with certain exemptions. (lease and insurance contracts, financial instruments and non-monetary exchanges).The new revenue standard supersedes, effective as of January 1, 2018 all current revenue recognition standards: · IAS 11 Construction Contracts; · IAS 18 Revenue; · IFRIC 13 Customer Loyalty Programs; · IFRIC 15 Agreements for the Construction of Real Estate; · IFRIC 18 Transfers of Assets from Customers; and · SIC-31 Revenue—Barter Transactions Involving Advertising Services. This new Standard introduces a general framework for recognition and measurement of revenue, based on the core principle that revenues are recognized for an amount that reflects the consideration to which the entity expects to be entitled in exchange for transferring promised goods or services to customers. This core principle shall be applied using a five-step approach to revenue recognition: (1) identify the contract with a customer; (2) identify the performance obligations in the contract; (3) determine the transaction price; (4) allocate the transaction price to the performance obligations in the contracts; and (5) recognize revenue when (or as) the entity satisfies a performance obligation. The Group carried out an implementation project, to identify and measure the possible impacts of applying IFRS 15 on its consolidated financial statements. This project involved identifying all of the revenue flows of Enel Chile and its subsidiaries, knowledge of the traditional practices of the business, a comprehensive evaluation of each kind of contract with customers and determining the methodology for recording this revenue under the standards. The evaluation was performed paying special attention to those contracts presenting key aspects of IFRS 15 and particular characteristics of interest to the Group, such as identifying contractual obligations; contracts with multiple obligations and recognition timing; contracts with variable compensation; significant financing components; analysis of principal versus agent; existence of service guarantees; and recognition of costs to obtain and fulfill a contract. Enel Generación Chile Group participates in the electrical energy generation, transmission and distribution business, and related activities. Based on the nature of the goods and services offered and the characteristic of its revenue flows streams, the Group did not identify any impact on the consolidated financial statements on the date of initial application of IFRS 15. For further details about the goods and services provided by the Company and revenue recognition criteria, see Note 3.p. The Group implemented changes in the systems, internal control, policies and procedures in order to comply with the new disclosures and accounting requirements of IFRS 15. The Group adopted the new standard on the required effective date using the retrospectively modified method. Prior to the application of IFRS 15 as of January 1, 2018, revenues were recognized according to IAS 18, which mainly stated that revenues were recognized when the risk and rewards inherent to ownership of the goods were transferred to the curstomer and that corresponds to the moment of the physical deliveries of energy and power, to the prices established in the respective contracts. The application has not had an impact on the Group’s consolidated financial statement. IFRIC 22 Foreign Currency Transactions and Advance Consideration Interpretation clarifies the date of the transaction for the purpose of determining the exchange rate to use in foreign currency transactions when the consideration is paid or received before recognizing related revenues, expenses or assets. For this purposes, the date of the transaction is the date on which an entity initially recognizes the non-monetary asset or non-monetary liability arising from the payment or receipt of advance consideration. IFRIC 22 has been implemented by the Group as of January 1, 2018 and it has not generated an impact on the consolidated financial statements of Enel Generación Chile and its subsidiaries. Amendments and Improvements Amendments and Improvements Mandatory Effective Date: Amendment to IFRS 2; Classification and Measurement of Share-based Payment Transactions Annual periods beginning on or after January 1, 2018 Amendment to IAS 40: Transfers of Investment Property Annual periods beginning on or after January 1, 2018 Annual Improvements to IFRS: Cycles 2014-2016 IFRS 1 and IAS 28 Annual periods beginning on or after January 1, 2018 ·Classification and Measurement of Share-based Payment Transactions (Amendments to IFRS 2) The amendments to IFRS 2, Share-based Payment Transactions, developed through the IFRS Interpretations Committee, address the following issues: a) the effects of vesting and non-vesting conditions on the measurement of cash-settled share-based payments; b) the classification of withholding tax obligations for share-based payment transactions with net settlement features; and c) the accounting for modifications of share-based payment transactions from cash-settled to equity-settled. The amendments to IFRS 2, applied as of January 1, 2018, have not had any material impact on the consolidated financial statements of the Group. ·Transfers of Investment Property (Amendments to IAS 40). The amendments to IAS 40 Investment Property clarify that an entity shall transfer a property to, or from, investment property when, and only when, there is evidence of a change in use. A change of use occurs if property meets, or ceases to meet, the definition of investment property. A change in management’s intentions for the use of a property by itself does not constitute evidence of a change in use. The amendments shall be applied prospectively. The amendments to IFRS 40, applied as of January 1, 2018, have not had any material impact on the consolidated financial statements of the Group. ·Annual Improvements to IFRS: Cycles 2014-2016 IFRS 1 and IAS 28 IFRS 1 First-time Adoption of IFRS: Deletes the short-term exemptions in paragraphs E3—E7 of IFRS 1, because they have now served their intended purpose. Clarifies that the election to measure at fair value through profit or loss an investment in an associate or a joint venture that is held by an entity that is a venture capital organization, or other qualifying entity, is available for each investment in an associate or joint venture on an investment-by-investment basis, upon initial recognition. If an entity that is not itself an investment entity has an interest in an associate or joint venture that is an investment entity, it may choose to maintain the fair value measurement applied to its associate or joint venture. Application of these improvements is on a retrospective basis. The 2014-2016 annual improvements, applied as of January 1, 2018, have not had any material impact on the consolidated financial statements of the Group. Accounting pronouncements with application effective as of January 1, 2019 and thereafter: As of the date of issuance of these consolidated financial statements, the following accounting pronouncements had been issued by the IASB, but their application is not mandatorily effective: New Standards and Interpretations Standards and Interpretations Mandatory Effective date IFRS 16: Leases Annual periods beginning on or after January 01, 2019 IFRIC 23 Uncertainty over Income Tax Treatments Annual periods beginning on or after January 01, 2019 Conceptual Framework (Revised) Annual periods beginning on or after January 01, 2020 IFRS 16 Leases In January 2016, the IASB issued IFRS 16 which establishes recognition, measurement, presentation and disclosure principles for lease agreements. IFRS 16 supersedes IAS 17 “Leases” and its interpretations, IFRIC 4 “Determining whether an Arrangement contains a Lease”, SIC-15 “Operating Leases—Incentives” and SIC-27 “Evaluating the Substance of Transactions Involving the Legal Form of a Lease”. The standard is effective for annual periods beginning on or after January 1, 2019. Although IFRS 16 substantially retains the definition of a lease in IAS 17, the main change is the incorporation of the “control” concept within the new definition. In relation to the accounting treatment for a lessee and a lessor, the new Standard states the following: i. Lessee accounting: IFRS 16 requires lessees to account for all leases under a single model, similar to accounting for finance leases under IAS 17. As a result, at the date of commencement of a lease, the lessee will recognize on the statement of financial position a right to use asset and a lease liability for the future payments. Subsequent to initial recognition it will recognize in the statement of profit or loss the depreciation expense of the asset separately from the interest related to the liability. The standard provides two voluntary recognition exceptions for low-value leases and short-term leases. ii. Lessor accounting: does not change substantially from the current model of IAS 17. The lessor will continue to classify leases under the same principles of the current standard as operating or financial leases. The Group carried out an assessment of the potential impact of IFRS 16 on its consolidated financial statements. Conducting this assessment required the use of professional judgment and assumptions, which are summarized below: · Analysis of the lease contracts executed by the Group companies in order to identify if they are within the scope of the standard. This analysis included not only the contracts in which Enel Generación Chile acts as a lessee, but also the contracts for the rendering of services and the contracts in which the Company acts as a lessor. · Analysis that could benefit from the exemption from application of this Standard, because they are contracts with a maturity of less than 12 months or that have underlying assets of low individual value, such as: lease of certain office equipment (personal computers, printers and photocopiers) that are considered low value assets. · Estimate of the lease terms, based on the non-cancellable period and the periods covered by the renewal options, the exercise of which is in the power of Enel Generación Chile and is considered reasonably certain. �� Estimate of the discount rate to calculate the present value of the lease payments. This is equal to the incremental rate of the lessee’s loans when the interest rate implicit in the lease cannot be easily determined. For the transition, the Group has used the incremental borrowing rate from January 2019, defined as the interest rate that the Group would have to pay to borrow over a similar term, and with a similar security, the funds necessary to obtain an asset of a value similar to the right-of-use asset in a similar economic environment. The implementation work also required a review of the processes and systems, including the internal control, in order to determine the most appropriate tool for the management of the information required for the application of the new standard, as well as the required disclosures in the consolidated financial statements. For the transition of the new standard, the Group has decided to apply the following practical expedients: · The Group decided not to re-evaluate if a contract is, or contains, a lease. Instead, it will apply the standard to contracts that were previously identified as leases by applying IAS 17 and IFRIC 4. Therefore, the Group will not apply the standard to contracts that were not previously identified as containing a lease. · The Group has determined that it will apply the modified retrospectively transition method, whereby the restatement of comparative periods is not required and the cumulative effect of the initial application of the standard is presented as an adjustment to the opening balance of retained earnings (or another component of equity as applicable) on the date of initial application, recording the asset for the same value as the liability. · Trust in its assessment of whether leases are onerous by applying IAS 37 Provisions, Contingent Liabilities and Contingent Assets immediately before the date of initial application and adjust the right-of-use asset at the date of initial application for the amount of any provision for onerous leases recognized in the financial statements immediately before the date of initial application. The new standard had an impact on all Group entities that have lease contracts. The main issues that arise are those related to the lease of land, buildings and automobiles. As a result of the change of the accounting model for lessees, the Group expects an increase in non-current and current liabilities of approximately ThCh$1,458,987 as of January 1, 2019, for the recognition of future payment obligations of lease contracts. In accordance with the chosen transition model, an increase in non-current assets for an equal amount is also expected, resulting from the recognition of the rights of use arising from those contracts. ·IFRIC 23 — Uncertainty over Income Tax Treatments In June 2017, the IASB issued IFRIC 23 to clarify the application of recognition and measurement requirements in IAS 12, Income Taxes when there is uncertainty over income tax treatments. The Interpretation specifically addresses the following: whether an entity considers uncertain tax treatments separately; the assumptions an entity makes about the examination of tax treatments by taxation authorities; how an entity determines taxable profit (loss), tax bases, unused tax losses, unused tax credits and tax rates; and how an entity considers changes in facts and circumstances. Uncertainty over income tax treatments can affect both current and deferred taxes. Recognizing the effects of uncertainty depends on whether the tax authority is likely or not to accept an uncertain tax treatment, assuming that the tax authority will examine the amounts that it is entitled to examine and has full knowledge of all the related information. This interpretation is effective for annual periods beginning on or after January 1, 2019. Retrospective application is permitted. Management has assessed the effects of the application of IFRIC 23 and has determined that its adoption will not have any material impacts of Enel Generación Chile and subsidiaries as of its effective date. ·Conceptual Framework (Revised). The IASB issued the Conceptual Framework (revised) in March 2018. It incorporates some new pronouncements, provides updated definitions and recognition criteria for assets and liabilities and clarifies some important matters. Revisions to the Conceptual Framework may affect the application of IFRSs when no standard applies to a particular transaction or event. The IASB has also issued a separate accompanying document, “Amendments to References to the Conceptual Framework in IFRS Standards,” which establishes amendments to other IFRSs in order to update references to the new Conceptual Framework. The Conceptual Framework (Revised) is effective as of January 1, 2020. Management is assessing the potential impact of the application of the new Conceptual Framework on the consolidated financial statements of the Group. Amendments and Improvements Amendments and Inprovements Mandatory Effective date Amendment to IFRS 9; Prepayment Features with Negative Compensation Annual periods beginning on or after January 01, 2019 Amendment to IAS 28: Long-term interests in Associates and Joint Ventures Annual periods beginning on or after January 01, 2019 Annual Improvements to IFRS 2015 -2017 Cycle (IFRS 3, IFRS 11, IAS 12 and IAS 23). Annual periods beginning on or after January 1, 2019. Amendment to IAS 19: Plan Amendment, Curtailment or Settlement Annual periods beginning on or after January 1, 2019 Amendment to IAS 3: Definition of a Business Amendments to IAS 1 and Material IFRS 10 and IAS Postponed indefinitely. Available for optional adoption ·Amendment to IFRS 9, Financial Instruments: Prepayment Features with Negative Compensation This amendment was issued on October 12, 2017. This amendment amends the existing requirements in IFRS 9 regarding termination rights in order to allow measurement at amortized cost (or, depending on the business model, at fair value through other comprehensive income) even in the case of negative compensation prepayments. Under IFRS 9, a debt instrument can be measured at amortized cost or at fair value through profit or loss in other comprehensive income, provided that the contractual cash flows are only principal and interest payments on the outstanding principal and the instrument is carried out within the business model for that classification. The amendments to IFRS 9 are intended to clarify that a financial asset meets the criterion of “only principal payments plus interest”, regardless of the event or circumstance that causes the early termination of the contract or of which party pays or receives fair value compensation for the early termination of the contract. The Amendments to IFRS 9 should be applied when the prepayment is close to the unpaid amounts of principal and interest in such a way that it reflects the change in the benchmark interest rate. This implies that prepayments at fair value or for an amount that includes the fair value of the cost of an associated hedging instrument will normally meet the criterion of only principal payments plus interest, only if other elements of the change in fair value, such as the effects of credit risk or liquidity, are not present. The amendments are applicable from January 1, 2019, retrospectively. Management considers that the application of these amendments will not have an impact on the consolidated financial statements of the Group. ·Amendments to IAS 28: Long-term interests in Associates and Joint Ventures These amendments clarify that IFRS 9 Financial Instruments is applicable to an entity’s long-term interests in an associate or joint venture to which the equity method is not applied. This clarification is relevant because it implies that the expected credit loss model, described in IFRS 9, applies to these long-term interests. Entities should apply the amendments retrospectively, with certain exceptions. The effective application date is January 1, 2019. Management considers that the application of these amendments will not have an impact on the consolidated financial statements of the Group. ·Annual Improvements to IFRS: 2015 - 2017 Cycle (IFRS 3, IFRS 11, IAS 12 and IAS 23). IFRS 3 “Business Combinations” and IFRS 11 “Joint Arrangements”: clarifies the accounting for increases in ownership interest in a joint operation that meets the definition of a business. If a party maintains (or obtains) joint control, the previously held ownership interest is not remeasured. If a party obtains control, the transaction is a business combination in stages and the acquiring party remeasures the previously held ownership interest in the assets and liabilities of a joint operation, at fair value. IAS 12 “Income Taxes” The amendments clarify that the income tax on dividends generated by financial instruments classified as equity is linked more directly to past transactions or events that generated distributable profits than to distributions to shareholders. Therefore, an entity recognizes income tax on dividends in profit or loss, other comprehensive income or equity according to where the entity originally recognized those transactions or past events. IAS 23 “Borrowing Costs” clarifies that loans that were specifically intended to finance qualifying assets that are now ready for use or sale (or any non-qualifying asset), become part of the entity’s general loan pool for the purpose of calculating the capitalization rate . The improvements are effective for annual reporting periods beginning on or after January 1, 2019. Management considers that the application of these improvements will not have an impact on the consolidated financial statements of the Group. ·Amendment to IAS 19: Plan Amendment, Curtailment or Settlement The amendments to IAS 19 Employee Benefits, issued in February 2018, address the accounting when a plan amendment, curtailment or settlement occurs during a reporting period. The amendments to IAS 19 clarify that an entity first determines any past service cost, or a gain or loss on settlement, without considering the effect of the asset ceiling. This amount is recognized in profit or loss. An entity then determines the effect of the asset ceiling after the plan amendment, curtailment or settlement. Any change in that effect, excluding amounts included in net interest, is recognized in other comprehensive income. This clarification provides that entities might have to recognise a past service cost, or a gain or loss on settlement, that reduces a surplus that was not recognized before. Changes in the effect of the asset ceiling are not netted against such amounts. The amendments to IAS 19 apply to a plan amendment, curtailment or settlement that occur from January 1, 2019. Management considers that the application of these improvements will not have an impact on the consolidated financial statements of the Group. ·Amendments to IFRS 3 “Definition of a Business” IFRS 3 Business Combinations was amended by the IASB in October 2018, to clarify the definition of business, in order to help entities to determine whether a transaction should be accounted for as a business combination or as the acquisition of an asset. To be considered as a business, an acquired set of activities and assets must include, at least, an input and a substantive process that together contribute significantly to the ability to create output. The amendment also adds guidance and illustrative examples to assess whether a substantial process has been acquired The amendment is applicable prospectively to business combinations and acquisitions of assets, the acquisition date of which is from January 1, 2020. Earlier application is permitted. Management is evaluating the potential impact of the application of these amendments on the consolidated financial statements of the Group. ·Amendments to IAS 1 and IAS 8 “Definition of Material or Materiality” In October 2018, the IASB amended IAS 1 Presentation of Financial Statements and IAS 8 Accounting Policies, Changes in Accounting Estimates and Errors, to improve the definition of “material” and the explanations accompanying the definition. The amendments ensure that the definition of material is consistent in all IFRS. Information is material if omitting, misstating or obscuring it could reasonably be expected to influence the decisions that the primary users of general purpose financial statements make on the basis of those financial statements, which provide financial information about a specific reporting entity. The amendments will be applicable prospectively for annual periods beginning on or after January 1, 2020. Earlier application is permitted. Management is evaluating the potential impact of the application of these amendments on the consolidated financial statements of the Group. ·Amendments to IFRS 10 and IAS 28 “Sales or Contributions of Assets between an Investor and its Associate/Joint Venture” The amendments to IFRS 10 Consolidated Financial Statements and IAS 28 Investments in Associates and Joint Ventures, issued in September 2014, address a recognized inconsistency between the requirements of both standards in the treatment of the sale or contribution of assets between an investor and its associate or joint venture. The amendments establish that when the transaction involves a business (whether it is in a subsidiary or not) all the generated profit or loss is recognized. A partial gain or loss is recognized when the transaction involves assets that do not constitute a business, even when the assets are housed in a subsidiary. The mandatory application date of these amendments is to be determined because the IASB is awaiting the results of its research project on the accounting under the equity method. These amendments must be applied retrospectively and early adoption is permitted, which must be disclosed. The Group will assess and apply these amendments when they are issued and effective. 2.3 Responsibility for the information, judgments and estimates provided The Company’s Board of Directors is responsible for the information contained in these consolidated financial statements and expressly states that all IFRS principles and standards, have been fully implemented. In preparing the consolidated financial statements, certain judgments and estimates made by the Company’s Management have been used to quantify some of the assets, liabilities, revenue, expenses and commitments recognized. The most important areas where critical judgment was required are: · The identification of cash generating units (CGU) for impairment testing (see Note 3.d). · The hierarchy of information used to measure assets and liabilities at fair value (see Note 3.g). · Application of the revenue recognition model in accordance with IFRS 15 (see Note 3.p). The estimates refer basically to: · The valuations performed to determine the existence of impairment losses in assets and goodwill (see Note 3.d). · The assumptions used to calculate the actuarial liabilities and obligations with employees, such as discount rates, mortality tables, salary increases, etc. (see Notes 3.l.1 and 24). · The useful lives of property, plant and equipment, and intangible assets (see Notes 3.a and 3.c). · The assumptions used to calculate the fair value of financial instruments (see Notes 3.g and 19). · Certain assumptions inherent in the electricity system affecting transactions with other companies, such as production, customer billings, energy consumption, that allow for estimation of electricity system settlements that occur on the corresponding final settlement dates, but that are pending as of the date of issuance of the consolidated financial statements and could affect the balances of assets, liabilities, income and expenses recognized in the financial statements (see Appendix 5.2). · The probability that uncertain or contingent liabilities will be incurred and their related amounts (see Note 3.l). · Future disbursements for closure of facilities and restoration of land, as well as associated discount rates to be used (see Note 3.a). · The tax results of the various subsidiaries of the Group that will be reported to the respective tax authorities in the future, and that have been used as the basis for recording income taxes in these consolidated financial statements (see Note 3.o). · The fair value of assets acquired and liabilities assumed, and any pre-existing interest in an entity acquired in a business combination. Although these judgments and estimates have been based on the best available information as of the issuance date of these consolidated financial statements, future events may occur that would require a change (increase or decrease) to these judgments and estimates in subsequent periods. This change would be made prospectively, recognizing the effects of this change in judgment and estimation in the corresponding future consolidated financial statements. Subsidiaries are defined as those entities controlled either directly or indirectly by Enel Generación Chile S.A. Control is exercised if and only if the following conditions are met: the Company has i) power over the subsidiary; ii) exposure, or rights to variable returns from these entities; and iii) the ability to use its power to influence the amount of theses returns. Enel Generación Chile S.A has power over its subsidiaries when it holds the majority of the substantive voting rights or, should that not be the case, when it has rights granting the practical ability to direct the entities’ relevant activities, that is, the activities that significantly affect the subsidiary’s results. The Group will reassess whether or not it controls a subsidiary if facts and circumstances indicate that there are changes to one or more of the elements of control listed above. Subsidiaries are consolidated as described in Note 2.7. Appendix 1 “Enel Generación Chile Group Entities” to these consolidated financial statements, describes the relationship of the Company with each of its subsidiaries. 2.4.1Changes in the scope of consolidation On March 1, 2016, as part of the corporate reorganization and as a result of the spin-off described in Note 5.2, all subsidiaries that were part of the generation and distribution businesses outside of Chile have been deconsolidated, which are detailed in Appendix 2. The effects of this transaction in the consolidated financial statements of Enel Generación Chile are described in Note 5.2. Associates are those entities in which Enel Generación Chile, either directly or indirectly, exercises significant influence. Significant influence is the power to participate in the financial and operational policy decisions of the associate but is not control or joint control over those policies. In assessing significant influence, the Group takes into account the existence and effect of potential exercisable voting rights or convertible rights at the end of each reporting period, including potential voting rights held by the Company or other entities. In general, significant influence is presumed to be those cases in which the Group has more than 20% of the voting power of the investee. Associates are accounted for under equity method as described in Note 3.h. Appendix 3 “Associates and Joint Ventures” to these consolidated financial statements, describes the relationship of the Company with each of these companies. Joint arrangements are defined as those entities in which the Group exercises control under an agreement with other shareholders and jointly with them, in other words, when decisions on the entities’ relevant activities require the unanimous consent of the parties sharing control. Depending on the rights and obligations of the participants, joint agreements are classified as: · Joint venture: an agreement whereby the parties exercising joint control have rights to the entity’s net assets. Joint ventures are incorporated to the consolidated financial statements using the equity method, as described in Note 3.h. · Joint operation: an agreement whereby the parties exercising joint control have rights to the assets and obligations with respect to the liabilities relating to the arrangement. Joint operations are incorporated to the consolidated financial statements recognizing the interest in the assets and liabilities held in the joint operation. At the end of the reporting period, the Group does not have any joint arrangements that qualify as joint operations. In determining the type of joint arrangement in which it is involved, the management of the Group assesses its rights and obligations arising from the arrangement by considering the structure and legal form of the arrangement, the terms agreed by the parties in the contractual arrangement and, when relevant, other facts and circumstances. If facts and circumstances change, the Group reassesses whether the type of joint arrangement in which it is involved has changed. Currently, the Company is not involved in any joint arrangement that qualifies as a joint operation. Appendix 3 “Associates and Joint Ventures” to these consolidated financial statements describes the relationship of the Company and each of these companies. 2.7 Basis of consolidation and business combinations The subsidiaries are consolidated and all their assets, liabilities, revenues, expenses, and cash flows are included in the consolidated financial statements once the adjustments and eliminations from intra-group transactions have been made. The comprehensive income of subsidiaries is included in the consolidated statement of comprehensive income from the date when the parent company obtains control of the subsidiary and until the date on which it loses control of the subsidiary. The operations of the parent company and its subsidiaries have been consolidated under the following basic principles: 1. At the date the parent obtains control, the subsidiary’s assets acquired and its liabilities assumed are recorded at fair value, except for certain assets and liabilities that are recorded using valuation principles established in other IFRS standards. If the fair value of the consideration transferred plus the fair value of any non-controlling interests exceeds the fair value of the net assets acquired, this difference is recorded as goodwill. In the case of a bargain purchase, the resulting gain is recognized in profit or loss for the period after reassessing whether all of the assets acquired and the liabilities assumed have been properly identified and following a review of the procedures used to measure the fair value of these amounts. For each business combination, the Group chooses whether to measure the non-controlling interests in the acquiree at fair value or at the proportional share of the net identifiable assets acquired. If the fair value of all assets acquired and liabilities assumed at the acquisition date has not been completed, the Group reports the provisional values accounted for in the business combination. During the measurement period, which shall not exceed one year from the acquisition date, the provisional values recognized will be adjusted retrospectively as if the accounting for the business combination had been completed at the acquisition date, and also additional assets or liabilities will be recognized to reflect new information obtained on events and circumstances that existed on the acquisition date, but which were unknown to the management at that time. Comparative information for prior periods presented in the financial statements is revised as needed, including making any change in depreciation, amortization or other income effects recognized in completing the initial accounting. For business combinations achieved in stages, the Company’s previously held equity interest in the acquiree is remeasured to its acquisition-date fair value and the resulting gain or loss, if any, is recognized in profit or loss. 2. Non-controlling interests in equity and in comprehensive income of the subsidiaries are presented, respectively, under the line items “Total Equity: Non-controlling interests” in the consolidated statement of financial position and “Net income attributable to non-controlling interests” and “Comprehensive income (loss) attributable to non-controlling interests” in the consolidated statement of comprehensive income. 3. The financial statements of the Group companies with functional currencies other than the Chilean peso are translated as follows: a. For assets and liabilities the prevailing exchange rate on the closing date of the financial statements is used. b. For items of the comprehensive income, the average exchange rate for the period is used (unless this average is not a reasonable approximation of the cumulative effect of the exchange rates in effect on the dates of the transactions, in which case the exchange rate in effect on the date of each transaction is used). c. For equity accounts the historical exchange rate from the date of acquisition or contribution is used, and retained earnings are translated at the average exchange rate at the date of origination. d. Exchange differences arising in translation of financial statements are recognized in the item “Foreign currency translation gains (losses”) within the consolidated statement of comprehensive income in other comprehensive income (see Note 25.2). 4. The financial statements of the subsidiaries whose functional currency is that of a hyper-inflationary economy is first adjusted for the inflation effect, and any gain or loss in the net position is recognized in profit or loss; then all the items (assets, liabilities, equity items, expenses and revenue) are translated using the closing exchange rate corresponding to the closing date of the most recent statement of financial position 5. Balances and transactions between consolidated companies were fully eliminated in the consolidation process. 6. Changes in the ownership interests in subsidiaries that do not result in the Group obtaining or losing control are recognized as equity transactions. The carrying amounts of the controlling and non-controlling interests are adjusted to reflect the changes in their relative interests in the subsidiaries. Any difference between the amount by which the non-controlling interests are adjusted and the fair value of the consideration paid or received is recognized directly in equity attributable to shareholders of the Parent. 7. Business combinations between entities under common control are accounted for using, as a reference, the ‘pooling of interest’ method. Under this method, the assets and liabilities involved in the transaction remain reflected at the same carrying amounts at which they were recognized in the ultimate controlling company, although subsequent accounting adjustments may need to be made to align the accounting policies of the companies involved. Any difference between assets and liabilities contributed to the consolidation and the consideration paid is recorded directly in equity, as a charge or credit to “Other reserves”. The Group does not restate comparative periods in its financial statements for business combinations under common control. The main accounting policies used in preparing the accompanying consolidated financial statements are the following: a) Property, plant and equipment Property, plant and equipment are measured at acquisition cost, net of accumulated depreciation and any impairment losses they may have experienced. In addition to the price paid to acquire each item, the cost also includes, where applicable, the following: · Financing expenses accrued during the construction period that are directly attributable to the acquisition, construction, or production of qualified assets, which require a substantial period of time before being ready for use such as, for example, electricity generation or distribution facilities. The Group defines “substantial period” as one that exceeds 12 months. The interest rate used is that of the specific financing or, if none exists, the weighted average financing rate of the company carrying out the investment (see Note 17.4.a). · Employee expenses directly related to construction in progress (see Note 17.4.b). · Future disbursements that the Group will have to make to close their facilities are incorporated into the value of the asset at fair value, recording in the accounting the corresponding provision for dismantling or restoration. The Group reviews its estimate of these future disbursements on a yearly basis, increasing or decreasing the value of the asset based on the results of this estimate (see Note 23). Items for construction work in progress are transferred to operating assets once the testing period has been completed and they are available for use, at which time depreciation begins. Expansion, modernization or improvement costs that represent an increase in productivity, capacity or efficiency, or a longer useful life are capitalized as increasing the cost of the corresponding assets. The replacement or overhaul of entire components that increase the asset’s useful life or economic capacity are recognized as an increase in cost for the respective assets, derecognizing the replaced or overhauled components. Expenditures for periodic maintenance, conservation and repair are recognized directly as an expense for the period in which they are incurred. The Group, based on the outcome of impairment testing performed as explained in Note 3.d, considers that the carrying amount of assets does not exceed their recoverable amount. Property, plant and equipment, net of its residual value, is depreciated by distributing the cost of the different items that comprise it on a straight-line basis over its estimated useful life, which is the period during which the Group companies expect to use the assets. Useful life estimates and residual values are reviewed on an annual basis and if appropriate, adjusted prospectively. The following are the main categories of property, plant and equipment with their respective estimated useful lives: Years of 10 – 60 Plant and equipment 6 – 65 IT equipment 3 – 15 Fixtures and fittings 2 – 35 Motor vehicles 5 – 10 Additionally, the following table sets forth more details on the useful lives of plant and equipment items: CategoriesIFRS 9 Financial InstrumentsIFRS 9 Financial InstrumentsIn June 2014, the IASB issued a finalized version of IFRS 9 which contains accounting requirements for financial instruments, replacing IAS 39 “Financial Instruments: Recognition and Measurement”. This new standard brings together the results of the three phases of the IASB project on financial instruments: (i) classification and measurement, (ii) impairment, and (iii) hedge accounting.IFRS 9 must be applied in an entity’s first annual IFRS financial statements forAnnual periods beginning on or after January 1, 2018. Early adoption is permitted. The standard imposes many specific transition rules, exceptions2020exemptions, but, in general, should be applied retrospectively, except for mostIAS 8 Definition of the hedge accounting requirements, which shall be applied prospectively. IFRS 9 does not require any prior period restatements. The Group has no plans to adopt this standard early.The effects that IFRS 9 will have on the Group's consolidated financial statements in 2018 are not yet known and cannot be reliably estimated, as it will depend on the financial instruments the Group possesses and the economic conditions as of the date of its adoption, as well as on the accounting choices and judgments made during the implementation period. However, the Group has made a preliminary assessment of the potential impact, which is based on currently available information and may therefore be subject to changes arising from the detailed analysis to be developed or new information available in the future.i)Classification and measurement.IFRS 9 introduces a new approach to classification of financial assets, based on two concepts: contractual cash flows characteristics and the business model. Under this new approach, the four classification categories that existed under IAS 39 “Financial Instruments: Recognition and Measurement” are replaced by the following three categories:- amortized cost;- fair value with changes in other comprehensive income; or- fair value through profit or loss.Financial liabilities under IFRS 9 are classified in a similar manner to under IAS 39 “Financial Instruments: Recognition and Measurement”. However there are differences in the requirements applicable to the measurement of financial liabilities designated at fair value through profit or loss. Changes originated by the variation of an entity’s own credit risk will be recognized in other comprehensive income.On the basis of its preliminary assessment, the Group believes that the new classification and measurement requirements for financial assets and financial liabilities, if applied as of December 31, 2016, would not have had significant effects on its consolidated financial statements.ii)Impairment.IFRS 9 introduces an expected credit loss model, different to the incurred credit loss model required by IAS 39 “Financial Instruments: Recognition and Measurement”. This means that under IFRS 9 impairment will be generally recognized earlier than under the current standard.The new impairment model will be applied to financial assets measured at amortized cost or at fair value with changes in other comprehensive income. Loss allowance will be measured based on:-expected credit losses over the next 12 months; or-expected credit losses over the life of the asset if, at the reporting date of the financial statements, there is a significant increase in the credit risk of a financial instrument since the initial recognition.The standard allows, as a matter of simplification, accounting for loss allowance on commercial receivables, contractual assets or lease receivables, based on expected credit losses over the life of these assets. The Group preliminarily believes that it will apply the simplified approach to all trade accounts receivable.iii)Hedge accounting.IFRS 9 introduces a new hedge accounting model that is designed to be more closely aligned with how entities undertake risk management activities when hedging financial and non- financial risk exposures, and establishes a more principles based approach. The new approach will better reflect the results of risk management activities in the financial statements, allowing more elements to be eligible as hedged items: risk component of non-financial items, net positions and aggregate exposures (i.e. a combination of non-derivative and derivative instruments).At the initial application of IFRS 9, the Group may choose as an accounting policy to continue applying IAS 39 “Financial Instruments: Recognition and Measurement” the hedge accounting requirements of IAS 39 instead of the IFRS 9 requirements. The Group currently intends to apply new IFRS 9 for hedge accounting on the date of its adoption.The Group believes that all hedging relationships currently in existence, which have been designated as effective hedges, will continue to be eligible for hedge accounting in accordance with IFRS 9. The Group will evaluate possible changes related to accounting for the time value of options, forward elements or monetary base differential in greater details in the future.IFRS 15 Revenue from Contracts with CustomersIn May 2014, the IASB published IFRS 15 “Revenue from Contracts with Customers”. This standard establishes a single, principles based five-step model to be applied to all contracts with customers. In accordance with IFRS 15, income is recognized at an amount that reflects the consideration to which an entity will be entitled in exchange for the promised goods or services.The new revenue standard supersedes all current revenue recognition standards:-IAS 11 Construction Contracts;-IAS 18 Revenue;-IFRIC 13 Customer Loyalty Programs;-IFRIC 15 Agreements for the Construction of Real Estate;-IFRIC 18 Transfers of Assets from Customers; and-SIC-31 Revenue—Barter Transactions Involving Advertising Services.IFRS 15 must be applied in an entity’s first annual IFRS financial statements forAnnual periods beginning on or after January 1, 2018. The standard is to be applied retrospectively to each prior reporting period presented in accordance with20208 “Accounting Policies, Changes in Accounting Estimates28 Sale or contribution of assets between an investor and Errors”, subject to some practical expedients;its associate or retrospectively with the cumulative effect of initially applying this standard recognized at the date of initial application. Earlyjoint venture is permitted. The Group preliminarily estimates that on the date of mandatory application it will apply the cumulative effect method. As a result, the Group will apply IFRS 15 retrospectively only to contracts in effect on the date of initial application, recognizing the cumulative effect of the initial application of the standard as an adjustment to the opening balance of retained earnings of the annual presentation period which includes the date of initial application.The Group has made a preliminary assessmentCategories of IFRS 15, determining that, if these standards were applied asProperty, plant and equipmentDecember 31, 2016, there would have been no significant effects on the consolidated financial statements of the Group.estimated useful livesIFRS 15 introduces new revenue disclosures in comparison to the current standards. These requirements represent a significant change from current practice and significantly increase the volume of disclosures to be included in the Group’s financial statements. During 2017, in accordance with the schedule of the IFRS 15 implementation established internally, the Group will evaluate and implement changes and improvements in the systems, internal controls, policies and procedures, necessary to enable collection and disclosure of the required information.IFRS 16 LeasesBuildingsIn January 2016 the IASB has published a new standard, IFRS 16 “Leases”. The new standard establishes recognition, measurement, presentation and disclosure principles for lease agreements. IFRS 16 supersedes IAS 17 “Leases”, IFRIC 4 “Determining whether an Arrangement contains a Lease”, SIC-15 “Operating Leases—Incentives” and SIC-27 “Evaluating the Substance of Transactions Involving the Legal Form of a Lease”.i)Lessee accounting: IFRS 16 requires lessees to account for all leases under a single model, similar to accounting for finance leases under IAS 17 “Leases”. As a result, at the date of commencement of a lease, the lessee will recognize an asset for the right to use the asset and a liability for the future payments. The standard provides two voluntary recognition exceptions for low-value leases and short-term leases.ii)Lessor accounting: does not change substantially from the current model of IAS 17 “Leases”. The lessor will continue to classify leases under the same principles of the current standard as operating or financial leases.The standard is effective for periods beginning on or after January 1, 2019, with earlier adoption permitted if IFRS 15 “Revenue from Contracts with Customers” has also been applied.IFRS 16 sets out a number of practical expedients for the transition, both for the lease definition and for the retrospective application. The Group has not yet decided whether to use any or all of the practical expedients.The Group is currently conducting an initial assessment of the potential impact of IFRS 16 on its consolidated financial statements. The quantitative effect will depend, among other things, on the chosen transition method, on the extent of practical expedients and recognition exemptions utilized, and on any additional lease that the Group may enter into in the future. The Group plans to disclose its transition method and quantitative information before the application date.New Interpretations and Amendments to StandardsEffective dateRecognition of Deferred Tax Assets for Unrealized Losses (Amendments to IAS 12)The amendments to IAS 12 “Income Tax” aim to clarify the accounting of deferred tax assets arising from unrealized losses related to debt instruments measured at fair value.Annual periods beginning on or after January 1, 2017Disclosure Initiative (Amendments to IAS 7)The amendments to IAS 7 “Statement of Cash Flows” are part of the IASB's initiative to improve the presentation and disclosure of information in the financial statements. These modifications introduce additional disclosure requirements to the cash flow statement.Annual periods beginning on or after January 1, 2017Annual Improvements to IFRS Standards 2014-2016 CycleAnnual improvements correspond to a series of minor amendments clarifying, correcting or eliminating redundancy in the following standards: IFRS 1 “First-time Adoption of IFRS”, IFRS 12 “Disclosures of Interests in Other Entities” and IAS 28 “Investments in Associates and Joint Ventures”.The amendments to IFRS 1 and IAS 28 are effective for annual periods beginning on or after January 1, 2018. The amendment to IFRS 12 for annual periods beginning on or after January 1, 2017.IFRIC 22 “Foreign Currency Transactions and Advance Consideration”Annual periods beginning on or after January 1, 2018This interpretation addresses determination of the transaction date for the purpose of establishing the exchange rate to be used in foreign currency transactions when the consideration is paid or received before recognizing related revenues, expenses or assets.Classification and Measurement of Share-based Payment Transactions (Amendments to IFRS 2)These amendments specify accounting requirements for: (i) performance conditions for cash-settled share-based payments;(ii) the classification of withholding tax obligations for share-based payment transactions with net settlement features; and (iii) the accounting for modifications of share-based payment transactions from cash-settled to equity-settled.Annual periods beginning on or after January 1, 2018Transfers of Investment Property (Amendments to IAS 40)The IASB issued this amendment to clarify that a change in management’s intentions for the use of a property by itself does not constitute evidence of a change in use and is not a sufficient reclassification criteria.Annual periods beginning on or after January 1, 2018Sale or Contribution of Assets between an Investor and its Associate or Joint Venture (Amendments to IFRS 10 and IAS 28)The amendment corrects an inconsistency between IFRS 10 “Consolidated Financial Statements” and IAS 28 “Investments in Associates and Joint Ventures” with respect to the accounting treatment of the sale or contributions between an investor and its associate or joint venture.The IASB decided to defer the date of effective implementation of this amendment indefinitely, pending the outcome of its research project on the method of participation.Effective date deferred indefinitelyIn Management’s opinion, the application of IFRIC 22 and amendments is not expected to have a significant effect on the consolidated financial statements of the Group.Management is responsible for the information contained in these consolidated financial statements and expressly states that all IFRS principles and standards, as issued by the IASB, have been fully implemented.In preparing the consolidated financial statements, certain judgments and estimates made by the Company’s Management have been used to quantify some of the assets, liabilities, revenue, expenses and commitments recognized in the statements.The most important areas that have required professional judgment are:-The identification of Cash Generating Units (CGU) for impairment testing (see Note 3.d).-The hierarchy of information used to value assets and liabilities measured at fair value (see Note 3.g).These estimates refer basically to:-The valuations performed to determine the existence of impairment losses in assets and goodwill (see Note 3.d).-The assumptions used to calculate the actuarial liabilities and obligations with employees, such as discount rates, mortality tables, salary increases, etc. (see Notes 3.l.1 and 23).-The assumptions used to calculate the fair value of financial instruments (see Notes 3.g and 20).-Certain assumptions inherent in the electricity system affecting transactions with other companies, such as production, customer billings, energy consumption, etc. that allow for estimating electricity system settlements that must occur on the corresponding final settlement dates, but that are pending as of the date of issuance of the consolidated financial statements and could affect the balances of assets, liabilities, income and expenses recognized in the statements (see Appendix 6.2).-The probability that uncertain or contingent liabilities will be incurred and their related amounts (see Note 3.l).-Future disbursements for the closure of facilities and restoration of land, as well as the discount rates to be used (see Note 3.a).-The tax results of the various subsidiaries of the Group that will be reported to the respective tax authorities in the future, and that have been used as the basis for recording different balances related to income taxes in these consolidated financial statements (see Note 3.o).-The fair values of assets acquired and liabilities assumed, and any pre-existing interest in the Company acquired in a business combination.Although these judgments and estimates have been based on the best information available as of the issuance date of these consolidated financial statements, future events may occur that would require a change (increase or decrease) to these judgments and estimates in subsequent periods. This change would be made prospectively, recognizing the effects of this change of judgments and estimates in the corresponding future consolidated financial statements.Subsidiaries are defined as entities that are controlled either directly or indirectly by the Group. Control is achieved when the following conditions are met: the Company has i) power over the subsidiary; ii) is exposed, or has rights to variable returns from its involvement with the subsidiary; and iii) has the capacity to use its power to affect its returns.The Group has power over its subsidiaries when it holds the majority of the substantive voting rights or when it has less than a majority of the voting rights, and those rights are sufficient to give it the practical ability to direct the relevant activities of the subsidiary unilaterally. The Group will reassess whether or not it controls a subsidiary if facts and circumstances indicate that there are changes to one or more of the elements of control listed above.As described in Note 2.7, subsidiaries are consolidated by applying full integration method.Appendix 1 to these consolidated financial statements, entitled “Group Companies”, describes the relationship of the Company with each of its subsidiaries.2.4.1Changes in the scope of consolidationOn March 1, 2016, as part of the corporate reorganization and as a result of the spin-off described in Note 4.2, the Group distributed to owners all of the shares of Endesa Américas S.A., to which the companies associated with the generation business outside of Chile, which are detailed in Appendix 2, had been assigned. The impact of this transaction on the consolidated financial statements as of December 31, 2016 is described in Note 4.2.On January 9, 2015, the Company, together with its subsidiary Compañía Eléctrica Tarapacá S.A., sold 100% of the shares of its subsidiary Sociedad Concesionaria Túnel El Melón S.A., for the amount of ThCh$ 25,000,000 (see Notes 7.e and 30).The disposal of Sociedad Concesionaria Túnel El Melón S.A. from the consolidation scope of the Group led to a reduction in the consolidated statement of financial position of ThCh$ 871,022 in current assets, ThCh$ 7,107,941 in non-current assets, ThCh$ 3,700,546 in current liabilities and ThCh$ 1,789,703 in non-current liabilities (see Note 4.3).During 2014, Inversiones GasAtacama Holding Ltda. came within the Group’s scope of consolidation as a result of the Company’s acquisition of an additional 50% interest in that company on April 22, 2014 (see Note 6 and Appendix 1).The inclusion of Inversiones GasAtacama Holding Ltda. in the Group’s scope of consolidation brought about an increase in the consolidated statement of financial position of ThCh$ 198,924,289 in current assets, ThCh$ 221,471,415 in non-current assets, ThCh$ 69,989,919 in current liabilities and ThCh$ 35,672,488 in non-current liabilities.2.4.2Unconsolidated companies with an ownership interest of over 50%Although the Group holds more than a 50% ownership interest in Centrales Hidroeléctricas de Aysén S.A., it is considered a “joint venture” since the Group, through contracts or agreements with shareholders, exercises joint control of the company.2.4.3Consolidated companies with an ownership interest of less than 50%Although the Group held a 26.87% ownership in the company Empresa Generadora de Energía Eléctrica S.A. E.S.P. (hereinafter “Emgesa” or “Emgesa S.A.E.S.P.”), which was classified as a discontinued operation as of December 31, 2015, this entity was considered a subsidiary because the Group exercised control over the entity through contracts or agreements with shareholders, or as a consequence of its structure, composition and shareholder classes. The Group held 56.43% of the voting rights of Emgesa until the effective date of the spin-off (see Note 4.2).Associated companies are those entities in which the Group, either directly or indirectly, exercises significant influence.Significant influence is the power to participate in the financial and operational policy decisions of the investee but does not control or have joint control over these policies. In the evaluation of the existence of significant influence, the Group considers potential voting rights (held either by the Company or by another Group entity) exercisable or convertible at the closing date of each period. In general, if the Group holds 20% or more of the voting power of an investee, it is presumed that the Group has significant influence over an investee.Associates are accounted for under equity method as described in Note 3.h.Appendix 3 to these consolidated financial statements, entitled “Associated Companies and Joint Ventures”, describes the relationship of the Company and each of these companies.Joint arrangements are those agreements in which the Group exercises joint control. Joint control is the contractually agreed sharing of control of an arrangement, which exists only when decisions about the entities’ relevant activities require the unanimous consent of the parties sharing control.Depending on the rights and obligations of the participants, joint agreements are classified as:-Joint venture: an agreement whereby the parties exercising joint control have rights to the net assets of the arrangement.-Joint operation: an agreement whereby the parties exercising joint control have rights to the assets and obligations for the liabilities relating to the arrangement. At the end of the reporting period, the Group does not have any joint arrangements that qualify as joint operations.In order to determine the type of joint agreement that results from a contractual agreement, Management evaluates the legal structure and form of the agreement, the terms agreed by the parties, as well as other relevant facts and circumstances. In the event of changes in the contractual elements of a joint agreement, these relevant facts and circumstances are re-evaluated.Appendix 3 to these consolidated financial statements, entitled “Associated Companies and Joint Ventures”, describes the relationship of the Company and each of these companies.The subsidiaries are consolidated and all their assets, liabilities, revenues, expenses, and cash flows are included in the consolidated financial statements once the adjustments and eliminations from intra-group transactions have been made.The comprehensive income of subsidiaries is included in the consolidated statement of comprehensive income from the date that the Parent Company gains control of the subsidiary until the date when it ceases to control the subsidiary.The operations of the Parent Company and its subsidiaries have been consolidated under the following basic principles:1.At the date the Parent obtains control, the identifiable assets acquired and liabilities assumed are recognized at their fair value, except for certain assets and liabilities that are recognized using valuation principles established in other IFRS standards. Goodwill is recognized as the excess of the sum of the consideration transferred and the amount of any non-controlling interests in the acquiree over the fair value of the net assets acquired and liabilities assumed. In the case when the net of the acquisition-date amounts of the identifiable assets acquired and liabilities assumed exceeds the sum of the consideration transferred and the amount of any non-controlling interests in the acquiree, the excess after reassessment is recognized immediately in profit or loss as a bargain purchase gain.For each business combination, the Group chooses whether to value the non-controlling interests in an acquired company at fair value or at the proportional share of the net identifiable assets acquired.If it is not possible to determine the fair value of all assets acquired and liabilities assumed at the acquisition date, the Group will report the provisional amounts for the items for which the accounting is incomplete. Those provisional amounts are adjusted retrospectively during the measurement period (which cannot exceed one year from the acquisition date), or additional assets or liabilities are recognized, to reflect new information obtained about facts and circumstances that existed at the acquisition date that, if known, would have affected the amounts recognized at that date.For business combinations achieved in stages, the Company’s previously held equity interest in the acquiree is remeasured to its acquisition-date fair value and the resulting gain or loss, if any, is recognized in profit or loss.2.Non-controlling interests in equity and in comprehensive income of the subsidiaries are presented, respectively, under the line items “Total Equity: Non-controlling interests” in the consolidated statement of financial position and “Net profit attributable to non-controlling interests” and “Comprehensive income (loss) attributable to non-controlling interests” in the consolidated statement of comprehensive income.3.The financial statements of the Group companies with functional currencies other than the Chilean peso are translated as follows:a.For assets and liabilities the prevailing closing exchange rate is used.b.For items of the comprehensive income, the average exchange rate for the period is used (unless this average is not a reasonable approximation of the cumulative effect of the exchange rates in effect on the dates of the transactions, in which case the exchange rate in effect on the date of each transaction is used).c.For equity accounts the historical exchange rate from the date of acquisition or contribution is used, and retained earnings are translated at the average exchange rate at the date of origination.d.Exchange differences arising in translation of financial statements are recognized in the item “Foreign currency translation losses, net” in other comprehensive income (see Note 24.2).4.The balances and transactions between consolidated companies were eliminated in full upon consolidation.5.Changes in the ownership interests in subsidiaries that do not result in the Group taking or losing control are accounted for as equity transactions. The carrying amounts of the controlling and non-controlling interests are adjusted to reflect the changes in their relative interests in the subsidiaries. Any difference between the amount by which the non-controlling interests are adjusted and the fair value of the consideration paid or received is recognized directly in equity attributable to the shareholders of the Parent.6.Business combinations between entities under common control are accounted for using, as a reference, the ‘pooling of interest’ method. Under this method, the assets and liabilities involved in the transaction remain reflected at the same carrying amounts at which they were recognized in the ultimate controlling company, although subsequent accounting adjustments may need to be made to align the accounting policies of the companies involved.Any difference between assets and liabilities contributed to the consolidation and the consideration paid is recorded directly in equity, as a charge or credit to “Other reserves”. The Company does not restate comparative periods in its financial statements for business combinations under common control.The principle accounting policies used in preparing the accompanying consolidated financial statements are the following:Property, plant and equipment are measured at acquisition cost, net of accumulated depreciation and any impairment losses they may have experienced. In addition to the price paid to acquire each item, the cost also includes, where applicable, the following:-Financing expenses accrued during the construction period that are directly attributable to the acquisition, construction, or production of qualified assets, which require a substantial period of time before being ready for use such as, for example, electricity generation or distribution facilities. The Group defines “substantial period” as one that exceeds 12 months. The interest rate used is that of the specific financing or, if none exists, the weighted average financing rate of the company carrying out the investment (see Note 16.d.1).-Employee expenses directly related to construction in progress (see Note 16.d.2).-Future disbursements that the Group will have to make to close their facilities are incorporated into the value of the asset at fair value, recording in the accounting the corresponding provision for dismantling or restoration. The Group reviews its estimate of these future disbursements on a yearly basis, increasing or decreasing the value of the asset based on the results of this estimate (see Note 22).Items for construction work in progress are transferred to operating assets once the testing period has been completed and they are available for use, at which time depreciation begins.Expansion, modernization or improvement costs that represent an increase in productivity, capacity or efficiency, or a longer useful life are capitalized as increasing the cost of the corresponding assets.The replacement or overhaul of entire components that increase the asset’s useful life or economic capacity are recognized as an increase in cost for the respective assets, derecognizing the replaced or overhauled components.Expenditures for periodic maintenance, conservation and repair are recognized directly as an expense for the period in which they are incurred.Property, plant and equipment, net of its residual value, is depreciated by distributing the cost of the different items that comprise it on a straight-line basis over its estimated useful life, which is the period during which the Group companies expect to use the assets. Useful life estimates and residual values are reviewed on an annual basis and if appropriate, adjusted prospectively.The following are the main categories of property, plant and equipment with their respective estimated useful lives:Categories of Property, plant and equipment Years of estimated useful lives Buildings10 – 50Plant and equipment10 – 65IT equipment3 – 15Fixtures and fittings2 – 35Motor vehicles5 – 10Additionally, the following provides greater detail of Property, plant and equipment Years of estimated useful lives Generating facilities:Hydroelectric plantsCivil engineering works10 – 65Electromechanical equipment10 – 40Coal / fuel plants25 – 40Combined cycle plants10 – 25Renewable energy power plants20Natural gas transport facilities:Pipelines20Land is not depreciated since it has an indefinite useful life.Gains or losses that arise from the sale or disposal of items of property, plant, and equipment are recognized as “Other gains, net” in the comprehensive income statement and are calculated by deducting the carrying amount of the asset and any sales expenses from the amount received in the sale.Goodwill arising from business combinations and represents the excess value of the consideration paid plus the amount of any non-controlling interests over the Group’s share of the net value of the assets acquired and liabilities assumed, measured at fair value as of the acquisition date. If the accounting for a business combination is completed, as well as the determination of goodwill, after the end of the reporting period in which the combination occurs, the amounts previously reported presented are adjusted, for comparative purposes, to include the value of the assets acquired and liabilities assumed and the value of the final goodwill as of acquisition date (see Note 2.7.1). Goodwill arising from acquisition of entities with functional currencies other than the Chilean peso is measured in the functional currency of the acquired company and translated to Chilean pesos using the closing exchange rate.Goodwill is not amortized; instead, at the end of each reporting period or when there are indicators that an impairment might have occurred, the Company estimates whether any impairment loss has reduced its recoverable amount to an amount less than the carrying amount and, if so, it impairment loss is immediately recognized in profit or loss (see Note 3.d). Intangible assets are initially recognized at their acquisition cost or production cost, and are subsequently measured at their cost, net of their accumulated amortization and impairment losses they may have experienced. Intangible assets are amortized on a straight line basis during their useful lives, starting from the date when they are ready for use, except for those with an indefinite useful life, which are not amortized.The criteria for recognizing these assets impairment losses and, if applicable, recovery of impairment losses recognized in previous periods are explained in Note 3.d below.An intangible asset is derecognized on disposal, or when no future economic benefits are expected from use or disposal.Gains or losses arising from derecognition of an intangible asset, measured as the difference between the net disposal proceeds and the carrying amount of the asset, are recognized in profit or loss when the asset is derecognized.c.1) Research and development expensesThe Group recognizes the costs incurred in a project’s development phase as intangible assets in the statement of financial position as long as the project’s technical feasibility and future economic benefits have been demonstrated. Expenditures on research activities are recognized as an expense in the year in which they are incurred.c.2) Other intangible assetsOther intangible assets correspond to computer software, water rights, and easements. They are initially recognized at acquisition or production cost and are subsequently measured at cost less accumulated amortization and impairment losses, if any.Computer software is amortized (on average) over four years. Easements and water rights have indefinite useful lives and, therefore, are not amortized.During the period, and principally at the end of each reporting period, the Company evaluates whether there is any indication that an asset has been impaired. If any such indication exists, the Company estimates the recoverable amount of that asset to determine the amount of the impairment loss. In the case of identifiable assets that do not generate cash flows independently, the Company estimates the recoverable amount of the Cash Generating Unit (CGU) to which the asset belongs, which is understood to be the smallest identifiable group of assets that generates independent cash inflows. Notwithstanding the preceding paragraph, in the case of CGUs to which goodwill or intangible assets with indefinite useful lives have been allocated, a recoverability analysis is performed routinely at each period end.Recoverable amount is the higher of fair value less costs of disposal and value in use, which is defined as the present value of the estimated future cash flows. In order to calculate the recoverable amount of Property, plant and equipment as well as
Years of goodwill, and intangible assets, the Company uses value-in-use criteria in practically all cases.
To estimate value in use, the Group prepares future pre-tax cash flow projections based on the most recent budgets available. These budgets incorporate management’s best estimates of a CGUs’ revenue and costs using sector projections, past experience and future expectations.
In general, these projections cover the next five years, estimating cash flows for subsequent years by applying reasonable growth rates which, in no case, are increasing rates nor exceed the average long-term growth rates for the particular sector and country in which the Group operates. As of December 31, 2016 and 2015 future cash flows projections were extrapolated using the growth rate 4.6% and 4.5%, respectively.
Future cash flows are discounted to calculate their present value at a pre-tax rate that covers the cost of capital for the business activity and the geographic area in which it is being carried out. The time value of money and risk premiums generally used among analysts for the business activity and the geographic zone are taken into account to calculate the pre-tax rate. As of December 31, 2016 and 2015 the Group applied the pre-tax discount rate 12.2% and 12.7%, respectively, expressed in nominal terms.
If the recoverable amount of the CGU is estimated to be less than its carrying amount, an impairment loss is recognized in the consolidated statement of comprehensive income in the line item “Impairmentuseful lives
Generating facilities:
Hydroelectric plants
Civil engineering works
10 – 65
Electromechanical equipment
10 – 45
Coal / fuel plants
20 – 40
Combined cycle plants
10 – 25
Renewable energy power plants
20
Natural gas transport facilities:
Pipelines
20
Land is not depreciated since it has an indefinite useful life.
Gains or losses that arise from the sale or disposal of items of property, plant, and equipment are recognized as “Other gains (losses)” in the comprehensive income statement and are calculated by deducting the net carrying amount of the asset and any sales costs from the consideration received in the sale.
Goodwill arising from business combinations, and reflected upon consolidation, represents the excess value of the consideration paid plus the amount of any non-controlling interests over the Group’s share of the net value of the assets acquired and liabilities assumed, measured at fair value at the acquisition date. If the accounting for a business combination is completed within the following year after the acquisition date, and so is the goodwill determination, the entity recognizes the corresponding adjustments to the provisional amounts as if the accounting for the business combination had been completed at the acquisition date (see Note 2.7.1).
Goodwill arising from acquisition of companies with functional currencies other than the Chilean peso is measured in the functional currency of the acquired company and translated to Chilean pesos using the exchange rate effective as of the date of the statement of financial position.
Goodwill is not amortized; instead, at the end of each reporting period or when there are indicators that an impairment might have occurred, the Company estimates whether any impairment loss has reduced its recoverable amount to an amount less than the carrying amount and, if so, it impairment loss is immediately recognized in profit or loss (see Note 3.d).
c) Intangible assets other than goodwill
Intangible assets are initially recognized at their acquisition cost or production cost, and are subsequently measured at their cost, net of their accumulated amortization and impairment losses they may have experienced.
Intangible assets are amortized on a straight line basis during their useful lives, starting from the date when they are ready for use, except for those with an indefinite useful life, which are not amortized. As of December 31, 2018 and 2017, there are no significant amounts in intangible assets with an indefinite useful life.
An intangible asset is derecognized on disposal, or when no future economic benefits are expected from use or disposal.
Gains or losses arising from derecognition of an intangible asset, measured as the difference between the net disposal proceeds and the carrying amount of the asset, are recognized in profit or loss when the asset is derecognized.
The criteria for recognizing these assets’ impairment losses and, if applicable, recovery of impairment losses recorded in previous periods are explained in Note 3.d below.
c.1) Research and development expenses
The Group recognizes the costs incurred in a project’s development phase as intangible assets in the statement of financial position as long as the project’s technical feasibility and future economic benefits have been demonstrated.
Expenditures on research activities are recognized as an expense in the period in which they are incurred.
c.2) Other intangible assets
Other intangible assets correspond to computer software, water rights, and easements. They are initially recognized at acquisition or production cost and are subsequently measured at cost less accumulated amortization and impairment losses, if any.
Computer software is amortized (on average) over four years. Easements and water rights have indefinite useful lives and, therefore, are not amortized.
d) Impairment of non-financial assets
During the period, and principally at the end of each reporting period, the Company evaluates whether there is any indication that an asset has been impaired. If any such indication exists, the Company estimates the recoverable amount of that asset to determine the amount of the impairment loss. In the case of identifiable assets that do not generate cash flows independently, the Company estimates the recoverable amount of the Cash Generating Unit (CGU) to which the asset belongs, which is understood to be the smallest identifiable group of assets that generates independent cash inflows.
Notwithstanding the preceding paragraph, in the case of CGUs to which goodwill or intangible assets with indefinite useful lives have been allocated, a recoverability analysis is performed routinely at each period end.
Recoverable amount is the higher of fair value less costs of disposal and value in use, which is defined as the present value of the estimated future cash flows. In order to calculate the recoverable amount of Property, plant, and equipment, as well as of goodwill, and intangible assets, the Company uses value-in-use criteria in practically all cases.
To estimate value in use, the Group prepares future pre-tax cash flow projections based on the most recent budgets available. These budgets incorporate management’s best estimates of a CGUs’ revenue and costs using sector projections, past experience and future expectations.
In general, these projections cover the next five years, estimating cash flows for subsequent years by applying reasonable growth rates which, in no case, are increasing rates nor exceed the average long-term growth rates
for the particular sector and country in which the Group operates. As of December 31, 2018 future cash flows projections were extrapolated using the growth rate 3.1%.
Future cash flows are discounted to calculate their present value at a pre-tax rate that covers the cost of capital for the business activity and the geographic area in which it is being carried out. The time value of money and risk premiums generally used among analysts for the business activity and the geographic zone are taken into account to calculate the pre-tax rate. As of December 31, 2018, the Group applied the pre-tax discount rate 10.6%, expressed in nominal terms.
If the recoverable amount of the CGU is estimated to be less than its carrying amount, an impairment loss is recognized in the consolidated statement of comprehensive income in the line item “Reversal of impairment loss (impairment loss) recognized in profi or loss”. The impairment is first allocated to reduce the carrying amount of any goodwill allocated to the CGU, and then on a pro rata basis to the other carrying amount of each asset in the unit. The carrying amount of an asset is not reduced below the highest of fair value less costs of disposal, its value in use; or zero.
Impairment losses recognized for an asset (other than goodwill) in prior periods are reversed when there are indications that the impairment loss no longer exists or may have decreased, thus increasing the asset’s carrying amount with a credit to earnings. The increase in the asset’s carrying amount shall not exceed that carrying amount that would have been determined had no impairment loss been recognized for the asset. Goodwill impairment losses are not reversed in subsequent periods.
In order to determine whether an arrangement is, or contains, a lease, the Group assesses the economic substance of the agreement, in order to determine whether fulfillment of the arrangement depends on the use of a specific asset and whether the agreement conveys the right to use an asset. If both conditions are met, at the inception of the arrangement the Group separates the payments and other considerations relating to the lease, at their fair values, from those corresponding to other components of the agreement.
Leases that substantially transfer all the risks and rewards of ownership to the Group are classified as finance leases. All others leases are classified as operating leases.
Finance leases in which the Group acts as a lessee are recognized at the inception of the arrangement. At that time, the Group records an asset based on the nature of the lease and a liability for the same amount, equal to the fair value of the leased asset or the present value of the minimum lease payments, if the latter is lower. Subsequently, the minimum lease payments are apportioned between finance expenses and reduction of the lease obligation. Finance expenses are recognized immediately in the income statement and allocated over the lease term, so as to achieve a constant interest rate on the remaining balance of the liability. Leased assets are depreciated on the same terms as other similar depreciable assets, as long as there is reasonable certainty that the lessee will acquire ownership of the asset at the end of the lease. If no such certainty exists, the leased assets are depreciated over the shorter of the useful lives of the assets and their lease term.
In the case of operating leases, payments are recognized as an expense in the case of the lessee and as income in the case of the lessor, both on a straight-line basis, over the term of the lease unless another type of systematic basis of distribution is deemed more representative.
amount of each asset in the unit. The carrying amount of an asset is not reduced below the highest of fair value less costs of disposal, its value in use; or zero.
Impairment losses recognized for an asset (other than goodwill) in prior periods are reversed when there are indications that the impairment loss no longer exists or may have decreased, thus increasing the asset’s carrying amount with a credit to earnings. The increase in the asset’s carrying amount shall not exceed that carrying amount that would have been determined had no impairment loss been recognized for the asset. Goodwill impairment losses are not reversed in subsequent periods.
In order to determine whether an arrangement is, or contains, a lease, the Group assesses the economic substance of the agreement, in order to determine whether fulfillment of the arrangement depends on the use of a specific asset and whether the agreement conveys the right to use an asset. If both conditions are met, at the inception of the arrangement the Group separates the payments and other considerations relating to the lease, at their fair values, from those corresponding to other components of the agreement.
Leases that substantially transfer all the risks and rewards of ownership to the Group are classified as finance leases. All others leases are classified as operating leases.
Finance leases in which the Group acts as a lessee are recognized at the inception of the arrangement. At that time, the Group records an asset based on the nature of the lease and a liability for the same amount, equal to the fair value of the leased asset or the present value of the minimum lease payments, if the latter is lower. Subsequently, the minimum lease payments are apportioned between finance expenses and reduction of the lease obligation. Finance expenses are recognized immediately in the income statement and allocated over the lease term, so as to achieve a constant interest rate on the remaining balance of the liability. Leased assets are depreciated on the same terms as other similar depreciable assets, as long as there is reasonable certainty that the lessee will acquire ownership of the asset at the end of the lease. If no such certainty exists, the leased assets are depreciated over the shorter of the useful lives of the assets and their lease term.
In the case of operating leases, payments are recognized as an expense in the case of the lessee and as income in the case of the lessor, both on a straight-line basis, over the term of the lease unless another type of systematic basis of distribution is deemed more representative.
Financial instruments are contracts that give rise to both a financial asset in one entity and a financial liability or equity instrument in another entity.
f.1) Financial assets other than derivatives
The Group classifies its non-derivative financial assets, whether permanent or temporary, excluding investments accounted for using the equity method (see Notes 3.h and 14) and non-current assets and disposal groups held for sale (see Note 3.j), into three categories.
·Amortized cost: This category includes the financial assets that meet the following conditions (i) the business model that supports it aims to maintain the financial assets to obtain the contractual cash flows, and (ii) the contractual terms of financial assets give rise on specific dates to cash flows that are solely payments of principal and interest (SPPI criterion).
Financial assets that meet the conditions established in IFRS 9, to be valued at amortized cost in the Group are: accounts receivable, loans and cash equivalents. These assets are recorded at amortized cost, which is the initial fair value , less repayments of principal, plus uncollected accrued interest, calculated using the effective interest rate method.
The effective interest rate method is a method of calculating the amortized cost of a financial asset or a financial liability (or a group of financial assets or financial liabilities) and allocating the finance income or financial expenses throughout the relevant period. The effective interest rate is the discount rate that exactly matches the estimated cash flows to be received or paid over the expected useful life of the financial instrument (or, when appropriate, in a shorter period of time), with the net carrying amount of the financial asset or financial liability.
·Financial Assets Recorded at Fair Value through Other Comprehensive Income: This category includes the financial assets that the meet the following conditions: (i) they are classified in a business model, the purpose of which is to maintain the financial assets both to collect the contractual cash flows and to sell them, and (ii) the contractual conditions comply with the SPPI criterion.
These investments are recognized in the consolidated statement of financial position at fair value when it is possible to determine reliably. In the case of holding in unlisted companies or companies with low liquidity, it is usually not possible to determine the fair value reliably. Thefore, when this circumstance occurs, such holdings are valued at their acquisition cost or for lower amount if there is evidence of their impairment.
Changes in fair value, net of their tax, effect, are recorded in the consolidated statement of comprehensive income: Other comprehensive income, until such time as the disposal of these investments lakes place, at which time the accumulated amount in this section is fully posted in the profit or loss for the period.
In the event that the fair value is lower than the acquisition cost, if there is objective evidence that the asset has suffered an impairment that cannot be considered as temporary, the difference is recorded directly in the losses for the period.
·Financial Assets Recorded at Fair Value through Profit or Loss: This category includes the trading portfolio of the financial assets that have been allocated as such upon their initial recognition and which are administered and assessed according to the fair value criterion, and the financial assets that do not meet the conditions to be classified in the two above categories.
They are valued at fair value in the consolidated statement of financial position and any changes in value are recorded directly in profit or loss when they occur.
f.2) Cash and cash equivalents
This item within the consolidated statement of financial position includes cash and bank balances, time deposits with original maturity of less than or equal to 90 days, and other highly liquid investments (with original
maturity of less or equal to 90 days) that are readily convertible to cash and are subject to insignificant risk of changes in value.
f.3) Impairment of financial assets
Under IFRS 9, the Group applies an impairment model based on expected credit losses. The new impairment model is applied to financial assets measured amortized cost and those measured at fair value through other comprehensive income, except for investments in equity instruments.
Under IFRS 9, the allowance for impairment losses are measured based on:
· 12 months expected credit losses; or
· Lifetime expected credit losses if the credit risk of a financial asset at the reporting date has increased significantly since initial recognition.
The Group applies a simplified approach for trade receivables, contract assets and lease receivables so that the impairment is always recognized in reference to the lifetime expected credit losses for the asset.
f.4) Financial liabilities other than derivatives
Financial liabilities are recognized based on cash received, net of any costs incurred in the transaction. In subsequent periods, these obligations are measured at their amortized cost using the effective interest method (see Note 3.f.1).
In the particular case that a liability is the hedged item in a fair value hedge, as an exception, such liability is measured at its fair value for the portion of the hedged risk.
In order to calculate the fair value of debt, both when it is recognized in the statement of financial position and for fair value disclosure purposes as shown in Note 21, debt has been divided into fixed interest rate debt (hereinafter “fixed-rate debt”) and variable interest rate debt (hereinafter “floating-rate debt”). Fixed-rate debt is that on which fixed-interest coupons established at the beginning of the transaction are paid explicitly or implicitly over its term. Floating-rate debt is that debt issued at a variable interest rate, i.e., each coupon is established at the beginning of each period based on the reference interest rate. All debt has been measured by discounting expected future cash flows with a market interest rate curve based on the payment currency.
f.5) Derivative financial instruments and hedge accounting
Derivatives held by the Group are transactions entered into to hedge interest and/or exchange rate risk, intended to eliminate or significantly reduce these risks in the underlying transactions being hedged.
Derivatives are recognized at fair value at the end of each reporting period as follows: if their fair value is positive, they are recognized within “Other financial assets”; and if their fair value is negative, they are recognized within “Other financial liabilities”. For derivatives on commodities, the positive fair value is recognized in “Trade and other receivables”, and negative fair values are recognized in “Trade and other payables”.
Changes in fair value are recognized directly in profit or loss, except when the derivative has been designated for hedge accounting purposes as a hedge instrument (in a cash flow hedge) and all of the conditions for
applying hedge accounting established by IFRS are met, including that the hedge be highly effective. In this case, changes are recognized as follows:
·Fair value hedges: The underlying portion for which the risk is being hedged (hedged risk) and the hedge instrument are measured at fair value, and any changes in value of both items are recognized in the consolidated statement of comprehensive income by offsetting the effects in the same comprehensive income statement account.
·Cash flow hedges: Changes in the fair value of the effective portion of the hedged item and hedge instrument are recognized in other comprehensive income and accumulated in an equity reserve known as “Reserve for cash flow hedges”. The cumulative loss or gain in this reserve is transferred to the consolidated statement of comprehensive income to the extent that the hedged item impacts the consolidated statement of comprehensive income because of the hedged risk, offsetting the effect in the same comprehensive income statement account. Gains or losses from the ineffective portion of the hedging relationship are recognized directly in the consolidated statement of comprehensive income.
Hedge accounting is discontinued only when the hedging relationship (or a part of the relationship) fails to meet the required criteria, after making any rebalancing of the hedging relationship, if applicable. If it is not possible to continue the hedging relationship, including when the hedging instrument expires, is sold, settled or exercised, any gain or loss accumulated in equity at that date remains in the equity until the projected transaction affects the statement of income. When a projected transaction is no longer expected to occur, the gain or loss accumulated in equity is immediately transferred to the income statement.
As a general rule, long-term commodity purchase or sale agreements are recognized in the consolidated statement of financial position at their fair value at the end of each reporting period, recognizing any differences in value directly in profit or loss, except for, when all of the following conditions are met:
· The sole purpose of the agreement is for its own use, which is understood as: (i) in the case of fuel purchase agreements its used to generate electricity; (ii) in the case of electrical energy purchased for sale, its sale to the end-customers; and, (iii) in the case of electricity sales its sale to the end-customers.
· The Group’s future projections evidence the existence of these agreements for its own use.
· Past experience with agreements evidence that they have been utilized for its own use, except in certain isolated cases when for exceptional reasons or reasons associated with logistical issues have been used beyond the control and projection of the Group.
· The agreement does not stipulate settlement of differences and the parties have not made it a practice to settle similar contracts with differences in the past.
The long-term commodity purchase or sale agreements maintained by the Group, which are mainly for electricity, fuel, and other supplies, meet the conditions described above. Thus, the purpose of fuel purchase agreements is to use them to generate electricity, electricity purchase contracts are used to sell to end-customers, and electricity sale contracts are used to sell its own products.
The Group also evaluates the existence of derivatives embedded in contracts or financial instruments to determine if their characteristics and risk are closely related to the principal contract, provided that when taken as a whole they are not being accounted for at fair value. If they are not closely related, they are recognized separately and changes in value are accounted for directly in the statement of comprehensive income.
f.6) Derecognition of financial assets and liabilities
Financial assets are derecognized when:
· The contractual rights to receive cash flows from the financial asset expire or have been transferred or, if the contractual rights are retained, the Company has assumed a contractual obligation to pay these cash flows to one or more recipients.
· The Group has substantially transferred all the risks and rewards of ownership of the financial asset, or, if it has neither transferred nor retained substantially all the risks and rewards, when it does not retain control of the financial asset.
Transactions in which the Group retains substantially all the inherent risks and rewards of ownership of the transferred asset, it continues recognizing the transferred asset in its entirety and recognizes a financial liability for the consideration received. Transactions costs are recognized in profit and loss by using the effective interest method (see Note 3.f.1).
Financial liabilities are derecognized when they are extinguished, that is, when the obligation arising from the liability has been paid or cancelled, or has expired.
f.7) Offsetting of financial assets and liabilities
The Group offsets financial assets and liabilities, and the net amount is presented in the statement of financial position only when:
· there is a legally binding right to offset recognized amounts; and
· the company intends to settle them on a net basis, or to simultaneously realize the asset and settle the liability.
The right of offset may only be legally enforceable in the normal course of business, or in the event of default, or in the event of insolvency or bankruptcy, of one or all of the counterparties.
f.8) Financial guarantees
The financial guarantee contracts, defined as the guarantees issued by the Company and its subsidiaries to third parties, are initially measured at their fair value, adjusted for transaction costs that are directly attributable to the issuance of the guarantee.
Subsequent to initial recognition, financial guarantee contracts are recognized at the higher of:
· The amount determined in accordance with the accounting policy in Note 3.l; and
· The amount initially recognized less, when appropriate, cumulative amortization recognized in accordance with the revenue recognition policies described in Note 3.p.
The fair value of an asset or liability is defined as the price that would be received from the sale of an asset or paid to transfer a liability in an orderly transaction between market participants at the measurement date.
Fair value measurement assumes that the transaction to sell an asset or transfer a liability occurs in the principal market, namely, the market with the greatest volume and level of activity for that asset or liability. In the
absence of a principal market, it is assumed that the transaction is carried out in the most advantageous market available to the entity, namely, the market that maximizes the amount that would be received to sell the asset or minimizes the amount that would be paid to transfer the liability.
In estimating fair value, the Group uses valuation techniques that are appropriate for the circumstances and for which there is sufficient data to conduct the measurement, maximizes the use of relevant observable data and minimizes the use of unobservable data.
Given the hierarchy of the entry data used in the valuation techniques, assets and liabilities measured at fair value can be classified at the following levels:
Level 1: Quoted prices (unadjusted) in active markets for identical assets or liabilities;
Level 2: Inputs other than quoted prices included within Level 1 that are observable for the assets or liabilities, either directly (i.e. as prices) or indirectly (i.e. derived from prices). The methods and assumptions used to determine the fair values at Level 2 by type of financial assets or financial liabilities take into consideration estimated future cash flows discounted at market rates. Future cash flows for financial assets and financial liabilities are discounted with the zero coupon interest rate curves for each currency (these valuations are carried out using external tools such as Bloomberg); and
Level 3: Inputs for assets or liabilities that are not based on observable market data (unobservable inputs).When measuring fair value, the Group takes into account the characteristics of the asset or liability, particularly:
· For non-financial assets, fair value measurement takes into account the ability of a market participant to generate economic benefits by using the asset in its highest and best use or by selling it to another market participant that would use the asset in its highest and best use;
· For liabilities and equity instruments, the fair value measurement assumes that the liability would not be settled and an equity instrument would not be cancelled or otherwise extinguished on the measurement date. The fair value of the liability reflects the effect of non-performance risk, namely, the risk that an entity will not fulfill the obligation, which includes, but is not limited to, the Company’s own credit risk;
· For derivatives not traded on active markets, the fair value is determined by using the discounted cash flow method and generally accepted options valuation models, based on current and future market conditions as of the close of the financial statements. This methodology also adjusts the value based on the Company’s own credit risk (Debt Valuation Adjustment, DVA), and the counterparty risk (Credit Valuation Adjustment, CVA). These CVA and DVA adjustments are measured on the basis of the potential future exposure of the instrument (creditor or borrower position) and the risk profile of both the counterparties and the Group itself;
· For financial assets and financial liabilities with offsetting positions in market risks or counterparty credit risks, it is permitted to measure the fair value on a net basis. However, this must be consistent with the manner in which market participants would price the net risk exposure at the measurement date.
Financial assets and liabilities measured at fair value are presented in Note 21.
h) Investments accounted for using the equity method
The Group’s interests in joint ventures and associates are recognized using the equity method.
Under the equity method, an investment in an associate or joint venture is initially recognized at cost. As of the acquisition date, the investment is recognized in the statement of financial position based on the share of its
equity that the Group’s interest represents in its capital, adjusted for, if appropriate, the effect of transactions with subsidiaries plus any goodwill generated in acquiring the company. If the resulting amount is negative, zero is recognized for that investment in the statement of financial position, unless the Group has a present obligation (either legal or implicit) to support the company’s negative equity position, in which case a provision is recognized.
Goodwill from the associate or joint venture is included in the carrying amount of the investment. It is not amortized but is subject to impairment testing as part of the overall investment carrying amount when there are indicators of impairment.
Dividends received from these companies are deducted from the value of the investment, and any profit or loss obtained from them to which the Group is entitled based on its interest is recognized under “Share of profit (loss) of investments accounted for using equity method”.
Appendix 3 “Associates and Joint Ventures” to these consolidated financial statements, describes the relationship of the Company with each of these companies.
Inventories are measured at their weighted average acquisition cost or the net realizable value, whichever is lower. Net realizable value is the estimated selling price in the ordinary course of business less the estimated costs of completion and the estimated costs necessary to make the sale.
The cost of inventories includes all costs of purchase and all necessary costs incurred in bringing the inventories to their present location and condition. Trade discounts, rebates and other similar items are deducted in determining the costs of purchase.
j) Non-current assets and disposal groups and liabilities associated held for sale or distribution to owners and discontinued operations
Non-current assets (including property, plant and equipment, intangible assets, investments accounted for using the equity method and joint ventures) and disposal groups (a group of assets to be disposed of and the liabilities directly associated with those assets) are classified as:
· held for sale if their carrying amount will be recovered principally through a sale transaction rather than through continuing use; or
· held for distribution to owners when the entity is committed to distribute the assets (or disposal groups) to the owners.
For this to be the case, the assets must be available for immediate sale or distribution in their present condition and the sale or distribution must be highly probable. For the sale or distribution to be highly probable, actions to complete the sale or distribution must have been initiated and should be expected to be completed within one year from the date of classification.
Actions required to complete the sale or distribution should indicate that it is unlikely that significant changes to the sale or distribution will be made or that the sale or distribution will be withdrawn. The probability of shareholders’ approval (if required in the jurisdiction) should be considered as part of the assessment of whether the sale or distribution is highly probable.
Non-current assets or disposal groups held-for-sale or held for distribution to owners are measured at the lower of their carrying amount and fair value less costs to sell or costs to distribute, as appropriate.
Depreciation and amortization on these assets cease when they meet the criteria to be classified as non-current assets held for sale or held for distribution to owners.
Assets that are no longer classified as held for sale or held for distribution to owners, or are no longer part of a disposal group, are measured at the lower of their carrying amounts before being classified as held for sale or held for distribution less any depreciations, amortizations or revaluations that would have been recognized if they had not been classified as held for sale or held for distribution to owners and their recoverable amount at the date of subsequent decision where would be reclassified as non-current assets.
Non-current assets held for sale or held for distribution to owners and the components of the disposal groups classified as held for sale or held for distribution to owners are presented in the consolidated statement of financial position as a line item entitled “Non-current assets and disposal groups held for sale or distribution to owners”, and the respective liabilities are presented as a line item entitled “Liabilities associated with disposal groups held for sale or distribution to owners”.
The Group classifies as discontinued operations those component of the Group that either have been disposed of, or are classified as held for sale and:
· represents a separate major line of business or geographical area of operations;
· is part of a single coordinated plan to dispose of a separate major line of business or geographical area of operations; or
· is a subsidiary acquired exclusively with a view to resale.
The components of profit or loss after taxes from discontinued operations and the post-tax gain or loss recognized on the measurement to fair value less costs to sell or on the disposal of the assets or groups constituting the discontinued operation are presented as a single line item in the consolidated comprehensive income statement as “Income after tax from discontinued operations”.
Treasury shares are deducted from equity in the consolidated statement of financial position and measured at acquisition cost.
Gains and losses from the disposal of treasury shares are recognized directly in “Equity — Retained earnings”, without affecting profit or loss for the period.
Provisions are recognized when the Group has a present obligation (legal or constructive) as a result of a past event, it is probable that the outflow of economic benefits will be required to settle the obligation, and a reliable estimate can be made of the amount of the obligation.
The amount recognized as a provision is the best estimate of the consideration required to settle the present obligation at the end of the reporting period, taking into account the risks and uncertainties surrounding the obligation. When a provision is measured using the cash flows estimated to settle the present obligation, its carrying amount is the present value of those cash flows (when the effect of the time value of money is material). The unwinding of the discount is recognized as a finance cost. Incremental legal cost expected to be incurred in resolving a legal claim is included in measuring of the provision.
Provisions are reviewed at the end of each reporting period and adjusted to reflect the current, best estimate. If it is no longer probable that an outflow of resources embodying economic benefits will be required to settle the obligation, the provision is reversed.
A contingent liability does not result in the recognition of a provision. Legal costs expected to be incurred in defending a legal claim are expensed as they are incurred. Significant contingent liabilities are disclosed unless the likelihood of an outflow of resources embodying economic benefits is remote.
l.1) Provisions for post-employment benefits and similar obligations
The Company and some of the subsidiaries have pension and similar obligations with their employees. These obligations, which can be defined benefits and defined contributions, are basically formalized through pension plans, except for certain non-monetary benefits, mainly electricity supply commitments, which, due to their nature, have not been externalized and are covered by the related in-house provisions.
For defined benefit plans, the cost of providing benefits is determined using the Projected Unit Credit Method, with actuarial valuations being carried out at the end of each reporting period. Past service costs relating to changes in benefits are recognized immediately.
The defined benefit plan obligations in the statement of financial position represent the present value of the accrued obligations, adjusted, once the fair value of the different plans’ assets has been deducted, if any.
Actuarial gains and losses arising in measurement of both the plan liabilities and the plan assets are recognized directly in other comprehensive income.
m) Translation of foreign currency balances
Transactions carried out by each entity in a currency other than its functional currency are recognized using the exchange rates prevailing as of the date of the transactions. During the period, any differences that arise between the prevailing exchange rate at the date of the transaction and the exchange rate as of the date of collection or payment are recognized as “Foreign currency exchange losses, net” in the consolidated statement of comprehensive income.
Likewise, at the end of each reporting period, receivable or payable balances denominated in a currency other than each entity’s functional currency are translated using the closing exchange rate. Any differences are recognized as “Foreign currency exchange losses, net” in the consolidated statement of comprehensive income.
The Group has established a policy to hedge the portion of revenue from its subsidiaries that is directly linked to variations in the U.S. dollar, through obtaining financing in such currency. Exchange differences related to this debt, which is regarded as the hedging instrument in cash flow hedge transactions, are recognized, net of taxes, in other comprehensive income and are accumulated in an equity reserve and reclassified to profit or loss when the hedged cash flows impact profit or loss. This term has been estimated at ten years.
n) Current/non-current classification
In these consolidated statements of financial position, assets and liabilities expected to be recovered or settled within twelve months are presented as current items, except for post-employment and other similar obligations. Those assets and liabilities expected to be recovered or settled in more than twelve months are presented as non-current items. Deferred income tax assets and liabilities are classified as non-current.
When the Group has any obligations that mature in less than twelve months but can be refinanced over the long term at the Group’s discretion, through unconditionally available credit agreements with long-term maturities, such obligations are classified as long-term liabilities.
Income tax expense for the period is determined as the sum of current taxes from the Group’s different subsidiaries and results from applying the tax rate to the taxable income for the period, after permitted deductions have been made, plus any changes in deferred tax assets and liabilities and tax credits, both for tax losses and deductions. Differences between the carrying amount and tax basis of assets and liabilities generate deferred tax assets and liabilities, which are calculated using the tax rates expected to apply when the assets and liabilities are realized or settled, based on tax rates that have been enacted or substantively enacted by the end of the reporting period.
Deferred tax assets are recognized for all deductible temporary differences, tax losses and unused tax credits to the extent that it is probable that sufficient future taxable profits exist to recover the deductible temporary differences and make use of the tax credits. Such deferred tax asset is not recognized if the deductible temporary difference arises from the initial recognition of an asset or liability that:
· Did not arise from a business combination; and
· At initial recognition affected neither accounting profit nor taxable profit (loss).
With respect to deductible temporary differences associated with investments in subsidiaries, associates and joint arrangements, deferred tax assets are recognized only to the extent that it is probable that the temporary differences will reverse in the foreseeable future and taxable profits will be available against which the temporary differences can be utilized.
Deferred tax liabilities are recognized for all temporary differences, except those derived from the initial recognition of goodwill and those that arose from investments in subsidiaries, associates and joint ventures in which the Group can control their reversal and where it is probable that they will not be reversed in the foreseeable future.
Current tax and changes in deferred tax assets or liabilities are recognized in profit or loss or in equity, depending on where the gains or losses that triggered these tax entries have been recognized.
Any tax deductions that can be applied to current tax liabilities are credited to earnings within the line item “Income tax expenses”, except when doubts exist about their tax realization, in which case they are not recognized until they are effectively realized, or when they correspond to specific tax incentives, in which case they are recognized as government grants.
At the end of each reporting period, the Group reviews the deferred taxes assets and liabilities recognized, and makes, if any, necessary corrections based on the results of its review.
Deferred tax assets and deferred tax liabilities are offset in the consolidated statement of financial position if has a legally enforceable right to set off current taxes receivable against current tax liabilities, and only when the deferred taxes relate to income taxes levied by the same taxation authority.
p) Revenue and expense recognition
Revenue is recognized when (or as) the control over a good or service is transferred to the customer. Revenue is measured based on the consideration to which it is expected to be entitled for said transfer of control, excluding the amounts collected on behalf of third parties.
The Group analyzes and takes into consideration all relevant facts and circumstances for revenue recognition, applying the, five step of the model established by IFRS 15: 1) Identifying the contract with a customer; 2) Identifying the performance obligations; 3) Determining the transaction price; 4) Allocating the transaction price; and 5) Recognizing revenue.
The following are the criteria for revenue recognition by type of good or service provided by the Group:
· Electricity supply (sale and transportation): Corresponds to a single performance obligation that transfers to the customer a number of different goods/services that are substantially the same and that have the same transfer pattern. Since the customer receives and simultaneously consumes the benefits provided by the Company, it is considered a performance obligation satisfied over time. In these cases, Enel Chile applies an output method to recognize revenue in the amount to which it is entitled to bill for electricity supplied to date.
Revenue is recorded according to the physical deliveries of energy and power, at the prices established in the respective contracts; at the prices stipulated in the electricity market by the current regulations; or at the marginal cost of energy and power, depending on whether free customers, regulated customers or energy trading in the spot market, are involved, respectively.
These revenues include an estimate of the service provided and not billed, intil the closing date of the financial statements (see Note 2.3 , Note 26 and Appendix 5.2).
· Sale and Transportation of Gas: Revenue is recognized over time, based on the actual physical deliveries of gas in the period of consumption, at the prices established in the respective contracts.
· Other services: mainly the provision of supplementary services to the electricity business, construction of works and engineering and consulting services. Customers control committed assets as they are created or improved. Therefore, the Company recognizes this revenue over time based on the progress, measuring progress through output methods (performance completed to date, milestones reached, etc.), or costs incurred (resources consumed, hours of labor spent, etc.), as appropriate in each case.
In contracts in which multiple committed goods and services are identified, the recognition criteria will be applied to each separably identifiable performance obligation of the transaction, based on the control transfer pattern of each such separable good or service and an independent selling price allocated to each of them, or to two or more transactions jointly, when these are linked to contracts with customers that are negotiated with a single commercial purpose and the goods and services committed represent a single performance obligation and their selling prices are not independent.
Enel Generación Chile, determines the existence of significant financing components in its contracts, adjusting the value of the consideration if applicable, to reflect the effects of the time value of money. However, the Group applies the practical expedient provided by IFRS 15, and will not adjust the value of the consideration committed for the purpose of a significant financing component since the Company expects, at the beginning of the contract, that the period between the payment and the transfer of goods or service to the customer is one year or less.
The Group excludes the gross revenue of economic benefits received when acting as an agent or broker on behalf of third parties from the revenue figure. The Group only records as revenue the payment or commission to which it expects to entitled.
Given that the Company mainly recognizes revenue for the amount to which it has the right to invoice, it has decided to apply the practical disclosure solution provided in IFRS 15, through which it is not required to disclose the aggregate amount of the transaction price allocated to the obligations of performance not met (or partially not met) at the end of the reporting period.
In addition, the Group evaluates the existence of incremental costs of obtaining a contract and costs directly related to the fulfillment of a contract. These costs are recognized as an asset, if their recovery is expected, and amortized in a manner consistent with the transfer of the related goods or services. The incremental costs of obtaining a contract are recognized as an expense, if the amortization period of such would have been
recognized is one year or less. Costs that do not qualify for capitalization are recognized as expenses at the time they are incurred, unless they are explicitly attributable to the customer.
Interest revenue (expenses) is (are) recorded considering the effective interest, rate applicable to the remaining unpaid principal during the corresponding accrual period.
Basic earnings per share are calculated by dividing net profit attributable to shareholders of the Parent (the numerator) by the weighted average number of ordinary shares outstanding (the denominator) during the period, excluding the average number of shares of the Parent held by the Group.
Total basic earnings per share are calculated as the ratio of the net profit for the year after tax from continuing and discontinued operations, less the corresponding portion attributable to non-controlling interests, and the weighted average number of common shares of the parent company outstanding during the period, excluding the average number of shares of the parent held by the Group.
Article No. 79 of the Chilean Corporations Act Law No.18,046 establishes that, unless unanimously agreed otherwise by the shareholders of all issued shares, listed corporations must distribute a cash dividend to shareholders on an annual basis, pro rata to the shares owned or the proportion established in the company’s by-laws if there are preferred shares, of at least 30% of profit for each year, except when accumulated deficit from prior years must be absorbed.
As it is practically impossible to achieve a unanimous agreement given the Group’s highly fragmented share capital, at the end of each reporting period the amount of the minimum statutory dividend obligation to its shareholders is determined, net of dividends approved during the period, and then accounted for in “Trade and other payables” and “Accounts payable to related parties”, as appropriate, and recognized in Equity.
The provisional and final dividends are deducted from Equity when approved by the competent body, which in the first case is normally the Board of Directors and in the second case is the shareholders as agreed at an Ordinary Shareholders’ Meeting.
The statement of cash flows reflects changes in cash and cash equivalents that took place during the period, determined with the direct method. It uses the following expressions and corresponding meanings:
·Cash flows: inflows and outflows of cash or cash equivalents, which are defined as highly liquid investments maturing in less than three months with a low risk of changes in value.
·Operating activities: the principal revenue-producing activities of the Group and other activities that cannot be considered investing or financing activities.
·Investing activities: the acquisition and disposal of long-term assets and other investments not included in cash and cash equivalents.
·Financing activities: activities that result in changes in the size and composition of the total equity and borrowings of the Group.
4. SECTOR REGULATIONS AND ELECTRICITY SYSTEM OPERATIONS
1)Regulatory framework
The electricity sector is regulated by the General Law of Electrical Services No. 20,018 (Chilean Electricity Law), also known as DFL No. 1 of 1982, of the Ministry of Mining — whose compiled and coordinated text was established in DFL No. 4 issued in 2006 by the Ministry of Economy (the Electricity Law) — as well as by an associated Regulation (D.S. No. 327 issued in 1998).
The main authority in energy matters is the Ministry of Energy, which is responsible for proposing and driving public policies for energy matters, strengthening coordination and expediting a comprehensive look at the sector. It was born on February 1, 2010 as an autonomous agency, after years of being part of the Ministry of Mines.
Answering to the Ministry of Energy are the regulatory agency of the power sector (the National Energy Commission) and the regulatory and administrative agency (Superintendency of Electricity and Fuels). The Ministry also has the Chilean Nuclear Energy Commission (CChEN), with Agency of Energy Sustainability.
The CNE, which has the authority to propose regulated tariffs (node prices) and to approve plans for the construction of new generating units. Besides, the SEF, supervises and oversees compliance with the laws, regulations, and technical standards that govern the generation, transmission, and distribution of electricity, as well as liquid fuels, and gas.
Furthermore, the law considers a Panel of Experts, made up of experts whose main function is to resolve any discrepancies occurring with regard to matters stipulated in the Electricity Law and in the application of other laws involving energy matters, by means of binding decrees.
The law stablishes a National Electric Coordinator, independent figure from the public law, in command of the operation and coordination of the Chilean electric system, which main objectives are: i) Preserve the security of the service, ii) Guarantee the economic operation of the interconnected facilities of the electric system and iii) Guarantee the free access to the transmission systems. Among its main activities are: Electric Market coordination, connection authorization, complementary management, public information implementation system, competition and payment chain audit, among others.
From a physical viewpoint, the Chilean electrical sector is divided into three electrical grids: the Sistema Electrico Nacional (“SEN”), and two separate medium-size grids located in southern Chile, one in Aysén and the other in Magallanes. The SEN was created in November 2017 with the interconnection of the Sistema Interconectado Central (“SIC”) and Sistema Interconectado del Norte Grande (“SING”). Until the interconnection, the SIC constituted the main electrical grid of Chile, which extended longitudinally 2,400 km and connected the country from Taltal in the north to Quellón, on the island of Chiloé in the south. Besides, the SING covered the northern part of the country, from Arica down to Coloso a length of some 700 km.
The Chilean power industry has basically three activities — Generation, Transmission and Distribution. Power facilities associated with these three activities are obligated to operate in an interconnected, coordinated manner, with the main purpose of providing the market with electrical energy at minimum cost and within the standards of service quality and safety required by the electricity regulations.
As essential services, the power transmission and distribution businesses are natural monopolies; these segments are regulated as such by the Electricity Law, which requires free access to networks and regulates rates.
Two products (Energy and Power) and sundry services are provided in the electricity market. In particular, the National Electricity Coordinator is in charge of making the balances, determining the respective transfers
between generating companies and calculating the marginal hourly cost, at which price the energy transfers are valued. For its part, the CNE determines the Power prices.
Consumers are classified according to the size of their demand into regulated or unregulated customers. Regulated customers are those that have a connected capacity of less than 5,000 kW. Without detriment to the above, customers with a connected power of between 500 kW and 5,000 kW may opt for a regulated or unregulated rates system.
Limits on integration and concentration
Chile has legislation in effect that defends free competition and, together with specific regulations that apply to the electricity market, defines criteria to avoid certain levels of economic concentration and/or abusive market practices.
In principle, the regulator allows the participation of companies in different activities (e.g. generation, distribution, and transmission) as long as there is an adequate separation of each activity, for both accounting and company purposes. Nevertheless, most of the restrictions imposed involve the transmission sector mainly due to its nature and to the need to guarantee adequate access to all agents. The Chilean Electricity Law establishes limits for participation of generation or distribution companies in the Trunk Transmission Systems and prohibits participation of Trunk Transmission Systems companies in the generation and distribution segment.
1.1. Generation segment
Generation companies must comply with the operation plan of the CISEN. However, each generation company is free to decide whether to sell its energy and capacity to regulated or unregulated customers. Any surplus or deficit between a company’s sales to its customers and its energy supply is sold to, or purchased from, other generators at the spot market price.
A power generation company may have the following types of customers:
(i) Unregulated customers: Are customers mainly industrial and mining companies, with a connected capacity higher than 5,000 kW. These consumers can freely negotiate prices for electrical supply with generators and/or distributors.
(ii) Distribution companies that supply power to regulated customers: distinguishing supply from its regulated and free customers. For the supply of their regulated customers, the distribution companies buy energy from the generating companies through Participation in public tenders regulated by the CNE for the supply to their free customers through bilateral contracts.
(iii) Other Generation Companies in Spot market: The relationship between generating companies can occur through bilateral contracts or due to transfers. This represents energy and capacity transactions among generating companies that result from the CISEN’s coordination to keep the system running as economically as possible, where the surpluses (deficits) between a generator’s energy supply and the energy it needs to comply with business commitments are transferred through sales (purchases) to (from) other generators in the CISEN, valued at the marginal cost, while node prices for capacity are set every semester by the regulators.
In Chile, the capacity that must be paid to each generator depends on an annual calculation performed according to current regulations by the CISEN, to determine the sufficiency capacity of each power plant, a value that depends mainly on the availability both of the facilities as such, and of the generation resource according to the technology.
Non-Conventional Renewable Energy
Law No. 20,257 was enacted in April of 2008 to encourage the use of Non-Conventional Renewable Energy (“NCRE”). The principal aspect of this law is that at least 5% of the energy sold by generation companies to their customers must come from renewable sources between years 2010 and 2014. This requirement progressively increases by 0.5% from 2015 until 2024, when a 10% renewable energy requirement will be reached. This law was amended in 2013 by Law No. 20,698, dubbed the “20/25 law,” as it establishes that by 2025, 20% of energy supplied will be generated by NCRE. It does not change the previous law’s plan for supplying energy under agreements in effect in July 2013.
1.2.Transmission segment
The transmission segment is comprised of a combination of lines, substations and equipment for the transmission of electricity from the production points (generators) to the centers of consumption or distribution, which do not correspond to distribution facilities. The transmission segment is divided into National Transmission System, Development Poles Transmission System, Zonal Transmission System, Dedicated Transmission System and International Interconnection Systems.
The transmission system is open access, and transmission companies may impose rights of way over the available transmission capacity under non-discriminatory conditions. The fees of the existing facilities of the National Transmission System and Zonal Transmission System is determined through a tariff setting process that is carried out every four years. In that process, the Annual Value of the Transmission is determined, which comprises efficient operation and maintenance costs and the annuity of the investment value, determined on the basis of a discount rate fixed by the authority on a quarterly basis (minimum 7% after tax) and the economic useful life of the facilities.
The planning of the National and Zonal Transmission Systems corresponds to a regulated and centralized process, where the CISEN annually issues an expansion plan, which must be approved by the CNE.
The expansions of both systems are carried out through open tenders, distinguishing between new projects and expansion of existing facilities projects. For new projects open tenders are considered, being the successful bidder the owner of the facilities. In the case of expansion of existing facilities, the owner of the original facilities is also the owner of its extension and has the obligation to tender its construction, but it has to be tendered. Both types of tenders are managed by the Coordinator.
The bids correspond to the value resulting from the tender, which constitutes the income for the first 20 years from the start of operation. On the other hand, the fees from the new facilities compose by the investment value resulting from the tender offer and the operation and maintenance applicable cost. As of the year 21, the fees of such transmission facilities are determined as if they were existing facilities.
The current regulations define that the transmission is remunerated by the sum of the tariff revenues and the collection of a single charge for the use of the transmission system. This charge is defined (ChP$ / kWh) by the CNE, on a half-yearly basis.
1.3.Distribution segment
The distribution segment is defined for regulatory purposes as all electricity supplied to end customers at a voltage no higher than 23 kW.
Distribution companies operate under a public service concession regime, having the obligation to provide service to all customers and clients submitted to regulated tariffs (clients with a connected capacity inferior to 5,000 kW, except for clients between 500 and 5,000 kW- connected capacity who exercise their option to opt for an unregulated tariff). It should be noted, that clients with an unregulated tariff could negotiate their supply
with any supplier (distribution or generation company) by paying a regulated usage charge for the use of the distribution network.
Regarding price regulation, the Chilean Electricity Law establishes that the distribution companies must permanently have available energy supply, on the basis of open, non-discriminatory and transparent public tenders. These bidding processes are managed by the CNE and are carried out at least five years in advance. The result of the process is a “pay as bid” contract, with an extension up to 20 years. In case of unforeseen deviations in the projections of demand, the regulator has the authority to carry out a short-term tenders. In addition, a reimbursement mechanism exists allowing supply without contract.
The tariffs setting for this segment are set every four years on the basis of costs studies in order to determine the distribution value added (VAD). VAD determination is based on an enterprise outline efficient model and concept of typical area.
Certainly, for the process of determining VAD, the CNE classifies companies with similar distribution costs by groups named “typical areas”. For each typical area both, the CNE and the distribution companies, commission studies to independent consultants to determine the associated costs with an efficient model company considering fixed costs, average energy and power losses and standard investment, maintenance and operating costs associated with the distribution. The calculation of the annual investment costs considers the New Replacement Value (NRV) of the facilities adapted to the demand, their useful life and an update rate equal to a real annual 10%.
The VAD is obtained by weighting the results of the commissioned studies by the CNE and the companies with a ratio of 2:3 and 1:3, respectively. Based on this result, the CNE structures basic tariffs and verifies that the aggregate profitability of the industry is within the established range of 10% with a margin of ± 4%.
Additionally, every four years a review of Services Associated with the calculation of VAD is carried out, which do not represent energy supply and which the Free Competition Court qualifies as subject to tariff regulation.
The Chilean distribution tariff model is a robust model, which already had eight cycles of tariff settings since the enactment of the General Electric Services Law in 1982.
2)Regulatory Developments in 2018
CNE 2018 Regulatory Plan
By means of Exempt Resolution No. 20 dated January 12, 2018, in accordance with the provisions of Article 72-19 of the General Electric Services Law, CNE published its Annual Work Plan for the preparation of the technical regulations for 2018. The document defines the general guidelines and the programmatic priorities of the CNE’s Regulatory Work Plan 2018 and the pending regulatory procedures of the , the preparation of which will continue being performed during 2018.
CNE 2019 Regulatory Plan
By means of Exempt Resolution No. 790 dated December 10, 2018, in accordance with the provisions of Article 72-19 of the General Electric Services Law, CNE published its Annual Work Plan for the preparation of the technical regulations for 2019. The document defines the general guidelines and the programmatic priorities of the CNE’s Regulatory Work Plan 2019 and the pending regulatory procedures of the 2018 Plan, the preparation of which will continue being performed during 2019.
Regulations Published in 2018
Panel of Experts Regulations On January 5, 2018, the Chilean Department of Energy published new Regulations for the Panel of Experts in the Official Gazette. The purpose of these regulations is to establish provisions for the operation, financing and competencies of the Panel of Experts, as well as the procedures necessary for the proper performance of its functions.
Regulations of the Electrical Coordinator On April 3, 2018, the Chilean Department of Energy approved the Regulations of the Independent Coordinator of the National Electricity System. The purpose of these regulations is to establish provisions for the organization, composition and operation of the Independent Coordinator of the National Electricity System, as well as the procedures necessary for the proper performance of its functions.
Safety Regulations of Complementary Services, Storage and Distribution of Electric Power On June the Chilean Department of Energy approved the Safety Regulations for Electrical Facilities for the production, transportation, provision of complementary services, storage systems and distribution of electric power.
3)Energy Tenders
Under the new law for energy tenders, three bidding processes have been carried out: Supply Bidding No. 2015/01, Supply Bidding No. 2015/02 and Supply Bidding No. 2017/01.
Supply Bidding No. 2015/02 was launched in June 2015 and finalized in October 2015. The final outcome of the process resulted in three energy blocks awarded for a total of 1.2 TWh (100%) per year at a weighted average price of US$79.3 per MWh.
Supply Bidding No. 2015/01 was launched in May 2015 and finalized in July 2016. The final outcome of the process resulted for a total of 12.4 TWh/year (100%) to 84 companies at a weighted average price of US$47.6 per MWh, with new players being incorporated into the market.
The main award of Supply Bidding No. 2015/01 was Enel Generación Chile with 5.918 TWh per year, which represents a 47.6% of the total energy awarded.
Supply Bidding No. 2017/01 was launched in January 2017 and finalized in November 2017. The final outcome of the process resulted in five blocks awared for a total of 2.2 TWh/year (100%) to 5 companies at a weighted average price of US$32.5 per MWh.
As in the previous process, the main successful bildder was Enel Generación Chile, which was awarded supply contracts of 1.2 TWh/year, representing 54% of the total awarded.
5. NON-CURRENT ASSETS OR GROUPS OF ASSETS FOR DISPOSAL CLASSIFIED AS HELD FOR SALE OR HELD FOR DISTRIBUTION TO OWNERS
5.1 Sale of Electrogas S.A. - Non-current assets and disposal groups held for sale
On December 16, 2016, Enel Generación Chile signed a share purchase agreement with Aerio Chile SpA (hereinafter “Aerio Chile”), which is indirectly wholly-owned subsidiary of Redes Energeticas Nacionais, S.G.P.S. S.A. (“REN”). In accordance with the agreement Enel Generación Chile agreed to sell its entire ownership interest in Electrogas S.A., representing 42.5% of the issued capital of that company. The total price was US$180 million, which was paid on the transaction closing date. Finally, the amount collected was ThCh$115,582,806 and originated a pre-tax gain of ThCh $ 105,311,912.
The sale of this investment to Aerio Chile was subject to satisfaction of customary conditions precedent for this type of transactions, which includes, among others, the non-exercise by the other shareholders of Electrogas S.A. of the preferential acquisition rights, which they were entitled to in accordance with the terms and conditions established in the shareholders agreement.
At the end of the fiscal year 2016, the investment made by Enel Generación Chile in Electrogas was ThCh$12,993,008 and following the criteria described in Note 3.j, was classified as a non-current asset available for sale.
The closing of the transaction and transfer of the investment occurred in February 7, 2017. The cash consideration received was ThCh$115,582,806 and was recognized a gain on sale before taxes of ThCh$105,311,912 (see Notes 7.c and 31, respectively).
Electrogas S.A.’s corporate purpose is to provide services of transportation of natural gas and other fuels, on its own and on behalf of third parties. In order to provide its services, it can build, operate and maintain gas and oil pipelines, polyducts and supplementary facilities.
I. General background
On April 28, 2015, the Company informed the SVS Commission for the Financial Market through a significant event notice, that the Board of Directors of its direct parent at that time, Enersis S.A. (currently named Enel Américas S.A.), communicated that it had decided to initiate an analysis of a corporate reorganization aimed at the separation of the activities of power generation and distribution in Chile from other activities conducted outside of Chile by Enersis S.A. (currently named Enel Américas S.A.) and its subsidiaries Empresa Nacional de Electricidad S.A. (the Company, currently named Enel Generación Chile S.A.) and Chilectra S.A. (currently named Enel Distribución Chile S.A.), while maintaining its inclusion in the Enel S.p.A. Group.
In the same significant event notice, the Board of Directors of the Company reported that it had agreed to initiate studies to analyze a possible corporate reorganization consisting of the spin-off of its businesses in Chile from those outside of Chile, and the subsequent merger of the latter into a single company. Furthermore, it indicated that the objective of this reorganization was to create value for all of its shareholders, as none of these operations require the contribution of additional resources from shareholders. The possible corporate reorganization would take into account the best interests as well as all shareholders’ interests, with special attention paid to minority interests, and if it were approved, it would be subject to approval at an Extraordinary Shareholders’ Meeting.
This corporate reorganization consisted of two steps:
· Each of Enersis S.A. (currently Enel Américas S.A.) and its subsidiaries Endesa Chile and Chilectra S.A. would effect a spin-off, resulting in separation (the “Spin-off”) of the businesses in Chile and outside of Chile.
· Once the previously mentioned spin-off transactions were completed, Enersis S.A. (currently named Enel Américas S.A.) would absorb by merger the newly created companies, Endesa Américas S.A. and Chilectra Américas S.A., to which the businesses outside of Chile would be allocated, and would dissolve them without liquidation.
On December 18, 2015, the Extraordinary Shareholders’ Meeting of the Company approved the demerger, subject to the conditions precedent consistent in approving the demergers of Enersis S.A. (currently Enel Américas S.A.) and Chilectra S.A. (currently Enel Distribución Chile S.A.) by their respective Extraordinary Shareholders’ Meetings, in addition to the relevant legal procedures and related matters. Also, it was agreed that the demerger would take effect from the first calendar day of the month following that in which a deed of compliance with conditions of the demerger is granted.
On March 1, 2016, having satisfied all conditions precedent, the demerger of the Company became effective and the new entity Endesa Américas S.A. began to exist, to which were allocated the shareholdings and other associated assets and liabilities of the businesses outside of Chile. Consequently, the corresponding capital decrease of the Company and other amendments to its by-laws were verified (see Note 23). On the same date, all of Enersis S.A. ownership interest in the Company were transferred to Enersis Chile S.A. (currently named Enel Chile S.A.) the new entity created from the demerger of Enersis S.A. (currently named Enel Américas S.A.) to which were allocated the generation and distribution businesses in Chile.
II. Accounting aspects
As of December 31, 2015, upon compliance with the criteria in IFRS 5 Non-Current Assets Held for Sale and Discontinued Operations, the following financial accounting treatment was applied:
i) Assets and liabilities
All assets and liabilities related to the generation and distribution business outside of Chile (including Enel Brasil, and distribution subsidiaries) were classified as “non-current assets and disposal groups held for sale or distribution to owners” or “liabilities associated with non-current assets and disposal groups held for sale or distribution to owners”, as appropriate, according to the accounting policy indicated in Note 3.j.
ii) Profit and loss
All income and expenses related to generation and distribution business located outside of Chile (Enel Brasil, distribution subsidiaries), subject to distribution to owners, represent discontinued operations and are presented in the “Income after tax from discontinued operations” line within the consolidated statement of comprehensive income.
The following table sets forth the breakdown by nature of the line item “Income from discontinued operations, net of taxes” for the two months ended February 29, 2016:
Discontinued operations | |||||
For 2 months ended | |||||
02-29-2016 | |||||
ThCh$ | |||||
STATEMENTS OF COMPREHENSIVE INCOME | |||||
Revenues | 229,074,809 | ||||
Other operating income | 6,648,363 | ||||
Revenues and Other Operating Income | 235,723,172 | ||||
Raw materials and consumables used | (95,953,531 | ) | |||
Contribution Margin | 139,769,641 | ||||
Other work performed by the entity and capitalized | 1,187,538 | ||||
Employee benefits expense | (11,608,563 | ) | |||
Impairment losses | (906,638 | ) | |||
Other expenses | (16,295,714 | ) | |||
Operating Income | 112,146,264 | ||||
Other gains, net | 41,806 | ||||
Financial income | 2,779,987 | ||||
Financial costs | (21,056,624 | ) | |||
Share of profit and losses of investments accounted for using the equity method | 6,375,719 | ||||
Foreign currency exchange gains (losses), net | 25,485,086 | ||||
Profit before income taxes | 125,772,238 | ||||
Income tax expense | (46,199,793 | ) | |||
NET PROFIT for
| |||||
| |||||
Shareholders of the parent | 39,759,035 | ||||
Non-controlling interests | 39,813,410 | ||||
TOTAL COMPREHENSIVE INCOME FROM DISCONTINUED OPERATIONS | 79,572,445 |
iii) Accumulated other comprehensive loss in equity
The accumulated other comprehensive loss amounts in equity reserves associated with assets and liabilities held for distribution to owners is as follows:
Discontinued operations | |||
For 2 months ended | |||
02-29-2016 | |||
ThCh$ | |||
Reserves originated from | |||
Exchange differences in foreign currency translation | (263,741,101 | ) | |
Cash flow hedges | (8,696,789 | ) | |
Gains and losses on remeasuring available-for-sale financial | (118,662 | ) | |
Other miscellaneous reserves | (2,561,252 | ) | |
Total | (275,117,804 | ) |
As a result of the classification of the generation and distribution activities located outside of Chile as discontinued operations, these business lines are not disclosed in Note 34 “Information by Segment”.
iv) Cash flows
The following table sets forth the net cash flows from operating, investing and financing activities attributable to discontinued operations for the two month period ended February 29, 2016:
Discontinued operations | |||||||||||||||||||||||||||||||||||||||||||||||||||||||||||||||||||||||
For 2 months ended | |||||||||||||||||||||||||||||||||||||||||||||||||||||||||||||||||||||||
02-29-2016 | |||||||||||||||||||||||||||||||||||||||||||||||||||||||||||||||||||||||
ThCh$ | |||||||||||||||||||||||||||||||||||||||||||||||||||||||||||||||||||||||
Summary of the net | |||||||||||||||||||||||||||||||||||||||||||||||||||||||||||||||||||||||
Net cash provided by operating activities | 69,011,031 | ||||||||||||||||||||||||||||||||||||||||||||||||||||||||||||||||||||||
Net cash used in investing activities | (25,947,761 | ) | |||||||||||||||||||||||||||||||||||||||||||||||||||||||||||||||||||||
Net cash provided by (used in) financing activities | 80,160,648 | ||||||||||||||||||||||||||||||||||||||||||||||||||||||||||||||||||||||
Net increase (decrease) in cash and cash equivalents before the effect of |
| 112,313,130 | |||||||||||||||||||||||||||||||||||||||||||||||||||||||||||||||||||||
Cash and cash
|
|
|
III. Other information
The Spin-off by the Company triggered the Company’s obligation to pay taxes in Peru for a total amount of 577 million Peruvian Soles (ThCh$ 116,053,255). This tax, paid during March 2016, was generated as a result of the application of the Peruvian Income Tax Law to the transfer of the ownership interests, which the Group held in Peru, to Endesa Américas S.A. The tax is calculated as the difference between the disposal value and the acquisition cost of the ownership interests.
Because this payment was directly linked to the Spin-off, the effect has been recognized directly in equity, specifically in other reserves, following the nature of the principal transaction (transaction with shareholders in their capacity as owners).
With respect to deductible temporary differences associated with investments in subsidiaries, associates and joint arrangements, deferred tax assets are recognized only to the extent that it is probable that the temporary differences will reverse in the foreseeable future and taxable profits will be available against which the temporary differences can be utilized.
Deferred tax liabilities are recognized for all temporary differences, except those derived from the initial recognition of goodwill and those that arose from investments in subsidiaries, associates and joint ventures in which the Group can control their reversal and where it is probable that they will not be reversed in the foreseeable future.
Current tax and changes in deferred tax assets or liabilities are recognized in profit or loss or in equity, depending on where the gains or losses that triggered these tax entries have been recognized.
Any tax deductions that can be applied to current tax liabilities are credited to earnings within the line item “Income tax expenses”, except when doubts exist about their tax realization, in which case they are not recognized until they are effectively realized, or when they correspond to specific tax incentives, in which case they are recognized as government grants.
At the end of each reporting period, the Group reviews the deferred taxes assets and liabilities recognized, and makes, if any, necessary corrections based on the results of its review.
Deferred tax assets and deferred tax liabilities are offset in the consolidated statement of financial position if has a legally enforceable right to set off current taxes receivable against current tax liabilities, and only when the deferred taxes relate to income taxes levied by the same taxation authority.
Revenue is recognized when the gross inflow of economic benefits arising in the course of the Group’s ordinary activities in the period occurs, provided that this inflow of economic benefits results in an increase in total equity that is not related to contributions from equity participants and that these benefits can be measured reliably.
Revenues and expenses are recognized on an accrual basis and depending on the type of transaction, the following criteria for recognition are taken:
|
|
Revenue from rendering of services is recognized, only if it can be estimated reliably, by reference to the stage of completion of the service at the end of the reporting period.
Revenue is recognized based on the economic substance of the transaction and is recognized when all of the following conditions are met:
|
|
|
|
|
|
|
|
|
|
Revenue is measured at the fair value of the consideration received or receivable that gives rise to the revenue.
In arrangements under which the Group will perform multiple revenue-generating activities (multiple-element arrangement), the recognition criteria are applied to the separately identifiable components of the transaction in order to reflect the substance of the transaction or to two or more transactions together when they are linked in such a way that the commercial effect cannot be understood without reference to the series of transactions as a whole.
The Group excludes from revenue those gross inflows of economic benefits it receives when it acts as an agent or commission agent on behalf of third parties, and only recognizes as revenue economic benefits received for its own activity.
When goods or services are exchanged or swapped for goods or services of a similar nature and value, the exchange is not regarded as a revenue-generating transaction.
The Group recognizes the net amount of non-financial asset purchases or sale contracts that are settled for a net amount of cash or through some other financial instruments. Contracts entered into and maintained for the purpose of receiving or delivering these non-financial assets are recognized on the basis of the contractual terms of the purchase, sale, or usage requirements expected by the entity.
Finance income (expense) is recognized using the effective interest method.
Expenses are recognized on an accruals basis, immediately in the event of expenditures that do not generate future economic benefits or when they do not meet the requirements for recording them as assets.
Basic earnings per share are calculated by dividing net profit attributable to shareholders of the Parent (the numerator) by the weighted average number of ordinary shares outstanding (the denominator) during the period, excluding the average number of shares of the Parent held by the Group, if any.
Total basic earnings per share are calculated as the ratio of the net profit for the year after tax from continuing and discontinued operations, less the corresponding portion attributable to non-controlling interests, and the weighted average number of common shares of the parent company outstanding during the period, excluding the average number of shares of the parent held by the Group.
Article No. 79 of the Chilean Public Companies Act establishes that, unless unanimously agreed otherwise by the shareholders of all issued shares, listed corporations must distribute a cash dividend to shareholders on an annual basis, pro rata to the shares owned or the proportion established in the company’s by-laws if there are preferred shares, of at least 30% of profit for each year, except when accumulated deficit from prior years must be absorbed.
As it is practically impossible to achieve a unanimous agreement given the Group’s highly fragmented share capital, at the end of each reporting period the amount of the minimum statutory dividend obligation to its shareholders is determined, net of interim dividends approved during the period, and then accounted for in “Trade and other payables” and “Accounts payable to related parties”, as appropriate, and recognized in Equity.
Interim and final dividends are deducted from Equity when approved by the competent body, which in the first case is normally the Board of Directors and in the second case is the shareholders as agreed at an Ordinary Shareholders’ Meeting.
The Group’s activities were previously organized primarily around its core business, electric energy generation. Considering the differentiated information that was analyzed by the Company’s chief operating decision maker (“CODM”), segment information had been organized by the geographical areas in which the Group operates:
Chile
Argentina (discontinued)
Peru (discontinued)
Colombia (discontinued)
However, since all non-Chilean operations were presented as discontinued operations in the Group’s 2015 consolidated financial statements as a result of the corporate reorganization described in Note 4.2, the Group no longer has any operating segments as that term is defined by IFRS 8 “Operating Segments”. The information currently provided to the CODM is the same as reported in Group’s consolidated financial statements. Management has elected to voluntarily present supplemental disaggregated asset, liability and cash flow information on a geographic basis. The accounting policies used to determine this supplemental disaggregated financial information are the same as those used in the preparation of the Group’s consolidated financial statements. See Note 33.
The Group generates substantially all of its revenue from continuing operations from customers located in Chile. Also, substantially of all of the Group’s non-current assets not classified as held for distribution are located in Chile. Consequently, no further geographic consolidated revenue and non-current asset information is presented.
|
|
|
|
On December 16, 2016, the Company entered into a share purchase agreement with Aerio Chile SpA (hereinafter “Aerio Chile”), a company that is indirectly wholly owned by Redes Energeticas Nacionais, S.G.P.S. S.A. (“REN”). In accordance with this agreement the Company agreed to sell its entire ownership interest in Electrogas S.A., representing 42.5% of the capital of that company. The agreed price amounts to US$ 180 million (approximately ThCh$ 120,544,600), which will be paid on the transaction closing date.
The sale of this investment to Aerio Chile is subject to satisfaction of customary conditions precedent for this type of transaction, which includes, among others, the non-exercise by the other shareholders of Electrogas S.A. of the preferential acquisition rights, which they possess in accordance with the terms and conditions established in the shareholders agreement. The closing of the transaction and transfer of the investment occurred in February 2017 (see Note 39).
Electrogas S.A.’s corporate purpose consists of providing natural gas and other fuels transportation services, for its own account or for others, for which it can build, operate and maintain gas pipelines, pipelines, pipelines and complementary facilities.
As described in Note 3.j, non-current assets and disposal groups classified as held for sale have been recognized at the lower of their carrying amount and estimated sale value less cost of disposal. The investment in Electrogas S.A. does not represent a significant business line for the Group.
The following table presents the balance of the Group’s investment in Electrogas S.A. as of December 31, 2016, which has been classified as non-current assets held for sale:
Equity of Electrogas S.A. | Ownership | Carrying Value of investment in Electrogas S.A |
ThCh$ | % | ThCh$ |
30,571,784 | 42.50% | 12,993,008 |
|
|
|
|
On April 28, 2015, the Company informed the SVS through a significant event notice, that the Board of Directors of its direct parent at that time, Enersis S.A. (currently Enel Américas S.A.), communicated that it had decided to initiate an analysis of a corporate reorganization aimed at the separation of the activities of power generation and distribution in Chile from other activities conducted outside of Chile by Enersis S.A. (currently Enel Américas S.A.) and its subsidiaries Empresa Nacional de Electricidad S.A. (the Company, currently Enel Generación Chile S.A.) and Chilectra S.A. (currently Enel Distribución Chile S.A.), while maintaining its inclusion in the Enel S.p.A. group.
In the same significant event notice, the Board of Directors of the Company reported that it had agreed to initiate studies to analyze a possible corporate reorganization consisting of the spin-off of its businesses in Chile from those outside of Chile, and the subsequent merger of the latter into a single company. Furthermore, it indicated that the objective of this reorganization was to create value for all of its shareholders, as none of these operations require the contribution of additional resources from shareholders. The possible corporate reorganization would take into account the best interests as well as all shareholders’ interests, with special attention paid to minority interests, and if it were approved, it would be subject to approval at an Extraordinary Shareholders’ Meeting.
This corporate reorganization consisted of two steps:
|
|
|
|
On December 18, 2015, the Extraordinary Shareholders' Meeting of the Company approved the demerger, subject to the conditions precedent consistent in approving the demergers of Enersis S.A. (currently Enel Américas S.A.) and Chilectra S.A. (currently Enel Distribución Chile S.A.) by their respective Extraordinary Shareholders’ Meetings, in addition to the relevant legal procedures and related matters.
The Company conducted a “división” or “demerger” under Chilean corporate law to divide the Company into two separate companies. The new company, Endesa Américas S.A. (“Endesa Américas”), was assigned the Company’s non-Chilean businesses and related assets and liabilities (the “Separation”). On March 1, 2016, having satisfied all conditions precedent including a corresponding capital decrease and amendments to the by-laws, the Separation became effective (see Note 24). Endesa Américas registered its shares with the Securities Registry of the SVS pursuant to Chilean law and with the U.S. Securities and Exchange Commission (the “SEC”) pursuant to applicable U.S. federal securities laws, and on April 21, 2016, the Company distributed shares of Endesa Américas to its shareholders in proportion to such shareholders’ share ownership in the Company based on a ratio of one share of Endesa Américas for each outstanding share of the Company (the “Distribution,” and together with the Separation, the “Spin-off”). Following the Spin-off, the Company retained its Chilean businesses and related assets and liabilities.
Chilectra S.A. (currently Enel Distribución Chile S.A.), a Chilean electricity distribution company and subsidiary of Enersis S.A. (currently Enel Américas S.A.), also conducted a “división” or “demerger” and distributed to its shareholders pro rata the shares of a new Chilean company, Chilectra Américas S.A. (“Chilectra Américas”), that was assigned the non-Chilean equity interests and related assets and liabilities of Chilectra S.A., which consisted exclusively of ownership interests in shares of companies domiciled outside of Chile (the “Chilectra Spin-off” and together with the Spin-off, the “Endesa/Chilectra Spin-offs”). Chilectra Américas registered its shares with the Securities Registry of the SVS pursuant to Chilean law and Chilectra S.A. (currently Enel Distribución Chile S.A.) continues to hold its Chilean businesses and related assets and liabilities.
In connection with the “demergers” of the Company and Chilectra S.A., Enersis S.A. (currently Enel Américas S.A.) conducted a “división” or “demerger”. Following the Endesa/Chilectra Spin-offs, Enersis S.A. (currently Enel Américas S.A.) distributed to its shareholders pro rata the shares of a new Chilean company, Enersis Chile S.A. (“Enersis Chile”), that was assigned the Chilean businesses and assets, including the equity interests in each of the Company and Chilectra S.A., after giving effect to the “demergers” of the Company and Chilectra S.A. (the “Enersis Spin-off”). On March 1, 2016, having satisfied all conditions precedent including the capital decrease and modifications to the by-laws, the demerger became effective and Enersis S.A.’s corporate name was changed to Enersis Américas S.A. The new entity Enersis Chile was also incorporated on that date and allocated the equity interest and related assets and liabilities of Enersis S.A.’s businesses in Chile. Enersis Chile registered its shares with the Securities Registry of the SVS pursuant to Chilean law and the SEC pursuant to applicable U.S. federal securities laws in connection with the Enersis Spin-off, which was completed in April 2016.
|
|
As of December 31, 2015, the following financial reporting has been reflected in the Company’s consolidated financial statements:
|
|
All assets and liabilities related to the generation and distribution business outside of Chile (Enel Brasil, distribution subsidiaries) have been classified as “non-current assets and disposal groups held for sale or distribution to owners” or
“liabilities associated with non-current assets and disposal groups held for sale or distribution to owners”, as appropriate, according to the accounting policy indicated in Note 3.j.
As of March 1, 2016 (the date when Spin-off became effective) and December 31, 2015, the main groups of assets and liabilities classified as held for distribution to owners, which relate to the Group’s operations outside of Chile, were as follows:
| Classified as held for distribution to owners | Classified as held for distribution to owners |
Balance as of 3-1-2016 | Balance as of 12-31-2015 | |
| ThCh$ | |
ASSETS |
|
|
CURRENT ASSETS |
|
|
Cash and cash equivalents | 211,252,436 | 112,313,130 |
Other current financial assets | 4,026,343 | 5,641,903 |
Other current non-financial assets | 11,065,826 | 14,336,049 |
Trade and other current receivables, net | 211,703,393 | 199,139,964 |
Current accounts receivable from related parties | 54,507,295 | 37,639,756 |
Inventories | 22,562,325 | 25,926,892 |
Current income tax receivables | 1,180,380 | 50,966 |
TOTAL CURRENT ASSETS | 516,297,998 | 395,048,660 |
NON-CURRENT ASSETS |
|
|
Other non-current financial assets | 577,719 | 625,981 |
Other non-current non-financial assets | 2,764,888 | 3,239,510 |
Trade and other non-current receivables, net | 220,651,649 | 230,824,700 |
Investments accounted for using the equity method | 441,310,088 | 446,338,964 |
Intangible assets other than goodwill, net | 29,219,975 | 31,083,689 |
Goodwill | 94,270,450 | 100,700,656 |
Property, plant and equipment, net | 2,481,383,742 | 2,663,590,814 |
Deferred income tax assets | 16,403,221 | 18,253,056 |
TOTAL NON-CURRENT ASSETS | 3,286,581,732 | 3,494,657,370 |
TOTAL ASSETS | 3,802,879,730 | 3,889,706,030 |
LIABILITIES |
|
|
CURRENT LIABILITIES |
|
|
Other current financial liabilities | 198,963,253 | 221,018,241 |
Trade and other current payables | 238,547,183 | 259,664,724 |
Current accounts payable to related parties | 55,541,485 | 48,124,723 |
Current provisions | 67,049,521 | 78,935,605 |
Current income tax liabilities | 69,623,615 | 65,310,111 |
Other current non-financial liabilities | 1,797,957 | 1,951,294 |
TOTAL CURRENT LIABILITIES | 631,523,014 | 675,004,698 |
NON-CURRENT LIABILITIES |
|
|
Other non-current financial liabilities | 908,367,472 | 896,924,119 |
Other non-current payables | 37,652,705 | 39,373,175 |
Non-current provisions, other than for employee benefits | 33,922,531 | 36,473,503 |
Deferred income tax liabilities | 158,913,576 | 163,761,907 |
Non-current provisions for employee benefits | 19,308,134 | 21,548,342 |
Other non-current non-financial liabilities | 17,547,661 | 18,698,412 |
TOTAL NON-CURRENT LIABILITIES | 1,175,712,079 | 1,176,779,458 |
TOTAL LIABILITIES | 1,807,235,093 | 1,851,784,156 |
|
|
All income and expenses related to generation and distribution business located outside of Chile (Enel Brasil, distribution subsidiaries), subject to distribution to owners, represent discontinued operations and are presented in the “Profit after tax for the year from discontinued operations” line within the consolidated statement of comprehensive income.
The following is the breakdown of comprehensive income for the year from discontinued operations for the two months ended February 29, 2016 and years ended December 31, 2015 and 2014:
STATEMENTS OF COMPREHENSIVE INCOME | Discontinued operations | ||
For 2 months ended | For the years ended | ||
2-29-2016 | 12-31-2015 | 12-31-2014 | |
| ThCh$
| ThCh$ | ThCh$ |
Revenues | 229,074,809 | 1,238,466,148 | 1,154,414,241 |
Other operating income | 6,648,363 | 64,649,040 | 61,145,248 |
Revenues and Other Operating Income | 235,723,172 | 1,303,115,188 | 1,215,559,489 |
Raw materials and consumables used | (95,953,531) | (481,747,189) | (369,241,528) |
Contribution Margin | 139,769,641 | 821,367,999 | 846,317,961 |
Other work performed by the entity and capitalized | 1,187,538 | 11,937,667 | 12,704,315 |
Employee benefits expense | (11,608,563) | (85,228,546) | (70,044,870) |
Depreciation and amortization expense | - | (108,405,664) | (103,836,335) |
Impairment losses | (906,638) | (4,813,372) | (2,057,856) |
Other expenses | (16,295,714) | (73,277,014) | (60,025,087) |
Operating Income | 112,146,264 | 561,581,070 | 623,058,128 |
Other gains, net | 41,806 | (508,842) | 749,878 |
Financial income | 2,779,987 | 59,300,320 | 93,967,597 |
Financial costs | (21,056,624) | (87,794,374) | (65,211,335) |
Share of profit and losses of investments accounted for using the equity method | 6,375,719 | 38,679,661 | 61,598,412 |
Foreign currency exchange gains (losses), net | 25,485,086 | 96,180,972 | (20,192,759) |
Profit before income taxes | 125,772,238 | 667,438,807 | 693,969,921 |
Income tax expense | (46,199,793) | (256,249,256) | (204,051,052) |
NET PROFIT for the year from discontinued operations | 79,572,445 | 411,189,551 | 489,918,869 |
Attributable to |
|
|
|
Shareholders of the parent | 39,759,035 | 180,546,069 | 220,165,543 |
Non-controlling interests | 39,813,410 | 230,643,482 | 269,753,326 |
Components of other comprehensive income (loss) that will not be reclassified subsequently to profit or loss, before income taxes |
|
|
|
Losses from defined benefit plans, net | - | 247,120 | (698,362) |
Components of other comprehensive income (loss) that will be reclassified subsequently to profit or loss, before income taxes |
|
|
|
Foreign currency translation losses, net | (135,953,119) | (245,784,132) | (20,835,470) |
Gains (losses) from available-for-sale financial assets, net | - | (441,549) | - |
Net losses from cash flow hedges and reclassification adjustments on cash flow hedges, net of tax | (1,697,346) | (10,204,780) | (6,445,743) |
Share of other comprehensive income from investments accounted for using the equity method | (213,919) | (1,897,437) | (1,998,473) |
Total other comprehensive loss, before income taxes | (137,864,384) | (258,327,898) | (29,279,686) |
TOTAL COMPREHENSIVE INCOME | (58,291,939) | 153,108,773 | 459,940,821 |
Comprehensive (loss) income attributable to |
|
|
|
Shareholders of the parent | (33,070,495) | 9,868,045 | 236,406,268 |
Non-controlling interests | (25,221,444) | 143,240,728 | 223,534,553 |
TOTAL COMPREHENSIVE INCOME | (58,291,939) | 153,108,773 | 459,940,821 |
|
|
Other comprehensive income amounts accumulated in equity reserves associated with assets and liabilities held for distribution to owners is as follows:
Reserves for | Balance as of | |
3-1-2016 | 12-31-2015 | |
ThCh$ | ThCh$ | |
Exchange differences in foreign currency translation | (263,741,101) | (192,080,845) |
Cash flow hedges | (8,696,789) | (8,022,483) |
Gains and losses on remeasuring available-for-sale financial assets | (118,662) | (118,662) |
Other miscellaneous reserves | (2,561,252) | (1,967,052) |
Total | (275,117,804) | (202,189,042) |
As a result of the classification of the generation and distribution activities located outside of Chile as discontinued operations in 2015, these business lines are not disclosed in Note 33 “Information by Segment”.
|
|
Net cash flows from operating, investing and financing activities, attributable to discontinued operations for the two months ended February 29, 2016 and the years ended December 31, 2015 and 2014 are presented below:
Summary of the net cash flows | Discontinued operations | ||
For 2 months ended | For the years ended | ||
2-29-2016 | 12-31-2015 | 12-31-2014 | |
ThCh$ | ThCh$ | ThCh$ | |
Net cash provided by operating activities | 69,011,031 | 473,002,615 | 567,896,051 |
Net cash used in investing activities | (25,947,761) | (233,343,856) | (136,647,445) |
Net cash provided by (used in) financing activities | 80,160,648 | (430,690,847) | (393,584,765) |
Net increase (decrease) in cash and cash equivalents before the effect of exchange rate changes | 123,223,918 | (191,032,088) | 37,663,841 |
Effect of exchange rate changes on cash and cash equivalents | (24,284,612) | 4,902,989 | (25,440,304) |
Net increase in cash and cash equivalents | 98,939,306 | (186,129,099) | 12,223,537 |
Cash and cash equivalents at the beginning of the year | 112,313,130 | 298,442,229 | 286,218,692 |
Cash and cash equivalents at the end of the year | 211,252,436 | 112,313,130 | 298,442,229 |
|
|
The Spin-off by the Company triggered the Company’s obligation to pay taxes in Peru for a total amount of 577 million Peruvian Soles (approximately ThCh$ 116,053,255). This tax, paid during March 2016, was generated as a result of the application of the Peruvian Income Tax Law to the transfer of the ownership interests, which the Group held in Peru, to Endesa Américas S.A. The tax is calculated as the difference between the disposal value and the acquisition cost of the ownership interests.
Because this payment was directly linked to the Spin-off, the effect has been recognized directly in equity, specifically in other reserves, following the nature of the principal transaction (transaction with shareholders in their capacity as owners).
|
|
During December 2014, the Company and its subsidiary Compañía Eléctrica Tarapacá S.A. (hereinafter “Celta”, a company merged with GasAtacama Chile S.A. on November 1, 2016) entered into a contract to sell to Temsa Private Investment Fund all their shares in Sociedad Concesionaria Túnel El Melón S.A. The contract established a number of conditions precedent, which had not been satisfied at the end of 2014, preventing the closing of the sale. The sale was finalized on January 9, 2015 and resulted in a post-tax gain of ThCh$ 4,207,167 (see Note 30).
Sociedad Concesionaria Túnel El Melón S.A. is a private corporation whose purpose is the construction, maintenance and operation of the public work called the El Melón Tunnel and the provision of ancillary services authorized by the Ministry of Public Works (MOP).
The El Melón Tunnel is an alternative to the road that climbs the El Melón pass, which is located between 126 and 132 kilometers north of Santiago on Route 5. This is the main highway linking the country from Arica to Puerto Montt.
As described in Note 3.j, non-current assets and disposal groups held for sale have been recorded at the lower of their carrying amount and fair value less costs to sell.
The main items of assets, liabilities and cash flows held for sale as of December 31, 2014
6. ARGENTINA’S HYPERINFLATIONARY ECONOMY
Since July 2018 Argentina’s economy is considered hyper-inflationary under the provisions of International Accounting Standard No. 29 - Financial Reporting in Hyperinflationary Economies. A number of qualitative and quantitative criteria led to this qualification; chief among them is the cumulative inflation rate over three years exceeding 100%.
In accordance with the provisions of IAS 29, the financial statements of the Argentine branch owned by GasAtacama Group in which Enel Generación Chile has an interest have been retrospectively restated by applying a general price index to the historical cost, in order to reflect changes in the purchasing power of the Argentine currency as of the closing date of these financial statements.
Considering that Enel Generación Chile functional and presentation currency is not that of a hyper-inflationary economy, according to the guidelines of IAS 29, the restatement of comparative periods is not required in the Group’s consolidated financial statements.
The general price indices used at the close of the reporting periods are as follows:
|
(*) Source National Institute of Statistics and Censuses of Argentina (INDEC, in its Spanish acronym). Following, a summary of the effect on consolidated comprehensive income of Enel Generación: |
(*) Corresponds to the financial effect from the application of IAS 29 “Financial Reporting in Hyperinflationary Economies”, which arises from gain/loss on the net position of monetary assets and liabilities, as defined by IAS 29. This profit or loss is determined by restating non-monetary assets and liabilities, as well as those income statement accounts that have not already been updated (see Note 32). a) The detail of cash and cash equivalents as of December 31, 2018 and 2017, is a follows:
Time deposits included in cash and cash equivalents represent interest-bearing time deposits with original maturity of less or equal to 90 days. Other fixed-income investments are mainly comprised of repurchase agreements with original maturities of less than or equal to 90 days. There is no significant available cash held by the Group that is restricted. b) The detail of cash and cash equivalents by currency is as follows:
c) The following table presents the proceeds received from the sale of ownership interest in the associate Electrogas S.A.: |
| ||||||||||||||||||||||||||||||||||||||||||||||||||||||||||||||||||||||||||||||||||||||||||||||||||||||||||||||||||||||||||||||||||||||||||||||||||||||||||||||||||||||||||||||||||||||||||||||||||||||||||||||||||||||||||||||||||||||||||||||||||||||||||||||||||||||||||||||||||||||||||||||||||||||||||||||||||||||||||||||||||||||||||||||||||||||||||||||||||||||||||||||||||||||||||||||||||||||||||||||||||||||||||||||||||||||||||||||||||||||||||||||||||||||||||||||||||||||||||||||||||||||||||||||||||||||||||||||||||||||||||||||||||||||||||||||||||||||||||||||||||||||||||||||||||||||||||||||||||||||||||||||||||||||||||||||||||||||||||||||||||||||||||||||||||||||||||||||||||||||||||||||||||||||||||||||||||||||||||||||||||||||||||||||||||||||||||||||||||||||||||||||||||||||||||||||||||||||||||||||||||||||||||||||||||||||||||||||||||||||||||||||||||||||||||||||||||||||||||||||||||||||||||||||||||||||||||||||||||||||||||||||||||||||||||||||||||||||||||||||||||||||||||||||||||||||||||||||||||||
|
| ||||||||||||||||||||||||||||||||||||||||||||||||||||||||||||||||||||||||||||||||||||||||||||||||||||||||||||||||||||||||||||||||||||||||||||||||||||||||||||||||||||||||||||||||||||||||||||||||||||||||||||||||||||||||||||||||||||||||||||||||||||||||||||||||||||||||||||||||||||||||||||||||||||||||||||||||||||||||||||||||||||||||||||||||||||||||||||||||||||||||||||||||||||||||||||||||||||||||||||||||||||||||||||||||||||||||||||||||||||||||||||||||||||||||||||||||||||||||||||||||||||||||||||||||||||||||||||||||||||||||||||||||||||||||||||||||||||||||||||||||||||||||||||||||||||||||||||||||||||||||||||||||||||||||||||||||||||||||||||||||||||||||||||||||||||||||||||||||||||||||||||||||||||||||||||||||||||||||||||||||||||||||||||||||||||||||||||||||||||||||||||||||||||||||||||||||||||||||||||||||||||||||||||||||||||||||||||||||||||||||||||||||||||||||||||||||||||||||||||||||||||||||||||||||||||||||||||||||||||||||||||||||||||||||||||||||||||||||||||||||||||||||||||||||||||||||||||||||||||||
(*) See Note 5.1
Table of Contents d) Reconciliation of liabilities arising from financing activities: Financing Cash Flows Non-Cash Changes Balance as of From Used Interest paid Total Changes in fair Foreign exchange Financial costs Other changes Balance as of ThCh$ ThCh$ ThCh$ ThCh$ ThCh$ ThCh$ ThCh$ ThCh$ ThCh$ ThCh$ Liabilities arising from financing activities Bank loans 109 — — (22,681 ) (22,681 ) — — 22,576 — 4 Unsecured obligations 763,579,585 — (5,654,112 ) (42,860,557 ) (48,514,669 ) — 66,096,234 45,333,098 — 826,494,248 Finance leases 14,608,914 — (1,889,685 ) (739,070 ) (2,628,755 ) — 1,757,221 739,070 — 14,476,450 Financial derivatives for hedging (29,478,642 ) — — (3,496,889 ) (3,496,889 ) 48,389,489 34,349,104 3,569,025 (7,676,501 ) 45,655,586 Loans to related parties 985 69,204,437 (66,540,959 ) (76,123 ) 2,587,355 — — 543,601 (755,371 ) 2,376,570 Other obligations — — (478,035 ) — (478,035 ) — — 478,035 — — Total 748,710,951 69,204,437 (74,562,791 ) (47,195,320 ) (52,553,674 ) 48,389,489 102,202,559 50,685,405 (8,431,872 ) 889,002,858 Financing Cash Flows Non-Cash Changes Balance as of From Used Interest paid Total Changes in fair Foreign exchange Financial costs Other changes Balance as of ThCh$ ThCh$ ThCh$ ThCh$ ThCh$ ThCh$ ThCh$ ThCh$ ThCh$ ThCh$ Liabilities arising from financing activities Bank loans 4,172 — (4,156 ) (169 ) (4,325 ) — — 262 — 109 Unsecured obligations 802,306,161 — (5,530,327 ) (43,514,578 ) (49,044,905 ) — (33,226,098 ) 43,544,427 — 763,579,585 Finance leases 17,749,647 — (1,781,064 ) (811,172 ) (2,592,236 ) — (1,359,668 ) 811,171 — 14,608,914 Financial derivatives for hedging 23,640,893 — — (3,543,399 ) (3,543,399 ) (25,059,561 ) (23,488,915 ) 3,473,938 (4,501,598 ) (29,478,642 ) Loans to related parties 39,211 31,680,253 (31,680,253 ) (805,551 ) (805,551 ) — — 767,325 — 985 Other obligations — — — (1,305,388 ) (1,305,388 ) — — 1,305,388 — — Total 843,740,084 31,680,253 (38,995,800 ) (49,980,257 ) (57,295,804 ) (25,059,561 ) (58,074,681 ) 49,902,511 (4,501,598 ) 748,710,951 The detail of other financial assets as of December 31, 2018 and 2017 is as follows: Balance as of 12-31-2018 12-31-2017 Current Non-Current Current Non-Current ThCh$ ThCh$ ThCh$ ThCh$ Other Financial Assets Financial assets at fair value with change in profit or loss — — — 6,353 Financial assets at fair value with change in other comprehensive income 269,031 2,326,484 — 2,595,342 Hedging derivatives (*) 38,169,894 — 20,038,433 30,789,703 Non- hedging derivatives 41,022 36,086 402,716 — Financial assets measured at amortized cost 84,580 — 82,127 — Total 38,564,527 2,362,570 20,523,276 33,391,398 (*) See Note 21.2.a. 9. OTHER NON-FINANCIAL ASSETS AND LIABILITIES a.Other non-financial assets Details of other non-financial assets as of December 31, 2018 and 2017 are as follows: Balance as of 12-31-2018 12-31-2017 ThCh$ ThCh$ Other current non-financial assets VAT Tax Credit and Other Taxes 7,780,245 10,913,120 Other 3,057,997 2,223,339 Total 10,838,242 13,136,459 Balance as of 12-31-2018 12-31-2017 ThCh$ ThCh$ Other non-current non-financial assets PPM water rights 5,763,496 5,300,052 Spare parts with consumption schedule over 12 months 4,324,153 5,444,789 Deposits in guarantee 1,379,970 1,379,970 Other 1,077,680 728,648 Total 12,545,299 12,853,459 b.Other non-financial liabilities Details of other non-financial liabilities as of December 31, 2018 and 2017 are as follows: Balance as of 12-31-2018 12-31-2017 ThCh$ ThCh$ Other current non-financial liabilities VAT Dedit Tax and Other Taxes 22,542,716 12,721,365 Tax for the payment of the Central Eólica Canela S.A. — 6,795,376 Other — 47,957 Total 22,542,716 19,564,698 10.TRADE AND OTHER RECEIVABLES i. The detail of trade and other receivables as of December 31, 2018 and 2017 is as follows: Balance as of 12-31-2018 12-31-2017 Current Non-Current Current Non-Current Trade and Other Receivables, Gross ThCh$ ThCh$ ThCh$ ThCh$ Trade and other receivables, gross 240,978,763 1,156,638 208,467,637 1,032,923 Trade receivables, gross 205,542,774 21,255 195,570,350 62,563 Other receivables, gross 35,435,989 1,135,383 12,897,287 970,360 Balance as of 12-31-2018 12-31-2017 Current Non-Current Current Non-Current Trade and Other Receivables, Net ThCh$ ThCh$ ThCh$ ThCh$ Trade and other receivables, net 239,425,507 1,156,638 207,208,820 1,032,923 Trade receivables, net 203,989,518 21,255 194,311,533 62,563 Other receivables, net 35,435,989 1,135,383 12,897,287 970,360 The balances in this account do not generally accrue interest. The Group did not have any customers for which it had sales representing 10% or more of the Group’s total consolidated revenues for the years ended December 31, 2018 and 2017. Refer to Note 11.1 for detailed information on amounts, terms and conditions associated with accounts receivable from related parties. ii. As of December 31, 2018 and 2017 the balance of unimpaired past due trade receivables is as follows: Balance as of 12-31-2018 12-31-2017 Trade Receivables Past Due But Not Impaired ThCh$ ThCh$ Less than three months 4,601,076 3,670,172 Between three and six months 46,499 386,333 Between six and twelve months 887,726 1,121,940 Total 5,535,301 5,178,445 Cash and cash equivalents Balance as of 12-31-2016 12-31-2015 Cash balances 31,293 4,759 Bank balances 24,787,424 10,802,821 Time deposits 17,325,478 971,873 Other fixed-income instruments 72,342,284 25,645,780 Total 114,486,479 37,425,233 Currency Balance as of 12-31-2016 12-31-2015 Chilean peso 105,038,095 27,625,086 Argentine peso 4,807,406 5,531,184 U.S. dollar 4,640,978 4,268,963 Total 114,486,479 37,425,233 Cash and cash equivalents Balance as of 12-31-2016 12-31-2015 Cash and cash equivalents (statement of financial position) 114,486,479 37,425,233 Cash and cash equivalents attributable to assets held for sale or distribution to owners (*) - 112,313,130 Cash and cash equivalents (statement of cash flow) 114,486,479 149,738,363 Other Financial Assets Balance as of 12-31-2016 12-31-2015 Current Non-Current Current Non-Current ThCh$ ThCh$ ThCh$ ThCh$ Available-for-sale financial investments - quoted equity securities - 407 - 389 Available-for-sale financial investments – non-quoted equity securities or with limited liquidity - 2,616,240 - 3,001,868 Hedging derivatives (*) 121,443 25,533,188 76,703 18,716,463 Financial assets held-to-maturity 365,663 652,733 934,852 - Total 487,106 28,802,568 1,011,555 21,718,720 Trade and Other Receivables, Gross Balance as of 12-31-2016 12-31-2015 Current Non-Current Current Non-Current ThCh$ ThCh$ ThCh$ ThCh$ Trade and other receivables, gross 261,754,397 6,788,437 365,024,469 35,901 Trade receivables, gross 214,479,114 5,751,510 271,783,505 35,901 Other receivables, gross 47,275,283 1,036,927 93,240,964 - Trade and Other Receivables, Net Balance as of 12-31-2016 12-31-2016 Current Current Current Current ThCh$ ThCh$ ThCh$ ThCh$ Trade and other receivables, net 260,440,086 6,788,437 363,475,277 35,901 Trade and other receivables, net 213,164,803 5,751,510 270,234,313 35,901 Other receivables, net 47,275,283 1,036,927 93,240,964 - Trade Receivables Past Due But Not Impaired Balance as of 12-31-2016 12-31-2015 ThCh$ ThCh$ Less than three months 4,709,261 1,122,810 Between three and six months 6,014,819 522 Between six and twelve months 13,747,986 411,387 More than twelve months 10,508,696 64,125,613 Total 34,980,762 65,660,332 The reconciliation of changes in the allowance for impairment of trade receivables is as follows: Current and Non-current Trade Receivables Past Due and Impaired ThCh$ Balance as of January 1, 2017 1,314,311 Increases (decreases) (55,494 ) Receivables from related parties Balance as of Taxpayer ID No. (RUT) Company Description of the transaction Term of the transaction Relationship Currency Country 12-31-2016 12-31-2015 Current ThCh$ ThCh$ 96.800.570-7 Enel Distribución Chile S.A. (*) Energy sales Less than 90 days Common control Ch$ Chile 35,228,094 44,709,413 96.800.570-7 Enel Distribución Chile S.A. (*) Dividends Less than 90 days Common control Ch$ Chile 26 - 96.800.570-7 Enel Distribución Chile S.A. (*) Other services Less than 90 days Common control Ch$ Chile 15,840 501,764 Foreign Enel Generación Piura S.A. Other services Less than 90 days Common control Ch$ Peru 346,061 - 96.783.910-8 Empresa Eléctrica de Colina Ltda. Energy sales Less than 90 days Common control Ch$ Chile 22 3,009 96.783.910-8 Empresa Eléctrica de Colina Ltda. Tolls Less than 90 days Common control Ch$ Chile 22,944 - 94.271.000-3 Enel Américas S.A. Other services Less than 90 days Parent Ch$ Chile 152,290 - 76.536.353-5 Enel Chile S.A. (*) Other services Less than 90 days Parent Ch$ Chile 251,977 265,162 Foreign Generalima S.A. Other services Less than 90 days Common control Ch$ Peru 341,948 - 76.418.940-K GNL Chile S.A. Anticipated gas purchase Less than 90 days Associate US$ Chile 16,780,275 15,570,315 76.418.940-K GNL Chile S.A. Loans Less than 90 days Associate US$ Chile - 1,498,339 76.788.080-4 GNL Quintero S.A. Energy sales Less than 90 days Associate Ch$ Chile - 571,118 76.107.186-6 Servicios Informáticos e Inmobiliarios Ltda. Other services Less than 90 days Common control Ch$ Chile 60,740 18,277 96.800.460-3 Luz Andes Ltda. Energy sales Less than 90 days Common control Ch$ Chile 2 2 96.800.460-3 Luz Andes Ltda. Tolls Less than 90 days Common control Ch$ Chile 4,917 460 96.806.130-5 Electrogas S.A. Dividends Less than 90 days Associate Ch$ Chile - 1,849,765 96.524.140-K Empresa Eléctrica Panguipulli S.A. Energy sales Less than 90 days Common control Ch$ Chile 129,755 86,713 96.524.140-K Empresa Eléctrica Panguipulli S.A. Other services Less than 90 days Common control Ch$ Chile 198 198 96.880.800-1 Empresa Eléctrica Puyehue S.A. Energy sales Less than 90 days Common control Ch$ Chile 64 64 Foreign Enel Brasil S.A. Other services Less than 90 days Associate Ch$ Brazil 2,097,313 - Foreign PH Chucas S.A. Other services Less than 90 days Common control Ch$ Costa Rica 1,614,168 1,188,564 Foreign Endesa Generación S.A. Commodity derivatives Less than 90 days Common control Ch$ Spain 587,224 1,858,366 Foreign Endesa Generación S.A. Other services Less than 90 days Common control U.F Spain 36,067 - Foreign Endesa Energía S.A. Other services Less than 90 days Common control Ch$ Spain - 232,867 76.126.507-5 Parque Eólico Talinay Oriente S.A. Energy sales Less than 90 days Common control Ch$ Chile 142,926 59,786 76.126.507-5 Parque Eólico Talinay Oriente S.A. Tolls Less than 90 days Common control Ch$ Chile 8 - Foreign Endesa España S.A. Other services Less than 90 days Common control Ch$ Spain 13,077 - 76.179.024-2 Parque Eólico Tal Tal S.A. Energy sales Less than 90 days Common control Ch$ Chile 243,946 215,977 76.321.458-3 Almeyda Solar S.p.A. Energy sales Less than 90 days Common control Ch$ Chile 98,353 91,443 76.052.206-6 Parque Eólico Valle de los Vientos S.A. Energy sales Less than 90 days Common control Ch$ Chile 81,377 125,727 Foreign Compania Energetica Veracruz S.A.C. Other services Less than 90 days Common control Ch$ Peru 639,233 - Foreign Enel Italia Servizi SRL Other services Less than 90 days Common control Ch$ Italy 8,144 - Foreign Enel S.p.A Other services Less than 90 days Parent Ch$ Italy 125,960 - Foreign Enel Trade S.p.A Commodity derivatives Less than 90 days Common control Ch$ Italy 22,321,017 20,397 Foreign Emgesa S.A. Other services Less than 90 days Common control Ch$ Colombia 29,989 - Foreign Enel Generación Perú S.A. Other services Less than 90 days Common control Ch$ Peru 1,328,268 - 76.412.562-2 Enel Green Power del Sur S.p.A Energy sales Less than 90 days Common control Ch$ Chile 25,558 - Total 82,727,781 68,867,726 Payables to related parties Balance as of Taxpayer ID No. (RUT) Company Description of the transaction Term of the transaction Relationship Currency Country 12-31-2016 12-31-2015 Current Non-Current Current Non-Current ThCh$ ThCh$ ThCh$ ThCh$ Foreign Comercializadora de Energía del Mercosur S.A. Other services Less than 90 days Associate Ar$ Argentina 13,574 - 17,836 - 96.800.570-7 Enel Distribución Chile S.A. (*) Other services Less than 90 days Common control Ch$ Chile 124 - 57,024 - 96.800.570-7 Enel Distribución Chile S.A. (*) Tolls Less than 90 days Common control Ch$ Chile 7,264,883 - 8,996,228 - 96.806.130-5 Electrogas S.A. Other services Less than 90 days Associate Ch$ Chile 257,060 - 641,113 - 96.806.130-5 Electrogas S.A. Tolls Less than 90 days Associate Ch$ Chile 74,388 - 77,049 - 76.536.353-5 Enel Chile S.A. (*) Other services Less than 90 days Parent Ch$ Chile 1,709,803 - 1,436,317 - 76.536.353-5 Enel Chile S.A. (*) Dividends Less than 90 days Parent Ch$ Chile 85,032,236 - 47,843,968 - 94.271.000-3 Enel Américas S.A. Loans Less than 90 days Parent Ch$ Chile - - 177,747,326 - 94.271.000-3 Enel Américas S.A. Other services Less than 90 days Parent CP Chile 14,457 - - - 76.418.940-K GNL Chile S.A. Gas purchase Less than 90 days Associate Ch$ Chile 4,872,264 - 6,357,467 - 76.107.186-6 Servicios Informáticos e Inmobiliarios Ltda. Other services Less than 90 days Common control Ch$ Chile 682,650 - 1,457,580 - 96.524.140-K Empresa Eléctrica Panguipulli S.A. Energy purchase Less than 90 days Common control Ch$ Chile 1,285,768 - 334,425 - Foreign Endesa Generación S.A. Carbon purchase Less than 90 days Common control Ch$ Spain 486,180 - 309,558 - Foreign Endesa Generación S.A. Other services Less than 90 days Common control Ch$ Spain 379,731 - 482,211 - Foreign Endesa Generación S.A. Commodity derivatives Less than 90 days Common control Ch$ Spain - - 2,899,021 - Foreign Enel Iberoamérica SRL Other services Less than 90 days Parent Ch$ Spain 183,607 - 419,898 - Foreign Enel Produzione S.p.A. Other services Less than 90 days Common control Ch$ Italy - - 216,599 97,186 77.017.930-0 Transmisora Eléctrica de Quillota Ltda. Other services Less than 90 days Joint Ventures Ch$ Chile - - 258,625 - 77.017.930-0 Transmisora Eléctrica de Quillota Ltda. Tolls Less than 90 days Joint Ventures Ch$ Chile 332,709 - - - Foreign Enel Ingegneria & Ricerca S.p.A Other services Less than 90 days Common control Ch$ Italy 6,343,845 251,527 4,295,894 - 76.126.507-5 Parque Eólico Talinay Oriente S.A. Energy purchase Less than 90 days Common control Ch$ Chile 48,432 - 50,757 - Foreign Enel Brasil S.A. Other services Less than 90 days Associate Ch$ Brazil 85,864 - 76,021 - 76.179.024-2 Parque Eólico Tal Tal S.A. Energy purchase Less than 90 days Common control Ch$ Chile 2,171,862 - 2,196,983 - 76.321.458-3 Almeyda Solar S.p.A Energy purchase Less than 90 days Common control Ch$ Chile 2,283 - 113 - 76.052.206-6 Parque Eólico Valle de los Vientos S.A. Energy purchase Less than 90 days Common control Ch$ Chile 475 - 1,162,999 - Foreign Enel S.p.A Other services Less than 90 days Parent Euro Italy 79,990 - 11,849 - Foreign Enel Trade S.p.A Commodity derivatives Less than 90 days Common control Ch$ Italy 1,103,206 - - - Foreign Enel Trade S.p.A Other services Less than 90 days Common control Ch$ Italy 571,754 - 237,624 - 76.412.562-2 Enel Green Power del Sur S.p.A Energy purchase Less than 90 days Common control Ch$ Chile 7,406,880 - - - 76.412.562-2 Enel Green Power del Sur S.p.A Tolls Less than 90 days Common control Ch$ Chile 42,901 - - - 76.412.562-2 Enel Green Power del Sur S.p.A Other services Less than 90 days Common control Ch$ Chile 87,448 - - - Foreign Enel Produzione S.p.A. Other services Less than 90 days Common control Euro Italy 483,665 - - - Total 121,018,039 251,527 257,584,485 97,186 Transactions with effects on income/expenses For the years ended Taxpayer ID No. (RUT) Company Relationship Description of Transaction Country 12-31-2016 12-31-2015 12-31-2014 ThCh$ ThCh$ ThCh$ 96.800.570-7 Enel Distribución Chile S.A. (*) Common control Energy sales Chile 374,962,639 337,882,270 262,011,113 96.800.570-7 Enel Distribución Chile S.A. (*) Common control Services provided Chile 34,506,435 30,650,096 17,612,598 96.800.570-7 Enel Distribución Chile S.A. (*) Common control Services received Chile - - (82,255) 96.800.570-7 Enel Distribución Chile S.A. (*) Common control Electricity tolls Chile (29,498,711) (28,371,022) (11,335,478) 96.783.910-8 Empresa Eléctrica de Colina Ltda. Common control Electricity tolls Chile 42,779 21,641 31,007 96.783.910-8 Empresa Eléctrica de Colina Ltda. Parent Services provided Chile 2,233 - - 94.271.000-3 Enel Américas S.A. Parent Services provided Chile 498,284 1,467,189 1,380,813 94.271.000-3 Enel Américas S.A. Parent Loans Chile (1,589,749) (4,545,877) (14,263,659) 94.271.000-3 Enel Américas S.A. Parent Services received Chile (979,655) (6,283,408) (5,069,370) 76.536.353-5 Enel Chile S.A. (*) Parent Services provided Chile 1,134,766 - - 76.536.353-5 Enel Chile S.A. (*) Parent Loans Chile (420,867) - - 76.536.353-5 Enel Chile S.A. (*) Parent Services received Chile (5,148,683) - - Foreign Empresa Distribuidora Sur S.A. Common control Services received Argentina (151,365) (1,281,486) (118,566) Foreign Empresa Distribuidora Sur S.A. Common control Energy sales Argentina 1,879 15,903 17,099 96.800.460-3 Luz Andes Ltda. Common control Electricity tolls Chile 6,294 1,907 3,369 Foreign Compañía Distribuidora y Comercializadora de Energía S.A. Common control Energy sales Colombia 19,901,620 69,490,689 106,451,872 Foreign Compañía Distribuidora y Comercializadora de Energía S.A. Common control Energy purchase Colombia (128,794) (838,185) (1,015,099) Foreign Compañía Distribuidora y Comercializadora de Energía S.A. Common control Services provided Colombia 15,714 97,342 112,364 Foreign Compañía Distribuidora y Comercializadora de Energía S.A. Common control Services received Colombia (17,587) (142,605) (147,705) Foreign Compañía Distribuidora y Comercializadora de Energía S.A. Common control Loans Colombia 11,355 (12,947) - Foreign Compañía Distribuidora y Comercializadora de Energía S.A. Common control Electricity tolls Colombia (3,864,016) (24,597,268) (26,321,732) Foreign Comercializadora de Energía del Mercosur S.A. Associate Services received Argentina (56,368) (525,165) (540,848) Foreign Empresa de Distribución Eléctrica de Lima Norte S.A.A. Common control Energy sales Peru 16,304,643 71,454,196 63,798,914 Foreign Empresa de Distribución Eléctrica de Lima Norte S.A.A. Common control Electricity tolls Peru (102,171) 16,442,636 (141,495) Foreign Empresa de Distribución Eléctrica de Lima Norte S.A.A. Common control Services provided Peru 4,889,644 - 11,966,790 Foreign Empresa de Distribución Eléctrica de Lima Norte S.A.A. Common control Services received Peru - (523,969) - Foreign Endesa Latinoamericana S.A. Common control Services received Spain (12,388) - - Foreign Enel Brasil S.A. Associate Services provided Brazil 2,044,935 - - Foreign Endesa Generación S.A. Common control Fuel consumption Spain (66,297,066) (15,030,911) (30,318,202) Foreign Endesa Generación S.A. Common control Commodity derivatives Spain - (2,144,063) (2,521,138) Foreign Endesa Generación S.A. Common control Services received Spain - (23,329) - Foreign Endesa Generación S.A. Common control Services provided Spain - - 17,157 Foreign Enel Generación Piura S.A. Common control Energy sales Peru 34,935 320,120 67,108 Foreign Enel Generación Piura S.A. Common control Energy purchase Peru (308,224) (2,337,992) (2,879,068) Foreign Enel Generación Piura S.A. Common control Services provided Peru 222,826 608,437 264,024 Foreign Enel Generación Piura S.A. Common control Services received Peru - (192) - Foreign Enel Generación Piura S.A. Common control Loans Peru (520) (27,502) - Foreign Generalima S.A. Common control Services provided Peru 108,817 151,907 3,126,444 Foreign Empresa de Energía de Cundinamarca S.A. Common control Electricity tolls Colombia (194,805) (1,076,426) (1,055,225) Foreign Empresa de Energía de Cundinamarca S.A. Common control Energy sales Colombia 1,161,383 4,239,620 3,230,442 76.788.080-4 GNL Quintero S.A. Associate Energy sales Chile 2,356,971 3,260,734 2,671,120 76.788.080-4 GNL Quintero S.A. Associate Services received Chile (37,162) - - 76.788.080-4 GNL Quintero S.A. Associate Services provided Chile 960,390 650,390 956,854 76.788.080-4 GNL Quintero S.A. Associate Electricity tolls Chile (71,599) 151,088 47,263 Foreign Compañía de Transmisión del Mercosur S.A. Common control Electricity tolls Argentina (95,813) (811,173) (805,099) 96.806.130-5 Electrogas S.A. Associate Gas tolls Chile (3,625,100) (3,296,956) (3,409,581) 96.806.130-5 Electrogas S.A. Associate Fuel consumption Chile (553,905) (952,044) (434,289) 76.418.940-K GNL Chile S.A. Associate Gas consumption Chile (116,391,269) (123,964,573) (114,115,041) 76.418.940-K GNL Chile S.A. Associate Loans Chile (436) 81,749 58,169 76.418.940-K GNL Chile S.A. Associate Gas transportation Chile (49,418,058) (52,195,582) (39,638,398) 76.418.940-K GNL Chile S.A. Associate Services provided Chile 82,762 54,377 56,042 76.107.186-6 Servicios Informáticos e Inmobiliarios Ltda. Common control Services received Chile (925,095) (826,358) (954,995) Transactions with effects on income/expenses For the years ended Taxpayer ID No. (RUT) Company Relationship Description of Transaction Country 12-31-2016 12-31-2015 12-31-2014 ThCh$ ThCh$ ThCh$ Servicios Informáticos e Inmobiliarios Ltda. Common control Services provided Chile 159,606 17,780 14,419 79.913.810-7 Inmobiliaria Manso de Velasco S.A. Common control Services provided Chile - - 5,526 96.524.140-K Empresa Eléctrica Panguipulli S.A. Common control Energy sale Chile 248,136 286,833 942,615 96.524.140-K Empresa Eléctrica Panguipulli S.A. Common control Energy purchase Chile (5,064,692) (5,713,909) (8,117,834) 96.524.140-K Empresa Eléctrica Panguipulli S.A. Common control Services provided Chile - 2,292 6,433 96.524.140-K Empresa Eléctrica Panguipulli S.A. Common control Electricity tolls Chile (67,341) (61,307) (152,045) 96.880.800-1 Empresa Eléctrica Puyehue S.A. Common control Energy sale Chile - - 34,008 96.880.800-1 Empresa Eléctrica Puyehue S.A. Common control Energy purchase Chile - - (3,805) 96.880.800-1 Empresa Eléctrica Puyehue S.A. Common control Electricity tolls Chile - - (12,399) Foreign Companhía Interconexao Energética S.A. Common control Electricity tolls Brazil 95,813 811,173 805,099 Foreign Enel Iberoamérica SRL Parent Services provided Spain (167,186) (363,777) (722,172) 76.652.400-1 Centrales Hidroeléctricas de Aysén S.A. Associate Loans Chile - (9,322) - 76.652.400-1 Centrales Hidroeléctricas de Aysén S.A. Associate Services provided Chile - - 23,891 77.017.930-0 Transmisora Eléctrica de Quillota Ltda. Associate Electricity tolls Chile (1,537,963) (1,473,974) (1,378,743) 76.412.562-2 Enel Green Power del Sur S.p.A Common control Energy sale Chile 48,337 - - 76.412.562-2 Enel Green Power del Sur S.p.A Common control Energy purchase Chile (34,954,457) - - 76.014.570-K GasAtacama Chile S.A. (**) Joint Venture Energy purchase Chile - - (3,322,616) 76.014.570-K GasAtacama Chile S.A. (**) Joint Venture Gas transportation Chile - - (7,764,442) 76.014.570-K GasAtacama Chile S.A. (**) Joint Venture Loans Chile - - 229,609 76.014.570-K GasAtacama Chile S.A. (**) Joint Venture Energy sale Chile - - 1,858,318 76.014.570-K GasAtacama Chile S.A. (**) Joint Venture Services received Chile - - (5,487) Foreign PH Chucas S.A. Common control Services provided Costa Rica 425,604 1,188,564 - Foreign Central Dock Sud S.A. Common control Services provided Argentina 454 3,383 2,442 Foreign Endesa Energía S.A. Common control Gas sale Spain 18,655,911 14,604,841 - Foreign Endesa Energía S.A. Common control Fuel consumption Spain (134,393) - - Foreign Endesa Energía S.A. Common control Services provided Spain - 226,509 - 76.126.507-5 Parque Eólico Talinay Oriente SA Common control Energy purchase Chile (471,210) (502,332) (5,141,673) 76.126.507-5 Parque Eólico Talinay Oriente SA Common control Energy sale Chile 129,418 153,158 - Foreign Enel Ingegneria & Ricerca Common control Services received Italy (772,044) (2,140,170) (437,196) 96.764.840-k Construcciones y Proyectos Los Maitenes S.A. Common control Services provided Chile - - 9,305 Foreign Enel Trade S.p.A Common control Commodity derivatives Italy 7,012,879 (833,366) - Foreign Enel Trade S.p.A Common control Services received Italy - (216,437) - Foreign Enel Trade S.p.A Common control Services provided Italy - - 3,222 Foreign Endesa España S.A. Common control Services received Spain (7,528) (74,767) - 76.179.024-2 Parque Eólico Tal Tal S.A. Common control Energy purchase Chile (26,796,385) (26,456,123) - 76.179.024-2 Parque Eólico Tal Tal S.A. Common control Energy sale Chile 49,477 217,448 - 76.052.206-6 Parque Eólico Valle de los Vientos SA Common control Energy purchase Chile (14,802,199) (14,929,463) - 76.052.206-6 Parque Eólico Valle de los Vientos SA Common control Energy sale Chile 697,970 670,035 - 76.321.458-3 Almeyda Solar S.P.A Common control Energy purchase Chile (35,362) (289,186) - 76.321.458-3 Almeyda Solar S.P.A Common control Energy sale Chile 98,994 87,080 - Foreign Compania Energetica Veracruz S.A.C. Common control Services provided Peru 52,524 1,058,037 - Foreign Enel Produzione S.p.A. Common control Services received Italy (40,217) (403,404) - Foreign Endesa Latinoamericana S.A. Parent Services received Spain - (89,075) - Foreign Empresa de Distribución Eléctrica de Lima Norte S.A.A. Common control Loans Peru - (1,747) - Foreign Enel S.p.A Parent Services received Italy (475,401) - - Foreign Enel S.p.A Parent Services received Italy (35,949) (1,166,150) - Foreign Enel Generación Perú S.A. Common control Services received Peru (125,069) - - Foreign Enel Global Trading S.p.A. Common control Services received Italy (13,114) - - 76.536.351-9 Endesa Américas S.A. Common control Services provided Chile 641,087 - - Foreign Enel Argentina S.A. (formerly named Endesa Argentina S.A.) Common control Services received Argentina (972) - - Total 122,176,626 231,835,882 195,589,794 1,258,817 Initial Balance Adjustment by IFRS 9 193,538 Increases (decreases) for the 100,900 Foreign currency translation differences 1 Balance as of Write-offs of bad debt Past-due debt is written off once all collection measures and legal proceedings have been exhausted and the debtors’ insolvency has been demonstrated. In our power generation business, this process normally takes at least one year of procedures. iii.Additional information: · Additional statistical information required under Official Bulletin 715 of the CMF of February 3, 2012, XBRL Taxonomy: see Appendix 5. · Supplemental information on trade receivables: see Appendix 5.1. 11. BALANCES AND TRANSACTIONS WITH RELATED PARTIES Related party transactions are performed at current market conditions. Transactions between the Company and its subsidiaries have been eliminated on consolidation and are not itemized in this note. As of the date of these consolidated financial statements, no guarantees have been given or received nor has any allowance for bad or doubtful accounts been recognized with respect to receivable balances for related party transactions. 11.1 Balances and transactions with related parties The balances of accounts receivable and payables between the Company and its non-consolidated related parties are as follows: a)Receivables from related parties: Receivables from related parties Balance as of 12-31-2018 12-31-2017 Taxpayer ID Company Description of the transaction Term of the transaction Relationship Currency Country Current Non-Current Current Non-Current 96.800.570-7 Enel Distribución Chile S.A. Energy sales Less than 90 days Common control CH$ Chile 76,767,486 — 42,378,091 — 96.800.570-7 Enel Distribución Chile S.A. Tolls Less than 90 days Common control CH$ Chile 19,880 — 10,673 — 96.800.570-7 Enel Distribución Chile S.A. Dividends Less than 90 days Common control CH$ Chile — — — — 96.800.570-7 Enel Distribución Chile S.A. Other services Less than 90 days Common control CH$ Chile 567,261 — 94,981 — Foreign Enel Generación Piura S.A. Other services Less than 90 days Common control CH$ Peru 89,545 — 165,875 — 96.783.910-8 Empresa Eléctrica de Colina Ltda. Energy sales Less than 90 days Common control CH$ Chile — — — — 96.783.910-8 Empresa Eléctrica de Colina Ltda. Tolls Less than 90 days Common control CH$ Chile 8,207 — 33 — 96.783.910-8 Empresa Eléctrica de Colina Ltda. Other services Less than 90 days Common control CH$ Chile 576 — 111 — 94.271.000-3 Enel Américas S.A. Other services Less than 90 days Common control CH$ Chile 106,878 — 54,949 — 76.536.353-5 Enel Chile S.A. Current account Less than 90 days Parent CH$ Chile 14,440,679 — — — 76.536.353-5 Enel Chile S.A. Other services Less than 90 days Parent CH$ Chile 806,932 — 188,902 — 76.091.595-5 Aysen Energía S.A Other services Less than 90 days Common control CH$ Chile 14,286 — — — 76.041.891-9 Aysen Transmision S.A Other services Less than 90 days Common control CH$ Chile 14,286 — — — 76.722.488-5 Empresa de Transmision Chena S.A Tolls Less than 90 days Common control CH$ Chile 6 — — — 94.271.000-3 Enel Americas S.A Dividends Less than 90 days Common control CH$ Chile 193 — — — Foreign Generalima S.A. Other services Less than 90 days Common control CH$ Peru — — — — 76.418.940-K GNL Chile S.A. Anticipated gas purchase Less than 90 days Associate US$ Chile 14,666,414 — 18,793,098 — 76.418.940-K GNL Chile S.A. Dividends Less than 90 days Associate US$ Chile 788,336 — — — 76.788.080-4 GNL Quintero S.A. Energy sales Less than 90 days Associate CH$ Chile — — — — 76.107.186-6 Servicios Informáticos e Inmobiliarios Ltda. Other services Less than 90 days Common control CH$ Chile — — — — 96.800.460-3 Luz Andes Ltda. Energy sales Less than 90 days Common control CH$ Chile — — — — 96.800.460-3 Luz Andes Ltda. Tolls Less than 90 days Common control CH$ Chile 3,351 — 9 — Foreign Enel Generación El Chocon S.A Other services Less than 90 days Common control US$ Argentina 13,367 — — — 96.806.130-5 Electrogas S.A. Dividends Less than 90 days Associate CH$ Chile — — — — 96.524.140-K Empresa Eléctrica Panguipulli S.A. Energy sales Less than 90 days Common control CH$ Chile 9,094 — 1,031,122 — 96.524.140-K Empresa Eléctrica Panguipulli S.A. Other services Less than 90 days Common control CH$ Chile 251,237 — — — 96.880.800-1 Empresa Eléctrica Puyehue S.A. Energy sales Less than 90 days Common control CH$ Chile — — — — Foreign Enel Brasil S.A. Other services Less than 90 days Associate CH$ Brazil 68,318 — 2,068,594 — Foreign PH Chucas S.A. Other services Less than 90 days Common control CH$ Costa Rica — — 432,233 — Foreign Enel Generacion Costanera S.A Other services Less than 90 days Common control US$ Argentina 32,264 — — — Foreign Endesa Generación S.A. Commodity derivatives Less than 90 days Common control CH$ Spain — — — — Foreign Endesa Generación S.A. Other services Less than 90 days Common control UF Spain 41,820 — 36,067 — Foreign Endesa Energía S.A. Other services Less than 90 days Common control CH$ Spain — — — — 76.126.507-5 Parque Eólico Talinay Oriente S.A. Energy sales Less than 90 days Common control CH$ Chile 28,260 — 16,994 — 76.126.507-5 Parque Eólico Talinay Oriente S.A. Tolls Less than 90 days Common control CH$ Chile — — — — 76.126.507-5 Parque Eólico Talinay Oriente S.A. Other services Less than 90 days Common control CH$ Chile — — 21,075 — Foreign Endesa España S.A. Other services Less than 90 days Common control CH$ Spain 13,684 — 13,077 — 76.179.024-2 Parque Eólico Tal Tal S.A. Energy sales Less than 90 days Common control CH$ Chile 169,547 — 41,487 — 76.179.024-2 Parque Eólico Tal Tal S.A. Other services Less than 90 days Common control CH$ Chile 30,087 — 23,182 — 76.321.458-3 Almeyda Solar S.p.A. Energy sales Less than 90 days Common control CH$ Chile 20,046 — 50,594 — 76.321.458-3 Almeyda Solar S.p.A. Other services Less than 90 days Common control CH$ Chile 10,941 — 8,430 — 76.052.206-6 Parque Eólico Valle de los Vientos S.A. Energy sales Less than 90 days Common control CH$ Chile 1,240 — 75,956 — 76.052.206-6 Parque Eólico Valle de los Vientos S.A. Other services Less than 90 days Common control CH$ Chile 27,352 — 21,075 — Foreign Compania Energetica Veracruz S.A.C. Other services Less than 90 days Common control CH$ Peru — — 758,841 — Foreign Enel Italia Servizi SRL Other services Less than 90 days Common control CH$ Italy 8,524 — 8,144 — Foreign Enel S.p.A Other services Less than 90 days Parent CH$ Italy 153,249 — 125,960 — Foreign Enel Trade S.p.A Commodity derivatives Less than 90 days Common control CH$ Italy 3,671,446 — 20,751,713 — Extranjera Enel Trade S.p.A Gas Sales Less than 90 days Common control US$ Italy 18,565,698 — 21,484,590 — Extranjera Enel Trade S.p.A Other services Less than 90 days Common control US$ Italy 44,675 — 8,511 — Foreign Emgesa S.A. Other services Less than 90 days Common control CH$ Colombia 703,368 — 13,746 — Foreign Enel Generación Perú S.A. Other services Less than 90 days Common control CH$ Peru — — — — Foreign Enel Generación Perú S.A. Other services Less than 90 days Common control US$ Peru 914,115 — — — Foreign Energia Nueva Energia Limpia Mexico Srl de Cv Other services Less than 90 days Common control US$ México 35,739 — — — Foreign Proyecto y Soluciones Renovables S.A.C Other services Less than 90 days Common control US$ Brazil 29,054 — — — 76.412.562-2 Enel Green Power del Sur S.p.A Energy sales Less than 90 days Common control CH$ Chile 6,323 — 28,835 — 76.412.562-2 Enel Green Power del Sur S.p.A Other services Less than 90 days Common control CH$ Chile 170,790 — 131,594 — 96.920.110-0 Enel Green Power Chile Ltda. Other services Less than 90 days Common control CH$ Chile 381,077 — 162,594 — Extranjera Enel Green Power Colombia SAS Other services Less than 90 days Common control US$ Colombia — — 46,557 — Extranjera Chinango S.A.C. Other services Less than 90 days Common control US$ Perú — — 17,410 — Extranjera Enel Green Power Brasil Other services Less than 90 days Common control US$ Brazil 52,215 — 47,124 — Extranjera Enel Green Power Mexico Other services Less than 90 days Common control US$ México 98,519 — 152,495 — Extranjera Enel Green Power Perú Other services Less than 90 days Common control US$ Perú 223,188 — 177,478 — Extranjera Enel Green Power Italia Other services Less than 90 days Common control CH$ Italy 979,121 — 262,694 — 96.971.330-6 Geotérmica del Norte purchase of energy Less than 90 days Common control CH$ Chile 18 — — — 96.971.330-6 Geotérmica del Norte Energy sales Less than 90 days Common control CH$ Chile 56,425 — 10,096 — 96.971.330-6 Geotérmica del Norte Other services Less than 90 days Common control US$ Chile — — 82,830 — Total 135,105,117 — 109,797,820 — b)Accounts payable to related parties: Balance as of Payables to related parties 12-31-2018 12-31-2017 Taxpayer ID Company Description of the transaction Term of the transaction Relationship Currency Country Current Non-Current Current Non-Current 96.800.570-7 Enel Distribución Chile S.A. Other services Less than 90 days Common control CH$ Chile 75,850 — 50,929 — 96.800.570-7 Enel Distribución Chile S.A. Tolls Less than 90 days Common control CH$ Chile 634,197 — 5,469,480 — 76.536.353-5 Enel Chile S.A. Other services Less than 90 days Parent CH$ Chile 9,780,125 — 762,725 — 76.536.353-5 Enel Chile S.A. Dividends Less than 90 days Parent CH$ Chile 86,727,349 — 75,296,956 — 76.536.353-5 Enel Chile S.A. Mercantile current account Less than 90 days Parent CH$ Chile 2,376,570 — 985 — 94.271.000-3 Enel Américas S.A. Other services Less than 90 days Parent CH$ Chile 1,987 — 1,987 — 76.418.940-K GNL Chile S.A. Other services Less than 90 days Associate CH$ Chile 12,389 — — — 76.418.940-K GNL Chile S.A. Gas purchase Less than 90 days Associate CH$ Chile 5,935,652 — 8,100,426 — 96.783.910-8 Empresa Electrica Colina Ltda. Tolls Less than 90 days Common control CH$ Chile 64 — — — 96.524.140-K Empresa Eléctrica Panguipulli S.A. Energy purchase Less than 90 days Common control CH$ Chile 1,019,252 — 2,568,900 — Foreign Endesa Generación S.A. Other services Less than 90 days Common control CH$ Spain 702,702 — 236,925 — Foreign Enel Iberoamérica SRL Other services Less than 90 days Parent Euro Spain — — 97,601 — Foreign Enel Iberoamérica SRL Other services Less than 90 days Parent Euro Italy 97,601 — — — Foreign Enel Produzione S.p.A. Other services Less than 90 days Common control Euro Italy 6,631,834 — 10,039,203 318,518 77.017.930-0 Transmisora Eléctrica de Quillota Ltda. Tolls Less than 90 days Joint Ventures CH$ Chile 13,887 — 143,949 — 76.126.507-5 Parque Eólico Talinay Oriente S.A. Energy purchase Less than 90 days Common control CH$ Chile 103,022 — 65,826 — Foreign Enel Brasil S.A. Other services Less than 90 days Associate CH$ Brazil 74,949 — 77,680 — Foreign Enel Global Thermal Gx Other services Less than 90 days Common control Euro Italy 2,199,811 — — — 76.179.024-2 Parque Eólico Tal Tal S.A. Energy purchase Less than 90 days Common control CH$ Chile 1,637,333 — 2,105,036 — 76.321.458-3 Almeyda Solar S.p.A Energy purchase Less than 90 days Common control CH$ Chile 540 — 9,365 — 76.052.206-6 Parque Eólico Valle de los Vientos S.A. Energy purchase Less than 90 days Common control CH$ Chile 1,303,508 — 1,261,153 — Foreign Enel S.p.A Other services Less than 90 days Parent Euro Italy 1,463,990 — 128,811 — Foreign Enel Trade S.p.A Commodity derivatives Less than 90 days Common control CH$ Italy 9,849,260 — 4,184,469 — Foreign Enel Trade S.p.A Other services Less than 90 days Common control CH$ Italy 2,123,546 — 798,030 — 76.412.562-2 Enel Green Power del Sur S.p.A Energy purchase Less than 90 days Common control CH$ Chile 13,431,566 — 10,323,525 — 76.722.488-5 Empresa de Transmisión Chena S.A. Energy purchase Less than 90 days Common control CH$ Chile — — 43,457 — 76.722.488-5 Empresa de Transmisión Chena S.A. Tolls Less than 90 days Common control CH$ Chile 20,757 — 174,766 — 76.250.019-1 Enel Green Power Chile Ltda. Other services Less than 90 days Common control CH$ Chile — — 80,231 — 96.920.110-0 Enel Green Power Chile Ltda. Other services Less than 90 days Common control CH$ Chile 441,510 — — — Foreign Enel Green Power Italia Other services Less than 90 days Common control CH$ Italy 2,416,756 — 357,579 — Foreign Enel Trading Argentina S.R.L. Other services Less than 90 days Associate AR$ Argentina 13,574 — 13,574 — 96.971.330-6 Geotermica del Norte Energy purchase Less than 90 days Common control CH$ Chile 2,824 — — — 96.800.460-3 Luz Andes Ltda Tolls Less than 90 days Common control CH$ Chile 7 — — — Foreign Cesi S.P.A Other services Less than 90 days Common control Euro Italy 458,228 — — — Foreign Tecnatom S.A Other services Less than 90 days Common control Euro Spain 102,962 — — — Foreign Enel Italia Servizi SRL Other services Less than 90 days Common control CH$ Italy 3,278,687 — 469,376 — Total 152,932,289 — 122,862,944 318,518 c)Significant transactions and effects on income/expenses: Transactions with related parties that are not consolidated and their effects on profit or loss are as follows: Transactions with effects on income/expenses For the years ended Taxpayer ID 12-31-2018 12-31-2017 12-31-2016 No. Company Relationship Description of Transaction Country ThCh$ ThCh$ ThCh$ 76.052.206-6 Parque Eólico Valle de los Vientos S.A. Common control Energy purchase Chile (14,098,262 ) (16,630,421 ) (14,802,199 ) 76.052.206-6 Parque Eólico Valle de los Vientos S.A. Common control Energy sales Chile 21,172 144,589 697,970 76.052.206-6 Parque Eólico Valle de los Vientos S.A. Common control Services provided Chile 23,613 17,710 — 76.107.186-6 Servicios Informáticos e Inmobiliarios Ltda. Common control Services provided Chile — 210,198 159,606 76.107.186-6 Servicios Informáticos e Inmobiliarios Ltda. Common control Services received Chile — (490,193 ) (925,095 ) 76.126.507-5 Parque Eólico Talinay Oriente SA Common control Electricity tolls Chile 46 54 — 76.126.507-5 Parque Eólico Talinay Oriente SA Common control Energy purchase Chile (582,467 ) (538,067 ) (471,210 ) 76.126.507-5 Parque Eólico Talinay Oriente SA Common control Energy sales Chile 21,358 128,626 129,418 76.126.507-5 Parque Eólico Talinay Oriente SA Common control Services provided Chile 23,613 17,710 — 76.179.024-2 Parque Eólico Tal Tal S.A. Common control Electricity tolls Chile 48,511 123 — 76.179.024-2 Parque Eólico Tal Tal S.A. Common control Energy purchase Chile (19,377,885 ) (25,957,247 ) (26,796,385 ) 76.179.024-2 Parque Eólico Tal Tal S.A. Common control Energy sales Chile 260,698 109,643 49,477 76.179.024-2 Parque Eólico Tal Tal S.A. Common control Services provided Chile 25,975 19,481 — 76.321.458-3 Almeyda Solar S.P.A Common control Electricity tolls Chile 7 17 — 76.321.458-3 Almeyda Solar S.P.A Common control Energy purchase Chile (17,467 ) (53,357 ) (35,362 ) 76.321.458-3 Almeyda Solar S.P.A Common control Energy sales Chile 80,357 149,146 98,994 76.321.458-3 Almeyda Solar S.P.A Common control Services provided Chile 9,445 7,084 52,524 76.412.562-2 Enel Green Power del Sur S.p.A Common control Energy purchase Chile (122,475,791 ) (104,860,690 ) (34,954,457 ) 76.412.562-2 Enel Green Power del Sur S.p.A Common control Energy sales Chile 78,932 528,740 48,337 76.412.562-2 Enel Green Power del Sur S.p.A Common control Services provided Chile 147,444 110,583 — 76.412.562-2 Enel Green Power del Sur S.p.A Common control Tolls Chile (12,540 ) 288 — 76.418.940-K GNL Chile S.A. Associate Gas consumption Chile (81,890,342 ) (146,507,374 ) (116,391,269 ) 76.418.940-K GNL Chile S.A. Associate Gas transportation Chile (49,631,647 ) (47,656,018 ) (49,418,058 ) 76.418.940-K GNL Chile S.A. Associate Loans Chile — — (436 ) 76.418.940-K GNL Chile S.A. Associate Services provided Chile (71,770 ) 85,274 82,762 76.536.351-9 Endesa Américas S.A. Common control Services provided Chile — — 641,087 76.536.353-5 Enel Chile S.A. (*) Parent financial expense Chile (543,476 ) — — 76.536.353-5 Enel Chile S.A. (*) Parent financial income Chile 185,047 — — 76.536.353-5 Enel Chile S.A. (*) Parent Loans Chile — (754,401 ) (420,867 ) 76.536.353-5 Enel Chile S.A. (*) Parent Services provided Chile — — 1,134,766 76.536.353-5 Enel Chile S.A. (*) Parent Services received Chile (11,635,262 ) (11,433,038 ) (5,148,683 ) 76.722.488-5 Empresa de Transmisión Chena S.A. Common control Energy purchase Chile (268,681 ) (218,223 ) — 76.788.080-4 GNL Quintero S.A. Associate Electricity tolls Chile — — (71,599 ) 76.788.080-4 GNL Quintero S.A. Associate Energy sales Chile — — 2,356,971 76.788.080-4 GNL Quintero S.A. Associate Services provided Chile — — 960,390 76.788.080-4 GNL Quintero S.A. Associate Services received Chile — — (37,162 ) 77.017.930-0 Transmisora Eléctrica de Quillota Ltda. Associate Tolls Chile (242,887 ) (1,383,710 ) (1,537,963 ) 94.271.000-3 Enel Américas S.A. Parent Loans Chile — — (1,589,749 ) 94.271.000-3 Enel Américas S.A. Parent Services provided Chile 298,161 387,924 498,284 94.271.000-3 Enel Américas S.A. Parent Services received Chile — — (979,655 ) 96.524.140-K Empresa Eléctrica Panguipulli S.A. Common control Energy purchase Chile (6,462,747 ) (5,095,279 ) (5,064,692 ) 96.524.140-K Empresa Eléctrica Panguipulli S.A. Common control Energy sales Chile 270,998 914,613 248,136 96.524.140-K Empresa Eléctrica Panguipulli S.A. Common control Services provided Chile — 162,672 — 96.524.140-K Empresa Eléctrica Panguipulli S.A. Common control Tolls Chile 16,128 (75,145 ) (67,341 ) 96.783.910-8 Empresa Eléctrica de Colina Ltda. Common control Electricity tolls Chile 60,300 59,105 42,779 96.783.910-8 Empresa Eléctrica de Colina Ltda. Parent Services provided Chile 1,140 652 2,233 96.800.460-3 Luz Andes Ltda. Common control Electricity tolls Chile 5,519 6,585 6,294 96.800.570-7 Enel Distribución Chile S.A. Common control Energy sales Chile 388,037,272 374,922,466 374,962,639 96.800.570-7 Enel Distribución Chile S.A. Common control Services provided Chile 1,603,224 1,592,105 12,453 96.800.570-7 Enel Distribución Chile S.A. Common control Tolls Chile (5,215,145 ) 4,884,387 4,995,271 96.806.130-5 Electrogas S.A. Associate Fuel consumption Chile — (25,025 ) (553,905 ) 96.806.130-5 Electrogas S.A. Associate Gas Tolls Chile — (251,099 ) (3,625,100 ) 96.880.800-1 Empresa Eléctrica Puyehue S.A. Common control Tolls Chile — — 95,813 96.920.110-0 Enel Green Power Chile Ltda. Common control Services provided Chile 58,840 132,577 — 96.920.110-0 Enel Green Power Chile Ltda. Common control Services received Chile (184,246 ) — — 96.971.330-6 Geotérmica del Norte Common control Energy purchase Chile (1,500 ) (456 ) — 96.971.330-6 Geotérmica del Norte Common control energy sale Chile 137,152 — — 96.971.330-6 Geotérmica del Norte Common control Services provided Chile — 80,157 — Foreign Central Dock Sud S.A. Common control Services provided Argentina — — 454 Foreign Chinango S.A.C. Common control Services provided Perú 39,759 18,516 — Foreign Comercializadora de Energía del Mercosur S.A. Associate Services received Argentina — — (56,368 ) Foreign Compania Energetica Veracruz S.A.C. Common control Services provided Perú — 283,346 — Foreign Compañía de Transmisión del Mercosur S.A. Common control Electricity tolls Argentina — — (95,813 ) Foreign Compañía Distribuidora y Comercializadora de Energía S.A. Common control Electricity tolls Colombia — — (3,864,016 ) Foreign Compañía Distribuidora y Comercializadora de Energía S.A. Common control Energy purchase Colombia — — (128,794 ) Foreign Compañía Distribuidora y Comercializadora de Energía S.A. Common control Energy sales Colombia — — 19,901,620 Foreign Compañía Distribuidora y Comercializadora de Energía S.A. Common control Loans Colombia — — 11,355 Foreign Compañía Distribuidora y Comercializadora de Energía S.A. Common control Services provided Colombia 13,637 — 15,714 Foreign Compañía Distribuidora y Comercializadora de Energía S.A. Common control Services received Colombia — 3,844 (17,587 ) Foreign Emgesa S.A. E.S.P. Common control Services provided Colombia 622,686 1,866 — Foreign Empresa de Distribución Eléctrica de Lima Norte S.A.A. Common control Electricity tolls Peru — — (102,171 ) Foreign Empresa de Distribución Eléctrica de Lima Norte S.A.A. Common control Energy sales Peru — — 16,304,643 Foreign Empresa de Distribución Eléctrica de Lima Norte S.A.A. Common control Services provided Peru — — 4,889,644 Foreign Empresa de Energía de Cundinamarca S.A. Common control Electricity tolls Colombia — — (194,805 ) Foreign Empresa de Energía de Cundinamarca S.A. Common control Energy sales Colombia — — 1,161,383 Foreign Empresa Distribuidora Sur S.A. Common control Energy sales Argentina — — 1,879 Foreign Empresa Distribuidora Sur S.A. Common control Services received Argentina — — (151,365 ) Foreign Endesa Energía S.A. Common control Fuel purchase Spain — (8,946,259 ) (134,393 ) Foreign Endesa Energía S.A. Common control Gas Sales Spain — 10,394,146 18,655,911 Foreign Endesa España S.A. Common control Services received Spain — — (7,528 ) Foreign Endesa Generación S.A. Common control Fuel consumption Spain — — (66,297,066 ) Foreign Endesa Generación S.A. Common control Services provided Spain (158,128 ) — — Foreign Endesa Latinoamericana S.A. Common control Services received Spain — — (12,388 ) Foreign Enel Argentina S.A. (ex - Endesa Argentina S.A.) Common control Services received Argentina — — (972 ) Foreign Enel Brasil S.A. Associate Financial Expenses Brazil (56 ) — — Foreign Enel Brasil S.A. Associate Services provided Brazil — — 2,044,935 Foreign Enel Brasil S.A. Associate Services received Brazil (207,966 ) — — Foreign Enel Generacion Chocon S.A Common control Services provided Argentina 10,176 — — Foreign Enel Generación Costanera S.A Common control Services provided Argentina 28,106 — — Foreign Enel Generación Perú S.A. Common control Loans Perú — (349 ) — Foreign Enel Generación Perú S.A. Common control Services provided Perú 1,139,809 745,818 — Foreign Enel Generación Piura S.A. Common control Energy purchase Peru — — (308,224 ) Foreign Enel Generación Piura S.A. Common control Energy sales Peru — — 34,935 Foreign Enel Generación Piura S.A. Common control Financial Expenses Peru (57 ) — — Foreign Enel Generación Piura S.A. Common control Loans Peru — (135 ) (520 ) Foreign Enel Generación Piura S.A. Common control Services provided Peru (57,180 ) 98,421 222,826 Foreign Enel Global Thermal Gx Common control Services received Italy (1,845,425 ) — — Foreign Enel Global Trading S.p.A. Common control Services received Italy — — (13,114 ) Foreign Enel Green Power Brasil Common control Services provided Brazil — 37,936 — Foreign Enel Green Power Brasil Participacoes Ltda. Common control Financial Income Brazil 5,426 — — Foreign Enel Green Power Brasil Participacoes Ltda. Common control Services provided Brazil — 9,188 — Foreign Enel Green Power Colombia SAS Common control Services provided Colombia — 46,557 — Foreign Enel Green Power Colombia SAS Common control Services received Colombia (4,797 ) — — Foreign Enel Green Power Italia Common control Services provided Italy — 262,694 — Foreign Enel Green Power Italia Common control Services provided Italy (730,968 ) — — Foreign Enel Green Power Mexico Common control Services provided Mexico — 152,495 — Foreign Enel Green Power Mexico Common control Services provided Mexico (53,976 ) — — Foreign Enel Green Power Perú Common control Services provided Perú 45,710 — — Foreign Enel Green Power Perú Common control Services provided Perú — 177,478 — Foreign Enel Iberoamérica SRL Parent Services received Spain — (6,115 ) (167,186 ) Foreign Enel Italia Servizi Srl Common control Services received Italy (2,484,835 ) — — Foreign Enel Perú S.A.C. Common control Services received Peru — (181 ) (125,069 ) Foreign Enel Produzione S.p.A. Common control Services received Italy — 94,045 (812,261 ) Foreign Enel S.p.A Parent Services received Italy (1,110,545 ) — (511,350 ) Foreign Enel Trade S.p.A Common control Commodity derivatives Italy 10,565,377 19,941,617 7,012,879 Foreign Enel Trade S.p.A Common control Services received Italy — — — Foreign Enel Trading S.p.A Common control Financial Expense Italy (13 ) — — Foreign Enel Trading S.p.A Common control Services received Italy (1,213,116 ) — — Foreign Energia Nueva Energia Limpia Mexico Sri de Cv Common control Services provided Mexico 35,739 — — Foreign Generalima S.A. Common control Services provided Peru 8,832 7,405 108,817 Foreign PH Chucas Costa Rica Common control Services provided Costa Rica (79,327 ) — — Foreign PH Chucas S.A. Common control Loans Costa Rica — (162,177 ) — Foreign PH Chucas S.A. Common control Services provided Costa Rica — 6,629 425,604 Total 83,271,705 45,909,551 122,176,626 Transfers of short-term funds between related parties are treated as current accounts changes, with variable interest rates based on market conditions used for the monthly balance. The resulting amounts receivable or payable are usually at 30 day terms, with automatic rollover for the same periods and amortization in line with cash flows. Enel Generation Chile S.A. received short-term loans from its parent Enel Chile S.A. As of December 31, 2018; the balance of the loans is ThCh$ 2,376,570 (ThCh$ 985 as of December 31, 2017). This debt accrues interest at a rate of TAB + 1.10% per annum (TIP + 0.05% per month as of December 31, 2017). 11.2Board of directors and key management personnel The Company is managed by a Board of Directors which consists of nine members. Each director serves for a three-year term being able to reelection. The current Board of Directors correspond to the one elected on Ordinary Shareholders’ Meeting held on April 24, 2018 On November 29, 2018, the director Mauro Di Carlo resigned. He was replaced by Mr. Cristiano Bussi effective as of November 29, 2018. On November 21, 2018, the director Jorge Atton Palma resigned. The Board of Directors, for year ended 2018 is integrated with the following members: · Mr. Giuseppe Conti (Chairman) · Mr. Hernán Cheyre Valenzuela · Julio Pellegrini Vial · Mr. Francesco Giorgianni · Mr. Luca Noviello · Mr. Fabrizio Barderi · Mr. Antonio Scala · Mr. Cristiano Bussi Also, at a Board meeting held on April 24, 2018, Mr. Giuseppe Conti was appointed as Chairman of the Board and Mr. Ignacio Quiñones Sotomayor as Secretary. a)Accounts receivable and payable and other transactions · Accounts receivable and payable There are no outstanding amounts receivable or payable between the Company and the members of the Board of Directors and key management personnel. · Other transactions No transactions other than transactions in the normal course of business-electricity supply have taken place between the Company and the members of the Board of Directors and key management personnel. b)Compensation for Directors In accordance with Article 33 of Law No. 18,046 governing stock corporations, the compensation of Directors is established each year at the Ordinary Shareholders Meeting of the Company. The methodology to determining the compensation, described below, was established at the 2018 Annual Shareholders Meeting of the Company. The remuneration is detailed as follows: a) UF 174 as a fixed monthly fee, and b) UF 84 per diem for each Board meeting attended. In accordance with the bylaws, the remuneration of the Chairman shall be double that of a Director, while that of the Vice-Chairman shall be 50% twice than that of a Director. If any Director of the Company is a member of more than one Board in any Chilean or foreign subsidiaries and/or associates or holds the position of Director or advisor in other Chilean or foreign companies or legal entities in which the Company has a direct or indirect ownership interest, that Director can be compensated for his/her participation in only one of those Boards or Management Committees. The Executive Officers the Company and/or any of its Chilean or foreign subsidiaries or associates will not receive any compensation or per diem if they hold the position of Director in any of the Chilean or foreign subsidiaries or associates of the Company. c)Directors’ Committee Each member of the Directors’ Committee receives monthly remuneration, a portion of which is for each session attended and a portion of which is a fixed monthly payment for every meeting. This remuneration is as follows: a. UF 58 monthly remuneration as a fixed payment, and b. UF 28 for each session attended with an unlimited number of sessions. The enactment of Law No. 20,382 on improved Corporate Governance resulted in the merger of the Directors’ Committee and the Audit Committee. The following tables show details of the remuneration paid to the members of the Board of Directors for the years ended December 31, 2018, 2017 and 2016: For the year ended 12-31-2018 Enel Generación Board of Directors’ Board Subsidiaries Committee Name Position Period in Position ThCh$ ThCh$ ThCh$ Giuseppe Conti (*) Chairman 01-01-2018 to 12-31-2018 — — — Francesco Giorgianni (*) Director 01-01-2018 to 12-31-2018 — — — Hernan Cheyre Valenzuela (1) Director 04-24-2018 to 12-31-2018 67,914 — 22,638 Jorge Atton Palma (2) Director 01-01-2018 to 12-31-2018 76,781 — 24,841 Julio Pellegrini Vial Director 01-01-2018 to 12-31-2018 90,996 — 29,579 Mauro Di Carlo (*) (3) Director 01-01-2018 to 09-30-2018 — — — Umberto Magrini (*) (1) Director 01-01-2018 to 04-24-2018 — — — Luca Noviello (*) Director 01-01-2018 to 12-31-2018 — — — Fabrizio Barderi (*) Director 01-01-2018 to 12-31-2018 — — — Enrique Cibié Bluth (1) Director 01-01-2018 to 04-24-2018 23,082 — 6,941 Antonio Scala (1) (*) Director 04-24-2018 to 12-31-2018 — — — Cristiano Bussi (*) (3) Director 11-29-2018 to 12-31-2018 — — — Total 258,773 — 83,999 For the year ended 12-31-2017 Enel Generación Board of Directors’ Board Subsidiaries Committee Name Position Period in Position ThCh$ ThCh$ ThCh$ Giuseppe Conti (*) Chairman 01-01-2017 to 12-31-2017 — — — Francesco Giorgianni (*) Director 01-01-2017 to 12-31-2017 — — — Francesco Buresti (3) (*) Director 01-01-2017 to 06-27-2017 — — — Enrique Cibié Bluth Director 01-01-2017 to 12-31-2017 95,729 — 32,648 Jorge Atton Palma Director 01-01-2017 to 12-31-2017 95,729 — 32,648 Julio Pellegrini Vial Director 01-01-2017 to 12-31-2017 95,729 — 32,648 Mauro Di Carlo (*) Director 01-01-2017 to 12-31-2017 — — — Umberto Magrini (*) Director 01-01-2017 to 12-31-2017 — — — Luca Noviello (*) Director 01-01-2017 to 12-31-2017 — — — Fabrizio Barderi (4) (*) Director 01-01-2017 to 12-31-2017 — — — Total 287,187 — 97,944 For the year ended 12-31-2016 Board of Directors Company Board Subsidiaries Committee Name Position Period in Position ThCh$ ThCh$ ThCh$ Giuseppe Conti Chairman 04-27-2016 to 12-31-2016 — — — Enrico Viale Chairman 01-01-2016 to 04-27-2016 — — — Francesco Giorgianni Vice-Chairman 04-27-2016 to 12-31-2016 — — — Ignacio Mateo Montoya Vice-Chairman 01-01-2016 to 04-27-2016 — — — Francesco Buresti Director 01-01-2016 to 12-31-2016 — — — Enrique Cibié Bluth Director 01-01-2016 to 12-31-2016 98,102 — 29,796 Jorge Atton Palma Director 01-01-2016 to 12-31-2016 98,102 — 29,796 Julio Pellegrini Vial Director 04-27-2016 to 12-31-2016 73,864 — 23,162 Mauro Di Carlo Director 04-27-2016 to 12-31-2016 — — — Umberto Magrini Director 04-27-2016 to 12-31-2016 — — — Luca Noviello 04-27-2016 to 12-31-2016 — — — Felipe Lamarca Claro Director 01-01-2016 to 04-27-2016 28,744 — 6,634 Isabel Marshall Lagarrigue Director 01-01-2016 to 04-27-2016 28,744 — — Vittorio Vagliasindi Director 01-01-2016 to 04-27-2016 — — — Francesca Gostinelli Director 01-01-2016 to 04-27-2016 — — — TOTAL 327,556 — 89,388 (1) Hernán Cheyre Valenzuela and Mr. Antonio Scala took over as Directors effective as of April 24, 2018 on the same date that Mr. Enrique Cibié Bluth and Mr. Umberto Magrini stepped down as directors. (2) Mr. Jorge Atton Palma ceased being a Director on November 29, 2018. (3) Mr. Cristiano Bussi took over as Director effective as of November 19, 2018 on the same date that Mr. Mauro Di Carlo stepped down as directors. (4) Mr. Francesco Buresti ceased being a Director on June 27, 2017. (5) Mr. Fabrizio Barderi took over as Director on August 28, 2017. (*) Mr. Giuseppe Conti, Francesco Giorgianni, Francesco Buresti, Mauro Di Carlo, Umberto Magrini, Luca Noviello, Vagliasindi,Antonio Scala, Cristiano Bussi and Fabrizio Barderi waived the compensation and fees for attending meetings they received as a result of being members of the Board of Directors of Enel Generación Chile S.A. d)Guarantees established by the Company in favor of the Directors During the years ended December 31, 2018 and 2017, no guarantees have been granted to the Directors. 11.3Compensation for the Group’s executives a)Compensation received by key management personnel Company ID No. Name Position Valter Moro Chief Executive Officer 13.226.963-7 Juan Alejandro Candia Narvaez Planning and 7.012.475-0 Raúl Arteaga Errazuriz Chief Financial Officer 8.586.744-K Luis Alberto Vergara Adamides Human Resources Officer 7.776.718-5 Luis Ignacio Quiñones Sotomayor General Counsel 11.629.179-7 Humberto Espejo Paluz Marketing and 24.789.926-K Valter Moro (1) Business Development Manager (Interim) 11.565.097-1 Bernardo Canales Fuenzalida Engineering and Construction Officer 25.467.930-5 Michele Siciliano Chilean Thermal Generation Officer 10.939.381-9 Claudio Ordenes Tirado Engineering and Thermal Construction Officer 8.803.928-9 Carlo Carvallo Artigas Chilean Hydroelectric Generation Officer 24.789.926-k Valter Moro (2) Regulation Manager (Interim) (1) Valter Moro took over as Business Development Manager effective April 1, 2018 on an interim basis from Mr. Claudio Helfmann Soto. (2) Mr. Valter Moro took over as Regulatory Manager effective August 13, 2018 on an interim basis, replacing Ms. Paola Hartung Martínez. b)Incentive plans for key management personnel Enel Generación Chile S.A has implemented an annual bonus plan for its executives based on meeting company-wide objectives and on the level of their individual contribution in achieving the overall goals of the Company. The plan provides for a range of bonus amounts according to seniority level. The bonuses paid to the executives consist of a certain number of monthly gross remunerations. The compensation of key management personnel for the years ended December 31, 2018, 2017 and 2016 is detailed as follows: For the year ended 12-31-2018 12-31-2017 12-31-2016 Remuneration of the Key Management Personnel ThCh$ ThCh$ ThCh$ Cash compensation 1,975,478 2,057,900 1,865,334 Short-term benefits for employees 454,564 550,238 553,550 Other long-term benefits 115,499 321,692 252,533 TOTAL 2,545,541 2,929,830 2,671,417 c)Guarantees established by the Company in favor of the Group’s executives During the years ended December 31, 2018 and 2017, no guarantees have been granted to the Group’s executives. 11.4Compensation plans linked to share price As of December 31, 2018 and 2017, there were no compensation plans linked to the share price. As of December 31, 2018 and 2017, this inventories is composed of the following: Balance as of 12-31-2018 12-31-2017 Classes of Inventories ThCh$ ThCh$ Supplies for Production 34,384,583 16,879,260 Gas 5,712,979 2,301,172 Oil 2,684,688 2,593,805 Coal 25,986,916 11,984,283 Supplies for projects and spare parts 9,386,198 14,861,643 Total 43,770,781 31,740,903 As of December 31, 2018 and 2017, there were no inventories pledged as collateral to hedge any liability. For the year ended December 31, 2018, the amount for raw materials and consumables recognized as fuel consumption for continuing operations was ThCh$ 230,993,754 (ThCh$ 280,739,362 for the years ended December 31, 2017). See Note 27. As of December 31, 2018 and 2017, “Other non-current non-financial assets” includes an amount of ThCh$12,545,299 and ThCh$12,853,459 respectively, ThCh$4,324,153 (ThCh$ 5,444,789 for the year ended December 31, 2017) corresponding to spare parts and materials that will be used over a twelve-month period. During the years ended December 31, 2018 and 2017, no inventories have been written down due to obsolescence or impairment. 13. CURRENT TAX RECEIVABLES AND PAYABLES Name Position Period in Position For the year ended 12-31-2016 Company Board Board of Subsidiaries Directors Committee ThCh$ ThCh$ ThCh$ Giuseppe Conti (1) (*) Chairman 4-27-16 to 12-31-16 - - - Enrico Viale (1) (*) Chairman 1-1-16 to 4-27-16 - - - Francesco Giorgianni (2) (*) Vice-Chairman 4-27-16 to 12-31-16 - - - Ignacio Mateo Montoya (2) (*) Vice-Chairman 1-1-16 to 4-27-16 - - - Francesco Buresti (*) Director 1-1-16 to 12-31-16 - - - Enrique Cibié Bluth Director 1-1-16 to 12-31-16 98,102 - 29,796 Jorge Atton Palma Director 1-1-16 to 12-31-16 98,102 - 29,796 Julio Pellegrini Vial (3) Director 4-27-16 to 12-31-16 73,864 - 23,162 Mauro Di Carlo (3) (*) Director 4-27-16 to 12-31-16 - - - Umberto Magrini (3) (*) Director 4-27-16 to 12-31-16 - - - Luca Noviello (3) (*) Director 4-27-16 to 12-31-16 - - - Felipe Lamarca Claro (3) Director 1-1-16 to 4-27-16 28,744 - 6,634 Isabel Marshall Lagarrigue (3) Director 1-1-16 to 4-27-16 28,744 - - Vittorio Vagliasindi (3) (*) Director 1-1-16 to 4-27-16 - - - Francesca Gostinelli (3) (*) Director 1-1-16 to 4-27-16 - - - Total 327,556 - 89,388 Name Position For the year ended 12-31-2015 Period in Position Company Board ThCh$ Board of Subsidiaries ThCh$ Directors Committee ThCh$ Enrico Viale Chairman 1-1-15 to 12-31-15 - - - Ignacio Mateo Montoya Vice Chairman 1-1-15 to 12-31-15 - - - Francesco Buresti Director 1-1-15 to 12-31-15 - - - Felipe Lamarca Claro Director 1-1-15 to 12-31-15 91,432 - 32,038 Enrique Cibié Bluth Director 1-1-15 to 12-31-15 91,432 - 32,038 Susana Carey Claro Director 1-1-15 to 4-27-15 18,065 - 7,336 Isabel Marshall Lagarrigue Director 1-1-15 to 12-31-15 91,432 - - Vittorio Vagliasindi Director 1-1-15 to 12-31-15 - - - Alfredo Arahuetes García Director 1-1-15 to 4-27-15 18,065 - - Jorge Atton Palma Director 4-27-15 to 12-31-15 73,366 - 24,454 Francesca Gostinelli Director 4-27-15 to 12-31-15 - - - TOTAL 383,792 - 95,866 Name Position For the year ended 12-31-2014 Period in Position Company Board ThCh$ Board of Subsidiaries ThCh$ Directors Committee ThCh$ Jorge Rosenblut Ratinoff Chairman 1-1-14 to 11-4-14 92,967 - - Paolo Bondi Vice-Chairman 1-1-14 to 11-4-14 - - - Enrico Viale Chairman 11-4-14 to 12-31-14 - - - Ignacio Mateo Montoya Vice-Chairman 11-4-14 to 12-31-14 - - - Francesco Buresti Director 1-1-14 to 12-31-14 - - - Vittorio Corbo Director 1-1-14 to 7-28-14 32,446 - - Jaime Bauzá Bauzá Director 1-1-14 to 11-4-14 42,235 - 14,624 Felipe Lamarca Claro Director 1-1-14 to 12-31-14 54,383 - 17,321 Alfredo Arahuetes García Director 1-1-14 to 12-31-14 55,970 - - Enrique Cibié Bluth Director 1-1-14 to 12-31-14 55,970 - 17,321 Susana Carey Claro Director 11-4-14 to 12-31-14 9,486 - 4,121 Isabel Marshall Lagarrigue Director 11-4-14 to 12-31-14 9,486 - - Manuel Morán Casero Director 1-1-14 to 11-4-14 - - - Vittorio Vagliasindi Director 11-4-14 to 12-31-14 - - - TOTAL 352,943 - 53,387 Remuneration of the Key Management Personnel For the years ended 12-31-2016 12-31-2015 12-31-2014 ThCh$ ThCh$ ThCh$ Cash compensation 1,865,334 1,581,984 2,144,848 Short-term benefits for employees 553,550 460,027 730,281 Other long-term benefits 252,533 695,840 519,990 TOTAL 2,671,417 2,737,851 3,395,119 Classes of Inventories Balance as of 12-31-2016 12-31-2015 ThCh$ ThCh$ Supplies for Production 12,377,179 17,838,254 Gas 2,159,901 3,882,410 Oil 2,556,438 3,183,800 Coal 7,660,840 10,772,044 Supplies for projects and spare parts 21,013,620 18,917,155 Total 33,390,799 36,755,409 The detail of current tax receivables as of December 31, 2018 and 2017 is as follows: Balance as of 12-31-2018 12-31-2017 Tax Receivables ThCh$ ThCh$ Monthly provisional tax payments 37,544,939 54,863,660 Tax credit for absorbed profits 15,037,217 10,177,809 Minimum presumed income 191,118 5,000 Other — 118,239 Total 52,773,274 65,164,708 The detail of current tax payables as of December 31, 2018 and 2017 is as follows: Balance as of 12-31-2018 12-31-2017 Tax Payables ThCh$ ThCh$ Income tax 12,541,174 66,933,261 Total 12,541,174 66,933,261 14. INVESTMENTS ACCOUNTED FOR USING THE EQUITY METHOD 14.1Investments accounted for using the equity method a) The following tables present the changes in investments accounted for with the equity method for the years ended December 31, 2018 and 2017: Changes in Investments Functional Ownership Balance as of Additions Share of Dividends Foreign Other Other Balance in Associates Relationship Country Currency % ThCh$ ThCh$ ThCh$ ThCh$ ThCh$ ThCh$ ThCh$ ThCh$ GNL Chile S.A. Associate Chile U.S. dollar 33.33 % 3,783,316 — 805,972 (1,884,140 ) 347,835 — — 3,052,983 Centrales Hidroeléctricas de Aysén S.A. (*) Joint venture Chile Chilean peso 0.00 % 4,205,233 — 1,734,508 — — — (5,939,741 ) — Transmisora Eléctrica de Quillota Ltda. Joint venture Chile Chilean peso 50.00 % 8,818,759 — 654,952 — — — — 9,473,711 Enel Argentina (formerly named Endesa Argentina S.A.) Associate Argentina Argentine peso 0.08 % 105,146 — 86,021 — (108,069 ) — 217,100 300,198 TOTAL 16,912,454 — 3,281,453 (1,884,140 ) 239,766 — (5,722,641 ) 12,826,892 Changes in Investments Functional Ownership Balance as of Additions Share of Dividends Foreign Other Other Balance in Associates Relationship Country Currency % ThCh$ ThCh$ ThCh$ ThCh$ ThCh$ ThCh$ ThCh$ ThCh$ GNL Chile S.A. Associate Chile U.S. dollar 33.33 % 3,982,934 — 841,957 (743,734 ) (297,841 ) — — 3,783,316 Centrales Hidroeléctricas de Aysén S.A. (*) Joint venture Chile Chilean peso 51.00 % 6,441,166 1,943,100 (4,179,034 ) — — — 1 4,205,233 Transmisora Eléctrica de Quillota Ltda. Joint venture Chile Chilean peso 50.00 % 8,222,763 — 595,996 — — — — 8,818,759 Enel Argentina (formerly named Endesa Argentina S.A.) Associate Argentina Argentine peso 0.12 % 91,335 — 44,177 — (29,199 ) (1,490 ) 323 105,146 TOTAL 18,738,198 1,943,100 (2,696,904 ) (743,734 ) (327,040 ) (1,490 ) 324 16,912,454 (*) See Note 14.b and Appendix 3. b)Centrales Hidroeléctricas de Aysén S.A. (Hydroaysén) In May 2014, the Committee of Ministers revoked the Environmental Qualification Resolution (“RCA”) of the Centrales Hidroeléctricas de Aysén S.A. project, in which the Company participates by accepting some of the claims filed against this project. It is a public information that this decision was resorted before the Environmental Courts in Valdivia and Santiago. On January 28, 2015, it was made public that the water rights request made in 2008 by Centrales Hidroeléctricas de Aysén S.A. has been partially rejected. The Company has expressed its intention to promote at Centrales Hidroeléctricas de Aysén S.A. the defense for water rights and the environmental qualification granted to the project in the corresponding instances, continuing with the judicial actions already started or implementing new administrative or judicial actions that are necessary to this end, and it maintains the belief that hydric resources of the Aysén region are important for the energy development of the country. Nevertheless, given the current situation, there is uncertainty on the recoverability of the investment made so far at Centrales Hidroeléctricas de Aysén S.A., since it depends both on judicial decisions and on definitions in the energy agenda which cannot be foreseen at present, consequently the investment is not included in the portfolio of the Company’s immediate projects. Consequently, at closing date of fiscal year 2014, the Company recognized an impairment of its participation in Centrales Hidroeléctricas de Aysén S.A. amounting to ThCh$ 69,066,857. At an Extraordinary Meeting of Hidroaysén shareholders of Centrales Hidroeléctricas de Aysén S.A. held on December 7, 2017, it was decided to proceed to the early dissolution of this company, and an agreement was reached on how to liquidate the company’s assets. The liquidation process contemplated an allocation of assets to the shareholders Enel Generación and Colbún pro rata of their ownership interest which are 51% and 49%, respectively. This liquidation process and the associated allocation took place on September 7, 2018. The following is the stand-alone balance sheet considered for the liquidation process: CENTRALES HIDROELECTRICAS DE AYSEN S.A. Liquidation Recognized 09-07-2018 09-07-2018 ASSETS M$ M$ CURRENT ASSETS Cash and cash equivalents 72,339 36,892 Trade and other current receivables 56,021 28,571 TOTAL CURRENT ASSETS 128,360 65,463 NON-CURRENT ASSETS Property, plant and equipment 11,603,281 5,917,673 TOTAL NON-CURRENT ASSETS 11,603,281 5,917,673 TOTAL ASSETS 11,731,641 5,983,136 09-07-2018 09-07-2018 CURRENT LIABILITIES M$ M$ Other current provisions 83,403 42,535 TOTAL CURRENT LIABILITIES 83,403 42,535 EQUITY Issued capital 188,855,665 96,316,389 Retained earnings (177,207,427 ) (90,375,788 ) TOTAL EQUITY 11,648,238 5,940,601 TOTAL LIABILITIES AND EQUITY 11,731,641 5,983,136 c)Sale of GNL Quintero S.A. On June 9, 2016, the Company entered into a share purchase agreement with Enagás Chile S.p.A. (“Enagás Chile”), a wholly-owned subsidiary of Enagás S.A., under which Enagás Chile would acquire the entire 20% ownership interest held by the Company in the associated company GNL Quintero S.A.. The sale of this investment to Enagás Chile was subject to satisfaction of customary conditions precedent for this type of transaction, which included, among others, non-exercising by the other shareholders of GNL Quintero S.A. of the preferential acquisition rights, which they possess in accordance with the terms and conditions of the shareholders agreement. On September 14, 2016, upon satisfaction of the conditions precedent, the Company transferred the shares it held in GNL Quintero S.A. to Enagás Chile. The purchase price was US$ 197,365,113.2 (ThCh$ 132,820,800). Cash received for GNL Quintero S.A. is included in “Other collections from the sale of equity or debt instruments belonging to other entities” of the Consolidated Statements of Cash Flows at year ended December 31, 2016. GNL Quintero S.A. operates a storage and regasification of Liquefied Natural Gas (LNG) plant and its related land-based Terminal for loading and unloading LNG, including facilities and network necessary to deliver LNG, through a LNG truck loading facility and delivery point’s pipelines. 14.2Additional financial information on investments in associated companies The following tables show financial information as of December 31, 2018 and 2017 from the financial statements of the investments in associates where the Group has significant influence: As of and for the year ended December 31, 2018 Other Ownership Current Non-current Current Non-current Comprehensive Comprehensive Investments with Interest Assets Assets Liabilities Liabilities Revenues Expenses Profit (Loss) Income Income Significant Influence % ThCh$ ThCh$ ThCh$ ThCh$ ThCh$ ThCh$ ThCh$ ThCh$ ThCh$ GNL Chile S.A. 33.33 % 75,571,058 267,884 66,679,077 — 707,597,382 (705,179,225 ) 2,418,157 1,043,609 3,461,766 As of and for the year ended December 31, 2017 Other Ownership Current Non-current Current Non-current Comprehensive Comprehensive Investments with Interest Assets Assets Liabilities Liabilities Revenues Expenses Profit (Loss) Income Income Significant Influence % ThCh$ ThCh$ ThCh$ ThCh$ ThCh$ ThCh$ ThCh$ ThCh$ ThCh$ GNL Chile S.A. 33.33 % 71,254,956 148,950 63,340,564 — 687,399,254 (684,873,130 ) 2,526,124 (24,472 ) 2,501,652 None of our associates have published price quotations. Appendix 3 to these consolidated financial statements provides information on the main activities of our associated companies and the ownership interest the Group holds in them. 14.3 Additional financial information on investments in joint ventures The following tables present information from the financial statements as of December 31, 2018 and 2017, on the main joint ventures: Centrales Hidroeléctricas de Aysén Transmisora Eléctrica de Quillota Ltda. 51.00% 51.00% 50.00% 50.00% 12-31-2018 (*) 12-31-2017 12-31-2018 12-31-2017 Investments in Joint Ventures ThCh$ ThCh$ ThCh$ ThCh$ Total current assets — 355,835 9,360,553 7,793,702 Total non-current assets — 8,030,172 11,530,788 12,036,201 Total current liabilities — 139,182 235,264 440,426 Total non-current liabilities — — 1,708,660 1,751,963 Cash and cash equivalents — 355,446 8,185,391 7,310,296 Revenues — — 3,003,757 2,813,493 Depreciation and amortization expense — — (758,607 ) (782,322 ) Other fixed operating expenses (125,697 ) (8,144,855 ) (784,364 ) (525,471 ) Interest income — 24,829 — — Other income 3,526,179 — 187,601 — Income tax expense — — (349,848 ) (313,709 ) Profit (loss) 3,400,997 (8,193,670 ) 1,309,903 1,191,991 Comprehensive income (loss) 3,400,997 (8,193,670 ) 1,309,903 1,191,991 (*) See Note 14 and Appendix 3. ·Restrictions on funds transfers from associated companies and joint ventures As of December 31, 2018 and 2017, there were no restrictions on funds transfers from associates or joint ventures. 14.4Commitments and contingencies As of December 31, 2018 and 2017, associated companies and joint ventures did not have significant commitments and contingencies. 15. INTANGIBLE ASSETS OTHER THAN GOODWILL, NET Intangible assets as of December 31, 2018 and 2017 are detailed as follows: Balance as of 12-31-2018 12-31-2017 Intangible Assets, Net ThCh$ ThCh$ Easements and water rights 5,664,621 6,338,591 Computer software 17,792,405 9,242,490 Other identifiable intangible assets 453,951 3,026,892 Total 23,910,977 18,607,973 Balance as of 12-31-2018 12-31-2017 Intangible Assets, Gross ThCh$ ThCh$ Easements and water rights 6,281,675 6,920,897 Computer software 39,370,957 24,658,245 Other identifiable intangible assets 3,212,927 5,762,166 Total 48,865,559 37,341,308 Balance as of 12-31-2018 12-31-2017 Accumulated Amoritzation and Impairment ThCh$ ThCh$ Easements and water rights (617,054 ) (582,306 ) Computer software (21,578,552 ) (15,415,755 ) Other identifiable intangible assets (2,758,976 ) (2,735,274 ) Total (24,954,582 ) (18,733,335 ) The reconciliation of the carrying amounts of intangible assets for the years ended December 31, 2018 and 2017 is as follows: Other Identifiable Easements and Computer Intangible Intangible Water Rights Software Assets, Net Assets, Net Changes in Intangible Assets ThCh$ ThCh$ ThCh$ ThCh$ Opening Balance as of January 1, 2018 6,338,591 9,242,490 3,026,892 18,607,973 Changes in identifiable intangible assets Increases other than those from business combinations 2,721 11,231,076 — 11,233,797 Increase (decrease) from net foreign exchange differences, net — (143 ) — (143 ) Amortization — (6,255,236 ) (2,130 ) (6,257,366 ) Increases (decreases) from transfers and other changes — 2,571,157 (2,571,157 ) — Increases (decreases) from transfers — 2,571,157 (2,571,157 ) — Disposals and withdrawals from service (509,981 ) — — (509,981 ) Disposals (509,981 ) — — (509,981 ) Increases (decreases) (166,710 ) 1,003,061 — 836,351 Argentine companies hyperinflation — — 346 346 Total changes in identifiable intangible assets (673,970 ) 8,549,915 (2,572,941 ) 5,303,004 Closing Balance as of December 31, 2018 5,664,621 17,792,405 453,951 23,910,977 Other Identifiable Easements and Computer Intangible Intangible Water Rights Software Assets, Net Assets, Net Changes in Intangible Assets ThCh$ ThCh$ ThCh$ ThCh$ Opening Balance as of January 1, 2017 6,043,003 10,189,162 3,034,709 19,266,874 Changes in identifiable intangible assets Increases other than those from business combinations 295,588 2,179,883 — 2,475,471 Increase (decrease) from net foreign exchange differences, net — — (114 ) (114 ) Amortization — (3,126,555 ) (7,703 ) (3,134,258 ) Increases (decreases) from transfers and other changes — — — — Increases (decreases) from transfers — — — — Disposals and withdrawals from service — — — — Disposals (*) — — — — Increases (decreases) — — — — Argentine companies hyperinflation — — — — Total changes in identifiable intangible assets 295,588 (946,672 ) (7,817 ) (658,901 ) Closing Balance as of December 31, 2017 6,338,591 9,242,490 3,026,892 18,607,973 Other Identifiable Easements and Computer Intangible Intangible Water Rights Software Assets, Net Assets, Net Changes in Intangible Assets ThCh$ ThCh$ ThCh$ ThCh$ Opening Balance as of January 1, 2016 8,052,525 12,373,049 479,852 20,905,426 Changes in identifiable intangible assets Increases other than those from business combinations 540,052 — 2,571,273 3,111,325 Increase (decrease) from net foreign exchange differences, net — — 2,897 2,897 Amortization (*) — (2,183,887 ) (18,961 ) (2,202,848 ) Increases (decreases) from transfers and other changes 352 — (352 ) — Increases (decreases) from transfers 352 — (352 ) — Disposals and withdrawals from service (2,549,926 ) — — (2,549,926 ) Disposals (2,549,926 ) — — (2,549,926 ) Total changes in identifiable intangible assets (2,009,522 ) (2,183,887 ) 2,554,857 (1,638,552 ) Closing Balance as of December 31, 2016 6,043,003 10,189,162 3,034,709 19,266,874 As of December 31, 2018 and December 31, 2017, the Group does not have significant intangible assets with an indefinite useful life. The following table shows goodwill by the CGU or group of CGUs to which it belongs and changes for the years ended December 31, 2018 and 2017: Balance as of Transfer on Balance as of 1-1-2018 mergers 12-31-2018 Company Cash-Generating Unit ThCh$ ThCh$ ThCh$ GasAtacama Chile S.A. Generación Chile 24,860,356 — 24,860,356 Total 24,860,356 — 24,860,356 Balance as of Transfer on Balance as of 1-1-2017 mergers 12-31-2017 Company Cash-Generating Unit ThCh$ ThCh$ ThCh$ GasAtacama Chile S.A. Generación Chile 24,860,356 — 24,860,356 Total 24,860,356 — 24,860,356 The origin of goodwill as detailed below is a result of the acquisitions of the following entities, subsequently merged directly or indirectly into GasAtacama Chile S.A.: On July 12, 2002, the Company acquired 2.51% of the shares of Empresa Eléctrica Pangue S.A. through a put option held by the minority shareholder International Finance Corporation (IFC). On August 11, 2005, the Company acquired interest of Inversiones Lo Venecia Ltda., which held as its only asset 25% interest in the company San Isidro S.A. Subsequently, Empresa Eléctrica Pangue S.A. and the company San Isidro S.A. were merged into Compañía Eléctrica Tarapacá S.A., the latter being the legal successor company. On April 22, 2014, the Company purchased the 50% interest in Inversiones GasAtacama Holding Ltda. held by Southern Cross Latin America Private Equity Fund III L.P. at that time. On October 1, 2016, Inversiones GasAtacama Holding Ltda. was merged into Compañía Eléctrica Tarapacá S.A., the latter being the legal successor company. On November 1, 2016, Compañía Eléctrica Tarapacá S.A. was merged into GasAtacama Chile S.A., the latter being the legal successor company. According to the Group management’s estimates and projections, the expected future cash flows projections attributable to the Cash-Generating Units or groups of Cash-Generating Units, to which the acquired goodwill has been allocated, allow recovering of its carrying amount as of December 31, 2018 and 2017 (see Note 3.b). 17. PROPERTY, PLANT AND EQUIPMENT, NET 17.1Property, plant, and equipment as of December 31, 2018 and 2017: Balance as of 12-31-2018 12-31-2017 Classes of Property, Plant and Equipment, Net ThCh$ ThCh$ Construction in progress 654,854,659 554,424,935 Land 57,932,689 52,063,679 Buildings 8,438,832 9,029,526 Plant and equipment 2,146,295,618 2,117,017,034 Fixtures and fittings 33,921,524 37,160,396 Finance leases 17,654,672 18,508,931 Property, plant and equipment, net 2,919,097,994 2,788,204,501 Balance as of 12-31-2018 12-31-2017 Classes of Property, Plant and Equipment, Gross ThCh$ ThCh$ Construction in progress 654,854,659 554,424,935 Land 57,932,689 52,063,679 Buildings 22,243,315 22,251,858 Plant and equipment 4,670,987,645 4,666,169,339 Fixtures and fittings 98,898,677 104,888,965 Finance leases 28,760,031 28,760,031 Property, plant and equipment, gross 5,533,677,016 5,428,558,807 Balance as of 12-31-2018 12-31-2017 Classes of Accumulated Depreciation and Impairment of Property, Plant and Equipment ThCh$ ThCh$ Buildings (13,804,483 ) (13,222,332 ) Plant and equipment (2,524,692,027 ) (2,549,152,305 ) Fixtures and fittings (64,977,153 ) (67,728,569 ) Finance leases (11,105,359 ) (10,251,100 ) Total Accumulated Depreciation and Impairment in Property, Plant and Equipment (2,614,579,022 ) (2,640,354,306 ) 17.2 The detail of, and changes in, property, plant, and equipment, net for the years December 31, 2018, 2017 and 2016 are as follows: Other Property, Property, Plant and Plant and Construction in Plant and Fixtures and Equipment under Equipment, Progress Land Buildings, Net Equipment, Net Fittings, Net Finance Leases, Net Net Changes in the year ended December 31, 2018 ThCh$ ThCh$ ThCh$ ThCh$ ThCh$ ThCh$ ThCh$ Opening Balance as of January 1, 2018 554,424,935 52,063,679 9,029,526 2,117,017,034 37,160,396 18,508,931 2,788,204,501 Change Increases other than those from business combinations 223,154,320 5,893,739 — 46,227 — — 229,094,286 Increase (decrease) from net foreign exchange differences (129,401 ) (35,406 ) (61,194 ) (790,755 ) 106,382 — (910,374 ) Depreciation — — (611,036 ) (108,405,979 ) (1,636,624 ) (854,258 ) (111,507,897 ) Increases (decreases) from transfers and other changes (135,136,356 ) — 81,534 135,214,591 (159,769 ) — — Increases (decreases) from transfers from construction in process (135,136,356 ) — 81,534 135,214,591 (159,769 ) — — Disposals and withdrawals from service 763 — — (527,470 ) (1 ) — (526,708 ) Disposals — — — (527,469 ) — — (527,469 ) Write-offs (*) 763 — — (1 ) (1 ) — 761 Argentine companies hyperinflation — — — 1,912,829 — — 1,912,829 Other increases/decreases 12,540,398 10,677 2 1,829,141 (1,548,860 ) (1 ) 12,831,357 Total changes 100,429,724 5,869,010 (590,694 ) 29,278,584 (3,238,872 ) (854,259 ) 130,893,493 Closing balance as of December 31, 2018 654,854,659 57,932,689 8,438,832 2,146,295,618 33,921,524 17,654,672 2,919,097,994 Other Property, Property, Plant and Plant and Construction in Plant and Fixtures and Equipment under Equipment, Progress Land Buildings, Net Equipment, Net Fittings, Net Finance Leases, Net Net Changes in the year ended December 31, 2017 ThCh$ ThCh$ ThCh$ ThCh$ ThCh$ ThCh$ ThCh$ Opening Balance as of January 1, 2017 588,700,578 51,342,724 9,703,906 2,033,720,809 24,007,331 19,363,189 2,726,838,537 Change Increases other than those from business combinations 203,401,391 — — — 58,944 — 203,460,335 Increase (decrease) from net foreign exchange differences (101,444 ) (25,624 ) (44,699 ) (336,622 ) 253,596 — (254,793 ) Depreciation — — (629,681 ) (110,391,381 ) (2,327,975 ) (854,258 ) (114,203,295 ) Increases (decreases) from transfers and other changes (207,314,070 ) 776,932 — 191,406,850 15,130,288 — — Increases (decreases) from transfers from construction in process (207,314,070 ) 776,932 — 191,406,850 15,130,288 — — Disposals and withdrawals from service (30,206,357 ) (30,353 ) — (1,723,479 ) 38,212 — (31,921,977 ) Disposals (5,099,800 ) (30,353 ) — (453,882 ) 38,212 — (5,545,823 ) Write-offs (*) (25,106,557 ) — — (1,269,597 ) — — (26,376,154 ) Argentine companies hyperinflation — — — — — — — Other increases/decreases (55,163 ) — — 4,340,857 — — 4,285,694 Total changes (34,275,643 ) 720,955 (674,380 ) 83,296,225 13,153,065 (854,258 ) 61,365,964 Closing balance as of December 31, 2017 554,424,935 52,063,679 9,029,526 2,117,017,034 37,160,396 18,508,931 2,788,204,501 (*) See Note 17.7.8 Material investments in the electricity generation business in Chile include developments in the program to create new capacity, including progress on the construction of the Central Hidroeléctrica Los Cóndores Plant, which will use the resources of the Laguna del Maule and will have approximately 150 MW of installed capacity. The construction involved additions of ThCh$ 142,578,993 for the year ended December 31, 2018 (ThCh$ 102,515,924 for the years ended December 31, 2017). a)Capitalized borrowing costs: Borrowing costs capitalized during the years ended December 31, 2018, 2017 and 2016, amounted to ThCh$6,523,443, ThCh$4,078,463 and ThCh$3,001,211 respectively. Weighted average capitalization rate varied from 7.71% to 7.12% for the year ended December 31, 2018, from 7.12% to 7.95% for the year ended December 31, 2017 and 7.95% to 9% for the year ended December 31, 2017 (see Note 32). b)Capitalized personnel expenses: Personnel expenses directly related to the construction capitalized during the years ended December 31, 2018, 2017 and 2016 amounted to ThCh$7,449,013, ThCh$7,226,484 and ThCh$9,758,304, respectively. As of December 31, 2018 and December 31, 2017, property, plant and equipment includes ThCh$17,654,672 and ThCh$18,508,931, respectively, in leased assets classified as finance leases. The present value of future lease payments derived from these finance leases is as follows: 12-31-2018 12-31-2017 Unearned Present Unearned Present Gross Interest Value Gross Interest Value ThCh$ ThCh$ ThCh$ ThCh$ ThCh$ ThCh$ Less than one year 2,779,081 612,806 2,166,275 2,459,000 659,212 1,799,788 From one to five years 13,284,596 974,421 12,310,175 9,836,000 1,244,808 8,591,192 More than five years — — — 4,377,544 159,610 4,217,934 Total (*) 16,063,677 1,587,227 14,476,450 16,672,544 2,063,630 14,608,914 Leased assets primarily relate to: The Company: a lease agreement for Electric Transmission Lines and Installations (Ralco-Charrúa 2X220 KV) entered into between the Company and Abengoa Chile S.A. The lease agreement has a 20-year maturity and bears interest at an annual rate of 6.5%. The consolidated statements of comprehensive income for the years ended December 31, 2018, 2017 and 2016 include ThCh$ 5,011,340, ThCh$ 3,606,514 and ThCh$ 1,229,779, respectively, related to accrual during these periods of operating lease contracts. As of December 31, 2018 and 2017 the total future lease payments under these contracts are as follows: Balance as of 12-31-2018 12-31-2017 ThCh$ ThCh$ Less than one year 279,253 871,520 From one to five years 523,116 3,331,037 More than five years 1,093,022 754,503 Total 1,895,391 4,957,060 1. As of December 31, 2018 and 2017 the Group had contractual commitments for the acquisition of property, plant and equipment amounting to ThCh$ 166,392,958 and ThCh$ 281,814,599, respectively. 2. As of December 31, 2018, and 2017 the Group does not have property, plant and equipment that was pledged as security for liabilities. 3. The Company and its domestic subsidiaries have insurance contracts in place that provide policies covering against all risks, earthquakes and machinery breakdowns, with a limit of € 1,000 million, including insurance against damages from business interruption. Additionally, the company has Civil Liability insurance in place to cover third-party claims with a limit of € 200 million, and with a limit of € 500 million to cover claims resulting from overflows of dams owned by the Company or its Subsidiaries, and with a limit of € 10 million in the case of Environmental Civil Liability. The premiums associated with these policies are recorded proportionally in each company under pre-paid expenses. 4. The condition of certain assets of the Company changed, primarily works and infrastructure for facilities built to support power generation in the SIC grid in 1998, due primarily to the installation in the SIC of new thermoelectric plants, the arrival of LNG, and new other projects. As such, a new supply configuration for the upcoming years, in which it is expected that these facilities will not be used. Therefore, in 2009, Enel Generación Chile S.A. recognized an impairment loss of ThCh$ 43,999,600 for these assets, which is still has not reversed. (see Note 3.d). 5. At the end of 2014, Enel Generación Chile S.A. recognized an impairment loss of ThCh$ 12,581,947 related to the Punta Alcalde project. This impairment loss was triggered because the current definition of the project is not fully aligned with the strategy that the Company is reformulating; particularly, with regard to technological leadership, and to community and environmental sustainability. Enel Generación Chile S.A. has decided to suspend the project as its profitability is still unclear (see Note 3.d). 6. As of December 31, 2015, Enel Generación Chile S.A. recognized an impairment loss of ThCh$ 2,522,445 related to the wind project Waiwen. This impairment loss was a result of new assessment of the feasibility of the project performed by the Company and a conclusion that, under existing conditions to date, profitability is uncertain. 7. In line with its sustainability strategy and in order to develop community relations, the Company has decided to research new design alternatives for the Neltume project, in particular regarding the question of the discharge of Lake Neltume, which has been raised by the communities in the various instances of dialogue. To start a new phase of research of an alternative project, which includes the discharge of water on the Fuy River in late December 2015, the Company withdrew the Environmental Impact Study. This decision applies only to the Neltume project and not to the transmission project, which continues its course on handling in the Environmental Assessment Service. As a result of the above, as of December 31, 2015, the Group recognized a loss of ThCh$2,706,830, associated with the write down of certain assets related to Environmental Impact Study, which had been withdrawn and to other studies directly linked to the old design of assets. Consequently, in line with the new sustainability strategy and as a result of sustained dialog with the communities, the Company’s projects in the territory, namely Neltume and Choshuenco, have good prospects from the social point of view. However, given the current conditions of the Chilean electricity market, expected profitability of the Neltume and Choshuenco projects is lower than the total capitalized investment in them. As a result, at the end of 2016, the Group recognized an impairment loss of ThCh$ 20,459,461 associated with the Neltume project and ThCh$ 3,748,124 associated with the Choshuenco project. At the end of the fiscal year 2017, following an analysis during the last months, Enel Generación Chile determined to abandon the Neltume project; a decision justified mainly by the high-sustained competitiveness in the Chilean electricity market, which in November 2017 was ratified with the result of the last tender of Electric Distributors. Added to the above, there is the time associated with developing the alternative water discharge, considering a period of no less than 5 years, given the necessity to request and obtain a transfer of the current Water Right and commission a new study for environmental impact. The abandonment implied the recognition of a ThCh$ 21,975,641 loss, with the purpose of reducing to zero the net book value of the assets associated with the project. Additionally, the Company also decided to abandon the Choshuenco project, mainly because the strong synergies considered with the Neltume hydroelectric project would not exist anymore and make it not viable. This decision involved recognizing a loss of ThCh$3,130,270, with the purpose of reducing the net book value of the assets associated with the project to zero. 8. As of August 31, 2016, the Company decided to withdraw from the water rights associated with the hydroelectric projects Bardón, Chillan 1, Chillan 2, Futaleufú, Hechún and Puelo. This decision was taken because of, among other aspects evaluated, the high annual maintenance cost of these unused water rights, lack of technical and economic feasibility and insufficient local community support. As a result, the Group wrote-off a total amount of ThCh$ 32,834,160 of property, plant and equipment and ThCh$ 2,549,926 of intangible assets, which represent 100% of the related costs previously capitalized. 9. As of December 31, 2016, the Group recognized an impairment loss of ThCh$ 6,577,946 associated with certain Non-Conventional Renewable Energy (“NCRE”) initiatives, such as wind, mini-hydro, biomass and solar projects. These initiatives deal with collection of natural resources data (wind speed, solar radiation, etc.) as well as engineering studies enabling the Company to perform and support technical and economical assessments in order to visualize their perspectives and decide on future steps. The results of the studies have not been entirely satisfactory, mainly due to the current conditions in the Chilean electricity market, as future viability of the NCRE projects is uncertain. As a result the Group recognized an impairment of 100% of the capitalized investments to date in NCRE projects. On the other hand, the Group decided to write off 100% of capitalized investment in two thermal projects that until now were held in its portfolio. These are the Tames 2 and Totoralillo projects, which were being developed within the framework of the public land concessions provided by the National Heritage Ministry in 2013. The amount of the write-off was ThCh$ 1,096,137 and arose as a result of the current conditions in the Chilean electricity market, lack of future viability of this type of technology (steam-coal) and high development costs, which make these projects unfeasible. Additionally, at the end of fiscal year 2016, the Company recorded an account payable for ThCh$2,244,900, from penalties that it should pay for waiving the concessions related to these projects. During fiscal year 2017, the Ministry of National Assets and Enel Generación Chile, agreed to extinguish onerous concessions and not imposed any penalties. a)The following is the analysis of deferred income tax assets/(liabilities) presented in the consolidated statements of financial position as of December 31, 2018 and 2017 Effects first Net balance Movements application IFRS restated as of Recognized in Recognized in Foreign currency Other Net balance as of Balance as of December 31, 2018 Net balance as of 9 January 1, profit or comprehensive translation increases December 31, Deferred tax Deferred Tax Deferred tax assets/(liabilities) January 1, 2018 and IAS 29 2018 loss income difference (decreases) 2018 assets Liabilities Depreciation (232,741,069 ) — (232,741,069 ) 20,382,971 — — — (212,358,098 ) 11,567 (212,795,353 ) Obligations for post-employment benefits 1,478,416 — 1,478,416 (192,839 ) 87,818 — — 1,373,395 1,474,757 (101,362 ) Tax loss 9,536,102 9,536,102 (9,536,102 ) — — — — — — Provisions 20,314,110 52,255 20,366,365 4,503,006 — — — 24,869,371 24,869,371 — Dismantling Provision 17,277,993 — 17,277,993 4,185,333 — — — 21,463,326 21,463,326 — Provision for doubtful trade accounts 555,914 52,255 608,169 (107,757 ) — — — 500,412 500,412 — Provision of Human Resources accounts 2,373,725 — 2,373,725 388,183 — — — 2,761,908 2,761,908 — Other Provisions 106,478 — 106,478 37,247 — — — 143,725 143,725 — Other Deferred tax 41,118,525 (213,442 ) 40,905,083 (27,785,843 ) 4 — (10,491,314 ) 2,627,930 8,695,342 (5,641,724 ) Tax Credit 10,491,314 — 10,491,314 — — (10,491,314 ) — — — Deferred income (673,896 ) — (673,896 ) 1,059,308 — — — 385,412 385,412 — Assets classified as held to distribute to owners (*) 30,938,736 — 30,938,736 (30,938,736 ) — — — — 1,398,289 — Monetary Correction - Argentina — (213,442 ) (213,442 ) (212,246 ) — — — (425,688 ) — — Other Deferred Taxes 362,371 — 362,371 2,305,831 4 — — 2,668,206 6,911,641 (5,641,724 ) Deferred tax asses/(liabilities) (160,293,916 ) (161,187 ) (160,455,103 ) (12,628,807 ) 87,822 — (10,491,314 ) (183,487,402 ) 35,051,037 (218,538,439 ) Offsetting of deferred tax assets/(liabilities) (35,051,037 ) 35,051,037 Deferred tax assets/(liabilities) after offsetting (183,487,402 ) — (183,487,402 ) Effects first Net balance Movements application IFRS restated as of Recognized in Recognized in Foreign currency Other Net balance as of Balance as of December 31, 2017 Net balance as of 9 January 1, profit or comprehensive translation increases December 31, Deferred Tax Deferred tax assets/(liabilities) January 1, 2017 and IAS 29 2017 loss income difference (decreases) 2017 Deferred tax assets Liabilities Depreciation (209,128,557 ) — (209,128,557 ) (23,672,231 ) — 61,221 (1,502 ) (232,741,069 ) 146,622 (232,887,691 ) Obligations for post-employment benefits 1,639,108 — 1,639,108 249,625 (68,034 ) — (342,283 ) 1,478,416 1,504,434 (26,018 ) Tax loss 11,911,396 — 11,911,396 (2,375,294 ) — — — 9,536,102 9,536,102 — Provisions 20,198,527 — 20,198,527 (226,700 ) — — 342,283 20,314,110 20,314,110 — Dismantling Provision 15,477,997 — 15,477,997 1,799,996 — — — 17,277,993 17,277,993 — Provision for doubtful trade accounts 513,049 — 513,049 42,865 — — — 555,914 555,914 — Provision of Human Resources accounts 2,405,948 — 2,405,948 (32,223 ) — — — 2,373,725 2,373,725 — Other Provisions 1,801,533 — 1,801,533 (2,037,338 ) — — 342,283 106,478 106,478 — Other Deferred tax 8,798,644 — 8,798,644 28,678,438 (2 ) (28,356 ) 3,669,801 41,118,525 45,901,164 (4,782,639 ) Tax Credit 10,295,696 — 10,295,696 — — — 195,618 10,491,314 10,491,314 — Deferred income 463,768 — 463,768 (1,137,664 ) — — — (673,896 ) (673,896 ) — Assets classified as held to distribute to owners — — — 30,938,736 — — — 30,938,736 30,938,736 — Other Deferred Taxes (1,960,820 ) — (1,960,820 ) (1,122,634 ) (2 ) (28,356 ) 3,474,183 362,371 5,145,010 (4,782,639 ) Deferred tax asses/(liabilities) (166,580,882 ) — (166,580,882 ) 2,653,838 (68,036 ) 32,865 3,668,299 (160,293,916 ) 77,402,432 (237,696,348 ) Offsetting of deferred tax assets/(liabilities) (77,402,432 ) 77,402,432 Deferred tax assets/(liabilities) after offsetting (160,293,916 ) — (160,293,916 ) (*) See Note 14.b Recovery of deferred tax assets will depend on whether sufficient tax profits will be obtained in the future. The Group believes that the future profit projections for its subsidiaries will allow these assets to be recovered. b)As of December 31, 2018, the Group does not have unrecognized deferred tax assets related to tax losses carry forward (see Note 3.o). The Group has not recognized deferred tax liabilities for taxable temporary differences associated with investment in subsidiaries and joint ventures, as it is able to control the timing of the reversal of the temporary differences and considers that it is probable that such temporary differences will not reverse in the foreseeable future. The aggregate amount of taxable temporary differences associated with investments in subsidiaries and joint ventures for which deferred tax liabilities have not been recognized totaled ThCh$ 11,313,612 as of December 31, 2018 (ThCh$ 59,530,551 as of December 31, 2017). Additionally, the Group has not recognized deferred tax assets for deductible temporary differences, associated with investment in subsidiaries and joint ventures, as it is able to control the timing of the reversal of the temporary differences and considers that it is probable that such temporary differences will not reverse in the foreseeable future, which as of December 31, 2018, totaled ThCh$ 242,676,148 (ThCh$ 238,424,357 as of December 31, 2017). The Group companies are potentially subject to income tax audits by the tax authorities in Chile. Such tax audits are limited to a number of annual tax periods and once these have expired audits of these periods can no longer be performed. Tax audits by nature are often complex and can require several years to complete. Tax periods potentially subject to examination correspond to fiscal years 2015-2017. Given the range of possible interpretations of tax standards, the results of any future inspections carried out by tax authorities for the years subject to audit can give rise to tax liabilities that cannot currently be quantified objectively. Nevertheless, the Company Management estimates that the liabilities, if any, that may arise from such audits, would not significantly impact the Company’s future results. The effects of deferred tax on the components of Other Comprehensive Income are as follows: For the year ended December 31, 2018 For the year ended December 31, 2017 For the year ended December 31, 2016 Effects of Deferred Tax on the Components of Amount Income Amount Amount Income Amount Amount Income Amount Other Comprehensive Income ThCh$ ThCh$ ThCh$ ThCh$ ThCh$ ThCh$ ThCh$ ThCh$ ThCh$ Available-for-sale financial assets (15 ) 4 (11 ) 8 (2 ) 6 18 (5 ) 13 Cash flow hedge (138,850,000 ) 37,616,791 (101,233,209 ) 97,309,516 (26,139,149 ) 71,170,367 86,959,338 (20,924,809 ) 66,034,529 Foreign currency translation (5,522,334 ) — (5,522,334 ) (3,690,798 ) — (3,690,798 ) (139,529,128 ) — (139,529,128 ) Investments accounted for using the equity method — — — — — — (11,904,709 ) — (11,904,709 ) Actuarial income on defined-benefit pension plans (325,252 ) 87,818 (237,434 ) 251,976 (68,034 ) 183,942 (1,757,402 ) 474,498 (1,282,904 ) Income tax related to components of other income and expenses debited or credited to Equity (144,697,601 ) 37,704,613 (106,992,988 ) 93,870,702 (26,207,185 ) 67,663,517 (66,231,883 ) (20,450,316 ) (86,682,199 ) The reconciliation of deferred tax movements between balance sheet and comprehensive income for the years 2018, 2017 and 2016 is as follows: For the years ended 12-31-2018 12-31-2017 12-31-2016 ThCh$ ThCh$ ThCh$ Increase (decrease) of the deferred taxes related to continuing operations 87,822 (68,036 ) 474,493 Deferred taxes on hedge movements (revenue and derivatives hedge) 37,616,791 (26,139,149 ) (21,528,043 ) Increase (decrease) of the deferred taxes related to discontinuing operations — — 603,234 Total 37,704,613 (26,207,185 ) (20,450,316 ) Law No. 20,780 was published in the Diario Oficial (the Official Gazette) on September 29, 2014, modifying the income tax and other tax systems. The law stipulates that, starting in 2017, the current income tax system will be replaced with two alternative tax systems: the attributed income system and the partially integrated system. This Law gradually increases the rate of income tax on corporate income. Thus, it are increased to 21% in 2014, to 22.5% in 2015, and 24% in 2016. From 2017 taxpayers choosing the attributed income system are subject to a rate of 25%, while companies choosing the partially integrated system are subject to a rate of 25.5% in 2017 and 27% in 2018. The Law also states that corporations will automatically be subject to the partially integrated system unless a future Special Shareholders’ Meeting agrees to select the attributed income system. Law No. 20,899 was published on February 8, 2016, simplifying the income tax system. This law among its main modifications, imposes a partially integrated system as mandatory for corporations, cancelling previously available attributed income system option. 19. OTHER FINANCIAL LIABILITIES The balance of other financial liabilities as of December 31, 2018 and 2017 is as follows: For the years ended 12-31-2018 12-31-2017 Current Non-current Current Non-current Other Financial Liabilities ThCh$ ThCh$ ThCh$ ThCh$ Interest-bearing borrowings 43,946,822 797,023,880 17,255,679 760,932,929 Hedging derivatives (*) 81,195,765 2,629,715 304,278 21,045,216 Non-hedging derivatives (**) 207,957 159,630 1,255,478 — Total 125,350,544 799,813,225 18,815,435 781,978,145 (*) See Note 21.2.a. (**) See Note 21.2.b. 19.1Interest-bearing borrowings The detail of current and non-current interest-bearing borrowings as of December 31, 2018 and 2017 is as follows: Balance as of 12-31-2018 12-31-2017 Current Non-current Current Non-current Interest-bearing borrowings ThCh$ ThCh$ ThCh$ ThCh$ Bank loans 4 — 109 — Unsecured liabilities 41,780,543 784,713,705 15,455,782 748,123,803 Finance leases 2,166,275 12,310,175 1,799,788 12,809,126 Total 43,946,822 797,023,880 17,255,679 760,932,929 19.2Bank loans by currency and contractual maturity as of December 31, 2018 and 2017 are as follows: ·Summary of bank loans by currency and contractual maturity Balance as of 12-31-2018 Current Non-Current Effective Nominal Secured (Yes / Less than 90 More than 90 Total One to two years Two to three Three to four Four to five More than Total Country Currency Interest Rate Interest Rate No) ThCh$ ThCh$ ThCh$ ThCh$ ThCh$ ThCh$ ThCh$ ThCh$ ThCh$ Chile Ch$ 6.00 % 6.00 % No 4 — 4 — — — — — — Total 4 — 4 — — — — — — Balance as of 12-31-2017 Current Non-Current Effective Nominal Secured (Yes / Less than 90 More than 90 Total One to two years Two to three Three to four Four to five More than Total Country Currency Interest Rate Interest Rate No) ThCh$ ThCh$ ThCh$ ThCh$ ThCh$ ThCh$ ThCh$ ThCh$ ThCh$ Chile Ch$ 6.00 % 6.00 % No 109 — 109 — — — — — — Total 109 — 109 — — — — — — ·Identification of Bank Loans by Company Balance as of 12-31-2018 Current Taxpayer ID Taxpayer ID Effective Nominal Interest Less than 90 More than 91 days Total Current No. (RUT) Company Country No. (RUT) Financial Institution Country Currency Rate Interest Rate payment ThCh$ ThCh$ ThCh$ 91.081.000-6 Enel Generación Chile S.A. Chile 97.036.000-k Banco Santander Chile Ch$ 6.00 % 6.00 % At maturity 4 — 4 Total ThCh$ 4 — 4 Balance as of 12-31-2017 Current Taxpayer ID Taxpayer ID Effective Nominal Interest Less than 90 More than 91 days Total Current No. (RUT) Company Country No. (RUT) Financial Institution Country Currency Rate Interest Rate payment ThCh$ ThCh$ ThCh$ 91.081.000-6 Enel Generación Chile S.A. Chile 97.006.000-6 Banco de Crédito e Inversiones Chile Ch$ 6.00 % 6.00 % At maturity 97 — 97 91.081.000-6 Enel Generación Chile S.A. Chile 97.036.000-k Banco Santander Chile Ch$ 6.00 % 6.00 % At maturity 12 12 Total ThCh$ 109 — 109 The detail of unsecured liabilities by currency and maturity as of December 31, 2018 and 2017 is as follows: Balance as of 12-31-2018 Current Non-current Effective Nominal Secured One to Three to Total One to Two to Three to Four to More than Total Country Currency Rate Rate (Yes/No) ThCh$ ThCh$ ThCh$ ThCh$ ThCh$ ThCh$ ThCh$ ThCh$ ThCh$ Chile US$ 6.99 % 6.90 % No 7,144,997 2,493,452 9,638,449 — — — — 487,595,270 487,595,270 Chile UF 6.00 % 5.48 % No — 32,142,094 32,142,094 30,793,493 30,793,493 30,793,493 30,793,493 173,944,463 297,118,435 Total 7,144,997 34,635,546 41,780,543 30,793,493 30,793,493 30,793,493 30,793,493 661,539,733 784,713,705 Balance as of 12-31-2017 Current Non-current Effective Nominal Secured One to Three to Total One to Two to Three to Four to More than Total Country Currency Rate Rate (Yes/No) ThCh$ ThCh$ ThCh$ ThCh$ ThCh$ ThCh$ ThCh$ ThCh$ ThCh$ Chile US$ 6.99 % 6.90 % No 6,322,081 2,206,269 8,528,350 — — — — 430,228,859 430,228,859 Chile UF 6.00 % 5.48 % No — 6,927,432 6,927,432 5,574,013 5,574,013 5,574,013 5,574,013 295,598,892 317,894,944 Total 6,322,081 9,133,701 15,455,782 5,574,013 5,574,013 5,574,013 5,574,013 725,827,751 748,123,803 The detail of secured liabilities by currency and maturity as of December 31, 2018 and 2017 is as follows: ·Summary of secured liabilities by currency and maturity There are no secured liabilities as of December 31, 2018 and 2017. ·Fair value measurement and hierarchy The fair value of current and non-current bond obligations, both secured and unsecured, as of December 31, 2018 and 2017 totaled ThCh$ 966,998,354 and ThCh$ 947,565,989 respectively. During both periods, the obligations have been classified as Level 2 fair values based on the inputs from the valuation techniques used (see Note 3.g). Notably, these financial liabilities are measured at amortized cost. (See Note 3.f.4). ·Secured and Unsecured Liabilities by Company Balance as of 12-31-2018 Current Non-current One to Two to Three to �� Effective Nominal Secured Less than More than two three four Four to More than Taxpayer ID Taxpayer ID Interest Interest (Yes 90 days 90 days Total years years years five years five years Total No. Company Country No. Company Country Currency Rate Rate / No) ThCh$ ThCh$ ThCh$ ThCh$ ThCh$ ThCh$ ThCh$ ThCh$ ThCh$ 91.081.000-6 Enel Generación Chile S.A. Chile Foreign BNY Mellon S-1 US US$ 7.96 % 7.88 % No 4,693,498 — 4,693,498 — — — — 142,300,747 142,300,747 91.081.000-6 Enel Generación Chile S.A. Chile Foreign BNY Mellon S-2 US US$ 7.40 % 7.33 % No 1,500,880 — 1,500,880 — — — — 48,131,124 48,131,124 91.081.000-6 Enel Generación Chile S.A. Chile Foreign BNY Mellon S-3 US US$ 8.26 % 8.13 % No 950,619 — 950,619 — — — — 22,694,249 22,694,249 91.081.000-6 Enel Generación Chile S.A. Chile Foreign BNY Mellon 24296 US US$ 4.32 % 4.25 % No — 2,493,452 2,493,452 — — — — 274,469,150 274,469,150 91.081.000-6 Enel Generación Chile S.A. Chile 97.036.000-k Banco Santander 317-H Chile U.F. 7.17 % 6.20 % No — 6,513,162 6,513,162 5,733,684 5,733,684 5,733,684 5,733,684 25,386,928 48,321,664 91.081.000-6 Enel Generación Chile S.A. Chile 97.036.000-k Banco Santander 522-M Chile U.F. 4.82 % 4.75 % No — 25,628,932 25,628,932 25,059,809 25,059,809 25,059,809 25,059,809 148,557,535 248,796,771 Total 7,144,997 34,635,546 41,780,543 30,793,493 30,793,493 30,793,493 30,793,493 661,539,733 784,713,705 Balance as of 12-31-2017 Current Non-current One to Two to Three to Effective Nominal Secured Less than More than two three four Four to More than Taxpayer ID Taxpayer ID Interest Interest (Yes 90 days 90 days Total years years years five years five years Total No. Company Country No. Company Country Currency Rate Rate / No) ThCh$ ThCh$ ThCh$ ThCh$ ThCh$ ThCh$ ThCh$ ThCh$ ThCh$ 91.081.000-6 Enel Generación Chile S.A. Chile Foreign BNY Mellon S-1 US US$ 7.96 % 7.88 % No 4,152,926 — 4,152,926 — — — — 125,566,611 125,566,611 91.081.000-6 Enel Generación Chile S.A. Chile Foreign BNY Mellon S-2 US US$ 7.40 % 7.33 % No 1,328,023 — 1,328,023 — — — — 42,902,198 42,902,198 91.081.000-6 Enel Generación Chile S.A. Chile Foreign BNY Mellon S-3 US US$ 8.26 % 8.13 % No 841,132 — 841,132 — — — — 19,398,499 19,398,499 91.081.000-6 Enel Generación Chile S.A. Chile Foreign BNY Mellon 24296 US US$ 4.32 % 4.25 % No — 2,206,269 2,206,269 — — — — 242,361,551 242,361,551 91.081.000-6 Enel Generación Chile S.A. Chile 97.036.000-k Banco Santander 317-H Chile U.F. 7.17 % 6.20 % No — 6,374,051 6,374,051 5,574,013 5,574,013 5,574,013 5,574,013 30,872,536 53,168,588 91.081.000-6 Enel Generación Chile S.A. Chile 97.036.000-k Banco Santander 522-M Chile U.F. 4.82 % 4.75 % No — 553,381 553,381 — — — — 264,726,356 264,726,356 Total 6,322,081 9,133,701 15,455,782 5,574,013 5,574,013 5,574,013 5,574,013 725,827,751 748,123,803 ·Detail of Finance Lease Obligations Balance as of December 31, 2018 Current Non-current One to Two to Three to Nominal Less than More than two three four Four to More than Taxpayer ID Taxpayer ID Interest 90 days 90 days Total years years years five years five years Total No. Company Country No. Name Country Currency Rate ThCh$ ThCh$ ThCh$ ThCh$ ThCh$ ThCh$ ThCh$ ThCh$ ThCh$ 91.081.000-6 Enel Generación Chile S.A. Chile 76.555.400-4 Transelec S.A Chile US$ 6.50 % 528,847 1,637,428 2,166,275 2,307,082 2,457,043 2,616,750 4,929,300 — 12,310,175 Total 2,166,275 12,310,175 Balance as of December 31, 2017 Current Non-current One to Two to Three to Nominal Less than More than two three four Four to More than Taxpayer ID Taxpayer ID Interest 90 days 90 days Total years years years five years five years Total No. Company Country No. Name Country Currency Rate ThCh$ ThCh$ ThCh$ ThCh$ ThCh$ ThCh$ ThCh$ ThCh$ ThCh$ 91.081.000-6 Enel Generación Chile S.A. Chile 76.555.400-4 Transelec S.A Chile US$ 6.50 % 439,377 1,360,411 1,799,788 2,459,000 1,916,774 2,041,364 2,174,053 4,217,935 12,809,126 Total 1,799,788 12,809,126 Of the U.S. dollar denominated debt held by the Group as of December 31, 2018, ThCh 498,203,587 is related to future cash flow hedges for the Group’s U.S. dollar-linked operating income (see Note 3.m). As of December 31, 2017, this amount was ThCh$ 440,823,086. The following table details changes in “Reserve for cash flow hedges” for the years ended December 31, 2018, 2017 and 2016 due to exchange differences corresponding to this debt: 12-31-2018 12-31-2017 12-31-2016 HEDGING RESERVE ThCh$ ThCh$ ThCh$ Balance in hedging reserves (hedging income) at beginning of year (44,278,685 ) (85,790,673 ) (122,448,724 ) Foreign currency exchange differences recorded in net equity (41,257,222 ) 28,878,949 23,870,051 Recognition of foreign currency exchange differences in profit (loss) 11,321,589 12,633,039 12,788,000 Balance in hedging reserves (hedging income) at year end (74,214,318 ) (44,278,685 ) (85,790,673 ) As of December 31, 2018 and 2017 the Group had long-term lines of credit unconditionally available for use totaling ThCh$ 138,954,000 and ThCh$ 199,271,103 respectively. 19.7 Future undiscounted debt flows The following table shows the estimates of undiscounted cash flows by type of financial debt: · Summary of bank loans by currencies and maturities Balance as of 12-31-2018 Current Non-Current Nominal Secured Less than 90 More than 90 Total One to two years Two to three Three to Four to More Total Country Currency Rate No) ThCh$ ThCh$ ThCh$ ThCh$ ThCh$ ThCh$ ThCh$ ThCh$ ThCh$ Chile Ch$ 6.00 % No 4 — 4 — — — — — — Total 4 — 4 — — — — — — Balance as of 12-31-2017 Current Non-Current Nominal Secured Less than 90 More than 90 Total One to two years Two to three Three to Four to More Total Country Currency Rate No) ThCh$ ThCh$ ThCh$ ThCh$ ThCh$ ThCh$ ThCh$ ThCh$ ThCh$ Chile Ch$ 6.00 % No 109 — 109 — — — — — — Total 109 — 109 — — — — — — · Summary of secured and unsecured liabilities by currency and maturity Balance as of 12-31-2018 Current Non-current One to Three to Two to Effective Nominal three twelve One to three Three to Four to five More than Interest Interest Secured months months Total two years years four years years five years Total Country Currency Rate Rate (Yes/No) ThCh$ ThCh$ ThCh$ ThCh$ ThCh$ ThCh$ ThCh$ ThCh$ ThCh$ Chile US$ 6.00 % 6.90 % No 7,557,992 22,673,976 30,231,968 30,231,967 30,231,967 30,231,967 30,231,967 763,227,018 884,154,886 Chile UF 6.00 % 5.48 % No 6,603,562 49,871,556 56,475,118 54,036,540 51,597,963 49,159,386 46,720,808 224,787,689 426,302,386 Total 14,161,554 72,545,532 86,707,086 84,268,507 81,829,930 79,391,353 76,952,775 988,014,707 1,310,457,272 Balance as of 12-31-2017 Current Non-current One to Three to Two to Effective Nominal three twelve One to three Three to Four to five More than Interest Interest Secured months months Total two years years four years years five years Total Country Currency Rate Rate (Yes/No) ThCh$ ThCh$ ThCh$ ThCh$ ThCh$ ThCh$ ThCh$ ThCh$ ThCh$ Chile US$ 6.00 % 6.90 % No 6,697,979 20,093,935 26,791,914 26,791,913 26,791,913 26,791,913 26,791,913 703,872,066 811,039,718 Chile UF 6.00 % 5.48 % No 5,775,038 22,689,438 28,464,476 51,927,014 49,837,566 47,748,117 45,658,669 256,892,562 452,063,928 Total 12,473,017 42,783,373 55,256,390 78,718,927 76,629,479 74,540,030 72,450,582 960,764,628 1,263,103,646 · Summary of finance lease obligations Balance as of December 31, 2018 Current Non-current Nominal Secured Less than More than Total One to Two to Three to Four to More than Total Country Currency Rate (Yes/No) ThCh$ ThCh$ ThCh$ ThCh$ ThCh$ ThCh$ ThCh$ ThCh$ ThCh$ Chile US$ 6.50 % No 760,090 2,278,842 3,038,932 3,034,977 3,030,765 3,026,279 5,044,764 14,136,785 Total 760,090 2,278,842 3,038,932 3,034,977 3,030,765 3,026,279 5,044,764 — 14,136,785 Balance as of December 31, 2017 Current Non-current Nominal Secured Less than More than Total One to Two to Three to Four to More than Total Country Currency Rate (Yes/No) ThCh$ ThCh$ ThCh$ ThCh$ ThCh$ ThCh$ ThCh$ ThCh$ ThCh$ Chile US$ 6.50 % No 685,232 2,052,448 2,737,680 2,728,693 2,719,123 2,708,931 2,698,076 4,473,883 15,328,706 Total 685,232 2,052,448 2,737,680 2,728,693 2,719,123 2,708,931 2,698,076 4,473,883 15,328,706 The Group’s companies are exposed to certain risks that are managed by systems that identify, measure, limit concentration of, and monitor these risks. The main principles in the Group’s risk management policy include the following: · Compliance with good corporate governance standards. · Strict compliance with all the Group’s internal policies. · Each business and corporate area determines: i) The markets in which it can operate based on its knowledge and ability to ensure effective risk management, ii) Criteria regarding counterparts; and iii) Authorized operators. · Business and corporate areas establish their risk tolerance in a manner consistent with the defined strategy for each market in which they operate. · All of the operations of the businesses and corporate areas are conducted within the limits approved for each case. · Businesses, corporate areas, lines of business and companies design the risk management controls necessary to ensure that transactions in the markets are conducted in accordance with the Group policies, standards, and procedures. Changes in interest rates affect the fair value of assets and liabilities bearing fixed interest rates, as well as the expected future cash flows of assets and liabilities subject to floating interest rates. The objective of managing interest rate risk exposure is to achieve a balance in the debt structure to minimize the cost of debt with reduced volatility in profit or loss. Depending on the Group’s estimates and on the objectives of the debt structure, hedging transactions are performed by entering into derivatives contracts that mitigate interest rate risk. The financial debt structure of the Group detailed by fixed and/or hedged and floating interest rate on total net debt, net of hedging derivative instruments, is as follows: Gross position Balance as of 12-31-2018 12-31-2017 % % Fixed interest rate 93 % 92 % Exchange rate risks principally involve the following transactions: · Debt taken on by the Group’s companies that is denominated in a currency other than that in which its cash flows are indexed. · Payments to be made for the acquisition of project-related materials in a currency other than that in which its cash flows are indexed. · Revenues in Group companies directly linked to changes in currencies other than those of its cash flows. In order to mitigate exchange rate risk, the Group’s foreign currency risk management policy is based on cash flows and includes maintaining a balance between U.S. dollar flows and the levels of assets and liabilities denominated in this currency. The objective is to minimize the exposure to variability in cash flows that are attributable to foreign exchange risk. The hedging instruments currently being used to comply with the policy are currency swaps and forward exchange contracts. In addition, the policy seeks to refinance debt in the functional currency of each of the Group’s companies. The Group has a risk exposure to price changes in certain commodities, due basically to: · Purchases of fuel used to generate electricity. · Energy purchase/sale transactions that take place in local markets. In order to reduce the risk in situations of extreme drought, the Company has designed a commercial policy that defines the levels of sales commitments in line with the capacity of its generating power plants in a dry year. It also includes risk mitigation terms in certain contracts with unregulated customers and, in the case of regulated customers subject to long-term tender agreements, it determines indexation polynomials that help reduce exposure to commodity risk. Considering the operating conditions faced by the power generation market in Chile, with drought and highly volatile commodity prices on international markets, the Company is constantly verifying the advisability of using hedging to lessen the impacts that these price swings have on its results. As of December 31, 2018 there were current operations for 432 kTon of API2 to be settled in 2019, 994 kBbl of Brent to be settled in 2019, 225 kTon of BCI7 to be settled in 2019 and 0.2 TBtu of HH to be settled in 2019 (figures considered net hedged position). As of December 31, 2017, the Group had swap hedges for 2.3 million MMBTU to be settled at January 2018. Depending on operating conditions, which are constantly being updated, these hedges may be modified or may cover other commodities. The Group’s liquidity risk management policy consists of entering into long-term committed banking facilities and temporary financial investments for amounts that cover the projected needs over a period of time that is determined based on the situation and expectations for debt and capital markets. The projected needs mentioned above include maturities of financial debt, net of financial derivatives. For further details regarding the features and conditions of financial obligations and financial derivatives (see Notes 19 and 21). As of December 31, 2018 the Group has liquidity of cash and cash equivalent totaling ThCh$ 151,989,905 and unconditionally available lines of long-term credit totaling ThCh$ 138,954,000. As of December 31, 2017 the Group has liquidity of cash and cash equivalent totaling ThCh$ 211,027,141 and unconditionally available lines of long-term credit totaling ThCh$ 199,271,103. The Group closely monitors its credit risk. Trade receivables: The credit risk for receivables from the Group’s commercial activity has historically been very low, due to the short-term period of collections from customers, resulting in non-significant cumulative receivables amounts. Energy service to customers with outstanding payments is suspended, and most contracts have termination clauses for payment default. The Company monitors its credit risk on an ongoing basis and measures its maximum exposure to payment default risk, which, as stated above, is very limited. Financial assets, other than trade receivables: Cash surpluses are invested in the highest-rated local and foreign financial entities (with risk rating equivalent to investment grade whenever possible) with thresholds established for each entity. Banks having investment grade ratings from the three main international rating agencies (Moody’s, S&P and Fitch) are considered in the investment selection process. Investments may be backed with Chilean treasury bonds and/or with commercial paper issued by the highest rated banks; the latter are preferred, as they offer higher returns (always in line with current investment policies). The Group measures the Value at Risk (VaR) of its debt positions and financial derivatives in order to monitor the risk assumed by the Company, thereby reducing volatility in the income statement. The portfolio of positions included in calculating the current VaR consists of the following: · Financial debt. · Hedge derivatives for debt, dividends and projects. The VaR determined represents the potential variation in value of the portfolio of positions described above within a quarter with a 95% confidence level. To determine the VaR, we take into account the volatility of the risk variables affecting the value of the portfolio of positions including: · U.S. dollar Libor interest rate. · The exchange rates of the various currencies used in the calculation. The calculation of VaR is based on generating possible future scenarios (at one quarter) of market values for the risk variables, using scenarios based on actual observations for 5 years of the same period (quarter). The quarterly 95%-confidence VaR number is calculated as the 5% percentile of the potential quarterly variations in the fair value of the portfolio. Given the aforementioned assumptions, the quarterly VaR of the positions discussed above corresponds to ThCh$ 36,993,336. These values represent the potential increase of the Debt and Derivatives’ Portfolio, thus these VaR are inherently related, among other factors, to the Portfolio’s value at each quarter’s end. 21.1Financial instruments, classified by type and category a)The detail of financial assets, less cash and cash equivalents, classified by type and category, as of December 31, 2018 and 2017 is as follows: Financial assets at fair Financial assets measured Financial assets at fair Financial derivatives designated Balance as of 12-31-2018 ThCh$ ThCh$ ThCh$ ThCh$ Equity instruments — — 269,031 — Trade and other receivables — 371,656,536 — — Derivative instruments 1,491,497 — 1,423,613 38,169,894 Other financial assets — 84,580 — — Total current 1,491,497 371,741,116 1,692,644 38,169,894 Equity instruments — — 2,326,484 — Trade and other receivables — 1,156,638 — — Derivative instruments 36,086 — — — Total non-current 36,086 1,156,638 2,326,484 — Total 1,527,583 372,897,754 4,019,128 38,169,894 Financial assets at fair Financial assets measured Financial assets at fair Financial derivatives designated Balance as of 12-31-2017 ThCh$ ThCh$ ThCh$ ThCh$ Trade and other receivables — 301,379,119 — — Derivative instruments 10,343,671 — 5,742,633 20,038,433 Other financial assets — 82,127 — — Total current 10,343,671 301,461,246 5,742,633 20,038,433 Equity instruments 6,353 — 2,595,342 — Trade and other receivables — 1,032,923 — — Derivative instruments — — — 30,789,703 Total non-current 6,353 1,032,923 2,595,342 30,789,703 Total 10,350,024 302,494,169 8,337,975 50,828,136 b)The detail of financial liabilities, classified by type and category, as of December 31, 2018 and 2017 is as follows: Financial liabilities at fair Financial liabilities Financial liabilities at fair value Financial derivatives designated Balance as of 12-31-2018 ThCh$ ThCh$ ThCh$ ThCh$ Interest-bearing loans — 43,946,822 — — Trade and other current payables — 419,006,236 — — Derivative instruments 756,005 — 7,161,949 81,195,765 Other financial liabilities — — — — Total current 756,005 462,953,058 7,161,949 81,195,765 Interest-bearing loans — 797,023,880 — — Trade and other current payables — 450,421 — — Derivative instruments 159,630 — — 2,629,715 Total non-current 159,630 797,474,301 — 2,629,715 Total 915,635 1,260,427,359 7,161,949 83,825,480 Financial liabilities held Loans and payables Financial liabilities at fair value Financial derivatives designated Balance as of 12-31-2017 ThCh$ ThCh$ ThCh$ ThCh$ Interest-bearing loans — 17,255,679 — — Trade and other current payables — 429,451,249 — — Derivative instruments 1,255,478 — — 304,278 Other financial liabilities 889,026 — — — Total current 2,144,504 446,706,928 — 304,278 Interest-bearing loans — 760,932,929 — — Trade and other current payables — 951,161 — — Derivative instruments — — — 21,045,216 Total non-current — 761,884,090 — 21,045,216 Total 2,144,504 1,208,591,018 — 21,349,494 The risk management policy of the Group primarily uses interest rate and foreign exchange rate derivatives to hedge its exposure to interest rate and foreign currency risks. The Company classifies its derivatives as follows: ·Derivatives designated for Cash flow hedges: Those that hedge the cash flows of the underlying hedged item. ·Derivatives designated for Fair value hedges: Those that hedge the fair value of the underlying hedged item. ·Non-hedge derivatives: Financial derivatives that do not meet the requirements established by IFRS to be designated as hedge instruments are recognized at fair value with changes in net profit (assets held for trading). a)Assets and liabilities for hedge derivative instruments As of December 31, 2018 and 2017, financial derivative transactions qualifying as hedge instruments resulted in recognition of the following assets and liabilities in the consolidated statement of financial position: Balance as of 12-31-2018 12-31-2017 Assets Liabilities Assets Liabilities Current Non-current Current Non-current Current Non-current Current Non-current ThCh$ ThCh$ ThCh$ ThCh$ ThCh$ ThCh$ ThCh$ ThCh$ Exchange rate hedge: 38,169,894 — 81,195,765 2,629,715 20,038,433 30,789,703 304,278 21,045,216 Cash flow hedge 38,169,894 — 81,195,765 2,629,715 20,038,433 30,789,703 304,278 21,045,216 Total 38,169,894 — 81,195,765 2,629,715 20,038,433 30,789,703 304,278 21,045,216 ·General information on hedge derivative instruments Hedge derivative instruments and their corresponding hedged instruments are shown in the following table: Type of Description of Fair value of Fair value of hedging hedging Description of 12-31-2018 12-31-2017 Type of risks instrument instrument hedged item ThCh$ ThCh$ hedged SWAP Exchange rate Unsecured liabilities (bonds) (18,892,399 ) 7,696,061 Cash flow FORWARD Exchange rate Revenues (26,763,187 ) 21,782,581 Cash flow For the years ended December 31, 2018 and 2017, the Group has not recognized gains or losses for ineffective cash flow hedges, based in results of hedge effectiveness test. b) �� Financial derivative instrument assets and liabilities at fair through profit or loss As of December 31, 2018 and 2017, financial derivative transactions recognized at fair value through profit or loss, resulted in the recognition of the following assets and liabilities in the statement of financial position: Balance as of 12-31-2018 12-31-2017 Asset Liabilities Asset Liabilities Current Non-Current Current Non-Current Current Non-Current Current Non-Current Non-hedging derivative instruments 41,023 36,086 207,957 159,630 402,716 — 1,255,478 — Total 41,023 36,086 207,957 159,630 402,716 — 1,255,478 — These derivative instruments correspond to forward contracts entered into by the Group, whose purpose is to hedge the exchange rate risk related to future obligations arising from civil works contracts linked to the construction of the Los Cóndores Plant. Although these hedges have an economic background, they do not qualify as accounting hedge because they do not strictly comply with the accounting hedge requirements established in NIIF 9 “Financial Instruments: Recognition and Measurement”. c)Other disclosures on financial derivatives The following tables present the fair value of hedging and non-hedging financial derivatives entered into by the Group as well as the remaining contractual maturities as of December 31, 2018 and 2017: Balance as of 12-31-2018 Notional value Fair value Less than 1 - 2 years 2 - 3 years Total Financial derivatives ThCh$ ThCh$ ThCh$ ThCh$ ThCh$ Exchange rate hedges: (45,655,586 ) 1,227,557,071 76,355,223 — 1,303,912,294 Cash flow hedges (45,655,586 ) 1,227,557,071 76,355,223 — 1,303,912,294 Derivatives not designated for hedge accounting (290,478 ) 34,525,045 29,457,793 1,913,220 65,896,058 Total (45,946,064 ) 1,262,082,116 105,813,016 1,913,220 1,369,808,352 Balance as of 12-31-2017 Notional value Fair value Less than 1 - 2 years 2 - 3 years Total Financial derivatives ThCh$ ThCh$ ThCh$ ThCh$ ThCh$ Exchange rate hedges: 29,478,642 306,350,419 525,812,635 — 832,163,054 Cash flow hedges 29,478,642 306,350,419 525,812,635 — 832,163,054 Derivatives not designated for hedge accounting (852,762 ) 19,682,638 — — 19,682,638 Total 28,625,880 326,033,057 525,812,635 — 851,845,692 The hedging and non-hedging derivatives contractual maturities do not represent the Group’s total risk exposure, as the amounts recorded in the above tables have been drawn up based on undiscounted contractual cash inflows and outflows for their settlement. Financial instruments recognized at fair value in the consolidated statement of financial position are classified based on the hierarchy described in Note 3.g above. The following table presents financial assets and liabilities measured at fair value as of December 31, 2018 and 2017: Fair value measured at end of Balance as of 12-31-2018 Level 1 Level 2 Level 3 Financial instruments measured at fair value ThCh$ ThCh$ ThCh$ ThCh$ Financial Assets Financial derivatives designated as cash flow hedges 38,169,894 — 38,169,894 — Financial derivatives not designated for hedge accounting 77,109 — 77,109 — Commodity derivatives designated as non-cash flow hedge 1,450,474 — 1,450,474 — Commodity derivatives designated as cash flow hedges 1,423,613 — 1,423,613 — Available-for-sale financial assets, non-current — — — — Equity instruments at fair value with changes in other comprehensive income 2,595,515 2,326,484 269,031 Total 43,716,605 2,326,484 41,390,121 — Financial Liabilities Financial derivatives designated as cash flow hedges 83,825,480 — 83,825,480 — Financial derivatives not designated for hedge accounting 367,587 — 367,587 — Commodity derivatives designated as non-cash flow hedge 548,048 — 548,048 — Commodity derivatives designated as fair value hedge 7,161,949 — 7,161,949 — Total 91,903,064 — 91,903,064 — Fair value measured at end of Balance as of 12-31-2017 Level 1 Level 2 Level 3 Financial instruments measured at fair value ThCh$ ThCh$ ThCh$ ThCh$ Financial Assets Financial derivatives designated as cash flow hedges 50,828,136 — 50,828,136 — Financial derivatives not designated for hedge accounting 402,716 — 402,716 — Commodity derivatives designated as non-cash flow hedge 9,940,955 — 9,940,955 — Commodity derivatives designated as cash flow hedges 5,472,633 — 5,742,633 — Available-for-sale financial assets, non-current 6,353 6,353 — — Total 66,650,793 6,353 66,914,440 — Financial Liabilities Financial derivatives designated as cash flow hedges 21,349,494 — 21,349,494 — Financial derivatives not designated for hedge accounting 1,255,478 — 1,255,478 — Commodity derivatives designated as non-cash flow hedge 889,026 — 889,026 — Commodity derivatives designated as fair value hedge — — — Total 23,493,998 — 23,493,998 — The breakdown of trade and other payables as of December 31, 2018 and 2017 is as follows: Balance as of 12-31-2018 12-31-2017 Current Non-current Current Non-current Trade and other payables ThCh$ ThCh$ ThCh$ ThCh$ Trade payables 106,415,197 — 94,132,901 — Other payables 168,916,421 450,421 215,750,627 632,643 Total trade and other payables 275,331,618 450,421 309,883,528 632,643 The detail of trade and other payables as of December 31, 2018 and 2017 is as follows: Balance as of 12-31-2018 12-31-2017 Current Non-current Current Non-current Trade and other payables ThCh$ ThCh$ ThCh$ ThCh$ Energy suppliers 66,627,358 — 80,832,851 — Fuel and gas suppliers 39,787,839 — 13,300,050 — Payables to tax authorities other than Corporate Income Tax 1,547,674 — 2,353,000 — Payables for goods and services 32,379,106 6,765 56,004,450 5,431 Asset Purchases 111,336,945 — 90,585,971 — Deposits in guarantee 183,514 — 194,193 Dividends payable to non-controlling interests 9,357,160 — 53,139,347 — Mitsubishi contract (LTSA) 710,477 — 1,227,656 — Other employee Benefits 12,745,222 — 11,741,237 — Other payables 656,323 443,656 504,773 627,212 Total trade and other payables 275,331,618 450,421 309,883,528 632,643 See Note 20.4 for the description of the liquidity risk management policy. The detail of payments due and paid as of December 31, 2018 and 2017 is presented in Appendix 6. a)The breakdown of provisions as of December 31, 2018 and 2017 is as follows: Balance as of 12-31-2018 12-31-2017 Current Non-current Current Non-current Provisions ThCh$ ThCh$ ThCh$ ThCh$ Provision for legal proceedings 3,884,018 — 3,497,786 — Decommissioning or restoration (*) — 79,493,801 — 63,992,567 Other provisions 1,298,849 — 1,798,849 — Total 5,182,867 79,493,801 5,296,635 63,992,567 (*) See Note 3.a. Provision for legal proceedings mainly consist of the contingencies related to the lawsuits on administrative sanctions. The ultimate timing and amount of the cash outflows related to the above provisions depends on the final resolution of the provisioned matters. For example, in the specific case of the legal proceedings it depends on the final resolution of the related legal claim. The Administration considers that the provisions recognized in the financial statements adequately cover the corresponding risks. b)Changes in provisions for the years ended December 31, 2018, and 2017 are as follows: Legal Decommissioning Other Total Changes in Provisions ThCh$ ThCh$ ThCh$ ThCh$ Opening balance as of January 1, 2018 3,497,786 63,992,567 1,798,849 69,289,202 Changes in Provisions Increase (decrease) in existing provisions 991,032 12,485,197 — 13,476,229 Provisions used (315,412 ) — (500,000 ) (815,412 ) Reversal of Not Used Provision (*) (259,419 ) — — (259,419 ) Increase for adjustment to value of money over time — 3,016,037 — 3,016,037 Foreign currency translation (29,969 ) — — (29,969 ) Total changes in provisions 386,232 15,501,234 (500,000 ) 15,387,466 Closing Balance as of December 31, 2018 3,884,018 79,493,801 1,298,849 84,676,668 Legal Decommissioning Other Total Changes in Provisions ThCh$ ThCh$ ThCh$ ThCh$ Opening balance as of January 1, 2017 4,694,579 57,325,915 1,798,849 63,819,343 Changes in Provisions Increase (decrease) in existing provisions 309,749 4,340,858 — 4,650,607 Provisions used (495,166 ) — — (495,166 ) Reversal of Not Used Provision (*) (1,016,300 ) — — (1,016,300 ) Increase for adjustment to value of money over time — 2,325,794 — 2,325,794 Foreign currency translation 4,924 — — 4,924 Total changes in provisions (1,196,793 ) 6,666,652 — 5,469,859 Closing Balance as of December 31, 2017 3,497,786 63,992,567 1,798,849 69,289,202 (*) Corresponds to reversals of provisions for Litigation. 24.EMPLOYEE BENEFIT OBLIGATIONS The Company and GasAtacama Chile S.A. provide various post-employment benefits for all or some of their active or retired employees. These benefits are calculated and recognized in the financial statements according to the criteria described in Note 3.l.1, and include primarily the following: ·Defined benefit plans: Complementary pension: The beneficiary is entitled to receive a monthly amount that supplements the pension obtained from the respective social security system. Employee severance indemnities: The beneficiary receives a certain number of contractual salaries upon retirement. Such benefit is subject to a required minimum service vesting requirement period, which depending on the company, varies within a range from 5 to 15 years. Electricity: The beneficiary receives a monthly bonus to cover a portion of their billed residential electricity consumption. Health benefit: The beneficiary receives health coverage in addition to that to which they are entitled to under applicable social security system. 24.2Details, changes and presentation in financial statements a) The post-employment obligations associated with the defined benefits plan as of December 31, 2018 and 2017 are as follows: Balance as of 12-31-2018 12-31-2017 Post-employment obligations ThCh$ ThCh$ Post-employment obligations 14,610,975 14,875,948 Total 14,610,975 14,875,948 Non-current portion 14,610,975 14,875,948 b) The balance and changes in post-employment defined benefit obligations as of and for the years ended December 31, 2018, 2017 and 2016 are as follows: Actuarial Value of Post-employment Obligations ThCh$ Closing balance as of December 31, 2016 Tax Receivables Balance as of 12-31-2016 12-31-2015 ThCh$ ThCh$ Monthly provisional tax payments 24,452,330 12,656,076 Tax credit for absorbed profits 9,839,979 9,597 Tax credit for training expenses - 22,000 Minimum presumed income 146,099 1,095 Other - 2,168,694 Total 34,438,408 14,857,462 Current service cost 790,850 Net interest cost 691,075 Actuarial gains from changes in financial assumptions (310,557 ) Actuarial gains from changes in seniority adjustments 58,581 Contributions paid by the Company (1,993,830 ) Transfer of (180,728 ) Closing balance as of December 31, Tax Payables Balance as of 12-31-2016 12-31-2015 ThCh$ ThCh$ Income tax 61,457,940 14,484,736 Total 61,457,940 14,484,736 14,875,948 Current service cost 680,467 Net interest cost Actuarial gains from changes in financial assumptions 145,338 Actuarial gains from changes in seniority adjustments 179,914 Changes in Investments in Associates Relationship Country Functional Currency Ownership % Balance as of 1-1-2016 Additions Share of Dividends Foreign Other Other Balance as of Transferred to assets held for distribution to owners Balance as of ThCh$ ThCh$ ThCh$ ThCh$ ThCh$ ThCh$ ThCh$ ThCh$ ThCh$ ThCh$ Electrogas S.A. (1) Associate Chile U.S. dollar 42.5000 12,042,874 - 5,166,226 (3,979,095) (844,372) 607,375 - 12,993,008 (12,993,008) - GNL Quinteros S.A. (2) Associate Chile U.S. dollar 20.0000 17,137,023 - 2,750,075 (2,598,035) (816,094) (12,298,165) (4,174,804) - - - GNL Chile S.A. Associate Chile U.S. dollar 33.3300 2,662,029 - 1,491,025 - (170,122) - - 3,982,932 - 3,982,932 Centrales Hidroeléctricas de Aysén S.A. Joint venture Chile Chilean peso 51.0000 6,280,292 2,346,000 (2,185,127) - - - - 6,441,165 - 6,441,165 Transmisora Eléctrica de Quillota Ltda. Joint venture Chile Chilean peso 50.0000 7,594,153 - 628,611 - - - - 8,222,764 - 8,222,764 Enel Argentina (formerly named Endesa Argentina S.A.) Associate Argentina Argentine peso 0.3400 - 235,090 23,611 - (21,043) (656) (145,665) 91,337 - 91,337 Southern Cone Power Argentina S.A. (3) Associate Argentina Argentine peso 2.0000 - 3,326 3,780 - (1,080) (63) (5,963) - - - TOTAL 45,716,371 2,584,416 7,878,201 (6,577,130) (1,852,711) (11,691,509) (4,326,432) 31,731,206 (12,993,008) 18,738,198 Changes in Investments in Associates Relationship Country Functional Currency Ownership % Balance as of 1-1-2015 Additions Share of Dividends Foreign Other Balance as of Negative Transferred to assets held for distribution to owners Balance as of ThCh$ ThCh$ ThCh$ ThCh$ ThCh$ ThCh$ ThCh$ ThCh$ ThCh$ ThCh$ Electrogas S.A. (1) Associate Chile U.S. dollar 42.5000 10,777,659 - 5,121,427 (4,398,423) 1,120,074 (577,863) 12,042,874 - - 12,042,874 GNL Quinteros S.A. (1) Associate Chile U.S. dollar 20.0000 15,198,935 - 4,534,344 (4,449,179) 1,852,923 - 17,137,023 - - 17,137,023 GNL Chile S.A. (1) Associate Chile U.S. dollar 33.3300 1,818,168 - 495,389 - 348,472 - 2,662,029 - - 2,662,029 Centrales Hidroeléctricas de Aysén S.A. (1) Joint venture Chile Chilean peso 51.0000 6,144,557 2,550,000 (2,414,264) - - - 6,280,292 - - 6,280,292 Transmisora Eléctrica de Quillota Ltda. (1) Joint venture Chile Chilean peso 50.0000 6,426,004 - 1,168,149 - - - 7,594,153 - - 7,594,153 Enel Brasil S.A. (2) Associate Brazil Brazilian real 38.6367 538,876,929 - 36,473,505 (16,467,640) (112,807,060) (1,893,133) 444,182,602 - (444,182,602) - Enel Trading Argentina S.R.L. (formerly named Endesa Cemsa S.A.) (2) Associate Argentina Argentine peso 45.0000 1,979,132 - (820,910) - (281,870) - 876,352 - (876,352) - Distrilec Inversora S.A. (2), (3) and (4) Associate Argentina Argentine peso 0.8875 - - 497,609 - (36,875) (4,306) 456,428 (315,634) (140,794) - Central Térmica Manuel Belgrano (2) Associate Argentina Argentine peso 24.1760 - 8,623 1,336,702 (585,303) (171,618) - 588,404 - (588,404) - Central Térmica San Martin (2) Associate Argentina Argentine peso 24.1760 - 8,623 1,192,755 (502,124) (157,897) - 541,357 - (541,357) - Central Vuelta Obligada S.A. (2) Associate Argentina Argentine peso 34.5000 - 12,213 - - (2,758) - 9,455 - (9,455) - TOTAL 581,221,384 2,579,459 47,584,706 (26,402,669) (110,136,609) (2,475,302) 492,370,969 (315,634) (446,338,964) 45,716,371 Changes in Investments in Associates Relationship Country Functional Currency Ownership % Balance as of 1-1-2014 Additions Share of Dividends Foreign Other Other Balance as of Negative Balance as of ThCh$ ThCh$ ThCh$ ThCh$ ThCh$ ThCh$ ThCh$ ThCh$ ThCh$ ThCh$ Electrogas S.A. (1) Associate Chile U.S. dollar 42.5000 9,682,324 - 4,456,124 (4,239,280) 847,016 31,475 - 10,777,659 - 10,777,659 Enel Brasil S.A. (2) Associate Brazil Brazilian real 38.6367 543,713,349 - 62,181,301 (75,642,378) 10,619,850 (1,995,193) - 538,876,929 - 538,876,929 GNL Quinteros S.A. (1) Associate Chile U.S. dollar 20.0000 4,797,508 - 3,541,883 (6,897,599) 311,747 13,445,396 - 15,198,935 - 15,198,935 GNL Chile S.A. (1) Associate Chile U.S. dollar 33.3300 559,615 - 1,099,143 - 159,410 - - 1,818,168 - 1,818,168 Inversiones GasAtacama Holding Ltda. (1) Joint venture Chile U.S. dollar 50.0000 123,627,967 - 3,053,468 - 8,919,247 - (135,600,682) - - - Centrales Hidroeléctricas de Aysén S.A. (1) Joint venture Chile Chilean peso 51.0000 69,684,864 3,315,000 (66,855,307) - - - - 6,144,557 - 6,144,557 Transmisora Eléctrica de Quillota Ltda.(1) Joint venture Chile Chilean peso 50.0000 6,073,897 - 352,107 - - - - 6,426,004 - 6,426,004 Enel Trading Argentina S.R.L. (formerly named Endesa Cemsa S.A.) (2) Associate Argentina Argentine peso 45.0000 2,400,103 - (153,554) - (267,417) - - 1,979,132 - 1,979,132 Distrilec Inversora S.A. (2), (3) and (4) Associate Argentina Argentine peso 0.8875 141,706 - (429,336) - (24,724) (3,280) - (315,634) 315,634 - TOTAL 760,681,333 3,315,000 7,245,829 (86,779,257) 20,565,129 11,478,398 (135,600,682) 580,905,750 315,634 581,221,384 (1,925,219 ) Past service costs (39,060 ) Transfer of (2,348 ) Investments with Significant Influence As of and for the year ended December 31, 2016 Ownership Interest Current Non-current Current Non-current Revenues Expenses Profit (Loss) Other Comprehensive % ThCh$ ThCh$ ThCh$ ThCh$ ThCh$ ThCh$ ThCh$ ThCh$ ThCh$ GNL Quintero S.A. 20.00% - - - - 86,471,706 (72,752,059) 13,719,647 (65,571,292) (51,851,645) Electrogas S.A. 42.50% 9,318,456 40,746,438 5,683,680 13,809,430 24,126,070 (11,970,244) 12,155,826 (347,369) 11,808,457 GNL Chile S.A. 33.33% 90,283,944 117,703 78,452,153 - 615,229,994 (610,756,322) 4,473,522 (510,406) 3,963,116 14,610,975 Investments with Significant Influence As of and for the year ended December 31, 2015 Ownership Current Non-current Current Non-current Revenues Expenses Profit (Loss) Other Comprehensive % ThCh$ ThCh$ ThCh$ ThCh$ ThCh$ ThCh$ ThCh$ ThCh$ ThCh$ GNL Quintero S.A. 20.00% 154,169,202 679,246,875 22,104,679 725,626,283 130,540,774 (107,869,054) 22,671,720 9,264,617 31,936,337 Electrogas S.A. 42.50% 9,800,478 46,815,192 12,191,561 16,087,931 23,546,048 (10,624,229) 12,921,819 1,275,795 14,197,614 GNL Chile S.A. 33.33% 73,289,529 19,843,392 59,207,958 25,938,077 655,759,390 (654,273,074) 1,486,316 1,045,519 2,531,835 Enel Trading Argentina S.R.L. (formerly named Endesa Cemsa S.A.) 45.00% 22,954,619 91,195 21,098,368 - 2,269,586 (4,093,829) (1,824,243) (626,380) (2,450,623) Enel Brasil S.A. 38.64% 796,102,019 1,994,170,371 653,756,271 725,006,818 2,016,488,835 (1,898,139,782) 118,349,053 (370,529,946) (252,180,893) Distrilec Inversora S.A. 0.89% 587,602 - 648,086 51,369,880 56,070,768 - 56,070,768 (9,439,319) 46,631,449 The Group companies make no contributions to funds for financing the payment of these benefits. Investments in Joint Ventures Centrales Hidroeléctricas de Aysén S.A. Transmisora Eléctrica de Quillota Ltda. 51.00% 51.00% 50.00% 50.00% 12-31-2016 12-31-2015 12-31-2016 12-31-2015 ThCh$ ThCh$ ThCh$ ThCh$ Total current assets 863,962 502,938 6,366,378 4,870,520 Total non-current assets 15,159,321 15,159,321 12,034,576 12,228,334 Total current liabilities 3,324,706 3,290,947 245,025 463,983 Total non-current liabilities 68,081 56,685 1,710,406 1,674,416 Cash and cash equivalents 860,719 428,440 5,716,196 4,457,803 Revenues - - 2,774,316 2,099,517 Depreciation and amortization expense - - (773,093) (529,169) Interest income 42,046 20,009 134,995 1,652,413 Income tax expense (7,070) (8,586) (225,008) (496,978) Gains (losses) (4,284,195) (4,733,482) 1,257,220 2,108,449 Comprehensive income (4,284,195) (4,733,482) 1,257,220 2,108,449 c)The following amounts were recognized in the consolidated statement of comprehensive income for continuing and discontinued operations for the years ended December 31, 2018, 2017 and 2016: For the year ended 12-31-2018 12-31-2017 12-31-2016 Expense Recognized in Comprehensive Income Statement ThCh$ ThCh$ ThCh$ Current service cost for defined benefits plan 680,467 790,850 802,823 Interest cost for defined benefits plan 695,935 691,075 705,211 Past service costs (39,060 ) — — Expenses recognized in the Statement of Income 1,337,342 1,481,925 1,508,034 Losses from remeasurement of defined benefit plans 325,252 (251,976 ) 1,757,402 Total expense recognized in Comprehensive Income Statement 1,662,594 1,229,949 3,265,436 Actuarial assumptions As of December 31, 2018 and 2017 the following assumptions were used in the actuarial calculation of defined benefits: Chile Actuarial assumptions 12-31-2018 12-31-2017 Discount rates used 4.70% 5.00% Expected rate of salary increases 3.80% 4.00% Mortality tables CB-H-2014 y RV-M-2014 CB-H-2014 y RV-M-2014 Expected rotation rate 4.0% 3.8% Sensitivity As of December 31, 2018, the sensitivity of the value of the actuarial liability for post-employment benefits to variations of 100 basis points in the discount rate assumes a decrease of ThCh$ 905,602 (ThCh$ 923,224 as of December 31, 2017) if the rate rises and an increase of ThCh$ 1,034,800, (ThCh$ 1,076,294 as of December 31, 2018 and 2017 respectively) if the rate falls. Future disbursements The estimates available indicate that disbursements for defined benefit plans will increase to ThCh$ 2,047,818 for the current year. Term of commitments The Group’s benefit obligations have a weighted average term of 6.93 years, and the flow for benefits for the next 10 years and more is expected to be as follows: Years ThCh$ 1 2,047,818 2 1,122,495 3 1,604,246 4 1,280,802 5 1,205,286 More than 5 6,551,575 Intangible Assets, Net Balance as of 12-31-2016 12-31-2015 Easements and water rights 6,043,003 8,052,525 Computer software 10,189,162 12,373,049 Other identifiable intangible assets 3,034,709 479,852 Total 19,266,874 20,905,426 Intangible Assets, Gross Balance as of 12-31-2016 12-31-2015 Easements and water rights 6,625,309 8,634,831 Computer software 22,478,362 25,214,814 Other identifiable intangible assets 5,773,153 479,852 Total 34,876,824 34,329,497 Accumulated Amortization and Impairment Balance as of 12-31-2016 12-31-2015 Easements and water rights (582,306) (582,306) Computer software (12,289,200) (12,841,765) Other identifiable intangible assets (2,738,444) - Total (15,609,950) (13,424,071) Changes in Intangible Assets Easements and Computer Other Intangible ThCh$ ThCh$ ThCh$ ThCh$ Opening Balance as of January 1, 2016 8,052,525 12,373,049 479,852 20,905,426 Changes in identifiable intangible assets Increases other than those from business combinations 540,052 - 2,571,273 3,111,325 Increase (decrease) from net foreign exchange differences, net - - 2,897 2,897 Amortization (*) - (2,183,887) (18,961) (2,202,848) Increases (decreases) from transfers and other changes 352 - (352) - Increases (decreases) from transfers 352 - (352) - Disposals and withdrawals from service (2,549,926) - - (2,549,926) Disposals (**) (2,549,926) - - (2,549,926) Total changes in identifiable intangible assets (2,009,522) (2,183,887) 2,554,857 (1,638,552) Closing Balance as of December 31, 2016 6,043,003 10,189,162 3,034,709 19,266,874 25.1Equity attributable to the Parent 25.1.1Subscribed and paid-up capital and number of shares As of December 31, 2018 is ThCh$ 552,777,321, divided into 8,201,754,580 fully subscribed and paid no par value shares listed at the Bolsa de Comercio de Santiago de Chile, Bolsa Electrónica de Chile and New York Stock Exchange (NYSE). As a result of the Spin-off, share premium, raised from capital contributions made in 1986 and 1994, which amounted to ThCh$ 206,008,557 as of December 31, 2015, as of December 31, 2016 decreased to ThCh $ 85,511,492. During the years ended December 31, 2018 and 2017, the Group did not engage in any transaction of any kind with potential dilutive effects leading to diluted earnings per share that could differ from basic earnings per share. The shareholders at the Ordinary Shareholders’ Meeting held on April 25, 2017 approved the dividend policy for 2017. This policy established the distribution as final dividends of an amount equal to 55% of net profits for 2017, of which up to 15% of net profit for the nine month period ended September 30, 2016, as shown in the financial statements at that date, represent provisional interim dividends to be paid in January 2018. Since the aforementioned interim dividend No. 63 was paid on January 26, 2018, the Ordinary General Shareholders’ Meeting held on April 24, 2018 approved and paid the remainder of the final dividend No. 64, amounting to Ch$ 23,12488 per share, which was paid on May 18, 2018. The General Shareholders’ Meeting of Enel Generación Chile, held on April 24, 2018 approved, as Dividend Policy, which the Board plans to implement during the 2018 fiscal year, the distribution as a final dividend of an amount equivalent to 60% of the net profits for the year 2018. It also approved the distribution of an interim dividend of up to 50% of the net profits as per the financial statements as of September 30, 2018 , to be paid in January 2019. Compliance with the aforementioned dividend plan is subject to the actual net profit earned by the Company during the applicable year, and to the results of the Company’s periodic income projections or to the existence of certain conditions, as applicable. The following table details the dividends paid by the Company in recent years: Number Type of Dividends Payment date Pesos per Share Effecting the year 49 Interim 1-26-2011 6.42895 2010 50 Final 5-11-2011 26.09798 2010 51 Interim 1-19-2012 5.08439 2011 52 Final 5-17-2012 22.1582 2011 53 Interim 1-24-2013 3.04265 2012 54 Final 5-9-2013 11.24302 2012 55 Interim 1-31-2014 3.87772 2013 56 Final 5-15-2014 17.69856 2013 57 Interim 1-27-2015 3.44046 2014 58 Final 5-25-2015 16.95495 2014 59 Interim 1-29-2016 3.55641 2015 60 Final 5-24-2016 11.02239 2015 61 Interim 1-27-2017 7.24787 2016 62 Final 05-26-2017 21.5605 2016 63 Interim 01-26-2018 4.93614 2017 64 Final 05-18-2018 23.12488 2017 65 Interim 01-05-2019 11.19557 2018 Development Easements and Patents, Computer Other Intangible ThCh$ ThCh$ ThCh$ ThCh$ ThCh$ ThCh$ Opening Balance as of January 1, 2015 5,666,572 31,781,522 1,514,216 12,995,648 493,875 52,451,833 Changes in identifiable intangible assets Increases other than those from business combinations 4,181,283 209,063 213,815 3,739,977 - 8,344,138 Increase (decrease) from net foreign exchange differences, net (747,993) (1,533,670) (166,947) (76,106) 18,464 (2,506,252) Amortization (*) - (872,437) (530,306) (1,994,281) (20,145) (3,417,169) Increases (decreases) from transfers and other changes (2,398,107) 275,065 5,439 224,384 79,875 (1,813,344) Increases (decreases) from transfers 2 275,419 5,439 (5,439) (275,421) - Increases (decreases) from other changes (2,398,109) (354) - 229,823 355,296 (1,813,344) Disposals and withdrawals from service (949,049) (80,000) - (41,042) - (1,070,091) Withdrawals from service (949,049) - - (41,042) - (990,091) Disposals - (80,000) - - - (80,000) Classified as held for distribution to owners (5,752,706) (21,727,018) (1,036,217) (2,475,531) (92,217) (31,083,689) Total changes in identifiable intangible assets (5,666,572) (23,728,997) (1,514,216) (622,599) (14,023) (31,546,407) Closing Balance as of December 31, 2015 - 8,052,525 - 12,373,049 479,852 20,905,426 Changes in Intangible Assets Development Easements and Concessions Patents, Computer Other Intangible ThCh$ ThCh$ ThCh$ ThCh$ ThCh$ ThCh$ ThCh$ Opening Balance as of January 1, 2014 7,365,667 28,962,374 7,247,556 1,824,734 7,876,555 2,771,659 56,048,545 Changes in identifiable intangible assets Increases other than those from business combinations 1,990,879 1,778,162 - 280,380 5,355,491 - 9,404,912 Increase (decrease) from net foreign exchange differences, net (311,518) (431,185) (3,305) (91,295) (11,790) 125,942 (723,151) Amortization (*) (2,734,208) (1,272,127) (2,564,216) (613,665) (850,304) (7,207) (8,041,727) Increases (decreases) from transfers and other changes (530,532) 2,744,298 (275,420) (5,381) 628,545 (2,396,519) 164,991 Increases (decreases) from transfers - (557,131) - (5,381) 562,512 - - Increases (decreases) from other changes (530,532) 3,301,429 (275,420) - 66,033 (2,396,519) 164,991 Disposals and withdrawals from service (113,716) - - 119,443 (2,849) - 2,878 Withdrawals from service (113,716) - - - (2,849) - (116,565) Disposals - - - 119,443 - - 119,443 Classified as held for sale - - (4,404,615) - - - (4,404,615) Total changes in identifiable intangible assets (1,699,095) 2,819,148 (7,247,556) (310,518) 5,119,093 (2,277,784) (3,596,712) Closing Balance as of December 31, 2014 5,666,572 31,781,522 - 1,514,216 12,995,648 493,875 52,451,833 25.2Foreign currency translation reserves The following table details currency translation adjustments attributable to the shareholders of the Parent in the consolidated statement of financial position for the years ended December 31, 2018, 2017 and 2016: For the years ended 12-31-2018 12-31-2017 12-31-2016 Reserves for Accumulated Currency Translation Differences ThCh$ ThCh$ ThCh$ GasAtacama Chile S.A. 6,674,136 11,688,351 14,979,960 Others 547,835 920,567 1,230,881 Total 7,221,971 12,608,918 16,210,841 The Company’s objective is to maintain an adequate level of capitalization in order to be able to secure its access to the financial markets, so as to fulfill its medium- and long-term goals while maximizing the return to its shareholders and maintaining a solid financial position. 25.4Restrictions on subsidiaries transferring funds to the parent As of December 31, 2018 and 2017, there were no restrictions on funds transfers from subsidiaries to the parent. Other reserves within equity attributable to shareholders of the Parent for the years ended December 31, 2018, 2017 and 2016 are as follows: Balance as of Balance as of 1-1-2018 Changes 12-31-2018 Other Reserves ThCh$ ThCh$ ThCh$ Exchange differences on translation 12,608,918 (5,386,947 ) 7,221,971 Cash flow hedges (52,329,034 ) (101,233,208 ) (153,562,242 ) Remeasurement of available-for-sale financial assets (1,027 ) (11 ) (1,038 ) Other comprehensive income from non-current assets held for distribution to owners — — — Other miscellaneous reserves (35,068,098 ) 3,646,134 (31,421,964 ) Total (74,789,241 ) (102,974,032 ) (177,763,273 ) Balance as of Balance as of 1-1-2017 Changes 12-31-2017 Other Reserves ThCh$ ThCh$ ThCh$ Exchange differences on translation 16,210,841 (3,601,923 ) 12,608,918 Cash flow hedges (123,499,401 ) 71,170,367 (52,329,034 ) Remeasurement of available-for-sale financial assets (1,033 ) 6 (1,027 ) Other comprehensive income from non-current assets held for distribution to owners 2,722,113 (2,722,113 ) — Other miscellaneous reserves (32,188,067 ) (2,880,031 ) (35,068,098 ) Total (136,755,547 ) 61,966,306 (74,789,241 ) Company Cash-Generating Unit Balance as of Transfer on mergers Balance as of ThCh$ ThCh$ ThCh$ Inversiones GasAtacama Holding Ltda. Generación Chile 20,204,251 (20,204,251) - Compañía Eléctrica Tarapacá S.A. Generación Chile 4,656,105 (4,656,105) - GasAtacama Chile S.A. Generación Chile - 24,860,356 24,860,356 Total 24,860,356 24,860,356 24,860,356 Company Cash-Generating Unit Balance as of Foreign Transferred to assets held for distribution to owners Balance as of ThCh$ ThCh$ ThCh$ ThCh$ Inversiones GasAtacama Holding Ltda. Generación Chile 20,204,251 - - 20,204,251 Compañía Eléctrica Tarapacá S.A. Generación Chile 4,656,105 - - 4,656,105 Enel Generación Perú S.A. (formerly named Edegel S.A.A.) Enel Generación Perú S.A. 88,241,040 2,351,245 (90,592,285) - Empresa Generadora de Energía Eléctrica S.A. Emgesa S.A.E.S.P. 4,886,064 (600,606) (4,285,458) - Enel Generación el Chocón S.A. (formerly named Hidroeléctrica El Chocón S.A.) Enel Generación el Chocón S.A. 7,622,438 (1,799,525) (5,822,913) - Total 125,609,898 (48,886) (100,700,656) 24,860,356 Classes of Property, Plant and Equipment, Net Balance as of 12-31-2016 12-31-2015 ThCh$ ThCh$ Construction in progress 588,700,578 511,700,683 Land 51,342,724 51,375,538 Buildings 9,703,906 10,394,207 Plant and equipment 2,033,720,809 2,109,572,014 Fixtures and fittings 24,007,331 26,457,203 Finance leases 19,363,189 20,217,447 Property, plant and equipment, net 2,726,838,537 2,729,717,092 Classes of Property, Plant and Equipment, Gross Balance as of 12-31-2016 12-31-2015 ThCh$ ThCh$ Construction in progress 588,700,578 511,700,683 Land 51,342,724 51,375,538 Buildings 22,458,889 22,542,374 Plant and equipment 4,481,701,141 4,452,010,828 Fixtures and fittings 87,281,446 87,187,343 Finance leases 28,760,031 28,760,031 Property, plant and equipment, gross 5,260,244,809 5,153,576,797 Classes of Accumulated Depreciation and Impairment of Property, Plant and Equipment Balance as of 12-31-2016 12-31-2015 ThCh$ ThCh$ Buildings (12,754,983) (12,148,167) Plant and equipment (2,447,980,332) (2,342,438,814) Fixtures and fittings (63,274,115) (60,730,140) Finance leases (9,396,842) (8,542,584) Total Accumulated Depreciation and Impairment in Property, Plant and Equipment (2,533,406,272) (2,423,859,705) Changes in the year ended December 31, 2016 Construction in Land Buildings, Net Plant and Fixtures and Other Property, Property, ThCh$ ThCh$ ThCh$ ThCh$ ThCh$ ThCh$ ThCh$ Opening Balance as of January 1, 2016 511,700,683 51,375,538 10,394,207 2,109,572,014 26,457,203 20,217,447 2,729,717,092 Change Increases other than those from business combinations 189,236,636 - - - 22,459 - 189,259,095 Increase (decrease) from net foreign exchange differences (186,893) (32,814) (59,699) (361,199) (153,858) - (794,463) Depreciation (*) - - (630,602) (126,106,763) (2,805,910) (854,258) (130,397,533) Impairment losses recognized in profit or loss (*) (**) (30,785,531) - - - - - (30,785,531) Increases (decreases) from transfers and other changes (34,679,145) - - 34,183,229 495,916 - - Increases (decreases) from transfers Increases (decreases) from transfers from construction in process (34,679,145) - - 34,183,229 495,916 - - Disposals and withdrawals from service (34,061,865) - - - (8,479) - (34,070,344) Write-offs (***) (34,061,865) - - - (8,479) - (34,070,344) Other increases/decreases (12,523,307) - - 16,433,528 - - 3,910,221 Total changes 76,999,895 (32,814) (690,301) (75,851,205) (2,449,872) (854,258) (2,878,555) Closing balance as of December 31, 2016 588,700,578 51,342,724 9,703,906 2,033,720,809 24,007,331 19,363,189 2,726,838,537 Changes in the year ended December 31, 2015 Construction in Land Buildings, Net Plant and Fixtures and Other Property, Property, ThCh$ ThCh$ ThCh$ ThCh$ ThCh$ ThCh$ ThCh$ Opening Balance as of January 1, 2015 1,187,912,827 59,924,326 22,025,921 3,868,224,748 35,627,709 56,713,317 5,230,428,848 Change Increases other than those from business combinations 564,234,389 50,874,933 126,085 139,715 275,145 168,589 615,818,856 Increase (decrease) from net foreign exchange differences (62,471,079) (5,108,866) (1,757,484) (183,492,582) (1,359,443) 901,095 (253,288,359) Depreciation (*) - - (1,750,734) (218,184,844) (5,997,874) (3,890,602) (229,824,054) (Impairment)/Reversal of impairment losses recognized in profit or loss (*) (2,522,445) - - 12,655,609 - - 10,133,164 Increases (decreases) from transfers and other changes (1,026,969,936) 14,273,553 5,680,711 1,025,604,765 5,980,519 (712,122) 23,857,490 Increases (decreases) from transfers Increases (decreases) from transfers from construction in process (1,030,758,049) 3,985,957 341,572 1,026,911,028 3,436,292 (3,916,800) - Increases (decreases) from other changes 3,788,113 10,287,596 5,339,139 (1,306,263) 2,544,227 3,204,678 23,857,490 Disposals and withdrawals from service (3,021,358) - (679) (701,220) (83,731) (11,051) (3,818,039) Write-offs - - - (10,367) (66,114) (11,051) (87,532) Other increases/decreases (3,021,358) - (679) (690,853) (17,617) - (3,730,507) Classified as held for contributions to owners (145,461,715) (68,588,408) (13,929,613) (2,394,674,177) (7,985,122) (32,951,779) (2,663,590,814) Total changes (676,212,144) (8,548,788) (11,631,714) (1,758,652,734) (9,170,506) (36,495,870) (2,500,711,756) Closing balance as of December 31, 2015 511,700,683 51,375,538 10,394,207 2,109,572,014 26,457,203 20,217,447 2,729,717,092 Changes in the year ended December 31, 2014 Construction in Land Buildings, Net Plant and Fixtures and Other Property, Property, ThCh$ ThCh$ ThCh$ ThCh$ ThCh$ ThCh$ ThCh$ Opening Balance as of January 1, 2014 870,787,402 56,927,135 20,737,186 3,670,530,303 15,585,705 57,721,214 4,692,288,945 Change Increases other than those from business combinations 601,694,765 - - 3,988 550,469 - 602,249,222 Acquisitions through business combinations (**) 10,802,165 3,216,432 - 171,934,311 13,707,483 - 199,660,391 Increase (decrease) from net foreign exchange differences (49,116,078) (180,363) (631,466) (17,912,049) 1,428,360 2,853,253 (63,558,343) Depreciation (*) - - (1,301,473) (189,570,715) (2,366,179) (3,861,150) (197,099,517) Impairment losses recognized in the profit or loss (*) - - - (13,770,564) - - (13,770,564) Increases (decreases) from transfers and other changes (246,310,557) 74 1,801,536 242,636,252 1,872,695 - - Increases (decreases) from transfers Increases (decreases) from transfers from construction in process (246,310,557) 74 1,801,536 242,636,252 1,872,695 - - Disposals and withdrawals from service - - - (186,817) (40,632) - (227,449) Write-offs - - - (186,817) (40,632) - (227,449) Reclassification as assets held for sale - - - - (81,432) - (81,432) Other increases/decreases 55,130 (38,952) 1,420,138 4,560,039 4,971,240 - 10,967,595 Total changes 317,125,425 2,997,191 1,288,735 197,694,445 20,042,004 (1,007,897) 538,139,903 Closing balance as of December 31, 2014 1,187,912,827 59,924,326 22,025,921 3,868,224,748 35,627,709 56,713,317 5,230,428,848 12-31-2016 12-31-2015 Gross Unearned Interest Present Value Gross Unearned Interest Present Value Less than one year 2,677,880 837,513 1,840,367 2,840,639 1,007,567 1,833,072 From one to five years 10,711,520 1,763,191 8,948,329 14,203,200 2,758,773 11,444,427 More than five years 7,445,079 484,128 6,960,951 7,897,586 513,553 7,384,033 Total (*) 20,834,479 3,084,832 17,749,647 24,941,425 4,279,893 20,661,532 Future lease payments Balance as of 12-31-2016 12-31-2015 Less than one year 1,827,649 1,764,360 From one to five years 7,633,602 7,361,782 More than five years 9,011,009 8,769,808 Total 18,472,260 17,895,950 Deferred Tax Assets Deferred Tax Assets Relating to Accumulated Provisions Post- Tax Loss Carry forwards Other Deferred Tax ThCh$ ThCh$ ThCh$ ThCh$ ThCh$ ThCh$ Opening Balance as of 1-1-2016 4,982,473 1,461,706 - 12,720,469 702,670 19,867,318 Change Increase (decrease) in profit or loss 487,371 1,515,506 (597,481) (809,016) (2,074,574) (1,478,194) Increase (decrease) in other comprehensive income - - 474,498 - - 474,498 Foreign currency translation - - - - 12,645 12,645 Classified as assets held for distribution to owners - 9,032 (22,675) - - (13,643) Other increase (decrease) (281,458) (1,389,903) 145,658 (57) 1,359,259 (166,501) Closing Balance as of 12-31-2016 5,188,386 1,596,341 - 11,911,396 - 18,696,123 Deferred Tax Assets Deferred Tax Assets Relating to Accumulated Provisions Post- Revaluation Tax Loss Carry forwards Other Deferred Tax ThCh$ ThCh$ ThCh$ ThCh$ ThCh$ ThCh$ ThCh$ Opening Balance as of 1-1-2015 42,410,489 7,788,371 494,680 54,260 4,851,839 2,775,070 58,374,709 Change Increase (decrease) in profit or loss 1,319,678 6,151,750 23,625 (50,718) 7,868,630 (2,117,518) 13,195,447 Increase (decrease) in other comprehensive income - - 191,008 557,599 - - 748,607 Foreign currency translation (3,717,007) (414,275) (69,045) (3,542) - (98,171) (4,302,040) Classified as assets held for distribution to owners (14,361,783) (3,241,403) (576,075) - - (39,660) (18,218,921) Other increase (decrease) (20,668,904) (8,822,737) (64,193) (557,599) - 182,949 (29,930,484) Closing Balance as of 12-31-2015 4,982,473 1,461,706 - - 12,720,469 702,670 19,867,318 Deferred Tax Assets Deferred Tax Assets Relating to Accumulated Provisions Post- Revaluation Tax Loss Carry forwards Other Deferred Tax ThCh$ ThCh$ ThCh$ ThCh$ ThCh$ ThCh$ ThCh$ Opening Balance as of 1-1-2014 44,338,482 4,029,561 366,977 - 1,450,462 1,679,980 51,865,462 Change Increase (decrease) in profit or loss 573,564 3,699,561 (532,469) (1,716) 6,332,662 3,972,077 14,043,679 Increase (decrease) in other comprehensive income - - 1,779,099 (348,587) - - 1,430,512 Acquisitions through business combinations (*) - 879,716 - - 537,933 974,882 2,392,531 Foreign currency translation (2,365,601) (63,966) (55,492) 12,753 86,414 (2,385,892) Classified as assets held for sale - (29,583) (1,761) - (1,448,281) (1,142,270) (2,621,895) Other increase (decrease) (135,956) (726,918) (1,061,674) 391,810 (2,020,937) (2,796,013) (6,349,688) Closing Balance as of 12-31-2014 42,410,489 7,788,371 494,680 54,260 4,851,839 2,775,070 58,374,709 Deferred Tax Liabilities Deferred Tax Liabilities Relating to Accumulated Provisions Other Deferred Tax ThCh$ ThCh$ ThCh$ ThCh$ Opening Balance as of 1-1-2016 216,682,401 285,255 792,050 217,759,706 Change Increase (decrease) in profit or loss (28,890,517) - (1,272,442) (30,162,959) Increase (decrease) in other comprehensive income - - 5 5 Increase (decrease) in equity (*) - - (5,555,110) (5,555,110) Foreign currency translation (79,558) - - (79,558) Other increase (decrease) (1,009,620) - 4,324,541 3,314,921 Closing Balance as of 12-31-2016 186,702,706 285,255 (1,710,956) 185,277,005 Deferred Tax Liabilities Deferred Tax Liabilities Relating to Accumulated Provisions Post- Revaluation of Other Deferred Tax ThCh$ ThCh$ ThCh$ ThCh$ ThCh$ ThCh$ Opening Balance as of 1-1-2015 361,570,401 41,553 - 163,062 28,544,947 390,319,963 Change Increase (decrease) in profit or loss 17,320,050 243,817 (678) - 21,344,620 38,907,809 Increase (decrease) in other comprehensive income - - (65,055) 184,060 (200,434) (81,429) Foreign currency translation 3,299,350 - 65,061 5,424 (10,368,839) (6,999,004) Classified as assets held for distributions to owners (131,174,728) (16,764) (237) (249,770) (32,286,273) (163,727,772) Other increase (decrease) (34,332,672) 16,649 909 (102,776) (6,241,971) (40,659,861) Closing Balance as of 12-31-2015 216,682,401 285,255 - - 792,050 217,759,706 Deferred Tax Liabilities Deferred Tax Liabilities Relating to Accumulated Provisions Post- Revaluation of Other Deferred Tax ThCh$ ThCh$ ThCh$ ThCh$ ThCh$ ThCh$ Opening Balance as of 1-1-2014 290,656,225 20,222 - 4,104,129 10,908,943 305,689,519 Change Increase (decrease) in profit or loss 38,037,322 379 1,210 (4,490,773) 14,414,699 47,962,837 Increase (decrease) in other comprehensive income - - (3,674) 665,247 (1,306) 660,267 Acquisitions through business combinations (*) 27,088,856 - - - 1,834,311 28,923,167 Foreign currency translation 14,540,966 (307,279) 13,619 (813,443) 13,433,863 Other increase (decrease) (8,752,968) 328,231 2,464 (129,160) 2,201,743 (6,349,690) Closing Balance as of 12-31-2014 361,570,401 41,553 - 163,062 28,544,947 390,319,963 Effects of Deferred Tax on the Components of Other Comprehensive Income For the year ended December 31, 2016 For the year ended December 31, 2015 For the year ended December 31, 2014 Amount Income Amount Amount Income Amount Amount Income Tax Amount ThCh$ ThCh$ ThCh$ ThCh$ ThCh$ ThCh$ ThCh$ ThCh$ ThCh$ Available-for-sale financial assets 18 (5) 13 (441,585) 10 (441,575) (6,042) 1,306 (4,736) Cash flow hedge 86,959,338 (20,924,809) 66,034,529 (135,791,934) 35,463,169 (100,328,765) (138,419,154) 34,120,329 (104,298,825) Foreign currency translation (139,529,128) - (139,529,128) (244,110,922) - (244,110,922) (8,365,502) - (8,365,502) Investments accounted for using the equity method (11,904,709) - (11,904,709) (2,475,299) - (2,475,299) 11,478,398 - 11,478,398 Actuarial income on defined-benefit pension plans (1,757,402) 474,498 (1,282,904) (216,648) (5,476) (222,124) (4,680,070) 1,929,441 (2,750,629) Income tax related to components of other income and expenses debited or credited to Equity (66,231,883) (20,450,316) (86,682,199) (383,036,388) 35,457,703 (347,578,685) (139,992,370) 36,051,076 (103,941,294) For the years ended 12-31-2016 12-31-2015 12-31-2014 ThCh$ ThCh$ ThCh$ Increase (decrease) of the deferred taxes related to continuing operations 474,493 830,036 770,245 Deferred taxes on hedge movements (revenue and derivatives hedge) (21,528,043) 31,318,550 32,036,006 Increase (decrease) of the deferred taxes related to discontinuing operations 603,234 3,309,117 3,244,825 Total (20,450,316) 35,457,703 36,051,076 Other Financial Liabilities Balance as of 12-31-2016 12-31-2015 Current Non-current Current Non-current Interest-bearing borrowings 18,013,012 802,046,968 18,446,476 826,380,628 Hedging derivatives (*) 313,571 48,981,953 328,415 78,768,620 Non-hedging derivatives (**) 7,369,481 2,987,830 9,146,674 12,048,542 Total 25,696,064 854,016,751 27,921,565 917,197,790 Interest-bearing borrowings Balance as of 12-31-2016 12-31-2015 Current Non-current Current Non-current Bank loans 4,172 - 58 - Unsecured liabilities 16,168,473 786,137,688 16,613,346 807,552,168 Finance leases (*) 1,840,367 15,909,280 1,833,072 18,828,460 Total 18,013,012 802,046,968 18,446,476 826,380,628 Country Currency Effective Nominal Secured (Yes/No) Balance as of 12-31-2016 Balance as of 12-31-2015 One to three months Three to twelve months Total Current One to three months Three to twelve months Total Current ThCh$ ThCh$ ThCh$ ThCh$ ThCh$ ThCh$ Chile CH$ 6.00% 6.00% No 4,172 - 4,172 58 - 58 Total 4,172 - 4,172 58 - 58 Taxpayer Company Country Taxpayer Financial Institution Country Currency Effective Nominal Interest payment Balance as of 12-31-2016 Balance as of 12-31-2015 Less than Total Less than Total ThCh$ ThCh$ ThCh$ ThCh$ 91.081.000-6 Enel Generación Chile S.A. Chile 97.006.000-6 Banco de Crédito e Inversiones Chile Ch$ 6.00% 6.00% At maturity 2,037 2,037 - - 91.081.000-6 Enel Generación Chile S.A. Chile 97.036.000-k Banco Santander Chile Ch$ 6.00% 6.00% At maturity 2,135 2,135 58 58 Total ThCh$ 4,172 4,172 58 58 Country Currency Effective Nominal Secured (Yes/No) Balance as of 12-31-2016 Current Non-current One to three months Three to months Total One to two years Two to Three to Four to five More than Total ThCh$ ThCh$ ThCh$ ThCh$ ThCh$ ThCh$ ThCh$ ThCh$ ThCh$ Chile US$ 6.99% 6.90% No 6,884,819 2,402,653 9,287,472 - - - - 468,578,474 468,578,474 Chile UF 6.00% 5.48% No - 6,881,001 6,881,001 5,480,380 5,480,380 5,480,380 5,480,380 295,637,694 317,559,214 Total 6,884,819 9,283,654 16,168,473 5,480,380 5,480,380 5,480,380 5,480,380 764,216,168 786,137,688 Country Currency Effective Nominal Secured (Yes/No) Balance as of 12-31-2015 Current Non-current One to three months Three to months Total One to two years Two to Three to Four to five More than Total ThCh$ ThCh$ ThCh$ ThCh$ ThCh$ ThCh$ ThCh$ ThCh$ ThCh$ Chile US$ 6.99% 6.90% No 7,303,274 2,548,685 9,851,959 - - - - 493,795,141 493,795,141 Chile UF 6.00% 5.48% No - 6,761,387 6,761,387 5,330,851 5,330,851 5,330,851 5,330,851 292,433,623 313,757,027 Total 7,303,274 9,310,072 16,613,346 5,330,851 5,330,851 5,330,851 5,330,851 786,228,764 807,552,168 Taxpayer ID No. (RUT) Company Country Taxpayer ID No. (RUT) Company Country Currency Effective Interest Rate Nominal Interest Rate Secured (Yes/ No) Balance as of 12-31-2016 Current Non-current Less than More than Total One to Two to Three to Four to More than Total ThCh$ ThCh$ ThCh$ ThCh$ ThCh$ ThCh$ ThCh$ ThCh$ ThCh$ 91.081.000-6 Enel Generación Chile S.A. Chile Foreign BNY Mellon S-1 US US$ 7.96% 7.88% No 4,522,585 - 4,522,585 - - - - 136,759,395 136,759,395 91.081.000-6 Enel Generación Chile S.A. Chile Foreign BNY Mellon S-2 US US$ 7.40% 7.33% No 1,446,232 - 1,446,232 - - - - 46,792,429 46,792,429 91.081.000-6 Enel Generación Chile S.A. Chile Foreign BNY Mellon S-3 US US$ 8.26% 8.13% No 916,002 - 916,002 - - - - 21,608,757 21,608,757 91.081.000-6 Enel Generación Chile S.A. Chile Foreign BNY Mellon 24296 US US$ 4.32% 4.25% No - 2,402,653 2,402,653 - - - - 263,417,893 263,417,893 91.081.000-6 Enel Generación Chile S.A. Chile 97.036.000-k Banco Santander 317-H Chile U.F. 7.17% 6.20% No - 6,337,021 6,337,021 5,480,380 5,480,380 5,480,380 5,480,380 35,587,764 57,509,284 91.081.000-6 Enel Generación Chile S.A. Chile 97.036.000-k Banco Santander 522-M Chile U.F. 4.82% 4.75% No - 543,980 543,980 - - - - 260,049,930 260,049,930 Total 6,884,819 9,283,654 16,168,473 5,480,380 5,480,380 5,480,380 5,480,380 764,216,168 786,137,688 Taxpayer ID No. (RUT) Company Country Taxpayer ID No. (RUT) Company Country Currency Effective Interest Rate Nominal Interest Rate Secured (Yes/ No) Balance as of 12-31-2015 Current Non-current Less than More than Total One to Two to Three to Four to More than Total ThCh$ ThCh$ ThCh$ ThCh$ ThCh$ ThCh$ ThCh$ ThCh$ ThCh$ 91.081.000-6 Enel Generación Chile S.A. Chile Foreign BNY Mellon S-1 US US$ 7.96% 7.88% No 4,797,465 - 4,797,465 - - - - 145,068,065 145,068,065 91.081.000-6 Enel Generación Chile S.A. Chile Foreign BNY Mellon S-2 US US$ 7.40% 7.33% No 1,534,133 - 1,534,133 - - - - 49,690,671 49,690,671 91.081.000-6 Enel Generación Chile S.A. Chile Foreign BNY Mellon S-3 US US$ 8.26% 8.13% No 971,676 - 971,676 - - - - 23,252,023 23,252,023 91.081.000-6 Enel Generación Chile S.A. Chile Foreign BNY Mellon 24296 US US$ 4.32% 4.25% No - 2,548,685 2,548,685 - - - - 275,784,382 275,784,382 91.081.000-6 Enel Generación Chile S.A. Chile 97.036.000-k Banco Santander 317-H Chile U.F. 7.17% 6.20% No - 6,232,249 6,232,249 5,330,851 5,330,851 5,330,851 5,330,851 39,700,607 61,024,011 91.081.000-6 Enel Generación Chile S.A. Chile 97.036.000-k Banco Santander 522-M Chile U.F. 4.82% 4.75% No - 529,138 529,138 - - - - 252,733,016 252,733,016 Total 7,303,274 9,310,072 16,613,346 5,330,851 5,330,851 5,330,851 5,330,851 786,228,764 807,552,168 Taxpayer ID No. (RUT) Company Country Taxpayer ID No. (RUT) Name Country Currency Nominal Interest Rate Balance as of December 31, 2016 Current Non-current Less than More than Total One to Two to Three to Four to More than Total ThCh$ ThCh$ ThCh$ ThCh$ ThCh$ ThCh$ ThCh$ ThCh$ ThCh$ 91.081.000-6 Enel Generación Chile S.A. Chile 76.555.400-4 Transelec S.A Chile US$ 6.50% 449,283 1,391,084 1,840,367 2,677,880 2,677,880 1,959,990 2,087,390 6,506,140 15,909,280 Total 1,840,367 15,909,280 Taxpayer ID No. (RUT) Company Country Taxpayer ID No. (RUT) Name Country Currency Nominal Interest Rate Balance as of December 31, 2015 Current Non-current Less than More than Total One to Two to Three to Four to More than Total ThCh$ ThCh$ ThCh$ ThCh$ ThCh$ ThCh$ ThCh$ ThCh$ ThCh$ 91.081.000-6 Enel Generación Chile S.A. Chile 76.555.400-4 Transelec S.A Chile US$ 6.50% - 1,833,072 1,833,072 2,840,640 1,952,223 2,079,117 2,214,260 9,742,220 18,828,460 Total 1,833,072 18,828,460 HEDGING RESERVE 12-31-2016 12-31-2015 12-31-2014 ThCh$ ThCh$ ThCh$ Balance in hedging reserves (hedging income) at beginning of year (122,448,724) (64,530,210) 2,365,784 Foreign currency exchange differences recorded in net equity 23,870,051 (70,199,670) (53,502,315) Recognition of foreign currency exchange differences in profit (loss) 12,788,000 6,438,133 (13,702,067) Foreign currency translation differences - (73,961) 308,388 Classified as assets held for distribution to owners (*) - 5,916,984 - Balance in hedging reserves (hedging income) at year end (85,790,673) (122,448,724) (64,530,210) Balance as of 12-31-2016 12-31-2015 Fixed interest rate 92% 92% Balance as of 12-31-2016 Held-to-maturity investments Loans and receivables Available-for-sale financial assets Financial derivatives designated for hedging ThCh$ ThCh$ ThCh$ ThCh$ Derivative instruments - - - 121,443 Other financial assets 365,663 309,844,312 - - Total current 365,663 309,844,312 - 121,443 Equity instruments - - 2,616,647 - Derivative instruments - - - 25,533,188 Other financial assets 652,733 6,788,437 - - Total non-current 652,733 6,788,437 2,616,647 25,533,188 Total 1,018,396 316,632,749 2,616,647 25,654,631 Balance as of 12-31-2015 Held-to-maturity investments Loans and receivables Available-for-sale financial assets Financial derivatives designated for hedging ThCh$ ThCh$ ThCh$ ThCh$ Derivative instruments - - - 76,703 Other financial assets 934,852 355,204,957 - - Total current 934,852 355,204,957 - 76,703 Equity instruments - - 3,002,257 - Derivative instruments - - - 18,716,463 Other financial assets - 35,901 - - Total non-current - 35,901 3,002,257 18,716,463 Total 934,852 355,240,858 3,002,257 18,793,166 Balance as of 12-31-2016 Financial liabilities held Loans and payables Financial derivatives designated for hedging ThCh$ ThCh$ ThCh$ Interest-bearing loans - 18,013,012 - Derivative instruments 7,369,481 - 313,571 Other financial liabilities - 441,818,602 - Total current 7,369,481 459,831,614 313,571 Interest-bearing loans - 802,046,968 - Derivative instruments 2,987,830 - 48,981,953 Other financial liabilities - 1,704,549 - Total non-current 2,987,830 803,751,517 48,981,953 Total 10,357,311 1,263,583,131 49,295,524 Balance as of 12-31-2015 Financial liabilities held Loans and payables Financial derivatives designated for hedging ThCh$ ThCh$ ThCh$ Interest-bearing loans - 18,446,476 - Derivative instruments 9,146,674 - 328,415 Other financial liabilities - 608,479,539 - Total current 9,146,674 626,926,015 328,415 Interest-bearing loans - 826,380,628 - Derivative instruments 12,048,542 - 78,768,620 Other financial liabilities - 6,072,872 - Total non-current 12,048,542 832,453,500 78,768,620 Total 21,195,216 1,459,379,515 79,097,035 Balance as of Balance as of 1-1-2016 Changes 12-31-2016 Other Reserves ThCh$ ThCh$ ThCh$ Exchange differences on translation 19,691,866 (3,481,025 ) 16,210,841 Cash flow hedges (205,691,575 ) 82,192,174 (123,499,401 ) Remeasurement of available-for-sale financial assets (1,046 ) 13 (1,033 ) Other comprehensive income from non-current assets held for distribution to owners (202,189,042 ) 204,911,155 2,722,113 Other miscellaneous reserves (719,716,306 ) 687,528,239 (32,188,067 ) Total (1,107,906,103 ) 971,150,556 (136,755,547 ) ·Reserves for Exchange differences on translation: These arise primarily from exchange differences relating to: · Translation of the financial statements of our foreign operations from their functional currencies to our presentation currency (i.e. Chilean peso) (see Note 2.7.3); · Translation of goodwill arising from the acquisition of foreign operations with a functional currency other than the Chilean peso (see Note 3.b). ·Cash flow hedges reserves: These represent the cumulative portion of gains and losses on hedging instruments deemed effective in cash flow hedges (see Notes 3.f.5 and 3.m). ·Remeasurement of available-for-sale financial assets: These represent variations in fair value, net of their effect on the available-for-sale investments (see Note 3.f.1). 25.6Other miscellaneous reserves: The main items of other miscellaneous reserves and their effects for the nine month periods ended December 31, 2018 and 2017, are the following: Balance as of Balance as of 12-31-2018 12-31-2017 Other Miscellaneous Reserves ThCh$ ThCh$ Reserve for corporate reorganization (“Spin-Off”) (1) 458,265,366 458,265,366 Reserve for transition to IFRS (2) (493,425,043 ) (493,425,043 ) Reserve for subsidiaries transactions (3) (4,047,287 ) (4,047,287 ) Other miscellaneous reserves (4) 7,785,000 4,138,866 Total miscellaneous reserves (31,421,964 ) (35,068,098 ) (1) Reserve for corporate reorganization (Spin-Offs of companies) completed on March 1, 2016. Corresponds to the effects from the reorganization of the Company and the separation of the Chilean business into a new entity, Endesa Américas S.A. (see Note 5.2). (2) Reserve for transition to IFRS. In accordance with Official Bulletin No. 456 from the CMF, included in this line item is the price-level restatement of paid-in capital from the date of transition to IFRS, January 1, 2004, to December 31, 2008. Also, it is included the foreign currency translation difference at the date of transition to IFRS. Please note that, while the Company adopted the IFRS as its statutory accounting standards on January 1, 2009, the date of transition to that international standard used was January 1, 2004. This results from applying the exemption for that purpose in IFRS 1, “First Time Adoption”. Table of Contents Balance as of 12-31-2016 12-31-2015 Assets Liabilities Assets Liabilities Current Non-current Current Non-current Current Non-current Current Non-current Exchange rate hedge: 121,443 25,533,188 313,571 48,981,953 76,703 18,716,463 328,415 78,768,620 Cash flow hedge 121,443 25,533,188 313,571 48,981,953 76,703 18,716,463 328,415 78,768,620 Total 121,443 25,533,188 313,571 48,981,953 76,703 18,716,463 328,415 78,768,620 Type of hedging instrument Description of hedging instrument Description of hedged item Fair value of Fair value of hedged item Type of risks 12-31-2016 12-31-2015 ThCh$ ThCh$ SWAP Exchange rate Unsecured liabilities (bonds) (23,640,893) (60,303,869) Cash flow Balance as of 12-31-2016 12-31-2015 Current liabilities Non-Current liabilities Current liabilities Non-Current liabilities ThCh$ ThCh$ ThCh$ ThCh$ Non-hedging derivative instruments 7,369,481 2,987,830 9,146,674 12,048,542 Financial derivatives Balance as of 12-31-2016 Fair value Notional value Total Less than one year 1 - 2 years 2 - 3 years ThCh$ ThCh$ ThCh$ ThCh$ ThCh$ Exchange rate hedges: (23,640,893) - - 523,686,966 523,686,966 Cash flow hedges (23,640,893) - - 523,686,966 523,686,966 Derivatives not designated for hedge accounting (10,357,311) 49,738,751 21,434,625 - 71,173,376 Total (33,998,204) 49,738,751 21,434,625 523,686,966 594,860,342 Financial derivatives Balance as of 12-31-2015 Fair value Notional value Total Less than one year 1 - 2 years 2 - 3 years 3 - 4 years ThCh$ ThCh$ ThCh$ ThCh$ ThCh$ ThCh$ Exchange rate hedges: (60,303,869) - - - 541,153,412 541,153,412 Cash flow hedges (60,303,869) - - - 541,153,412 541,153,412 Derivatives not designated for hedge accounting (21,195,216) 55,337,986 52,761,844 22,737,409 - 130,837,239 Total (81,499,085) 55,337,986 52,761,844 22,737,409 541,153,412 671,990,651 Financial instruments measured at fair value Balance as of 12-31-2016 Fair value measured at end of Level 1 Level 2 Level 3 ThCh$ ThCh$ ThCh$ ThCh$ Financial Assets Financial derivatives designated as cash flow hedges 25,654,631 - 25,654,631 - Commodity derivatives designated as cash flow hedges 875,481 - 875,481 - Commodity derivatives not designated for hedge accounting 16,159,565 - 16,159,565 - Available-for-sale financial assets, non-current 407 407 - - Total 42,690,084 407 42,689,677 - Financial Liabilities Financial derivatives designated as cash flow hedges 49,295,524 - 49,295,524 - Financial derivatives not designated for hedge accounting 10,357,311 - 10,357,311 - Commodity derivatives not designated for hedge accounting 40,013 - 40,013 - Commodity derivatives designated as cash flow hedges 1,063,193 - 1,063,193 - Total 60,756,041 - 60,756,041 - Financial instruments measured at fair value Balance as of 12-31-2015 Fair value measured at end of Level 1 Level 2 Level 3 ThCh$ ThCh$ ThCh$ ThCh$ Financial Assets Financial derivatives designated as cash flow hedges 18,793,166 - 18,793,166 - Commodity derivatives not designated for hedge accounting 20,397 - 20,397 - Available-for-sale financial assets, non-current 389 389 - - Total 18,813,952 389 18,813,563 - Financial Liabilities Financial derivatives designated as cash flow hedges 79,097,035 - 79,097,035 - Financial derivatives not designated for hedge accounting 21,195,216 - 21,195,216 - Total 100,292,251 - 100,292,251 - Trade and other payables Balance as of 12-31-2016 12-31-2015 Current Non-current Current Non-current ThCh$ ThCh$ ThCh$ ThCh$ Trade payables 90,386,018 - 122,490,300 - Other payables 250,702,646 1,453,022 237,969,309 5,975,686 Total trade and other payables 341,088,664 1,453,022 360,459,609 5,975,686 Trade and other payables Balance as of 12-31-2016 12-31-2015 Current Non-current Current Non-current ThCh$ ThCh$ ThCh$ ThCh$ Energy suppliers 72,361,322 - 79,795,564 - Fuel and gas suppliers 18,024,696 - 42,694,736 - Payables to tax authorities other than Corporate Income Tax 7,152,058 - 6,346,470 - Payables for goods and services 147,606,676 40,256 169,583,420 - VAT debit tax (VAT/ICMS) 13,136,043 - 3,218,085 - Dividends payable to non-controlling interests 58,901,712 - 34,076,876 - Payables to third parties on decrease of capital of the subsidiary - - 1,804,507 - Mitsubishi contract (LTSA) 10,582,997 - 6,402,157 - Accounts payable to staff 12,401,802 - 15,669,083 Other payables 921,358 1,412,766 868,711 5,975,686 Total trade and other payables 341,088,664 1,453,022 360,459,609 5,975,686 Provisions Balance as of 12-31-2016 12-31-2015 Current Non-current Current Non-current ThCh$ ThCh$ ThCh$ ThCh$ Provision for legal proceedings 4,694,579 - 9,798,765 - Decommissioning or restoration (*) - 57,325,915 - 50,702,975 Other provisions 1,798,849 - 5,818,849 - Total 6,493,428 57,325,915 15,617,614 50,702,975 Changes in Provisions Legal Proceedings Decommissioning and Restoration Other Provisions Total ThCh$ ThCh$ ThCh$ ThCh$ Opening balance as of January 1, 2016 9,798,765 50,702,975 5,818,849 66,320,589 Changes in Provisions Increase (decrease) in existing provisions (165,886) 4,091,238 - 3,925,352 Provisions used (4,948,437) - (4,020,000) (8,968,437) Increase for adjustment to value of money over time - 2,531,702 - 2,531,702 Foreign currency translation 10,137 - - 10,137 Total changes in provisions (5,104,186) 6,622,940 (4,020,000) (2,501,246) Closing Balance as of December 31, 2016 4,694,579 57,325,915 1,798,849 63,819,343 Changes in Provisions Legal Proceedings Decommissioning and Restoration Environmental issues Other Provisions Total ThCh$ ThCh$ ThCh$ ThCh$ ThCh$ Opening balance as of January 1, 2015 24,254,905 28,388,046 6,767,212 7,795,380 67,205,543 Changes in Provisions Additional provisions - 23,678,951 - - 23,678,951 Increase (decrease) in existing provisions (7,886,540) 89,280 103,641,796 2,416,314 98,260,850 Provisions used (329,563) - - - (329,563) Increase for adjustment to value of money over time 95,164 2,029,978 (109,582) 64,829 2,080,389 Foreign currency translation (866,814) 82,695 (6,457,892) (1,924,462) (9,166,473) Reclassified to liabilities associated with assets held for distribution to owners (5,468,387) (3,565,975) (103,841,534) (2,533,212) (115,409,108) Total changes in provisions (14,456,140) 22,314,929 (6,767,212) (1,976,531) (884,954) Closing Balance as of December 31, 2015 9,798,765 50,702,975 - 5,818,849 66,320,589 (3) Reserve from transactions with our subsidiaries. Corresponds to the effect of purchases of equity interests in subsidiaries that were accounted for as transactions between entities under common control. The details of non-controlling interests are as follows: % financial interest Equity Profit (loss) Non-Controlling Interests Non-Controlling 12-31-2018 12-31-2017 12-31-2018 12-31-2017 Company Interests ThCh$ ThCh$ ThCh$ ThCh$ Empresa Eléctrica Pehuenche S.A. 7.35 % 10,310,215 9,963,472 6,885,422 5,649,253 GasAtacama Chile S.A. (*) 2.63 % 16,660,247 17,532,754 2,290,359 1,439,148 Total 26,970,462 27,496,226 9,175,781 7,088,401 The detail of revenues presented in the statement of comprehensive income for the years ended December 31, 2018, 2017 and 2016 is as follows: For the years ended 12-31-2018 12-31-2017 12-31-2016 Revenues ThCh$ ThCh$ ThCh$ Energy sales 1,369,333,310 1,457,671,722 1,516,688,442 Generation 1,369,333,310 1,457,671,722 1,516,688,442 Regulated customers 997,315,635 1,101,089,106 1,180,042,597 Non-regulated customers 337,748,542 285,623,737 234,641,908 Spot market sales 34,269,133 70,958,879 102,003,937 Other sales 103,745,285 94,452,287 64,638,599 Natural gas sales 103,717,558 91,652,707 64,443,715 Sales of products and services 27,727 2,799,580 194,884 Other services provided 8,475,543 46,908,131 58,632,774 Tolls and transmission 3,267,012 38,850,596 50,437,592 Engineering and consulting services 231,373 — — Other services 4,977,158 8,057,535 8,195,182 Total operating revenue 1,481,554,138 1,599,032,140 1,639,959,815 ThCh$ ThCh$ ThCh$ Other operating income Commodity derivatives 9,819,777 20,328,649 10,794,682 Other income (1) 29,680,268 15,576,299 8,972,832 Total Other operating income 39,500,045 35,904,948 19,767,514 Legal Proceedings Decommissioning and Restoration Environmental issues Other Provisions Total ThCh$ ThCh$ ThCh$ ThCh$ ThCh$ Opening balance as of January 1, 2014 9,764,679 20,267,967 12,139,002 9,176,319 51,347,967 Changes in Provisions Additional provisions - 6,684,278 - - 6,684,278 Increase (decrease) in existing provisions 16,963,084 - (4,608,836) (134,664) 12,219,584 Provisions used (2,361,954) - - - (2,361,954) Increase for adjustment to value of money over time - 1,205,276 - 62,493 1,267,769 Foreign currency translation (110,904) 230,525 (762,954) (1,308,768) (1,952,101) Total changes in provisions 14,490,226 8,120,079 (5,371,790) (1,380,939) 15,857,576 Closing Balance as of December 31, 2014 24,254,905 28,388,046 6,767,212 7,795,380 67,205,543 (1) For the year ended December 31, 2018, this includes Central Tarapacá indemnization for ThCh$ 21,987,899 (ThCh$ 0 for 2017). 27.RAW MATERIALS AND CONSUMABLES USED The detail of raw materials and consumables presented in profit or loss for the years ended December 31, 2018, 2017 and 2016 is as follows: For the years ended 12-31-2018 12-31-2017 12-31-2016 Raw Materials and Consumables ThCh$ ThCh$ ThCh$ Energy purchases (326,365,798 ) (346,954,692 ) (335,731,822 ) Fuel consumption (230,993,754 ) (280,739,362 ) (295,148,838 ) Transportation costs (141,551,194 ) (152,869,838 ) (192,502,995 ) Other raw materials and consumables (111,063,406 ) (123,414,114 ) (71,676,459 ) Total raw materials and consumables (809,974,152 ) (903,978,006 ) (895,060,114 ) Employee expenses recognized in profit or loss for the years ended December 31, 2018, 2017 and 2016 are as follows: For the years ended 12-31-2018 12-31-2017 12-31-2016 Employee Benefits Expense ThCh$ ThCh$ ThCh$ Wages and salaries (44,154,344 ) (44,367,982 ) (47,845,074 ) Post-employment benefit obligations expense (641,407 ) (790,850 ) (802,823 ) Social security and other contributions (5,797,834 ) (6,524,962 ) (7,031,344 ) Other staff expenses (3,206,953 ) (2,538,676 ) (4,670,831 ) Total employee benefits expense (53,800,538 ) (54,222,470 ) (60,350,072 ) 29. DEPRECIATION, AMORTIZATION AND IMPAIRMENT LOSSES The detail of depreciation, amortization and impairment losses recognized in profit or loss for the years ended December 31, 2018, 2017 and 2016 is as follows: For the years ended 12-31-2018 12-31-2017 12-31-2016 Depreciation, amortization and impairment losses ThCh$ ThCh$ ThCh$ Depreciation (111,507,897 ) (114,203,295 ) (130,397,533 ) Amortization (6,257,366 ) (3,134,258 ) (2,202,848 ) Subtotal (117,765,263 ) (117,337,553 ) (132,600,381 ) (Impairment)/Reversal of impairment (*) (100,900 ) 55,494 (30,785,531 ) Total depreciation, amortization and impairment losses (117,866,163 ) (117,282,059 ) (163,385,912 ) For the years ended 12-31-2018 12-31-2017 12-31-2016 (1) (Impairment)/Reversal of impairment ThCh$ ThCh$ ThCh$ (Impairment)/Reversal of impairment (100,900 ) 55,494 — (Impairment)/Reversal of impairment of property, plant and equipment — — (30,785,531 ) Total (100,900 ) 55,494 (30,785,531 ) (*) See Note 10.c and Appendix 5.b. Post-employment obligations Balance as of 12-31-2016 12-31-2015 ThCh$ ThCh$ Post-employment obligations 15,820,557 15,271,416 Total 15,820,557 15,271,416 Non-current portion 15,820,557 15,271,416 Other operating expenses for the years ended December 31, 2018, 2017 and 2016 are as follows: For the years ended 12-31-2018 12-31-2017 12-31-2016 Other expenses by nature ThCh$ ThCh$ ThCh$ Professional, outsourced and other services (21,459,861 ) (27,666,155 ) (31,529,339 ) Other supplies and services (19,184,762 ) (18,746,799 ) (16,538,925 ) Insurance premiums (13,270,568 ) (12,479,501 ) (15,963,457 ) Taxes and charges (2,549,959 ) (3,411,239 ) (3,589,932 ) Repairs and maintenance (7,386,375 ) (2,183,793 ) (2,467,908 ) Marketing, public relations and advertising (205,114 ) (388,562 ) (713,691 ) Leases and rental costs (5,011,340 ) (3,606,514 ) (1,229,779 ) Environmental expenses (6,024,405 ) (3,862,251 ) (1,341,773 ) Huechún and Chillán projects written-off (*) — — (2,549,926 ) Current projects written-off (**) — (25,105,910 ) (33,930,297 ) Other supplies (5,738,384 ) (2,720,780 ) (4,680,233 ) Travel expenses (1,321,048 ) (1,925,277 ) (1,974,202 ) Indemnities and fines (327,131 ) (724,239 ) (2,793,753 ) Total other expenses by nature (82,478,947 ) (102,821,020 ) (119,303,215 ) Expense Recognized in Comprehensive Income Statement For the years ended 12-31-2016 12-31-2015 12-31-2014 ThCh$ ThCh$ ThCh$ Current service cost for defined benefits plan 802,823 2,271,559 1,306,750 Interest cost for defined benefits plan 705,211 3,320,289 3,043,960 Past service costs - (523) 487,603 Expenses recognized in the Statement of Income 1,508,034 5,591,325 4,838,313 Losses from remeasurement of defined benefit plans 1,757,402 216,648 4,680,070 Total expense recognized in Comprehensive Income Statement 3,265,436 5,807,973 9,518,383 Actuarial assumptions Chile 12-31-2016 12-31-2015 Discount rates used 4.70% 4.95% Expected rate of salary increases 4.00% 4.00% Mortality tables CB-H-2014 and RV-M-2014 RV 2009 Expected rotation rate 7% 7% Years ThCh$ 1 2,233,666 2 1,218,573 3 1,609,333 4 1,076,489 5 1,732,027 More than 5 6,982,496 (*) See Note 17.7.8. (**) See Note 17.7.8, 8 and 9. Other gains, net for the years ended December 31, 2018, 2017 and 2016 are as follows: For the years ended 12-31-2018 12-31-2017 12-31-2016 Other gains (losses) ThCh$ ThCh$ ThCh$ Gain on disposal of Electrogas (*) — 105,311,912 — Gain on disposal of Lineas de Transmision Pangue Duqueco 3,024,549 — — Gain on disposal of GNL Quintero (**) — — 121,325,018 Gain on sale of land — 7,626,100 — Other 409,954 150,857 165,956 Total other gains, net 3,434,503 113,088,869 121,490,974 (*) See Notes 5.1. (**) See Note 14.1.c. Number Type of Dividends Payment date Pesos per Share Effecting the year 51 Interim 1-19-2012 5.08439 2011 52 Final 5-17-2012 22.15820 2011 53 Interim 1-24-2013 3.04265 2012 54 Final 5-9-2013 11.24302 2012 55 Interim 1-31-2014 3.87772 2013 56 Final 5-15-2014 17.69856 2013 57 Interim 1-27-2015 3.44046 2014 58 Final 5-25-2015 16.95495 2014 59 Interim 1-29-2016 3.55641 2015 60 Final 5-24-2016 11.02239 2015 61 Interim 1-27-2017 7.24787 2016 Reserves for Accumulated Currency Translation Differences For the years ended 12-31-2016 12-31-2015 12-31-2014 ThCh$ ThCh$ ThCh$ GasAtacama Chile S.A. 14,979,960 16,780,346 19,881,460 Empresa Generadora de Energía Eléctrica S.A. (Emgesa S.A. E.S.P.) - - 69,075,372 Generandes Perú - - 69,304,036 Enel Generación el Chocón S.A. (formerly named Hidroeléctrica El Chocón S.A.) - - (53,592,631) Enel Argentina S.A. (formerly named Endesa Argentina S.A.) - - (13,561,202) Enel Generación Costanera S.A. (formerly named Central Costanera S.A.) - - 10,185,346 Enel Brasil S.A. - - (105,465,588) GNL Quintero S.A. - (1,164,922) (3,824,104) Others 1,230,881 4,076,442 (3,412,559) Total 16,210,841 19,691,866 (11,409,870) Financial income and costs for the years ended December 31, 2018, 2017 and 2016 are as follows: For the years ended 12-31-2018 12-31-2017 12-31-2016 Financial Income ThCh$ ThCh$ ThCh$ Cash and cash equivalents 5,527,543 3,077,708 2,150,797 Other financial income 250,699 2,195,964 3,999,954 Total financial income 5,778,242 5,273,672 6,150,751 For the years ended 12-31-2018 12-31-2017 12-31-2016 Financial Costs ThCh$ ThCh$ ThCh$ Financial Costs (48,189,495 ) (50,851,829 ) (55,701,778 ) Bank loans (22,576 ) (261 ) (2,033,835 ) Secured and unsecured obligations (43,965,839 ) (42,708,253 ) (44,268,489 ) Valuation of financial derivatives — (1,067,820 ) (824,922 ) Post-employment benefit obligations (695,935 ) (691,075 ) (705,211 ) Capitalized borrowing costs (*) 6,523,443 4,078,463 3,001,211 Formalization of debts and other associated expenses — (836,174 ) — Other (10,028,588 ) (9,626,709 ) (10,870,532 ) Gains from indexed assets and liabilities, net (a) (2,480,291 ) 145,608 606,075 Foreign currency exchange differences (a) (3,055,807 ) 8,822,301 13,266,320 Positive 18,458,283 19,563,838 48,546,664 Negative (21,514,090 ) (10,741,537 ) (35,280,344 ) Total financial costs (53,725,593 ) (41,883,920 ) (41,829,383 ) Total financial results (47,947,351 ) (36,610,248 ) (35,678,632 ) (*) See Note 17.4.a. Other Reserves Balance as of 1-1-2016 Changes Balance as of 12-31-2016 ThCh$ ThCh$ ThCh$ Exchange differences on translation 19,691,866 (3,481,025) 16,210,841 Cash flow hedges (205,691,575) 82,192,174 (123,499,401) Remeasurement of available-for-sale financial assets (1,046) 13 (1,033) Other miscellaneous reserves (202,189,042) 204,911,155 2,722,113 Exchange differences on translation (719,716,306) 687,528,239 (32,188,067) Total (1,107,906,103) 971,150,556 (136,755,547) The effects on financial results from exchange differences and the application of indexed assets and liabilities originated from the following: For the years ended 12-31-2018 12-31-2017 12-31-2016 Gains from indexed assets and liabilities, net (a) ThCh$ ThCh$ ThCh$ Other financial assets (derivative instruments) 7,676,500 4,657,016 7,188,900 Other non-financial assets — — — Trade and other accounts receivable — — 452,440 Current tax receivables and liabilities 3,020,250 1,039,755 1,979,594 Other financial liabilities (financial debt and derivative instruments) (9,390,716 ) (5,551,163 ) (9,014,859 ) Total Gains from indexed 1,306,034 145,608 606,075 Total Hyperinflation (*) (3,786,325 ) — — Total gains from indexed assets and liabilities, net (2,480,291 ) 145,608 606,075 Balance as of 1-1-2015 Changes Balance as of 12-31-2015 ThCh$ ThCh$ ThCh$ Exchange differences on translation (11,409,870) 31,101,736 19,691,866 Cash flow hedges (117,559,279) (88,132,296) (205,691,575) Remeasurement of available-for-sale financial assets (1,020) (26) (1,046) Other miscellaneous reserves - (202,189,042) (202,189,042) Other reserves within Equity related to non-current assets and disposal groups and liabilities associated held for sale or distribution to owners (719,216,262) (500,044) (719,716,306) Total (848,186,431) (259,719,672) (1,107,906,103) Other Reserves Balance as of 1-1-2014 Changes Balance as of 12-31-2014 ThCh$ ThCh$ ThCh$ Exchange differences on translation (45,609,591) 34,199,721 (11,409,870) Cash flow hedges (15,595,990) (101,963,289) (117,559,279) Remeasurement of available-for-sale financial assets 3,716 (4,736) (1,020) Other miscellaneous reserves (732,764,785) 13,548,523 (719,216,262) Total (793,966,650) (54,219,781) (848,186,431) (*) See Note 6. For the years ended 12-31-2018 12-31-2017 12-31-2016 Foreign currency exchange differences (b) ThCh$ ThCh$ ThCh$ Cash and cash equivalents (938,799 ) 3,109,046 183,225 Other financial assets (derivative instruments) 5,973,179 10,895,862 25,048,205 Other non-financial assets 55,196 — — Trade and other accounts receivable 4,105,799 363,325 2,541,385 Current tax receivables and liabilities — (188,270 ) — Other financial liabilities (financial debt and derivative instruments) (7,440,825 ) (4,358,937 ) (18,217,515 ) Trade and other accounts payable (4,810,357 ) (998,725 ) 3,711,020 Total foreign currency exchange differences (3,055,807 ) 8,822,301 13,266,320 The following table presents the components of the income tax expense/(benefit) recognized in the accompanying Consolidated Statement of Comprehensive Income for the years ended December 31, 2018, 2017 and 2016: For the years ended 12-31-2018 12-31-2017 12-31-2016 Current Income Tax and Adjustments to Current Income Tax for Previous Periods ThCh$ ThCh$ ThCh$ Current income tax (47,840,814 ) (133,038,125 ) (135,594,643 ) Adjustments to current tax from the previous period (5,882,343 ) (24,409 ) (295,585 ) Current tax income/(expense) related to hedge accounting (38,594,801 ) 18,309,177 23,630,564 Current tax expense, net (92,317,958 ) (114,753,357 ) (112,259,664 ) Expense from deferred taxes for origination and reversal of temporary differences (17,447,105 ) 2,653,838 29,042,729 Expense for deferred income tax due to changes in tax rates or the introduction of new taxes 4,818,298 — — Total deferred tax benefit (12,628,807 ) 2,653,838 29,042,729 Income tax expense, continuing operations (104,946,765 ) (112,099,519 ) (83,216,935 ) The principal temporary differences are detailed in Note 16.a. The following table reconciles computed income tax expense resulting from applying the applicable statutory tax rate to “Profit before income taxes” and the actual income tax expense recognized in the accompanying Consolidated Statement of Comprehensive Income for the years ended December 31, 2018, 2017 and 2016: Rate 12-31-2018 Rate 12-31-2017 Rate 12-31-2016 Reconciliation of Tax Expense % ThCh$ % ThCh$ % ThCh$ ACCOUNTING PROFIT BEFORE INCOME TAX 423,152,001 537,641,734 525,076,863 Total tax income (expense) using statutory rate (27.00 )% (114,251,041 ) (25.50 )% (137,098,643 ) (24.00 )% (126,018,446 ) Tax effect of rates applied in other countries — — 0.06 % 328,968 0.06 % 330,353 Tax effect of non-taxable revenues 0.19 % 801,347 6.43 % 34,547,907 7.51 % 39,421,280 Tax effect of non-tax-deductible expenses (0.32 )% (1,370,485 ) (3.09 )% (16,589,585 ) (1.95 )% (10,216,591 ) Tax effect of adjustments to deferred taxes in previous periods (1.39 )% (5,882,343 ) (0.00 )% (24,409 ) (0.05 )% (295,585 ) Deferred tax adjustments from previous years 1.14 % 4,818,298 — — — — Price level restatement for tax purposes (equity investments) 2.58 % 10,937,459 1.25 % 6,736,243 2.58 % 13,562,054 Total adjustments to tax expense using statutory rates 2.20 % 9,304,276 4.65 % 24,999,124 8.15 % 42,801,511 Actual income tax expense (24.80 )% (104,946,765 ) (20.85 )% (112,099,519 ) (15.85 )% (83,216,935 ) 34.SUPPLEMENTAL DISAGGREGATED FINANCIAL INFORMATION In the development of its activity, the organization of Enel Generación Chile was previously organized on the basis of the priority focus on its main business, consisting of the generation of electrical energy. Bearing in mind the differentiated information that is analyzed by the Administration for decision making, the information by segments had been presented following a geographical distribution by country: · Chile. · Argentina. (discontinued) · Perú. (discontinued) · Colombia. (discontinued) However, since the corporate reorganization was carried out (see note 5.2.), and operations outside Chile are presented as discontinued operations in the consolidated financial statements, the Group no longer has operating segments as defined by IFRS 8 “Segments”. The financial information currently provided to the Administration for decision making is the same included in the Group’s consolidated financial statements. The Company, for comparative purposes, has chosen to voluntarily present supplementary disaggregated information of the net results and cash flows related to discontinued operations, on a geographical basis. The accounting policies used to determine this supplementary disaggregated financial information are the same as those used in the preparation of the Group’s consolidated financial statements. The Group generates substantially all of its income from continuing operations in Chile. Likewise, in Chile there are substantially all non-current assets. Supplementary financial information disaggregated (detail): Chile Argentina Colombia Perú Eliminations Total As of 31, December As of 31, December As of 31, December As of 31, December As of 31, December As of 31, December 2018 2017 2016 2018 2017 2016 2018 2017 2016 2018 2017 2016 2018 2017 2016 2018 2017 2016 Country ThCh$ ThCh$ ThCh$ ThCh$ ThCh$ ThCh$ ThCh$ ThCh$ ThCh$ ThCh$ ThCh$ ThCh$ ThCh$ ThCh$ ThCh$ ThCh$ ThCh$ ThCh$ STATEMENT OF INCOME REVENUES AND OTHER OPERATING INCOME 1,521,054,183 1,634,937,088 1,659,727,329 — — — — — — — — — — — — 1,521,054,183 1,634,937,088 1,659,727,329 Revenues 1,481,554,138 1,599,032,140 1,639,959,815 — — — — — — — — — — — — 1,481,554,138 1,599,032,140 1,639,959,815 Energy sales 1,369,333,310 1,457,671,722 1,516,688,442 — — — — — — — — — — — — 1,369,333,310 1,457,671,722 1,516,688,442 Other sales 103,745,285 94,452,287 64,638,599 — — — — — — — — — — — — 103,745,285 94,452,287 64,638,599 Other services rendered 8,475,543 46,908,131 58,632,774 — — — — — — — — — — — — 8,475,543 46,908,131 58,632,774 Other operating income 39,500,045 35,904,948 19,767,514 39,500,045 35,904,948 19,767,514 RAW MATERIALS AND CONSUMABLES USED (809,974,152 ) (903,978,006 ) (895,060,114 ) — — — — — — — — — — — — (809,974,152 ) (903,978,006 ) (895,060,114 ) Energy purchases (326,365,798 ) (346,954,692 ) (335,731,822 ) — — — — — — — — — — — — (326,365,798 ) (346,954,692 ) (335,731,822 ) Fuel consumption (230,993,754 ) (280,739,362 ) (295,148,838 ) — — — — — — — — — — — — (230,993,754 ) (280,739,362 ) (295,148,838 ) Transportation expenses (141,551,194 ) (152,869,838 ) (192,502,995 ) — — — — — — — — — — — — (141,551,194 ) (152,869,838 ) (192,502,995 ) Other miscellaneous supplies and services (111,063,406 ) (123,414,114 ) (71,676,459 ) — — — — — — — — — — — — (111,063,406 ) (123,414,114 ) (71,676,459 ) CONTRIBUTION MARGIN 711,080,031 730,959,082 764,667,215 — — — — — — — — — — — — 711,080,031 730,959,082 764,667,215 Other work performed by the entity and capitalized 7,449,013 7,226,484 9,758,304 — — — — — — — — — — — — 7,449,013 7,226,484 9,758,304 Employee benefit expense (53,800,538 ) (54,222,470 ) (60,350,072 ) — — — — — — — — — — — — (53,800,538 ) (54,222,470 ) (60,350,072 ) Other expenses (82,478,947 ) (102,821,020 ) (119,303,215 ) — — — — — — — — — — — — (82,478,947 ) (102,821,020 ) (119,303,215 ) GROSS OPERATING INCOME 582,249,559 581,142,076 594,772,232 — — — — — — — — — — — — 582,249,559 581,142,076 594,772,232 Depreciation and amortization expense (117,765,263 ) (117,337,553 ) (132,600,381 ) — — — — — — — — — — — — (117,765,263 ) (117,337,553 ) (132,600,381 ) Impairment losses (reversals of impairment losses) recognized in profit or loss (100,900 ) 55,494 (30,785,531 ) — — — — — — — — — — — — (100,900 ) 55,494 (30,785,531 ) — — OPERATING INCOME 464,383,396 463,860,017 431,386,320 — — — — — — — — — — — — 464,383,396 463,860,017 431,386,320 FINANCIAL RESULT (47,947,351 ) (36,610,248 ) (35,678,632 ) — — — — — — — — — — — — (47,947,351 ) (36,610,248 ) (35,678,632 ) Financial income 5,778,242 5,273,672 6,150,751 — — — — — — — — — — — — 5,778,242 5,273,672 6,150,751 Income from deposits and other financial instruments 5,527,543 3,077,708 2,150,797 — — — — — — — — — — — — 5,527,543 3,077,708 2,150,797 Other financial income 250,699 2,195,964 3,999,954 — — — — — — — — — — — — 250,699 2,195,964 3,999,954 Financial costs (48,189,495 ) (50,851,829 ) (55,701,778 ) — — — — — — — — — — — — (48,189,495 ) (50,851,829 ) (55,701,778 ) Bank borrowings (22,576 ) (261 ) (2,033,835 ) — — — — — — — — — — — — (22,576 ) (261 ) (2,033,835 ) Secured and unsecured obligations (43,965,839 ) (42,708,253 ) (44,268,489 ) — — — — — — — — — — — — (43,965,839 ) (42,708,253 ) (44,268,489 ) Other (4,201,080 ) (8,143,315 ) (9,399,454 ) — — — — — — — — — — — — (4,201,080 ) (8,143,315 ) (9,399,454 ) Gains (losses) from indexed assets and liabilities (2,480,291 ) 145,608 606,075 — — — — — — — — — — — — (2,480,291 ) 145,608 606,075 Foreign currency exchange differences (3,055,807 ) 8,822,301 13,266,320 — — — — — — — — — — — — (3,055,807 ) 8,822,301 13,266,320 Positive 18,458,283 19,563,838 48,546,664 — — — — — — — — — — — — 18,458,283 19,563,838 48,546,664 Negative (21,514,090 ) (10,741,537 ) (35,280,344 ) — — — — — — — — — — — — (21,514,090 ) (10,741,537 ) (35,280,344 ) Share of profit (loss) of associates and joint ventures accounted for using the equity method 3,281,453 (2,696,904 ) 7,878,201 — — — — — — — — — — — — 3,281,453 (2,696,904 ) 7,878,201 Other gains (losses) 3,434,503 113,088,869 121,490,974 — — — — — — — — — — — — 3,434,503 113,088,869 121,490,974 Gain (loss) from other investments 409,954 105,462,769 121,457,430 — — — — — — — — — — — — 409,954 105,462,769 121,457,430 Gain (loss) from the sale of property, plant and equipment 3,024,549 7,626,100 33,544 — — — — — — — — — — — — 3,024,549 7,626,100 33,544 INCOME BEFORE TAX 423,152,001 537,641,734 525,076,863 — — — — — — — — — — — — 423,152,001 537,641,734 525,076,863 Income tax (104,946,765 ) (112,099,519 ) (83,216,935 ) — — — — — — — — — — — — (104,946,765 ) (112,099,519 ) (83,216,935 ) Net income from continuing operations 318,205,236 425,542,215 441,859,928 — — — — — — — — — — — — 318,205,236 425,542,215 441,859,928 Net income from discontinued operations — — 5,889,236 — — 15,063,586 — — 32,152,791 — — 26,466,832 — — — — — 79,572,445 NET INCOME 318,205,236 425,542,215 447,749,164 — — 15,063,586 — — 32,152,791 — — 26,466,832 — — — 318,205,236 425,542,215 521,432,373 Net income attributable to: — 425,542,215 447,749,164 — — 15,063,586 — — 32,152,791 — — 26,466,832 — — — 318,205,236 425,542,215 521,432,373 Shareholders of Enel Chile 309,029,455 418,453,814 472,558,428 Non-controlling interests 9,175,781 7,088,401 48,873,945 Chile Argentina Colombia Peru Eliminations Total 12-31-2018 12-31-2017 12-31-2016 12-31-2018 12-31-2017 12-31-2016 12-31-2018 12-31-2017 12-31-2016 12-31-2018 12-31-2017 12-31-2016 12-31-2018 12-31-2017 12-31-2016 12-31-2018 12-31-2017 12-31-2016 Country ThCh$ ThCh$ ThCh$ ThCh$ ThCh$ ThCh$ ThCh$ ThCh$ ThCh$ ThCh$ ThCh$ ThCh$ ThCh$ ThCh$ ThCh$ ThCh$ ThCh$ ThCh$ STATEMENT OF CASH FLOW Net cash provided by (used in) operating activities 465,273,275 488,167,382 490,177,558 — — 13,638,776 — — 47,055,127 — — 8,317,128 — — — 465,273,275 488,167,382 559,188,589 Net cash (used in) provided by investing activities (228,125,034 ) (91,867,647 ) (34,631,759 ) — — (5,901,336 ) — — (16,448,412 ) — — (3,598,013 ) — — — (228,125,034 ) (91,867,647 ) (60,579,520 ) Net cash (used in) provided by financing activities (291,939,624 ) (301,835,211 ) (388,561,440 ) — — (17,813,237 ) — — (90,476,446 ) — — (22,802,105 ) — — — (291,939,624 ) (301,835,211 ) (519,653,228 ) Non-Controlling Interests % financial interest Equity Profit (loss) Company Non-Controlling Interests 12-31-2016 12-31-2015 12-31-2016 12-31-2015 12-31-2014 ThCh$ ThCh$ ThCh$ ThCh$ ThCh$ Empresa Eléctrica Pehuenche S.A. 7.35% 10,008,502 10,900,863 6,512,893 8,674,207 10,522,428 Compañía Eléctrica Tarapacá S.A.(*) 3.79% - 20,589,138 - 2,840,348 4,144,136 GasAtacama Chile S.A. (*) 2.63% 18,789,260 - 2,547,670 - - Empresa Generadora de Energía Eléctrica S.A. (Emgesa S.A. E.S.P.) 73.13% - 584,922,225 23,510,575 154,959,234 211,210,105 Generandes Perú S.A. 39.00% - 118,101,218 5,488,220 19,466,375 22,882,930 Enel Generación Perú S. A. (formerly named Edegel S.A.A.) 16.40% - 91,467,160 4,257,097 15,078,085 17,790,998 Chinango S.A.C. 20.00% - 14,268,911 697,822 3,042,018 3,002,284 Enel Generación Costanera S.A. (formerly named Central Costanera S.A.) 24.32% - 3,759,405 (1,729,294) (242,897) 11,072,950 Enel Generación el Chocón S.A. (formerly named Hidroeléctrica El Chocón S.A.) 32.33% - 48,208,347 7,090,623 35,783,793 3,538,006 Others - - 3,482,905 498,339 2,551,535 252,534 Total 28,797,762 895,700,172 48,873,945 242,152,698 284,416,371 35. THIRD PARTY GUARANTEES, OTHER CONTINGENT ASSETS AND LIABILITIES, AND OTHER COMMITMENTS As of December 31, 2018 and 2017 no property, plant and equipment was pledged as security for liabilities. As of December 31, 2018, the Group does not have future energy purchase commitments (ThCh$ 3,938,524,357 as of December 31,2017). There were no indirect guarantees as of December 31, 2018 and 2017. 35.3Litigation and arbitration As of the date of these consolidated financial statements, the most relevant litigation involving the Group are as follows: Pending lawsuits of the Company and Subsidiaries 1. Inversiones Tricahue S.A., a minority shareholder of Empresa Eléctrica Pehuenche S.A., requested in the 20th Civil Court of Santiago the designation of an arbitrator, to hear and resolve the arbitration claim that Inversiones Tricahue S.A. seeks to bring against Empresa Eléctrica Pehuenche S.A., Enel Generación Chile S.A., Enel Chile S.A., and the directors of these three companies, for the alleged damages that the Pehuenche management allegedly inflicted on the minority shareholders, as a result of the Project Elqui reorganization and the development of Pehuenche’s electricity generation business. Once the request for the appointment of an arbitrator was presented, the three defendant companies and their directors submitted numerous objections, all of which were rejected by the ruling of June 25, 2018. The defendants filed an appeal to the ruling, which to date is pending a decision. Subsequently, Mr. Nelson Contador was designated as a referee judge whom accepted the position. The companies and their directors appealed the appointment of arbitrator judge, granting said recourse in the only devolutive effect. Against this resolution, the defendants filed an appeal to the ruling claiming that said appeal should have been granted in both cases ordering the suspension of the sentence while the appeals are resolved. For its part, the plaintiff also filed an appeal in the ruling. Both resources are pending resolution. 2. GasAtacama Chile S.A.: By means of ORD No. 5,705 of May 23, 2016, the Superintendency of Electricity and Fuels, filed charges against GasAtacama Chile S.A. for providing allegedly erroneous information to the centralized operating agent of the national CDEC-SING with respect to the Technical Minimum (MT) and Average Time of the Operation parameters (TMO) during the period between January 1, 2011 and October 29, 2015, GasAtacama Chile S.A. presented its objections, which were rejected by the Superintendency’s Resolution No. 014606 of August 4 of 2016, which imposed a fine of 120,000 UTM (ThCh $5,802,360). In opposition to the above mentioned resolution of the Superintendency that applied the fine, GasAtacama Chile S.A. submitted a request for reconsideration before the Superintendency, which was rejected through Resolution No. 15908, dated November 2, 2016, which confirms the totality of the fine imposed. In opposition to the resolution, GasAtacama Chile S.A. filed a claim of illegality before the Court of Appeals of Santiago, recognizing a provision for 25% of the fine. The Court of Appeals of Santiago, meanwhile, on April 9, 2019, issued a ruling that reduced the fine imposed from 10,000 UTA (120,000 UTM) to 500 UTA. Both the Superintendency of Electricity and Fuels and GasAtacama Chile S.A. filed appeals before the Supreme Court against this ruling, which is pending admissibility, hearing and resolution. Revenues For the years ended 12-31-2016 12-31-2015 12-31-2014 ThCh$ ThCh$ ThCh$ Energy sales 1,516,688,442 1,474,818,366 1,155,805,379 Generation 1,516,688,442 1,474,818,366 1,155,805,379 Regulated customers 1,180,042,597 1,081,142,280 775,781,024 Non-regulated customers 234,641,908 243,596,910 281,573,444 Spot market sales 102,003,937 150,079,176 98,450,911 Other sales 64,638,599 24,293,133 11,062,697 Natural gas sales 64,443,715 23,797,122 4,721,305 Sales of products and services 194,884 496,011 6,341,392 Other services provided 58,632,774 40,866,012 42,928,659 Tolls and transmission 50,437,592 34,734,375 24,835,318 Other services 8,195,182 6,131,637 18,093,341 Total operating revenue 1,639,959,815 1,539,977,511 1,209,796,735 Table of Contents Raw Materials and Consumables For the years ended 12-31-2016 12-31-2015 12-31-2014 ThCh$ ThCh$ ThCh$ Energy purchases (335,731,822) (320,731,795) (288,442,686) Fuel consumption (*) (295,148,838) (327,502,996) (305,479,173) Transportation costs (192,502,995) (179,691,471) (142,831,143) Other raw materials and consumables (71,676,459) (52,964,961) (13,463,669) Total raw materials and consumables (895,060,114) (880,891,223) (750,216,671) The management of Enel Generación Chile S.A. considers that the provisions recorded in the consolidated financial statements are adequate to cover the risks resulting from litigation because it does not consider there to be any additional liabilities other than those specified. In relation to the litigation described above, the Group has established provisions for ThCh $2,901,180. Given the characteristics of the risks covered by these provisions, it is not possible to determine a reasonable schedule of payment dates if there are any. A number of the Group’s loan agreements include the obligation to comply with certain financial covenants, which is normal for the contracts of this nature. There are also affirmative and negative ratios requiring the monitoring of these commitments. In addition, there are restrictions in the events-of-default clauses of the agreements which require compliance. 1)Cross Default Some of the financial debt contracts of Enel Generación Chile S.A. contain cross default clauses. The domestic credit line agreement governed by Chilean law, which Enel Generación Chile S.A. signed in March 2016 and that expires in March 2019, for UF 2.8 million, stipulate that cross default arises only in the event of non-compliance by the borrower itself, with no reference made to its subsidiaries; i.e., Enel Generación Chile S.A. In order to accelerate payment of the debt in this credit line due to cross default originating from other debt, the amount overdue of a debt must exceed US$ 50 million, or the equivalent in other currencies, and other additional conditions must be met such as the expiry of grace periods. This credit line has not been drawn upon. Enel Generación Chile S.A international credit line governed by New York State law, which was signed in February 2016 expiring in February 2020, also makes no reference to its subsidiaries, thus, cross default is only triggered in the event of non-compliance by the borrower itself. For the repayment of debt to be accelerated under these credit lines due to cross default regardless of whether at the level of individual or aggregated debt, the amount in default must exceed US$50 million or its equivalent in other currencies, and other additional conditions must be met, including the expiration of grace periods (if any), and a formal notice of intent to accelerate the debt repayment must have been served by creditors representing more than 50% of the amount owed or committed in the contract. As of December 31, 2018, these credit lines have not been drawn upon. Regarding the bond issues of Enel Generación Chile S.A. registered with the United States Securities and Exchange Commission (the “SEC”), commonly called “Yankee bonds”, a cross default can be triggered by another debt of the Company or of any of its Chilean subsidiaries, for any amount overdue provided that the principal of the debt giving rise to the cross default exceeds US$ 30 million or its equivalent in other currencies. Debt acceleration due to cross default does not occur automatically but has to be demanded by the holders of at least 25% of the bonds of a certain series of Yankee bonds. In addition, events of bankruptcy or insolvency of foreign subsidiaries have no contractual effects on the Company’s Yankee bonds. The Company’s Yankee bonds mature in 2024, 2027, 2037 and 2097. Specifically for those maturing in 2024 (issued in April 2014), the threshold for triggering cross default increased to US$ 50 million or its equivalent in other currencies. As of December 31, 2018, the outstanding amount of Yankee bonds totals ThCh$ 497,233,719. The bonds of Enel Generación Chile S.A. issued in Chile state that cross default can be triggered only by the default of the issuer in cases where the amount overdue exceeds US$50 million or its equivalent in other currencies. Debt acceleration requires the agreement of at least 50% of the bondholders of a certain series. As of December 31, 2018, the outstanding amount owed of domestic bonds totals ThCh$ 329,260,529. 2)Financial covenants Financial covenants are contractual commitments with respect to minimum or maximum financial ratios that Enel Generación Chile S.A is obliged to meet at certain periods of time (quarterly, annually, etc.). Most of the Group’s financial covenants limit the level of indebtedness and evaluate the ability to generate cash flows in order to service the companies’ debts. Various companies are also required to certify these covenants periodically. The types of covenants and their respective limits vary according to the type of debt. Enel Generación Chile S.A bonds issued in Chile include the following financial covenants whose definitions and calculation formulas are established in the respective indentures: Series H · Consolidated Debt Ratio: The consolidated debt ratio, which is Financial debt to Capitalization, must be no more than 0.64. Financial debt is the sum of Interest-bearing loans, current; Interest-bearing loans, non-current; Other financial liabilities, current; Other financial liabilities, non-current; and Other obligations guaranteed by the issuer or its subsidiaries; while Capitalization is the sum of Financial liabilities, Equity attributable to the shareholders of the Company, and Non-controlling interests. As of December 31, 2018, the ratio was 0.30. · Consolidated Equity: A minimum Equity of Ch$ 761,661 million must be maintained; this limit is adjusted at the end of each year as established in the indenture. Equity corresponds to Equity attributable to the shareholders of the parent company. As of December 31, 2018, the equity attributable to shareholders of Enel Generación Chile S.A. was Ch$ 1,970,521 million. · Financial Expense Coverage: A financial expense coverage ratio of at least 1.85 must be maintained. Financial expense coverage is the quotient between i) the Gross margin plus Financial income and Dividends received from associates, and ii) Financial expenses; both items refer to the period of four consecutive quarters ending at the close of the quarter being reported. For the year ended December 31, 2018, this ratio was 12.23. · Net Asset Position with Related Parties: A net asset position must be maintained with related parties of no more than a hundred million dollars. The Net asset position with related parties is the difference between i) the sum of Accounts receivable from related entities, Current, accounts receivable from related entities, non-current, less transactions in the ordinary course of business of less than 180 days term, short-term transactions of associates of Enel Generación Chile S.A. in which Enel Américas S.A. has no participation, and long-term transactions of associates of Enel Generación Chile S.A. in which Enel Américas S.A. has no participation, and ii) the sum of Accounts payable to related entities, current, Accounts payable to related entities, non-current, less transactions in the ordinary course of business at less than 180 days term, short-term transactions of associates of Enel Generación Chile S.A. in which Enel Américas S.A. has no participation, and long-term transactions of associates of Enel Generación Chile S.A. in which Enel Américas S.A. has no participation. As of December 31, 2018, using the exchange rate prevailing on that date, the net asset position with related parties was a negative US$ 125 million, indicating that Enel Américas S.A. is a net debtor of Enel Generación Chile S.A.. Series M · Consolidated Debt Ratio: The consolidated debt ratio, which is Financial debt to Capitalization, must be no more than 0.64. Financial debt is the sum of Interest-bearing loans, current; Interest-bearing loans, non-current; Other financial liabilities, current; and Other financial liabilities, non-current; while Capitalization is the sum of Financial liabilities and Equity. As of December 31, 2018, the debt ratio was 0.30. · Consolidated Equity: Same as for Series H. · Financial Expense Coverage Ratio: Same as for Series H. The Company’s domestic (governed by Chilean law, maturity in April 2019) and international (governed by New York State law, maturity in February 2020) credit lines include the following covenants whose definitions and formulas, identical to each other, are established in the respective contracts: · Debt Equity Ratio: The debt equity ratio, which is Financial debt to Net Equity, must be no more than 1.4. Financial debt is the sum of Interest-bearing loans, current; Interest-bearing loans, non-current; while Net Equity is the sum of the Equity attributable to the shareholders of the Company, and Non-controlling interests. As of December 31, 2018, the ratio was 0.42. · Debt Repayment Capacity (Debt/EBITDA Ratio): The ratio between Financial Debt and EBITDA must be no more than 6.5. Financial Debt is the sum of interest-bearing loans, current; and interest-bearing loans, non-current; while EBITDA is the operating income excluding depreciation and amortization expense and impairment losses/(reversal of impairment losses) for the four mobile quarters ended on the calculation date. As of December 31, 2018, the Debt/EBITDA ratio was 1.44. Yankee Bonds are not subject to financial covenants. As of December 31, 2018, the most restrictive financial covenant was the Debt Equity Ratio requirement for two credit lines. The other Group companies not mentioned in this Note, are not subject to compliance with financial covenants. Lastly, in most of the contracts, debt acceleration for non-compliance with these covenants does not occur automatically, but is subject to certain conditions, such as a cure period. As of December 31, 2018 and 2017, no company of the Group was in default under their financial obligations summarized herein or other financial obligations whose defaults might trigger the acceleration of their financial commitments. The Group personnel, including that of subsidiaries and jointly-controlled companies in the five Latin American countries where the Group is present, is distributed as follows as of December 31, 2018 and 2017: As of and for the year ended 12-31-2018 Country Managers and Professionals and Workers and Total Average for Chile 20 653 68 741 769 Argentina — 7 19 26 26 Total 20 660 87 767 795 As of and for the year ended 12-31-2017 Country Managers and Professionals and Workers and Total Average for Chile 24 772 27 823 842 Argentina — 23 2 25 25 Total 24 795 29 848 867 It is important to note that the Group’ operations outside of Chile, beginning on March 1, 2016, are part of the new company named Endesa Américas S.A. (See Notes 3.j and 5.2 and Appendix 2). The following Group’s subsidiaries have received sanctions from administrative authorities: As of December 31, 2018, the illegality claims against Resolution No. 2658 of Biobío’s Secretary of Health Ministry imposing a fine of UTM 500 for alleged infractions of Enel Generación Chile S.A. related to asbestos removal approved by the Health authority are still pending. The request for reconsideration of the sanctioning process before the Bío Bío Regional Health Ministry, initiated by Act 180566, for an amount of 500 UTM, for alleged infringements in compliance with obligations related to waste disposal regulations in the Cantarrana landfill is also pending. Likewise the Valparaíso Regional Health Ministry initiated sanction proceedings for inspection report No. 1705213, for alleged breaches of obligations and regulations related to the Noise Exposure Protocols and other health surveillance regulations at the Quintero plant. The amount of this sanction is 500 UTM. There are pending two requests for reconsideration claimed against the Tarapacá Regional Health Ministry’s resolutions, through inspection records Nos. 011599 and 766, that imposed fines on GasAtacama Chile S.A. for 500 UTM each. In addition, there is pending resolution before the Coquimbo Regional Health Ministry a health summary for an amount of 500 UTM. 37.3. Empresa Eléctrica Pehuenche S.A. There are no sanctions. In relation to the sanctions described above, the Group has established provisions for ThCh$ 120,883 as of December 31, 2018. Although there are other sanctions that also have associated provisions but are not described in this note because they individually represent immaterial amounts, the management of the Company considers that the provisions recorded in the consolidated financial statements are adequate to cover the risks resulting from sanctions because it does not consider there to be any additional liabilities other than those specified. Environmental expenses for the years ended December 31, 2018, 2017 and 2016, are as follows: Project Status 12-31-2018 12-31-2017 (Terminated, In ThCh$ ThCh$ Company Project Name Project Description Process) Total Disbursements Amounts Capitalized Expenses Total Disbursements Total disbursements previous period Gas Atacama Chile Environmental monitoring Environmental monitoring In process 797,543 — 797,543 797,543 1,463,204 Hydraulic power stations Studies, monitoring, laboratory analysis, removal and final disposal of solid waste in hydroelectric plants (Hydroelectric Power Plant) In process 11,567 — 11,567 11,567 — Normalization CEMS Warehouse standardization, environmental management In process 645,302 645,302 — 645,302 1,021,630 Pehuenche Hydro Power Plants Environmental Costs Studies, monitoring, laboratory analysis, removal and disposal of solid waste from hydropower (Hydroelectric Power Plant) In process 62,560 62,560 62,560 6,787 Hydroelectric Power Plant Pehuenche S.A. Supply of flow measurement equipment. In process 48,574 48,574 — 48,574 — Enel Generación Environmental costs in combined cycle plants Principal incurred expenses: Bocamina U1-2: Operation and maintenance of air monitoring and meteorological stations, Environmental audit monitoring network, CEMS Annual Validation, Biomass Protocol Service, Environment Materials (magazine, books), Isocinetic Measurements , SGI Works (NC Objective, Inspections, Audits and Audit) ISO 14001, OHSAS Certification, Operation and Maintenance Service CEMS. In process 2,102,056 — 2,102,056 2,102,056 1,252,355 Studies, monitoring, laboratory analysis, removal and final disposal of solid waste in thermoelectric plants. In process 2,867,523 — 2,867,523 2,867,523 870,281 Environmental costs in hydroelectric plants Studies, monitoring, laboratory analysis, withdrawal and final disposal of solid waste in hydroelectric plants. In process 183,156 — 183,156 183,156 251,277 Ralco Hydroelectric Plant Reforestation according to Agreement with the Catholic University and Electrification of housing in Ayin Maipu In process 4,542,216 4,542,216 — 4,542,216 5,075,137 Central Quintero Engineering, Civil Works and Permits In process 417,194 417,194 — 417,194 — Total 11,677,691 5,653,286 6,024,405 11,677,691 9,940,671 Project Status 12-31-2017 12-31-2016 (Terminated, In Total Disbursements Amounts Capitalized Expenses Total Disbursements ThCh$ Company Project Name Project Description Process) ThCh$ ThCh$ ThCh$ ThCh$ Total disbursements previous period Gas Atacama Chile Environmental monitoring Environmental monitoring In process 1,463,204 — 1,463,204 1,463,204 — Normalization CEMS Normalization of warehouses, environmental management In process 1,021,630 1,021,630 1,021,630 — Pehuenche Hydro Power Plants Environmental Costs Studies, monitoring, laboratory analysis, removal and disposal of solid waste from hydropower (Hydroelectric Power Plant) In process 6,787 — 6,787 6,787 6,515 Eólica Canela Improving reforested sectors Environmental maintenance In process 104,810 104,810 — 104,810 — Environmental expenditures in power plants. Analysis and monitoring of water quality and Canela’s hygienic maintenance In process 18,347 — 18,347 18,347 94,770 Environmental costs in combined cycle plants Principal incurred expenses: Bocamina U1-2: Operation and maintenance of air monitoring and meteorological stations, Environmental audit monitoring network, CEMS Annual Validation, Biomass Protocol Service, Environment Materials (magazine, books), Isocinetic Measurements , SGI Works (NC Objective, Inspections, Audits and Audit) ISO 14001, OHSAS Certification, Operation and Maintenance Service CEMS. In process 1,252,355 — 1,252,355 1,252,355 567,616 Environmental costs in thermal plants Studies, monitoring, laboratory analysis, withdrawal and final disposal of solid waste in hydroelectric plants. In process 251,277 — 251,277 251,277 181,644 Enel Generación Chile S.A Environmental costs in hydroelectric plants Studies, monitoring, laboratory analysis, removal and final disposal of solid waste in thermoelectric plants Estudios, monitoreos, análisis de laboratorio, retiro y disposición final de residuos sólidos en centrales termoeléctricas (C.T.) In process 870,281 — 870,281 870,281 243,264 Ralco Hydroelectric Plant Reforestation according to Agreement with the Catholic University and Electrification of housing in Ayin Maipu In process 5,075,137 5,075,137 — 5,075,137 4,497,330 Tal Tal Thermal Plant Engineering, Civil Works and Permits In process 1,290,133 1,290,133 — 1,290,133 3,173,813 Total 11,353,961 7,491,710 3,862,251 11,353,961 8,764,952 Project Status 12-31-2016 (Terminated, In Total Disbursements Amounts Capitalized Expenses Total Disbursements Company Project Name Project Description Process) ThCh$ ThCh$ ThCh$ ThCh$ Pehuenche Hydro Power Plants Environmental Costs Studies, monitoring, laboratory analysis, removal and disposal of solid waste from hydropower (Hydroelectric Power Plant) In process 6,515 — 6,515 6,515 Environmental costs in combined cycle plants Principal incurred expenses: Bocamina U1-2: Operation and maintenance of air monitoring and meteorological stations, Environmental audit monitoring network, CEMS Annual Validation, Biomass Protocol Service, Environment Materials (magazine, books), Isocinetic Measurements , SGI Works (NC Objective, Inspections, Audits and Audit) ISO 14001, OHSAS Certification, Operation and Maintenance Service CEMS. In process 567,616 — 567,616 567,616 Enel Generación Chile S.A Environmental costs in thermal plants Studies, monitoring, laboratory analysis, withdrawal and final disposal of solid waste in hydroelectric plants. In process 181,644 — 181,644 181,644 Environmental costs in hydroelectric plants Studies, monitoring, laboratory analysis, removal and final disposal of solid waste in thermoelectric plants Estudios, monitoreos, análisis de laboratorio, retiro y disposición final de residuos sólidos en centrales termoeléctricas (C.T.) In process 243,264 — 243,264 243,264 Ralco Hydroelectric Plant Reforestation according to Agreement with the Catholic University and Electrification of housing in Ayin Maipu In process 4,497,330 4,497,330 — 4,497,330 Tal Tal Thermal Plant Engineering, Civil Works and Permits In process 3,173,813 3,173,813 — 3,173,813 Studies, monitoring and waste disposal Hygiene, waste treatment, management system and pest control Terminated 78,221 — 78,221 78,221 Gas Atacama Chile Studies, monitoring and laboratory analysis Removal and final disposal of solid waste in thermal power plants In process 169,743 — 169,743 169,743 Coal-fired power stationsCentrales a carbón Emissions Standard (Desox and Denox Tarapacá) In process 27,648,451 27,648,451 — 27,648,451 ZLD plant (studies) ZLD plant (studies) Terminated 13,470 13,470 — 13,470 Eólica Canela Environmental expenditures in power plants. Analysis and monitoring of water quality and Canela’s hygienic maintenance. In process 94,770 — 94,770 94,770 Total 36,674,837 35,333,064 1,341,773 36,674,837 39. FINANCIAL INFORMATION ON SUBSIDIARIES, SUMMARIZED As of and for the years ended December 31, 2018 and 2017 the summarized financial information of our principal subsidiaries under IFRS is as follows: Financial Current Non-current Total Assets Current Non-current Equity Total Revenues Costs Profit Other Total As of and for the year ended 12-31-2018 Statements ThCh$ ThCh$ ThCh$ ThCh$ ThCh$ ThCh$ ThCh$ ThCh$ ThCh$ ThCh$ ThCh$ ThCh$ Empresa Eléctrica Pehuenche S.A. Separate 51,279,432 179,693,183 230,972,615 44,459,385 46,238,191 140,275,039 230,972,615 162,768,187 (21,539,172 ) 93,679,208 — 93,679,208 Group Inversiones GasAtacama Holding Ltda. Consolidated 154,726,337 601,914,918 756,641,255 61,155,090 94,466,221 601,019,944 756,641,255 271,433,788 (94,746,409 ) 87,093,211 (5,273,886 ) 81,819,325 Financial Current Non-current Total Assets Current Non-current Equity Total Revenues Costs Profit Other Total As of and for the year ended 12-31-2017 Statements ThCh$ ThCh$ ThCh$ ThCh$ ThCh$ ThCh$ ThCh$ ThCh$ ThCh$ ThCh$ ThCh$ ThCh$ Empresa Eléctrica Pehuenche S.A. Separate 35,369,243 186,760,346 222,129,589 (38,310,560 ) (48,261,590 ) (135,557,439 ) (222,129,589 ) 152,501,383 (36,289,330 ) 76,860,591 — 76,860,591 Group Inversiones GasAtacama Holding Ltda. Consolidated 182,143,224 611,319,090 793,462,314 (75,370,131 ) (83,894,881 ) (634,197,303 ) (793,462,315 ) 307,272,380 (170,752,796 ) 54,725,392 (3,338,115 ) 51,387,277 On April 24, 2019, Enel Generación Chile S.A. (“Enel Generación”) announced in a significant event filing that in connection with the contracts for the purchase and sale of power and electricity informed through a significant event issued on May 5, 2016, Anglo American Sur S.A. (“AngloAmerican”) and Enel Generación have signed an Agreement called “Payment of Compensation for Exit Clause, Settlement and Transaction for Contracts for the Purchase and Sale of Power and Electricity for Los Bronces, El Soldado and Chagres” (the “Agreement”), by virtue of which it has been agreed to anticipate the date of termination of the contracts as of February 20, 2020 and the payment of the respective exit compensation that corresponds to Enel Generación, in accordance with both the provisions of the contracts and the aforementioned Agreement. As of this date, it is not possible to reasonably quantify the financial effect of the early termination date in the results of Enel Generación. The financial effects will depend on factors that affect the behavior of the electricity market, such as, among others, the price of fuels; the hydrological conditions; growth of demand and international inflation rates, which to date are not possible to determine. There have been no other subsequent events that have occurred between January 1, 2019 and the date when these consolidated financial statements were approved for issuance board of the Directors of the Company. This appendix is part of Note 2.4, “Subsidiaries”. It presents the Group’s percentage of control in each subsidiary. Taxpayer ID Functional % of control as of 12-31-2018 % of control as of 12-31-2017 No. Company Currency Direct Indirect Total Direct Indirect Total Relationship Country Activity 96.504.980-0 Empresa Eléctrica Pehuenche S.A. Chilean peso 92.65 % 0.00 % 92.65 % 92.65 % 0.00 % 92.65 % Subsidiary Chile Complete electric energy cycle 96.830.980-3 GasAtacama Chile S.A. Chilean peso 97.37 % 0.00 % 97.37 % 97.37 % 0.00 % 97.37 % Subsidiary Chile Management of Companies 78.952.420-3 Gasoducto Atacama Argentina S.A. Chilean peso 0.03 % 99.97 % 100.00 % 0.03 % 99.97 % 100.00 % Subsidiary Chile Natural gas exploitation and transportation APPENDIX 2 CHANGES IN THE SCOPE OF CONSOLIDATION This appendix is part of Note 2.4.1 “Changes in the scope of consolidation” Exclusion from the scope of consolidation for the years ended December 31, 2018 and 2017. For the year ended 12-31-2018 For the year ended 12-31-2017 % ownership interest % ownership interest Company Direct Indirect Total Consolidation method Direct Indirect Total Consolidation method Central Eólica Canela S.A.(1) 0.00 % 0.00 % 0.00 % Full Integration 0.00 % 75.00 % 75.00 % Full Integration Electrogas S.A. (2) 0.00 % 0.00 % 0.00 % Equity method 0.00 % 42.50 % 42.50 % Equity method Employee Benefits Expense For the years ended 12-31-2016 12-31-2015 12-31-2014 ThCh$ ThCh$ ThCh$ Wages and salaries (47,845,074) (57,501,658) (57,994,957) Post-employment benefit obligations expense (802,823) (1,063,547) (363,445) Social security and other contributions (7,031,344) (5,603,779) (4,842,700) Other staff expenses (4,670,831) (6,800,373) (1,658,863) Total employee benefits expense (60,350,072) (70,969,357) (64,859,965) (1) The company was dissolved on Noviembre 30, 2017. (2) See Note 5.1. APPENDIX 3 ASSOCIATED COMPANIES AND JOINT VENTURES This appendix is an integral part of Note 14. Investments accounted for using the equity method . Taxpayer Company Functional Ownership Interest as of 12-31-2018 Ownership Interest as of 12-31-2017 ID No. (in alphabetical order) currency Direct Indirect Total Direct Indirect Total Relationship Country Activity 76.652.400-1 Centrales Hidroeléctricas De Aysén S.A. (1) Chilean peso 0.00 % 0.00 % 0.00 % 51.00 % 0.00 % 51.00 % Joint venture Chile Hydroelectric plant development and operation 77.017.930-0 Transmisora Eléctrica de Quillota Ltda. (2) Chilean peso 0.00 % 50.00 % 50.00 % 0.00 % 50.00 % 50.00 % Joint venture Chile Electric energy transportation and distribution 76.418.940-K GNL Chile. S.A. (3) U.S. dollar 33.33 % 0.00 % 33.33 % 33.33 % 0.00 % 33.33 % Associate Chile Promotion of liquefied natural gas supply project Foreign Enel Argentina S.A. (ex - Endesa Argentina S.A.) (5) Argentine peso 0.00 % 0.08 % 0.08 % 0.00 % 0.12 % 0.12 % Associate Argentina Portfolio company 76.041.595-5 Aysen energia S.A (4) Argentine peso 51.00 % 0.00 % 51.00 % 0.00 % 0.00 % 0.00 % Associate Argentina Hydroelectric plant development and operation 76.041.891-9 Aysen Transmision S.A (4) Argentine peso 51.00 % 0.00 % 51.00 % 0.00 % 0.00 % 0.00 % Associate Argentina Hydroelectric plant development and operation (1) On September 7, 2018, Centrales Hidroeléctricas de Aysén S.A. was liquidated and distributed among its shareholders (see Note 14.1.b). (2) See Note 14.3. (3) See Note 14.2. (4) The companies Aysén Energía S.A. and Aysén Transmission S.A. are in the process of being liquidated as of December 31, 2018. Depreciation, amortization and impairment losses For the years ended 12-31-2016 12-31-2016 12-31-2016 ThCh$ ThCh$ ThCh$ Depreciation (*) (130,397,533) (123,336,695) (98,313,923) Amortization (**) (2,202,848) (1,498,864) (2,990,986) Subtotal (132,600,381) (124,835,559) (101,304,909) (Impairment)/Reversal of impairment (1) (30,785,531) 9,793,652 (12,461,456) Total depreciation, amortization and impairment losses (163,385,912) (115,041,907) (113,766,365) (1) (Impairment)/Reversal of impairment For the years ended 12-31-2016 12-31-2015 12-31-2014 ThCh$ ThCh$ ThCh$ (Charge)/Reversal of bad debt expense for financial assets (*) - (371,558) 120,491 (Impairment)/Reversal of impairment of property, plant and equipment (**) (30,785,531) 10,165,210 (12,581,947) Total (30,785,531) 9,793,652 (12,461,456) APPENDIX 4 DETAIL OF ASSETS AND LIABILITIES IN FOREIGN CURRENCY This appendix forms an integral part of Enel Generación Chile S.A. financial statements. The detail of assets denominated in foreign currencies is the following: 12-31-2018 12-31-2017 ASSETS Foreign Currency Functional Currency ThCh$ ThCh$ 31-12-2017 12-31-2017 CURRENT ASSETS Foreign Currency Functional Currency ThCh$ ThCh$ Cash and cash equivalents 14,871,843 20,048,279 U.S. dollars Chilean peso 8,760,454 13,784,935 Euros Chilean peso 53,596 — Argentine peso Chilean peso 6,057,793 6,263,344 Other current financial assets 38,117,291 20,441,149 U.S. dollars Chilean peso 38,117,291 20,441,149 Other current non-financial assets 1,887,486 934,647 U.S. dollars Chilean peso 969,768 902,026 Argentine peso Chilean peso 917,718 32,621 Trade and other current receivables 30,517 6,346,175 U.S. dollars Chilean peso — 5,273,103 Argentine peso Chilean peso 30,517 1,073,072 Current accounts receivable from related parties 41,909,120 65,225,546 U.S. dollars Chilean peso 18,430,902 22,833,551 Euros Chilean peso 23,478,218 42,391,995 Current tax assets 168,714 146,525 Argentine peso Chilean peso 168,714 146,525 TOTAL CURRENT ASSETS 96,984,971 113,142,321 12-31-2018 12-31-2017 NON-CURRENT ASSETS Foreign Currency Functional Currency ThCh$ ThCh$ Other non-current financial assets 38,021,172 30,789,703 U.S. dollars Chilean peso 38,021,172 30,789,703 Other non-current non-financial assets 320,238 701,684 U.S. dollars Chilean peso 123,829 322,744 Argentine peso Chilean peso 196,409 378,940 Trade and other non-current receivables 25,706 62,563 Argentine peso Chilean peso 25,706 62,563 Current accounts payable to related parties — — Investments accounted for using the equity method — 3,888,467 U.S. dollars Chilean peso — 3,783,316 Argentine peso Chilean peso — 105,151 Intangible assets other than goodwill 253,937 253,849 Argentine peso Chilean peso 253,937 253,849 Property, plant and equipment 15,646,727 15,450,783 Argentine peso Chilean peso 15,646,727 15,450,783 TOTAL NON-CURRENT ASSETS 54,267,780 51,147,049 TOTAL ASSETS 151,252,751 164,289,370 Other expenses by nature For the years ended 12-31-2016 12-31-2015 12-31-2014 ThCh$ ThCh$ ThCh$ Professional, outsourced and other services (31,529,339) (35,580,482) (25,679,586) Other supplies and services (16,538,925) (17,249,969) (15,000,018) Insurance premiums (15,963,457) (14,750,997) (11,189,610) Taxes and charges (3,589,932) (5,897,231) (4,118,235) Repairs and maintenance (2,467,908) (3,277,318) (2,237,638) Marketing, public relations and advertising (713,691) (572,883) (273,283) Leases and rental costs (1,229,779) (1,240,625) (2,939,241) Environmental expenses (1,341,773) (2,806,941) (2,066,568) Huechún and Chillán projects write-off (*) (2,549,926) - - Current projects write-off (*) (33,930,297) (2,706,830) - Other supplies (4,680,233) (3,308,962) (697,698) Travel expenses (1,974,202) (2,057,192) (2,133,664) Indemnities and fines (2,793,753) (890,392) - Total other expenses by nature (119,303,215) (90,339,822) (66,335,541) 12-31-2018 12-31-2018 12-31-2017 12-31-2017 Up to 90 days 91 days to 1 year Up to 90 days 91 days to 1 year LIABILITIES Foreign Currency Functional Currency ThCh$ ThCh$ ThCh$ ThCh$ Other current financial liabilities 88,903,639 4,241,006 7,999,743 13,681,329 U.S. dollars Chilean peso 88,903,639 4,241,006 7,999,743 13,681,329 Trade and other current payables 2,337,671 — 20,092,325 — U.S. dollars Chilean peso 1,081,389 — 16,184,962 — Euros Chilean peso 744,822 — 3,174,586 — Argentine peso Chilean peso 511,460 — 732,777 — Current accounts payable to related parties 50,944,448 — 24,125,790 — U.S. dollars Chilean peso 21,619,106 — 8,394,761 — Euros Chilean peso 29,325,342 — 15,717,455 — Colombian peso Chilean peso — — — — Argentine peso Chilean peso — — 13,574 — Other current provisions 24,667 — 45,419 — Argentine peso Chilean peso 24,667 — 45,419 — Current tax liabilities — 411,577 146,769 — Argentine peso Chilean peso — 411,577 146,769 — Other non-current financial liabilities 10,061 — — — Argentine peso Chilean peso 10,061 — — — TOTAL CURRENT LIABILITIES 142,220,486 4,652,583 52,410,046 13,681,329 12-31-2018 12-31-2018 12-31-2017 12-31-2017 One to five years More than five years One to five years More than five years NON-CURRENT LIABILITIES Moneda extranjera Moneda funcional ThCh$ ThCh$ ThCh$ ThCh$ Other non-current financial liabilities 15,099,520 487,595,270 29,636,407 434,446,795 U.S. dollars Peso chileno 15,099,520 487,595,270 29,636,407 434,446,795 Trade and other non-current payables 4,762 — 174,290 — U.S. dollars 4,762 — 947 — Euros Peso chileno — — — — Argentine peso Peso chileno — — 173,343 — Non-current accounts payable to related parties — — — 318,518 Euros — — — 318,518 Deferred tax liabilities — — 4,459,081 — Argentine peso Peso chileno — — 4,459,081 — TOTAL NON-CURRENT LIABILITIES 15,104,282 487,595,270 34,269,778 434,446,795 TOTAL LIABILITIES 157,324,768 492,247,853 86,679,824 448,128,124 Other gains (losses) For the years ended 12-31-2016 12-31-2015 12-31-2014 ThCh$ ThCh$ ThCh$ Gain on disposal of Sociedad Concesionaria Túnel El Melón S.A. (*) - 4,207,167 - Gain from remeasurement of the pre-existing stake held in GasAtacama - - 21,546,320 Gain from currency exchange difference in the pre-existing stake held in GasAtacama - - 21,006,456 Gain on disposal of GNL Quintero (**) 121,325,018 - - Others 165,956 (191,766) 98,791 Total other gains, net 121,490,974 4,015,401 42,651,567 APPENDIX 5 ADDITIONAL INFORMATION CIRCULAR No. 715 OF FEBRUARY 3, 2012 This appendix forms an integral part of the Group’s financial statements. a)Portfolio stratification · Trade and other receivables by aging (original maturity): Balance as of 12-31-2018 On demand 1-30 days 31-60 days 61-90 days 91-120 days 121-150 days 151-180 days 181-210 days 211-250 days More than Total Current Total Non- Trade and Other Receivables ThCh$ ThCh$ ThCh$ ThCh$ ThCh$ ThCh$ ThCh$ ThCh$ ThCh$ ThCh$ ThCh$ ThCh$ Trade receivables, gross 198,454,217 671,037 248,135 140,571 224 7,274 39,001 43,681 56,046 5,882,588 205,542,774 21,255 Allowance for doubtful accounts — — — — — — — — — (1,553,256 ) (1,553,256 ) — Other receivables, gross 35,435,989 — — — — — — — — — 35,435,989 1,135,383 Total 233,890,206 671,037 248,135 140,571 224 7,274 39,001 43,681 56,046 4,329,332 239,425,507 1,156,638 Balance as of 12-31-2017 On demand 1-30 days 31-60 days 61-90 days 91-120 days 121-150 days 151-180 days 181-210 days 211-250 days More than Total Current Total Non- Trade and Other Receivables ThCh$ ThCh$ ThCh$ ThCh$ ThCh$ ThCh$ ThCh$ ThCh$ ThCh$ ThCh$ ThCh$ ThCh$ Trade receivables, gross 186,769,753 3,057,994 333,078 279,100 10,021 42,015 334,297 399,552 228,498 4,116,042 195,570,350 62,563 Allowance for doubtful accounts — — — — — — — — — (1,258,817 ) (1,258,817 ) — Other receivables, gross 12,897,287 — — — — — — — — — 12,897,287 970,360 Total 199,667,040 3,057,994 333,078 279,100 10,021 42,015 334,297 399,552 228,498 2,857,225 207,208,820 1,032,923 Financial Income For the years ended 12-31-2016 12-31-2015 12-31-2014 ThCh$ ThCh$ ThCh$ Cash and cash equivalents 2,150,797 152,518 1,283,124 Other financial income 3,999,954 82,303 302,909 Total financial income 6,150,751 234,821 1,586,033 Financial Costs For the years ended 12-31-2016 12-31-2015 12-31-2014 ThCh$ ThCh$ ThCh$ Financial Costs (55,701,778) (64,206,719) (71,617,257) Bank loans (2,033,835) (129,350) (612,003) Secured and unsecured obligations (44,268,489) (51,697,708) (48,046,358) Valuation of financial derivatives (824,922) (1,725,211) (2,634,032) Post-employment benefit obligations (705,211) (759,311) (785,598) Capitalized borrowing costs (*) 3,001,211 2,221,329 1,817,283 Bank loans (10,870,532) (12,116,468) (21,356,549) Gains from indexed assets and liabilities, net (1) 606,075 3,600,187 13,926,117 Foreign currency exchange differences (2) 13,266,320 (53,880,472) (21,240,269) Positive 48,546,664 26,738,738 17,473,252 Negative (35,280,344) (80,619,210) (38,713,521) Total financial costs (41,829,383) (114,487,004) (78,931,409) Total financial results (35,678,632) (114,252,183) (77,345,376) (1) Gains from indexed assets and liabilities, net For the years ended 12-31-2016 12-31-2015 12-31-2014 ThCh$ ThCh$ ThCh$ Other financial assets (derivative instruments) 7,188,900 10,153,342 23,320,934 Other non-financial assets - 819,503 105,210 Trade and other accounts receivable 452,440 526,361 2 Current tax receivables and liabilities 1,979,594 4,965,940 8,189,573 Other financial liabilities (financial debt and derivative instruments) (9,014,859) (12,864,959) (17,623,602) Other provisions - - (66,000) Total gains from indexed assets and liabilities, net 606,075 3,600,187 13,926,117 (2) Foreign currency exchange differences For the years ended 12-31-2016 12-31-2015 12-31-2014 ThCh$ ThCh$ ThCh$ Cash and cash equivalents 183,225 2,584,228 882,326 Other financial assets (derivative instruments) 25,048,205 10,637,768 (23,775,272) Other non-financial assets - - 23,905 Trade and other accounts receivable 2,541,385 9,884,307 5,299,539 Current tax receivables and liabilities - - (1,077,140) Other financial liabilities (financial debt and derivative instruments) (18,217,515) (30,533,746) (2,694,805) Trade and other accounts payable 3,711,020 (46,453,029) 830,878 Other non-financial liabilities - - (729,700) Total foreign currency exchange differences 13,266,320 (53,880,472) (21,240,269) Current Income Tax and Adjustments to Current Income Tax for Previous Periods For the years ended 12-31-2016 12-31-2015 12-31-2014 ThCh$ ThCh$ ThCh$ Current income tax (135,594,643) (49,317,727) (46,489,891) Adjustments to current tax from the previous period (295,585) (7,068,433) (3,795,517) Expense for current income tax due to changes in tax rates or the introduction of new taxes - - (5,050,864) Current tax income/(expense) related to hedge accounting 23,630,564 (32,386,954) (2,460,042) Current tax expense, net (112,259,664) (88,773,114) (57,796,314) Expense from deferred taxes for origination and reversal of temporary differences 29,042,729 12,117,295 23,698,208 Expense for deferred income tax due to changes in tax rates or the introduction of new taxes - - (59,959,546) Total deferred tax benefit 29,042,729 12,117,295 (36,261,338) Income tax expense, continuing operations (83,216,935) (76,655,819) (94,057,652) Reconciliation of Tax Expense Rate 12-31-2016 Rate 12-31-2015 Rate 12-31-2014 % ThCh$ % ThCh$ % ThCh$ ACCOUNTING PROFIT BEFORE INCOME TAX 525,076,863 300,487,081 163,216,063 Total tax income (expense) using statutory rate (24.00%) (126,018,446) (22.50%) (67,609,594) (21.00%) (34,275,372) Tax effect of rates applied in other countries 0.06% 330,353 0.00% - 0.00% 689 Tax effect of non-taxable revenues 7.51% 39,421,280 0.70% 2,118,333 6.82% 11,132,065 Tax effect of non-tax-deductible expenses (1.95%) (10,216,591) (3.47%) (10,419,563) (5.04%) (8,225,638) Tax effect from change in tax rate 0.00% - 0.00% - (39.82%) (64,997,657) Tax effect of adjustments to current taxes in previous periods 0.00% - 0.00% - (2.33%) (3,795,517) Tax effect of adjustments to deferred taxes in previous periods (0.05%) (295,585) (2.35%) (7,068,433) 0.00% - Price level restatement for tax purposes (equity investments) 2.58% 13,562,054 2.10% 6,323,438 3.74% 6,103,778 Total adjustments to tax expense using statutory rates 8.15% 42,801,511 (3.01%) (9,046,225) (36.63%) (59,782,280) Actual income tax expense (15.85%) (83,216,935) (25.51%) (76,655,819) (57.63%) (94,057,652) · By type of portfolio: Non-renegotiated portfolio as of Renegotiated portfolio as of Total portfolio as of Non-renegotiated portfolio as of Renegotiated portfolio as of Total portfolio as of Aging (original maturity) of balances Number of Gross value Number of Gross value Number of Gross value Number of Gross value Number of Gross value Number of Gross value On demand and non-current 582 198,424,050 2 51,442 584 198,475,492 502 186,724,468 2 107,848 504 186,832,316 1 to 30 days 148 671,037 — — 148 671,037 85 3,057,994 — — 85 3,057,994 31 to 60 days 57 248,135 — — 57 248,135 68 333,078 — — 68 333,078 61 to 90 days 27 140,571 — — 27 140,571 28 279,100 — — 28 279,100 91 to 120 days 1 224 — — 1 224 71 10,021 — — 71 10,021 121 to 150 days 10 7,274 — — 10 7,274 99 42,015 — — 99 42,015 151 to 180 days 6 39,001 — — 6 39,001 45 334,297 — — 45 334,297 181 to 210 days 7 43,681 — — 7 43,681 48 399,552 — — 48 399,552 211 to 250 days 4 56,046 — — 4 56,046 33 228,498 — — 33 228,498 More than 251 days 354 5,882,588 — — 354 5,882,588 323 4,116,042 — — 323 4,116,042 Total 1,196 205,512,607 2 51,442 1,198 205,564,049 1,302 195,525,065 2 107,848 1,304 195,632,913 b)Provisions and write-offs For the year ended 12-31-2018 12-31-2017 Provisions and Write-offs ThCh$ ThCh$ Provision (recovery of provision) for non-renegotiated portfolio 79,911 (55,494 ) Provision renegotiated portfolio 17,890 — Write-offs during the period 3,099 — Total 100,900 (55,494 ) c)Number and value of operations For the years ended 12-31-2018 12-31-2017 Number and Value of Operations Last quarter Year Last quarter Year Impairment provision and recoveries Number of operations 1 3 — 5 Value of operations, in ThCh$ — 100,900 (55,494 ) (55,494 ) Country Chile Argentina Colombia Peru Eliminations Total ASSETS 12-31-2016 ThCh$ 12-31-2015 ThCh$ 12-31-2016 ThCh$ 12-31-2015 ThCh$ 12-31-2016 ThCh$ 12-31-2015 ThCh$ 12-31-2016 ThCh$ 12-31-2015 ThCh$ 12-31-2016 ThCh$ 12-31-2015 ThCh$ 12-31-2016 ThCh$ 12-31-2015 ThCh$ CURRENT ASSETS 543,372,955 567,841,878 - 459,495,019 - 1,980,785,898 - 928,453,235 - 475,985,410 543,372,955 4,412,561,440 Cash and cash equivalents 114,486,479 37,425,233 - - - - - - - - 114,486,479 37,425,233 Other current financial assets 487,106 1,011,555 - - - - - - - - 487,106 1,011,555 Other current non-financial assets 4,409,288 462,748 - - - - - - - - 4,409,288 462,748 Trade and other current receivables, net 260,440,086 363,475,277 - - - - - - - - 260,440,086 363,475,277 Current accounts receivable from related parties 82,727,781 68,946,489 - - - - - - - (78,763) 82,727,781 68,867,726 Inventories 33,390,799 36,755,409 - - - - - - - - 33,390,799 36,755,409 Current taxes receivable 34,438,408 14,857,462 - - - - - - - - 34,438,408 14,857,462 Non-current assets and disposal groups held for sale 12,993,008 44,907,705 - 459,495,019 - 1,980,785,898 - 928,453,235 - 476,064,173 12,993,008 3,889,706,030 NON-CURRENT ASSETS 2,856,309,536 4,648,220,875 - - - - - - - (1,782,011,982) 2,856,309,536 2,866,208,893 Other non-current financial assets 28,802,568 21,718,720 - - - - - - - - 28,802,568 21,718,720 Other non-current non-financial assets 12,318,443 3,387,709 - - - - - - - - 12,318,443 3,387,709 Trade and other non-current receivables, net 6,788,437 35,901 - - - - - - - - 6,788,437 35,901 Investments accounted for using the equity method 18,738,198 1,852,588,709 - - - - - - - (1,806,872,338) 18,738,198 45,716,371 Intangible assets other than goodwill, net 19,266,874 20,905,426 - - - - - - - - 19,266,874 20,905,426 Goodwill 24,860,356 - - - - - - - - 24,860,356 24,860,356 24,860,356 Property, plant and equipment, net 2,726,838,537 2,729,717,092 - - - - - - - - 2,726,838,537 2,729,717,092 Deferred tax assets 18,696,123 19,867,318 - - - - - - - - 18,696,123 19,867,318 TOTAL ASSETS 3,399,682,491 5,216,062,753 - 459,495,019 - 1,980,785,898 - 928,453,235 - (1,306,026,572) 3,399,682,491 7,278,770,333 LIABILITIES AND EQUITY CURRENT LIABILITIES 555,777,465 650,993,509 - 289,631,652 - 1,180,904,567 - 355,978,337 - 50,367,430 555,777,465 2,527,875,495 Other current financial liabilities 25,696,064 27,921,565 - - - - - - - - 25,696,064 27,921,565 Trade and other current payables 341,088,664 341,275,697 - - - - - - - 19,183,912 341,088,664 360,459,609 Current accounts payable to related parties 121,018,039 250,892,133 - - - - - - - 6,692,352 121,018,039 257,584,485 Current provisions 6,493,428 15,617,614 - - - - - - - - 6,493,428 15,617,614 Current tax liabilities 61,457,940 14,484,736 - - - - - - - - 61,457,940 14,484,736 Other current non-financial liabilities 23,330 23,330 - - - - - - - - 23,330 23,330 Liabilities associated with disposal groups held for sale - 778,434 - 289,631,652 - 1,180,904,567 - 355,978,337 - 24,491,166 - 1,851,784,156 NON-CURRENT LIABILITIES 1,114,144,777 1,177,739,370 - - - - - - - 29,265,389 1,114,144,777 1,207,004,759 Other non-current financial liabilities 854,016,751 917,197,790 - - - - - - - - 854,016,751 917,197,790 Trade and other non-current payables 1,453,022 7,389,664 - - - - - - - (1,413,978) 1,453,022 5,975,686 Non-current accounts payable to related parties 251,527 97,186 - - - - - - - - 251,527 97,186 Non-current provisions, other than for employee benefits 57,325,915 50,702,975 - - - - - - - - 57,325,915 50,702,975 Deferred tax liabilities 185,277,005 187,080,339 - - - - - - - 30,679,367 185,277,005 217,759,706 Non-current provisions for employee benefits 15,820,557 15,271,416 - - - - - - - - 15,820,557 15,271,416 EQUITY 1,729,760,249 3,387,329,874 - 169,863,367 - 799,881,331 - 572,474,898 - (1,385,659,391) 1,729,760,249 3,543,890,079 Equity attributable to Shareholders of the Parent 1,729,760,249 3,387,329,874 - 169,863,367 - 799,881,331 - 572,474,898 - (1,385,659,391) 1,700,962,487 2,648,189,907 Issued capital 552,777,321 2,041,622,319 - 38,308,208 - 146,498,021 - 312,948,407 - (1,207,662,870) 552,777,321 1,331,714,085 Retained earnings 1,199,429,221 1,726,639,411 - 52,817,928 - 217,958,121 - 39,261,286 - 181,696,622 1,199,429,221 2,218,373,368 Share premium 85,511,492 206,008,557 - - - - - - - - 85,511,492 206,008,557 Other reserves (107,957,785) (586,940,413) - 78,737,231 - 435,425,189 - 220,265,205 - (359,693,143) (136,755,547) (1,107,906,103) NON-CONTROLLING INTERESTS - - - - - - - - - - 28,797,762 895,700,172 TOTAL LIABILITIES AND EQUITY 3,399,682,491 5,216,062,753 - 459,495,019 - 1,980,785,898 - 928,453,235 - (1,306,026,572) 3,399,682,491 7,278,770,333 Country Chile Argentina Colombia Peru Eliminations Total STATEMENT OF CASH FLOW 12-31-2016 12-31-2015 12-31-2014 12-31-2016 12-31-2015 12-31-2014 12-31-2016 12-31-2015 12-31-2014 12-31-2016 12-31-2015 12-31-2014 12-31-2016 12-31-2015 12-31-2014 12-31-2016 12-31-2015 12-31-2014 ThCh$ ThCh$ ThCh$ ThCh$ ThCh$ ThCh$ ThCh$ ThCh$ ThCh$ ThCh$ ThCh$ ThCh$ ThCh$ ThCh$ ThCh$ ThCh$ ThCh$ ThCh$ Net cash provided by (used in) operating activities 490,177,558 433,106,626 248,147,763 13,638,776 71,449,572 73,261,969 47,055,127 254,539,609 364,425,930 8,317,128 144,659,247 131,371,133 - (2,540,818) (407,290) 559,188,589 901,214,236 816,799,505 Net cash (used in) provided by investing activities (34,631,759) (132,241,285) 34,558,118 (5,901,336) (50,193,057) (46,912,356) (16,448,412) (159,371,575) (185,214,366) (3,598,013) (32,455,858) (21,749,650) - (114,333,695) (108,128,882) (60,579,520) (488,595,470) (327,447,136) Net cash (used in) provided by financing activities (388,561,440) (302,477,643) (290,982,024) (17,813,237) (18,352,756) (20,558,700) (90,476,446) (259,847,758) (151,340,517) (22,802,105) (141,981,410) (97,913,910) - 116,874,513 108,536,172 (519,653,228) (605,785,054) (452,258,979) APPENDIX 5.1 SUPPLEMENTARY INFORMATION ON TRADE RECEIVABLES This appendix forms an integral part of the Group’s financial statements. a)Portfolio stratification · Trade receivables by aging (original maturity): Balance as of 12-31-2018 On 1-30 31-60 61-90 91-120 121-150 151-180 181-210 211-250 251-365 More than 365 Total Total Non- Trade Receivables ThCh$ ThCh$ ThCh$ ThCh$ ThCh$ ThCh$ ThCh$ ThCh$ ThCh$ ThCh$ ThCh$ ThCh$ ThCh$ Generation and transmission receivables 198,454,217 671,037 248,135 140,571 224 7,274 39,001 43,681 56,046 787,999 5,094,589 205,542,774 21,255 -Large customers 198,424,050 671,037 248,135 140,571 224 7,274 39,001 43,681 56,046 787,999 5,094,589 205,512,607 — -Others 30,167 — — — — — — — — — — 30,167 21,255 Allowance for doubtful Accounts — — — — — — — — — — (1,553,256 ) (1,553,256 ) — Unbilled services 165,128,644 — — — — — — — — — — 165,128,644 — Billed services 33,325,573 671,037 248,135 140,571 224 7,274 39,001 43,681 56,046 787,999 5,094,589 40,414,130 21,255 Total trade receivables, gross 198,454,217 671,037 248,135 140,571 224 7,274 39,001 43,681 56,046 787,999 5,094,589 205,542,774 21,255 Total allowance for doubtful accounts — — — — — — — — — — (1,553,256 ) (1,553,256 ) — Total trade receivables, net 198,454,217 671,037 248,135 140,571 224 7,274 39,001 43,681 56,046 787,999 3,541,333 203,989,518 21,255 Balance as of 12-31-2017 On 1-30 31-60 61-90 91-120 121-150 151-180 181-210 211-250 251-365 More than 365 Total Total Non-current Trade Receivables ThCh$ ThCh$ ThCh$ ThCh$ ThCh$ ThCh$ ThCh$ ThCh$ ThCh$ ThCh$ ThCh$ ThCh$ ThCh$ Generation and transmission receivables 186,769,753 3,057,994 333,078 279,100 10,021 42,015 334,297 399,552 228,498 1,596,976 2,519,066 195,570,350 62,563 -Large customers 186,724,468 3,057,994 333,078 279,100 10,021 42,015 334,297 399,552 228,498 1,596,976 2,519,066 195,525,065 62,563 -Others 45,285 — — — — — — — — — — 45,285 — Allowance for doubtful Accounts — — — — — — — — — (1,103,086 ) (155,731 ) (1,258,817 ) — Unbilled services 138,781,170 — — — — — — — — — — 138,781,170 — Billed services 47,988,583 3,057,994 333,078 279,100 10,021 42,015 334,297 399,552 228,498 1,596,976 2,519,066 56,789,180 — Total trade receivables, gross 186,769,753 3,057,994 333,078 279,100 10,021 42,015 334,297 399,552 228,498 1,596,976 2,519,066 195,570,350 62,563 Total allowance for doubtful accounts — — — — — — — — — (1,103,086 ) (155,731 ) (1,258,817 ) — Total trade receivables, net 186,769,753 3,057,994 333,078 279,100 10,021 42,015 334,297 399,552 228,498 493,890 2,363,335 194,311,533 62,563 F-125 Creditor of Guarantee Debtor Type of guarantee Pending balance as of Pledged assets Currency 12-31-2016 12-31-2015 Type Currency Book value Mitsubishi Corporation Enel Generación Costanera S.A. (formerly named Central Costanera S.A.) Pledge ThCh$ - 35,254,202 Combined cycle ThCh$ 10,804,894 Credit Suisse First Boston Enel Generación Costanera S.A. (formerly named Central Costanera S.A.) Pledge ThCh$ - 1,183,600 Combined cycle ThCh$ 3,098,134 Citibank N.A. Enel Argentina S.A. (formerly named Endesa Argentina S.A.) Pledge ThCh$ - 435,681 Deposit ThCh$ 435,681 · By type of portfolio: Balance as of 12-31-2018 On 1-30 31-60 61-90 91-120 121-150 151-180 181-210 211-250 More than 251 Total Total Non- Portfolio type ThCh$ ThCh$ ThCh$ ThCh$ ThCh$ ThCh$ ThCh$ ThCh$ ThCh$ ThCh$ ThCh$ ThCh$ Generation and transmission 198,454,217 671,037 248,135 140,571 224 7,274 39,001 43,681 56,046 5,882,588 205,542,774 — -Large customers 198,424,050 671,037 248,135 140,571 224 7,274 39,001 43,681 56,046 5,882,588 205,512,607 — -Others 30,167 — — — — — — — — — 30,167 — Total gross portfolio 198,454,217 671,037 248,135 140,571 224 7,274 39,001 43,681 56,046 5,882,588 205,542,774 — Balance as of 12-31-2017 On demand 1-30 days 31-60 days 61-90 days 91-120 days 121-150 days 151-180 days 181-210 days 211-250 days More than 251 days Total Current Portfolio type ThCh$ ThCh$ ThCh$ ThCh$ ThCh$ ThCh$ ThCh$ ThCh$ ThCh$ ThCh$ ThCh$ Generation and transmission 186,769,753 3,057,994 333,078 279,100 10,021 42,015 334,297 399,552 228,498 4,116,042 195,570,350 -Large customers 186,724,468 3,057,994 333,078 279,100 10,021 42,015 334,297 399,552 228,498 4,116,042 195,525,065 -Others 45,285 — — — — — — — — — 45,285 Total gross portfolio 186,769,753 3,057,994 333,078 279,100 10,021 42,015 334,297 399,552 228,498 4,116,042 195,570,350 APPENDIX 5.2 ESTIMATED SALES AND PURCHASES OF ENERGY AND CAPACITY This appendix forms an integral part of the Group’s financial statements. 2018 2017 Energy Tolls Energy Tolls Balance as of 31, December ThCh$ ThCh$ ThCh$ ThCh$ STATEMEMENT OF FINANCIAL POSITION Current accounts receivable from related parties 36,662,291 6,352,401 40,584,214 6,235,517 Trade and other current receivables 114,285,494 43,788,503 105,768,269 43,356,142 Total Estimated Assets 150,947,785 50,140,904 146,352,483 49,591,659 Trade and other current payables to related parties 16,666,536 346,044 20,942,895 5,818,224 Trade and other current payables 32,012,972 11,079,172 39,101,357 41,338,368 Total Estimated Liabilities 48,679,508 11,425,216 60,044,252 47,156,592 For the year ended 12-31-2018 For the year ended 12-31-2017 For the year ended 12-31-2016 Energy Tolls Energy Tolls Energy Tolls Chile ThCh$ ThCh$ ThCh$ ThCh$ ThCh$ ThCh$ STATEMENT OF INCOME Energy Sales 150,947,785 50,140,904 146,352,483 49,591,659 122,806,219 24,269,608 Energy Purchases 48,679,508 11,425,216 60,035,699 47,156,593 39,670,997 32,087,476 APPENDIX 6 DETAILS OF DUE DATES OF PAYMENTS TO SUPPLIERS This appendix forms an integral part of the Group’s financial statements. Balance as of 12-31-2018 12-31-2017 Goods Services Other Total Goods Services Other Total Suppliers ThCh$ ThCh$ ThCh$ ThCh$ ThCh$ ThCh$ ThCh$ ThCh$ Suppliers with Current Payment Amounts Up to 30 days 12,198,153 229,044,692 — 241,242,845 — 94,132,901 — 94,132,901 Entre 31 y 60 dias 436,324 9,162,556 — 9,598,880 Mas de 365 dias — 6,765 — 6,765 Total 12,634,477 238,214,013 — 250,848,490 — 94,132,901 — 94,132,901 Country As of and for the year ended 12-31-2016 Managers and Main Executives Professionals and Technicians Workers and Others Total Average for the Year Chile 25 798 34 857 910 Argentina - 26 - 26 27 Total 25 824 34 883 937 Country As of and for the year ended 12-31-2015 Managers and Main Executives Professionals and Technicians Workers and Others Total Average for the Year Chile 24 914 48 986 1,105 Argentina 6 456 70 532 531 Peru 15 245 - 260 264 Colombia 12 484 14 510 580 Total 57 2,099 132 2,288 2,480 Company Project Name Project Description Project Status [Terminated, In Process] For the year ended 12-31-2016 Total Disbursements Amounts Capitalized Expenses ThCh$ ThCh$ ThCh$ PEHUENCHE Hydro Power Plants Environmental Costs Studies, monitoring, laboratory analysis, removal and disposal of solid waste from hydropower (Hydroelectric Power Plant) In process 6,515 - 6,515 GAS ATACAMA CHILE Studies, monitoring and waste disposal Hygiene, waste treatment, management system and pest control Terminated 78,221 - 78,221 Studies, monitoring and laboratory analysis Withdrawal and final disposal of solid waste in thermal power plants In process 169,743 - 169,743 ZLD plant (studies) ZLD plant (studies) Terminated 13,470 13,470 - Coal-fired power stations Emissions Standard (Desox and Denox Tarapacá) In process 27,648,451 27,648,451 - EOLICA CANELA Environmental expenditures in power plants. Analysis and monitoring of water quality and cinnamonization In process 94,770 94,770 Enel Generación Chile S.A Environmental costs in combined cycle plants Principal incurred expenses: Bocamina U1-2: Operation and maintenance of air monitoring and meteorological stations, Environmental audit monitoring network, CEMS Annual Validation, Biomass Protocol Service, Environment Materials (magazine, books), Isocinetic Measurements , SGI Works (NC Objective, Inspections, Audits and Audit) ISO 14001, OHSAS Certification, Operation and Maintenance Service CEMS. In process 567,616 - 567,616 Environmental costs in thermal plants Studies, monitoring, laboratory analysis, withdrawal and final disposal of solid waste in hydroelectric plants (C.H.) In process 243,264 - 243,264 Environmental costs in hydroelectric plants Studies, monitoring, laboratory analysis, removal and final disposal of solid waste in thermoelectric plants (C.T.) In process 181,644 - 181,644 Ralco Hydroelectric Plant Reforestation according to Agreement with the Catholic University and Electrification of housing in Ayin Maipu In process 4,497,330 4,497,330 - Tal Tal Thermal Plant Engineering, Civil Works and Permits In process 3,173,813 3,173,813 - Total 36,674,837 35,333,064 1,341,773 Company Project Name Project Description Project Status [Terminated, In Process] For the year ended 12-31-2015 Total Disbursements Amounts Capitalized Expenses ThCh$ ThCh$ ThCh$ PEHUENCHE Hydro Power Plants Environmental Costs Studies, monitoring, laboratory analysis, removal and disposal of solid waste from hydropower (Hydroelectric Power Plant) In process 16,877 - 16,877 Investments in Central Hydroelectric Plants Regularization fuel facilities; Regularization water and sewer system; Regularization collection wells; Fabrication and installation cubits acid spill; Normalization fenced site archeology In process 361,712 361,712 - ENEL GENERACIÓN CHILE Central Environmental Costs Waste treatment, sanitation In process 2,455,575 - 2,455,575 CT Bocamina Emissions monitoring, CEMS project, NOX abatement In process 1,855 1,855 - Cems project Cems C.T. Quintero project In process 33 33 - Cems project Cems C.T. San Isidro II project In process 16 16 - Cems project Cems C.T. Tal Tal project In process 12 12 - Regularizations C.H. Regularizations C.H. In process 155,485 155,485 - Regularizations C.H. Ralco Social Afforestation Program and Restorations Palmucho Chenqueco bypass road; Bridge reconstruction Lonquimay. In process 1,051,017 61 - Compañía Eléctrica de Tarapacá S.A. Waste Studies, monitoring, laboratory analysis and waste disposal retirement Terminated 196,060 - 196,060 Waste treatment Removal of non-hazardous household and industrial waste Terminated 127,053 - 127,053 Abatement Nox (LNF burners + OFA), desulfurizer and monitoring CEMS emissions Abatement Nox (LNF burners + OFA), desulfurizer and monitoring CEMS emissions Terminated 9,624 9,624 - Afforestation (RCA) Water Eyes Afforestation (RCA) Water Eyes Terminated 27,032 27,032 - CANELA Central Environmental expenses Analysis and monitoring water quality and Sanitation Canela In process 11,376 - 11,376 Total 4,413,727 555,830 2,806,941 Company Project name Description Project status [Terminated, In process] For the year ended 12-31-2014 ThCh$ Disbursements Capitalized Expenses Future disbursements Estimated date of future disbursement Total disbursement PEHUENCHE Environmental expenses CC.HH Studies, monitoring, laboratory analysis, removal and disposal of solid waste from hydropower (Hydroelectric Power Plant) Terminated 522 - 522 - - 522 ENEL GENERACIÓN CHILE Central Environmental Costs Waste treatment, sanitation and monitoring In process 1,703,168 - 1,703,168 - - 1,703,168 CT Bocamina Emissions monitoring, CEMS project, NOX abatement In process 20,335,487 20,335,487 - - - 20,335,487 CT Los Molles Compliance DS 78 chemicals storage In process 22,069 22,069 - - - 22,069 C.T. San Isidro I Cems Project In process 55,878 55,878 - - - 55,878 C.T. San Isidro II Cems Project In process 108,973 108,973 - - - 108,973 C.T. Quintero Cems Project In process 286,750 286,750 - - - 286,750 CT Tal Tal Compliance DS 78 Health Ministry; Cems project In process 1,401,989 1,401,989 - - - 1,401,989 CELTA Thermal environmental costs Studies monit., Lab. waste analysis and disp. waste In process 184,494 - 184,494 196,060 12-31-2015 380,554 CEMS project Abatement system particulate material (baghouses / emissions monitoring) In process 10,522,046 10,522,046 - 9,624 12-31-2015 10,531,670 GASATACAMA Monitoring, MA audits, consultants, etc. RCA commitments, studies, air quality monitoring and analysis, water Terminated 162,305 - 162,305 - - 162,305 CANELA Central Environmental Costs Analysis and monitoring water quality and Sanitation Canela In process 16,079 - 16,079 - - 16,079 Total 34,799,760 32,733,192 2,066,568 205,684 - 35,005,444 As of and for the year ended 12-31-2016 Financial Statements Current Assets Non-current Assets Total Assets Current Liabilities Non-current Liabilities Equity Total Liabilities and Equity Revenues Costs Profit (loss) Other Comprehensive Income Total Comprehensive Income ThCh$ ThCh$ ThCh$ ThCh$ ThCh$ ThCh$ ThCh$ ThCh$ ThCh$ ThCh$ ThCh$ ThCh$ Empresa Eléctrica Pehuenche S.A. Separate 35,730,340 193,496,141 229,226,481 (43,012,321) (50,044,060) (136,170,100) (229,226,481) 155,568,982 (23,529,449) 88,610,786 - 88,610,786 Compañía Eléctrica Tarapacá S.A. Consolidated - - - - - - - 219,980,554 (139,960,874) 61,981,668 (924,812) 61,056,856 Group Inversiones GasAtacama Holding Ltda. Consolidated 195,487,529 662,442,813 857,930,342 (86,380,335) (89,573,087) (681,976,920) (857,930,342) 173,489,754 (87,098,923) 43,329,082 (1,779,413) 41,549,669 As of and for the year ended 12-31-2015 Financial Statements Current Assets Non-current Assets Total Assets Current Liabilities Non-current Liabilities Equity Total Liabilities and Equity Revenues Costs Profit (loss) Other Comprehensive Income Total Comprehensive Income ThCh$ ThCh$ ThCh$ ThCh$ ThCh$ ThCh$ ThCh$ ThCh$ ThCh$ ThCh$ ThCh$ ThCh$ Subsidiaries within continuing operations Empresa Eléctrica Pehuenche S.A. Separate 63,745,589 201,366,300 265,111,889 (62,820,897) (51,972,920) (150,318,072) (265,111,889) 193,189,705 (28,569,912) 118,016,421 33,526 118,049,947 Compañía Eléctrica de Tarapacá S.A. Separate 82,875,363 509,275,829 592,151,192 (115,138,485) (44,379,433) (432,633,274) (592,151,192) 230,852,534 (139,555,849) 70,262,390 (624) 70,261,766 Inversiones GasAtacama Holding Ltda. Group Consolidated 245,456,212 207,236,190 452,692,402 (24,048,629) (49,959,438) (378,684,335) (452,692,402) 183,015,183 (110,330,364) 46,215,560 (3,059,806) 43,155,754 Subsidiaries within discontinued operations Enel Argentina S.A. (formerly named Endesa Argentina S.A.) Separate 1,814,204 32,328,045 34,142,249 (616,318) - (33,525,931) (34,142,249) - - 622,972 (10,352,540) (9,729,568) Enel Generación Costanera S.A. (formerly named Central Costanera S.A.) Separate 27,559,412 142,918,106 170,477,518 (102,001,988) (53,611,202) (14,864,328) (170,477,518) 100,856,664 (4,598,130) (998,809) (4,729,767) (5,728,576) Hidroinvest S.A. Separate 575,373 11,429,899 12,005,272 (452,427) - (11,552,845) (12,005,272) - - 21,877 (3,570,020) (3,548,143) Enel Generación el Chocón S.A. (formerly named Hidroeléctrica El Chocón S.A.) Separate 44,240,854 240,460,115 284,700,969 (71,433,902) (63,908,193) (149,358,874) (284,700,969) 40,004,655 (4,574,336) 110,802,880 (44,667,506) 66,135,374 Southem Cone Power Argentina S.A. Separate 8,003 575,537 583,540 (12,826) - (570,714) (583,540) - - (7,151) (176,471) (183,622) Empresa Generadora de Energía Eléctrica S.A. Separate 172,918,511 1,803,546,987 1,976,465,498 (349,736,334) (831,187,906) (795,541,258) (1,976,465,498) 778,768,426 (321,664,855) 211,896,264 (91,252,276) 120,643,988 Generandes Perú S.A. Separate 1,945,582 225,170,087 227,115,669 (1,364,513) - (225,751,156) (227,115,669) - - 42,044,140 4,890,902 46,935,042 Enel Generación Perú S. A. (formerly named Edegel S.A.A.) Separate 111,421,412 723,995,979 835,417,391 (117,775,269) (188,814,672) (528,827,450) (835,417,391) 343,761,564 (143,234,611) 91,161,037 4,059,334 95,220,371 Chinango S.A.C. Separate 7,647,526 112,688,111 120,335,637 (8,369,365) (40,621,719) (71,344,553) (120,335,637) 39,114,967 (8,235,270) 15,210,089 (708,295) 14,501,794 Generandes Perú Group Consolidated 120,047,319 808,405,916 928,453,235 (126,541,945) (229,436,392) (572,474,899) (928,453,236) 382,452,709 (151,046,058) 95,054,809 (9,131,696) 85,923,113 Enel Argentina S.A. (formerly named Endesa Argentina S.A.) Group Consolidated 73,348,681 385,562,798 458,911,479 (173,663,474) (115,955,351) (169,292,654) (458,911,479) 140,398,933 (9,172,466) 109,347,016 (50,970,094) 58,376,922 As of and for the year ended 12-31-2014 Financial Statements Current Assets Non-current Assets Total Assets Current Liabilities Non-current Liabilities Equity Total Liabilities and Equity Revenues Costs Profit (loss) Other Comprehensive Income Total Comprehensive Income ThCh$ ThCh$ ThCh$ ThCh$ ThCh$ ThCh$ ThCh$ ThCh$ ThCh$ ThCh$ ThCh$ ThCh$ Subsidiaries within continuing operations Empresa Eléctrica Pehuenche S.A. Separate 75,414,557 209,069,274 284,483,831 59,142,217 53,952,811 171,388,803 284,483,831 227,886,302 (98,273,049) 129,613,253 (51,043) 129,562,210 Compañía Eléctrica de Tarapacá S.A. Separate 77,067,775 450,573,978 527,641,753 110,849,007 30,918,614 385,874,132 527,641,753 318,959,142 (236,099,025) 82,860,117 (604) 100,868,285 Inversiones GasAtacama Holding Ltda. Group Consolidated 197,276,197 216,893,717 414,169,914 29,892,670 48,748,663 335,528,581 414,169,914 179,474,707 (159,244,645) 20,230,062 51,288,697 71,518,759 Subsidiaries within discontinued operations Sociedad Concesionaria Túnel El Melón S.A. Separate 19,183,735 7,107,942 26,291,677 3,709,123 1,789,703 20,792,851 26,291,677 10,484,435 (4,152,625) 6,331,810 (12,156) 6,319,654 Enel Argentina S.A. (formerly named Endesa Argentina S.A.) Separate 1,924,047 42,081,267 44,005,314 749,815 - 43,255,499 44,005,314 340,599 - 340,599 (5,299,756) (4,959,157) Enel Generación Costanera S.A. (formerly named Central Costanera S.A.) Separate 31,868,372 154,649,134 186,517,506 108,956,607 56,967,994 20,592,905 186,517,506 75,204,382 (29,671,728) 45,532,654 3,989,198 49,521,852 Hidroinvest S.A. Separate 562,612 14,962,217 15,524,829 423,843 - 15,100,986 15,524,829 - - (2,811) (1,868,145) (1,870,956) Enel Generación el Chocón S.A. (formerly named Hidroeléctrica El Chocón S.A.) Separate 22,930,536 137,891,546 160,822,082 31,540,350 46,058,232 83,223,500 160,822,082 30,178,802 (19,141,980) 11,036,822 (8,763,212) 2,273,610 Southem Cone Power Argentina S.A. Separate 4,162 753,403 757,565 3,229 - 754,336 757,565 - (4,919) (4,919) (94,023) (98,942) Empresa Generadora de Energía Eléctrica S.A. Separate 329,672,209 1,782,307,979 2,111,980,188 500,414,812 883,041,284 728,524,092 2,111,980,188 753,455,621 (464,634,223) 288,821,398 (73,145,883) 215,675,515 Generandes Perú S.A. Separate 3,473,185 219,325,990 222,799,175 3,148,425 - 219,650,750 222,799,175 46,503,610 - 46,503,610 12,303,680 58,807,290 Enel Generación Perú S. A. (formerly named Edegel S.A.A.) Separate 110,164,628 720,449,664 830,614,292 85,724,692 235,667,176 509,222,424 830,614,292 319,399,578 (213,260,179) 106,139,399 23,688,400 129,827,799 Chinango S.A.C. Separate 8,439,096 111,912,667 120,351,763 7,433,439 39,382,244 73,536,080 120,351,763 34,656,130 (19,544,709) 15,011,421 3,041,428 18,052,849 Generandes Perú Group Consolidated 121,446,538 816,077,565 937,524,103 95,676,185 275,049,420 566,798,498 937,524,103 353,847,452 (242,497,338) 111,350,114 23,990,135 135,340,249 Enel Argentina S.A. (formerly named Endesa Argentina S.A.). Group Consolidated 56,074,841 297,050,238 353,125,079 140,459,888 101,749,459 110,915,732 353,125,079 105,281,293 (48,769,700) 56,511,593 (5,660,609) 50,850,984 Taxpayer ID No. (RUT) Company Functional Currency % of control as of 12-31-2016 % of control as of 12-31-2015 Relationship Country Activity Direct Indirect Total Direct Indirect Total 76.003.204-2 Central Eólica Canela S.A. Chilean peso 0.00% 75.00% 75.00% 0.00% 75.00% 75.00% Subsidiary Chile Promotion and development of renewable energy projects 96.770.940-9 Compañía Eléctrica Tarapacá S.A. (3) (4) Chilean peso n/a n/a n/a 96.21% 0.00% 96.21% Subsidiary Chile Complete electric energy cycle 96.504.980-0 Empresa Eléctrica Pehuenche S.A. Chilean peso 92.65% 0.00% 92.65% 92.65% 0.00% 92.65% Subsidiary Chile Complete electric energy cycle 96.830.980-3 GasAtacama Chile S.A. (1), (2), (3) and (4) Chilean peso 0.00% 97.37% 97.37% 0.00% 100.00% 100.00% Subsidiary Chile Management of Companies 76.676.750-8 GNL Norte S.A. (2) Chilean peso n/a n/a n/a 0.00% 100.00% 100.00% Subsidiary Chile Energy and fuel production, transportation and distribution 77.032.280-4 Gasoducto TalTal S.A. (1) Chilean peso n/a n/a n/a 0.00% 100.00% 100.00% Subsidiary Chile Natural gas transportation, sales and distribution 96.905.700-K Progas S.A. (1) Chilean peso n/a n/a n/a 0.00% 100.00% 100.00% Subsidiary Chile Natural gas acquisition, production, transportation and commercial distribution 78.932.860-9 GasAtacama S.A. (3) Chilean peso n/a n/a n/a 0.00% 100.00% 100.00% Subsidiary Chile Electric energy and natural gas exploitation, generation, transmission and distribution 76.014.570-K Inversiones GasAtacama Holding Ltda. (3) Chilean peso n/a n/a n/a 50.00% 50.00% 100.00% Subsidiary Chile Energy generation and natural gas transportation Foreign Southern Cone Power Argentina S.A. (7) Argentine peso n/a n/a n/a 98.00% 2.00% 100.00% Subsidiary Argentina Portfolio company Foreign Enel Argentina S.A. (formerly named Endesa Argentina S.A.) (6) and (7) Argentine peso 0.00% 0.34% 0.34% 99.66% 0.34% 100.00% Subsidiary Argentina Portfolio company 78.952.420-3 Gasoducto Atacama Argentina S.A. Chilean peso 0.00% 100.00% 100.00% 0.00% 100.00% 100.00% Subsidiary Chile Natural gas exploitation and transportation Foreign Enel Generación Perú S.A. (formerly named Edegel S.A.A.) (5) Peruvian sol 0.00% 0.00% 0.00% 29.40% 54.20% 83.60% Subsidiary Peru Electric energy generation, sales, and distribution Foreign Chinango S.A.C. (5) Peruvian sol 0.00% 0.00% 0.00% 0.00% 80.00% 80.00% Subsidiary Peru Electric energy generation, sales, and distribution Foreign Generandes Perú S.A. (5) Peruvian sol 0.00% 0.00% 0.00% 61.00% 0.00% 61.00% Subsidiary Peru Portfolio company Foreign Empresa Generadora de Energía Eléctrica S.A. (Emgesa S.A. E.S.P.) (5) Colombian peso 0.00% 0.00% 0.00% 56.43% 0.00% 56.43% Subsidiary Colombia Electric energy generation Foreign Emgesa Panama S.A. (5) U.S. dollar 0.00% 0.00% 0.00% 0.00% 56.43% 56.43% Subsidiary Colombia Electric energy purchases and sales Foreign Sociedad Portuaria Central Cartagena S.A. (5) Colombian peso 0.00% 0.00% 0.00% 0.00% 94.95% 94.95% Subsidiary Colombia Investment, construction and maintenance of public or private wharves and ports Foreign Enel Generación el Chocón S.A. (formerly named Hidroeléctrica El Chocón S.A.) (5) Argentine peso 0.00% 0.00% 0.00% 2.48% 65.19% 67.67% Subsidiary Argentina Electric energy production and sales Foreign Hidroinvest S.A. (5) Argentine peso 0.00% 0.00% 0.00% 41.94% 54.15% 96.09% Subsidiary Argentina Portfolio company Foreign Enel Generación Costanera S.A. (formerly named Central Costanera S.A.) (5) Argentine peso 0.00% 0.00% 0.00% 24.85% 50.82% 75.67% Subsidiary Argentina Electric energy generation and sales Foreign Ingendesa do Brasil Ltda. (5) Brazilian real 0.00% 0.00% 0.00% 1.00% 99.00% 100.00% Subsidiary Brazil Project engineering consulting Company For the year ended 12-31-2016 For the year ended 12-31-2015 % ownership interest % ownership interest Direct Indirect Total Consolidation method Direct Indirect Total Consolidation method Sociedad Concesionaria Túnel El Melón S.A. (1) - - - - 99.99% 0.91% 100.00% Full integration Gasoducto TalTal S.A. (2) 0.00% 100.00% 100.00% Full integration - - - - GNL Norte S.A. (2) 0.00% 100.00% 100.00% Full integration - - - - Progas S.A. (2) 0.00% 100.00% 100.00% Full integration - - - - GNL Quintero S.A. (3) 20.00% 0.00% 20.00% Equity method - - - - Compañía Eléctrica Tarapacá S.A. (2) 96.21% 0.00% 96.21% Full integration - - - - Inversiones GasAtacama Holding Ltda. (2) 50.00% 50.00% 100.00% Full integration - - - - GasAtacama S.A. (2) 0.00% 100.00% 100.00% Full integration - - - - Southern Cone Power Argentina S.A. (4) and (6) 98.00% 2.00% 100.00% Full integration - - - - Empresa Generadora de Energía Eléctrica S.A. (Emgesa S.A. E.S.P.) (4) 56.43% 0.00% 56.43% Full integration - - - - Emgesa Panama S.A. (4) 0.00% 56.43% 56.43% Full integration - - - - Sociedad Portuaria Central Cartagena S.A. (4) 0.00% 94.95% 94.95% Full integration - - - - Enel Generación El Chocón S.A. (formerly named Hidroeléctrica El Chocón S.A.) (4) 2.48% 65.19% 67.67% Full integration - - - - Hidroinvest S.A. (4) 41.94% 54.15% 96.09% Full integration - - - - Enel Generación Costanera S.A. (formerly named Central Costanera S.A.) (4) 24.85% 50.82% 75.67% Full integration - - - - Ingendesa do Brasil Ltda. (4) 1.00% 99.00% 100.00% Full integration - - - - Enel Generación Perú S.A. (formerly named Edegel S.A.A) (4) 29.40% 54.20% 83.60% Full integration - - - - Chinango S.A.C. (4) 0.00% 80.00% 80.00% Full integration - - - - Generandes Perú S.A. (4) 61.00% 0.00% 61.00% Full integration - - - - Distrilec Inversora S.A. (4) 0.89% 0.00% 0.89% Equity method - - - - Enel Trading Argentina S.R.L. (formerly named Endesa Cemsa S.A.) (4) 0.00% 45.00% 45.00% Equity method - - - - Enel Argentina S.A. (formerly named Endesa Argentina S.A.). (4), (5) and (6) 99.66% 0.34% 100.00% Full integration - - - - Central Térmica Manuel Belgrano 0.00% 24.18% 24.18% Equity method - - - - Central Térmica San Martin 0.00% 24.18% 24.18% Equity method - - - - Central Vuelta Obligada S.A. 0.00% 3.45% 3.45% Equity method - - - - Enel Brasil S.A. 34.64% 4.00% 38.64% Equity method - - - - Taxpayer ID No. Company Functional currency Ownership Interest as of 12-31-2016 Ownership Interest as of 12-31-2015 Relationship Country Activity (in alphabetical order) Direct Indirect Total Direct Indirect Total 76.652.400-1 Centrales Hidroeléctricas De Aysén S.A. Chilean peso 51.00% 0.00% 51.00% 51.00% 0.00% 51.00% Joint venture Chile Hydroelectric plant development and operation 77.017.930-0 Transmisora Eléctrica de Quillota Ltda. U.S. dollar 0.00% 50.00% 50.00% 0.00% 50.00% 50.00% Joint venture Chile Electric energy transportation and distribution 96.806.130-5 Electrogas S.A. U.S. dollar 42.50% 0.00% 42.50% 42.50% 0.00% 42.50% Associate Chile Portfolio company 76.418.940-K GNL Chile. S.A. U.S. dollar 33.33% 0.00% 33.33% 33.33% 0.00% 33.33% Associate Chile Promotion of liquefied natural gas supply project 76.788.080-4 GNL Quintero S.A. (1) U.S. dollar 0.00% 0.00% 0.00% 20.00% 0.00% 20.00% Associate Chile Development, design and supply of liquid natural gas degasifying terminal Foreign Distrilec Inversora S.A. (2) Argentine peso 0.00% 0.00% 0.00% 0.89% 0.00% 0.89% Associate Argentina Portfolio company Foreign Enel Trading Argentina S.R.L. (formerly named Endesa Cemsa S.A.) (2) Argentine peso 0.00% 0.00% 0.00% 0.00% 45.00% 45.00% Associate Argentina Wholesale purchase and sale of electric energy Foreign Central Térmica Manuel Belgrano (2) Argentine peso 0.00% 0.00% 0.00% 0.00% 24.18% 24.18% Associate Argentina Production and marketing of electric energy Foreign Central Térmica San Martin (2) Argentine peso 0.00% 0.00% 0.00% 0.00% 24.18% 24.18% Associate Argentina Production and marketing of electric energy Foreign Central Vuelta Obligada S.A. (2) Argentine peso 0.00% 0.00% 0.00% 0.00% 3.45% 3.45% Associate Argentina Production and marketing of electric energy Foreign Enel Brasil S.A. (2) Brazilian real 0.00% 0.00% 0.00% 34.64% 4.00% 38.64% Associate Brazil Portfolio company Foreign Enel Argentina S.A. (formerly named Endesa Argentina) (3) Argentine peso 0.00% 0.34% 0.34% 99.66% 0.34% 100.00% Associate Argentina Portfolio company Country Currency Effective Nominal Secured (Yes/No) Balance as of 12-31-2016 Balance as of 12-31-2015 One to three months Three to twelve months Total Current One to three months Three to twelve months Total Current ThCh$ ThCh$ ThCh$ ThCh$ ThCh$ ThCh$ Chile CH$ 6.00% 6.00% No 4,181 - 4,181 4 - 4 Total 4,181 - 4,181 4 - 4 Taxpayer Company Country Taxpayer Financial Institution Country Currency Effective Nominal Interest payment Balance as of 12-31-2016 Balance as of 12-31-2015 Less than Total Less than Total ThCh$ ThCh$ ThCh$ ThCh$ 91.081.000-6 Enel Generación Chile S.A. Chile 97.006.000-6 Banco de Crédito e Inversiones Chile Ch$ 6.00% 6.00% At maturity 2,048 2,048 - - 91.081.000-6 Enel Generación Chile S.A. Chile 97.036.000-k Banco Santander Chile Ch$ 6.00% 6.00% At maturity 2,133 2,133 4 4 Total ThCh$ 4,181 4,181 4 4 Country Currency Effective Nominal Secured (Yes/No) Balance as of 12-31-2016 Current Non-current One to three months Three to months Total One to two years Two to Three to Four to five More than Total ThCh$ ThCh$ ThCh$ ThCh$ ThCh$ ThCh$ ThCh$ ThCh$ ThCh$ Chile US$ 6.99% 6.90% No 7,264,786 21,794,359 29,059,145 29,059,146 29,059,146 29,059,146 29,059,146 641,348,382 757,584,966 Chile UF 6.00% 5.48% No 6,466,160 24,665,200 31,131,360 30,632,431 53,611,843 51,316,337 49,020,830 305,390,728 489,972,169 Total 13,730,946 46,459,559 60,190,505 59,691,577 82,670,989 80,375,483 78,079,976 946,739,110 1,247,557,135 Country Currency Effective Nominal Secured (Yes/No) Balance as of 12-31-2015 Current Non-current One to three months Three to months Total One to two years Two to Three to Four to five More than Total ThCh$ ThCh$ ThCh$ ThCh$ ThCh$ ThCh$ ThCh$ ThCh$ ThCh$ Chile US$ 6.99% 6.90% No 7,318,857 21,956,571 29,275,428 29,275,427 29,275,427 29,275,427 29,275,427 827,386,294 944,488,002 Chile UF 6.00% 5.48% No 7,420,915 27,355,985 34,776,900 34,213,890 33,650,880 55,868,495 53,284,158 359,246,902 536,264,325 Total 14,739,772 49,312,556 64,052,328 63,489,317 62,926,307 85,143,922 82,559,585 1,186,633,196 1,480,752,327 Taxpayer ID No. (RUT) Company Country Taxpayer ID No. (RUT) Company Country Currency Effective Interest Rate Nominal Interest Rate Secured (Yes/ No) Balance as of 12-31-2016 Current Non-current Less than More than Total One to Two to Three to Four to More than Total ThCh$ ThCh$ ThCh$ ThCh$ ThCh$ ThCh$ ThCh$ ThCh$ ThCh$ 91.081.000-6 Enel Generación Chile S.A. Chile Foreign BNY Mellon S-1 US US$ 7.96% 7.88% No 2,832,647 8,497,942 11,330,589 11,330,590 11,330,590 11,330,590 11,330,590 196,227,387 241,549,747 91.081.000-6 Enel Generación Chile S.A. Chile Foreign BNY Mellon S-2 US US$ 7.40% 7.33% No 903,234 2,709,703 3,612,937 3,612,937 3,612,937 3,612,937 3,612,937 93,701,216 108,152,964 91.081.000-6 Enel Generación Chile S.A. Chile Foreign BNY Mellon S-3 US US$ 8.26% 8.13% No 574,765 1,724,294 2,299,059 2,299,059 2,299,059 2,299,059 2,299,059 56,341,806 65,538,042 91.081.000-6 Enel Generación Chile S.A. Chile Foreign BNY Mellon 24296 US US$ 4.32% 4.25% No 2,954,140 8,862,420 11,816,560 11,816,560 11,816,560 11,816,560 11,816,560 295,077,973 342,344,213 91.081.000-6 Enel Generación Chile S.A. Chile 97.036.000-k Banco Santander 317-H Chile U.F. 7.17% 6.20% No 1,525,571 9,843,433 11,369,004 10,870,075 10,371,146 9,872,218 9,373,289 52,887,199 93,373,927 91.081.000-6 Enel Generación Chile S.A. Chile 97.036.000-k Banco Santander 522-M Chile U.F. 4.82% 4.75% No 4,940,589 14,821,767 19,762,356 19,762,356 43,240,697 41,444,119 39,647,541 252,503,529 396,598,242 Total 13,730,946 46,459,559 60,190,505 59,691,577 82,670,989 80,375,483 78,079,976 946,739,110 1,247,557,135 Taxpayer ID No. (RUT) Company Country Taxpayer ID No. (RUT) Company Country Currency Effective Interest Rate Nominal Interest Rate Secured (Yes/ No) Balance as of 12-31-2015 Current Non-current Less than More than Total One to Two to Three to Four to More than Total ThCh$ ThCh$ ThCh$ ThCh$ ThCh$ ThCh$ ThCh$ ThCh$ ThCh$ 91.081.000-6 Enel Generación Chile S.A. Chile Foreign BNY Mellon S-1 US US$ 7.96% 7.88% No 2,879,332 8,637,995 11,517,327 11,517,326 11,517,326 11,517,326 11,517,326 217,149,037 263,218,341 91.081.000-6 Enel Generación Chile S.A. Chile Foreign BNY Mellon S-2 US US$ 7.40% 7.33% No 919,193 2,757,578 3,676,771 3,676,770 3,676,770 3,676,770 3,676,770 90,711,728 105,418,808 91.081.000-6 Enel Generación Chile S.A. Chile Foreign BNY Mellon S-3 US US$ 8.26% 8.13% No 584,223 1,752,670 2,336,893 2,336,894 2,336,894 2,336,894 2,336,894 196,474,523 205,822,099 91.081.000-6 Enel Generación Chile S.A. Chile Foreign BNY Mellon 24296 US US$ 4.32% 4.25% No 2,936,109 8,808,328 11,744,437 11,744,437 11,744,437 11,744,437 11,744,437 323,051,006 370,028,754 91.081.000-6 Enel Generación Chile S.A. Chile 97.036.000-k Banco Santander 317-H Chile U.F. 7.17% 6.20% No 1,862,265 10,680,034 12,542,299 11,979,289 11,416,279 10,853,268 10,290,258 63,261,536 107,800,630 91.081.000-6 Enel Generación Chile S.A. Chile 97.036.000-k Banco Santander 522-M Chile U.F. 4.82% 4.75% No 5,558,650 16,675,951 22,234,601 22,234,601 22,234,601 45,015,227 42,993,900 295,985,366 428,463,695 Total 14,739,772 49,312,556 64,052,328 63,489,317 62,926,307 85,143,922 82,559,585 1,186,633,196 1,480,752,327 Taxpayer ID No. (RUT) Company Country Taxpayer ID No. (RUT) Name Country Currency Nominal Interest Rate Balance as of December 31, 2016 Current Non-current Less than More than Total One to Two to Three to Four to More than Total ThCh$ ThCh$ ThCh$ ThCh$ ThCh$ ThCh$ ThCh$ ThCh$ ThCh$ 91.081.000-6 Enel Generación Chile S.A. Chile 76.555.400-4 Transelec S.A Chile US$ 6.50% 734,006 2,200,827 2,934,833 2,931,533 2,928,019 2,924,276 2,920,289 7,777,314 19,481,431 Total 734,006 2,200,827 2,934,833 2,931,533 2,928,019 2,924,276 2,920,289 7,777,314 19,481,431 Taxpayer ID No. (RUT) Company Country Taxpayer ID No. (RUT) Name Country Currency Nominal Interest Rate Balance as of December 31, 2015 Current Non-current Less than More than Total One to Two to Three to Four to More than Total ThCh$ ThCh$ ThCh$ ThCh$ ThCh$ ThCh$ ThCh$ ThCh$ ThCh$ 91.081.000-6 Enel Generación Chile S.A. Chile 76.555.400-4 Transelec S.A Chile US$ 6.50% 732,936 2,203,853 2,936,789 2,950,745 2,965,609 2,981,438 2,998,297 11,193,448 23,089,537 Total 732,936 2,203,853 2,936,789 2,950,745 2,965,609 2,981,438 2,998,297 11,193,448 23,089,537 ASSETS Foreign Currency Functional Currency Balance as of 12-31-2016 12-31-2015 ThCh$ ThCh$ CURRENT ASSETS Cash and cash equivalents 9,448,384 9,800,146 U.S. dollars Chilean peso 4,640,978 4,268,962 Argentine peso Chilean peso 4,807,406 5,531,184 Trade receivables due from related parties 50,976,270 64,125,614 U.S. dollars Chilean peso 50,976,270 64,125,614 Current accounts receivable from related parties 16,780,275 17,068,654 U.S. dollars Chilean peso 16,780,275 17,068,654 TOTAL CURRENT ASSETS 77,204,929 90,994,414 TOTAL ASSETS 77,204,929 90,994,414 Foreign Functional Balance as of 12-31-2015 Current Non-current One to Three to Total One to Two to Three to Four to More than Total Non- current ThCh$ ThCh$ ThCh$ ThCh$ ThCh$ ThCh$ ThCh$ ThCh$ ThCh$ Other financial liabilities U.S. dollars 7,998,792 23,995,186 31,993,978 31,990,679 31,987,165 31,983,422 31,979,435 649,125,696 777,066,397 U.S. dollars Chilean peso 7,998,792 23,995,186 31,993,978 31,990,679 31,987,165 31,983,422 31,979,435 649,125,696 777,066,397 TOTAL LIABILITIES 7,998,792 23,995,186 31,993,978 31,990,679 31,987,165 31,983,422 31,979,435 649,125,696 777,066,397 Foreign Functional Balance as of 12-31-2016 Current Non-current One to Three to Total One to Two to Three to Four to More than Total Non- current ThCh$ ThCh$ ThCh$ ThCh$ ThCh$ ThCh$ ThCh$ ThCh$ ThCh$ Other financial liabilities U.S. dollars 8,051,793 24,160,424 32,212,217 32,226,172 32,241,036 32,256,865 32,273,724 838,579,742 967,577,539 U.S. dollars Chilean peso 8,051,793 24,160,424 32,212,217 32,226,172 32,241,036 32,256,865 32,273,724 838,579,742 967,577,539 TOTAL LIABILITIES 8,051,793 24,160,424 32,212,217 32,226,172 32,241,036 32,256,865 32,273,724 838,579,742 967,577,539 Trade and Other Receivables Balance as of 12-31-2016 On demand 1-30 days 31-60 days 61-90 days 91-120 days 121-150 days 151-180 days 181-210 days 211-250 days More than Total Current Total Non- ThCh$ ThCh$ ThCh$ ThCh$ ThCh$ ThCh$ ThCh$ ThCh$ ThCh$ ThCh$ ThCh$ ThCh$ Trade receivables, gross 179,498,352 2,770,582 1,165,177 773,502 900,093 5,101,117 13,609 553,986 3,593,733 20,108,963 214,479,114 5,751,510 Allowance for doubtful accounts - - - - - - - - - (1,314,311) (1,314,311) - Other receivables, gross 47,275,283 - - - - - - - - - 47,275,283 1,036,927 Total 226,773,635 2,770,582 1,165,177 773,502 900,093 5,101,117 13,609 553,986 3,593,733 18,794,652 260,440,086 6,788,437 Trade and Other Receivables Balance as of 12-31-2015 On demand 1-30 days 31-60 days 61-90 days 91-120 days 121-150 days 151-180 days 181-210 days 211-250 days More than Total Current Total Non- ThCh$ ThCh$ ThCh$ ThCh$ ThCh$ ThCh$ ThCh$ ThCh$ ThCh$ ThCh$ ThCh$ ThCh$ Trade receivables, gross 204,629,475 1,110,952 199 11,659 175 345 2 12 36,166 65,994,520 271,783,505 35,901 Allowance for doubtful accounts (55,494) - - - - - - - - (1,493,698) (1,549,192) - Other receivables, gross 93,240,964 - - - - - - - - - 93,240,964 - Total 297,814,945 1,110,952 199 11,659 175 345 2 12 36,166 64,500,822 363,475,277 35,901 Aging (original maturity) of balances of trade receivables Non-renegotiated portfolio as of 12-31-2016 Non-renegotiated portfolio as of 12-31-2015 Number of customers Gross value Number of customers Gross value ThCh$ ThCh$ On demand and non-current 402 185,249,862 355 204,665,376 1 to 30 days 91 2,770,582 161 1,110,952 31 to 60 days 62 1,165,177 18 199 61 to 90 days 55 773,502 6 11,659 91 to 120 days 41 900,093 43 175 121 to 150 days 85 5,101,117 35 345 151 to 180 days 87 13,609 2 2 181 to 210 days 29 553,986 3 12 211 to 250 days 26 3,593,733 120 36,166 More than 251 days 80 20,108,963 20 65,994,520 Total 958 220,230,624 763 271,819,406 Provisions and Write-offs For the years ended 12-31-2016 12-31-2015 12-31-2014 ThCh$ ThCh$ ThCh$ Provision (recovery of provision) for non-renegotiated portfolio - 371,558 (120,491) Write-offs during the period - - - Total - 371,558 (120,491) Number and Value of Operations For the years ended 12-31-2016 12-31-2015 12-31-2014 Last quarter Year Last quarter Year Last quarter Year Impairment provision and recoveries Number of operations - - 12 12 181 181 Value of operations, in ThCh$ - - 371,558 371,558 (120,491) (120,491) Trade Receivables Balance as of 12-31-2016 On demand 1-30 days 31-60 days 61-90 days 91-120 days 121-150 days 151-180 days 181-210 days 211-250 days 251-365 days More than 365 days Total Current Total Non-current ThCh$ ThCh$ ThCh$ ThCh$ ThCh$ ThCh$ ThCh$ ThCh$ ThCh$ ThCh$ ThCh$ ThCh$ ThCh$ Generation and transmission receivables 179,498,352 2,770,582 1,165,177 773,502 900,093 5,101,117 13,609 553,986 3,593,733 9,600,267 10,508,696 214,479,114 5,751,510 -Large customers 179,482,500 2,770,582 1,165,177 773,502 900,093 5,101,117 13,609 553,986 3,593,733 9,600,267 10,508,696 214,463,262 5,723,943 -Others 15,852 - - - - - - - - - - 15,852 27,567 Allowance for doubtful Accounts - - - - - - - - - (1,314,311) - (1,314,311) - Unbilled services 125,367,509 - - - - - - - - - - 125,367,509 3,308,454 Billed services 54,130,843 2,770,582 1,165,177 773,502 900,093 5,101,117 13,609 553,986 3,593,733 9,600,267 10,508,696 89,111,605 2,443,056 Total trade receivables, gross 179,498,352 2,770,582 1,165,177 773,502 900,093 5,101,117 13,609 553,986 3,593,733 9,600,267 10,508,696 214,479,114 5,751,510 Total allowance for doubtful accounts - - - - - - - - - (1,314,311) - (1,314,311) - Total trade receivables, net 179,498,352 2,770,582 1,165,177 773,502 900,093 5,101,117 13,609 553,986 3,593,733 8,285,956 10,508,696 213,164,803 5,751,510 Trade Receivables Balance as of 12-31-2015 On demand 1-30 days 31-60 days 61-90 days 91-120 days 121-150 days 151-180 days 181-210 days 211-250 days 251-365 days More than 365 days Total Current Total Non-current ThCh$ ThCh$ ThCh$ ThCh$ ThCh$ ThCh$ ThCh$ ThCh$ ThCh$ ThCh$ ThCh$ ThCh$ ThCh$ Generation and transmission receivables 204,629,475 1,110,952 199 11,659 175 345 2 12 36,166 65,994,520 - 271,783,505 35,901 -Large customers 204,609,906 1,110,952 199 11,659 175 345 2 12 36,166 65,994,520 - 271,763,936 - -Others 19,569 - - - - - - - - - - 19,569 35,901 Allowance for doubtful accounts (55,494) - - - - - - - - (1,493,698) - (1,549,192) - Unbilled services 169,489,606 - - - - - - - - 390,612 - 169,880,218 - Billed services 99,265,483 1,110,952 199 11,659 175 345 2 12 36,166 1,478,294 - 101,903,287 35,901 Total trade receivables, gross 204,629,475 1,110,952 199 11,659 175 345 2 12 36,166 65,994,520 - 271,783,505 35,901 Total allowance for doubtful accounts (55,494) - - - - - - - - (1,493,698) - (1,549,192) - Total trade receivables, net 204,573,981 1,110,952 199 11,659 175 345 2 12 36,166 64,500,822 - 270,234,313 35,901 Portfolio type Balance as of 12-31-2016 On demand 1-30 days 31-60 days 61-90 days 91-120 days 121-150 days 151-180 days 181-210 days 211-250 days 251-365 days More than 365 days Total Current Total Non-current ThCh$ ThCh$ ThCh$ ThCh$ ThCh$ ThCh$ ThCh$ ThCh$ ThCh$ ThCh$ ThCh$ ThCh$ ThCh$ Generation and transmission 179,498,352 2,770,582 1,165,177 773,502 900,093 5,101,117 13,609 553,986 3,593,733 9,600,267 10,508,696 214,479,114 5,751,510 -Large customers 179,482,500 2,770,582 1,165,177 773,502 900,093 5,101,117 13,609 553,986 3,593,733 9,600,267 10,508,696 214,463,262 5,723,943 -Others 15,852 - - - - - - - - - - 15,852 27,567 Total gross portfolio 179,498,352 2,770,582 1,165,177 773,502 900,093 5,101,117 13,609 553,986 3,593,733 9,600,267 10,508,696 214,479,114 5,751,510 Portfolio type Balance as of 12-31-2015 On demand 1-30 days 31-60 days 61-90 days 91-120 days 121-150 days 151-180 days 181-210 days 211-250 days 251-365 days More than 365 days Total Current Total Non-current ThCh$ ThCh$ ThCh$ ThCh$ ThCh$ ThCh$ ThCh$ ThCh$ ThCh$ ThCh$ ThCh$ ThCh$ ThCh$ Generation and transmission 204,629,475 1,110,952 199 11,659 175 345 2 12 36,166 65,994,520 - 271,783,505 35,901 -Large customers 204,609,906 1,110,952 199 11,659 175 345 2 12 36,166 65,994,520 - 271,763,936 - -Others 19,569 - - - - - - - - - - 19,569 35,901 Total gross portfolio 204,629,475 1,110,952 199 11,659 175 345 2 12 36,166 65,994,520 - 271,783,505 35,901 Balance as of 12-31-2016 Chile Total STATEMEMENT OF FINANCIAL POSITION Energy Tolls Energy Tolls ThCh$ ThCh$ ThCh$ ThCh$ Current accounts receivable from related parties 29,836,181 5,522,921 29,836,181 5,522,921 Trade and other current receivables 111,304,041 19,109,490 111,304,041 19,109,490 Total Estimated Assets 141,140,222 24,632,411 141,140,222 24,632,411 Trade and other current payables to related parties 17,499,611 191,657 17,499,611 191,657 Trade and other current payables 20,844,033 37,425,664 20,844,033 37,425,664 Total Estimated Liabilities 38,343,644 37,617,321 38,343,644 37,617,321 Balance as of 12-31-2015 Colombia Peru Argentina Chile Total STATEMEMENT OF FINANCIAL POSITION Energy Tolls Energy Tolls Energy Tolls Energy Tolls Energy Tolls ThCh$ ThCh$ ThCh$ ThCh$ ThCh$ ThCh$ ThCh$ ThCh$ ThCh$ ThCh$ Current accounts receivable from related parties - - - - - - 34,406,648 5,631,953 34,406,648 5,631,953 Trade and other current receivables - - - - - - 123,429,202 28,572,415 123,429,202 28,572,415 Discontinued operations 50,383,731 - 28,793,710 6,819,173 3,800,557 114,662 - - 82,977,998 6,933,835 Total Estimated Assets 50,383,731 - 28,793,710 6,819,173 3,800,557 114,662 157,835,850 34,204,368 240,813,848 41,138,203 Trade and other current payables to related parties - - - - - - 3,685,869 5,400,614 3,685,869 5,400,614 Trade and other current payables - - - - - - 24,944,506 37,803,719 24,944,506 37,803,719 Discontinued operations - 5,255,942 1,176,124 3,590,591 4,875,237 148,113 - - 6,051,361 8,994,646 Total Estimated Liabilities - 5,255,942 1,176,124 3,590,591 4,875,237 148,113 28,630,375 43,204,333 34,681,736 52,198,979 Chile For the year ended 12-31-2016 For the year ended 12-31-2015 For the year ended 12-31-2014 STATEMENT OF INCOME Energy Tolls Energy Tolls Energy Tolls ThCh$ ThCh$ ThCh$ ThCh$ ThCh$ ThCh$ Energy Sales 141,140,222.0 24,632,411.0 131,440,713 23,919,361 121,647,612 626,278 Energy Purchases 38,343,644.0 37,687,588.0 28,630,375 43,204,333 26,351,205 15,957,699 Suppliers Balance as of 12-31-2016 12-31-2015 Goods Services Other Total Goods Services Other Total ThCh$ ThCh$ ThCh$ ThCh$ ThCh$ ThCh$ ThCh$ ThCh$ Suppliers with Current Payment Amounts Up to 30 days - 90,386,018 - 90,386,018 - 122,490,300 - 122,490,300 From 31 to 60 days - - - - - 14,290,685 - 14,290,685 Total - 90,386,018 - 90,386,018 - 136,780,985 - 136,780,985 | |||||||||||||||||||||||||||||||||||||||||||||||||||||||||||||||||||||||||||||||||||||||||||||||||||||||||||||||||||||||||||||||||||||||||||||||||||||||||||||||||||||||||||||||||||||||||||||||||||||||||||||||||||||||||||||||||||||||||||||||||||||||||||||||||||||||||||||||||||||||||||||||||||||||||||||||||||||||||||||||||||||||||||||||||||||||||||||||||||||||||||||||||||||||||||||||||||||||||||||||||||||||||||||||||||||||||||||||||||||||||||||||||||||||||||||||||||||||||||||||||||||||||||||||||||||||||||||||||||||||||||||||||||||||||||||||||||||||||||||||||||||||||||||||||||||||||||||||||||||||||||||||||||||||||||||||||||||||||||||||||||||||||||||||||||||||||||||||||||||||||||||||||||||||||||||||||||||||||||||||||||||||||||||||||||||||||||||||||||||||||||||||||||||||||||||||||||||||||||||||||||||||||||||||||||||||||||||||||||||||||||||||||||||||||||||||||||||||||||||||||||||||||||||||||||||||||||||||||||||||||||||||||||||||||||||||||||||||||||||||||||||||||||||||||||||||||||||||||||||||