Table of Contents
UNITED STATES
SECURITIES AND EXCHANGE COMMISSION
WASHINGTON, D.C. 20549
FORM 20-F
☐o
| REGISTRATION STATEMENT PURSUANT TO SECTION 12(b) OR 12(g) OF THE SECURITIES EXCHANGE ACT OF 1934 |
OR
☒
|
|
OR |
|
|
x | ANNUAL REPORT PURSUANT TO SECTION 13 OR 15(d) OF THE SECURITIES EXCHANGE ACT OF 1934
For the fiscal year ended December 31, 2018 |
For the fiscal year ended December 31, 2016
OR
☐
|
|
OR |
|
|
o | TRANSITION REPORT PURSUANT TO SECTION 13 OR 15(d) OF THE SECURITIES EXCHANGE ACT OF 1934 |
For the transition period from to
OR
☐
|
|
For the transition period from to |
|
|
OR |
|
|
o | SHELL COMPANY REPORT PURSUANT TO SECTION 13 OR 15(d) OF THE SECURITIES EXCHANGE ACT OF 1934 |
Date of event requiring this shell company report, . . . . . . . . . . . . . . . . . . .
Commission file number: 001-37723
ENEL CHILE S.A.
(Exact name of Registrant as specified in its charter)
ENEL CHILE S.A.
(Translation of Registrant’s name into English)
CHILE
(Jurisdiction of incorporation or organization)
Santa Rosa 76, Santiago, Chile
(Address of principal executive offices)
Nicolás Billikopf, phone: (56-2) 2353-4628, nicolas.billikopf@enel.com, Santa Rosa 76, Piso 15, Santiago, Chile
ENEL CHILE S.A. |
(Exact name of Registrant as specified in its charter) |
| | |
| ENEL CHILE S.A. | |
| (Translation of Registrant’s name into English) | |
| | |
| CHILE | |
| (Jurisdiction of incorporation or organization) | |
| | |
| Santa Rosa 76, Santiago, Chile | |
| (Address of principal executive offices) | |
| | |
| Nicolás Billikopf, phone: (56-2) 2353-4628, nicolas.billikopf@enel.com, Santa Rosa 76, Piso 15, Santiago, Chile | |
| (Name, Telephone, E-mail and/or Facsimile number and Address of Company Contact Person) | |
| | |
Securities registered or to be registered pursuant to Section 12(b) of the Act:
Title of Each Class each class | | Name of Each Exchangeeach exchange on Which Registeredwhich registered |
American Depositary Shares Representing Common Stock | | New York Stock Exchange
|
Common Stock, no par value *
| | New York Stock Exchange |
*Listed, not for trading, but only in connection with the registration of American Depositary Shares, pursuant to the requirements of the Securities and Exchange Commission. | Listed, not for trading, but only in connection with the registration of American Depositary Shares, pursuant to the requirements of the Securities and Exchange Commission.
|
Securities registered or to be registered pursuant to Section 12(g) of the Act: None
Table of Contents
Securities for which there is a reporting obligation pursuant to Section 15(d) of the Act: None
Indicate by check mark if the registrant is a well-known seasoned issuer, as defined in Rule 405 of the Securities Act.
☒x Yes ☐o No
If this report is an annual or transition report, indicate by check mark if the registrant is not required to file reports pursuant to Section 13 or 15(d) of the Securities Exchange Act of 1934.
☐o Yes ☒x No
Indicate by check mark whether the registrant (1) has filed all reports required to be filed by Section 13 or 15(d) of the Securities Exchange Act of 1934 during the preceding 12 months (or for such shorter period that the registrant was required to file such reports), and (2) has been subject to such filing requirements for the past 90 days.
☐x Yes ☒o No
Indicate by check mark whether the registrant has submitted electronically and posted on its corporate Web site, if any, every Interactive Data File required to be submitted and posted pursuant to Rule 405 of Regulation S-T (§232.405 of this chapter) during the preceding 12 months (or for such shorter period that the registrant was required to submit and post such files).
☐x Yes ☐o No
Indicate by check mark whether the registrant is a large accelerated filer, an accelerated filer, a non-accelerated filer, or an emerging growth company. See the definitions of “large accelerated filer,” “accelerated filer,” and “emerging growth company” in Rule 12b-2 of the Exchange Act.
Large accelerated filer ☐x | | Accelerated filer ☐o | | Non-accelerated filer ☒o | | Emerging growth company ☐o |
If an emerging growth company that prepares its financial statements in accordance with U.S. GAAP, indicate by check mark if the registrant has elected not to use the extended transition period for complying with any new or revised financial accounting standards † provided pursuant to Section 13(a) of the Exchange Act. ☐o
†The term “new or revised financial accounting standard” refers to any update issued by the Financial Accounting Standards Board to its Accounting Standards Codification after April 5, 2012.
Indicate by check mark which basis of accounting the registrant has used to prepare the financial statements included in this filing:
U.S. GAAP ☐o | | International Financial Reporting Standards as issued
by the International Accounting Standards Board ☒x
| | Other ☐o |
If “Other” has been checked in response to the previous question, indicate by check mark which financial statement item the registrant has elected to follow.
☐o Item 17 ☐o Item 18
If this is an annual report, indicate by check mark whether the registrant is a shell company (as defined in Rule 12b-2 of the Exchange Act).
☐o Yes ☒x No
Indicate the number of outstanding shares of each of the issuer’s classes of capital or common stock as of the close of the period covered by the annual report
Shares of Common Stock: 49,092,772,762
Table of Contents
Enel Chile’s Organizational Chart(1)
As of December 31, 2018

(1) Only principal operating consolidated entities are presented here. The percentage listed in the box for each of Enel Chile’s consolidated subsidiaries represents its economic interest in such consolidated subsidiary.
(2) Excluding treasury stock.
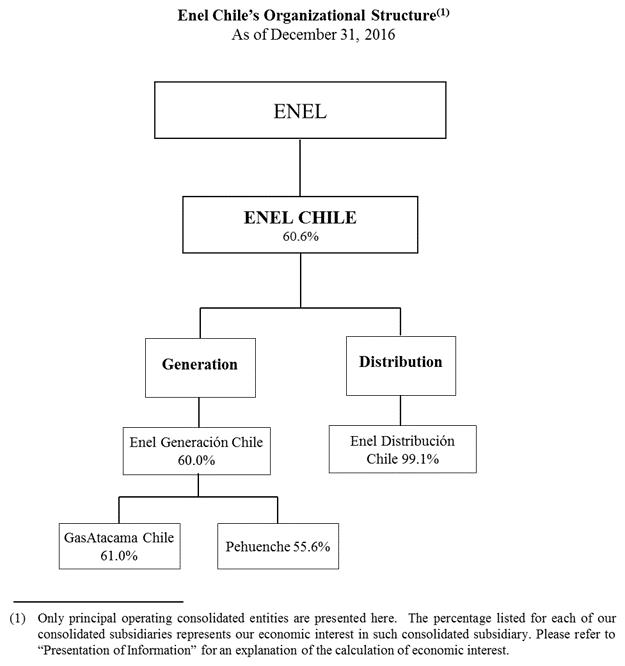
TABLE OF CONTENTS
GLOSSARYGLOSSARY
AFP |
| Administradora de Fondos de Pensiones | | A legal entity that manages aone of the private sector Chilean pension fund.funds in a fully funded capitalization system implemented in 1980. |
| | | | |
CDEC |
| Centro de Despacho Económico de Carga | | AutonomousThe autonomous entity in two Chilean electric systems in charge of coordinating the efficient operation and dispatch of generation units to satisfy demand.demand in the SIC and SING that was replaced by the CEN in November 2017.
|
| | | | |
Celta |
| Compañía Eléctrica Tarapacá S.A. | | Celta was a former Chilean generation subsidiary of Enel Generación Chile that operatesoperated plants in the SING and the SIC. Celta merged into GasAtacama Chile in November 2016.2016. |
|
|
| | |
CEN |
| Coordinador Eléctrico Nacional | | An autonomous entity in charge of coordinating the efficient operation of the SEN, dispatching generation units to satisfy demand and known as the National Electricity Coordinator. It replaced the CDEC for both the SIC and SING in November 2017. |
| | | | |
Chilean Stock Exchanges |
| Chilean Stock Exchanges | | The threetwo principal stock exchanges located in Chile: the Santiago Stock Exchange the Electronic Stock Exchange and the ValparaísoElectronic Stock Exchange. |
|
|
| | |
CNE
|
|
| | |
CMF | | Comisión para el Mercado Financiero | | Chilean Financial Market Commission, the governmental authority that supervises the financial markets. Formerly known as the Chilean Superintendence of Securities and Insurance, or SVS in its Spanish acronym. |
|
|
| | |
CNE |
| Comisión Nacional de Energía | | Chilean National Energy Commission, governmental entity with responsibilities under the Chilean regulatory framework. |
| | | | |
DCV |
| Depósito Central de Valores S.A. | | Chilean Central Securities Depositary. |
| | | | |
EnelEGP Chile
| | Enel S.p.A.Green Power Chile Ltda. | | An Italian energyA Chilean limited liability company, with multinationalnon-conventional renewable electricity generation operations in the power and, gas markets. A 60.6% beneficial owner of us and our ultimate parent company.since April 2, 2018, a consolidated subsidiary.
|
| | | | |
Enel AméricasEGPL
|
| Enel Green Power Latin Américasrica S.A. | | A relatedChilean closely held limited liability stock corporation that merged with us on April 2, 2018. As a result, we now consolidate EGP Chile. |
| | | | |
Enel Américas |
| Enel Américas S.A. | | An affiliated Chilean publicly held limited liability stock corporation incorporated under the laws of the Republic ofheadquartered in Chile, with subsidiaries engaged primarily in the generation, transmission and distribution of electricity in Argentina, Brazil, Colombia, and Peru. Formerly known on an interim basis as Enersis Américas S.A. Peru, and prior to that as Enersis S.A.which is controlled by Enel. |
| | | | |
Enel Chile |
| Enel Chile S.A. | | Enel Chile S.A.
| | Our company, a Chilean publicly held limited liability stock corporation, incorporated under the laws of the Republic of Chile, with subsidiaries engaged primarily in the generation and distribution of electricity in Chile. Registrant of this Report. Formerly known on an interim basis as Enersis Chile S.A. |
Enel Distribution |
| Enel Distribución Chile S.A. | | A publicly held limited liability stock corporation and our electricity distribution subsidiary operating in the Santiago Metropolitan Region. Formerly known as Chilectra S.A. |
| | | | |
Enel DistribucióGeneration |
| Enel Generación Chile S.A. | | Enel Distribución Chile S.A.
| | A publicly held limited liability stock corporation incorporated under the laws of the Republic of Chile and our electricity distribution company subsidiary operating in the Santiago metropolitan area. Formerly known on an interim basis as Chilectra Chile S.A. and prior to that as Chilectra S.A. |
| | | | |
Enel Generación Chile
| | Enel Generación Chile S.A.
| | A publicly held limited liability stock corporation incorporated under the laws of the Republic of Chile and our electricity generation subsidiary in Chile. Formerly known as Empresa Nacional de Electricidad S.A. or Endesa Chile.
|
| | | | |
Enel IberoaméricaX Chile | | Enel Iberoamérica, S.R.L.X Chile SpA | | A wholly-owned subsidiary of EnelChilean closely held limited liability stock corporation and our direct 60.6% owner. wholly-owned subsidiary. |
| | | | |
ESMGasAtacama
| | Extraordinary Shareholders’ MeetingGasAtacama Chile S.A.
| | Extraordinary Shareholders’ Meeting.An affiliated Chilean closely held limited liability stock corporation engaged in gas transportation and electricity generation in northern Chile. A subsidiary of Enel Generation.
|
| | | | |
GasAtacama ChileHolding |
| Inversiones GasAtacama Holding Ltda. | | GasAtacama Chile S.A.
| | Company engaged in gas transportation and electricity generation in northern Chile that also operates plants in the SIC after the merger with Celta in November 2016. A holding company subsidiary of Enel Generación Chile.Generation, which previously held GasAtacama. GasAtacama Holding merged into Celta during 2016, which later merged into GasAtacama.
|
| | | | |
GasAtacama HoldingGener
|
| Inversiones GasAtacama Holding Ltda.AES Gener S.A.
| | A holdingChilean generation company subsidiaryand one of Enel Generación Chile, which previously held GasAtacama Chile. GasAtacama Holding merged into Celta during 2016, which later merged into GasAtacamaour competitors in Chile. |
| | | | |
GenerGNL Quintero
|
| GNL Quintero S.A. | | AES Gener S.A.
| | Chilean generationA company and one of our competitors in Chile.
|
| | | | |
GNL Quintero
| | GNL Quintero S.A.
| | Company created to develop, build, finance, own and operate a LNG regasification facility at Quintero Bay (Chile) at which LNG is unloaded, stored and regasified. Enel Generación ChileGeneration sold its 20% stake in this company to EnagásEnagas Chile S.p.A., an unaffiliated company, in September 2016.
|
| | | | |
IFRSHidroAysén
|
| Centrales Hidroeléctricas de Aysén S.A. | | A company created to develop a hydroelectric project in the Aysén region, southern Chile. Enel Generation owned 51% of HidroAysén and Colbún, an unaffiliated company, owned the remaining 49%. The company terminated its activities in 2017. |
|
|
| | |
IFRS |
| International Financial Reporting Standards | | International Financial Reporting Standards as issued by the International Accounting Standards Board (IASB). |
| | | | |
LNG |
| Liquefied Natural Gas. | | Liquefied natural gas. |
| | | | |
NCRE |
| Non-Conventional Renewable Energy | | Energy sources whichthat are continuously replenished by natural processes, such as wind, biomass, mini-hydro, geothermal, wave, solar or tidal energy. |
| | | | |
NISOSM
|
| Ordinary Shareholders’ Meeting | | Sistema Interconectado Nacional
| | Chilean national interconnected electric system.Ordinary Shareholders’ Meeting.
|
| | | | |
OSMPehuenche
|
| Ordinary Shareholders’ Meeting
| | Ordinary Shareholders’ Meeting.
|
| | | | |
Pehuenche
| | Empresa Eléctrica Pehuenche S.A. | | A Chilean publicly held limited liability Chileanstock corporation engaged in the electricity stock corporation,generation business, owner of three power stations in the Maule River basin and a subsidiary of Enel Generación Chile.Generation. |
| | | | |
SEF |
| Superintendencia de Electricidad y Combustible | | Chilean Superintendence of Electricity and Fuels, the governmental authority that supervises the Chilean electricity industry. |
SEN |
| Sistema Eléctrico Nacional | | The National Electricity System is the Chilean national interconnected electricity system formed in November 2017 through the integration of the SIC and SING. |
| | | | |
SIC |
| Sistema Interconectado Central | | Chilean central interconnected electricelectricity system covering all of Chile exceptthat was integrated with the north andSING in November 2017 to form a single interconnected system, the extreme south.SEN. |
| | | | |
SING |
| Sistema Interconectado del Norte Grande | | Chilean interconnected electric system operating in northern Chile.Chile that was integrated with the SIC in November 2017 to form a single interconnected system, the SEN. |
| | | | |
SVSUF
|
| Superintendencia de Valores y Seguros
| | Chilean Superintendence of Securities and Insurance, the governmental authority that supervises public companies, securities and the insurance business.
|
| | | | |
UF
| | Unidad de Fomento | | Chilean inflation-indexed, Chilean peso-denominated monetary unit, equivalent to Ch$ 26,347.9827,565.79 as of December 31, 2016.2018. |
| | | | |
UTA |
| Unidad Tributaria Anual | | Unidad Tributaria Anual
| | Chilean annual tax unit. One UTA equals 12 Unidad Tributaria MensualUnidades Tributarias Mensuales (“UTM”), a Chilean inflation-indexed monthly tax unit used to define fines, among other purposes. As ofFor December 31, 2016,2018, one UTM was equivalent to Ch$ 46,18348,353 and one UTA was equivalent to Ch$ 554,196.580,236. |
| | | | |
VAD |
| Valor Agregado de Distribución | | Value added from distribution of electricity. |
INTRODUCTION
INTRODUCTION
As used in this Report on Form 20-F (“Report”), first person personal pronouns such as “we”, “us” or “our”, as well as “Enel Chile” or the “Company”, refer to Enel Chile S.A. and our consolidated subsidiaries unless the context indicates otherwise. Unless otherwise noted, our interest in our principal subsidiaries, and jointly-controlled companies and associates is expressed in terms of our economic interest as of December 31, 2016.2018.
We are a Chilean company engaged in the electricity generation and distribution businesses in Chile through our subsidiaries and jointly-controlled entities.affiliates. As of the date of this Report and after giving effect to the 2018 Reorganization (described in “Item 4. Information on the Company — A. History and Development of the Company — the 2018 Reorganization”), we own 60.0%93.6% of Enel Generación Chile S.A. (“Enel Generación Chile”Generation”), a Chilean electricity generation company holding electricity generation operations in Chile, and 99.1% of Enel Distribución Chile S.A. (“Enel Distribución Chile”Distribution”), a Chilean electricity distribution company with operation in the Santiago Metropolitan Area. Region.
On April 2, 2018, as part of the 2018 Reorganization, Enel Green Power Latin America S.A. (“EGPL”), a Chilean non-conventional electricity generation company holding non-conventional electricity generation operations in Chile, merged with us. As a result, we now wholly own and consolidate Enel Green Power Chile Ltda. (“EGP Chile”). For additional information relating the company and the corporate reorganization completed in 2018, please see “Item 4. Information on the Company — A. History and Development of the Company — The 2018 Reorganization”.
We wereare a publicly held limited liability stock corporation organized on March 1, 2016, under the laws of the Republic of Chile as a result of a corporate reorganization completed in 2016 by the former Enersis S.A., which separated its Chilean businesses from its non-Chilean businesses. On October 18, 2016, and as part of this process, (i) Endesa Chile changed its name to Enel Generación Chile S.A.; (ii) Chilectra Chile S.A. changed its name to Enel Distribución Chile S.A.; and (iii) Enersis Chile S.A. and changed ourits name to Enel Chile S.A. For additional information relating the company and the corporate reorganization completed in 2016, please see “Item 4. Information on October 18, 2016.the Company — A. History and Development of the Company — The 2016 Reorganization”.
As of the date of this Report, Enel S.p.A. (“Enel”), an Italian energy company with multinational operations in the power and gas markets, owns 60.6%61.9% (excluding treasury stock) of us and is our ultimate controlling shareholder.
During 2016, Enersis S.A. (now known as Enel Américas S.A.) carried out a reorganization process, which involved, among other things, the separation of its Chilean and non-Chilean electricity businesses in South America. The separation of its businesses was effective on March 1, 2016, resulting in the creation of the Company as the holding company of the Chilean businesses. For additional information relating to the reorganization, see “Item 4. Information on the Company — A. History and Development of the Company —The 2016 Reorganization.”
PRESENTATION OF INFORMATION
Financial Information
In this Report, unless otherwise specified, references to “U.S. dollars” or “US$”, are to dollars of the United States of America (“United States”); references to “pesos” or “Ch$” are to Chilean pesos, the legal currency of Chile; and references to “UF” are to Unidades de Fomento. The UF is a Chilean inflation-indexed, peso-denominated monetary unit that is adjusted daily to reflect changes in the official Consumer Price Index (“CPI”) of the Chilean National Institute of Statistics (Instituto Nacional de Estadísticas or “INE”“INE”). The UF is adjusted in monthly cycles. Each day in the period beginning on the tenth day of the current month through the ninth day of the succeeding month, the nominal peso value of the UF is indexed in order to reflect a proportionate amount of the change in the Chilean CPI during the prior calendar month. As of December 31, 2016,2018, one UF was equivalent to Ch$ 26,347.98.27,565.79. The U.S. dollar equivalent of one UF was US$ 39.3639.68 as of December 31, 2016,2018, using the Observed Exchange Rate reported by the Central Bank of Chile (Banco Central de Chile) as of December 31, 20162018 of Ch$ 669.47694.77 per US$ 1.00. The U.S. dollar observed exchange rate (dólar observado) (the “Observed Exchange Rate”), which is reported by the Central Bank of Chile and published daily on its webpage, is the weighted average exchange rate of the previous business day’s transactions in the Formal Exchange Market. Unless the context specifies otherwise, all amounts translated from Chilean pesos to U.S. dollars or vice versa, or from UF to Chilean pesos, have been carried out at the rates applicable foras of December 31, 2016.2018.
The Central Bank of Chile may intervene by buying or selling foreign currency on the Formal Exchange Market to maintain the Observed Exchange Rate within a desired range.
As of April 25, 2017, one UF was equivalent to Ch$ 26,543.75. The U.S. dollar equivalent of one UF was US$ 40.22 as of the same date, using the Observed Exchange Rate reported by the Central Bank of Chile as of such date of Ch$ 660.04 per US$ 1.00.
Our consolidated financial statements and, unless otherwise indicated, other financial information concerning us included in this Report are presented in Chilean pesos. We have prepared our consolidated financial statements in accordance with International Financial Reporting Standards (“IFRS”), as issued by the International Accounting Standards Board (“IASB”).
All of our subsidiaries are integrated and all their assets, liabilities, income, expenses and cash flows are included in the consolidated financial statements after making the adjustments and eliminations related to intra-group transactions. InvestmentsOur participation in associated companies over which we exercise significant influence are included in our consolidated financial statements using the equity method. For detailed information regarding consolidated entities, jointly-controlled entities and associated companies, see Appendices 1, 2 and 3 to the consolidated financial statements.
For
Solely for the convenience of the reader, this Report contains translations of certain Chilean peso amounts into U.S. dollars at specified rates. Unless otherwise indicated, the U.S. dollar equivalent for information in Chilean pesos is based on the Observed Exchange Rate for December 31, 2016,2018, as defined in “Item 3. Key Information — A. Selected Financial Data — Exchange Rates.”Rates”. The Federal Reserve Bank of New York does not report a noon buying rate for Chilean pesos. No representation is made that the Chilean peso or U.S. dollar amounts shown in this Report could have been or could be converted into U.S. dollars or Chilean pesos, as the case may be, at such rate or at any other rate. See “Item 3. Key Information — A. Selected Financial Data — Exchange Rates. ”Rates”.
Technical Terms
References to “TW” are to terawatts (1012 watts or a trillion watts); references to “GW” and “GWh” are to gigawatts (109 watts or a billion watts) and gigawatt hours, respectively; references to “MW” and “MWh” are to megawatts (106 watts or a million watts) and megawatt hours, respectively; references to “kW” and “kWh” are to kilowatts (103 watts or a thousand watts) and kilowatt hours, respectively; references to “kV” are to kilovolts, and references to “MVA” are to megavolt amperes. References to “BTU” and “MBTU” are to British thermal unit and million British thermal units, respectively. A “BTU” is an energy unit equal to approximately 1,055 joules. References to “Hz” are to hertz; and references to “mtpa” are to metric tons per annum. Unless otherwise indicated, statistics provided in this Report with respect to the installed capacity of electricity generation facilities are expressed in MW. One TW equals 1,000 GW, one GW equals 1,000 MW and one MW equals 1,000 kW. The installed capacity we are presenting in this Report corresponds to the gross installed capacity, without considering the MW that each power plant consumes for its own operation.
Statistics relating to aggregate annual electricity production are expressed in GWh and based on a year of 8,760 hours, except for leap years, which are based on 8,784 hours. Statistics relating to installed capacity and production of the electricity industry do not include electricity of self-generators.
Energy losses experienced by generation companies during transmission are calculated by subtracting the number of GWh of energy sold from the number of GWh of energy generated (excluding their own energy consumption and losses on the part of the power plant), within a given period. Losses are expressed as a percentage of total energy generated.
Energy losses during distribution are calculated as the difference between total energy purchased (GWh of electricity demand, including own generation) and the energy sold excluding tolls and energy consumption not billed (also measured in GWh), within a given period. Distribution losses are expressed as a percentage of total energy purchased. Losses in distribution arise from illegally tapped energy as well as technical losses.
Calculation of Economic Interest
References are made in this Report to the “economic interest” of Enel Chile in its related companies. We could have direct and indirect interest is such companies. In circumstances where we do not directly own an interest in a related company, our economic interest in such ultimate related company is calculated by multiplying the percentage of economic interest in a directly held related company by the percentage of economic interest of any entity in the ownership chain of such related company. For example, if we directly own a 6% equity stake in an associatedassociate company and 40% is directly held by our 60%-owned subsidiary, our economic interest in such associate would be 60% times 40% plus 6%, orequal to 30%.
Rounding
Certain figures included in this Report have been rounded for ease of presentation. Because of this rounding, it is possible that amounts in tables may not add up to exactly the same amounts as the sum of the entries.
FORWARD-LOOKING STATEMENTSFORWARD-LOOKING STATEMENTS
This Report contains statements that are or may constitute forward-looking statements within the meaning of Section 27A of the Securities Act of 1933, as amended, and Section 21E of the Securities Exchange Act of 1934, as amended (the “Exchange Act”). These statements appear throughout this Report and include statements regarding our intent, belief or current expectations, including but not limited to any statements concerning:
·our capital investment program;
·trends affecting our financial condition or results from operations;
·the future impact of competition and regulation;
·political and economic conditions in the countries in which we or our related companies operate or may operate in the future;
·any statements preceded by, followed by or that include the words “believes,” “expects,” “predicts,” “anticipates,” “intends,” “estimates,” “should,” “may” or similar expressions; and
·other statements contained or incorporated by reference in this Report regarding matters that are not historical facts.
Because such statements are subject to risks and uncertainties, actual results may differ materially from those expressed or implied by such forward-looking statements. Factors that could cause actual results to differ materially include, but are not limited to:
·demographic developments, political events, economic fluctuations and interventionist measures by authorities in Chile;
hydrology,
· water supply, droughts, flooding and other weather conditions;
·changes in the Chilean environmental regulationregulations and the regulatory framework of the electricity industry;
·our ability to implement proposed capital expenditures, including our ability to arrange financing where required;
·the nature and extent of future competition in our principal markets; and
·the factors discussed below under “Risk Factors”.Factors.”
You should not place undue reliance on such statements, which speak only as of the date that they were made. Our independent registered public accounting firm has not examined or compiled the forward-looking statements and, accordingly, does not provide any assurance with respect to such statements. You should consider these cautionary statements together with any written or oral forward-looking statements that we may issue in the future. We do not undertake any obligation to release publicly any revisions to forward-looking statements contained in this Report to reflect later events or circumstances or to reflect the occurrence of unanticipated events.events, except as required by law.
For all these forward-looking statements, we claim the protection of the safe harbor for forward-looking statements contained in the Private Securities Litigation Reform Act of 1995.
PART I
PART I
Item 1.Identity of Directors, Senior Management and Advisers
Not applicable.
Item 2.Offer Statistics and Expected Timetable
Not applicable.
Item 3.Key InformationKey Information
A.Selected Financial Data.
The following selected consolidated financial data should be read in conjunction with our consolidated financial statements included in this Report. The selected consolidated financial data as of December 31, 20162018, and 20152017 and for each of the years in the three-year period ended December 31, 2016, are derived from our audited consolidated financial statements included in this Report. The selected consolidated financial data as of December 31, 20142016, 2015 and 2013,2014, and for the yearyears ended December 31, 2013 is2015, and 2014 are derived from our consolidated financial statements not included in this Report. Our consolidated financial statements were prepared in accordance with IFRS, as issued by the IASB. Pursuant to transitional relief granted by
Amounts in the SEC in respect of first time application of IFRS, selected consolidated financial data as of and for the year ended December 31, 2012 have been omitted.
Amountstables are expressed in millions, except for ratios, operating data and data for shares and American Depositary Shares (“ADS”). For the convenience of the reader, all data presented in U.S. dollars in the following summary, as of and for the year ended December 31, 2016,2018, has been converted at the U.S. dollar Observed Exchange Rate (dólar observado) for that date of Ch$ 669.47694.77 per US$ 1.00. The Observed Exchange Rate, which is reported and published daily on the Central Bank of Chile’s web page, corresponds to the weighted average exchange rate of the previous business day’s transactions in the Formal Exchange Market. For more information concerning historical exchange rates, see “Item 3. Key Information — A. Selected Financial Data— Exchange Rates” below.
The following tables set forth our selected consolidated financial data and operating data for the years indicated:
| | As of and for the year ended December 31, | |
| | 2016 (1) | | | 2016 | | | 2015 | | | 2014 | | | 2013 | |
| | (US$ millions) | | | (Ch$ millions) | |
Consolidated Statement of Comprehensive Income Data | | | | | | | | | | | | | | | | | | | | |
Revenues and other operating income | | | 3,796 | | | | 2,541,567 | | | | 2,399,029 | | | | 2,049,065 | | | | 1,738,083 | |
Operating costs (2) | | | (2,948 | ) | | | (1,973,778 | ) | | | (1,873,540 | ) | | | (1,666,315 | ) | | | (1,346,460 | ) |
Operating income | | | 848 | | | | 567,789 | | | | 525,489 | | | | 382,750 | | | | 391,623 | |
Financial results (3) | | | (31 | ) | | | (20,483 | ) | | | (97,869 | ) | | | (67,045 | ) | | | (56,363 | ) |
Other non-operating income | | | 181 | | | | 121,490 | | | | 20,056 | | | | 70,893 | | | | 14,528 | |
Share of profit (loss) of associates and joint ventures accounted for using the equity method | | | 12 | | | | 7,878 | | | | 8,905 | | | | (54,353 | ) | | | 24,309 | |
Income before income taxes | | | 1,011 | | | | 676,674 | | | | 456,581 | | | | 332,245 | | | | 374,097 | |
Income tax expenses | | | (166 | ) | | | (111,403 | ) | | | (109,613 | ) | | | (132,687 | ) | | | (61,712 | ) |
Net income | | | 844 | | | | 565,271 | | | | 346,968 | | | | 199,558 | | | | 312,385 | |
Net income attributable to the parent Company | | | 574 | | | | 384,160 | | | | 251,838 | | | | 162,459 | | | | 229,527 | |
Net income attributable to non-controlling interests | | | 271 | | | | 181,111 | | | | 95,130 | | | | 37,099 | | | | 82,858 | |
Total basic and diluted earnings per average number of shares (Ch$/US$ per share) | | | 0.01 | | | | 7.83 | | | | 5.13 | | | | 3.31 | | | | 5.08 | |
Total basic and diluted earnings per average number of ADSs (Ch$/US$ per ADS) | | | 0.58 | | | | 391.26 | | | | 256.49 | | | | 165.46 | | | | 253.79 | |
Cash dividends per share (Ch$/US$ per share)(4) | | | 0.00 | | | | 2.09 | | | | — | | | | — | | | | — | |
Cash dividends per ADS (Ch$/US$ per ADS)(4) | | | 0.16 | | | | 104.65 | | | | — | | | | — | | | | — | |
Weighted average number of shares of common stock (millions) | | | | | | | 49,093 | | | | 49,093 | | | | 49,093 | | | | 45,219 | |
| | | | | | | | | | | | | | | | | | | | |
Consolidated Statement of Financial Position Data | | | | | | | | | | | | | | | | | | | | |
Total assets | | | 8,064 | | | | 5,398,711 | | | | 5,325,469 | | | | 5,126,735 | | | | 4,820,392 | |
Non-current liabilities | | | 1,760 | | | | 1,178,471 | | | | 1,270,006 | | | | 1,122,585 | | | | 826,478 | |
Equity attributable to the parent company | | | 4,128 | | | | 2,763,391 | | | | 2,592,682 | | | | 2,472,201 | | | | 2,438,837 | |
Equity attributable to non-controlling interests | | | 1,045 | | | | 699,602 | | | | 609,219 | | | | 611,864 | | | | 626,947 | |
Total equity | | | 5,173 | | | | 3,462,994 | | | | 3,201,901 | | | | 3,084,066 | | | | 3,065,784 | |
Capital stock | | | 3,330 | | | | 2,229,109 | | | | 2,229,109 | | | | 2,229,109 | | | | 2,238,169 | |
| | | | | | | | | | | | | | | | | | | | |
Other Consolidated Financial Data | | | | | | | | | | | | | | | | | | | | |
Capital expenditures (CAPEX) (5) | | | 332 | | | | 222,386 | | | | 309,503 | | | | 196,932 | | | | 128,239 | |
Depreciation, amortization and impairment losses (6) | | | 295 | | | | 197,587 | | | | 150,147 | | | | 141,623 | | | | 127,720 | |
| | As of and for the year ended December 31, | |
| | 2018 (1) | | 2018 | | 2017 | | 2016 | | 2015 | | 2014 | |
| | (US$ millions) | | (Ch$ millions) | |
Consolidated Statement of Comprehensive Income Data | | | | | | | | | | | | | |
Revenues and other operating income | | 3,537 | | 2,457,161 | | 2,522,978 | | 2,541,567 | | 2,399,029 | | 2,049,065 | |
Operating costs (2) | | (2,571 | ) | (1,786,546 | ) | (1,944,348 | ) | (1,973,778 | ) | (1,873,540 | ) | (1,666,315 | ) |
Operating income | | 965 | | 670,605 | | 578,631 | | 567,789 | | 525,489 | | 382,750 | |
Financial results (3) | | (160 | ) | (110,875 | ) | (22,415 | ) | (20,483 | ) | (97,869 | ) | (67,045 | ) |
Other non-operating income | | 5 | | 3,410 | | 113,241 | | 121,490 | | 20,056 | | 70,893 | |
Share of profit (loss) of associates and joint ventures accounted for using the equity method | | 5 | | 3,190 | | (2,697 | ) | 7,878 | | 8,905 | | (54,353 | ) |
Income before income taxes | | 815 | | 566,330 | | 666,760 | | 676,674 | | 456,581 | | 332,245 | |
Income tax expenses | | (221 | ) | (153,483 | ) | (143,342 | ) | (111,403 | ) | (109,613 | ) | (132,687 | ) |
Net income | | 594 | | 412,848 | | 523,418 | | 565,271 | | 346,968 | | 199,558 | |
Net income attributable to the parent Company | | 521 | | 361,710 | | 349,383 | | 384,160 | | 251,838 | | 162,459 | |
Net income attributable to non-controlling interests | | 74 | | 51,138 | | 174,035 | | 181,111 | | 95,130 | | 37,099 | |
Total basic and diluted earnings per average number of shares (Ch$/US$ per share) | | 0.01 | | 5.66 | | 7.12 | | 7.83 | | 5.13 | | 3.31 | |
Total basic and diluted earnings per average number of ADSs (Ch$/US$ per ADS) | | 0.41 | | 282.97 | | 355.84 | | 391.26 | | 256.49 | | 165.46 | |
Cash dividends per share (Ch$/US$ per share)(4) | | 0.004 | | 3.00 | | 3.23 | | 2.09 | | — | | — | |
Cash dividends per ADS (Ch$/US$ per ADS)(4) | | 0.22 | | 149.89 | | 161.72 | | 104.65 | | — | | — | |
Weighted average number of shares of common stock (millions) | | 63,913 | | 63,913 | | 49,093 | | 49,093 | | 49,093 | | 49,093 | |
| | | | | | | | | | | | | |
Consolidated Statement of Financial Position Data | | | | | | | | | | | | | |
Total assets | | 10,778 | | 7,488,020 | | 5,694,773 | | 5,398,711 | | 5,325,469 | | 5,126,735 | |
Non-current liabilities | | 3,737 | | 2,596,392 | | 1,090,995 | | 1,178,471 | | 1,270,006 | | 1,122,585 | |
Equity attributable to the parent company | | 4,924 | | 3,421,229 | | 2,983,384 | | 2,763,391 | | 2,592,682 | | 2,472,201 | |
Equity attributable to non-controlling interests | | 364 | | 252,935 | | 803,578 | | 699,602 | | 609,219 | | 611,864 | |
Total equity | | 5,288 | | 3,674,164 | | 3,786,962 | | 3,462,994 | | 3,201,901 | | 3,084,066 | |
Capital stock | | 5,692 | | 3,954,491 | | 2,229,109 | | 2,229,109 | | 2,229,109 | | 2,229,109 | |
| | | | | | | | | | | | | |
Other Consolidated Financial Data | | | | | | | | | | | | | |
Capital expenditures (CAPEX) (5) | | 433 | | 300,539 | | 266,030 | | 222,386 | | 309,503 | | 196,932 | |
Depreciation, amortization and impairment losses (6) | | 318 | | 220,750 | | 160,622 | | 197,587 | | 150,147 | | 141,623 | |
(1)
| Solely for the convenience of the reader, Chilean peso amounts have been converted into U.S. dollars at the exchange rate of Ch$ 669.47 per U.S. dollar, as of December 31, 2016.
|
(2)
| Operating costs represent raw materials and supplies used, other work performed by the entity and capitalized, employee benefits expenses, depreciation and amortization expenses, impairment losses recognized in the period’s profit or loss and other expenses.
|
(3)
| Financial results represent (+) financial income, (-) financial expenses, (+/-) foreign currency exchange differences and net gains/losses from indexed assets and liabilities.
|
(4)
| Corresponds to a payout ratio of 50% based on annual consolidated net income for our 2016’s annual consolidated net income filed with the SVS, based on 10 months of results starting as of our creation on March 1, 2016, and therefore differs from the twelve month net income included in this Report.
|
(5)
| CAPEX figures represent cash flows used for purchases of property, plant and equipment and intangible assets for each year.
|
(6)
| For further detail please refer to Note 28 of the Notes to our consolidated financial statements.
|
(1) Solely for the convenience of the reader, Chilean peso amounts have been converted into U.S. dollars at the exchange rate of Ch$ 694.77 per U.S. dollar, as of December 31, 2018.
(2) Operating costs represent raw materials and supplies used, other work performed by the entity, employee benefits expenses, depreciation and amortization expenses, impairment losses recognized in the period’s profit or loss and other expenses.
(3) Financial results represent (+) financial income, (-) financial costs, (+/-) foreign currency exchange differences and net gains/losses from indexed assets and liabilities.
| | As of and for the year ended December 31, | |
| | 2016 | | | 2015 | | | 2014 | | | 2013 | | | 2012 | |
OPERATING DATA OF SUBSIDIARIES | | | | | | | | | | | | | | | | | | | | |
| | | | | | | | | | | | | | | | | | | | |
Enel Distribución Chile | | | | | | | | | | | | | | | | | | | | |
Electricity sold (GWh) (1) | | | 15,924 | | | | 15,893 | | | | 15,690 | | | | 15,140 | | | | 14,433 | |
Number of customers (thousands) | | | 1,826 | | | | 1,781 | | | | 1,737 | | | | 1,694 | | | | 1,659 | |
Total energy losses (%) (2) | | | 5.3 | % | | | 5.3 | % | | | 5.3 | % | | | 5.3 | % | | | 5.4 | % |
| | | | | | | | | | | | | | | | | | | | |
Enel Generación Chile | | | | | | | | | | | | | | | | | | | | |
Installed capacity (MW) (3) | | | 6,351 | | | | 6,351 | | | | 6,351 | | | | 5,571 | | | | 5,571 | |
Generation (GWh) (3) | | | 17,564 | | | | 18,294 | | | | 18,063 | | | | 19,438 | | | | 19,194 | |
(4) For 2016, a payout ratio of 50% was used based on annual consolidated net income for our 2016 annual consolidated net income filed with the CMF, based on 10 months of results starting as of our incorporation on March 1, 2016, and therefore differs from the twelve-month net income included in this Report.
(5) CAPEX figures represent cash flows used for purchases of property, plant and equipment and intangible assets for each year.
(6) For further detail, please refer to Note 31 of the Notes to our consolidated financial statements.
| | As of and for the year ended December 31, | |
| | 2018 | | 2017 | | 2016 | | 2015 | | 2014 | |
OPERATING DATA OF SUBSIDIARIES | | | | | | | | | | | |
| | | | | | | | | | | |
Enel Distribution | | | | | | | | | | | |
Electricity sold (GWh) | | 16,782 | | 16,438 | | 15,924 | | 15,893 | | 15,690 | |
Number of customers (thousands) | | 1,925 | | 1,882 | | 1,826 | | 1,781 | | 1,737 | |
Total energy losses (%) (1) | | 5.0 | | 5.1 | | 5.3 | | 5.3 | | 5.3 | |
| | | | | | | | | | | |
Enel Generation | | | | | | | | | | | |
Installed capacity (MW) (2) | | 6,274 | | 6,351 | | 6,351 | | 6,351 | | 6,351 | |
Generation (GWh) (2) | | 17,373 | | 17,073 | | 17,564 | | 18,294 | | 18,063 | |
(1)
| Beginning in 2013, we changed how we calculate our electricity generation. The impact of applying the new criteria on a cumulative basis for 2010 through 2012 is not material. We now report the energy effectively available for sales in all countries. Electricity sales may be different than reported in previous periods because currently sales do not reflect non-billable consumption.
|
(2)
| Energy losses are calculated as the difference between total energy generated and purchased and the energy sold excluding tolls and energy consumption not billed (GWh) within a given period. Losses are expressed as a percentage of total energy purchased. Losses in distribution arise from illegally tapped energy as well as technical losses.
|
(3)
| The 2014 and 2015 data includes the capacity and generation of GasAtacama Chile, as a result of its consolidation. Prior to 2014, our unconsolidated interest in GasAtacama Chile was excluded.
|
(1) Energy losses in distribution arise from illegally tapped energy as well as technical losses. They are calculated as the difference between total energy generated and purchased and the energy sold, excluding tolls and energy consumption not billed (GWh), within a given period. Losses are expressed as a percentage of total energy purchased.
(2) The 2015 and 2014 data includes the capacity and generation of GasAtacama, as a result of its consolidation.
Exchange Rates
Fluctuations in the exchange rate between the Chilean peso and the U.S. dollar will affect the U.S. dollar equivalent of the peso price of our shares of common stock on the Santiago Stock Exchange (Bolsa de Comercio de Santiago), and the Chilean Electronic Stock Exchange (Bolsa Electrónica de Chile) and the Valparaíso Stock Exchange (Bolsa de Corredores de Valparaíso). These exchange rate fluctuations affect the price of our American Depositary Shares (“ADSs”) and the conversion of cash dividends relating to the common shares represented by ADSs from Chilean pesos to U.S. dollars. In addition, to the extent that significant financial liabilities of the Company are denominated in foreign currencies, exchange rate fluctuations may have a significant impact on earnings.
In Chile, there are two currency markets, the Formal Exchange Market (Mercado Cambiario Formal) and the Informal Exchange Market (Mercado Cambiario Informal). The Formal Exchange Market is comprised of banks and other entities authorized by the Central Bank of Chile. The Informal Exchange Market is comprised of entities that are not expressly authorized to operate in the Formal Exchange Market, such as certain foreign currency exchange houses and travel agencies, among others. The Central Bank of Chile has the authority to require that certain purchases and sales of foreign currencies be carried out on the Formal Exchange Market. Both the Formal and Informal Exchange Markets are driven by free market forces. Current regulations require that the Central Bank of Chile be informed of certain transactions that must be carried out through the Formal Exchange Market.
The U.S. dollar Observed Exchange Rate, which is reported by the Central Bank of Chile and published daily on its web page, is the weighted average exchange rate of the previous business day’s transactions in the Formal Exchange Market. Nevertheless, the Central Bank of Chile may intervene by buying or selling foreign currency on the Formal Exchange Market to attempt to maintain the Observed Exchange Rate within a desired range.
The Informal Exchange Market reflects transactions carried out at an informal exchange rate (the “Informal Exchange Rate”). There are no limits imposed on the extent to which the rate of exchange in the Informal Exchange Market can fluctuate above or below the Observed Exchange Rate. Foreign currency for payments and distributions with respect to the ADSs may be purchased either in the Formal or the Informal Exchange Market, but such payments and distributions must be remitted through the Formal Exchange Market.
The Federal Reserve Bank of New York does not report a noon buying rate for Chilean pesos. As of December 31, 2016,2018, the U.S. dollar Observed Exchange Rate was Ch$ 669.47694.77 per US$ 1.00.
The following table sets forth the low, high, average and period-end Observed Exchange Rate for U.S. dollars for the periods set forth below, as reported by the Central Bank of Chile:
| | Daily Observed Exchange Rate (Ch$ per US$)(1) | |
| | Low(2) | | | High(2) | | | Average(3) | | | Period-end | |
Year ended December 31, | | | | | | | | | | | | | | | | |
2016 | | | 645.22 | | | | 730.31 | | | | 676.67 | | | | 669.47 | |
2015 | | | 597.10 | | | | 715.66 | | | | 654.66 | | | | 710.16 | |
2014 | | | 527.53 | | | | 621.41 | | | | 570.34 | | | | 606.75 | |
2013 | | | 466.50 | | | | 533.95 | | | | 498.83 | | | | 524.61 | |
2012 | | | 469.65 | | | | 519.69 | | | | 486.31 | | | | 479.96 | |
Month ended | | | | | | | | | | | | | | | | |
March 2017 | | | 650.98 | | | | 669.52 | | | n.a. | | | | 663.97 | |
February 2017 | | | 638.35 | | | | 648.88 | | | n.a. | | | | 648.88 | |
January 2017 | | | 646.19 | | | | 673.36 | | | n.a. | | | | 646.19 | |
December 2016 | | | 649.40 | | | | 677.11 | | | n.a. | | | | 669.47 | |
November 2016 | | | 650.72 | | | | 679.24 | | | n.a. | | | | 673.54 | |
October 2016 | | | 651.18 | | | | 670.88 | | | n.a. | | | | 651.18 | |
Source: Central Bank of Chile.
(2)
| Exchange rates are the actual low and high, on a day-by-day basis for each period.
|
(3)
| The average of the exchange rates on the last day of each month during the period.
|
As of April 25, 2017,22, 2019, the U.S. dollar Observed Exchange Rate was Ch$ 660.04663.91 per US$ 1.00.
Calculation of the appreciation or devaluation of the Chilean peso against the U.S. dollar in any given period is made by determining the percent change between the reciprocals of the Chilean peso equivalent of US$ 1.00 at the end of the preceding period and the end of the period for which the calculation is being made. For example, to calculate the appreciationdevaluation of the year-end Chilean peso in 2016,2018, one determines the percentpercentage of change between the reciprocal of Ch$ 710.16,694.77, the value of one U.S. dollar as of December 31, 2015,2018, or 0.001408,0.001439, and the reciprocal of Ch$ 669.47,614.75, the value of one U.S. dollar as of December 31, 2016,2017, or 0.001494.0.001627. In this example, the percentage change between the two periods is 6.1%-11.5%, which represents the 20162018 year-end appreciationdevaluation of the Chilean peso against the 20152017 year-end U.S. dollar. A positive percentage change means that the Chilean peso appreciated against the U.S. dollar, while a negative percentage change means that the Chilean peso devaluated against the U.S. dollar.
The following table sets forth the period-end rates for U.S. dollars for the years ended December 31, 20122014, through December 31, 2016,2018, based on information published by the Central Bank of Chile.
| | Ch$ per US$(1) | | | Ch$ per US$(1) | |
| | Period End | | | Appreciation (Devaluation) | | | Period End | | Appreciation (Devaluation) | |
| | (in Ch$) | | | (in %) | | | (in Ch$) | | (in %) | |
Year ended December 31, | | | | | | | | | | | | | |
2018 | | | 694.77 | | (11.5 | ) |
2017 | | | 614.75 | | 8.9 | |
2016 | | | 669.5 | | | | 6.1 | | | 669.47 | | 6.1 | |
2015 | | | 710.2 | | | | (14.6 | ) | | 710.16 | | (14.6 | ) |
2014 | | | 606.8 | | | | (13.5 | ) | | 606.75 | | (13.5 | ) |
2013 | | | 524.6 | | | | (8.5 | ) | |
2012 | | | 480.0 | | | | 8.2 | | |
Source: Central Bank of Chile.
(1) Calculated based on the variation of period-end exchange rates. B.Capitalization and Indebtedness. | Calculated based on the variation of period-end exchange rates.
|
B.
| Capitalization and Indebtedness.
|
Not applicable.
C.Reasons for the Offer and Use of Proceeds. | Reasons for the Offer and Use of Proceeds.
|
Not applicable.
D.Risk Factors.
Chilean economic fluctuations, as well as certain economic interventionist measures by governmental authorities as well as political events or financial or other crises in any region worldwide may affect our results of operations, and financial condition and liquidity as well as the value of our securities.
All of our operations are located in Chile. Accordingly, our consolidated revenues may beare affected by the performance of the Chilean economy. If local, regional or worldwide economic trends adversely affect the Chilean economy, our financial condition and results from operations could be adversely affected. Moreover, insufficientInsufficient cash flows for our subsidiaries could result in theirthe inability to meet our debt obligations and the need to seek waivers to comply with restrictive debt covenants.
covenants and increasing costs for subsequent financings. The Chilean government has exercised in the past, and continues to exercise, a substantial influence over many aspects of the private sector, which may result in changes to economic or other policies. For example, in 2014 and 2016, the Chilean government approved Law 20,780, a tax reform law, and Law 20,940, a labor reform law, both of which may have a negative effect upon non-Chilean holders of shares or ADSs. For further details regarding Chilean tax considerations, please refer to “Item 10. Additional Information — E. Taxation.” Other governmental actions could involve wage, price and tariff rate controls, increase strikes and give workers greater collective bargaining power and other interventionist measures, such as expropriation or nationalization.
Future adverse developments in Chile or changes in policies regarding tariffs, water rights, exchange controls, regulations and taxation may impair our ability to execute our strategic plans,business plan, which could adversely affect our results of operations and financial condition. Inflation, devaluation, social instability and other political, economic or diplomatic developments, including the response by governments in the region to these circumstances, could also reduce our profitability. In addition, Chilean financial and securities markets are influenced by economic and market conditions in other countries and may be affected by events in other countries, which could adversely affect the value of our securities.
Because our businesses dependOur business depends heavily on hydrology, droughts, flooding and other weather conditions may adversely affect our operations and profitability.hydrological conditions.
Approximately 55%48% of our consolidated installed generation capacity in 20162018 was hydroelectric. Accordingly, extremely dry hydrological conditions could adversely affect our business, results of operations and financial condition. Our results have been adversely affected when hydrological conditions in Chile have been significantly below their historical average.
In addition, the below-average hydrological conditions not only reduce
While our ability to operate our hydroelectric plants at full capacity, but also may result in increased water transportation costs for the operation of the San Isidro thermal power plant for cooling purposes. Whilesubsidiary, Enel Generación ChileGeneration, has entered into certain agreements with the Chilean government and local irrigators regarding the use of water for hydroelectric generation purposes especially during periods of low water levels, if drought conditionsdroughts persist or become worse, we may face increased pressure by the Chilean government or other third parties to further restrict our water use.
Thermal plant operating costs can be considerably higher than those of hydroelectric plants.
Our operating expenses increase during these drought periods when thermal plants, which have higher operating costs relative to hydroelectric plants, are useddispatched more frequently. In addition, depending on our commercial obligations, weWe may need to buy electricity at higher spot prices in order to comply with our contractual supply obligations and the cost of these electricity purchases may exceed our contracted electricity sale prices, thus potentially producing losses from those contracts. For further information with respect to the effect of hydrology on our business and financial results, please refer to “Item 5. Operating and Financial Review and Prospects—Prospects — A. Operating Results—1.Results —1. Discussion of Main Factors Affecting Operating Results and Financial Condition of the Company —a. Generation Business.”
Droughts also indirectly affect the operation of our thermal plants, including our facilities that use natural gas, fuel oil or coal, as fuel, in the following manner:
·Our thermal plants require water for cooling and droughts not onlyin extreme situations may reduce the availability of water but alsoand increase the concentrationcost of chemicals, such as sulfates in the water. The high concentration of chemicals in the water that we use for cooling increases the risk of damaging the equipment at our thermal plants as well as the risk of violating environmental regulations.transportation. As a result, we have had to purchase water for our San Isidro power plant from agricultural areas that are also experiencing water shortages. These water purchases may increase our operating costs and alsomay require us to further negotiate with the local communities.
| •
| Thermal power plants that burn natural gas generate emissions such as sulfur dioxide (SO2) and nitrogen oxide (NO) gases. When operating with diesel they also release particulate matter into the atmosphere. Coal fired plants generate emissions of SO2 and NO. Therefore, greater use of thermal plants during periods of drought generally increases the risk of producing a higher level of pollutants.
|
The
· Thermal power plants that burn natural gas generate emissions such as nitrogen oxide (NO), carbon dioxide (CO2) and carbon monoxide (CO) gases. When operating with diesel they release NO, sulfur dioxide (SO2) and particulate matter into the atmosphere. Coal fired plants generate SO2 and NO emissions. Therefore, greater use of thermal plants during droughts generally increases the risk of producing higher levels of greenhouse gas emissions, which also decreases our operating income due to the payment of so-called “green taxes.”
A full recovery from the drought that has been affecting the regions where most of our hydroelectric plants are located may last for an extended period andbut new drought periods may recur in the future. A prolonged drought may exacerbate the risks described above and have a further adverse effect upon our business, results of operations and financial condition.
The distribution business is also affected by weather conditions such as moderate temperatures that might decrease heating or air conditioning use, affecting energy consumption. Even withinclement weather. With extreme temperatures, demand can increase significantly within a very short period of time, which could affectin turn affects service and could result in stoppages which bring the additional risk of beingservice disruptions that are potentially subject to fines by the authorities.fines. Depending on weather conditions, results obtained by our distribution business can vary significantly from year to year. For example, as a result of severe rainstorms in June 2017, with high wind gusts that brought down part of the electric network, 125,000 of our customers, or 7%, were affected adversely. In July 2017, a strong snowstorm over the Santiago Metropolitan Region caused massive damage to the electrical infrastructure, and affected 342,000 of our customers, or 18%, and 17% of our feeders. This was the most damaging snowstorm in Santiago since 1970, and left parts of the capital without power for over a week. These events significantly increased our costs due to emergency responses including payments related to damage compensation, fines, line maintenance and tree trimming programs.
Governmental regulations may adversely affect our businesses.businesses, cause delays, impede the development of new projects, or increase the costs of operations and capital expenditures.
Our businesses and the tariffs that we charge to our customers are subject to extensive regulation and these regulations may adversely affect our profitability. For example, governmental authorities might impose material rationing policies during droughts or prolonged failures of power facilities, which may adversely affect our business, results of operations and financial condition. Our operating subsidiaries are also subject to environmental regulations that, among other things, require us to perform environmental impact studies for future projects and obtain construction and operating permits from both local and national regulators. Governmental authorities may withhold the approval of these environmental impact studies and therefore their processing time may be longer than expected.
The Chilean governmentalGovernmental authorities may also delay the distribution tariff review process, or tariff adjustments may be insufficient to pass through all of our costs.costs to customers. Some aspects of the Chilean electricity law date back to 1982, and could very well experience significant regulatory changes. The government has mentioned the potential introduction of electricity distribution tariff reform, and it possible that such new regulation may adversely affect our future profitability. Similarly, electricity regulations issued by governmental authorities in Chile may affect the ability of our generation companies to collect revenues sufficient to offsetcover their operating costs.
The inability
Environmental regulations for existing and future generation capacity have become stricter and require increased capital investments. Any delay in meeting the standards constitutes a violation of any companythe regulations. Failure to certify the original implementation and ongoing emission standard requirements of such monitoring system may result in our consolidated groupsignificant penalties and sanctions or legal claims for damages. We expect that even more restrictive emission limits will be established in the future. We are also subject to collect revenues sufficient to cover operating costs may affect the ability of that company to operate as a going concern and may otherwise have an adverse effectannual green tax, based on our business, financial resultsgreenhouse gas emissions in the previous year, and operations.such taxes may increase in the future, and discourage thermal electricity generation.
In addition, changes
Changes in the regulatory framework are often submitted to the legislators and administrative authorities and, some of these changes could have a material adverse impact on our business, results of operations and financial condition. For instance, in 2005 there was a change in the water rights law in Chile that requires us to pay for unused water rights, increasing the annual cost to maintain unused water rights for hydroelectric projects that are neither economically nor technically feasible. In August 2016, Enel Generación Chile waived its unused water rights and recorded a write-off of Ch$ 35.4 billion.
Regulatory authorities may impose fines on our subsidiaries due to operational failures or any breachbreaches of regulations.
Our electricity businesses may beare subject to regulatory fines for any breach of current regulations, including energy supply failures.
In Chile, such Such fines may be imposed for a maximum of 10,000 Annual Tax Units (“UTA” in its Spanish acronym), or Ch$ 5.55.8 billion using the UTA as of December 31, 2016.2018. Our electricity generation subsidiaries are supervised by local regulatory entitiesauthorities and may beare subject to these fines in cases where, in the opinion of the regulatory entity,authority, operational failures affecting the regular energy supply to the system, including coordination issues, are the fault of the company such as when agents are not coordinated with the system operator. In addition, the new transmission law establishesgenerator. Regulations establish a compensation fee to end customers when the energy supply is interrupted more than the standard allowed time. The compensationtime due to events or failures affecting transmission facilities. Compensation is a proportion of the energy not supplied with a minimum value between 20,000 UTA (Ch$ 11.111.6 billion) and the previous year'syear’s energy sales revenues in the case of generators. Fines may also be associated with breach of regulations.
In 2015, the CDEC-SING audited GasAtacama Chile’sGasAtacama’s thermal power plant and reported its findings to the Superintendence of Electricity and Fuels (“SEF”). In, which in August 2016 the SEF fined GasAtacama Chile Ch$ 5.5 billion10,000 UTA (Ch$ 5.8 billion) for allegedly providing inaccurate information to the CDEC-SING relatedCDEC-SING. In 2017, Gener and Engie, both competitors, demanded that Enel Generation pay US$ 65.8 million and US$ 160 million, respectively, as compensation for the alleged additional costs attributed to certain technical operating parameters that implied higher operating costs toGasAtacama in the system. These costs were associated with the technical minimum capacity reported by GasAtacama at 310 MW, with a 30-hour minimum operating time that the CEN later estimated to be only 118 MW and a 2-hour minimum operating time. Further compensation claims from other market players may arise in the future and further fines to any of our plants could adversely affect our business, results of operations and financial condition.
As of December 31, 2016,
In 2017, Enel Distribución Chile had five unresolved fines imposedwas fined by the SEF for a total amount of Ch$ 1.8 billion, mainly160,000 UTM (Ch$ 7.7 billion) due to regulatoryvarious claims of infractions related to extreme inclement weather in June and July 2017. During 2017, Enel Distribución was also fined for a total amount of 35,611 UTM (Ch$ 1.7 billion) associated with breaches in relation to theof quality and continuitystandards of service during previous years and failures in two substations. Those penalties have not been paid yet, since they were appealed before the electricity authority and courts of justice.supply. For further information on fines, please refer to Note 3536.3 of the Notes to our consolidated financial statements.
We depend on payments from our subsidiaries and jointly-controlled entities to meet our payment obligations.
In order to pay our obligations, we rely on cash from dividends, loans, interest payments, capital reductions and other distributions from our subsidiaries. The ability of our subsidiaries to pay dividends, interestSuch payments loans and other distributions to us isare subject to legal constraints such as dividend restrictions and fiduciary duties and contractual limitations that may be imposed by local authorities.obligations.
Dividend Limits and Other Legal Restrictions. The ability of any of our subsidiaries that are not wholly-owned to distribute cash to us may be limited by the directors’ fiduciary duties of such subsidiaries to their minority shareholders. Furthermore, some of our subsidiaries may be forced by law, in accordance with applicable regulation, to diminish or eliminate dividend payments. As a consequence of such restrictions, our subsidiaries could, under certain circumstances, be impeded from distributing cash to us.
Contractual Constraints. Distribution restrictions included in certain credit agreements of our subsidiaries may prevent dividends and other distributions to shareholders if they are not in compliance with certain financial ratios. Generally, ourOur credit agreements typically prohibit any type of distribution if there is an ongoing default.
Operating Results of Our Subsidiaries. The ability of our subsidiaries to pay dividends or make loan payments or other distributions to us is limited by their operating results. To the extent that the cash requirements of any of our subsidiaries exceed their available cash, the subsidiary will not be able to make cash available to us.
Any of the situations described above could adversely affect our business, results of operations and financial condition.
We are involved in litigation proceedings.
We are currently involved in various litigation proceedings, which could result in unfavorable decisions or financial penalties against us. We will continue to be subject to future litigation proceedings, which could cause material adverse consequences to our business.
Our financial condition or results of operations could be adversely affected if we are unsuccessful in defending lawsuits and proceedings against us. For further information on litigation proceedings, please see “Item 8. Financial Information — A. Consolidated Statements and Other Financial Information — Legal Proceedings” and Note 33.336.3 of the Notes to our consolidated financial statements.
Environmental regulations
Construction and other factorsoperation of power plants may causeencounter significant delays impede the developmentor halt and cost over-runs as well as stakeholder opposition that may damage our reputation and result in impairment of new projects, or increase the costs of operations and capital expenditures.our goodwill with stakeholders.
Our operating subsidiaries are subject to environmental regulations which, among other things, require us to perform environmental impact studies for futurepower plant projects and obtain permits from both local and national regulators. The approval of these environmental impact studies may be withheld by governmental authoritiesdelayed in obtaining regulatory approvals, or may face shortages and therefore their processing time may be longer than expected.
The projects that require consultation with local stakeholdersincreases in their evaluation process may be rejectedthe price of equipment, materials or their development may be impeded or slowed down. Our stakeholders may also seek injunctive or other relief, which could negatively impact us iflabor, and they are successful. Moreover, projects that do not require consultation with local stakeholders may be subject to intervention or suffer continuous resistance, delaying their approval process or development. construction delays, strikes, adverse weather conditions, natural disasters, civil unrest, accidents, and human error. Any such event could adversely impact our business, results of operations and financial condition.
Environmental regulations for existing
Market conditions at the time when the projects are initially approved may differ significantly from those that prevail when the projects are completed, which in some cases make such projects commercially unfeasible. This has been the case with many of our former projects, which were initially planned under very different market conditions with higher energy prices prevailing in the market and future generation capacity may become stricter, requiring increased capital investments. For example, Decree13/2011less competition. Deviations in these assumptions, including the estimates of the Chilean Ministry of the Environment, published in June 2011, established stricter emission standards for existing thermoelectric plants that were requiredtiming and expenditures related to be met between 2014these projects, may lead to cost over-runs and 2016, and stricter standards for new facilities or additional capacity. This regulation also required the establishment of a system of continuous emission monitoring, pursuant to which thermoelectric plants must implement a monitoring system in accordance with the guidelines and protocols issued by the Chilean Superintendence of the Environment. In compliance with these Chilean environmental regulations, all thermal plants made incremental investments to comply with the new regulations by installing abatement systems to control pollutant emissions. For example, we are improvingcompletion time widely exceeding our Tarapacá thermal plant through the installation of a desulphurizer to reduce sulfur oxide (SO2) and implementation of measures to improve combustion to reduce emissions of nitrogen oxide (NOx). As of December 31, 2016, the amount accrued in connection with such investments was Ch$ 65,718 million.
Any delay in meeting the standards constitutes a violation of the regulations which established emission limits effective June 23, 2015 or June 23, 2016 depending on the plant’s location and failure to certify the implementation of such monitoring system may result in penalties and sanctions. In addition, any deviation from the environmental license to operate could result in severe sanctions from authorities.
In addition, any deviation from the environmental license to operate could imply severe sanctions from authorities. For example, during 2016 Enel Generación Chile paid fines of Ch$ 1.1 billion for non-compliance with the requirements underthe environmental licenses and failing to send the monitoring reports for our Bocamina, Huasco and Diego de Almagro thermal plants in past years.
Currently, the Chilean Ministry of Environment is working on new prevention and decontamination plans in polluted areas and the Chilean Ministry of Energy is also preparing new mitigation plans to reduce carbon dioxide emissions and comply with the Paris Agreement under the United Nations Framework Convention on Climate Change. Such plans may modify Decree 13/2011 and even further restrict the emission standards for thermoelectric plants, which in turn may require additional investments in the future.
In September 2014, the Chilean government enacted Law 20,780, a tax reform law, which will come into effect in 2018, and thereby established an annual tax on stationary power generators, such as thermal generators, based on their emission of pollutants for the previous year. In December 2016, the Chilean Ministry of Environment published the list of thermal generators that are affected by this tax, and the list included all of our thermal plants. These plants will have to report their emissions during 2017 and will have an additional tax liability in 2018. It is possible that the tax expense might increase in the future, discouraging thermal generation given the increasing cost of operation.
In December 2016, our subsidiary Enel Generación Chile recorded a write-off of Ch$ 1.1 billion for the Tames 2 and Totoralillo thermal projects, due to their technology (steam turbine/coal), which is becoming more expensive because of stricter regulation and its uncertain profitability, among other reasons.
We may have to incur additional costs to remediate and implement our asbestos control and sanitation policy, or be subject to legal actions against us,initial estimates, which in turn may have a material adverse effect on our business, results of operation and financial condition.
In addition
The locations where we develop projects are sometimes highly challenging in terms of geographical topography, in some cases in mountain slopes with very limited access. These factors may also lead to environmental considerations,delays and cost overruns. For example, Cerro Pabellón, our 48 MW geothermal plant, was built at 4,500 meters above sea level and currently we are constructing a third unit that will increase its capacity by 33MW. We may face challenges associated with high altitude construction, including health concerns, and these may affect the construction schedule and associated investment. Additionally, given the geographic location of some projects, there are other factors thatarchaeological risks. In 2018, 11 charges related to archaeological issues were brought against us in connection with Cerro Pabellón, of which three are considered material. They could lead to fines of up to 5,000 UTM (approximately US$ 241,765), a revocation of the Environmental Qualifications Resolution (“RCA” in its Spanish acronym) and even the shutdown of the plant. The claims result from not having implemented adequate and timely preventive measures associated with archaeological sites discovered in the grounds.
The operation of our coal-fired thermal power plants may adversely affect our abilitygoodwill with stakeholders, due to build new facilities or to complete projects currently under development on time, including delays in obtaining regulatory approvals, shortages or increases in the price of equipment, materials or labor, construction delays, strikes, adverse weather conditions, natural disasters, civil unrest, accidents, or other unforeseen events. For example, many of our power plants have been delayed by years in relation to their original planning and desing. Any such event could adversely impact our results of operations and financial condition.
Delays or modifications to any proposed project and laws or regulations may change or be interpreted in a manner thatgreenhouse gas emissions, which could adversely affect our operationsthe environment and local residents. In addition, communities might have their own interests and different perceptions of the company, influenced by other stakeholders or our plans for companies in which we hold investments,motivations unrelated to the project. If the company fails to engage with its relevant stakeholders, it may face opposition, which could adversely affect our business, results ofreputation, stall operations and financial condition.
Our business may be adversely affected by judicial decisions on environmental qualification resolutions for electricity projects in Chile.
The amount of time necessaryor lead to obtain an environmental qualification resolution for electricity generationlitigation threats or transmission projects in Chile has materially increased, primarily due to judicial decisions against such projects, environmental opposition, social criticism and government delays. This can cast doubt on the ability of a project to obtain such approval and increase the uncertainty for investing in electricity generation and transmission projects in Chile. The uncertainty is forcing companies to reassess their business strategies.
Our power plant projects may encounter significant opposition from different groups that may delay their development, increase costs, damage our reputation and potentially result in impairment of our goodwill with stakeholders.
action. Our reputation is the foundation of our relationship with key stakeholders. If we are unable to effectively manage real or perceived issues that could impact us negatively, our business, results of operations and financial condition could be adversely affected.
In 2015, the Chilean Ministry of Environment enacted Law 20,500, setting the procedures for stakeholder participation in the preliminary phase of the evaluation process to avoid risk of conflict and minimize the project impacts. Plants built before the adoption of these rules that were not submitted to local consultation may face opposition from several stakeholders, such as ethnic groups,
environmental groups, land owners, farmers, local communities and political parties, among others, any of whom may impact the sponsoring company’s reputation and goodwill. For example, since December 2013, the Bocamina II power plant has encountered substantial opposition from local fishermen’s unions that claim that our facility negatively affects marine life and causes pollution, which resulted in the interruption of the operation of the power plant for more than a year. On July 1, 2015, the Bocamina II power plant resumed operations, after the approval of a new RCA in April 2015. Also, between November 23, 2015 and January 7, 2016, a second group of fishermen illegally occupied the first high-tension pylon which supports the 154 kV and 220 kV circuits owned by Transelec S.A. and serve the Bocamina I and II power plants. As a consequence, both Bocamina I and II power plants were temporarily shut down. This second group claimed that they should receive the same benefits that Enel Generación Chile granted to the first group of fishermen in the zone. The financial effects of this illegal occupation and electricity transmission interruption amounted to Ch$ 2.8 billion of losses between November 23, 2015 and January 7, 2016. At the level of the electrical system, this situation increased the spot prices and the anticipated use of hydroelectric reserves. Such groups and other similar groups may have the ability to block our power plants and directly affect our results.
The operation of our current thermal power plants may also affect our goodwill with stakeholders, due to emissions such as particulate matter, sulfur dioxide (SO2) and nitrogen oxide (NO), which could adversely affect the environment.
Damage to our reputation may exert considerable pressure on regulators, creditors, and other stakeholders and ultimately lead to projects and operations that may be abandoned, causing our share prices to drop and hindering our ability to attract and retain valuable employees, any of which could result in an impairment of our goodwill with stakeholders.
Political events or financial or other crises in any region worldwide can have a significant impact in Chile, and consequently, may adversely affect our operations as well as our liquidity.
Chile is vulnerable to external shocks, including financial and political events, which could cause significant economic difficulties and affect growth. If the Chilean economyChile experiences lower than expected economic growth or a recession, it is likely that our customers will demand less electricity and that some of our customers may experience difficulties paying their electric bills, possibly increasing our uncollectible accounts. Any of these situations could adversely affect our results of operations and financial condition.
Financial and political events in other parts of the world could also adversely affect our business. For example, the 2016 presidential electionsince 2018, U.S. and China have been involved in the United States considerablya trade war involving protectionist measures, which increased the volatility of financial markets worldwide based ondue to the uncertainty of political decisions. New United States policies could affect world markets and global trade and result in renewed volatility, especially in commodity prices. Moreover, instabilityInstability in the Middle East or in any other major oil producingoil-producing region could also result in higher fuel prices worldwide, which in turn could increaseincreasing the operating cost of fuel for our thermal generation plants and adversely affect our results of operations and financial condition.
In addition, an
The U.S. federal government has experienced shutdowns in recent times, including the 2018—2019 U.S. government shutdown, which affected the SEC among many other federal agencies, and extended for 35 days, the longest federal government shutdown in U.S. history. Even temporary or threatened U.S. government shutdowns could have a material adverse effect on the timing, execution and increased expense associated with our international financings and our M&A activities.
An international financial crisis and its disruptive effects on the financial industry could adversely impact our ability to obtain new bank financings on the same historical terms and conditions that we have benefited from to date.
Political events or financial or other crises could also diminish our ability to access the Chilean and international capital markets or increase the interest rates available to us. Reduced liquidity, could, in turn, could adversely affect our capital expenditures, our long-term investments and acquisitions, our growth prospects and our dividend payout policy.
We may be unable to enter into suitable acquisitions.acquisitions or successfully integrate businesses that we acquire.
On an ongoing basis, we review acquisition prospects that may increase our market coverage or supplement our existing businesses, though there can be no assurance that we will be able to identify and consummate suitable acquisition transactions in the future. The acquisition and integration of independent companies that we do not control is generally a complex, costly and time-consuming process and requires significant efforts and expenditures. If we consummate an acquisition, it could result in the incurrence of substantial debt and assumption of unknown liabilities, the potential loss of key employees, amortization of expenses related to tangible assets and the diversion of management’s attention from other business concerns. In addition, anyintegrating acquired businesses may be difficult, expensive, time-consuming and a strain on our resources and our relationships with our employees and customers and ultimately may not be successful or achieve the benefits expected. Any delays or difficulties encountered in connection with acquisitions and the integration of multiple operationstheir businesses could have a material adverse effect on our business, financial condition or results of operations.
Our business and profitability could be adversely affected if water rights are denied or if water concessions are granted with limited duration.
We own water rights granted by the Chilean Water Authority (Dirección General de Aguas) for the supply of water from rivers and lakes near our production facilities. Under current law, these water rights are (i) for unlimited duration, (ii) absolute and unconditional property rights and (iii) not subject to further challenge. Chilean generation companies must pay an annual license fee for unused water rights. New hydroelectric facilities are required to obtain water rights, the conditions of which may impact design, timing or profitability of a project.
In addition, the Chilean Congress is currently discussinghas discussed amendments to the Water Code since 2014 in order to prioritize the use of water by defining its access as a basic human rightneed that must be guaranteed by the State. The amendment will establish that water use for human consumption, domestic subsistence and sanitation will always take precedence, in both the granting and limiting the exercise of rights of exploitation. Under the proposal: (i) new water use concessions would be limitedRestrictions enacted to 30 years, which would be extendable with respect to water rights actually used during the 30-year period, unless the Chilean Water Authority demonstrates the water rights have not been used effectively; (ii) new non-consumptive water rights would expire if the holder does not exercise the rights within eight years; (iii) existing non-consumptive water rights which have not been used would expire within eight years from the date of enactment of the new Water Code; and (iv) the preservation of waterpreserve environmental flows to protect the ecosystem for future water rights was added for both consumptive and non-consumptive water use and empowers the Chilean Water Authority to mandate an environmental flow requirement for existing water rights. This last point would reduce water availability for generation purposes.
Any limitations on our current water rights, our need for additional water rights, or our current unlimited duration of water concessions could have a material adverse effect on our hydroelectric development projects and our profitability.
Any limitations on our current water rights, our need for additional water rights, or our current unlimited durationAs of water concessions couldthe date of this Report, no resolutions have a material adverse effect on our hydroelectric development projectsbeen adopted and our profitability.the uncertainty remains.
Foreign exchange risks may adversely affect our results and the U.S. dollar value of dividends payable to ADS holders.
The Chilean peso has been subject to devaluations and appreciations against the U.S. dollar and may be subject to significant fluctuations in the future. Historically, a significant portion of our consolidated indebtedness has been denominated in U.S. dollars. Although a substantial portion of our operating cash flows is linked to the U.S. dollarsdollar (primarily coming from the generation business), we generally have been and will continue to be materially exposed to fluctuations of the Chilean peso against the U.S. dollar, because ofwhich is due to time lags and other limitations to pegpegging our tariffs to the U.S. dollar and the eventualpotential difficulty of incurring debtobtaining loans in the same currency as our operating cash flow.
Because of this exposure, the U.S. dollar value of cash generated by our subsidiaries in U.S. dollars can decrease substantially due to peso devaluations against the U.S. dollar. Future volatility in the exchange rate of the currency in which we receive revenues or incur expenditures may adversely affect our business, results of operations and financial condition.
Our long-term energyelectricity sale contracts are subject to fluctuations in the market prices of certain commodities, energy and other factors.
In our conventional generation business, we have economic exposure to fluctuations in the market prices of certain commodities as a result of the long-term energylong term electricity sales contracts into which we have entered, and the fact that currently 83.0% of our expected annual generation is sold under contracts with terms of at least five years.entered. We have material obligations as selling parties under long-termlong term fixed-price electricity sales contracts. Prices in these contracts are indexed according to different commodities, the exchange rate, inflation,rates and the market price of electricity.inflation. Adverse changes to these indices would reduce the rates we charge under our long-term fixed-price electricity sales contracts, which could adversely affect our business, results of operations and financial condition.
In our distribution business, we are also exposed to fluctuations in energyelectricity prices. DuringSince 2016, some customers who are ablehad freely chosen to choose their tariff according the Chilean regulation and chosebe subject to regulated tariffs inhave been switching to the past, elected unregulated tariffs instead.tariff regime instead due to the lower prices. These customers are tendering their electricity needs, either directly or in association with other customers, their energy needs given that unregulatedbecause regulated tariffs are currently lowerhigher than regulated tariffs, which in generalunregulated prices, given that the former are based on contracts tendered in the past at higher prices. Lower market prices might reduce the number of customers that choose regulated tariffs, and customers may choose an alternative energy provider, reducing our number of customers, which could adversely affect our business, results of operations and financial condition.
Our controlling shareholder may exert influence over us and may have a different strategic view for our development than that of our minority shareholders.
Enel, beneficiallyour controlling shareholder, owns 60.6%61.9% (excluding treasury stock) of our share capital.voting shares. Enel our ultimate controlling shareholder, has the power to determine the outcome of substantially all material matters that require shareholdera simple majority of shareholders’ votes in accordance with Chilean corporate law, such as the election of the majority of our board members and, subject to contractual and legal restrictions, the adoption of our dividend policy. Enel also exercises significant influence over our business strategy and operations. Its interests, may in some cases, may differ from those of our minority shareholders. For example, Enel conducts its business operations in the field of renewable energy in Chile through Enel Green Power S.p.A. in which we have no equity interest. Certain conflicts of interest affecting Enel in these matters may be resolved in a manner that is different from interests of our company or of our minority shareholders.
Our electricity business is subject to risks arising from natural disasters, catastrophic accidents and acts of terrorism whichthat could adversely affect our operations, earnings and cash flow.
Our primary facilities include power plants and distribution assets. Our facilities may be damaged by earthquakes, flooding, fires and other catastrophic disasters arising from natural or accidental human causes, as well as acts of protest, vandalism, riot, and terrorism. A catastrophic event could cause prolonged unavailability of our assets, disruptions in our business, significant decreases in revenues due to lower demand or significant additional costs to us not covered by our business interruption insurance. There may be lags between a major accident or catastrophic event and the final reimbursement from our insurance policies, which typically carry a deductible and are subject to per event policy maximum amounts.
In our distribution business, on May 6, 2015 a fire damaged the Alonso de Córdoba Substation in Santiago, cutting power to 50,000 customers in eastern Santiago, where a significant part of the commercial and financial activity of the city is located. Damages totaled US$ 5.8 million. The Chilean authority also fined Enel Distribución Chile 6,000 UTM or (Ch$ 277.1 million).
We are subject to financing risks, such as those associated with funding our new projects and capital expenditures, and risks related to refinancing our maturing debt; we are also subject to debt covenant compliance, all of which could adversely affect our liquidity.
As of December 31, 2016,2018, our consolidated interest-bearing debt totaled Ch$ 820 billion.
Our consolidated interest-bearing2,479,624,032 (including Ch$ 447,317,781 in debt had the following maturity profile:with EFI, a related company).
Ch$ 16 billion from 2018 to 2019;
Ch$ 15 billion from 2020 to 2021; and
Ch$ 771 billion thereafter.
Some of our debt agreements are subject to (1) financial covenants, (2) affirmative and negative covenants, (3) events of default and (4) mandatory prepayments for contractual breaches, among other provisions. A significant portion of our subsidiaries’ financial indebtedness is subject to cross default provisions, which have varying definitions, criteria, materiality thresholds and applicability with respect to subsidiaries that could give rise to such a cross default. We incurred debt in connection with the 2018 Reorganization. As a result, we entered into a debt agreement and we issued US$ 1 billion in bonds in the U.S that are subject to cross default provisions. In addition, since April 2018, we consolidate EGP Chile’s debt and we may incur in additional debt in the future, which may increase our debt leverage and associated financial risk.
In the event that we or our subsidiaries breach any of these material contractual provisions, our debtholders may demand immediate repayment, and a significant portion of our subsidiaries’ indebtedness could become due and payable. We may be unable to refinance our indebtedness or obtain such refinancing on terms acceptable to us. In the absence of such refinancing, we could be forced to dispose of assets in order to make the payments due on our subsidiaries’ indebtedness under circumstances that might not be favorable to obtaining the best price for such assets. Furthermore, we may be unable to sell our assets quickly enough, or at sufficiently high prices, to enable us to make such payments.
We may also be unable to raise the necessary funds required to finish our projects under development or under construction. Market conditions prevailing at the moment we require these funds or other unforeseen project costs can compromise our ability to finance these projects and expenditures.
Our inability to finance new projects or capital expenditures or to refinance our existing debt could adversely affect our results of operation and financial condition.
We rely on electricity transmission facilities that we do not own or control. If these facilities do not provide us with an adequate transmission service, we may not be able to deliver the power we sell to our final customers.
We depend on transmission facilities owned and operated by other unaffiliated power companies to deliver the electricity we sell. This dependence exposes us to several risks. If transmission is disrupted, or transmission capacity is inadequate, we may be unable to sell and deliver our electricity.electricity, as has been the case of some of our solar and wind power plants located in northern Chile. If a region’s power transmission infrastructure is inadequate, our recovery of sales costs and profits may be insufficient. If restrictive transmission price regulation is imposed, transmission companies upon whom we rely may not have sufficient incentives to invest in expansion of their transmission infrastructure, which could adversely affect our operations and financial results. Currently, theThe construction of new transmission lines is takingmay take longer than in the past, mainly because of new social and environmental requirements that are creating uncertainty aboutas to the probabilitytime of completingproject completion.
There have been blackout events in the projects.
In addition, the increase of new NCRE projects is congesting the current transmission system as these projects can be built relatively quickly, while new transmission projects may take longer to be built. In May 2014, the Chilean government’s Energy Agenda established a long-term energy policy. In 2016, a new transmission law called for the interconnection between the Chilean Central Interconnected System (“SIC” in its Spanish acronym) and the Northern Interconnected System (“SING” in its Spanish acronym) by 2019.
On September 24, 2011, nearly 10 million people located in central Chile experienced a blackout (affecting more than half of the Chilean population),past due to the failure of Transelec’s 220 kV Ancoa substation. The failure led to the disruption of two 500 kV transmission lines, in the SIC and the subsequent failure of the remote recovery computer software used by the independent entity that coordinates generators, transmission companies and large customers (“CDEC” in its Spanish acronym) to operate the grid. This blackout, which lasted two hours, exposed weaknesses in the transmission grid and its need for expansion and technological improvements to increase the reliability of the transmission grid.its reliability. Additional failures of lesser magnitude have occurredtransmission lines may occur in the recent past.future.
Any such disruption or failure of transmission facilities could interrupt our business, which could adversely affect our results of operations and financial condition.
Our business may experience adverse consequences if we are unable to reach satisfactory collective bargaining agreements with our unionized employees or if we are unable to retain key employees.
A large percentage of our employees are members of unions and have collective bargaining agreements that must be renewed on a regular basis. Our business, financial condition and results of operations could be adversely affected by a failure to reach agreement with any labor union representing such employees or by an agreement with a labor union that contains terms we view as unfavorable. Chilean law provides legal mechanisms for judicial authorities to impose a collective bargaining agreement if the parties are unable to come to an agreement, which may materially increase our costs beyond what we have budgeted.
In addition, we employ many highly-specialized employees, and certain actions such as strikes, walk-outs or work stoppages by these employees, could adversely impact our business, results of operations and financial condition as well as our reputation.
The relative illiquidity and volatility of the Chilean securities markets and its dependence on economic conditions in Latin America and other parts of the world could adversely affect the price of our common stock and ADS.
Chilean securities markets are substantially smaller and less liquid than the major securities markets in the United States or other developed countries. The low liquidity of the Chilean market may impair the ability of shareholders to sell shares, or holders of ADSs to sell shares of our common stock withdrawn from the ADS program, into the Chilean market in the amount and at the price and time they wish to do so. Also, the liquidity and the market for our shares or ADSs may be affected by a number of factors including variations in exchange and interest rates, the deterioration and volatility of the markets for similar securities and any changes in our liquidity, financial condition, creditworthiness, results and profitability.
In addition, Chilean securities markets may be affected to varying degrees by economic and market conditions and developments in Latin American countries, other emerging markets and elsewhere in the world. Although economic conditions in such countries may differ significantly from economic conditions in Chile, investors’ reactions to developments in any of these other countries may have an adverse effect on the market value and the liquidity of securities for Chilean issuers. An increase in the
perceived risks associated with investing in SouthAmerican countries and elsewhere in the world could lessen capital flows to Chile and adversely affect the Chilean economy in general, and the interest of investors in our shares or ADSs in particular.
We cannot give assurance that theThe price or the liquidity of our shares or ADSs will notmay be negatively affected by events in Latin American markets or the global economy in general.
Lawsuits against us brought outside Chile or complaints against us based on foreign legal concepts may be unsuccessful.
All of our investmentsoperations are located outside of the United States. All of our directors and officers reside outside of the United States and mostsubstantially all of their assets are located outside the United States as well.States. If any investor were to bring a lawsuit against our directors, officers or experts in the United States, it may be difficult for them to effect service of legal process within the United States upon these persons, or to enforce against them, in United States or Chilean courts, judgments obtained in United States courts based upon the civil liability provisions of the federal securities laws of the United States.States, against them in United States or Chilean courts. In addition, there is doubt as to whether an action could be brought successfully in Chile on the basis of liability based solely upon the civil liability provisions of the United States federal securities laws.
Interruption or failure of our information technology, control and communications systems or external attackscyberattacks to or cybersecurity breaches of these systems could have ana material adverse effect on our operations and results.
We depend on information technology, communication and processing systems (“IT Systems”) to operate our businesses, the failure of which could adversely affect our business, results of operations and financial condition.
We operate in an industry that requires the continued operation of sophisticated information technology, control and communications systems (“IT Systems”) and network infrastructure. In addition, we use our IT Systems and infrastructure to create, collect, use, disclose, store, dispose of and otherwise process sensitive information, including company data, customer data, and personal information regarding customers, employees and their dependents, contractors, shareholders and other individuals. In our generation business, IT Systems are vital to our generation subsidiaries’ ability to monitorcritical in controlling and monitoring our power plants’ operations, maintainmaintaining generation and network performance, adequately generategenerating invoices to bill customers, achieveachieving operating efficiencies and meetmeeting our service targets and standards. Our distribution subsidiaries could also be affected adversely because they rely heavilybusiness increasingly relies on IT Systems to monitor theirsmart grids, billing processes for millions of customers and customer service platforms. Temporary or long-lasting operational failuresThe operation of anyour generation and distribution systems is dependent not only on the physical interconnection of theseour facilities with the electricity network infrastructure, but also on communications among the various parties connected to the network. The reliance on IT Systems to manage the information and communication among and between those parties has increased significantly since the deployment of intelligent grids.
Our generation and distribution facilities, IT Systems and other infrastructure, as well as the information processed in our IT Systems could havebe affected by cybersecurity incidents, including those caused by human error. Our industry has begun to see an increase in the volume and sophistication of cyber security incidents from international activist organizations, nation states and individuals, being among the emerging risks identified in our planning process. Cybersecurity incidents could harm our businesses by limiting our generating and distributing capabilities, delaying our development and construction of new facilities or capital improvement projects to existing facilities, disrupting our customer operations or exposing us to liability. Our generation and distribution systems are part of an interconnected system. Therefore, a material adverse effect ondisruption caused by the impact of a cybersecurity incident in the electric transmission grid, network infrastructure, fuel sources or our third party service providers’ operations could also negatively impact our business.
In addition, our business requires the collection and retention of personally identifiable information of our customers, employees and shareholders, who expect that we will adequately protect the privacy of such information. Cybersecurity breaches may expose us to a risk of loss or misuse of confidential and proprietary information. A significant theft, loss, or fraudulent use of personally identifiable information may lead to potentially large costs associated with notifying and protecting the impacted persons, and/or could cause us to become subject to significant litigation, costs, liability, fines, or penalties, any of which could materially and adversely affect our results of operations. Additionally, cyber-attacksoperations, as well as our reputation with customers, shareholders and regulators, among others. In addition, we may be required to incur significant costs associated with governmental actions in response to such intrusions or to strengthen our information and electronic control systems.
The cybersecurity threat is dynamic and evolves continually and, in the electricity industry, is increasing in sophistication, magnitude and frequency. There can have an adverse effectbe no assurance that we can implement adequate preventative measures or accurately assess the likelihood of a cyber-incident. We are unable to quantify the potential impact of cybersecurity incidents on our imagebusiness and our relationship with the community. In the last few years, global cyber-attacks on security systems, treasury operations,reputation. These potential cybersecurity incidents and IT Systems have intensified worldwide. We are exposed to cyber-attacks aimed at damaging our assets through computer networks, cyber spying involving strategic information that may be beneficial for third parties and cyber-theft of proprietary and confidential information, including information of our customers. We are exposed to several types of cyber-attacks, including denial-of-service attacks that may affect the accessibility of our services to our users and attacks that may affect our domain name systems, preventing the use of certain useful web pages and applications.
We have suffered cyber-attackscorresponding regulatory action could result in the past. Further cyber-attacks may occura material decrease in revenues and may affect us adverselyresult in significant additional costs, including penalties, third party claims, repair costs, additional insurance expense, litigation costs, notification and remediation costs, security costs and compliance costs. While we maintain property and casualty insurance, there can be no assurance that liabilities or losses we may incur, including as a result of cybersecurity litigation, will be covered under such policies or that the future.amount of insurance will be adequate.
Item 4.InformationInformation on the Company
A.History and Development of the Company. | A.
| History and Development of the Company.
|
We are a publicly held limited liability stock corporation organized on March 1, 2016 under the laws of the Republic of Chile. Since April 2016, we have been registered in Santiago with the SVSCMF under Registration No. 1139. We are also registered with the SEC under the commission file number 001-37723. We are legally referred to by ourOur full name is Enel Chile S.A. and we are also known commercially as well as by the abbreviated name “Enel Chile.”Chile”.
Enel beneficially owns 60.6%owned 61.9% (excluding treasury stock) of our Company.Company as of December 31, 2018. Our shares are listed and traded on the Chilean Stock Exchanges and our ADRsADSs are listed and traded on the NYSE.
Our contact information in Chile is:
| |
Contact Person: | Nicolás Billikopf |
Street Address: | Santa Rosa 76, Santiago, Código Postal 8330099, Chile |
email: | nicolas.billikopf@enel.com |
Telephone: | (56-2) 2353-4628 |
Web site: | www.enelchile.cl |
The information contained on or linked from our internet website is not included as part of, or incorporated by reference into this Report. The SEC maintains an internet website that contains reports, proxy and information statements, and other information regarding issuers that file electronically with the SEC, such as our company, at http://www.sec.gov.
We are an electricityelectric utility company engaged, through our subsidiaries and affiliates, in the generation, transmission and distribution of electricity businesses in Chile. As of December 31, 2016,2018, we had 6,3517,463 MW of installed capacity and 1.81.9 million distribution customers. Our installed capacity is comprised of 2848 generation facilities, and a total of 111 generation units, of which 54.6% consists of48% are hydroelectric power plants. As of December 31, 2016,2018, we had consolidated assets ofamounting to Ch$ 5,398.77,488 billion and operating revenues of Ch$ 2,5422,457 billion.
We have been known as Enel Chile since the 2016 Reorganization described further below. However, we trace our origins to Compañía Chilena de Electricidad Ltda. (“CCE”), which was formed in 1921 as a result of the merger of Chilean Electric Tramway and Light Co., founded in 1889, and Compañía Nacional de Fuerza Eléctrica, (“CONAFE”), with operations dating back to 1919. In 1970,Following nationalization of CCE in the 1970s, during the 1980s, the Chilean government nationalized CCE. During the 1980s, theelectric utility sector was reorganized through the Chilean Electricity Law, known as Decree with Force of Law No. 1 of 1982 (“DFL1”). CCE’s operations were divided into one generation company, a currently unrelated company, and two distribution companies, one with a concession in the Valparaíso Region, and the other, our predecessor company, with a concession in the Santiago metropolitan region.Metropolitan Region. From 1982 to 1987, the Chilean electric utility sector went through a process of re-privatization. In August 1988, our predecessor company changed its name to Enersis S.A. (“Enersis” and currently known as Enel Américas S.A.) and became the new parent company of Distribuidora Chilectra Metropolitana S.A., later renamed Chilectra S.A (“Chilectra” and currently known as Enel Distribución Chile S.A)S.A.). In the 1990s, Enersis diversified into electricity generation through our increasing equity stakestakes in Endesa Chile currentlyS.A. (currently known as Enel Generación Chile S.A.).
The 2016 Reorganization
During 2016, our shareholders carried outwe completed a corporate reorganization process to separate theEnersis’s Chilean businesses from theits non-Chilean businesses (the “2016 Reorganization”).
The first phase of the 2016 Reorganization involved the separation of the respective Chilean and non-Chilean electricity generation, transmission and distribution businesses of Empresa Nacional de Electricidad S.A. (“Endesa Chile”),Chile, Chilectra and Enersis by means of a “demerger” under Chilean law and the subsequent
distribution of the shares of the newly created entities to each company’s respective shareholders (collectively, the “Spin-Offs”). Following the approvals of the Spin-Offs by the shareholders of Enersis, Endesa Chile and Chilectra at their extraordinary shareholders’ meetings held on December 18, 2015, theThe “demerger” or separation of the businesses occurred on March 1, 2016 and the Spin-Offs were completedeffective in April 2016, with the creation and public listing of the shares of the newly incorporated entities: (i) Enersis Chile S.A. (“, which held the Chilean businesses of Enersis, Chile”),(ii) Endesa Américas S.A. (“Endesa Américas”) and Chilectra Américas S.A. (“Chilectra Américas”). As a result of the Spin-Offs: (i) Endesa Chile spun-off Endesa Américas,, which held the non-Chilean businesses of Endesa Chile, (ii) Chilectra spun-offand (iii) Chilectra Américas S.A., which held the non-Chilean businesses of Chilectra and (iii) Enersis spun-off Enersis Chile, which holds the Chilean businesses of Enersis.
Chilectra. The second phase of the 2016 Reorganization also involved the merger between the companies holding the non‑Chileannon-Chilean assets. On September 28, 2016, the respective shareholders of Enersis Américas S.A., Endesa Américas and Chilectra Américas approved the merger of Endesa Américas and Chilectra Américas with and into Enersis Américas S.A., with Enersis Américas S.A. continuing as the surviving company. The merger combined the non-Chilean generation, transmission and distribution businesses under a single holding company, with the aim of contributing to the simplification of the corporate structure of the group and providing benefits such as subsidiary cash leakage reduction, strategic interest alignment and increased decision-making and operational efficiencies. The merger became effective on December 1, 2016.2016 and merged Endesa Américas S.A. and Chilectra Américas S.A. with and into Enersis Américas S.A. (currently Enel Américas S.A.), with the latter continuing as the surviving company.
As part of this process, we changed our name from Enersis changed its name to Enersis AméricasChile S.A. on March 1, 2016 and subsequently to Enel AméricasChile S.A. on December 1, 2016, and on October 18, 20162016. That same date, (i) Endesa Chile changed its name to Enel Generación Chile S.A.; and (ii) Chilectra changed its name to Enel Distribución Chile S.A.;
The 2018 Reorganization
On August 25, 2017, we proposed a corporate reorganization (the “2018 Reorganization”) to consolidate Enel’s conventional and (iii) Enersisnon-conventional renewable energy businesses in Chile S.A. changed its name tounder our company, Enel Chile, S.A.Enel’s only vehicle to invest in Chile. The 2018 Reorganization involved the following transactions:
· a cash tender offer by Enel Chile of all outstanding shares of common stock (including ADSs) of Enel Generation. The tender offer was subject to the condition that the tendering holders of Enel Generación shares and ADSs use Ch$236 of the Ch$590 tender offer consideration for each Enel Generation share and Ch$7,080 of the Ch$17,700 tender offer consideration for each Enel Generation ADS to subscribe for shares of our common stock at a subscription price of Ch$82 per Enel Chile share (or Ch$2,460 per Enel Chile ADS);
· a capital increase to make available a sufficient number of shares of common stock of Enel Chile to deliver to tendering holders of Enel Generation shares and ADSs to satisfy all conditions precedent; and
· a merger pursuant to which Enel Green Power Latin América S.A. (“EGPL”) merged into Enel Chile. EGPL was a closely held stock corporation organized under the laws of the Republic of Chile. Before the 2018 Reorganization, EGPL was a member of the Enel Green Power group of companies. Enel Green Power is a transnational company dedicated to electricity generation with renewable resources, which in turn is controlled by Enel. EGPL was a renewable energy generation holding company engaged, through its wholly owned subsidiary Enel Green Power Chile Ltda. (“EGP Chile”), in the electricity generation business in Chile.
The different steps of the 2018 Reorganization were approved by the respective shareholders of Enel Chile, Enel Generation and EGPL at their extraordinary shareholders’ meetings held on December 20, 2017. The tender offer occurred between February 16, 2018 and March 22, 2018, the preemptive rights offering in connection with the capital increase took place between February 15, 2018 and March 16, 2018 and the 2018 Reorganization, in the aggregate, was completed and effective on April 2, 2018.
As a result of the consummation of the 2018 Reorganization, we increased our economic interest in Enel Generation from 60% to 93.6% economic interest, we continue to own 99.1% of Enel Distribución and EGP Chile is wholly-owned. Currently, we consolidate the Chilean conventional and renewable electricity generation business through Enel Generation, the Chilean electricity distribution business through Enel Distribución and the Chilean non-conventional renewable electricity generation business through EGP Chile. Enel remains as our parent company and our majority shareholder owning 61.9% (excluding treasury stock) of our Company.
During the last few years, our business strategy has focused on our core business. We have increased our shareholdings in subsidiaries related to electricity generation, divested certain non-strategic assets and reduced the number of our companies, simplifying our corporate structure, mainly through mergers.
We have conducted the following sales of non-core assets over the past three years:
· On September 14, 2016, we sold our 20% equity interest in GNL Quintero S.A. (“GNL Quintero”), to Enagás Chile S.p.A. We obtained this interest in GNL Quintero in 2007, as part of a consortium we formed along with ENAP, Metrogas and British Gas to build the LNG regasification facility in the Quintero Bay. Partial commercial operations of the facility began in September 2009 and full commercial operations began on January 1, 2011.
· On December 16, 2016, we sold our 42.5% equity interest in Electrogas S.A. (“Electrogas”). Electrogas is a company dedicated to the transportation of natural gas and other fuels, which serves our San Isidro and Quintero power plants, among others. We received the proceeds of this sale, amounting to US$ 180 million (Ch$ 115 billion at that time), on February 7, 2017.
In order to simplify our corporate structure, we have continued to reduce the number of our companies over the last three years:
· During 2016, Inversiones GasAtacama Holding Ltda. merged into Celta, which later merged into GasAtacama, the surviving company on November 1, 2016. Celta was our investment vehicle through which we owned the San Isidro thermal plants, the Pangue hydroelectric plant and the Tarapacá thermal generation facility, in addition to our interest in Central Eólica Canela S.A., which owns the Canela wind farms.
· On November 9, 2017, GasAtacama purchased the 25% minority interest of Central Eólica Canela S.A, which was dissolved on December 22, 2017. Our economic interest in GasAtacama was 93.7% as of December 31, 2018.
EGP Chile
EGP Chile currently has 20 operational power plants with a total installed capacity of 1,189 MW consisting of 92 MW of hydroelectric power, 564 MW of wind power, 492 MW of solar power, and 41 MW of geothermal power.
In 2015, EGP Chile focused on continued growth as well as maintenance of existing facilities impacted by natural disasters. In particular, it rebuilt the Diego de Almagro solar power plant after it was damaged by floods, as well as the Talinay Oriente and Talinay Poniente wind plants which were damaged by an 8.4-magnitude earthquake in Northeast Chile. A volcanic eruption in Southern Chile also affected plant operations. That year, EGP Chile also began construction on the Cerro Pabellón geothermal plant (the first in South America at 4,500 meters above sea level), the Los Buenos Aires and Renaico wind farms, and the Pampa Norte solar plant. By the end of 2015, EGP Chile totaled 606 MW of installed capacity and completed construction of the Carrera Pinto solar plant. In 2016, EGP Chile began operating the La Silla solar plant and began construction on the Sierra Gorda Este wind plant and by the end of that year, it reached its goal of 1 GW of installed capacity in Chile, well before the 2017 target.
During 2017, Cerro Pabellón geothermal plant start operation adding 48 MW to the total installed capacity, consolidating us as the Chilean multi-technology leader with a very well diversified portfolio of renewable energy. EGP Chile has become a leader in Chile’s renewable energy market (in terms of installed capacity) with a mixed portfolio of wind, solar, hydroelectric and geothermal power.
Enel X Chile
On September 7, 2018, we formed a new wholly-owned subsidiary, Enel X Chile SpA (“Enel X Chile”), to develop, implement and sell products and services that incorporate innovation and cutting-edge technology and are different from the sale of energy or concessioned energy distribution. Enel X Chile expects to offer turnkey projects for municipalities and other public and governmental entities, industrial or residential customer appliances such as photovoltaic systems, heating ventilation air conditioning, led lighting, projects related to energy efficiency, and the development of public and private electric mobility and charging infrastructure, in all cases including customers outside of our concession area. As of December 31, 2018, we supported installation of over 40 public charge stations, some of which located outside the Metropolitan Region concession area. In addition, we are offering smart charging solutions, including household devices or office devices having a load capacity of 2 to 4 times faster than a conventional plug.
Capital Investments, Capital Expenditures and Divestitures
We coordinate our overall financing strategy, including the terms and conditions of loans and intercompany advances entered into by our subsidiaries, in order to optimize debt and liquidity management. Generally, our operating subsidiaries independently plan capital expenditures financed by internally generated funds or direct financings. One of our goals is to focus on investments that will provide long-term benefits suchand sustainability initiatives. On the other hand, in the distribution business we will continue investing with the aim to allow the connection of new customers, increase the quality of our service and in new technologies (such as energy loss reduction projects.smart meters) to automate our networks. Although we have considered how these investments will be
financed as part of our budget process, we have not committed to any particular financing structure, and investments will depend on the prevailing market conditions at the time the cash flows are needed.
Our investment plan is flexible enough to adapt to changing circumstances by giving different priorities to each project in accordance with profitability and strategic fit. Investment priorities are currently focused on the distribution business, related to network reliability, capacity improvement and new technology developments such as smart meters.
For the 2017-20192019-2021 period, we expect to make capital expenditures of Ch$ 8881,355 billion in our subsidiaries, related to investments currently in progress, maintenance of our distribution network maintenance of existingand generation plants and in the studies required to develop other potential generation and distribution projects. For further detail regarding these projects, please see “Item 4. Information on the Company — D. Property, PlantsPlant and Equipment—Equipment — Projects Under Development.”Development”.
The table below sets forth the expected capital expenditures for the 2017-20192019-2021 period and the capital expenditures incurred in 2016, 20152018, 2017 and 2014:2016:
| | | |
| | Estimated 2017-2019 | | | 2016 | | | 2015 | | | 2014 | |
| | (in millions of Ch$) | |
Capital Expenditure(1) | | | 887,928 | | | | 222,386 | | | | 309,503 | | | | 196,932 | |
| | Estimated
2019-2021 | | 2018 | | 2017 | | 2016 | |
| | (in millions of Ch$) | |
Capital Expenditure(1) | | 1,355,018 | | 300,539 | | 266,030 | | 222,386 | |
(1)Capex amounts represent effective payments for each year, except for future projections.
In the past, we reported a five‑year estimate of future capital expenses. However, while
While our planned investments go beyond the three years highlighted in this table, we are now reporting three years to be aligned with Enel’s three-year industrial plan that was disclosed in November 2016.2018. For further information, please refer to “Item 4. Information on the Company — D. Property, PlantsPlant and Equipment.Equipment — Project Investments” and “Item 5. Operating and Financial Review and Prospects — F. Tabular Disclosure of Contractual Obligations.”Obligations”.
Capital Expenditures forin 2018, 2017 and 2016 2015 and 2014
Our capital expenditures in the last three years were principally related to the optimization of the 350 MW Bocamina II power plant, improvements to the Tarapacá coal-fired power plant, the construction of the 150 MW Los Cóndores power plant and maintenance of our current power plants. TheInvestments related to the Bocamina II and Tarapacá power plants focused on making improvements to reduce environmental impact. These improvements were the consequence of environmental injunctions in the case of Bocamina II and new environmental regulations in the case of Tarapacá. The improvements to Bocamina II were completed in 2018, while those of Tarapacá in 2017. During 2018, we also concluded investments associated with the 48 MW Cerro Pabellón power plant, suspended operationsthe first geothermal plant in December 2013 dueSouth America.
In 2018, our investments in the distribution business were focused on connections of new customers, reinforcing feeders mainly to environmental injunctionsincrease our service quality, increasing the capacity of our substations, automatization of our systems through the installation of control remote devices and resumed operations in July 2015. On April 2, 2016, the Environmental Qualifications Resolutionssmart meters for “optimization” (environmental improvements) were approved. We expect to complete the improvements in 2018.residential customers.
Investments currently in progress
In our generation business, material plans in progress include:include Los Cóndores project, which began construction in 2014 with completion expected during 2020. For further detail of the Los Cóndores project, please see “Item 4. Information on the Company — D. Property, Plant and Equipment. — Projects Under Construction.”
In our distribution business, we plan to continue to expand our services, control energy losses and increase our quality of service in order to improve the efficiency of our facilities, profitability of our business and increase our capacity to satisfy our growing number of customers and their increasing demands. | (i)
| the optimization of Bocamina II, in connection with environmental improvements for the power plant (including coating of the fields of carbon, filters of biomass) and sustainability initiatives (including relocation programs for families living near the power plant, agreements with fishermen in order to support their economic activities in the Coronel Bay, funds that seek to develop sustainable projects agreed to with the local community); and
|
| (ii)
| Los Cóndores project, a 150 MW hydroelectric power plant located in the El Maule region, which began construction in 2014 with completion expected by the end of 2018.
|
A portion of our capital expenditures is reserved for maintenance, and for the assurance of quality and operational standards of our facilities.
In our distribution business, we plan to continue to expand our services and reduce energy losses in order to improve the efficiency of our facilities and profitability of our business. Our current distribution projects seek to increase the connections available to end customers.
Projects in progress will be financed with resources provided by external financing as well as internally generated funds.
B.Business Overview.
We are a publicly held limited liability stock corporation with all of our consolidated operationsthat operates in Chile. Our core businesses arebusiness is electricity, both generation and distribution, which wedistribution. We conduct our business through Enel Generación ChileGeneration and Enel Distribución Chile, as well asDistribution, and their respective subsidiaries.
We also participate in other activities whichbut that are not part of our core business. Since these non-core activitiesbusinesses and represent less than 1% of our 2016 revenues, we2018 revenues. We do not report them as separate business segmentssegment in this Report ornor in our consolidated financial statements.
The table below presents our revenues:
| | Year ended December 31, | | | Year ended December 31, | |
Revenues | | 2016 | | | 2015 | | | 2014 | | | Change 2016 vs. 2015 | | | 2018 | | 2017 | | 2016 | | Change
2018 vs. 2017 | |
| | (in millions of Ch$) | | | (in %) | | | (in millions of Ch$) | | (in %) | |
Generation | | | 1,659,727 | | | | 1,543,812 | | | | 1,220,566 | | | | 7.5 | | | 1,580,653 | | 1,634,937 | | 1,659,727 | | (3.3 | ) |
Distribution | | | 1,315,761 | | | | 1,257,732 | | | | 1,127,893 | | | | 4.6 | | | 1,263,224 | | 1,326,659 | | 1,315,761 | | (4.8 | ) |
Other businesses and intercompany transaction adjustments | | | (433,921 | ) | | | (402,515 | ) | | | (299,393 | ) | | | 7.8 | | | (386,716 | ) | (438,618 | ) | (433,921 | ) | (11.8 | ) |
Total revenues | | | 2,541,567 | | | | 2,399,029 | | | | 2,049,066 | | | | 5.9 | | | 2,457,161 | | 2,522,978 | | 2,541,567 | | (2.6 | ) |
For further financial information related to our revenues, see “Item 5. Operating and Financial Review and Prospects — A. Operating Results” and Note 3235 of the Notes to our consolidated financial statements.
Electricity Generation Business Segment
Our consolidated
We, through our subsidiary Enel Generation, in which we hold a 94% economic interest as of the date hereof, are a generation operator in the SEN, representing 34.2% of the electricity salesmarket share in 2016 were 23,689 GWh and our production was 17,564 GWh, a 0.6% increase and a 4.0% decrease, respectively, compared to 2015.2018.
As of December 31, 2016,2018, we accounted for 29%31.5% of Chile’sthe SEN’s total generation capacity, measured by the installed capacity, asaccording to figures published by the CDEC.National Electricity Coordinator (“CEN” in its Spanish acronym). Hydroelectric, installed capacity represents 54.6%thermal, solar, wind and geothermal power represent 47.5%, 36.7%, 6.6%, 8.6% and 0.5% of our total installed capacity in Chile, thermoelectric represents 44.2% and wind power represents 1.2%.respectively.
For additional detail on our historical capacity, see “Item 4. Information on the Company — D. Property, PlantsPlant and Equipment.”
The following tables summarize the information relating to our capacity, electricity generation:
ELECTRICITY DATAgeneration and energy sales:
| | Year ended December 31, | |
| | 2016 | | | 2015 | | | 2014 | |
Number of generating units(1) | | | 111 | | | | 111 | | | | 111 | |
Installed capacity (MW)(2) | | | 6,351 | | | | 6,351 | | | | 6,351 | |
Electricity generation (GWh) | | | 17,564 | | | | 18,294 | | | | 18,063 | |
Energy sales (GWh) | | | 23,689 | | | | 23,558 | | | | 21,156 | |
ELECTRICITY DATA
| | Year ended December 31, | |
| | 2018 | | 2017 | | 2016 | |
Number of generating units(1) (2) | | 1,030 | | 111 | | 111 | |
Installed capacity (MW)(3) | | 7,463 | | 6,351 | | 6,351 | |
Electricity generation (GWh) | | 20,046 | | 17,073 | | 17,564 | |
Energy sales (GWh) | | 24,369 | | 23,356 | | 23,689 | |
(1)
| For details on generation facilities, see “Item 4. Information on the Company — D. Property, Plants and Equipment — Property, Plant and Equipment of Generating Companies.”
|
(2)
| Total installed capacity is defined as the maximum capacity (MW), under specific technical conditions and characteristics. In most cases, installed capacity is confirmed by satisfaction guarantee tests performed by equipment suppliers. Figures may differ from installed capacity declared to governmental authorities and customers, according to criteria defined by such authorities and relevant contracts.
|
(1) For details on generation facilities, see “Item 4. Information on the Company — D. Property, Plant and Equipment — Property, Plant and Equipment of Generation Companies.”
(2) The increase in the number of generating units from 2017 to 2018 is the result of including the EGP Chile solar plants, since each inverter element is considered a generating unit.
(3) Total installed capacity is defined as the maximum capacity (MW), under specific technical conditions and characteristics. In most cases, installed capacity is confirmed by satisfaction guarantee tests performed by equipment suppliers. Figures may differ from installed capacity declared to governmental authorities and customers, according to criteria defined by such authorities and relevant contracts.
Our consolidated electricity generation was 20,046 GWh in 2018 and our sales were 24,369 GWh, which represents a 17% and 4% increase, when compared to 2017, respectively.
InDividing the electricity industry, it is common to divide thegeneration business into hydroelectric, thermoelectric and other generation is customary in the electricity industry, because each generation type of generation has significantly different variable costs. Thermoelectric generation, for instance, requires the purchase of fuel, which generally leads to higher variable costs than hydroelectric generation from reservoirs or rivers that normally has minimal variable
costs. Of our total consolidated generation in 2016, 51.7%2018, 56.8% was from hydroelectric sources, 47.7%31.3% was from thermal sources and less than 1%11.9% was from solar and wind energy, which is generated by the Canela I and Canela II wind farms, which are subsidiaries of GasAtacama Chile (the continuing company of Celta after their merger on November 1, 2016).energy.
The following table summarizes our consolidated generation by type of energy:
GENERATION BY TYPE OF ENERGY (GWh)
| | Year ended December 31, | |
| | 2018 | | 2017 | | 2016 | |
| | Generation | | % | | Generation | | % | | Generation | | % | |
Hydroelectric | | 11,395 | | 56.8 | | 9,652 | | 56.5 | | 9,078 | | 51.7 | |
Thermal | | 6,268 | | 31.3 | | 7,292 | | 42.7 | | 8,379 | | 47.7 | |
Other generation(1) | | 2,384 | | 11.9 | | 129 | | 0.8 | | 107 | | 0.6 | |
Total generation | | 20,046 | | 100 | | 17,073 | | 100 | | 17,564 | | 100 | |
| | Year ended December 31, | |
| | 2016 | | | 2015 | | | 2014 | |
| | Generation | | | % | | | Generation | | | % | | | Generation | | | % | |
Hydroelectric | | | 9,078 | | | | 51.7 | | | | 11,842 | | | | 64.7 | | | | 11,561 | | | | 64.0 | |
Thermal | | | 8,379 | | | | 47.7 | | | | 6,314 | | | | 34.5 | | | | 6,344 | | | | 35.1 | |
Other generation(1) | | | 107 | | | | 0.6 | | | | 138 | | | | 0.8 | | | | 158 | | | | 0.9 | |
Total generation | | | 17,564 | | | | 100 | | | | 18,294 | | | | 100 | | | | 18,063 | | | | 100 | |
(1)
| (1)Other generation refers to the generation from the Canela I and Canela II wind farms. |
The potential for contracting electricity is generally related to electricity demand. Customers identified as small volume regulated customers, including residential customers, are subject to government regulated electricity tariffs and must purchase electricity directly from a distribution company. These distribution companies, which purchase large amounts of electricity for small volume residential customers, generally enter into contractual agreements with generators at a regulated tariff price. Those identified as large volume industrial customers also enter into contractual agreements with energy suppliers. However, such large volume industrial customers are not subject to the regulated tariff price. Instead, these customers are allowed to negotiate the energy price with generators based on the characteristics of the service required. Finally, the pool market, where energy is normally sold at the spot price, is not carried out through contracted pricing.generation from wind and solar energy.
The following table contains information regarding our consolidated sales of electricity by type of customer for each of the periods indicated:
ELECTRICITY SALES BY CUSTOMER TYPE (GWh)
| | Year ended December 31, | |
| | 2018 | | 2017 | | 2016 | |
| | Sales | | % of Sales
Volume | | Sales | | % of Sales
Volume | | Sales | | % of Sales
Volume | |
Regulated customers | | 15,645 | | 64.2 | | 17,029 | | 72.9 | | 18,516 | | 78.2 | |
Unregulated customers | | 7,549 | | 31.0 | | 5,586 | | 23.9 | | 4,321 | | 18.2 | |
Total contracted sales(1) | | 23,194 | | 95.2 | | 22,615 | | 96.8 | | 22,838 | | 96.4 | |
Electricity pool market sales | | 1,174 | | 4.8 | | 742 | | 3.2 | | 852 | | 3.6 | |
Total electricity sales | | 24,369 | | 100 | | 23,356 | | 100 | | 23,689 | | 100 | |
| | Year ended December 31, | |
| | 2016 | | | 2015 | | | 2014 | |
| | Sales | | | % of Sales Volume | | | Sales | | | % of Sales Volume | | | Sales | | | % of Sales Volume | |
Regulated customers | | | 18,516 | | | | 78.2 | | | | 17,622 | | | | 74.8 | | | | 15,838 | | | | 74.9 | |
Unregulated customers | | | 4,321 | | | | 18.2 | | | | 4,319 | | | | 18.3 | | | | 4,065 | | | | 19.2 | |
Total contracted sales(1) | | | 22,838 | | | | 96.4 | | | | 21,940 | | | | 93.1 | | | | 19,903 | | | | 94.1 | |
Electricity pool market sales | | | 852 | | | | 3.6 | | | | 1,618 | | | | 6.9 | | | | 1,254 | | | | 5.9 | |
Total electricity sales | | | 23,689 | | | | 100 | | | | 23,558 | | | | 100 | | | | 21,157 | | | | 100 | |
(1)
| Includes the sales to distribution companies not backed by contracts.
|
Specific energy consumption limits (measured(1) Includes sales to distribution companies not backed by contracts.
Dividing sales by customer type in GWh) forterms of regulated and unregulated customer is useful in managing and understanding the business. We sell electricity to regulated customers through distribution companies and to unregulated customers directly. The sales to distribution companies to supply the distributors’ regulated customers, that is, either residential, commercial or others, are classified as regulated sales and are subject to government regulated electricity tariffs. The sales of generation companies to distribution companies to supply the distributors’ unregulated customers are established. Moreover,also classified as unregulated sales and are also governed by contracts at a freely negotiated prices and terms. We directly sell to large commercial and industrial customers and other generators are classified as unregulated sales and are generally governed by contracts with freely negotiated prices and terms. Finally, pool market sales are the sales that take place when generation companies are dispatched by the CEN in excess of their contractual obligations and therefore must sell their surplus electricity in the pool market, or when the generators electricity dispatched is less than their contractual commitments with their customers and therefore must purchase the deficit in the pool market. These purchase and sale transactions among electricity companies are normally carried out in the pool market at the spot price, and do not require a contractual agreement.
The regulatory frameworksframework often requirerequires that regulatedelectricity distribution companies have contracts to support their commitments to small volume customers andcustomers. Chilean regulations also determine which customers can purchase energy directly in the electricity pool markets.market.
We attempt to minimize the risk of electricity generation deficits resulting from poor hydrological conditions in any given year by limiting our contractual sales requirements to a quantity that does not exceed our estimated electricity production in a dry year. We consider the available statistical information concerning rainfall, mountain snow and ice, and when they are expected to melt, hydrological levels, and the capacity of key reservoirs to determine our estimated production for a dry year. In addition to limiting contracted sales, we may adopt other strategies including installing temporary thermal capacity, negotiating lower consumption levels
with unregulated customers, negotiating with other water users and including pass-through cost clauses in contracts with customers to cover the cost of spot market purchases.
In 2022, distribution company contracts awarded in the August 2016 auction will come into effect and therefore the tariffs of our regulated contracts will decrease by 6% as a consequence of the lower prices offered by NCRE providers in the energy auction for distribution companies. In 2024, contracts awarded in the November 2017 auction will come into effect with an average price of US$ 32.5 per MWh, which is 31% lower than the average price of the previous tender process. We routinely participate in energy bids and we have been awarded long-term energy sale contracts that incorporate the expected variable costs considering changes to the most relevant variables. These contracts secure the sale of our current and expected new capacity and allow us to stabilize our income.
In November 2017, the outcome of the latest bidding process was announced. This process tendered 2,200 GWh per year to be delivered between 2024 and 2043. The total amount of energy tendered was based on renewable energy offers, thus representing a milestone in the industry. We, through Enel Generation, were awarded 54% of the tender, corresponding to 1.2 TWh at an average price of US$ 34.7 per MWh with a mix of wind, solar and geothermal generation, these prices are 6.8% higher than the average price.
In terms of expenses, the primary variable costs involved in the electricity generation business, in addition to the direct variable cost of generating hydroelectric or thermal electricity such as fuel costs, are energy purchases and transportation costs. During periods of relatively low rainfall conditions,hydrology, the amount of our thermal generation increases. This involves an increase in the amount of the total fuel costrequired and the costs of its transportation to the thermal generation power plants. Under droughtdry conditions, electricity that we have contractually agreed to provide may exceed the amount of electricity that we are able to generate, which requires usgenerate. Therefore, to satisfy our contractual commitments, we may be required to purchase electricity in the pool market at spot prices in order to satisfy our contractual commitments.market prices. The cost of these purchases at spot prices, may, under certain circumstances, may exceed the price at which we sell electricity under contracts and, therefore, may result in a loss. We attempt to minimize the effect of poor hydrological conditions on our operations in any given year by limiting our contractual sales requirements to a quantity that does not exceed theour estimated electricity production in a dry year. To determine an estimated production in a dry
year, we take into considerationWe consider the available statistical information concerning rainfall, mountain snow and ice which isand when they are expected to melt, hydrological levels, and the capacity of key reservoirs.reservoirs to determine our estimated production for a dry year. In addition to limiting contracted sales, we may adopt other strategies including installing temporary thermal capacity, negotiating lower consumption levels with unregulated customers, negotiating with other water users and including pass-through cost clauses in contracts with customers.
Seasonality
While our core business is subject to weather patterns, generally only extreme events such as prolonged droughts, which may adversely affect our generation capacity, rather than seasonal weather variations, materially affect our operating results and financial condition.
The generation business is affected by seasonal changes throughout the year. During normal hydrological years, snow meltssnowmelts typically occur during the warmer months of October through March. These snow meltssnowmelts increase the level of water in our reservoirs. The months with most precipitation are typically May through August.
When there is more precipitation, hydroelectric generating facilities can accumulate additional water to be used for generation. The increased level of our reservoirs allows us to generate more electricity with hydro power plants during months in which marginal electricity costs are lower.
In general, hydrological conditions such as droughts and insufficient rainfall adversely affect our generation capacity. For example, severe prolonged drought conditions or reduced rainfall levels in Chile caused by El Niño phenomenon reduces the amount of water that can be accumulated in reservoirs, thereby curtailing our hydroelectric generation capacity. In order to mitigate hydrological risk, hydroelectric generation may be substituted with thermal generation (natural gas, LNG, coal or diesel) and energy purchases on the spot market, both of which could result in higher costs, in order to meet our obligations under contracts with both regulated and unregulated customers.
Operations
We own and operate a total of 11148 generation unitspower plants in Chile both directly and through our subsidiaries, EGP Chile, GasAtacama Chile and Pehuenche. Of these generation units, 38power plants, 18 are hydroelectric, with a total installed capacity of 3,465 MW. This represents 54.6%3,548 MW, representing 48 % of our total installed capacity in Chile. There are 2211 thermal generation unitspower plants (including a geothermal power plant) that operate with gas, coal or oil with a total installed capacity of 2,8082,781 MW, representing 44.2%37 % of our total installed capacity in
Chile. There are 9 wind powered generation power plants with an aggregate installed capacity of 642 MW, representing 9% of our total installed capacity in Chile. There are 51 wind10 solar powered generation unitspower plants with an aggregate installed capacity of 78492 MW, representing 1.2%7% of our total installed capacity in Chile. AllOn November 21, 2017, the integration of our generation units are connected to the SIC except for eight of GasAtacama Chile’s thermoelectric generation units which are connected toand the SING into one interconnected system was completed and resulted in northernthe creation of the SEN, a new national interconnected system that extends from Arica in the north of Chile to Chiloé in the south of Chile.
For information on the installed generation capacity for each of our subsidiaries, see “Item 4. Information on the Company — D. Property, PlantsPlant and Equipment.”
Our total gross electricity generation in Chile (including the SIC and the SING) accounted for 23.9%27.8 % of total gross electricity productiongeneration in Chile during 2016.2018.
The following table sets forth the electricity generation by each of our generation companies:
ELECTRICITY GENERATION BY COMPANY (GWh)
| | Year ended December 31, | |
| | 2018 | | 2017 | | 2016 | |
Enel Generation | | 11,314 | | 10,976 | | 11,538 | |
EGP Chile(1) | | 2,673 | | — | | — | |
Pehuenche | | 2,794 | | 2,443 | | 2,369 | |
GasAtacama | | 3,265 | | 3,654 | | 3,657 | |
Total | | 20,046 | | 17,073 | | 17,564 | |
| | Year ended December 31, | |
| | 2016 | | | 2015(1) | | | 2014(1) | |
Enel Generación Chile | | | 11,538 | | | | 10,450 | | | | 10,092 | |
Pehuenche | | | 2,369 | | | | 2,959 | | | | 2,902 | |
Celta(1) | | | — | | | | 3,614 | | | | 4,553 | |
GasAtacama Chile(1) | | | 3,657 | | | | 1,270 | | | | 516 | |
Total | | | 17,564 | | | | 18,294 | | | | 18,063 | |
(1)
| In November 2016, Celta was merged into GasAtacama Chile.
|
In 2016, Chilean reservoirs reached 3,049 GWh(1) Includes all of energy equivalent, a 1,360 GWh decrease, or 30.8%, compared to 4,409 GWh in 2015. In 2014, the energy equivalent was 3,886 GWh. EGP Chile’s subsidiaries
The following table sets forth the electricity generation by type:
ELECTRICITY GENERATION BY TYPE (GWh)
| | Year ended December 31, | | | Year ended December 31, | |
| | 2016 | | | 2015 | | | 2014 | | | 2018 | | 2017 | | 2016 | |
| | Generation | | | % | | | Generation | | | % | | | Generation | | | % | | | Generation | | % | | Generation | | % | | Generation | | % | |
Hydroelectric generation | | | 8,815 | | | | 50.2 | | | | 11,557 | | | | 63.2 | | | | 11,271 | | | | 62.4 | | | 11,101 | | 55.4 | | 9,392 | | 55.0 | | 8,815 | | 50.2 | |
Thermal generation | | | 8,379 | | | | 47.7 | | | | 6,314 | | | | 34.5 | | | | 6,344 | | | | 35.1 | | | 6,268 | | 31.3 | | 7,292 | | 42.7 | | 8,379 | | 47.7 | |
Wind generation – NCRE(1) | | | 107 | | | | 0.6 | | | | 138 | | | | 0.8 | | | | 158 | | | | 0.9 | | |
Mini-hydro generation – NCRE(2) | | | 263 | | | | 1.5 | | | | 285 | | | | 1.6 | | | | 289 | | | | 1.6 | | |
Wind generation — NCRE(1)(3) | | | 1,352 | | 6.7 | | 129 | | 0.8 | | 107 | | 0.6 | |
Mini-hydro generation — NCRE(2) | | | 293 | | 1.5 | | 260 | | 1.5 | | 263 | | 1.5 | |
Solar generation — NCRE(2) | | | 872 | | 4.4 | | — | | — | | — | | — | |
Geothermal generation — NCRE(2) | | | 159 | | 0.8 | | — | | — | | — | | — | |
Total generation | | | 17,564 | | | | 100 | | | | 18,294 | | | | 100 | | | | 18,063 | | | | 100 | | | 20,046 | | 100 | | 17,073 | | 100 | | 17,564 | | 100 | |
(1)
| Electricity generated by the Canela I and Canela II wind farms.
|
(2)
| Electricity generated by the Palmucho and the Ojos de Agua mini-hydroelectric plants.
|
(1) For 2017, electricity generated by the Canela I and Canela II wind farms.
(2) For 2017, electricity generated by the Palmucho and the Ojos de Agua mini-hydroelectric plants.
(3) Includes all EGP Chile wind farms.
Water Agreements
Water agreements refer to the right of a user to useutilize water from a waterparticular source, such as a river, stream, pond or groundwater. In times of good hydrological conditions, water agreements are generally not complicated or contentious. However, in times of poor hydrological conditions, water agreements protect our abilityright to use water resources for hydroelectric generation.
Through our subsidiaries, we have three agreements in force with the purpose of utilizing water for both irrigation and hydroelectric generation more efficiently. Two of them are agreements between Enel Generación ChileGeneration and the Chilean Water Works Authority (“DOH” in its Spanish acronym) and are related to the water consumption during the most intense irrigation period (normally from September to April) from Laja Lake and Maule Lagoon, both located in southern Chile. Enel Generación ChileGeneration signed the first agreementsagreement with the DOH with respectrelated to Laja Lake and Maule Lagoon on October 24, 1958 and September 9, 1947, respectively. Both basins have been severely impacted by drought conditions
After four years of studies and high consumption over the past several years. As a result, during recent years, Enel Generación Chile and the DOH signed supplementary agreements that apply for special irrigation periods depending on hydrological conditions. These agreements will allowdialogue with different sectors making use of water from the Laja Lake, on November 16, 2017, the Operation and Maule Lagoon reservoirsRecovery of Laja Lake Agreement was signed, which complements the agreement signed with DOH in 1958. This agreement provides reasonable irrigation security to recoverirrigators in the area, giving priority to extractions for irrigation when the reservoir is at low levels, which are also used by generation. It also contemplates the use of a certain volume of water to maintain the scenic beauty of Salto del Laja, a well-known tourist attraction in the area. It also significantly improves the flexibility in the use of water, eliminating most of the restrictions that existed in the form of water extraction, replacing it by annual volumes that will manage irrigation and generation according to their accumulated water levels and to preserve water use for future years. The thirdneeds. Another agreement was signed in September 2016October 2018 between our subsidiary Pehuenche and the Canal Melado irrigators inof the Maule basinLagoon Monitoring Board to optimize the use of the water during the drought periods. These agreements allow us to use the water more efficiently and to avoid further litigation with the local community, especially with farmers.
Thermal Generation
Our thermal electricelectricity generation facilities mainly use mostly LNG, coal and to a lesser extent, diesel. This mix allows us to use other fuels if the price of LNG iswere to be relatively too high, if there iswere to be a shortage of supply, or if there is another circumstance that makeswere to make LNG unavailable. In order toTo satisfy our natural gas and transportation requirements, we signed a long-term gas contractssupply contract with suppliers that establishestablishes maximum supply amounts and prices, as well as long-term gas transportation agreements with the pipeline companies. Currently, we use Gasoducto GasAndes S.A. (an unaffiliated entity) and Electrogas S.A. (our associate until February 2017) asare our suppliers.current gas transportation providers. Since March 2008, all of our natural gas units can operate using either natural gas or diesel and since December 2009, San Isidro, San Isidro 2 and Quintero power plants operate using LNG.
The LNG contract for LNG is the largest supply contract and it is based on long-term agreements between Enel Generación Chileus and the Quintero LNG Terminal (“GNLQ terminal”) for regasification services and British Gas for supply. In July 2013, Enel Generación Chile renegotiated theOur LNG Sale and Purchase Agreement with British Gas and modified some conditions of the original contract. Enel Generación Chile’s current LNG Sale and Purchase Agreement with British Gas runsis in force through 2030 and is indexed to the Henry Hub/Brent commodity prices. We receive 29.7 TBtu of gas annually, andDuring 2018, the contract provides the flexibilityQuintero LNG Terminal unloaded 44 shipments, with a content equivalent to purchase an additional amount between 23.6 TBtu and 24.6 TBtu. There are contingencies in the contract that would allow cancellations (for a fee), and deviations, under certain conditions. We are not dependent on any one particular source of LNG, as long as the LNG meets the contracted specifications.
The Terminal Use Agreement, between Enel Generación Chile and the GNLQ terminal, is the most relevant for our LNG supply and is sufficient to meet our current needs. This contract runs through 2035, has a fixed pricing structure of 10% return on assets plus a marketing fee and allows us, through GNL Chile, to access additional supply from the spot market, if needed.
These contracts allow us to secure its long-term LNG supply at competitive prices, with significant flexibility and the addition of new capacity sufficient for our current and potential needs.
Enel Generación Chile also exercised a priority right to purchase additional regasification capacity as part of an expansion of the GNLQ terminal. This allowed us to increase our regasification capacity from 3.2 million cubic meters per day to 5.4 million cubic meters per day since first quarter of 2015. This additional capacity allows our San Isidro and Quintero facilities to provide additional thermal generation, to secure the regasification for future power plants, as well as develop new businesses, such as the lease agreement signed with Gener in 2015, which has allowed us to generate energy utilizing our additional capacity of LNG in Gener’s Nueva Renca combined-cycle power plant.
In September 2016, Enel Generación Chile completed the sale of its 20% equity interest in GNL Quintero S.A. to Enagás Chile S.p.A., but retained our contracted capacity for LNG supply.
In 2016, Enel Generación Chile, together with ENAP and Metrogas exported 2743,523 million cubic meters of natural gas, fromof which 1,096 million cubic meters corresponded to Enel Generation for its generation and commercialization requirements.
Regarding the GNLQ terminal to Argentinasupply of natural gas, a milestone was achieved during the winter through an existing transport infrastructure, which includeslast quarter of 2018. In a new environment of cooperation and promotion of energy integration by governments and private actors in Argentina and Chile, and after eleven years of interrupted supply gas supply, it was possible to reactivate the LNG satellite stationsimport of natural gas from Argentina. In this context, Enel Generation signed interruptible supply agreements for natural gas with YPF and Total Austral and the pipeline network used to transport gas fromcorresponding export permits were obtained in Argentina, to Chile fromallowing the late 1990’s until 2006. Enel Generación Chile contributed 57%supply of the gas volume. This export was unprecedented and considered a milestone in natural gas commercialization.
We also contracted capacity in the LNG truck loading facility (“TLF”) in the GNLQ terminal through Enel Generación Chile, which has allowed us to sell natural gas to industrial customers since August 2014. During 2014, a 20-yearbegin on December 28, 2018, to be used in the operation of the San Isidro power plant.
The agreement was signed with GasValpo (a gas distribution company) to distributeof the Nueva Renca thermal power plant that were entered into by AES Gener and subsequently by Empresa Eléctrica Santiago (currently known as Empresa de Mercado Eléctrico S.A.), allowed natural gas usingto be available to Nueva Renca in 2010. With this availability, the TLFelectrical energy produced by Nueva Renca, which was approximately 0.5 TWh, accounted for new customersthe electrical energy balance of Enel Generation and helped to reduce our spot energy purchases.
From the point of view of gas commercialization, during 2018, Enel Generation had five LNG shipment sales transactions, including the sale to Enel Trade of two LNG shipments with delivery to the United Kingdom, continuing international trading transactions for shipments under the contract with BG Global Energy Ltda. in various cities in Chile. The first stage began operations in August 2015 to supply the cityrelevant international markets, outside of Talca (270 km south of Santiago) Latin America.
In addition, Enel Generation, together with ENAP and later in 2015 to supply the cities of Coquimbo and La Serena (both approximately 475 km north of Santiago) and Los Andes (84 km south of Santiago). In May 2016, we began to operateAgesa, implemented a new satellite stationagreement for the export of natural gas from the Quintero LNG Terminal to supply Intergas, Argentina with Empresa Nacional de Energía distributorArgentina in 2018. Gas shipments totaled 90.6 million cubic meters, of which Enel Generation contributed 55% of the city of Temuco (700 km south of Santiago). Other plants are currently in construction and will start to operate in 2017, which will strengthen our position in the LNG distribution business to industrial customers.total exported volume.
During 2016, Enel Generación Chile signed
In 2018, the Terminal Use Agreement signed with GNL Mejillones a port located in northern Chile, to discharge allowed the unloading of an LNG becoming one of the main suppliers in the zone.shipment at this terminal. This agreement allowed us to renewthe renewal of gas purchase contractsagreements with important mining and industrial customers in the north of Chile, making of Enel Generation the main industrial gas trader in the north of Chile, in addition to having volumes of this gas available to Enel Generation thermal units connected to the northern gas pipeline network (Taltal and GasAtacama).
In relation to supply our thermal plantsthe commercialization of LNG by trucks, 2018 was marked by a 30% increase compared to 2017. During 2018, new agreements were reached that are part of the SING.will allow distribute natural gas to two new cities.
During 2016, 1,263With respect to coal-based power plant operations, during 2018, 1,037 kilotons of coal were consumed by the Tarapacá and Bocamina power plants, an increaseplants. This consumption was equivalent of 540 kilotons compared to 2015. The higher coal consumption is mainly due to the return2.3 TWh of theenergy generated by Bocamina I2, 0.6 TWh generated by Bocamina and II units to normal operating conditions in 2016, after they were stopped for 8 and 18 months, respectively, until July 2015, due to judicial issues affecting the power plants. 0.01 TWh generated by Tarapacá.
Generation from NCRE sources
Under Chilean law, powerelectricity generation companies must derive a minimum amount of their energy sales from NCRE. This minimum amount depends on the date of execution of the sale contract and ranges from zero, for those signed prior to 2007, to 20% for those signed starting in July 2013. Currently, our Canela wind farms, Ojos de Agua mini-hydroelectric plant, and 40% of the installed capacity of our Palmucho mini-hydroelectric plant, as well as most of EGP Chile’s power plants (except Pullinque y Pilamiquén power plants) qualify as NCRE facilities. We have fully complied with the applicable NCRE generation requirements since the promulgation of the law. The additional cost of generating electricity using NCRE facilities is being charged as a pass-through costs in our new contracts, which mitigates the impact to our operating income.
Electricity sales and generation
The total industrySEN’s electricity sales increased 1.6%4.3% during 2016 as2018 compared to 2015, with a sales increase of 1.9% in the SIC and of 0.4% in the SING,2017, as set forth in the following table:
ELECTRICITY SALES PER SYSTEM (GWh)
| | Year ended December 31, | |
| | 2018(1) | | 2017 | | 2016 | |
Electricity sales in the SIC | | — | | — | | 50,516 | |
Electricity sales in the SING | | — | | — | | 16,960 | |
Total electricity sales (SEN) | | 71,179 | | 68,256 | | 67,476 | |
| | Year ended December 31, | |
| | 2016 | | | 2015 | | | 2014 | |
Electricity sales in the SIC | | | 50,516 | | | | 49,581 | | | | 49,066 | |
Electricity sales in the SING | | | 16,960 | | | | 16,887 | | | | 15,785 | |
Total electricity sales | | | 67,476 | | | | 66,468 | | | | 64,851 | |
(1) On November 21, 2017, the SIC and the SING were integrated into one interconnected system and resulted in the creation of SEN.
Our electricity sales reached 24,369 GWh in 2018, 23,356 GWh in 2017 and 23,689 GWh in 2016, 23,558 GWh in 2015 and 21,157 GWh in 2014, which represented a 35.1%34.2%, 35.4%34.2% and 32.6%35.1% market share, respectively. The percentage of the energy purchases to comply with our contractual obligations to third parties increaseddecreased by 16.4%31% in 20162018 when compared to 20152017 primarily due to morethe fact that (i) EGP Chile’s purchases are not included in the total since they are considered as intercompany sales, and (ii) to regulated customers.lower energy available in the contract with Nueva Renca, which is also included in this total.
The following table sets forth our electricity generation and purchases:
ELECTRICITY GENERATION AND PURCHASES (GWh)
| | Year ended December 31, | | | Year ended December 31, | |
| | 2016 | | | 2015 | | | 2014 | | | 2018 | | 2017 | | 2016 | |
| | (GWh) | | | % of Volume | | | (GWh) | | | % of Volume | | | (GWh) | | | % of Volume | | | (GWh) | | %
of Volume | | (GWh) | | %
of Volume | | (GWh) | | %
of Volume | |
Electricity generation | | | 17,564 | | | | 74.1 | | | | 18,294 | | | | 77.7 | | | | 18,063 | | | | 85.4 | | | 20,046 | | 82.3 | | 17,073 | | 73.1 | | 17,564 | | 74.1 | |
Electricity purchases | | | 6,125 | | | | 25.9 | | | | 5,264 | | | | 22.3 | | | | 3,094 | | | | 14.6 | | | 4,323 | | 17.7 | | 6,283 | | 26.9 | | 6,125 | | 25.9 | |
Total | | | 23,689 | | | | 100 | | | | 23,558 | | | | 100 | | | | 21,157 | | | | 100 | | | 24,369 | | 100 | | 23,356 | | 100 | | 23,689 | | 100 | |
We supply electricity to the major regulated electricity distribution companies, large unregulated industrial firms (primarily in the mining, pulp and steel sectors) and the pool market. Commercial relationships with our customers are usually governed by contracts. Supply contracts with distribution companies must be auctioned, and are generally standardized with an average term of ten years.
Supply contracts with unregulated customers (large industrial customers) are specific to the needs of each customer, and the conditions are agreed between both parties, reflecting competitive market conditions.
In 2016, 20152018, 2017 and 2014,2016, we had 46, 41294, 152 and 46 customers, respectively. This significant increase in 2018 is mainly due the increase in the number of unregulated customers. Regulated customers of a certain size may use their option to become
unregulated customers in order to benefit from the current market situation, which offers lower prices than would be paid as regulated customers. In 2016,2018, our customers included 23 distribution companies in the SIC20 regulated customers and 23274 unregulated customers.
In addition, through our subsidiary, GasAtacama Chile, we began electricity exports to Argentina in February 2016. During 2016, 103.9 GWh were exported to Argentina using the AES Gener S.A. (“Gener”) transmission line that connects Mejillones, Chile and Salta, Argentina.
The most significant supply contracts with regulated customers are with our subsidiary Enel Distribución ChileDistribution and with Compañía General de Electricidad S.A. (“CGE”), an unaffiliated entity. These are the two largest electricity distribution companies in Chile in terms of sales.
The following table sets forth our public contracts with electricity distribution companies in the SIC for their regulated customers as of December 31, 2016:
| | Year ended December 31, | |
| | (in GWh) | | | | | |
Company | | | 2017 | | | | 2018 | | | | 2019 | | | | 2020 | | | | 2021 | | | | 2022 | | | | 2023 | | | | 2024 | | | | 2025 | | | | 2026 | | | | 2027 | | | | 2028 | | | | 2029 | | | | 2030 | |
Enel Distribución Chile | | | 7,601 | | | | 7,824 | | | | 7,971 | | | | 8,018 | | | | 6,851 | | | | 7,682 | | | | 6,426 | | | | 6,427 | | | | 5,592 | | | | 3,937 | | | | 3,937 | | | | 2,452 | | | | 2,452 | | | | 2,452 | |
CGE | | | 7,075 | | | | 6,973 | | | | 6,814 | | | | 5,951 | | | | 6,067 | | | | 6,558 | | | | 6,778 | | | | 6,524 | | | | 2,432 | | | | 2,055 | | | | 2,055 | | | | 2,055 | | | | 2,055 | | | | 2,055 | |
Chilquinta | | | 1,792 | | | | 1,856 | | | | 1,913 | | | | 1,941 | | | | 1,915 | | | | 2,183 | | | | 2,135 | | | | 1,739 | | | | 967 | | | | 933 | | | | 548 | | | | 548 | | | | 548 | | | | 548 | |
Saesa | | | 2,552 | | | | 2,368 | | | | 2,322 | | | | 735 | | | | 761 | | | | 1,950 | | | | 1,684 | | | | 1,607 | | | | 987 | | | | 863 | | | | 863 | | | | 863 | | | | 863 | | | | 863 | |
Total | | | 19,020 | | | | 19,021 | | | | 19,020 | | | | 16,645 | | | | 15,594 | | | | 18,373 | | | | 17,023 | | | | 16,297 | | | | 9,978 | | | | 7,788 | | | | 7,403 | | | | 5,918 | | | | 5,918 | | | | 5,918 | |
Our generation contracts with unregulated customers are generally on a long-term basis and typically range from five to fifteen years. Such contracts are usually automatically extended at the end of the applicable term, unless terminated by either party upon prior notice. Some include a price adjustment mechanism in the case of high marginal costs, and therefore, reduces the hydrological risk. Contracts with unregulated customers may also include specifications regarding power sources and equipment, which may be provided at special rates, as well as provisions for technical assistance to the customer. We have not experienced any supply interruptions under our contracts. If we experienced a force majeure event, as defined in the contract, we are allowed to reject purchases and we have no obligation to supply electricity to our unregulated customers. Disputes are typically subject to binding arbitration between the parties, with limited exceptions.
For the year ended December 31, 2016,2018, our principal distribution customers were (ordered alphabetically)(in alphabetical order): CGE, Chilquinta, Emel group, Enel Distribución ChileDistribution. Grupo CGE, Grupo Chilquinta and Grupo Saesa group. .
Our principal unregulated customers were (ordered alphabetically)(in alphabetical order): Caserones, Compañíia Minera Doña Minera CarmenInés de Andacollo, Compañía Minera Collahuasi and SCM, Enel Distribution, Empresa CMPC S.A., Minera Valle Central.Central S.A. and SCM Minera Lumina Copper Chile.
We compete in the SIC primarily with two generation companies, Gener and Colbún S.A. (“Colbún”). According to the CDEC-SIC in 2016, in the SIC, Colbún had an installed capacity of 3,301 MW, of which approximately 53.2% was thermoelectric and Gener and its subsidiaries had an installed capacity of 2,756 MW, of which 89% was thermoelectric. In addition, there are a number of smaller entities with an aggregate installed capacity of 5,999 MW that generate electricity in the SIC.
As of December 31, 2016, our primary competitors in the SING were Engie (formerly named GDF Suez Group) and Gener, which have 1,971.7 MW and 1,405 MW of installed capacity, respectively. Our direct participation in the SING includes our 182 MW Tarapacá thermal plant and the 780 MW GasAtacama Chile thermal plant.
Electricity generation companies compete largely based on the basis of price, technical experience and reliability. In addition, because 64.3%48% of our installed capacity inconnected to the SICSEN is from hydroelectric, power plants, we have lower marginal production costs than companies generating electricity through thermal plants.whose installed capacity is primarily thermal. Our installed thermal capacity benefits from access to gas from the GNLQ terminal.Quintero LNG Terminal. However, during periods of extended droughts, we may be forced to buy more expensive electricity from thermoelectricthermal generators at spot prices in order to comply with our contractual obligations.
Directly and through our subsidiaries, we are the principal generation operator in the SIC, with 32.3% of the total installed capacity and 42.7% of the electricity energy sales in this system in 2016.
In the SING, our subsidiary GasAtacama Chile, accounted for 18.4% of the total installed capacity and 12.4% of the electricity energy sales in this system in 2016.
Electricity Distribution Business Segment
We
Through our subsidiary Enel Distribución, in which we have a 99.1% economic interest, we are one of the largest electricity distribution companies in Chile in terms of the number of regulated customers, distribution assets and energy sales, through our 99.1% economic interest in Enel Distribución Chile.sales.
We operate in a concession area of 2,105 square kilometers, under an indefinite concession granted by the Chilean government. We transmit and distribute electricity in 33 municipalities in the Santiago metropolitan region. Our service area is primarily defined as a densely populated area under the Chilean tariff regulations, which govern electricity distribution companies and includes all residential, commercial, industrial, governmental electricity customers, and toll customers. The Santiago metropolitan region, which includes the capital of Chile, is the country’s most densely populated area and has the highest concentration of industries, industrial parks and office facilities in the country. As of December 31, 2016,2018, we distributed electricity to approximately 1.81.9 million customers. Energy losses were 5.0% in 2018, 5.1% in 2017 and 5.3% in both 2016 and 2015.2016.
For the year ended December 31, 2016,2018, residential, commercial, industrial and other customers, who are primarily municipalities, represented 28%, 32%30%, 16%13%, and 24%28%, respectively, of our total energy sales of 15,92416.782 GWh, which is an increase of 0.2%2.1% in comparison with the same period in 2015.2017.
The following table sets forth our principal operating data for each of the periods indicated:
| | Year ended December 31, | | | Year ended December 31, | |
| | 2016 | | | 2015 | | | 2014 | | | 2018 | | 2017 | | 2016 | |
Electricity sales (GWh) | | | 15,924 | | | | 15,893 | | | | 15,690 | | | 16,782 | | 16,438 | | 15,924 | |
Residential | | | 4,442 | | | | 4,329 | | | | 4,256 | | | 4,702 | | 4,676 | | 4,442 | |
Commercial | | | 5,075 | | | | 5,157 | | | | 4,983 | | | 5,107 | | 5,271 | | 5,075 | |
Industrial | | | 2,536 | | | | 2,674 | | | | 2,818 | | | 2,202 | | 2,451 | | 2,536 | |
Other customers(1) | | | 3,871 | | | | 3,733 | | | | 3,633 | | |
Other customers(1) | | | 4,771 | | 4,039 | | 3,871 | |
Number of customers (thousands) | | | 1,826 | | | | 1,781 | | | | 1,737 | | | 1,925 | | 1,882 | | 1,826 | |
Residential | | | 1,634 | | | | 1,593 | | | | 1,555 | | | 1,725 | | 1,686 | | 1,634 | |
Commercial | | | 142 | | | | 139 | | | | 135 | | | 149 | | 146 | | 142 | �� |
Industrial | | | 13 | | | | 12 | | | | 12 | | | 13 | | 13 | | 13 | |
Other customers | | | 37 | | | | 37 | | | | 35 | | | 39 | | 38 | | 37 | |
Energy purchased (GWh)(2) | | | 16,803 | | | | 16,772 | | | | 16,571 | | |
Total energy losses (%)(3) | | | 5.3 | % | | | 5.3 | % | | | 5.3 | % | |
Energy purchased (GWh)(2) | | | 17,718 | | 17,373 | | 16,803 | |
Total energy losses (%)(3) | | | 5.0 | | 5.1 | | 5.3 | |
(1)
| The data for other customers includes tolls.
|
(2)
| During 2016, 2015, and 2014, we acquired from Enel Generación Chile 39%, 38% and 35%, respectively, of our electricity purchases.
|
(3)
| Energy losses are calculated as the percent difference between energy purchased and energy sold excluding tolls and energy consumption not billed (GWh) within a given period Losses in distribution arise from illegally tapped lines as well as technical losses.
|
For(1) The data for other customers includes tolls.
(2) During 2018, 2017, and 2016, Enel Distribution acquired from Enel Generation 37%, 39% and 38%, respectively, of its electricity purchases.
(3) Energy losses are calculated as the year ended December 31,percent difference between energy purchased and energy sold excluding tolls and energy consumption not billed (GWh) within a given period. Losses in distribution arise from illegally tapped lines as well as technical losses.
Enel Distribution’s tariff review process, which set the tariffs for the 2016-2020 period, was finalized in August 2017. The new tariffs were applied retroactively as of November 2016 our principal unregulated customers were (ordered alphabetically): CIAL Alimentos S.A., Empresa Depuradora de Aguas Servidas Mapocho-Trebal Limitada, Entel S.A., Gerdau Aza S.A., Grupo Cencosud, Grupo Mall Plaza S.A., Linde Gas S.A., Metro S.A., Nestle Chile S.A., Parque Arauco S.A., Praxair Chile Ltda, SCA Chile S.A., Terminal Aéreo de Santiago (SCL), Watt’s S.A. and Wenco S.A.the review did not have a significant effect on Enel Distribution’s tariffs.
For the year ended December 31, 2016,2018, the collection rate was 100.2%98.6%, compared to 98.0%99.6% during the same period in 2015. The 2016 collection rate was more than 100% due to the collection of unpaid bills from previous years.2017.
For the supply to regulated distribution customers, we haveEnel Distribución has entered into contracts with the following generation companies: Enel Generación Chile, our subsidiary, as well as the unaffiliated companiesGeneration., AES Gener S.A., Colbún Guacolda S.A. and Panguipulli S.A., EE Carén S.A., Santiago Solar S.A., Acciona Energía Chile Holdings S.A., Engie, Central El Campesino S.A., Norvind S.A., Abengoa Generación Chile S.A. Chungungo, Pelumpén S.A., EE ERNC-1 S.A., Energía Cerro El Morado S.A., San Juan S.A., SPV P4 S.A. Amunche Solar Spa, Aela Generación S.A., Abengoa Generación Chile Dos S.A., SCB II Spa and Ibereólica Cabo Leones I S.A.others companies.
In 2016,2017, the distribution companies of the former SIC jointly submitted a 12,4302,200 GWh/year bid for the period of 20212024 through 2040, of which approximately 4,300 GWh/year was submitted by Enel Distribución Chile.2043. In August 2016, all ofNovember 2017, the electricity supply in the bidding process was awarded to 22 companies. The following generation companies ranked by amountwere awarded were the principal awardedmost relevant amounts of the bid companies: Enel Generación Chile, Ibereólica Cabo Leones II S.A, Camán Eólica Spa, Coihue Eólica Spa, Esperanza Eólica Spa, AccionaGeneration, Energía ChileRenovable Verano Tres SpA, Cox Energía SpA, Atacama Energy Holdings S.A., Cerro Tigre Eólica Spa and Tchamma Eólica Spa.Atacama Solar S.A.
For the supply to unregulated distribution customers, Enel Distribución ChileDistribution has contracts with the following generation companies: Duke Parque Eólico Los Cururos Ltda., Latin América Power, Orazul Energy International Duqueco SpA, Colbún SpA., Hidroeléctrica La HigueraEnel Generation., Empresa Electrica Puntilla S.A., Hidroeléctrica La Confluencia S.A., Guacolda S.A., Pacific Hydro Chacayes S.A., KDM Energía S.A and Enel Green Power Chile Ltda, a subsidiary of our controlling company.KDM.
Enel Distribución Chile’s tariff is under review. Once the review is completed and the tariff is established, it will be in effect for the 2016-2020 period and will be applied retroactively to November 2016.
Seasonality
The distribution business is directly influenced by seasonal changes in energy demand. Although the price at which a distribution company purchases electricity can change seasonally and has an impact on the price at which it is sold to end users, it does
not have an impact on our profitability since the cost of electricity purchased is passed to end users through tariffs that are set for multi-year periods. In general, moderate temperatures reduce the need for electric heating and air conditioning. During 2016,2018, the effects of moderatelow temperatures (neither extremely cold nor hot) in Santiago negatively(especially during winter) positively impacted our residential customers’ per capita consumption, which represented 28% of our electricity distribution during 2016.
Non-Electricity Businesses
Servicios Informáticos e Inmobiliarios Ltda.
Servicios Informáticos e Inmobiliarios Ltda. (“SIEI”), a wholly-owned subsidiary, is a business that provides consulting services in the fields of technology, information and computer services, telecommunications, data transmission and also develops real estate projects in Chile. It accounts for less than 1% of our revenues, income and assets.2018.
ELECTRICITY INDUSTRY STRUCTURE AND REGULATORY FRAMEWORK
The following chart shows a summary of the main characteristics of
1. Overview and Industry Structure
In the Chilean electricity regulatory framework by business segment.
Gx
| Unregulated Market
| | Spot market with costs audited by the regulator
|
Gx
| Regulated
| | Node price public auction for up to 20 years
|
Capacity
| | Income based on power contributions during peak demand
|
Tx
| Features
| | Public - Open Access - Regulated Tariff
Monopoly Regime for Transmission System Operators
|
Dx
| Law
| | Administrative Concession (indefinite duration)
|
Expansion
| | Undefined
|
Tariff review
| | Every 4 years
|
Td
| Unregulated customers
| | > 5 MW
|
Unregulated market (%)
| | ≈ 30%
|
Gx: Generation
| Tx: Transmission
| Dx: Distribution
| Td: Trading
|
Industry OverviewElectricity Market, there are four categories of local agents: generators, transmitters, distributors and Structurelarge customers.
The Chilean electricity industry is divided into three business segments: generation, transmission and distribution. These business segments are carried out by publicly listed private sector companies, in which generators can also trade energy with unregulated customers. The state’s role is limited to regulation, supervision and indicative investment planning through non-binding recommendations in the case of generation. In the transmission segment, investment planning and construction bidding processes are binding.
The following chart shows the relationships among the various participants in the Chilean electricity market:


The Chilean electricity sector is physically divided into three main networks, the SEN and two smaller isolated networks (Aysén and Magallanes). The SEN was created after the integration of the SIC and the SING that took place in November 2017 and extends from Arica in the north to Chiloé in the south. The CEN (Coordinador Eléctrico Nacional), a centralized dispatch center, coordinates the SEN’s operation. Until the interconnection of the SIC and SING in 2017, each system was coordinated by its respective dispatch center, the CDEC-SIC and the CDEC-SING.
The industry’s three business segments: generation, transmission and distribution, must operate in an interconnected and coordinated manner in order to supply electricity to final customers at the minimum cost and within the standards of quality and security required by the industry’s rules and regulations.
i)Generators:
Generators supply electricity to end customers using the lines and substations that belong to transmission and distribution companies. The generation segment is comprised ofoperates competitively and does not require a group of electricity companies that own generating plants, whose energy is transmitted and distributed to end customers. This segment is characterizedconcession granted by being a competitive market, which operates under market-driven conditions. Generation plantsthe authority. Generators may sell their energy through contracts to distribution companies, who in turn serve the regulated market, to unregulated customers, and to other generation companies. Generatorscompanies through contracts at freely negotiated prices, or they may sell surpluses onto distribution companies to supply regulated customers through contracts governed by bids.
The operation of electricity generation companies is coordinated by the CEN, with an efficiency criterion in which the lowest cost producer available is usually required to satisfy demand at any moment in time. Any differences between electricity production and generators’ contracted sales are sold in the spot market. The transmission segment is comprisedmarket at a price equal to the hourly marginal cost of the system.
ii)Transmitters:
Transmission companies own lines and substations with a combination of lines, substations and equipment for the transmission of electricityvoltage above 23 kV flowing from generators’ production points to the centers of consumption or distribution. In Chile,distribution, charging a regulated toll for the use of their installations. The transmission segment is defined as the conveying ofa natural monopoly subject to special industry regulations, including antitrust legislation. Tariffs are regulated, and access must be open and guaranteed under nondiscriminatory conditions.
iii)Distributors:
Distribution companies supply electricity over lines or substationsto end customers using electricity infrastructure with a voltage or tension higherless than 23 kV. The transmission system operates underdistribution segment is a natural monopoly subject to special industry regulations as well, including antitrust legislation. The electricity network is open access and transmission companies may impose rightstariffs of way over the available transmission capacity through the payment of tolls.
The distribution segment is defined for regulatory purposes as the electricity supplied to end customers at a voltage no higher than 23 kV.are regulated. Distribution companies operate under a public utilityhave the obligation to provide electricity to the regulated customers within their concession regime, with service obligationsarea and at regulated tariffs for supplying regulated customers.prices. They may sell to unregulated customers through contracts at freely negotiated prices.
Customers
Furthermore, customers are classified according to their capacity,demand as follows: (i) new“regulated” or “unregulated.” Certain customers have the choice to be either regulated or unregulated, customers as of 2016 with connected capacity of over 5,000 kW (existing customers who were formerlyand therefore subject to the lower 2,000 kW threshold priorrespective price regime. Demand requirements to 2016 will be grandfatheredqualify as of 2019); (ii) regulated customers with connected capacity up to 500 kW;or unregulated customer are described below under “—3. Generation Segment — Dispatch, Customers and (iii) customers that choose either a regulated tariff or an unregulated regime for a minimum period of four years, available to customers whose connected capacity falls in the range of 500 kW to 5,000 kW.Pricing”.
2. Electricity Law and Authorities
The distribution companies supply regulated customers, a segment for which the price and supply conditions are the result of tender processes regulated by the CNE (“Comisión Nacional de Energía”), and unregulated customers that have agreements with generators or distributors, which terms are freely negotiated and agreed upon.
In Chile, there are four separate interconnected electricity systems. The main systems in Chile are the SIC and the SING. The SIC services the central and south central part of the country, where 92.2%goal of the Chilean population lives. The SING, which operatesElectricity Law is to provide incentives to maximize efficiency and to provide a simplified regulatory scheme and tariff-setting process that limits the discretionary role of the government. This goal is achieved by establishing objective criteria for setting prices that provide a competitive rate of return on investment to stimulate private investment, while ensuring the availability of electricity in the northern partsystem to all who request it.
Since its inception, the Chilean electricity industry has been developed primarily by private sector companies. However, nationalization by the government was carried out between 1970 and 1973. During the 1980s, the sector was reorganized through the Chilean Electricity Law, known as Decreto con Fuerza de Ley DFL 1 (“DFL 1”), allowing for the renewed participation of the countryprivate sector.
The industry is currently governed by the electricity law Ley General de Servicios Eléctricos No. 20,018 and where mostits modifications, under the Electricity Law, known as Decreto con Fuerza de Ley DFL 4 (“DFL 4”), the restated DFL 1, published in 2006 by the Ministry of Economy and its respective Regulations included in Decreto Supremo D.S. No. 327/1998.
The Ministry of Energy is the main authority in the energy industry since February 1, 2010. The Ministry of Energy elaborates and coordinates plans, policies and standards for the proper operation of the mining industry is located, is where 6.3%sector and the development of the Chilean population lives (accordingindustry in Chile.
The National Energy Commission (“CNE”, in its Spanish acronym) and the Superintendence of Electricity and Fuel, “SEF,” are also relevant industry authorities. They report to the 2015 CDEC-SICMinistry of Energy.
The CNE is the entity in charge of approving the annual report)transmission expansion plans, elaborating the indicative plan for the construction of new electricity generation facilities and proposing regulated tariffs to the Ministry of Energy for approval. The SEF inspects and oversees compliance with the law, rules regulations and technical norms applicable to electricity generation, transmission and distribution, liquid fuels and gas.
The Energy Sustainability Agency was created in 2018 and replaced the Energy Efficiency Agency that is in charge of promoting energy efficiency.
Additionally, the law provides for a “Panel of Experts,” whose main responsibility is to acts as a court, issuing enforceable resolutions in disputes related to subjects referred to by DFL 4, and other electricity related laws. This panel is comprised of professional experts, all of whom are elected every six years by the antitrust government agency, Tribunal de la Libre Competencia (“TDLC” in its Spanish acronym).
The CEN is an independent entity in charge of coordinating the operation of the electricity system with the following objectives:
i) maintain service security;
ii) guarantee the efficient operation of the facilities connected to the system; and
iii) guarantee open access to all transmission networks.
The CEN’S main activities include:
a) coordination of electricity market operations;
b) authorization of connections;
c) ancillary services management, implementation of information systems available for the public; and
d) monitor competition and payments, among others.
The CEN performs the calculation of market balances (energy injections and withdrawals), determines the transfers among generation companies and calculates the hourly marginal cost, which is the price at which energy transfers are carried out in the spot market. However, the CEN does not calculate the prices of generation capacity. Such prices are calculated by the National Energy Commission or CNE.
Limits on Integration and Concentration
The antitrust legislation established in DFL 211 (modified by Law No. 20,945 in 2016) and the regulations applicable to the electricity industry stated in DFL 4 and Law No. 20,018, have established the criteria to avoid economic concentration and abusive market practices in Chile.
Companies can participate in the different market segments (generation, distribution, transmission) to the extent that they are appropriately separated, both from an accounting perspective and a corporate perspective according to the requirements established in DFL 4 and Law No. 20,018 and the antitrust law DL 211 referred to above, in addition to complying with the conditions established in Resolution No 667/2002, listed below.
The transmission sector is subject to the greatest restrictions, mainly because of its open access requirements. DFL 4 sets limits to the shareholdings of generation and distribution companies in companies that participate in the national transmission segment of the transmission system.
The owners of the National Transmission System (“STN” in its Spanish acronym) must be constituted as limited liability stock corporations. Individual interests in the STN by companies operating in another electricity or unregulated customer segment cannot exceed, directly or indirectly, 8% of the total investment value of the STN. The aggregate interest of all such agents in the STN cannot exceed 40% of the total investment value.
According to the Electricity Law, there are no restrictions on market concentration for generation and distribution activities. However, Chilean antitrust authorities have imposed certain measures to increase transparency associated with us and our subsidiaries, through Resolution 667 issued by the TDLC.
Resolution 667 states that:
· electricity generation and distribution activities cannot be merged. For instance, Enel Chile must continue to keep both business segments separate and manage them as independent business units; and
· we, Enel Generation and Enel Distribution are registered with the CMF and must remain subject to the regulatory authority of the CMF and comply with the regulations applicable to publicly held stock corporations, even if any of these companies should lose such designation;
· members of the Board of Director must be elected from different and independent groups;
· the external auditors of the companies must be different for local statutory purposes.
In addition, the Water Utility Services Law also sets restrictions on the overlapping of different utility concessions in the same area, setting restrictions on the ownership of the property for water and sewage service concessions and utilities that are natural monopolies, such as electricity distribution, gas or home telephone networks. By way of example, an electricity distribution company and a water utility company that belong to the SIC andsame owner cannot operate in the SING, there are two isolated systems in southern Chilesame concession area.
3. Generation Segment
The generation segment is comprised of companies that provideown electricity generation power plants. They operate under market-driven conditions delivering their electricity to remote areas, where 1.5%end customers through transmission and distribution networks. Generation companies freely determine whether to sell their energy and capacity to regulated or unregulated customers, but the operation of their power plants is determined by the population lives.
In January 2014, Law No 20,726 approved the interconnectionCEN. The surplus or deficit between the SICgeneration company’s electricity sales and production is sold or purchased, as the SING. The interconnection is being builtcase may be, to other generators at the spot market price.
Law No. 20,257 was issued in 2008 to promote the development of NCRE generation. In Chile, NCRE refers to power from wind, solar, geothermal, biomass, ocean (movement of tides, waves and currents, as well as the ocean’s thermal gradient) and mini-hydro plants under 20 MW.
Law No. 20,257 required generators, between 2010 and 2014, to supply at least 5% of their total contracted sales with NCRE sources and progressively increases that percentage by GDF SUEZ0.5% a year beginning in 2015 with the aim of reaching 10% by 2024. In 2013, Law No. 20,698, modified the previously defined NCRE source minimum requirements, establishing a mandatory 20% share of NCRE source as a percentage of total contracted energy sales by 2025, but allowing contracts signed between 2007 and is expected2013 to be completedmaintain the 10% target by 2019. Once in place, energy generated in one system will be able2024.
Dispatch, Customers and Pricing
Generation companies may sell to cover a portion of any shortfalls in thedistribution companies, unregulated end customers or to other system.
The operation ofgeneration companies through contracts. Generation companies satisfy their contractual sales requirements with dispatched electricity, whether produced by them or purchased from other generation companies in eachthe spot market or through contracts. They balance their contractual obligations with their dispatch by trading deficit and surplus electricity at the spot market price, which is set hourly by the CEN, based on the lowest cost of production of the two major interconnectedlast kWh dispatched.
The CEN operates the electricity systems is coordinatedsystem with an approach that minimizes costs while monitoring the quality of the service provided by their respective dispatch centers, the CDEC-SICgeneration and the CDEC-SING, independent entities that coordinate generators, transmission companies and large customers. Each CDEC coordinates the operation of its system withcompanies. To minimize operating costs, it applies an efficiency criterion in which the lowest cost producer available is usually required to satisfy demand at any moment in time. As a result, at any specific level of demand, the appropriate supply will be provided at the lowest possible production cost available in the system. TheThis marginal cost usedon an hourly basis is the price at which generators trade energy on an hourly basis, involvingin the spot market, both their injections into the system(sales) and their withdrawals or purchases for supplying(purchases) to balance their customers.
contracted customer sales to their production determined by the CEN.
The Energy Agenda
In May 2014, the Chilean government announced the Energy Agenda, establishing a plan to create and execute a long-term energy policy. The Energy Agenda presents several linescustomers of action and goals to achieve in the short, medium and long term. These objectivesgeneration companies are lower energy prices, the incorporation of non-conventional renewable energy sources (“NCRE”) and promotion of the efficient use of energy. In Chile, NCRE refers to power from wind, solar, geothermal, biomass, ocean (movement of tides, waves and currents, as well as the ocean’s thermal gradient) and mini-hydro plants under 20 MW.
The Energy Agenda includes a program of legal initiatives to achieve those goals. Among the subjects to be addressedclassified by the program are: “Amendmentselectricity capacity demand required, explained as follows:
i) Unregulated customers: Customers who demand over 5,000 kW of capacity, mainly industrial and mining companies. These customers freely negotiate their electricity supply prices with generators and/or distributors. This customer category also includes those who demand between 500 and 5,000 kW of capacity that have the option to choose between the legal framework for procurement of electricity forunregulated regime and the regulated customers” (January 2015), “Amendmentsregime and choose the unregulated regime.
ii) Distribution companies: Distributors distinguishing between the energy they require to satisfy their regulated customers from their unregulated customers. In the legal framework offormer case, distributors purchase energy from generation companies through an open bid process regulated by the CNE, while they freely negotiated bilateral contracts with unregulated customers.
iii) Generation companies trading on the spot or short-term market: The energy and capacity transactions between generation companies arise from the difference between the electricity transmission systems” (July 2016), and “Energy Efficiency Law” (expected to be enacted during 2017).
As part of the Energy Agenda, Decree 148 (“Energíproduced by a 2050 Política Energética de Chile”) was signed on December 30, 2015. Decree 148 approves the new long-term strategy for the electricity sector, which aims to (i) improve electricity service for the impoverished, (ii) have 70% of national electricity generation come from NCRE and (iii) ensure that all new construction will incorporate energy control systems and smart energy management by 2050.
Principal Regulatory Authorities
The Chilean Ministry of Energy develops and coordinates plans, policies and standards for the proper operation of the sector, approves tariffs and node prices setgenerator, as determined by the CNE, and regulates the grantingcontractual obligations of concessions to electricity generation, transmission and distribution companies.that generator with its customers. The CNEprice of energy traded on the spot market is the technical entity in chargehourly marginal cost of defining prices, technical standards and regulatory requirements.
The SEF monitors the proper operation of electricity, gas and fuel sectors in compliance with the law in terms of safety, quality, and technical standards.
The Chilean Ministry of Environment is responsible for the development and application of regulatory and policy instruments that provide for the protection of natural resources, the promotion of environmental educationsystem and the controlprice of pollution, among other matters. It is also responsible for administeringcapacity traded on the environmental impact assessment systemspot market at a certain node.
Each generator receives a capacity payment set by the national level, coordinatingCEN based on the preparationgeneration capacity of environmental standards and establishing the programs for compliance with those standards.
Chilean antitrust authorities are responsible for preventing, investigating and correcting any threats to free market competition and any anti-competitive practices by potentially monopolistic companies. These authorities include:
Free Market Competition Tribunal (“TDLC” in its Spanish acronym). This is a special and independent jurisdictional entity, subject to the directive, correctional and economic authority of the Chilean Supreme Court, which functions to prevent, correct and sanction threats to free market competition.
National Economic Prosecutor (“FNE” in its Spanish acronym). This is the attorney general responsible for economic matters and for investigating and prosecuting all antitrust conduct before the FNE’s regulatory commission and other tribunals.
The Panel of Experts acts as a tribunal in electricity matters arising from disputes between participants in the electricity market and between participants in the electricity marketeach power plant and the regulatory authority in certain tariff processes.available primary resource. This capacity payment replaces the previous “firm capacity” concept. It issues enforceable resolutions and is composed of experts in industry matters, five engineers or economists and two lawyers, all of whom are elected every six years by the TDLC.
There are also other entities relatedcontinues to the energy sector: the Chilean Nuclear Energy Commission is in charge of research, development, use and control of nuclear energy, the Chilean Energy Efficiency Agency is in charge of promoting energy efficiency,
and the Center for Innovation and Promotion of Sustainable Energies is in charge of strategic programs and projects with public financing for innovation and promotion of sustainable energies.
The Electricity Law
General
Since its inception, the Chilean electricity industry has been developed by private sector companies. Nationalization had been carried out during the period from 1970 to1973. During the 1980s, the sector was reorganized through the Chilean Electricity Law, known as DFL 1, allowing participation of private sector capital in the electricity sector. By the end of the 1990s, foreign companies had a majority participation in the Chilean electricity system.
The goal of the Chilean Electricity Law is to provide incentives to maximize efficiency and to provide a simplified regulatory scheme and tariff-setting process that limits the discretionary role of the government by establishing objective criteria for setting prices. The goal is an economically efficient allocation of resources. The regulatory system is designed to provide a competitive rate of returndepend primarily on investment to stimulate private investment, while ensuring the availability of electricitysuch facility, the type of power plant technology, and the resources used to all who request it.
DFL 1 was published in 1982 and has had few important changes since then to deal with droughts, encourage investments in transmission lines and to create long-term contracts between generation and distribution companies as part of a bid process. The present law was restated as DFL 4 of 2006, and has been supplemented with a series of regulations and standards.
In January 2015, the Chilean Congress approved amendments to the legal framework for procurement of electricity by regulated customers. Among the principal changes introduced in these amendments, were:
Increased CNE participation in the development of tenders.
Additional time to call for tenders: five years in advance.
Allocation mechanism: Will be awarded to the lowest prices offered. These prices will be limited by a capped price that will be deemed as a reserve price and keep private until the bid pricegenerate. It is public.
Reduced risk: Providers of electricity have the ability to postpone delivery of electricity in the event there are delays due to well-founded reasons not attributable to the tenderer and to request a price review, indexed to the conditions prevalent at the time at which the energy is delivered.
Short-term contracts: Short-term procurement contracts (up to three years), with an advance of one year, have a minimum price equal to the average market price plus 50%. Additionally, within specified ranges from the average marginal cost price, marginal cost will be used.
Non-contracted energy: All generators within a particular system will be required to offset energy supply contract deficits in proportion to the energy they inject into the system. Each generator will receive the higher of the short-term node price or variable cost of the plant. When energy without contracts exceeds 5% of the total regulated supply, the excess will be paid by distribution companies at a price equal to marginal cost. In turn, these marginal costs will be passed on to end customers.
Customers are classified according to their capacity, as follows: (i) new unregulated customers as of 2016 with connected capacity of over 5,000 kW (existing customers who were formerly subject to the lower 2,000 kW threshold prior to 2016 will be grandfathered as of 2019); (ii) regulated customers with connected capacity up to 500 kW; and (iii) customers that choose either a regulated tariff or an unregulated regime for a minimum period of four years, available to customers whose connected capacity falls in the range of 500 kW to 5,000 kW.
In 2016, transmission Law 20,936 restructured the electricity transmission system operation. The main provisions included are:
Functional redefinition of Transmission Systems, which will now be classified into National Transmission Systems, Zonal, Dedicated Systems, development poles and international interconnections. The creation of a single independent national coordinator, who will replace the current CDEC-SING and CDEC-SIC dispatching operators as of January 2017;
A new remuneration mechanism for assets with a progressive shift of all costs from generators to the end customers; and
Government assumes a main role in planning reinforcement and expansion of the grid.
Limits and Restrictions
The owners of the main transmission system must be constituted as limited liability stock corporations and cannot take part in the electricity generation or distribution businesses.
Individual interest in the Main Transmission System (“STT” in its Spanish acronym) by companies operating in another electricity or unregulated customer segment cannot exceed, directly or indirectly, 8% of the total investment value of the STT. The aggregate interest of all such agents in the STT must never exceed 40% of the investment value.
According to the Chilean Electricity Law, there are no restrictions on market concentration for generation and distribution activities. However, Chilean antitrust authorities have imposed certain measures to increase transparency associated with us and our subsidiaries Enel Generación Chile and Enel Distribución Chile. The TDLC’s Resolution 667 requires that for all three of these companies:
board members must be elected from different and independent groups;
the external auditors must be different for local statutory purposes;
electricity generation and distribution activities cannot be merged; instead, Enel Chile must continue to keep separate both business segments and manage them as independent business units; and
all three companies must remain subject to the regulatory authority of the SVS and comply with the regulations applicable to publicly held stock corporations, even if they should lose such designation.
Enel Américas, as the continuing company following the spin-off of Enel Chile in 2016, is also subject to the restrictions of Resolution 667. However, these antitrust restrictions are not applicable between Enel Chile and Enel Américas.
Additionally, in October 2012, FNE Official Letter 1479 imposed additional antitrust restrictions which have the following implications for the current Enel Generación Chile:
the controlling shareholders of Enel Generación Chile should refrain from designating as directors any persons who may have been directors of Enel Distribución Chile during the prior term; and
Enel Generación Chile’s management should refrain from designating employees in first and second level positions who may have held the same positions in Enel Distribución Chile during the six months prior to their designation.
In addition, the Water Utility Services Law also sets restrictions on the overlapping of concessions in the same area, setting restrictions on the ownership of the property for water and sewage service concessions and utilities that are natural monopolies, such as electricity distribution, gas or home telephone networks.
Regulation of Generation Companies Concessions
Chilean law permits generation activity without a concession. However, companies may apply for a concession to facilitate access to third-party properties. Third-party property owners are entitled to compensation, which may be agreed to by the parties or, if there is no agreement, it may be determined by an administrative proceeding that may be appealed in the Chilean courts.
Dispatch and Pricing
In each of the two major electric systems, the pertinent CDEC coordinates the operations of generation companies, in order to minimize the operating costs in the electricity system and monitor the quality of service provided by the generation and transmission companies. Generation companies satisfy their contractual sales requirements with dispatched electricity, whether produced by them or purchased from other generation companies in the spot market. As of January 2017, a single independent national coordinator replaced the two CDECs.
Sales by Generation Companies to Unregulated Customers
Sales by generation companies may be made to distribution companies, unregulated end customers or to other generation companies under freely negotiated contracts. To balance their contractual obligations with their dispatch, generators have to trade deficit and surplus electricity at the spot market price, which is set hourly by each CDEC based on the lowest cost of production of the last kWh dispatched.
Sales to Distribution Companies and Certain Regulated Customers
Under Law 20,018 (Ley Corta II), enacted on May 19, 2005, all new contracts between generation and distribution companies to supply electricity to regulated customers must arise from international bids. In January 2015, Law 20,805 amended the bidding process for supplying electricity to regulated customers. These amendments, among others, changed the anticipation required for the bidding process from three to five years, extended the maximum contract period from 15 to 20 years, adopted a capped price known as “reserve price” that is kept private until the bid price is made public, and allowed for the possibility to review the price awarded during the supply period, setting new procedures to assign energy without contracts and to regulate the short-term bidding process.
Sales of Capacity to Other Generation Companies
Each CDEC determines a firm capacity for each power plant on an annual basis. Firm capacity is the highest capacity which a generator may supply to the system at certain peak hours, taking into considerationconsidering statistical information, and accounting for maintenance time out of service for maintenance purposes and for extremely dry conditions infor hydroelectric power plants, but differs from firm capacity because it does not consider the case of hydroelectric plants.
A generation company may be required to purchase or sell capacity in the spot market, depending upon its contractual requirements in relationpower plants’ contribution to the amount of electricity to be dispatched from such company and to its firm capacity.
Promotion of Generation from Renewable Energy Sources
On April 1, 2008, Law 20,257 amended the General Electric Services Law. The purposesecurity of the amendment wasentire system.
Generation costs are passed on to promotedistributors’ regulated end consumers through the development“average node price,” which corresponds to a single price determined for each distributor by the CNE, considering the weighted average prices of NCRE. This law definestheir current supply contracts for regulated customers The average node price is adjusted in three instances: (1) every six months, in January and July of each year, based on local and international indexes; (2) upon the different types of technologies that qualify as NCRE and establishes the obligation for generators, between 2010 and 2014, to supply at least 5% of the total energy contracted as of August 31, 2007 to beentry of a certain type,new supply contract with any distribution company; and to progressively increase this percentage by 0.5% annually up to(3) upon indexation of a minimum ofsupply contract in more than 10% by 2024..
Rationing
On October 22, 2013, Law. 20,698 was adopted to promote the use of NCRE and modify the previously defined NCRE minimum requirements. This law establishes a mandatory share of renewable energy sources in 2025, calculated as a percentage of the total contracted energy of each generator. For contracts signed between 2007 and 2013, the target is 10% by 2024, while for contracts beyond 2013 the target is 20% by 2025.
Incentives and Penalties
If a rationing decree is enacted in response to prolonged periods of electricity shortages, strict penalties may be imposed on generation companies that contravene the decree. A severe drought is not considered a force majeure event under our service agreements.
Generation companies may also be required to pay fines to the regulatory authorities, as well as compensate electricity customers affected by shortages of electricity. The fines are related to system blackouts due to an electricity generator’s operational problems, including failures related to the coordination duties of all system agents. If generation companies cannot satisfy their contractual commitments to deliver electricity during periods when a rationing decree is in effect and there is no energy available to purchase in the system, the generation company must compensate the customers at a rate known as the “failure cost” determined by the authority in each node price setting. This failure cost, which is updated semiannually by the CNE, is a measurement of how much end customers would pay for one extra MWh under rationing conditions.
Water Rights
Companies in Chile must pay an annual fee for unused water rights. License fees already paid may be recovered through monthly tax credits, commencing on the start-up date of the project associated with the water right. The maximum license fees that may be recovered are those paid during the eight years before the start-up date.
The Chilean Constitution considers water as a national public good onin which real utilization rights are defined. ThatIt is similar to holding the private property rights over water, as set forth in article 19, paragraph 24: “The rights of individuals over water, recognized or constituted in accordance with the law, grant their holders ownership over such rights.” Notwithstanding the foregoing, paragraph 24 also specifies legal limitations to those water rights.
The Chilean Congress is currently discussing amendments to the Water Code with the objective of making water use for human consumption, household subsistence and sanitation a high priority.
On November 22, 2016, the Chilean House of Representatives approved an amendment whichthat is currently being evaluated by the Water Resources, Desertification and Drought Commission of the Chilean Senate. The main aspects of the amendments are as follows:
·Granting of new water rights, which would be limited to a maximum period of 30 years, and extendable over future terms, unless the Chilean Water Authority proves the ineffective usenon-use of the resources. The extension shallwould be effective only for used water rights.
·The expiration of new non-consumptive water rights that were granted by law, if the holder does not exercise the right of use within eight years.
·The expiration of new non-consumptive water rights already granted, if the user does not effectively use the rights within a period of eight years from the date of enactment of the new Water Code. The term can be extended for up to four years only in justified cases such as delays in obtaining permits or environmental approvals.
In April 2017,January 2019, the President modified this amendment statingto state that the preservation of water environmental flows to protect the ecosystem only applies to future water rights have an unlimited duration.
4. Transmission Segment
The transmission segment supplies electricity over lines or substations with a voltage or tension higher than 23 kV from generators’ production points to the centers of consumption or distribution. Transmission systems are comprised of the electricity lines and substations that are not considered part of the distribution network.
Given the structural characteristics of the transmission segments, it is subject to special electricity industry regulation. Tariffs are regulated, and access must be open guaranteed under nondiscriminatory conditions.
Law No. 20,936 published in July 2016 established a new regulatory framework for all electricity transmission systems in Chile, redefining the system into the following segments: National, Development Poles, Zonal, Dedicated, and International.
National and Zonal Transmission Systems planning is a centralized, regulated process carried out by the CEN that annually issues an expansion plan to be approved by the CNE.
The expansion of both consumptivesystems is granted through an open tender process that distinguishes new installations from enlargement of existing installations. The tenders carried out for new installations grant the winner ownership of the installation to be built. The expansion of existing installations, on the other hand, belongs to the owner of the original installation, who is obliged to tender the construction of the required expansion.
The remuneration of existing national and non-consumptive water use, which would reducezonal transmission installations is determined by a tariff setting process performed every four years. This process determines the water availabilityAnnual Transmission Value that considers efficient operation and maintenance costs and an annual valuation of investments that is based on a discount rate determined by the authority every four years (minimum 7% after tax) and the useful life of the installations.
The remuneration of expansions is the value resulting from the respective bid of such expansion for generation purposes.the first 20 years of operations. From year 21 on, such expansion is considered an existing installation and remunerated accordingly.
Regulation currently in force states that transmission remuneration is the sum of tariff revenue and the usage charge revenue, received for use of the transmission system defined as $/kWh by the CNE.
Finally, in the case of a failure in electricity transmission, Law No. 20,396 defines the penalty conditions for the responsible company (transmission, generation or other).
Transmission Tariffs
Law No. 20,936 introduced changes to the transmission tariff setting process. In transitioning to the implementation of the new law, the current zonal transmission tariff setting process continued as stated by transitory Article No. 20 of Law No. 20,936. The tariff setting process for the 2018-2019 period concluded in October 2018 and has been effective retrospectively since January 1, 2018. The 2020-2023 tariff setting process is now in progress.
5. Distribution CompaniesSegment
Concessions
The distribution segment is comprised of electricity infrastructure with a voltage lower than 23 kV to supply electricity to end customers. Electricity distribution is considered a natural monopoly and companies therefore operate under a public utility concession regime, with service obligations and regulated tariffs for supplying regulated customers. They may sell to unregulated customers at negotiated prices.
Customers are classified according to their demand as regulated or unregulated. Regulated customers are those whose connected capacity is below or equal to 5,000 kW and unregulated customers are those whose connected capacity is at least 5,000 kW. Customers with connected capacity between 500 kW and 5,000 kW may choose to be regulated or unregulated, subject to the respective price regime. Clients who choose one category must remain at least four years in the option chosen.
Customers subject to the unregulated price regime may negotiate their electricity supply with any generator or distributor, although they must pay a regulated toll for using the distribution network.
Regulated customers with residential generation can sell their surpluses to the distribution company, under certain conditions (regulation of net billing). Since November 2018, Law No. 21,118 permits customers with connected capacity up to 300 kW to sell their surpluses.
Distribution service concessions give the right to use public areas for building distribution lines. The concessions are given by the Chilean Ministry of Energy for an undefined period.period of time and give the right to use public areas for building distribution lines. Distribution companies have the obligation to serve and connect thesupply electricity to regulated customers that makerequest service within their concession area, except for customers that have chosen the requirement in theunregulated regime. A concession area. The president of Chile can declare a concessionmay be declared expired if the quality of service does not meet certain minimum standards.
Energy Purchases
Since 2005, withRegarding the enactmentsupply of the law “Ley Corta II,” energy sales between generation andelectricity to regulated customers, DFL 4 establishes that distribution companies must permanently have been made by an international auction process. After the last modification of the law (Law 20,805 – 2015), the auctions of all distribution companieselectricity supply available. They must contract their energy supply through open, non-discriminatory and transparent public tenders. These bidding processes are managed by the CNE. The auctionsCNE and are based on distribution companies’ projections of energy demand fordemand. They are carried out at least five years in advance from the coming years. The resultexpected effective date of the processenergy supply contract, which has a 20-year term. In case of unforeseen deviations in the projections of demand, the regulator has the authority to carry out short term tenders. There is also a “pay as bid” contract, with an extension up to 20 years. In addition, the modifications of the law establish aregulated mechanism to remunerate supply the excess demand that is not covered by a contract if this were to take place.
The latest tender was carried out in 2017. A total 2,200 GWh/year were awarded for the contract.period from January 1, 2024 to December 31, 2043 at an average price of 32.5 US$/MWh, which must be completely sourced from NCRE. For further detail on the outcome of tenders, please see “Item 4. Information on the Company — B. Business overview”.
Distribution Tariffs to End Customers
The Chilean distribution tariff model has gone through nine tariff setting process since its privatization in the 1980s.
Tariffs charged by distribution companies to end regulated customers are set every four years. Tariffs are determined by the sum of the cost of electricity purchased by the distribution company, a transmission charge and the value addedValue Added from distributionDistribution of electricity (“VAD”), which allows distribution companies to recover their investment and operating costs, including a return on investment, which is set by law. The price for both generation and distribution capacity sold to customers includes a factor which reflects the simultaneous contribution of each customer to peak capacity demand of the system as a whole. The transmission charge reflects the cost paid for electricity transmission and transformation.
The VAD is based on a so-called “efficient model company,” whichcompany” within a Typical Distribution Area (“TDA”). It considers the cost of building and operating the company at the minimum cost, fulfilling quality and safety standards. It includes the annualized investment in distribution assets, the company’s operation, administration, and maintenance costs, and an expected return on investment, before taxes of 10% per year in real terms, based on the replacement cost of assets used for the distribution business.
Generation costs are passed on to distributors end consumers through the “Average Node Price” stated in government’s price decrees. The Average Node Price is adjusted in three instances: (1) every six months, in January and July of each year, based on local and international indexes; (2) upon the entrystandards of a new supply contract with any distribution company; and (3) upon indexation of a supply contract in excess of 10%.
Regulatory Charges and Subsidies
The Chilean law deemscompany within that transitory subsidies can be granted, ifTDA. Therefore, the residential customer tariff increased by 5% or more within a six-month period. The application of this subsidy is optional and the last one was granted in 2009.
Distribution Tariff-Setting Process
The VAD is set every four years. The CNE classifies all distribution companies into groups called Typical Distribution Areas (“TDA”) based on economic factors that group companies with similar distribution costs, which in turn determines the equipment requirements of the network. The CNEaccording to their TDA, then selects one distribution company for every groupfrom each TDA and estimates its cost under the concept ofas an efficient model company. At the same time, distributionDistribution companies also carry out their own studies whichto determine the costs of such company as the efficient model company. Cost estimates include fixed costs, average energy and capacity losses, standard investment costs, and operation and maintenance costs. The annual investment costs are basedcalculated considering the Replacement Cost (“VNR” in its Spanish acronym) of the installations, useful life and a 10% return on the same one company selected by the CNE for each TDA. assets associated with electricity investments.
The VAD of each TDA is determined inas a weighted manneraverage with one third of the value estimated by the study of the companies and two thirds by the CNE. Preliminary tariffs, as a result ofwith the resulting VAD, are tested to ensure that they provide aan industry aggregate rate of return between 6% and 14% on distribution assets..
The real return on investment for a distribution company depends on its actual performance relative to the standards chosen by the CNE for the efficient model company. The tariff system allows for a greater return to distribution companies that are more efficient than the model company.
At
Electricity regulation establishes tariff equality mechanisms for electrical services. Law No. 20,928 states that the endmaximum tariff that distribution companies may charge residential customers must not exceed the average national tariff by more than 10%. The differences arising from the application of 2015,this mechanism will be progressively absorbed by the CNE setremaining customers subject to regulated prices that are under the typical distribution areas, and startedmentioned average, except for those residential users whose monthly average consumption of energy in the process for setting distribution tariffs for 2016-2020. In March 2016, Enel Distribución Chile engagedprior calendar year is lower than or equal to 200 kWh.
Additionally, Chilean law provides that transitory subsidies can be granted if the residential customer tariff increases by 5% or more within a consultant to calculatesix-month period. This subsidy is conferred by the state, its one-third weightingapplication is a faculty of the VAD, whilegovernment and the CNE must provide its value for its two-thirds weighting. The studylast one was delivered to the CNE on September 5, 2016.granted in 2009.
Associated Electrical Services
In 2013, the CNE concluded theThe tariff setting process for 25 regulated associated services (which include meter rental, disconnection2016-2020 concluded in August 2017 and reconnectionhad been effective, retroactively, since November 4, 2016. On December 18, 2017, CNE published a resolution which sets the Technical Standard of Quality of Service for Distribution Systems. The Distribution System Technical Service Quality Standards established higher technical and commercial standards, including electricity supply reliability indicators, such as, the System Average Interruption Frequency Index (SAIFI) which measures the average number of times a customer’s supply is interrupted in a year; and the System Average Interruption Duration Index (SAIDI), which measures the total number of minutes, on average, that a customer is without electricity in a year, among others. This resolution also refers to product quality, metering, monitoring and controlling and commercial service among others). These new prices were applied starting March 14, 2014quality. In this context, in September 2018, there was an extraordinary tariff update process. This updated tariff is non-retroactive and will remain in effectbe effective until the publication of a new decree, which was initially expected in November 2016. Currently, thisnext tariff setting process is not concluded and it is expected to be completed in 2017.process.
Incentives and Penalties
Distribution companies may be required to compensate end customers in the case of electricity shortages that exceed the authorized standards. These compensatory payments are equal to double the amount of electricity the distribution company failed to provide, using a rate equal to the so-called “failure cost.”
Transmission Regulation
The main transmission system consists of 220 kV or higher voltage lines that In addition, distribution companies are used by generators and customers. Every four years, a study is carried out to evaluate the existing system and to define the expansion plan. On July 31, 2015, the last study was deliveredsubject to the CNE. In February 2016, the Chilean Ministry of Energy promulgated Decree 23T, which defines the current valueprovisions of the existing linesSEF, in particular to be remunerated for the period from 2016 to 2019. The main transmission system is paid for generatorsin its articles 15 and customers.
According to the General Electricity Services Law, the transportation of electricity by main transmission systems and sub-transmission systems are defined as a public service. Therefore, the transmitter has a service obligation and is responsible for the maintenance and improvement of its facilities.
In July 2016, Transmission Law No 20,936 restructured electrical transmission system operations, introducing a single independent national coordinator that replaces the current CDECs (notwithstanding the existence of some intermediate and isolated electrical systems). In addition, the government assumes the main role in the planning16 of the transmission system, including the tender process. Among other aspects of the law, open access is extended to all transmission facilities. It unites the process of the transmission facility qualification process of each segment into a single process,Law No. 18,410, in which different infractions are listed and modifies the remuneration mechanism by means of the application of a stamped rate of charge of the demand. The new independent national coordinator will take the CDECs’ responsibilities and assume its new functions dated prior to July 2018, by which time the process will be fully operative.
Zonal Transmission System Regulation
The Transmission Law redefines the previous subtransmission system as the Zonal Transmission System. The Zonal Transmission Systems are defined as voltage lines exceeding 23 kV and are grouped geographically. There are six zonal systems defined by decree. The zonal systems are paid mainly by customersclassified according to their severity and associated fines.
Distribution-Related Services
Distribution-related services are services identified by the TDLC as subject to regulation, such as meter rentals and meter verification, among others. The tariffs fixed by decree of the Chilean Ministry of Energy. Zonal tariffs remunerate the Zonal Transmission Annual Value, which is calculatedthese services are set every four years in a process carried out by the government. CNE along with the VAD calculation.
The annual value of each system includes efficient operation, maintenance, administration coststariff setting process for the distribution related services for the 2016-2020 period concluded in July 2018. The new tariff is non-retroactive and annual valuation of real investments, which are valued as new, and uses a discount rate determined by the CNE. The discount rate is calculated using a CAPM model with a minimum value of 7% after tax. If major discrepancies are discovered between the government and zonal companies, an expert panel will resolve them based on technical aspects.
In April 2013, Decree 14 was promulgated, which established a tariff schedule for 2011 through 2014. During 2014, studies were developed to set tariffs for zonal systems. The results of these studies should have been applied at the beginning of 2015. However, the authority ruled that the current values will remainbe in effect for an additional year. Subsequently, withuntil the application of Law 20,936, the current values will remain in effect for another two additional years, until 2018.next tariff setting process.
On September 30, 2016, in accordance with the definitions of the Transmission Law, Enel Distribución Chile delivered the updated and supplemented list of zonal assets as of December 31, 2015 of the Stx-D system (the zonal system that includes the Enel Distribución Chile assets) and the summary report valuation of the annual investments and costs of operation, maintenance and administration of these installations, for their consideration in the determination of the annual value of the zonal transmission systems for the 2018 – 2019 period. Currently, the CNE is reviewing this information to prepare a technical document.
6. Environmental Regulation
The Chilean constitution grants citizens the right to live in a pollution-free environment. It further provides that certain other constitutional rights may be limited in order to protect the environment.
Chile has numerous laws, regulations, decrees and municipal ordinances that address environmental considerations. Among them are regulations relating to waste disposal (including the discharge of liquid industrial wastes), the establishment of industries in areas that may affect public health, and the protection of water for human consumption.
Environmental Law No. 19,300 was enacted in 1994 and has been amended by several regulations, including the Environmental Impact Assessment System Rule issued in 1997 and modified in 2001. This law establishes a general framework of regulation of the right to live in a pollution-free environment, the protection of the environment, the preservation of nature and the conservation of environmental heritage. It also regulates environmental management instruments such as the Strategic Environmental Assessment, the Environmental Impact Assessment System and Access to Environmental Information, the Environmental Damage Liability, the Enforcement and the Environmental Protection Fund and the environmental institutional framework of Chile. This law requires companies to conduct an environmental impact study (“EIA” in its Spanish acronym) and a declaration of any future generation or transmission projects.
In January 2010, Law No. 19,300 was modified by Law No. 20,417, whichand introduced changes to the environmental assessment process and in the public institutions involved, principally creating the Chilean Ministry of Environment and the Superintendence of Environment. Environmental assessment processes are coordinated by this entity and by the Environmental Assessment Service. Service (SEA).
The Ministry of the Environment is in charge of the management, protection and application of policies in environmental matters, whose mission is to lead sustainable development, through the generation of efficient public policies and regulations, by promoting good practices that improve citizen environmental education. This Ministry works in the recovery of air quality in urban centers, the management of natural resources and biodiversity, the proper final disposal of solid waste, climate change and protection of water resources, and environmental education and citizen participation.
The SEA is in charge of guarding the regulatory integrity within the framework of the environmental impact assessment of the projects, while the Superintendence of Environment monitors compliance with the environmental qualification, standards and plans.
In June 2011, the Ministry of Environment published Decree 13, which establishes emission standards for thermoelectric plants applicable to generation units of at least 50 MW. The objective of this regulation is to control atmospheric emissions of particulate matter (MP), nitrogen oxides (NOx)(NOx), sulfur dioxide (SO2) and mercury (Hg), in order to prevent and protect the health of the population and protect the environment. Existing emission sources are required to meet emission limits as established in the regulation for MP emissions and for SO2 and NOxNOx emissions by June 2015 in highly polluted areas and by June 2016 elsewhere.
In June 2012, Law No. 20,600 created the Environmental Courts, special jurisdictional courts subject to the control of the Chilean Supreme Court. Their primary function is to resolve environmental disputes within their jurisdiction and look intoinvestigate other matters that are submitted for their attention under the law. The law created three such courts, all of which are in operation.
On December 28, 2012, the Superintendence of Environment was formally created and began to exercise its powers of enforcement and sanctions pursuant to Chilean environmental regulations.
On September 10, 2014, Law No. 20,780 was enacted and included charges for the emission of MP, NOx,NOx, SO2 and CO2 into the atmosphere. For CO2 emissions, the charge is US$ 5 per emitted ton (not applicable to renewable biomass generation). MP, NOxNOx and SO2 emissions will be charged the equivalent of US$ 0.10 per emitted ton, multiplied by the result of a formula based on the population of the municipality where the generation plant is located and an additional fee of US$ 0.90 per ton of MP emitted, US$ 0.01 per ton of SO2SO2 emitted and US$ 0.025 per ton of NOx emitted. This tax will be in effect beginningbecame effective in 2018, taking into accountwith the amount due calculated based on the previous year’s emissions.
AsIn 2017, authorities published Exempt Resolution No. 659 related to the implementation of December 31, 2016, allArticle No. 8 of Law No. 20,780 regarding taxes on thermal electric power plant emissions as a result of the country’s latest tax reform.
All thermal plants of Enel Generación ChileGeneration and its subsidiary GasAtacama Chile have established methodologies to measure emissions during 2017 and pay related taxes, in line with the requirements of the Environmental Superintendence of Chile.
Regarding biodiversity, on January 5, 2018, the Chilean Sustainable Development Board approved the 2017-2030 National Biodiversity Strategy. This strategy replaces the existing national strategy adopted in 2003. The new strategy identifies five objectives related to the sustainable use of biodiversity, and the development of the institutions and regulation required for the sustainable management of ecosystems.
7. Raw Materials
For information regarding our raw materials, please see “Item 11. Quantitative and Qualitative Disclosures About Market Risk — Commodity Price Risk.”
C.Organizational Structure.
Principal Subsidiaries and Affiliates
We are part of an electricity group controlled by Enel, an Italian company and our Italian ultimate controlling shareholder, which beneficially owns 60.6%owned 61.9% of our shares.shares (excluding treasury stock) as of December 31, 2018. Enel is an energy company with multinational operations in the power and gas markets, with a focus on Europe and Latin America. Enel operates in over 3035 countries across fourfive continents, produces energy through a netmanaged installed capacity over 89 GW, which includes 43 GW of 84 GWrenewable sources, and distributes electricity and gas through a network covering 1.92.2 million kilometers. With over 6173 million users worldwide, Enel has the largest customer base among European competitors and figures among Europe’s leading power companies in terms of installed capacity and reported EBITDA. Enel publicly tradesshares trade on the Milan Stock Exchange.

As of December 31, 2018

(1) Only principal operating consolidated entities are presented here. The percentage listed in the box for each of Enel Chile’s consolidated subsidiaries represents its economic interest in such consolidated subsidiary.
(2) Excluding treasury stock.
The companies listed in the following table were consolidated by us as of December 31, 2016.2018. In the case of subsidiaries, economic interest is calculated by multiplying our percentage of economic interest in a directly held subsidiary by the percentage economic interest of any entity in the chain of ownership of such ultimate subsidiary.
Principal Subsidiaries | | % Ownership of Each Main Subsidiary by Enel Chile | | | Consolidated Assets of Each Main Consolidated Entity | | | Revenues and Other Operating Income of Each Main Subsidiary | |
| | (in %) | | | (in billions of Ch$) | | | | | |
Electricity Generation | | | | | | | | | | | | |
Enel Generación Chile(1) | | | 60.0 | % | | | 3,399.7 | | | | 1,659.7 | |
Electricity Distribution | | | | | | | | | | | | |
Enel Distribución Chile | | | 99.1 | % | | | 1,074.3 | | | | 1,315.8 | |
Other non-electricity businesses | | | | | | | | | | | | |
SIEI | | | 100.0 | % | | | 69.2 | | | | 10.9 | |
Principal Subsidiaries | | % Ownership of Each
Main Subsidiary by
Enel Chile | | Consolidated
Assets of Each
Main Consolidated
Entity | | Revenues and Other
Operating Income
of Each
Main Subsidiary | |
| | (in %) | | (in billions of Ch$) | | | |
Electricity Generation | | | | | | | |
Enel Generation | | 93.6 | % | 3,669 | | 1,521 | |
EGP Chile(1) | | 100.0 | % | 1,973 | | 183 | |
Electricity Distribution | | | | | | | |
Enel Distribution | | 99.1 | % | 1,279 | | 1,263 | |
(1)
| Enel Generación Chile consolidates all generation facilities in Chile.
|
(1) EGP Chile is the result of EGPL merging into Enel Chile during the 2018 Reorganization
Generation Business
Enel Generation
Enel Generación Chile
Enel Generación ChileGeneration is a Chilean electricity generation business,company, which has a total installed capacity of 6,351 MW as of December 31, 2016,2018, with 28 generation facilities. Of the total installed capacity, 54.6%55% is from hydroelectric power plants and includes, among others, Ralco with 690689 MW, Pehuenche with 570568 MW, El Toro with 450449 MW, Rapel with 377376 MW, and Antuco with 320319 MW. Nearly 77% of its thermoelectric facilities are gas/fuel oil power plants, and the remaining are coal-fired steam power plants. Our economic interest in Enel Generación was 93.6% as of December 31, 2018.
EGP Chile
On April 2, 2018, and as a result of the 2018 Reorganization, EGPL merged into Enel Chile and EGP Chile became a direct and wholly-owned subsidiary of Enel Chile. EGP Chile is 60.0%an electricity utility company engaged in the generation business in Chile and a leader in Chile’s renewable energy market with a mixed portfolio of wind (564 MW), solar (492 MW), hydroelectric (92 MW) and geothermal (41 MW) power. We hold a 99.99% economic interest in EGP Chile. For additional information on the corporate reorganization, see “Item 4. Information of the Company — A. History and Development of the Company — The 2018 Reorganization”.
GasAtacama
GasAtacama is a generation company located northern Chile, which owns and operate a four-unit combined-cycle power plant with a total installed capacity of 732 MW and a gas pipeline, which connects to Argentina. In April 2014, we acquired a 50% ownership interest in Inversiones GasAtacama Holding Ltda. (“GasAtacama Holding”) and as a result of it, we owned a controlling equity interest in GasAtacama Holding.
Since the second half of 2016, we have been carrying out a corporate simplification process, which mainly involved mergers. During 2016, GasAtacama Holding merged into Celta, which merged into GasAtacama, the surviving company, on November 1, 2016. On November 9, 2017, GasAtacama purchased the 25% minority interest of Central Éolica Canela S.A. On December 22, 2017, Central Éolica Canela S.A. was dissolved subsequent to the sale of its assets to GasAtacama on November 21, 2017.
As of December 31, 2018, GasAtacama owned the following power plants: Tarapacá, San Isidro, Pangue, Canela I and II and Ojos de Agua, which have an aggregate capacity of 1,110 MW.
As of December 31, 2018, we beneficially owned 93.7% of GasAtacama, with 91.1% from our indirect equity interest through Enel Generation, which owns 97.4% of GasAtacama, and the remaining 2.6% from our direct ownership.
Pehuenche
Pehuenche, a generation company connected to the SEN, owns three hydroelectric facilities located in the hydrological basin of the Maule River, south of Santiago, with a total installed capacity of 697 MW. The 568 MW Pehuenche plant began operations in 1991, the 89 MW Curillinque plant began operations in 1993, and the 40 MW Loma Alta plant began operations in 1997. Enel Generación holds 92.7% of the economic interest in Pehuenche. As of December 31, 2018, we beneficially owned an 86.7% economic interest in Pehuenche, through Enel Generación, and consolidate Pehuenche in our consolidated financial statements.
Distribution Business
Enel Distribution
Enel Distribution is one of the largest electricity distribution businesses in Chile as measured by the number of regulated customers, distribution assets and energy sales. Enel Distribution operates in a concession area of 2,105 square kilometers in the Santiago Metropolitan Region, serving approximately 1.9 million customers. As of December 31, 2018, our economic interest in Enel Distribution was 99.1%.
D.Property, Plant and Equipment.
Our property, plant and equipment are concentrated on electricity generation and distribution assets in Chile.
We conduct our generation business through EGP Chile, Enel Generation and their subsidiaries, which together own 48 generation power plants, all located in Chile, of which 18 are hydroelectric (3,548 MW installed capacity), 11 are thermal (2,781 MW installed capacity), 10 are solar (492 MW installed capacity) and 9 are wind powered (642 MW installed capacity). The description for our generation subsidiaries and their businesses is included in this “Item 4. Information on the Company.”
A substantial portion of our generating subsidiaries’ cash flow and net income is derived from the sale of electricity produced by our electricity generation facilities. Significant damage to one or more of our main electricity generation facilities or interruption in the production of electricity, whether resulting from an earthquake, flood, volcanic activity, severe and extended droughts or any other such natural disasters, could have a material adverse effect on our operations.
The following table identifies the power plants that we own, all located in Chile, at the end of each year, by company and their basic characteristics:
Property, Plant and Equipment of Generation Companies
| | | | | | Installed Capacity(1)(2)
As of December 31, | |
Company | | Power Plant Name | | Power Plant Type(3) | | 2018 | | 2017 | | 2016 | |
| | | | | | (in MW) | |
Enel Generation | | Rapel | | Reservoir | | 376 | | 377 | | 377 | |
| | Cipreses | | Reservoir | | 106 | | 106 | | 106 | |
| | El Toro | | Reservoir | | 449 | | 450 | | 450 | |
| | Los Molles | | Run-of-the-river | | 18 | | 18 | | 18 | |
| | Sauzal | | Run-of-the-river | | 77 | | 77 | | 77 | |
| | Sauzalito | | Run-of-the-river | | 12 | | 12 | | 12 | |
| | Isla | | Run-of-the-river | | 70 | | 70 | | 70 | |
| | Antuco | | Run-of-the-river | | 319 | | 320 | | 320 | |
| | Abanico | | Run-of-the-river | | 136 | | 136 | | 136 | |
| | Ralco | | Reservoir | | 689 | | 690 | | 690 | |
| | Palmucho | | Run-of-the-river | | 34 | | 34 | | 34 | |
| | Total hydroelectric | | | | 2,284 | | 2,290 | | 2,290 | |
| | Bocamina | | Steam Turbine/Coal | | 478 | | 478 | | 478 | |
| | Diego de Almagro | | Gas Turbine/ Diesel Oil | | 24 | | 24 | | 24 | |
| | Huasco | | Gas Turbine | | 64 | | 64 | | 64 | |
| | Taltal | | Gas Turbine/Natural Gas+Diesel Oil | | 240 | | 245 | | 245 | |
| | San Isidro 2 | | Combined Cycle /Natural Gas+Diesel Oil | | 388 | | 399 | | 399 | |
| | Quintero | | Gas Turbine/Natural Gas | | 257 | | 257 | | 257 | |
| | Total thermal | | | | 1,451 | | 1,467 | | 1,467 | |
| | Total | | | | 3,735 | | 3,757 | | 3,757 | |
Pehuenche | | Pehuenche | | Reservoir | | 568 | | 570 | | 570 | |
| | Curillinque | | Run-of-the-river | | 89 | | 89 | | 89 | |
| | Loma Alta | | Run-of-the-river | | 40 | | 40 | | 40 | |
| | Total | | | | 697 | | 699 | | 699 | |
GasAtacama | | Atacama | | Combined Cycle /Natural Gas+Diesel Oil | | 732 | | 781 | | 781 | |
| | Tarapacá | | Steam Turbine/Coal | | 158 | | 158 | | 158 | |
| | Tarapacá | | Gas Turbine/Diesel Oil | | 20 | | 24 | | 24 | |
| | San Isidro | | Combined Cycle /Natural Gas+Diesel Oil | | 379 | | 379 | | 379 | |
| | Pangue | | Reservoir | | 466 | | 467 | | 467 | |
| | Canela I | | Wind Farm | | 18 | | 18 | | 18 | |
| | Canela II | | Wind Farm | | 60 | | 60 | | 60 | |
| | Ojos de Agua | | Run-of-the-river | | 9 | | 9 | | 9 | |
| | Total | | | | 1,842 | | 1,896 | | 1,896 | |
| | | | | | Installed Capacity(1)(2)
As of December 31, | |
Company | | Power Plant Name | | Power Plant Type(3) | | 2018 | | 2017 | | 2016 | |
| | | | | | (in MW) | |
EGP Chile (4) | | Eólica Los Buenos Aires | | Wind | | 24 | | — | | — | |
| | Eólica Talinay Oriente | | Wind | | 90 | | — | | — | |
| | Eólica Talinay Poniente | | Wind | | 61 | | — | | — | |
| | Eólica Taltal | | Wind | | 99 | | — | | — | |
| | Parque Eólico Renaico | | Wind | | 88 | | — | | — | |
| | Parque Eólico Sierra Gorda Este | | Wind | | 112 | | — | | — | |
| | Valle De Los Vientos | | Wind | | 90 | | — | | — | |
| | Cerro Pabellón | | Geothermal | | 41 | | — | | — | |
| | Pilmaiquén | | Reservoir | | 41 | | — | | — | |
| | Pullinque | | Run-of-the-river | | 51 | | — | | — | |
| | Carrera Pinto I Etapa | | Solar | | 20 | | — | | — | |
| | Carrera Pinto II Etapa | | Solar | | 77 | | — | | — | |
| | Chañares | | Solar | | 40 | | — | | — | |
| | Lalackama | | Solar | | 60 | | — | | — | |
| | Lalackama 2 | | Solar | | 18 | | — | | — | |
| | Pampa Solar Norte | | Solar | | 79 | | — | | — | |
| | Parque Solar Finis Terrae | | Solar | | 160 | | — | | — | |
| | Solar Diego de Almagro | | Solar | | 36 | | — | | — | |
| | Solar Diego de Almagro (Ampliación) | | Solar | | — | | — | | — | |
| | Solar La Silla | | Solar | | 2 | | — | | — | |
| | Total | | | | 1,189 | | — | | — | |
| | Total Capacity | | | | 7,463 | | 6,351 | | 6,351 | |
| | | | | | | | | | | |
(1) The installed capacity corresponds to the gross installed capacity, without considering the MW that each power plant consumes for its own operation.
(2) The 2018installed capacity may differ from previous years since the CEN has reviewed the capacity of each generation unit and adjusted their capacity.
(3) “Reservoir” and “run-of-the-river” refer to hydroelectric plants that use the force of a dam or a river, respectively, to move the turbines that generate electricity. “Steam” refers to thermal power plants fueled with natural gas, coal, diesel or fuel oil to produce steam that moves the turbines. “Gas Turbine” or “Open Cycle” refer to thermal power that uses either diesel or natural gas to produce gas that moves the turbines. “Combined-Cycle” refers to a thermal power plant fueled with natural gas, diesel oil, or fuel oil to generate gas that first moves a turbine and then recovers the gas from that process to generate steam to move a second turbine.
(4) The acquisition of EGP Chile by Enel Chile was completed April 2, 2018. It includes power plants of its subsidiaries Almeyda Solar SpA, Empresa Eléctrica Paguipulli S.A, Enel Green Power del Sur SpA, Geotérmica del Norte S.A., Parque Eólico Tal Tal S.A., Parque Eólico Talinay Oriente S.A. and Parque Eólico Valle de Los Vientos S.A.
Property, Plant and Equipment of Distribution Companies
We conduct our distribution business through Enel Distribution and its subsidiaries, Empresa Eléctrica de Colina Ltda. and Luz Andes Ltda. The description of our distribution subsidiary and its business is included in this “Item 4. Information on the Company.”
A substantial portion of our distribution subsidiaries’ cash flow and net income is derived from the sale of electricity distributed through our distribution installations. Significant damage to one or more of our main electricity distribution installations or interruption in the distribution of electricity, whether as a result of an earthquake, flood, volcanic activity, severe snowstorms and wind storms or any other such natural disasters, could have a material adverse effect on our operations.
The table below describes our main electricity distribution equipment, such as, distribution networks, substations and transformers and transmission lines. They include the consolidate property, plant and equipment figures of our subsidiary Enel Distribution.
TABLE OF DISTRIBUTION FACILITIES
General Characteristics
| | | | Transmission Lines(1)
As of December 31, | |
| | Concession Area | | 2018 | | 2017 | | 2016 | |
| | (in km2) | | (in kilometers) | |
Enel Distribution | | 2,105 | | 367 | | 367 | | 361 | |
(1) The transmission lines consist of circuits with voltages in the 35-220 kV range.
Power and Interconnection Substations and Transformers (1)
| | As of December 31, 2018 | | As of December 31, 2017 | | As of December 31, 2016 | |
| | Number of
Substations | | Number of
Transformers | | Capacity
(MVA) | | Number of
Substations | | Number of
Transformers | | Capacity
(MVA) | | Number of
Substations | | Number of
Transformers | | Capacity
(MVA) | |
Enel Distribution (2) | | 56 | | 206 | | 8,398 | | 56 | | 203 | | 8,386 | | 56 | | 204 | | 8,281 | |
(1) Voltage of these transformers is in the range of 500 kV (in - high voltage) and 1 kV (out - medium voltage).
(2) In 2017 a failure destroyed a transformer in the Quilicura SE, which caused its withdrawal from the system.
Distribution Network - Medium and Low Voltage Lines (1)
| | As of December 31, 2018 | | As of December 31, 2017 | | As of December 31, 2016 | |
| | Medium Voltage | | Low Voltage | | Medium Voltage | | Low Voltage | | Medium Voltage | | Low Voltage | |
| | | | | | (in Kilometers) | | | | | |
Enel Distribution | | 5,331 | | 11,678 | | 5,298 | | 11,519 | | 5,251 | | 11,431 | |
(1) Medium voltage lines: 1 kV - 34.5 kV; low voltage lines: 380-110 V.
Transformers for Distribution (1)
| | As of December 31, 2018 | | As of December 31, 2017 | | As of December 31, 2016 | |
| | Number of
Transformers | | Capacity | | Number of
Transformers | | Capacity | | Number of
Transformers | | Capacity | |
| | | | (in MVA) | | | | (in MVA) | | | | (in MVA) | |
Enel Distribution | | 21,767 | | 4,739 | | 21,838 | | 4,575 | | 21,876 | | 4,505 | |
(1) Voltage of these transformers is in the range of 34.5 kV (in - medium voltage) and 1 kV (out - low voltage).
Insurance
Both our electricity generation and distribution facilities are insured against damage caused by natural disasters such as earthquakes, fires, floods, other acts of god (but not for droughts, which are not considered force majeure risks, and are not covered by insurance) and from damage due to third-party actions, based on the appraised value of the facilities as determined from time to time by an independent appraiser. Based on geological, hydrological and engineering studies, management believes that the risk of the previously described events resulting in a material adverse effect on our facilities is remote. Claims under our subsidiaries’ insurance policies are subject to customary deductibles and other conditions. We also maintain business interruption insurance providing coverage for the failure of any of our facilities for a period of up to 24 months, including the deductible period. Insurance policies include liability clauses, which protect our companies from claims made by third parties. The insurance coverage taken for our property is approved by each company’s management, taking into account the quality of the insurance companies and the needs, conditions and risk evaluations of each facility, and is based on general corporate guidelines. All insurance policies are purchased
from reputable international insurers. We continuously monitor and meet with the insurance companies in order to obtain what we believe is the most commercially reasonable insurance coverage.
Project Investments
We are continuously analyzing potential opportunities for growth. The study and profitability assessment of our project portfolio is an ongoing effort. Industry technology is allowing for smaller, less environmentally damaging power plants. These plants can be built quicker, allow greater flexibility to activate or deactivate according to system needs, and are generally preferred by the community. We are favoring renewable energy technology for our new power plant investments. We seek opportunities, either by building new greenfield projects or by modernizing existing brownfield assets and improving (operationally and/or environmentally) performance. The expected start-up for each project is assessed and is defined based on the commercial opportunities and our financing capacity to fund these projects. All of our projects are financed with internally generated funds. Below we list our most important projects under development; however, any decision related to construction will depend on commercial opportunities foreseen in the upcoming years, including future tenders for supplying the regulated market, and the evolution of the regulatory framework (mainly associated with ancillary services).
Budgeted amounts include connecting lines that could be owned by third parties and paid as tolls, unless otherwise indicated.
1.Generation Business Projects
Projects completed during 2018
Bocamina Optimization Project
Bocamina is a 478 MW coal-fired power plant located in Coronel in the Bíobío Region in southern Chile, which consists of two units, Bocamina I (128 MW) and Bocamina II (350 MW). Bocamina II started commercial operations in July 2013 but suspended its operations in December 2013 due to environmental injunctions. A new Environmental Impact Statement was approved in March 2015 and included a new technical optimization plan. On April 2, 2015, the Chilean Court approved the new RCA, and the plant resumed operations in July 2015, after complying with all requested conditions established in the new RCA.
The technical optimization plan involves the following: (i) installation of Johnson filters for seawater intake in both units; (ii) installation of domes over the north and south coalfields; (iii) improvement of the ash dump in operation, and (iv) construction of a water treatment plant. After we finished the dome over the north coalfield, we proceeded to the construction and completion of the south dome in June 2018, achieving a storage capacity of 270,000 tons of coal.
The latest progress includes:
· On June 15, 2018, we received the Provisional Acceptance Certificate.
· On October 17, 2018, we received the certificate of definitive reception of the building works for the south dome.
We expect that the estimated total investment will be Ch$ 62,103 million, of which Ch$ 61,357 million was incurred as of December 31, 2018.
A.Projects under Construction
A.1 Enel Generation
Los Cóndores Hydroelectric Project
The Los Cóndores project is located in the Maule Region, in the San Clemente area. It consists of a 150 MW run-of-the-river hydroelectric power plant, with two Pelton vertical water turbine units, which will use water from the Maule Lagoon reservoir through
a pressure tunnel. The power plant will be connected to the SEN at the Ancoa substation (220 kV) through an 87 km transmission line.
On September 14, 2018, the Board of Directors of Enel Generation approved an updated construction plan, with a total project investment of US$ 957.3 million, excluding contingencies. The construction activities will continue until 2020. After that, the power plant commissioning phase will follow as well as commercial operations.
As of December 31, 2018, 65.6% of the project was completed and 86.8% of the transmission lines were completed and assembled, according to the last approved construction plan. We expect that the estimated total investment will be Ch$ 665,986 million, of which Ch$ 419,022 million was incurred as of December 31, 2018. This project is being financed primarily with internally generated funds.
Sauzal Repowering
The Sauzal Repowering project is to be implemented within the Sauzal power plant, located in the Libertador General Bernando O’Higgins Region of central Chile. The power plant uses the water of the Cachapoal and Claro Rivers and is a run-of-the-river hydroelectric power plant with three Francis vertical units.
The project involves replacing two turbines with a target efficiency rate of 95%, obtaining up to 3MW of new capacity and 13.7 GWh per year. The contract was signed with Voith in July 2018. During 2018, detailed engineering was carried out and the manufacturing of the runner parts, shaft and seals of the first unit commenced, with an overall progress of 37% as of December 2018.
The estimated total investment is US$ 10.5 million, of which US$ 2 million has been incurred as of December 31, 2018. This project is being financed primarily with internally generated funds.
Bocamina closure plan of the landfill
The project considers the application of the best practices for closure of similar ash dumpsite facilities. In a first stage there will be infrastructure and operation improvements in two sectors. We expect to satisfy the environmental standard established in the Environmental Impact Assessment approved in March 2015.
The project is composed of two stages:
· Stage 1: Closure works of sectors one and two and a lateral one (the total area is around 48,000 m2), which we expect to complete during the second quarter of 2020.
· Stage 2: Closure works for the remaining sector 3 at the end of the life of the power plant. This second stage does not have a commissioning date defined since it depends on several factors such as the operation of the plant and the sale of ashes.
Currently, the basic design is completed and the bidding process of major works is ongoing.
For stage 1 we estimate a total investment of Ch$ 6,555 million, of which Ch$ 1,668 million was incurred as of December 31, 2018.
A.2 EGP Chile
Campos del Sol I Project
The Campos del Sol I project is located in the Atacama Region of Chile. It consists of a 382 MW solar power plant. This project was awarded to EGP Chile in the DisCo Tender 2016 and is expected to reach commercial operation in 2021. The land has been secured, the environmental approval has been obtained and power purchase agreements for 2021-2045 have already been confirmed. The project has potential synergies with the already operational Carrera Pinto solar project. We expect a total investment of US$320.9 million, of which we had accrued US$ 2 million as of December 31, 2018.
Renaico II Project
The Renaico II project is located in the Araucanía Region of Chile and it consists of a 133 MW power plant with two farms: (i) the Las Viñas project, which consists of a 48 MW wind power plant built by EGP Chile and (ii) the Puelche project, which
consists of a 85 MW wind power plant developed independently by Pacific Energy. The Puelche project will be entirely acquired by EGP Chile. This project is expected to begin commercial operations in 2021, has potential synergies with EGP Chile’s operational Renaico I wind project and will use existing infrastructure such as a substation and a transmission line. The land has been secured and the environmental approval is in process. We estimate a total investment of US$ 176.4 million, with US$ 0.51 million accrued as of December 31, 2018.
Cerro Pabellón 3 Project
The Cerro Pabellón 3 project is located in the Antofagasta Region in northern Chile. It consists of a 33 MW geothermal power plant. We expect that this project will begin to operate commercially in 2020. It has potential synergies with the operational Cerro Pabellón geothermal project and will use existing infrastructures such as a substation and transmission line. The land has been secured and the environmental approval is in process. We expect a total investment of US$ 95.8 million, none of which was accrued as of December 31, 2018.
B.Projects Under Development
We are currently evaluating the development of the following projects, which we classify as “under development”. We will finally decide whether to proceed or not with each project depending on the commercial and other opportunities foreseen in upcoming years, and in particular, future tender prices for supplying the energy requirements of the regulated market and/or negotiations with existing or new unregulated customers.
B.1 Enel Generation
Vallecito Hydroelectric Project
The Vallecito hydroelectric project is located in the Maule Region, in the upper part of the Maule River basin. It consists of a run-of-the-river hydroelectric plant with an installed capacity of 55 MW. We expect to deliver energy to the SEN through the transmission line of the Los Cóndores hydroelectric plant, which we are also currently building (see above).
We have developed the Vallecito project based on a sustainable development plan that requires the development of technical-economic, environmental and hydroelectric social activities. We have established community-specific actions to be carried out with nine communities of the Pehuenche Route in order to incorporate social stakeholder considerations, capacity and local projects in the hydro project development plan.
During 2017, we developed complete basic design and environmental base line campaigns and implemented a sustainable development plan after several meetings with local communities aimed to jointly design the best-shared use for the hydro project and to obtain agreements with local communities that will be integrated in the Environmental Impact Study (“EIA” in its Spanish acronym).
The next steps are to finalize and prepare the EIA that will include collaborative agreements with communities directly related to the project. Based on current market conditions and future commercial options, we will eventually decide whether to continue to undertake the development of this project. The current plan contemplates commencing construction during 2020 and commissioning to take place in 2023. We estimate a total investment of Ch$ 127,357 million, of which Ch$ 9,159.6 million was incurred as of December 31, 2018.
Smart Repowering Projects
Within the context of projects under development, we are analyzing the following three Smart Repowering projects to increase the installed capacity or electricity generation, or both, of power plants already in operations by upgrading some components or improving the hydraulic potential of the plant, or both.
Antuco Repowering
The Antuco Repowering project is to be implemented within the Antuco operating power plant, located in Biobío Region in southern Chile. The project involves replacing one turbine installed in 1981 with an 88% load factor, with a new turbine with a target
efficiency rate of 94%, obtaining 21 GWh of new energy. We estimate total investments of US$ 14.5 million, none of which has been incurred as of December 31, 2018, and we expect to begin operations in the second half of 2020.
Quintero Combined-Cycle Project
The Quintero project is located in the Valparaíso Region and consists of an energy efficiency project that takes advantage of the heat of the gases emitted by the existing turbines to produce steam through the installation of a steam turbine and a generator, which allows converting the existing open cycle plant into a combined-cycle gas plant. Currently, the Quintero plant has two gas turbines with a total capacity of 257 MW. With the addition of a steam turbine unit of 130 MW capacity, the Quintero plant would reach a total capacity of 387 MW. We would deliver the produced energy to the SEN through the existing Quintero-San Luis line, a simple 220 kV circuit built to evacuate the energy of the combined-cycle power plant.
In 2017, we started the preparation of the environmental impact study and the implementation of the sustainability plan. However, during August 2018, the Quintero and Puchuncaví areas suffered an environmental crisis leaving more than 300 people suffering the toxic effects allegedly associated with gas emissions of other industries. As a result, the project was indefinitely postponed and the environmental impact study has been suspended.
The estimated total investment for the project is Ch$ 150,651 million, of which Ch$ 2,858 million was incurred as of December 31, 2018.
Ttanti Combined-Cycle Project
The Ttanti project is located in the Antofagasta Region, on land adjacent to the existing Atacama power plant that is located in the industrial zone of the city of Mejillones. The project consists of the construction of a natural gas combined-cycle power plant with an aggregate installed capacity of 1,290 MW (430 MW for each of the three units), and one unit would be able to use diesel oil as a backup in case of a shortage of natural gas. The power plant would connect to the SEN through a 0.5 km 220 kV double circuit transmission line to the Atacama substation, which would be expanded for this purpose.
The environmental permit, requested through an Environmental Impact Assessment, was approved in December 2017 by the Environmental Evaluation Service (“SEA” in its Spanish acronym) of the Antofagasta Region. Any decision related to the construction of the project will depend primarily on the commercial opportunities foreseen in the upcoming years (prices in future tenders and/or negotiations with unregulated customers, among other factors).
The estimated total investment for the first unit is Ch$ 251,078 million, of which Ch$ 1,319 million was incurred as of December 31, 2018.
Taltal Combined-Cycle Project
The Taltal project consists of the construction of a steam turbine for converting the existing Taltal gas-fired open cycle plant to a combined-cycle plant by adding a turbine in the vapor phase, which would use the steam generated by the gas turbines’ heat emissions to produce energy, which will considerably improve its efficiency. The Taltal power plant is located in the Antofagasta Region. Currently, the existing Taltal power plant has two gas turbines with 120 MW installed capacity each. The steam turbine would add 130 MW and therefore, the Taltal power plant would reach a total capacity of 370 MW. We will supply the produced energy to the SEN through the existing 220 kV double circuit Diego de Almagro — Paposo transmission line.
The environmental permit, requested through an Environmental Impact Statement submitted in December 2013, was approved in January 2017. Any decision related to the construction of the project will depend primarily on the commercial opportunities foreseen in the upcoming years (prices in future tenders and/or negotiations with unregulated customers, among others).
The estimated total investment is Ch$ 136,998 million, of which Ch$ 2,873 million was incurred as of December 31, 2018.
Taltal Battery Energy Storage System
The project consists of the installation of a battery energy storage system (BESS) in the Taltal power plant to provide ancillary services in upcoming years.
The project would reach an installed capacity of 12 MW and 12 MWh of energy storage, connected to the 15 kV bar of one of the existing 120 MW turbines installed in the Taltal power plant.
In May 2018, the Antofagasta Region SEA issued the resolution waiving the obligation to submit the project to environmental assessment before its construction. Any decision related to the construction of the project will depend primarily on the commercial opportunities foreseen in the upcoming years and, particularly, on the evolution of the regulatory framework for the provision and remuneration of the ancillary services, currently under elaboration by the authority.
The estimated total investment is Ch$ 8,119 million, of which Ch$ 15.1 million was incurred as of December 31, 2018.
Tarapacá Battery Energy Storage System
The project consists of the installation of a BESS in the Tarapacá power plant to provide ancillary services in upcoming years. The BESS has about 14 MW of installed capacity and 14 MWh of energy storage, and will be connected to the 11.5 kV bar of the existing 23 MW turbine installed in the Tarapacá power plant.
In December 2017, the SEA of the Tarapacá Region issued the resolution waiving the obligation to submit the project to environmental assessment before its construction. Any decision related to the construction of the project will depend on the commercial opportunities foreseen in the upcoming years and particularly on the evolution of the regulatory framework for the provision and remuneration of the ancillary services, currently under elaboration by the authority.
The estimated total investment is Ch$ 9,427 million, of which Ch$ 80.5 million was incurred as of December 31, 2018.
C.2 EGP Chile
Name | | Capacity (MW) | | Potential Synergies | | Expected
Commercial
Operation | | Estimated
investment | | Amount accrued
as of December
31, 2018 | |
| | | | | | | | (in US$ million) | |
Azabache | | 63 MW(1) | | With use the same land as the already operational Valle de los Vientos wind project as well as existing transmission line towers. | | 2021 | | 49.0 | | 0.34 | |
Valle del Sol | | 116 | | With the operational Finis Terrae I solar project. | | 2024 | | 91.4 | | 0.79 | |
Finis Terrae Extension Project | | 126 | | With the operational Finis Terrae I solar project and use of existing infrastructure (including a substation and transmission line). | | 2021 | | 94.4 | | 0.09 | |
Sol de Lila | | 122 | | This project may interconnect with the Argentine transmission system. | | 2023 | | 97.9 | | 0.81 | |
Flor del Desierto | | 50 | | — | | 2023 | | 39.4 | | 0.31 | |
Los Manolos | | 80 | | — | | 2023 | | 62.6 | | 0.33 | |
(1) The first wind and photovoltaic hybrid at an industrial scale in Chile
2.Distribution Business Projects
During 2018, our subsidiary Enel Distribution and its subsidiaries, Empresa Eléctrica de Colina and Luz Andes, invested a total Ch$ 96 billion in projects related to our customers’ natural growth rate, service quality requirements, safety and information system needs.
The most relevant investments in 2018 include the following:
· Ch$ 21 billion in the medium and low voltage network to allow for the connection of our new customers, including residential customers, large volume clients, and real estate projects.
· Ch$ 17.0 billion to increase our distribution capacity, consisting of Ch$ 12 billion invested in the San Pablo, Chicureo, Club Hípico substations and Ch$ 1.0 billion for adding and reinforcing medium voltage feeders.
· Ch$ 15 billion to reinforce feeders, specifically those determined by our service quality plan. Automation of the medium voltage network increased rapidly as a result of the installation of 320 new remote control devices, reaching a total of 1,701 devices controlled by our Centralized Network Operations Center.
· Ch$ 4 billion in network relocations due to new highways and requests from municipalities, which imply changing the electricity cables, including in some cases placing them below ground.
· Ch$ 12 billion to buy and install 190,856 smart meters in 2018, reaching a total 291,719 smart meters throughout 32 districts in Santiago. Smart meters allow us to remotely and automatically read electricity consumption, connect and disconnect electricity supply and allow customers to install solar panels and inject their surplus energy into the distribution network without the need of any additional equipment. By 2025, we should have all of our clients with smart meters, according to current regulations.
In December 2017, the CNE published the Technical Standard of Quality of Service for Distribution systems (NTDC in its Spanish acronym). This norm seek to reduce the service interruption duration (known in the industry as System Average Interruption Duration Index or SAIDI) from the current 8.5 hours per customer in urban areas on an annual basis to only 5 hours (measured as an average per municipality) by 2020 and to less than one hour by 2050 as well as to reduce the frequency of interruptions (known as System Average Interruption Frequency Index or SAIFI) from the current 6 times per customer on an annual basis to 4.5 by 2020. As of December 31, 2018, our average SAIDI of the 33 municipalities that we covered was 3 hours (a 32% reduction in comparison to 2017) and our SAIFI was 1.5 times.
Major Encumbrances
As of December 31, 2018, we have full ownership of our assets and they are not subject to material encumbrances.
Item 4A.Unresolved Staff Comments
None.
Item 5.Operating and Financial Review and Prospects
A. Operating Results.
General
The following discussion should be read in conjunction with our audited consolidated financial statements and the notes thereto, included in Item 18 in this Report, and “Selected Financial Data,” included in Item 3 herein. Our audited consolidated financial statements as of December 31, 2018 and 2017 and for each of the years in the three-year period ended December 31, 2018, have been prepared in accordance with IFRS, as issued by the IASB.
1.Discussion of Main Factors Affecting Operating Results and Financial Condition of the Company
We own and operate, through our subsidiaries, electricity generation and distribution companies in Chile. Our revenues, income and cash flows primarily come from the operations of our subsidiaries and associates in Chile.
Factors such as (i) hydrological conditions, (ii) fuel prices, (iii) regulatory developments, (iv) exceptional actions adopted by governmental authorities and (v) changes in economic conditions may materially affect our financial results. In addition, our results from operations and financial condition are affected by variations in the exchange rate between the Chilean peso and the U.S. dollar. We have certain critical accounting policies that affect our consolidated operating results. The impact of these factors on us, for the years covered by this Report, is discussed below.
After giving effect to the 2018 Reorganization (see “Item 4. Information on the Company — A. History and Development of the Company — the 2018 Reorganization”), since April 2, 2018, we own 93.6% of Enel Generation and we consolidate operations and results of EGP Chile, a wholly owned subsidiary. For further information regarding the acquisition of this company, please refer to “Item 4. Information on the Company — A. History and Development of the Company. — History.” The effects of this transaction on our consolidated financial statements as of December 31, 2018 are described in Note 6 to our consolidated financial statements.
a.Generation Business
A substantial part of our generation capacity is hydroelectric and depends on the prevailing hydrological conditions in Chile. Our installed capacity as of December 31, 2018, 2017 and 2016 was 7,463 MW, 6,351 MW and 6,351 MW, respectively, of which 48%, 55% and 55% was hydroelectric, respectively. See “Item 4. Information on the Company — D. Property, Plant and Equipment.”
Hydroelectric generation was 11,395 GWh, 9,652 GWh and 9,078 GWh in 2018, 2017 and 2016, respectively. Our 2018 hydroelectric generation was greater than 2017, continuing the same trend that occurred in 2017 and 2016. The increase was mainly due to the slight increase in the total fluvial energy and rainfalls that were few in number but intense, especially during July and between October and November 2018. However, some important reservoirs are still at relatively low levels due to several years of accumulated drought, characterized by low rainfalls and a poor snowmelt, since 2010.
Hydrological conditions in Chile can range from very wet, as a result of several years of abundant rainfall and lakes at their peak capacity, to extremely dry, as a consequence of prolonged droughts lasting for several years, the partial or material depletion of water reservoirs and the significant reduction of snow and ice in the mountains, which in turn leads to materially lower levels of available water as a consequence of lower melts. In between these two extremes, there is a wide range of possible hydrological conditions and their final effect on us may depend on the accumulated hydrology. For instance, a new year with drought conditions has less of an impact on us if it follows several periods of abundant rainfall as opposed to exacerbating a prolonged drought. Likewise, a good hydrological year has less marginal impact if it comes after several wet years as opposed to after a prolonged drought. In Chile, the period of the year that typically has the most precipitation is from May through August, and the period in which snow and ice in the mountains melt at higher levels is during the warmer months, from October through March, providing water flow to lakes, reservoirs and rivers, which supply our hydroelectric plants, most of them located in southern Chile. For purposes of discussing the impact of hydrological conditions on our business, we generally categorize our hydrological conditions as either dry or wet, although there are several other intermediate scenarios. Extreme hydrological conditions materially affect our operating results and financial condition.
However, it is difficult to indicate the effects of hydrology on our operating income, without concurrently considering other factors, because our operating income can only be explained by looking at a combination of factors and not each one on a stand-alone basis.
Hydrological conditions affect electricity market prices, generation costs, spot prices, tariffs and the mix of hydroelectric, thermal and NCRE generation, which is constantly being determined by the CEN to minimize the operating costs of the entire system. According to the current regulatory framework, the price at which energy is traded on the spot market (known as spot price) is determined by the marginal cost of the system. The marginal cost is the cost of the most expensive power plant in operation given an efficiency-based dispatch. Regulation also considers capacity payments to generators, which remunerates each power plant’s installed capacity according to its availability and contribution to the system’ safety. This capacity payment is determined by the regulator every six months. Run-of-the-river hydroelectric and NCRE generation are almost always the least expensive generation technology and normally have a marginal cost close to zero. Water from reservoirs used to generate electricity, on the other hand, is assigned an opportunity cost for the use of water, which may lead to hydroelectric generation using water from reservoirs having a significant cost in extended drought conditions. The cost of thermal generation does not depend on hydrological conditions but instead on international commodity prices for LNG, coal, diesel and fuel oil. Solar and wind sources are currently the NCRE technologies most widely used. NCRE facilities are able to dispatch energy to the system at very low marginal costs, but they depend on the blowing of the wind or the shining of the sun.
Spot prices primarily depend on hydrological conditions and commodity prices and, to a lesser extent, on NCRE availability. Under most circumstances, abundant hydrological conditions lower spot prices while dry conditions normally increase spot prices. Spot market prices affect our results because we must purchase electricity in the spot market when our contracted energy sales are greater than our generation, and we sell electricity in the spot market when we have electricity surpluses.
There are many other factors that may affect our operating income, including the level of contracted sales, purchases and sales in the spot market, commodity prices, energy demand and supply, technical and unforeseen problems that can affect the availability of our thermal plants, plant locations in relation to urban demand centers, and transmission system conditions, among others.
To illustrate the effects of hydrology on our operating results, the following table describes certain hydrological conditions, their expected effects on spot prices and generation, and the expected impact on our operating income, assuming that other factors remain unchanged. In all cases, hydrological conditions do not have an isolated effect but need to be evaluated along with other factors to better understand the impact on our operating results.
Hydrological
Conditions |
| Expected effects on spot prices
and generation |
| Expected impact on our operating results |
| | | | |
Dry | | Higher spot prices | | Positive: if our generation is higher than our contracted energy sales, energy surpluses are sold in the spot market at higher prices. Negative: if our generation is lower than our contracted sales, we have an energy deficit and must purchase energy in the spot market at higher prices. |
| Reduced hydro generation | | Negative: less energy available to sell in the spot market. |
| Increased thermal generation | | Positive: increases our energy available for sale and either reduces purchases in the spot market or increases sales in the spot market at higher prices. |
| | | | |
Wet | | Lower spot prices | | Positive: if our generation is lower than contracted energy sales, the energy deficit is covered by purchases in the spot market at lower prices. Negative: if we have energy surpluses, they are sold in the spot market at lower prices. |
| | | |
| Increased hydroelectric generation | | Positive: more energy available to sell in the spot market at lower prices. |
| | | |
| Reduced thermal generation | | Negative: less energy available to sell in the spot market. |
If factors other than those described above apply, the expected impact of hydrological conditions on operating results will be different from those shown above. For instance, in a dry year with lower commodity prices, spot prices may decrease, or in a wet year if demand increases, or generation plants are not available for technical or other reasons, the spot price may increase, altering the impact of hydrological conditions discussed in the table above.
b.Distribution Business
Our electricity distribution business is conducted through Enel Distribution in the Santiago metropolitan area, providing electricity to more than 1.9 million customers. Santiago is the country’s most densely populated area and has the highest concentration of industries, industrial parks and office facilities in the country.
For the year ended December 31, 2018, electricity sales amounted to 16,782 GWh, representing a 2.1% increase when compared to 2017. For the year ended December 31, 2017, electricity sales amounted to 16,438 GWh, representing a 3.2% increase when compared to 2016.
Distribution revenues are mainly derived from the resale of electricity purchased from generators. Revenues associated with distribution include the recovery of the cost of electricity purchased and the resulting revenues from the “Value Added from Distribution,” or VAD, plus the physical energy losses permitted by the regulator. Other revenues derived from our distribution business normally consist of transmission revenues, charges for new connections and the maintenance and rental of meters, among others. It also includes revenues derived from public lighting, infrastructure projects mainly associated with real estate development and energy efficiency solutions, including air conditioning equipment, LED lights, etc., in all cases including customers outside of our concession area.
Although these other sources of revenue have increased, the core business continues to be the distribution of electricity at regulated prices. Therefore, the regulatory framework has a substantive impact on our distribution business results.
In particular, regulators set distribution tariffs taking into account the cost of electricity purchases paid by distribution companies (which distribution companies pass on to their customers) and the VAD, all of which are intended to reflect investment and operating costs incurred by distribution and generation companies and to allow them to earn a regulated level of return on their investments and guarantee service quality and reliability. Our earnings are determined to a large degree by government regulation, mainly through the tariff setting process. Our ability to buy electricity relies highly on generation availability, and on regulation to a lesser degree. The cost of electricity purchased is passed on to end users through tariffs that are set for multi-year periods. Therefore, variations in the price at which a distribution company purchases electricity do not have an impact on our profitability.
In the past, we focused on reducing physical losses, especially those due to illegally tapped energy. Our physical losses have generally been around 5% for the last 20 years, a level close to the distribution technical loss threshold for our concession. Reducing losses below this level requires additional investments to reduce illegal tapping and would not be expected to have an economically attractive return. Currently, we are working instead on improving our efficiency, especially through new technologies to automate our networks as well as in increasing our quality of service in order to improve the efficiency of our facilities, profitability of our business and increase our capacity to satisfy our growing number of customers and their increasing demands.
Enel Distribution’s tariff review process, which set the tariffs for the 2016-2020 period, was finalized in August 2017. The new tariffs were applied retroactively as of November 2016 and the review did not have a significant effect on Enel Distribution’s tariffs. Tariffs for residential, commercial and industrial customers changed, but the changes offset each other, and Enel Distribution’s revenues remained stable. In September 2018, there was an extraordinary and non-retroactive tariff update process that will be effective until the next tariff setting process. This tariff increase is to recognize the necessary investments to comply with the new requirements on quality of service standards. Tariff reviews seek to capture distribution efficiencies and economies of scale resulting from economic
c.Economic Conditions
Macroeconomic conditions, such as changes in employment levels and inflation or deflation may have a significant effect on our operating results. Macroeconomic factors, such as the variation of the Chilean peso against the U.S. dollar, may impact our operating results, as well as our assets and liabilities, depending on the amounts denominated in U.S. dollars. For example, a devaluation of the Chilean peso against the U.S. dollar increases the cost of capital expenditure plans. For additional information, see “Item 3. Key Information — D. Risk Factors — Foreign exchange risks may adversely affect our results and the U.S. dollar value of dividends payable to ADS holders.” and “Item 3. Key Information — D. Risk Factors — Chilean economic fluctuations, certain economic interventionist measures by governmental authorities as well as political events or financial or other crises in any region worldwide may affect our results of operations, financial condition and liquidity as well as the value of our securities.”
The following table sets forth the closing and average Chilean pesos per U.S. dollar exchange rates for the years indicated:
| | Local Currency U.S. Dollar Exchange Rates | |
| | 2018 | | 2017 | | 2016 | |
| | Average | | Year End | | Average | | Year End | | Average | | Year End | |
Chilean pesos per U.S. dollar | | 640.95 | | 694.77 | | 648.51 | | 614.75 | | 676.19 | | 669.47 | |
Source: Central Bank of Chile
d.Critical Accounting Policies
Critical accounting policies are defined as those that reflect significant judgments and uncertainties that would potentially result in materially different results under different assumptions and conditions. We believe that our most critical accounting policies with reference to the preparation of our consolidated financial statements under IFRS are those described below.
For further detail of the accounting policies and the methods used in the preparation of the consolidated financial statements, see Notes 2 and 3 of the Notes to our consolidated financial statements.
Impairment of Long-Lived Assets
From time to time, and principally at the end of any year, we evaluate whether there is any indication that an asset has been impaired. Should any such indication exist, we estimate the recoverable amount of that asset to determine, where appropriate, the amount of impairment. In the case of identifiable assets that do not generate cash flows independently, we estimate the recoverability of the cash generating unit to which the asset belongs, which is understood to be the smallest identifiable group of assets that generates independent cash inflows.
Notwithstanding the preceding paragraph, in the case of cash generating units to which goodwill or intangible assets with an indefinite useful life have been allocated, a recoverability analysis is performed routinely at each period end.
The recoverable amount is the greater of (i) the fair value less the cost needed to sell and (ii) the value in use, which is defined as the present value of the estimated future cash flows. In order to calculate the recoverable value of property, plant and equipment, goodwill and intangible assets that form part of a cash-generating unit, we use “value in use” criteria in nearly all cases.
To estimate the value in use, we prepare future pre-tax cash flow projections based on the most recent budgets available. These budgets incorporate management’s best estimates of cash generating units, revenues and costs using sector projections, past experience and future expectations.
In general, these projections cover the next five years, estimating cash flows for future years and applying reasonable growth rates, which in no case are increasing nor exceed the average long term growth rates for the Chilean electricity sector. At the end of December 2018, projected cash flows were extrapolated using an annual growth rate of 3.1%.
These future cash flows are discounted at a given pre-tax rate to calculate their present value. This rate reflects the cost of capital of the business in Chile. The discount rate is calculated taking into account the current time value of money and the risk premiums generally used by market participants for the specific business activity.
The pre-tax nominal discount rates applied in 2018, 2017 and 2016 are as follows:
Year ended December 31, | |
2018 | | 2017 | | 2016 | |
Minimum | | Maximum | | Minimum | | Maximum | | Minimum | | Maximum | |
6.9 | % | 11.0 | % | 7.5 | % | 10.7 | % | 8.1 | % | 12.2 | % |
If the recoverable amount is less than the net carrying amount of the cash generating unit, the corresponding impairment loss provision is recognized for the difference, and charged to “Reversal of impairment loss (impairment loss) recognized in profit or loss” in the consolidated statement of comprehensive income.
Impairment losses recognized for an asset other than goodwill in prior periods are reversed when its estimated recoverable amount changes, increasing the asset’s value with a credit to earnings, limited to the asset’s carrying amount if no adjustment had occurred. Impairment adjustments to goodwill are not reversible.
Litigation and Contingencies
We are currently involved in legal and tax proceedings. As discussed in Note 25 of the Notes to our consolidated financial statements as of December 31, 2018, we recognized provisions for legal and tax proceedings in an aggregate amount of Ch$ 17.4 billion as of December 31, 2018. This amount was based on consultations with our legal and tax advisors, who are carrying out our defense in these matters and an analysis of potential results, assuming a combination of litigation and settlement strategies.
Hedge Cash Revenues Directly Linked to the U.S. Dollar
We have established a policy to hedge the portion of our revenues directly linked to the U.S. dollar by obtaining financing in U.S. dollars. Exchange differences related to this debt, as they are cash flow hedge transactions, are charged net of taxes to an equity reserve account that forms part of “Other Comprehensive Income” and recorded as income during the period in which the hedged cash flows are realized. This term has been estimated at ten years.
This policy reflects a detailed analysis of our future revenues directly linked to the U.S. dollar, with the purpose of confirming that hedge accounting is applicable. Such analysis may change in the future due to new electricity regulations limiting the amount of cash flows tied to the U.S. dollar.
Pension and Post-Employment Benefit Liabilities
We have various defined benefit plans for our employees. These plans pay benefits to employees at retirement and use formulas based on years of service and employee compensations. We also offer certain additional benefits for some specific retired employees.
The liabilities shown for the pensions and post-employment benefits reflect our best estimate of the future cost of meeting our obligations under these plans. The accounting applied to these defined benefit plans involves actuarial calculations which contain key assumptions that include employee turnover, life expectancy, retirement age, discount rates, the future level of employee compensations and benefits, the claims rate under medical plans and future medical costs. These assumptions change as economic and market conditions vary and any change in any of these assumptions could have a material effect on the reported results from operations.
The effect of an increase of 100 basis points in the discount rate used to determine the present value of the post-employment defined benefits would decrease the liability by Ch$ 4.3 billion as of December 31, 2018 and 2017, and the effect of a decrease of 100 basis points in the rate used to determine the present value of the post-employment defined benefits would increase the liability by Ch$ 4.8 billion as of December 31, 2018 and 2017.
Recent Accounting Pronouncements
Please see Note 2.2 of the Notes to our consolidated financial statements for additional information regarding recent accounting pronouncements.
2.Analysis of Results of Operations for the Years Ended December 31, 2018 and 2017
Consolidated Revenues and other operating income
The following table sets forth our revenues and other operating income by reportable segment for the years ended December 31, 2018 and 2017:
| | Years ended December 31, | |
| | 2018 | | 2017 | | Change | | Change | |
| | (in millions of Ch$) | | (in %) | |
Generation Business | | | | | | | | | |
Enel Generation, EGP Chile and subsidiaries | | 1,580,653 | | 1,634,937 | | (54,284 | ) | (3.3 | ) |
Distribution Business | | | | | | | | | |
Enel Distribution and subsidiaries | | 1,263,224 | | 1,326,659 | | (63,435 | ) | (4.8 | ) |
Non-electricity business and consolidation adjustments | | (386,716 | ) | (438,618 | ) | 51,902 | | (11.8 | ) |
Total Revenues and other operating income | | 2,457,161 | | 2,522,978 | | (65,817 | ) | (2.6 | ) |
Generation Business: Revenues and other operating income
Revenues and other operating income from our generation business (which include EGP Chile sales of Ch$ 49.7 billion for the nine-month period ended December 31, 2018) decreased in 2018 compared to 2017, primarily explained by:
(i) Ch$ 31.7 billion lower revenues from energy sales, which was primarily attributable to
a. Ch$ 29.1 billion of lower capacity payments;
b. Ch$ 21.9 billion of lower revenues as a result of settlements performed by the CEN associated with price and quantity adjustments registered in 2017; and
c. Ch$ 11 billion associated with the lower average energy sales price in Chilean pesos due to the lower average exchange rate of the period, partially offset by higher physical sales of Ch$ 32.9 billion as a result of an 8% decrease in sales to regulated clients; and
(ii) Ch$ 35.4 billion of lower toll revenues;
all of which was partially offset by Ch$ 9.3 billion of higher commodity sales, mainly Ch$ 12.1 billion of higher gas sales offset by Ch$ 2.8 billion of lower coal sales.
Distribution Business: Revenues and other operating income
Revenues and other operating income from our distribution business decreased in 2018 compared to 2017, primarily due to:
(i) a Ch$ 60.9 billion reduction in other services revenues, namely lower revenues from transmission tolls as a result of the new zonal transmission decree, and
(ii) Ch$ 10.3 billion of lower energy sales revenues mainly as a consequence of a Ch$ 33.7 billion decrease due to lower average sales prices resulting from the transfer of lower purchase prices, which was offset by higher physical sales of 345 GWh equivalent to Ch$ 23.4 billion. These lower revenues were compensated by Ch$ 4 billion of higher products and services sales.
The number of customers rose by 42,590 in 2018 compared to 2017, totaling 1,924,984, mainly new residential customers.
Consolidated Operating Costs
Our operating costs are primarily energy purchases from third parties, fuel purchases, tolls paid to transmission companies, depreciation, amortization and impairment losses, maintenance costs, employee salaries and administrative and selling expenses.
The following two tables set forth the consolidated operating costs (excluding selling and administrative expenses) for the years ended December 31, 2018, and 2017, by category and by business segment.
| | Years ended December 31, | |
| | 2018 | | 2017 | | Change | | Change | |
| | (in millions of Ch$) | | (in %) | |
Energy purchases | | 747,647 | | 902,435 | | (154,788 | ) | (17.2 | ) |
Fuel consumption | | 231,028 | | 280,739 | | (49,711 | ) | (17.7 | ) |
Other variable procurement and services | | 146,627 | | 175,733 | | (29,107 | ) | (16.6 | ) |
Transmission costs | | 166,876 | | 155,879 | | 10,997 | | 7.1 | |
Total Consolidated Operating Costs | | 1,292,177 | | 1,514,787 | | (222,610 | ) | (14.7 | ) |
| | Years ended December 31, | |
| | 2018 | | 2017 | | Change | | Change | |
| | (in millions of Ch$) | | (in %) | |
Generation Business | | | | | | | | | |
Enel Generation, EGP Chile and subsidiaries | | 709,506 | | 903,978 | | (194,472 | ) | (21.5 | ) |
Distribution Business | | | | | | | | | |
Enel Distribution and subsidiaries | | 972,500 | | 1,055,708 | | (83,208 | ) | (7.9 | ) |
Non-electricity business and consolidation adjustments | | (389,829 | ) | (444,899 | ) | 55,070 | | (12.4 | ) |
Total Consolidated Operating Costs (excluding Selling and Administrative Expenses) | | 1,292,177 | | 1,514,787 | | (222,610 | ) | (14.7 | ) |
Generation Business: Operating Costs
Operating costs of our generation business decreased in 2018 compared to 2017, mainly due to:
· a Ch$ 133.8 billion reduction in the value of energy purchases primarily explained by lower physical energy purchases of 1,960 GWh, mainly 2,733 GWh of lower contracted energy purchases that were partially compensated by 773 GWh higher spot market purchases. This positive variation includes the consolidation effect of adding EGP Chile in 2018, which led to a net reduction of Ch$ 115.3 billion in our consolidated energy purchase costs as a consequence of the elimination of related party transactions (sales of EGP Chile to Enel Generation Chile);
· a Ch$ 49.7 billion decrease in fuel costs, primarily due to Ch$ 30.5 billion of lower gas consumption, Ch$ 9.2 billion of lower coal consumption, and Ch$ 9.9 billion of lower fuel oil costs, primarily responding to the lower level of thermal dispatch; and
· a Ch$ 12.1 billion decrease in other variable procurement and services costs, which in turn was mostly attributable to (i) Ch$ 8.3 billion of lower costs related to the lease agreement with Eléctrica Santiago S.A., an unrelated company, to use its Nueva Renca combined-cycle power plant, allowing us to use our available LNG; (ii) Ch$ 3.7 billion of lower thermal emissions taxes; (iii) Ch$ 1.7 billion of lower commodity derivative costs; and (iv) Ch$ 1.1 billion of lower water consumption costs. These cost decreases were partly offset by Ch$ 4.8 billion of higher costs in the gas commercialization business.
Distribution Business: Operating Costs
Operating costs of our distribution business decreased in 2018 compared to 2017, mainly due to (i) Ch$ 53.2 billion of lower transportation costs as a consequence of the new zonal transmisional decree; (ii) Ch$ 11.7 billion of lower energy purchases mainly attributable to a Ch$ 30.3 billion decrease due to lower average energy purchase prices, as a result of changes in node prices and lower surcharges homogenizing tariffs nationwide, offset by Ch$ 18.6 billion in higher physical purchases required to satisfy demand; and (iii) Ch$ 18.3 billion in lower variable procurement and services costs, primarily for fines and compensations derived from extraordinary weather events that occurred in 2017, an insurance recovery in 2018, and other businesses such as meter rentals and street lighting services.
Consolidated Selling and Administrative Expenses
Our selling and administrative expenses are salaries, compensation, administrative expenses, depreciation, amortization and impairment losses, and office materials and supplies, as set forth in the following two tables:
| | Years ended December 31, | |
| | 2018 | | 2017 | | Change | | Change | |
| | (in millions of Ch$) | | (in%) | |
Depreciation, amortization and impairment losses | | 220,750 | | 160,621 | | 60,129 | | 37.4 | |
Other fixed costs | | 167,210 | | 161,824 | | 5,386 | | 3.3 | |
Employee benefit expense and others | | 106,419 | | 107,115 | | (695 | ) | (0.6 | ) |
Total Consolidated Selling and Administrative Expenses | | 494,380 | | 429,560 | | 64,820 | | 15.1 | |
| | Years ended December 31, | |
| | 2018 | | 2017 | | Change | | Change | |
| | (in millions of Ch$) | | (in%) | |
Generation Business | | | | | | | | | |
Enel Generation, EGP Chile and subsidiaries | | 337,527 | | 267,099 | | 70,428 | | 26.4 | |
Distribution Business | | | | | | | | | |
Enel Distribution and subsidiaries | | 131,465 | | 138,441 | | (6,976 | ) | (5.0 | ) |
Non-electricity business and consolidation adjustments | | 25,388 | | 24,020 | | 1,368 | | 5.7. | |
Total Consolidated Selling and Administrative Expenses | | 494,380 | | 429,560 | | 64,820 | | 15.1 | |
Consolidated selling and administrative expenses from continuing operations increased in 2018 compared to 2017, mainly due to an increase in the generation business. The increase in the generation business is mainly explained by the inclusion of the depreciation of EGP Chile that amounted to Ch$ 62.1 billion.
Selling and administrative expenses in our distribution business decreased in 2018 compared to 2017, primarily due to Ch$ 5.9 billion in payroll expenses associated with extraordinary employee bonuses given to employees during 2017.
Consolidated Operating Income
The following table sets forth our operating income by reportable segment for the years ended December 31, 2018 and 2017:
| | Years ended December 31, | |
| | 2018 | | 2017 | | Change | | Change | |
| | (in millions of Ch$) | | (in%) | |
Generation Business | | | | | | | | | |
Enel Generation, EGP Chile and subsidiaries | | 533,620 | | 463,860 | | 69,760 | | 15.0 | |
Distribution Business | | | | | | | | | |
Enel Distribution and subsidiaries | | 159,259 | | 132,510 | | 26,749 | | 20.2 | |
Non-electricity business and consolidation adjustments | | (22,275 | ) | (17,740 | ) | (4,535 | ) | 25.6 | |
Total Consolidated Operating Income | | 670,605 | | 578,631 | | 91,974 | | 15.9 | |
Operating margin (1) | | 27.3 | % | 22.9 | % | — | | — | |
(1) Operating margin, a measure of efficiency, represents income as a percentage of revenues.
Our operating income in 2018 increased compared to 2017 due to the combination of the following:
· Hydrological conditions in Chile have been below the historical average since 2010. However, in 2018 hydrological conditions were more humid than in 2017. This allowed us to produce more electricity through hydroelectric generation rather than through thermal generation, which is more expensive. In addition, the commissioning of new NCRE plants reduced the impact of dry conditions and the interconnection between the SIC and SING also helps to reduce or stabilize marginal costs. Therefore, the marginal cost of electricity generation decreased in 2018 when compared to 2017 notwithstanding higher prices for our fuels. As a result, we were able to cover our energy deficit in the spot market at lower prices. While our physical sales increased when compared to 2017, they were at lower average sales prices, and our customer mix changed because during 2018 a portion of our regulated customers chose the unregulated tariff regime instead, all of which led to a decrease of our consolidated revenues. However, due to the incorporation of EGP Chile, our operating costs (mainly energy purchases) considerably decreased in 2018, which compensated the lower revenues and the increase in our selling and administrative expenses, also due to the inclusion of EGP Chile.
· In the distribution business, although our revenues decreased in 2018 when compared to 2017, our operating costs also significantly decreased when compared to 2017, due primarily to the weather emergencies we faced in 2017, and to a lesser degree, lower selling and administrative expenses. As a result, our distribution business operating income increased in 2018.
Consolidated Financial and Other Results
The following table sets forth our financial and other results for the years ended December 31, 2018 and 2017:
| | Years ended December 31, | |
| | 2018 | | 2017 | | Change | | Change | |
| | (in millions of Ch$) | | (in%) | |
Financial results | | | | | | | | | |
Financial income | | 19,934 | | 21,663 | | (1,729 | ) | (8.0 | ) |
Financial costs | | (122,184 | ) | (53,511 | ) | (68,673 | ) | 128.3 | |
Gain from indexed assets and liabilities | | (818 | ) | 916 | | (1,734 | ) | (189.3 | ) |
Foreign currency exchange differences | | (7,807 | ) | 8,517 | | (16,324 | ) | (191.7 | ) |
Total financial results | | (110,875 | ) | (22,415 | ) | (88,460 | ) | 394.7 | |
Other Results | | | | | | | | | |
Share of the profit (loss) of associates and joint ventures accounted for using the equity method | | 3,190 | | (2,697 | ) | 5,887 | | (218.3 | ) |
Gain from sales of assets | | 3,411 | | 113,241 | | (109,830 | ) | (97.0 | ) |
Total Other results | | 6,601 | | 110,544 | | (103,943 | ) | (94.0 | ) |
Total Consolidated Financial and Other Results | | (104,274 | ) | 88,129 | | (192,403 | ) | (218.3 | ) |
Financial Results
We recorded a higher net financial expense for the year ended December 31, 2018 compared to 2017. This is primarily attributable to (i) higher financial costs mainly due to higher interest on bank loans and bonds amounting to Ch$ 37 billion mainly related to our new debt to finance the 2018 Reorganization, plus higher interest expense related to the consolidation of EGP Chile amounting to Ch$ 31.7 billion; and (ii) higher losses from foreign currency exchange differences, mainly as a result of greater negative exchange differences on forward contracts of Ch$ 5.4 billion, on supplier accounts of Ch$ 4.2 billion and on cash and cash equivalents of Ch$ 3.3 billion; and (iii) Ch$ 1.7 billion in lower financial income due to Ch$ 2.4 billion of lower income related to customer refinancing offset by Ch$ 0,7 billion of greater income from short-term fixed income investments.
Other Results
Our gain from disposition of assets decreased in 2018 compared to 2017, primarily explained by the sale of Electrogas in February 2017 for Ch$ 105.3 billion.
We also registered a higher share of the profit (loss) of associates and joint ventures accounted for using the equity method in 2018 when compared to 2017, mainly explained by better results from HidroAysén amounting to Ch$ 5.9 billion until its liquidation.
Consolidated Income Tax Expenses
Consolidated income tax expenses totaled Ch$ 153.5 billion in 2018, an increase of Ch$ 10.1 billion, or 7.1%, when compared to 2017.
The increase in consolidated income tax expenses was primarily due to an increase of the statutory tax rate from 25.5% in 2017 to 27% in 2018 leading to Ch$ 8.5 billion in higher taxes. As a result, the effective tax rate increased to 27.1% in 2018 compared to 21.5% in 2017. For further details, please refer to Note 20 of the Notes to our consolidated financial statements.
Consolidated Net Income
The following table sets forth our consolidated net income before taxes, income tax expenses and net income for the years ended December 31, 2018 and 2017:
| | Years ended December 31, | |
| | 2018 | | 2017 | | Change | | Change | |
| | (in millions of Ch$) | | (in%) | |
Operating income | | 670,605 | | 578,631 | | 91,974 | | 15.9 | |
Other results | | (104,274 | ) | 88,129 | | (192,403 | ) | (218.3 | ) |
Net income before taxes | | 566,330 | | 666,760 | | (100,430 | ) | (15.1 | ) |
Income tax expenses | | (153,482 | ) | (143,342 | ) | (10,140 | ) | 7.1 | |
Consolidated Net income | | 412,848 | | 523,418 | | (110,570 | ) | (21.1 | ) |
Net income attributable to the Parent Company | | 361,710 | | 349,383 | | 12,327 | | 3.5 | |
Net income attributable to non-controlling interests | | 51,138 | | 174,035 | | (122,897 | ) | (70.6 | ) |
The decrease in net income attributable to non-controlling interests in 2018 compared to 2017 is primarily due to the Ch$ 124.6 billion decrease of net income attributable to the non-controlling interests of Enel Generation for 2018, which in turn is mainly due to the decrease of percentage of minority shareholders of Enel Generation as a result of our increase controlling and economic interest in Enel Generation after the completion of the 2018 Reorganization.
3. Analysis of Results of Operations for the Years Ended December 31, 2017 and 2016
Consolidated Revenues and other operating income
The following table sets forth our revenues and other operating income by reportable segment for the years ended December 31, 2017 and 2016:
| | Years ended December 31, | |
| | 2017 | | 2016 | | Change | | Change | |
| | (in millions of Ch$) | | (in%) | |
Generation Business | | | | | | | | | |
Enel Generation and subsidiaries | | 1,634,937 | | 1,659,727 | | (24,790 | ) | (1.5 | ) |
Distribution Business | | | | | | | | | |
Enel Distribution and subsidiaries | | 1,326,659 | | 1,315,761 | | 10,898 | | 0.8 | |
Non-electricity business and consolidation adjustments | | (438,618 | ) | (433,921 | ) | (4,696 | ) | 1.1 | |
Total Revenues and other operating income | | 2,522,978 | | 2,541,567 | | (18,589 | ) | (0.7 | ) |
Generation Business: Revenues and other operating income
Revenues and other operating income from our generation business decreased in 2017 compared to 2016. The decrease was mainly due to Ch$59.0 billion lower revenues from energy sales, which was primarily attributable to (i) Ch$41.2 billion associated with the lower energy average sales price, (ii) lower physical sales of Ch$ 39.6 billion as a result of an 8% decrease in sales to regulated clients, and (iii) partially offset by Ch$ 21.9 billion of higher revenues as a result of settlements performed by the CEN associated with price and quantity adjustments. The decrease was partially offset by Ch$28.4 billion of higher natural gas sales.
Distribution Business: Revenues and other operating income
Revenues and other operating income from our distribution business increased in 2017 compared to 2016, primarily due to an increase in customer consumption of Ch$ 17.3 billion, mainly attributable to (i) greater sales of Ch$ 9.8 billion to residential customers, (ii) higher unregulated customer sales of Ch$ 4.3 billion, and (iii) greater revenues from non-electricity sales of Ch$ 3.8 billion, mainly sales of products and connections to telecommunications companies.
The number of customers rose by 56,875 in 2017 compared to 2016, totaling 1,882,394, mainly new residential customers.
Consolidated Operating Costs
Total operating costs consist primarily of energy purchases from third parties, fuel purchases, tolls paid to transmission companies, depreciation, amortization and impairment losses, maintenance costs, employee salaries and administrative and selling expenses.
The following table sets forth the principal items for our consolidated operating costs by category for the years ended December 31, 2017, and 2016:
| | Years ended December 31, | |
| | 2017 | | 2016 | | Change | | Change | |
| | (in millions of Ch$) | | (in%) | |
| | | | | | | | | |
Energy purchases | | 902,435 | | 891,747 | | 10,688 | | 1.2 | |
Fuel consumption | | 280,739 | | 295,149 | | (14,409 | ) | (4.9 | ) |
Transmission costs | | 155,879 | | 195,123 | | (39,244 | ) | (20.1 | ) |
Other variable procurement and services | | 175,733 | | 115,401 | | 60,333 | | 52.3 | |
Total Consolidated Operating Costs | | 1,514,787 | | 1,497,420 | | 17,368 | | 1.2 | |
The following table sets forth our consolidated operating costs (excluding selling and administrative expenses) by reportable segment for the years ended December 31, 2017 and 2016:
| | Years ended December 31, | |
| | 2017 | | 2016 | | Change | | Change | |
| | (in millions of Ch$) | | (in%) | |
Generation Business | | | | | | | | | |
Enel Generation and subsidiaries | | 903,978 | | 895,060 | | 8,918 | | 1.0 | |
Distribution Business | | | | | | | | | |
Enel Distribution and subsidiaries | | 1,055,708 | | 1,042,329 | | 13,378 | | 1.3 | |
Non-electricity business and consolidation adjustments | | (444,899 | ) | (439,970 | ) | (4,929 | ) | 1.1 | |
Total Consolidated Operating Costs (excluding Selling and Administrative Expenses) | | 1,514,787 | | 1,497,420 | | 17,367 | | 1.2 | |
Generation Business: Operating Costs
Operating costs of our generation business increased in 2017 compared to 2016, mainly due to Ch$ 51.7 billion higher other variable procurement and services costs, which in turn was mostly attributable to (i) Ch$ 29.5 billion higher costs in the gas commercialization business, (ii) Ch$17.3 billion higher thermal emissions taxes and (iii) Ch$ 7.6 billion higher commodity derivative costs and increased purchases of Ch$ 11.2 billion due to higher physical purchases to comply with our contractual sales obligations. Such increases were partially offset by Ch$ 39.6 billion lower transportation costs due to lower tolls and Ch$ 14.4 billion lower fuel consumption costs mainly due to better hydrology in southern Chile during the fourth quarter of 2017, which allowed us to reduce our thermal generation during such quarter.
Distribution Business: Operating Costs
Operating costs of our distribution business increased in 2017 compared to 2016, mainly due to (i) Ch$ 16.1 billion higher other variable procurement and service costs attributable to greater outages, reinstatement and emergency plan costs related to extraordinary climatic events in June and July 2017 amounting to Ch$ 15.5 billion (including provisions for fines amounting to Ch$ 8.4 billion, legal damage compensation payments for Ch$ 3.6 billion, the payment of voluntary compensations for Ch$ 3.4 billion), and (ii) increased transportation expenses for Ch$ 2.6 billion.
Consolidated Selling and Administrative Expenses
Selling and administrative expenses relate to salaries, compensation, administrative expenses, depreciation, amortization and impairment losses, and office materials and supplies.
The following table sets forth our consolidated selling and administrative expenses in Chilean pesos and as a percentage of total consolidated selling and administrative expenses for the years ended December 31, 2017 and 2016:
| | Years ended December 31, | |
| | 2017 | | 2016 | | Change | | Change | |
| | (in millions of Ch$) | | (in%) | |
| | | | | | | | | |
Depreciation, amortization and impairment losses | | 160,621 | | 197,587 | | (36,966 | ) | (18.7 | ) |
Other fixed costs | | 161,824 | | 170,769 | | (8,945 | ) | (5.2 | ) |
Employee benefit expense and others | | 107,115 | | 108,002 | | (887 | ) | (0.8 | ) |
Total Consolidated Selling and Administrative Expenses | | 429,560 | | 476,358 | | (46,798 | ) | (9.8 | ) |
The following table sets forth our consolidated selling and administrative expenses by reportable segment for the years ended December 31, 2017 and 2016:
| | Years ended December 31, | |
| | 2017 | | 2016 | | Change | | Change | |
| | (in millions of Ch$) | | (in%) | |
Generation Business | | | | | | | | | |
Enel Generation and subsidiaries | | 267,099 | | 333,281 | | (66,182 | ) | (19.9 | ) |
Distribution Business | | | | | | | | | |
Enel Distribution and subsidiaries | | 138,441 | | 116,837 | | 21,603 | | 18.5 | |
Non-electricity business and consolidation adjustments | | 24,020 | | 26,240 | | (2,220 | ) | (8.5 | ) |
Total Consolidated Selling and Administrative Expenses | | 429,560 | | 476,358 | | (46,798 | ) | (9.8 | ) |
Consolidated selling and administrative expenses decreased in 2017 compared to 2016, mainly due to a reduction in the generation business. The reduction in the generation business is primarily due to (i) lower impairment losses of property, plant and equipment of Ch$ 30.8 billion due to the non-recurring impairment charges of Ch$ 24.2 billion booked in 2016 related to NCRE projects and the Neltume and Choshuenco projects (see “— 2. Analysis of Result of operations for the year ended December 31, 2016 and 2015 — Consolidated Selling and Administrative Expenses”); (ii) lower other fixed costs of Ch$ 16.5 billion primarily attributable to the non-recurring impairment charges of Ch$ 35.4 billion related to the waiver of water rights of the Bardón, Chillán 1 and 2, Futaleufú, Huechún and Puelo hydroelectric projects recorded in 2016 compared with the Ch$ 25.1 billion loss recognized in 2017 in connection with Enel Generation’s decision to abandon the Neltume and Choshuenco projects for being economically unfeasible to reduce the net book value of the associated assets to zero; and (iii) lower depreciation and amortization of Ch$ 15.3 billon primarily due to the modification of the remaining useful life of fixed assets applied to Property, Plant, and Equipment in 2017.
Selling and administrative expenses in our distribution business increased in 2017 compared to 2016, primarily due to (i) Ch$ 9.8 billion higher other fixed costs, mainly attributable to an increase in emergency attention, line maintenance and a tree trimming plan of Ch$ 8.6 billion, (ii) Ch$ 9.1 billion higher depreciation and amortization and impairment losses due to an increase in depreciation related to construction works that became operational and (iii) a Ch$ 2.6 billion increase in employee expenses due to extraordinary non-recurrent employee bonuses related to the new collective bargaining process carried out with Enel Distribution’s unions in 2016.
Consolidated Operating Income
The following table sets forth our operating income by reportable segment for the years ended December 31, 2017 and 2016:
| | Years ended December 31, | |
| | 2017 | | 2016 | | Change | | Change | |
| | (in millions of Ch$) | | (in%) | |
Generation Business | | | | | | | | | |
Enel Generation and subsidiaries | | 463,860 | | 431,386 | | 32,474 | | 7.5 | |
Distribution Business | | | | | | | | | |
Enel Distribution and subsidiaries | | 132,510 | | 156,594 | | (24,084 | ) | (15.4 | ) |
Non-electricity business and consolidation adjustments | | (17,740 | ) | (20,191 | ) | 2,452 | | (12.1 | ) |
Total Consolidated Operating Income | | 578,631 | | 567,789 | | 10,841 | | 1.9 | |
Operating margin(1) | | 22.9 | % | 22.3 | % | — | | — | |
(1) Operating margin, a measure of efficiency, represents operating income as a percentage of revenues.
Our operating income in 2017 increased slightly compared to 2016 primarily due to the combination of:
· Hydrological conditions in Chile have been below the historical average since 2010. However, in 2017, hydrological conditions were slightly more humid than in 2016, mainly during the fourth quarter of 2017. This allowed us to produce more electricity through hydroelectric generation rather than thermal generation, which is more expensive. In addition, the commissioning of new NCRE plants reduced the impact of dry conditions. Therefore, the marginal cost of electricity generation decreased in 2017 when compared to 2016. As a result, we were able to cover our energy deficit in the spot market at lower prices. Our physical sales decreased when compared to 2016 and our customer mix changed because a portion of our regulated customers chose the unregulated tariff regime instead. Our selling and administrative expenses decreased considerably in 2017, mainly due to the impairments and write-offs we booked in 2016.
· In the distribution business, although our physical sales and unregulated sales related to infrastructure projects and public lighting increased in 2017 when compared to 2016, in June and July 2017 we faced rain storms and the most damaging snow storm in Santiago since 1970, leaving parts of the capital without power for over one week. These situations significantly increased our costs due to emergency responses including payments related to damage compensation, fines, lines maintenance and tree trimming plans.
Consolidated Financial and Other Results
The following table sets forth our financial and other results for the years ended December 31, 2017 and 2016:
| | Years ended December 31, | |
| | 2017 | | 2016 | | Change | | Change | |
| | (in millions of Ch$) | | (in%) | |
Financial results | | | | | | | | | |
Financial income | | 21,663 | | 23,106 | | (1,443 | ) | (6.2 | ) |
Financial costs | | (53,511 | ) | (58,199 | ) | 4,689 | | (8.1 | ) |
Profit for indexed assets and liabilities | | 916 | | 1,632 | | (716 | ) | (43.9 | ) |
Foreign currency exchange differences | | 8,517 | | 12,978 | | (4,462 | ) | (34.4 | ) |
Total | | (22,416 | ) | (20,483 | ) | (1,932 | ) | 9.4 | |
Other Results | | | | | | | | | |
Share of the profit (loss) of associates and joint ventures accounted for using the equity method | | (2,697 | ) | 7,878 | | (10,575 | ) | n.a. | |
Gain from sales of assets | | 113,241 | | 121,490 | | (8,249 | ) | (6.8 | ) |
Total | | 110,544 | | 129,368 | | (18,824 | ) | (14.6 | ) |
Total Consolidated Financial and Other Results | | 88,129 | | 108,885 | | (20,756 | ) | (19.1 | ) |
Financial Results
We recorded a higher net financial expense for the year ended December 31, 2017 compared to 2016. This is primarily attributable to lower gains from foreign currency exchange differences, mainly as a result of the lower Chilean peso value of the U.S.
dollar intercompany debt owed by Enel Generation to Enel Américas for Ch$ 10.1 billion that was offset by greater income on cash and cash equivalents in U.S. dollars for Ch$ 5.7 billion. These lower gains were offset by Ch$ 4.7 billion in lower financial costs, mainly due to lower interest expenses on bank loans and public bonds for Ch$ 4.7 billion. The reduction of our financial result was also the consequence of Ch$ 1.4 billion lower financial income due to a settlement agreement we entered into with YPF in 2016 for Ch$ 2.0 billion and lower customer refinancing income for Ch$ 1.9 billion in 2017, offset by higher income from temporary investments in fixed income securities for Ch$ 2.6 billion.
Other Results
Our share of the profit (loss) of associates and joint ventures accounted for using the equity method for the year ended December 31, 2017, decreased compared to 2016, primarily due to the sale of our former associate Electrogas in February 2017 and GNL Quintero in September 2016, accounting for a Ch$ 5.2 billion and Ch$ 2.8 billion decrease in equity investment profits, respectively. In addition, the loss registered in connection with HidroAysén increased by Ch$ 2.0 billion. For additional information on the termination and liquidation of HidroAysén, see “Item 4. Information on the Company — C. Organizational Strucuture — Selected Related and Jointly-Controlled Companies — HidroAysén.”
We also registered a lower gain from the sales of assets in 2017 when compared to 2016. In 2017 we recorded a Ch$ 105.3 billion gain from the sale of Electrogas and the sale of a land owned by GasAtacama for Ch$ 7.6 billion, while in 2016 we recognized a Ch$ 121.3 billion gain in 2016 from the sale of GNL Quintero.
Consolidated Income Tax Expenses
Consolidated income tax expenses totaled Ch$ 143.3 billion in 2017, an increase of Ch$ 31.9 billion, or 28.7%, when compared to 2016.
The increase in consolidated income tax expenses was primarily due to (i) a Ch$ 13.5 billion higher expense due to the reversal of the deferred income tax related to the dissolution of Central Canela S.A., (ii) Ch$ 13.1 billion greater income tax expenses related to lower exchange rate and price-level restatement losses (which increases the taxable income) and (iii) Ch$ 8.0 billion related to the increase of the statutory tax rate, from 24.0% to 25.5%. The increase in consolidated income tax expenses resulted in the increase of the effective income tax rate.
The effective tax rate was 21.5% in 2017 compared to 16.5% in 2016. For further details, please refer to Note 17 of the Notes to our consolidated financial statements.
Consolidated Net Income
The following table sets forth our consolidated net income before taxes, income tax expenses and net income for the years ended December 31, 2017 and 2016:
| | Years ended December 31, | |
| | 2017 | | 2016 | | Change | | Change | |
| | (in millions of Ch$) | | (in%) | |
Consolidated Operating income | | 578,631 | | 567,789 | | 10,841 | | 1.9 | |
Consolidated Other results | | 88,129 | | 108,885 | | (20,756 | ) | (19.1 | ) |
Consolidated Net income before taxes | | 666,759 | | 676,674 | | (9,915 | ) | (1.5 | ) |
Income tax expenses | | (143,342 | ) | (111,403 | ) | (31,939 | ) | 28.7 | |
Consolidated Net income | | 523,417 | | 565,271 | | (41,854 | ) | (7.4 | ) |
Net income attributable to the Parent Company | | 349,383 | | 384,160 | | (34,777 | ) | (9.1 | ) |
Net income attributable to non-controlling interests | | 174,035 | | 181,111 | | (7,076 | ) | (3.9 | ) |
The decrease in net income attributable to non-controlling interests in 2017 compared to 2016 is primarily due to the Ch$ 5.8 billion decrease of net income attributable to the non-controlling interests of Enel Generation for 2017, which in turn is mainly due to the decrease of the net income of Enel Generation by Ch$ 95.9 billion. The controlling and economic interest in Enel Generation was the same in both years.
B.Liquidity and Capital Resources.
Our main assets are our consolidated Chilean subsidiaries, Enel Generation, EGP Chile and Enel Distribution. The following discussion of cash sources and uses reflects the key drivers of our cash flow.
We receive cash inflows from our subsidiaries and related companies. Our subsidiaries’ and associates’ cash flows may not always be available to satisfy our own liquidity needs because there may be a time lag before we have effective access to those funds through dividends or capital reductions. However, we believe that cash flow generated from our business operations, as well as cash balances, borrowings from commercial banks, short- and long-term intercompany loans and ample access to the capital markets will be sufficient to satisfy all our needs for working capital, expected debt service, dividends and planned capital expenditures in the foreseeable future.
Set forth below is a summary of our consolidated cash flow information for the years ended December 31, 2018, 2017 and 2016:
| | Year ended December 31, | |
| | 2018 | | 2017 | | 2016 | |
| | (in billions of Ch$) | |
Net cash flows provided by operating activities | | 736 | | 636 | | 615 | |
Net cash flows used in investing activities | | (1,882 | ) | (146 | ) | (63 | ) |
Net cash flows provided by (used in) financing activities | | 967 | | (318 | ) | (446 | ) |
Net increase (decrease) in cash and cash equivalents before effect of exchange rates changes | | (179 | ) | 172 | | 105 | |
Effect of exchange rate changes on cash and cash equivalents | | 5 | | 2 | | (4 | ) |
Cash and cash equivalents at beginning of period | | 419 | | 246 | | 144 | |
Cash and cash equivalents at end of period | | 245 | | 419 | | 246 | |
For the year ended December 31, 2018, net cash flow provided by operating activities increased 15.7% compared to the same period in 2017. The increase was in part the result of lower payments as detailed below:
(i) a decrease of Ch$ 147 billion in payments to suppliers of goods and services mainly due to:
a. the positive effect of adding EGP Chile into our consolidated perimeter, which led to a net reduction of Ch$ 107 billion in our cost of energy purchases as a consequence of the elimination of related party transactions (sales of EGP Chile to Enel Generation and Enel Distribution);
b. a decrease of Ch$ 37 billion in fuel costs to Enel Generation;
(ii) a decrease of Ch$ 49 billion in income tax payments during 2018 primarily due to Ch$45 billion in tax refunds for recognition of tax losses in Celta and higher monthly payments made by GasAtacama in 2017; and
(iii) a decrease of Ch$ 9 billion in payments to and on behalf of employees from operating activities, mainly in Enel Distribution, which registered higher payments in 2017 associated with retirement plans and union agreements.
This was partially offset by a decrease of Ch$ 109 million in collections from the sale of goods and services, comprised mainly of:
(i) a decrease of Ch$ 95 billion in collections from Enel Generation, on a stand-alone basis and excluding intercompany transactions, due to a lower average sales price and lower sales to regulated customers;
(ii) a decrease of Ch$ 41 billion in collections from GasAtacama, excluding intercompany transactions, due to lower physical sales mainly in the spot market;
(iii) a decrease of Ch$ 39 billion in collections from Enel Distribution, excluding intercompany transactions, due to a reduction in billings from transmission tolls partially offset by; and
(iv) an increase of Ch$ 57 billion in collections from EGP Chile, excluding intercompany transactions as a result of its acquisition and consolidation for the nine-month period ended December 31, 2018.
For further information regarding our operating results in 2018 and 2017, please see “— A. Operating Results. — 2. Analysis of Results of Operations for the Years Ended December 31, 2018 and 2017.”
For the year ended December 31, 2017, net cash flow provided by operating activities increased 3.4% compared to the same period in 2016. The increase was in part the result of:
(i) a decrease of Ch$ 102 billion in other payments for operating activities mainly attributable to an increase of Ch$ 132 billion in additional tax payments in 2016, generated in accordance with Peruvian tax law as a result of the spin-offs of the non-Chilean electricity businesses in 2016, paid in March 2016 by Enel Generation (Ch$ 116 billion) and Enel Distribution (Ch$ 16 billion), and partially offset by an increase of Ch$ 29 billion in VAT in 2017;
(ii) a decrease of Ch$ 51 billion in payments to suppliers of goods and services, comprised mainly of Ch$ 41 billion from Enel Distribution, mostly as a consequence of lower energy purchases from third parties; and
(iii) an increase of Ch$ 11 billion in other collections from operating activities, comprised mainly of tax refunds in the context of the 2016 Reorganization from Peru to Enel Generation corresponding to excess tax paid in 2016.
This was partially offset by a decrease of Ch$ 88 million in collections from the sale of goods and services, comprised mainly of:
(i) a decrease of Ch$ 62 billion in collections from Enel Distribution, excluding intercompany transactions, due to lower energy billing during 2017 compared to the same period in 2016, as a result of the non-application of the government’s price decree that establishes the “Average Node Price”, which was applied retroactively to November 2016;
(ii) a decrease of Ch$ 63 billion in collections from GasAtacama, excluding intercompany transactions, due to lower physical sales mainly in the spot market; and
(iii) an increase of Ch$ 41 billion in collections from Enel Generation, on a stand-alone basis and excluding intercompany transactions, due to higher natural gas sales and higher collections from energy sales.
Finally, the increase was also offset by an increase of Ch$ 57 billion in income tax paid during 2017, primarily due to the absence of the tax credit benefit corresponding to dividends received from Enel Generation’s former non-Chilean subsidiaries.
For further information regarding our operating results in 2017 and 2016, please see “— A. Operating Results. — 3. Analysis of Results of Operations for the Years Ended December 31, 2017 and 2016.”
For the year ended December 31, 2018, net cash flows used in investing activities increased 1,185% compared to the same period of 2017. The increase was mainly due to the 2018 Reorganization completed on April 2, 2018, with Ch$ 1,624 million related to the tender offer for Enel Generation and a decrease of Ch$ 116 billion in other collections from the sale of equity or debt instruments belonging to other entities related to the sale of Electrogas.
For the year ended December 31, 2017, net cash flows used for investing activities increased 131% compared to the same period of 2016. The increase was mainly due to the acquisition of Ch$ 266 billion in fixed assets, primarily related to Los Cóndores project and extension of the electrical network, partially offset by Ch$ 116 billion in other collections from the sale of equity or debt instruments belonging to other entities related to the sale of Electrogas, and proceeds of Ch$ 4 billion received from the sale of land by GasAtacama.
For further information regarding the 2018 Reorganization and the acquisition of fixed assets in 2017, please see “Item 4. Information on the Company — A. History and Development of the Company — Capital Investments, Capital Expenditures and Divestitures.”
For the year ended December 31, 2018, net cash flows provided by financing activities increased 404% compared to 2017 mainly to finance the 2018 Reorganization.
The aggregate cash inflows from financing activities in 2018 were primarily due to:
(i) Ch$ 625 billion in Yankee bonds issued by us;
(ii) Ch$ 940 billion in bank loans granted to us; and
(iii) Ch$ 666 billion in proceeds from the issuance of shares in connection with the tender offer and related capital increase made as part of the 2018 Reorganization.
The aggregate cash outflows from financings activities in 2018 were primarily due to:
(i) Ch$ 820 billion in payments of loans and bonds (including Ch$ 749 billion from us on a stand-alone basis, related to the 2018 Reorganization and Ch$ 65 billion from EGP Chile);
(ii) Ch$ 231 billion in dividend payments, of which Ch$ 118 billion was paid to Enel, our controlling shareholder;
(iii) Ch$ 116 billion in interest expense (Ch$ 47 billion paid by Enel Generation, Ch$ 41 billion paid by EGP Chile and Ch$ 28 billion paid by us); and
(iv) Ch$ 72 billion in payments to acquire treasury shares.
For the year ended December 31, 2017, net cash flows used in financing activities decreased 29% compared to 2016, mainly due to lower dividend payments due in part to the payment of dividends by Enel Distribution and Enel Generation to Enel Américas prior to the spin-offs in 2016, and lower other cash outflows associated with cash allocations related to the 2016 Reorganization.
The aggregate cash outflows from financing activities in 2017 were primarily due to:
(i) Ch$ 261 billion in dividend payments, of which Ch$ 96 billion was paid to Enel, our controlling shareholder;
(ii) Ch$ 44 billion in interest expense, mainly paid by Enel Generation on a stand-alone basis;
(iii) Ch$ 6 billion in payments of loans and bonds paid by Enel Generation on a stand-alone basis; and
(iv) Ch$ 5 billion mainly of derivatives instrument payments executed by Enel Generation.
For a description of liquidity risks resulting from the inability of our subsidiaries to transfer funds, please see “Item 3. Key Information — D. Risk Factors — We depend on payments from our subsidiaries to meet our payment obligations.”
We coordinate the overall financing strategy of our subsidiaries. However, our subsidiaries develop their capital expenditure plans and customarily finance their capital expansion programs through internally generated funds or direct financings. We, on a stand-alone basis, have no legal obligations or other commitments to support our subsidiaries financially. In some cases, we may finance our subsidiaries through intercompany loans. For information regarding our commitments for capital expenditures, see “Item 4. Information on the Company — A. History and Development of the Company — Capital Investments, Capital Expenditures and Divestitures” and our contractual obligations table set forth below under “Item 5. Operating and Financial Review and Prospects — F. Tabular Disclosure of Contractual Obligations.”
As of December 31, 2018, our consolidated interest-bearing debt totaled Ch$ 2,479 billion (including Ch$ 447 billion in debt that EGP Chile incurred with Enel Finance International N.V.) and had the following maturity profile:
· Ch$ 329 billion in 2019;
· Ch$ 170 billion from 2020 to 2021;
· Ch$ 194 billion from 2022 to 2023; and
· Ch$ 1,786 billion thereafter.
We have American Depositary Shares listed and traded on the NYSE since April 26, 2016, and may in the future access the international equity capital markets (including SEC-registered ADS offerings). Our subsidiary Enel Generation accessed the international equity capital markets, with a SEC-registered ADS offering on August 3, 1994. Enel Generation actively issued bonds in the United States (“Yankee Bonds”) in the past, and we, on an individual basis, have issued bonds Yankee Bonds for US$ 1,000 million in 2018 and, depending on liquidity needs, may issue Yankee bonds in the future. Since 1996, Enel Generation and Pehuenche have issued a total of US$ 2.8 billion in Yankee Bonds.
The following table lists our Yankee Bonds outstanding as of December 31, 2018.
| | | | | | | | Aggregate Principal Amount | |
Issuer | | Term | | Maturity | | Coupon | | Issued | | Outstanding | |
| | | | | | (%) | | (in millions of US$) | |
Enel Chile | | 10 years | | June 2028 | | 4.875 | | 1,000 | | 1,000 | |
The following table lists the Yankee Bonds issued by our subsidiary, Enel Generation, and the aggregate principal amount outstanding as of December 31, 2018. The weighted average annual coupon interest rate for such bonds is 5.8%, without giving effect to each bond’s duration, or put options.
| | | | | | | | Aggregate Principal Amount | |
Issuer | | Term | | Maturity | | Coupon | | Issued | | Outstanding | |
| | | | | | (%) | | (in millions of US$) | |
Enel Generation | | 10 years | | April 2024 | | 4.250 | | 400 | | 400 | |
Enel Generation (1) | | 30 years | | February 2027 | | 7.875 | | 230 | | 206 | |
Enel Generation (2) | | 40 years | | February 2037 | | 7.325 | | 220 | | 70.8 | |
Enel Generation (1) | | 100 years | | February 2097 | | 8.125 | | 200 | | 40 | |
Total | | | | | | 5.813 | (3) | 1.050 | | 717 | |
(1) Enel Generation repurchased some of these bonds in 2001.
(2) Holders of the Enel Generation 7.325% Yankee Bonds due 2037 exercised a put option on February 1, 2009, for a total amount of US$ 149.2 million. The remaining US$ 70.8 million principal amount of the Yankee Bonds mature in February 2037.
(3) Weighted-average coupon by outstanding amount.
We also have access to the Chilean domestic capital markets. Our subsidiary, Enel Generation, has issued debt instruments including commercial paper and medium- and long-term bonds that are primarily sold to Chilean pension funds, life insurance companies and other institutional investors.
The following table lists UF-denominated Chilean bonds issued by Enel Generation that are outstanding as of December 31, 2018.
| | | | | | Coupon (inflation | | Aggregate Principal Amount | |
Issuer | | Term | | Maturity | | adjusted rate) | | Issued | | Outstanding | |
| | | | | | (%) | | (in millions of UF) | | (in millions of US$) | | (in billions of Ch$) | |
Enel Generation Series H | | 25 years | | October 2028 | | 6.20 | | 4.00 | | 84.4 | | 59 | |
Enel Generation Series M | | 21 years | | December 2029 | | 4.75 | | 10.0 | | 396.8 | | 276 | |
Total | | | | | | 5 | (1) | 14.0 | | 481.2 | | 334 | |
(1) Weighted-average coupon by outstanding amount.
For a full description of local bonds issued by Enel Generation, see “Unsecured liabilities detailed by currency and maturity” in Note 21.2 of the Notes to our consolidated financial statements.
We may also participate in the international and local commercial bank markets through syndicated or bilateral senior unsecured loans, including both fixed term and revolving credit facilities. The amounts outstanding or available under our syndicated revolving loan as of December 31, 2018, is set forth in the table below.
Borrower |
| Type |
| Maturity |
| Facility Amount |
| Amount Drawn |
|
|
|
|
|
|
| (in millions of US$) |
| (in millions of US$) |
|
Enel Generation | | Syndicated revolving loan | | February 2020 | | 200 | | — | |
Enel Chile | | Bilateral revolving loan | | December 2022 | | 400 | | — | |
Total | | | | | | 600 | | — | |
Enel Generation’s undrawn revolving credit facility is governed by the laws of the State of New York and does not contain a condition precedent requirement regarding the non-occurrence of a “Material Adverse Effect” (or MAE, as defined contractually) prior to a disbursement, allowing us full flexibility to draw on it for up to US$ 200 million as of December 31, 2018, and as of the date of this Report from such committed revolving facilities under any circumstances, including situations involving a MAE. On
December 21, 2018, we also entered into a 4-year revolving credit line with Enel International Finance N.V. for up to US$ 400 million, with an availability period of 6 months, which as of December 31, 2018, and as of the date of this Report remained undrawn.
We may also borrow from banks in Chile under fully committed facilities, under which a potential MAE would not be an impediment to this source of liquidity. In 2016, Enel Generation entered into a 3-year bilateral revolving loan for an aggregate amount of UF 2.8 million (Ch$ 79 billion as of December 31, 2018) as set forth in the table below.
Borrower |
| Type |
| Maturity |
| Facility Amount |
| Amount Drawn |
|
| | | | | | (in millions of UF$) | | (in millions of UF$) | |
Enel Generation | | Bilateral revolving loan | | March 2019 | | 2.8 | | — | |
This facility matured in March 2019 and was not renewed.
As a result of the foregoing, we have access to fully committed undrawn revolving loans, both international and domestic, for up to Ch$ 495 billion in the aggregate as of December 31, 2018, and up to Ch$ 417 billion as of the date of this Report.
On January 12, 2018, we entered into a senior unsecured term loan credit agreement. The credit agreement provides for an 18-month facility, originally comprised of a Ch$ 667.9 billion Term A Loan Commitment and a US$ 900 million Term B Loan Commitment, and is governed by the laws of the State of New York. We entered into this credit agreement to fund the financial needs arising from the 2018 Reorganization. In March 2018, we drew down Ch$ 517.7 billion from the Term A Loan Commitment and US$ 697.5 million from the Term B loans Loan Commitment. This facility matures on July 12, 2019. This loan was substantially repaid with proceeds obtained from our first Yankee bond issuance in June 2018.
We and our subsidiaries also borrow routinely from uncommitted Chilean bank facilities with approved lines of credit for approximately Ch$ 53 billion in the aggregate, none of which are currently drawn. Unlike the committed lines described above, which are not subject to a MAE conditions precedent prior to disbursements, these facilities are subject to greater risk of not being disbursed in the event of a MAE, and therefore could limit our liquidity under such circumstances.
We may also access the Chilean commercial paper market under programs that need to be registered with the CMF. In addition, in March 2018, we registered a 30-year local bond program with the CMF for UF 15 million (Ch$ 595 billion as of December 31, 2018). Finally, we can also access other types of financing, including supplier credits, leasing, among others.
EGP Chile has also accessed the Chilean bank market through bilateral loan agreements, which as of December 31, 2018, totaled Ch$ 278 billion, with a final maturity in December 2021. In addition, EGP Chile incurred in debt with Enel International Finance N.V. through a US dollar-denominated loan, which as of December 31, 2018, had US$ 644 million (Ch$ 447 billion) outstanding, with a maturity in December 2027.
Only Enel Generation’s outstanding debt facilities, with the exception of their Yankee Bonds, include financial covenants. The types of financial covenants, and their respective limits, vary from one type of debt to another. As of December 31, 2018, the most restrictive financial covenant affecting Enel Generation was the leverage ratio in connection with the bilateral revolving loan facility that matured in March 2019, and the syndicated senior unsecured loan that matures in February 2020. Under such covenants, the maximum additional debt that could be incurred without a breach is Ch$ 1,956 billion. As of December 31, 2018, and as of the date of this Report, our subsidiaries are in compliance with the financial covenants contained in their debt instruments.
As is customary for certain credit and capital market debt facilities, a significant portion of our financial indebtedness is subject to cross default provisions. Each of the revolving credit facilities described above, as well as Yankee Bonds issued by us and Enel Generation, have cross default provisions with different definitions, criteria, materiality thresholds and applicability as to the subsidiaries that could give rise to a cross default.
The cross default provision for our credit agreement executed in January 2018, governed by the laws of the State of New York, refers to defaults of the borrower, without reference to any subsidiary. Under such credit facility, only matured defaults of the borrower exceeding US$ 100 million qualify for a potential cross default when the principal exceeds US$ 100 million, or its equivalent in other currencies. In the case of a matured default above the materiality threshold, the revolving credit facility’s lenders would have the option to accelerate if lenders representing more than 50% of the aggregate debt of a particular outstanding facility chose to do so.
The cross default provisions for the Enel Generation revolving credit facility that is due in February 2020, governed by the laws of the State of New York, refers to defaults of the borrower, without reference to any subsidiary. Under such credit facility, only matured defaults of the borrower exceeding US$ 50 million qualify for a potential cross default when the principal exceeds US$ 50 million, or its equivalent in other currencies, although its subsidiaries do not have any financial obligation. In the case of a matured default above the materiality threshold, the revolving credit facility’s lenders would have the option to accelerate if lenders
representing more than 50% of the aggregate debt of the outstanding facility chose to do so. All of our and Enel Generation’s Yankee Bonds are unsecured and not subject to any guarantees by any of its subsidiaries or parent companies.
The local facility of Enel Generation was due in March 2019 and was not renewed.
The cross default provision of our Yankee Bonds may be triggered by our subsidiaries’ debt. A matured default of Enel Generation or any of its subsidiaries could result in a cross default to Yankee Bonds issued by us and by Enel Generation if such matured default, on an individual basis, has a principal exceeding certain materiality thresholds. Enel Generation’s subsidiaries do not currently have any financial obligations. In the case of a matured default above the materiality threshold, holders of Yankee Bonds would have the option to accelerate if either the trustee or bondholders representing at least 25% of the aggregate debt of a particular series then outstanding chose to do so. Enel Generation’s local bonds do not have cross default provisions arising from its subsidiaries.
Payment of dividends and distributions by our subsidiaries and affiliates represent an important source of funds for us. The payment of dividends and distributions by certain subsidiaries and affiliates are potentially subject to legal restrictions, such as legal reserve requirements, capital and retained earnings criteria and other contractual restrictions. We are currently in compliance with the legal restrictions and therefore, they currently do not affect the payment of dividends or distributions to us. Certain credit facilities and investment agreements of our subsidiaries may restrict the payment of dividends or distributions in certain special circumstances. For instance, one of Enel Generation’s UF-denominated Chilean bonds restricts the amount of intercompany loans that Enel Generation and its subsidiaries are allowed to lend to related parties. The threshold for such aggregate restriction of intercompany loans is currently US$ 100 million, equal to approximately Ch$ 69 billion. After a liability management process carried out by Enel Generation, the threshold was increased to US$ 500 million (equal to Ch$ 347 million), which, as of the date of this Report, is still subject to the final approval by the CMF. For a description of liquidity risks resulting from our company status, please see “Item 3. Key Information — D. Risk Factors— We depend on payments from our subsidiaries to meet our payment obligations.”
Our estimated capital expenditures for 2019 through 2021 are expected to amount to Ch$ 1,355 billion, which includes maintenance capital expenditures, investment in expansion projects under execution, such as those for Los Cóndores project, as well as water rights and expansion projects that are still under evaluation, in which case we would undertake them only if deemed profitable.
We do not currently anticipate liquidity shortfalls affecting our ability to satisfy the material obligations described in this Report. We expect to be able to refinance our consolidated indebtedness as it becomes due, fund our purchase obligations with internally generated cash and fund capital expenditures with a mixture of internally generated cash and borrowings.
C.Research and Development, Patents and Licenses, etc.
None.
D.Trend Information.
Our subsidiaries are engaged in the generation and distribution of electricity in Chile, which is undergoing changes including more restrictive government regulations, the introduction of new technologies and business models, and more competition. Our businesses are subject to a wide range of conditions that may result in significant variability in our earnings and cash flows from year to year. We seek to establish a conservative and well-balanced commercial policy, which aims at controlling relevant variables, reducing risks and providing stability to our results of operations.
Generation
Our operating income is affected by several factors including contracted electricity prices, prevailing hydrological conditions, the price of fuels used to generate thermal electricity, contracted obligations, generation mix, and the electricity prices prevailing in the spot market, among others. With the consolidation of EGP Chile as of April 2018, we added 1,189 MW of installed capacity. We expect that NCRE will boost the growth of our generation business in the long term.
Sales prices and energy costs are among the main drivers of our results of operations of our electricity generation business. The quantity of electricity sold has been generally stable over time, with increases reflecting economic and demographic growth. Our profits from contracted sales rely on our ability to generate or buy electricity at a cost lower than contracted prices. However, the applicable price for electricity sales and purchases in the spot market is much harder to predict because the spot generation price is influenced by several factors, including hydrology and fuel prices. Abundant hydrological conditions generally lower spot prices, while dry conditions increase them, although this effect on prices may be partly mitigated with NCRE generation.
Our operating income might not be impacted adversely even when we are required to buy electricity at high prices in the spot market if our commercial policy is appropriately managed. Our goal is to have a conservative and well-balanced commercial policy that controls relevant variables, provides stability to profits, and mitigates our exposure to the volatility of the spot market by contracting a significant portion of our expected electricity generation through long-term electricity supply contracts. The optimal level of electricity supply commitments is one that protects us against low marginal cost conditions, such as those existing during a rainy season, while still taking advantage of high marginal cost conditions, such as higher spot market prices during dry years. In order to determine the optimal mix of long-term contracts and sales in the spot market, we project our aggregate generation taking into consideration our diversified generation mix and the incorporation of new projects under construction under dry hydrology. We then create demand estimates using standard economic theory and forecast the system’s marginal cost using proprietary stochastic models. We also participate in the energy forward derivatives market, which allows us to negotiate volume and future price, in order to ensure demand and avoid buying in the spot market, which has high volatility and risk.
Our sales contracts to customers not subject to regulated prices are not standardized and the contractual terms and conditions are individually negotiated. When negotiating these contracts, we try to set the price at a premium over future expected spot prices to mitigate the risk of increases in future spot prices. However, the premium can vary substantially depending on several conditions such as node values, load profile and the term of the contract. Our contracted sales with regulated customers represent on average more than 67% of our sales, allowing us to maintain steady prices for longer periods, normally 10 to 15 years, which combined with our balanced commercial policy, generally provides for a stable profit. Most of our current regulated tariffs are indexed to the U.S. CPI and, to a lesser extent, to commodity prices. We expect regulated tariffs to remain fairly stable, without material changes before 2021, with a downward trend as a result of the full integration of the two electricity systems, the former SIC (central and southern Chile) and SING (northern Chile), into one interconnected system, the SEN, since November 2017. This integration is expected to increase system generation efficiency, especially under extreme situations, and also improve investment and commercialization opportunities in both markets, mainly allowing for a higher dispatch of solar and wind power plants located in northern areas of Chile which will have a direct benefit to our own NCRE power plants located in that zone. We expect that Los Cóndores will be completed during 2020, adding an average 600 GWh of annual generation to our consolidated generation capacity. In 2022 and 2024, we expect significant price decreases, mainly due to the start of operations of projects tendered in 2016 and 2017, respectively, including our Campos del Sol, Cerro Pabellón 3 and Renaico II projects.
In 2022, distribution company contracts awarded to Enel Generation in the August 2016 auction will come into effect and therefore we expect the tariffs of our regulated contracts will decrease as a consequence of the lower prices offered by NCRE providers. In 2024, contracts awarded in the November 2017 auction, the last such process, will come into effect with an average price of the total awarded energy of US$ 32.5 per MWh, 32% lower than the average price of the previous tender process. The total amount of energy tendered was based on NCRE offers, representing a milestone in the industry. We were awarded 54% of the total tender of 2,200 GWh per annum, corresponding to 1,180 GWh per annum at an average price of US$ 34.7 per MWh with a mix of wind, solar and geothermal generation, which will be provided through NCRE projects backed up by conventional energy.
We regularly participate in energy bids and we have been awarded long-term energy sale contracts that incorporate the expected variable costs considering changes to the most relevant variables. These contracts secure the sale of our current and expected new capacity and allow us to stabilize our income. Considering the results of the last two tenders for regulated customers, we expect to continue increasing the NCRE market competitiveness. As a result, offered prices will probably continue to decrease, but at a lower rate compared to previous years.
Spot prices could also be affected by international prices of fuel commodities such as fuel oil, coal and LNG, since Chile does not produce those fuels in any significant quantities. Fuel prices directly affect our thermal generation costs, which as of December 31, 2018, represented 37% of our installed capacity. Commodity prices, mainly oil, have significantly increased since their lowest level in the first quarter of 2016, characterized by a high volatility. The trend is expected to continue into 2019.
During the last few years, NCRE generation has grown much faster than expected, mainly as a consequence of the technological improvement in wind and solar technologies and the associated declining amount of capital required to deploy them. The government also established a regulated tender framework that allows the energy market to access this price reduction in the medium and long term. Currently, NCRE (solar, wind and geothermal) generation installed capacity represents 18% of the total market share, according to the monthly CEN report for March 2019. Currently, EGP Chile has a competitive pipeline of projects with short time-to-market, which is possible because of current commercial opportunities through PPA contracts.
For the period 2019-2021, we expect to invest Ch$ 1,355 billion in investments related to projects of current and future development, including research studies necessary to develop other generation and maintenance projects of distribution networks and existing generation power plants. By 2021, renewable projects under development are expected to increase the current installed capacity by 1.1 GW.
With respect to the development of new projects to increase our installed capacity, our strategy is to focus in creating synergies with plants in operation and obtaining economies of scale, by combining existing plants with new NCRE projects to achieve greater competitiveness. We expect to continue competing in the future through PPA contracts, in part associated with the migration of regulated customers from the distribution business, mainly mining and large industries, who are demanding NCRE sources to reduce their energy costs and to clean their own carbon footprint. The continuous addition of NCRE power plants to the grid will require further market flexibility and focus on operational efficiency to combine the different technologies while maintaining the security and the system’s supply reliability, which is typically a NCRE weakness. Wind and solar sources, the NCRE sources most widely used, have higher intermittency than other non-NCRE facilities since they can only generate electricity when the wind blows or the sun shines. Battery energy solutions will likely play a key role in the next decade, providing a crucial solution for frequency control and grid stability in the context of significant wind and solar penetration.
Distribution
Distribution customers who can choose between regulated and unregulated tariffs are switching to unregulated tariffs, thereby becoming direct generation company customers and paying tolls to distribution companies. These customers are tendering their energy needs, either directly or in association with other customers, because unregulated tariffs are currently lower than regulated tariffs that are based on contracts tendered in the past at higher prices. We expect this trend may continue in the future until lower cost contracts are recognized in the regulated tariffs. Based on the latest tender processes, it may last until 2024 with the recognition of the 2017 tendered prices in the regulated tariff.
We expect organic growth expansion in the distribution business mainly coming from the digitalization of the network. We expect to invest in new technologies that will automate our networks to achieve better operational and economic efficiency. The investment in these smart meters will be recognized in the regulated tariffs. These smart meters allow bi-directional communication, digitized and interconnected networks, and also enable our consumers to improve their energy efficiency. We will continue investing in this technology since it will allow us to reduce costs mainly in remote meter reading without an inspector, disconnection and reconnection processes, and to address extreme weather emergencies better by significantly reducing failure recognition time. These instruments will also facilitate maintenance that is more efficient, as well as provide a necessary technical tool through which residential customers may inject their future excess energy into the electrical system.
E.Off-balance Sheet Arrangements.
We are not a party to any off-balance sheet arrangements.
F.Tabular Disclosure of Contractual Obligations.
The table below sets forth our cash payment obligations as of December 31, 2018:
| | Payments due by Period | |
Ch$ billion | | Total | | 2019 | | 2020-2021 | | 2022-2023 | | After 2023 | |
Purchase obligations(1) | | 12,776 | | 4,023 | | 3,977 | | 3,393 | | 1,383 | |
Interest expense(2) | | 1,086 | | 128 | | 242 | | 211 | | 505 | |
Yankee bonds | | 1,193 | | — | | — | | — | | 1,193 | |
Local bonds(3) | | 357 | | 53 | | 62 | | 62 | | 180 | |
Financial Leases | | 16 | | 3 | | 8 | | 5 | | — | |
Pension and post-retirement obligations(4) | | 57 | | 7 | | 8 | | 7 | | 35 | |
Bank debt | | 960 | | 283 | | 272 | | 149 | | 256 | |
Total contractual obligations | | 16,445 | | 4,497 | | 4,569 | | 3,831 | | 3,553 | |
(1) Includes generation and distribution business purchase obligations, which are comprised mainly of energy purchases, operating and maintenance contracts, and other services. Of the total contractual obligations of Ch$ 8,404 billion, 65.8% corresponds to energy purchased for distribution, 23.3% corresponds primarily to fuel supply, maintenance of medium and
low voltage lines, supplies of cable and utility poles, and energy purchased for generation, and the remaining 10.9% corresponds to miscellaneous services, such as LNG regasification, fuel transportation and coal handling.
(2) Interest expense includes the interest payments for all outstanding financial obligations, calculated as principal multiplied by the interest rate, presented according to when the interest payment comes due.
(3) Hedging instruments included might substantially affect the outstanding amount of debt.
(4) We have funded and unfunded pension and post-retirement benefit plans. Our funded plans have contractual annual commitments for contributions, which do not change based on funding status. Cash flow estimates in the table are based on such annual contractual commitments including certain estimable variable factors such as interest. Cash flow estimates in the table relating to our unfunded plans are based on future discounted payments necessary to meet all of our pension and post-retirement obligations.
G.Safe Harbor.
The information contained in Items 5.E and 5.F contains statements that may constitute forward-looking statements. See “Forward-Looking Statements” in the “Introduction” of this information statement, for safe harbor provisions.
Item 6.Directors, Senior Management and Employees
A.Directors and Senior Management.
Directors
Our Board of Directors consists of seven members who are elected for a three-year term at an Ordinary Shareholders’ Meeting (“OSM”). Following the end of their term, they may be re-elected or replaced. If a vacancy occurs in the interim, the Board of Directors will elect a temporary director to fill the vacancy until the next OSM, at which time the entire Board of Directors will be elected to a new three-year term. Our Executive Officers are appointed and hold office at the discretion of the Board of Directors.
The members of our Board of Directors as of December 31, 2018 were as follows:
Directors | | Position | | Age(1) | | Current Position
Held Since |
Herman Chadwick P. | | Chairman | | 74 | | 2016 |
Salvatore Bernabei | | Director | | 46 | | 2016 |
Pablo Cabrera G. | | Director | | 71 | | 2016 |
Daniele Caprini | | Director | | 46 | | 2018 |
Giulio Fazio | | Director | | 48 | | 2016 |
Fernán Gazmuri P. | | Director | | 75 | | 2016 |
Juan Gerardo Jofré M. | | Director | | 70 | | 2016 |
(1) As of April 30, 2019.
At ordinary shareholders meeting held on April 25, 2018, the members of our Board of Directors were elected to three-year terms ending in April 2021. During the Board of Directors’ meeting held on April 25, 2018, Mr. Chadwick was appointed Chairman and Messrs. Gazmuri, Cabrera and Jofré as members of the Directors’ Committee. Mr. Gazmuri was also appointed Financial Expert of the Directors’ Committee.
Set forth below are brief biographical descriptions of the members of our Board of Directors, three of whom reside outside Chile and four of whom reside in Chile, as of December 31, 2018:
Herman Chadwick P.
Mr. Chadwick is law partner at Chadwick & Cía. and a director of several companies unrelated to us, including Aguas Andinas, a Chilean water utility company, and Viña Santa Carolina, a Chilean winery. Mr. Chadwick is an advisor and arbitrator at Centro de Arbitraje y Mediación de la Cámara de Comercio de Santiago, an association that provides arbitration services to resolve legal disputes. Mr. Chadwick holds a law degree from Pontificia Universidad Católica de Chile.
Salvatore Bernabei
Mr. Bernabei is the Head of Global Procurement of Enel since May 2017. He has been Head of Renewable Energies Latin America of Enel Green Power (2016-2017) and Country Manager for Chile and the Andean Countries (2013-2016). He joined Enel in 1999 and held several positions involving project integration, execution, inspection, operations and logistics. Mr. Bernabei holds a degree in industrial engineering from Università degli Studi di Roma “Tor Vergata”, and an MBA from Politecnico di Milano.
Pablo Cabrera G.
Mr. Cabrera is a member of the Chilean Society of International Law. Mr. Cabrera served concurrently as ambassador to the Holy See, to the Sovereign Military Order of Malta and Albania (2006-2010), to the People’s Republic of China (2004-2006) to Russia (2000-2004) and to the UK (1999-2000). Mr. Cabrera holds a law degree from Pontificia Universidad Católica de Chile and Academia Diplomática Andrés Bello.
Daniele Caprini
Mr. Caprini is the Head of Enel’s Group Planning and Reporting and the CFO of Enel Colombia since 2016. He headed Enel’s Financial Valuation and Investment Control (2013-2015), Management Control (2015-2016) and Strategic Planning M&A and Financial Valuation (2009-2013) of Enel Green Power S.A. Mr. Caprini holds a degree in economics from the Università degli Studi di Siena and an MBA from Roma Università LUISS.
Giulio Fazio
Mr. Fazio is the Head of Enel’s Legal and Corporate Affairs since January 2016. Previously, he held a comparable position at Enel Green Power S.p.A. (2008-2014). Since 2004, he has worked in finance and antitrust operations in Enel’s Legal Department. Mr. Fazio joined an Enel affiliate in 1996. He holds a degree in law and a Ph.D. from Università degli Studi di Palermo.
Fernán Gazmuri P.
Mr. Gazmuri has been a board member of companies unrelated to us. He is Currently Vice Chairman of Invexans S.A., a telecom and Maritime Cable Company and a Director of Citroën Chile S.A.C., the Chilean Security Association, Invexans S.A, Sociedad de Fomento Fabril (SOFOFA) and Asociación Nacional Automotriz de Chile. In 2013-2016, he was director of Empresa Nacional del Petróleo (ENAP), the Chilean state-owned oil company and Vice-Chairman of the Chilean International Chamber of Commerce. He holds a degree in business administration from Pontificia Universidad Católica de Chile.
Gerardo Jofré M.
Mr. Jofré is a director of CAP S.A., a mining and steel company, and a member of the self-regulatory council of the Asociación de Aseguradores de Chile, the insurance companies association. In 2010-2014 he was Chairman of the Board of Codelco, the Chilean state-owned copper mining company. He has been a director of several prominent Chilean companies unrelated to us, and has held several managerial positions, primarily in Banco Santander Chile and affiliates. He holds a degree in business administration from Pontificia Universidad Católica de Chile.
Executive Officers
Set forth below are our Executive Officers as of December 31, 2018.
Executive Officers | | Position | | Age(1) | | Joined Enel or
Affiliate in | | Current Position
Held Since |
Paolo Pallotti | | Chief Executive Officer | | 56 | | 1990 | | 2018 |
Angel Barrios R. | | IT Officer | | 49 | | 1994 | | 2018 |
Juan José Bonilla A. | | Procurement Officer | | 40 | | 2010 | | 2018 |
Raffaele Cutrignelli | | Internal Audit Officer | | 38 | | 1995 | | 2016 |
Marcelo Antonio de Jesus | | Chief Financial Officer | | 49 | | 2018 | | 2018 |
Monica De Martino | | Regulatory Affairs Officer | | 43 | | 2011 | | 2017 |
Alison Dunsmore M. | | Services Officer | | 39 | | 2005 | | 2018 |
José Miranda M. | | Communications Officer | | 37 | | 2014 | | 2016 |
Antonella Pellegrini | | Sustainability Officer | | 57 | | 2000 | | 2017 |
Andrés Pinto B. | | Safety Officer | | 40 | | 2010 | | 2017 |
Liliana Schnaidt H. | | Human Resources Officer | | 40 | | 2009 | | 2018 |
Claudia Navarrete C. | | Planning and Control Officer | | 46 | | 1998 | | 2018 |
Pedro Urzúa F. | | Institutional Affairs Officer | | 49 | | 2012 | | 2016 |
Domingo Valdés P. | | General Counsel | | 55 | | 1993 | | 2016 |
(1) As of April 30, 2019.
Set forth below are brief biographical descriptions of our Executive Officers, all of whom reside in Chile.
Paolo Pallotti: Mr. Pallotti was the CFO of Enel Américas in 2018. He played a key role in various Enel corporate reorganization processes. He has been CFO of Enel’s Italian businesses (2014-2018), Financial Director of Enel’s Infrastructure & Networks division (2012), and director of Enel Energia S.p.A. (2015-2018) and Enel Italia S.r.L (2017-2018). He holds a degree in electronic engineering from Università degli Studi di Ancona.
Angel Barrios R.: Mr. Barrios has held several positions related to Information Systems, including Head of ICT, a subsidiary of Enel Chile (2014-2018). Mr. Barrios holds a degree in civil engineering in informatics from Universidad Santa María and a master’s degree in Information Technology from Universidad Santa María.
Juan José Bonilla A.: Mr. Bonilla was CEO of EGP Chile in 2017 and was Operation and Maintenance Manager of EGP North America (2014-2016). Before, he held managerial positions at EGP including Head of Wind Maintenance and Technical Support. He holds a degree in industrial engineer from Escuela Superior de Ingenieros Industriales de Madrid, an MBA from ESERP Business School, and a master’s degree from Universidad San Pablo - CEU.
Raffaele Cutrignelli: Mr. Cutrignelli was the Audit Officer for Codensa and Emgesa (2015-2016) and the Head of Latin American Audit for EGP in Brazil (2013-2015). Mr. Cutrignelli holds a degree in international business from Nottingham Trent University, and a master’s degree in audit and internal controls from Universitá di Pisa.
Marcelo Antonio de Jesus: Mr. de Jesus was CFO at Eletropaulo and a member of the Business Council of AES Group companies and held finance positions at TAM Linhas Aéreas S.A, Latam Airlines Group, Flora Higiene y Belleza, Syngenta and AES Latin America & Caribbean. He graduated from Universidad de São Caetano do Sul Business School and holds a master’s degree in business administration from Dom Cabral Foundation.
Mónica De Martino: Ms. De Martino was Head of EGP Regulatory Affairs Latin America (2011-2017). She holds a degree in political science from Libera Università Internazionale degli Studi Sociali Guido Carli, an MBA from Columbia Business School and a graduate degree from London Business School.
Alison Dunsmore M.: Ms. Dunsmore has held various Enel positions including Head of Commercial Management (2013-2015) and Chief of Staff and Head of Strategic Planning (2015-2017). Ms. Dunsmore holds a degree in civil industrial engineer from Universidad de Santiago de Chile.
José Miranda M.: Before joining Enel, Mr. Miranda worked for eleven years at Televisión Nacional de Chile, a state-owned Chilean TV channel. He is an audiovisual communicator with a degree from DUOC UC and a graduate degree in management from Universidad de Chile.
Antonella Pellegrini: Ms. Pellegrini has held managerial positions in business development and sustainability for EGP affiliates since 2014. She holds a degree in marketing and communications from Istituto Europeo di Design.
Andrés Pinto B.: Mr. Pinto has held managerial positions in project planning, cost control and operations for Enel affiliates since 2010. Mr. Pinto holds a degree in civil engineering from Pontificia Universidad Católica de Chile.
Claudia Navarrete C.: Ms. Navarrette held management positions in analysis and financial control in 2012-2018. Ms. Navarrete holds a degree in civil engineering, a master’s degree in computer science and an MBA from Pontificia Universidad Católica de Chile.
Liliana Schnaidt H. Ms. Schnaidt held positions in EGP business development, with a focus on solar energy (2009-2018). Ms. Schnaidt holds a degree in civil engineering from Pontificia Universidad Católica de Chile.
Pedro Urzúa F.: Mr. Urzúa has been Institutional Affairs Officer for Chile and the Andean Countries for EGP (2012-2016), Director of Corporate Affairs of ENAP (2009-2012), director of Fundación Acción RSE (2012) and Communications Director of ENAP Sipetrol (2009-2012). He a holds a degree in journalism from Universidad de Artes y Ciencias de la Comunicación.
Domingo Valdés P.: Mr. Valdés is the Secretary of the Boards of Directors of both Enel Chile and Enel Américas and is a Professor of Economic and Antitrust Law at Universidad de Chile. Mr. Valdés holds a law degree from Universidad de Chile and a master’ in law degree from the University of Chicago.
B.Compensation.
At the OSM held on April 25, 2018, our shareholders approved the compensation policy for our Board of Directors. Director compensation consists of a monthly fixed compensation of UF 216 per month and an additional fee of UF 79.2 per meeting, up to a maximum of 16 sessions in total, including ordinary and extraordinary meetings, within the respective fiscal year. The Chairman of the Board is entitled to double the compensation of other directors.
The members of our Directors’ Committee are paid a monthly fixed compensation of UF 72 per month and an additional fee of UF 26.4 per meeting, up to a maximum of 16 sessions in total, including ordinary and extraordinary meetings. The monthly fees (fixed and variable) are considered as advances on the annual variable fee.
If a director serves on one or more Boards of Directors of the subsidiaries and/or associate companies or serves as director of other companies or corporations in which the economic group holds an interest directly or indirectly, the director can only receive compensation from one of these Boards of Directors.
Executive Officers of our Company and/or of our subsidiaries or associate companies will not receive compensation in the case that they serve as director of any other affiliate. However, compensation may be received by the officer to the extent that it is expressly and previously authorized as an advance payment of the variable portion of the wage to be paid by the affiliate with which the officer signed a contract.
In 2018, the total compensation paid to each of our directors, including fees for attending Directors’ Committee meetings was as follows:
Director | | Fixed
Compensation | | Ordinary and
Extraordinary
Session | | Directors’
Committee (Fixed
Compensation) | | Ordinary and
Extraordinary
Session
(Directors’
Committee) | | Total | |
| | | | | | (in Th Ch$) | | | | | |
Herman Chadwick P. | | 133,016 | | 48,773 | | — | | — | | 181,789 | |
Salvatore Bernabei | | — | | — | | — | | — | | — | |
Pablo Cabrera G. | | 66,508 | | 24,386 | | 22,176 | | 8,842 | | 121,912 | |
Daniele Caprini | | — | | — | | — | | — | | — | |
Giulio Fazio | | — | | — | | — | | — | | — | |
Fernán Gazmuri P. | | 66,508 | | 24,386 | | 22,176 | | 8,842 | | 121,912 | |
Juan Gerardo Jofré M. | | 66,508 | | 24,386 | | 22,176 | | 8,842 | | 121,912 | |
Total | | 332,540 | | 121,931 | | 66,527 | | 26,526 | | 547,525 | |
We do not disclose, to our shareholders or otherwise, any information about an individual Executive Officer’s compensation. Executive Officers are eligible for variable compensation under a bonus plan. The annual bonus plan is paid to our Executive Officers for achieving company-wide objectives and for their individual contribution to our results and objectives. The annual bonus plan provides for a range of bonus amounts according to seniority level and consists of a certain multiple of gross monthly salaries. For the year ended December 31, 2018, the aggregate gross compensation, paid or accrued, for all of our Executive Officers, attributable to fiscal year 2018, was Ch$ 2,676 million in fixed compensation and Ch$ 765 million in variable compensation and benefits.
We entered into severance indemnity agreements with all of our Executive Officers, pursuant to which we will pay a severance indemnity in the event of voluntary resignation or termination by mutual agreement among the parties. The severance indemnity does not apply if the termination is due to willful misconduct, prohibited negotiations, unjustified absences or abandonment of duties, among other causes, as defined in Article 160 of the Chilean Labor Code. All of our employees are entitled to legal severance pay if terminated due to our needs, as defined in Article 161 of the Chilean Labor Code.
The total amounts accrued as of the end of 2018 to provide severance indemnity to our Executive Officers totaled Ch$ 391.4 million. There are no other amounts set aside or accrued to provide for pension, retirement or similar benefits for our Executive Officers.
C. Board Practices.
Our Board of Directors in office as of December 31, 2018, was elected at the OSM held on April 25, 2018, for a three-year term that ends in April 2021. For information about each of the directors and the year that they began their service on the Board of Directors, see “Item 6. Directors, Senior Management and Employees — A. Directors and Senior Management” above. Members of the Board of Directors do not have service contracts with us or with any of our subsidiaries that provide them benefits upon termination of their service.
Corporate Governance
We are managed by a Board of Directors, in accordance with our bylaws, consisting of seven directors who are elected by our shareholders at an OSM, each of whom serves for a three-year term. Following the end of their term, they may be re-elected indefinitely or replaced. Staggered terms are not permitted under Chilean law. If a vacancy occurs on the Board of Directors during the three-year term, the Board of Directors may appoint a temporary director to fill the vacancy. A vacancy triggers an election for every seat on the Board of Directors at the next OSM.
Chilean corporate law provides that a company’s Board of Directors is responsible for the management and representation of a company in all matters concerning its corporate purpose, subject to the provisions of the company’s bylaws and the shareholders’ resolutions. In addition to the bylaws, our Board of Directors has adopted regulations and policies that guide our corporate governance principles.
Our corporate governance policies are included in the following policies or procedures: the Manual for the Management of Information of Interest to the Market (the “Manual”), the Human Rights Policy (Política de Derechos Humanos), the Code of Ethics and a Zero Tolerance Anti-Corruption Plan (the “ZTAC Plan”), the Penal Risk Prevention Model, the “Guidelines 231: Guidelines applicable to non-Italian subsidiaries in accordance with Legislative Decree 231 of June 8, 2001” (the “Guidelines 231”) and procedures issued in compliance with General Regulation 385 issued by the CMF.
In order to ensure compliance with Securities Market Law 18,045 and CMF regulations, our Board of Directors approved the Manual at the meeting held on February 29, 2016 and ratified such decision at its meeting held on March 23, 2016. This document addresses applicable standards regarding the information in connection with transactions of our securities and those of our affiliates, entered into by directors, management, principal executives, employees and other related parties, the existence of blackout periods for such transactions undertaken by directors, principal executives and other related parties, the existence of mechanisms for the continuous disclosure of information that is of interest to the market and mechanisms that provide protection for confidential information. The Manual was released to the public in 2016 and it is posted on our website at www.enelchile.cl. The provisions of this Manual apply to the members of our Board, as well as our executives and employees who have access to confidential information, and especially those who work in areas related to the securities markets.
Our Board of Directors approved a procedure for relationships between Politically Exposed People (Procedimiento Personas Políticamente Expuestas y Conexas) and our Company, which established a specific regulation for their commercial and contractual relationships.
The Human Rights Policy incorporates and adapts the United Nations’ general principles related to human rights into the corporate reality.
In order to supplement the aforementioned corporate governance regulations, our Board of Directors approved a Code of Ethics and a ZTAC Plan at its first meeting held on February 29, 2016 and ratified such decision at its meeting held on March 23, 2016. The Code of Ethics is based on general principles such as impartiality, honesty, integrity and other ethical standards of similar importance, all of which are expected from our employees. The ZTAC Plan reinforces the principles included in the Code of Ethics, but with special emphasis on avoiding corruption in the form of bribes, preferential treatment, prohibition of political donations under all circumstances and other similar matters.
In order to comply with Law 20,393 enacted on December 2, 2009, which imposes criminal responsibility on legal entities for the crimes of asset laundering, financing of terrorism and bribing of public officials, our Board of Directors approved the Penal Risk Prevention Model at its first meeting held on February 29, 2016 and ratified such decision at its meeting held on March 23, 2016. The law encourages companies to adopt this model, whose implementation involves compliance with managerial and supervision duties. The adoption of the Penal Risk Prevention Model mitigates, and in some cases relieves, the effects of criminal responsibility even when a crime is committed.
At its meeting held on October 27, 2016, our Board approved “The Global Compliance Program for Corporate Penal Liability”, which was incorporated into the Penal Risk Prevention Model to reflect current standards and appointed Mr. Rafael Cutrignelli as our Penal Risk Prevention and Global Compliance Program for Corporate Penal Liability Officer, as required by the Penal Risk Prevention Model. Mr. Cutrignelli also serves as Internal Audit Officer for both of Enel Américas and Enel Chile.
On February 29, 2016, our Board of Directors also approved the Guidelines 231 and ratified such decision at its meeting held on March 23, 2016. The Guidelines 231 is defined by Italian Legislative Decree 231, which was enacted on June 8, 2001. It establishes a compliance program that identifies the behaviors expected of related parties for the non-Italian subsidiaries of Enel. Given that our ultimate controlling shareholder, Enel, complies with Italian Legislative Decree 231, which establishes management responsibility for Italian companies as a consequence of certain crimes committed in Italy or abroad, in the name of or for the benefit of such entities, including those crimes described in Chilean Law 20,393, these guidelines set a group of measures, with standards of behavior expected from all employees, advisers, auditors, officials, directors as well as consultants, contractors, commercial partners, agents and suppliers. Legislative Decree 231 includes various activities of a preventive nature that are coherent with and integral to the requirements and compliance with Chilean Law 20,393, which deals with the criminal responsibility of legal entities. These guidelines are supplementary to the standards included in the Code of Ethics and the ZTAC Plan.
On November 29, 2012, the CMF issued General Regulation 341, which established regulations for the disclosure of information with respect to the standards of corporate governance compliance adopted by publicly held limited liability corporations and set the procedures, mechanisms and policies that are indicated in the Appendix to the regulation. The objective of this regulation is to provide credible information to investors with respect to good corporate governance policies and practices adopted by publicly held limited liability corporations, which include us, and permit entities like stock exchanges to produce their own analyses to help the various market participants to understand and evaluate the commitment of companies. General Regulation 341 was substituted by General Regulation 385, issued by the CMF on June 8, 2015. This regulation has similar objectives than the former General Regulation 341, but includes additional issues, by the way of separating each policy into several more detailed policies. Subjects such as non-discrimination, inclusion and sustainability are particularly important in this new regulation. The Appendix of General Regulation 385 is divided into the following four sections with respect to which companies must report the corporate practices that have been adopted: (i) the functioning and composition of the board, (ii) relations between the company, shareholders and the general public, (iii) risk management and control, and (iv) assessment by a third party. Publicly held limited liability corporations should send the information with respect to corporate governance practices to the CMF, no later than March 31 of each year, using the contents of the Appendix to this regulation as criteria. If none of them is adopted, the company must explain its reasons to the CMF. The information should refer to December 31 of the calendar year prior to its dispatch. At the same time, such information should also be at the public’s disposal on the company’s website and must be sent to the stock exchanges.
Compliance with the New York Stock Exchange Listing Standards on Corporate Governance
The following is a summary of the significant differences between our corporate governance practices and those applicable to U.S. domestic issuers under the corporate governance rules of the NYSE.
Independence and Functions of the Directors’ Committee (Audit Committee)
Chilean law requires that at least two thirds of the Directors’ Committee be independent directors. According to Article 50 bis of Law No.18,046, a member would not be considered independent if, at any time, within the last 18 months he: (i) maintained any relationship of a relevant nature and amount with the company, with other companies of the same group, with its controlling shareholder or with the principal officers of any of them or has been a director, manager, administrator or officer of any of them; (ii) maintained a family relationship with any of the members described in (i) above; (iii) has been a director, manager, administrator or principal officer of a non-profit organization that has received contributions from (i) above; (iv) has been a partner or a shareholder that has controlled, directly or indirectly, 10% or more of the capital stock or has been a director, manager, administrator or principal officer of an entity that has provided consulting or legal services for a relevant consideration or external audit services to the persons listed in (i) above; and (v) has been a partner or a shareholder that has controlled, directly or indirectly, 10% or more of the capital stock or has been a director, manager, administrator or principal officer of the principal competitors, suppliers or customers. In case there are not sufficient independent directors on the Board to serve on the Directors’ Committee, Chilean law determines that the independent director nominates the rest of the members of the Directors’ Committee among the remaining Board members that do not meet the Chilean law independence requirements. Chilean law also requires that all publicly held limited liability stock corporations that have a market capitalization of at least UF 1,500,000 (Ch$ 413 billion as of December 31, 2018) and at least 12.5% of its voting shares are held by shareholders that individually control or own less than 10% of such shares, must have at least one independent director and a Directors’ Committee.
Under the NYSE corporate governance rules, all members of the Audit Committee must be independent. The Audit Committee of a U.S. company must perform the functions detailed in, and otherwise comply with the requirements of NYSE Listed Company Manual Rules 303A.06 and 303A.07. As of July 31, 2005, non-U.S. companies have been required to comply with Rule 303A.06, but not with Rule 303A.07. We currently comply with the independence and the functional requirement of Rule 303A.06. Since our incorporation on March 1, 2016, we have complied with the independence and the functional requirement of Rule 303A.06.
Pursuant to our bylaws, all members of the Directors’ Committee must satisfy the requirements of independence, as stipulated by the NYSE. The Directors’ Committee is composed of three members of the Board and complies with Article 50 bis of Law No.18,046, as well as with the criteria and requirements of independence prescribed by the Sarbanes-Oxley Act (“SOX”), the SEC and the NYSE. As of the date of this Report, the Directors’ Committee complies with the conditions of the Audit Committee as required by the SOX, the SEC and the NYSE corporate governance rules. As a result, we have a single Committee, the Directors’ Committee, which includes among its functions the duties performed by an Audit Committee.
Our Directors’ Committee performs the following functions:
· review of financial statements and the reports of the external auditors prior to their submission for shareholders’ approval;
· present proposals to the Board of Directors, which will make its own proposals to shareholders’ meetings, for the selection of external auditors and private rating agencies;
· review of information related to our transactions with related parties and reports the opinion of the Directors’ Committee to the Board of Directors;
· the examination of the compensation framework and plans for managers, executive officers and employees;
· the preparation of an Annual Management Report, including its main recommendations to shareholders;
· provide information to the Board of Directors about the convenience of recruiting external auditors to provide non-auditing services, when such services are not prohibited by law, depending on whether such services might affect the external auditors’ independence;
· oversee the work of external auditors;
· review and approval of the annual auditing plan by the external auditors;
· evaluate the qualifications, independence and quality of the auditing services;
· elaborate on policies regarding employment of former members of the external auditing firm;
· review and discuss problems or disagreements between management and external auditors regarding the auditing process;
· establish procedures for receiving and dealing with complaints regarding accounting, internal control and auditing matters;
· any other function mandated to the Committee by the bylaws, our Board of Directors or our shareholders.
Corporate Governance Guidelines
The NYSE’s corporate governance rules require U.S.-listed companies to adopt and disclose corporate governance guidelines. Chilean law provides for this practice through the disclosure of the procedures related to the General Resolution 385 and the Manual. We have also adopted the Code of Ethics, and our bylaws include provisions that govern the creation, composition, attributions, functions and compensation of the Directors’ Committee described above, which includes among its functions the duties performed by an Audit Committee.
D. Employees.
The following table sets forth the total number of our personnel, permanent and temporary employees, in Enel Chile and in our subsidiaries as of December 31, 2018, 2017, and 2016:
Company | | 2018 | | 2017 | | 2016 | |
Enel Generation | | 678 | | 753 | | 790 | |
Pehuenche | | 2 | | 2 | | 2 | |
Enel Chile(1) | | 451 | | 431 | | 336 | |
Enel Distribution (2) | | 681 | | 669 | | 688 | |
Servicios Informáticos e Inmobiliarios Ltda. | | 0 | | 0 | | 103 | |
GasAtacama(3) | | 87 | | 93 | | 91 | |
EGP Chile (4) | | 163 | | 0 | | 0 | |
Total Personnel (5) | | 2,062 | | 1,948 | | 2,010 | |
(1) Includes Servicios Informáticos e Inmobiliarios Ltda., a former subsidiary that merge into us on September 1, 2017.
(2) Includes Luz Andes S.A. and Empresa Eléctrica de Colina S.A.
(3) Includes GasAtacama Argentina S.A.
(4) We have consolidated EGP Chile and its subsidiaries since April 2, 2018.
(5) The total number of temporary employees was not significant.
All Chilean employees who are dismissed for reasons other than misconduct are entitled by law to severance payment. According to Chilean law, employees holding contracts of indefinite duration are entitled to a payment of one-month’s salary for each year (or a six-month portion thereof) worked, subject to a limit of a total payment of a maximum of 11 months’ pay for employees hired after August 14, 1981. Severance payments to employees hired prior to that date consist of one-month’s salary for each full year worked, not subject to any maximum limitation. Under our collective bargaining agreements, we are obligated to make severance payments to all covered employees in cases of voluntary resignation or death in specified amounts that increase according to seniority and may exceed the amounts required under Chilean law.
We have the following bargaining agreements:
|
| In Force |
|
Company |
| From |
| To |
|
Enel Chile - Collective Bargaining Agreement 1 (1) | | July 2015 | | July 2019 | |
Enel Chile - Collective Bargaining Agreement 2 (1) | | January 2016 | | December 2019 | |
Enel Chile - Collective Bargaining Agreement 3 (2) | | January 2016 | | December 2019 | |
Enel Generation - Collective Bargaining Agreement 1 | | January 2018 | | June 2020 | |
Enel Generation - Collective Bargaining Agreement 2 | | January 2018 | | June 2020 | |
Enel Generation - Collective Bargaining Agreement 3 | | January 2018 | | December 2020 | |
Enel Generation - Collective Bargaining Agreement 4 | | July 2015 | | June 2019 | |
Enel Generation - Collective Bargaining Agreement 5 | | January 2016 | | December 2019 | |
Enel Generation - Collective Bargaining Agreement 6 | | July 2016 | | June 2020 | |
Enel Distribution - Collective Bargaining Agreement 1 | | January 2017 | | December 2020 | |
Enel Distribution - Collective Bargaining Agreement 2 | | January 2017 | | December 2020 | |
Enel Distribution - Collective Bargaining Agreement 3 | | January 2017 | | December 2020 | |
Enel Green Power - Collective Bargaining Agreement 1 | | October 2017 | | September 2020 | |
Empresa Eléctrica de Colina | | November 2015 | | October 2019 | |
Empresa Eléctrica Panguipulli S.A. | | January 2018 | | December 2020 | |
GasAtacama ChileGiulio Fazio
| GasAtacama Chile, a generation company located in northern Chile, which contains a four-unit combined-cycle 780 MW power plant and a natural gas pipeline which connects to Argentina. In April 2014, Enel Generación Chile acquired a 50% ownership interest in Inversiones GasAtacama Holding Ltda. (“GasAtacama Holding”). As a result, Enel Generación Chile owned a controlling equity interest in GasAtacama Holding, and GasAtacama Holding merged into GasAtacama Chile, the surviving company, on November 1,
| Director | | 48 | | 2016 through Celta. Since May 1, 2014, we have fully consolidated GasAtacama Chile in our consolidated financial statements. During the second half of 2016, we carried out a corporate simplification process, which involved several mergers, including the merger of Celta into GasAtacama Chile, the legal surviving company. As of December 31, 2016, GasAtacama Chile also owns the following power plants: Tarapacá, San Isidro, Pangue, Canela I and II and Ojos de Agua, which have an aggregate capacity of 1,115 MW as of December 31, 2016.
We beneficially own 61.0% of GasAtacama Chile, with 58.4% from our indirect equity interest through Enel Generación Chile, which owns 97.4% of GasAtacama Chile, and the remaining 2.6% from our direct ownership.
Pehuenche
Pehuenche, a generation company connected to the SIC, owns three hydroelectric facilities located in the hydrological basin of the Maule River, south of Santiago, with a total installed capacity of 699 MW. The 570 MW Pehuenche plant began operations in 1991, the 89 MW Curillinque plant began operations in 1993, and the 40 MW Loma Alta plant began operations in 1997. Enel Generación Chile holds 92.7% of the economic interest in Pehuenche. We beneficially own a 55.6% economic interest in Pehuenche, through Enel Generación Chile.
Distribution Business
Enel Distribución Chile
Enel Distribución Chile is one of the largest electricity distribution businesses in Chile as measured by the number of regulated customers, distribution assets and energy sales. Enel Distribución Chile operates in a concession area of 2,105 square kilometers in the Santiago metropolitan area, serving approximately 1.8 million customers. Our economic interest in Enel Distribución Chile is 99.1%.
Selected Related and Jointly-Controlled Companies
HidroAysén
HidroAysén was incorporated in March 2007 to develop and exploit a hydroelectric project in the Aysén Region in southern Chile. Enel Generación Chile owns 51.0% of HidroAysén, and Colbún, an unaffiliated entity, owns the remaining 49.0%. In the fourth quarter of 2014, we recorded an impairment loss of Ch$ 69,067 million, related to the uncertainty of recovering the investment carried out in HidroAysén.
Transquillota
Transquillota was formed by San Isidro and Colbún for the joint development of a 220 kV transmission line to dispatch the energy produced and to connect both the San Isidro generation plant (currently owned by GasAtacama Chile) and Nehuenco generation plant (a subsidiary of Colbún) to the SIC. The 220 kV transmission line is 8 kilometers long. The property is equally divided between Enel Generación Chile and Nehuenco. Enel Generación Chile’s economic interest in Transquillota is 48.7% and our economic interest in Transquillota is 30.5%.
Non-Electricity Businesses
SIEI
SIEI is a company that provides consulting, management, administration and contract operations related to information systems, technological information, telecommunications, and control systems in South America, as well as real estate projects in Chile. SIEI was formed in December 2014, as a result of the merger of ICT Servicios Informáticos Ltda. with Inmobiliaria Manso de Velasco Ltda.
For additional information on all of our subsidiaries and jointly-controlled companies, please refer to Appendix 1 of our consolidated financial statements.
D.
| Property, Plants and Equipment.
|
|
Our property, plant and equipment are concentrated on electricity generation and distribution assets in Chile.
Property, Plant and Equipment of Generating Companies
We conduct our generation businesses through Enel GeneracióFernán Chile, which owns 28 generation power plants in Chile.
A substantial portion of our generating subsidiaries’ cash flow and net income is derived from the sale of electricity produced by our electricity generation facilities. Significant damage to one or more of our main electricity generation facilities or interruption in the production of electricity, whether as a result of an earthquake, flood, volcanic activity, severe and extended droughts or any other such natural disasters, could have a material adverse effect on our operations.
The following table identifies the power plants that we own, all in Chile, at the end of each year, by company and their basic characteristics:
| | | | | | Installed Capacity(1) As of December 31, | | Company | | Power Plant Name | | Power Plant Type(2) | | 2016 | | | 2015 | | | 2014 | | | | | | | | (in MW) | | Enel Generación Chile | | Rapel | | Reservoir | | | 377 | | | | 377 | | | | 377 | | | | Cipreses | | Reservoir | | | 106 | | | | 106 | | | | 106 | | | | El Toro | | Reservoir | | | 450 | | | | 450 | | | | 450 | | | | Los Molles | | Pass-through | | | 18 | | | | 18 | | | | 18 | | | | Sauzal | | Pass-through | | | 77 | | | | 77 | | | | 77 | | | | Sauzalito | | Pass-through | | | 12 | | | | 12 | | | | 12 | | | | Isla | | Pass-through | | | 70 | | | | 70 | | | | 70 | | | | Antuco | | Pass-through | | | 320 | | | | 320 | | | | 320 | | | | Abanico | | Pass-through | | | 136 | | | | 136 | | | | 136 | | | | Ralco | | Reservoir | | | 690 | | | | 690 | | | | 690 | | | | Palmucho | | Pass-through | | | 34 | | | | 34 | | | | 34 | | | | Total hydroelectric | | | | | 2,290 | | | | 2,290 | | | | 2,290 | | | | Bocamina | | Steam Turbine/Coal | | | 478 | | | | 478 | | | | 478 | | | | Diego de Almagro | | Gas Turbine/ Diesel Oil | | | 24 | | | | 24 | | | | 24 | | | | Huasco | | Gas Turbine | | | 64 | | | | 64 | | | | 64 | | | | Taltal | | Gas Turbine/Natural Gas+Diesel Oil | | | 245 | | | | 245 | | | | 245 | | | | San Isidro 2 | | Combined Cycle /Natural Gas+Diesel Oil | | | 399 | | | | 399 | | | | 399 | | | | Quintero | | Gas Turbine/Natural Gas | | | 257 | | | | 257 | | | | 257 | | | | Total thermal | | | | | 1,467 | | | | 1,467 | | | | 1,467 | | | | Total | | | | | 3,757 | | | | 3,757 | | | | 3,757 | | Pehuenche | | Pehuenche | | Reservoir | | | 570 | | | | 570 | | | | 570 | | | | Curillinque | | Pass-through | | | 89 | | | | 89 | | | | 89 | | | | Loma Alta | | Pass-through | | | 40 | | | | 40 | | | | 40 | | | | Total | | | | | 699 | | | | 699 | | | | 699 | | Celta(3) | | Tarapacá | | Steam Turbine/Coal | | — | | | | 158 | | | | 158 | | | | Tarapacá | | Gas Turbine/Diesel Oil | | — | | | | 24 | | | | 24 | | | | San Isidro | | Combined Cycle /Natural Gas+Diesel Oil | | — | | | | 379 | | | | 379 | | | | Pangue | | Reservoir | | — | | | | 467 | | | | 467 | | | | Canela I | | Wind Farm | | — | | | | 18 | | | | 18 | | | | Canela II | | Wind Farm | | — | | | | 60 | | | | 60 | | | | Ojos de Agua | | Pass-through | | — | | | | 9 | | | | 9 | | | | Total | | | | — | | | | 1,115 | | | | 1,115 | | GasAtacama Chile(4) | | Atacama | | Combined Cycle /Natural Gas+Diesel Oil | | | 781 | | | | 781 | | | | 781 | | | | Tarapacá | | Steam Turbine/Coal | | | 158 | | | — | | | — | | | | Tarapacá | | Gas Turbine/Diesel Oil | | | 24 | | | — | | | — | | | | San Isidro | | Combined Cycle /Natural Gas+Diesel Oil | | | 379 | | | — | | | — | | | | Pangue | | Reservoir | | | 467 | | | — | | | — | | | | Canela I | | Wind Farm | | | 18 | | | — | | | — | | | | Canela II | | Wind Farm | | | 60 | | | — | | | — | | | | Ojos de Agua | | Pass-through | | | 9 | | | — | | | — | | | | Total | | | | | 1,896 | | | | 781 | | | | 781 | |
Total capacity
| | | | | | | 6,351
| | | | 6,351
| | | | 6,351Gazmuri P.
| | Director | | 75 | | 2016 |
|
Juan Gerardo Jofré M. | (1)
| Director | The installed capacity corresponds to the gross installed capacity, without considering the MW that each power plant consumes for its own operation.
|
(2)
| “Reservoir” and “pass-through” refer to hydroelectric plants that use the force of a dam or a river, respectively, to move the turbines which generate electricity. “Steam” refers to thermal power plants fueled with natural gas, coal, diesel or fuel oil to produce steam that moves the turbines. “Gas Turbine” or “Open Cycle” refer to thermal power that uses either diesel or natural gas to produce gas that moves the turbines. “Combined-Cycle” refers to a thermal power plant fueled with natural gas, diesel oil, or fuel oil to generate gas that first moves a turbine and then recovers the gas from that process to generate steam to move a second turbine.
|
(3)
| Celta merged into GasAtacama Chile, the surviving company, on November 1, 2016.
|
(4)
| Since May 1, 2014, GasAtacama Chile has been fully consolidated following Enel Generación Chile’s purchase of an additional 50% interest in GasAtacama Chile. Previously, it was accounted for under the equity method and its installed capacity was not included in a portion of 2014.
|
Property, Plant and Equipment of Distribution Companies
We also have significant interests or investments in electricity distribution. The description for our distribution company is included in this “Item 4. Information on the Company.” The table below describes our main equipment used for our distribution business, such as transmission lines, substations, distribution networks and transformers.
We are insured against damage to substations, transformers that are within the substations, the distribution network that is less one kilometer from the substations and administrative buildings. Risks covered include damages caused by fires, explosions, earthquakes, floods, lightning, damage to machinery and other such events. Insurance policies include liability clauses, which protect our companies from claims made by third parties.
TABLE OF DISTRIBUTION FACILITIES
General Characteristics
| | | | | | | | Transmission Lines(1) As of December 31, | | | | Location | | Concession Area | | | 2016 | | | 2015 | | | 2014 | | | | | | (in km2) | | | (in kilometers) | | Enel Distribución Chile | | Chile | | | 2,105 | | | | 361 | | | | 361 | | | | 355 | |
| (1)
| The transmission lines consist of circuits with voltages in the 27-220 kV range.
|
Power and Interconnection Substations and Transformers(1)
| | As of December 31, 2016 | | | As of December 31, 2015 | | | As of December 31, 2014 | | | | Number of Substations | | | Number of Transformers | | | Capacity (MVA) | | | Number of Substations | | | Number of Transformers | | | Capacity (MVA) | | | Number of Substations | | | Number of Transformers | | | Capacity (MVA) | | Enel Distribución Chile(2) | | | 56 | | | | 204 | | | | 8,281 | | | | 56 | | | | 201 | | | | 8,146 | | | | 55 | | | | 195 | | | | 7,673 | |
(1)Voltage of these transformers is in the range of 500 kV (high voltage) and 1 kV (medium voltage).
(2)
| Figures related to the number of substations and the number of transformers could differ from those previously reported, since we are now including substations if the land is owned by the company and has transformer or protective equipment.
|
Distribution Network - Medium and Low Voltage Lines(1)
| | As of December 31, 2016 | | | As of December 31, 2015 | | | As of December 31, 2014 | | | | Medium Voltage | | | Low Voltage | | | Medium Voltage | | | Low Voltage | | | Medium Voltage | | | Low Voltage | | | | | | | | | | | | (in Kilometers) | | | | | | | | | | Enel Distribución Chile | | | 5,251 | | | | 11,431 | | | | 5215 | | | | 11,208 | | | | 5,152 | | | | 11,016 | |
(1)
| Medium voltage lines: 1 kV - 34.5 kV; low voltage lines: 380-110 V.
|
Transformers for Distribution(1)
| | As of December 31, 2016 | | | As of December 31, 2015 | | | As of December 31, 2014 | | | | Number of Transformers | | | Capacity | | | Number of Transformers | | | Capacity | | | Number of Transformers | | | Capacity | | | | | | | | (in MVA) | | | | | | | (in MVA) | | | | | | | (in MVA) | | Enel Distribución Chile(2) | | | 21,876 | | | | 4,505 | | | | 22,177 | | | | 4,357 | | | | 22,332 | | | | 4,270 | |
(1)
| Voltage of these transformers is in the range of 34.5 kV (medium voltage) and 1 kV (low voltage).
|
(2)
| Figures related to the number and capacity of transformers could differ from previously reported since we are now not including transformers owned by customers.
|
Insurance
Both our electricity generation and distribution facilities are insured against damage due to natural disasters such as earthquakes, fires, floods, other acts of god (but not for droughts, which are not considered force majeure risks, and are not covered by insurance) and from damage due to third-party actions, based on the appraised value of the facilities as determined from time to time by an independent appraiser. Based on geological, hydrological and engineering studies, management believes that the risk of the previously described events resulting in a material adverse effect on our facilities is remote. Claims under our subsidiaries’ insurance policies are subject to customary deductibles and other conditions. We also maintain business interruption insurance providing coverage for the failure of any of our facilities for a period of up to 24 months, including the deductible period. The insurance coverage taken for our property is approved by each company’s management, taking into account the quality of the insurance companies and the needs, conditions and risk evaluations of each facility, and is based on general corporate guidelines. All insurance policies are purchased from reputable international insurers. We continuously monitor and meet with the insurance companies in order to obtain what we believe is the most commercially reasonable insurance coverage.
Project Investments
The total investment for each project described below was translated into Chilean pesos at the exchange rate of Ch$ 669.47 per U.S. dollar, the U.S. dollar Observed Exchange Rate as of December 31, 2016. Budgeted amounts include connecting lines that could be owned by third parties and paid as tolls, unless otherwise indicated.
Projects under Construction
Los Cóndores Hydroelectric Project
The Los Cóndores project is located in the Maule region, in the San Clemente area. It consists of a 150 MW run-of-the river hydroelectric power plant, with two Pelton water turbine vertical units, which will use water from the Maule Lagoon reservoir through a 12 km penstock. The power plant will be connected to the SIC at the Ancoa substation (220 kV) through an 87 km transmission line and will consist of two power units.
The basic engineering and the Environmental Impact Statement (“DIA” in its Spanish acronym) of the Los Cóndores optimized project were concluded in early 2011. The Environmental Qualifications Resolution (“RCA” in its Spanish acronym) for the power plant was obtained in November 2011 and the RCA of the transmission line project was granted in May 2012. In November 2014, the General Water Authority approved the waterworks permit.
By the end of 2016, we entered into easement agreements for 93.2% of the total structures required for connecting the project to the SIC. In addition, the process for obtaining the definitive concession for electricity, which relates to the authorization of a legal easement by the competent authority for access to carry out works of generation, transmission or distribution of energy, is progressing in case it needs to be applied in situations or locations where a voluntary easement agreement has not been reached.
The main developments in 2016 were:
In March 2016, the raise borer machine started the first stage of excavation on vertical shaft.
In May 2016, we started the excavation of the headrace tunnel downstream from the intake area.
| •
| In June 2016, we received the distributor and lining of Unit 1.
|
In July 2016, we started the construction of Unit 1, with the placement of the lining and distributor.
In September 2016, we started the construction of the structures for the transmission line.
In November 2016, the tunnel boring machine finished the excavation of Lo Aguirre gallery and we started the excavation of the headrace tunnel downstream from Lo Aguirre gallery
Since November 2016, the overhead construction crane has been in operation.
Construction is expected to be completed by the end of 2018. This project is being financed primarily with internally generated funds. The estimated total investment is Ch$ 407,928 million, of which Ch$ 172,479 million was accrued as of December 31, 2016.
Bocamina Optimization Project
Bocamina is a coal-fired power plant, located in Coronel in the Bío Bío region in southern Chile composed of two units: 128 MW (Bocamina I) and 350 MW (Bocamina II). Bocamina II started its commercial operations in July 2013 but suspended operations in December 2013 due to environmental injunctions. We submitted several documents, studies and mitigation plans to the authorities, and in December 2013, we presented a new EIA regarding the technical optimization of the plant, which was approved on March 16, 2015. On April 2, 2015, the Chilean Court approved the new RCA and after complying with the conditions established in the new RCA, the plant resumed operations in July 2015.
The scope of work of the optimization plan is as follows: (i) installation of Johnson filters in both units; (ii) installation of domes for the north and south coal fields; (iii) improvement of the ash dump in operation; (iv) studies of a new ash dump, and (v) construction of a water treatment plant.
The main developments in 2016 were:
In January 2016, the installation of the Johnson filter for Bocamina II was completed.
In April 2016, the installation of the Johnson filter for Bocamina I was completed.
In June 2016, completion of the improvements to zone 3 of the current dump and in July 2016 to zone 2 of the current dump.
In December 2016, the construction of the dome for the north coal field was completed.
On January 27, 2017, the Municipal Works Department of Coronel granted the construction permit for the dome for the south coal field.
Construction is expected to be completed in 2018. This project is being financed with internally generated funds. The estimated total investment is Ch$ 62,644 million, of which Ch$ 42,483 million was accrued as of December 31, 2016.
Tarapacá Environmental Retro-fitting Project
Tarapacá is a 158 MW coal-fired power plant located in the Tarapacá region in northern Chile, with an annual average generation of 1,100 GWh supplied to the SING.
Decree 13/2011 regulates the emissions of thermal power plants, and requires the reduction of SO2 and NOx emissions effective as of June 23, 2016. In order to comply with this decree, we are improving Tarapacá through the installation of desulfurizers and implementation of measures to reduce emissions of NOx.
The project is in the final stage of commissioning, pending the termination of some tests since the power plant was limited to generating no more than 70 MW of power due to the unavailability of water supply pumps.
The scope of work of the project is as follows: (i) execution of preliminary works and activities (elimination of the electrostatic precipitator, demolition of its foundations, and demolition and construction of a new electromechanical workshop); (ii) construction and commissioning of desulfurizers; (iii) change and installation of low NOx burners, improvement in the coal mills and installation of an Over-Fire Air system, a system that also will reduce NOx emissions; (iv) construction and start-up of lime storage silos; (v)
construction and commissioning of a seawater desalination system, and (vi) modification of the ash discharge site to improve the handling and disposal of waste resulting from the desulfurization process.
The main developments in 2016 were:
In June 2016, the desalination plant started operations and the ash handling system and the electrical system were delivered for the operation of the power plant.
In August 2016, the semi-dry desulfurizers and its auxiliaries were delivered for the operation of the power plant.
In November 2016, the performance test of the desalination plant was completed, with positive results.
In December 2016, the CDEC reported that the unit was commercially operable.
Commissioning is expected to be completed within the first half of 2017. This project is being financed with internally generated funds. The estimated total investment is Ch$ 68,350 million, of which Ch$ 65,718 million was accrued as of December 31, 2016.
Projects Under Development
We continuously analyze different growth opportunities in Chile. We study and assess our project portfolio, focusing recently on constructing smaller, less environmentally invasive power plants. These plants are constructed faster, allow greater flexibility to activate or deactivate according to system needs, and are generally more acceptable to area residents. An additional focus will be placed on the development of renewable energy technologies. In the thermal generation business, we seek new opportunities, either by building new greenfield projects or by modernizing existing brownfield assets and improving (operationally and / or environmentally) in the performance of such assets. The expected start-up for each project is assessed and is defined based on the commercial opportunities and our financing capacity to fund these projects. The most important projects under development are as follows:
Generation Business
Vallecito Hydroelectric Project
The Vallecito hydroelectric project is located in the Maule region, in the upper part of the Maule river basin. It consists of a run-of-the-river hydroelectric plant with an installed capacity of 70 MW. The energy produced is expected to be delivered to the SIC through the transmission line of the Los Cóndores hydroelectric plant, which is currently under construction (see above).
The Vallecito project has been developed on the basis of a sustainable development plan, which consists of defining activities to be developed in the technical-economic, environmental and social scope of the project. We have established lines of action by locality with nine communities of the Pehuenche Route in order to incorporate their aspirations, capacities and projects.
During 2016, the technical feasibility studies of the project were carried out and a series of field studies campaigns (drilling, paving, geophysical prospecting, etc.) were culminated. We also started the environmental baseline campaigns, as well as the implementation of a sustainable development plan. The next steps are to complete the technical designs and the environmental baseline studies, prepare the EIA and initiate collaborative processes with the communities that are directly related to the project. The Vallecito project is part of our renewable energy projects.
Based on the current market conditions, we expect construction to start during 2020 and commissioning is expected in 2023. This project is being financed primarily with internally generated funds. The estimated total investment is Ch$ 129,542 million, of which Ch$ 6,869 million was accrued as of December 31, 2016.
Quintero Combined-Cycle Project
The Quintero project is located in the Valparaíso region and consists of an energy efficiency project that takes advantage of the heat of the gases emitted by the existing turbines to produce steam. This is accomplished through the installation of a steam turbine and a generator, which allows converting the existing open cycle plant into a combined-cycle gas plant. Currently, the Quintero plant has two gas turbines with a total capacity of 257 MW. With the addition of a steam turbine unit of 130 MW capacity, the Quintero plant would reach a total capacity of 387 MW. The energy produced would be delivered to the SIC through the existing Quintero-San Luis line, a simple 220 kV circuit built to evacuate the energy of the combined-cycle power plant.
During 2016, technical feasibility studies of the project and the environmental baseline campaigns were carried out and the sustainable development plan was implemented.
We expect construction to start during 2019 and commissioning is expected in 2022, based on current market conditions. This project is being financed primarily with internally generated funds. The estimated total investment is Ch$ 147,685 million, of which Ch$ 2,474 million was accrued as of December 31, 2016.
Ttanti Combined-Cycle Project
The Ttanti project is located in Antofagasta region, on land adjacent to the existing Atacama power plant that is located in the industrial zone of the city of Mejillones. The project consists of the construction of a natural gas combined-cycle power plant with an installed capacity of 1,290 MW (430 MW for each of three units) and would be able to use diesel oil as a backup in case of scarcity of natural gas for one unit with 430 MW of capacity. The power plant would be connected to the SING through a 0.5 km 220 kV double circuit transmission line to the Atacama substation, which would be expanded for this purpose.
Currently, the project is in the environment assessment phase. On December 22, 2015, we registered Addendum 1, which responded to the inquiries carried out by the SEA. On February 4, 2016, the SEA issued ICSARA 2, which contains new inquiries and clarification requests for the project. We submitted our response on March 14, 2017.
We expect to receive the RCA during the second quarter of 2017. If the RCA is favorable and we have successful participation in energy auctions, we expect construction to start during 2021 and completion in 2024. The estimated total investment of the first unit is Ch$ 234,984 million, of which Ch$ 1,185 million was accrued as of December 31, 2016.
Taltal Combined-Cycle Project
The Taltal project consists of the construction of a steam turbine for converting the existing Taltal gas-fired open cycle plant to a combined-cycle plant by adding a turbine in the vapor phase, which would use the steam generated by the gas turbines’ heat emissions to produce energy, which will considerably improve its efficiency. The Taltal power plant is located in the Antofagasta region. Currently, the existing Taltal power plant has two gas turbines of 120 MW each. The extra power to be added by the steam turbine would be 130 MW and therefore, the Taltal power plant would achieve a total capacity of 370 MW. The energy produced will be supplied to the SIC through the existing 220 kV double circuit Diego de Almagro – Paposo transmission line.
In December 2013, a DIA was submitted to the SEA for approval, in order to optimize the project. The main modification relates to a change in the cooling system, which was originally designed as a wet system (using sea water) and is being modified to a dry cooling system (using air condensers). During the second quarter of 2015, Addendum 2 was submitted which responded to the second round of observations formulated by the SEA. During the third quarter of 2015, the SEA formulated its third round of observations and we responded at the end of 2016. We postponed the response so as to improve our dialog and work in partnership with the local community (Paposo). After the submission of additional requirements requested by the authority, the DIA was approved on January 19, 2017.
Based on current market conditions, we expect construction to start during 2020 and commissioning for 2022. This project is being financed primarily with internally generated funds. The estimated total investment is Ch$ 132,555 million, of which Ch$ 2,942 million was accrued as of December 31, 2016.
Neltume Hydroelectric Project
The Neltume project is expected to be located in Los Ríos region, on the upper part of the Valdivia River basin. The future of this project is uncertain. If completed, it would consist of a 490 MW installed capacity run-of-the-river hydro power plant. It would be connected to the SIC through a 42 kilometer 220 kV transmission line from Neltume to Pullinque.
In the fourth quarter of 2016, we recorded an impairment loss of Ch$ 20.5 billion related to the Neltume project due to the fact that under current electricity market conditions, the project’s profitability is less than the capitalized investment. In addition, considering our new focus on investing in more manageable projects with shorter construction periods and shorter paybacks, the project will need to be redesigned in order to be economically and technically feasible.
Our indigenous community inquiry process, which was completed at the end of 2015, revealed that there were some significant social and environmental controversies in the land associated with the Neltume project. Therefore, the original 2010 EIA was likely to
be rejected given the official announcements of various public services issued in late 2015 as well as several meetings with the authorities and the concerns of residents living near Lake Neltume. We decided to study new design alternatives in order to redesign the discharge to the lake. As a consequence of this decision, we recorded a write-off of Ch$ 2.7 billion in the fourth quarter of fiscal year 2015, associated with some assets related to the 2010 EIA, which was withdrawn on December 29, 2015, and other studies directly related to the original design.
The project does not have any defined dates for the beginning of construction and commercial start-up. To date, Neltume has been financed primarily with internally generated funds. The accrued investment as of December 31, 2016 was Ch$ 20,356 million, including the impairment loss and write-off mentioned above.
Piruquina Hydroelectric Project
The Piruquina hydroelectric project is expected to be located in Los Lagos region, on Chiloé Island, and would use water from the Carihueico River. The future of this project is uncertain. If completed, it would consist of an 8 MW installed capacity mini hydroelectric power plant and would be connected to the SIC at the Pid-Pid substation, through a 6 kilometer 23 kV transmission line.
This project has all the engineering studies and principal permits required, as well as the favorable RCA issued on November 10, 2009 and the Hydraulic Work Permit granted on August 6, 2014 that approves and authorizes the construction of hydraulic works for the power plant.
However, we have placed Piruquina on hold mainly due to the drop in energy prices in the market. This project has been financed primarily with internally generated funds. The accrued investment as of December 31, 2016 was Ch$ 2,823 million.
Distribution Business
Enel Distribución Chile
As of December 31, 2016, Enel Distribución Chile had invested a total of Ch$ 81.1 billion (excluding intercompany purchases) in capital expenditures.
We carried out two reinforcement projects for our 110 kV subtransmission lines, Tap Altamirano (Ch$ 232 million) and Espejo - Ochagavía, section Espejo - Tap Cisterna (Ch$ 957 million).
For the medium voltage network, four new feeders were built: 12 kV Monckeberg for La Reina Substation (Ch$ 214 million), 12 kV Talladores for the Macul Substation (Ch$ 282 million), 12 kV Angamos for the Cisterna Substation (Ch$ 658 million) and 12 kV Neruda for the Bicentenario Substation (Ch$ 625 million).
The Quality of Service project (Ch$ 7.0 billion) seeks to improve the quality indices of Enel Distribución Chile and achieve efficiencies in technical processes, through work focused on improving high, medium and low voltage networks. Among the main focuses are the installation of telecontrolled equipment and the replacement of old networks.
With regard to the automation of the medium voltage network (Telecontrol Plan, Ch$ 6.4 billion), 500 new pieces of equipment were added during 2016, along with the necessary network adjustments. This allowed us to increase from 700 to 1,200 the number of operating equipment telecontrolled from the Network Operation Center. We also installed 50 thousand smart meters in Santiago (Ch$ 4.7 billion), which will measure customers’ consumption in a remote and automatic way.
Regarding the large volume customer supply, the following feeders entered into operation: 23 kV Cementos BSA (Ch$ 522 million) and 23 kV Luna (Ch$ 54 million). The following feeders requested by our customers are currently under construction: CCU (Ch$ 56 million) and Anya (Ch$ 218 million), with a requested capacity of 17 MVA; two for the supply of Mall Plaza Los Dominicos (Ch$ 41 million), with a requested capacity of 26 MVA; and Mall Independencia (Ch$ 81 million), with a requested capacity of 12 MVA to 12 kV.
In addition, we carried out a large electric grid reallocation (Ch$ 5.6 billion) in the Aconcagua highway, located north of Santiago, by reallocating 15 km of electric networks.
We also connected to the grid more than 46,000 customers, including retail, real estate and large customers (Ch$ 22 billion).
Major Encumbrances
As of December 31, 2016, we have full ownership of our assets and they are not subject to material encumbrances.
Climate Change
In recent years, Chile and the region have seen an increase of developments related to NCRE and strategies to combat climate change. This has required both the public and private sectors to adopt strategies in order to comply with the new environmental requirements, as evidenced by legal obligations at the local level, commitments assumed by countries at the international level, and the demanding requirements of the international markets.
NCRE plants provide energy with minimal environmental impact and without CO2 emissions. They are therefore considered technological options that strengthen sustainable energy development as they supplement the production of traditional generators.
Enel, our ultimate controlling shareholder, announced in October 2015 that it will no longer build coal power plants because it considers the technology to be counterproductive to its goal of being carbon neutral by 2050. Closures of existing coal power plants are scheduled at the end of their life cycles. The lost capacity will be substituted with more environmentally friendly types of generation, focusing on NCRE. This announcement is aligned with the Energy Agenda that the Chilean government released in May 2014. Among its objectives are facilitating the incorporation of NCRE sources and promoting the efficient use of energy.
Our NCRE facilities are: (i) Canela I wind farm with 18 MW of installed capacity and 11 self-generators, which has been in operation since 2007, (ii) Canela II wind farm with 60 MW of installed capacity and 40 self-generators, which has been in operation since 2009, and (iii) Ojos de Agua pass-through mini-hydro power plant with 9 MW of installed capacity, which has been in operation since 2008. In addition, we are constructing Los Cóndores project (see above), a run-of-the river hydroelectric power plant, which will displace thermal units in the SIC, and we are improving the efficiency of some of our power plants.
Item 4A.Unresolved Staff Comments
None.
Item 5.Operating and Financial Review and Prospects
A. Operating Results.
General
The following discussion should be read in conjunction with our audited consolidated financial statements and the notes thereto, included in Item 18 in this Report, and “Selected Financial Data,” included in Item 3 herein. Our audited consolidated financial statements as of December 31, 2016 and 2015 and for each of the years in the three-year period ended December 31, 2016, have been prepared in accordance with IFRS, as issued by the IASB.
1.
| Discussion of Main Factors Affecting Operating Results and Financial Condition of the Company
|
We own and operate electricity generation and distribution companies in Chile. Our revenues, income and cash flows primarily come from the operations of our subsidiaries and associates in Chile.
Factors such as (i) hydrological conditions, (ii) fuel prices, (iii) regulatory developments, (iv) exceptional actions adopted by governmental authorities and (v) changes in economic conditions may materially affect our financial results. In addition, our results from operations and financial condition are affected by variations in the exchange rate between the Chilean peso and the U.S. dollar. We have certain critical accounting policies that affect our consolidated operating results. The impact of these factors on us, for the years covered by this Report, is discussed below.
A substantial part of our generation capacity depends on the prevailing hydrological conditions. Our installed capacity as of December 31, 2016, 2015 and 2014 was 6,351 MW, of which 54.6% was hydroelectric for the three years. See “Item 4. Information on the Company — D. Property, Plants and Equipment.”
Hydroelectric generation was 9,078 GWh, 11,842 GWh and 11,561 GWh in 2016, 2015 and 2014, respectively. Our 2016 hydroelectric generation was lower than 2015 mainly due to slightly drier hydrological conditions. In addition, some important reservoirs are still at low levels due to several years of drought since 2010, characterized by low rainfalls and a poor snowmelt.
Hydrological conditions in Chile can range from very wet, as a result of several years of abundant rainfall and lakes at their peak capacity, to extremely dry, as a consequence of prolonged droughts lasting for several years, the partial or material depletion of water reservoirs and the significant reduction of snow and ice in the mountains, which in turn leads to materially lower levels of hydrology as a consequence of lower melts. In between these two extremes, there is a wide range of possible hydrological conditions. For instance, a new year of drought has very different impacts on our business, depending on whether it follows several years of drought or a period of abundant rainfall. On the other hand, a good hydrological year has less marginal impact if it comes after several wet years than after a prolonged drought. In Chile, the months that typically have the most precipitation are May through August, and the months when snow and ice melts typically are October through March, providing water flow to our lakes, reservoirs and rivers, which supply our hydroelectric plants, most of them concentrated in southern Chile. For purposes of discussing the impact of hydrological conditions on our business, we generally categorize our hydrological conditions as dry, wet or normal, although there are many other possible scenarios. Extreme hydrological conditions materially affect our operating results and financial conditions. However, it is difficult to indicate the effects of hydrology on our operating income, without concurrently taking into account other factors, because our operating income can only be explained by looking at a combination of factors and not each one on a stand-alone basis.
Hydrological conditions affect electricity market prices, generation costs, spot prices, tariffs and the mix of hydroelectric, thermal and NCRE generation, which is constantly being defined by the CDEC to minimize the operating cost of the entire system. Pass-through hydroelectric generation is almost always the least expensive method to generate electricity and normally has a marginal cost close to zero. In the case of reservoirs, Chilean authorities assign a cost for the use of water, which may lead to hydroelectric generation not necessarily being the lowest marginal cost. This is the case of Laja Lake, which is used as a reference for the SIC. The cost of thermal generation does not depend on hydrological conditions but instead on international commodity prices for LNG, coal, diesel and fuel oil.
Spot prices primarily depend on hydrological conditions and commodity prices. Under most circumstances, abundant hydrological conditions lower spot prices while dry conditions normally increase prices. Spot market prices affect our results since we purchase electricity in the spot market in the case that we have deficits between our contracted energy sales and our generation, and we sell electricity in the spot market if we have electricity surpluses.
There are many other factors that may affect operating income, including the level of contracted sales, purchases/sales in the spot electricity market, commodity prices, energy demand and supply, technical and unforeseen problems that can affect the availability of our thermal plants, plant locations in relation to urban demand centers, and transmission system conditions, among others.
To illustrate the effects of hydrology on our operating results, the following table describes certain hydrological conditions, their expected effects on spot prices and generation, and the expected impact on our operating income, assuming that other factors remain unchanged. In all cases, hydrological conditions do not have an isolated effect but need to be evaluated in conjunction with other factors to better understand the impact on our operating results.
Hydrological
Conditions
| | Expected effects on spot prices
and generation
| | Expected impact on our operating results
| | | | | | Dry
| | Higher spot prices
| | Positive: if our generation is higher than contracted energy sales, energy surpluses are sold in the spot market at high prices.
Negative: if our generation is less than contracted sales, there is an energy deficit and we must purchase in the spot market at high prices.
| | Reduced hydro generation
| | Negative: less energy available to sell in the spot market.
| | Increased thermal generation
| | Positive: increases our energy available for sale and either reduces purchases in the spot market or increases sales in the spot market at high prices.
| | | | | | Wet
| | Lower spot prices
| | Positive: if our generation is less than energy contracted sales, the energy deficit is covered by purchases in the spot market at low prices.
Negative: if there are energy surpluses, they are sold in the spot market at low prices.
| | | | | | Increased hydroelectric generation
| | Positive: more energy available to sell in the spot market despite the low prices.
| | | | | | Reduced thermal generation
| | Negative: less energy available to sell in the spot market.
|
If factors other than those described above apply, the expected impact of hydrological conditions on operating results will be different than those shown above. For example, in a dry year with lower commodity prices, spot prices may decrease, or in a wet year if the demand grows, or generation plants are not available for technical or other reasons, the spot price may increase, altering the impact of hydrological conditions discussed in the table above.
In the last few years, hydrological conditions in Chile have been below the historical average.
Our electricity distribution business is conducted through Enel Distribución Chile. For the year ended December 31, 2016, electricity sales amounted to 15,924 GWh, an increase of 0.2% compared to 2015. For the year ended December 31, 2015, electricity sales totaled 15,893 GWh, increasing by 1.3% compared to 2014. Enel Distribución Chile operates in the Santiago metropolitan area, providing electricity to more than 1.8 million customers. Santiago is the country’s most densely populated area and has the highest concentration of industries, industrial parks and office facilities in the country. Enel Distribución Chile faces growing electricity demand, because of organic growth in demand, which requires it to continually invest in its facilities.
Distribution revenues are mainly derived from the resale of electricity purchased from generators. Revenues associated with distribution include the recovery of the cost of electricity purchased and the resulting revenues from the VAD, which is associated with the recovery of costs and the return on the investment with respect to the distribution assets, plus the physical energy losses permitted by the regulator. Other revenues derived from our distribution business consist of charges for new connections and the maintenance and rental of meters, among others.
Among the key factors that impact our financial results in the distribution business are regulations. This is especially true when the actions adopted by government authorities define or intervene with directly regulated customer tariffs, or affect the price at which distributors can buy their energy. Our ability to buy electricity relies highly on generation availability, and to regulation in a lesser degree. The cost of electricity purchased is passed on to end users through tariffs that are set for multi-year periods. Therefore, variations in the price at which a distribution company purchases electricity do not have an impact on our profitability. In the past, we focused on reducing physical losses, especially those due to illegally tapped energy, currently at a 5.3% level. We are working on improving our collectability indices and our efficiency.
c.
| Selective Regulatory Developments
|
The regulatory framework governing our businesses has a material effect on our operating results. In particular, regulators set (i) energy prices in the generation business, taking into consideration factors such as fuel costs, reservoir levels, exchange rates, future investments in installed capacity and demand growth, and (ii) distribution tariffs taking into account the costs of energy purchases paid by distribution companies (which distribution companies pass on to their customers) and the “Value Added from Distribution,” or VAD, all of which are intended to reflect investment and operating costs incurred by distribution and generation companies and to allow our companies to earn a regulated level of return on their investments and guarantee service quality and reliability. In addition, regulators set technical standards based on environmental, health and social considerations, among others. Our earnings are determined to a large degree by government regulators, mainly through the tariff setting process.
Enel Distribución Chile’s tariffs are under review, with results expected in May 2017. Once the review is completed and the tariffs are established, they will be in force for the 2016-2020 period and will be applied retroactively to November 2016. Such reviews seek to capture distribution efficiency and economies of scale based on economic growth.
For additional information relating to the regulatory framework, see “Item 4. Information on the Company — B. Business Overview — Electricity Industry Regulatory Framework.”
Macroeconomic conditions, such as changes in employment levels and inflation or deflation may have a significant effect on our operating results. Macroeconomic factors, such as the variation of the Chilean peso against the U.S. dollar may impact our operating results, as well as our assets and liabilities, depending on the amounts denominated in U.S. dollars. For example, a devaluation of the Chilean peso against the U.S. dollar increases the cost of capital expenditure plans. For additional information, see “Item 3. Key Information — D. Risk Factors — Foreign exchange risks may adversely affect our results and the U.S. dollar value of dividends payable to ADS holders” and “Item 3. Key Information — D. Risk Factors — Chilean economic fluctuations as well as certain economic interventionist measures by governmental authorities may affect our results of operations and financial condition as well as the value of our securities.”
Local Currency Exchange Rate
Variations in the parity of the U.S. dollar and the Chilean peso may have an impact on our operating results and overall financial position. The impact will depend on the level at which tariffs are pegged to the U.S. dollar, costs for purchases of energy and fuels in the international markets, costs or revenues from buying and selling in the spot market and U.S. dollar-denominated assets and liabilities.
The following table sets forth the closing and average Chilean pesos per U.S. dollar exchange rates for the years indicated:
| | Local Currency U.S. Dollar Exchange Rates | | | | 2016 | | | 2015 | | | 2014 | | | | Average | | | Year End | | | Average | | | Year End | | | Average | | | Year End | | Chilean pesos per U.S. dollar | | | 676.67 | | | | 669.47 | | | | 654.66 | | | | 710.16 | | | | 570.40 | | | | 606.75 | |
Source: Central Bank of Chile
e.
| Critical Accounting Policies
|
Critical accounting policies are defined as those that reflect significant judgments and uncertainties which would potentially result in materially different results under different assumptions and conditions. We believe that our most critical accounting policies with reference to the preparation of our consolidated financial statements under IFRS are those described below.
For further detail of the accounting policies and the methods used in the preparation of the consolidated financial statements, see Notes 2 and 3 of the Notes to our consolidated financial statements.
Impairment of Long-Lived Assets
During the year, and principally at year end, we evaluate whether there is any indication that an asset has been impaired. Should any such indication exist, we estimate the recoverable amount of that asset to determine, where appropriate, the amount of impairment. In the case of identifiable assets that do not generate cash flows independently, we estimate the recoverability of the cash generating unit to which the asset belongs, which is understood to be the smallest identifiable group of assets that generates independent cash inflows.
Notwithstanding the preceding paragraph, in the case of cash generating units to which goodwill or intangible assets with an indefinite useful life have been allocated, a recoverability analysis is performed routinely at each period end.
The recoverable amount is the greater of (i) the fair value less the cost needed to sell and (ii) the value in use, which is defined as the present value of the estimated future cash flows. In order to calculate the recoverable value of property, plant and equipment, goodwill and intangible assets that form part of a cash generating unit, we use value in use criteria in nearly all cases.
To estimate the value in use, we prepare future pre-tax cash flow projections based on the most recent budgets available. These budgets incorporate management’s best estimates of cash generating units, revenues and costs using sector projections, past experience and future expectations.
In general, these projections cover the next five years, with estimates of cash flows for future years based on applying reasonable growth rates, between 4.6% and 4.7%, and a unique growth rate applied for the entire forecasted period that is also in line with the average long-term growth rates for the electricity sector.
These cash flows are discounted at a given pre-tax rate in order to calculate their present value. This rate reflects the cost of capital of the business in Chile. The discount rate is calculated taking into account the current time value of money and the risk premiums generally used by market participants for the specific business activity.
The pre-tax nominal discount rates applied in 2016, 2015 and 2014 are as follows:
| | | | Year ended December 31, | | | | | | 2016 | | | 2015 | | | 2014 | | Country | | Currency | | Minimum | | | Maximum | | | Minimum | | | Maximum | | | Minimum | | | Maximum | | Chile | | Chilean peso | | | 8.1 | % | | | 12.2 | % | | | 8.1 | % | | | 12.7 | % | | | 7.9 | % | | | 13.0 | % |
If the recoverable amount is less than the net carrying amount of the cash generating unit, the corresponding impairment loss provision is recognized for the difference, and charged to “Reversal of impairment loss (impairment loss) recognized in profit or loss” in the consolidated statement of comprehensive income.
Impairment losses recognized for an asset other than goodwill in prior periods are reversed when its estimated recoverable amount changes, increasing the asset’s value with a credit to earnings, limited to the asset’s carrying amount if no adjustment had occurred. Impairment adjustments to goodwill are not reversible.
Litigation and Contingencies
We are currently involved in certain legal and tax proceedings. As discussed in Note 22 of the Notes to our consolidated financial statements as of December 31, 2016, we recognized provisions for legal and tax proceedings in an aggregate amount of Ch$ 10.0 billion as of December 31, 2016. This amount was based on consultations with our legal and tax advisors, who are carrying out our defense in these matters and an analysis of potential results, assuming a combination of litigation and settlement strategies.
Hedge Cash Revenues Directly Linked to the U.S. Dollar
We have established a policy to hedge the portion of our revenues directly linked to the U.S. dollar by obtaining financing in U.S. dollars. Exchange differences related to this debt, as they are cash flow hedge transactions, are charged net of taxes to an equity reserve account that forms part of Other Comprehensive Income and recorded as income during the period in which the hedged cash flows are realized. This term has been estimated at ten years.
This policy reflects a detailed analysis of our future U.S. dollar revenue streams. Such analysis may change in the future due to new electricity regulations limiting the amount of cash flows tied to the U.S. dollar.
Pension and Post-Employment Benefit Liabilities
We have various defined benefit plans for our employees. These plans pay benefits to employees at retirement and use formulas based on years of service and employee compensations. We also offer certain additional benefits for some retired employees in particular.
The liabilities shown for the pensions and post-employment benefits reflect our best estimate of the future cost of meeting our obligations under these plans. The accounting applied to these defined benefit plans involves actuarial calculations which contain key assumptions that include employee turnover, life expectancy, retirement age, discount rates, the future level of employee compensations and benefits, the claims rate under medical plans and future medical costs. These assumptions change as economic and market conditions vary and any change in any of these assumptions could have a material effect on the reported results from operations.
The effect of an increase of 100 basis points in the discount rate used to determine the present value of the post-employment defined benefits would decrease the liability by Ch$ 4.7 billion and Ch$ 4.1 billion as of December 31, 2016 and 2015, respectively, and the effect of a decrease of 100 basis points in the rate used to determine the present value of the post-employment defined benefits would increase the liability by Ch$ 5.2 billion and Ch$ 4.7 billion as of December 31, 2016 and 2015, respectively.
Recent Accounting Pronouncements
Please see Note 2.2 of the Notes to our consolidated financial statements for additional information regarding recent accounting pronouncements.
2.
| Analysis of Results of Operations for the Years Ended December 31, 2016 and 2015
|
In 2016, hydrological conditions were slightly drier than in 2015 and adversely affected our hydroelectric generation. However, our Bocamina and San Isidro thermal plants generated during the full year 2016, compared to 2015 during which they only operated partially, which helped to offset our lower hydroelectric generation. In 2015, Bocamina operated for only five months due to legal issues and San Isidro generated at half of its capacity due to the lack of water needed to produce energy as a combined-cycle power plant. In 2016, despite the drought that especially affected southern Chile, where most of our plants are located, the marginal cost of electricity decreased mainly as a consequence of: (i) higher thermal generation, and a greater reliance on coal, with its lower marginal cost in relation to LNG; (ii) low international prices, and (iii) the commissioning of new NCRE plants into the system. As result, we were able to cover our energy deficit in the spot market at lower prices, partially offsetting our higher physical purchases, and to reduce our fuel consumption cost.
In the distribution business, physical sales in 2016 remained at practically the same level as in 2015, however our operating income increased due to regular indexed cost adjustment in the tariff as well as from higher margins in the non-regulated businesses, mainly infrastructure projects and other business outside of our concession area.
The combination of these factors, among others, contributed to increase our operating income in 2016 compared to 2015. Please refer to “Consolidated Operating Income” below.
Consolidated Revenues
Generation Business
The following table sets forth the physical electricity sales of Enel Generación Chile and its subsidiaries and the corresponding changes for the years ended December 31, 2016 and 2015:
| | Years ended December 31, | | | | 2016 | | | 2015 | | | Change | | | Change | | | | (in GWh) | | | (in %) | | Enel Generación Chile and subsidiaries | | | 23,689 | | | | 23,558 | | | | 131 | | | | 0.6 | |
Distribution Business
The following table sets forth the physical electricity sales of Enel Distribución Chile and its subsidiaries and the corresponding changes for the years ended December 31, 2016 and 2015:
| | Years ended December 31, | | | | 2016 | | | 2015 | | | Change | | | Change | | | | (in GWh) | | | (in %) | | Enel Distribución Chile | | | 15,924 | | | | 15,893 | | | | 31 | | | | 0.2 | |
The following table sets forth our revenues by reportable segment for the years ended December 31, 2016 and 2015:
| | Years ended December 31, | | | | 2016 | | | 2015 | | | Change | | | Change | | | | (in millions of Ch$) | | | (in %) | | Generation Business | | | | | | | | | | | | | | | | | Enel Generación Chile and subsidiaries | | | 1,659,727 | | | | 1,543,812 | | | | 115,915 | | | | 7.5 | | Distribution Business | | | | | | | | | | | | | | | | | Enel Distribución Chile and subsidiaries | | | 1,315,761 | | | | 1,257,732 | | | | 58,029 | | | | 4.6 | | Non-electricity business and consolidation adjustments | | | (433,921 | ) | | | (402,515 | ) | | | (31,406 | ) | | | 7.8 | | Total Revenues | | | 2,541,567 | | | | 2,399,029 | | | | 142,538 | | | | 5.9 | |
Generation Business: Revenues
Revenues from Enel Generación Chile increased by Ch$ 115.9 billion, or 7.5%, in 2016 compared to 2015, primarily due to (i) Ch$ 53.1 billion as a result of a 3.6% increase in average energy sale prices, (ii) Ch$ 40.6 billion of higher natural gas sales, mainly related to exports to Argentina, (iii) Ch$ 15.9 billion increase in other income mainly related to better results in commodity hedges in Enel Generación Chile (Ch$ 9.0 billion) and insurance indemnification for damage to the Tarapacá power plant (Ch$ 6.5 billion), and (iv) Ch$ 8.2 billion from increased physical sales of 131 GWh, an increase of 0.6%, mostly to regulated customers.
Distribution Business: Revenues
Revenues from Enel Distribución Chile increased by Ch$ 58 billion, or 4.6%, in 2016 compared to 2015, primarily due to Ch$ 49.7 billion increase due to Ch$ 4.2/kWh (5.0%) higher tariff to regulated customers because of regular indexed cost adjustment in the tariff and Ch$ 6.6 billion related to services rendered to non-regulated customers, such as street lighting outside of the concession area. The number of customers, mainly residential, rose by 44,739 in 2016 compared to 2015, totaling 1,825,519, and was mainly new residential customers.
Consolidated Operating Costs
Total operating costs consist primarily of energy purchases from third parties, fuel purchases, tolls paid to transmission companies, depreciation, amortization and impairment losses, maintenance costs, employee salaries and administrative and selling expenses.
The following table sets forth our consolidated operating costs in Chilean pesos, and as a percentage of total consolidated operating costs, for the years ended December 31, 2016 and 2015:
| | Years ended December 31, | | | | 2016 | | | 2015 | | | | (in millions of Ch$) | | | (in %) | | | (in millions of Ch$) | | | (in %) | | Energy purchases | | | 891,747 | | | | 45.2 | | | | 860,203 | | | | 45.9 | | Fuel consumption | | | 295,149 | | | | 15.0 | | | | 327,503 | | | | 17.5 | | Depreciation, amortization and impairment losses (1) | | | 197,587 | | | | 10.0 | | | | 150,147 | | | | 8.0 | | Transportation costs | | | 195,123 | | | | 9.9 | | | | 182,453 | | | | 9.7 | | Other fixed costs (1) | | | 170,769 | | | | 8.7 | | | | 125,857 | | | | 6.7 | | Other variable procurement and services | | | 115,401 | | | | 5.8 | | | | 111,826 | | | | 6.0 | | Employee benefit expense and others (1) | | | 108,002 | | | | 5.5 | | | | 115,551 | | | | 6.2 | | Total operating costs | | | 1,973,778 | | | | 100 | | | | 1,873,540 | | | | 100 | |
(1)
| Corresponds to selling and administration expenses.
|
The following table sets forth our consolidated operating costs (excluding selling and administrative expenses) by reportable segment for the years ended December 31, 2016 and 2015:
| | Years ended December 31, | | | | 2016 | | | 2015 | | | Change | | | Change | | | | (in millions of Ch$) | | | (in %) | | Generation Business | | | | | | | | | | | | | | | | | Enel Generación Chile and subsidiaries | | | 895,060 | | | | 880,891 | | | | 14,169 | | | | 1.6 | | Distribution Business | | | | | | | | | | | | | | | | | Enel Distribución Chile and subsidiaries | | | 1,042,329 | | | | 983,733 | | | | 58,596 | | | | 6.0 | | Non-electricity business activities and consolidation adjustments | | | (439,970 | ) | | | (382,639 | ) | | | (57,331 | ) | | | 15.0 | | Total operating costs (excluding selling and administrative expenses) | | | 1,497,420 | | | | 1,481,985 | | | | 15,435 | | | | 1.0 | |
Generation Business: Operating Costs
Operating costs (excluding selling and administrative expenses) from continuing operations, increased by Ch$ 14.2 billion, or 1.6%, in 2016 compared to 2015, mainly due to (i) Ch$ 18.7 billion of higher other variable procurement and services costs mostly attributable to Ch$ 31.9 billion of higher costs in the gas commercialization business, (ii) increased purchases of energy of Ch$ 15.0 billion due to higher physical purchases of 861 GWh, an increase of 16.3%, mostly in the spot market, and (iii) Ch$ 12.8 billion of higher transportation costs due to higher tolls. This increase was partially offset by (i) Ch$ 32.4 billion of lower fuel consumption costs mainly due to lower average prices, given the decrease of international commodity prices, which accounted for Ch$ 93.9 billion of the decrease, partially offset by Ch$ 69.3 billion related to higher thermal generation and by (ii) Ch$ 15.9 billion lower costs related to the lease agreement with Gener to use its Nueva Renca combined-cycle power plant, allowing us to use our available LNG, which directly compensates other variable procurement and services costs.
Distribution Business: Operating Costs
Operating costs of Enel Distribución Chile increased by Ch$ 58.6 billion, or 6.0%, in 2016 compared to 2015, mainly due to Ch$ 55.4 billion greater energy purchases, primarily attributable to a higher average purchase price of Ch$ 3.8 /KWh (6.0%) as a result of regular indexed costs adjustment.
Consolidated Selling and Administrative Expenses
Selling and administrative expenses relate to salaries, compensation, administrative expenses, depreciation, amortization and impairment losses, and office materials and supplies.
The following table sets forth our consolidated selling and administrative expenses in Chilean pesos, and as a percentage of total consolidated selling and administrative expenses for the years ended December 31, 2016 and 2015:
| | Years ended December 31, | | | | 2016 | | | 2015 | | | | (in millions of Ch$) | | | (in %) | | | (in millions of Ch$) | | | (in %) | | Depreciation, amortization and impairment losses | | | 197,587 | | | | 41.5 | | | | 150,147 | | | | 38.3 | | Other fixed costs | | | 170,769 | | | | 35.8 | | | | 125,857 | | | | 32.1 | | Employee benefit expense and others | | | 108,002 | | | | 22.7 | | | | 115,551 | | | | 29.5 | | Total consolidated selling and administrative expenses | | | 476,358 | | | | 100 | | | | 391,555 | | | | 100 | |
The following table sets forth our consolidated selling and administrative expenses by reportable segment for the years ended December 31, 2016 and 2015:
| | Years ended December 31, | | | | 2016 | | | 2015 | | | Change | | | Change | | | | (in millions of Ch$) | | | (in %) | | Generation Business | | | | | | | | | | | | | | | | | Enel Generación Chile and subsidiaries | | | 333,281 | | | | 261,088 | | | | 72,193 | | | | 27.7 | | Distribution Business | | | | | | | | | | | | | | | | | Enel Distribución Chile and subsidiaries | | | 116,837 | | | | 124,706 | | | | (7,869 | ) | | | (6.3 | ) | Non-electricity business and consolidation adjustments | | | 26,240 | | | | 5,761 | | | | 20,479 | | | n.a. | | Total selling and administrative expenses | | | 476,358 | | | | 391,555 | | | | 84,803 | | | | 21.7 | |
Selling and administrative expenses from continuing operations increased by Ch$ 84.8 billion, or 21.7%, in 2016 compared to 2015, mainly related to the generation business, which increased by Ch$ 72.2 billion. The increase in the generation business is mainly due to (i) higher impairment losses of property, plant and equipment of Ch$ 40.6 billion related to a recognition in 2016 of Ch$ 24.2 billion of impairment charges related to the Neltume (Ch$ 20.5 billion) and Choshuenco (Ch$ 3.7 billion) projects and an increase of Ch$ 4.1 billion impairment of capitalized investments in NCRE projects between 2016 and 2015, compared to income in 2015 of Ch$ 12.6 billion due to the reversal of impairment charges associated with the Tarapacá power plant; and (ii) higher other fixed costs of Ch$ 29.0 billion mostly attributable to the write-off of Ch$ 32.8 billion of property, plant and equipment related to the waiver of water rights associated with the Bardón, Chillán 1 and 2, Futaleufú, Hechún, Puelo, Tames 2 and Totoralillo hydroelectric projects, which was partially offset by Ch$ 4.1 billion in lower expenses of outsourced services, compared to 2015 in which we incurred higher costs related to the corporate reorganization.
Selling and administrative expenses in our distribution business decreased by Ch$ 7.9 billion, or 6.3%, mainly due to (i) Ch$ 4.4 billion reduction of third-party services expenses due to lower activity in customer inspections, and (ii) Ch$ 3.8 billion lower transmission rental expenses, as a result of the acquisition of transmission assets in August 2015. These decreases were partially offset by a Ch$ 2.5 billion increase in employee expenses due to salary increases.
Consolidated Operating Income
The following table sets forth our operating income by reportable segment for the years ended December 31, 2016 and 2015:
| | Years ended December 31, | | | | 2016 | | | 2015 | | | Change | | | Change | | | | (in millions of Ch$) | | | (in %) | | Generation Business | | | | | | | | | | | | | | | | | Enel Generación Chile and subsidiaries | | | 431,386 | | | | 401,833 | | | | 29,553 | | | | 7.4 | | Distribution Business | | | | | | | | | | | | | | | | | Enel Distribución Chile and subsidiaries | | | 156,594 | | | | 149,294 | | | | 7,300 | | | | 4.9 | | Non-electricity business and consolidation adjustments | | | (20,191 | ) | | | (25,638 | ) | | | 5,447 | | | | (21.2 | ) | Total consolidated operating income | | | 567,789 | | | | 525,489 | | | | 42,300 | | | | 8.0 | | Operating margin from continuing operations(1) | | | 22.3 | % | | | 21.9 | % | | | — | | | | — | |
(1)
| Operating margin from continuing operations represents income from continuing operations as a percentage of revenues from continuing operations.
|
The 5.9% increase in revenues from continuing operations offset a slight increase in operating costs (excluding selling and administrative expenses) from continuing operations of 1.0% and a 21.7% increase in selling and administrative expenses from continuing operations and contributed to a 8.0% increase in our operating income in 2016 compared to 2015, and a small increase in operating margin from 21.9% to 22.3%.
Consolidated Financial and Other Results
The following table sets forth our financial and other results for the years ended December 31, 2016 and 2015:
| | Years ended December 31, | | | | 2016 | | | 2015 | | | Change | | | Change | | | | (in millions of Ch$) | | | (in %) | | Financial results | | | | | | | | | | | | | | | | | Financial income | | | 23,106 | | | | 15,270 | | | | 7,836 | | | | 51.3 | | Financial costs | | | (58,199 | ) | | | (66,701 | ) | | | 8,501 | | | | (12.7 | ) | Gain from indexed assets and liabilities | | | 1,632 | | | | 4,839 | | | | (3,207 | ) | | | (66.3 | ) | Foreign currency exchange differences | | | 12,978 | | | | (51,277 | ) | | | 64,256 | | | n.a. | | Total financial results | | | (20,483 | ) | | | (97,869 | ) | | | 77,386 | | | | (79.1 | ) | Other results | | | | | | | | | | | | | | | | | Share of the profit (loss) of associates and joint ventures accounted for using the equity method | | | 7,878 | | | | 8,905 | | | | (1,027 | ) | | | (11.5 | ) | Gain from sales of assets | | | 121,490 | | | | 20,056 | | | | 101,434 | | | n.a. | | Total Other results | | | 129,368 | | | | 28,961 | | | | 100,407 | | | n.a | | Total Consolidated Financial and Other results | | | 108,885 | | | | (68,908 | ) | | | 177,793 | | | n.a | |
Financial Results
The net financial results for the year ended December 31, 2016 was an expense of Ch$ 20.5 billion, an increase of Ch$ 77.4 billion, or 79.1%, compared to 2015. This increase is primarily due to lower charges for foreign currency exchange differences of Ch$ 64.3 billion, mainly as a result of the lower Chilean peso value of the U.S. dollar intercompany debt owed by Enel Generación Chile to Enel Américas for Ch$ 48.0 billion, and the higher gain in forward contracts for Ch$ 14.4 billion.
Other Results
Our share of the profit (loss) of associates and joint ventures accounted under the equity method for the year ended December 31, 2016 was Ch$ 7.9 billion, a decrease of Ch$ 1.0 billion, or 11.5%, compared to 2015, primarily because we sold our former associate GNL Quintero in September 2016, while in 2015 we recognized a full year of operations of GNL Quintero.
Gain from the sales of assets was Ch$ 121.5 billion in 2016, an increase of Ch$ 101.4 billion as compared to 2015. This increase was primarily due to the gain of Ch$ 121.3 billion from the sale of our former associate GNL Quintero, when compared to the gains recognized in 2015 of Ch$ 4.2 billion arising from the sale of our former associate Túnel El Melón in January 2015 and the sale of the land next to our Alonso de Córdova substation of Ch$ 14.6 billion during the fourth quarter of 2015.
Consolidated Income Tax Expenses
Total income tax expenses totaled Ch$ 111.4 billion in 2016, an increase of Ch$ 1.8 billion, or 1.6% compared to 2015.
The increase in total income tax expenses from continuing operations was mainly due to Ch$ 4.2 billion related to the increase of the nominal tax rate from 22.5% to 24% and Ch$ 52.9 billion higher income from continuing operations effect for the year ended December 31, 2016, including Ch$ 28.1 billion of higher taxes due to the effect generated by the sale of our former associate GNL Quintero. These increases were partially offset by Ch$ 18.8 billion of tax benefits gained as part of the corporate simplification process related to generating companies in Chile, Ch$ 14.4 billion of lower taxes on taxable price-level readjustment of investments,
Ch$ 5.6 billion lower deferred taxes associated with the investments Enel Generación Chile had in Peru and Ch$ 16.5 lower income taxes due to other different concepts of non-taxable revenues. These decreases resulted in the decrease of the effective income tax rate.
The effective tax rate was 16.5% in 2016 compared to 24% in 2015. For further details, please refer to note 17 of the Notes to our consolidated financial statements.
Consolidated Net Income
The following table sets forth our consolidated net income before taxes, income tax expenses and net income for the years ended December 31, 2016 and 2015:
| | Years ended December 31, | | | | 2016 | | | 2015 | | | Change | | | Change | | | | (in millions of Ch$) | | | (in %) | | Operating income | | | 567,789 | | | | 525,489 | | | | 42,300 | | | | 8.0 | | Other results | | | 108,885 | | | | (68,908 | ) | | | 177,793 | | | n.a. | | Net income before taxes | | | 676,674 | | | | 456,581 | | | | 220,094 | | | | 48.2 | | Income tax expenses | | | (111,403 | ) | | | (109,613 | ) | | | (1,791 | ) | | | 1.6 | | Consolidated Net income | | | 565,271 | | | | 346,968 | | | | 218,303 | | | | 62.9 | | Net income attributable to the Parent Company | | | 384,160 | | | | 251,838 | | | | 132,321 | | | | 52.5 | | Net income attributable to non-controlling interests | | | 181,111 | | | | 95,130 | | | | 85,981 | | | | 90.4 | |
The increase in net income attributable to non-controlling interests of Ch$ 86.0 billion in 2016 compared to 2015, is primarily due to the Ch$ 87.2 billion increase of net income attributable to the non-controlling interests of Enel Generación Chile for 2016, which in turn is mainly due to the increase in net income from continuing operations in Enel Generación Chile by Ch$ 218 billion. The controlling and economic interest in Enel Generación Chile is the same in both years (59.98%).
3.
| Analysis of Results of Operations for the Years Ended December 31, 2015 and 2014.
|
In the generation business, for the first seven months of 2015, hydrological conditions were less favorable than average. During this period, we reduced our thermal generation due to the shutdown of Bocamina I and II. In the spot market, prices were higher than normal despite lower commodity prices. Our generation was lower than our contracted sales and we covered our physical energy deficit in the spot market, resulting in higher energy purchase costs. As of July 2015, Bocamina I and II were in service again, and in August 2015 hydrological conditions improved. Therefore, in the last five months of 2015, we generated at normal levels, and experienced better operating income compared to the same period in 2014.
In the distribution business, our results remained similar in 2015 and 2014. Results for 2015 results improved due to higher margins in value-added products and services and higher margin in the energy sales as a result of the increase of sales with respect to 2014, which helped to offset compensation to customers and fines. These slighter better results were offset by higher benefits for the employees for higher salaries and indemnification.
The combination of these factors, among others, contributed to increase our operating income in 2015 compared to 2014. Please refer to “Consolidated Operating Income” below.
Consolidated Revenues
Generation Business
The following table sets forth the physical electricity sales of Enel Generación Chile and its subsidiaries and the corresponding changes for the years ended December 31, 2015 and 2014:
| | Years ended December 31, | | | | 2015 | | | 2014 | | | Change | | | Change | | | | (in GWh) | | | (in %) | | Enel Generación Chile and subsidiaries | | | 23,558 | | | | 21,157 | | | | 2,401 | | | | 11.3 | |
Distribution Business
The following table sets forth the physical electricity sales of Enel Distribución Chile and the corresponding changes for the years ended December 31, 2015 and 2014:
| | Years ended December 31, | | | | 2015 | | | 2014 | | | Change | | | Change | | | | (in GWh) | | | (in %) | | Enel Distribución Chile | | | 15,893 | | | | 15,690 | | | | 203 | | | | 1.3 | |
The following table sets forth our revenues by reportable segment for the years ended December 31, 2015 and 2014:
| | Years ended December 31, | | | | 2015 | | | 2014 | | | Change | | | Change | | | | (in millions of Ch$) | | | (in %) | | Generation Business | | | | | | | | | | | | | | | | | Enel Generación Chile and subsidiaries | | | 1,543,812 | | | | 1,220,566 | | | | 323,246 | | | | 26.5 | | Distribution Business | | | | | | | | | | | | | | | | | Enel Distribución Chile and subsidiaries | | | 1,257,732 | | | | 1,127,893 | | | | 129,839 | | | | 11.5 | | Non-electricity business and consolidation adjustments | | | (402,515 | ) | | | (299,394 | ) | | | (103,121 | ) | | | 34.4 | | Total | | | 2,399,029 | | | | 2,049,065 | | | | 349,964 | | | | 17.1 | |
Generation Business: Revenues
Revenues from Enel Generación Chile increased by Ch$ 323.2 billion, or 26.5% in 2015, compared to 2014, mainly due to (i) Ch$153.6 billion as a result of a 16.0% increase in average energy sale prices, (ii) Ch$ 88.9 billion as a result of increased physical sales of 2,401 GWh, or 11.3%, due to both increased contractual sales, especially to distributors, and increased sales in the spot market, and (iii) Ch$ 69.9 billion of higher revenues contributed by GasAtacama Chile, a consolidated entity since May 2014.
Distribution Business: Revenues
Revenues from Enel Distribución Chile increased by Ch$ 129.8 billion, or 11.5%, in 2015 compared to 2014. This increase is a result of (i) higher energy sales of Ch$ 115.1 billion, mainly due to Ch$ 7.1/kWh (10.7%) increase of the tariff to regulated clients due to regular indexed cost adjustment in the tariff, which accounted for Ch$ 105.4 billion of the increase and (ii) Ch$ 16.4 billion higher revenues from other services, mainly related to tolls charged to generating companies and rental and maintenance of street lighting and network installments. The number of customers rose by 43,500 in 2015 compared to 2014, totaling 1,780,800.
Consolidated Operating Costs
Total operating costs consist primarily of energy purchases from third parties, fuel purchases, depreciation, amortization and impairment losses, maintenance costs, tolls paid to transmission companies, employee salaries and administrative and selling expenses.
The following table sets forth our consolidated operating costs in Chilean pesos and, as a percentage of total consolidated operating costs, for the years ended December 31, 2015 and 2014:
| | Years ended December 31, | | | | 2015 | | | 2014 | | | | (in millions of Ch$) | | | (in %) | | | (in millions of Ch$) | | | (in %) | | Operating Costs as a Percentage of Total Operating Costs | | | | | | | | | | | | | | | | | Energy purchases | | | 860,203 | | | | 45.9 | | | | 788,421 | | | | 47.3 | | Fuel purchases | | | 327,503 | | | | 17.5 | | | | 305,480 | | | | 18.3 | | Transportation costs | | | 182,453 | | | | 9.7 | | | | 151,949 | | | | 9.1 | | Depreciation, amortization and impairment losses(1) | | | 150,147 | | | | 8.0 | | | | 141,623 | | | | 8.5 | | Other fixed costs(1) | | | 125,857 | | | | 6.7 | | | | 110,454 | | | | 6.6 | | Employee benefit expense and others(1) | | | 115,551 | | | | 6.2 | | | | 104,836 | | | | 6.3 | | Other variable costs | | | 111,826 | | | | 6.0 | | | | 63,553 | | | | 3.8 | | Total Consolidated Operating Costs | | | 1,873,540 | | | | 100 | | | | 1,666,316 | | | | 100 | |
(1) Corresponds to selling and administration expenses.
The following table sets forth our consolidated operating costs (excluding selling and administrative expenses) by reportable segment for the years ended December 31, 2015 and 2014:
| | Years ended December 31, | | | | 2015 | | | 2014 | | | Change | | | Change | | | | (in millions of Ch$) | | | (in %) | | Generation Business | | | | | | | | | | | | | | | | | Enel Generación Chile and subsidiaries | | | 880,891 | | | | 750,213 | | | | 130,678 | | | | 17.4 | | Distribution Business | | | | | | | | | | | | | | | | | Enel Distribución Chile and subsidiaries | | | 983,733 | | | | 855,758 | | | | 127,975 | | | | 15.0 | | Non-electricity business and consolidation adjustments | | | (382,639 | ) | | | (296,569 | ) | | | (86,070 | ) | | | 29.0 | | Total | | | 1,481,985 | | | | 1,309,402 | | | | 172,583 | | | | 13.2 | |
Generation Business: Operating Costs
Operating costs increased by Ch$ 130.7 billion, or 17.4%, in 2015 compared to 2014, mainly due to (i) Ch$ 39.5 billion of higher other variable procurement and services costs mostly attributable to (a) Ch$ 23.7 billion related to the cost of the agreement with Gener’s Nueva Renca combined-cycle power plant that allows Enel Generación Chile to use its available LNG and (b) Ch$ 9.4 billion of higher water transportation costs for the operation of the San Isidro power plant, (ii) Ch$ 36.9 billion of higher gas transportation costs related to additional energy purchases, (iii) Ch$ 22.0 billion of higher fuel consumption costs mainly due to Enel Generación Chile’s higher coal consumption costs of Ch$ 16.0 billion, and (iv) increased purchases of energy on the spot market of Ch$ 32.2 billion due to higher sales.
Distribution Business: Operating Costs
Operating costs of Enel Distribución Chile increased by Ch$ 128.0 billion, or 15.0%, in 2015 compared to 2014, mainly due to Ch$ 115.3 billion greater energy purchases, primarily attributable to a higher average purchase price of Ch$ 6.5 /kWh (13.2%) as a result of regular indexed costs adjustment that accounted for Ch$ 105.3 billion. In addition, operating costs increased because of variable procurement and service costs of Ch$ 8.2 billion, higher transportation costs of Ch$ 4.5 billion and compensation to customers and fines.
Consolidated Selling and Administrative Expenses
Consolidated selling and administrative expenses relate to salaries, compensation, administrative expenses, depreciation, amortization and impairment losses, and office materials and supplies.
The following table sets forth our consolidated selling and administrative expenses in Chilean pesos and as a percentage of total consolidated selling and administrative expenses for the years ended December 31, 2015 and 2014:
| | Years ended December 31, | | | | 2015 | | | 2014 | | | | (in millions of Ch$) | | | (in %) | | | (in millions of Ch$) | | | (in %) | | Operating Costs as a Percentage of Total Operating Costs | | | | | | | | | | | | | | | | | Depreciation, amortization and impairment losses | | | 150,147 | | | | 38.3 | | | | 141,623 | | | | 39.7 | | Other fixed costs | | | 125,857 | | | | 32.1 | | | | 110,454 | | | | 30.9 | | Employee benefit expense and others | | | 115,551 | | | | 29.5 | | | | 104,836 | | | | 29.4 | | Total consolidated selling and administrative expenses | | | 391,555 | | | | 100 | | | | 356,913 | | | | 100 | |
The following table sets forth our consolidated selling and administrative expenses by reportable segment for the years ended December 31, 2015 and 2014:
| | Years ended December 31, | | | | 2015 | | | 2014 | | | Change | | | Change | | | | (in millions of Ch$) | | | (in %) | | Generation Business | | | | | | | | | | | | | | | | | Enel Generación Chile and subsidiaries | | | 261,088 | | | | 224,627 | | | | 36,461 | | | | 16.2 | | Distribution Business | | | | | | | | | | | | | | | | | Enel Distribución Chile and subsidiaries | | | 124,706 | | | | 118,028 | | | | 6,678 | | | | 5.7 | | Non-electricity business and consolidation adjustments | | | 5,749 | | | | 14,258 | | | | (8,509 | ) | | | (59.7 | ) | Total consolidated selling and administrative expense | | | 391,543 | | | | 356,913 | | | | 34,630 | | | | 9.7 | |
Selling and administrative expenses increased by Ch$ 34.6 billion, or 9.7%, in 2015 compared to 2014, mainly due to (i) higher other fixed costs of Ch$ 24.9 billion mostly attributable to increased costs related to the corporate reorganization and higher fines for sanctions and litigations, and (ii) higher charges in Enel Generación Chile for depreciation of Ch$ 2.8 billion from the full consolidation of GasAtacama Chile.
Consolidated Operating Income
The following table sets forth our operating income by reportable segment for the years ended December 31, 2015 and 2014:
| | Years ended December 31, | | | | 2015 | | | 2014 | | | Change | | | Change | | | | (in millions of Ch$) | | | (in %) | | Generation Business | | | | | | | | | | | | | | | | | Enel Generación Chile and subsidiaries | | | 401,833 | | | | 245,726 | | | | 156,107 | | | | 63.5 | | Distribution Business | | | | | | | | | | | | | | | | | Enel Distribución Chile and subsidiaries | | | 149,294 | | | | 154,107 | | | | (4,813 | ) | | | (3.1 | ) | Non-electricity business and consolidation adjustments | | | (25,624 | ) | | | (17,083 | ) | | | (8,541 | ) | | | 50.0 | | Total consolidated operating income | | | 525,503 | | | | 382,750 | | | | 142,753 | | | | 37.3 | | Operating margin from continuing operations(1) | | | 21.9 | % | | | 18.7 | % | | | — | | | | — | |
(1)
| Operating margin from continuing operations represents income from continuing operations as a percentage of revenues from continuing operations.
|
The 17.1% increase in revenues from continuing operations offset the 13.2% increase in operating costs (excluding selling and administrative expenses) from continuing operations and a 9.7% increase in selling and administrative expenses from continuing operations and contributed to a 37.3% increase in our operating income in 2015 compared to 2014, and an increase in operating margin from 18.7% to 21.9%.
Consolidated Financial and Other Results
The following table sets forth our financial and other results for the years ended December 31, 2015 and 2014:
| | Years ended December 31, | | | | 2015 | | | 2014 | | | Change | | | Change | | | | (in millions of Ch$) | | | (in %) | | Financial results | | | | | | | | | | | | | | | | | Financial income | | | 15,270 | | | | 14,763 | | | | 507 | | | | 3.4 | | Financial costs | | | (66,701 | ) | | | (75,626 | ) | | | 8,925 | | | | (11.8 | ) | Profit for indexed assets and liabilities | | | 4,839 | | | | 15,264 | | | | (10,425 | ) | | | (68.3 | ) | Foreign currency exchange differences | | | (51,277 | ) | | | (21,444 | ) | | | (29,833 | ) | | | 139.1 | | Total | | | (97,869 | ) | | | (67,043 | ) | | | (30,826 | ) | | | 46.0 | | Others | | | | | | | | | | | | | | | | | Gain from sales of assets | | | 20,056 | | | | 70,893 | | | | (50,837 | ) | | | (71.7 | ) | Share of the profit (loss) of associates and joint ventures accounted for using the equity method | | | 8,905 | | | | (54,353 | ) | | | 63,258 | | | n.a. | | Total | | | 28,961 | | | | 16,540 | | | | 12,421 | | | | 75.1 | | Total Consolidated Other Results | | | (68,908 | ) | | | (50,503 | ) | | | (18,405 | ) | | | 36.4 | |
Financial Results
The net financial results for the year ended December 31, 2015 was an expense of Ch$ 97.9 billion, an increase of Ch$ 30.8 billion, or 46.0%, compared to 2014. This increase was primarily due to (i) higher charges for foreign currency exchange differences of Ch$ 29.8 billion mainly as a result of the devaluation of the Chilean peso against the U.S. dollar that affected the valuation of financial debt and derivative instruments and (ii) decreased gain for indexed assets and liabilities of Ch$ 10.4 billion due to lower inflation rate in 2015, compared to 2014. These greater expenses were partially offset by Ch$ 8.9 billion of lower financial costs due to lower intercompany debt.
Other Results
The gain from sales of assets for the year ended December 31, 2015 was Ch$ 20.1 billion, a decrease of Ch$ 50.8 billion or 71.7%, compared to 2014. This decrease was primary due non-recurring gains in 2014 of (i) Ch$ 42.6 billion recorded in 2014 arising from the revaluation of the 50% pre-existing investment in GasAtacama Chile and a recognition of its accumulated currency exchange differences and (ii) Ch$ 21.1 billion recorded in 2014 from the sale of the equity interest in Los Maitenes and Aguas Santiago Poniente (ENEA Project). The decrease was partially offset by a net gain of Ch$ 14.6 billion from the sale of land (Alonso de Córdova substation) during the fourth quarter of 2015.
Our share of the profit (loss) of associates and joint venture investments accounted for using the equity method in 2015 was Ch$ 8.9 billion, an increase of Ch$ 63.3 billion as compared to 2014, primarily due to the non-recurring impairment loss of Ch$ 69.1 billion recorded in December 2014 in connection with HidroAysén project. This decision was based on the uncertainty of recovering the investment made in the project, mainly as a consequence of the long judicial process in order to obtain environmental approvals.
Consolidated Income Tax Expenses
Consolidated income tax expenses totaled Ch$ 109.7 billion in 2015, a decrease of Ch$ 23.1 billion, or 17.4%, compared to 2014. The decrease in corporate income tax expense was mainly due to the absence in 2015 of an adjustment recognized as a net deferred tax liability of Ch$ 66.7 billion in 2014, following the tax reform enacted in Chile on September 29, 2014. The 2014 tax reform established a gradual increase in the taxation rate until 2018 and is expected to slightly affect our results in the future, considering that the main impacts on deferred taxes have been already recognized.
The consolidated effective tax rate was 24.0% in 2015 and 39.9% in 2014.
Consolidated Net Income
The following table sets forth our consolidated net income before taxes, income tax expenses and net income for the years ended December 31, 2015 and 2014:
| | Years ended December 31, | | | | 2015 | | | 2014 | | | Change | | | Change | | | | (in millions of Ch$) | | | (in %) | | Consolidated Operating income | | | 525,489 | | | | 382,750 | | | | 142,739 | | | | 37.3 | | Consolidated Other results | | | (68,908 | ) | | | (50,504 | ) | | | (18,404 | ) | | | 36.4 | | Consolidated Net income before taxes | | | 456,581 | | | | 332,246 | | | | 124,335 | | | | 37.4 | | Income tax expenses | | | (109,613 | ) | | | (132,687 | ) | | | 23,074 | | | | (17.4 | ) | Consolidated Net income | | | 346,968 | | | | 199,559 | | | | 147,409 | | | | 73.9 | | Net income attributable to the Parent Company | | | 251,838 | | | | 162,459 | | | | 89,379 | | | | 55.0 | | Net income attributable to non-controlling interests | | | 95,130 | | | | 37,100 | | | | 58,030 | | | | 156.4 | |
The increase in net income attributable to non-controlling interests of Ch$ 58.0 billion in 2015 compared to 2014, is primarily due to the Ch$ 69.3 billion increase of net income attributable to the non-controlling interests of Enel Generación Chile for 2015, which in turn is mainly due to the increase in net income in Enel Generación Chile by Ch$ 154.7 billion. The controlling and economic interest in Enel Generación Chile is the same in both years (59.98%).
B.
| Liquidity and Capital Resources.
|
Our main assets are our consolidated Chilean subsidiaries, Enel Generación Chile and Enel Distribución Chile. The following discussion of cash sources and uses reflects the key drivers of our cash flow.
We, on a stand-alone basis, receive cash inflows from our subsidiaries, as well as from related companies. Our subsidiaries and associates’ cash flows may not always be available to satisfy our own liquidity needs, mainly because they are not wholly-owned, and because there is a time lag before we have effective access to those funds through dividends or capital reductions. However, we believe that cash flow generated from our business operations, as well as cash balances, borrowings from commercial banks, and ample access to both Chilean and international capital markets will be sufficient to satisfy all our needs for working capital, expected debt service, dividends and planned capital expenditures in the foreseeable future.
Set forth below is a summary of our consolidated cash flow information for the years ended December 31, 2016, 2015 and 2014:
| | Year ended December 31, | | | | 2016 | | | 2015 | | | 2014 | | | | (in billions of Ch$) | | Net cash flows provided by operating activities | | | 615 | | | | 577 | | | | 265 | | Net cash flows used in investing activities | | | (63 | ) | | | (297 | ) | | | (189 | ) | Net cash flows used in financing activities | | | (446 | ) | | | (273 | ) | | | (159 | ) | Net increase (decrease) in cash and cash equivalents before effect of exchange rates changes | | | 105 | | | | 6 | | | | (83 | ) | Effects of exchange rate changes on cash and cash equivalents | | | (4 | ) | | | 5 | | | | 1 | | Cash and cash equivalents at beginning of period | | | 144 | | | | 133 | | | | 215 | | Cash and cash equivalents at end of period | | | 246 | | | | 144 | | | | 133 | |
For the year ended December 31, 2016, net cash flow provided by operating activities was Ch$ 615 billion, an increase of Ch$ 38 billion, or 6.6%, compared to Ch$ 577 billion for the same period in 2015. The increase was primarily the result of an increase in collections from the sale of goods and services of Ch$ 185 billion comprised mainly of:
| (i)
| Ch$ 99 billion higher collections from Enel Generación Chile, excluding intercompany transactions, mainly due to an increase in physical sales to regulated customers and gas export to Argentina;
|
| (ii)
| Ch$ 82 billion higher collections from Enel Distribución Chile excluding intercompany transactions, due to an increase of the tariff for regulated customers in 2016 compared to 2015.
|
This increase was partially offset by:
| (i)
| an increase in payments to suppliers of goods and services of Ch$ 49 billion mainly from Enel Distribución Chile, mostly as a consequence of higher energy purchases from third parties, primarily attributable to a higher average purchase price of Ch$ 3.8 /kWh (6.0%);
|
| (ii)
| an increase in other payments for operating activities of Ch$ 109 billion mainly attributable to Ch$ 132 billion of additional tax payments generated in accordance with Peruvian tax law as a result of the spin-off, paid in March 2016, by both Enel Generación Chile (Ch$ 116 billion) and Enel Distribución Chile (Ch$ 16 billion), partially offset by Ch$ 24 billion lower VAT and other payments due to higher purchases; and
|
| (iii)
| a decrease in other outflows of Ch$ 7 billion.
|
For further information regarding our operational results in 2016 and 2015, please see “Item 5. Operating and Financial Review and Prospects — A. Operating Results. — 2. Analysis of Results of Operations for the Years Ended December 31, 2016 and 2015.”
For the year ended December 31, 2015, net cash flow provided by operating activities was Ch$ 577 billion, an increase of Ch$ 312 billion, or 117.6%, compared to Ch$ 265 billion for the same period in 2014. The increase was primarily the result of an increase in collections from the sale of goods and services of Ch$ 662 billion comprised of:
| (i)
| Ch$ 286 billion from Enel Generación Chile, on a stand-alone basis, mainly due to an increase in physical sales;
|
| (ii)
| Ch$ 116 billion from the consolidation of GasAtacama Chile; and
|
| (iii)
| Ch$ 337 billion from Enel Distribución Chile due to an increase of the tariff for regulated customers, despite the slight decrease in the collection rate from 99.6% to 97.0% in 2015 compared to 2014. These factors were due to increasing economic activity in recent years and greater per capita consumption.
|
This increase was partially offset by:
| (i)
| an increase in payments to suppliers of goods and services of Ch$ 194 billion comprised of (a) Ch$ 151 billion from Enel Generación Chile, which was mostly a consequence of higher variable procurement and service costs of Ch$ 39.5 billion, mostly attributable to costs related to the Enel Generación Chile’s lease of Gener’s Nueva Renca combined-cycle power plant for use of Enel Generación Chile’s available LNG and Ch$ 36.9 billion higher transportation costs related to additional energy purchases, and (b) Ch$ 133 billion from Enel Distribución Chile mainly due to Ch$ 115.3 billion of higher energy purchases due to the higher periodic price index changes;
|
| (ii)
| an increase in income tax payments of Ch$ 100 billion mainly due to lower tax refunds to Enel Generación Chile and increased tax advances of Enel Distribución Chile as a consequence of higher sales; and
|
| (iii)
| an increase in other payments for operating activities of Ch$ 33 billion attributable to higher VAT payments by Enel Distribución Chile and GasAtacama Chile as a consequence of higher sales.
|
For further information regarding our operational results in 2015 and 2014, please see “Item 5. Operating and Financial Review and Prospects — A. Operating Results. — 3. Analysis of Results of Operations for the Years Ended December 31, 2015 and 2014.”
For the year ended December 31, 2016, net cash flows used in investing activities was Ch$ 63 billion, compared to net cash flows used in investing activities of Ch$ 297 billion for the same period of 2015. The change was mainly due to the acquisition of fixed assets of Ch$ 222 billion, partially offset by collections from time deposits with a maturity greater than 90 days of Ch$ 135 billion, proceeds received from the sale of land next to Enel Distribución Chile’s Alonso de Córdova substation of Ch$ 15 billion, and dividends classified as investment cash flow of Ch$ 9 billion.
For the year ended December 31, 2015, net cash flows used in investing activities was Ch$ 297 billion, compared to net cash flows used in investing activities of Ch$ 189 billion for the same period of 2014. The change was mainly due to the acquisition of fixed assets of Ch$ 310 billion, partially offset by dividends classified as investment cash flow of Ch$ 10 billion, loss of control of subsidiaries for Ch$ 7 billion, related to the sale of all of our shareholdings in Túnel El Melon, and interest received of Ch$ 3 billion.
For further information regarding the acquisition of fixed assets in 2016 and 2015, please see “Item 4. Information on the Company — A. History and Development of the Company — Capital Investments, Capital Expenditures and Divestitures.”
For the year ended December 31, 2016, net cash flows used in financing activities increased to Ch$ 446 billion from Ch$ 273 billion in 2015. The main drivers of this change are described below.
The aggregate cash outflows from financing activities were primarily due to:
Ch$ 138 billion of payments of loans and bonds for Enel Generación Chile on a stand-alone basis.
Ch$ 322 billion in dividend payments (including Ch$ 165 billion paid by Enel Distribución Chile and Enel Generación Chile to Enel Américas during 2016 and before the spin-off was completed, Ch$ 103 billion paid by us, Ch$ 45 billion paid by Enel Generación Chile, on a stand-alone basis, excluding dividends paid to us and Ch$ 8 billion for Pehuenche, among others);
Ch$ 48 billion of interest expense, mainly for Enel Generación Chile on a stand-alone basis;
Ch$ 55 billion of other outflows of cash, net; and
Ch$ 17 billion in loans from related entities, including Enel Generación Chile and Enel Distribución Chile.
These outflows were partially offset by cash inflows primarily due to:
Ch$ 137 billion in loans from Enel Generación Chile.
For the year ended December 31, 2015, net cash flows used in financing activities increased to Ch$ 273 billion from Ch$ 159 billion in 2014. The main drivers of this change are described below.
The aggregate cash outflows from financing activities were primarily due to:
Ch$ 140 billion of payments of bonds for Enel Generación Chile related to its own operations;
Ch$ 135 billion in dividend payments (including Ch$ 103 billion for Enel Américas, on a stand-alone basis, Ch$ 22 billion paid by Enel Generación Chile, excluding dividends paid to us and Ch$ 9 billion for Pehuenche, among others); and
Ch$ 60 billion of interest expense, mainly for Enel Generación Chile.
These outflows were partially offset by cash inflows primarily due to:
Ch$ 40 billion in loans from related entities, including Enel Generación Chile and Enel Distribución Chile, and
Ch$ 29 billion of net investment from parent companies.
For a description of liquidity risks resulting from the inability of our subsidiaries to transfer funds, please see “Item 3. Key Information — D. Risk Factors — We depend on payments from our subsidiaries, jointly-controlled entities and associates to meet our payment obligations.”
We coordinate the overall financing strategy of our subsidiaries. However, our subsidiaries independently develop their capital expenditure plans and finance their capital expansion programs through internally generated funds or direct financings. We, on a stand-alone basis, have no legal obligations or other commitments to financially support our subsidiaries. We, on a stand-alone basis, currently have no debt obligations and are therefore not affected by any cross default provisions that could be triggered by any of our subsidiary defaults. In some cases, our subsidiaries may be financed by us through intercompany loans. For information regarding our commitments for capital expenditures, see “Item 4. Information on the Company — A. History and Development of the Company — Capital Investments, Capital Expenditures and Divestitures” and our contractual obligations table set forth below under “Item 5. Operating and Financial Review and Prospects — F. Tabular Disclosure of Contractual Obligations.”
We have American Depositary Shares listed and that trade on the NYSE since April 26, 2016 and may in the future access the international equity capital markets (including SEC-registered ADS offerings) while our subsidiary Enel Generación Chile has accessed the international equity capital markets, with an SEC-registered ADS offering on August 3, 1994. Enel Generación Chile has also actively issued bonds in the United States (“Yankee Bonds”), and we and Enel Generación Chile may in the future issue Yankee
Bonds depending on liquidity needs. Since 1996, Enel Generación Chile and Pehuenche have issued a total of US$ 2.8 billion in Yankee Bonds.
The following table lists the Yankee Bonds issued by our subsidiary, Enel Generación Chile, and the aggregate principal amount outstanding as of December 31, 2016. The weighted average annual coupon interest rate for such bonds is 5.8%, without giving effect to each bond’s duration, or put options.
| | | | | | | | | | Aggregate Principal Amount | | Issuer | | Term | | Maturity | | Coupon | | | Issued | | | Outstanding | | | | | | | | (%) | | | (in millions of US$) | | Enel Generación Chile | | 10 years | | April 2024 | | | 4.250 | | | | 400 | | | | 400 | | Enel Generación Chile (1) | | 30 years | | February 2027 | | | 7.875 | | | | 230 | | | | 206 | | Enel Generación Chile (2) | | 40 years | | February 2037 | | | 7.325 | | | | 220 | | | | 71 | | Enel Generación Chile (1) | | 100 years | | February 2097 | | | 8.125 | | | | 200 | | | | 40 | | Total | | | | | | 5.813 (3) | | | | 1,050 | | | | 717 | |
(1)
| Enel Generación Chile repurchased some of these bonds in 2001.
|
(2)
| Holders of the Enel Generación Chile 7.325% Yankee Bonds due 2037 exercised a put option on February 1, 2009 for a total amount of US$ 149.2 million. The remaining US$ 70.8 million principal amount of the Yankee Bonds mature in February 2037.
|
(3)
| Weighted-average coupon by outstanding amount.
|
We have access to the Chilean domestic capital markets. Our subsidiary, Enel Generación Chile, has issued debt instruments including commercial paper and medium and long-term bonds that are primarily sold to Chilean pension funds, life insurance companies and other institutional investors.
The following table lists UF-denominated Chilean bonds issued by Enel Generación Chile that are outstanding as of December 31, 2016.
| | | | | | | | | | Aggregate Principal Amount | | Issuer | | Term | | Maturity | | Coupon (inflation adjusted rate) | | | Issued | | | Outstanding | | | | | | | | (%) | | | (in millions of UF) | | | (in millions of UF) | | | (in billions of Ch$) | | Enel Generación Chile Series H | | 25 years | | October 2028 | | | 6.20 | | | | 4.0 | | | | 2.5 | | | | 67 | | Enel Generación Chile Series M | | 21 years | | December 2029 | | | 4.75 | | | | 10.0 | | | | 10.0 | | | | 263 | | Total | | | | | | 5.04 (1) | | | | 14.0 | | | | 12.5 | | | | 331 | |
(1)
| Weighted-average coupon by outstanding amount.
|
For a full description of local bonds issued by Enel Generación Chile, see “Unsecured liabilities detailed by currency and maturity” in Note 18 of the Notes to our consolidated financial statements.
We may also participate in the international commercial bank markets through syndicated senior unsecured loans, including both fixed term and revolving credit facilities. The amounts outstanding or available under our syndicated revolving loans as of December 31, 2016 are set forth in the table below. The syndicated revolving loan due in July 2019 was voluntarily terminated in February 2017, before its due date.
Borrower
| | Type
| | Maturity
| | Facility Amount
| | | Amount Drawn
| | | | | | | | (in millions of US$)
| | | (in millions of US$)
| | Enel Generación Chile
| | Syndicated revolving loan
| | July 2019
| | | 200
| | | | —
| | Enel Generación Chile
| | Syndicated revolving loan
| | February 2020
| | | 200
| | | | —
| | Total
| | | | | | | 400
| | | | —
| |
Both undrawn revolving credit facilities are governed by the laws of the State of New York and do not contain a condition precedent requirement regarding the non-occurrence of a “Material Adverse Effect” (or MAE, as defined contractually) prior to a disbursement, allowing us full flexibility to draw on up to US$ 400 million in the aggregate as of December 31, 2016 and US$ 200
million as of the date of this Report from such committed revolving facilities under any circumstances, including situations involving a MAE.
We also borrow from banks in Chile under fully committed facilities under which a potential MAE would not be an impediment to this source of liquidity. In 2016, Enel Generación Chile entered into a 3-year bilateral revolving loan for an aggregate amount of UF 2.8 million (Ch$ 75 billion as of December 31, 2016) as set forth in the table below.
Borrower
| | Type
| | Maturity
| | Facility Amount
| | | Amount Drawn
| | | | | | | | (in millions of UF$)
| | | (in millions of UF$)
| | Enel Generación Chile
| | Bilateral revolving loan
| | March 2019
| | | 2.8
| | | | —
| |
As a result of the foregoing, we have access to fully committed undrawn revolving loans, both international and domestic, for up to Ch$ 343 billion in the aggregate as of December 31, 2016.
We and our subsidiaries also borrow routinely from uncommitted Chilean bank facilities with approved lines of credit for approximately Ch$ 59 billion in the aggregate, none of which are currently drawn. Unlike the committed lines described above, which are not subject to MAE conditions precedent prior to disbursements, these facilities are subject to greater risk of not being disbursed in the event of a MAE, and therefore could limit our liquidity under such circumstances.
We may also access the Chilean commercial paper market under programs that need to be registered with the SVS. Enel Generación Chile has an outstanding program for a maximum of US$ 200 million. Finally, we can also access other types of financing, including supplier credits, leasing, among others.
As of December 31, 2016, we, on a stand-alone basis, had no debt obligations and was therefore not affected by any covenants or events of default. Enel Generación Chile’s outstanding debt facilities, with the exception of their Yankee Bonds, include financial covenants. The types of financial covenants, and their respective limits, vary from one type of debt to another. As of December 31, 2016, the most restrictive financial covenant affecting Enel Generación Chile was the leverage ratio in connection with the bilateral revolving loan facility that matures in March 2019, and both syndicated senior unsecured loans that mature in July 2019 and February 2020, respectively. Under such covenants, the maximum additional debt that could be incurred without a breach is Ch$ 1,602 billion. As of December 31, 2016 and as of the date of this Report, our subsidiaries are in compliance with the financial covenants contained in their debt instruments.
As is customary for certain credit and capital market debt facilities, a significant portion of Enel Generación Chile’s financial indebtedness is subject to cross default provisions. Each of the revolving credit facilities described above, as well as all of Enel Generación Chile’s Yankee Bonds, have cross default provisions with different definitions, criteria, materiality thresholds, and applicability as to the subsidiaries that could give rise to a cross default.
The cross default provisions for the Enel Generación Chile revolving credit facilities that are due in July 2019 and in February 2020, governed by the laws of the State of New York, refer to defaults of the borrower, without reference to any subsidiary. Under such credit facilities, only matured defaults of the borrower exceeding US$ 50 million qualify for a potential cross default when the principal exceeds US$ 50 million, or its equivalent in other currencies. In the case of a matured default above the materiality threshold, the revolving credit facility’s lenders would have the option to accelerate if lenders representing more than 50% of the aggregate debt of a particular outstanding facility choose to do so. All of Enel Generación Chile’s Yankee Bonds are unsecured and not subject to any guarantees by any of its subsidiaries or parent companies.
The local facility of Enel Generación Chile due in March 2019 does not have cross default provisions to debt other than the respective borrower’s own indebtedness.
Cross default provisions of Enel Generación Chile’s Yankee Bonds may be triggered by its subsidiaries’ debt. A matured default of Enel Generación Chile or any of its subsidiaries could result in a cross default to Enel Generación Chile’s Yankee Bonds if such matured default, on an individual basis, has a principal exceeding US$ 30 million, or its equivalent in other currencies, although Enel Generación Chile’s subsidiaries do not have any financial obligation. In the specific case of the Enel Generación Chile’s Yankee Bond, issued in April 2014, due in 2024, the threshold is US$ 50 million, or its equivalent in other currencies. In the case of a matured default above the materiality threshold, holders of Yankee Bonds would have the option to accelerate if either the trustee or bondholders representing at least 25% of the aggregate debt of a particular series then outstanding choose to do so. Enel Generación Chile’s local bonds do not have cross default provisions arising from its subsidiaries.
Payment of dividends and distributions by our subsidiaries and affiliates represent an important source of funds for us. The payment of dividends and distributions by certain subsidiaries and affiliates are potentially subject to legal restrictions, such as legal reserve requirements, and capital and retained earnings criteria, and other contractual restrictions. We are currently in compliance with the legal restrictions, and therefore, they currently do not affect the payment of dividends or distributions to us. Certain credit facilities and investment agreements of our subsidiaries may restrict the payment of dividends or distributions in certain special circumstances. For instance, one of Enel Generación Chile’s UF-denominated Chilean bonds restricts the amount of intercompany loans that Enel Generación Chile and its subsidiaries are allowed to lend to related parties. The threshold for such aggregate restriction of intercompany loans is US$ 100 million equal to approximately Ch$ 67 billion. For a description of liquidity risks resulting from our company status, please see “Item 3. Key Information — D. Risk Factors— We depend on payments from our subsidiaries, jointly-controlled entities and associates to meet our payment obligations.”
Our estimated capital expenditures for 2017 through 2019 amount to Ch$ 888 billion, of which Ch$ 704 billion are considered non-discretionary investments. Maintenance capital expenditures is considered non-discretionary because we need to maintain the quality and operation standards required for our facilities, but we do have some flexibility regarding the timing for these investments. We consider the investment in expansion projects under execution as non-discretionary expenditures, such as those for Los Cóndores project, as well as water rights. We consider the remaining Ch$ 184 billion as discretionary capital expenditures. The latter includes expansion projects that are still under evaluation, in which case we would undertake them only if deemed profitable.
We do not currently anticipate liquidity shortfalls affecting our ability to satisfy the material obligations described in this Report. We expect to be able to refinance our consolidated indebtedness as it becomes due, fund our purchase obligations outlined previously with internally generated cash and fund capital expenditures with a mixture of internally generated cash and borrowings.
C.
| Research and Development, Patents and Licenses, etc.
|
None.
Our subsidiaries are engaged in the generation and distribution of electricity in Chile. Our businesses are subject to a wide range of conditions that may result in significant variability in our earnings and cash flows from year to year. We seek to establish a conservative and well-balanced commercial policy, which aims at controlling relevant variables, reducing risks and providing stability in our results of operations.
Our net income is principally the result of operating income from our generation and distribution businesses, and non-operating income, which consists primarily of income arising from related companies accounted for under the equity method, interest expense and tax expense.
In our generation business, our operating income is impacted by the combined effect of several factors including our contracted electricity prices, prevailing hydrological conditions, the price of fuels used to generate thermal electricity, contracted obligations, generation mix, and the electricity prices prevailing in the spot market, among others. The combined effect of many, and sometimes all, of these factors impact our operating income.
Among the main drivers of our results of operations of our electricity generation business are our sale prices and energy costs. The quantity of electricity sold has been generally stable over time, with increases reflecting economic and demographic growth. Our profits from contracted sales are driven by the ability to generate or buy electricity at a cost lower than the contracted price. However, the applicable price for sales and purchases for electricity sold and purchased in the spot market is much harder to predict because the spot generation price is influenced by many factors. Abundant hydrological conditions generally lower spot prices, while dry conditions increase them. However, our operating income might not be impacted adversely even when we are required to buy at high
prices in the spot market if our commercial policy is appropriately managed. Our goal is to have a conservative and well balanced commercial policy, which aims at controlling relevant variables, provides stability to profits, and mitigates our exposure to the volatility of the spot market by contracting sales of a significant portion of our expected electricity generation through long-term electricity supply contracts. Our optimal level of electricity supply commitments is one that allows us to protect ourselves against low marginal cost conditions, such as those existing during the rainy season, while still taking advantage of high marginal cost conditions, such as higher spot market prices during dry years. In order to determine the optimal mix of long-term contracts and sales in the spot market we: (i) project our aggregate generation taking into consideration our generation mix, the incorporation of new projects under construction and a dry hydrology scenario, (ii) create demand estimates using standard economic theory, and (iii) forecast the system’s marginal cost using proprietary stochastic models.
Currently, our contracted sales are not standardized and the terms and conditions of these sale contracts are individually negotiated. Typically, when we negotiate these sale contracts, we try to set the price at a premium over future expected spot prices so as to mitigate the risk of future increases in spot prices. However, the premium can vary substantially depending on a variety of conditions. The proportion of contracted sales with regulated customers (distributors) has increased in relation to the non-regulated customers. This allows us to have consistent prices for longer periods, normally between 10 to 20 years, which combined with our conservative commercial policy, generally provides for our profitability. Most regulated tariffs are composed of 70% U.S. consumer price index (“CPI”) and 30% commodities prices. Recently, the tariff components have been 25% of U.S. CPI, 25% Henry Hub prices, 25% Brent prices and 25% coal prices, in order to better reflect higher commodity dependence. We expect that during the next three years, regulated tariff rates in Chile will remain fairly stable, without material changes.
We routinely participate in energy bids and we have been awarded long-term energy sale contracts. These contracts incorporate the expected variable cost considering the changes in the main variables, secure the sale of our current and expected new capacity and allow us to stabilize our income. Currently, 30.6 % of our expected annual generation is sold under contracts with terms of at least ten years and 83.0 % is sold under contracts with terms of at least five years.
Spot prices could be affected by international prices for commodities such as fuel oil, coal and LNG, since Chile does not produce coal or hydrocarbons in any significant quantities. Fuel prices affect our results since commodity prices directly affect generation costs of our thermal power plants. Commodity prices, mainly oil, materially decreased since the second half of 2014 reaching their lowest level in February 2016 and increasing slightly during 2016, but still remaining lower than 2015 prices. It is expected that fuel prices will continue to increase during 2017 and, therefore our costs would correspondingly increase. Our costs also depend on other factors such as spot prices, generation mix, hydrology conditions and our contractual surpluses/deficits. As described above, our contracted sales prices are indexed to coal, Brent and Henry Hub prices; therefore, sales prices will also be affected by variations of commodity prices, impacting in part our results. Commodities are contracted for long-term periods (10-15 years) and we try to determine the indexation formula based on our cost forecasts. The indexation of long-term sale prices tries to hedge revenues and operating costs, which are also constantly monitored and analyzed to reach favorable hedge positions in the short-term as well.
In order to mitigate the risk of fuel cost increases, we have entered into supply contracts to cover part of the fuel needed to operate the thermal generation units, which operate with natural gas among other types of fuel. In July 2013, we renegotiated a LNG sale and purchase agreement with British Gas through 2030, allowing us to secure our long-term LNG supply at competitive prices, with significant flexibility and at capacities sufficient for our current and future needs. This enhances our position to manage fuel supply risks, especially when facing increasing fuel costs scenarios. This is becoming more important as there is an increasing trend to penalize fuel intensive technologies, such as coal and diesel, which have greater environmental impacts.
In 2016, Enel Generación Chile entered into a Terminal Use Agreement with GNL Mejillones, a port located in northern Chile, to discharge LNG, becoming one of the main suppliers in the zone. This agreement allowed us to renew gas purchase contracts with industrial customers and to supply our thermal plants that are part of the SING.
During 2016, the average marginal costs in the SIC decreased by 37% compared to the previous year, mainly due to a decrease in commodity prices, an increase in NCRE generation and a greater availability of thermal electricity generation despite the drought that has affected southern Chile. This decrease could continue depending on the availability of water for generation. The lower marginal cost partially offset our higher energy purchase costs due to higher physical energy purchases in the spot market in 2016 compared to 2015. Also, we increased our thermal generation given the higher availability of the Bocamina and San Isidro thermal power plants. The combination of these factors had a positive effect on our operating income in the generation segment.
Other factors that affect operating income include transmission costs incurred when delivering electricity from its source to end consumers. The transmission charge is set by the Chilean regulator, and has tended to remain stable over time and with the recent regulations, the costs will be progressively transferred to the customers.
NCRE energy generation will increase in the upcoming years. According to the “Study of Integration of NCRE into the National Interconnected System” published by the CDEC -SIC in December 2016, it is expected that NCRE capacity will increase from the current 12.9% of the aggregate capacity of the SIC and the SING to 30% of the estimated capacity of the National Interconnected System (“SIN” in its Spanish acronym, that has replaced and combined the SIC and the SING since January 2017) in 2025. This growth tendency is a direct consequence of several initiatives that the Chilean government is promoting with the Energy Agenda program, which aim to have by 2050 70% of the national generation of electricity to be produced by NCRE. The government is also promoting a new transmission law, with which it introduced the “Development Poles” concept to encourage the development of new projects in zones that might have high potential to generate NCRE, using the same transmission system. For more detail, see “Item 4. Information on the Company— B. Business Overview — Electricity Industry Regulatory Framework.”
With respect to the development of new projects to increase our installed capacity, the cost of developing conventional energy projects has increased over time due to growing environmental restrictions, scarcity of places to locate plants coupled with significant opposition from different groups that delay development and increase costs. On the other hand, in the last couple of years, the cost of NCRE has decreased as a result of technological improvements, enabling smaller projects to become profitable while simultaneously facing less environmental restrictions and minor opposition. In addition, NCRE sources have a shorter construction period and their smaller size provides more flexibility to address changes in demand. The emergence of NCRE power plants will require that markets be more flexible and focus on operational efficiency to combine the different technologies.
Enel, our ultimate controlling shareholder, announced in October 2015 that it will no longer build coal power plants because it considers the technology to be counterproductive considering its desire to be carbon neutral by 2050. Closures of these existing coal power plants are scheduled at the end of their life cycles. The lost capacity will most likely be substituted with NCRE generation.
In connection with the distribution segment tariffs, and taking into account the future periodic review process in Chile, we expect that the regulator will continue to recognize investments, encourage efficiency, and establish prices that will allow for an appropriate return on our investment. We also anticipate that our distribution company will maintain its profitability during the period between periodic tariff setting processes, according to price cap tariff model, due to growth and economies of scale. After tariffs have been set, distribution companies have the opportunity to increase their efficiency, and obtain extra profits associated with such efficiencies, during the period subsequent to each new tariff setting.
Although the price at which a distribution company purchases electricity has an impact on the price at which it is sold to end customers, it does not have an impact on our profitability since the cost of electricity purchased is passed to end customers through tariffs. Regulation dictates that purchase contracts must be made through long-term contracts and are the result of a regulated tender.
During 2016, some customers, who are able to choose their tariff according to the Chilean regulation and chose a regulated tariff in the past, are switching to unregulated tariffs. These customers are tendering, either directly or in association with other customers, their energy needs given that currently unregulated tariffs are lower than regulated tariffs, since the latter sets its rates based on contracts tendered in the past at higher prices. Lower prices should be reflected in the regulated tariffs when a recent low cost contract is recognized.
We expect to grow organically in the distribution business. We are continuously seeking investments, especially in new technologies to automate our networks to achieve operational and economic efficiencies. During 2016, we installed 50 thousand smart meters in our concession area, which will permit bi-directional communication, digitized and interconnected networks, and enable our consumers to improve their energy efficiency. In addition, we are looking into other business development related to the distribution of electricity known as Value Added Products and Services (PSVA), such as public lighting and full electric appliances, including electricity transportation, in all cases including customers outside of our concession area.
For more detail on how factors impact the net income of our electricity generation and distribution businesses and 2016 results compared with those recorded in previous periods, see “Item 5. Operating and Financial Review and Prospects — A. Operating Results — 1. Discussion of Main Factors Affecting Operating Results and Financial Condition of the Company” and “Item 5. Operating and Financial Review and Prospects — A. Operating Results — 2. Analysis of Results of Operations for the Years Ended December 31, 2016 and 2015.”
We expect reasonably good operating performance during the coming years given the macroeconomic perspective for Chile. Despite current uncertainties concerning the global economy, there is favorable expectation for Chile’s growth during the next five years, including an expected 1.8% growth in GDP in 2017, based on Latin American Consensus Forecasts published by Consensus Economics Inc. on March 20, 2017, and an expected 4% growth in the annual electricity demand over the next five years.
E.
| Off-balance Sheet Arrangements.
|
We are not a party to any off-balance sheet arrangements.
F.
| Tabular Disclosure of Contractual Obligations.
|
The table below sets forth our cash payment obligations as of December 31, 2016:
| | Payments due by Period | | Ch$ billion | | Total | | | 2017 | | | 2018-2019 | | | 2020-2021 | | | After 2021 | | Purchase obligations(1) | | | 16,776 | | | | 897 | | | | 1,892 | | | | 2,039 | | | | 11,948 | | Interest expense(2) | | | 494 | | | | 53 | | | | 103 | | | | 101 | | | | 237 | | Yankee bonds | | | 480 | | | | - | | | | - | | | | - | | | | 480 | | Local bonds(3) | | | 354 | | | | 5 | | | | 59 | | | | 59 | | | | 231 | | Pension and post-retirement obligations(4) | | | 60 | | | | 7 | | | | 8 | | | | 7 | | | | 37 | | Financial leases | | | 21 | | | | 3 | | | | 5 | | | | 5 | | | | 8 | | Total contractual obligations | | | 18,185 | | | | 966 | | | | 2,068 | | | | 2,211 | | | | 12,941 | |
(1)
| Includes generation and distribution business purchase obligations which are comprised mainly of energy purchases, operating and maintenance contracts, and other services. Of the total contractual obligations of Ch$ 16,776 billion, 57,8% corresponds to energy purchased for distribution, 37.8% corresponds primarily to fuel supply, maintenance of medium and low voltage lines, supplies of cable and utility poles, and energy purchased for generation, and the remaining 4,3% corresponds to miscellaneous services, such as LNG regasification, fuel transport and coal handling.
|
(2)
| Interest expense includes the interest payments for all outstanding financial obligations, calculated as principal multiplied by the interest rate, presented according to when the interest payment comes due.
|
(3)
| Represents net value. Hedging instruments included might substantially affect the outstanding amount of debt.
|
(4)
| We have funded and unfunded pension and post-retirement benefit plans. Our funded plans have contractual annual commitments for contributions, which do not change based on funding status. Cash flow estimates in the table are based on such annual contractual commitments including certain estimable variable factors such as interest. Cash flow estimates in the table relating to our unfunded plans are based on future discounted payments necessary to meet all of our pension and post-retirement obligations.
|
The information contained in Items 5.E and 5.F contains statements that may constitute forward-looking statements. See “Forward-Looking Statements” in the “Introduction” of this information statement, for safe harbor provisions.
Item 6. Directors, Senior Management and Employees
A.
| Directors and Senior Management.
|
Directors
Our Board of Directors consists of seven members who are elected for a three-year term at an Ordinary Shareholders’ Meeting (“OSM”). Following the end of their term, they may be re-elected or replaced. If a vacancy occurs in the interim, the Board of Directors will elect a temporary director to fill the vacancy until the next OSM, at which time the entire Board of Directors will be elected to a new three-year term. Our Executive Officers are appointed and hold office at the discretion of the Board of Directors.
The business address of our directors is c/o Enel Chile S.A., Santa Rosa 76, Santiago, Chile.
Our Board of Directors is as follows:
Directors
| | Position
| | Current Position
Held Since
| Hermán Chadwick P.
| | Chairman
| | 2016 | |
(1) As of April 30, 2019. At ordinary shareholders meeting held on April 25, 2018, the members of our Board of Directors were elected to three-year terms ending in April 2021. During the Board of Directors’ meeting held on April 25, 2018, Mr. Chadwick was appointed Chairman and Messrs. Gazmuri, Cabrera and Jofré as members of the Directors’ Committee. Mr. Gazmuri was also appointed Financial Expert of the Directors’ Committee. Set forth below are brief biographical descriptions of the members of our Board of Directors, three of whom reside outside Chile and four of whom reside in Chile, as of December 31, 2018: Herman Chadwick P. Mr. Chadwick is law partner at Chadwick & Cía. and a director of several companies unrelated to us, including Aguas Andinas, a Chilean water utility company, and Viña Santa Carolina, a Chilean winery. Mr. Chadwick is an advisor and arbitrator at Centro de Arbitraje y Mediación de la Cámara de Comercio de Santiago, an association that provides arbitration services to resolve legal disputes. Mr. Chadwick holds a law degree from Pontificia Universidad Católica de Chile. Salvatore Bernabei Mr. Bernabei is the Head of Global Procurement of Enel since May 2017. He has been Head of Renewable Energies Latin America of Enel Green Power (2016-2017) and Country Manager for Chile and the Andean Countries (2013-2016). He joined Enel in 1999 and held several positions involving project integration, execution, inspection, operations and logistics. Mr. Bernabei holds a degree in industrial engineering from Università degli Studi di Roma “Tor Vergata”, and an MBA from Politecnico di Milano. Pablo Cabrera G. Mr. Cabrera is a member of the Chilean Society of International Law. Mr. Cabrera served concurrently as ambassador to the Holy See, to the Sovereign Military Order of Malta and Albania (2006-2010), to the People’s Republic of China (2004-2006) to Russia (2000-2004) and to the UK (1999-2000). Mr. Cabrera holds a law degree from Pontificia Universidad Católica de Chile and Academia Diplomática Andrés Bello. Daniele Caprini Mr. Caprini is the Head of Enel’s Group Planning and Reporting and the CFO of Enel Colombia since 2016. He headed Enel’s Financial Valuation and Investment Control (2013-2015), Management Control (2015-2016) and Strategic Planning M&A and Financial Valuation (2009-2013) of Enel Green Power S.A. Mr. Caprini holds a degree in economics from the Università degli Studi di Siena and an MBA from Roma Università LUISS. Giulio Fazio Mr. Fazio is the Head of Enel’s Legal and Corporate Affairs since January 2016. Previously, he held a comparable position at Enel Green Power S.p.A. (2008-2014). Since 2004, he has worked in finance and antitrust operations in Enel’s Legal Department. Mr. Fazio joined an Enel affiliate in 1996. He holds a degree in law and a Ph.D. from Università degli Studi di Palermo. Fernán Gazmuri P. Mr. Gazmuri has been a board member of companies unrelated to us. He is Currently Vice Chairman of Invexans S.A., a telecom and Maritime Cable Company and a Director of Citroën Chile S.A.C., the Chilean Security Association, Invexans S.A, Sociedad de Fomento Fabril (SOFOFA) and Asociación Nacional Automotriz de Chile. In 2013-2016, he was director of Empresa Nacional del Petróleo (ENAP), the Chilean state-owned oil company and Vice-Chairman of the Chilean International Chamber of Commerce. He holds a degree in business administration from Pontificia Universidad Católica de Chile. Gerardo Jofré M. Mr. Jofré is a director of CAP S.A., a mining and steel company, and a member of the self-regulatory council of the Asociación de Aseguradores de Chile, the insurance companies association. In 2010-2014 he was Chairman of the Board of Codelco, the Chilean state-owned copper mining company. He has been a director of several prominent Chilean companies unrelated to us, and has held several managerial positions, primarily in Banco Santander Chile and affiliates. He holds a degree in business administration from Pontificia Universidad Católica de Chile. Executive Officers Set forth below are our Executive Officers as of December 31, 2018. Executive Officers | | Position | | Age(1) | | Joined Enel or
Affiliate in | | Current Position
Held Since | Paolo Pallotti | | Chief Executive Officer | | 56 | | 1990 | | 2018 | Angel Barrios R. | | IT Officer | | 49 | | 1994 | | 2018 | Juan José Bonilla A. | | Procurement Officer | | 40 | | 2010 | | 2018 | Raffaele Cutrignelli | | Internal Audit Officer | | 38 | | 1995 | | 2016 | Marcelo Antonio de Jesus | | Chief Financial Officer | | 49 | | 2018 | | 2018 | Monica De Martino | | Regulatory Affairs Officer | | 43 | | 2011 | | 2017 | Alison Dunsmore M. | | Services Officer | | 39 | | 2005 | | 2018 | José Miranda M. | | Communications Officer | | 37 | | 2014 | | 2016 | Antonella Pellegrini | | Sustainability Officer | | 57 | | 2000 | | 2017 | Andrés Pinto B. | | Safety Officer | | 40 | | 2010 | | 2017 | Liliana Schnaidt H. | | Human Resources Officer | | 40 | | 2009 | | 2018 | Claudia Navarrete C. | | Planning and Control Officer | | 46 | | 1998 | | 2018 | Pedro Urzúa F. | | Institutional Affairs Officer | | 49 | | 2012 | | 2016 | Domingo Valdés P. | | General Counsel | | 55 | | 1993 | | 2016 |
(1) As of April 30, 2019. Set forth below are brief biographical descriptions of our Executive Officers, all of whom reside in Chile. Paolo Pallotti: Mr. Pallotti was the CFO of Enel Américas in 2018. He played a key role in various Enel corporate reorganization processes. He has been CFO of Enel’s Italian businesses (2014-2018), Financial Director of Enel’s Infrastructure & Networks division (2012), and director of Enel Energia S.p.A. (2015-2018) and Enel Italia S.r.L (2017-2018). He holds a degree in electronic engineering from Università degli Studi di Ancona. Angel Barrios R.: Mr. Barrios has held several positions related to Information Systems, including Head of ICT, a subsidiary of Enel Chile (2014-2018). Mr. Barrios holds a degree in civil engineering in informatics from Universidad Santa María and a master’s degree in Information Technology from Universidad Santa María. Juan José Bonilla A.: Mr. Bonilla was CEO of EGP Chile in 2017 and was Operation and Maintenance Manager of EGP North America (2014-2016). Before, he held managerial positions at EGP including Head of Wind Maintenance and Technical Support. He holds a degree in industrial engineer from Escuela Superior de Ingenieros Industriales de Madrid, an MBA from ESERP Business School, and a master’s degree from Universidad San Pablo - CEU. Raffaele Cutrignelli: Mr. Cutrignelli was the Audit Officer for Codensa and Emgesa (2015-2016) and the Head of Latin American Audit for EGP in Brazil (2013-2015). Mr. Cutrignelli holds a degree in international business from Nottingham Trent University, and a master’s degree in audit and internal controls from Universitá di Pisa. Marcelo Antonio de Jesus: Mr. de Jesus was CFO at Eletropaulo and a member of the Business Council of AES Group companies and held finance positions at TAM Linhas Aéreas S.A, Latam Airlines Group, Flora Higiene y Belleza, Syngenta and AES Latin America & Caribbean. He graduated from Universidad de São Caetano do Sul Business School and holds a master’s degree in business administration from Dom Cabral Foundation. Mónica De Martino: Ms. De Martino was Head of EGP Regulatory Affairs Latin America (2011-2017). She holds a degree in political science from Libera Università Internazionale degli Studi Sociali Guido Carli, an MBA from Columbia Business School and a graduate degree from London Business School. Alison Dunsmore M.: Ms. Dunsmore has held various Enel positions including Head of Commercial Management (2013-2015) and Chief of Staff and Head of Strategic Planning (2015-2017). Ms. Dunsmore holds a degree in civil industrial engineer from Universidad de Santiago de Chile. José Miranda M.: Before joining Enel, Mr. Miranda worked for eleven years at Televisión Nacional de Chile, a state-owned Chilean TV channel. He is an audiovisual communicator with a degree from DUOC UC and a graduate degree in management from Universidad de Chile. Antonella Pellegrini: Ms. Pellegrini has held managerial positions in business development and sustainability for EGP affiliates since 2014. She holds a degree in marketing and communications from Istituto Europeo di Design. Andrés Pinto B.: Mr. Pinto has held managerial positions in project planning, cost control and operations for Enel affiliates since 2010. Mr. Pinto holds a degree in civil engineering from Pontificia Universidad Católica de Chile. Claudia Navarrete C.: Ms. Navarrette held management positions in analysis and financial control in 2012-2018. Ms. Navarrete holds a degree in civil engineering, a master’s degree in computer science and an MBA from Pontificia Universidad Católica de Chile. Liliana Schnaidt H. Ms. Schnaidt held positions in EGP business development, with a focus on solar energy (2009-2018). Ms. Schnaidt holds a degree in civil engineering from Pontificia Universidad Católica de Chile. Pedro Urzúa F.: Mr. Urzúa has been Institutional Affairs Officer for Chile and the Andean Countries for EGP (2012-2016), Director of Corporate Affairs of ENAP (2009-2012), director of Fundación Acción RSE (2012) and Communications Director of ENAP Sipetrol (2009-2012). He a holds a degree in journalism from Universidad de Artes y Ciencias de la Comunicación. Domingo Valdés P.: Mr. Valdés is the Secretary of the Boards of Directors of both Enel Chile and Enel Américas and is a Professor of Economic and Antitrust Law at Universidad de Chile. Mr. Valdés holds a law degree from Universidad de Chile and a master’ in law degree from the University of Chicago. B.Compensation. At the OSM held on April 25, 2018, our shareholders approved the compensation policy for our Board of Directors. Director compensation consists of a monthly fixed compensation of UF 216 per month and an additional fee of UF 79.2 per meeting, up to a maximum of 16 sessions in total, including ordinary and extraordinary meetings, within the respective fiscal year. The Chairman of the Board is entitled to double the compensation of other directors. The members of our Directors’ Committee are paid a monthly fixed compensation of UF 72 per month and an additional fee of UF 26.4 per meeting, up to a maximum of 16 sessions in total, including ordinary and extraordinary meetings. The monthly fees (fixed and variable) are considered as advances on the annual variable fee. If a director serves on one or more Boards of Directors of the subsidiaries and/or associate companies or serves as director of other companies or corporations in which the economic group holds an interest directly or indirectly, the director can only receive compensation from one of these Boards of Directors. Executive Officers of our Company and/or of our subsidiaries or associate companies will not receive compensation in the case that they serve as director of any other affiliate. However, compensation may be received by the officer to the extent that it is expressly and previously authorized as an advance payment of the variable portion of the wage to be paid by the affiliate with which the officer signed a contract. In 2018, the total compensation paid to each of our directors, including fees for attending Directors’ Committee meetings was as follows: Director | | Fixed
Compensation | | Ordinary and
Extraordinary
Session | | Directors’
Committee (Fixed
Compensation) | | Ordinary and
Extraordinary
Session
(Directors’
Committee) | | Total | | | | | | | | (in Th Ch$) | | | | | | Herman Chadwick P. | | 133,016 | | 48,773 | | — | | — | | 181,789 | | Salvatore Bernabei | | — | | — | | — | | — | | — | | Pablo Cabrera G. | | 66,508 | | 24,386 | | 22,176 | | 8,842 | | 121,912 | | Daniele Caprini | | — | | — | | — | | — | | — | | Giulio Fazio | | — | | — | | — | | — | | — | | Fernán Gazmuri P. | | 66,508 | | 24,386 | | 22,176 | | 8,842 | | 121,912 | | Juan Gerardo Jofré M. | | 66,508 | | 24,386 | | 22,176 | | 8,842 | | 121,912 | | Total | | 332,540 | | 121,931 | | 66,527 | | 26,526 | | 547,525 | |
We do not disclose, to our shareholders or otherwise, any information about an individual Executive Officer’s compensation. Executive Officers are eligible for variable compensation under a bonus plan. The annual bonus plan is paid to our Executive Officers for achieving company-wide objectives and for their individual contribution to our results and objectives. The annual bonus plan provides for a range of bonus amounts according to seniority level and consists of a certain multiple of gross monthly salaries. For the year ended December 31, 2018, the aggregate gross compensation, paid or accrued, for all of our Executive Officers, attributable to fiscal year 2018, was Ch$ 2,676 million in fixed compensation and Ch$ 765 million in variable compensation and benefits. We entered into severance indemnity agreements with all of our Executive Officers, pursuant to which we will pay a severance indemnity in the event of voluntary resignation or termination by mutual agreement among the parties. The severance indemnity does not apply if the termination is due to willful misconduct, prohibited negotiations, unjustified absences or abandonment of duties, among other causes, as defined in Article 160 of the Chilean Labor Code. All of our employees are entitled to legal severance pay if terminated due to our needs, as defined in Article 161 of the Chilean Labor Code. The total amounts accrued as of the end of 2018 to provide severance indemnity to our Executive Officers totaled Ch$ 391.4 million. There are no other amounts set aside or accrued to provide for pension, retirement or similar benefits for our Executive Officers. C. Board Practices. Our Board of Directors in office as of December 31, 2018, was elected at the OSM held on April 25, 2018, for a three-year term that ends in April 2021. For information about each of the directors and the year that they began their service on the Board of Directors, see “Item 6. Directors, Senior Management and Employees — A. Directors and Senior Management” above. Members of the Board of Directors do not have service contracts with us or with any of our subsidiaries that provide them benefits upon termination of their service. Corporate Governance We are managed by a Board of Directors, in accordance with our bylaws, consisting of seven directors who are elected by our shareholders at an OSM, each of whom serves for a three-year term. Following the end of their term, they may be re-elected indefinitely or replaced. Staggered terms are not permitted under Chilean law. If a vacancy occurs on the Board of Directors during the three-year term, the Board of Directors may appoint a temporary director to fill the vacancy. A vacancy triggers an election for every seat on the Board of Directors at the next OSM. Chilean corporate law provides that a company’s Board of Directors is responsible for the management and representation of a company in all matters concerning its corporate purpose, subject to the provisions of the company’s bylaws and the shareholders’ resolutions. In addition to the bylaws, our Board of Directors has adopted regulations and policies that guide our corporate governance principles. Our corporate governance policies are included in the following policies or procedures: the Manual for the Management of Information of Interest to the Market (the “Manual”), the Human Rights Policy (Política de Derechos Humanos), the Code of Ethics and a Zero Tolerance Anti-Corruption Plan (the “ZTAC Plan”), the Penal Risk Prevention Model, the “Guidelines 231: Guidelines applicable to non-Italian subsidiaries in accordance with Legislative Decree 231 of June 8, 2001” (the “Guidelines 231”) and procedures issued in compliance with General Regulation 385 issued by the CMF. In order to ensure compliance with Securities Market Law 18,045 and CMF regulations, our Board of Directors approved the Manual at the meeting held on February 29, 2016 and ratified such decision at its meeting held on March 23, 2016. This document addresses applicable standards regarding the information in connection with transactions of our securities and those of our affiliates, entered into by directors, management, principal executives, employees and other related parties, the existence of blackout periods for such transactions undertaken by directors, principal executives and other related parties, the existence of mechanisms for the continuous disclosure of information that is of interest to the market and mechanisms that provide protection for confidential information. The Manual was released to the public in 2016 and it is posted on our website at www.enelchile.cl. The provisions of this Manual apply to the members of our Board, as well as our executives and employees who have access to confidential information, and especially those who work in areas related to the securities markets. Our Board of Directors approved a procedure for relationships between Politically Exposed People (Procedimiento Personas Políticamente Expuestas y Conexas) and our Company, which established a specific regulation for their commercial and contractual relationships. The Human Rights Policy incorporates and adapts the United Nations’ general principles related to human rights into the corporate reality. In order to supplement the aforementioned corporate governance regulations, our Board of Directors approved a Code of Ethics and a ZTAC Plan at its first meeting held on February 29, 2016 and ratified such decision at its meeting held on March 23, 2016. The Code of Ethics is based on general principles such as impartiality, honesty, integrity and other ethical standards of similar importance, all of which are expected from our employees. The ZTAC Plan reinforces the principles included in the Code of Ethics, but with special emphasis on avoiding corruption in the form of bribes, preferential treatment, prohibition of political donations under all circumstances and other similar matters. In order to comply with Law 20,393 enacted on December 2, 2009, which imposes criminal responsibility on legal entities for the crimes of asset laundering, financing of terrorism and bribing of public officials, our Board of Directors approved the Penal Risk Prevention Model at its first meeting held on February 29, 2016 and ratified such decision at its meeting held on March 23, 2016. The law encourages companies to adopt this model, whose implementation involves compliance with managerial and supervision duties. The adoption of the Penal Risk Prevention Model mitigates, and in some cases relieves, the effects of criminal responsibility even when a crime is committed. At its meeting held on October 27, 2016, our Board approved “The Global Compliance Program for Corporate Penal Liability”, which was incorporated into the Penal Risk Prevention Model to reflect current standards and appointed Mr. Rafael Cutrignelli as our Penal Risk Prevention and Global Compliance Program for Corporate Penal Liability Officer, as required by the Penal Risk Prevention Model. Mr. Cutrignelli also serves as Internal Audit Officer for both of Enel Américas and Enel Chile. On February 29, 2016, our Board of Directors also approved the Guidelines 231 and ratified such decision at its meeting held on March 23, 2016. The Guidelines 231 is defined by Italian Legislative Decree 231, which was enacted on June 8, 2001. It establishes a compliance program that identifies the behaviors expected of related parties for the non-Italian subsidiaries of Enel. Given that our ultimate controlling shareholder, Enel, complies with Italian Legislative Decree 231, which establishes management responsibility for Italian companies as a consequence of certain crimes committed in Italy or abroad, in the name of or for the benefit of such entities, including those crimes described in Chilean Law 20,393, these guidelines set a group of measures, with standards of behavior expected from all employees, advisers, auditors, officials, directors as well as consultants, contractors, commercial partners, agents and suppliers. Legislative Decree 231 includes various activities of a preventive nature that are coherent with and integral to the requirements and compliance with Chilean Law 20,393, which deals with the criminal responsibility of legal entities. These guidelines are supplementary to the standards included in the Code of Ethics and the ZTAC Plan. On November 29, 2012, the CMF issued General Regulation 341, which established regulations for the disclosure of information with respect to the standards of corporate governance compliance adopted by publicly held limited liability corporations and set the procedures, mechanisms and policies that are indicated in the Appendix to the regulation. The objective of this regulation is to provide credible information to investors with respect to good corporate governance policies and practices adopted by publicly held limited liability corporations, which include us, and permit entities like stock exchanges to produce their own analyses to help the various market participants to understand and evaluate the commitment of companies. General Regulation 341 was substituted by General Regulation 385, issued by the CMF on June 8, 2015. This regulation has similar objectives than the former General Regulation 341, but includes additional issues, by the way of separating each policy into several more detailed policies. Subjects such as non-discrimination, inclusion and sustainability are particularly important in this new regulation. The Appendix of General Regulation 385 is divided into the following four sections with respect to which companies must report the corporate practices that have been adopted: (i) the functioning and composition of the board, (ii) relations between the company, shareholders and the general public, (iii) risk management and control, and (iv) assessment by a third party. Publicly held limited liability corporations should send the information with respect to corporate governance practices to the CMF, no later than March 31 of each year, using the contents of the Appendix to this regulation as criteria. If none of them is adopted, the company must explain its reasons to the CMF. The information should refer to December 31 of the calendar year prior to its dispatch. At the same time, such information should also be at the public’s disposal on the company’s website and must be sent to the stock exchanges. Compliance with the New York Stock Exchange Listing Standards on Corporate Governance The following is a summary of the significant differences between our corporate governance practices and those applicable to U.S. domestic issuers under the corporate governance rules of the NYSE. Independence and Functions of the Directors’ Committee (Audit Committee) Chilean law requires that at least two thirds of the Directors’ Committee be independent directors. According to Article 50 bis of Law No.18,046, a member would not be considered independent if, at any time, within the last 18 months he: (i) maintained any relationship of a relevant nature and amount with the company, with other companies of the same group, with its controlling shareholder or with the principal officers of any of them or has been a director, manager, administrator or officer of any of them; (ii) maintained a family relationship with any of the members described in (i) above; (iii) has been a director, manager, administrator or principal officer of a non-profit organization that has received contributions from (i) above; (iv) has been a partner or a shareholder that has controlled, directly or indirectly, 10% or more of the capital stock or has been a director, manager, administrator or principal officer of an entity that has provided consulting or legal services for a relevant consideration or external audit services to the persons listed in (i) above; and (v) has been a partner or a shareholder that has controlled, directly or indirectly, 10% or more of the capital stock or has been a director, manager, administrator or principal officer of the principal competitors, suppliers or customers. In case there are not sufficient independent directors on the Board to serve on the Directors’ Committee, Chilean law determines that the independent director nominates the rest of the members of the Directors’ Committee among the remaining Board members that do not meet the Chilean law independence requirements. Chilean law also requires that all publicly held limited liability stock corporations that have a market capitalization of at least UF 1,500,000 (Ch$ 413 billion as of December 31, 2018) and at least 12.5% of its voting shares are held by shareholders that individually control or own less than 10% of such shares, must have at least one independent director and a Directors’ Committee. Under the NYSE corporate governance rules, all members of the Audit Committee must be independent. The Audit Committee of a U.S. company must perform the functions detailed in, and otherwise comply with the requirements of NYSE Listed Company Manual Rules 303A.06 and 303A.07. As of July 31, 2005, non-U.S. companies have been required to comply with Rule 303A.06, but not with Rule 303A.07. We currently comply with the independence and the functional requirement of Rule 303A.06. Since our incorporation on March 1, 2016, we have complied with the independence and the functional requirement of Rule 303A.06. Pursuant to our bylaws, all members of the Directors’ Committee must satisfy the requirements of independence, as stipulated by the NYSE. The Directors’ Committee is composed of three members of the Board and complies with Article 50 bis of Law No.18,046, as well as with the criteria and requirements of independence prescribed by the Sarbanes-Oxley Act (“SOX”), the SEC and the NYSE. As of the date of this Report, the Directors’ Committee complies with the conditions of the Audit Committee as required by the SOX, the SEC and the NYSE corporate governance rules. As a result, we have a single Committee, the Directors’ Committee, which includes among its functions the duties performed by an Audit Committee. Our Directors’ Committee performs the following functions: · review of financial statements and the reports of the external auditors prior to their submission for shareholders’ approval; · present proposals to the Board of Directors, which will make its own proposals to shareholders’ meetings, for the selection of external auditors and private rating agencies; · review of information related to our transactions with related parties and reports the opinion of the Directors’ Committee to the Board of Directors; · the examination of the compensation framework and plans for managers, executive officers and employees; · the preparation of an Annual Management Report, including its main recommendations to shareholders; · provide information to the Board of Directors about the convenience of recruiting external auditors to provide non-auditing services, when such services are not prohibited by law, depending on whether such services might affect the external auditors’ independence; · oversee the work of external auditors; · review and approval of the annual auditing plan by the external auditors; · evaluate the qualifications, independence and quality of the auditing services; · elaborate on policies regarding employment of former members of the external auditing firm; · review and discuss problems or disagreements between management and external auditors regarding the auditing process; · establish procedures for receiving and dealing with complaints regarding accounting, internal control and auditing matters; · any other function mandated to the Committee by the bylaws, our Board of Directors or our shareholders. Corporate Governance Guidelines The NYSE’s corporate governance rules require U.S.-listed companies to adopt and disclose corporate governance guidelines. Chilean law provides for this practice through the disclosure of the procedures related to the General Resolution 385 and the Manual. We have also adopted the Code of Ethics, and our bylaws include provisions that govern the creation, composition, attributions, functions and compensation of the Directors’ Committee described above, which includes among its functions the duties performed by an Audit Committee. D. Employees. The following table sets forth the total number of our personnel, permanent and temporary employees, in Enel Chile and in our subsidiaries as of December 31, 2018, 2017, and 2016: Company | | 2018 | | 2017 | | 2016 | | Enel Generation | | 678 | | 753 | | 790 | | Pehuenche | | 2 | | 2 | | 2 | | Enel Chile(1) | | 451 | | 431 | | 336 | | Enel Distribution (2) | | 681 | | 669 | | 688 | | Servicios Informáticos e Inmobiliarios Ltda. | | 0 | | 0 | | 103 | | GasAtacama(3) | | 87 | | 93 | | 91 | | EGP Chile (4) | | 163 | | 0 | | 0 | | Total Personnel (5) | | 2,062 | | 1,948 | | 2,010 | |
(1) Includes Servicios Informáticos e Inmobiliarios Ltda., a former subsidiary that merge into us on September 1, 2017. (2) Includes Luz Andes S.A. and Empresa Eléctrica de Colina S.A. (3) Includes GasAtacama Argentina S.A. (4) We have consolidated EGP Chile and its subsidiaries since April 2, 2018. (5) The total number of temporary employees was not significant. All Chilean employees who are dismissed for reasons other than misconduct are entitled by law to severance payment. According to Chilean law, employees holding contracts of indefinite duration are entitled to a payment of one-month’s salary for each year (or a six-month portion thereof) worked, subject to a limit of a total payment of a maximum of 11 months’ pay for employees hired after August 14, 1981. Severance payments to employees hired prior to that date consist of one-month’s salary for each full year worked, not subject to any maximum limitation. Under our collective bargaining agreements, we are obligated to make severance payments to all covered employees in cases of voluntary resignation or death in specified amounts that increase according to seniority and may exceed the amounts required under Chilean law. We have the following bargaining agreements:
|
| In Force |
| Company |
| From |
| To |
| Enel Chile - Collective Bargaining Agreement 1 (1) | | July 2015 | | July 2019 | | Enel Chile - Collective Bargaining Agreement 2 (1) | | January 2016 | | December 2019 | | Enel Chile - Collective Bargaining Agreement 3 (2) | | January 2016 | | December 2019 | | Enel Generation - Collective Bargaining Agreement 1 | | January 2018 | | June 2020 | | Enel Generation - Collective Bargaining Agreement 2 | | January 2018 | | June 2020 | | Enel Generation - Collective Bargaining Agreement 3 | | January 2018 | | December 2020 | | Enel Generation - Collective Bargaining Agreement 4 | | July 2015 | | June 2019 | | Enel Generation - Collective Bargaining Agreement 5 | | January 2016 | | December 2019 | | Enel Generation - Collective Bargaining Agreement 6 | | July 2016 | | June 2020 | | Enel Distribution - Collective Bargaining Agreement 1 | | January 2017 | | December 2020 | | Enel Distribution - Collective Bargaining Agreement 2 | | January 2017 | | December 2020 | | Enel Distribution - Collective Bargaining Agreement 3 | | January 2017 | | December 2020 | | Enel Green Power - Collective Bargaining Agreement 1 | | October 2017 | | September 2020 | | Empresa Eléctrica de Colina | | November 2015 | | October 2019 | | Empresa Eléctrica Panguipulli S.A. | | January 2018 | | December 2020 | | Vice Chairman
| | 2016
| Salvatore Bernabei
| | Director
| | 2016
| Pablo Cabrera G.
| | Director
| | 2016
| Fernán Gazmuri P.
| | Director
| | 2016
| Juan Gerardo Jofré M.
| | Director
| | 2016
| Vicenzo Ranieri
| | Director
| | 2016
|
Set forth below are brief biographical descriptions of the members of our Board of Directors, of whom three reside in Chile and the rest in Europe.
Hernán Chadwick P.
Chairman of the Board of Directors
Mr. Chadwick is partner at Chadwick & Cía, a Chilean law firm. Mr. Chadwick serves as director of several companies unrelated to us, Aguas Andinas, a Chilean utility company, Inversiones Agunas Metropolitana, an investment holding company and controller of Aguas Andinas, and Viña Santa Carolina, a Chilean winery company. In addition, Mr. Chadwick serves as an advisor and arbitrator at Centro de Arbitraje y Mediación de la Cámara de Comercio de Santiago, an association that provides arbitration services to solve disputes and at Sociedad de Fomento Fabril (SOFOFA), a non-profit trade association representing the views and interests of Chilean businessmen. Mr. Chadwick holds a law degree from Pontificia Universidad Católica de Chile.
Giulio Fazio Vice Chairman of the Board of Directors
Mr. Fazio has served as the Head of Legal and Corporate Affairs of Enel since January 2016. Previously, he served in comparable positions in Italy since November 2014, and at Enel Green Power from October 2008 to November 2014. Since 2004, he has served as Head of Extraordinary Finance Operations and Antitrust in Enel’s Legal Department. In 2007, Mr. Fazio was Head of the Legal Department for Iberia and Latin America, a position he maintained until the acquisition of Endesa, S.A. (Spain) was completed. Mr. Fazio started working for Enel as an attorney at Enel Distribution S.p.A. in 1996. Since 2003, Mr. Fazio has been the Chairman of the College of Accounting Reviewers of the Aeroclub of Rome. Mr. Fazio holds a degree in law and a Ph.D. in business law from Università degli Studi di Palermo (Palermo, Italy).
| Salvatore Bernabei
| Director Mr. Bernabei has been Head of Renewable Energies Latin America of Enel Green Power since May 2016. Previously, he was the Country Manager for Chile and the Andean Countries (January 2013 to April 2016). Between November 2011 and December 2012, Mr. Bernabei was the Head of Operations & Maintenance for Enel Green Power in Spain. From November 2010 to October 2011, Mr. Bernabei worked as Engineering and Construction Resource Coordinator for Iberia and Latin America in Enel Green Power. From May 2010 to October 2010 Mr. Bernabei worked as Engineering and Construction Resource Coordinator and Head of Safety and Environment for Iberia for Enel Green Power in Spain. From November 2009 to April 2010, Mr. Bernabei was both Project Execution Manager at Enel Unión Fenosa and European Health Safety Environment Officer at Enel Green Power in Spain. Mr. Bernabei joined Enel in 1999 and held positions as Project Integration Manager, Project Time Manager, Inspection and Spending Manager and Logistics Manager. Mr. Bernabei holds a Degree in Industrial Engineering from Università degli Studi di Roma “Tor Vergata” (Rome, Italy) and an M.B.A from Politecnico di Milano (Milan, Italy).
| | Pablo Cabrera G.48
| Director and Member of the Directors’ Committee
| Mr. Cabrera is a member of the Chilean Society of International Law. He is advisor to the Joint Chiefs of Staff of Chilean National Defense and to Pontificia Universidad Católica de Chile. Mr. Cabrera was a director of Academia Diplomática Andrés Bello, a Chilean institution engaged in the education of future Chilean diplomats, from 2010 to 2014, and also served as a professor at Diego Portales University and at Academia Nacional de Estudios Políticos y Estratégicos, the higher education institution for the Chilean national defense. Mr. Cabrera served in multiple positions within the Chilean government. He served as Ambassador to the following places: Holy See (2006 to 2010), Sovereign Military Order of Malta (2006 to 2010) and concurrently to Albania; People’s Republic of China (2004 to 2006); Russian Federation (2000 to 2004) and concurrently to Ukraine; and The United Kingdom (1999 to 2000) and concurrently to Ireland as well as Deputy Secretary of the Navy in the Ministry of National Defense (1995 to 1999), among others2016
positions since he joined the Chilean foreign service in 1970. Mr. Cabrera holds a degree in law from Pontificia Universidad Católica de Chile and a degree from Academia Diplomática Andrés Bello (Santiago, Chile).
|
Fernán Gazmuri P. | | Director Chairman and Financial Expert of the Directors’ Committee | Mr. Gazmuri currently serves as director of several Chilean companies unrelated to us. He has been Chairman of Citroën Chile S.A.C. since 1983 and Chairman of the Chilean Security Association since July 2011. He has been the Vice Chairman of Invexans S.A. a Chilean public company holding of the French cable producer Nexans, since May 2014. In addition, he has acted as director at Sociedad de Fomento Fabril (SOFOFA), a non-profit trade association representing the views and interests of Chilean businessmen, since 2005 and the Asociación Nacional Automotriz de Chile, a Chilean car dealer association, since 2004. Between 2013 and
| 75 | | 2016 he was director of Empresa Nacional del Petróleo (ENAP), the Chilean state-owned oil company. He acted as Vice-Chairman of the International Chamber of Commerce of Chile (ICC) between 2005 and 2009. In 2016, Mr. Gazmuri was awarded with the Jorge Alessandri Rodríguez distinction by the Asociación de Industriales Metalúrgicos y Metalmecánicos, a metal-mechanic manufacturers’ association, due to his outstanding professional and business career. In 2014, Mr. Gazmuri was awarded the Ordre National du Mérite by the government of the Republic of France. Mr. Gazmuri holds a degree in business administration from the Pontificia Universidad Católica de Chile. |
Juan Gerardo Jofré M. | Director and Member of the Directors’ Committee
Mr. Jofré is currently director of Codelco, a Chilean state-owned mining company and LATAM Airlines Group S.A., a member of the Real Estate Investment Council of Santander Asset Management S.A. and member of the Self-Regulatory Council of the Asociación de Aseguradores de Chile, the Chilean insurers association. From 2010 to 2014 he was the Chairman of Codelco. From 2005 to 2009, he served as a director of Enel Generación Chile, Viña San Pedro Tarapacá S.A., a Chilean winery, D&S S.A., a supermarket company, Construmart S.A., a Chilean hardware store chain, Inmobiliaria Titanium S.A., and Inmobiliaria Parque del Sendero S.A., both real estate companies. From 1989 to 2004, he served as a senior manager of Banco Santander, and then as Second Vice Chairman of the same bank in Chile, and Director of Insurance for Latin America. Mr. Jofré also served as CEO and Chairman of many companies related to Banco Santander. Mr. Jofré holds a degree in business administration from the Pontificia Universidad Católica de Chile.
Vicenzo Ranieri
| Director Mr. Ranieri is Head of Control for Enel S.p.A. Previously, Mr. Ranieri served as Head of Planning & Control of Infrastructure and Network from September 2014 to September 2015. From June 2011 to August2014, he served as Head of Finance of Slovenské Elektrárne, an Enel generation subsidiary in the Slovak Republic, and from May 2009 to June 2011 he served in the same position in an Enel generation subsidiary in Romania. Mr. Ranieri served as Head of Planning & Control from March 2008 to April 2009 and as Head of Market Commercial Operations from July 2006 to March 2008 for Enel and for Enel Distribuzione from November 2004 to July 2006. Mr. Ranieri first joined Enel in 2000 as a member of the Strategic Planning department. He holds a degree in business administration specialized in auditing and finance from Libera Università Internazionale degli Studi Sociali Guido Carli –LUISS (Rome, Italy).
Executive Officers
Set forth below are our Executive Officers as of December 31, 2016.
The business address of our Executive Officers is c/o Enel Chile S.A., Santa Rosa 76, Santiago, Chile.
| Executive Officers
| | Position
| | Current Position Held Since
| Nicola Cotugno
| | Chief Executive Officer
| 70 | | 2016 | Antonio Barreda T.
|
(1) As of April 30, 2019. At ordinary shareholders meeting held on April 25, 2018, the members of our Board of Directors were elected to three-year terms ending in April 2021. During the Board of Directors’ meeting held on April 25, 2018, Mr. Chadwick was appointed Chairman and Messrs. Gazmuri, Cabrera and Jofré as members of the Directors’ Committee. Mr. Gazmuri was also appointed Financial Expert of the Directors’ Committee. Set forth below are brief biographical descriptions of the members of our Board of Directors, three of whom reside outside Chile and four of whom reside in Chile, as of December 31, 2018: Herman Chadwick P. Mr. Chadwick is law partner at Chadwick & Cía. and a director of several companies unrelated to us, including Aguas Andinas, a Chilean water utility company, and Viña Santa Carolina, a Chilean winery. Mr. Chadwick is an advisor and arbitrator at Centro de Arbitraje y Mediación de la Cámara de Comercio de Santiago, an association that provides arbitration services to resolve legal disputes. Mr. Chadwick holds a law degree from Pontificia Universidad Católica de Chile. Salvatore Bernabei Mr. Bernabei is the Head of Global Procurement of Enel since May 2017. He has been Head of Renewable Energies Latin America of Enel Green Power (2016-2017) and Country Manager for Chile and the Andean Countries (2013-2016). He joined Enel in 1999 and held several positions involving project integration, execution, inspection, operations and logistics. Mr. Bernabei holds a degree in industrial engineering from Università degli Studi di Roma “Tor Vergata”, and an MBA from Politecnico di Milano. Pablo Cabrera G. Mr. Cabrera is a member of the Chilean Society of International Law. Mr. Cabrera served concurrently as ambassador to the Holy See, to the Sovereign Military Order of Malta and Albania (2006-2010), to the People’s Republic of China (2004-2006) to Russia (2000-2004) and to the UK (1999-2000). Mr. Cabrera holds a law degree from Pontificia Universidad Católica de Chile and Academia Diplomática Andrés Bello. Daniele Caprini Mr. Caprini is the Head of Enel’s Group Planning and Reporting and the CFO of Enel Colombia since 2016. He headed Enel’s Financial Valuation and Investment Control (2013-2015), Management Control (2015-2016) and Strategic Planning M&A and Financial Valuation (2009-2013) of Enel Green Power S.A. Mr. Caprini holds a degree in economics from the Università degli Studi di Siena and an MBA from Roma Università LUISS. Giulio Fazio Mr. Fazio is the Head of Enel’s Legal and Corporate Affairs since January 2016. Previously, he held a comparable position at Enel Green Power S.p.A. (2008-2014). Since 2004, he has worked in finance and antitrust operations in Enel’s Legal Department. Mr. Fazio joined an Enel affiliate in 1996. He holds a degree in law and a Ph.D. from Università degli Studi di Palermo. Fernán Gazmuri P. Mr. Gazmuri has been a board member of companies unrelated to us. He is Currently Vice Chairman of Invexans S.A., a telecom and Maritime Cable Company and a Director of Citroën Chile S.A.C., the Chilean Security Association, Invexans S.A, Sociedad de Fomento Fabril (SOFOFA) and Asociación Nacional Automotriz de Chile. In 2013-2016, he was director of Empresa Nacional del Petróleo (ENAP), the Chilean state-owned oil company and Vice-Chairman of the Chilean International Chamber of Commerce. He holds a degree in business administration from Pontificia Universidad Católica de Chile. Gerardo Jofré M. Mr. Jofré is a director of CAP S.A., a mining and steel company, and a member of the self-regulatory council of the Asociación de Aseguradores de Chile, the insurance companies association. In 2010-2014 he was Chairman of the Board of Codelco, the Chilean state-owned copper mining company. He has been a director of several prominent Chilean companies unrelated to us, and has held several managerial positions, primarily in Banco Santander Chile and affiliates. He holds a degree in business administration from Pontificia Universidad Católica de Chile. Executive Officers Set forth below are our Executive Officers as of December 31, 2018. Executive Officers | | Position | | Age(1) | | Joined Enel or
Affiliate in | | Current Position
Held Since | Paolo Pallotti | | Chief Executive Officer | | 56 | | 1990 | | 2018 | Angel Barrios R. | | IT Officer | | 49 | | 1994 | | 2018 | Juan José Bonilla A. | | Procurement Officer | | 40 | | 2010 | | 2018 | Raffaele Cutrignelli | | Internal Audit Officer | | 38 | | 1995 | | 2016 | Marcelo Antonio de Jesus | | Chief Financial Officer | | 49 | | 2018 | | 2018 | Monica De Martino | | Regulatory Affairs Officer | | 43 | | 2011 | | 2017 | Alison Dunsmore M. | | Services Officer | | 39 | | 2005 | | 2018 | José Miranda M. | | Communications Officer | | 37 | | 2014 | | 2016 | Antonella Pellegrini | | Sustainability Officer | | 57 | | 2000 | | 2017 | Andrés Pinto B. | | Safety Officer | | 40 | | 2010 | | 2017 | Liliana Schnaidt H. | | Human Resources Officer | | 40 | | 2009 | | 2018 | Claudia Navarrete C. | | Planning and Control Officer | | 46 | | 1998 | | 2018 | Pedro Urzúa F. | | Institutional Affairs Officer | | 49 | | 2012 | | 2016 | Domingo Valdés P. | | General Counsel | | 55 | | 1993 | | 2016 |
(1) As of April 30, 2019. Set forth below are brief biographical descriptions of our Executive Officers, all of whom reside in Chile. Paolo Pallotti: Mr. Pallotti was the CFO of Enel Américas in 2018. He played a key role in various Enel corporate reorganization processes. He has been CFO of Enel’s Italian businesses (2014-2018), Financial Director of Enel’s Infrastructure & Networks division (2012), and director of Enel Energia S.p.A. (2015-2018) and Enel Italia S.r.L (2017-2018). He holds a degree in electronic engineering from Università degli Studi di Ancona. Angel Barrios R.: Mr. Barrios has held several positions related to Information Systems, including Head of ICT, a subsidiary of Enel Chile (2014-2018). Mr. Barrios holds a degree in civil engineering in informatics from Universidad Santa María and a master’s degree in Information Technology from Universidad Santa María. Juan José Bonilla A.: Mr. Bonilla was CEO of EGP Chile in 2017 and was Operation and Maintenance Manager of EGP North America (2014-2016). Before, he held managerial positions at EGP including Head of Wind Maintenance and Technical Support. He holds a degree in industrial engineer from Escuela Superior de Ingenieros Industriales de Madrid, an MBA from ESERP Business School, and a master’s degree from Universidad San Pablo - CEU. Raffaele Cutrignelli: Mr. Cutrignelli was the Audit Officer for Codensa and Emgesa (2015-2016) and the Head of Latin American Audit for EGP in Brazil (2013-2015). Mr. Cutrignelli holds a degree in international business from Nottingham Trent University, and a master’s degree in audit and internal controls from Universitá di Pisa. Marcelo Antonio de Jesus: Mr. de Jesus was CFO at Eletropaulo and a member of the Business Council of AES Group companies and held finance positions at TAM Linhas Aéreas S.A, Latam Airlines Group, Flora Higiene y Belleza, Syngenta and AES Latin America & Caribbean. He graduated from Universidad de São Caetano do Sul Business School and holds a master’s degree in business administration from Dom Cabral Foundation. Mónica De Martino: Ms. De Martino was Head of EGP Regulatory Affairs Latin America (2011-2017). She holds a degree in political science from Libera Università Internazionale degli Studi Sociali Guido Carli, an MBA from Columbia Business School and a graduate degree from London Business School. Alison Dunsmore M.: Ms. Dunsmore has held various Enel positions including Head of Commercial Management (2013-2015) and Chief of Staff and Head of Strategic Planning (2015-2017). Ms. Dunsmore holds a degree in civil industrial engineer from Universidad de Santiago de Chile. José Miranda M.: Before joining Enel, Mr. Miranda worked for eleven years at Televisión Nacional de Chile, a state-owned Chilean TV channel. He is an audiovisual communicator with a degree from DUOC UC and a graduate degree in management from Universidad de Chile. Antonella Pellegrini: Ms. Pellegrini has held managerial positions in business development and sustainability for EGP affiliates since 2014. She holds a degree in marketing and communications from Istituto Europeo di Design. Andrés Pinto B.: Mr. Pinto has held managerial positions in project planning, cost control and operations for Enel affiliates since 2010. Mr. Pinto holds a degree in civil engineering from Pontificia Universidad Católica de Chile. Claudia Navarrete C.: Ms. Navarrette held management positions in analysis and financial control in 2012-2018. Ms. Navarrete holds a degree in civil engineering, a master’s degree in computer science and an MBA from Pontificia Universidad Católica de Chile. Liliana Schnaidt H. Ms. Schnaidt held positions in EGP business development, with a focus on solar energy (2009-2018). Ms. Schnaidt holds a degree in civil engineering from Pontificia Universidad Católica de Chile. Pedro Urzúa F.: Mr. Urzúa has been Institutional Affairs Officer for Chile and the Andean Countries for EGP (2012-2016), Director of Corporate Affairs of ENAP (2009-2012), director of Fundación Acción RSE (2012) and Communications Director of ENAP Sipetrol (2009-2012). He a holds a degree in journalism from Universidad de Artes y Ciencias de la Comunicación. Domingo Valdés P.: Mr. Valdés is the Secretary of the Boards of Directors of both Enel Chile and Enel Américas and is a Professor of Economic and Antitrust Law at Universidad de Chile. Mr. Valdés holds a law degree from Universidad de Chile and a master’ in law degree from the University of Chicago. B.Compensation. At the OSM held on April 25, 2018, our shareholders approved the compensation policy for our Board of Directors. Director compensation consists of a monthly fixed compensation of UF 216 per month and an additional fee of UF 79.2 per meeting, up to a maximum of 16 sessions in total, including ordinary and extraordinary meetings, within the respective fiscal year. The Chairman of the Board is entitled to double the compensation of other directors. The members of our Directors’ Committee are paid a monthly fixed compensation of UF 72 per month and an additional fee of UF 26.4 per meeting, up to a maximum of 16 sessions in total, including ordinary and extraordinary meetings. The monthly fees (fixed and variable) are considered as advances on the annual variable fee. If a director serves on one or more Boards of Directors of the subsidiaries and/or associate companies or serves as director of other companies or corporations in which the economic group holds an interest directly or indirectly, the director can only receive compensation from one of these Boards of Directors. Executive Officers of our Company and/or of our subsidiaries or associate companies will not receive compensation in the case that they serve as director of any other affiliate. However, compensation may be received by the officer to the extent that it is expressly and previously authorized as an advance payment of the variable portion of the wage to be paid by the affiliate with which the officer signed a contract. In 2018, the total compensation paid to each of our directors, including fees for attending Directors’ Committee meetings was as follows: Director | | Fixed
Compensation | | Ordinary and
Extraordinary
Session | | Directors’
Committee (Fixed
Compensation) | | Ordinary and
Extraordinary
Session
(Directors’
Committee) | | Total | | | | | | | | (in Th Ch$) | | | | | | Herman Chadwick P. | | 133,016 | | 48,773 | | — | | — | | 181,789 | | Salvatore Bernabei | | — | | — | | — | | — | | — | | Pablo Cabrera G. | | 66,508 | | 24,386 | | 22,176 | | 8,842 | | 121,912 | | Daniele Caprini | | — | | — | | — | | — | | — | | Giulio Fazio | | — | | — | | — | | — | | — | | Fernán Gazmuri P. | | 66,508 | | 24,386 | | 22,176 | | 8,842 | | 121,912 | | Juan Gerardo Jofré M. | | 66,508 | | 24,386 | | 22,176 | | 8,842 | | 121,912 | | Total | | 332,540 | | 121,931 | | 66,527 | | 26,526 | | 547,525 | |
We do not disclose, to our shareholders or otherwise, any information about an individual Executive Officer’s compensation. Executive Officers are eligible for variable compensation under a bonus plan. The annual bonus plan is paid to our Executive Officers for achieving company-wide objectives and for their individual contribution to our results and objectives. The annual bonus plan provides for a range of bonus amounts according to seniority level and consists of a certain multiple of gross monthly salaries. For the year ended December 31, 2018, the aggregate gross compensation, paid or accrued, for all of our Executive Officers, attributable to fiscal year 2018, was Ch$ 2,676 million in fixed compensation and Ch$ 765 million in variable compensation and benefits. We entered into severance indemnity agreements with all of our Executive Officers, pursuant to which we will pay a severance indemnity in the event of voluntary resignation or termination by mutual agreement among the parties. The severance indemnity does not apply if the termination is due to willful misconduct, prohibited negotiations, unjustified absences or abandonment of duties, among other causes, as defined in Article 160 of the Chilean Labor Code. All of our employees are entitled to legal severance pay if terminated due to our needs, as defined in Article 161 of the Chilean Labor Code. The total amounts accrued as of the end of 2018 to provide severance indemnity to our Executive Officers totaled Ch$ 391.4 million. There are no other amounts set aside or accrued to provide for pension, retirement or similar benefits for our Executive Officers. C. Board Practices. Our Board of Directors in office as of December 31, 2018, was elected at the OSM held on April 25, 2018, for a three-year term that ends in April 2021. For information about each of the directors and the year that they began their service on the Board of Directors, see “Item 6. Directors, Senior Management and Employees — A. Directors and Senior Management” above. Members of the Board of Directors do not have service contracts with us or with any of our subsidiaries that provide them benefits upon termination of their service. Corporate Governance We are managed by a Board of Directors, in accordance with our bylaws, consisting of seven directors who are elected by our shareholders at an OSM, each of whom serves for a three-year term. Following the end of their term, they may be re-elected indefinitely or replaced. Staggered terms are not permitted under Chilean law. If a vacancy occurs on the Board of Directors during the three-year term, the Board of Directors may appoint a temporary director to fill the vacancy. A vacancy triggers an election for every seat on the Board of Directors at the next OSM. Chilean corporate law provides that a company’s Board of Directors is responsible for the management and representation of a company in all matters concerning its corporate purpose, subject to the provisions of the company’s bylaws and the shareholders’ resolutions. In addition to the bylaws, our Board of Directors has adopted regulations and policies that guide our corporate governance principles. Our corporate governance policies are included in the following policies or procedures: the Manual for the Management of Information of Interest to the Market (the “Manual”), the Human Rights Policy (Política de Derechos Humanos), the Code of Ethics and a Zero Tolerance Anti-Corruption Plan (the “ZTAC Plan”), the Penal Risk Prevention Model, the “Guidelines 231: Guidelines applicable to non-Italian subsidiaries in accordance with Legislative Decree 231 of June 8, 2001” (the “Guidelines 231”) and procedures issued in compliance with General Regulation 385 issued by the CMF. In order to ensure compliance with Securities Market Law 18,045 and CMF regulations, our Board of Directors approved the Manual at the meeting held on February 29, 2016 and ratified such decision at its meeting held on March 23, 2016. This document addresses applicable standards regarding the information in connection with transactions of our securities and those of our affiliates, entered into by directors, management, principal executives, employees and other related parties, the existence of blackout periods for such transactions undertaken by directors, principal executives and other related parties, the existence of mechanisms for the continuous disclosure of information that is of interest to the market and mechanisms that provide protection for confidential information. The Manual was released to the public in 2016 and it is posted on our website at www.enelchile.cl. The provisions of this Manual apply to the members of our Board, as well as our executives and employees who have access to confidential information, and especially those who work in areas related to the securities markets. Our Board of Directors approved a procedure for relationships between Politically Exposed People (Procedimiento Personas Políticamente Expuestas y Conexas) and our Company, which established a specific regulation for their commercial and contractual relationships. The Human Rights Policy incorporates and adapts the United Nations’ general principles related to human rights into the corporate reality. In order to supplement the aforementioned corporate governance regulations, our Board of Directors approved a Code of Ethics and a ZTAC Plan at its first meeting held on February 29, 2016 and ratified such decision at its meeting held on March 23, 2016. The Code of Ethics is based on general principles such as impartiality, honesty, integrity and other ethical standards of similar importance, all of which are expected from our employees. The ZTAC Plan reinforces the principles included in the Code of Ethics, but with special emphasis on avoiding corruption in the form of bribes, preferential treatment, prohibition of political donations under all circumstances and other similar matters. In order to comply with Law 20,393 enacted on December 2, 2009, which imposes criminal responsibility on legal entities for the crimes of asset laundering, financing of terrorism and bribing of public officials, our Board of Directors approved the Penal Risk Prevention Model at its first meeting held on February 29, 2016 and ratified such decision at its meeting held on March 23, 2016. The law encourages companies to adopt this model, whose implementation involves compliance with managerial and supervision duties. The adoption of the Penal Risk Prevention Model mitigates, and in some cases relieves, the effects of criminal responsibility even when a crime is committed. At its meeting held on October 27, 2016, our Board approved “The Global Compliance Program for Corporate Penal Liability”, which was incorporated into the Penal Risk Prevention Model to reflect current standards and appointed Mr. Rafael Cutrignelli as our Penal Risk Prevention and Global Compliance Program for Corporate Penal Liability Officer, as required by the Penal Risk Prevention Model. Mr. Cutrignelli also serves as Internal Audit Officer for both of Enel Américas and Enel Chile. On February 29, 2016, our Board of Directors also approved the Guidelines 231 and ratified such decision at its meeting held on March 23, 2016. The Guidelines 231 is defined by Italian Legislative Decree 231, which was enacted on June 8, 2001. It establishes a compliance program that identifies the behaviors expected of related parties for the non-Italian subsidiaries of Enel. Given that our ultimate controlling shareholder, Enel, complies with Italian Legislative Decree 231, which establishes management responsibility for Italian companies as a consequence of certain crimes committed in Italy or abroad, in the name of or for the benefit of such entities, including those crimes described in Chilean Law 20,393, these guidelines set a group of measures, with standards of behavior expected from all employees, advisers, auditors, officials, directors as well as consultants, contractors, commercial partners, agents and suppliers. Legislative Decree 231 includes various activities of a preventive nature that are coherent with and integral to the requirements and compliance with Chilean Law 20,393, which deals with the criminal responsibility of legal entities. These guidelines are supplementary to the standards included in the Code of Ethics and the ZTAC Plan. On November 29, 2012, the CMF issued General Regulation 341, which established regulations for the disclosure of information with respect to the standards of corporate governance compliance adopted by publicly held limited liability corporations and set the procedures, mechanisms and policies that are indicated in the Appendix to the regulation. The objective of this regulation is to provide credible information to investors with respect to good corporate governance policies and practices adopted by publicly held limited liability corporations, which include us, and permit entities like stock exchanges to produce their own analyses to help the various market participants to understand and evaluate the commitment of companies. General Regulation 341 was substituted by General Regulation 385, issued by the CMF on June 8, 2015. This regulation has similar objectives than the former General Regulation 341, but includes additional issues, by the way of separating each policy into several more detailed policies. Subjects such as non-discrimination, inclusion and sustainability are particularly important in this new regulation. The Appendix of General Regulation 385 is divided into the following four sections with respect to which companies must report the corporate practices that have been adopted: (i) the functioning and composition of the board, (ii) relations between the company, shareholders and the general public, (iii) risk management and control, and (iv) assessment by a third party. Publicly held limited liability corporations should send the information with respect to corporate governance practices to the CMF, no later than March 31 of each year, using the contents of the Appendix to this regulation as criteria. If none of them is adopted, the company must explain its reasons to the CMF. The information should refer to December 31 of the calendar year prior to its dispatch. At the same time, such information should also be at the public’s disposal on the company’s website and must be sent to the stock exchanges. Compliance with the New York Stock Exchange Listing Standards on Corporate Governance The following is a summary of the significant differences between our corporate governance practices and those applicable to U.S. domestic issuers under the corporate governance rules of the NYSE. Independence and Functions of the Directors’ Committee (Audit Committee) Chilean law requires that at least two thirds of the Directors’ Committee be independent directors. According to Article 50 bis of Law No.18,046, a member would not be considered independent if, at any time, within the last 18 months he: (i) maintained any relationship of a relevant nature and amount with the company, with other companies of the same group, with its controlling shareholder or with the principal officers of any of them or has been a director, manager, administrator or officer of any of them; (ii) maintained a family relationship with any of the members described in (i) above; (iii) has been a director, manager, administrator or principal officer of a non-profit organization that has received contributions from (i) above; (iv) has been a partner or a shareholder that has controlled, directly or indirectly, 10% or more of the capital stock or has been a director, manager, administrator or principal officer of an entity that has provided consulting or legal services for a relevant consideration or external audit services to the persons listed in (i) above; and (v) has been a partner or a shareholder that has controlled, directly or indirectly, 10% or more of the capital stock or has been a director, manager, administrator or principal officer of the principal competitors, suppliers or customers. In case there are not sufficient independent directors on the Board to serve on the Directors’ Committee, Chilean law determines that the independent director nominates the rest of the members of the Directors’ Committee among the remaining Board members that do not meet the Chilean law independence requirements. Chilean law also requires that all publicly held limited liability stock corporations that have a market capitalization of at least UF 1,500,000 (Ch$ 413 billion as of December 31, 2018) and at least 12.5% of its voting shares are held by shareholders that individually control or own less than 10% of such shares, must have at least one independent director and a Directors’ Committee. Under the NYSE corporate governance rules, all members of the Audit Committee must be independent. The Audit Committee of a U.S. company must perform the functions detailed in, and otherwise comply with the requirements of NYSE Listed Company Manual Rules 303A.06 and 303A.07. As of July 31, 2005, non-U.S. companies have been required to comply with Rule 303A.06, but not with Rule 303A.07. We currently comply with the independence and the functional requirement of Rule 303A.06. Since our incorporation on March 1, 2016, we have complied with the independence and the functional requirement of Rule 303A.06. Pursuant to our bylaws, all members of the Directors’ Committee must satisfy the requirements of independence, as stipulated by the NYSE. The Directors’ Committee is composed of three members of the Board and complies with Article 50 bis of Law No.18,046, as well as with the criteria and requirements of independence prescribed by the Sarbanes-Oxley Act (“SOX”), the SEC and the NYSE. As of the date of this Report, the Directors’ Committee complies with the conditions of the Audit Committee as required by the SOX, the SEC and the NYSE corporate governance rules. As a result, we have a single Committee, the Directors’ Committee, which includes among its functions the duties performed by an Audit Committee. Our Directors’ Committee performs the following functions: · review of financial statements and the reports of the external auditors prior to their submission for shareholders’ approval; · present proposals to the Board of Directors, which will make its own proposals to shareholders’ meetings, for the selection of external auditors and private rating agencies; · review of information related to our transactions with related parties and reports the opinion of the Directors’ Committee to the Board of Directors; · the examination of the compensation framework and plans for managers, executive officers and employees; · the preparation of an Annual Management Report, including its main recommendations to shareholders; · provide information to the Board of Directors about the convenience of recruiting external auditors to provide non-auditing services, when such services are not prohibited by law, depending on whether such services might affect the external auditors’ independence; · oversee the work of external auditors; · review and approval of the annual auditing plan by the external auditors; · evaluate the qualifications, independence and quality of the auditing services; · elaborate on policies regarding employment of former members of the external auditing firm; · review and discuss problems or disagreements between management and external auditors regarding the auditing process; · establish procedures for receiving and dealing with complaints regarding accounting, internal control and auditing matters; · any other function mandated to the Committee by the bylaws, our Board of Directors or our shareholders. Corporate Governance Guidelines The NYSE’s corporate governance rules require U.S.-listed companies to adopt and disclose corporate governance guidelines. Chilean law provides for this practice through the disclosure of the procedures related to the General Resolution 385 and the Manual. We have also adopted the Code of Ethics, and our bylaws include provisions that govern the creation, composition, attributions, functions and compensation of the Directors’ Committee described above, which includes among its functions the duties performed by an Audit Committee. D. Employees. The following table sets forth the total number of our personnel, permanent and temporary employees, in Enel Chile and in our subsidiaries as of December 31, 2018, 2017, and 2016: Company | | 2018 | | 2017 | | 2016 | | Enel Generation | | 678 | | 753 | | 790 | | Pehuenche | | 2 | | 2 | | 2 | | Enel Chile(1) | | 451 | | 431 | | 336 | | Enel Distribution (2) | | 681 | | 669 | | 688 | | Servicios Informáticos e Inmobiliarios Ltda. | | 0 | | 0 | | 103 | | GasAtacama(3) | | 87 | | 93 | | 91 | | EGP Chile (4) | | 163 | | 0 | | 0 | | Total Personnel (5) | | 2,062 | | 1,948 | | 2,010 | |
(1) Includes Servicios Informáticos e Inmobiliarios Ltda., a former subsidiary that merge into us on September 1, 2017. (2) Includes Luz Andes S.A. and Empresa Eléctrica de Colina S.A. (3) Includes GasAtacama Argentina S.A. (4) We have consolidated EGP Chile and its subsidiaries since April 2, 2018. (5) The total number of temporary employees was not significant. All Chilean employees who are dismissed for reasons other than misconduct are entitled by law to severance payment. According to Chilean law, employees holding contracts of indefinite duration are entitled to a payment of one-month’s salary for each year (or a six-month portion thereof) worked, subject to a limit of a total payment of a maximum of 11 months’ pay for employees hired after August 14, 1981. Severance payments to employees hired prior to that date consist of one-month’s salary for each full year worked, not subject to any maximum limitation. Under our collective bargaining agreements, we are obligated to make severance payments to all covered employees in cases of voluntary resignation or death in specified amounts that increase according to seniority and may exceed the amounts required under Chilean law. We have the following bargaining agreements:
|
| In Force |
| Company |
| From |
| To |
| Enel Chile - Collective Bargaining Agreement 1 (1) | | July 2015 | | July 2019 | | Enel Chile - Collective Bargaining Agreement 2 (1) | | January 2016 | | December 2019 | | Enel Chile - Collective Bargaining Agreement 3 (2) | | January 2016 | | December 2019 | | Enel Generation - Collective Bargaining Agreement 1 | | January 2018 | | June 2020 | | Enel Generation - Collective Bargaining Agreement 2 | | January 2018 | | June 2020 | | Enel Generation - Collective Bargaining Agreement 3 | | January 2018 | | December 2020 | | Enel Generation - Collective Bargaining Agreement 4 | | July 2015 | | June 2019 | | Enel Generation - Collective Bargaining Agreement 5 | | January 2016 | | December 2019 | | Enel Generation - Collective Bargaining Agreement 6 | | July 2016 | | June 2020 | | Enel Distribution - Collective Bargaining Agreement 1 | | January 2017 | | December 2020 | | Enel Distribution - Collective Bargaining Agreement 2 | | January 2017 | | December 2020 | | Enel Distribution - Collective Bargaining Agreement 3 | | January 2017 | | December 2020 | | Enel Green Power - Collective Bargaining Agreement 1 | | October 2017 | | September 2020 | | Procurement Officer
| | 2016
| Raffaele Cutrignelli
| | Internal Audit Officer
| | 2016
| Raffaele Grandi
| | Chief Financial Officer
| | 2016
| José Miranda M.
| | Communications Officer
| | 2016
| Alain Rosolino
| | Human Resources Officer
| | 2016
| Pedro Urzúa F.
| | Institutional Affairs Officer
| | 2016
| Domingo Valdés P.
| | General Counsel
| | 2016
|
Set forth below are brief biographical descriptions of our Executive Officers, all of whom reside in Chile.
Nicola Cotugno was appointed as our Chief Executive Officer in August 2016. During 2015, he served as CEO of Slovenské Elektrárne, an Enel generation subsidiary in the Slovak Republic, where he held several positions since 2006 and had been a member of its board since 2008. In 2013 and 2014, he served as Chief Operating Officer and from 2006 to 2012 he was Head of the Energy Division of Slovenské Elektrárne. In 2005 and 2006, he served as Head of the Spanish Market Division at Viesgo, an Enel generation and distribution subsidiary in Spain. From 2003 to 2005, and from 1991 to 2000, Mr. Cotugno served in several managerial positions at Enel Produzione, a generation subsidiary of Enel in Rome. From 2000 to 2003, he served as Head of Energy Management of Interpower, a former Enel generation subsidiary. Mr. Cotugno holds a degree in mechanical engineering from Università degli Studi di Roma La Sapienza (Rome, Italy).
Antonio Barreda T. was appointed as our Procurement Officer in February 2016. Mr. Barreda has also been the Procurement Officer of Enel Américas since January 2015. From 2008 to 2014, he served as Deputy Director of Works and Services Latin America. From 2001 to 2008, he served as Deputy Director of both Business Relations Providers and of Corporate Service Purchases at Enel Américas. From 2000 to 2001, Mr. Barreda served as Contracts Manager for CAM, a former subsidiary of Enel Américas. Mr. Barreda holds a degree in electrical engineering from Universidad de Santiago and an M.B.A.from Pontificia Universidad Católica de Chile.
Raffaele Cutrignelli was appointed as our Internal Audit Officer in October 2016, and he also holds the same position at Enel Américas. From February 2015 to October 2016, Mr. Cutrignelli served as Audit Officer for Codensa and Emgesa, Enel Américas’ subsidiaries in Colombia. From January 2013 to January 2015, Mr. Cutrignelli served as Head of Latin America Audit for Enel Green Power in Brazil, and from January 2011 to December 2012, served in a comparable position for Enel Green Power in the United States. From October 2008 to December 2010, Mr. Cutrignelli served as Internal Audit Manager at Enel OGK-5 in Moscow, Russia. Mr. Cutrignelli holds a degree in in international business at Nottingham Trent University (Nottingham, United Kingdom), and a master’s degree in audit and internal controls from Universitá di Pisa (Pisa, Italia).
José Miranda M. was appointed as our Communications Officer in February 2016. Mr. Miranda has also been the Communications Officer of Enel Américas since December 2014. Before joining the company, Mr. Miranda worked for 11 years at Televisión Nacional de Chile (TVN), a Chilean TV channel, as producer of many shows and covering both national and international events. From 2011 to November 2014, Mr. Miranda was General Producer of the Entertainment Area, and Executive Producer in charge of International and National Business Content. From 2008 to 2010, he worked as General Producer of the Chilean news channel “Canal 24 Horas,” another TVN channel. Mr. Miranda is an Audiovisual Communicator with a degree from DUOC UC (Santiago, Chile) and holds a graduate degree in management from Universidad de Chile.
Rafaelle Grandi was appointed as our Chief Financial Officer in April 2016. Previously he worked in the Administration, Finance and Control area of Enel Américas and was responsible for Chilean activities. From September 2012 to March 2015, Mr. Grandi served as Accounting and Finance Officer for Enel in Peru and was director of Enel Peru Distribución (formerly known as Edelnor). From October 2010 to August 2012, Mr. Grandi served as Head of Structured and Subsidized Finance for Enel Green Power in Rome. From September 2006 to September 2010, Mr.Grandi served as CFO of Enel Green Power in Brazil. Before joining the company, he was CFO for Aguas de San Pedro, a Honduran water utility company (2004-2006), in which the main shareholders are Italian companies, Head of Investor Relations at Manuli Rubber Industries, an Italian rubber/metal component producer (1999-2003) and consultant at Metis S.p.A, a consulting company (1997-2000). Mr. Grandi holds a degree in economics at the Universitá di Genova (Genoa, Italy).
Alain Rosolino has been our and Enel Américas’ Human Resource Officer since his appointment in October 2016. Prior to these roles, he served as our Internal Audit Officer beginning in February 2016 and also was the Internal Audit Officer of Enel Américas beginning in December 2012. He joined Enel in 2003, and held several positions in the audit area at Enel, Enel Romania, Enel Green Power, Enel Latin America, and from 2011 to 2012, at Enel EGP IBAL (Iberian Peninsula and Latin America). Mr. Rosolino holds a degree in business administration from Libera Università Internazionale degli Studi Sociali Guido Carli (Rome, Italy).
Pedro Urzúa F. was appointed as our Institutional Affairs Officer in February 2016. Mr. Urzúa served as Institutional Affairs Officer of Chile and the Andean countries for Enel Green Power from November 2012 to January 2016. Prior to joining Enel, he served as director of corporate affairs of ENAP (from April 2009 to November 2012), director of the Fundación Acción RSE (2012), whose main purpose is to contribute to the development of Chile, communications director of ENAP Sipetrol (from November 2009 to November 2012) and Chief of Staff of the Ministry of Mining (from January 2002 to March 2006). Mr. Urzúa holds a degree in journalism from the Universidad de Artes y Ciencias de la Comunicación (Santiago, Chile).
Domingo Valdés P. was appointed as our General Counsel in March 2016. Mr. Valdés has also been the General Counsel of Enel Américas since May 1999. Mr. Valdés further serves as Secretary of the Enel Chile and Enel Américas Board of Directors and a Professor of Economic and Antitrust Law at Universidad de Chile. He joined Enel Distribución Chile in 1993 and Enel Américas in 1997. Mr. Valdés held the role of intern for the New York City law firms of Milbank, Tweed, Hadley & McCloy LLP and Chadbourne & Parke LLP. Before joining Enel Distribución Chile, Mr. Valdés was a lawyer for the Corporate Department of Chase Manhattan Bank, N.A. in Chile and an associate of Carey & Cía., a Santiago based law firm. Mr. Valdés holds a law degree from Universidad de Chile and a masters’ in law degree from University of Chicago (Illinois, USA).
To the best of our knowledge there is not any relationship between any of the persons named above.
At the OSM held on April 28, 2016, our shareholders approved the compensation policy for our Board of Directors. Directors are paid an annual variable fee equivalent to 0.1% of our net earnings for the current year based on the consolidated financial statements. Directors are also paid a monthly fee, in advance, depending on their attendance at Board meetings and their participation as director of any of our subsidiaries. Director compensation consists of a monthly fixed compensation of UF 180 per month and an additional fee of UF 66 per meeting, depending on attendance to Board meetings. The monthly fixed fees are considered as advances on the annual variable fee and creditable against that amount. Once our net earnings are approved at the OSM of the following year, the difference between the accrued annual variable fee and the total fees paid in advance will be paid to directors, but only if the resulting amount is positive. The Chairman of the Board is entitled to double the compensation compared to other directors under this policy, while the Vice Chairman receives fixed compensation higher than the directors but lower than the Chairman. The members of our Directors’ Committee are paid a variable annual fee, equivalent to a percentage of our net earnings of the current year. If a Director serves on one or more Boards of Directors of the subsidiaries and/or related companies or serves as director of other companies or corporations in which the economic group holds an interest directly or indirectly, the Director can only receive compensation in one of these Boards of Directors. Executive Officers of our Company and/or of our subsidiaries or related companies will not receive compensation in the case that they serve as director of any subsidiary, related company or are affiliated in any way to our Company.
In 2016 the total compensation paid to each of our directors, including fees for attending Directors’ Committee meetings was as follows:
Directors | | Fixed Compensation | | | Variable Compensation(1) | | | Directors' Committee | | | Total | | | | (in thousand Ch$) | | Hermán Chadwick P. | | | 129,578 | | | | — | | | | — | | | | 129,578 | | Giulio Fazio(2) | | | — | | | | — | | | | — | | | | — | | Salvatore Bernabei(2) | | | — | | | | — | | | | — | | | | — | | Pablo Cabrera G. | | | 80,864 | | | | — | | | | 25,250 | | | | 106,114 | | Fernán Gazmuri P. | | | 80,864 | | | | — | | | | 25,250 | | | | 106,114 | | Juan Gerardo Jofré M. | | | 80,864 | | | | — | | | | 25,250 | | | | 106,114 | | Vicenzo Ranieri(2) | | | — | | | | — | | | | — | | | | — | | Total | | | 372,170 | | | | — | | | | 75,750 | | | | 447,920 | |
(1) Includes any positive balance against the annual variable fee paid in advance. In 2016, the balance was negative thus, there was no additional variable compensation.
(2)
| Messrs. Fazio, Bernabei and Ranieri waived their compensation for their position as director.
|
We do not disclose, to our shareholders or otherwise, any information about an individual Executive Officer’s compensation. For the year ended December 31, 2016, the aggregate gross compensation, paid or accrued, for all of our Executive Officers, attributable to fiscal year 2016, was Ch$ 2,123 million in fixed compensation and Ch$ 219 million in variable compensation.
Executive Officers are eligible for variable compensation under a bonus plan. The annual bonus plan is paid to our Executive Officers for achieving company-wide objectives and for their individual contribution to our results and objectives. The annual bonus plan provides for a range of bonus amounts according to seniority level and consists of a certain multiple of gross monthly salaries.
We entered into severance indemnity agreements with all of our Executive Officers, pursuant to which we will pay a severance indemnity in the event of voluntary resignation or termination by mutual agreement among the parties. The severance indemnity does not apply if the termination is due to willful misconduct, prohibited negotiations, unjustified absences or abandonment of duties,
among other causes, as defined in Article 160 of the Chilean Labor Code. All of our employees are entitled to legal severance pay if terminated due to our needs, as defined in Article 161 of the Chilean Labor Code.
The total amounts accrued as of the end of 2016 to provide severance indemnity to our Executive Officers totaled Ch$ 614 million, of which Ch$ 147 million was accrued during 2016. There are no other amounts set aside or accrued to provide for pension, retirement or similar benefits for our Executive Officers.
C. Board Practices.
Our Board of Directors in office as of December 31, 2016 was elected at the OSM held on April 28, 2016, for a three-year term which ends in April 2019. For information about each of the directors and the year that they began their service on the Board of Directors, see “Item 6. Directors, Senior Management and Employees — A. Directors and Senior Management” above. Members of the Board of Directors do not have service contracts with us or with any of our subsidiaries that provide them benefits upon termination of their service.
Corporate Governance
We are managed by a Board of Directors in accordance with our by-laws, consisting of seven directors who are elected by our shareholders at an OSM. Each director serves for a three-year term. Following the end of their term, they may be re-elected or replaced. Directors can be re-elected indefinitely. Staggered terms are not permitted under Chilean law. If a vacancy occurs on the Board of Directors during the three-year term, the Board of Directors may appoint a temporary director to fill the vacancy. Any vacancy triggers an election for every seat on the Board of Directors at the next OSM.
Chilean corporate law provides that a company’s Board of Directors is responsible for the management and representation of a company in all matters concerning its corporate purpose, subject to the provisions of the company’s by-laws and the shareholders’ resolutions. In addition to the by-laws, our Board of Directors has adopted regulations and policies that guide our corporate governance principles.
Our corporate governance policies are included in the following policies or procedures: the Manual for the Management of Information of Interest to the Market (the “Manual”), the Human Rights Policy (Política de Derechos Humanos), the Code of Ethics and a Zero Tolerance Anti-Corruption Plan (the“ZTAC Plan”), the Penal Risk Prevention Model, the “Guidelines 231: Guidelines applicable to non-Italian subsidiaries in accordance with Legislative Decree 231 of June 8, 2001” (the “Guidelines 231”) and procedures issued in compliance with General Regulation. 385 issued by the SVS.
In order to ensure compliance with Securities Market Law 18,045 and SVS regulations, our Board of Directors approved the Manual at the meeting held on February 29, 2016 and ratified such decision at its meeting held on March 23, 2016. This document addresses applicable standards regarding the information in connection with transactions of our securities and those of our affiliates, entered into by directors, management, principal executives, employees and other related parties, the existence of blackout periods for such transactions undertaken by directors, principal executives and other related parties, the existence of mechanisms for the continuous disclosure of information that is of interest to the market and mechanisms that provide protection for confidential information. The Manual was released to the public in 2016 and it is posted on our website at www.enelchile.cl. The provisions of this Manual apply to the members of our Board, as well as our executives and employees who have access to confidential information, and especially those who work in areas related to the securities markets.
Our Board of Directors approved a procedure for relationship between People Politically Exposed (Procedimiento Personas Políticamente Expuestas y Conexas) and our Company, which established a specific regulation for their commercial and contractual relationships.
The Human Rights Policy incorporates and adapts the United Nations’ general principles related to human rights into the corporate reality.
In order to supplement the aforementioned corporate governance regulations, our Board of Directors approved a Code of Ethics and a ZTAC Plan at its first meeting held on February 29, 2016 and ratified such decision at its meeting held on March 23, 2016. The Code of Ethics is based on general principles such as impartiality, honesty, integrity and other ethical standards of similar importance, all of which are expected from our employees. The ZTAC Plan reinforces the principles included in the Code of Ethics, but with special emphasis on avoiding corruption in the form of bribes, preferential treatment, prohibition of political donations under all circumstances and other similar matters.
In order to comply with Law 20,393 enacted on December 2, 2009, which imposes criminal responsibility on legal entities for the crimes of asset laundering, financing of terrorism and bribing of public officials, our Board of Directors approved the Penal Risk Prevention Model at its first meeting held on February 29, 2016 and ratified such decision at its meeting held on March 23, 2016. The law encourages companies to adopt this model, whose implementation involves compliance with managerial and supervision duties. The adoption of the Penal Risk Prevention Model mitigates, and in some cases relieves, the effects of criminal responsibility even when a crime is committed.
At its meeting held on October 27, 2016, our Board approved “The Global Compliance Program on Corporate Penal Liability”, which was incorporated into the Penal Risk Prevention Model to reflect current standards and appointed Mr. Rafael Cutrignelli as our Penal Risk Prevention and Global Compliance Program for Corporate Penal Liability Officer, as required by the Penal Risk Prevention Model. Mr. Cutrignelli also serves as Internal Audit Officer for both of Enel Américas and Enel Chile.
On February 29, 2016, our Board of Directors also approved the Guidelines 231 and ratified such decision at its meeting held on March 23, 2016. The Guidelines 231 is defined by Italian Legislative Decree. 231, which was enacted on June 8, 2001. It establishes a compliance program that identifies the behaviors expected of related parties for the non-Italian subsidiaries of Enel. Given that our ultimate controlling shareholder, Enel, complies with Italian Legislative Decree 231, which establishes management responsibility for Italian companies as a consequence of certain crimes committed in Italy or abroad, in the name of or for the benefit of such entities, including those crimes described in Chilean Law 20,393, these guidelines set a group of measures, with standards of behavior expected from all employees, advisers, auditors, officials, directors as well as consultants, contractors, commercial partners, agents and suppliers. Legislative Decree. 231 includes various activities of a preventive nature that are coherent with and integral to the requirements and compliance with Chilean Law. 20,393, which deals with the criminal responsibility of legal entities. These guidelines are supplementary to the standards included in the Code of Ethics and the ZTAC Plan.
On November 29, 2012, the SVS issued General Regulation 341 which established regulations for the disclosure of information with respect to the standards of corporate governance compliance adopted by publicly held limited liability corporations and set the procedures, mechanisms and policies that are indicated in the Appendix to the regulation. The objective of this regulation is to provide credible information to investors with respect to good corporate governance policies and practices adopted by publicly held limited liability corporations, which include us, and permit entities like stock exchanges to produce their own analyses to help the various market participants to understand and evaluate the commitment of companies. General Regulation 341 was substituted by General Regulation 385, issued by the SVS on June 8, 2015. This regulation has similar objectives than the former General Regulation 341, but includes additional issues, by the way of separating each policy in several more detailed policies. Subjects such as non-discrimination, inclusion and sustainability are particularly important in this new regulation. The Appendix of General Regulation. 385 is divided into the following four sections with respect to which companies must report the corporate practices that have been adopted: (i) the functioning and composition of the board, (ii) relations between the company, shareholders and the general public, (iii) risk management and control, and (iv) assessment by a third party. Publicly held limited liability corporations should send the information with respect to corporate governance practices to the SVS, no later than March 31 of each year, using the contents of the Appendix to this regulation as criteria. If none of them is adopted, the company must explain its reasons to the SVS. The information should refer to December 31 of the calendar year prior to its dispatch. At the same time, such information should also be at the public’s disposal on the company’s website and must be sent to the stock exchanges.
Compliance with the New York Stock Exchange Listing Standards on Corporate Governance
The following is a summary of the significant differences between our corporate governance practices and those applicable to U.S. domestic issuers under the corporate governance rules of the NYSE.
Independence and Functions of the Directors’ Committee (Audit Committee)
Chilean law requires that at least two thirds of the Directors’ Committee be independent directors. According to Chilean law, a member would not be considered independent if, at any time, within the last 18 months he: (i) maintained any relationship of a relevant nature and amount with the company, with other companies of the same group, with its controlling shareholder or with the principal officers of any of them or has been a director, manager, administrator or officer of any of them; (ii) maintained a family
relationship with any of the members described in (i) above; (iii) has been a director, manager, administrator or principal officer of a non-profit organization that has received contributions from (i) above; (iv) has been a partner or a shareholder that has controlled, directly or indirectly, 10% or more of the capital stock or has been a director, manager, administrator or principal officer of an entity that has provided consulting or legal services for a relevant consideration or external audit services to the persons listed in (i) above; and (v) has been a partner or a shareholder that has controlled, directly or indirectly, 10% or more of the capital stock or has been a director, manager, administrator or principal officer of the principal competitors, suppliers or customers. In case there are not sufficient independent directors on the Board to serve on the Directors’ Committee, Chilean law determines that the independent director nominates the rest of the members of the Directors’ Committee among the remaining Board members that do not meet the Chilean law independence requirements. Chilean law also requires that all publicly held limited liability stock corporations that have a market capitalization of at least UF 1,500,000 (Ch$ 39.5 billion as of December 31, 2016) and at least 12.5% of its voting shares are held by shareholders that individually control or own less than 10% of such shares, must have at least one independent director and a Directors’ Committee.
Under the NYSE corporate governance rules, all members of the Audit Committee must be independent. The Audit Committee of a U.S. company must perform the functions detailed in, and otherwise comply with the requirements of NYSE Listed Company Manual Rules 303A.06 and 303A.07. As of July 31, 2005, non-U.S. companies have been required to comply with Rule 303A.06, but not with Rule 303A.07. We currently comply with the independence and the functional requirement of Rule 303A.06. Since our formation on March 1, 2016 we have complied with the independence and the functional requirement of Rule 303A.06.
Pursuant to our by-laws, all members of the Directors’ Committee must satisfy the requirements of independence, as stipulated by the NYSE. The Directors’ Committee is composed of three members of the Board and complies with Chilean law, as well as with the criteria and requirements of independence prescribed by the Sarbanes-Oxley Act (“SOX”), the SEC and the NYSE. As of the date of this Report, the Directors’ Committee complies with the conditions of the Audit Committee as required by the SOX, the SEC and the NYSE corporate governance rules. As a result, we have a single Committee, the Directors’ Committee, which includes among its functions the duties performed by the Audit Committee.
Our Directors’ Committee performs the following functions:
review of financial statements and the reports of the external auditors prior to their submission for shareholders’ approval;
present proposals to the Board of Directors, which will make its own proposals to shareholders’ meetings, for the selection of external auditors and private rating agencies;
review of information related to our transactions with related parties and reports the opinion of the Directors’ Committee to the Board of Directors;
the examination of the compensation framework and plans for managers, executive officers and employees;
the preparation of an Annual Management Report, including its main recommendations to shareholders;
provide information to the Board of Directors about the convenience of recruiting external auditors to provide non-auditing services, when such services are not prohibited by law, depending on whether such services might affect the external auditors’ independence;
oversee the work of external auditors;
review and approval of the annual auditing plan by the external auditors;
evaluate the qualifications, independence and quality of the auditing services;
elaborate on policies regarding employment of former members of the external auditing firm;
review and discuss problems or disagreements between management and external auditors regarding the auditing process;
establish procedures for receiving and dealing with complaints regarding accounting, internal control and auditing matters;
any other function mandated to the committee by the by-laws, our Board of Directors or our shareholders.
Corporate Governance Guidelines
The NYSE’s corporate governance rules require U.S.-listed companies to adopt and disclose corporate governance guidelines. Chilean law provides for this practice through the disclosure of the procedures related to the General Resolution 385 and the Manual. We have also adopted the codes of conduct described above, and our by-laws include provisions that govern the creation, composition, attributions, functions and compensation of both Directors’ and Audit Committees described above.
D. Employees.
The following table sets forth the total number of our personnel (both permanent and temporary employees) and the number of personnel (both permanent and temporary employees) of each of our subsidiaries as of December 31, 2016, 2015, and 2014, assuming that the Spin-Offs had been completed as of December 31, 2015:
Company | | 2016 | | | 2015 | | | 2014 | | Enel Generación Chile | | | 790 | | | | 919 | | | | 1,137 | | Pehuenche | | | 2 | | | | 2 | | | | 3 | | Celta(1) | | | — | | | | — | | | | 1 | | Túnel El Melón(2) | | | — | | | | — | | | | 15 | | Enel Chile | | | 336 | | | | 391 | | | | 445 | | Enel Distribución Chile(3) | | | 688 | | | | 686 | | | | 690 | | Servicios Informáticos e Inmobiliarios Ltda. | | | 103 | | | | 110 | | | | 128 | | GasAtacama Chile(4) | | | 91 | | | | 99 | | | | 134 | | Total personnel | | | 2,010 | | | | 2,207 | | | | 2,553 | |
(1)
| In November 2016, Celta merged into GasAtacama Chile, which is the continuing company.
|
(2)
| This company was sold by Enel Generación Chile in January 2015.
|
(3)
| Includes Luz Andes S.A. and Empresa Eléctrica de Colina S.A.
|
(4)
| Includes GasAtacama Argentina S.A.
|
The following table sets forth the total number of our temporary employees and the number of temporary employees of each of our subsidiaries as of the dates indicated and the average during the most recent financial year, assuming that the Spin-Offs had been completed as of December 31, 2015:
Company | | Average 2016 | | | 2016 | | | 2015 | | | 2014 | | Enel Generación Chile | | | 46 | | | | 29 | | | | 51 | | | | 119 | | Enel Chile | | | — | | | | — | | | | 4 | | | | 4 | | GasAtacama Chile(1)(2) | | | — | | | | — | | | | 1 | | | | 1 | | Total temporary personnel | | | 46 | | | | 29 | | | | 56 | | | | 124 | |
| (1)
| Includes GasAtacama Argentina S.A.
|
| (2)
| In November 2016, Celta merged into GasAtacama Chile, which is the continuing company.
|
All Chilean employees who are dismissed for reasons other than misconduct are entitled by law to a severance payment. According to Chilean law, employees holding contracts of indefinite duration are entitled to a basic payment of one-month’s salary for each year (or a six-month portion thereof) worked, subject to a limit of a total payment of a maximum of 11 months’ pay for employees hired after August 14, 1981. Severance payments to employees hired prior to that date consist of one-month’s salary for each full year worked, not subject to any maximum limitation. Under our collective bargaining agreements, we are obligated to make severance payments to all covered employees in cases of voluntary resignation or death in specified amounts that increase according to seniority and may exceed the amounts required under Chilean law.
We currently have two collective bargaining agreements in Chile that were transferred from Enel Américas. The first one was signed in July 2015 and will expire in July 2019. The second one was signed in January 2016 and will expire in December 2019. Enel Distribución has three collective bargaining agreements, all of which were signed in 2016 and will expire in December 2020. Empresa Eléctrica de Colina has one collective bargaining agreement which was signed in
| | November 2015 and will expire in | | October 2019. SIEI has one agreement which was signed in January 2016, and will expire in December 2019. Enel Generación Chile has four collective bargaining agreements in Chile, which will expire between 2017 and 2020.2019
To the best of our knowledge, none of our directors or officers owns more than 0.1% of our shares or owns any stock options. It is not possible to confirm whether any of our directors or officers has a beneficial, rather than direct, interest in our shares. To the best of our knowledge, any share ownership by all of our directors and officers, in the aggregate, amounts to significantly less than 10% of our outstanding shares.
Item 7.Major Shareholders and Related Party Transactions
We have only one class of capital stock and Enel, our ultimate controlling shareholder, has no different voting rights than our other shareholders. As of April 25, 2017, our 49,092,772,762 shares of our common stock outstanding were held by 6,598 shareholders of record. There were five record holders of our ADSs, as of such date. In addition, as of March 31, 2017, Enel beneficially owned 60.6% of our shares, Chilean private pension funds (“AFPs”) in the aggregate owned 11.6% of our shares, Chilean stockbrokers, mutual funds, insurance companies, foreign equity funds, and other Chilean institutional investors collectively held 18.0% of our equity, ADS holders owned 7.4% of our equity and the remaining 2.4% of our equity was held by 6,440 minority shareholders.
It is not practicable for us to determine the number of our ADSs or our common shares beneficially owned in the United States as the depositary for our ADSs only has knowledge of the record holders, including the Depositary Trust Company and its nominees. As a result, we are not able to ascertain the domicile of the final beneficial holders represented by the five ADS record holders in the United States. Likewise, we cannot readily determine the domicile of any of our foreign shareholders who hold our common stock, either directly or indirectly.
On April 26, 2016, Enel Américas distributed our shares to all our shareholders as part of the spin-off of Enel Chile from Enel Américas. For further details related to the reorganization process, please refer to “Item 4. Information on the Company — A. History — The 2016 Reorganization.”
The following table sets forth certain information concerning ownership of our common stock as of April 25, 2017, with respect to each shareholder known by us to own more than 5% of our outstanding shares of common stock:
| | Number of Shares Owned | | | Percentage of Shares Outstanding | | Enel Iberoamérica(1) | | | 29,762,213,531 | | | | 60.6 | % |
(1)
| Enel Iberoamérica is wholly-owned by Enel.
|
Enel is an energy company with multinational operations in the power and gas markets, with a focus on Europe and Latin America. Enel operates in over 30 countries across four continents, produces energy through a net installed capacity of 84 GW and distributes electricity and gas through a network covering 1.9 million kilometers. With over 61 million users worldwide, Enel has the largest customer base among European competitors and figures among Europe’s leading power companies in terms of installed capacity and reported EBITDA. Enel publicly trades on the Milan Stock Exchange.
B.
| Related Party Transactions.
|
Article 146 of Law 18,046 (the “Chilean Companies Act”) defines related-party transactions as all transactions involving a company and any entity belonging to the corporate group, its parent companies, controlling companies, subsidiaries or related companies, board members, managers, administrators, senior officers or company liquidators, including their spouses, some of their relatives and all entities controlled by them, in addition to individuals who may appoint at least one member of the company’s board of directors or who control 10% or more of voting capital, or companies in which a board member, manager, administrator, senior officer or company liquidator has been serving in the same position within the last 18 months. The law establishes that in the event that these persons fulfill the requirements established by Article 146, such persons must immediately inform the Board of Directors of their related-party nature, or such other group as the Board may appoint for that purpose. As required by law, “related-party transactions” must comply with corporate interests, as well as prices, terms and conditions prevailing in the market at the time of their approval. They must also meet all legal requirements, including acknowledgement and approval of the transaction by the Board of
Directors (excluding the affected directors), by the ESM (in some cases, with requisite majority approval) and by any applicable regulatory procedures.
The aforementioned law, which also applies to our affiliates, also provides for some exceptions, stating that in certain cases, Board approval would suffice for “related-party transactions,” pursuant to certain related-party transaction thresholds and when such transactions are conducted in compliance with the related-party policies defined by the company’s board. At its meeting held on March 23, 2016, our Board of Directors approved a related-party transaction policy (política de habitualidad). This policy is available on our website at www.enelchile.cl.
If a transaction is not in compliance with Article 146 of the Chilean Companies Act, this would not affect the transaction’s validity, but we or our shareholders may demand compensation from the individual associated with the infringement as provided under law, and reparation for damages.
It is our policy that all cash inflows and outflows of our Chilean subsidiaries be managed through our centralized cash management policy. It is a common practice in Chile to transfer surplus funds from one company to another affiliate that has a cash deficit. These transfers are carried out through either short-term transactions or through structured inter-company loans. Under Chilean laws and regulations, such transactions must be carried out on an arm’s-length basis. All of these transactions will be subject to the supervision of our Directors’ Committee. As of April 25, 2017, these transactions were priced at TIP (a Chilean variable interest rate) plus 0.05% per month.
Our subsidiary Enel Generación Chile has received short term loans from our related parties in Chile and also granted short term loans to such parties, primarily to satisfy reciprocal working capital needs. As of March 31, 2017, the outstanding balance of the loan received from GasAtacama Chile was Ch$ 65,569 million and the outstanding balance of the loan received from Pehuenche was Ch$ 1,035 million. GasAtacama Chile has granted short term loans to its subsidiaries, Canela and GasAtacama Argentina, primarily to satisfy working capital needs. As of March 31, 2017, the outstanding balance of the loan granted to Canela was Ch$ 4,209 million and the outstanding balance of the loan granted to GasAtacama Argentina was Ch$ 118 million.
In addition, Enel Generación Chile’s subsidiary GasAtacama Chile has granted a structured loan to Canela to satisfy working capital needs. As of March 31, 2017, the outstanding balance was US$ 167 million at a fixed annual interest rate of 5.5%.
March 31, 2017, the outstanding balance was US$ 167 million at a fixed annual interest rate of 5.5%. During 2016, Enel Generación Chile repaid in full a structured loan of US$ 250 million from Enel Américas with a fixed annual interest rate of 1.38%.
Our subsidiary SIEI has granted us and its subsidiary Sociedad Agrícola De Cameros Ltda. short term loans, primarily to satisfy working capital needs. As of March 31, 2017, the account payable by us amounted to Ch$ 48,713 million and the outstanding balance of the loan granted by SIEI to Sociedad Agrícola De Cameros Ltda. was Ch$ 1,035 million. Our subsidiary Enel Distribución Chile received short term loans from its subsidiaries, Luz Andes Ltda. and Empresa Eléctrica de Colina Ltda., primarily to satisfy working capital needs. As of March 31, 2017, the outstanding balance of the loan received from Luz Andes Ltda. was Ch$ 3,579 million and the outstanding balance of the loan received from Empresa Eléctrica de Colina Ltda. was Ch$ 1,434 million.Panguipulli S.A.
| In addition, our subsidiary Enel Distribución Chile has received a structured loan from us to satisfy working capital needs. As of March 31, 2017, the outstanding balance was Ch$ 50,000 million at a fixed annual interest rate of 4.47%.
| Intercompany Arrangements Related to the Spin-OffsJanuary 2018
| Enel Américas does not own any of our common stocks or ADSs and we do not own any of Enel Américas’ common stocks or ADSs. Under Chilean law, Enel Américas remains jointly and severally liable for the obligations of Enel Américas assumed by us pursuant to the separation of the businesses completed on March 1, 2016. Such liability, however, will not extend to any obligation to a person or entity that has given its express consent relieving Enel Américas of such liability and approving the spin-off.
| There are various contractual relationships between Enel Américas, Enel Generación Chile and Enel Distribución Chile and us to provide for intercompany services. We entered into intercompany agreements under which we provide services directly and indirectly to Enel Américas, Enel Generación Chile and its subsidiaries, Enel Distribución Chile and its subsidiaries and SIEI. To a much lesser extent, we may require services from Enel Américas and from SIEI. The services to be rendered by us include certain legal, finance, treasury, insurance services, capital markets, financial compliance, accounting, human resources, communications, security, relations with contractors, purchases, IT services, tax services, corporate affairs and other corporate support and administrative services. The services rendered varies depending on the company receiving the service. These services are providedDecember 2020
| and charged at market prices if there is a comparable service. If there are no comparable services in the market, they will be provided at cost plus a specified percentage. The intercompany services contracts are valid for five years with renewable terms since January1,2017.
As of the date of this Report, the abovementioned transactions have not experienced material changes. For more information regarding transactions with related parties, refer to Note 9 of the Notes to our consolidated financial statements.
C.
| Interests of Experts and Counsel.
|
|
Not applicable.GasAtacama Chile
| | Item 8.Financial InformationJanuary 2018
| | December 2020 | |
A.
| Consolidated Statements and Other Financial Information.
|
See “Item 18. Financial Statements.”
Legal Proceedings
We and our subsidiaries are parties to legal proceedings arising in the ordinary course of business. We believe it is unlikely that any loss associated with pending lawsuits will significantly affect the normal development of our business.
For detailed information as of December 31, 2016 on the status of the material pending lawsuits that have been filed against us and our subsidiaries, please refer to Note 33.3 of the Notes to our consolidated financial statements. Please note that since March 1, 2016, we appear as the defendant instead of Enel Américas for current legal proceedings or those that may arise from our former Chilean businesses.
In relation to the legal proceedings reported in the Notes to our consolidated financial statements, we use the criteria of disclosing lawsuits above a minimum threshold of US$ 10 million of potential impact to us, and, in some cases, qualitative criteria according to the materiality of the plausible impact in the conduct of our business. The lawsuit status includes a general description, the process status and the estimate of the amount involved in each lawsuit.
Dividend Policy
Our Board of Directors establishes a definitive dividend payable each year, accrued in the prior year, which cannot be less than the legal minimum of 30% of annual net income. Additionally, the shareholders of Enel Américas agreed to consider a percentage of Enel Américas’ 2015 annual consolidated net income as our 2015 annual consolidated net income at the ESM held on December 18, 2015. The initial definitive dividend payout was equal to 50% of the annual consolidated net income of Enel Américas (before the spin-off) for fiscal year 2015. Since an interim dividend for Enel Américas was already paid in January 2016, the remainder of the definitive dividend was divided in a determined proportion between the continuing company, Enel Américas, and us. Therefore, on May 24, 2016, we paid a dividend of approximately Ch$ 2.09338 per share of common stock and shareholders of Enel Américas received a dividend of approximately Ch$ 3.40599 per share of common stock. The payment of dividends for fiscal year 2015 was based on Enel Américas’ annual consolidated net income filed with the SVS, which was marginally different from net income based on IFRS.
On November 25, 2016, the Board of Directors agreed to distribute an interim dividend of Ch$ 0.75884 per share of common stock on January 27, 2017, accrued in fiscal year 2016. The aforementioned interim dividend will be deducted from the definitive dividend to be paid in May 2017. The definitive dividend of Ch$ 158,781 million, equivalent to approximately Ch$ 3.2343 per share of common stock, agreed by the OSM held on April 26, 2017, corresponds to a payout ratio of 50% based on annual consolidated net income for our 2016’s annual consolidated net income filed with the SVS, based on 10 months of results starting as of our creation on March 1, 2016, and therefore differs from the twelve‑month net income included in this Report.
In accordance with our current dividend policy, the interim dividend corresponds to 15% of consolidated net income as of September 30 of each year. Additionally, our Board of Directors will propose a definitive dividend payout equal to 55% of the annual consolidated net income for fiscal year 2017. Actual dividend payments will be subject to net profits obtained in each period, as well as to expectations of future profit levels and other conditions that may exist at the time of such dividend declaration. The fulfillment of
the aforementioned dividend policy will depend on 2017 consolidated net income. The proposed dividend policy is subject to our Board of Director’s right to change the amount and timing of the dividends under the circumstances at the time of the payment.
The payment of dividends is potentially subject to legal restrictions, such as the requirement to pay dividends either from the net income or from retained earnings of the fiscal year, in both cases from financial statements formally approved by the shareholders. The Board of Directors may approve the distribution of provisional dividends during any given year only in the absence of retained losses. There may be also other contractual restrictions such as the non-default on credit agreements. However, these potential legal and contractual restrictions do not currently affect our ability or any of our subsidiaries’ ability to pay dividends. (See “Item 5. Operating and Financial Review and Prospects — B. Liquidity and Capital Resources” for further detail on our debt instruments).
Shareholders set dividend policies at each subsidiary and affiliate. Dividends
(1) These collective bargaining agreements were transferred from Enel Américas S.A. in connection with the Spin-offs in the 2016 Reorganization.
(2) This collective bargaining agreement was transferred from ICT Servicios Informáticos Ltda., a former subsidiary that merge into us.
E.Share Ownership.
To the best of our knowledge, none of our directors or officers owns more than 0.1% of our shares or owns any stock options. It is not possible to confirm whether any of our directors or officers has a beneficial, rather than direct, interest in our shares. To the best of our knowledge, any share ownership by all of our directors and officers, in the aggregate, amounts to significantly less than 10% of our outstanding shares.
Item 7.Major Shareholders and Related Party Transactions
A.Major Shareholders.
We have only one class of capital stock and Enel, our ultimate controlling shareholder, has no different voting rights than our other shareholders. As of March 31, 2019, 6,278 shareholders of record held our 69,166,557,219(1) shares of our common stock outstanding. Enel owned 42,832,058,392 shares of our total common stock, representing a 61.9% direct ownership interest in us. There were five record holders of our ADSs, as of such date.
It is not practicable for us to determine the number of our ADSs or our common shares beneficially owned in the United States as the depositary for our ADSs only has knowledge of the record holders, including the Depositary Trust Company and its nominees. As a result, we are not able to ascertain the domicile of the final beneficial holders represented by the five ADS record holders in the United States. Likewise, we cannot readily determine the domicile of any of our foreign shareholders who hold our common stock, either directly or indirectly.
As of March 31, 2019, Chilean private pension funds (“AFPs”), owned 13.7% of our shares in the aggregate. Chilean stockbrokers, mutual funds, insurance companies, foreign equity funds, and other Chilean institutional investors collectively held 19.1% of our shares, ADS holders owned 3.8% of our shares and the remaining 1.4% of our shares were held by 6,105 minority shareholders.
On April 26, 2016, Enel Américas distributed our shares to all our shareholders as part of the spin-off of Enel Chile from Enel Américas. For further details related to the reorganization process, please refer to “Item 4. Information on the Company — A. History — The 2016 Reorganization.”
The following table sets forth certain information concerning ownership of the common stock as of March 31, 2019, with respect to each stockholder known by us to own more than 5% of the outstanding shares of common stock:
| | Number of Shares
Owned | | Percentage of Shares
Outstanding | |
Enel S.p.A. (Italy) | | 42,832,058,392 | | 61.9 | % |
Enel is an energy company with multinational operations in the power and gas markets, with a focus on Europe and Latin America. Enel operates in 35 countries across five continents, produces energy through a managed installed capacity of almost 90 GW, which includes 43 GW of renewable sources, and distributes electricity and gas through a network covering 2.2 million kilometers. With over 73 million users worldwide, Enel has the largest customer base among European competitors and figures among Europe’s leading power companies in terms of installed capacity and reported EBITDA. Enel shares trade on the Milan Stock Exchange.
B.Related Party Transactions.
Article 146 of Law 18,046 (the “Chilean Corporations Act”) defines related-party transactions as all transactions involving a company and any entity belonging to the corporate group, its parent companies, controlling companies, subsidiaries or related companies, board members, managers, administrators, senior officers or company liquidators, including their spouses, some of their relatives and all entities controlled by them, in addition to individuals who may appoint at least one member of the company’s board of directors or who control 10% or more of voting capital, or companies in which a board member, manager, administrator, senior officer or company liquidator has been serving in the same position within the last 18 months. The law establishes that in the event that these persons fulfill the requirements established by Article 146, such persons must immediately inform the Board of Directors of their related-party nature, or such other group as the Board may appoint for that purpose. As required by law, “related-party transactions” must comply with corporate interests, as well as prices, terms and conditions prevailing in the market at the time of their approval. They must also meet all legal requirements, including acknowledgement by the Directors’ Committee and approval of the transaction by the Board of Directors (excluding the affected directors), by the ESM (in some cases, with requisite majority approval) and by any applicable regulatory procedures.
(1) The shares of outstanding common stock do not include 967,520,599 shares of treasury stock, which were acquired in connection with the statutory withdrawal right process associated with the 2018 Reorganization.
The aforementioned law, which also applies to our affiliates, also provides for some exceptions, stating that in certain cases, Board approval would suffice for “related-party transactions,” pursuant to certain related-party transaction thresholds and when such transactions are conducted in compliance with the related-party policies defined by the company’s board. The related-party transaction policy (política de habitualidad) was initially approved by the Board of Directors of Enel Américas at its session held on February 29, 2016, and subsequently ratified by our Board of Directors in its session held on March 23, 2016. This policy is available on our website at www.enelchile.cl.
If a transaction is not in compliance with Article 146 of the Chilean Corporations Act, this would not affect the transaction’s validity, but we or our shareholders may demand compensation from the individual associated with the infringement as provided under law, and compensation for damages.
Our internal procedure contemplates that all of our subsidiaries’ cash inflows and outflows are managed through our centralized cash management mechanism. It is a common practice in Chile to transfer surplus funds from one company to another affiliate that has a cash deficit. These transfers are executed through either short-term transactions or structured inter-company loans. Under Chilean laws and regulations, such transactions must be carried out on an arm’s-length basis. All of these transactions are subject to the supervision of our Directors’ Committee. As of December 31, 2018, the peso-denominated transactions were priced at TAB 1m (a Chilean interbank interest rate published on a daily basis) plus 1.10% when borrowing and TAB 1m plus 0.00% when lending. The US$-denominated transactions were priced at Libor plus 0.90% when borrowing and Libor plus 0.15% when lending.
On December 21, 2018, we signed a US$-denominated term loan with Enel Finance International N.V. The committed amount of the loan was up to US$ 400 million. As of March 31, 2019, the loan was undrawn. The applicable interest rate for the loan is Libor plus 1.00%. We intend to use the proceeds from the term loan to refinance short term maturities and general corporate purposes.
On December 31, 2015, our subsidiary Enel Green Power del Sur SpA signed a US$-denominated term loan with Enel Finance International N.V. The committed amount of the loan was up to US$ 650 million. As of March 31, 2019, the outstanding balance of the loan amounted US$ 644 million, at a variable interest rate of Libor plus 4.94%
On January 15, 2018, our subsidiary Enel Distribution received a peso-denominated structured loan from us. As of March 31, 2019, the outstanding balance of the loan amounted Ch$ 121,000 million, at a fixed annual interest rate of 4.03%.
On July 27, 2018, our subsidiary Enel Green Power del Sur SpA granted a US$-denominated structured loan to our subsidiary Empresa Electrica Panguipulli S.A. As of March 31, 2019, the outstanding balance of the loan amounted Ch$ 36,052 million, at a fixed annual interest rate of 3.63%.
During 2018, we granted short-term intercompany loans to our subsidiaries Enel Generación Chile SA, Empresa Eléctrica Pehuenche SA, Gas Atacama Chile SA, Enel Distribución Chile SA, Empresa Eléctrica De Colina Ltda, Luz Andes Ltda, Empresa de Transmisión Chena S.A., Enel Green Power Chile Ltda, Empresa Eléctrica Panguipulli SA, Parque Talinay Oriente SA and Enel Green Power del Sur SpA. As of March 31, 2019, the total outstanding balance of the loans amounted Ch$ 310,956 million.
We also received short-term intercompany loans from our subsidiaries Sociedad Agrícola De Cameros Ltda, Enel X Chile SpA., Almeyda Solar SpA, Parque Eólico Taltal SA and Parque Eólico Valle de los Vientos SA. As of March 31, 2019, the total outstanding balance of the loans amounted Ch$ 157,932 million.
Our subsidiary Gas Atacama Chile S.A. granted short-term intercompany loan to its subsidiary, GasAtacama Argentina (domiciled in Chile). As of March 31, 2019, the total outstanding balance of the loan amounted Ch$ 1,429 million.
Our subsidiary EGP Chile granted short-term intercompany loans to its subsidiaries Empresa Nacional De Geotermia S.A. and Geotermica Del Norte S.A. As of March 31, 2019, the total outstanding balance of the loans amounted Ch$ 11,977.
Starting from January 1, 2019, all intercompany operating lease contracts began to be considered as financial debt between related parties to comply with the new IFRS16 standards. As of March 31, 2019, the intercompany operating lease agreements amounted to Ch$ 14,737 million.
In addition, on February 25, 2011, Enel Latin America (Chile) (now Enel Green Power Chile Ltda.) signed with Enel Green Power International BV (now Enel Finance International N.V.) a cash management agreement, amended from time to time, through which it could invest the funds as time deposits. As of December 31, 2018, the outstanding amount invested was US $ 0.17 million, with an interest rate of 1-month Libor plus 0.8%.
As a result of the 2016 Reorganization, we entered into intercompany arrangements. Under Chilean law, Enel Américas remains jointly and severally liable for its former obligations that were assumed by us pursuant to the separation of the businesses completed on March 1, 2016. Such liability, however, will not extend to any obligation to a person or entity that has given its express consent relieving Enel Américas of such liability. For additional information on the corporate reorganization, see “Item 4. Information on the Company — A. History and Development of the Company — The 2016 Reorganization.”
There are various contractual relationships between Enel Américas, Enel Generation, Enel Distribution, Enel X Chile SpA and EGP Chile and us to provide-intercompany services. We entered into intercompany agreements under which we provide services directly and indirectly to Enel Generation and its subsidiaries, Enel Distribution and its subsidiaries. The services to be rendered by us include certain legal, finance, treasury, insurance services, capital markets, financial compliance, accounting, human resources, communications, security, relations with contractors, purchases, IT services, tax services, corporate affairs and other corporate support and administrative services. The services rendered varies depending on the company receiving the service. These services are provided and charged at market prices if there is a comparable service. If there are no comparable services in the market, they will be provided at cost plus a specified percentage. The intercompany services contracts are valid for five years with renewable terms since January 1, 2017.
The 2018 Reorganization consolidated Enel’s conventional and non-conventional renewable energy businesses in Chile. Under Chilean Law, the 2018 Reorganization has been deemed a related party transaction, subject to the statutory requirements and protections of the Title XVI of the Chilean Corporations Act. For additional information on the 2018 Reorganization, see “Item 4. Information on the Company — A. History and Development of the Company — The 2018 Reorganization.”
As of the date of this Report, the abovementioned transactions have not experienced material changes. Finally, as of December 31, 2018, there were also some commercial transactions with related parties. For more information regarding transactions with related parties, refer to Note 12 of the Notes to our consolidated financial statements.
C.Interests of Experts and Counsel.
Not applicable.
Item 8.Financial Information
A.Consolidated Statements and Other Financial Information.
See “Item 18. Financial Statements.”
Legal Proceedings
We and our subsidiaries are parties to legal proceedings arising in the ordinary course of business. We believe it is unlikely that any loss associated with pending lawsuits will significantly affect the normal development of our business.
For detailed information as of December 31, 2018 on the status of the material pending lawsuits that have been filed against us and our subsidiaries, please refer to Note 36.3 of the Notes to our consolidated financial statements. Please note that since March 1, 2016, we appear as the defendant instead of Enel Américas for current legal proceedings or those that may arise from our former Chilean businesses.
In relation to the legal proceedings reported in the Notes to our consolidated financial statements, we use the criteria of disclosing lawsuits above a minimum threshold of US$ 10 million of potential impact to us, and, in some cases, qualitative criteria according to the materiality of the plausible impact in the conduct of our business. The lawsuit status includes a general description, the process status and the estimate of the amount involved in each lawsuit.
Dividend Policy
Our Board of Directors proposes annually to the OSM for approval a definitive dividend payable each year, which is accrued in the prior year and cannot be less than the legal minimum of 30% of annual net income and informs a dividend policy for the current fiscal year. Additionally, our Board of Directors generally establishes an interim dividend for the current fiscal year, to be paid in January of the following year and which is deducted from the definitive dividend to be paid in May of the following year. The interim dividend is established by the Board of Directors and it is not subject to any restrictions under the Chilean law.
For dividends corresponding to fiscal year 2017, the interim and definitive dividend were paid on January 26, 2018 and May 18, 2018, respectively. The interim dividend of Ch$ 0.75642 per share of common stock was paid as part of the definitive dividend and amounted to 15% of consolidated net income as of September 30, 2017. At the OSM held on April 25, 2018, our shareholders approved the definitive dividend equivalent to Ch$ 2.99776 per share of common stock, but only Ch$ 2.24134 was effectively distributed since the interim dividend paid in January 2018 was deducted from it. The definitive dividend amounted to a payout ratio of 55% based on annual consolidated net income for fiscal year 2017.
For dividends corresponding to fiscal year 2018, on November 29, 2018, the Board of Directors agreed to distribute an interim dividend of Ch$ 0.45236, per share of common stock on January 25, 2019, accrued in fiscal year 2018, amounting to 15% of consolidated net income as of September 30, 2018. At the OSM held on April 29, 2019, our shareholders approved a definitive dividend equivalent to Ch$ 3.13773 per share of common stock for fiscal year 2018 but only Ch$ 2.68537 per share will be effectively distributed on May 17, 2019, after deducting the interim dividend paid in January 2019. The definitive dividend amounted to a payout ratio of 60% based on annual net income for fiscal year 2018.
For dividends corresponding to fiscal year 2019, our Board of Directors informed to the OSM held on April 29, 2019 the following Dividend Policy:
· An interim dividend, accrued in fiscal year 2019 and amounting to 15% of consolidated net income as of September 30, 2019, to be paid in January 2020.
· A definitive dividend payout equal to 65% of the annual net income for fiscal year 2019, to be paid in May 2020.
This dividend policy is conditional to net profits obtained in each period, as well as to expectations of future profit levels and other conditions that may exist at the time of such dividend declaration. The proposed dividend policy is subject to our Board of Director’s right to change the amount and timing of the dividends under the circumstances at the time of the payment.
The payment of dividends is potentially subject to legal restrictions, such as the requirement to pay dividends either from the net income or from retained earnings of the fiscal year. There may be also other contractual restrictions such as the non-default on credit agreements. However, these potential legal and contractual restrictions do not currently affect our ability or any of our subsidiaries’ ability to pay dividends. For additional information, see “Item 5. Operating and Financial Review and Prospects — B. Liquidity and Capital Resources”.
Shareholders at each subsidiary and affiliate agree on the definitive dividend payments. Dividends are paid to shareholders of record as of midnight of the fifth business day prior to the payment date. Holders of ADS on the applicable record dates will be entitled to participate in dividends.
Dividends
The table below sets forth, for each of the years indicated, the per-share dividend amounts distributed by us in Chilean pesos and the amount of dividends distributed per ADS (one ADS = 50 shares of common stock) in U.S. dollars for income attributable to 2018. For additional information, see “Item 10. Additional Information — D. Exchange Controls”.
| | Dividends distributed (1) | |
Year | | Nominal Ch$ per Share | | US$ per ADS (2) | |
2018 | | 2.988 | | 0.22 | |
2017 | | 3.234 | | 0.26 | |
2016 | | 2.093 | | 0.17 | |
(1) This chart details dividends paid and not the dividends accrued. These amounts do not reflect reduction for any applicable Chilean withholding tax.
(2) The U.S. dollar per ADS amount has been calculated by applying the exchange rates as of December 31 of each year, as applicable. One ADS = 50 shares of common stock.
For a discussion of Chilean withholding taxes and access to the formal currency market in Chile in connection with the payment of dividends and sales of ADSs and the underlying common stock, see “Item 10. Additional Information — E. Taxation” and “Item 10. Additional Information — D. Exchange Controls”.
B.Significant Changes
None.
Item 9.The Offer and Listing
A.Offer and Listing Details.
The shares of our common stock and our ADSs are currently trading on the Chilean Stock Exchanges and the NYSE, respectively, under the trading symbols “ENELCHILE” and “ENIC”, respectively.
B.Plan of Distribution.
Not applicable.
C.Markets.
In Chile, our common stock is traded on the following stock exchanges since April 21, 2016: the Santiago Stock Exchange, the Electronic Stock Exchange and, until October 8, 2018, the Valparaíso Stock Exchange. The Santiago Stock Exchange, the largest stock exchange in the country was established in 1893 as a private company. As of December 31, 2018, more than 200 companies had shares listed on the Santiago Stock Exchange. For 2018, the Santiago Stock Exchange accounted for 90.9% of our total equity traded in Chile and amounted to 12,556,590,152 shares. In addition, 9.1% of our equity trading was conducted on the Electronic Stock Exchange, an electronic trading market that was created by banks and non-member brokerage houses, and less than 0.1% was traded on the Valparaíso Stock Exchange.
On October 5, 2018, the Board of the Financial Market Commission (“CMF”) made public its resolution to revoke the existence authorization of the Valparaíso Stock Exchange, after 126 years of operations. The CMF explained that this was the result of the breach of the requirement of having a minimum number of 10 brokers as established in No. 4 of Article 40 of the Securities Market Law No. 18,045. Therefore, since October 8, 2018, the Valparaiso Stock Exchange stopped its operations.
Equities, closed-end funds, fixed-income securities, short-term and money market securities, gold and U.S. dollars are traded on the Santiago Stock Exchange. The Santiago Stock Exchange also trades U.S. dollar futures and stock index futures. The Santiago Stock Exchange also trades U.S. dollar futures and stock index futures. The Santiago Stock Exchange operates on business day from 9:30 a.m. to 4:00 p.m., during winter period from March to October, and from 9:30 a.m. to 5:00 p.m. during the summer period, from November to February, which may differ from New York City time by up to two hours, depending on the season.
Until early August 2018, there were two main stock price indexes on the Santiago Stock Exchange, the General Shares Price Index, or IGPA, and the Selective Shares Price Index, or IPSA. The IGPA was calculated using the prices of the shares traded during at least 5% of the days of the year, with a total of annual transactions exceeding UF 10,000 (approximately Ch$ 276 million as of December 31, 2018, equivalent to US$ 396,761) and a free float representing at least 5%. The IPSA was calculated using the prices of the 40 shares with the highest volume of quarterly transactions and with a market capitalization above US$ 200 million. The shares included in the IPSA and IGPA were weighted according to the weighted value of the shares traded. We have been included in the IPSA since April 21, 2016.
In August 2016, the Santiago Stock Exchange and the S&P Dow Jones Indices (“S&P DJI”) signed an Operating Agreement and Index Licensing. The alliance between the Santiago Stock Exchange and S&P DJI, the main global provider of concepts, data and research on indexes, includes the implementation of international methodological standards, as well as the integration of operational processes and business strategies, enhancing the visibility, governance and transparency of the existing indexes. The agreement also enables the development, granting of licenses, distribution and administration of current and future indexes, which will be developed as innovative and practical tools at the service of local and international investors. The indexes of the Santiago Stock Exchange, both new and existing, will use the shared brand “S&P / CLX” and may be used as underlying liquid financial products, thereby contributing to the expansion and depth of the Chilean capital markets. Under this agreement, S&P DJI assumed the tasks of calculation, production, maintenance, licensing and distribution of the indexes on Monday, August 6, 2018. Since that date, the IGPA and the IPSA are referred to as the SPCLXIGPA and the SPCLXIPSA, respectively.
The SPCLXIGPA is calculated considering, among other things, the prices of the shares traded during at least 25% of the days of the year, with a total of annual transactions exceeding UF 10,000 (approximately US$ 396,761 as of December 31, 2018) and a free float representing at least 5%. The SPCLXIGPA is rebalanced annually, after the close of the third Friday in March, and also, the
number of shares per component of the index is updated quarterly after the close of the third Friday of the months of June, September and December. The SPCLXIGPA index at the close of December 2018 was 25,949.84 points.
Our common stock trades in the United States in the form of ADSs on the NYSE by way of “when-issued” trading since April 21, 2016 under the ticker symbol “ENIC WI” and regular-way trading since April 27, 2016 under the ticker symbol “ENIC.” Each ADS represents 50 shares of common stock, with the ADSs in turn evidenced by American Depositary Receipts (“ADRs”). The ADRs were issued under a Deposit Agreement dated April 26, 2016, among us, Citibank, N.A. acting as Depositary (the “Depositary”), and the holders and beneficial owners from time to time of ADRs issued thereunder, which was amended on February 14, 2018 (the “Deposit Agreement”). Only persons in whose names ADSs are registered on the books of the Depositary are treated by the Depositary as owners of ADRs.
As of March 31, 2019, ADRs evidencing 52,852,890 ADSs (equivalent to 2,642,644,523 shares of common stock) were outstanding, representing 3.82% of the total number of outstanding shares. It is not practicable for us to determine the proportion of ADSs beneficially owned by U.S. final beneficial holders. Trading volume of our shares on the NYSE and other exchanges during 2018 amounted to 117.5 million ADSs, equivalent to US$ 625.8 million.
The NYSE is open for trading Monday through Friday from 9:30 am to 4:00 pm, with the exception of holidays declared by the NYSE in advance. On the trading floor, the NYSE trades in a continuous auction format, where traders can execute stock transactions on behalf of investors. Specialist brokers act as auctioneers in an open outcry auction market to bring buyers and sellers together and to manage the actual auction. Customers can also send orders for immediate electronic execution or route orders to the floor for trade in the auction market. The NYSE works with U.S. regulators like the SEC and the Commodity Futures Trading Commission to coordinate risk management measures in the electronic trading environment through the implementation of mechanisms like circuit breakers and liquidity replenishment points.
The following table contains information regarding the amount of total traded shares of common stock and the corresponding percentage traded per market during 2018:
| | Number of common
shares traded | | Percent | |
Market | | | | | |
Chile(1) | | 13,813,989,667 | | 70.2 | % |
United States (One ADS = 50 shares of common stock)(2) | | 5,873,666,300 | | 29.8 | % |
Total | | 19,687,655,967 | | 100 | % |
(1) Includes Santiago Stock Exchange, Electronic Stock Exchange and, until October 8, 2018, Valparaíso Stock Exchange.
(2) Includes the New York Stock Exchange and over-the-counter trading.
D.Selling Shareholders.
Not applicable.
E.Dilution.
Not applicable.
F.Expenses of the Issue.
Not applicable.
Item 10.Additional Information
A.Share Capital.
Not applicable.
B.Memorandum and Articles of Association.
Description of Share Capital
Set forth below is certain information concerning our share capital and a brief summary of certain significant provisions of Chilean law and our bylaws.
General
Shareholders’ rights in Chilean companies are governed by the company’s bylaws (estatutos), which have the same purpose as the articles or the certificate of incorporation and the bylaws of a company incorporated in the United States, and by the Chilean Corporations Act, Law No. 18,046. In addition, D.L. 3500, or the Pension Funds’ System Law, which permits the investment by Chilean pension funds in stock of qualified companies, indirectly affects corporate governance and prescribes certain rights of shareholders. In accordance with the Chilean Corporations Act, legal actions by shareholders to enforce their rights as shareholders of the company must be brought in Chile in arbitration proceedings or, at the option of the plaintiff, before Chilean courts. Members of the Board of Directors, managers, officers and principal executives of the company, or shareholders that individually own shares with a book value or stock value higher that UF 5,000 (Ch$ 138 million as of December 31, 2018) do not have the option to bring the procedure to the courts.
The Chilean securities markets are principally regulated by the CMF under Securities Market Law (Law No. 18,045) and the Chilean Corporations Act. These two laws state the disclosure requirements, restrictions on insider trading and price manipulation, and provide protection to minority shareholders. The Securities Market Law sets forth requirements for public offerings, stock exchanges and brokers, and outlines disclosure requirements for companies that issue publicly offered securities. The Chilean Corporations Act and the Securities Market Law, both as amended, state rules regarding takeovers, tender offers, transactions with related parties, qualified majorities, share repurchases, directors’ committees, independent directors, stock options and derivative actions.
Public Register
We are a publicly held stock corporation incorporated under the laws of Chile. We were incorporated by public deed issued on January 8, 2016 by the Santiago Notary Public, Mr. Iván Torrealba A., and registered on January 19, 2016 in the Commercial Register (Registro de Comercio del Conservador de Bienes Raíces y Comercio de Santiago) on pages 4288 No. 2570. Our registry in the Securities Registry of the CMF was approved by the CMF on April 13, 2016, under the entry number 1139. We are also registered with the United States Securities and Exchange Commission under the commission file number 001-37723 on March 31, 2016.
Reporting Requirements Regarding Acquisition or Sale of Shares
Under Article 12 of the Securities Market Law and General Rule No. 269 of the CMF, certain information regarding transactions in shares of a publicly held stock corporation or in contracts or securities whose price or financial results depend on, or are conditioned in whole or in part on the price of such shares, must be reported to the CMF and the Chilean Stock Exchanges. Since ADSs are deemed to represent the shares of common stock underlying the ADRs, transactions in ADRs will be subject to these reporting requirements and those established in Circular No. 1375 of the CMF. Shareholders of publicly held stock corporations are required to report to the CMF and the Chilean Stock Exchanges:
· any direct or indirect acquisition or sale of shares made by a holder who owns, directly or indirectly, at least 10% of a publicly held stock corporation’s subscribed capital;
· any direct or indirect acquisition or sale of contracts or securities whose price or financial results depend on or are conditioned in whole or in part on the price of shares made by a holder who owns, directly or indirectly, at least 10% of a publicly held stock corporation’s subscribed capital;
· any direct or indirect acquisition or sale of shares made by a holder who, due to an acquisition of shares of such publicly held stock company, results in the holder acquiring, directly or indirectly, at least 10% of a publicly held stock company’s subscribed capital; and
· any direct or indirect acquisition or sale of shares in any amount, made by a director, receiver, principal executive, general manager or manager of a publicly held stock corporation.
In addition, majority shareholders of a publicly held stock corporation must inform the CMF and the Chilean stock exchanges if such transactions are entered into with the intention of acquiring control of the company or if they are making a passive financial investment instead.
Under Article 54 of the Securities Market Law and General Rule No. 104 enacted by the CMF, any person who directly or indirectly intends to take control of a publicly held stock corporation must disclose this intent to the market at least ten business days in advance of the proposed change of control and, in any event, as soon as the negotiations for the change of control have taken place or reserved information of the publicly held stock corporation has been provided.
Corporate Objectives and Purposes
Article 4 of our bylaws states that our corporate objectives and purposes are, among other things, to conduct the exploration, development, operation, generation, distribution, transformation, or sale of energy in any form, directly or through other companies, as well as to provide engineering-consulting services related to these objectives, to make loans to related companies, subsidiaries and affiliates and to participate in the telecommunications business.
Board of Directors
Our Board of Directors consists of seven members who are appointed by shareholders at an OSM and are elected for a three-year term, at the end of which they will be re-elected or replaced. The seven directors elected at the OSM are the seven individual nominees who receive the highest majority of the votes. Each shareholder may vote his shares in favor of one nominee or may apportion his shares among any number of nominees. The effect of these voting provisions is to ensure that a shareholder owning more than 12.5% of our shares is guaranteed to be able to elect a member of the Board, although depending on the distribution of the rest of the votes at the OSM, a director may in some cases be elected with the votes of less than 12.5% of our shares. This number is derived from the reciprocal of the number of directors plus one. In our case, there are seven directors, and the reciprocal of eight is equal to 12.5%.
The compensation of the directors is established annually at the OSM. See “Item 6. Directors, Senior Management and Employees — B. Compensation”.
Agreements entered into by us with related parties can only be executed when such agreements serve our interest, and their price, terms and conditions are consistent with prevailing market conditions at the time of their approval and comply with all the requirements and procedures indicated in Article 147 of the Chilean Corporations Act.
Certain Powers of the Board of Directors
Our bylaws provide that every agreement or contract that we enter into with our controlling shareholder, our directors or executives, or their related parties, must be previously approved by two-thirds of the Board of Directors and be included in the Board meetings, and must comply with the provisions of the Chilean Corporations Act.
Our bylaws do not contain provisions relating to:
· the directors’ power, in the absence of an independent quorum, to vote on compensation for themselves or any members of their body;
· borrowing powers exercisable by the directors and how such borrowing powers can be changed;
· retirement or non-retirement of directors under an age limit requirement; or
· number of shares, if any, required for directors’ qualification.
Certain Provisions Regarding Shareholder Rights
As of the date of the filing of this Report, our capital is comprised of only one class of shares, all of which are common shares and have the same rights.
Our bylaws do not contain any provisions relating to:
· redemption provisions;
· sinking funds; or
· liability for capital reductions by us.
Under Chilean law, the rights of our shareholders may only be modified by an amendment to the bylaws that complies with the requirements explained below under “Item 10. Additional Information — B. Memorandum and Articles of Association. — Shareholders’ Meetings and Voting Rights”.
Capitalization
Under Chilean law, only the shareholders of a company acting at an ESM have the power to authorize a capital increase. When an investor subscribes shares, these are officially issued and registered under his name, and the subscriber is treated as a shareholder for all purposes, except receipt of dividends and for return of capital in the event that the shares have been subscribed but not paid for. The subscriber becomes eligible to receive dividends only for the shares that he has actually paid for or, if the subscriber has paid for only a portion of such shares, the pro rata portion of the dividends declared with respect to such shares unless the company’s bylaws provide otherwise. If a subscriber does not fully pay for shares for which the subscriber has subscribed on or prior to the date agreed upon for payment, notwithstanding the actions intended by the company to collect payment, the company is entitled to auction the shares on the stock exchange where such shares are traded, for the account and risk of the debtor, the number of shares held by the debtor necessary for the company to pay the outstanding balances and disposal expenses. However, until such shares are sold at auction, the subscriber continues to hold all the rights of a shareholder, except the right to receive dividends and return of capital. The Chief Executive Officer, or the person replacing him, will reduce in the shareholders’ register the number of shares in the name of the debtor shareholder to the number of shares that remain, deducting the shares sold by the company and settling the debt in the amount necessary to cover the result of such disposal after the corresponding expenses.
When there are authorized and issued shares for which full payment has not been made within the period fixed by shareholders at the same ESM at which the subscription was authorized (which in no case may exceed three years from the date of such meeting), these shall be reduced in the non-subscribed amount until that date. With respect to the shares subscribed and not paid following the term mentioned above, the Board must proceed to collect payment, unless the shareholders’ meeting authorizes (by two thirds of the voting shares) a reduction of the company’s capital to the amount effectively collected, in which case the capital shall be reduced by force of law to the amount effectively paid. Once collection actions have been exhausted, the Board should propose to the shareholders’ meeting the approval by simple majority of the write-off of the outstanding balance and the reduction of capital to the amount effectively recovered.
As of December 31, 2018, our subscribed and fully paid capital totaled Ch$ 3,954 billion and consisted of 70,134,077,818 shares (which includes 967,520,599 shares of treasury stock).
Preemptive Rights and Increases of Share Capital
The Chilean Corporations Act requires Chilean companies to grant shareholders preemptive rights to purchase a sufficient number of shares to maintain their existing ownership percentage of such company whenever such company issues new shares.
Under Chilean law, preemptive rights are exercisable or freely transferable by shareholders during a 30-day period. The options to subscribe for shares in capital increases of the company or of any other securities convertible into shares or that confer future rights over these shares, should be offered, at least once, to the shareholders pro rata to the shares held registered in their name at midnight on the fifth business day prior to the date of the start of the preemptive rights period. The preemptive rights offering and the start of the 30-day period for exercising them shall be communicated through the publication of a prominent notice, at least once, in the newspaper that should be used for notifications of shareholders’ meetings. During such 30-day period, and for an additional period of up to 30-days immediately following the initial 30-day period, publicly held stock corporations are not permitted to offer any unsubscribed shares to third parties on terms that are more favorable than those offered to their shareholders. At the end of the second 30-day period, a Chilean publicly held stock corporation is authorized to sell non-subscribed shares to third parties on any terms, provided they are sold on one of the Chilean stock exchanges.
Shareholders’ Meetings and Voting Rights
An OSM must be held within the first four months following the end of our fiscal year. Our OSM was held on April 29, 2019. An ESM may be called by the Board of Directors when deemed appropriate, or when requested by shareholders representing at least 10% of the issued shares with voting rights, or by the CMF. To convene an OSM or an ESM, notice must be given three times in a newspaper located in our corporate domicile. The newspaper designated by our shareholders is El Mercurio. The first notice must be published not less than 15-days and no more than 20-days in advance of the scheduled meeting. Notice must also be mailed to each shareholder, to the CMF and to the Chilean stock exchanges.
The OSM shall be held on the day stated in the notice and should remain in session until having exhausted all the matters stated in the notice. However, once constituted, upon the proposal of the chairman or shareholders representing at least 10% of the shares with voting rights, the majority of the shareholders present may agree to suspend it and to continue it within the same day and place, with no new constitution of the meeting or qualification of powers being necessary, recorded in one set of minutes. Only those shareholders who were present or represented may attend the recommencement of the meeting with voting rights.
Under Chilean law, a quorum for a shareholders’ meeting is established by the presence, in person or by proxy, of shareholders representing at least a majority of the issued shares with voting rights of a company. If a quorum is not present at the first meeting, a reconvened meeting can take place at which the shareholders present are deemed to constitute a quorum regardless of the percentage of the shares represented. This second meeting must take place within 45-days following the scheduled date for the first meeting. Shareholders’ meetings adopt resolutions by the affirmative vote of a majority of those shares present or represented at the meeting. An ESM must be called to take the following actions:
· a transformation of the company into a form other than a publicly held stock corporation under the Chilean Corporations Act, a merger or split-up of the company;
· an amendment to the term of duration or early dissolution of the company;
· a change in the company’s domicile;
· a decrease of corporate capital;
· an approval of capital contributions in kind and non-monetary assessments;
· a modification of the authority reserved to shareholders or limitations on the Board of Directors;
· a reduction in the number of members of the Board of Directors;
· a disposition of 50% or more of the assets of the company, whether it includes disposition of liabilities or not, as well as the approval or the amendment of the business plan which contemplates the disposition of assets in an amount greater that such percentage;
· the disposition of 50% or more of the assets of a subsidiary, as long as such subsidiary represents at least 20% of the assets of the corporation, as well as any disposition of its shares that results in the parent company losing its position as controlling shareholder;
· the form of distributing corporate benefits;
· issue of guarantees for third-party liabilities which exceed 50% of the assets, except when the third party is a subsidiary of the company, in which case approval of the Board of Directors is deemed sufficient;
· the purchase of the company’s own shares;
· other actions established by the bylaws or the laws;
· certain remedies for the nullification of the company’s bylaws;
· inclusion in the bylaws of the right to purchase shares from minority shareholders, when the controlling shareholders reaches 95% of the company’s shares by means of a tender offer for all of the company’s shares, where at least 15% of the shares have been acquired from unrelated shareholders; and
· approval or ratification of acts or contracts with related parties.
Regardless of the quorum present, the vote required for any of the actions above is at least two-thirds of the outstanding shares with voting rights.
Bylaw amendments for the creation of a new class of shares, or an amendment to or an elimination of those classes of shares that already exist, must be approved by at least two-thirds of the outstanding shares of the affected series.
Chilean law does not require a publicly held stock corporation to provide its shareholders the same level and type of information required by the U.S. securities laws regarding the solicitation of proxies. However, shareholders are entitled to examine the financial statements and corporate books of a publicly held stock corporation within the 15-day period before its scheduled shareholders meetings. Under Chilean law, a notice of a shareholders meeting listing matters to be addressed at the meeting must be mailed at least 15 days prior to the date of such meeting, and, an indication of the way complete copies of the documents that support the matters submitted for voting can be obtained, which must also be made available to shareholders on our website. In the case of an OSM, our annual report of activities, which includes audited financial statements, must also be made available to shareholders and published on our website at: www.enelchile.cl.
The Chilean Corporations Act provides that, upon the request by the Directors’ Committee or by shareholders representing at least 10% of the issued shares with voting rights, a Chilean company’s annual report must include, in addition to the materials provided by the Board of Directors to shareholders, such shareholders’ comments and proposals in relation to the company’s affairs. In accordance with Article 136 of the Chilean Corporations Regulation (Reglamento de Sociedades Anónimas), the shareholder(s) holding or representing at least 10% of the shares issued with voting rights, may:
· make comments and proposals relating to the progress of the corporate businesses in the corresponding year, no shareholder being able to make individually or jointly more than one presentation. These observations should be presented in writing to the company concisely, responsibly and respectfully, and the respective shareholder(s) should state their willingness for these to be included as an appendix to the annual report. The Board shall include in an appendix to the annual report of the year a faithful summary of the pertinent comments and proposals the interested parties had made, provided they are presented during the year or within 30-days after its ending; or
· make comments and proposals on matters that the Board submits for the knowledge or voting of the shareholders. The Board shall include a faithful summary of those comments and proposals in all information it sends to shareholders, provided the shareholders’ proposal is received at the offices of the company at least 10-days prior to the date of dispatch of the information by the company. The shareholders should present their comments and proposals to the company, expressing their willingness for these to be included in the appendix to the respective annual report or in information sent to shareholders, as the case may be. The observations referred to in Article 136 may be made separately by each shareholder holding at least 10% of the shares issued with voting rights or shareholders who together hold that percentage, who should act as one.
Similarly, the Chilean Corporations Act provides that whenever the Board of Directors of a publicly held stock corporation convenes an OSM and solicits proxies for the meeting, or circulates information supporting its decisions or other similar material, it is obligated to include the pertinent comments and proposals that may have been made by the Directors’ Committee or by shareholders owning at least 10% of the shares with voting rights who request that such comments and proposals be so included.
Only shareholders registered as such with us as of midnight on the fifth business day prior to the date of a meeting are entitled to attend and vote their shares. A shareholder may appoint another individual, who does not need to be a shareholder, as his proxy to attend the meeting and vote on his behalf. Proxies for such representation shall be given for all the shares held by the owner. The proxy may contain specific instructions to approve, reject, or abstain with respect to any of the matters submitted for voting at the meeting and which were included in the notice. Every shareholder entitled to attend and vote at a shareholders’ meeting shall have one vote for every share subscribed.
There are no limitations imposed by Chilean law or our bylaws on the right of nonresidents or foreigners to hold or vote shares of common stock. However, the registered holder of the shares of common stock represented by ADSs, and evidenced by outstanding ADSs, is the custodian of the Depositary, currently Banco Santander-Chile, or any successor thereto. Accordingly, holders of ADSs are not entitled to receive notice of meetings of shareholders directly or to vote the underlying shares of common stock represented by ADS directly. The Deposit Agreement contains provisions pursuant to which the Depositary has agreed to request instructions from registered holders of ADSs as to the exercise of the voting rights pertaining to the shares of common stock represented by the ADSs. Subject to compliance with the requirements of the Deposit Agreement and receipt of such instructions, the Depositary has agreed to endeavor, insofar as practicable and permitted under Chilean law and the provisions of the bylaws, to vote or cause to be voted (or grant a discretionary proxy to the Chairman of the Board of Directors or to a person designated by the Chairman of the Board of Directors to vote) the shares of common stock represented by the ADSs in accordance with any such instruction. The Depositary shall not itself exercise any voting discretion over any shares of common stock underlying ADSs. If no voting instructions are received by the Depositary from a holder of ADSs with respect to the shares of common stock represented by the ADSs, on or before the date
established by the Depositary for such purpose, the shares of common stock represented by the ADS, may be voted in the manner directed by the Chairman of the Board, or by a person designated by the Chairman of the Board, subject to limitations set forth in the Deposit Agreement.
Dividends and Liquidation Rights
According to the Chilean Corporations Act, unless otherwise decided by unanimous vote of its issued shares eligible to vote, all companies must distribute a cash dividend in an amount equal to at least 30% of their consolidated net income, unless and except to the extent we have carried forward losses. The law provides that the Board of Directors must agree to the dividend policy and inform such policy to the shareholders at the OSM.
Any dividend in excess of 30% of net income may be paid, at the election of the shareholders, in cash, or in our shares, or in shares of publicly held corporations owned by us. Shareholders who do not expressly elect to receive a dividend other than in cash are legally presumed to have decided to receive the dividend in cash.
Dividends, which are declared but not paid within the appropriate time period set forth in the Chilean Corporations Act (as to minimum dividends, 30-days after declaration; as to additional dividends, the date set for payment at the time of declaration), are adjusted to reflect the change in the value of UF, from the date set for payment to the date such dividends are actually paid. Such dividends also accrue interest at the then-prevailing rate for UF-denominated deposits during such period. The right to receive a dividend lapses if it is not claimed within five years from the date such dividend is payable. Payments not collected in such period are transferred to the volunteer fire department.
In the event of our liquidation, the shareholders would participate in the assets available in proportion to the number of paid-in shares held by them, after payment to all creditors.
Approval of Financial Statements
The Board of Directors is required to submit our consolidated financial statements to the shareholders annually for their approval. If the shareholders by a vote of a majority of shares present (in person or by proxy) at the shareholders’ meeting reject the financial statements, the Board of Directors must submit new financial statements no later than 60-days from the date of such meeting. If the shareholders reject the new financial statements, the entire Board of Directors is deemed removed from office and a new board is elected at the same meeting. Directors who individually approved such financial statements are disqualified for reelection for the following period. Our shareholders have never rejected the financial statements presented by the Board of Directors.
Change of Control
The Capital Markets Law establishes a comprehensive regulation related to tender offers. The law defines a tender offer as the offer to purchase shares of companies which publicly offer their shares or securities convertibles into shares and which offer is made to shareholders to purchase their shares under conditions that allow the bidder to reach a certain percentage of ownership of the company within a fixed period of time. These provisions apply to both voluntary and hostile tender offers.
Acquisition of Shares
No provision in our bylaws discriminates against any existing or prospective holder of shares as a result of such shareholder owning a substantial number of shares. However, no person may directly or indirectly own more than 65% of the outstanding shares of our stock. The foregoing restriction does not apply to the depositary as record owner of shares represented by ADRs, but it does apply to each beneficial ADS holder. Additionally, our bylaws prohibit any shareholder from exercising voting power with respect to more than 65% of the common stock owned by such shareholder or on behalf of others representing more than 65% of the outstanding issued shares with voting rights.
Right of Dissenting Shareholders to Tender Their Shares
The Chilean Corporations Act provides that upon the adoption of any of the resolutions enumerated below at a meeting of shareholders, dissenting shareholders acquire the right to withdraw from the company and to compel the company to repurchase their shares, subject to the fulfillment of certain terms and conditions. In order to exercise such withdrawal rights, holders of ADRs must first withdraw the shares represented by their ADRs pursuant to the terms of the Deposit Agreement.
“Dissenting” shareholders are defined as those who at a shareholders’ meeting vote against a resolution that results in the withdrawal right, or who if absent from such meeting, state in writing their opposition to the respective resolution, within the 30-days following the shareholders’ meeting. Shareholders present or represented at the meeting and who abstain in exercising their voting rights shall not be considered as dissenting. The right to withdraw should be exercised for all the shares that the dissenting shareholder had registered in their name on the date on which the right is determined to participate in the meeting at which the resolution is adopted that motivates the withdrawal and which remains on the date on which their intention to withdraw is communicated to the company.
The price paid to a dissenting shareholder of a publicly held stock corporation whose shares are quoted and actively traded on one of the Chilean stock exchanges is the weighted average of the sales prices for the shares as reported on the Chilean stock exchanges on which the shares are quoted for the two-month period between the ninetieth and the thirtieth day before the shareholders’ meeting giving rise to the withdrawal right. If, because of the volume, frequency, number and diversity of the buyers and sellers, the CMF determines that the shares are not actively traded on a stock exchange, the price paid to the dissenting shareholder shall be the book value. Book value for this purpose shall equal paid capital plus reserves and profits, less losses, divided by the total number of subscribed shares, whether entirely or partially paid. For the purpose of making this calculation, the last consolidated statements of financial position is used, as adjusted to reflect inflation up to the date of the shareholders’ meeting which gave rise to the withdrawal right.
Article 126 of the Chilean Corporations Act Regulations establishes that in cases where the right to withdraw arises, the company shall be obliged to inform the shareholders of this situation, the value per share that will be paid to shareholders exercising their right to withdraw and the term for exercising it. Such information should be given to shareholders at the same meeting at which the resolutions are adopted giving rise to the right of withdrawal, prior to its voting. A special communication should be given to the shareholders with rights, within two days following the date on which the rights to withdraw are born. In the case of publicly held companies, such information shall be communicated by a prominent notice in a newspaper with a wide national circulation and on its website, plus a written communication addressed to the shareholders with rights at the address they have registered with the company. The notice of the shareholders meeting that should pronounce on a matter that could originate withdrawal rights should mention this circumstance.
The resolutions that result in a shareholder’s right to withdraw include, among others, the following:
· the transformation of the company into an entity which is not a publicly held stock corporation governed by Chilean Corporations Act;
· the merger of the company with another company;
· disposition of 50% or more of the assets of the company, whether it includes disposition of liabilities or not, as well as the approval or the amendment of the business plan which contemplates the disposition of assets in an amount greater than such percentage;
· the disposition of 50% or more of the assets of a subsidiary, as long as such subsidiary represents at least 20% of the assets of the company, as well as any disposition of its shares that results in the parent company losing its position of controlling shareholder;
· issue of guarantees for third parties’ liabilities which exceed 50% of the assets (if the third party is a subsidiary of the company, the approval of the Board of Directors is sufficient);
· the creation of preferential rights for a class of shares or an amendment to the existing ones. In this case the right to withdraw only accrues to the dissenting shareholders of the class or classes of shares adversely affected;
· certain remedies for the nullification of the corporate bylaws; and
· such other causes as may be established by the law or by the company’s bylaws.
Investments by AFPs
The Pension Funds’ System Law permits AFPs to invest their funds in companies that are subject to Title XII and these companies are subject to greater restrictions than other companies. The determination of which stocks may be purchased by AFPs is made by the Risk Classification Committee. The Risk Classification Committee establishes investment guidelines and is empowered to approve or disapprove those companies that are eligible for AFP investments. We are and have been a Title XII company and are approved by the Risk Classification Committee.
Title XII companies are required to have bylaws that:
· limit the ownership of any shareholder to a specified maximum percentage, currently 65%;
· require that certain actions be taken only at a meeting of the shareholders; and
· give the shareholders the right to approve certain investment and financing policies.
Registrations and Transfers
Shares issued by us are registered with an administrative agent, which is DCV Registros S.A. This entity is also responsible for our shareholders registry. In case of jointly-owned shares, an attorney-in-fact must be appointed to represent the joint owners in dealing with us.
C.Material Contracts.
None.
D.Exchange Controls.
The Central Bank of Chile is responsible for, among other things, monetary policies and exchange controls in Chile. Currently applicable foreign exchange regulations are set forth in the Compendium of Foreign Exchange Regulations (the “Compendium”) approved by the Central Bank of Chile in 2002. Appropriate registration of a foreign investment in Chile permits the investor access to the Formal Exchange Market. Foreign investments can be registered with the Foreign Investment Committee under D.L. 600 of 1974 or can be registered with the Central Bank of Chile under the Central Bank Act, Law No. 18,840 of October 1989.
a)Chapter XIV
The following is a summary of certain provisions of Chapter XIV that are applicable to all existing shareholders (and ADS holders). This summary does not intend to be complete and is qualified in its entirety by reference to Chapter XIV. Chapter XIV regulates the following type of investments: credits, deposits, investments and equity contributions. A Chapter XIV investor may at any time repatriate an investment made in us upon sale of our shares, and the profits derived therefrom, with no monetary ceiling, subject to the then effective regulations, which must be reported to the Central Bank of Chile.
Except for compliance with tax regulations and some reporting requirements, currently there are no rules in Chile affecting repatriation rights, except that the remittance of foreign currency must be made through a Formal Exchange Market entity. However, the Central Bank of Chile has the authority to change such rules and impose exchange controls.
b)The Compendium and International Bond Issuances
Chilean issuers may offer bonds issued by the Central Bank of Chile internationally under Chapter XIV of the Compendium.
E. Taxation.
Chilean Tax Considerations
The following discussion summarizes material Chilean income and withholding tax consequences to foreign holders arising from the ownership and disposition of shares and ADSs. The summary that follows does not purport to be a comprehensive description of all of the tax considerations that may be relevant to a decision to purchase, own or dispose of shares or ADSs, if any, and does not purport to deal with the tax consequences applicable to all categories of investors, some of which may be subject to special rules. Holders of shares and ADSs are advised to consult their own tax advisors concerning the Chilean and other tax consequences of the ownership of shares or ADSs.
The summary that follows is based on Chilean law, in effect on the date hereof, and is subject to any changes in these or other laws occurring after such date, possibly with retroactive effect. Under Chilean law, provisions contained in statutes such as tax rates applicable to foreign investors, the computation of taxable income for Chilean purposes and the manner in which Chilean taxes are imposed and collected may be amended only by another law. In addition, the Chilean tax authorities enact rulings and regulations of either general or specific application and interpret the provisions of the Chilean Income Tax Law. Chilean tax may not be assessed retroactively against taxpayers who act in good faith relying on such rulings, regulations and interpretations, but Chilean tax
authorities may change their rulings, regulations and interpretations in the future. The discussion that follows is also based, in part, on representations of the depositary, and assumes that each obligation in the Deposit Agreement and any related agreements will be performed in accordance with its terms. As of this date, there is currently no applicable income tax treaty in effect between the United States and Chile. However, in 2010 the United States and Chile signed an income tax treaty that will enter into force once the treaty is ratified by both countries, which has not happened as of the date of this Report. There can be no assurance that the treaty will be ratified by either country. The following summary assumes that there is no applicable income tax treaty in effect between the United States and Chile.
As used in this Report, the term “foreign holder” means either:
· In the case of an individual holder, a person who is not a resident of Chile. For purposes of Chilean taxation, (a) an individual is a Chilean resident if he has resided in Chile for more than six months in one calendar year, or a total of more than six months in two consecutive fiscal years; or (b) an individual is domiciled in Chile if he resides in Chile and has the intention of remaining in Chile (such intention to be evidenced by circumstances such as the acceptance of employment in Chile or the relocation of the individual’s family to Chile), or
· in the case of a legal entity holder, an entity that is not organized under the laws of Chile, unless the shares or ADSs are assigned to a branch, agent, representative or permanent establishment of such entity in Chile.
Taxation of Shares and ADSs
Taxation of Cash Dividends and Property Distributions
Cash dividends paid with respect to the shares or ADSs held by a foreign holder will be subject to Chilean withholding tax, which is withheld and paid by the company. The amount of the Chilean withholding tax is determined by applying a 35% rate to a “grossed-up” distribution amount (such amount equal to the sum of the actual distribution amount and the correlative Chilean corporate income tax (“CIT”), paid by the issuer), and then subtracting as a credit 65% of such Chilean CIT paid by the issuer, in case the residence country of the holder of shares or ADSs does not have a tax treaty with Chile. If there is a tax treaty between both countries (in force or signed prior to January 1, 2017) the Foreign Holder can apply 100% of the CIT as a credit. For 2018, the Chilean CIT applicable to us is a rate of 27%, and depending on the circumstances mentioned above, the Foreign Holder may apply 100% or 65% of the CIT as a credit.
There are two alternative mechanisms of shareholder-level income taxation in effect since January 1, 2017: a) accrued income basis (known as attributed-income system in Chile) shareholder taxation and b) cash basis (known as partially-integrated system in Chile) shareholder taxation.
Under the current Chilean Income Tax Law, publicly held limited liability stock companies, such as we, are subject to the latter regime.
Under the cash basis regime (or partially-integrated regime), a company pays CIT on its annual income tax result. Foreign and local individual shareholders will only pay in Chile the relevant tax on effective profit distributions and will be allowed to use the CIT paid by the distributing company as credit, with certain limitations. Only 65% of the CIT is creditable against the 35% shareholder-level tax (as opposed to 100% under the accrued income basis regime). However, in those cases where tax treaties between Chile and the jurisdiction of the shareholder’s residence are signed prior to January 1, 2019 (even if not yet in effect), the CIT is fully creditable against the 35% withholding tax. This is the case with the tax treaty signed between Chile and the United States, which was signed prior to this date, but which is not in effect as of the time of this Report. In the case of treaties signed prior to January 1, 2019 but not enacted as of December 31, 2021, the shareholder may apply 100% of the CIT as a credit if a dividend distribution is made before December 31, 2021, on a transitional basis. Under the Chilean Tax Law in force at the time of this Report, the transitional treatment of applying the full 100% of the CIT as a credit against withholding tax of the U.S. Holders in case of dividend distributions will terminate on December 31, 2021, if the tax treaty between the United States and Chile is not ratified by that date. In that particular case, effective January 1, 2022, only 65% of the CIT will be creditable against the 35% U.S. Holders’ tax. On the other hand, if a tax treaty with a foreign jurisdiction is enacted by December 31, 2021, shareholders from that particular jurisdiction can continue to apply 100% of the CIT as a credit beyond such date.
The example below illustrates the effective Chilean withholding tax burden on a cash dividend received by a Foreign Holder, assuming a Chilean withholding tax base rate of 35%, an effective Chilean CIT rate of 27% (the CIT rate for 2018 for companies that
elected the cash basis regime) and a distribution of 50% of the net income of the company distributable after payment of the Chilean CIT:
Line | | Concept and calculation assumptions | | Amount Tax
treaty resident | | Amount Non-tax treaty
resident | |
1 | | Company taxable income (based on Line 1 = 100) | | 100 | | 100.0 | |
2 | | Chilean corporate income tax : 27% x Line 1 | | 27 | | 27 | |
3 | | Net distributable income: Line 1—Line 2 | | 73 | | 73 | |
4 | | Dividend distributed (50% of net distributable income): 50% of Line 3 | | 36.5 | | 36.5 | |
5 | | Withholding tax: (35% of (the sum of Line 4 and 50% of Line 2)) | | 17.5 | | 17.5 | |
6 | | Credit for 50% of Chilean corporate income tax : 50% of Line 2 | | 13.5 | | 13.5 | |
7 | | CIT partial restitution (Line 6 x 35)%(1) | | — | | 4.7 | |
8 | | Net withholding tax: Line 5 - Line 6 + Line 7 | | 4 | | 8.7 | |
9 | | Net dividend received: Line 4 - Line 8 | | 32.5 | | 27.8 | |
10 | | Effective dividend withholding rate : Line 8 / Line 4 | | 11.0 | | 23.9 | |
(1) Only applicable to non-tax treaty jurisdiction resident. From a practical standpoint the foregoing means that the CIT is only partially creditable (65%) against the withholding tax (i.e., CIT of 8.7%).
However, for purposes of the foregoing, the tax authority has not clarified whether the taxpayer residence will be the ADS holder’s address or the depository’s address.
Taxation on sale or exchange of ADSs, outside of Chile
Gains obtained by a foreign holder from the sale or exchange of ADSs outside Chile are not be subject to Chilean taxation.
Taxation on sale or exchange of Shares
The Chilean Income Tax Law includes a tax exemption on capital gains arising from the sale of shares of listed companies traded in stock markets. Although there are certain restrictions, in general terms, the law provides that in order to qualify for the capital gain exemption: (i) the shares must be of a publicly held stock corporation with a “sufficient stock market liquidity” status in the Chilean Stock Exchanges; (ii) the sale must be carried out in a Chilean Stock Exchange authorized by the CMF, or in a tender offer subject to Chapter XXV of the Chilean Securities Market Law or as the consequence of a contribution to a fund as regulated in Section 109 of the Chilean Income Tax Law; (iii) the shares which are being sold must have been acquired on a Chilean Stock Exchange, or in a tender offer subject to Chapter XXV of the Chilean Securities Market Law, or in an initial public offering (due to the creation of a company or to a capital increase), or due to the exchange of convertible publicly offered securities, or due to the redemption of a fund’s quota as regulated in Section 109 of the Chilean Income Tax Law; and (iv) the shares must have been acquired after April 19, 2001. For purposes of considering the ADS’s as convertible publicly offered securities, they should be registered in the Chilean foreign securities registry (unless expressly excluded from such registry by the CMF).
Shares are considered to have a “high presence” in the Chilean Stock Exchanges when (i) they have been traded for a certain number of days at or beyond a volume threshold specified under Chilean law and regulations or (ii) in case the issuer has retained a market maker, in accordance with Chilean law and regulations. As of this date, our shares are considered to have a high presence in the Chilean Stock Exchanges and no market maker has been retained by us. Should our shares cease to have a “high presence” in the Chilean Stock Exchanges, a transfer of our shares may be subject to capital gains taxes from which holders of “high presence” securities are exempted, and which will apply at varying levels depending on the time of the transfer in relation to the date of loss of sufficient trading volume to qualify as a “high presence” security. If our shares regain a “high presence,” the tax exemptions will again be available to holders thereof.
If the shares do not qualify for the exemption, capital gains on their sale or exchange of shares (as distinguished from sales or exchanges of ADSs representing such shares of common stock) could be subject to the general tax regime, with a 27% Chilean CIT, the rate applicable during 2018, and a 35% Chilean withholding tax, the former being creditable against the latter.
The date of acquisition of the ADSs is considered to be the date of acquisition of the shares for which the ADSs are exchanged.
Taxation of Share Rights and ADS Rights
For Chilean tax purposes and to the extent we issue any share rights or ADS rights, the receipt of share rights or ADS rights by a Foreign Holder of shares or ADSs pursuant to a rights offering is a nontaxable event. In addition, there are no Chilean income tax consequences to Foreign Holders upon the exercise or the expiration of the share rights or the ADS rights.
Any gain on the sale, exchange or transfer of any ADS rights by a Foreign Holder is not subject to taxes in Chile.
Any gain on the sale, exchange or transfer of the share rights by a Foreign Holder is subject to a 35% Chilean withholding tax.
Other Chilean Taxes
There is no gift, inheritance or succession tax applicable to the ownership, transfer or disposition of ADSs by foreign holders, but such taxes will generally apply to the transfer at death or by gift of the shares by a foreign holder. There is no Chilean stamp, issue, registration or similar taxes or duties payable by holders of shares or ADSs.
Material U.S. Federal Income Tax Considerations
This discussion is based on the U.S. Internal Revenue Code of 1986, as amended (the “Code”), administrative pronouncements, judicial decisions and final, temporary and proposed Treasury regulations, all as of the date of this Report. These authorities are subject to change, possibly with retroactive effect. This discussion assumes that the depositary’s activities are clearly and appropriately defined so as to ensure that the tax treatment of ADSs will be identical to the tax treatment of the underlying shares.
The following are the material U.S. federal income tax consequences to U.S. Holders (as defined herein) of receiving, owning, and disposing of shares or ADSs, but it does not purport to be a comprehensive description of all of the tax considerations that may be relevant to a particular person’s decision to hold such securities and is based on the assumption stated above under “Chilean Tax Considerations” that there is no applicable income tax treaty in effect between the United States and Chile. The discussion applies only if the beneficial owner holds shares or ADSs as capital assets for U.S. federal income tax purposes and it does not describe all of the tax consequences that may be relevant in light of the beneficial owner’s particular circumstances. For instance, it does not describe all the tax consequences that may be relevant to:
· certain financial institutions;
· insurance companies;
· dealers and traders in securities who use a mark-to-market method of tax accounting;
· persons holding shares or ADSs as part of a “straddle” integrated transaction or similar transaction;
· persons whose functional currency for U.S. federal income tax purposes is not the U.S. dollar;
· partnerships or other entities classified as partnerships for U.S. federal income tax purposes or partners in such partnerships;
· persons liable for the alternative minimum tax;
· tax-exempt organizations;
· persons holding shares or ADSs that own or are deemed to own ten percent or more of our stock; or
· persons holding shares or ADSs in connection with a trade or business conducted outside of the United States.
Persons or entities described above, including partnerships holding shares or ADSs and partners in such partnerships, should consult their tax advisors as to the particular U.S. federal income tax consequences of holding and disposing of shares or ADSs.
You will be a “U.S. Holder” for purposes of this discussion if you become a beneficial owner of our shares or ADSs and if you are, for U.S. federal income tax purposes:
· a citizen or individual resident of the United States; or
· a corporation, or other entity taxable as a corporation, created or organized in or under the laws of the United States or any political subdivision thereof; or
· an estate, the income of which is subject to U.S. federal income taxation regardless of its source; or
· a trust (i) that validly elects to be treated as a U.S. person for U.S. federal income tax purposes or (ii) if (A) a court within the United States is able to exercise primary supervision over the administration of the trust and (B) one or more U.S. persons have the authority to control all substantial decisions of the trust.
For U.S. federal income tax purposes, it is generally expected that a U.S. Holder of ADSs will be treated as the beneficial owner of the underlying shares represented by the ADSs. The remainder of this discussion assumes that a U.S. Holder of our ADSs will be treated in this manner for U.S. federal income tax purposes. Accordingly, deposits or withdrawals of shares for ADSs will generally not be subject to U.S. federal income tax.
The U.S. Treasury has expressed concerns that parties to whom ADSs are released before shares are delivered to the depositary (pre-release) or intermediaries in the chain of ownership between beneficial owners and the issuer of the security underlying the ADSs may be taking actions that are inconsistent with the claiming of foreign tax credits for beneficial owners of depositary shares. Such actions would also be inconsistent with the claiming of the reduced tax rate, described below, applicable to dividends received by certain non-corporate beneficial owners. Accordingly, the analysis of the creditability of Chilean taxes, and the availability of the reduced tax rate for dividends received by certain non-corporate holders, each described below, could be affected by actions taken by such parties or intermediaries.
This discussion assumes that we will not be a passive foreign investment company, as described below. The discussion below does not address the effect of any U.S. state, local, estate or gift tax law or non-U.S. tax law or tax considerations that arise from rules of general application to all taxpayers on a U.S. Holder of the shares or ADSs or of any future administrative guidance interpreting provisions thereof.
U.S. Holders should consult their tax advisors with respect to their particular tax consequences of owning or disposing of shares or ADSs, including the applicability and effect of state, local, non-U.S. and other tax laws and the possibility of changes in tax laws, including the effects of any future administrative guidance.
Taxation of Distributions
The following discussion of cash dividends and other distributions is subject to the discussion below under “Passive Foreign Investment Company Rules.” Distributions received by a U.S. Holder on shares or ADSs, including the amount of any Chilean taxes withheld, other than certain pro rata distributions of shares to all shareholders, will constitute foreign-source income to the extent paid out of our current or accumulated earnings and profits (as determined for U.S. federal income tax purposes). Because we do not maintain calculations of our earnings and profits under U.S. federal income tax principles, it is expected that distributions generally will be reported to U.S. Holders as dividends. The amount of dividend income paid in Chilean pesos that a U.S. Holder will be required to include in income will equal the U.S. dollar value of the distributed Chilean peso, calculated by reference to the exchange rate in effect on the date the payment is received, regardless of whether the payment is converted into U.S. dollars on the date of receipt. If the dividend is converted into U.S. dollars on the date of receipt, a U.S. Holder will generally not be required to recognize foreign currency gain or loss in respect of the dividend income. A U.S. Holder may have foreign currency gain or loss if the dividend is converted into U.S. dollars after the date of its receipt, which would be ordinary income or loss and would be treated as income from U.S. sources for foreign tax credit purposes. Dividends will be included in a U.S. Holder’s income on the date of the U.S. Holder’s, or in the case of ADSs, the depositary’s, receipt of the dividend.
Subject to certain exceptions for short-term and hedged positions, the discussion above regarding concerns expressed by the U.S. Treasury and the discussion below regarding rules intended to be promulgated by the U.S. Treasury, the U.S. dollar amount of dividends received by a noncorporate U.S. Holder in respect of shares or ADSs generally will be subject to taxation at preferential rates if the dividends are “qualified dividends.” Dividends paid on the ADSs generally will be treated as qualified dividends if (i) the ADSs are readily tradable on an established securities market in the United States (ii) we were not, in the year prior to the year in which the dividend was paid, and is not, in the year in which the dividend is paid, a passive foreign investment company (“PFIC”) and (iii) the holder thereof has satisfied certain holding period requirements. The ADSs are listed on the New York Stock Exchange and generally will qualify as readily tradable on an established securities market in the United States so long as they are so listed. We do not expect that we will be treated as having been a PFIC for U.S. federal income tax purposes with respect to our 2018 taxable year.
In addition, based on our current expectations regarding the value and nature of our assets, the sources and nature of our income, and relevant market and shareholder data, we do not anticipate becoming a PFIC for our 2019 taxable year. However, because PFIC status depends upon the composition of a company’s income and assets and the market value of its assets from time to
time, and because it is unclear whether certain types of our income constitute passive income for PFIC purposes, there can be no assurance that we will not be considered a PFIC for any current, prior or future taxable year.
Based on existing guidance, it is not entirely clear whether dividends received with respect to shares will be treated as qualified dividends, because the shares are not themselves listed on a U.S. exchange. In addition, the U.S. Treasury has announced its intention to promulgate rules pursuant to which holders of ADSs and intermediaries through whom such securities are held will be permitted to rely on certifications from issuers to establish that dividends are treated as qualified dividends. Because such procedures have not yet been issued, it is not clear whether we will be able to comply with them. A U.S. Holder should consult its tax advisors to determine whether the favorable rate will apply to dividends it receives and whether it is subject to any special rules that limit its ability to be taxed at this favorable rate.
The amount of a dividend generally will be treated as foreign-source dividend income to a U.S. Holder for foreign tax credit purposes. As discussed in more detail below under “—Foreign Tax Credits,” it is not free from doubt whether Chilean withholding taxes imposed on distributions on shares or ADSs will be treated as income taxes eligible for a foreign tax credit for U.S. federal income tax purposes. If a Chilean withholding tax is treated as an eligible foreign income tax, subject to generally applicable limitations, you may claim a credit against your U.S. federal income tax liability for the eligible Chilean taxes withheld from distributions on shares or ADSs. If the dividends are taxed as qualified dividend income (as discussed above), special rules will apply in determining the amount of the dividend taken into account for purposes of calculating the foreign tax credit limitation. The rules relating to foreign tax credits are complex. U.S. Holders are urged to consult their own tax advisors regarding the treatment of Chilean withholding taxes imposed on distributions on shares or ADSs.
Sale or Other Disposition of Shares or ADSs
If a beneficial owner is a U.S. Holder, for U.S. federal income tax purposes, the gain or loss a beneficial owner realizes on the sale or other disposition of shares or ADSs will be a capital gain or loss, and will be a long term capital gain or loss if the beneficial holder has held the shares or ADSs for more than one year. The amount of a beneficial owner’s gain or loss will equal the difference between the beneficial owner’s tax basis in the shares or ADSs disposed of and the amount realized on the disposition, in each case as determined in U.S. dollars. Such gain or loss will generally be U.S.-source gain or loss for foreign tax credit purposes. In addition, certain limitations exist on the deductibility of capital losses by both corporate and individual taxpayers.
In certain circumstances, Chilean taxes may be imposed upon the sale of shares (but not ADSs). See “Item 10. Additional Information — E. Taxation — Chilean Tax Considerations — Taxation of Shares and ADSs.” If a Chilean tax is imposed on the sale or disposition of shares, a beneficial owner that is a U.S. Holder may be eligible to claim a credit against its U.S. federal income tax liability for the eligible Chilean taxes withheld pursuant to a sale or disposition of shares or ADSs as discussed in “— Foreign Tax Credits” below.
Foreign Tax Credits
Subject to applicable limitations that may vary depending upon a U.S. Holder’s circumstances and subject to the discussion above regarding concerns expressed by the U.S. Treasury, you may be eligible to claim a credit against your U.S. tax liability for Chilean income taxes (or taxes imposed in lieu of an income tax) imposed in connection with distributions on and proceeds from the sale or other disposition of our shares or ADSs. Chilean dividend withholding taxes generally are expected to be income taxes eligible for the foreign tax credit. The Chilean capital gains tax is likely to be treated as an income tax (or a tax paid in lieu of an income tax) and thus eligible for the foreign tax credit; however, you generally may claim a foreign tax credit only after taking into account any available opportunity to reduce the Chilean capital gains tax, such as the reduction for the credit for Chilean corporate income tax that is taken into account when calculating Chilean withholding tax. If a Chilean tax is imposed on the sale or disposition of our shares or ADSs, and a U.S. Holder does not receive significant foreign source income from other sources, such U.S. Holder may not be able to credit such Chilean tax against its U.S. federal income tax liability. If a Chilean tax is not treated as an income tax (or a tax paid in lieu of an income tax) for U.S. federal income tax purposes, a U.S. Holder would be unable to claim a foreign tax credit for any such Chilean tax withheld; however, a U.S. Holder may be able to deduct such tax in computing its U.S. federal income tax liability, subject to applicable limitations. In addition, instead of claiming a credit, a U.S. Holder may, at the U.S. Holder’s election, deduct such Chilean taxes in computing the U.S. Holder’s taxable income, subject to generally applicable limitations under U.S. law. An election to deduct foreign taxes instead of claiming foreign tax credits applies to all taxes paid or accrued in the taxable year to foreign countries and possessions of the U.S. The calculation of foreign tax credits and, in the case of a U.S. Holder that elects to deduct foreign income taxes, the availability of deductions, involves the application of complex rules that depend on such U.S. Holders’ particular circumstances. U.S. Holders are urged to consult their tax advisors regarding the availability of foreign tax credits in their particular circumstances.
Passive Foreign Investment Company Rules
We were not a “passive foreign investment company” or PFIC for U.S. federal income tax purposes for our 2018 taxable year and we do not anticipate being a PFIC for our 2019 taxable year. However, because PFIC status depends upon the composition of a company’s income and assets and the market value of its assets from time to time, and because it is unclear whether certain types of our income constitute passive income for PFIC purposes, there can be no assurance that we will not be considered a PFIC for any current, prior or future taxable year. If we were to become a PFIC for any taxable year during which a beneficial owner held shares or ADSs, certain adverse consequences could apply to the U.S. Holder, including the imposition of higher amounts of tax than would otherwise apply, and additional filing requirements. In addition, if we were treated as a PFIC in a taxable year in which we pay a dividend or in the prior taxable year, the favorable dividend rates discussed above with respect to dividends paid to certain non-corporate U.S. Holders would not apply (see “— Taxation of Distributions” above). U.S. Holders should consult their tax advisors regarding the consequences to them if we were to become a PFIC, as well as the availability and advisability of making any election that might mitigate the adverse consequences of PFIC status.
Required Disclosure with Respect to Foreign Financial Assets
Certain U.S. Holders are required to report information relating to an interest in our shares or ADSs, subject to certain exceptions (including an exception for our shares or ADSs held in accounts maintained by certain financial institutions), by attaching a completed IRS Form 8938, Statement of Specified Foreign Financial Assets, with their tax return for each year in which they hold an interest in our shares or ADSs. U.S. Holders are urged to consult their own U.S. tax advisors regarding information reporting requirements relating to their ownership of our shares or ADSs.
Information Reporting and Backup Withholding
Payments of dividends and sales proceeds that are made within the United States or through certain U.S.- related financial intermediaries generally are subject to information reporting and to backup withholding unless:
(i) the U.S. Holder is an exempt recipient or (ii) in the case of backup withholding, the beneficial owner provides a correct taxpayer identification number and certifies that the U.S. Holder is not subject to backup withholding.
The amount of any backup withholding from a payment to a beneficial owner will be allowed as a credit against the beneficial owner’s U.S. federal income tax liability and may entitle the U.S. Holder to a refund, provided that the required information is furnished in a timely fashion to the U.S. Internal Revenue Service.
Medicare Contribution Tax
Legislation enacted in 2010 generally imposes a tax of 3.8% on the “net investment income” of certain individuals, trusts and estates. Among other items, net investment income generally includes gross income from dividends and net gain attributable to the disposition of certain property, like the shares or ADSs, less certain deductions. A U.S. Holder should consult the holder’s own tax advisor regarding the possible application of this legislation in the beneficial owner’s particular circumstances.
U.S. Holders should consult their tax advisors with respect to the particular consequences to them of owning or disposing of shares or ADSs.
F.Dividends and Paying Agents.
Not applicable.
G.Statement by Experts.
Not applicable.
H.Documents on Display.
We are subject to the information requirements of the Exchange Act, except that as a foreign issuer, we are not subject to SEC proxy rules (other than general anti-fraud rules) or the short-swing profit disclosure rules of the Exchange Act. In accordance with these statutory requirements, we file or furnish reports and other information with the SEC. Reports, information statements and other
information we file with or furnish to the SEC are available electronically on the SEC’s website, which can be accessed at http://www.sec.gov and on our website www.enelchile.cl. Copies of such material may also be inspected at the offices of the New York Stock Exchange, at 11 Wall Street, New York, New York 10005, on which our ADS are listed.
I.Subsidiary Information.
For information on our principal subsidiaries, see “Item 4. Information on the Company — C. Organizational Structure — Principal Subsidiaries and Affiliates”.
Item 11.Quantitative and Qualitative Disclosures About Market Risk
We are exposed to risks arising from changes in commodity prices, interest rates and foreign exchange rates that affect the generation and distribution businesses in Chile. We monitor and manage these risks in coordination with Enel Generation. Our Board of Directors approves risk management policies at all levels.
Commodity Price Risk
In our electricity generation business segment, we are exposed to market risks arising from the price volatility of electricity, natural gas, diesel oil, and coal. We seek to ensure our fuel supply by securing long-term contracts with our suppliers for periods that are expected to match the lifetime of our generation assets. These contracts generally have provisions that allow us to purchase natural gas with a pricing formula that combines Henry Hub natural gas and Brent diesel oil at market prices prevailing at the time the purchase occurs.
In order to reduce risk under extreme drought conditions, Enel has designed a commercial policy that defines sale commitment levels in line with the capacity of its generating facilities during a dry year, by including risk mitigation clauses with unregulated clients in some contracts. In the case of regulated clients subject to long-term tender processes, indexing polynomials are determined in order to reduce commodity exposure.
Considering the operating conditions faced by the electricity generation market in Chile, drought and volatility of commodity prices in international markets, the Company is constantly evaluating the convenience of contracting hedges to mitigate the impact of price changes on profits.
As of December 31, 2018, the Company held swaps for 432 kTon of Coal API2 to be settled in 2019, for 994 kBbl of Brent oil to be settled in 2019, 225 kTon of BCI7 to be settled in 2019, for 0.2 TBtu of Henry Hub gas to be settled in 2019.
As of December 31, 2017, the Company held swaps for 2.3 million MMBTU of Henry Hub gas to be settled on January 2018.
According to the operating conditions that are updated permanently, these hedging measures may be modified, or include other commodities.
We are continually analyzing strategies to hedge commodity price risk, including transferring commodity price variations to customers’ contract prices, and permanently adjusting commodity indexed price formulas for new Power Purchase Agreements according to our exposure or analyzing ways to mitigate risk through hydrological insurance in dry years. In the future, we may consider using price-sensitive instruments.
Interest Rate and Foreign Currency Risk
As of December 31, 2018, the carrying values according to maturity and the corresponding fair value of our interest bearing debt are detailed below. Values do not include derivatives.
| | Expected maturity date | |
For the year ended December 31, | | 2019 | | 2020 | | 2021 | | 2022 | | 2023 | | Thereafter | | Total | | Fair
Value(2) | |
| | (in billions of Ch$)(1) | |
Fixed Rate | | | | | | | | | | | | | | | | | |
Ch$/UF | | | | | | | | | | | | | | | | | |
Weighted average interest rate | | | | | | | | | | | | | | | | | |
US$ | | 2,166 | | 2,307 | | 2,457 | | 23,460 | | 4,929 | | 1,192,974 | | 1,228,293 | | 1,316,361 | |
Weighted average interest rate | | 6.5 | % | 6.5 | % | 6.5 | % | 2.1 | % | 6.5 | % | 5.4 | % | 5.4 | % | — | |
Total fixed rate | | 2,166 | | 2,307 | | 2,457 | | 23,460 | | 4,929 | | 1,192,974 | | 1,228,293 | | 1,316,361 | |
Weighted average interest rate | | 6.5 | % | 6.5 | % | 6.5 | % | 2.1 | % | 6.5 | % | 5.4 | % | 5.4 | % | — | |
Variable Rate | | | | | | | | | | | | | | | | | |
Ch$/UF | | 244,553 | | 30,793 | | 30,793 | | 30,793 | | 30,793 | | 180,350 | | 548,077 | | 618,940 | |
Weighted average interest rate | | 3.9 | % | 7.9 | % | 7.9 | % | 7.9 | % | 7.9 | % | 7.9 | % | 6.1 | % | — | |
US$ | | 69,477 | | 104,216 | | 168,171 | | 63,956 | | 63,956 | | 255,823 | | 725,598 | | 725,598 | |
Weighted average interest rate | | 1.6 | % | 4.4 | % | 3.8 | % | 6.9 | % | 6.9 | % | 6.9 | % | 5.3 | % | — | |
Total variable rate | | 314,030 | | 135,009 | | 198,965 | | 94,749 | | 94,749 | | 436,173 | | 1,273,675 | | 1,344,538 | |
Weighted average interest rate | | 3.4 | % | 5.2 | % | 4.4 | % | 7.2 | % | 7.2 | % | 7.3 | % | 5.7 | % | — | |
Total | | 316,196 | | 137,316 | | 201,422 | | 118,209 | | 99,678 | | 1,629,147 | | 2,501,968 | | 2,660,899 | |
(1) Calculated based on the Observed Exchange Rate as of December 31, 2018, which was Ch$ 694.77 per US$ 1.00.
(2) As of December 31, 2018, fair value was calculated based on the discounted value of future cash flows expected to be paid (or received), considering current discount rates that reflect the different risks involved.
As of December 31, 2017, the carrying values according to maturity and the corresponding fair value of our interest bearing debt are detailed below. Values do not include derivatives.
| | Expected maturity date | |
For the year ended December 31, | | 2018 | | 2019 | | 2020 | | 2021 | | 2022 | | Thereafter | | Total | | Fair
Value(2) | |
| | (in billions of Ch$)(1) | |
Fixed Rate | | | | | | | | | | | | | | | | | |
Ch$/UF | | — | | — | | — | | — | | — | | — | | — | | — | |
Weighted average interest rate | | — | | — | | — | | — | | — | | — | | — | | — | |
US$ | | 1,800 | | 1,917 | | 2,041 | | 2,174 | | 2,315 | | 445,185 | | 455,432 | | 555,049 | |
Weighted average interest rate | | 6.8 | % | 6.8 | % | 6.8 | % | 6.8 | % | 6.8 | % | 6.1 | % | 6.1 | % | | |
Total fixed rate | | 1,800 | | 1,917 | | 2,041 | | 2,174 | | 2,315 | | 445,185 | | 455,432 | | 555,049 | |
Weighted average interest rate | | 6.8 | % | 6.8 | % | 6.8 | % | 6.8 | % | 6.8 | % | 6.1 | % | 6.1 | % | — | |
Variable Rate | | | | | | | | | | | | | | | | | |
Ch$/UF | | 5,574 | | 29,936 | | 29,936 | | 29,936 | | 29,936 | | 205,264 | | 330,582 | | 408,534 | |
Weighted average interest rate | | 9.0 | % | 7.0 | % | 7.0 | % | 7.0 | % | 7.0 | % | 6.9 | % | 7.0 | % | — | |
US$ | | — | | — | | — | | — | | — | | — | | — | | — | |
Weighted average interest rate | | — | | — | | — | | — | | — | | — | | — | | — | |
Total variable rate | | 5,574 | | 29,936 | | 29,936 | | 29,936 | | 29,936 | | 205,264 | | 330,582 | | 408,534 | |
Weighted average interest rate | | 9.0 | % | 7.0 | % | 7.0 | % | 7.0 | % | 7.0 | % | 6.9 | % | 7.0 | % | — | |
Total | | 7,374 | | 31,853 | | 31,977 | | 32,110 | | 32,251 | | 650,449 | | 786,014 | | 963,582 | |
(1) Calculated based on the Observed Exchange Rate as of December 31, 2017, which was Ch$ 614.75 per US$ 1.00.
(2) As of December 31, 2017, fair value was calculated based on the discounted value of future cash flows expected to be paid (or received), considering current discount rates that reflect the different risks involved.
Interest Rate Risk
Our policy aims to minimize the average cost of debt and reduce the volatility of our financial results. Depending on our estimates and the debt structure, we sometimes manage interest rate risk through the use of interest rate derivatives.
As of December 31, 2018 and 2017, 71% and 92%, respectively, of our total outstanding debt was denominated in fixed terms and 29% and 8% respectively was subject to variable interest rates. Because of the exposure to variable interest rate risks, we engage in derivative hedging instruments.
As of December 31, 2018, the carrying values for financial reporting purposes and the corresponding fair value of the instruments that hedge the interest rate risk of our interest bearing debt were as follows:
| | Expected Maturity Date | |
For the year ended December 31, | | 2019 | | 2020 | | 2021 | | 2022 | | 2023 | | Thereafter | | Total | | Fair
Value(2) | |
| | (in billions of Ch$)(1) | |
Variable to fixed rates | | 69,477 | | 104,216 | | 104,216 | | | | | | | | 277,908 | | 5,049 | |
Fixed to variable rates | | | | | | | | | | | | | | | | | |
Total | | 69,477 | | 104,216 | | 104,216 | | | | | | | | 277,908 | | 5,049 | |
(1)Calculated based on the Observed Exchange Rate as of December 31, 2018, which was Ch$ 694.77 per US$ 1.00.
(2)Fair values were calculated based on the discounted value of future cash flows expected to be paid (or received), considering current discount rates that reflect the different risks involved.
As of December 31, 2017, because the exposure to variable interest rate risk was so low, we did not engage in derivative hedging instruments.
Foreign Currency Risk
Our policy seeks to maintain a balance between the currency in which cash flows are indexed and the currency of the debt of each company. Most of our subsidiaries have access to funding in the same currency as their revenues, therefore reducing the exchange rate volatility impact. In some cases, we cannot fully benefit from this, and therefore, we try to manage the exposure with financial derivatives such as cross currency swaps or currency forwards, among others. However, this may not always be possible under reasonable terms due to market conditions.
As of December 31, 2018, the carrying values for financial accounting purposes and the corresponding fair value of the instruments that hedge the foreign exchange risk of our interest bearing debt were as follows:
| | Expected Maturity Date | |
For the year ended December 31, | | 2019 | | 2020 | | 2021 | | 2022 | | 2023 | | Thereafter | | Total | | Fair
Value(2) | |
| | (in billions of Ch$)(1) | |
UF to US$ | | 534,547 | | — | | — | | — | | — | | — | | 534,547 | | (18,892 | ) |
US$ to Ch$/UF | | — | | — | | — | | — | | — | | — | | — | | — | |
Ch$ to US$ | | — | | — | | — | | — | | — | | — | | — | | — | |
Total | | 534,547 | | — | | — | | — | | — | | — | | 534,547 | | (18,892 | ) |
(1) Calculated based on the Observed Exchange Rate as of December 31, 2018, which was Ch$ 694.77 per US$ 1.00.
(2) Fair values were calculated based on the discounted value of future cash flows expected to be paid (or received), considering current discount rates that reflect the different risks involved.
As of December 31, 2017, the carrying values for financial accounting purposes and the corresponding fair value of the instruments that hedge the foreign exchange risk of our interest bearing debt were as follows:
| | Expected Maturity Date | |
For the year ended December 31, | | 2018 | | 2019 | | 2020 | | 2021 | | 2022 | | Thereafter | | Total | | Fair
Value(2) | |
| | (in billions of Ch$)(1) | |
UF to US$ | | — | | 500,198 | | — | | — | | — | | — | | 500,198 | | 7,696 | |
US$ to Ch$/UF | | — | | — | | — | | — | | — | | — | | — | | — | |
Ch$ to US$ | | — | | — | | — | | — | | — | | — | | — | | — | |
Total | | — | | 500,198 | | — | | — | | — | | — | | 500,198 | | 7,696 | |
(1) Calculated based on the Observed Exchange Rate as of December 31, 2017, which was Ch$ 614.75 per US$ 1.00.
(2) Fair values were calculated based on the discounted value of future cash flows expected to be paid (or received), considering current discount rates that reflect the different risks involved.
For further detail, please refer to Note 22 of the Notes to our consolidated financial statements.
(d) Safe Harbor
The information in this “Item 11. Quantitative and Qualitative Disclosures About Market Risk,” contains information that may constitute forward-looking statements. See “Forward-Looking Statements” in the Introduction of this Report for safe harbor provisions.
Item 12.Description of Securities Other Than Equity Securities
A.Debt Securities.
Not applicable.
B.Warrants and Rights.
Not applicable.
C.Other Securities.
Not applicable.
D.American Depositary Shares.
Depositary Fees and Charges
Our ADS program’s depositary is Citibank, N.A. The Depositary collects fees for delivery and surrender of ADSs directly from investors depositing shares or surrendering ADSs for the purpose of withdrawal or from intermediaries acting for them. The Depositary fees payable for cash distributions are deducted from the cash being distributed. In the case of distributions other than cash, the Depositary will invoice the applicable ADS record date holders. The Depositary may generally refuse to provide the requested services until its fees for those services are paid. Under the terms of the Deposit Agreement, an ADS holder may have to pay the following service fees to the Depositary:
Service Fees |
| Fees |
| | |
(1) Issuance of ADS upon deposit of shares (excluding issuances as a result of distributions described in paragraph (4) below) | | Up to US$5 per 100 ADSs (or fraction thereof) issued |
| | |
(2) Delivery of deposited securities against surrender of ADS | | Up to US$5 per 100 ADSs (or fraction thereof) surrendered |
| | |
(3) Distribution of cash dividends or other cash distributions (i.e., sale of rights and other entitlements) | | Up to US$5 per 100 ADSs (or fraction thereof) held |
| | |
(4) Distribution of ADS pursuant to (i) stock dividends or other free stock distributions, or (ii) exercise of rights to purchase additional ADS | | Up to US$5 per 100 ADSs (or fraction thereof) held |
| | |
(5) Distribution of securities other than ADS or rights to purchase additional ADS (i.e., spin-off of shares) | | Up to US$5 per 100 ADSs (or fraction thereof) held |
| | |
(6) Depositary services | | Up to US$5 per 100 ADSs (or fraction thereof) held on the applicable record dates will be entitled to participate in dividends. Dividends
The table below sets forth, the per-share dividend amounts distributed by us in Chilean pesos and the amount of dividends distributed per ADS (one ADS = 50 shares of common stock) in U.S. dollars for income attributable to 2016. See “Item 10. Additional Information — D. Exchange Controls.”
| | Dividends distributed (1) | | Year | | Nominal Ch$ per Share | | | US$ per ADS (2) | | 2016 | | | 2.093 | | | | 0.16 | |
(1)
| This chart details dividends actually paid and not the dividends accrued in 2016. These amounts do not reflect reduction for any applicable Chilean withholding tax.
|
(2)
| The U.S. dollar per ADS amount has been calculated by applying the exchange rate as of December 31, 2016. One ADS = 50 shares of common stock.
|
For a discussion of Chilean withholding taxes and access to the formal currency market in Chile in connection with the payment of dividends and sales of ADSs and the underlying common stock, see “Item 10. Additional Information — E. Taxation” and “Item 10. Additional Information — D. Exchange Controls.”
None.
Item 9.
| The Offer and Listing
|
A.
| Offer and Listing Details.
|
Market Price Information
The shares of our common stock and our ADSs currently trade on Chilean exchanges and the NYSE, respectively.
The table below shows, for the periods indicated, high and low prices in Chilean pesos on the Santiago Stock Exchange, and high and low closing prices of the ADSs in U.S. dollars as reported by the NYSE. We started trading in the Chilean exchanges since April 21, 2016 and on the NYSE since April 26, 2016.
| | Santiago Stock Exchange(1) | | | U.S. Stock Exchanges(2) | | | | Ch$ per share | | | US$ per ADS | | | | High | | | Low | | | High | | | Low | | 2017 | | | 74.50 | | | | 61.00 | | | | 5.71 | | | | 4.50 | | April (up to April 25, 2017) | | | 74.50 | | | | 69.85 | | | | 5.71 | | | | 5.31 | | March | | | 73.25 | | | | 65.20 | | | | 5.53 | | | | 4.88 | | February | | | 66.98 | | | | 61.00 | | | | 5.36 | | | | 4.61 | | January | | | 67.01 | | | | 62.00 | | | | 5.29 | | | | 4.50 | | | | | | | | | | | | | | | | | | | 2016 | | | 90.00 | | | | 58.65 | | | | 6.81 | | | | 4.25 | | December | | | 64.99 | | | | 58.65 | | | | 4.98 | | | | 4.25 | | November | | | 68.51 | | | | 61.12 | | | | 5.23 | | | | 4.43 | | October | | | 70.15 | | | | 60.80 | | | | 5.25 | | | | 4.62 | | September | | | 74.41 | | | | 60.48 | | | | 5.48 | | | | 4.52 | | 4th Quarter | | | 70.15 | | | | 58.65 | | | | 5.25 | | | | 4.25 | | 3rd Quarter | | | 79.00 | | | | 60.48 | | | | 6.08 | | | | 4.52 | | 2nd Quarter | | | 90.00 | | | | 73.94 | | | | 6.81 | | | | 5.22 | |
(1)
| Source: Santiago Stock Exchange.
|
(2)
| Source: NYSE and over-the-counter trading. Our ADS composite figures include transactions in all U.S. stock exchanges. One ADS = 50 shares of common stock.
|
On the last trading day in 2016, our common stock closed at Ch$ 62.01 per share on the Santiago Stock Exchange and our ADSs closed at US$ 4.55 per ADS on the NYSE.
On April 25, 2017, our common stock closed at Ch$ 72.97 per share on the Santiago Stock Exchange and our ADSs closed at US$ 5.42 per ADS on the NYSE.
Not applicable.
In Chile, our common stock is traded on three stock exchanges since April 21, 2016: the Santiago Stock Exchange, the Electronic Stock Exchange and the Valparaíso Stock Exchange. The Santiago Stock Exchange, the largest stock exchange in the country was established in 1893 as a private company. As of December 31, 2016, 214 companies had shares listed on the Santiago Stock Exchange. For 2016, the Santiago Stock Exchange accounted for 89.9% of our total equity traded in Chile and amounted to 5,632,385,628 shares. In addition, 10.1% of our equity trading was conducted on the Electronic Stock Exchange, an electronic trading market that was created by banks and non-member brokerage houses, and finally, less than 0.1% was traded on the Valparaíso Stock Exchange.
Equities, closed-end funds, fixed-income securities, short-term and money market securities, gold and U.S. dollars are traded on the Santiago Stock Exchange. The Santiago Stock Exchange also trades U.S. dollar futures and stock index futures. Securities are traded primarily through an open voice auction system; a firm offers system or the daily auction. Trading through the open voice system occurs on each business day from 9:30 a.m. to 4:00 p.m., during local standard time, and from 9:30 a.m. to 5:00 p.m. when daylight savings time is in place (usually from November to March), which may differ from New York City time by up to two hours, depending on the season. The Santiago Stock Exchange has an electronic trading system called Telepregón, which operates continuously from 9:30 a.m. to 4:00 p.m. during local standard time, and from 9:30 a.m. to 5:00 p.m. when daylight savings time in Chile is in place, on each business day. During local standard time, electronic auctions may be conducted at any of four times a day, at 10:30 a.m., 11:30 a.m., 1:30 p.m., and 3:30 p.m. When daylight savings time is in place there is an additional electronic auction at 4:30 p.m. More than 99% of the auctions and transactions take place electronically.
There are two main share price indexes on the Santiago Stock Exchange, the General Shares Price Index, or IGPA, and the Selected Shares Price Index, or IPSA. The IGPA is calculated using the prices of shares that are traded at least 5% of the trading days of a year, with total annual transactions exceeding UF 10,000 (Ch$ 263 million as of December 31, 2016, equivalent to US$ 393,565) and a free float representing at least 5%. The IPSA is calculated using the prices of the 40 shares with highest trading volume on a quarterly basis, and with a market capitalization above US$ 200 million. The shares included in the IPSA and IGPA are weighted according to the weighted value of the shares traded. We have been included in the IPSA since April 21, 2016.
Our common stock trades in the United States in the form of ADSs on the NYSE by way of “when-issued” trading since April 21, 2016 under the ticker symbol “ENIC WI” and regular-way trading since April 27, 2016 under the ticker symbol “ENIC.” Each ADS represents 50 shares of common stock, with the ADSs in turn evidenced by American Depositary Receipts (“ADRs”). The ADRs were issued under a Deposit Agreement dated April 26, 2016, among us, Citibank, N.A. acting as Depositary (the “Depositary”), and the holders and beneficial owners from time to time of ADRs issued thereunder (the “Deposit Agreement”). Only persons in whose names ADRs are registered on the books of the Depositary are treated by the Depositary as owners of ADRs.
As of April 25, 2017, ADRs evidencing 72,143,815 ADSs (equivalent to 3,607,190,750 shares of common stock) were outstanding, representing 7.3% of the total number of outstanding shares. It is not practicable for us to determine the proportion of ADSs beneficially owned by U.S. final beneficial holders. Trading volume of our shares on the NYSE and other exchanges during 2016 amounted to 84.1 million ADSs, equivalent to US$ 459 million.
The NYSE is open for trading Monday through Friday from 9:30 am to 4:00 pm, with the exception of holidays declared by the NYSE in advance. On the trading floor, the NYSE trades in a continuous auction format, where traders can execute stock transactions on behalf of investors. Specialist brokers act as auctioneers in an open outcry auction market to bring buyers and sellers together and to manage the actual auction. Customers can also send orders for immediate electronic execution or route orders to the floor for trade in the auction market. The NYSE works with U.S. regulators like the SEC and the Commodity Futures Trading Commission to coordinate risk management measures in the electronic trading environment through the implementation of mechanisms like circuit breakers and liquidity replenishment points.
The following table contains information regarding the amount of total traded shares of common stock and the corresponding percentage traded per market during 2016:
| | Number of common shares traded | | | Percent | | Market | | | | | | | | | Chile(1) | | | 6,268,091,654 | | | | 59.8 | % | United States (One ADS = 50 shares of common stock)(2) | | | 4,206,677,950 | | | | 40.2 | % | Total | | | 10,474,769,604 | | | | 100 | % |
(1)
| Includes Santiago Stock Exchange, Electronic Stock Exchange and Valparaíso Stock Exchange.
|
(2)
| Includes the New York Stock Exchange and over-the-counter trading.
|
For further information see “Item 9. The Offer and Listing — A. Offer and Listing Details — Market Price Information.”
Not applicable.
Not applicable.
Not applicable.
Item 10.Additional Information
Not applicable.
B.
| Memorandum and Articles of Association.
|
Description of Share Capital
Set forth below is certain information concerning our share capital and a brief summary of certain significant provisions of Chilean law and our by-laws.
General
Shareholders’ rights in Chilean companies are governed by the company’s by-laws (estatutos), which have the same purpose as the articles or the certificate of incorporation and the by-laws of a company incorporated in the United States, and by the Chilean Companies Act, Law 18,046. In addition, D.L. 3500, or the Pension Funds’ System Law, which permits the investment by Chilean pension funds in stock of qualified companies, indirectly affects corporate governance and prescribes certain rights of shareholders. In accordance with the Chilean Companies Act, legal actions by shareholders to enforce their rights as shareholders of the company must be brought in Chile in arbitration proceedings or, at the option of the plaintiff, before Chilean courts. Members of the Board of Directors, managers, officers and principal executives of the company, or shareholders that individually own shares with a book value or stock value higher that UF 5,000 (Ch$ 132 million as of December 31, 2016) do not have the option to bring the procedure to the courts.
The Chilean securities markets are principally regulated by the SVS under Securities Market Law (Law 18,045) and the Chilean Companies Act. These two laws state the disclosure requirements, restrictions on insider trading and price manipulation, and provide protection to minority shareholders. The Securities Market Law sets forth requirements for public offerings, stock exchanges and brokers, and outlines disclosure requirements for companies that issue publicly offered securities. The Chilean Companies Act and the Securities Market Law, both as amended, state rules regarding takeovers, tender offers, transactions with related parties, qualified majorities, share repurchases, directors’ committees, independent directors, stock options and derivative actions.
Public Register
We are a publicly held stock corporation incorporated under the laws of Chile. We were constituted by public deed issued on January 8, 2016 by the Santiago Notary Public, Mr. Ivan Torrealba A., and registered on January 19, 2016 in the Commercial Registrar (Registro de Comercio del Conservador de Bienes Raíces y Comercio de Santiago) on pages 4288 No. 2570. Our registry in the Securities Registry of the SVS was approved by the SVS on April 13, 2016, under the entry number 1139. We are also registered with the United States Securities and Exchange Commission under the commission file number 001-37723 on March 31, 2016.
Reporting Requirements Regarding Acquisition or Sale of Shares
Under Article 12 of the Securities Market Law and General Rule 269 of the SVS, certain information regarding transactions in shares of a publicly held stock corporation or in contracts or securities whose price or results depend on, or are conditioned in whole or in part on the price of such shares, must be reported to the SVS and the Chilean stock exchanges. Since ADSs are deemed to represent the shares of common stock underlying the ADRs, transactions in ADRs will be subject to these reporting requirements and those established in Circular 1375 of the SVS. Shareholders of publicly held stock corporations are required to report to the SVS and the Chilean stock exchanges:
any direct or indirect acquisition or sale of shares made by a holder who owns, directly or indirectly, at least 10% of a publicly held stock corporation’s subscribed capital;
any direct or indirect acquisition or sale of contracts or securities whose price or results depend on or are conditioned in whole or in part on the price of shares made by a holder who owns, directly or indirectly, at least 10% of a publicly held stock corporation’s subscribed capital;
any direct or indirect acquisition or sale of shares made by a holder who, due to an acquisition of shares of such publicly held stock company, results in the holder acquiring, directly or indirectly, at least 10% of a publicly held stock company’s subscribed capital; and
| •
| any direct or indirect acquisition or sale of shares in any amount, made by a director, receiver, principal executive, general manager or manager of a publicly held stock company.
|
In addition, majority shareholders of a publicly held stock corporation must inform the SVS and the Chilean stock exchanges if such transactions are entered into with the intention of acquiring control of the company or if they are making a passive financial investment instead.
Under Article 54 of the Securities Market Law and General Rule 104 enacted by the SVS, any person who directly or indirectly intends to take control of a publicly held stock corporation must disclose this intent to the market at least ten business days in advance of the proposed change of control and, in any event, as soon as the negotiations for the change of control have taken place or reserved information of the publicly held stock corporation has been provided.
Corporate Objectives and Purposes
Article 4 of our by-laws states that our corporate objectives and purposes are, among other things, to conduct the exploration, development, operation, generation, distribution, transformation, or sale of energy in any form, directly or through other companies, as well as to provide engineering- consulting services related to these objectives, to make loans to related companies, subsidiaries and affiliates and to participate in the telecommunications business.
Board of Directors
Our Board of Directors consists of seven members who are appointed by shareholders at an OSM and are elected for a three-year term, at the end of which they will be re-elected or replaced.
The seven directors elected at the OSM are the seven individual nominees who receive the highest majority of the votes. Each shareholder may vote his shares in favor of one nominee or may apportion his shares among any number of nominees.
The effect of these voting provisions is to ensure that a shareholder owning more than 12.5% of our shares is able to elect a member of the Board.
The compensation of the directors is established annually at the OSM. See “Item 6. Directors, Senior Management and Employees —B. Compensation.”
Agreements entered into by us with related parties can only be executed when such agreements serve our interest, and their price, terms and conditions are consistent with prevailing market conditions at the time of their approval and comply with all the requirements and procedures indicated in Article 147 of the Chilean Companies Act.
Certain Powers of the Board of Directors
Our by-laws provide that every agreement or contract that we enter into with our controlling shareholder, our directors or executives, or their related parties, must be previously approved by two-thirds of the Board of Directors and be included in the Board meetings, and must comply with the provisions of the Chilean Companies Act.
Our by-laws do not contain provisions relating to:
the directors’ power, in the absence of an independent quorum, to vote on compensation for themselves or any members of their body;
borrowing powers exercisable by the directors and how such borrowing powers can be varied;
retirement or non-retirement of directors under an age limit requirement; or
number of shares, if any, required for directors’ qualification.
Certain Provisions Regarding Shareholder Rights
As of the date of the filing of this Report, our capital is comprised of only one class of shares, all of which are ordinary shares and have the same rights.
Our by-laws do not contain any provisions relating to:
liability for capital reductions by us.
Under Chilean law, the rights of our shareholders may only be modified by an amendment to the by-laws that complies with the requirements explained below under “Item 10. Additional Information — B. Memorandum and Articles of Association. — Shareholders’ Meetings and Voting Rights.”
Capitalization
Under Chilean law, only the shareholders of a company acting at an ESM have the power to authorize a capital increase. When an investor subscribes shares, these are officially issued and registered under his name, and the subscriber is treated as a shareholder for all purposes, except receipt of dividends and for return of capital in the event that the shares have been subscribed but not paid for. The subscriber becomes eligible to receive dividends only for the shares that he has actually paid for or, if the subscriber has paid for only a portion of such shares, the pro rata portion of the dividends declared with respect to such shares unless the company’s by-laws provide otherwise. If a subscriber does not fully pay for shares for which the subscriber has subscribed on or prior to the date agreed upon for payment, notwithstanding the actions intended by the company to collect payment, the company is entitled to auction the shares on the stock exchange where such shares are traded, for the account and risk of the debtor, the number of shares held by the debtor necessary for the company to pay the outstanding balances and disposal expenses. However, until such shares are sold at auction, the subscriber continues to hold all the rights of a shareholder, except the right to receive dividends and return of capital. The Chief Executive Officer, or the person replacing him, will reduce in the shareholders’ register the number of shares in the name of the debtor shareholder to the number of shares that remain, deducting the shares sold by the company and settling the debt in the amount necessary to cover the result of such disposal after the corresponding expenses. When there are authorized and issued shares for which full payment has not been made within the period fixed by shareholders at the same ESM at which the subscription was authorized (which in no case may exceed three years from the date of such meeting), these shall be reduced in the non-subscribed amount until that date. With respect to the shares subscribed and not paid following the term mentioned above, the Board must proceed to collect payment, unless the shareholders’ meeting authorizes (by two thirds of the voting shares) a reduction of the company’s capital to the amount effectively collected, in which case the capital shall be reduced by force of law to the amount effectively paid. Once collection actions have been exhausted, the Board should propose to the shareholders’ meeting the approval by simple majority of the write-off of the outstanding balance and the reduction of capital to the amount effectively recovered.
As of December 31, 2016, our subscribed and fully paid capital totaled Ch$ 2,229 billion and consisted of 49,092,772,762 shares.
Preemptive Rights and Increases of Share Capital
The Chilean Companies Act requires Chilean companies to grant shareholders preemptive rights to purchase a sufficient number of shares to maintain their existing ownership percentage of such company whenever such company issues new shares.
Under Chilean law, preemptive rights are exercisable or freely transferable by shareholders during a 30-day period. The options to subscribe for shares in capital increases of the company or of any other securities convertible into shares or that confer future rights over these shares, should be offered, at least once, to the shareholders pro rata to the shares held registered in their name at midnight on the fifth business day prior to the date of the start of the preemptive rights period. The preemptive rights offering and the start of the 30-day period for exercising them shall be communicated through the publication of a prominent notice, at least once, in the newspaper that should be used for notifications of shareholders’ meetings. During such 30-day period, and for an additional period of up to 30-days immediately following the initial 30-day period, publicly held stock corporations are not permitted to offer any unsubscribed shares to third parties on terms which are more favorable than those offered to their shareholders. At the end of the second 30-day period, a Chilean publicly held stock corporation is authorized to sell non-subscribed shares to third parties on any terms, provided they are sold on one of the Chilean stock exchanges.
Shareholders’ Meetings and Voting Rights
An OSM must be held within the first four months following the end of our fiscal year. Our last OSM was held on April 26, 2017. An ESM may be called by the Board of Directors when deemed appropriate, or when requested by shareholders representing at least 10% of the issued shares with voting rights, or by the SVS. To convene an OSM or an ESM, notice must be given three times in a newspaper located in our corporate domicile. The newspaper designated by our shareholders is El Mercurio de Santiago. The first notice must be published not less than 15-days and no more than 20-days in advance of the scheduled meeting. Notice must also be mailed to each shareholder, to the SVS and to the Chilean stock exchanges.
The OSM shall be held on the day stated in the notice and should remain in session until having exhausted all the matters stated in the notice. However, once constituted, upon the proposal of the chairman or shareholders representing at least 10% of the shares with voting rights, the majority of the shareholders present may agree to suspend it and to continue it within the same day and place, with no new constitution of the meeting or qualification of powers being necessary, recorded in one set of minutes. Only those shareholders who were present or represented may attend the recommencement of the meeting with voting rights.
Under Chilean law, a quorum for a shareholders’ meeting isdate(s) established by the presence, in person or by proxy, of shareholders representing at least a majority of the issued shares with voting rights of a company. If a quorum is not present at the first meeting, a reconvened meeting can take place at which the shareholders present are deemed to constitute a quorum regardless of the percentage of the shares represented. This second meeting must take place within 45-days following the scheduled date for the first meeting. Shareholders’ meetings adopt resolutions by the affirmative vote of a majority of those shares present or represented at the meeting. An ESM must be called to take the following actions:
a transformation of the company into a form other than a publicly held stock corporation under the Chilean Companies Act, a merger or split-up of the company;
an amendment to the term of duration or early dissolution of the company;
a change in the company’s domicile;
a decrease of corporate capital;
an approval of capital contributions in kind and non-monetary assessments;
a modification of the authority reserved to shareholders or limitations on the Board of Directors;
a reduction in the number of members of the Board of Directors;
a disposition of 50% or more of the assets of the company, whether it includes disposition of liabilities or not, as well as the approval or the amendment of the business plan which contemplates the disposition of assets in an amount greater that such percentage;
the disposition of 50% or more of the assets of a subsidiary, as long as such subsidiary represents at least 20% of the assets of the corporation, as well as any disposition of its shares that results in the parent company losing its position as controlling shareholder;
the form of distributing corporate benefits;
issue of guarantees for third-party liabilities which exceed 50% of the assets, except when the third party is a subsidiary of the company, in which case approval of the Board of Directors is deemed sufficient;
the purchase of the company’s own shares;
other actions established by the by-laws or the laws;
certain remedies for the nullification of the company’s by-laws;
inclusion in the by-laws of the right to purchase shares from minority shareholders, when the controlling shareholders reaches 95% of the company’s shares by means of a tender offer for all of the company’s shares, where at least 15% of the shares have been acquired from unrelated shareholders; and
approval or ratification of acts or contracts with related parties.
Regardless of the quorum present, the vote required for any of the actions above is at least two-thirds of the outstanding shares with voting rights.
By-law amendments for the creation of a new class of shares, or an amendment to or an elimination of those classes of shares that already exist, must be approved by at least two-thirds of the outstanding shares of the affected series.
Chilean law does not require a publicly held stock corporation to provide its shareholders the same level and type of information required by the U.S. securities laws regarding the solicitation of proxies. However, shareholders are entitled to examine the financial statements and corporate books of a publicly held stock corporation within the 15-day period before its scheduled OSM. Under Chilean law, a notice of a shareholders meeting listing matters to be addressed at the meeting must be mailed at least 15 days prior to the date of such meeting, and, an indication of the way complete copies of the documents that support the matters submitted for voting can be obtained, which must also be made available to shareholders on our website. In the case of an OSM, our annual report of activities, which includes audited financial statements, must also be made available to shareholders and published on our website at: www.enelchile.cl.
The Chilean Companies Act provides that, upon the request by the Directors’ Committee or by shareholders representing at least 10% of the issued shares with voting rights, a Chilean company’s annual report must include, in addition to the materials provided by the Board of Directors to shareholders, such shareholders’ comments and proposals in relation to the company’s affairs. In accordance with Article 136 of the Chilean Companies Regulation (Reglamento de Sociedades Anónimas), the shareholder(s) holding or representing 10% or more of the shares issued with voting rights, may:
make comments and proposals relating to the progress of the corporate businesses in the corresponding year, no shareholder being able to make individually or jointly more than one presentation. These observations should be presented in writing to the company concisely, responsibly and respectfully, and the respective shareholder(s) should state their willingness for these to be included as an appendix to the annual report. The board shall include in an appendix to the annual report of the year a faithful summary of the pertinent comments and proposals the interested parties had made, provided they are presented during the year or within 30-days after its ending; or
make comments and proposals on matters that the board submits for the knowledge or voting of the shareholders. The board shall include a faithful summary of those comments and proposals in all information it sends to shareholders, provided the shareholders’ proposal is received at the offices of the company at least 10-days prior to the date of dispatch of the information by the company. The shareholders should present their comments and proposals to the company, expressing their willingness for these to be included in the appendix to the respective annual report or in information sent to shareholders, as the case may be. The observations referred to in this Article may be made separately by each shareholder holding 10% or more of the shares issued with voting rights or shareholders who together hold that percentage, who should act as one.
Similarly, the Chilean Companies Act provides that whenever the Board of Directors of a publicly held stock corporation convenes an OSM and solicits proxies for the meeting, or circulates information supporting its decisions or other similar material, it is obligated to include the pertinent comments and proposals that may have been made by the Directors’ Committee or by shareholders owning 10% or more of the shares with voting rights who request that such comments and proposals be so included.
Only shareholders registered as such with us as of midnight on the fifth business day prior to the date of a meeting are entitled to attend and vote their shares. A shareholder may appoint another individual, who does not need to be a shareholder, as his proxy to attend the meeting and vote on his behalf. Proxies for such representation shall be given for all the shares held by the owner. The proxy may contain specific instructions to approve, reject, or abstain with respect to any of the matters submitted for voting at the meeting and which were included in the notice. Every shareholder entitled to attend and vote at a shareholders’ meeting shall have one vote for every share subscribed.
There are no limitations imposed by Chilean law or our by-laws on the right of nonresidents or foreigners to hold or vote shares of common stock. However, the registered holder of the shares of common stock represented by ADSs, and evidenced by outstanding ADSs, is the custodian of the Depositary currently Banco Santander-Chile, or any successor thereto. Accordingly, holders of ADSs are not entitled to receive notice of meetings of shareholders directly or to vote the underlying shares of common stock represented by ADS directly. The Deposit Agreement contains provisions pursuant to which the Depositary has agreed to solicit instructions from registered holders of ADSs as to the exercise of the voting rights pertaining to the shares of common stock represented by the ADSs. Subject to compliance with the requirements of the Deposit Agreement and receipt of such instructions, the Depositary has agreed to endeavor, insofar as practicable and permitted under Chilean law and the provisions of the by-laws, to vote or cause to be voted (or grant a discretionary proxy to the Chairman of the Board of Directors or to a person designated by the Chairman of the Board of Directors to vote) the shares of common stock represented by the ADSs in accordance with any such instruction. The Depositary shall not itself exercise any voting discretion over any shares of common stock underlying ADSs. If no voting instructions are received by the Depositary from a holder of ADSs with respect to the shares of common stock represented by the ADSs, on or before the date
established by the Depositary for such purpose, the shares of common stock represented by the ADS, may be voted in the manner directed by the Chairman of the Board, or by a person designated by the Chairman of the Board, subject to limitations set forth in the Deposit Agreement.
Dividends and Liquidation Rights
According to the Chilean Companies Act, unless otherwise decided by unanimous vote of its issued shares eligible to vote, all companies must distribute a cash dividend in an amount equal to at least 30% of their consolidated net income, unless and except to the extent we have carried forward losses. The law provides that the Board of Directors must agree to the dividend policy and inform such policy to the shareholders at the OSM.
Any dividend in excess of 30% of net income may be paid, at the election of the shareholders, in cash, or in our shares, or in shares of publicly held corporations owned by us. Shareholders who do not expressly elect to receive a dividend other than in cash are legally presumed to have decided to receive the dividend in cash.
Dividends, which are declared but not paid within the appropriate time period set forth in the Chilean Companies Act (as to minimum dividends, 30-days after declaration; as to additional dividends, the date set for payment at the time of declaration), are adjusted to reflect the change in the value of UF, from the date set for payment to the date such dividends are actually paid. Such dividends also accrue interest at the then-prevailing rate for UF-denominated deposits during such period. The right to receive a dividend lapses if it is not claimed within five years from the date such dividend is payable. Payments not collected in such period are transferred to the volunteer fire department.
In the event of our liquidation, the shareholders would participate in the assets available in proportion to the number of paid-in shares held by them, after payment to all creditors.
Approval of Financial Statements
The Board of Directors is required to submit our consolidated financial statements to the shareholders annually for their approval. If the shareholders by a vote of a majority of shares present (in person or by proxy) at the shareholders’ meeting reject the financial statements, the Board of Directors must submit new financial statements no later than 60-days from the date of such meeting. If the shareholders reject the new financial statements, the entire Board of Directors is deemed removed from office and a new board is elected at the same meeting. Directors who individually approved such financial statements are disqualified for reelection for the following period. Our shareholders have never rejected the financial statements presented by the Board of Directors.
Change of Control
The Capital Markets Law establishes a comprehensive regulation related to tender offers. The law defines a tender offer as the offer to purchase shares of companies which publicly offer their shares or securities convertibles into shares and which offer is made to shareholders to purchase their shares under conditions which allow the bidder to reach a certain percentage of ownership of the company within a fixed period of time. These provisions apply to both voluntary and hostile tender offers.
Acquisition of Shares
No provision in our by-laws discriminates against any existing or prospective holder of shares as a result of such shareholder owning a substantial number of shares. However, no person may directly or indirectly own more than 65% of the outstanding shares of our stock. The foregoing restriction does not apply to the depositary as record owner of shares represented by ADRs, but it does apply to each beneficial ADS holder. Additionally, our by-laws prohibit any shareholder from exercising voting power with respect to more than 65% of the common stock owned by such shareholder or on behalf of others representing more than 65% of the outstanding issued shares with voting rights.
Right of Dissenting Shareholders to Tender Their Shares
The Chilean Companies Act provides that upon the adoption of any of the resolutions enumerated below at a meeting of shareholders, dissenting shareholders acquire the right to withdraw from the company and to compel the company to repurchase their shares, subject to the fulfillment of certain terms and conditions. In order to exercise such withdrawal rights, holders of ADRs must first withdraw the shares represented by their ADRs pursuant to the terms of the Deposit Agreement.
“Dissenting” shareholders are defined as those who at a shareholders’ meeting vote against a resolution that results in the withdrawal right, or who if absent from such meeting, state in writing their opposition to the respective resolution, within the 30-days following the shareholders’ meeting. Shareholders present or represented at the meeting and who abstain in exercising their voting rights shall not be considered as dissenting. The right to withdraw should be exercised for all the shares that the dissenting shareholder had registered in their name on the date on which the right is determined to participate in the meeting at which the resolution is adopted that motivates the withdrawal and which remains on the date on which their intention to withdraw is communicated to the company.
The price paid to a dissenting shareholder of a publicly held stock corporation whose shares are quoted and actively traded on one of the Chilean stock exchanges is the weighted average of the sales prices for the shares as reported on the Chilean stock exchanges on which the shares are quoted for the two-month period between the ninetieth and the thirtieth day before the shareholders’ meeting giving rise to the withdrawal right. If, because of the volume, frequency, number and diversity of the buyers and sellers, the SVS determines that the shares are not actively traded on a stock exchange, the price paid to the dissenting shareholder shall be the book value. Book value for this purpose shall equal paid capital plus reserves and profits, less losses, divided by the total number of subscribed shares, whether entirely or partially paid. For the purpose of making this calculation, the last consolidated statements of financial position is used, as adjusted to reflect inflation up to the date of the shareholders’ meeting which gave rise to the withdrawal right.
Article 126 of the Chilean Companies Act Regulations establishes that in cases where the right to withdraw arises, the company shall be obliged to inform the shareholders of this situation, the value per share that will be paid to shareholders exercising their right to withdraw and the term for exercising it. Such information should be given to shareholders at the same meeting at which the resolutions are adopted giving rise to the right of withdrawal, prior to its voting. A special communication should be given to the shareholders with rights, within two days following the date on which the rights to withdraw are born. In the case of publicly held companies, such information shall be communicated by a prominent notice in a newspaper with a wide national circulation and on its website, plus a written communication addressed to the shareholders with rights at the address they have registered with the company. The notice of the shareholders meeting that should pronounce on a matter that could originate withdrawal rights should mention this circumstance.
The resolutions that result in a shareholder’s right to withdraw include, among others, the following:
the transformation of the company into an entity which is not a publicly held stock corporation governed by Chilean Companies Act;
the merger of the company with another company;
disposition of 50% or more of the assets of the company, whether it includes disposition of liabilities or not, as well as the approval or the amendment of the business plan which contemplates the disposition of assets in an amount greater than such percentage;
the disposition of 50% or more of the assets of a subsidiary, as long as such subsidiary represents at least 20% of the assets of the company, as well as any disposition of its shares that results in the parent company losing its position of controlling shareholder;
issue of guarantees for third parties’ liabilities which exceed 50% of the assets (if the third party is a subsidiary of the company, the approval of the Board of Directors is sufficient);
the creation of preferential rights for a class of shares or an amendment to the existing ones. In this case the right to withdraw only accrues to the dissenting shareholders of the class or classes of shares adversely affected;
certain remedies for the nullification of the corporate by-laws; and
such other causes as may be established by the law or by the company’s by-laws.
Investments by AFPs
The Pension Funds’ System Law permits AFPs to invest their funds in companies that are subject to Title XII and these companies are subject to greater restrictions than other companies. The determination of which stocks may be purchased by AFPs is made by the Risk Classification Committee. The Risk Classification Committee establishes investment guidelines and is empowered to approve or disapprove those companies that are eligible for AFP investments. We are and have been a Title XII company and are approved by the Risk Classification Committee.
Title XII companies are required to have by-laws that:
limit the ownership of any shareholder to a specified maximum percentage, currently 65%;
require that certain actions be taken only at a meeting of the shareholders; and
give the shareholders the right to approve certain investment and financing policies.
Registrations and Transfers
Shares issued by us are registered with an administrative agent, which is DCV Registros S.A. This entity is also responsible for our shareholders registry. In case of jointly-owned shares, an attorney-in-fact must be appointed to represent the joint owners in dealing with us.
None.
The Central Bank of Chile is responsible for, among other things, monetary policies and exchange controls in Chile. Currently applicable foreign exchange regulations are set forth in the Compendium of Foreign Exchange Regulations (the “Compendium”) approved by the Central Bank of Chile in 2002. Appropriate registration of a foreign investment in Chile permits the investor access to the Formal Exchange Market. Foreign investments can be registered with the Foreign Investment Committee under D.L. 600 of 1974 or can be registered with the Central Bank of Chile under the Central Bank Act, Law 18,840 of October 1989.
The following is a summary of certain provisions of Chapter XIV that are applicable to all existing shareholders (and ADS holders). This summary does not purport to be complete and is qualified in its entirety by reference to Chapter XIV. Chapter XIV regulates the following type of investments: credits, deposits, investments and equity contributions. A Chapter XIV investor may at any time repatriate an investment made in us upon sale of our shares, and the profits derived therefrom, with no monetary ceiling, subject to the then effective regulations, which must be reported to the Central Bank of Chile.
Except for compliance with tax regulations and some reporting requirements, currently there are no rules in Chile affecting repatriation rights, except that the remittance of foreign currency must be made through a Formal Exchange Market entity. However, the Central Bank of Chile has the authority to change such rules and impose exchange controls.
b)
| The Compendium and International Bond Issuances
|
Chilean issuers may offer bonds issued by the Central Bank of Chile internationally under Chapter XIV, as amended, of the Compendium.
E. Taxation.
Chilean Tax Considerations
The following discussion summarizes material Chilean income and withholding tax consequences to foreign holders arising from the ownership and disposition of shares and ADSs. The summary that follows does not purport to be a comprehensive description of all of the tax considerations that may be relevant to a decision to purchase, own or dispose of shares or ADSs, if any, and does not purport to deal with the tax consequences applicable to all categories of investors, some of which may be subject to special rules. Holders of shares and ADSs are advised to consult their own tax advisors concerning the Chilean and other tax consequences of the ownership of shares or ADSs. The summary that follows is based on Chilean law, in effect on the date hereof, and is subject to any changes in these or other laws occurring after such date, possibly with retroactive effect. Under Chilean law, provisions contained in statutes such as tax rates applicable to foreign investors, the computation of taxable income for Chilean purposes and the manner in which Chilean taxes are imposed and collected may be amended only by another law. In addition, the Chilean tax authorities enact rulings and regulations of either general or specific application and interpret the provisions of the Chilean Income Tax Law. Chilean tax may not be assessed retroactively against taxpayers who act in good faith relying on such rulings,
regulations and interpretations, but Chilean tax authorities may change their rulings, regulations and interpretations in the future. The discussion that follows is also based, in part, on representations of the depositary, and assumes that each obligation in the Deposit Agreement and any related agreements will be performed in accordance with its terms. As of this date, there is currently no applicable income tax treaty in effect between the United States and Chile. However, in 2010 the United States and Chile signed an income tax treaty that will enter into force once the treaty is ratified by both countries, which has not happened as of the date of this Report. There can be no assurance that the treaty will be ratified by either country. The following summary assumes that there is no applicable income tax treaty in effect between the United States and Chile.
As used in this Report, the term “foreign holder” means either:
in the case of an individual holder, a person who is not a resident of Chile; for purposes of Chilean taxation, an individual is resident of Chile if he or she has resided in Chile for more than six months in one calendar year, or a total of more than six months in two consecutive fiscal years; or
in the case of a legal entity holder, an entity that is not organized under the laws of Chile, unless the shares or ADSs are assigned to a branch, agent, representative or permanent establishment of such entity in Chile.
Taxation of Shares and ADSs
Taxation of Cash Dividends and Property Distributions
General Rule: The following taxation of cash dividends and property distributions applies until 2016. Cash dividends paid with respect to the shares or ADSs held by a foreign holder will be subject to Chilean withholding tax, which is withheld and paid by the company. As described in the example below, the amount of the Chilean withholding tax is determined by applying a 35% rate to a “grossed-up” distribution amount (such amount equal to the sum of the actual distribution amount and the correlative Chilean corporate income tax paid by the issuer), and then subtracting as a credit such Chilean corporate income tax paid by the issuer.
In September 2014, a tax reform was enacted (Law 20,780) which, among other topics, progressively increased the corporate income tax (“CIT”). The CIT rate will be adjusted as follows: in 2014 it increased from 20% to 21%; in 2015 it increased to 22.5%; in 2016 it increased to 24%; in 2017, depending on which of the two new alternative systems enacted as part of the 2014 tax reform (discussed below) is chosen, the rate increases to 25% for companies electing the accrued income basis and 25.5% for companies electing the cash basis for shareholders. As of 2018, the CIT rate will remain at 25% for companies that elected the accrued income basis and will increase to 27% for companies that elected the cash basis for shareholders. The example below illustrates the effective Chilean withholding tax burden on a cash dividend received by a foreign holder, assuming a Chilean withholding tax base rate of 35%, an effective Chilean corporate income tax rate of 24 % (CIT rate for 2016) and a distribution of 50% of the net income of the company distributable after payment of the Chilean corporate income tax:
Line | | Concept and calculation assumptions | | Amount | | 1 | | Company taxable income (based on Line 1 = 100) | | | 100.0 | | 2 | | Chilean corporate income tax : 24% x Line 1 | | | 24 | | 3 | | Net distributable income: Line 1 — Line 2 | | | 76 | | 4 | | Dividend distributed (50% of net distributable income): 50% of Line 3 | | | 38 | | 5 | | Withholding tax: (35% of (the sum of Line 4 and 50% of Line 2)) | | | (17.5 | ) | 6 | | Credit for 50% of Chilean corporate income tax : 50% of Line 2 | | | 12 | | 7 | | Net withholding tax : Line 5 + Line 6 | | | (5.6 | ) | 8 | | Net dividend received: Line 4 - Line 7 | | | 32.5 | | 9 | | Effective dividend withholding rate : Line 7 / Line 4 | | | 14.5 | |
In general, the effective Chilean dividend withholding tax rate, after giving effect to the credit for the Chilean corporate income tax paid by the company, can be computed using the following formula:
Effective Dividend
| =
| (Withholding tax rate) - (Chilean corporate income tax rate)
| Withholding Tax Rate
| | 1 - (Chilean corporate income tax rate)
|
Using the rates prevailing until 2016, the Effective Dividend Withholding Rate is
(35%-24%) / (100%-24%) = 14.47%
Dividends are generally assumed to have been paid out of our oldest retained profits for purposes of determining the level of Chilean corporate income tax that was paid by us. For information as to our retained earnings for tax
|
The Depositary collects fees for delivery and surrender of ADSs directly from investors depositing shares or surrendering ADSs for the purpose of withdrawal or from intermediaries acting for them. The Depositary fees payable for cash distributions are deducted from the cash being distributed. In the case of distributions other than cash, the Depositary will invoice the applicable ADS record date holders and such fees may be deducted from distributions.
Depositary Payments for Fiscal Year 2018
The Depositary has agreed to reimburse certain expenses incurred by us in connection with our ADS program. In 2018, the Depositary reimbursed expenses related primarily to investor relations’ activities for a total amount of US$ 0.8 million (after the deduction of applicable U.S. taxes).
PART II
Item 13.Defaults, Dividend Arrearages and Delinquencies
None.
Item 14.Material Modifications to the Rights of Security Holders and Use of Proceeds
None.
Item 15.Controls and Procedures
a) Disclosure Controls and Procedures
We carried out an evaluation under the supervision and with the participation of our senior management, including the Chief Executive Officer and Chief Financial Officer, of the effectiveness of the design and operation of our “disclosure controls and procedures” (as defined in Rules 13a-15(e) and 15d-15(e) under the Exchange Act) for the year ended December 31, 2018.
There are inherent limitations to the effectiveness of any system of disclosure controls and procedures, including the possibility of human error, and the circumvention or overriding of the controls and procedures. Accordingly, our disclosure controls and procedures are designed to provide reasonable assurance of achieving their control objectives.
Based upon our evaluation, the Chief Executive Officer and the Chief Financial Officer concluded that the disclosure controls and procedures are effective in providing reasonable assurance that information required to be disclosed in the reports we file and submit under the Exchange Act is recorded, processed, summarized and reported, within the time periods specified in the applicable rules and forms, and that it is gathered and communicated to our management, including the Chief Executive Officer and Chief Financial Officer, as appropriate, to allow timely decisions regarding required disclosure.
Our disclosure controls and procedures are designed to provide reasonable assurance of achieving their objectives, and our principal executive officer and principal financial officer have concluded that our disclosure controls and procedures are effective at that reasonable assurance level.
(b) Management’s Annual Report on Internal Control Over Financial Reporting
As required by Section 404 of the Sarbanes-Oxley Act of 2002, our management is responsible for establishing and maintaining “adequate internal control over financial reporting” (as defined in Rule13a-15(f) under the Exchange Act). Our internal control over financial reporting is designed to provide reasonable assurance regarding the reliability of financial reporting and the preparation of the financial statements for external purposes in accordance with IFRS, as issued by the IASB.
During the first half of 2018, EGP Chile became part of our consolidated subsidiaries as of April 2, 2018 because to the 2018 Reorganization. EGP Chile represents 26.3% of our total consolidated assets and 7.4% of our total consolidated revenues as reported in our consolidated financial statements as of and for the year ended December 31, 2018.
Because of its inherent limitations, internal control over financial reporting may not necessarily prevent or detect some misstatements. It can only provide reasonable assurance regarding financial statement preparation and presentation. Also, projections of any evaluation of effectiveness for future periods are subject to the risk that controls may become inadequate because of changes in conditions or because the degree of compliance with the policies or procedures may deteriorate over time.
Management assessed the effectiveness of its internal control over financial reporting for the year ended December 31, 2018. The assessment was based on criteria established in “Internal Control — Integrated Framework” issued by the Committee of Sponsoring Organizations of the Treadway Commission (“COSO 2013 framework”). Management has excluded from the scope of its assessment of internal control over financial reporting the operations and related assets of EGP Chile, in accordance with applicable guidance provided by the SEC. Based on the assessment, our management has concluded that as of December 31, 2018, our internal control over financial reporting was effective.
(c) Attestation Report of the Public Accounting Firm
Our independent registered public accounting firm has audited the effectiveness of our internal control over financial reporting as of December 31, 2018. Their attestation report appears on page F-2.
(d) Changes in Internal Control over Financial Reporting
During the first half of 2018, EGP Chile became part of our consolidated subsidiaries as of April 2, 2018, due to the 2018 Reorganization. EGP Chile represents 26.3% of our total consolidated assets and 7.4% of our total consolidated revenues as reported in our consolidated financial statements as of and for the year ended December 31, 2018.
EGP Chile will be included in the scope of the internal control model for financial reporting in 2019 and its processes and controls will be included and certified in 2019.
There were no changes in our internal control over financial reporting identified in connection with the evaluation required by Rules 13a-15(d) or 15d-15(d) under the Exchange Act that occurred during 2018 that have materially affected, or are reasonably likely to materially affect, our internal control over financial reporting model.
Item 16.Reserved
Item 16A.Audit Committee Financial Expert
As of December 31, 2018, the Directors’ Committee (which performs the functions of the Audit Committee) financial expert was Mr. Fernán Gazmuri P., as determined by the Board of Directors. Mr. Gazmuri is an independent member of the Directors’ Committee pursuant to the requirement of both Chilean law and NYSE corporate governance rules.
Item 16B.Code of Ethics
Our standards of ethical conduct are governed by means of the following five corporate rulings or policies: the Code of Ethics, the Zero Tolerance Anti-Corruption Plan (the “ZTAC Plan”), the Human Rights Policy, the Manual for the Management of Information of Interest to the Market (the “Manual”) and the Diversity Policy.
The Manual, adopted by our Board of Directors, addresses the following issues: applicable standards and blackout periods regarding the information in connection with transactions of our securities or those of our affiliates, entered into by directors, management, principal executives, employees and other related parties; the existence of mechanisms for the continuous disclosure of information that is of interest to the market; and mechanisms that provide protection for confidential information.
In addition to the corporate governance rules described above, our Board adopted the Code of Ethics, the ZTAC Plan and the Human Rights Policy. The Code of Ethics is based on general principles such as impartiality, honesty, integrity and other values of similar importance, which are translated into detailed behavioral criteria. The ZTAC Plan reinforces the principles included in the Code of Ethics, but with a special emphasis on avoiding corruption in the form of bribes, preferential treatment, and other similar matters. The Human Rights Policy incorporates and adapts the general human rights principles championed by the United Nations into a corporate reality.
The Diversity Policy was approved by the Board of Directors on August 30, 2016. This policy defines the key principles required to spread a culture that focuses on diversity and is based on the respect and promotion of the principles of preventing arbitrary discrimination and encouraging equal opportunities and inclusion, which are fundamental values in the development of the Company’s activities. By means of this policy, the Company seeks to improve the work environment and the tax credit available on the distribution of such retained earnings, see Note 17 of the Notes to our consolidated financial statements.
Under Chilean Income Tax Law, dividend distributions made in property are subject to the same Chilean tax rules as cash dividends. Stock dividends that represent free shares distributed to foreign shareholders as a consequence of a capitalization made on the same corporation are not subject to Chilean taxation.
Exceptions: Despite the aforementioned general rule, there are special circumstances under which a different tax treatment would apply depending on the source of the income or due to special circumstances existing at the date of the dividend distribution. The most common special cases are briefly described below:
1) Circumstances where there is no CIT credit against the Chilean withholding tax: These cases are when: (i) profits paid as dividends (following the seniority rule indicated above) exceed a company’s taxable income (such dividend distributions in excess of a company’s taxable income determined as of December 31 of the distribution’s year will be subject to the Chilean withholding tax rate of 35%, without the CIT credit; in relation to the provisional withholding rule applicable on the date of the dividend payment, please see number 3 below); or (ii) the income was not subject to CIT due to an exemption of the Chilean corporate income tax, in which case the foreign holder will be also subject to the Chilean withholding tax rate of 35% without the CIT credit.
2) Circumstances where dividends have been attributed to income exempted from all the Chilean income taxes: In these cases, dividends distributed by a company to the foreign holder will not be subject to Chilean withholding tax. Income exempted from Chilean income tax is expressly listed in the Chilean Income Tax Law.
3) Circumstances where dividends are subject to a provisional withholding tax: In the event that on the date of the dividend distribution there are no earnings on which income tax has been paid and there are no tax-exempt earnings, a 35% Chilean withholding tax with a provisional 24% Chilean CIT credit is applicable. This provisional 24% Chilean corporate income tax credit must be confirmed with the information of a company’s taxable income as of December 31 of the year in which the dividend was paid. A company can agree with the foreign holders to withhold a higher amount in order to avoid under withholding of the Chilean withholding tax.
4) Circumstances when it is possible to use certain credits in Chile against income taxes paid abroad, or “foreign tax credit”: This occurs when dividends distributed by the Chilean company have income generated by companies domiciled in third countries as their source. If that income was subject to withholding tax or corporate income tax in those third countries, such income will have a credit or “foreign tax credit” against corresponding Chilean taxes, which can be proportionally transferred to the shareholders of a Chilean company.
New System in effect starting in 2017
The tax reform released in September 2014, as amended by Law 20,899 enacted on February 8, 2016, created two alternative mechanisms of shareholder-level income taxation beginning on January 1, 2017: a) accrued income basis (known as attributed-income system in Chile) shareholder taxation and b) cash basis (known as partially-integrated system in Chile and most similar to the current system) shareholder taxation. Since we are a public limited company (“Sociedad Anónima” in Spanish), no election is available to us, and therefore the cash basis system is mandatory for us according to the law.
In addition, the aforementioned Law No. 20,899 expanded the 100% CIT credit against the Chilean shareholder tax to taxpayers who are residents in countries with which Chile has an effective or signed tax treaty to avoid international double taxation prior to January 1, 2017, even if not in force as of such date. This is currently the status of the treaty signed between Chile and the United States. This temporary rule will be in force from January 1, 2017 through December 31, 2019.
Under the cash basis system, we will pay CIT (at 25% in 2017 and at 27% thereafter) on our annual result. Foreign and local individual shareholders will only pay in Chile the relevant tax (as described below) on effective profit distributions and will be allowed to use the tax paid by the distributing company as credit, with certain limitations. Only 65% of the CIT is creditable against the 35% shareholder- level tax (as opposed to 100% under the current FUT regime and under the accrued income basis). However, if there is an effective or signed tax treaty with Chile before January 1, 2017 (even if not in effect), the CIT is fully creditable against the 35% shareholder tax.
Taxation in two stages:
| • Company:
| 27% of accrued profits (using the maximum CIT applicable from 2018 and forward).
|
| • Shareholder:
| 35% of cash disbursement (65% of CIT tax is creditable against the shareholder level tax, resulting in an effective tax rate to the shareholder of 17.5%. However, if the shareholder is a resident of a country with an effective or signed tax treaty with Chile before January 1, 2017 (even if not in effect), CIT tax is fully creditable, resulting in an effective tax rate to the shareholder of 8%).
|
Total Tax Burden: 44.45% (35% for residents of countries with tax treaties).
Taxation on sale or exchange of ADSs, outside of Chile
Gains obtained by a foreign holder from the sale or exchange of ADSs outside Chile will not be subject to Chilean taxation.
Taxation on sale or exchange of Shares
Until December 31, 2016, the Chilean Income Tax Law included a tax exemption on capital gains arising from the sale of shares of listed companies traded in the stock markets. Although there were certain restrictions, in general terms, the amendment provided that in order to qualify for the capital gain exemption: (i) the shares must be of a publicly held stock corporation with a certain minimum level of trading on a stock exchange; (ii) the sale must be carried out in a Chilean stock exchange, or in a tender offer subject to Chapter XXV of the Chilean Securities Market Law; (iii) the shares which were being sold must have been acquired on a Chilean stock exchange, or in a tender offer subject to Chapter XXV of the Chilean Securities Market Law, or in an initial public offering (due to the creation of a company or to a capital increase), or due to the exchange of convertible bonds; and (iv) the shares must have been acquired after April 19, 2001.
If the shares did not qualify for the above exemption, capital gains on their sale or exchange of shares (as distinguished from sales or exchanges of ADSs representing such shares of common stock) could be subject to two alternative tax regimes: (a) the general tax regime, with a 24% Chilean CIT and a 35% Chilean withholding tax, the former being creditable against the latter; or (b) a 24% Chilean CIT as sole tax regime, when all the following circumstances were met: (i) the sale was made between unrelated parties, (ii) the sale of shares was not a recurrent or habitual activity for the seller and (iii) at least one year had elapsed between the acquisition and the sale of the shares.
The date of acquisition of the ADSs was considered to be the date of acquisition of the shares for which the ADSs were exchanged.
Since January 1, 2017, the capital gains obtained in the sales of shares owned by foreign holders are subject to CIT and Chilean withholding tax, and the CIT serves as a credit in Chile to reduce the withholding tax.
Other Chilean Taxes
There is no gift, inheritance or succession tax applicable to the ownership, transfer or disposition of ADSs by foreign holders, but such taxes will generally apply to the transfer at death or by gift of the shares by a foreign holder. There is no Chilean stamp, issue, registration or similar taxes or duties payable by holders of shares or ADSs.
Material U.S. Income Tax Considerations
This discussion is based on the Internal Revenue Code of 1986, as amended (the “Code”), administrative pronouncements, judicial decisions and final, temporary and proposed Treasury regulations, all as of the date hereof. These authorities are subject to change, possibly with retroactive effect. This discussion assumes that the depositary’s activities are clearly and appropriately defined so as to ensure that the tax treatment of ADSs will be identical to the tax treatment of the underlying shares.
The following are the material U.S. federal income tax consequences to U.S. Holders (as defined herein) of receiving, owning, and disposing of shares or ADSs, but it does not purport to be a comprehensive description of all of the tax considerations that may be relevant to a particular person’s decision to hold such securities and is based on the assumption stated above under “Chilean Tax Considerations” that there is no applicable income tax treaty in effect between the United States and Chile. The discussion applies only if the beneficial owner holds shares or ADSs as capital assets for U.S. federal income tax purposes and it does not describe all of
the tax consequences that may be relevant in light of the beneficial owner’s particular circumstances. For instance, it does not describe all the tax consequences that may be relevant to:
certain financial institutions;
dealers and traders in securities who use a mark-to-market method of tax accounting;
persons holding shares or ADSs as part of a “straddle” integrated transaction or similar transaction;
persons whose functional currency for U.S. federal income tax purposes is not the U.S. dollar;
partnerships or other entities classified as partnerships for U.S. federal income tax purposes;
persons liable for the alternative minimum tax;
tax-exempt organizations;
persons holding shares or ADSs that own or are deemed to own ten percent or more of our stock; or
persons holding shares or ADSs in connection with a trade or business conducted outside of the United States.
If an entity classified as a partnership for U.S. federal income tax purposes holds shares or ADSs, the U.S. federal income tax treatment of a partner will generally depend on the status of the partner and upon the activities of the partnership. Partnerships holding shares or ADSs and partners in such partnerships should consult their tax advisors as to the particular U.S. federal income tax consequences of holding and disposing of the shares or ADSs.
You will be a “U.S. Holder” for purposes of this discussion if you become a beneficial owner of our shares or ADSs and if you are, for U.S. federal income tax purposes:
a citizen or individual resident of the United States; or
a corporation, or other entity taxable as a corporation, created or organized in or under the laws of the United States or any political subdivision thereof; or
an estate, the income of which is subject to U.S. federal income taxation regardless of its source; or
a trust (i) that validly elects to be treated as a U.S. person for U.S. federal income tax purposes or (ii) if(A) a court within the United States is able to exercise primary supervision over the administration of the trust and (B) one or more U.S. persons have the authority to control all substantial decisions of the trust.
In general, if a beneficial owner owns ADSs, such owner will be treated as the owner of the shares represented by those ADSs for U.S. federal income tax purposes. Accordingly, no gain or loss will be recognized if a beneficial owner exchanges ADSs for the underlying shares represented by those ADSs.
The U.S. Treasury has expressed concerns that parties to whom ADSs are released before shares are delivered to the depositary (pre-release) or intermediaries in the chain of ownership between beneficial owners and the issuer of the security underlying the ADSs may be taking actions that are inconsistent with the claiming of foreign tax credits for beneficial owners of depositary shares. Such actions would also be inconsistent with the claiming of the reduced tax rate, described below, applicable to dividends received by certain non-corporate beneficial owners. Accordingly, the analysis of the creditability of Chilean taxes, and the availability of the reduced tax rate for dividends received by certain non-corporate holders, each described below, could be affected by actions taken by such parties or intermediaries.
This discussion assumes that we will not be a passive foreign investment company, as described below.
Beneficial owners should consult their tax advisors with respect to their particular tax consequences of owning or disposing of shares or ADSs, including the applicability and effect of state, local, non-U.S. and other tax laws and the possibility of changes in tax laws.
Taxation of Distributions
The following discussion is based on the current regime for taxation of cash dividends and distributions applicable in Chile until 2016. For 2017 and later, the U.S. federal income tax treatment will depend on which of the two regimes we elect to adopt. We adopted the cash basis system, which is very similar to the regime that was in effect until 2016. See “Item 10. Additional Information — E. Taxation — Chilean Tax Considerations — Taxation of shares and ADSs — Taxation of Cash Dividends and Property Distributions” above.
Distributions paid on shares or ADSs other than certain pro rata distributions of shares of common stock will be treated as dividends taxable as ordinary income to the extent paid out of our current or accumulated earnings and profits (as determined under U.S. federal income tax principles). Because we do not maintain calculations of our earnings and profits under U.S. federal income tax principles, it is expected that distributions generally will be reported as dividends.
If a beneficial owner is a U.S. Holder, subject to applicable limitations and the discussion above regarding concerns expressed by the U.S. Treasury, dividends paid by qualified foreign corporations to the beneficial owner that is not a corporation are taxable at a maximum rate of 20%. A foreign company is treated as a qualified foreign corporation with respect to dividends paid on stock that is readily tradable on an established securities market in the United States, such as the New York Stock Exchange where our ADSs are traded. Beneficial owners should consult their tax advisors to determine whether the favorable rate will apply to dividends they receive and whether they are subject to any special rules that limit their ability to be taxed at this favorable rate.
The amount of a dividend will include the net amount withheld by us in respect of Chilean withholding taxes on the distribution. The amount of the dividend will be treated as foreign-source dividend income to a beneficial owner and will not be eligible for the dividends-received deduction generally allowed to U.S. corporations under the Code. Dividends will be included in a beneficial owner’s income on the date of the beneficial owner’s, or in the case of ADSs, the Depositary’s receipt of the dividend. The amount of any dividend paid in Chilean pesos will be a U.S. dollar amount calculated by reference to the exchange rate for converting Chilean pesos into U.S. dollars in effect on the date of such receipt regardless of whether the payment is in fact converted into U.S. dollars. If the dividend is converted into U.S. dollars on the date of receipt, a beneficial owner generally should not be required to recognize foreign currency gain or loss in respect of the dividend income. A beneficial owner may have foreign currency gain or loss if the dividend is converted into U.S. dollars on a date after the date of receipt.
Subject to applicable limitations that may vary depending upon a beneficial owner’s circumstances and subject to the discussion above regarding concerns expressed by the U.S. Treasury, the net amount of Chilean withholding tax (after reduction for the credit for Chilean corporate income tax, as discussed above under “Item 10. Additional Information — E. Taxation — Chilean Tax Considerations — Taxation of Shares and ADSs — Taxation of Cash Dividends and Property Distributions”) withheld from dividends on shares or ADSs will be creditable against a beneficial owner’s U.S. federal income tax liability. The rules governing foreign tax credits are complex and, therefore, a beneficial owner should consult the beneficial owner’s tax advisor regarding the availability of foreign tax credits in the beneficial owner’s particular circumstances. Instead of claiming a credit, a beneficial owner may, at the beneficial owner’s election, deduct such Chilean taxes in computing the beneficial owner’s taxable income, subject to generally applicable limitations under U.S. law. An election to deduct foreign taxes instead of claiming foreign tax credits applies to all taxes paid or accrued in the taxable year to foreign countries and possessions of the United States.
Sale or Other Disposition of Shares or ADSs
If a beneficial owner is a U.S. Holder, for U.S. federal income tax purposes, the gain or loss a beneficial owner realizes on the sale or other disposition of shares or ADSs will be a capital gain or loss, and will be a long- term capital gain or loss if the beneficial holder has held the shares or ADSs for more than one year. The amount of a beneficial owner’s gain or loss will equal the difference between the beneficial owner’s tax basis in the shares or ADSs disposed of and the amount realized on the disposition, in each case as determined in U.S. dollars. Such gain or loss will generally be U.S.-source gain or loss for foreign tax credit purposes. In addition, certain limitations exist on the deductibility of capital losses by both corporate and individual taxpayers.
In certain circumstances prior to 2017, and in all circumstances starting in 2017, Chilean taxes may be imposed upon the sale of shares (but not ADSs). See “Item 10. Additional Information — E. Taxation — Chilean Tax Considerations — Taxation of Shares and ADSs.” If a Chilean tax is imposed on the sale or disposition of shares, and a beneficial owner that is a U.S. Holder does not receive significant foreign source income from other sources, such beneficial owner may not be able to credit such Chilean tax against the beneficial owner’s U.S. federal income tax liability.
Passive Foreign Investment Company Rules
We believe that we will not be a “passive foreign investment company” (“PFIC”) for U.S. federal income tax purposes for our 2017 taxable year or for the foreseeable future. However, because PFIC status depends upon the composition of a company’s income and assets and the market value of its assets from time to time, and because it is unclear whether certain types of our income constitute passive income for PFIC purposes, there can be no assurance that we will not be considered a PFIC for any taxable year. If we were to become a PFIC for any taxable year during which a beneficial owner held shares or ADSs, certain adverse consequences could apply to the beneficial owner, including the imposition of higher amounts of tax than would otherwise apply, and additional filing requirements. Beneficial owners should consult their tax advisors regarding the consequences to them if we were to become a PFIC, as well as the availability and advisability of making any election that might mitigate the adverse consequences of PFIC status.
Information Reporting and Backup Withholding
Payments of dividends and sales proceeds that are made within the United States or through certain U.S.- related financial intermediaries generally are subject to information reporting and to backup withholding unless:
(i) the beneficial owner is an exempt recipient or (ii) in the case of backup withholding, the beneficial owner provides a correct taxpayer identification number and certifies that the beneficial owner is not subject to backup withholding.
The amount of any backup withholding from a payment to a beneficial owner will be allowed as a credit against the beneficial owner’s U.S. federal income tax liability and may entitle the beneficial owner to a refund, provided that the required information is furnished in a timely fashion to the Internal Revenue Service.
Medicare Contribution Tax
Legislation enacted in 2010 generally imposes a tax of 3.8% on the “net investment income” of certain individuals, trusts and estates. Among other items, net investment income generally includes gross income from dividends and net gain attributable to the disposition of certain property, like the shares or ADSs, less certain deductions. A beneficial owner should consult the beneficial owner’s tax advisor regarding the possible application of this legislation in the beneficial owner’s particular circumstances.
Beneficial owners should consult their tax advisors with respect to the particular consequences to them of receiving, owning or disposing of shares or ADSs.
F.
| Dividends and Paying Agents.
|
Not applicable.
Not applicable.
We are subject to the information requirements of the Exchange Act, except that as a foreign issuer, we are not subject to SEC proxy rules (other than general anti-fraud rules) or the short-swing profit disclosure rules of the Exchange Act. In accordance with these statutory requirements, we file or furnish reports and other information with the SEC. Reports and other information filed or furnished with the SEC may be inspected and copied at the public reference facilities maintained by the SEC at Room 1024, 100 F Street, N.E., Washington, D.C. 20549. Copies of such material may also be inspected at the offices of the New York Stock Exchange, at 11 Wall Street, New York, New York 10005, on which our ADSs are listed. In addition, the SEC maintains a website that contains electronically filed information, which can be accessed at http://www.sec.gov.
I.
| Subsidiary Information.
|
Not applicable.
Item 11. Quantitative and Qualitative Disclosures About Market Risk
We are exposed to risks arising from changes in commodity prices, interest rates and foreign exchange rates that affect the generation and distribution businesses in Chile. These risks are monitored and managed by us in coordination with Enel Generación Chile. Our Board of Directors approves risk management policies at all levels.
Commodity Price Risk
In our electricity generation business segment, we are exposed to market risks arising from the price volatility of electricity, natural gas, diesel oil, and coal. We seek to ensure our fuel supply by securing long-term contracts with our suppliers for periods that are expected to match the lifetime of our generation assets. These contracts generally have provisions that allow us to purchase natural gas with a pricing formula that combines Henry Hub natural gas and Brent diesel oil at market prices prevailing at the time the purchase occurs. As of December 31, 2016 we held contracts classified as derivative financial instruments related to diesel oil (2,928,675 barrels of Brent diesel oil) and natural gas (3,317,491 MMBTU of Henry Hub). As of December 31, 2015, we held contracts classified as financial instruments related to diesel oil (133,058 barrels of Brent diesel oil).
In our thermal power plants, which use coal or petroleum-based liquid fuel, the dispatch or bidding mechanism allows these plants to cover their operating costs. However, under certain circumstances, fuel price fluctuations might affect marginal costs. We transfer commodity prices variations to contracted sale prices according to indexing formulas. Due to the drought conditions in the past several years in Chile and the price volatility of coal, we hedged this risk with commodity instruments available in the international markets. As of December 31, 2016 and 2015, we did not hold any contracts classified as either derivative financial instruments or financial instruments related either to coal or petroleum based liquid fuel.
Additionally, through adequate commercial risk mitigation policies, and a hydro-thermal power plant mix, we seek to naturally protect our operating income from electricity price volatility. As of December 31, 2016 and 2015, we did not hold electricity price-sensitive instruments.
We are continually analyzing strategies to hedge commodity price risk, like transferring commodity price variations to the customers’ contract prices and/or permanently adjusting commodity indexed price formulas for new Power Purchase Agreements according to our exposure and/or analyzing ways to mitigate risk through hydrological insurance in dry years. In the future we may use price-sensitive instruments.
Interest Rate and Foreign Currency Risk
As of December 31, 2016, the carrying values according to maturity and the corresponding fair value of our interest bearing debt are detailed below. Values do not include derivatives.
| | Expected maturity date | |
For the year ended December 31, | | 2017 | | | 2018 | | | 2019 | | | 2020 | | | 2021 | | | Thereafter | | | Total | | | Fair Value(2) | |
| | (in millions of Ch$)(1) | |
Fixed Rate | | | | | | | | | | | | | | | | | | | | | | | | | | | | | | | | |
Ch$/UF | | | | | | | | | | | | | | | | | | | | | | | | | | | | | | | | |
Weighted average interest rate | | | | | | | | | | | | | | | | | | | | | | | | | | | | | | | | |
US$ | | | 1,840 | | | | 1,960 | | | | 2,087 | | | | 2,223 | | | | 2,368 | | | | 487,333 | | | | 497,811 | | | | 596,452 | |
Weighted average interest rate | | | 6.5 | % | | | 6.5 | % | | | 6.5 | % | | | 6.5 | % | | | 6.5 | % | | | 6.1 | % | | | 6.1 | % | | | | |
Total fixed rate | | | 1,840 | | | | 1,960 | | | | 2,087 | | | | 2,223 | | | | 2,368 | | | | 487,333 | | | | 497,811 | | | | 596,452 | |
Weighted average interest rate | | | 6.5 | % | | | 6.5 | % | | | 6.5 | % | | | 6.5 | % | | | 6.5 | % | | | 6.1 | % | | | 6.1 | % | | — | |
Variable Rate | | | | | | | | | | | | | | | | | | | | | | | | | | | | | | | | |
Ch$/UF | | | 5,480 | | | | 5,480 | | | | 29,433 | | | | 29,433 | | | | 29,433 | | | | 231,249 | | | | 330,509 | | | | 422,604 | |
Weighted average interest rate | | | 9.1 | % | | | 9.1 | % | | | 7.8 | % | | | 7.8 | % | | | 7.8 | % | | | 7.8 | % | | | 7.8 | % | | — | |
US$ | | — | | | — | | | — | | | — | | | — | | | — | | | — | | | — | |
Weighted average interest rate | | — | | | — | | | — | | | — | | | — | | | — | | | — | | | — | |
Total variable rate | | | 5,480 | | | | 5,480 | | | | 29,433 | | | | 29,433 | | | | 29,433 | | | | 231,249 | | | | 330,509 | | | | 422,604 | |
Weighted average interest rate | | | 9.1 | % | | | 9.1 | % | | | 7.8 | % | | | 7.8 | % | | | 7.8 | % | | | 7.8 | % | | | 7.8 | % | | — | |
Total | | | 7,321 | | | | 7,440 | | | | 31,520 | | | | 31,656 | | | | 31,801 | | | | 718,582 | | | | 828,320 | | | | 1,019,056 | |
(1)
| Calculated based on the Observed Exchange Rate as of December 31, 2016, which was Ch$ 669.47 per US$ 1.00.
|
(2)
| As of December 31, 2016, fair value was calculated based on the discounted value of future cash flows expected to be paid (or received), considering current discount rates that reflect the different risks involved.
|
As of December 31, 2015, the carrying values according to maturity and the corresponding fair value of our interest bearing debt are detailed below. Values do not include derivatives.
| | Expected maturity date | |
For the year ended December 31, | | 2016 | | | 2017 | | | 2018 | | | 2019 | | | 2020 | | | Thereafter | | | Total | | | Fair Value(2) | |
| | (in millions of Ch$)(1) | |
Fixed Rate | | | | | | | | | | | | | | | | | | | | | | | | | | | | | | | | |
Ch$/UF | | | 0.10 | | | — | | | — | | | — | | | — | | | — | | | | 0.10 | | | | 0.10 | |
Weighted average interest rate | | | 6.7 | % | | — | | | — | | | — | | | — | | | — | | | | 6.7 | % | | — | |
US$ | | | 1,833 | | | | 1,952 | | | | 2,079 | | | | 2,214 | | | | 2,358 | | | | 519,464 | | | | 529,901 | | | | 594,108 | |
Weighted average interest rate | | | 5.6 | % | | | 5.6 | % | | | 5.6 | % | | | 5.6 | % | | | 5.6 | % | | | 5.7 | % | | | 5.7 | % | | — | |
Total fixed rate | | | 1,833 | | | | 1,952 | | | | 2,079 | | | | 2,214 | | | | 2,358 | | | | 519,464 | | | | 529,901 | | | | 594,108 | |
Weighted average interest rate | | | 5.6 | % | | | 5.6 | % | | | 5.6 | % | | | 5.6 | % | | | 5.6 | % | | | 5.7 | % | | | 5.7 | % | | — | |
Variable Rate | | | | | | | | | | | | | | | | | | | | | | | | | | | | | | | | |
Ch$/UF | | | 5,331 | | | | 5,331 | | | | 5,331 | | | | 28,630 | | | | 28,630 | | | | 253,570 | | | | 326,822 | | | | 410,256 | |
Weighted average interest rate | | | 10.6 | % | | | 10.6 | % | | | 10.6 | % | | | 9.0 | % | | | 9.0 | % | | | 9.0 | % | | | 9.1 | % | | — | |
US$ | | — | | | — | | | — | | | — | | | — | | | — | | | — | | | — | |
Weighted average interest rate | | — | | | — | | | — | | | — | | | — | | | — | | | — | | | — | |
Total variable rate | | | 5,331 | | | | 5,331 | | | | 5,331 | | | | 28,630 | | | | 28,630 | | | | 253,570 | | | | 326,822 | | | | 410,256 | |
Weighted average interest rate | | | 10.6 | % | | | 10.6 | % | | | 10.6 | % | | | 9.0 | % | | | 9.0 | % | | | 9.0 | % | | | 9.1 | % | | — | |
Total | | | 7,164 | | | | 7,283 | | | | 7,410 | | | | 30,844 | | | | 30,988 | | | | 773,034 | | | | 856,723 | | | | 1,004,364 | |
(1)
| Calculated based on the Observed Exchange Rate as of December 31, 2015, which was Ch$ 710.16 per US$ 1.00.
|
(2)
| As of December 31, 2015, fair value was calculated based on the discounted value of future cash flows expected to be paid (or received), considering current discount rates that reflect the different risks involved.
|
Interest Rate Risk
Our policy aims to minimize the average cost of debt and reduce the volatility of our financial results. Depending on our estimates and the debt structure, we sometimes manage interest rate risk through the use of interest rate derivatives.
At both December 31, 2016 and 2015, 92% of our total outstanding debt was denominated in fixed terms and 8% was subject to variable interest rates. Because the exposure to variable interest rate risk was so low, we did not engage in derivative hedging instruments.
Foreign Currency Risk
Our policy seeks to maintain a balance between the currency in which cash flows are indexed and the currency of the debt of each company. Most of our subsidiaries have access to funding in the same currency as their revenues, therefore reducing the exchange rate volatility impact. In some cases, we cannot fully benefit from this, and therefore, we try to manage the exposure with financial derivatives such as cross currency swaps or currency forwards, among others. However, this may not always be possible under reasonable terms due to market conditions.
As of December 31, 2016, the carrying values for financial accounting purposes and the corresponding fair value of the instruments that hedge the foreign exchange risk of our interest bearing debt were as follows:
| | Expected Maturity Date | |
For the year ended December 31, | | 2017 | | | 2018 | | | 2019 | | | 2020 | | | 2021 | | | Thereafter | | | Total | | | Fair Value(2) | |
| | (in millions of Ch$)(1) | |
UF to US$ | | | — | | | | — | | | | 523,687 | | | | — | | | | — | | | | — | | | | 523,687 | | | | (23,641 | ) |
US$ to Ch$/UF | | | — | | | | — | | | | — | | | | — | | | | — | | | | — | | | | — | | | | — | |
Ch$ to US$ | | | — | | | | — | | | | — | | | | — | | | | — | | | | — | | | | — | | | | — | |
Total | | | — | | | | — | | | | 523,687 | | | | — | | | | — | | | | — | | | | 523,687 | | | | (23,641 | ) |
(1)
| Calculated based on the Observed Exchange Rate as of December 31, 2016, which was Ch$ 669.47 per US$ 1.00.
|
(2)
| Fair values were calculated based on the discounted value of future cash flows expected to be paid (or received), considering current discount rates that reflect the different risks involved.
|
As of December 31, 2015, the carrying values for financial accounting purposes and the corresponding fair value of the instruments that hedge the foreign exchange risk of our interest bearing debt were as follows:
| | Expected Maturity Date | |
For the year ended December 31, | | 2016 | | | 2017 | | | 2018 | | | 2019 | | | 2020 | | | Thereafter | | | Total | | | Fair Value(2) | |
| | (in millions of Ch$)(1) | |
UF to US$ | | | — | | | | — | | | | — | | | | 541,153 | | | | | | | | — | | | | 541,153 | | | | (60,304 | ) |
US$ to Ch$/UF | | | — | | | | — | | | | — | | | | — | | | | — | | | | — | | | | — | | | | — | |
Ch$ to US$ | | | — | | | | — | | | | — | | | | — | | | | — | | | | — | | | | — | | | | — | |
Total | | | — | | | | — | | | | — | | | | 541,153 | | | | — | | | | — | | | | 541,153 | | | | (60,304 | ) |
(1)
| Calculated based on the Observed Exchange Rate as of December 31, 2015, which was Ch$ 710.16 per US$ 1.00.
|
(2)
| Fair values were calculated based on the discounted value of future cash flows expected to be paid (or received), considering current discount rates that reflect the different risks involved.
|
For further detail please refer to Note 19.6 of the Notes to our consolidated financial statements.
(d) Safe Harbor
The information in this “Item 11. Quantitative and Qualitative Disclosures About Market Risk,” contains information that may constitute forward-looking statements. See “Forward-Looking Statements” in the Introduction of this Report for safe harbor provisions.
Item 12. Description of Securities Other Than Equity Securities
Not applicable.
Not applicable.
Not applicable.
D.
| American Depositary Shares.
|
Depositary Fees and Charges
Our ADS program’s depositary is Citibank, N.A. The Depositary collects fees for delivery and surrender of ADSs directly from investors depositing shares or surrendering ADSs for the purpose of withdrawal or from intermediaries acting for them. The Depositary fees payable for cash distributions are deducted from the cash being distributed. In the case of distributions other than cash, the Depositary will invoice the applicable ADS record date holders and such fees may be deducted from distributions. The Depositary may generally refuse to provide the requested services until its fees for those services are paid. Under the terms of the Deposit Agreement, an ADS holder may have to pay the following service fees to the Depositary:
Service Fees
| | Fees
|
| | |
(1) Issuance of ADS upon deposit of shares (i.e., an issuance upon a deposit of shares or upon a change in the ADS(s) to share(s) ratio), excluding issuances as a result of distributions described in paragraph (4) below.
| | Up to US$5 per 100 ADSs (or fraction thereof) issued.
|
| | |
(2) Delivery of deposited securities against surrender of ADS
| | Up to US$5 per 100 ADSs (or fraction thereof) surrendered.
|
| | |
(3) Distribution of cash dividends or other cash distributions (i.e., sale of rights and other entitlements)
| | Up to US$5 per 100 ADSs (or fraction thereof) held.
|
| | |
(4) Distribution of ADS pursuant to (i) stock dividends or other free stock distributions, or (ii) exercise of rights to purchase additional ADS
| | Up to US$5 per 100 ADSs (or fraction thereof) held.
|
| | |
(5) Distribution of securities other than ADS or rights to purchase additional ADS (i.e., spin-off of shares)
| | Up to US$5 per 100 ADSs (or fraction thereof) held.
|
| | |
(6) Depositary services
| | Up to US$5 per 100 ADSs (or fraction thereof) held on the applicable record date(s) established by the Depositary.
|
The Depositary collects fees for delivery and surrender of ADSs directly from investors depositing shares or surrendering ADSs for the purpose of withdrawal or from intermediaries acting for them. The Depositary fees payable for cash distributions are deducted from the cash being distributed. In the case of distributions other than cash, the Depositary will invoice the applicable ADS record date holders and such fees may be deducted from distributions. The Depositary may generally refuse to provide the requested services until its fees for those services are paid.
Depositary Payments for Fiscal Year 2016
The Depositary has agreed to reimburse certain expenses incurred by us in connection with our ADS program. In 2016, the Depositary reimbursed expenses related primarily to investor relations’ activities for a total amount of US$ 0.4 million (after the deduction of applicable U.S. taxes).
PART II
Item 13.Defaults, Dividend Arrearages and Delinquencies
None.
Item 14.Material Modifications to the Rights of Security Holders and Use of Proceeds
None.
Item 15.Controls and Procedures
a) Disclosure Controls and Procedures
We carried out an evaluation under the supervision and with the participation of our senior management, including the Chief Executive Officer and Chief Financial Officer, of the effectiveness of the design and operation of our “disclosure controls and procedures” (as defined in Rules 13a-15(e) and 15 (d)-15 (e) under the Exchange Act) for the year ended December 31, 2016.
There are inherent limitations to the effectiveness of any system of disclosure controls and procedures, including the possibility of human error, and the circumvention or overriding of the controls and procedures. Accordingly, our disclosure controls and procedures are designed to provide reasonable assurance of achieving their control objectives.
Based upon our evaluation, the Chief Executive Officer and the Chief Financial Officer concluded that the disclosure controls and procedures are effective in providing reasonable assurance that information required to be disclosed in the reports we file and submit under the Exchange Act is recorded, processed, summarized and reported, within the time periods specified in the applicable rules and forms, and that it is gathered and communicated to our management, including the Chief Executive Officer and Chief Financial Officer, as appropriate, to allow timely decisions regarding required disclosure.
Our disclosure controls and procedures are designed to provide reasonable assurance of achieving their objectives, and our principal executive officer and principal financial officer have concluded that our disclosure controls and procedures are effective at that reasonable assurance level.
(b) Management’s Annual Report on Internal Control Over Financial Reporting
As required by Section 404 of the Sarbanes-Oxley Act of 2002, our management is responsible for establishing and maintaining “adequate internal control over financial reporting” (as defined in Rule13a-15 (f) under the Exchange Act). Our internal control over financial reporting is designed to provide reasonable assurance regarding the reliability of financial reporting and the preparation of the financial statements for external purposes in accordance with IFRS, as issued by the IASB.
Because of its inherent limitations, internal control over financial reporting may not necessarily prevent or detect some misstatements. It can only provide reasonable assurance regarding financial statement preparation and presentation. Also, projections of any evaluation of effectiveness for future periods are subject to the risk that controls may become inadequate because of changes in conditions or because the degree of compliance with the policies or procedures may deteriorate over time.
Management assessed the effectiveness of its internal control over financial reporting for the year ended December 31, 2016. The assessment was based on criteria established in “Internal Control – Integrated Framework” issued by the Committee of Sponsoring Organizations of the Treadway Commission (“COSO 2013 framework”). Based on the assessment, our management has concluded that as of December 31, 2016, our internal control over financial reporting was effective.
(c) Attestation Report of the Public Accounting Firm
Our independent registered public accounting firm has audited the effectiveness of our internal control over financial reporting as of December 31, 2016. Their attestation report appears on page F-2.
(d) Changes in Internal Control over Financial Reporting
There were no changes in our internal control over financial reporting identified in connection with the evaluation required by Rules 13a-15(d) or 15d-15(d) under the Exchange Act that occurred during 2016 that have materially affected, or are reasonably likely to materially affect, our internal control over financial reporting model.
Item 16. Reserved
Item 16A.Audit Committee Financial Expert
As of December 31, 2016, the Directors’ Committee (which performs the functions of the Audit Committee) financial expert was Mr. Fernán Gazmuri P., as determined by the Board of Directors. Mr. Gazmuri is an independent member of the Directors’ Committee pursuant to the requirement of both Chilean law and NYSE corporate governance rules.
Item 16B.Code of Ethics
Our standards of ethical conduct are governed by means of the following five corporate rulings or policies: the Code of Ethics, the Zero Tolerance Anti-Corruption Plan (the “ZTAC Plan”), the Human Rights Policy, the Manual for the Management of Information of Interest to the Market (the “Manual”) and the Diversity Policy.
The Manual, adopted by our Board of Directors, addresses the following issues: applicable standards and blackout periods regarding the information in connection with transactions of our securities or those of our affiliates, entered into by directors, management, principal executives, employees and other related parties; the existence of mechanisms for the continuous disclosure of information that is of interest to the market; and mechanisms that provide protection for confidential information.
In addition to the corporate governance rules described above, our Board adopted the Code of Ethics, the ZTAC Plan and the Human Rights Policy. The Code of Ethics is based on general principles such as impartiality, honesty, integrity and other values of similar importance, which are translated into detailed behavioral criteria. The ZTAC Plan reinforces the principles included in the Code of Ethics, but with a special emphasis in avoiding corruption in the form of bribes, preferential treatment, and other similar matters. The Human Rights Policy incorporates and adapts the general human rights principles championed by the United Nations into a corporate reality.
The Diversity Policy was approved by the Board of Directors on August 30, 2016. This policy aims to define the key principles required to spread a culture that focuses on diversity and is based on the respect and promotion of the principles of preventing arbitrary discrimination and encouraging equal opportunities and inclusion, which are fundamental values in the development of the Company’s activities. Under this policy, the Company seeks to improve the work environment and make possible a better quality of life at work. The Company is committed to creating an inclusive work environment where workers can develop their potential and maximize their contribution.
A copy of these documents is available on our webpage at www.enelchile.cl as well as upon request, free of charge, by writing or calling us at:
Enel Chile S.A.
Investor Relations Department
Santa Rosa 76, Piso 15
Santiago, Chile
(56-2) 2353-4682
During fiscal year 2016,2018, there have been no amendments to any provisions of the documents described above. No waivers from any provisions of the Charter Governing Executives, the Employee Code of Conduct, the Code of Ethics, the ZTAC Plan or the Manual, were expressly or implicitly granted to the Chief Executive Officer, the Chief Financial Officer or any other senior financial officers of the Company in fiscal year 2016.2018.
Item 16C.Principal AccountantAccountant Fees and Services
The following table provides information on the aggregate fees for approved services billed by our independent registered accounting firm, as well as the other member firms and their respective affiliates, by type of services for the periods indicated.
Services Rendered | | 2016 | | | 2015 | | | 2018 | | 2017 | |
| | (in millions of Ch$) | | | (in millions of Ch$) | |
Audit fees | | | 928 | | | | — | | | 1,069 | | 855 | |
Audit-related fees(1) | | | 837 | | | | — | | | 552 | | 957 | (1) |
Tax fees | | | — | | | | — | | | — | | — | |
All other fees | | | — | | | | — | | | — | | — | |
Total | | | 1,765 | | | | — | | | 1,621 | | 1,812 | |
(1) Includes non-recurring audit services related to the 2018 Reorganization. | Includes non-recurrent audit services related to the group’s reorganization for Ch$ 753 million.
|
All of the fees disclosed under audit-related fees and all other fees were pre-approved as required by the Directors’ Committee pre-approval policies and procedures.
The amounts included in the table above and the related footnotes have been classified in accordance with SEC guidance.
Directors’ Committee Pre-Approval Policies and Procedures
Our external auditors are appointed by our shareholders at the OSM. Similarly, the shareholders of our subsidiaries, which are located in countries where applicable law and regulation so require, appoint their own external auditors.auditors according to applicable law and regulation.
The Directors’ Committee (which performs the functions of the Audit Committee), reviews engagement letters with external auditors, ensures quality control in respect of the services provided, reviews and controls independence issues, and other related matters.
The Directors’ Committee has a pre-approval policy regarding the contracting of our external auditor, or any affiliate of the external auditor, for professional services. The professional services covered by such policy include audit and non-audit services provided to us.
Fees payable in connection with recurring audit services are pre-approved as part of our annual budget. Fees payable in connection with non-recurring audit services, once they have been analyzed by the CFO, are submitted to the Directors’ Committee for approval or rejection.
The pre-approval policy established by the Directors’ Committee for non-audit services and audit-related fees is as follows:
·The business unit that has requested the service and the audit firm expected to perform the service must request that the CFO review the nature of the service to be provided.
·The CFO then analyzes the request and requires the selected audit firm to issue a certificate signed by the partner responsible for the audit of our consolidated financial statements confirming such audit firm’s independence.
·Finally, the proposal is submitted to the Directors’ Committee for approval or denial.
The Directors’ Committee has designed, approved, and implemented the necessary procedures to fulfill the new requirements described in SEC release number 34-53677, File No. PCAOB-2006-01 (Audit Committee Pre-Approval of Certain Tax Services).
Item 16D.Exemptions from the ListingListing Standards for Audit Committees
Not applicable.
Item 16E.Purchases of Equity Securities by the Issuer and Affiliated Purchasers
None.
Item 16F.Change in Registrant’sRegistrant’s Certifying Accountant
None.
Item 16G.Corporate GovernanceCorporate Governance
For a summary of the significant differences between our corporate governance practices and those applicable to domestic issuers under the corporate governance rules of the NYSE, see “Item 6. Directors, Senior Management and Employees — C. Board Practices.”
Item 16H.Mine Safety DisclosureMine Safety Disclosure
Not applicable.
PART III
PART III
Item 17.Financial StatementsFinancial Statements
Not Applicable.
Item 18.Financial StatementsFinancial Statements
Enel Chile
Index to the Consolidated Financial Statements
Report of Independent Registered Public Accounting Firm:
Report of EY Servicios Profesionales de Auditoría y AsesoríasAudit SpA — Enel Chile at December 31, 20162018 and December 31, 2015 | 2017 | F-1 |
Report of EY Servicios Profesionales de Auditoría y AsesoríasAudit SpA — Enel Chile S.A. — Internal Control over Financial Reporting 2016 | 2018 | F-2 |
| | |
| | |
Consolidated Financial Statements: | | |
| | |
Consolidated Statements of Financial Position at December 31, 20162018 and December 31, 20152017 | | F-3F-4
|
Consolidated Statements of Comprehensive Income for the years ended December 31, 2016, 20152018, 2017 and 20142016 | | F-5F-6
|
Consolidated Statements of Changes in Equity for the years ended December 31, 2016, 20152018, 2017 and 20142016 | | F-7F-8
|
Consolidated Statements of Cash Flows for the years ended December 31, 2016, 20152018, 2017 and 20142016 | | F-9F-10
|
Notes to the Consolidated Financial Statements | | F-10F-11
|
Ch$ | Chilean pesos | |
US$ | U.S. dollars | |
UF | The UF is a Chilean inflation-indexed, peso-denominated monetary unit that is set daily in advance based on the previous month’s inflation rate. | |
ThCh$ | Thousands of Chilean pesos | |
ThUS$ | Thousands of U.S. dollars | |
Item 19.ExhibitsExhibits
101.INS | | XBRL Instance Document |
101.SCH | | XBRL Taxonomy Extension Schema Document |
101.CAL | | XBRL Taxonomy Extension Calculation Linkbase Document |
101.DEF | | XBRL Taxonomy Extension Definition Linkbase Document |
101.LAB | | XBRL Taxonomy Extension Label Linkbase Document |
101.PRE | | XBRL Taxonomy Extension Presentation Linkbase Document |
We will furnish to the Securities and Exchange Commission, upon request, copies of any unfiled instruments that define the rights of stakeholders of Enel Chile.
SIGNATURES
SIGNATURES
The registrant hereby certifies that it meets all of the requirements for filing on Form 20-F and that it has duly caused and authorized the undersigned to sign this annual report on its behalf.
ENEL CHILE S.A.
|
| |
By:
| /s/ Nicola Cotugno
|
Name:
| Nicola Cotugno
|
Title:
| Chief Executive Officer
|
Date: April 27, 2017
Enel Chile S.A. (formerly named Enersis Chile S.A.) and its Subsidiaries
Consolidated Financial Statements as of December 31, 2016 and 2015
Index to the Audited Consolidated Financial Statements
Reports of Independent Registered Public Accounting Firms:
Date: April 30, 2019
Enel Chile S.A. and its Subsidiaries
Consolidated Financial Statements as of December 31, 2018 and 2017 and for the years ended December 31, 2018, 2017 and 2016
Table of Contents
Index to the Audited Consolidated Financial Statements
Reports of Independent Registered Public Accounting Firms:
Report of EY Audit S.p.A. — Enel Chile S.A. at December 31, 2018 and December 31, 2017 | F-1 |
Report of EY Audit S.p.A. — Enel Chile S.A. — Internal Control Over Financial Reporting 2018 | F-2 |
| |
Consolidated Financial Statements: | | |
| | |
Consolidated Statements of Financial Position at December 31, 20162018 and December 31, 20152017 | | F-3F-4
|
Consolidated Statements of Comprehensive Income by Nature for the years ended December 31, 2016, 20152018, 2017 and 20142016 | | F-5F-6
|
Consolidated Statements of Changes in Equity for the years ended December 31, 2016, 20152018, 2017 and 20142016 | | F-7F-8
|
Consolidated Statements of Cash Flows Direct for the years ended December 31, 2016, 20152018, 2017 and 20142016 | | F-9F-10
|
Notes to the Consolidated Financial Statements | F-11 |
| | F-10
|
Ch$ | Chilean pesos | Chilean pesos
|
US$ | U.S. dollars | U.S. dollars
|
UF | | The UF is a Chilean inflation-indexed, peso-denominated monetary unit that is set daily in advance based on the previous month’s inflation rate. | |
ThCh$ | | Thousands of Chilean pesos | |
ThUS$ | | Thousands of U.S. dollars | |
Table of Contents

| EY Audit SpA Avda. Presidente Riesco 5435, piso 4, Santiago | Tel: +56 (2) 2676 1000 www.eychile.cl | |
Report of Independent RegisteredRegistered Public Accounting Firm
To the Shareholders and the Board of Directors of
Enel Chile S.A.
Opinion on the Financial Statements
We have audited the accompanying consolidated statements of financial positionbalance sheets of Enel Chile S.A. (formerly Enersis Chile S.A.) and subsidiaries (the “Company”)Company) as of December 31, 20162018 and 2015, and2017, the related consolidated statements of comprehensive income, changes in shareholders’ equity and cash flows for each of the three years in the period ended December 31, 2016. 2018, and the related notes (collectively referred to as the “consolidated financial statements”). In our opinion, the consolidated financial statements present fairly, in all material respects, the financial position of the Company at December 31, 2018 and 2017, and the results of its operations and its cash flows for each of the three years in the period ended December 31, 2018, in conformity with International Financial Reporting Standards as issued by the International Accounting Standards Board.
We also have audited, in accordance with the standards of the Public Company Accounting Oversight Board (United States) (PCAOB), the Company’s internal control over financial reporting as of December 31, 2018, based on criteria established in Internal Control-Integrated Framework issued by the Committee of Sponsoring Organizations of the Treadway Commission (2013 framework), and our report dated April 29, 2019 expressed an unqualified opinion thereon.
Basis for Opinion
These consolidated financial statements are the responsibility of the Company’s management. Our responsibility is to express an opinion on thesethe Company’s financial statements based on our audits. We are a public accounting firm registered with the PCAOB and are required to be independent with respect to the Company in accordance with the U.S. federal securities laws and the applicable rules and regulations of the Securities and Exchange Commission and the PCAOB.
We conducted our audits in accordance with the standards of the Public Company Accounting Oversight Board (United States).PCAOB. Those standards require that we plan and perform the audit to obtain reasonable assurance about whether the financial statements are free of material misstatement. An audit includesmisstatement, whether due to error or fraud. Our audits included performing procedures to assess the risks of material misstatement of the financial statements, whether due to error or fraud, and performing procedures that respond to those risks. Such procedures included examining, on a test basis, evidence supportingregarding the amounts and disclosures in the financial statements. An auditOur audits also includes assessingincluded evaluating the accounting principles used and significant estimates made by management, as well as evaluating the overall presentation of the financial statement presentation.statements. We believe that our audits provide a reasonable basis for our opinion.
/s/ EY Audit SpA. | |
EY Audit SpA. | |
We have served as the Company’s auditor since 2011.
Santiago, Chile
April 29, 2019
F-1
Table of Contents
| EY Audit SpA Avda. Presidente Riesco 5435, piso 4, Santiago | Tel: +56 (2) 2676 1000 www.eychile.cl | |
Report of Independent Registered Public Accounting Firm
To the Shareholders and the Board of Directors of Enel Chile S.A.
Opinion on Internal Control over Financial Reporting
We have audited Enel Chile S.A. and subsidiaries’ internal control over financial reporting as of December 31, 2018, based on criteria established in Internal Control— Integrated Framework issued by the Committee of Sponsoring Organizations of the Treadway Commission (2013 framework) (the COSO criteria). In our opinion, the financial statements referred to above present fairly, in all material respects, the consolidated financial position of Enel Chile S.A. and subsidiaries at(the Company) maintained, in all material respects, effective internal control over financial reporting as of December 31, 20162018, based on the COSO criteria.
As indicated in the accompanying Management’s Report on Internal Control over Financial Reporting, management’s assessment of and 2015,conclusion on the effectiveness of internal control over financial reporting did not include the internal controls of Enel Green Power Chile S.A. and subsidiaries, which are consolidated since April 2018 and constituted 26.3% and 23.6% of total and net assets, respectively, as of December 31, 2018 and 7.4% and 5.2% of revenues and net income, respectively, for the consolidated resultsyear then ended. Our audit of their operations and their cash flows for eachinternal control over financial reporting of the three years inCompany also did not include an evaluation of the period ended December 31, 2016, in conformity with International Financial Reporting Standards (IFRS), as issued by the International Accounting Standards Board.internal control over financial reporting of Enel Green Power Chile S.A. and subsidiaries.
We also have audited, in accordance with the standards of the Public Company Accounting Oversight Board (United States) (PCAOB), Enel Chile S.A.’s internal control over financial reportingthe consolidated balance sheets of the Company as of December 31, 2016, based on criteria established in Internal Control-Integrated Framework issued by2018 and 2017, the Committeerelated consolidated statements of Sponsoring Organizationscomprehensive income, shareholders’ equity and cash flows for each of the Treadway Commission (2013 framework)three years in the period ended December 31, 2018, and the related notes and our report dated April 26, 201729, 2018 expressed an unqualified opinion thereon.
|
/s/ EY Audit SpA.
|
EY Audit SpA.
|
|
Santiago, Chile
|
April 26, 2017
|
Report of Independent Registered Public AccBasis for Opinionounting Firm On Internal Control Over Financial Reporting
The Board of Directors and Shareholders of Enel Chile S.A.
We have audited the internal control over financial reporting of Enel Chile S.A. (formerly Enersis Chile S.A.) and subsidiaries (the “Company”) as of December 31, 2016, based on criteria established in Internal Control—Integrated Framework issued by the Committee of Sponsoring Organizations of the Treadway Commission (2013 framework) (the COSO criteria). The Company’s management is responsible for maintaining effective internal control over financial reporting and for its assessment of the effectiveness of internal control over financial reporting included in the accompanying Management’s Annual Report on Internal Control Overover Financial Reporting. Our responsibility is to express an opinion on the company’sCompany’s internal control over financial reporting based on our audit. We are a public accounting firm registered with the PCAOB and are required to be independent with respect to the Company in accordance with the U.S. federal securities laws and the applicable rules and regulations of the Securities and Exchange Commission and the PCAOB.
We conducted our audit in accordance with the standards of the Public Company Accounting Oversight Board (United States).PCAOB. Those standards require that we plan and perform the audit to obtain reasonable assurance about whether effective internal control over financial reporting was maintained in all material respects. Our audit included obtaining an understanding of internal control over financial reporting, assessing the risk that a material weakness exists, testing and evaluating the design and operating effectiveness of internal control based on the assessed risk, and performing such other procedures as we considered necessary in the circumstances. We believe that our audit provides a reasonable basis for our opinion.
F-2
Table of Contents
Definition and Limitations of Internal Control Over Financial Reporting
A company’s internal control over financial reporting is a process designed to provide reasonable assurance regarding the reliability of financial reporting and the preparation of financial statements for external purposes in accordance with generally accepted accounting principles. A company’s internal control over financial reporting includes those policies and procedures that (1) pertain to the maintenance of records that, in reasonable detail, accurately and fairly reflect the transactions and dispositions of the assets of the company; (2) provide reasonable assurance that transactions are recorded as necessary to permit preparation of financial statements in accordance with generally accepted accounting principles, and that receipts and expenditures of the company are being made only in accordance with authorizations of management and directors of the company; and (3) provide reasonable assurance regarding prevention or timely detection of unauthorized acquisition, use, or disposition of the company’s assets that could have a material effect on the financial statements.
Because of its inherent limitations, internal control over financial reporting may not prevent or detect misstatements. Also, projections of any evaluation of effectiveness to future periods are subject to the risk that controls may become inadequate because of changes in conditions, or that the degree of compliance with the policies or procedures may deteriorate.
In our opinion, based on our audit, Enel Chile S.A. and subsidiaries maintained, in all material respects, effective internal control over financial reporting as of December 31, 2016, based on the COSO criteria.
We also have audited, in accordance with the standards of the Public Company Accounting Oversight Board (United States), the consolidated statements of financial position of Enel Chile S.A. and subsidiaries as of December 31, 2016 and 2015 and the related consolidated statements of comprehensive income, changes in shareholders’ equity, and cash flows for each of the three years in the period ended December 31, 2016, and our report dated April 26, 2017 expressed an unqualified opinion thereon.
|
/s/ EY Audit SpA. | |
EY Audit SpA. | |
| |
Santiago, Chile | |
April 26, 201729, 2019 | |
F-3
Table of Contents
ENEL CHILE S.A. (FORMERLY NAMED ENERSIS CHILE S.A.)
Consolidated Statements of Financial Position
As of December 31, 20162018 and 20152017
(In thousands of Chilean pesos)pesos — ThCh$)
| | | | | 12-31-2018 | | 12-31-2017 | |
| | 12-31-2016 | | 12-31-2015 | | Note | | ThCh$ | | ThCh$ | |
ASSETS | | Note | | ThCh$ | | ThCh$ | | | | | | | |
| | | | |
CURRENT ASSETS | | | | | | | | | | |
Cash and cash equivalents | | 6 | | 245,999,192 | | 144,261,845 | | 8 | | 245,171,924 | | 419,456,026 | |
Other current financial assets | | 7 | | 584,244 | | 16,313,194 | | 9 | | 40,303,173 | | 20,627,062 | |
Other current non-financial assets | | | | 15,831,486 | | 3,984,943 | | 10.a | | 22,406,088 | | 18,785,891 | |
Trade and other current receivables | | 8 | | 445,071,856 | | 596,364,467 | | 11 | | 478,170,067 | | 406,968,537 | |
Current accounts receivable from related parties | | 9 | | 52,858,384 | | 25,144,559 | | 12 | | 54,171,060 | | 71,856,046 | |
Inventories | | 10 | | 37,539,596 | | 42,616,615 | | 13 | | 56,961,643 | | 39,686,942 | |
Current tax assets | | 11 | | 55,649,171 | | 20,306,212 | | 14 | | 99,763,817 | | 77,756,048 | |
Total current assets other than assets or disposal groups held for sale | | | | 853,533,929 | | 848,991,835 | |
Non-current assets or disposal groups held for sale | | 5 | | 12,993,008 | | - | |
TOTAL CURRENT ASSETS | | | | 866,526,937 | | 848,991,835 | | | | 996,947,772 | | 1,055,136,552 | |
| | | | | | | | | | | | | |
NON-CURRENT ASSETS | | | | | | | | | | | |
Other non-current financial assets | | 7 | | 28,827,542 | | 21,750,452 | | 9 | | 7,269,669 | | 33,418,204 | |
Other non-current non-financial assets | | | | 13,336,152 | | 4,769,885 | | 10.a | | 44,608,012 | | 13,813,139 | |
Trade and other non-current receivables | | 8 | | 33,500,105 | | 14,392,223 | | 11 | | 60,527,843 | | 36,182,399 | |
Investments accounted for using the equity method | | 12 | | 18,738,198 | | 45,716,371 | | 15 | | 12,873,531 | | 16,912,454 | |
Intangible assets other than goodwill | | 13 | | 44,470,750 | | 42,879,326 | | 16 | | 115,372,393 | | 55,170,904 | |
Goodwill | | 14 | | 887,257,655 | | 887,257,655 | | 17 | | 915,044,725 | | 887,257,655 | |
Property, plant and equipment | | 15 | | 3,476,128,634 | | 3,429,167,797 | | 18 | | 5,308,647,633 | | 3,585,687,137 | |
Investment property | | 16 | | 8,128,522 | | 8,150,987 | | 19 | | 7,557,356 | | 8,356,772 | |
Deferred tax assets | | 17 | | 21,796,517 | | 22,392,339 | | 20.b | | 19,171,230 | | 2,837,792 | |
TOTAL NON-CURRENT ASSETS | | | | 4,532,184,075 | | 4,476,477,035 | | | | 6,491,072,392 | | 4,639,636,456 | |
TOTAL ASSETS | | | | 5,398,711,012 | | 5,325,468,870 | | | | 7,488,020,164 | | 5,694,773,008 | |
The accompanying notes are an integral part of these consolidated financial statementsstatements.
F-4
Table of Contents
ENEL CHILE S.A. (FORMERLY NAMED ENERSIS CHILE S.A.)
Consolidated Statements of Financial Position
As of December 31, 20162018 and 20152017
(In thousands of Chilean pesos)pesos — ThCh$)
| | | | | 12-31-2018 | | 12-31-2017 | |
| | | | 12-31-2016 | | 12-31-2015 | | Note | | ThCh$ | | ThCh$ | |
LIABILITIES AND EQUITY | | Note | | ThCh$ | | ThCh$ | | | | | | | |
| | | | | |
CURRENT LIABILITIES | | | | | | | | | | |
Other current financial liabilities | | 18 | | 25,696,166 | | 27,921,725 | | 21 | | 410,665,815 | | 18,815,448 | |
Trade and other current payables | | 21 | | 561,505,283 | | 554,915,971 | | 24 | | 554,286,324 | | 555,978,518 | |
Current accounts payable to related parties | | 9 | | 90,428,929 | | 233,154,916 | | 12 | | 157,936,325 | | 119,612,972 | |
Other current provisions | | 22 | | 6,493,532 | | 16,329,195 | | 25 | | 5,588,786 | | 5,636,171 | |
Current tax liabilities | | 11 | | 61,599,415 | | 15,119,789 | | 14 | | 17,677,920 | | 67,027,507 | |
Other current non-financial liabilities | | | | 11,523,322 | | 6,120,658 | | 10.b | | 71,308,982 | | 49,746,030 | |
Total current liabilities other than those associated with disposal groups held for sale | | | | 757,246,647 | | 853,562,254 | |
Liabilities associated with disposal groups held for sale | | | | - | | - | |
TOTAL CURRENT LIABILITIES | | | | 757,246,647 | | 853,562,254 | | | | 1,217,464,152 | | 816,816,646 | |
| | | | | | | | | | | | | |
NON-CURRENT LIABILITIES | | | | | | | | | | | |
Other non-current financial liabilities | | 18 | | 854,016,751 | | 917,197,790 | | 21 | | 1,705,833,503 | | 781,978,145 | |
Trade and other non-current payables | | 21 | | 1,483,113 | | 6,034,216 | | 24 | | 2,584,180 | | 659,824 | |
Current accounts payable to related parties | | 9 | | 251,527 | | 97,186 | |
Non-Current accounts payable to related parties | | | 12 | | 447,193,802 | | 318,518 | |
Other long-term provisions | | 22 | | 63,106,908 | | 56,116,140 | | 25 | | 105,871,375 | | 78,422,837 | |
Deferred tax liabilities | | 17 | | 199,364,794 | | 235,101,356 | | 20.b | | 278,080,054 | | 172,223,681 | |
Non-current provisions for employee benefits | | 23 | | 59,934,127 | | 55,023,456 | | 26 | | 56,602,664 | | 57,081,924 | |
Other non-current non-financial liabilities | | | | 313,503 | | 435,689 | | 10.b | | 226,653 | | 309,776 | |
TOTAL NON-CURRENT LIABILITIES | | | | 1,178,470,723 | | 1,270,005,833 | | | | 2,596,392,231 | | 1,090,994,705 | |
TOTAL LIABILITIES | | | | 1,935,717,370 | | 2,123,568,087 | | | | 3,813,856,383 | | 1,907,811,351 | |
| | | | | | | | | | | | | |
EQUITY | | | | | | | | | | | |
Allocated capital | | | | 2,229,108,975 | | 2,229,108,975 | | 27.1 | | 3,954,491,479 | | 2,229,108,975 | |
Retained earnings | | | | 1,569,375,291 | | 1,322,162,479 | | | | 1,914,797,613 | | 1,751,605,583 | |
Treasury shares | | | 27.1 | | (72,388,009 | ) | — | |
Other reserves | | 24.5 | | (1,035,092,978) | | (958,589,952) | | 27.5 | | (2,375,672,564 | ) | (997,330,548 | ) |
Equity attributable to Enel Chile | | | | 2,763,391,288 | | 2,592,681,502 | | | | 3,421,228,519 | | 2,983,384,010 | |
Non-controlling interests | | 24.6 | | 699,602,354 | | 609,219,281 | | 27.6 | | 252,935,262 | | 803,577,647 | |
TOTAL EQUITY | | | | 3,462,993,642 | | 3,201,900,783 | | | | 3,674,163,781 | | 3,786,961,657 | |
TOTAL LIABILITIES AND EQUITY | | | | 5,398,711,012 | | 5,325,468,870 | | | | 7,488,020,164 | | 5,694,773,008 | |
The accompanying notes are an integral part of these consolidated financial statementsstatements.
F-5
Table of Contents
ENEL CHILE S.A. (FORMERLY NAMED ENERSIS CHILE S.A.)
Consolidated Statements of Comprehensive Income, by Nature
For the years ended December 31, 2016, 20152018, 2017 and 20142016
(In thousands of Chilean pesos)pesos — ThCh$)
CONSOLIDATED STATEMENTS OF
COMPREHENSIVE INCOME | | | | 2018 | | 2017 | | 2016 | |
Profit (loss) | | Note | | ThCh$ | | ThCh$ | | ThCh$ | |
Revenues | | 28 | | 2,410,360,459 | | 2,484,101,582 | | 2,515,843,880 | |
Other operating income | | 28 | | 46,800,967 | | 38,876,700 | | 25,722,939 | |
Revenues and other operating income | | | | 2,457,161,426 | | 2,522,978,282 | | 2,541,566,819 | |
Raw materials and consumables used | | 29 | | (1,292,177,116 | ) | (1,514,786,921 | ) | (1,497,419,580 | ) |
Contribution Margin | | | | 1,164,984,310 | | 1,008,191,361 | | 1,044,147,239 | |
| | | | | | | | | |
Other work performed by the entity and capitalized | | 18.b.2 | | 16,710,963 | | 14,388,987 | | 16,096,852 | |
Employee benefits expense | | 30 | | (123,130,334 | ) | (121,503,777 | ) | (124,098,428 | ) |
Depreciation and amortization expense | | 31 | | (215,187,300 | ) | (152,684,106 | ) | (161,660,610 | ) |
Impairment loss recognized in the period’s profit or loss | | 31 | | (5,562,897 | ) | (7,937,817 | ) | (35,926,710 | ) |
Other expenses | | 32 | | (167,210,021 | ) | (161,824,074 | ) | (170,769,137 | ) |
Operating Income | | | | 670,604,721 | | 578,630,574 | | 567,789,206 | |
| | | | | | | | | |
Other gains | | 33 | | 3,410,379 | | 113,241,196 | | 121,490,062 | |
Financial income | | 34 | | 19,934,468 | | 21,662,688 | | 23,105,901 | |
Financial costs | | 34 | | (122,184,189 | ) | (53,510,882 | ) | (58,199,382 | ) |
Share of profit (loss) of associates and joint ventures accounted for using the equity method | | 15 | | 3,190,240 | | (2,696,904 | ) | 7,878,200 | |
Foreign currency exchange differences | | 34 | | (7,807,197 | ) | 8,516,874 | | 12,978,471 | |
Gains or loss from indexed assets and liabilities, net | | 7 - 34 | | (818,146 | ) | 916,666 | | 1,631,840 | |
Income before taxes | | | | 566,330,276 | | 666,760,212 | | 676,674,298 | |
Income tax expense | | 20.a | | (153,482,519 | ) | (143,342,301 | ) | (111,403,182 | ) |
NET INCOME | | | | 412,847,757 | | 523,417,911 | | 565,271,116 | |
| | | | | | | | | |
Net income attributable to: | | | | | | | | | |
Equity owners of Enel Chile | | | | 361,709,937 | | 349,382,642 | | 384,159,865 | |
Non-controlling interests | | 27.6 | | 51,137,820 | | 174,035,269 | | 181,111,251 | |
NET INCOME | | | | 412,847,757 | | 523,417,911 | | 565,271,116 | |
| | | | | | | | | |
Basic earnings per share | | | | | | | | | |
Basic earnings per share | | Ch$/Share | | 5.66 | | 7.12 | | 7.83 | |
Weighted average number of shares of common stock | | | | 63,913,359,484 | | 49,092,772,762 | | 49,092,772,762 | |
| | | | | | | | | |
Diluted earnings per share | | | | | | | | | |
Diluted earnings per share | | Ch$/Share | | 5.66 | | 7.12 | | 7.83 | |
Weighted average number of shares of common stock | | | | 63,913,359,484 | | 49,092,772,762 | | 49,092,772,762 | |
(*) Includes Argentina’s hyperinflationary effect (see Note 7).
The accompanying notes are an integral part of these consolidated financial statements.
F-6
| | | For the years ended December 31, |
CONSOLIDATED STATEMENTS OF COMPREHENSIVE INCOME | | | 2016 | | 2015 | | 2014 |
Profit (loss) | Note | | ThCh$ | | ThCh$ | | ThCh$ |
| | | | | | | |
Revenues | 25 | | 2,515,843,880 | | 2,384,293,189 | | 2,014,863,898 |
Other operating income | 25 | | 25,722,939 | | 14,735,951 | | 34,201,387 |
Revenues and other operating income | | | 2,541,566,819 | | 2,399,029,140 | | 2,049,065,285 |
Raw materials and consumables used | 26 | | (1,497,419,580) | | (1,481,985,559) | | (1,309,402,283) |
Contribution Margin | | | 1,044,147,239 | | 917,043,581 | | 739,663,002 |
| | | | | | | |
Other work performed by the entity and capitalized | 15.b.2 | | 16,096,852 | | 21,004,053 | | 21,505,568 |
Employee benefits expense | 27 | | (124,098,428) | | (136,554,721) | | (126,341,363) |
Depreciation and amortization expense | 28 | | (161,660,610) | | (153,201,662) | | (128,437,154) |
Impairment loss recognized in the period’s profit or loss | 28 | | (35,926,710) | | 3,054,903 | | (13,185,420) |
Other expenses | 29 | | (170,769,137) | | (125,857,397) | | (110,454,215) |
Operating Income | | | 567,789,206 | | 525,488,757 | | 382,750,418 |
| | | | | | | |
Other gains | 30 | | 121,490,062 | | 20,055,745 | | 70,893,263 |
Financial income | 31 | | 23,105,901 | | 15,270,169 | | 14,762,515 |
Financial costs | 31 | | (58,199,382) | | (66,700,698) | | (75,626,489) |
Share of profit (loss) of associates and joint ventures accounted for using the equity method | 12 | | 7,878,200 | | 8,905,045 | | (54,352,582) |
Foreign currency exchange differences | 31 | | 12,978,471 | | (51,277,332) | | (21,444,198) |
Gains from indexed assets and liabilities | 31 | | 1,631,840 | | 4,839,077 | | 15,263,623 |
Income before taxes | | | 676,674,298 | | 456,580,763 | | 332,246,550 |
Income tax expense, continuing operations | 17 | | (111,403,182) | | (109,612,599) | | (132,687,133) |
NET INCOME | | | 565,271,116 | | 346,968,164 | | 199,559,417 |
| | | | | | | |
Net income attributable to: | | | | | | | |
Equity owners of Enel Chile | | | 384,159,865 | | 251,838,410 | | 162,459,039 |
Non-controlling interests | 24.6 | | 181,111,251 | | 95,129,754 | | 37,100,378 |
NET INCOME | | | 565,271,116 | | 346,968,164 | | 199,559,417 |
| | | | | | | |
Basic and diluted earnings per share | | | | | | | |
Basic and diluted earnings per share | Ch$/Share | | 7.83 | | 5.13 | | 3.31 |
Weighted average number of shares of common stock | Thousands | | 49,092,772.76 | | 49,092,772.76 | | 49,092,772.76 |
Table of Contents
ENEL CHILE S.A.
Consolidated Statements of Comprehensive Income, by Nature (continued)
For the years ended December 31, 2018, 2017 and 2016
(In thousands of Chilean pesos — ThCh$)
CONSOLIDATED STATEMENTS OF COMPREHENSIVE INCOME | | | | 2018 | | 2017 | | 2016 | |
Other comprehensive income (loss) | | Note | | ThCh$ | | ThCh$ | | ThCh$ | |
Net Income | | | | 412,847,757 | | 523,417,911 | | 565,271,116 | |
Components of other comprehensive income that will not be reclassified subsequently to profit or loss, before taxes | | | | | | | | | |
Remeasurement losses from defined benefit plans | | 26.2.b | | 37,881 | | 1,716,875 | | (6,618,514 | ) |
Other comprehensive loss that will not be reclassified subsequently to profit or loss | | | | 37,881 | | 1,716,875 | | (6,618,514 | ) |
Components of other comprehensive income (loss) that will be reclassified subsequently to profit or loss, before taxes | | | | | | | | | |
Foreign currency translation gains | | | | 107,492,316 | | (3,686,549 | ) | (3,532,410 | ) |
Gains (losses) from available-for-sale financial assets | | | | (411 | ) | 1,840 | | (6,740 | ) |
Share of other comprehensive income (loss) from associates and joint ventures accounted for using the equity method | | 15.a | | — | | (1,490 | ) | (11,691,509 | ) |
Gains (losses) from cash flow hedges | | | | (244,271,689 | ) | 73,333,487 | | 68,850,275 | |
Adjustments from reclassification of cash flow hedges, transferred to profit or loss | | | | 22,364,834 | | 24,225,474 | | 20,218,082 | |
Other comprehensive income (loss) that will be reclassified subsequently to profit or loss | | | | (114,414,950 | ) | 93,872,762 | | 73,837,698 | |
Other comprehensive income (loss), before taxes | | | | (114,377,069 | ) | 95,589,637 | | 67,219,184 | |
Income tax related to components of other comprehensive income that will not be reclassified subsequently to profit or loss | | | | | | | | | |
Income tax related to defined benefit plans | | | | (10,228 | ) | (463,556 | ) | 1,786,999 | |
Income tax related to components of other comprehensive income that will not be reclassified subsequently to profit or loss | | | | (10,228 | ) | (463,556 | ) | 1,786,999 | |
Income tax related to components of other comprehensive income that will be reclassified subsequently to profit or loss | | | | | | | | | |
Income tax related to cash flow hedge | | | | 60,650,786 | | (25,701,599 | ) | (21,116,232 | ) |
Income tax related to available-for-sale financial assets | | | | 111 | | (497 | ) | 1,820 | |
Income tax related to components of other comprehensive income that will be reclassified subsequently to profit or loss | | | | 60,650,897 | | (25,702,096 | ) | (21,114,412 | ) |
| | | | | | | | | |
Total Other Comprehensive Income (Loss) | | | | (53,736,400 | ) | 69,423,985 | | 47,891,771 | |
TOTAL COMPREHENSIVE INCOME | | | | 359,111,357 | | 592,841,896 | | 613,162,887 | |
| | | | | | | | | |
Comprehensive income attributable to: | | | | | | | | | |
Equity owners of Enel Chile | | | | 297,410,542 | | 391,680,966 | | 411,551,269 | |
Non-controlling interests | | | | 61,700,815 | | 201,160,930 | | 201,611,618 | |
TOTAL COMPREHENSIVE INCOME | | | | 359,111,357 | | 592,841,896 | | 613,162,887 | |
The accompanying notes are an integral part of these consolidated financial statementsstatements.
F-7
Table of Contents
ENEL CHILE S.A. (FORMERLY NAMED ENERSIS CHILE S.A.)
Consolidated Statements of Comprehensive Income, by Nature (continued)Changes in Equity
For the years ended December 31, 2016, 20152018, 2017 and 20142016
(In thousands of Chilean pesos)pesos — ThCh$)
| | | | | | Changes in Other Reserves | | | | | | | | | |
| | | | | | | | | | | | | | Amounts recognized | | | | | | | | | | | | | |
| | | | | | | | | | | | | | in other comprehensive | | | | | | | | | | | | | |
| | | | | | | | | | | | Reserve for Gains | | income and | | | | | | | | | | | | | |
| | | | | | Reserve for | | | | | | and Losses on | | accumulated in equity | | | | | | | | | | | | | |
| | | | | | Exchange | | | | Reserve for | | Remeasuring | | related to non-current | | | | | | | | | | Non- | | | |
| | Allocated | | | | Differences in | | | | Gains and Losses | | Available-for- | | assets or groups of assets | | Other | | | | | | Equity | | controlling | | | |
| | Capital | | Treasury | | Translation | | Reserve for Cash | | for Defined | | Sale Financial | | for disposal classified as | | Miscellaneous | | Other Reserves | | Retained | | Attributable to | | Interests | | | |
Statements of | | (1) | | Shares | | (2) | | Flow Hedges | | Benefit Plans | | Assets | | held for sale | | Reserves | | (3) | | Earnings | | Enel Chile | | (4) | | Total Equity | |
Changes in Equity | | ThCh$ | | ThCh$ | | ThCh$ | | ThCh$ | | ThCh$ | | ThCh$ | | ThCh$ | | ThCh$ | | ThCh$ | | ThCh$ | | ThCh$ | | ThCh$ | | ThCh$ | |
Equity at beginning of period 1-1-2018 | | 2,229,108,975 | | | | 6,976,383 | | (32,849,736 | ) | — | | 11,284 | | — | | (971,468,479 | ) | (997,330,548 | ) | 1,751,605,583 | | 2,983,384,010 | | 803,577,647 | | 3,786,961,657 | |
Increase (decrease) through changes in accounting policies (5) | | | | | | | | | | | | | | | | | | | | (2,702,470 | ) | (2,702,470 | ) | (44,691 | ) | (2,747,161 | ) |
Equity at beginning of period 1-1-2018 as restated | | 2,229,108,975 | | — | | 6,976,383 | | (32,849,736 | ) | — | | 11,284 | | — | | (971,468,479 | ) | (997,330,548 | ) | 1,748,903,113 | | 2,980,681,540 | | 803,532,956 | | 3,784,214,496 | |
Changes in equity | | | | | | | | | | | | | | | | | | | | | | | | | | | |
Comprehensive income | | — | | | | — | | — | | — | | — | | — | | — | | — | | — | | — | | — | | — | |
Profit (loss) | | — | | | | — | | — | | — | | — | | — | | — | | — | | 361,709,937 | | 361,709,937 | | 51,137,820 | | 412,847,757 | |
Other comprehensive income | | — | | | | 94,678,453 | | (159,020,809 | ) | 43,204 | | (243 | ) | — | | — | | (64,299,395 | ) | — | | (64,299,395 | ) | 10,562,995 | | (53,736,400 | ) |
Comprehensive income | | — | | | | — | | — | | — | | — | | — | | — | | — | | — | | 297,410,542 | | 61,700,815 | | 359,111,357 | |
Issuance of equity | | 1,725,382,504 | | | | | | | | | | | | | | | | | | | | 1,725,382,504 | | — | | 1,725,382,504 | |
Dividends | | — | | | | — | | — | | — | | — | | — | | | | — | | (195,858,641 | ) | (195,858,641 | ) | (19,603,211 | ) | (215,461,852 | ) |
Increase (decrease) from other changes | | — | | | | — | | — | | (43,204 | ) | — | | — | | (403,562,193 | ) | (403,605,397 | ) | 43,204 | | (403,562,193 | ) | 92,644,186 | | (310,918,007 | ) |
Increase (decrease) due to portfolio transactions | | | | (72,388,009 | ) | | | | | | | | | | | | | | | | | (72,388,009 | ) | — | | (72,388,009 | ) |
Increase (decrease) due to changes in subsidiary interests that do not lead to loss of control | | | | | | | | | | | | | | | | (910,437,224 | ) | (910,437,224 | ) | | | (910,437,224 | ) | (685,339,484 | ) | (1,595,776,708 | ) |
Total changes in equity | | 1,725,382,504 | | (72,388,009 | ) | 94,678,453 | | (159,020,809 | ) | — | | (243 | ) | — | | (1,313,999,417 | ) | (1,378,342,016 | ) | 165,894,500 | | 440,546,979 | | (550,597,694 | ) | (110,050,715 | ) |
Equity at end of period 12-31-2018 | | 3,954,491,479 | | (72,388,009 | ) | 101,654,836 | | (191,870,545 | ) | — | | 11,041 | | — | | (2,285,467,896 | ) | (2,375,672,564 | ) | 1,914,797,613 | | 3,421,228,519 | | 252,935,262 | | 3,674,163,781 | |
F-8
Table of Contents
| | | | Changes in Other Reserves | | | | | | | | | |
| | | | | | | | | | | | Amounts recognized | | | | | | | | | | | | | |
| | | | | | | | | | | | in other comprehensive | | | | | | | | | | | | | |
| | | | | | | | | | Reserve for Gains | | income and | | | | | | | | | | | | | |
| | | | Reserve for | | | | | | and Losses on | | accumulated in equity | | | | | | | | | | | | | |
| | | | Exchange | | | | Reserve for | | Remeasuring | | related to non-current | | | | | | | | | | | | | |
| | Allocated | | Differences in | | | | Gains and Losses | | Available-for- | | assets or groups of assets | | Other | | | | | | Equity | | Non-controlling | | | |
| | Capital | | Translation | | Reserve for Cash | | for Defined | | Sale Financial | | for disposal classified as | | Miscellaneous | | Other Reserves | | Retained | | Attributable to | | Interests | | | |
| | (1) | | (2) | | Flow Hedges | | Benefit Plans | | Assets | | held for sale | | Reserves | | (3) | | Earnings | | Enel Chile | | (4) | | Total Equity | |
Statements of Changes in Equity | | ThCh$ | | ThCh$ | | ThCh$ | | ThCh$ | | ThCh$ | | ThCh$ | | ThCh$ | | ThCh$ | | ThCh$ | | ThCh$ | | ThCh$ | | ThCh$ | |
Equity at beginning of period 1-1-2017 | | 2,229,108,975 | | 9,222,933 | | (76,218,470 | ) | — | | 9,955 | | 1,632,724 | | (969,740,120 | ) | (1,035,092,978 | ) | 1,569,375,291 | | 2,763,391,288 | | 699,602,354 | | 3,462,993,642 | |
Changes in equity | | | | | | | | | | | | | | | | | | | | | | | | | |
Comprehensive income | | — | | — | | — | | — | | — | | — | | — | | — | | — | | — | | — | | — | |
Profit (loss) | | — | | — | | — | | — | | — | | — | | — | | — | | 349,382,642 | | 349,382,642 | | 174,035,269 | | 523,417,911 | |
Other comprehensive income | | — | | (2,246,550 | ) | 43,368,734 | | 1,174,811 | | 1,329 | | — | | — | | 42,298,324 | | — | | 42,298,324 | | 27,125,661 | | 69,423,985 | |
Comprehensive income | | — | | — | | — | | — | | — | | — | | — | | — | | — | | 391,680,966 | | 201,160,930 | | 592,841,896 | |
Dividends | | — | | — | | — | | — | | — | | — | | | | — | | (168,327,161 | ) | (168,327,161 | ) | (94,944,701 | ) | (263,271,862 | ) |
Increase (decrease) from other changes | | — | | — | | — | | (1,174,811 | ) | — | | (1,632,724 | ) | (1,728,359 | ) | (4,535,894 | ) | 1,174,811 | | (3,361,083 | ) | (2,240,936 | ) | (5,602,019 | ) |
Total changes in equity | | — | | (2,246,550 | ) | 43,368,734 | | — | | 1,329 | | (1,632,724 | ) | (1,728,359 | ) | 37,762,430 | | 182,230,292 | | 219,992,722 | | 103,975,293 | | 323,968,015 | |
Equity at end of period 12-31-2017 | | 2,229,108,975 | | 6,976,383 | | (32,849,736 | ) | — | | 11,284 | | — | | (971,468,479 | ) | (997,330,548 | ) | 1,751,605,583 | | 2,983,384,010 | | 803,577,647 | | 3,786,961,657 | |
| | | | | | Changes in Other Reserves | | | | | | | | |
| | | | | | | | | | | | Amounts recognized | | | | | | | | | | | | | |
| | | | | | | | | | | | in other comprehensive | | | | | | | | | | | | | |
| | | | | | | | | | Reserve for Gains | | income and | | | | | | | | | | | | | |
| | | | Reserve for | | | | | | and Losses on | | accumulated in equity | | | | | | | | | | | | | |
| | | | Exchange | | | | Reserve for | | Remeasuring | | related to non-current | | | | | | | | | | | | | |
| | Allocated | | Differences in | | | | Gains and Losses | | Available-for- | | assets or groups of assets | | Other | | | | | | Equity | | Non-controlling | | | |
| | Capital | | Translation | | Reserve for Cash | | for Defined | | Sale Financial | | for disposal classified as | | Miscellaneous | | Other Reserves | | Retained | | Attributable to | | Interests | | | |
Statements of Changes in | | (1) | | (2) | | Flow Hedges | | Benefit Plans | | Assets | | held for sale | | Reserves | | (3) | | Earnings | | Enel Chile | | (4) | | Total Equity | |
Equity | | ThCh$ | | ThCh$ | | ThCh$ | | ThCh$ | | ThCh$ | | ThCh$ | | ThCh$ | | ThCh$ | | ThCh$ | | ThCh$ | | ThCh$ | | ThCh$ | |
Equity at beginning of period 1-1-2016 | | 2,229,108,975 | | 12,423,692 | | (121,503,052 | ) | — | | 14,835 | | — | | (849,525,427 | ) | (958,589,952 | ) | 1,322,162,479 | | 2,592,681,502 | | 609,219,281 | | 3,201,900,783 | |
Changes in equity | | | | | | | | | | | | | | | | | | | | | | | | | |
Comprehensive income | | | | | | | | | | | | | | | | | | | | | | | | | |
Profit (loss) | | — | | — | | — | | — | | — | | — | | — | | — | | 384,159,865 | | 384,159,865 | | 181,111,251 | | 565,271,116 | |
Other comprehensive income | | — | | (2,137,753 | ) | 40,843,826 | | (4,297,479 | ) | (4,880 | ) | — | | (7,012,310 | ) | 27,391,404 | | — | | 27,391,404 | | 20,500,367 | | 47,891,771 | |
Comprehensive income | | — | | — | | — | | — | | — | | — | | — | | — | | — | | 411,551,269 | | 201,611,618 | | 613,162,887 | |
Dividends | | — | | — | | — | | — | | — | | — | | | | — | | (145,636,016 | ) | (145,636,016 | ) | (81,524,150 | ) | (227,160,166 | ) |
Increase (decrease) from other changes | | — | | (1,063,006 | ) | 4,440,756 | | 4,297,479 | | — | | 1,632,724 | | (113,202,383 | ) | (103,894,430 | ) | 8,688,963 | | (95,205,467 | ) | (29,704,395 | ) | (124,909,862 | ) |
Total changes in equity | | — | | (3,200,759 | ) | 45,284,582 | | — | | (4,880 | ) | 1,632,724 | | (120,214,693 | ) | (76,503,026 | ) | 247,212,812 | | 170,709,786 | | 90,383,073 | | 261,092,859 | |
Equity at end of period 12-31-2016 | | 2,229,108,975 | | 9,222,933 | | (76,218,470 | ) | — | | 9,955 | | 1,632,724 | | (969,740,120 | ) | (1,035,092,978 | ) | 1,569,375,291 | | 2,763,391,288 | | 699,602,354 | | 3,462,993,642 | |
| | | | For the years ended December 31, |
CONSOLIDATED STATEMENTS OF COMPREHENSIVE INCOME | | | | 2016 | | 2015 | | 2014 |
Other comprehensive income (loss) | | Note | | ThCh$ | | ThCh$ | | ThCh$ |
| | | | | | | | |
Net Income | | | | 565,271,116 | | 346,968,164 | | 199,559,417 |
Components of other comprehensive income that will not be reclassified subsequently to profit or loss, before taxes | | | | | | | | |
Remeasurement losses from defined benefit plans | | 23.2.b | | (6,618,514) | | (5,645,532) | | (12,692,856) |
Other comprehensive loss that will not be reclassified subsequently to profit or loss | | | | (6,618,514) | | (5,645,532) | | (12,692,856) |
Components of other comprehensive income (loss) that will be reclassified subsequently to profit or loss, before taxes | | | | | | | | |
Foreign currency translation gains | | | | (3,532,410) | | 162,373 | | 12,473,950 |
Gains (losses) from available-for-sale financial assets | | | | (6,740) | | 1,077 | | 1,849 |
Share of other comprehensive income (loss) from associates and joint ventures accounted for using the equity method | | 12.1 | | (11,691,509) | | (577,862) | | 13,476,871 |
Gains (losses) from cash flow hedges | | | | 68,850,275 | | (137,733,945) | | (122,590,463) |
Adjustments from reclassification of cash flow hedges, transferred to profit or loss | | | | 20,218,082 | | 15,140,369 | | (8,765,418) |
Other comprehensive income (loss) that will be reclassified subsequently to profit or loss | | | | 73,837,698 | | (123,007,988) | | (105,403,211) |
Other comprehensive income (loss), before taxes | | | | 67,219,184 | | (128,653,520) | | (118,096,067) |
Income tax related to components of other comprehensive income that will not be reclassified subsequently to profit or loss | | | | | | | | |
Income tax related to defined benefit plans | | | | 1,786,999 | | 1,325,242 | | 4,527,209 |
Income tax related to components of other comprehensive income that will not be reclassified subsequently to profit or loss | | | | 1,786,999 | | 1,325,242 | | 4,527,209 |
Income tax related to components of other comprehensive income that will be reclassified subsequently to profit or loss | | | | | | | | |
Income tax related to cash flow hedge | | | | (21,116,232) | | 31,868,299 | | 31,585,153 |
Income tax related to available-for-sale financial assets | | | | 1,820 | | (290) | | (1,462) |
Income tax related to components of other comprehensive income that will be reclassified subsequently to profit or loss | | | | (21,114,412) | | 31,868,009 | | 31,583,691 |
| | | | | | | | |
Total Other Comprehensive Income (Loss) | | | | 47,891,771 | | (95,460,269) | | (81,985,167) |
TOTAL COMPREHENSIVE INCOME | | | | 613,162,887 | | 251,507,895 | | 117,574,250 |
| | | | | | | | |
Comprehensive income attributable to: | | | | | | | | |
Equity owners of Enel Chile | | | | 411,551,269 | | 193,709,073 | | 110,466,754 |
Non-controlling interests | | | | 201,611,618 | | 57,798,822 | | 7,107,496 |
TOTAL COMPREHENSIVE INCOME | | | | 613,162,887 | | 251,507,895 | | 117,574,250 |
(1) See Note 27.1
(2) See Note 27.3
(3) See Note 27.5
(4) See Note 27.6
(5) Considers a charge in results for ThCh$3,411,631 due to application of IFRS 9 and a credit to retained earnings for ThCh$664,470 due to application of IAS 29. See notes 22.2 — Impairment — and 2.7.4, respectively.
The accompanying notes are an integral part of these consolidated financial statements
F-9
Table of Contents
ENEL CHILE S.A. (FORMERLY NAMED ENERSIS CHILE S.A.)
Consolidated Statements of Changes in EquityCash Flows, Direct
For the years ended December 31, 2016, 20152018, 2017 and 2014
(In thousands of Chilean pesos)2016
| | | | | | | | | | | | | | | | | | | | | | | | |
Statements of Changes in Equity | | | | Changes in Other Reserves | | | | | | | | |
| Allocated Capital | | Reserve for Exchange Differences in Translation | | Reserve for Cash Flow Hedges | | Reserve for Gains and Losses for Defined Benefit Plans | | Reserve for Gains and Losses on Remeasuring Available-for-Sale Financial Assets | | Amounts recognized in other comprehensive income and accumulated in equity related to non-current assets or groups of assets for disposal classified as held for sale | | Other Miscellaneous Reserves | | Other Reserves | | Retained Earnings | | Equity Attributable to Enersis Chile | | Non-controlling Interests | | Total Equity |
| | | | | | | | | | | |
| | | | | | | | | | | |
| | | | | | | | | | | |
| | | | | | | | | | | |
| ThCh$ | | ThCh$ | | ThCh$ | | ThCh$ | | ThCh$ | | ThCh$ | | ThCh$ | | ThCh$ | | ThCh$ | | ThCh$ | | ThCh$ | | ThCh$ |
Equity at beginning of period 1/1/2016 | | 2,229,108,975 | | 12,423,692 | | (121,503,052) | | - | | 14,835 | | - | | (849,525,427) | | (958,589,952) | | 1,322,162,479 | | 2,592,681,502 | | 609,219,281 | | 3,201,900,783 |
Changes in equity | | | | | | | | | | | | | | | | | | | | | | | | |
Comprehensive income | | | | | | | | | | | | | | | | | | | | | | | | |
Profit (loss) | | - | | - | | - | | - | | - | | - | | - | | - | | 384,159,865 | | 384,159,865 | | 181,111,251 | | 565,271,116 |
Other comprehensive income | | - | | (2,137,753) | | 40,843,826 | | (4,297,479) | | (4,880) | | - | | (7,012,310) | | 27,391,404 | | - | | 27,391,404 | | 20,500,367 | | 47,891,771 |
Comprehensive income | | | | | | | | | | | | | | | | | | | | 411,551,269 | | 201,611,618 | | 613,162,887 |
Dividends | | - | | - | | - | | - | | - | | | | - | | - | | (145,636,016) | | (145,636,016) | | (81,524,150) | | (227,160,166) |
Increase (decrease) from other changes | | - | | (1,063,006) | | 4,440,756 | | 4,297,479 | | - | | 1,632,724 | | (113,202,383) | | (103,894,430) | | 8,688,963 | | (95,205,467) | | (29,704,395) | | (124,909,862) |
Total changes in equity | | - | | (3,200,759) | | 45,284,582 | | - | | (4,880) | | | | (120,214,693) | | (76,503,026) | | 247,212,812 | | 170,709,786 | | 90,383,073 | | 261,092,859 |
| | | | | | | | | | | | | | | | | | | | | | | | |
Equity at end of period 12/31/2016 | | 2,229,108,975 | | 9,222,933 | | (76,218,470) | | - | | 9,955 | | 1,632,724 | | (969,740,120) | | (1,035,092,978) | | 1,569,375,291 | | 2,763,391,288 | | 699,602,354 | | 3,462,993,642 |
| | | | | | | | | | | | | | | | | | | | | | | | |
| | | | | | | | | | | | | | | | | | | | | | | | |
Statements of Changes in Equity | | | | Changes in Other Reserves | | | | | | | | |
| Allocated Capital | �� | Reserve for Exchange Differences in Translation | | Reserve for Cash Flow Hedges | | Reserve for Gains and Losses for Defined Benefit Plans | | Reserve for Gains and Losses on Remeasuring Available-for-Sale Financial Assets | | Amounts recognized in other comprehensive income and accumulated in equity related to non-current assets or groups of assets for disposal classified as held for sale | | Other Miscellaneous Reserves | | Other Reserves | | Retained Earnings | | Equity Attributable to Enersis Chile | | Non-controlling Interests | | Total Equity |
| | | | | | | | | | | |
| | | | | | | | | | | |
| | | | | | | | | | | |
| | | | | | | | | | | |
| ThCh$ | | ThCh$ | | ThCh$ | | ThCh$ | | ThCh$ | | ThCh$ | | ThCh$ | | ThCh$ | | ThCh$ | | ThCh$ | | ThCh$ | | ThCh$ |
Equity at beginning of period 1/1/2015 | | 2,229,108,975 | | 11,443,966 | | (66,850,863) | | - | | 14,046 | | - | | (873,486,367) | | (928,879,218) | | 1,171,971,677 | | 2,472,201,434 | | 611,864,357 | | 3,084,065,791 |
Changes in equity | | | | | | | | | | | | | | | | | | | | | | | | |
Comprehensive income | | | | | | | | | | | | | | | | | | | | | | | | |
Profit (loss) | | - | | - | | - | | - | | - | | - | | - | | - | | 251,838,410 | | 251,838,410 | | 95,129,754 | | 346,968,164 |
Other comprehensive income | | - | | 979,726 | | (54,652,189) | | (4,111,061) | | 789 | | - | | (346,602) | | (58,129,337) | | - | | (58,129,337) | | (37,330,932) | | (95,460,269) |
Comprehensive income | | | | | | | | | | | | - | | | | | | | | 193,709,073 | | 57,798,822 | | 251,507,895 |
Dividends | | - | | - | | - | | - | | - | | - | | - | | - | | (93,477,653) | | (93,477,653) | | (40,335,478) | | (133,813,131) |
Increase (decrease) from other changes | | - | | - | | - | | 4,111,061 | | - | | - | | 24,307,542 | | 28,418,603 | | (8,169,955) | | 20,248,648 | | (20,108,420) | | 140,228 |
Total changes in equity | | - | | 979,726 | | (54,652,189) | | - | | 789 | | - | | 23,960,940 | | (29,710,734) | | 150,190,802 | | 120,480,068 | | (2,645,076) | | 117,834,992 |
| | | | | | | | | | | | | | | | | | | | | | | | |
Equity at end of period 12/31/2015 | | 2,229,108,975 | | 12,423,692 | | (121,503,052) | | - | | 14,835 | | - | | (849,525,427) | | (958,589,952) | | 1,322,162,479 | | 2,592,681,502 | | 609,219,281 | | 3,201,900,783 |
The accompanying notes are an integral part of these consolidated financial statements
| | | | | | | | | | | | | | | | | | | | | | | | |
Statements of Changes in Equity | | | | Changes in Other Reserves | | | | | | | | |
| Allocated Capital | | Reserve for Exchange Differences in Translation | | Reserve for Cash Flow Hedges | | Reserve for Gains and Losses for Defined Benefit Plans | | Reserve for Gains and Losses on Remeasuring Available-for-Sale Financial Assets | | Amounts recognized in other comprehensive income and accumulated in equity related to non-current assets or groups of assets for disposal classified as held for sale | | Other Miscellaneous Reserves | | Other Reserves | | Retained Earnings | | Equity Attributable to Enersis Chile | | Non-controlling Interests | | Total Equity |
| | | | | | | | | | | |
| | | | | | | | | | | |
| | | | | | | | | | | |
| | | | | | | | | | | |
| ThCh$ | | ThCh$ | | ThCh$ | | ThCh$ | | ThCh$ | | ThCh$ | | ThCh$ | | ThCh$ | | ThCh$ | | ThCh$ | | ThCh$ | | ThCh$ |
| | | | | | | | | | | | |
Equity at beginning of period 1/1/2014 | | 2,238,169,268 | | 3,628,184 | | (6,258,379) | | - | | 11,811 | | - | | (877,246,493) | | (879,864,877) | | 1,080,532,977 | | 2,438,837,368 | | 626,946,621 | | 3,065,783,989 |
Changes in equity | | | | | | | | | | | | | | | | | | | | | | | | |
Comprehensive income | | | | | | | | | | | | | | | | | | | | | | | | |
Profit (loss) | | - | | - | | - | | - | | - | | - | | - | | - | | 162,459,039 | | 162,459,039 | | 37,100,378 | | 199,559,417 |
Other comprehensive income | | - | | 7,815,782 | | (60,592,484) | | (7,301,245) | | 2,235 | | - | | 8,083,427 | | (51,992,285) | | - | | (51,992,285) | | (29,992,882) | | (81,985,167) |
Comprehensive income | | | | | | | | | | | | - | | | | | | | | 110,466,754 | | 7,107,496 | | 117,574,250 |
Dividends | | - | | - | | - | | - | | - | | - | | - | | - | | (109,706,921) | | (109,706,921) | | (40,621,604) | | (150,328,525) |
Increase (decrease) from other changes | | (9,060,293) | | - | | - | | 7,301,245 | | - | | - | | (5,224,276) | | 2,076,969 | | 38,686,582 | | 31,703,258 | | 48,255,408 | | 79,958,666 |
Increase (decrease) from changes in ownership interests of subsidiaries that do not result in loss of control | | - | | - | | - | | - | | - | | - | | 900,975 | | 900,975 | | - | | 900,975 | | (29,823,564) | | (28,922,589) |
Total changes in equity | | (9,060,293) | | 7,815,782 | | (60,592,484) | | - | | 2,235 | | - | | 3,760,126 | | (49,014,341) | | 91,438,700 | | 33,364,066 | | (15,082,264) | | 18,281,802 |
| | | | | | | | | | | | | | | | | | | | | | | | |
Equity at end of period 12/31/2014 | | 2,229,108,975 | | 11,443,966 | | (66,850,863) | | - | | 14,046 | | - | | (873,486,367) | | (928,879,218) | | 1,171,971,677 | | 2,472,201,434 | | 611,864,357 | | 3,084,065,791 |
| | | | 2018 | | 2017 | | 2016 | |
Statements of Direct Cash Flows | | Note | | ThCh$ | | ThCh$ | | ThCh$ | |
Cash flows from (used in) operating activities | | | | | | | | | |
| | | | | | | | | |
Types of collection from operating activities | | | | | | | | | |
Collections from the sale of goods and services | | | | 3,037,830,501 | | 3,147,019,752 | | 3,234,555,814 | |
Collections from premiums and services, annual payments, and other obligations from policies held | | | | 9,201,388 | | 6,808,382 | | 3,941,414 | |
Other collections from operating activities | | | | 23,353,592 | | 15,216,737 | | 3,764,294 | |
Types of payment in cash from operating activities | | | | | | | | | |
Payments to suppliers for goods and services | | | | (1,921,809,622 | ) | (2,068,346,327 | ) | (2,119,032,266 | ) |
Payments to and on behalf of employees | | | | (119,944,410 | ) | (128,787,065 | ) | (128,828,942 | ) |
Payments on premiums and services, annual payments, and other obligations from policies held | | | | (15,704,586 | ) | (15,466,609 | ) | (17,236,985 | ) |
Other payments for operating activities | | | | (137,352,099 | ) | (130,403,003 | ) | (232,754,099 | ) |
Cash flows from (used in operations) | | | | | | | | | |
Income taxes paid | | | | (134,512,945 | ) | (183,022,750 | ) | (125,565,819 | ) |
Other outflows of cash, net | | | | (5,536,297 | ) | (7,405,397 | ) | (4,158,555 | ) |
Net cash flows from operating activities | | | | 735,525,522 | | 635,613,720 | | 614,684,856 | |
| | | | | | | | | |
Cash flows from (used in) investing activities | | | | | | | | | |
Cash flows from the loss or gains of control of subsidiaries or other businesses, net | | 27.1.3 | | (1,624,326,739 | ) | — | | 3,003 | |
Other collections from the sale of equity or debt instruments belonging to other entities | | | | — | | 115,582,806 | | 134,925,825 | |
Other payments to acquire stakes in joint ventures | | | | — | | (1,943,100 | ) | (2,346,000 | ) |
Loans to related companies | | | | (37,940,159 | ) | (161,363,897 | ) | (72,633,744 | ) |
Proceeds from the sale of property, plant and equipment | | | | 4,640,835 | | 4,428,995 | | 15,272,996 | |
Purchases of property, plant and equipment | | | | (300,538,836 | ) | (266,029,921 | ) | (222,385,600 | ) |
Payments for future, forward, option and swap contracts | | | | (1,475,713 | ) | (7,808,837 | ) | (8,044,017 | ) |
Collections from future, forward, option and swap contracts | | | | 352,734 | | 835,105 | | 3,744,080 | |
Collections from related companies | | | | 76,307,192 | | 161,363,898 | | 72,855,009 | |
Dividends received | | | | 1,520,979 | | 879,884 | | 8,682,136 | |
Interest received | | | | 6,653,972 | | 7,589,290 | | 6,437,720 | |
Other inflows (outflows) of cash | | | | (6,753,959 | ) | — | | — | |
Net cash flows used in investing activities | | | | (1,881,559,694 | ) | (146,465,777 | ) | (63,488,592 | ) |
| | | | | | | | | |
Cash flows from (used in) financing activities | | | | | | | | | |
Payments proceeds from share Issuance | | | | 665,829,207 | | — | | — | |
Payments for acquiring treasury shares | | 27.1.2 | | (72,388,009 | ) | — | | — | |
Total Amounts from long-term loans | | | | 1,565,782,604 | | — | | 136,870,540 | |
Proceeds from long-term loans | | 8.e | | 1,565,782,604 | | — | | 136,870,500 | |
Proceeds from short-them loans | | | | — | | — | | 40 | |
Loans from related companies | | 8.e | | — | | 150,000,000 | | 150,517,279 | |
Payments of loans | | 8.e | | (819,525,929 | ) | (5,534,483 | ) | — | |
Payments on borrowings and financial lease liabilities | | 8.e | | (1,889,685 | ) | (2,592,237 | ) | (139,596,278 | ) |
Payment of loans to related companies | | 8.e | | — | | (150,000,000 | ) | (167,561,709 | ) |
Dividends paid | | | | (231,392,743 | ) | (260,803,055 | ) | (322,805,225 | ) |
Interest paid | | 8.e | | (116,540,891 | ) | (43,816,959 | ) | (48,344,510 | ) |
Other outflows of cash, net | | 8.e | | (23,297,678 | ) | (4,848,787 | ) | (54,947,069 | ) |
Net cash flows used in financing activities | | | | 966,576,876 | | (317,595,521 | ) | (445,866,972 | ) |
Net increase (decrease) in cash and cash equivalents before effect of exchange rate changes | | | | (179,457,296 | ) | 171,552,422 | | 105,329,292 | |
Effect of exchange rate changes on cash and cash equivalents | | | | | | | | | |
Effect of exchange rate changes on cash and cash equivalents | | | | 5,173,194 | | 1,904,412 | | (3,591,945 | ) |
Net increase (decrease) in cash and cash equivalents | | | | (174,284,102 | ) | 173,456,834 | | 101,737,347 | |
Cash and cash equivalents at beginning of year | | 8 | | 419,456,026 | | 245,999,192 | | 144,261,845 | |
Cash and cash equivalents at end of year | | 8 | | 245,171,924 | | 419,456,026 | | 245,999,192 | |
The accompanying notes are an integral part of these consolidated financial statements
F-10
ENEL CHILE S.A. (FORMERLY NAMED ENERSIS CHILE S.A.)
Consolidated StatementsTable of Cash Flows, Direct
For the years ended December 31, 2016, 2015 and 2014
(In thousands of Chilean pesos)Contents
| | | | For the years ended December 31, |
| | | | 2016 | | 2015 | | 2014 |
Statements of Direct Cash Flows | | Note | | ThCh$ | | ThCh$ | | ThCh$ |
| | | | | | | | |
Cash flows from (used in) operating activities | | | | | | | | |
| | | | | | | | |
Types of collection from operating activities | | | | | | | | |
Collections from the sale of goods and services | | | | 3,234,555,814 | | 3,049,501,263 | | 2,387,905,862 |
Collections from premiums and services, annual payments, and other obligations from policies held | | | | 3,941,414 | | 1,575,093 | | - |
Other collections from operating activities | | | | 3,764,294 | | 4,399,898 | | 15,244,642 |
Types of payment in cash from operating activities | | | | | | | | |
Payments to suppliers for goods and services | | | | (2,119,032,266) | | (2,069,604,155) | | (1,875,922,724) |
Payments to and on behalf of employees | | | | (128,828,942) | | (132,245,067) | | (118,058,522) |
Payments on premiums and services, annual payments, and other obligations from policies held | | | | (17,236,985) | | (7,547,854) | | (8,060,258) |
Other payments for operating activities | | | | (232,754,099) | | (123,833,216) | | (92,292,159) |
Income taxes paid | | | | (125,565,819) | | (134,275,698) | | (33,916,694) |
Other outflows of cash, net | | | | (4,158,555) | | (11,438,737) | | (9,953,266) |
Net cash flows from operating activities | | | | 614,684,856 | | 576,531,527 | | 264,946,881 |
| | | | | | | | |
Cash flows from (used in) investing activities | | | | | | | | |
Cash flows from the loss of control of subsidiaries or other businesses, net | | | | 3,003 | | 6,639,653 | | 40,861,571 |
Cash flows used to obtain control of subsidiaries or other businesses | | | | - | | - | | (37,654,762) |
Other collections from the sale of equity or debt instruments belonging to other entities | | | | 134,925,825 | | - | | - |
Other payments to acquire equity or debt instruments belonging to other entities | | | | - | | - | | (15,894,195) |
Other payments to acquire stakes in joint ventures | | | | (2,346,000) | | (2,550,000) | | (3,315,000) |
Loans to related companies | | | | (72,633,744) | | - | | - |
Proceeds from the sale of property, plant and equipment | | | | 15,272,996 | | 29,853 | | 167,486 |
Purchases of property, plant and equipment | | | | (222,385,600) | | (309,503,337) | | (193,980,458) |
Proceeds from the sale of other long-term assets | | | | - | | 1,729,727 | | 2,037,930 |
Purchases of other long-term assets | | | | - | | - | | (2,952,035) |
Payments for future, forward, option and swap contracts | | | | (8,044,017) | | (6,143,222) | | (17,364,789) |
Collections from future, forward, option and swap contracts | | | | 3,744,080 | | 186,522 | | 22,536,125 |
Collections from related companies | | | | 72,855,009 | | - | | - |
Dividends received | | | | 8,682,136 | | 10,163,153 | | 12,857,184 |
Interest received | | | | 6,437,720 | | 2,706,304 | | 3,952,768 |
Other inflows (outflows) of cash, net | | | | - | | - | | 9,704 |
Net cash flows used in investing activities | | | | (63,488,592) | | (296,741,347) | | (188,738,471) |
| | | | | | | | |
Cash flows from (used in) financing activities | | | | | | | | |
Proceeds from long-term loans | | | | 136,870,500 | | - | | 221,932,163 |
Proceeds from short-them loans | | | | 40 | | - | | - |
Loans from related companies | | | | 150,517,279 | | 672,906,691 | | 475,737,765 |
Payments on borrowings and financial lease liabilities | | | | (139,596,278) | | (142,318,377) | | (117,659,358) |
Payment of loans to related companies | | | | (167,561,709) | | (633,103,315) | | (633,824,523) |
Dividends paid | | | | (322,805,225) | | (134,692,408) | | (161,129,816) |
Interest paid | | | | (48,344,510) | | (59,614,618) | | (63,291,514) |
Change in parent company investment | | | | - | | 28,596,303 | | 131,304,205 |
Other outflows of cash, net | | | | (54,947,069) | | (5,216,726) | | (12,213,403) |
Net cash flows used in financing activities | | | | (445,866,972) | | (273,442,450) | | (159,144,481) |
Net increase (decrease) in cash and cash equivalents before effect of exchange rate changes | | | | 105,329,292 | | 6,347,730 | | (82,936,071) |
Effect of exchange rate changes on cash and cash equivalents | | | | | | | | |
Effect of exchange rate changes on cash and cash equivalents | | | | (3,591,945) | | 4,898,486 | | 1,044,603 |
Net increase (decrease) in cash and cash equivalents | | | | 101,737,347 | | 11,246,216 | | (81,891,468) |
Cash and cash equivalents at beginning of year | | | | 144,261,845 | | 133,015,629 | | 214,907,097 |
Cash and cash equivalents at end of year | | | | 245,999,192 | | 144,261,845 | | 133,015,629 |
The accompanying notes are an integral part of these consolidated financial statements
ENEL CHILE S.A (FORMERLY NAMED ENERSIS CHILE S.A.)
NOTES TO THE CONSOLIDATED FINANCIAL STATEMENTS
F-13
Table of Contents
ENEL CHILE S.A. (FORMERLY NAMED ENERSIS CHILE S.A.) AND ITS SUBSIDIARIES
CONSOLIDATED FINANCIAL STATEMENTS AS OF DECEMBER 31, 20162018 AND 20152017 AND FOR THE YEARS ENDED DECEMBER 31, 2018, 2017 AND 2016
(In thousands of Chilean pesos)pesos - ThCh)
1.BACKGROUND AND BUSINESS ACTIVITIES | BACKGROUND AND BUSINESS ACTIVITIES
|
Enel Chile S.A. (formerly named Enersis Chile S.A.) (hereinafter the “Parent Company” or the “Company”) and its subsidiaries comprise the Enel Chile Group (hereinafter the “Group”).
The Company is a publicly traded corporation with registered address and head office located at Avenida Santa Rosa, No. 76, in Santiago, Chile. Since April 13, 2016, thethe Company is registered in the securities register of the Financial Market Commission of Chile (“Comisión para el Mercado Financiero” or “CMF”, formerly the Chilean Superintendence of Securities and Insurance, of Chile (Superintendencia“Superintendencia de Valores y SegurosSeguros” or SVS),“SVS”) and since March 31, 2016 is registered with the Securities and Exchange Commission of the United States of America. On April 21, 2016, the Company’s shares began trading on the Santiago Stock Exchange the Electronic Stock Exchange and the ValparaísoElectronic Stock Exchange. In addition, the Company’s common stock began trading in the United States in the form of American Depositary Shares on the New York Stock Exchange by way of “when-issued” trading from April 21, 2016 to April 26, 2017 and “regular-way” trading since April 27, 2016.
Enel S.p.A. (hereinafter “Enel”), an Italian generation company, is the ultimate controlling shareholder of the Company.
The Company was initially constitutedincorporated by public deed dated January 22, 2016 and came into legal existence on March 1, 2016 under the name of Enersis Chile S.A. The Company changed its name to Enel Chile S.A. effective October 4, 2016, the date its by-laws were amended in connection with the corporate reorganization of the Group. For tax purposes, the Company operates under Chilean tax identification number 76.536.353-5.
As of December 31, 2016,2018, the Group had 2,0102,062 employees. During the fiscal year ended December 31, 2016,2018, the Group averaged a total of 2,0152,096 employees (see Note 34)37).
Enel Chile’s corporate purpose consists of exploring, developing, operating, generating, distributing, transporting, transforming and/or sale of energy in any of its forms or nature, directly or through other entities within Chile. Additionally, it is also engaged in investing and managing its investments in its subsidiaries and associates, whose activities include the generation, transmission, distribution or selling of electrical energy, or whose corporate purpose includes any of the following:
i) Energy of any kind or form,
ii) Supplying public services, or services whose main component is energy,
iii) Telecommunications and information technology services, and
iv) Internet-based intermediation business.
F-14
| i)
| Energy of any kind or form,
|
| ii)
| Supplying public services, or services whose main component is energy,
|
| iii)
| Telecommunications and information technology services, and
|
| iv)
| Internet-based intermediation business.
|
Corporate ReorganizationTable of Contents
In 2015, Enersis S.A. (“Enersis”), which was ultimately controlled and 60.6% beneficially owned by Enel, initiated a reorganization process to separate its electricity generation and distribution
1.1.Information about the Group
a)Separation of businesses and related assets and liabilities in Chile from its generation, transmission and distribution businessesbusiness in Argentina, Brazil, Colombia and Peru (the “Reorganization”“Spin-Off”).:
The Reorganization began
On April 28, 2015, Enersis S.A (currently Enel Américas S.A.) reported as an essential fact to the SVS (currently CMF) that its board of directors decided unanimously to start an assessment of the restructuring of the company with a view to separating the spin-offs byenergy generation and distribution activities in Chile from its other activities carried out outside Chile; the purpose would be to resolve some duplications and redundancies arising from the complex company structure of Enersis S.A. and its subsidiaries Empresa Nacional de Electricidad S.A. (“Endesa Chile”(currently Enel Generación Chile S.A.) and Chilectra S.A. (“Chilectra”(currently Enel Distribución Chile S.A.), following and to generate value for all of its shareholders, maintaining the approvalbenefits arising from belonging to the Grupo Enel SpA..
On July 27, 2015, in compliance with the provisions of articles 9 and 10 of Law 18045 on the Securities Market and the stipulations of General Standard 30 of the spin-offsSVS, Enersis S.A. (hereinafter Enersis) reported as an essential fact to the SVS that its board of directors had decided unanimously to approve the separation of its generation and distribution activities in Chile from the other activities carried out outside Chile by the respective shareholdersGroup. This restructuring would be carried out using the following steps:
a. Division of Enersis,Empresa Nacional de Electricidad S.A. (hereinafter Endesa Chile) and Chilectra S.A. (hereinafter Chilectra), by creating two new companies called Endesa Américas S.A. and Chilectra Américas S.A. Endesa Chile and Chilectra, at their extraordinary shareholders’ meetingsthe surviving companies after the division, would keep the entire business currently carried out in Chile; i.e. they would be assigned the part of the equity made up of, among other things, the assets, liabilities and respective administrative authorizations, held by each of the divided companies in Chile. On the other hand, , the companies created as a result of the division, i.e. Endesa Américas S.A. and Chilectra Américas S.A., would be assigned the equity corresponding to the international business (basically, interests in companies domiciled in Argentina, Brazil, Colombia and Peru) (the “Separation”).
b. Division of Enersis S.A., by creating a new company called Enersis Chile S.A. (currently Enel Chile S.A.). The pre-existing and continuing entity before the division, Enersis S.A., would be assigned the interests and investments in the companies Endesa Américas S.A. and Chilectra Américas S.A., and any possible liabilities that would be assigned to the it as a divided business. Thus, the new company Enersis Chile would be the holding company of the Chilean business established in Endesa Chile and Chilectra, and the pre-existing and continuing Enersis S.A. would continue to be the holding company for the international business comprising the interests of Endesa Américas S.A. and Chilectra Américas S.A. The new company Enersis Chile S.A. would be listed in the stock exchanges where Enersis S.A. is currently listed and would be subject to the provisions of Section XII of Statutory Decree 3500 of November 4, 1980.
c. After the above divisions have been accomplished, a merger by absorption would take place between Endesa Américas S.A. and Chilectra Américas S.A., by Enersis S.A.. The end result would be that the surviving company after the merger, i.e. Enersis S.A., would carry out the international business directly, and Enersis Chile S.A., indirectly through its ownership of shares in its subsidiaries Endesa Chile and Chilectra, would carry out the Chilean domestic business, which, in this case, would represent a significant simplification in relation to the current structure.
The Extraordinary Shareholders’ Meeting of Enersis S.A., held on December 18, 2015,.
Endesa Chile conducted a “división” or “demerger” under Chilean corporate law to divide Endesa Chile approved the division of Enersis S.A. into two separate companies. Thecompanies, with a new company, Endesa Américascorporation arising from that division, Enersis Chile S.A. (“Endesa Américas”), wasgoverned by Section XII of Statutory Decree 3500, to which were assigned Endesa Chile's non-Chilean businessesthe corporate interests and related assets and liabilities on March 1, 2016 (the “Separation”).associated with Enersis S.A. in Chile, including the interests in the already divided Chilectra and Endesa Américas registered its sharesChile, and with the Securities Registryall of the SVS pursuantshareholders of Enersis S.A. being incorporated into Enersis Chile S.A. in the same proportion to Chilean lawtheir interest in the capital of Enersis S.A. for an equal number of shares that they had received in the divided company (1 to 1 ratio); and withfor the U.S. Securitiescorporate interests outside Chile, including its ownership interests in the companies resulting from the divisions of Chilectra and Exchange Commission (the “SEC”) pursuant to applicable U.S. federal securities laws, and on April 21, 2016, Endesa Chile, distributed sharesand the liabilities linked to them, as well as all of Endesa Américas to its shareholders in proportion to such shareholders’ share ownership in Endesa Chile based on a ratio of one share of Endesa Américas for each outstanding share of Endesa Chile (the “Distribution,” and together with the Separation, the “Spin-Off”). Following the Spin-Off, Endesa Chile retained its Chilean businesses and related assets and liabilities.
Chilectra, a Chilean electricity distribution company and subsidiary of Enersis, also conducted a “división” or “demerger” and then distributed to its shareholders pro rata the shares of a new Chilean company, Chilectra Américas S.A. (“Chilectra Américas”), that holds the non-Chilean equity interests and relatedother assets and liabilities which consists exclusively of Chilectra’s ownership interests in shares of companies domiciled outside of Chile (the “Chilectra Spin-Off” and together with the Spin-Off, the “Endesa/Chilectra Spin-Offs”). Chilectra Américas registered its shares with the Securities Registry of the SVS pursuantnot assigned expressly to Chilean law and Chilectra continues to hold its Chilean businesses and related assets and liabilities.
In connection with the “demergers” of Endesa Chile and Chilectra, Enersis conducted a “división” or “demerger”. Following the Endesa/Chilectra Spin-Offs, Enersis distributed to its shareholders pro rata the shares of a new Chilean company, Enersis Chile S.A. (“Enersis Chile”), that was assignedin the Chilean businesses and assets, including the equity interests in each of Endesa Chile and Chilectra, after giving effectdivision thus belonging to the “demergers”divided company Enersis S.A..
F-15
Table of Endesa Chile and Chilectra (the “Enersis Spin-Off”). On March 1, 2016, having satisfied all conditions precedent including the capital decrease and modifications to the by-laws, the Enersis Spin-Off became effective and Enersis S.A.’s corporate name was changed to Enersis Américas S.A. The new entity Enersis Chile was also incorporated on that date and allocated the equity interest and related assets and liabilities of Enersis' businesses in Chile. Enersis Chile registered its shares with the Securities Registry of the SVS pursuant to Chilean law and the SEC pursuant to applicable U.S. federal securities laws in connection with the Enersis Spin-Off, which was completed in April 2016.Contents
As part of the Enersis Spin-Off, it was agreed that Enersis’(i) Enersis S.A.’s share capital would be reduced from Ch$5,804,447,986,0005,804,447,986,087 divided into 49,092,772,762 registered common shares of a single series with no par value, to Ch$3,575,339,011,549 divided into 49,092,772,762 registered common shares of a single series with no par value. Additionally, it was agreed that (i)(ii) Enersis Chile’s share capital would be Ch$2,229,108,974,451,2,229,108,974,538, which corresponds to the amount by which the Enersis share capital would be decreased, divided into 49,092,772,762 registered common shares of a single series with no par value, and (ii)(iii) Enersis’ equity interest would be distributed between Enersis Américas and Enersis Chile by allocating assets and liabilities to Enersis Chile, as agreed at the abovementioned extraordinary shareholders’ meetingmeeting.
For their part, the bylaws of Enersis Chile S.A. were approved; once they came into force, this entity has been subject voluntarily and in advance to the regulations set forth in article 50 A of the Law on Corporations with regard to the election of independent directors and the creation of Committees of Directors.
In compliance with the agreement of the Extraordinary Shareholders’ Meeting of Enersis S.A., held on December 18, 2015,.
On October 4, the Board of Directors of Enersis S.A. was informed that the condition precedent to which the division of Enersis S.A. was subject had been complied with. It stipulated the drawing up and execution of the public deed stating that the above condition precedent had been met, called “Deed of Compliance with the Condition for the Division of Enersis.” Consequently, and in accordance with the above approval by the Shareholders’ Meeting, the division of Enersis S.A. was implemented as of March 1, 2016, from which date the respective by-laws were amendednew company Enersis Chile S.A. came into existence and the corporate namesdecrease in capital and other amendments to the bylaws of Enersis S.A. were verified, with the latter becoming formally known as Enersis Américas S.A. as of February 1, 2016. The shares into which the capital of Enersis Chile Endesa Chile and Chilectra were changedS.A is divided are distributed free of charge to Enel Chilethe shareholders of Enersis Américas S.A., Enel Generación Chile S.A. and Enel Distribución Chile S.A., respectively entitled to receive them on April 21, 2016.
.b)Incorporation of Renewable Assets in Chile:
2.
| BASIS OF PRESENTATION OF THE CONSOLIDATED FINANCIAL STATEMENTS.
|
For a discussion of the 2018 corporate restructuring project, see Note 6.
2.BASIS OF PRESENTATION OF THE CONSOLIDATED FINANCIAL STATEMENTS
2.1 Basis of preparation
The accompanying consolidated financial statements as of December 31, 20162018 of Enel Chile were approved by the Company’s Board of Directors at its meeting held on April 29, 2019, and 2015 of the Company have been prepared in accordance with International Financial Reporting Standards (“IFRS”) as issued by the International Accounting Standards Board (“IASB”). These consolidated financial statements were approved by the Company’s Board of Directors at its meeting held on April 26, 2017.
The consolidated financial statements for the periods prior to the Separation reflect the combined operations of the Group as it would have been incorporated following the Spin-Off, assuming date would have been January 1, 2013.Spin- Off mentioned in Note 1. The combined financial statements may not be indicative of the Group’s future performance and do not necessarily reflect what the results of operations, financial position and cash flows would have been had it operated, since January 1, 2013 as an independent combined group during the periods presented.
For the periods prior to the Separation, the Group does not represent a group for consolidated financial statement reporting purposes in accordance with IFRS 10 Consolidated Financial Statements.
Since IFRS does not provide any guidance for the preparation of combined financial statements, paragraph 12 of IAS 8 Accounting Policies, Changes in Accounting Estimates and Errorswas used for the preparation of the combined financial statements. This paragraph requires that the latest pronouncements of other standard setters, other accounting literature and accepted industry practice should be considered. The combined financial statements of the Company were derived from the aggregation of the net assets of the Chilean business of Enersis S.A. (currently Enel Américas S.A.). All intra-group balances, revenues, expenses and unrealized gains and losses arising from transactions between companies belonging to combined group were eliminated when preparing the combined financial statements. In addition, the investments of Enersis S.A. in the Group were eliminated against the equity of the respective combined entities. Transactions with Enel Américas group companies, which do not belong to the Group, have been disclosed as transactions with related parties.
F-16
Table of Contents
Following the Separation, the consolidated financial statements include the financial statements of the Company and its subsidiaries, associates and joint ventures, and no longer include any allocations of expenses from Enersis S.A. to the Company. Accordingly:
| •
| The consolidated statement of financial position as of December 31, 2016, consists of the consolidated statement of financial position of the Group, while as of December 31, 2015 consists of the combined statement of financial position of the Company’s businesses aggregated as a combined group.
|
· The consolidated statement of financial position as of December 31, 2018 and 2017, consists of the consolidated statement of financial position of the Group.
· The consolidated statements of comprehensive income for the years ended December 31, 2018 and 2017, consist of the consolidated statement of comprehensive income of the Group. The consolidated statement of comprehensive income for the year ended December 31, 2016, consists of the consolidated statement of comprehensive income of the Group for the ten month period ended December 31, 2016 and the combined statement of comprehensive income of the Company’s businesses aggregated as a combined group for the two month period ended March 1, 2016.
· The combinedconsolidated statements of comprehensive incomechanges in equity for the years ended December 31, 20152018 and 2014,2017, consist of the combinedconsolidated statements of comprehensive incomechanges in equity of the Company’s businesses aggregated as a combined group.
Group. The consolidated statement of changes in equity for the year ended December 31, 2016, consists of the consolidated statement of changes in equity of the Group for the ten month period ended December 31, 2016 and the combined statement of changes in equity of the Company’s businesses aggregated as a combined group for the two month period ended March 1, 2016.
· The combinedconsolidated statements of changes in equitycash flows for the years ended December 31, 20152018 and 2014,2017, consist of the combinedconsolidated statements of changes in equitycash flows of the Company’s businesses aggregated as a combined group.
Group. The consolidated statement of cash flows for the year ended December 31, 2016, consists of the consolidated statement of cash flows of the Group for the ten month period ended December 31, 2016 and the combined statement of cash flows of the Company’s businesses aggregated as a combined group for the two month period ended March 1, 2016. The combined statements of cash flows for the years ended December 31, 2015 and 2014, consist of the combined statements of cash flows of the Company’s businesses aggregated as a combined group.
These consolidated financial statements are presented in thousands of Chilean pesos (unless otherwise stated) which is the Company’s functional and presentation currency.
Principles applied in preparing the Combined Financial Statements
The following summarizes the accounting and other principles applied in preparing the combined financial statements. Management considers that the allocations described below were made on a reasonable basis, but are not necessarily indicative of the costs that would have been incurred if the Company aggregated as a combined group (hereinafter “the Combined Group”) had been a stand-alone entityentity.
Net assets of the Parent Company (equity)
Prior to the Separation, the Combined Group had not previously formed a separate legal group nor presented any stand-alone financial statements, and accordingly it was not conceivable to present share capital or an analysis of equity reserves. The net assets of the Combined Group were represented by capital invested in the Combined Group and were shown as “Equity” using the same captions as those used by Enersis. Issued capital, share premium and retained earnings of Enersis were allocated to Enersis Chile based on the net assetsasset value ratio assigned to it. Other reserves (which were primarily composed of the equity effects of past reorganizations, business combinations under common control, residual effects of first-time adoption of IFRS and the equity effects of the recent Spin-Off) were allocated considering the transaction and circumstances that led to creation of these reserves.
F-17
Table of Contents
Cash and cash equivalents
Cash and cash equivalents of the foreign subsidiaries of Enersis were excluded from the combined financial statements.
In addition, the cash and cash equivalents balance of Enersis, on a stand-alone basis, was allocated using the following criteria:
(i) Cash and cash equivalents from the proceeds from the capital increase carried out in 2013 were excluded from the combined financial statements; and
(ii) Cash and cash equivalents remaining after excluding the 2013 capital increase proceeds, were allocated based on the exercise carried out by Enersis’ management, the ratios obtained for the division of the cash and cash equivalents, were as follows:
| | | Proportion of | |
| | Proportion of
Net Assets Market Value | | Net Assets Market Value | |
Entity | | Chile | | Américas | | Chile | | Américas | |
Enersis | | 42% | | 58% | |
Enersis S.A. | | | 42 | % | 58 | % |
Endesa S.A. | | 66% | | 34% | | 66 | % | 34 | % |
Chilectra S.A. | | 63% | | 37% | | 63 | % | 37 | % |
Intercompany balances and transactions with related companies
Intercompany balances with successors of Enersis were allocated by identifying the entity that provided/received the service as well as the nature of it. Intercompany balances with the Company were eliminated in full for the purpose of the combined financial statements. Intercompany balances with Enel Américas are included in the combined financial statements and disclosed as accounts with related companies.
Debt instruments and related interest expenses, exchange differences and effects of hedge accounting strategies
Financial debt and related interest expenses and exchange rate differences of the Chilean subsidiaries of Enersis were included in the combined financial statements. Financial debt and related interest expenses and exchange rate differences of Enersis stand-alone was 100% allocated to Enel Americas and were not included in the combined financial statements.
In relation to derivative instruments designated as hedging instruments for the Chilean subsidiaries of Enersis, these were included in the combined financial statements. Enersis’ management adopted as a criterion to keep the strategies of hedge accounting. Therefore, all effects on the statement of financial position, income and other comprehensive income were assigned to the specific companies to which the hedged items were assigned. In the case of Enersis on a stand-alone basis, the main items covered by the hedging strategies were related to debt (hedging exposure to foreign currency debt and variability in interest rates). Therefore, the main derivative instruments associated with such hedging strategies were assigned accordingly to Enel Américas, the entity that assumed 100% of the debt of Enersis stand-alone entity, or the Company, as applicable.
Personnel, salary expenses other employee benefits
For purposes of properly distributing the accounting effect of personnel from Enersis on a stand-alone basis between the Company and Enel Américas, the Enersis’Enersis management defined as a criterion to identify those personnel whose main
F-18
Table of Contents
activities were related 100% to the operations based in Chile under Enersis. This group of employees was assigned to the Company. On the other hand, management also identified those employees whose main activities related 100% to foreign operations. This group of employees was assigned to Enel Américas.
All remaining personnel, who divide their main activities between the Chilean operations of Enersis and foreign operations, were assigned to the Company, meaning that from the date of the Spin-Off, those employees would identify the activities offered to foreign operations of Enersis and vice-versa. The existing contracts of inter-company provision of services between foreign and local businesses ensure reimbursement of the incurred costs of these employees that were allocated based on the time dedicated to activities offered to the Company’s entities from their total available time.
The table below sets forth the breakdown of employees allocated to the Company and Enel Américas:
| | Employee
Allocation |
Entity | | Chile | | Américas |
Enersis | | 391 | | 87 |
Endesa S.A. | | 925 | | 7 |
Chilectra S.A. | | 668 | | 2 |
Total | | 1,984 | | 96 |
Employee allocation
Entity | | Chile | | Américas | |
Enersis S.A. | | 391 | | 87 | |
Endesa S.A. | | 925 | | 7 | |
Chilectra S.A. | | 668 | | 2 | |
Total | | 1,984 | | 96 | |
Once the allocation of personnel was determined Enersis management applied the following criterion to the division of all the personnel related accounts in the statements of financial position and comprehensive income that were associated with the costs directly related to the personnel, such as wages and salaries, post-employment benefit obligations expense and social security and other benefits, travel expenses, etc. In this regard their allocation was performed based on the specific assignment of the related personnel to the Combined Group, as described above.
Other share costs
The combined statements of income include expense allocations for certain corporate functions provided by Enersis, including, but not limited to, human resources administration, treasury, risk management, internal audit, accounting, tax, legal, insurance, medical services, information technology support, communication management, and other shared services. These expenses were allocated to the Company and Enel Américas based on a specific identification basis, and in other cases these expenses were allocated by Enersis based on a pro-rata basis of headcount or some other basis depending on the nature of the allocated cost. Management considers the basis on which the expenses were allocated to reasonably reflect the utilization of services provided to or the benefit received by the Company during the periods presented.
F-19
Table of Contents
Dividends receivable and payable
The criterion defined by Enersis’ management to allocate to both the Company as well as to Enel Américas a portion of dividends receivable accounts from Enersis as a stand-alone basis as of the date of the Spin-Off, was based mainly on identifying the origin of each one of those dividends. If the dividends come directly from a Chilean subsidiary, these dividends were allocated 100% to the Company.
Income tax
The tax effect (income statement and income tax provision) related to the Chilean subsidiaries of Enersis was included in the combined financial statements and was calculated using the statutory corporate tax rates according to the jurisdiction where the pre-tax income was originated.
In addition, for the tax effect in the income statement of Enersis on a stand-alone basis it was allocated to the combined financial statements by determining a hypothetical taxable income as if the Company and Enel Américas had operated as separate taxpayers. However, and from a tax point of view, there is currently only one taxpaying company, which is Enersis’ successor, Enel Américas. Accordingly, income tax payable by Enersis was allocated to the combined financial statements.
In relation to deferred tax assets and liabilities, these were assigned to the Company and Enel Américas, taking into account the underlying assets and liabilities, whose respective temporary differences have originated such deferred taxes.
Other working capital accounts
Working capital items such as accounts receivable, accounts payable and inventories that were directly attributable to the Chilean operations of the Combined Group were included in the combined financial statements.
2.2 New accounting pronouncements
a) The following accounting pronouncements have been adopted by the Group effective as of January 1, 2018:
i. New Standards and Interpretations
New Standards and Interpretations | 2.2
| New accounting pronouncementsMandatory
Effective
Date:
|
| a)
| Accounting pronouncements effective from January 1, 2016:
|
Improvements and AmendmentsIFRS 9: Financial Instruments
| | Mandatory application for annualAnnual periods beginning on or after:
|
Amendment to IFRS 11: Accounting for Acquisitions of Interests in Joint Operations
This amendment to IFRS 11 “Joint Arrangements” states that the accounting standards contained in IFRS 3 and other standards that are pertinent to business combinations accounting must be applied to the accounting for acquiring an interest in a joint operation in which the activities constitute a business.
| | January 1, 2016
|
Improvements to IFRS (Cycles 2012-2014)
These are a set of improvements that were necessary, but not urgent, and that amend the following standards IFRS 5 – Non-current assets held for sale and discontinued operations; IFRS7 - Financial Instruments: Disclosures; IAS19 – Employee Benefits; and IAS 34 – Interim Financial Reporting.
| | January 1, 2016
|
Amendment to IAS 16 and IAS 38: Clarification of Acceptable Methods of Depreciation and Amortization
The amendment to IAS 16 explicitly prohibits the use of revenue-based depreciation for property, plant and equipment. The amendment to IAS 38 introduces the rebuttable presumption that, for intangible assets, the revenue-based amortization method is inappropriate and establishes two limited exceptions.
| | January 1, 2016
|
Amendment to IAS 1: Disclosure Initiative
The IASB has issued amendments to IAS 1 as part of its principal initiative to improve the presentation and disclosure of information in financial statements. These improvements are designed to assist companies in applying professional judgment to determine what type of information to disclose in their financial statements.
| | January 1, 2016
|
Amendment to IFRS 10, IFRS 12 and IAS 28: Investment Entities, Application of the Consolidation Exception
The modifications, which have a restricted scope, introduce clarifications to the requirements for the accounting of investment entities. The modifications also provide relief in some circumstances, which will reduce the costs of applying the Standards.
| | January 1, 2016
|
The amendments and improvements to the standards, which came into effect on January 1, 2016, had no significant effect on the consolidated financial statements of the Company and its subsidiaries.
b) Accounting pronouncements effective from January 1, 2017 and subsequent periods:
As of the date of issue of these consolidated financial statements, the following accounting pronouncements had been issued by the IASB, but their application was not yet mandatory:
New Standards
| | Mandatory application for annual periods beginning on or after:
|
IFRS 9: Financial Instruments
| | after January 1, 2018 |
IFRS 15: Revenue from Contracts with Customers. Customers | | Annual periods beginning on or after January 1, 2018 |
IFRS 16: Leases
IFRIC 22: Foreign Currency Transactions and Advance Consideration | | Annual periods beginning on or after January 1, 20192018 |
·IFRS 9 –— Financial Instruments
In July 2014, the IASB issued the final version of
IFRS 9 that replacesentered into force effective as of January 1, 2018, replacing IAS 39 Financial Instruments: Recognition and Measurement and all previous versions of IFRS 9.. This new Standard brings together all three phases ofstandard contains requirements in regards to the IASB's project on financial instruments: (i)recognition, classification and measurement (ii) impairmentof financial assets, financial liabilities and (iii) hedge accounting.certain purchase or sale contracts of non-financial items.
F-20
Table of Contents
IFRS 9 is effective
The Group adopted retroactively for annual periods beginning on or after January 1, 2018, with earlytransition in the first time adoption of this standard. The accumulated effect of this application permitted.was accounted for as an adjustment to the opening balance of retained earnings as of the initial application date. The standardGroup has several specific requirements on transition, exceptions and exemptions, but, as a general rule, it will be applied retrospectively, except for most ofprospectively the hedge accounting requirements that will be applied prospectively.of IFRS 9 does not mandatorily require to restate prior periods. The Group does not expect to early adopt9.
Management conducted a detailed evaluation of the standard.
The actualthree aspects of the standard and its impact of adopting IFRS 9 on the Group’s consolidated financial statements in 2018 is not known and cannot be reliably estimated because it will be dependent on the financial instruments thatof the Group, holdswhich is summarized as follows:
(i) Classification and economic conditions at that time as well as accounting elections and judgments that it will make during the implementation period. However, the Group has performed a preliminary assessment of the potential impact, based on currently available information and, therefore, it may be subject to changes based on detailed analysis to be completed or new information available in the future.measurement
| (i)
| Classification and measurement
|
IFRS 9 introduces a new classification approach for financial assets, based on two concepts: the characteristics of the contractual cash flows of the financial assetassets and the business model of the entity. Under this new approach, the four classification categories inof IAS 39 are replaced by the following three categories:
| -
| Fair value through other comprehensive income; and
|
| -
| Fair value through profit or loss
|
· Amortized cost, if the financial assets are held within a business model whose objective is to collect contractual cash flows;
· Fair value through other comprehensive income, if the financial assets are held within a business model whose objective is achieved by both collecting contractual cash flows and selling financial assets; or
· Fair value through profit or loss, a residual category which consists of financial instruments that are not held within any of the two business models previously discussed, including those held for trading and those designated at fair value on initial recognition.
For financial liabilities, IFRS 9 retains largely the existing requirements in IAS 39, with certain specific modifications, under which most of the classification requirements from IAS 39. However, there are new accounting requirements for those financial liabilities designatedare measured at initial recognition underamortized cost, and allowing the fair value optiondesignation of a financial liability to be measured at fair value through profit or loss. In this case, the change in theloss, if certain criteria are met.
However, IFRS 9 introduces new requirements for financial liabilities designated at fair value attributable tothrough profit or loss, which states that under certain circumstances, changes in “ownfair value originated by the variation of an entity’s own credit risk” isrisk will be recognized in other comprehensive income.
Based on its preliminary assessment,the business model and the characteristics of the contractual cash flows, the Group does not believedetermined that the new classification requirements if applied at December 31, 2016, wouldfor financial assets did not have had a materialan impact on itsthe consolidated financial statements. Most of the Group’s financial instruments, i.e. loans and trade receivables, will continue to be measured at amortized cost under IFRS 9, and derivative instruments will continue to be measured at fair value through profit or loss (general treatment) or through other comprehensive income (hedge accounting), as appropriate. The Group has elected to measure certain investments in equity instruments at measured at fair value through other comprehensive income under IFRS 9 (see Note 23).
(ii) Impairment | (ii)
| Impairment
|
The new impairment model in IFRS 9 is based on expected credit losses, which differs fromas opposed to the incurred loss model in IAS 39. Consequently, under IFRS 9 impairment losses will be recognized, as a general rule, earlier than currentprevious practice.
The new impairment model will be applied to financial assets measured at amortized cost and those measured at fair value through other comprehensive income. Theincome, except for investments in equity instruments. Under IFRS 9, the allowance for impairment losses will be measured based on:
| -
| 12-month expected credit losses; or
|
| -
| · 12-months expected credit losses; or ·Lifetime expected credit losses, if the credit risk of a financial asset at the reporting date has increased significantly since initial recognition. The standard allows the application of a financial asset at the reporting date has increased significantly since initial recognition. |
The Standard allows to apply a simplified approach for trade receivables, contract assets and lease receivables so as tothat the impairment is always recognized in reference to the lifetime expected credit losses.losses for the asset. The Group preliminary expectshas chosen to apply this policy for the designated financial assets.
F-21
Table of Contents
The analysis of the impairment of the Group’s financial assets was made with a focus on trade accounts receivable, which represent most of the Group’s credit exposure. In particular, for the application of the simplified approach contemplated in the standard, these accounts receivable were grouped into specific pools, taking into account the nature and credit risk, and the impairment model based on expected losses developed by the Group was applied on a collectively-evaluated basis.. For trade accounts receivable that management considered significant on an individual basis and for which more detailed information on credit risk was available, an analytical approach was adopted within the simplified model. As of January 1, 2018, as a result of the application of the new impairment model, the Group recognized a charge, net of taxes, of ThCh$3,411,631 to all of its trade receivables.retained earnings.
(iii) Hedge Accounting | (iii)
| Hedge Accounting
|
IFRS 9 introduces a new model for hedge accounting in order to more closely align the accounting treatment with risk management activities of the entities and to establish a new principle-based approach. The new model will enable entities to better reflect risk management activities in the financial statements, and allowingallow more items to be eligible as hedged items, such as:as non-financial risk component,components, net positions, and aggregated exposures (i.e., a combination of derivative and non-derivative exposure).
The most significant changes in relation to hedging instruments compared to hedge accounting methodology in IAS 39, is the possibility to defer in other comprehensive income the time value of options, forward points in forward contracts, and foreign currency basis spread, until the hedged item impacts profit or loss.
IFRS 9 eliminates the current quantitative requirement for a hedge effectiveness test, under which the results must be within a range of 80-125 percent. This will allow aligning hedge effectiveness with risk management by demonstrating the existence of an economic relationship between the hedging instrument and the hedged item, and enables the rebalancing of a hedging relationship if the risk management objective remains unchanged. However, retrospective ineffectiveness should continue to be valued and recognized in profit or loss.
When initially applying IFRS 9, the Group may choose as its accounting policy to continue to apply the hedge accounting requirements of IAS 39 instead of the requirements in IFRS 9.9, until the time the new requirements on macro-hedging are published and adopted. The Group’s current plan is that it will electGroup has chosen to apply the new requirements of IFRS 9.9 on the date of its adoption.
The Group believes that all existing hedge relationships that are currently designatedimplemented changes in effective hedging relationships will still qualify forthe systems, internal control, policies and procedures in order to comply with the new disclosures and accounting requirements of IFRS 9.
The application of the new hedge accounting under IFRS 9. The Group will assess possible changes related tomodel has not had an impact on the accounting for the time value of options, forward points or the currency basis spread in more detail in the future.Group’s consolidated financial statements.
·IFRS 15 –— Revenue from Contracts with Customers
In May 2014, the IASB published IFRS 15, was issued in May 2014 and establishes a five-step modelwhich is applicable to account forall revenue arising from contracts with customers. Under IFRScustomers, with certain exemptions (lease and insurance contracts, financial instruments and non-monetary exchanges) and to recognition and measurement of gains and losses on disposal of non-financial assets. The new revenue standard supersedes, effective as of January 1, 2018, all current revenue recognition standards:
· IAS 11 Construction Contracts;
· IAS 18 Revenue;
· IFRIC 13 Customer Loyalty Programs;
· IFRIC 15 Agreements for the Construction of Real Estate;
· IFRIC 18 Transfers of Assets from Customers; and
· SIC-31 Revenue — Barter Transactions Involving Advertising Services.
This new standard introduces a general framework for recognition and measurement of revenue, isbased on the core principle that revenues are recognized atfor an amount that reflects the consideration to which anthe entity
F-22
Table of Contents
expects to be entitled in exchange for transferring promised goods or services to customers. This core principle shall be applied using a customer.
The new revenue standard will supersede all current standards relatedfive-step approach to revenue recognition: (1) identify the contract with a customer; (2) identify the performance obligations in the contract; (3) determine the transaction price; (4) allocate the transaction price to the performance obligations in the contracts; and (5) recognize revenue when (or as) the entity satisfies a performance obligation.
| -
| IAS 11Construction Contracts;
|
| -
| IFRIC 13 Customer Loyalty Programs;
|
| -
| IFRIC 15 Agreements for the Construction of Real Estate;
|
| -
| IFRIC 18 Transfers of Assets from Customers; and
|
| -
| SIC-31 Revenue – Barter Transactions Involving Advertising Services.
|
The Standard shall be applied for annual periods beginning on or after January 1, 2018, either under a full retrospective method or a modified retrospective method. Early adoption is permitted. The Group preliminarily planscarried out an implementation project, to adoptidentify and measure the possible impacts of applying IFRS 15 on its consolidated financial statements. This project involved identifying all of the revenue flows of Enel Chile and its subsidiaries, knowledge of the traditional practices of the business, a comprehensive evaluation of each kind of contract with customers and determining the methodology for recording this revenue under the standards. The evaluation was performed paying an special attention to those contracts presenting key aspects of IFRS 15 and particular characteristics of interest to the Group, such as: identifying contractual obligations; contracts with multiple obligations and recognition timing; contracts with variable compensation; significant financing components; analysis of principal versus agent; existence of service guarantees; and recognition of costs to obtain and fulfill a contract.
The Group participates in the electrical energy generation, transmission and distribution businesses, and related activities. Based on the nature of the goods and services offered and the characteristics of its revenue flows streams, the Group did not identify any impact on the consolidated financial statements of the Group he date of initial application of IFRS 15 For further details about the goods and services provided by the Group and the revenue recognition criteria, see Note 3.q.
The Group implemented changes in the systems, internal control, policies and procedures in order to comply with the new disclosures and accounting requirements of IFRS 15.
The Group adopted the new standard on the required effective date using the retrospectively modified retrospective method. Consequently, the Group will apply IFRS 15 retrospectively only to those contracts effectiveThe application has not had an impact on the initial application date, recognizing the cumulative effect of initially applying the Standard as an adjustment to the opening balance of retained earnings of the annual reporting period that includesGroup’s consolidated financial statement.
·IFRIC 22 — Foreign Currency Transactions and Advance Consideration
This Interpretation clarifies the date of initial application.the transaction for the purpose of determining the exchange rate to use in foreign currency transactions when the consideration is paid or received before recognizing related revenues, expenses or assets. For this purposes, the date of the transaction is the date on which an entity initially recognizes the non-monetary asset or non-monetary liability arising from the payment or receipt of advance consideration.
Based on its preliminary assessment of IFRS 15,
IFRIC 22 has been implemented by the Group as of January 1, 2018 and it has not generated an impact on the consolidated financial statements of the Group.
ii. Amendments and Improvements
Amendments and Improvements |
| Mandatory
Effective
Date: |
Amendment to IFRS 2: Classification and Measurement of Share-based Payment Transactions | | Annual periods beginning on or after January 1, 2018 |
Amendment to IAS 40: Transfers of Investment Property | | Annual periods beginning on or after January 1, 2018 |
Annual Improvements to IFRS: Cycles 2014-2016 IFRS 1 and IAS 28 | | Annual periods beginning on or after January 1, 2018 |
F-23
Table of Contents
·Classification and Measurement of Share-based Payment Transactions (Amendments to IFRS 2)
The amendments to IFRS 2, Share-based Payment Transactions, developed through the IFRS Interpretations Committee, address the following issues:
a) the effects of vesting and non-vesting conditions on the measurement of cash-settled share-based payments;
b) the classification of withholding tax obligations for share-based payment transactions with net settlement features; and
c) the accounting for modifications of share-based payment transactions from cash-settled to equity-settled.
The amendments to IFRS 2, applied as of January 1, 2018, have not had any impact on the consolidated financial statements of the Group.
·Transfers of Investment Property (Amendments to IAS 40)
The amendments to IAS 40 Investment Property clarify that an entity shall transfer a property to, or from, investment property when, and only when, there is evidence of a change in use. A change of use occurs if property meets, or ceases to meet, the definition of investment property. A change in management’s intentions for the use of a property by itself does not believeconstitute evidence of a change in use. The amendments shall be applied prospectively.
The amendments to IAS 40, applied as of January 1, 2018, have not had any impact on the consolidated financial statements of the Group.
·Annual Improvements to IFRS: Cycles 2014-2016 IAS 28
IAS 28 Investments in Associates and Joint Ventures clarifies that if an entity that is not itself an investment entity has an interest in an associate or joint venture that is an investment entity, it may choose to maintain the new Standard, iffair value measurement applied at December 31, 2016, wouldby its investment entity associate or joint venture. Application of these improvements is on a retrospective basis.
The 2014-2016 annual improvements, applied as of January 1, 2018, have not had aany material impact on itsthe consolidated financial statements.
IFRS 15 requires more detailed disclosures thanstatements of the current requirements. The disclosure requirements represent a significant changesGroup.
b) Accounting pronouncements with application effective as compared to current practiceof January 1, 2019 and increase significantlythereafter:
As of the volumedate of disclosures to be included inissuance of these consolidated financial statements, the Group’s financial statements. During 2017, in accordance with the Group’s IFRS 15 implementation timetable, an assessment and the necessary changes and enhancements will be made to the systems, internal controls, policies and procedures, to gather and disclosure the required information.
IFRS 16 wasfollowing accounting pronouncements had been issued by the IASB, inbut their application is not mandatorily effective:
i. New Standards and Interpretations
Amendments and Improvements |
| Mandatory
Effective
Date: |
IFRS 16: Leases | | Annual periods beginning on or after January 1, 2019 |
IFRIC 23 Uncertainty over Income Tax Treatments | | Annual periods beginning on or after January 1, 2019 |
Conceptual Framework (Revised) | | Annual periods beginning on or after January 1, 2020 |
F-24
Table of Contents
·IFRS 16 Leases
In January 2016, andthe IASB issued IFRS 16 which establishes principles for the recognition, measurement, presentation and disclosure of leases. The new Standard replacesprinciples for lease agreements. IFRS 16 supersedes IAS 17 Leases, and its interpretations: IFRIC 4 Determining whether an Arrangement contains a Lease, SIC-15 Operating Leases-IncentivesLeases—Incentives and SIC-27 Evaluating the Substance of Transactions Involving the Legal Form of a Lease.
The Standardstandard is effective for annual periods beginning on or after January 1, 2019. Early application is permitted for entities that apply IFRS 15 at or before the date of initial application of IFRS 16. The Group does not plan to early adopt the Standard.
Although IFRS 16 provides a series of practical expedients for the transition, both forsubstantially retains the definition of a lease and for retrospective applicationin IAS 17, the main change is the incorporation of the standard. The Group has not yet decided if“control” concept within the new definition. In relation to the accounting treatment for a lessee and a lessor, the new standard states the following:
i) Lessee accounting: IFRS 16 requires lessees to account for all leases under a single model, similar to accounting for finance leases under IAS 17. As a result, at the date of commencement of a lease, the lessee will recognize on the statement of financial position a right to use asset and a lease liability for the future payments. Subsequent to initial recognition it will use certainrecognize in the statement of profit or allloss the depreciation expense of the practical expedients.asset separately from the interest related to the liability. The standard provides two voluntary recognition exceptions for low-value leases and short-term leases.
ii) Lessor accounting: does not change substantially from the current model of IAS 17. The lessor will continue to classify leases under the same principles of the current standard as operating or financial leases. | i)
| Lessee accounting under IFRS 16 requires lessees to account for all leases under a single on-balance sheet model similar to the accounting for finance leases under IAS 17. Consequently, at the commencement date of a lease contract, the lessee will recognize a right-of-use asset and a liability for future lease payments to be made. The standard includes two optional recognition exceptions for leases of low value items and short-term leases.
|
| ii)
| Lessor accounting under IFRS 16 is substantially unchanged from current accounting under IAS 17. Lessors will continue to classify leases using the same classification principles as in IAS 17 as operating and finance leases.
|
The Group is currently carryingcarried out an initial assessment of the potential impact of IFRS 16 on its consolidated financial statements. The quantitative effect will depend, among other things,Conducting this assessment required the use of professional judgment and assumptions, which are summarized below:
· Analysis of the lease contracts executed by the Group’s companies in order to identify if they are within the scope of the standard. This analysis included not only the contracts in which Enel Chile acts as a lessee, but also the contracts for the rendering of services and the contracts in which the Company acts as a lessor.
· Analysis of lease contracts that could benefit from the exemption from application of this standard, because they are contracts with a maturity of less than 12 months or that have underlying assets of low individual value, such as: lease of certain office equipment (personal computers, printers and photocopiers) that are considered low value assets.
· Estimate of the lease terms, based on the chosennon-cancellable period and the periods covered by the renewal options, the exercise of which is in the power of Enel Chile and is considered reasonably certain.
· Estimate of the discount rate to calculate the present value of the lease payments. This is equal to the incremental rate of the lessee’s loans when the interest rate implicit in the lease can not be easily determined. For the transition, the Group has used the incremental borrowing rate from January 2019, defined as the interest rate that the Group would have to pay to borrow over a similar term, and with a
F-25
Table of Contents
similar security, the funds necessary to obtain an asset of a value similar to the right-of-use asset in a similar economic environment.
The implementation work also required a review of the processes and systems, including the internal control, in order to determine the most appropriate tool for the management of the information required for the application of the new standard, as well as the required disclosures in the consolidated financial statements.
For the transition of the new standard, the Group has decided to apply the following practical expedients:
· The Group decided not to re-evaluate if a contract is, or contains, a lease. Instead, it will apply the standard to contracts that were previously identified as leases by applying IAS 17 and IFRIC 4. Therefore, the Group will not apply the standard to contracts that were not previously identified as containing a lease.
· The Group has determined that it will apply the modified retrospective transition method, whereby the extent to whichrestatement of comparative periods is not required and the Group uses the practical expedients and recognition exemptions, and any additional lease contract entered into by the Group in the future. The Group expects to disclose its transition method elected and quantitative information beforecumulative effect of the initial application of the standard.standard is presented as an adjustment to the opening balance of retained earnings (or another component of equity as applicable) on the date of initial application, recording the asset for the same value as the liability.
· Trust in its assessment of whether leases are onerous by applying IAS 37 Provisions, Contingent Liabilities and Contingent Assets immediately before the date of initial application and adjust the right-of-use asset at the date of initial application for the amount of any provision for onerous leases recognized in the financial statements immediately before the date of initial application.
The new Standard will have an impact on all Group entities that have lease contracts. The main issues that arise are those related to the lease of land, buildings and automobiles. As a result of the change of the accounting model for lessees, the Group expects an increase in non-current and current liabilities of approximately Ch$29,162 million as of January 1, 2019, for the recognition of future payment obligations of lease contracts. In accordance with the chosen transition model, an increase in non-current assets for an equal amount is also expected, resulting from the recognition of the rights of use arising from those contracts.
·IFRIC 23 — Uncertainty over Income Tax Treatments
In June 2017, the IASB issued IFRIC 23 to clarify the application of recognition and measurement requirements in IAS 12, Income Taxes, when there is uncertainty over income tax treatments. The Interpretation specifically addresses the following: whether an entity considers uncertain tax treatments separately; the assumptions an entity makes about the examination of tax treatments by taxation authorities; how an entity determines taxable profit (loss), tax bases, unused tax losses, unused tax credits and tax rates; and how an entity considers changes in facts and circumstances.
Uncertainty over income tax treatments can affect both current and deferred taxes. Recognizing the effects of uncertainty depends on whether the tax authority is likely or not to accept an uncertain tax treatment, assuming that the tax authority will examine the amounts that it is entitled to examine and has full knowledge of all the related information.
This interpretation is effective for annual periods beginning on or after January 1, 2019. Retrospective application is allowed, if it is possible without the use of hindsight. Management has assessed the effects of the application of IFRIC 23 and has determined that its adoption will not have any material impacts on the consolidated financial statements of Enel Chile and subsidiaries as of its effective date.
F-26
Table of Contents
·Conceptual Framework (Revised).
The IASB issued the Conceptual Framework (revised) in March 2018. It incorporates some new concepts, provides updated definitions and recognition criteria for assets and liabilities and clarifies some important matters. Revisions to the Conceptual Framework may affect the application of IFRSs when no standard applies to a particular transaction or event.
The IASB has also issued a separate accompanying document, “Amendments to References to the Conceptual Framework in IFRS Standards,” which establishes amendments to affected IFRSs in order to update references to the new Conceptual Framework.
The Conceptual Framework (Revised) is effective as of January 1, 2020. Management is assessing the potential impact of the application of the new Conceptual Framework on the consolidated financial statements of the Group.
ii. Amendments and Improvements
Amendments and Improvements |
| Mandatory
Effective
date: |
Amendment to IFRS 9: Prepayment Features with Negative Compensation | | Annual periods beginning on or after January 1, 2019 |
Standards, InterpretationsAmendment to IAS 28: Long-term interests in Associates and AmendmentsJoint Ventures
| | Mandatory
application for annualAnnual periods beginning on or after:
after January 1, 2019 |
IFRIC 22: Foreign Currency TransactionsAnnual Improvements to IFRS: 2015 - 2017 Cycle (IFRS 3, IFRS 11, IAS 12 and Advance Consideration
This interpretation addresses the exchange rate to be used in foreign currency transactions when the consideration is paid or received before recognizing related revenues, expenses or assets.
IAS 23) | | Annual periods beginning on or after January 1, 20182019 |
Amendment to IAS 12: Recognition of Deferred Tax Assets for Unrealized Losses The purpose of the amendments to IAS 12 “Income Taxes” is to provide requirements on recognition of deferred tax assets for unrealized losses, and clarify how to account for deferred tax assets related to debt instruments measured at fair value.
19: Plan Amendment, Curtailment or Settlement | | Annual periods beginning on or after January 1, 20172019 |
Amendment to IAS 7: Disclosure Initiative The amendments to IAS 7 “Statement3: Definition of Cash Flows” are part of the IASB’s initiative aimed at improving presentation and disclosure of information in the financial statements. The amendments add additional disclosure requirements relating to financing activities in the statement of cash flows.a Business
| | Annual periods beginning on or after January 1, 20172020 |
Standards, InterpretationsAmendment to IAS 1 and AmendmentsIAS 8: Definition of Material
| | Mandatory
application for annualAnnual periods
beginning on or after:after January 1, 2020 |
Annual Improvements to IFRS (Cycles 2014-2016)
Annual improvements correspond to a series of minor amendments clarifying, correcting or eliminating redundancy in the following standards: IFRS 1 “First-time Adoption of IFRS”, IFRS 12 “Disclosures of Interests in Other Entities” and IAS 28 “Investments in Associates and Joint Ventures”.
| | IFRS 12: January 1, 2017.
IFRS 1: January 1, 2018
IAS 28: January 1, 2018
|
Amendment to IFRS 2: Classification and Measurement of Share-based Payment Transactions
| | |
The amendments provide specific accounting requirements for: (i) the effects of vesting and non-vesting conditions on the measurement of cash-settled share-based payments; ii) share-based payment transactions with a net settlement feature for withholding tax obligations; and iii) a modification to the terms and conditions of a share-based payment that changes the classification of the transaction from cash-settled to equity-settled
| | January 1, 2018.
|
Amendments to IAS 40: Transfers of investment property
The IASB issued this amendment to clarify that a change in management’s intentions for the use of a property by itself does not constitute evidence of a change in use and is not a sufficient reclassification criteria.
| | January 1, 2017.
|
Amendment to IFRS 10 and IAS 28: Sale or Contributioncontribution of Assetsassets between an investor and its associate or joint venture
| | |
The amendment corrects an inconsistency between IFRS 10 “Consolidated Financial Statements” and IAS 28 “Investments in Associates and Joint Ventures” relating to the accounting treatment of the sale or contributions of assets between an Investor and its Associate or Joint Venture.
The IASB decided to postpone the effective date of application of the amendment, until obtaining the results of its research Project on the equity method of accounting.
| | Effective date deferredPostponed indefinitely. Available for optional adoption
|
In management’s opinion,·Amendment to IFRS 9, Financial Instruments: Prepayment Features with Negative Compensation
This amendment was issued on October 12, 2017. This amendment amends the futureexisting requirements in IFRS 9 regarding termination rights in order to allow measurement of financial assets at amortized cost (or, depending on the business model, at fair value through other comprehensive income) even in the case of negative compensation prepayments.
Under IFRS 9, a debt instrument can be measured at amortized cost or at fair value through profit or loss in other comprehensive income, provided that the contractual cash flows are only principal and interest payments on the outstanding principal and the instrument is carried out within the business model for that classification. The amendments to IFRS 9 are intended to clarify that a financial asset meets the criterion of “only principal payments plus interest”, regardless of the event or circumstance that causes the early termination of the contract or of which party pays or receives reasonable compensation for the early termination of the contract.
The amendments to IFRS 9 should be applied when the prepayment is close to the unpaid amounts of principal and interest in such a way that it reflects the change in the benchmark interest rate. This implies that prepayments at fair value or for an amount that includes the fair value of the cost to terminate an associated hedging instrument
F-27
Table of Contents
will normally meet the criterion of only principal payments plus interest, only if other elements of the change in fair value, such as the effects of credit risk or liquidity, are minimal.
The amendments are applicable from January 1, 2019, retrospectively. Management considers that the application of IFRIC 22 and the foregoingthese amendments iswill not expected to have a significant effectan impact on the consolidated financial statements of the CompanyGroup.
·Amendments to IAS 28: Long-term interests in Associates and Joint Ventures
These amendments clarify that IFRS 9 Financial Instruments is applicable to an entity’s long-term interests in an associate or joint venture to which the equity method is not applied. This clarification is relevant because it implies that the expected credit loss model, described in IFRS 9, applies to these long-term interests. Entities should apply the amendments retrospectively, with certain exceptions.
The effective application date is January 1, 2019. Management considers that the application of these amendments will not have an impact on the consolidated financial statements of the Group.
·Annual Improvements to IFRS: 2015 - 2017 Cycle (IFRS 3, IFRS 11, IAS 12 and IAS 23).
IFRS 3 Business Combinations and IFRS 11 Joint Arrangements : clarifies the accounting for increases in ownership interest in a joint operation that meets the definition of a business. If a party maintains (or obtains) joint control, the previously held ownership interest is not remeasured. If a party obtains control, the transaction is a business combination in stages and the acquiring party remeasures the previously held ownership interest in the assets and liabilities of a joint operation, at fair value.
IAS 12 Income Taxes The amendments clarify that the income tax on dividends is linked more directly to past transactions or events that generated distributable profits than to distributions to shareholders. Therefore, an entity recognizes income tax on dividends in profit or loss, other comprehensive income or equity according to where the entity originally recognized those past transactions or events.
IAS 23 Borrowing Costs clarifies that loans that were specifically intended to finance qualifying assets become part of the entity’s general loan pool for the purpose of calculating the capitalization rate, when substantially all of the activities necessary to prepare the asset for its subsidiaries.intended use or sale are complete.
The improvements are effective for annual reporting periods beginning on or after January 1, 2019. Management considers that the application of these improvements will not have an impact on the consolidated financial statements of the Group.
·Amendment to IAS 19: Plan Amendment, Curtailment or Settlement
The amendments to IAS 19 Employee Benefits, issued in February 2018, address the accounting when a plan amendment, curtailment or settlement occurs during a reporting period. The amendment specifies that an entity is required to determine the current service cost and net interest for the remainder of the annual period using the actuarial assumptions used to remeasure the defined benefit liability (asset) and plan assets after the plan amendment, curtailment or settlement.
The amendments to IAS 19 also clarify that an entity first determines any past service cost, or a gain or loss on settlement, without considering the effect of the asset ceiling. This amount is recognized in profit or loss. An entity then determines the effect of the asset ceiling after the plan amendment, curtailment or settlement. Any change in that effect, excluding amounts included in net interest, is recognized in other comprehensive income.
This clarification provides that entities might have to recognize a past service cost, or a gain or loss on settlement, that reduces a surplus that was not recognized before. Changes in the effect of the asset ceiling are not netted against such amounts.
F-28
Table of Contents
The amendments to IAS 19 apply to a plan amendment, curtailment or settlement that occur from January 1, 2019.
·Amendments to IFRS 3 Definition of a Business
IFRS 3 Business Combinations was amended by the IASB in October 2018, to clarify the definition of business, in order to help entities to determine whether a transaction should be accounted for as a business combination or as the acquisition of an asset. To be considered as a business, an acquired integrated set of activities and assets must include, at least, an input and a substantive process that together contribute significantly to the ability to create output. The amendment also adds guidance and illustrative examples to assess whether a substantial process has been acquired.
The amendment is applicable prospectively to business combinations and acquisitions of assets, the acquisition date of which is from January 1, 2020. Earlier application is permitted.
·Amendments to IAS 1 and IAS 8 Definition of Material or Materiality
In October 2018, the IASB amended IAS 1 Presentation of Financial Statements and IAS 8 Accounting Policies, Changes in Accounting Estimates and Errors, to improve the definition of “material” and the explanations accompanying the definition. The amendments ensure that the definition of material is consistent in all IFRS.
Information is material if omitting, misstating or obscuring it could reasonably be expected to influence the decisions that the primary users of general purpose financial statements make on the basis of those financial statements, which provide financial information about a specific reporting entity.
The amendments will be applicable prospectively for annual periods beginning on or after January 1, 2020. Earlier application is permitted. Management is evaluating the potential impact of the application of these amendments on the consolidated financial statements of the Group.
2.3 Responsibility for the information, judgments and estimates provided
Management
The Company’s Board of Directors is responsible for the information contained in these consolidated financial statements and expressly states that all IFRS principles and standards, as issued by the IASB, have been fully implemented.
In preparing the consolidated financial statements, certain judgments and estimates made by managementthe Group’s Management have been used to quantify some of the assets, liabilities, income,revenue, expenses and commitments recorded in the statements.recognized.
The most important areas werewhere critical judgment iswas required are:
·The identification of Cash Generating Units (CGU) for impairment testing (see Note 3.e).
·The hierarchy of information used to measure assets and liabilities at fair value (see Note 3.h)
· Application of the revenue recognition model in accordance with IFRS 15 (see Note 3.q)
The estimates refer basically to:
·The valuations performed to determine the existence of impairment losses among tangible and intangiblein assets and goodwill (see Note 3.e).
·The assumptions used to calculate the actuarial liabilities and obligations towith employees, such as discount rates, mortality tables, salary raises,increases, etc. (see Notes 3.m.1 and 23)26).
·The useful lifelives of property, plant and equipment, and intangible assets (see Notes 3.a and 3.d).
F-29
Table of Contents
·The assumptions used to calculate the fair value of financial instruments (see Notes 3.g.53.h and 20)23).
Energy
· The energy supplied to customerscustomer whose meter readingsmeters have not yet been read.
· Certain assumptions inherent in the electricity system affecting transactions with other companies, such as production, customer billings, energy consumption, that allow for estimation of electricity system settlements that occur on the corresponding final settlement dates, but that are pending.pending as of the date of issuance of the consolidated financial statements and could affect the balances of assets, liabilities, income and expenses recognized in the financial statements (see Appendix 2.2).
| •
| Certain assumptions inherent in the electricity system affecting transactions with other companies, such as production, customer billings, energy consumption, etc. that allow for estimating electricity system settlements that must occur on the corresponding final settlement dates, but that are pending as of the date of issuance of the consolidated financial statements and could affect the balances of assets, liabilities, income and expenses recorded in the statements (See Appendix 6.2).
|
·The probability that uncertain or contingent liabilities will be incurred and their related amounts (see Note 3.l)3.m).
·Future disbursements for the closure of facilities and restoration of land, as well as theassociated discount rates to be used (see Note 3.a).
·The tax results of the various subsidiaries of the Group that will be reported to the respective tax authorities in the future, and that have servedbeen used as the basis for recording different balancesthe various income tax related to income taxesbalance in these consolidated financial statements (see Note 3.o)3.p).
·The fair valuesvalue of assets acquired and liabilities assumed, and any pre-existing interest in an entity acquired in a business combination.
Although these judgments and estimates have been based on the best available information available onas of the issuance date of these consolidated financial statements, future events may occur that would require a change (increase or decrease) to these judgments and estimates in subsequent periods. This change would be made prospectively, recognizing the effects of this change in judgment and estimation in the corresponding future consolidated financial statements.
2.4 Subsidiaries
Subsidiaries are defined as those entities controlled either, directly or indirectly by the Company.Enel Chile. Control is exercised if, and only if, the following conditions are met: the Company has i) power over the subsidiary; ii) exposure or rights to variable returns from these entities; and iii) the ability to use its power to influence the amount of these returns.
The Company
Enel Chile has power over its subsidiaries when it holds the majority of the substantive voting rights or, should that not be the case, when it has rights granting the practical ability to direct the entities’ relevant activities, that is, the activities that significantly affect the subsidiary’s results.
The CompanyGroup will reassess whether or not it controls a subsidiary if the facts and circumstances indicate that there are changes to one or more of the three elements of control listed above.
Subsidiaries are consolidated as described in noteNote 2.7.
Appendix 1. “Enel Chile
The following are the entities in which the Group Subsidiaries”has the ability to exercise control and are therefore included in these consolidated financial statements describes the relationshipstatements:
Taxpayer ID | | | | | | Percentage of control at
12-31-2018 | | Percentage of control at
12-31-2017 | |
No. | | Company | | Currency | | Direct | | Indirect | | Total | | Direct | | Indirect | | Total | |
96.800.570-7 | | Enel Distribución Chile S.A. | | Chilean peso | | 99.09 | % | — | | 99.09 | % | 99.09 | % | — | | 99.09 | % |
96.783.910-8 | | Empresa Eléctrica de Colina Ltda. | | Chilean peso | | — | | 100.00 | % | 100.00 | % | — | | 100.00 | % | 100.00 | % |
96.504.980-0 | | Empresa Eléctrica Pehuenche S.A. | | Chilean peso | | — | | 92.65 | % | 92.65 | % | — | | 92.65 | % | 92.65 | % |
91.081.000-6 | | Enel Generación Chile S.A. | | Chilean peso | | 93.55 | % | — | | 93.55 | % | 59.98 | % | — | | 59.98 | % |
78.932.860-9 | | GasAtacama Chile S.A. (1) | | Chilean peso | | 2.63 | % | 97.37 | % | 100.00 | % | 2.63 | % | 97.37 | % | 100.00 | % |
78.952.420-3 | | Gasoducto Atacama Argentina S.A. | | Chilean peso | | — | | 100.00 | % | 100.00 | % | — | | 100.00 | % | 100.00 | % |
96.800.460-3 | | Luz Andes Ltda. | | Chilean peso | | — | | 100.00 | % | 100.00 | % | — | | 100.00 | % | 100.00 | % |
76.722.488-5 | | Empresa de Transmisión Chena S.A | | Chilean peso | | — | | 100.00 | % | 100.00 | % | — | | 100.00 | % | 100.00 | % |
77.047.280-6 | | Sociedad Agrícola de Cameros Ltda. | | Chilean peso | | 57.50 | % | — | | 57.50 | % | 57.50 | % | — | | 57.50 | % |
96.920.110-0 | | Enel Green Power Chile Ltda. * | | U.S. dollar | | 99.99 | % | — | | 99.99 | % | — | | — | | — | |
F-30
Table of the Company with each of its subsidiaries.Contents
96.524.140-K | | Empresa Electrica Panguipulli S.A * | | U.S. dollar | | 0.05 | % | 99.95 | % | 100.00 | % | — | | — | | — | |
76.306.985-0 | | Diego de Almagro Matriz SpA. * | | U.S. dollar | | — | | 100.00 | % | 100.00 | % | — | | — | | — | |
76.179.024-2 | | Parque Eolico Tal Tal S.A * | | U.S. dollar | | 0.01 | % | 99.99 | % | 100.00 | % | — | | — | | — | |
96.971.330-6 | | Geotermica del Norte S.A * | | U.S. dollar | | — | | 84.59 | % | 84.59 | % | — | | — | | — | |
99.577.350-3 | | Empresa Nacional de Geotermia S.A * | | U.S. dollar | | — | | 51.00 | % | 51.00 | % | — | | — | | — | |
76.052.206-6 | | Parque Eolico Valle de los Vientos S.A * | | U.S. dollar | | — | | 99.99 | % | 99.99 | % | — | | — | | — | |
76.126.507-5 | | Parque Talinay Oriente S.A * | | U.S. dollar | | — | | 61.37 | % | 61.37 | % | — | | — | | — | |
76.321.458-3 | | Almeyda Solar SpA * | | U.S. dollar | | — | | 100.00 | % | 100.00 | % | — | | — | | — | |
76.412.562-2 | | Enel Green Power del Sur SpA. * | | U.S. dollar | | — | | 100.00 | % | 100.00 | % | — | | — | | — | |
76.924.079-9 | | Enel X Chile SpA | | U.S. dollar | | 100.00 | % | — | | 100.00 | % | — | | — | | — | |
(*) See Section 2.4.1, i)
2.4.1 Changes in the scope of consolidation
(i)On January 9, 2015, ourApril 2, 2018, renewable energy assets held in Chile by Enel Green Power Latin Americas S.A. (“EGPL”) were incorporated into Enel Chile (see Note 6). The EGPL group comprises the following companies.
· Enel Green Power Chile Ltda.
· Empresa Eléctrica Panguipulli S.A.
· Diego de Almagro Matriz SpA
· Parque Eólico Tal Tal S.A.
· Geotérmica del Norte S.A.
· Empresa Nacional de Geotermia S.A.
· Parque Eólico Valle de los Vientos S.A.
· Parque Talinay Oriente S.A.
· Almeyda Solar SpA
· Enel Green Power del Sur SpA
(ii) Servicios Informáticos e Inmobiliarios Ltda. was absorbed by Enel Chile on September 1, 2017. The latter is the legal successor.
(iii) Central Eólica Canela S.A. was liquidated on September 1, 2017. Its net assets were transferred to GasAtacama Chile.
(iv) On September 7, 2018, the subsidiary Enel GeneraciónX Chile S.A. (formerly named Endesa Chile S.A.), sold allSpA was incorporated. The corporate purpose of this subsidiary, among others, is to develop, implement and sell products and services related to energy that incorporate innovation, state-of-the-art technology and trends of the shares ownedfuture, other than the electricity distribution under concession and their related services, whether they are priced or not.
2.5 Investments in Sociedad Concesionaria Túnel El Melón S.A. for ThCh$25,000,000.associates
The elimination of Sociedad Concesionaria Túnel El Melón S.A. from the Group’s scope of consolidation resulted in a decrease in the consolidated statement of financial position of ThCh$871,022 in current assets, ThCh$7,107,941 in non-current assets, ThCh$3,698,444 in current liabilities and ThCh$1,789,703 in non-current liabilities.
On December 30, 2014, Inmobiliaria Manso de Velasco Ltda., a subsidiary of Enersis Chile, sold all of its direct and indirect ownership interest in Construcciones y Proyectos Los Maitenes S.A. (“Maitenes”) and Aguas Santiago Poniente S.A. The total amount received for the sale of these shares was ThCh$57,173,142, which was received in cash on the same date (see Notes 5 and 30).
The elimination of Maitenes and Aguas Santiago Poniente S.A. from the Group’s scope of consolidation resulted in a decrease in the consolidated statement of financial position of ThCh$54,845,853 in current assets, ThCh$12,822,077 in non-current assets, and ThCh$1,393,348 in current liabilities; there was no effect on non-current liabilities.
2.4.2 Unconsolidated companies with an ownership interest of more than 50%
Although the Group holds more than a 50% ownership interest in Centrales Hidroeléctricas de Aysén S.A. (Aysén), it is considered a “joint venture” since the Group, through contracts or agreements with shareholders, exercises joint control of the investee.
2.5 Investment in associates
Associates are those inentities over which the Group,Enel Chile, either directly or indirectly, exercises significant influence.
Significant influence is the power to participate in the financial and operational policy decisions of the associate but is not control or joint control over those policies. In assessing significant influence, the Group takes into account the existence and effect of potentialcurrently exercisable voting rights or convertible rights at the end of each reporting period, including potentialcurrently exercisable voting rights held by the Company or by another Group entity.other entities. In general, significant influence is presumed to be those cases in which the Group has an ownership interest of more than 20%. of the voting power of the investee
Associates are incorporated to the consolidated financial statements using theaccounted for under equity method as described in note 3.h.Note 3.i.
Appendix 3. “Associates and Joint Ventures” to these consolidated financial statements describes the relationship
The detail of the Company and eachcompanies that qualify as associates is the following:
F-31
Table of these companies.Contents
| | | | | | Ownership Interest at
12-31-2018 | | Ownership Interest at
12-31-2017 | |
Taxpayer ID No. | | Company | | Currency | | Direct | | Indirect | | Total | | Direct | | Indirect | | Total | |
76.418.940-K | | GNL Chile S.A. | | Chilean peso | | — | | 33.33 | % | 33.33 | % | — | | 33.33 | % | 33.33 | % |
76.364.085-K | | Energia Marina SpA | | Chilean peso | | | | 25.00 | % | 25.00 | % | — | | — | | — | |
· On February 7, 2017 Electrogas S.A., a company where Enel Chile had an interest of 42.5%, was sold (see Note 5).
· On April 2, 2018, renewable energy assets held in Chile EGPL were incorporated into Enel Chile (see Note 6). Added companies include the associate Energía Marina SpA.
2.6 Joint arrangements2.6 Investment in joint arrangements
Joint arrangements are defined as those entities in which the Group exercises control under an agreement with other shareholders and jointly with them, in other words, when decisions on the entities’ relevant activities require the unanimous consent of the parties sharing control.
Depending on the rights and obligations of the parties,participants, joint arrangementsagreements are classified as:
· Joint venture: an agreement whereby the parties exercising joint control have rights to the entity’s net assets. Joint ventures are incorporated to the consolidated financial statements using the equity method, as described in note 3.i. · Joint operation: an agreement whereby the parties exercising joint control have rights to the assets and obligations with respect to the liabilities relating to the arrangement. Joint operations are incorporated to the consolidated financial statements recognizing the interest in the contractually named assets and liabilities in the joint operation. | -
| Joint ventures: an agreement whereby the parties exercising joint control have rights to the entity’s net assets. Joint ventures are incorporated to the consolidated financial statements using the equity method, as described in note 3.h.
|
| -
| Joint operation: an agreement whereby the parties exercising joint control have rights to the assets and obligations with respect to the liabilities relating to the arrangement. Joint operations are incorporated to the consolidated financial statements recognizing the interest in the assets and liabilities held in the joint operation.
|
In determining the type of joint arrangement in which it is involved, the management of the Group assesses its rights and obligations arising from the arrangement by considering the structure and legal form of the arrangement, the terms agreed by the parties in the contractual arrangement and, when relevant, other facts and circumstances. If facts and circumstances change, the Group reassesses whether the type of joint arrangement in which it is involved has changed.
Currently, the Company is not involved in any joint arrangement that qualifies as a joint operation.
Appendix 3. “Associates
The detail of the companies that qualify as Associates and Joint Ventures” to these consolidated financial statements describesVenture is the relationship of the Companyfollowing:
| | | | | | Ownership Interest at
12-31-2018 | | Ownership Interest at
12-31-2017 | |
Taxpayer ID No. | | Company | | Currency | | Direct | | Indirect | | Total | | Direct | | Indirect | | Total | |
76.091.595-5 | | Aysén Energía S.A. (1) | | Chilean peso | | — | | 51.00 | % | 51.00 | % | — | | 51.00 | % | 51.00 | % |
76.041.891-9 | | Aysén Transmisión S.A. (1) | | Chilean peso | | — | | 51.00 | % | 51.00 | % | — | | 51.00 | % | 51.00 | % |
76.652.400-1 | | Centrales Hidroeléctricas De Aysén S.A. (2) | | Chilean peso | | — | | — | | — | | — | | 51.00 | % | 51.00 | % |
77.017.930-0 | | Transmisora Eléctrica de Quillota Ltda. | | Chilean peso | | — | | 50.00 | % | 50.00 | % | — | | 50.00 | % | 50.00 | % |
(1) Aysén Energía S.A. and each of theseAysén Trasmisión S.A. companies are currently in liquidation process as December 31, 2018.
(2) Centrales Hidroeléctricas de Aysén S.A. was liquidated and distributed among shareholders on September 7, 2018 (see Note 15.1b).
2.7 Basis of consolidation and business combinations
The subsidiaries are consolidated and all their assets, liabilities, income,revenues, expenses, and cash flows are included in the consolidated financial statements once the adjustments and eliminations from intragroupintra-group transactions have been made.
F-32
Table of Contents
The comprehensive income of subsidiaries is included in the consolidated statement of comprehensive income statement from the date when the parent company obtains control of the subsidiary and until the date on which it loses control of the subsidiary.
The operations of the parent company and its subsidiaries have been consolidated under the following basic principles:
1. At the date the parent obtains control, the subsidiary’s assets acquired and its liabilities assumed are recorded at fair value, except for certain assets and liabilities that are recorded using valuation principles established in other IFRS standards. If the fair value of the consideration transferred plus the fair value of any non-controlling interests exceeds the fair value of the net assets acquired, this difference is recorded as goodwill. In the case of a bargain purchase, the resulting gain is recognized in profit or loss after reassessing whether all of the assets acquired and the liabilities assumed have been properly identified and following a review of the procedures used to measure the fair value of these amounts. | 1.
| At the date the parent obtains control, the subsidiary’s assets acquired and its liabilities assumed are recorded at fair value, except for certain assets and liabilities that are recorded using valuation principles established in other IFRS standards. If the fair value of the consideration transferred plus the fair value of any non-controlling interests exceeds the fair value of the net assets acquired, this difference is recorded as goodwill. In the case of a bargain purchase, the resulting gain is recognized in profit or loss for the period after reassessing whether all of the assets acquired and the liabilities assumed have been properly identified and following a review of the procedures used to measure the fair value of these amounts.
|
For each business combination, the Group chooses whether to measure the non-controlling interests in the acquireeacquire at fair value or at the proportional share of the net identifiable assets acquired.
If the fair value of all assets acquired and liabilities assumed at the acquisition date has not been completed, the Group reports the provisional values accounted for in the business combination. During the measurement period, which shall not exceed one year from the acquisition date, the provisional values recognized will be adjusted retrospectively as if the accounting for the business combination had been completed at the acquisition date, and also additional assets or liabilities will be recognized to reflect new information obtained onabout events and circumstances that existed on the acquisition date, but which were unknown to the management at that time. Comparative information for prior periods presented in the financial statements is revised as needed, including making any change in depreciation, amortization or other income effects recognized in completing the initial accounting.
For business combinations achieved in stages, the Company’s previously held equity interest in the acquire is remeasured to its acquisition date fair value and the resulting gain or loss, if any, is recognized in profit or loss.
2. Non-controlling interests in equity and in comprehensive income of the equity interest previously heldsubsidiaries are presented, respectively, under the line items “Total Equity: Non-controlling interests” in the acquired company’s equityconsolidated statement of financial position and “Net Income attributable to non-controlling interests” and “Comprehensive income (loss) attributable to non-controlling interests” in the consolidated statement of comprehensive income.
3. The financial statements of the Group companies operating in non- hyper-inflationary economies, with functional currencies other than the Chilean peso are translated as follows:
a. For assets and liabilities, the prevailing exchange rate on the closing date of the financial statements is measuredused.
b. For items of the comprehensive income, the average exchange rate for the period is used (unless this average is not a reasonable approximation of the cumulative effect of the exchange rates in effect on the dates of the transactions, in which case the exchange rate in effect on the date of each transaction is used).
c. For equity accounts the historical exchange rate from the date of acquisition or contribution is used, and retained earnings are translated at the average exchange rate at the date of origination.
d. Exchange differences arising in translation of financial statements are recognized in the item “Foreign currency translation gains (losses)” within the consolidated statement of comprehensive income in other comprehensive income (see Note 27.3).
4. The financial statements of the subsidiaries whose functional currency comes from hyper-inflationary economies, as is the case of the Argentine economy (see Note 7), are first adjusted for the inflation effect, and any gain or loss in the net monetary position is recognized in profit or loss; then all the results for that period.items (assets, liabilities, equity items,
| 2.
| Non-controlling interests in equity and in the comprehensive income of the consolidated subsidiaries are presented, respectively, under the line items “Total Equity: Non-controlling interests” in the consolidated statement of financial position and “Net Income attributable to non-controlling interests” and “Comprehensive income attributable to non-controlling interests” in the consolidated statement of comprehensive income.
|
F-33
| 3.
| The financial statements of entities with functional currencies other than the Chilean peso are translated as follows:
|
| a.
| For assets and liabilities, the prevailing exchange rate on
Table of Contents expenses and revenue) are translated using the closing exchange rate corresponding to the closing date of the financial statements is used. |
| b.
| For items in the comprehensive income statement, the average exchange rate for the period is used (unless this average is not a reasonable approximation of the cumulative effect of the exchange rates in effect on the dates of the transactions, in which case the exchange rate in effect on the date of each transaction is used).
|
| c.
| Equity remains at the historical exchange rate from the date of acquisition or contribution, and retained earnings at the average exchange rate at the date of origination.
|
| d.
| Exchange differences arising in translation of financial statements are recognized in the item “Foreign currency translation gains (losses)” in other comprehensive income (see Note 24.3).
|
In 2015, the assessment of the functional currencymost recent statement of Inversiones GasAtacama Holding Ltda. was revisedfinancial position.
5. Balances and we determinedtransactions between consolidated companies have been fully eliminated in the Chilean Pesoconsolidation process.
6. Changes in the ownership interests in subsidiaries that do not result in the Group obtaining or losing control are recognized as its functional currency. Our decisionequity transactions. The carrying amounts of the controlling and non-controlling interests are adjusted to changereflect the functional currency was made considering that upon integration of operations of this entity it became an extension of its immediate parent Endesa Chile, as such, havechanges in their relative interests in the same functional currency, that is, the Chilean peso. The change was applied prospectively.
| 4.
| Balances and transactions between consolidated entities were fully eliminated in the consolidation process.
|
| 5.
| Changes in interests in subsidiaries that do not result in obtaining or losing control are recognized as equity transactions, and the carrying amount of the controlling and non-controlling interests is adjusted to reflect the change in relative interest in the subsidiary. Any difference that may exist, between the value for which a non-controlling interest is adjusted and the fair value of a compensation paid or received, is recognized directly in Equity attributable to the shareholders of Enersis Chile.
|
| 6.
| Business combinations under common control are recorded using, as a reference, the ‘pooling of interest’ method. Under this method, the assets and liabilities involved in the transaction remain reflected at the same carrying amount at which they were recorded in the ultimate controlling company, although subsequent accounting adjustments may need to be made to align the accounting policies of the companies involved.
|
subsidiaries. Any difference between the amount by which the non-controlling interests are adjusted and the fair value of the consideration paid or received, is recognized directly in Equity attributable to shareholders of the Parent.
Business combinations between entities under common control are accounted for using, as a reference, the ‘pooling of interest’ method. Under this method, the assets and liabilities involved in the transaction remain reflected at the same carrying amounts at which they were recognized in the ultimate controlling company, although subsequent accounting adjustments may need to be made to align the accounting policies of the companies involved.
Any difference between assets and liabilities contributed to the consolidation and the compensation givenconsideration paid is recorded directly in Net equity as a debitcharge or credit to otherOther reserves. The Group does not apply retrospective accounting recognition ofstate comparative periods in its financial statements for business combinations under common control.
3. ACCOUNTING POLICIES. | ACCOUNTING POLICIES APPLIED.
|
The main accounting policies used in preparing the accompanying consolidated financial statements are the following:
a) Property, plant and equipment | a)
| Property, plant and equipment
|
Property, plant and equipment are measured at acquisition cost, net of accumulated depreciation and any impairment losses they may have experienced. In addition to the price paid to acquire each item, the cost also includes, where applicable, the following concepts:
| •
| Financing expenses accrued during the construction period that are directly attributable to the acquisition, construction, or production of qualified assets, which require a substantial period of time before being ready for use such as, for example,
|
| | electricity generation or distribution facilities. The Group defines “substantial period” as one that exceeds twelve months. The interest rate used is that of the specific financing or, if none exists, the weighted average financing rate of the company carrying out the investment. (See Note 15.b.1).
|
· Financing expenses accrued during the construction period that are directly attributable to the acquisition, construction, or production of qualified assets, which require a substantial period of time before being ready for use such as, for example, electricity generation or distribution facilities. The Group defines “substantial period” as one that exceeds twelve months. The interest rate used is that of the specific financing or, if none exists, the weighted average financing rate of the company carrying out the investment. (See Note 18.b.1).
·Employee expenses directly related to construction in progress. (See Note 15.b.2)18.b.2).
·Future disbursements that the Group will have to incur to close its facilities are added to the value of the asset at fair value, recognizing the corresponding provision for dismantling or restoration. The Group reviews its estimate of these future disbursements on an annual basis, increasing or decreasing the value of the asset based on the results of this estimate (See Note 22)25).
Items for construction work in progress are transferred to operating assets once the testing period has been completed and they are available for use, at which time depreciation begins.
Expansion, modernization or improvement costs that represent an increase in productivity, capacity or efficiency, or a longer useful life are capitalized as increasing the cost of the corresponding assets.
F-34
Table of Contents
The replacement or overhaul of entire components that increase the asset’s useful life or economic capacity are recorded as an increase in cost for the respective assets, derecognizing the replaced or overhauled components.
Expenditures for periodic maintenance, conservation and repair are recognized directly as an expense for the year in which they are incurred.
The Group, based on the outcome of impairment testing performed as explained in Note 3.e), considers that the carrying amount of assets does not exceed their recoverable amount.
Property, plant and equipment, net of its residual value, is depreciated by distributing the cost of the different items that comprise it on a straight-line basis over its estimated useful life, which is the period during which the Group expects to use the assets. Useful life estimates and residual values are reviewed on an annual basis and if appropriate adjusted prospectively.
The following table sets forthare the main categories of property, plant and equipment with their respective estimated useful lives:
| |
| |
Categories of Property, plant and equipment | | Years of estimated
useful lives | |
Buildings | | 10 – 60 | |
Plant and equipment | | 6 – 65 | |
IT equipment | | 3 – 15 | |
Fixtures and fittings | | 2 – 4035 | |
Motor vehicles | | 5 – 10 | |
Additionally, the following table sets forth more details on the useful lives of plant and equipment items:
Categories of Property, plant and equipment | |
| Years of estimated
useful lives | |
Generating facilities: | Years of estimated
useful lives
| |
Generating facilities:
| |
Hydroelectric plants | | | |
Civil engineering works | | 10 – 65 | |
Electromechanical equipment | | 10 – 4045 | |
Fuel oil/coal-fired power plants | | 25 – 40 | |
Combined cycle power plants | | 10 – 25 | |
Renewable energy power plants | | 20 | |
Transmission and distribution facilities: | | | |
High-voltage network | | 10 - 80– 60 | |
Low- and medium-voltage network | | 10 – 50 | |
Measuring and remote control equipment | | 10 – 50 | |
Primary substations | | 6 – 25 | |
Natural gas transport facilities | | | |
Pipelines | | 20 | |
Land is not depreciated since it has an indefinite useful life.
Gains or losses that arise from the sale or disposal of items of Property, plant and equipment are recognized as “Other gains (losses)” in the comprehensive income statement and are calculated by deducting the net carrying amount of the asset and any sales expenses from the amount received in the sale.
b) Investment property
“Investment property” includes basically land and buildings heldthat are kept for the purpose of earning rentals and/obtaining profits in future sales or for capital appreciation.lease arrangements.
F-35
Table of Contents
Investment property is measured at acquisition cost, less anynet of accumulated depreciation and any impairment losses thatthey may have been incurred.experienced. Investment property,properties, excluding land, isare depreciated by distributing the cost of the various elements that make them up on a straight-line basis over the years of useful lives of the related assets.life.
An investment property is derecognized uponon disposal, or when no future economic benefits are expected from its use or disposal.
Gains or losses on derecognitionthat arise from the sale or disposal of theitems of investment property isare recognized as “Other gains (losses)” in the comprehensive income statement and are calculated asby deducting the difference between the net disposal proceeds and the carrying amount of the asset.
Theasset and any sales costs from the consideration received in the sale.The breakdown of the fair value of investment property is detailed in Note 16.19.
Goodwill arising from business combinations, and reflected upon consolidation, represents the excess value of the consideration paid plus the amount of any non-controlling interests over the Group’s share of the net value of the assets acquired and liabilities assumed, measured at fair value at the acquisition date. If the accounting for a business combination is completed within the following year after the acquisition date, and so is the goodwill determination, the entity recognizes the corresponding adjustments to the provisional amounts as if the accounting for the business combination had been completed at the acquisition date. Thus, comparative informationIf the accounting for prior periods presented in financial statementsa business combination is revisedcompleted within the following year after the acquisition date, and thus the goodwill determination as needed, including making any change in depreciation, amortization or other income effects recognized in completingwell, the initial accounting.entity recognizes the corresponding adjustments to the provisional amounts as if the accounting for the business combination had been completed at the acquisition date (See Note 2.7.1).
Goodwill arising from acquisition of companies with functional currencies other than the Chilean peso is measured in the functional currency of the acquired company and translated to Chilean pesos using the exchange rate effective as of the date of the statement of financial position.
Goodwill is not amortized; instead, at the end of each reporting period or when there are indicators that an impairment might have occurred, the Group estimates whether any impairment loss has reduced its recoverable amount to an amount less than the carrying amount and, if so, an impairment loss is immediately recognized in profit or loss (See Note 3.e).
d) Intangible assets other than goodwill | d)
| Intangible assets other than goodwill
|
Intangible assets are initially recognized at their acquisition cost or production cost, and are subsequently measured at their cost, net of their accumulated amortization and impairment losses they may have experienced.
Intangible assets are amortized on a straight line basis during their useful lives, starting from the date when they are ready for use, except for those with an indefinite useful life, which are not amortized. As of December 31, 20162018 and 2015,2017, there are no significant intangible assets with an indefinite useful life.
An intangible asset is derecognized on disposal, or when no future economic benefits are expected from use or disposal.
Gains or losses arising from derecognition of an intangible asset, measured as the difference between the net disposal proceeds and the carrying amount of the asset are recognized in profit or loss when the asset is derecognized.
The criteria for recognizing these assets’ impairment losses and, if applicable, recovery of impairment losses recorded in previous fiscal yearsperiods are explained in Note 3.e below.
F-36
Table of Contents
d.1) Research and development expenses
The Group recognizes the costs incurred in a project’s development phase as intangible assets in the statement of financial position as long as the project’s technical feasibility and future economic benefits have been demonstrated.
Research costs are recorded as an expense in the consolidated statement of comprehensive income in the period in which they are incurred.
d.2) Other intangible assets
Other intangible assets correspond to computer software, water rights, and easements. They are initially recognized at acquisition or production cost and are subsequently measured at cost less accumulated amortization and impairment losses, if any.
Computer software is amortized (on average) over fivefour years. Certain easements and water rights have indefinite useful lives and, therefore, are not amortized, while others have useful lives ranging from 40 to 60 years, depending on their characteristics, and they are amortized over that term.amortized.
e) Impairment of non-financial assets | e)
| Impairment of non-financial assets
|
During the year, and principally at the end of each reporting period, the Group evaluates whether there is any indication that an asset has been impaired. If any such indication exist, the Group estimates the recoverable amount of that asset to determine the amount of the impairment loss. In the case of identifiable assets that do not generate cash flows independently, the Group estimates the recoverable amount of the Cash Generating Unit (CGU) to which the asset belongs, which is understood to be the smallest identifiable group of assets that generates independent cash inflows.
Notwithstanding the preceding paragraph, in the case of CGUsCGU’s to which goodwill or intangible assets with indefinite useful lives have been allocated, a recoverability analysis is performed routinely at each period end.
Recoverable amount is the higher of fair value less costs of disposal and value in use, which is defined as the present value of the estimated future cash flows. In order to calculate the recoverable amount of Property, plant, and equipment, as well as of goodwill, and intangible assets, the Group uses value in use criteria in practically all cases.
To estimate value in use, the Group prepares future pre-tax cash flow projections based on the most recent budgets available. These budgets incorporate management’s best estimates of a CGUs’CGU’s revenue and costs using sector projections, past experience and future expectations.
In general, these projections cover the next five years, estimating cash flows for subsequent years by applying reasonable growth rates which, in no case, are increasing rates nor exceed the average long-term growth rates for the particular sector and country in which the Group operates. For the years endedAs of December 31, 2016, 2015 and 2014,2018, the growth rate used to extrapolate the projections were extrapolated from the following rates:was 3.1%.
| | |
| | |
Growth rates (g) |
2016 | 2015 | 2014 |
4.6% – 4.7% | 4.5% – 5.1% | 2.2% – 5.0% |
Future cash flows are discounted to calculate their present value at a pre-tax rate that covers the cost of capital for the business activity and the geographic area in which it is being carried out. The time value of money and risk premiums generally used among analysts for the business activity and the geographic zone are taken into account to calculate the pre-tax rate.
The following are theminimum and maximum pre-tax discount rates applied in 2016, 2015 and 2014the period ended December 31, 2018 expressed in nominal terms:terms were 6.9% and 11.0%, respectively.
| | | | | |
| | | | | |
2016 | 2015 | 2014 |
Minimum | Maximum | Minimum | Maximum | Minimum | Maximum |
8.1% | 12.2% | 8.1% | 12.7% | 7.9% | 13.0% |
If the recoverable amount of the CGU is estimated to be less than the net carrying amount of the asset, the corresponding impairment loss is recognized for the difference, and charged to “Reversal of impairment loss (impairment loss)” recognized in profit or loss"loss” in the consolidated statement of comprehensive income. The impairment is first allocated to reduce the CGU’s goodwill carrying amount, ofif any, goodwill allocated to the CGU, and then to the other assets of the unit pro ratacomprising it, prorated on the basis of the carrying
F-37
Table of Contents
amount of each asset in the unit. The carrying amount of an asset is not reduced below the highest ofone, limited to its fair value less costs of disposal, or its value in use; or zero.use, a negative amount may not be obtained.
Impairment losses recognized in prior periods for an asset in prior periodsother than goodwill are reversed, whenif and only if, there are indicationshas been a change in the estimates used to determine the asset’s recoverable amount since the last impairment loss was recognized. If this is the case, the carrying amount of the asset is increased to its recoverable amount and crediting profit or loss, but so that the impairment loss no longer exists or may have decreased, thus increasing the asset’sincreased carrying amount with a credit to earnings. The increase in the asset’s carrying amount shalldoes not exceed thatthe carrying amount that would have been determined had no impairment loss been recognized for the asset. GoodwillIn the case of goodwill, impairment losses are not reversed in subsequent periods.reversed.
In order to determine whether an arrangement is, or contains, a lease, the Group assesses the economic substance of the agreement, in order to determine whether fulfillment of the arrangement depends on the use of a specific asset and whether the agreement conveys the right to use an asset. If both conditions are met, at the inception of the arrangement the Group separates the payments and other considerations relating to the lease, at their fair values, from those corresponding to other components of the agreement.
Leases that substantially transfer all the risks and rewards of ownership to the Group are classified as finance leases. All others leases are classified as operating leases.
Finance leases in which the Group acts as a lessee are recognized at the inception of the arrangement. At that time, the Group records an asset based on the nature of the lease and a liability for the same amount, equal to the fair value of the leased asset or the present value of the minimum lease payments, if the latter is lower. Subsequently, the minimum lease payments are apportioned between finance expenses and reduction of the lease obligation. Finance expenses are recognized immediately in the income statement and allocated over the lease term, so as to achieve a constant interest rate on the remaining balance of the liability. Leased assets are depreciated on the same terms as other similar depreciable assets, as long as there is reasonable certainty that the lessee will acquire ownership of the asset at the end of the lease. If no such certainty exists, the leased assets are depreciated over the shorter of the useful lives of the assets and their lease term.
In the case of operating leases, payments are recognized as an expense in the case of the lessee and as income in the case of the lessor, both on a straight-line basis, over the term of the lease unless another type of systematic basis of distribution is deemed more representative.
g) Financial instruments
Financial instruments are contracts that give rise to both a financial asset in one entity and a financial liability or equity instrument in another entity.
g.1) Financial assets other than derivatives
The Group classifies its non-derivative financial assets, other than derivatives, whether permanent or temporary, except forexcluding investments accounted for using the equity method (See Note 12)Notes 3.i and those15) and non-current assets and disposal groups held for sale or distribution to owners, into fourthree categories:
Loans·Amortized cost: This category includes the financial assets that meet the following conditions (i) the business model that supports it aims to maintain the financial assets to obtain the contractual cash flows, and account receivables: Trade(ii) the contractual terms of financial assets give rise on specific dates to cash flows that are solely payments of principal and other receivables andinterest (SPPI criterion).
Financial assets that meet the conditions established in IFRS 9, to be valued at amortized cost in the Group are: accounts receivable, from related companiesloans and cash equivalents. These assets are recognizedrecorded at amortized cost, which is the initial
F-38
Table of Contents
fair value, less repayments of principal, repayments made, plus uncollected accrued and uncollected interest, calculated using the effective interest rate method.
The effective interest rate method is used to calculatea method of calculating the amortized cost of a financial asset or a financial liability (or a group of financial assets or financial liabilities) and of allocating the finance income or cost overfinancial expenses throughout the relevant period. The effective interest rate is the discount rate that exactly discountsmatches the estimated future cash flows to be received or paid over the expected useful life of the financial instrument or,(or when appropriate in a shorter period toof time), with the net carrying amount of the financial asset or financial liability.
Held-to-maturity investments:· Investments that the Group intends to hold and is capable of holding until their maturity are accounted forFinancial Assets Recorded at amortized cost as defined in the preceding paragraph.
Financial assets at fair value with changes in net income:Fair Value through Other Comprehensive Income: This category includes the trading portfolio and those financial assets that have been designated as such upon initial recognition and thatthe meet the following conditions: (i) they are managed and evaluated onclassified in a fair value basis. They are measured inbusiness model, the consolidated statementpurpose of financial position at fair value, with changes in value recorded directly in income when they occur.
Available-for-sale financial assets: These arewhich is to maintain the financial assets specifically designated as available-for-sale or are not classify within any ofboth to collect the three preceding categories.contractual cash flows and to sell them, and (ii) the contractual conditions comply with the SPPI criterion.
These investments are recognized in the consolidated statement of financial position at fair value when it can be reliably determined. For investments in equity instrumentsis possible to determine reliably. In the case of holdings in unlisted companies or companies with lower levels oflow liquidity, normallyit is usually not possible to determine the fair value cannot be reliably measured. Whenreliably. Therefore, when this circumstance occurs, those investments in equity instrumentssuch holdings are measuredvalued at their acquisition cost less impairment losses,or for a lower amount if any.there is evidence of their impairment.
Changes in fair value, net of taxes,their tax effect, are recognizedrecorded in otherthe consolidated statement of comprehensive income: Other comprehensive income, until such time as the disposal of these investments are disposed of,takes place, at which time the accumulated amount accumulated in other comprehensive incomethis section is reclassified tofully posted in the profit or loss.loss for the period.
If
In the event that the fair value is lower than the acquisition cost, and if there is objective evidence that the asset has been more than temporarily impaired,suffered an impairment that can not be considered as temporary, the difference is recognizedrecorded directly in the losses for the period
·Financial Assets Recorded At Fair Value through Profit or Loss: This category includes the trading portfolio of the financial assets that have been allocated as such upon their initial recognition and which are administered and assessed according to the fair value criterion, and the financial assets that do not meet the conditions to be classified in the two above categories.
They are valued at fair value in the consolidated statement of financial position and any changes in value are recorded directly in profit or loss.
Purchases and sales of financial assets are accounted for using their trade date.loss when they occur.
g.2) Cash and cash equivalents
This item within the consolidated statement of financial position includes cash and bank balances, time deposits, and other highly liquid investments (with original maturity of less than or equal to 90 days) that are readily convertible to cash and are subject to insignificant risk of changes in value.
F-39
Table of Contents
g.3) Impairment of financial assets
Under IFRS 9, the Group applies an impairment model based on expected credit losses. The following criteria are usednew impairment model is applied to determine if a financial asset has been impaired:
For trade receivablesassets measured at amortized cost and those measured at fair value through other comprehensive income, except for investments in equity instruments.
Under IFRS 9, the electricity generation, transmission and distribution segments, the Group’s policy is to recognize impairment losses when there is objective evidence that the balance will not be recoverable. In general terms, the Group’s entities has a defined policy to recognize an allowance for impairment losses are measured based onon:
· 12 months expected credit losses; or
· Lifetime expected credit losses if the aging of past-due balances, except in those cases where a specific collective basis analysis is recommended, such as in the case of receivables from government-owned companies (See Note 8).
In the case of receivablescredit risk of a financial nature,asset at the reporting date has increased significantly since initial recognition.
The Group applies a simplified approach for trade receivables, contract assets and lease receivables so that are included in the “Loan and receivables” and “Investment held-to-maturity”, impairment is determinedalways recognized in reference to the lifetime expected credit losses for the asset.
Based on case-by-case basisthe reference market and is measuredthe regulatory context of the sector, as well as the difference betweenrecovery expectations after 90 days, for such accounts receivable, the carrying amount andGroup mainly applies a predetermined definition of 180 days to determine the present valueexpected credit losses, since this is considered an effective indicator of the future estimated cash flows discounted at the original effective interest rate (See Notes 7 and 20).
Fora significant increase in credit risk. Therefore, financial investments available-for-sale, the criteria for impairment appliedassets with an aging of more than 90 days are describedgenerally not considered to be in Note 3.g.1.default.
g.4) Financial liabilitiesliabilities other than derivatives
Financial liabilities are recognized based on cash received, net of any costs incurred in the transaction. In subsequent periods, these obligations are measured at their amortized cost using the effective interest rate method (see Note 3.g.1).
In the particular case that a liability is the hedged item in a fair value hedge, as an exception, such liability is measured at its fair value for the portion of the hedged risk.
In order to calculate the fair value of debt, both when it is recorded in the statement of financial position and for fair value disclosure purposes as shown in Note 20,22, debt has been divided into fixed interest rate debt (hereinafter “fixed-rate debt”) and variable interest rate debt (hereinafter “floating-rate debt”). Fixed-rate debt is that on which fixed-interest coupons established at the beginning of the transaction are paid explicitly or implicitly over its term. Floating-rate debt is that debt issued at a variable interest rate, i.e., each coupon is established at the beginning of each period based on the reference interest rate. All debt has been measured by discounting expected future cash flows with a market interest rate curve based on the payment currency.
g.5) Derivative financial instruments and hedge accounting
Derivatives held by the Group are transactions entered into to hedge interest and/or exchange rate risk, intended to eliminate or significantly reduce these risks in the underlying transactions being hedged.
Derivatives are recorded at fair value at the end of each reporting period as follows: if their fair value is positive, they are recorded within “Other financial assets”; and if their fair value is negative, they are recorded within “Other financial liabilities.” For derivatives on commodities, the positive fair value is recorded in “Trade and other receivables,” and negative fair values are recorded in “Trade and other liabilities.”
Changes in fair value are recordedrecognized directly in profit or loss, except when the derivative has been designated for hedge accounting purposes as a hedge instrument (in a cash flow hedge) and all of the conditions for applying hedge
F-40
Table of Contents
accounting established by IFRS are met, including that the hedge be highly effective. In this case, changes are recognized as follows:
·Fair value hedges: The underlying portion for which the risk is being hedged (hedged risk) and the hedge instrument are measured at fair value, and any changes in value of both items are recognized in the statement of comprehensive income by offsetting the effects in the same comprehensive income statement account.
·Cash flow hedges:Changes in the fair value of the effective portion of the hedged item and hedge instrument are recognized in other comprehensive income anand accumulated in an equity reserve known as “Reserve for cash flow hedges.”hedges”. The cumulative gainloss or lossgain in this reserve is reclassifiedtransferred to the consolidated statement of comprehensive income to the extent that the hedged item impacts the consolidated statement of comprehensive income offsetting the effect in the same comprehensive income statement account. Gains or losses from the ineffective portion of the hedginghedge relationship are recordedrecognized directly in the statement of comprehensive income.
A hedge
· Hedge accounting is discontinued only when the hedging relationship is considered highly effective when changes in fair value or in cash flows(or a part of the underlying item directly attributablerelationship) fails to meet the hedged risk are offset by changes in fair value or cash flowsrequired criteria, after making any rebalancing of the hedging relationship, if applicable. If it is not possible to continue the hedging relationship, including when the hedging instrument with an effectiveness ranging from 80%expires, is sold, settled or exercised, any gain or loss accumulated in equity at that date remains in equity until the projected transaction affects the statement of comprehensive. When a projected transaction is no longer expected to 125%.occur, the gain or loss accumulated in equity is immediately transferred to the income statement.
As a general rule, long-term commodity purchases or sales agreements are recognized in the statement of financial position at their fair value at the end of each reporting period, recognizing any differences in value directly in profit or loss, except for, when all of the following conditions are met:
·The sole purpose of the agreement is for the Group’sits own use, which is understood as: (i) in the case of fuel purchase agreements its usedsuch use is to generate electricity; (ii) in the case of electrical energy purchased for sale, its sale is to the end-customers; and (i)(iii) in the case of electricity sales its sale is to the end-customers.
·The Group’s future projections evidence the existence of these agreements for its own use.
·Past experience with agreements evidence that they have been utilized for the Group’s own use,are “own use” agreements, except in certain isolated cases when for exceptional reasons or reasons associated with logistical issues, they have been used for other purposes beyond the control and projectionexpectations of the Group.
·The agreement does not stipulate net settlement by differences and the parties have not made it a practice to net settle similar contracts with differences in the past.
The long-term commodity purchase or sale agreements maintained by the Group, which are mainly for electricity, fuel, and other supplies, meet the conditions described above. Thus, the purpose of fuel purchase agreements is to use them to generate electricity, electricity purchase contracts are used to sell to end-customers, and electricity sale contracts are used to sell the Group’s own products.
The Group also evaluates the existence of derivatives embedded in contracts or financial instruments to determine if their characteristics and risk are closely related to the host contract, provided that when taken as a whole they are not being accounted for at fair value. If they are not closely related, they are recorded separately and changes in value are accounted for directly in profit or loss.the statement of comprehensive income.
F-41
Table of Contents
g.6) Derecognition of financial assets and liabilities
Financial assets are derecognized when:
·The contractual rights to receive cash flows from the financial asset expire or have been transferred or, if the contractual rights are retained, the Group has assumed a contractual obligation to pay these cash flows to one or more recipients.
·The Group has substantially transferred all the risks and rewards of ownership of the financial asset, or, if it has neither transferred nor retained substantially all the risks and rewards, when it does not retain control of the financial asset.
Transactions in which the Group retains substantially all the inherent risks and rewards of ownership of the transferred asset, it continues recognizing the transferred asset in its entirety and recognizes a financial liability for the consideration received. Transactions costs are recognized in profit and loss by using the effective interest method (See Note 3.g.1).
Financial liabilities are derecognized when they are extinguished, that is, when the obligation arising from the liability has been paid or cancelled, or has expired.
g.7) Offsetting financial assets and liabilities.liabilities
The Group offsets financial assets and liabilities and the net amount is presented in the statement of financial position when, and only when:
There
· there is a legally enforceablebinding right to set offoffset the recognized amounts; and
There is an intention
· the Company intends to settle them on a net basis, or to realize the asset and settle the liability simultaneously.
The right of offset may only be legally enforceable in the normal course of business, or in the event of default, or in the event of insolvency or bankruptcy, of one or all of the counterparties.
g.8) Financial guarantee contracts
Financial
The financial guarantee contracts, suchdefined as the guarantees givenissued by the Group to third parties, are initially recognizedmeasured at their fair value, adjusting theadjusted for transaction costs that are directly attributable to the issuance of the guarantee.
Subsequently to initial recognition, financial guarantee contracts are measuredrecognized at the higher of:
·the amount of the liability determined underin accordance with the accounting policy describe in Note 3.l;3.m; and
·the amount of the asset initially recognized less, whenif appropriate, any accumulated amortization.accumulate amortization recognized in accordance with the revenue recognition policies described in Note 3.q.
F-42
| h)
| Measurement of fair value
|
The fair value of an asset or liability is defined as the price that would be received from the sale of an asset or paid to transfer a liability in an orderly transaction between market participants at the measurement date.
Fair value measurement assumes that the transaction to sell an asset or transfer a liability occurs in the principal market, namely, the market with the greatest volume and level of activity for that asset or liability. In the absence of a principal market, it is assumed that the transaction is carried out in the most advantageous market available to the entity, namely, the market that maximizes the amount that would be received to sell the asset or minimizes the amount that would be paid to transfer the liability.
In estimating fair value, the Group uses valuation techniques that are appropriate for the circumstances and for which there areis sufficient data to conductperform the measurement. The Groupmeasurement where it maximizes the use of relevant observable data and minimizes the use of unobservable data.
Considering
Given the hierarchy of theexplained below, data used in thesethe valuation techniques, the assets and liabilities measured at fair value can be classified intoat the following levels:
| |
Level 1·Level 1: Quoted prices (unadjusted) in active markets for identical assets or liabilities; ·Level 2: Inputs other than quoted prices included within Level 1 that are observable for the assets or liabilities, either directly (i.e. as prices) or indirectly (i.e. derived from prices). The methods and assumptions used to determine the fair values at Level 2 by type of financial assets or financial liabilities take into consideration estimated future cash flows discounted at market rates. Future cash flows for financial assets and financial liabilities are discounted with the zero coupon interest rate curves for each currency (these valuations are carried out using external tools such as Bloomberg); and ·Level 3: Inputs for assets or liabilities that are not based on observable market data (unobservable inputs).
| Quoted prices (unadjusted) in active markets for identical assets or liabilities;
|
| |
Level 2:
| Inputs other than quoted prices included within Level 1 that are observable for the assets or liabilities, either directly (i.e. as prices) or indirectly (i.e. derived from prices). The methods and assumptions used to determine the fair values at Level 2 by type of financial asset or financial liability take into consideration estimated future cash flows discounted at zero coupon interest rate curves for each currency. All the valuations described are carried out using external tools, such as “Bloomberg”.
|
| |
Level 3:
| Inputs for assets or liabilities that are not based on observable market data (unobservable inputs).
|
The Group takes into account the characteristics of the asset or liability when measuring fair value, in particular:
·For non-financial assets, fair value measurement takes into account the ability of a market participant to generate economic benefits by using the asset in its highest and best use or by selling it to another market participant that would use the asset inat its highest and best use;
·For liabilities and equity instruments, the fair value measurement assumes that the liability would not be settled and an equity instrument would not be cancelled or otherwise extinguished on the measurement date. The fair value of the liability reflects the effect of non-performance risk, namely, the risk that an entity will not fulfill the obligation, which includes but is not limited to, the Group’sCompany’s own credit risk;
·For derivatives not quoted in an organized market,traded on active markets, the Group measures fair value is determined by using the discounted cash flow method and generally accepted options valuation models, based on current and future market conditions as of year-end.the close of the financial statements. This methodology also adjusts the value based on the Company’s own credit risk (Debt Valuation Adjustment, DVA), and the counterparty risk (Credit Valuation Adjustment, CVA). These CVA and DVA adjustments are measured on the basis of the potential future exposure of the instrument (creditor or borrower position) and the risk profile of both the counterparties and the Group itself.
In the case of· For financial assets and financial liabilities with offsetting positions in market risks or counterparty credit risks, it is permitted to measure the fair value on a net basis. However, this must be consistent with the manner in which market participants would price the net risk exposure at the measurement date.
Financial assets and liabilities measured at fair value are disclosedshown in Note 20.3.23.3.
F-43
| i)
| Investments accounted for using the equity method
|
The Group’s interests in joint ventures and associates are recognized using the equity method.
Under the equity method, an investment in an associate or joint venture is initially recognized at cost. As of the acquisition date, the investment is recognized in the statement of financial position based on the share of its equity that the Group’s interest represents in its capital, adjusted for, if appropriate, the effect of transactions with Group’s entities,the Group plus any goodwill generated in acquiring the entity.company. If the resulting amount is negative, zero is recorded for that investment in the statement of financial position, unless the Group has a present obligation (either legal or constructive) to support the investee’s negative equity situation, in which case a provision is recognized.
Goodwill from associatesthe associate or joint venturesventure is included in the carrying amount of the investment. It is not amortized but is subject to impairment testing as part of the overall investment carrying amount when impairmentthere are indicators exist.of impairment.
Dividends received from these investments are deducted from the carrying amount of the investment, and any profit or loss obtained from them to which the Group is entitled based on its ownership interest is recognized under “Share of profit (loss) of associates accounted for using equity method.”
Appendix 3.
The companies classified as “Associates and Joint Ventures” to(see Note 2.5 and 2.6 respectively) in these consolidated financial statements describes the relationship of the Company and each of these companies.are accounted for under this method.
j) Inventories | j)
| Inventories
|
Inventories are measured at their weighted average acquisition cost or the net realizable value, whichever is lower.
The net realizable value is the estimated selling price in the ordinary course of business less the estimated costs necessary to make the sale.
The cost of inventories includes all costs of purchase and all necessary costs incurred in bringing the inventories to their present location and condition. Trade discounts, rebates and other similar items are deducted in determining the costs of purchase. k) Non-current assets (or disposal group of assets) held for sale or held for distribution to owners and discontinued operations. | k)
| Non-current assets held for sale and discontinued operations
|
Non-current assets, including property, plant and equipment; intangible assets; investments accounted for using the equity method, joint ventures, and disposal groups (a group of assets to be disposed of and the liabilities directly associated with those assets), are classified as:
· Held for sale, if their carrying amount will be recovered principally through a sale transaction rather than through continuing use; or · Held for distribution to owners, when the entity is committed to distribute the assets (or disposal groups) to the owners. | -
| Held for sale, if their carrying amount will be recovered principally through a sale transaction rather than through continuing use
|
| -
| Held for distribution to owners, when the Company is committed to distribute the asset (or disposal group) to the owners.
|
For the above classification, the assets must be available for immediate sale or distribution in their present condition and its sale or distribution is highly probable. For this transaction to be considered highly probable, management must
F-44
Table of Contents
be committed to the sale or distribution and actions to complete the transaction must have been initiated and should be expected to be completed within one year from the date of classification.
Actions required to complete the sale or distribution plan should indicate that it is unlikely that significant changes to the plan will be made or that the plan will be withdrawn. The probability of shareholders’ approval (if required in the jurisdiction) should be considered as part of the assessment of whether the sale or distribution is highly probable.
Non-current assets or disposal groups held-for-sale or held for distribution to owners are measured at the lower of their carrying amount and fair value less costs to sell or costs to distribute, as appropriate.
Depreciation and amortization on these assets cease when they meet the criteria to be classified as non-current assets held for sale or held for distribution to owners.
Assets that are no longer classified as held for sale or held for distribution to owners, or are no longer part of a disposal group, are measured at the lower of their carrying amounts before being classified as held for sale or held for distribution less any depreciations, amortizations or revaluations that would have been recognized if they had not been classified as held for sale or held for distribution to owners and their recoverable amount at the date of subsequent decision where would be reclassified as non-current assets.
Non-current assets held for sale and the components of the disposal groups classified as held for sale or held for distribution to owners are presented in the consolidated statement of financial position as a single line item within assets called “Non-current assets or disposal groups held for sale or for distribution to owners,” and the respective liabilities are presented as a single line item within liabilities called “Liabilities included in disposal groups held for sale or for distribution to owners.”
The Group classifies as discontinued operations those components of the Group that either have been disposed of, or are classified as held for sale, and:
(i) represents a separate major lines of business or geographical area of operations; (ii) is a part of a single coordinated plan to dispose a separate major line of business or geographical area of operations; or (iii) is a subsidiary acquired exclusively with a view to resale. | (i)
| represents a separate major lines of business or geographical area of operations;
|
| (ii)
| is a part of a single coordinated plan to dispose a separate major line of business or geographical area of operations; or
|
| (iii)
| is a subsidiary acquired exclusively with a view to resale.
|
The components of profit or loss after taxes from discontinued operations and the post-tax gain or loss recognized on the measurement to fair value less costs to sell or on the disposal of the assets or groups constituting the discontinued operation are presented as a single line item in the consolidated comprehensive income statement as “Income after tax from discontinued operations”.
l) Treasury shares Treasury shares are deducted from equity in the consolidated statement of financial position and measured at acquisition cost. Gains and losses from the disposal of treasury shares are recognized directly in “Equity — Retained earnings”, without affecting profit or loss for the period. m) Provisions | l)
| Provisions
|
Provisions are recognized when the Group has a present obligation (legal or constructive) as a result of a past event, it is probable that an outflow of economic benefits will be required to settle the obligation, and a reliable estimate can be made of the amount of the obligation.
F-45
Table of Contents
The amount recognized as a provision is the best estimate of the consideration required to settle the present obligation at the end of the reporting period, taking into account the risks and uncertainties surrounding the obligation. When a provision is measured using the cash flows estimated to settle the present obligation, its carrying amount is the present value of those cash flows (when the effect of the time value of money is material). The unwinding of the discount is recognized as finance cost. Incremental legal cost expected to be incurred in resolving a legal claim is included in measuring of the provision.
Provisions are reviewed at the end of each reporting period and adjusted to reflect the current best estimate. If it is no longer probable that an outflow of resources embodying economic benefits will be required to settle the obligation, the provision is reversed.
A contingent liability does not result in the recognition of a provision. Legal costs expected to be incurred in defending a legal claim are expensed as they are incurred. Significant contingent liabilities are disclosed unless the likelihood of an outflow of resources embodying economic benefits is remote.
l.1)m.1) Provisions for post-employment benefits and similar obligations
Some of the Group’s subsidiaries have pension and similar obligations to their employees. Such obligations, which combinerelated to defined benefits and defined contributions,plans, are basically formalized through pension plans, except for certain non-monetary benefits, mainly electricity supply commitments, which, due to their nature, have not been externalized and are covered by the related in-house provisions.
For defined benefit plans, the cost of providing benefits is determined using the Projected Unit Credit Method, with actuarial valuations being carried out at the end of each reporting period. Past service costs relating to changes in benefits are recognized immediately.
The defined benefit plan obligations in the statement of financial position represent the present value of the accrued obligations, adjusted, once the fair value of the different plans’ assets has been deducted, if any.
For each of the defined benefit plans, any deficit between the actuarial liability and the plan assets (if any) is recognized under line item “Provisions for employee benefits” within current and non-current liabilities in the statement of financial position.
Actuarial gains and losses arising in measurementmeasurements of both the plan liabilities and the plan assets (if any, and excluding interest) are recognized directly in other comprehensive income.
Contributions to defined contribution benefit plans are recognized as an expense in the statement
n) Translation of comprehensive income when the employees have rendered their services.foreign currency balances
| m)
| Translation of foreign currency balances
|
Transactions carried out by each entity in a currency other than its functional currency are recognized using the exchange rates prevailing as of the date of the transactions. During the year, any differences that arise between the prevailing exchange rate at the date of the transaction and the exchange rate as of the date of collection or payment are recognized as “Foreign currency exchange differences” in the consolidated statement of comprehensive income.
Likewise, at the end of each reporting period, receivable or payable balances denominated in a currency other than each entity’s functional currency are translated using the closing exchange rate. Any differences are recorded as “Foreign currency exchange differences” in the consolidated statement of comprehensive income.
The Group has established a policy to hedge the portion of revenue from its consolidated entities that is directly linked to variations in the U.S. dollar, through obtaining financing in such currency. Exchange differences related to this debt, which is regarded as the hedging instrument in cash flow hedge transactions, are recognized, net of taxes, in other comprehensive income and are accumulated in an equity reserve and reclassified to profit or loss when the hedged cash flows impactaffect profit or loss. This term has been estimated at fiveten years.
o) Current/non-current classification | n)
| Current/non-current classification
|
In these consolidated statements of financial position, assets and liabilities expected to be recovered or settled within twelve months are presented as current items, except for post-employment and other similar obligations. Those
F-46
Table of Contents
assets and liabilities expected to be recovered or settled in more than twelve months are presented as non-current items. Deferred income tax assets and liabilities are classified as non-current.
When the Group have any obligations that mature in less than twelve months but can be refinanced over the long term at the Group’s discretion, through unconditionally available credit agreements with long-term maturities, such obligations are classified as long-termnon-current liabilities.
p) Income taxes | o)
| Income taxes
|
Income tax expense for the period is determined as the sum of current taxes from each of the Group’s different entitiessubsidiaries and results from applying the tax rate to the taxable income for the period, after permitted deductions have been made, plus any changes in deferred tax assets and liabilities and tax credits, both for tax losses and deductions. Differences between the carrying amount and tax basis of assets and liabilities generate deferred tax assets and liabilities, which are calculated using the tax rates expected to apply when the assets and liabilities are realized or settled, based on tax rates that have been enacted or substantively enacted by the end of the reporting period.
Deferred tax assets are recognized for all deductible temporary differences, tax losses and unused tax credits to the extent that it is probable that sufficient future taxable profits exist to recover the deductible temporary differences and make use of the tax credits. Such deferred tax asset is not recognized if the deductible temporary difference arises from the initial recognition of an asset or liability that:
·
Did not arise from a business combination, and
·At initial recognition affected neither accounting profit nor taxable profit (loss).
With respect to deductible temporary differences associated with investments in subsidiaries, associates and joint arrangements, deferred tax assets are recognized only to the extent that it is probable that the temporary differences will reverse in the foreseeable future and taxable profits will be available against which the temporary differences can be utilized.
Deferred tax liabilities are recognized for all temporary differences, except those derived from the initial recognition of goodwill and those that arose from investments in subsidiaries, associates and joint ventures in which the Group can control their reversal and where it is probable that they will not be reversed in the foreseeable future.
Current tax and changes in deferred tax assets or liabilities are recorded in profit or loss or in equity, depending on where the gains or losses that triggered these tax entries have been recognized.
Any tax deductions that can be applied to current tax liabilities are credited to earnings within the line item “Income tax expenses”, except when exists uncertainty about their tax realization, in which case they are not recognized until they are effectively realized, or when they correspond to specific tax incentives, in which case they are recorded as government grants.
At the end of each reporting period, the Group reviews the deferred taxes assets and liabilities recognized, and makes, if any, necessary corrections based on the results of this analysis.
Deferred tax assets and deferred tax liabilities are offset in the consolidated statement of financial position if has a legally enforceable right to set off current tax assets against current tax liabilities, and only when the deferred taxes relate to income taxes levied by the same taxation authority.
q) Revenue and expense recognition | p)
| Revenue and expense recognition
|
Revenue is recognized when (or as) the gross inflowcontrol over a good or service is transferred to the customer. Revenue is measured based on the consideration to which it is expected to be entitled for said transfer of economiccontrol, excluding the amounts collected on behalf of third parties.
F-47
Table of Contents
The Group analyzes and takes into consideration all the relevant facts and circumstances for revenue recognition, applying the five step of the model established by IFRS 15: 1) Identifying the contract with a customer; 2) Identifying the performance obligations; 3) Determining the transaction price; 4) Allocating the transaction price; and 5) Recognizing revenue.
The following are the criteria for revenue recognition by type of good or service provided by the Group:
· Electricity supply (sale and transportation): Corresponds to a single performance obligation that transfers to the customer a number of different goods/services that are substantially the same and that have the same transfer pattern. Since the customer receives and simultaneously consumes the benefits arisingprovided by the Company, it is considered a performance obligation met over time. In these cases, Enel Chile applies an output method to recognize revenue in the course ofamount to which it is entitled to bill for electricity supplied to date.
· Generation: revenue is recorded according to the Group’s ordinary activities in the period occurs, provided that this inflow of economic benefits results in an increase in total equity other than increases relating to contributions from equity participants and such benefits can be measured reliably.
Revenues and expenses are recognized on an accrual basis and depending on the type of transaction; the following criteria for recognition are taken:
Generation and transmission of electricity: Revenue is recognized based on physical deliverydeliveries of energy and power, at the prices established in the respective contracts, at the prices stipulated in the electricity market by applicablethe current regulations, or at the marginal cost determinedof energy and power, depending on whether they are unregulated, regulated customers or energy trading in the spot market as appropriate. This revenue includes an estimate of the service provided and not billed until the closing date (See Note 2.3 and 25).are involved, respectively.
·Distribution of electricity:electricity: Revenue is recognized based on the amount of energy supplied to customers during the period, at prices established in the respective contracts or at prices stipulated in the electricity market by applicable regulations, as appropriate.
This revenue includes an estimate of the energy supplied butservice provided and not billed and for whichinvoiced at the customers’ meters have not been read yetbalance sheet date (See Note 2.3 and 25)Note 28).
· Sale and Transportation of Gas: Revenue from renderingis recognized over time, based on the actual physical deliveries of gas in the period of consumption, at the prices established in the respective contracts.
· Other services: mainly the provision of supplementary services is only recognized when it can be estimated reliably, by reference to the stageelectricity business, construction of completionworks and engineering and consulting services. Customers control committed assets as they are created or improved. Therefore, the Company recognizes this revenue over time based on the progress, measuring progress through output methods (performance completed to date , milestones reached, etc.), or resource methods (resources consumed, hours of labor spent, etc.), as appropriate in each case.
· Sale of goods: revenue from the service rendered at the date of the statement of financial position. When the outcome of a transaction involving the rendering of services cannot be estimated reliably, revenue is recognized only to the extent of the expenses recognized that are recoverable. (See Note 25)
Revenue from salessale of goods is recognized based on the economic substanceat a certain time, when control of the transaction and are recognized when all and each of the following conditions are met:
the entity hasgoods have been transferred to the buyer, which generally occurs at the significant risks and rewards of ownershiptime of the goods;
physical delivery of the entity retains neither continuing managerial involvementgoods. Revenues are measured at the independent sale price of each good, and any type of applicable variable compensation.
In contracts in which multiple committed goods and services are identified, the recognition criteria will be applied to each of the degree usually associated with ownership nor effective control over the goods sold;
the amount of revenue can be measured reliably;
it is probable that the economic benefits associated with the transaction will flow to the entity; and
the costs incurred or to be incurred in respectidentifiable performance obligation of the transaction, can be measured reliably.
Revenuebased on the control transfer pattern of each good or service that is measured at the fair valueseparate and an independent selling price allocated to each of the consideration received or receivable that gives rise to the revenue.
In arrangements under which the Group will perform multiple revenue-generating activities (multiple-element arrangement), the recognition criteria are applied to the separately identifiable components of the transaction in order to reflect the substance of the transactionthem, or to two or more transactions togetherjointly, when theythese are linked to contracts with customers that are negotiated with a single commercial purpose and the goods and services committed represent a single performance obligation and their selling prices are not independent.
Enel Chile determines the existence of significant financing components in suchits contracts, adjusting the value of the consideration if applicable, to reflect the effects of the time value of money. However, the Group applies the practical solution provided by IFRS 15, and will not adjust the value of the consideration committed for the purpose of a waysignificant financing component, if the Company expects, at the beginning of the contract, that the commercial effect cannot be understood without referenceperiod between the payment and the transfer of goods or service to the seriescustomer is one year or less.
F-48
Table of transactions as a whole.Contents
The Group excludes fromthe gross revenue those gross inflows of economic benefits it receivesreceived when it actsacting as an agent or commission agentbroker on behalf of third parties andfrom the revenue figure. The Group only recognizesrecords as revenue economic benefits received for its own activity.the payment or commission to which it expects to be entitled.
WhenGiven that the Company mainly recognizes revenue for the amount to which it has the right to invoice, it has decided to apply the practical disclosure solution provided in IFRS 15, through which it is not required to disclose the aggregate amount of the transaction price allocated to the obligations of performance not met (or partially not met) at the end of the reporting period.
In addition, the Group evaluates the existence of incremental costs of obtaining a contract and costs directly related to the fulfillment of a contract. These costs are recognized as an asset, if their recovery is expected, and amortized in a manner consistent with the transfer of the related goods or services are exchanged or swapped for goods or servicesservices. The incremental costs of obtaining a similar nature and value, the exchange is not regarded as a revenue-generating transaction.
The Group recognizes the net amount of non-financial asset purchase or sale contracts that are settled for a net amount of cash or through some other financial instruments. Contracts entered into and maintained for the purpose of receiving or delivering these non-financial assetscontract are recognized onas an expense, if the basisdepreciation period of the contractual terms ofasset that has been recognized is one year or less. Costs that do not qualify for capitalization are recognized as expenses at the purchase, sale, or usage requirements expected bytime they are incurred, unless they are explicitly attributable to the entity.customer.
Financial income (expense)
Interest revenue (expenses) is recognized using(are) recorded considering the effective interest rate applicable to the outstanding principal overwith pending amortization, during the repaymentcorresponding accrual period.
Expenses are recognized on an accruals basis, immediately in the event of expenditures that do not generate future economic benefits or when they do not meet the requirements for recognizing them as assets.
r) Earnings per share | q)
| Earnings per share
|
Basic earnings per share are calculated by dividing net income attributable to shareholders of the Parent Company by the weighted average number of ordinary shares outstanding during the period, excluding the average number of shares of the Parent Company held by other subsidiaries within the Group, if any.
Basic earnings per share for continuing and discontinued operations are calculated by dividing net income from continuing and discontinued operations attributable to shareholders of the Parent Company (the numerator) by the weighted average number of ordinary shares outstanding (the denominator) during the year, excluding the average number of shares of the Parent Company held by other subsidiaries within the Group, if any.
During
Diluted EPS is calculated by dividing net income to shareholders of the years ended December 31, 2016, 2015 and 2014,Parent Company by the Group did not engage inweighted average number of ordinary shares outstanding during the period plus the weighted average number of ordinary shares that would be issued on conversion of all the dilutive potential ordinary shares into ordinary shares, if any transaction of any kind with potential dilutive effects leading to diluted earnings per share that could differ from basic earnings per share.
Article No. 79 of the Chilean CompaniesCorporations Act Law No. 18,046; establishes that, unless unanimously agreed otherwise by the shareholders of all issued shares, listed corporations must distribute a cash dividend to shareholders on an annual basis, pro rata to the shares owned or the proportion established in the company’s by-laws if there are preferred shares, of at least 30% of net income for each period, except when accumulated losses from prior years must be absorbed.
As it is practically impossible to achieve a unanimous agreement given the Company’s highly fragmented share capital, at the end of each reporting period the amount of the minimum statutory dividend obligation to its shareholders is determined, net of interim dividends approved during the fiscal year, and then accounted for in “Trade and other current payables” and “Accounts payable to related companies”, as appropriate, and recognized in equity.
Interim and final dividends are deducted from equity as soon as they are approved by the competent body, which in the first case is normally the Company’s Board of Directors and in the second case is the shareholders as agreed at anOrdinary Shareholders’ Meeting.
F-49
Table of Contents t) Share issuance costs Share issuance costs, only when they represent incremental expenses directly attributable to the transaction, are recognized directly in net equity as a deduction from “Share premiums,” net of any applicable taxes. If the share premium account has a zero balance or if the costs described exceed the balance, they are recognized in “Other reserves.” u) Statement of cash flows | s)
| Statement of cash flows
|
The statement of cash flows reflects changes in cash and cash equivalents that took place during the period, determined with the direct method. It uses the following expressions and corresponding meanings:
| -
| Cash flows: inflows and outflows of cash or cash equivalents, which are defined as highly liquid investments maturing in less than three months with a low risk of changes in value.
|
| -
| Operating activities: the principal revenue-producing activities of the Group and other activities that cannot be considered investing or financing activities.
|
| -
| Investing activities: the acquisition and disposal of long-term assets and other investments not included in cash and cash equivalents.
|
| -
| Financing activities: activities that result in changes in the size and composition of the total equity and borrowings of the Group.
|
4.
| SECTOR REGULATION AND ELECTRICITY SYSTEM OPERATIONS.
|
· Cash flows: inflows and outflows of cash or cash equivalents, which are defined as highly liquid investments maturing in less than three months with a low risk of changes in value.
· Operating activities: the principal revenue-producing activities of the Group and other activities that cannot be considered investing or financing activities.
· Investing activities: the acquisition and disposal of long-term assets and other investments not included in cash and cash equivalents.
· Financing activities: activities that result in changes in the size and composition of the total equity and borrowings of the Group.
4. SECTOR REGULATION AND ELECTRICITY SYSTEM OPERATIONS.4.1
a) Regulatory framework:
The electricity sector is regulated by the General Law of Electrical Services No. 20,018 (Chilean Electricity Law), also known as DFL No. 1 of 1982, of the Ministry of Mining, whose compiled and coordinated text was established in DFL No. 4 issued in 2006 by the Ministry of Economy (the Electricity Law), as well as by an associated Regulation (D.S. No. 327 issued in 1998).
Three government bodies are primarily responsible for enforcing this law: the National Energy Commission (CNE in its Spanish acronym), which has the authority to propose regulated tariffs (node prices) and to draw up indicative plans for the construction of new generating units; the SuperintendenceSuperintendency of Electricity and Fuels (SEC in its Spanish acronym)(SEF), which supervises and oversees compliance with the laws, regulations, and technical standards that govern the generation, transmission, and distribution of electricity, as well as liquid fuels, and gas; and the Ministry of Energy, which is responsible for proposing and guiding public policies on energy matters. It also oversees the SEC,SEF, the CNE, and the Chilean Commission for Nuclear Energy (CChNE(CChEN in its Spanish acronym), thus strengthening coordination and allowing for an integrated view of the energy sector. The Ministry of Energy also includes the Agency for Energy Efficiency and the National Center for Innovation and Development of Sustainable Energy (Centro Nacional para la Innovación y Fomento de las Energías Sustentables, – or CIFES). The Chilean Electricity Law has also established a Panel of Experts whose main task is to resolve potential discrepancies among the participants in the electricity market, including electricity companies, system operators, regulators, etc.
From a physical viewpoint,point of view, the Chilean electricalpower sector is divided into fourthree electrical grids: the Sistema Interconectado Central (SIC), the Sistema Interconectado del Norte Grande (SING),Electrico Nacional (SEN) and two separate medium-size grids located in southern Chile, one in Aysén and the other in Magallanes. The SEN was incoroporated in November 2017 through the interconnection of the Sistema Interconectado Central (SIC) and the Sistema Interconectado del Norte Grande (SING). Prior to the interconnection, the SIC was the main electrical grid, runsrunning 2,400 kmkm. longitudinally and connectsconnecting the country from Taltal in the north, to Quellon,Quellón on
F-50
Table of Contents
the island of ChiloeChiloé in the south. TheOn the other hand, the SING coverscovered the northern part of the country, from Arica down to Coloso, covering a length of someabout 700 km. Currently, the project for the interconnection of the SIC with the SING is being developed.
The electricity industry is organized into three business segments:activities: generation, transmission, and distribution, all operating in an interconnected and coordinated manner, and whose main purpose is to supply electrical energy to the market at minimum cost while maintaining the quality and safety service standards required by the electrical regulations. As essential services, the power transmission and distribution businesses are natural monopolies; these segments are regulated as such by the Electricity Law, which requires free access to networks and regulates tariffs.
Under the Chilean Electricity Law, the electricity market coordinates their operations through a centralizing operating agent, the Coordinador Eléctrico Nacional (CISEN), in order to operate the system at minimum cost while maintaining reliable service, and the current SIC and SING systems, and in 2017, the National Electricity System.SEN. The CISEN plans and operates the systems, including the calculation of the so-called “marginal cost,” which is the price assigned to energy transfers among power generating companies.
Consumers are classified according to the size of their demand in regulated or free clients. Regulated customers are those customers who have a connected capacity of less than 5,000 kW. Without prejudice to this, customers with power connected between 500 kW and 5,000 kW may opt for a free or regulated rate regime.
Limits on integration and concentration
Chile has legislation in effect that defends free competition and, together with specific regulations that apply to the electricity market, defines criteria to avoid certain levels of economic concentration and/or abusive market practices.
In principle, the regulator allows the participation of companies in different activities (e.g. generation, distribution, and commercialization) as long as there is an adequate separation of each activity, for both accounting and company purposes. Nevertheless, most of the restrictions imposed involve the transmission sector mainly due to its nature and to the need to guarantee adequate access to all agents. In Chile, there are specific restrictions if generation or distribution companies want to become majority shareholders in transmission companies.
With regard to concentration in a specific sector, while there are regulations on free competition, there are no specific quantitative limits on vertical or horizontal integration. However, the General
The Chilean Electricity Law on Electrical Services establishes limits for participation of generatinggeneration or distributingdistribution companies in the Trunk Transmission Systems, and prohibits participation of Trunk Transmission Systems’ companies from participating in the generation and distribution segment.
4.1.1
a.1 Generation Segment
Generation companies must comply with the operation plan of the CISEN. However, each generation company is free to decide whether to sell its energy to regulated or unregulated customers. Any surplus or deficit between a company’s sales to its customers and its energy supply is sold to, or purchased from, other generators at the spot market priceprice.
A generation company may have the following types of customers:
(i) Unregulated customers: Those customers, mainly industrial and mining companies, with a connected capacity higher than 5,000 kW. These customers can freely negotiate prices for electrical supply with generators and/or distributors. Those customers with connected capacity between 500 and 5,000 kW have the option to contract energy at prices agreed upon with their suppliers or be subject to regulated prices, with a minimum term of at least four years under each pricing system.
(ii) Distribution companies that supply power to regulated customers: Participation in public tenders regulated by the CNE for the supply to their unregulated customers through bilateral contracts.
(iii) Spot market: This represents energy and capacity transactions among generating companies that result from the CISEN’s coordination to keep the system running as economically as possible, where the surpluses (deficits) between a generator’s energy supply and the energy it needs to comply with business commitments are transferred through sales (purchases) to (from) other generators in the CISEN. In the case of energy,
F-51
Table of Contents transfers are valued at the marginal cost, while node prices for capacity are set every semester by the regulators. | (i)
| Unregulated customers: Those customers, mainly industrial and mining companies, with a connected capacity higher than 5,000 kW. These customers can freely negotiate prices for electrical supply with generators and/or distributors. Those
|
| | customers with connected capacity between 500 and 5,000 kW have the option to contract energy at prices agreed upon with their suppliers or be subject to regulated prices, with a minimum term of at least four years under each pricing system.
|
| (ii)
| Distribution companies that supply power to regulated customers: Participation in public tenders regulated by the CNE for the supply to their free customers through bilateral contracts.
|
| (iii)
| Spot market: This represents energy and capacity transactions among generating companies that result from the CISEN’s coordination to keep the system running as economically as possible, where the surpluses (deficits) between a generator’s energy supply and the energy it needs to comply with business commitments are transferred through sales (purchases) to (from) other generators in the CISEN. In the case of energy, transfers are valued at the marginal cost, while node prices for capacity are set every semester by the regulators.
|
In Chile, the capacity that must be paid to each generator depends on an annual calculation performed by the CISEN to determine the firmsufficiency capacity of each power plant, which is not the same as the dispatched capacity.
Non-Conventional Renewable Energy
Law No. 20,257 was enacted in April of 2008 to encourage the use of Non-Conventional Renewable Energy (NCRE). The principal aspect of this law is that at least 5% of the energy sold by generation companies to their customers must come from renewable sources between years 2010 and 2014. This requirement progressively increases by 0.5% from 2015 until 2024, when a 10% renewable energy requirement will be reached. This law was amended in 2013 by Law No. 20,698, dubbed the “20/25 law,” as it establishes that by 2025, 20% of energy supplied will be generated by NCRE. It does not change the previous law’s plan for supplying energy under agreements in effect in July 2013.
4.1.2.
a.2 Transmission Segment
The transmission segment is comprised of a combination of lines, substations and equipment for the transmission of electricity from the production points (generators) to the centers of consumption or distribution, which do not correspond to distribution facilities. The transmission segment is divided into National Transmission System, Development Poles Transmission System, Zonal Transmission System and Dedicated Transmission System. The International Interconnection Systems, which are governed by special rules, are also part of the transmission segment.
The transmission system is open access, and transmission companies may impose rights of way over the available transmission capacity under non-discriminatory conditions. The fees of the existing facilities of the National and Zonal Transmission Systems is determined through a tariff setting process that is carried out every four years. In that process, the Annual Value of the Transmission is determined, which comprises efficient operation and maintenance costs and the annuity of the investment value, determined on the basis of a discount rate fixed by the authority on a quarterly basis (minimum 7% after tax) and the economic useful life of the facilities.
The planning of the National and Zonal Transmission Systems corresponds to a regulated and centralized process, in which the CISEN annually issues an expansion plan, which must be approved by the CNE. The expansions of both systems are carried out through open tenders, distinguishing between new projects (with tenders open to any bidder) and expansion of existing facilities projects (participation in the expansion corresponds to the original facilities owners under modification). TheBoth types of tenders are managed by the Coordinator.The bids correspond to the value resulting from the tender, which constitutes the revenues for the first 20 years from the start of operation. As of the year 21, the fees of such transmission facilities are determined as if they were existing facilities.
4.1.3
The current regulations define that the transmission is remunerated by the sum of the tariff revenues and the collection of a single charge for the use of the transmission system. This charge is defined (Ch$ / kWh) by the CNE, on a half-yearly basis.
a.3 Distribution segment
The distribution segment is defined for regulatory purposes as all electricity supplied to end customers at a voltage no higher than 23 kV. Distribution companies operate under a distribution public utility concession regime, with service obligations and regulated tariffs for supplying regulated customers.
Customers are classified based on their demand as regulated and unregulated. Regulated customers are those with connected capacity of more than 5,000 kW. Customers with connected capacity between 500 kW and 5,000 kW can choose either a regulated or an unregulated regime.
F-52
Table of Contents
Distribution companies can supply both regulated customers, under supply conditions regulated by the Law, and unregulated customers, whose supply conditions are freely negotiated and agreed in bilateral contracts with energy suppliers (generation or distribution companies).
Regarding price regulation, the Law establishes that distribution companies must permanently have available energy supply, on the basis of open, non-discriminatory and transparent public tenders. These bidding processes are managed by the CNE and are carried out at least five years in advance. The result of the process is a “pay as bid” contract, with an extension up to 20 years. In case of unforeseen deviations in the projections of demand, the regulator has the authority to carry out short-term tenders. In addition, a reimbursement mechanism exists allowing supply without contract and regulating corresponding tariffs.
The tariffs are set every four years in order to determine the distribution value added (“VAD”) as a result of model companies cost studies, composed of fixed costs, average energy and capacity losses and standard distribution costs. Both the CNE and the distribution companies grouped by typical areas engage independent consultants for these studies. The VAD is obtained by weighting the results of the study received by the CNE and the companies with a ratio of 2:3 and 1:3, respectively. Based on this result, the CNE structures basic tariffs and verifies that the aggregate profitability of the industry is within the established range of 10% with a margin of ± 4%.
Additionally, every four years a review of services associated with the calculation of VAD is carried out, which do not represent energy supply and which the Free Competition Court qualifies as subject to tariff regulation.
The Chilean distribution tariff model is a consolidated model, which already had eight cycles of tariff settings since the privatizationenactment of the sector.General Electric Services Law in 1982.
4.2
b) Regulatory Developments in 20162018
CNE 2018 Regulatory Plan
By means of Exempt Resolution No. 20 dated January 12, 2018, in accordance with the provisions of Article 72-19 of the General Electric Services Law, CNE published its Annual Work Plan for the preparation of the technical regulations for 2018. The document defines the general guidelines and the programmatic priorities of the CNE’s. Work Plan 2018 and the pending regulatory procedures of the 2017 Plan, the preparation of which will continue being performed during 2018.
CNE 2019 Regulatory Plan
By means of Exempt Resolution No. 790 dated December 10, 2018, in accordance with the provisions of Article 72-19 of the General Electric Services Law, CNE published its Annual Work Plan for the preparation of the technical regulations for 2019. The document defines the general guidelines and the program priorities of the CNE’s Regulatory Work Plan 2019 and the pending regulatory procedures of the 2018 Plan, the preparation of which will continue being performed during 2019.
Regulations Published in 2018
Panel of Experts Regulations On January 5, 2018, the Chilean Department of Energy published new Regulations for the Panel of Experts in the Official Gazette. The purpose of these regulations is to establish provisions for the operation, financing and competencies of the Panel of Experts, as well as the procedures necessary for the proper performance of its functions.
Regulations of the Electrical Coordinator On April 3, 2018, the Chilean Department of Energy approved the Regulations of the Independent Coordinator of the National Electricity System. The purpose of these regulations is to establish provisions for the organization, composition and operation of the Independent Coordinator of the National Electricity System, as well as the procedures necessary for the proper performance of its functions.
F-53
Table of Contents
Safety Regulations of Complementary Services, Storage and Distribution of Electric Power On June 12, 2018, the Chilean Department of Energy Policyapproved the Safety Regulations for Electrical Facilities for the production, transportation, provision of complementary services, storage systems and distribution of electric power.
2017 Expansion Plan - Transmission
On May 15, 2014,December 29, 2017, the Ministerregulator, by means of CNE Exempt Resolution No. 770, issued the Preliminary Technical Report of the 2017 Transmission Expansion Plan. In accordance with the stages included in the law, the persons concerned (duly registered in the citizen participation register) made the responsive observations. Having evaluated the observations, by means of Exempt Resolution No. 163 dated February 27, 2018, the CNE approved the Final Technical Report of the 2017 Annual Transmission Expansion Plan. The persons concerned filed their discrepancies before Panel of Experts in a Public Hearing. Complying with all the stages of the process, on November 8, 2018, the Chilean Department of Energy releasedpublished the “Energy Agenda”, a document outlining general guidelinesExpansion Plan for 2017, establishing the Expansion Works of the National and Zonal Transmission Systems that must start their Tender process in the next twelve months.
2018 Transmission Expansion Plan
Within the framework of the Annual Transmission Planning process for 2018, the CNE invited all the persons concerned to participate in the stage of submitting proposals for Transmission Expansion projects until April 30, 2018, in accordance with the the provisions of Article 91 of the Electricity Law. The summons states that the proposals can be submitted no later than April 30, 2018. Following the stages of the process, on November 14, 2018 the CNE published the Preliminary Technical Report that contains the Annual Transmission Expansion Plan for 2018.
Energy Planning 2018-2022
By means of publication in the Official Gazette, dated April 10, 2018, the Chilean Department of Energy approved the Long Term Energy Planning for the period 2018-2020. This is the first energy policyplanning process carried out in accordance with the provisions introduced by Law 20,936. This plan, which is non-binding, must be carried out every 5 years, in accordance with Article 83 of the new government.Electricity Law.
Law No. 21,076 Obligations on Removal and Replacement of Junction and Meter
On February 27, 2018, Law 21,076 was published in the Official Gazette amending the Electricity Law, with the purpose to impose on the distribution company, the obligation to solve the removal and replacement of the junction and meter in the event of desablement of the facilities due to overwhelming force.
The sole article of this Law and its transients indicates that the junction and meter are part of the distribution network and that the ownership would modify to the extent of the change of these facilities, according to the requirements of the electrical network.
Fee estudies in accordance with article 187 of Electric Law
On October 6, 2017, the CNE issues CNE Exempt Resolution No. 560, which approves a unanimous agreement to carry out a New Fees Study in accordance with article 187, final part of the Electricity Law, signed between the CNE and the concessionary companies of public distribution service.
In this context, on February 29,in December 2017, the CNE requested the distribution companies the investment plans and costs necessary to comply with the Technical Standard of Service Quality for Distribution Systems (approved by CNE Exempt Resolution No. 706, dated December 7, 2017) not recognized in the current electricity supply rates (Supreme Decree No. 11T of 2016 of the Ministry of Energy).
On September 28, 2018, the Ministry of Energy published in the Official Gazette the approvalDecree No. 5T, that updates Decree No. 11T of the National Energy Policy contained in the document entitled “Energy 2050: Política Energética de Chile” (the “National Energy Policy”), establishing a long-term strategy for the electricity sector. The National Energy Policy is based on four pillars: Safety and Quality2016 of Supply, Energy as a Development Engine; Compatibility with the Environment; and Efficiency and Energy Education.
Law No. 20,928 - Tariff Equality Law
On June 22, 2016, the Ministry of Energy and, therefore, updates the tariffs for the electricity distribution
F-54
Table of Contents
segment. These new pricing conditions would be in force the next tariff fixing process and its issuance initiates the effects of the Technical Standard of Quality of Service for Distribution Systems, indicated in the preceding paragraph.
Law 21.118 - Normative Framework Amendments for Residential Generators
On November 17, 2018, Law 21,118 was published in Official Gazette modifying the Electricity Law in order to encourage the development of residential generators. Among the main changes introduced by this law, the increase in the maximum capacity of residential generation equipment for a mechanism of 100 kW to 300 kW.
c. Tariff Revisions:
c.1 Distribution Tariff Setting
The process of setting tariffs for the four-year period 2016-2020 ended on August 24, 2017 with the publication of the Decree No. 20,92811T in the Official Gazette, establishingGazette. This decree established tariff equality mechanisms for electrical services, amendingformulas at the Electricity Law (DFLdistribution level, and was effective as of November 4, 2016.
Decree No. 4) of 2006. The law states that the maximum tariffs that distribution companies may charge to residential customers must not exceed the average national tariff by more than 10%. The differences arising from the application of this mechanism will be progressively absorbed by all the rest5T of the Ministry of Energy became effective on September 28, 2018. This decree updated Decree No. 11T of 2016 of the Chilean Department of Energy. Therefore, it updated tariffs for the electricity distribution segment in effect until the next tariff setting.
The tariffs applied in 2017 and 2018 to end customers subject to regulated prices that are underwere determined based on the mentioned average, except for those residential users whose monthly average consumption of energy in the prior calendar year is lower than or equal to 200 kWh.following decrees and resolutions:
In addition, the Law provides for a discount for consumers with installed capacity greater than 200 MW that are located in those cities with intensive energy generation.
Lawi. Decree No. 20,936 – Transmission Law
On July 20, 2016, the Transmission Law was1T published in the Official Gazette restructuring the electrical system operation scheme, introducing a single independent national centralizing operating agent, the Coordinador Eléctrico Nacional (“CISEN”), that replaces the CDEC (without prejudice to the continued existence of some medium and isolated electrical systems). In addition, the CISEN assumes a key role in the transmission planning and subsequent bidding and awarding of new projects or expansion projects. Open access to all transmission facilities is granted. The law, among other relevant aspects, unifies each segment qualification of the transmission facilities processes in a single process and modifies the remuneration scheme by applying a stamped rate of demand charge.
4.3 Tariff Revisions:
4.3.1 Distribution Tariff Setting
In 2012, it was carried outon April 2, 2013, set the tariff setting process for distribution and distribution-related servicesformulas applicable to be applied for the 2012 – 2016 period. The results of the processregulated customers. Tariffs were published in the Official Gazette through Decree No. 1T. The tariffs were effective until November 3, 2016.
At the end of 2015, the National Energy Commission (CNE) began the 2016 – 2020 tariff setting process through publishing Exempted Resolution No. 699 communicating the definition for Typical Areas, the terms for the “Distribution Value Added 2016 – 2020 Study”, and the terms for the “Services associated with Energy Distribution Supply Cost Study”.
The CNE defines six Typical Areas with separate tariff each, and Enel Distribución Chile was categorized within Typical Area No. 1, same as in prior tariff process, reflecting the higher density of its network and, therefore, lower costs as compared to other companies in the industry. The subsidiaries Empresa Eléctrica de Colina and Luz Andes were categorized, same as in prior tariff process, within Typical Areas No. 4 and No. 2, respectively.
In February 2016, the CNE published in the Official Gazette, Exempted Resolution No. 83 containing the list of the qualified independent consultant entities to be eligible by the distribution companies to carry out the tariff studies. In April 2016, Enel
Distribución Chile selected Consultor Systep Ingeniería y Diseños S.A. to carry out the Distribution Value Added 2016 – 2020 Study.
On September 5, 2016, Enel Distribución Chile submitted to the CNE the tariff study in compliance with the requirements indicated in the regulations.
The 2016-2020 tariff setting process is currently under progress and will be finalized once the tariff decree is released at which time the tariff will be retroactively applied with a start date of November 4, 2012 until November 3, 2016.
The tariffsii. Decree No. 11T published in the Official Gazette on August 24, 2017, set the tariff indexation formulas applicable to energy supplies subject to regulated prices. Tariffs were retroactively applied in 2016 to end customers were determined based on the following decrees:from November 4, 2016.
| (i)
| Decree No. 1T published in the Official Gazette on April 2, 2013, set the tariff formulas applicable to regulated customers. Tariffs were retroactively applied with a start date
iii. Decree No. 5T, which sets tariff formulas applicable to electricity supplies subject to regulated prices listed in Decree No. 11T dated 2016 of November 4, 2012 until November 3, 2016. |
| (ii)
| Decree No. 14 published in the Official Gazette on April 9, 2013, set the tariffs and indexation formulas applicable to the subtransmission and additional transmission systems. Tariffs were retroactively applied with a start date of January 1, 2011 until December 31, 2015. Subsequently, Decree No. 7T extended the effective date until December 31, 2015.
|
Node Average Prices:
On January 4, 2016, the Ministry of Energy, published in the Official Gazette on September 28, 2018 and which is effective from its publication date until November 3, 2020.
iv.Decree No. 22T, setting the node prices for energy supply, retroactively applied from September 1, 2015.
On January 21, 2016, the Ministry of Energy14 published in the Official Gazette Decree No. 24T, settingon April 9, 2013, set the node prices for energy supply,tariffs and indexation formulas applicable to the subtransmission and additional transmission systems. Tariffs were retroactively applied from Novemberwith a start date of January 1, 2011 until December 31, 2015.
On March 4, 2016, the Ministry of Energy Decree 7T, published in the Official Gazette on April 22, 2015, extends its validity until December 31, 2015.
v.Decree No. 1T, setting6T, which fixes Annual Value per Tranche of the node pricesZonal and Dedicated Transmission Facilities used by users subject to price regulation, their rates and Indexing formulas for energy supply, retroactively appliedthe two-year period 2018-2019, published by the Chilean Department of Energy in the Journal Official on October 5, 2018, which in effect from January 1, 2016.2018 to December 31, 2019.
On May 23, 2016, the Ministry of Energy published in the Official Gazette, Decree No. 4T, setting the node prices for energy supply, retroactively applied from March 1, 2016.
On June 17, 2016, the Ministry of Energy published in the Official Gazette, Decree No. 7T, setting the node prices for energy supply, retroactively applied from April 1, 2016.vi. Price Decrees
On August 6, 2016, the Ministry of Energy published in the Official Gazette, Decree No. 8T, setting the node prices for energy supply, retroactively applied from May 1, 2016.
Node Average prices:
On September 1, 2016, the Ministry of Energy published in the Official Gazette, Decree No. 9T, setting the node prices for energy supply as part of Law No. 20,928 on Tariff Equality in relation to the Domestic Generation Acknowledgement, retroactively applied from August 1, 2016.
Short-Term Node Prices
F-55
Table of Contents
On October 10, 2017, the Ministry of Energy published in the Official Gazette, Decree No. 12T, setting the node prices for energy supply and the adjustments and surcharges from applying the Residential Rate Equality Mechanism, retroactively applied from January 1, 2017.
On October 10, 2017, the Ministry of Energy published in the Official Gazette Decree No. 3T, setting the node prices for energy supply and the adjustments and surcharges from applying the Residential Rate Equality Mechanism, retroactively applied from July 1, 2017.
The Chilean Department of Energy published Decree No. 12T in the Official Gazette on March 24, 2018. This decree fixed node prices for electricity supplies and set adjustments and surcharges for the application of the Residential Tariff Equality Mechanism, with retroactive effect as of January 1, 2018.
The Chilean Department of Energy published Decree No. 7T in the Official Gazette on September 28, 2018. This decree fixed node prices for electricity supplies and set adjustments and surcharges for the application of the Residential Tariff Equality Mechanism, with retroactiveeffect as of July 1, 2018.
Short-term node prices:
On July 2, 2016, the Ministry of Energy published in the Official Gazette, Decree No. 5T, setting the short-term node prices for energy supply, retroactively applied from May 1, 2016.
As
On August 26, 2017, the Ministry of Energy published in the Official Gazette, Decree No. 2T, setting short-term node prices for energy supply, retroactively applied from April 1, 2017.
The Chilean Department of Energy published Decree 5T in the Official Gazette on January 25, 2018. This decree fixed node prices for electricity supplies with retroactive effect as of October 1, 2017.
The Chilean Department of Energy published Decree 1T on June 28, 2018. This decree fixed node prices for electricity supplies with retroactive effect as of April 1, 2018
c.2 Setting of Service Tariffs Associated with Distribution
At the end of 2015, the CNE published Exempt Resolution No. 699 that informed, among others, the bases for the “Studies of Costs of Services Associated with the Supply of Distribution Electricity”, during the process of setting distribution tariffs 2016-2020.
These bases incorporate five new services, including the “Execution or installation of temporary connections” and the “Rental of temporary connections”.
The “Final Report of the reporting dateStudy of these consolidated financial statements,Cost of Services Associated with Distribution Electricity Supply” was published on January 20, 2017. Following the established process, Enel Distribución submitted its observations to the study.
Subsequently, by means of Exempt Resolution No. 213 dated April 27, 2017, the CNE approved the Technical Report “Setting of Tariff Formulas for Non-Consistent Services in Energy Supply, Associated with the Distribution of Electricity”. Following the stages of the process, Enel Distribución submitted its discrepancies to the Technical Report.
The Chilean Department of Energy published Decree applicableNo. 13T in the Official Gazette on July 24, 2018. This decree established prices for Non-Consistent Services in Energy Supplies associated with electricity distribution. These prices have been in force since the publication of the aforementioned decree and they are in effect to December 2016 has not been yet published.date.
F-56
Table of Contents4.3.2
c.3 Subtransmission Tariff Setting
On July 20, 2016, Law No. 20,936 was publish, setting the new regulatory framework for all electric energy transmission systems, making changes to the tariff process in all transmission sector. Also, the sector named “Subtransmission” was renamed to “Zonal Transmission”.
The subtransmissionZonal Transmission tariffs are set every four years. The subtransmission entities, grouped by systems based onHowever, before publishing Law No. 20.936, the qualification of their facilitiestariff period for Substansmission had been extended, as ruled by the CNE, are subject to a tariff setting process to determine the Subtransmission Systems Annual Value, which allows to set the tariffs applicable to the use of the subtransmission systems.follows:
·On January 29, 2015, Law No. 20.80520,805 was published in the Official Gazette, which, among other matters, it entitleentitles the Ministry of Energy to extend in one more year the effective date of Decree CNE No. 14 of 2012 (“Decree No.14”), which set the subtransmission tariffs for the 2011 – 2014 period (i.e., such decree would be effective for the 2011 – 2015 period), and also to extend in one more year the effective date of the tariff setting process for the period 2015 – 2018 (i.e., 2016 – 2019).
Consequently, on· On April 22, 2015, the Ministry of Energy published in the Official Gazette, Decree No. 7T, extending the effective date of the subtransmission tariff decree and expressly stating that the tariffs will be applied beginning on January 1, 2016.
On July 20, 2016, Law No. 20.936 was published, setting the new regulatory framework for all electric energy transmission systems, including subtransmission. InNotwithstanding, in accordance with Article No. 11 of the transitory provisions of Law No. 20.936,20,936/2016, the effective date forunder Decree No. 14 of 2012, was extended to December 31, 2017.
In relation to the 2016 – 2017 tariff period, on December 29, 2016 it was published Exempted Resolution No. 940, which defined the necessary adjustments to Decree No. 14 to extend its effective date for the years 2016 and 2017. The main adjustment is related to exempt generating power plants from payment for using subtransmissionthe Zonal Transmission systems. The 2016 – 2019 tariff setting process will continue is progress, and in accordance with Article No. 11 of the transitory provisions of Law No. 20.936,20,936, the results will be used for the tariffs to be applied to the 2018 – 2019 period.
4.3.3 Distribution-Related Services Tariff Setting
On February 10, 2017, the CNE issued Exempted Resolution No. 83, which contained the “Preliminary Technical Report on Determination of the Annual Value of the Zonal Transmission and Dedicated Transmission Systems for the 2018-2019 period”. Enel Distribución, made comments to the report, and the final technical report was issued on March 14, 2014,28, 2017. Following the Ministryprocess steps, Enel Distribución Chile communicated its discrepancies with the final technical report. On May 19, 2017, it was carried out a Public Hearing at which Enel Distribución and other interested parties presented their discrepancies to an Expert Panel.
The Chilean Department of Energy published in the Official Gazette, Decree No. 8T, setting6T on October 5, 2018. This decree set annual value per tranche of the priceszonal and dedicated transmission facilities used by users subject to price regulation, their tariffs and indexation formulas for distribution-related services, which are currently still effective.the two-year period 2018-2019.
Atc.4 Transmission Tariff Setting 2020-2023
In the endframework of 2015,the process of Transmission Tariff Setting 2020-2023, the processes of Qualification of Facilities of the Transmission Systems, Setting of Useful Life of the Transmission Facilities and definition of the Technical and Administrative Bases for the Study of Valuation of Transmission Facilities are in progress.
In this context, for the purposes of the Qualification Process of Transmission System Facilities for the period 2020-2023, the Regulator, by means of CNE Exempt Resolution No. 771 (December 29, 2017), issued the preliminary technical report defining which transmission facilities correspond to each segment (National, Zonal and Dedicated). The persons concerned (duly registered in the citizen participation register) made observations on this report during the first days of January 2018. Subsequently, the CNE through Exemptedissued the Final Technical Report by means of Exempt Resolution No. 699 communicated, among other matters,123 dated February 13, 2018. Following the termsstages established by the regulations, the persons concerned will submit their discrepancies before the Panel of Experts at a public hearing.
F-57
Table of Contents
In this process, within the framework of the analysis and study of the discrepancies presented, the Panel of Experts requested additional information from the CNE. As a result of this request, the CNE identified inconsistencies in the application of the methodology for the “Services associated with Energy Distribution Supply Cost Study” as partqualification of facilities. Therefore, it started an administrative procedure of invalidation of said process. In this context, on September 4, 2018, the CNE published Exempt Resolution No. 613, by means of which it invalidated the steps already carried out in the referred process, referring it rather to the publication of the 2016 – 2020 tariff settingpreliminary technical report. Thus, on October 5, 2018, CNE published a new Preliminary Technical Report by means of Exempt Resolution No. 673, which received the observations of the persons concerned registered in the process. The terms incorporate five new distribution-related services,Subsequently, on November 21, 2018, the CNE by means of whichExempt Resolution No. 761 issued the most significant are “Construction and installmentFinal Technical Report on Facilities Qualification of temporary junctions” and “Leasethe Transmission Systems for the period 2020-2023. Following the stages of temporary junctions”.the process, the persons concerned may submit their discrepancies before Panel of Experts.
AtAlso, for the reporting datepurposes of these consolidated financial statements, no decree setting new tariffsthe process of Setting of Useful Life of the Transmission Facilities, the CNE by means of Exempt Resolution No. 212 of March 15, 2018, issued a Preliminary Report. The persons concerned (duly registered in the citizen participation register) sent the relevant observations and participated in the discrepancy process before the Panel of Experts. On June 5, 2018, the CNE approved the Final Technical Report that determines Useful Lives, by means of Exempt Resolution No. 412.
Finally, for distribution-related services has been released.the purposes of the definition of the Technical and Administrative Bases for the Study of Valuation of Transmission Facilities, the CNE published the Technical and Administrative Preliminary Bases by means of Exempt Resolution No. 769 (December 29, 2017). Said document, in general terms, regulates the contracting process of the tariff study and defines the rules for carrying out the tariff study of the entire transmission, defining the tender for two studies: one for National facilities and another for Zonal and Dedicated facilities. In accordance with the stages included in the Law, the persons concerned (duly registered in the citizen participation register) made observations on this document during the first days of January 2018. Subsequently, the CNE issued the Final Technical Report by means of Exempt Resolution No. 124 dated February 13, 2018. Following the stages established by the regulations, the persons concerned submitted their discrepancies before the Panel of Experts at a public hearing. The formalization of the Final Bases is subject to the completion of the aforementioned Facilities Qualification process.
4.3.4
c.5 Energy Tenders
Under the new law for energy tenders, twothree bidding processes have been carried out: Supply Bidding No. 2015/01, and Supply Bidding No. 2015/02.
02 and Supply Bidding No. 2015/Tender 2017/01 was launched in May 2016 and finalized in July 2016. The final outcome of the process resulted in five energy blocks awarded for a total of 12,430 GWh to 84 companies at a weighted average price of US$ 47.6 per MWh. Enel Generación Chile was awarded with 5,918 GWh per year, which represents a 47.6% of the total energy awarded.
Supply Bidding No. 2015/02 was launched in June 2015 and finalized in October 2015. The final outcome of the process resulted in three energy blocks awarded for a total of 1,2001.2 GWh per year (100%) at a weighted average price of US$ 79.3 per MWh.
Supply Bidding No. 2015/01 was launched in May 2015 and finalized in July 2016. The final outcome of the process resulted in five energy blocks awarded for a total of 12.4 GWh (100%) to 84 companies at a weighted average price of US$ 47.6 per MWh.
Enel Generación Chile was awarded with 5.9 TWh / year, which represents 47.6% of the total energy awarded.
Supply Bidding No. 2017/01 was launched in January, 2017 and finalized in November 2017. The final outcome of the process resulted in five energy blocks awarded to five companies for a total of 2,200 GWh per year at a weighted average price of US$ 79.332.5 per MWh, a 30% reduction as compared to the prices of prior bids, which indicates that the amendments to the Electricity Law have effectively reduced the prices through increased competition and a reduction in the risks for generators.MWh.
Enel Generación Chile was awarded with 1.2 TWh per year, which represents 54% of the total energy awarded.
F-58
5.
Table of Contents 5. NON-CURRENT ASSETS OR DISPOSAL GROUPS CLASSIFIED AS HELD FOR SALE. i. Electrogas S.A. | NON-CURRENT ASSETS OR GROUPS OF ASSETS FOR DISPOSAL CLASSIFIED AS HELD FOR SALE.
|
On December 16, 2016, our subsidiary Enel Generación Chile S.A. signed an agreement to sell all shares of its equity method investee Electrogas S.A., equivalent torepresenting a 42.5% ownership interest, to Aerio Chile SpA (“Aerio Chile”) which is an indirectly wholly-owned subsidiary of REN –— Redes Energéticas Nacionais, S.G.P.S., S.A., under which Enel Generación Chile sold all its shares in Electrogas S.A., representing 42.5% of the capital of said company. The total sale price was US$180 million, (approximately ThCh$ 120,544,600) which was paid in February 2017.on the closing date of the referred transaction. Finally, the amount collected was ThCh$115,582,806 and originated a pre-tax gain of ThCh $ 105,311,912 (see Notes 8.d and 30, respectively).
Electrogas S.A. is a private corporation whose purpose is to provide services of transportation of natural gas and other fuels, on its own and on behalf of third parties. In order to provide its services, it can build, operate and maintain gas and oil pipelines, polyducts and supplementary facilities.
As described
6. BUSINESS COMBINATIONS UNDER COMMON CONTROL.
Corporate restructuring project
Considering the high priority given to renewable energies in Note 3.k)the Open Power strategy, and with the purpose of consolidating a vehicle that maximizes this strategy, on August 25, 2017 Enel Chile proposed for the consideration of Enel S.p.A., non-currenta corporate restructuring (hereinafter “the Restructuring of Renewable Assets”) which consisted of integrating the renewable energy assets in Chile maintained by Enel Green Power Latin America S.A. (“EGPL”) with Enel Chile, which in turn controlled the conventional power generation assets belonging to Enel Generación Chile S.A. (“Enel Generación Chile”) and groupsthe electricity distribution assets belonging to Enel Distribución Chile S.A..
Enel Chile and Enel Generación Chile are entities registered with the Financial Market Commission of assetsChile and have American Depository Receipts (“ADS”) traded on the New York Stock Exchange, and are therefore also subject to regulation by the Securities and Exchange Commission of the United States of America.
EGPL was an indirect subsidiary of Enel S.p.A., actually controlled by Enel Green Power SpA. (“EGP”).
The Reorganization involved two principal phases, each of which was conditional on the implementation of the other, as follows:
i)Public tender offer
Enel Chile presented a public tender offer (the “Tender Offer”) for all of the shares (including in the form of American Depositary Shares (“ADSs”)) of its subsidiary Enel Generación Chile held by non-controlling interests (equivalent to approximately 40% of the share capital). The Tender Offer consideration was paid in cash, subject to the condition that tendering Enel Generación Chile shareholders agreed to use Ch$236 of the Ch$590 cash tender offer consideration for sale have been recognizedeach Enel Generación Chile share and Ch$7,080 of the Ch$17,700 cash tender offer consideration for each Enel Generación Chile ADS to subscribe for shares of Enel Chile common stock at a subscription price of Ch$82 per Enel Chile share (or Ch$4,100 per Enel Chile ADS) (the “Share/ADS Subscription Condition”).
ii)Capital increase
Enel Chile undertook a capital increase to make available a sufficient number of shares of Enel Chile common stock to deliver to tendering holders of Enel Generación Chile shares and ADSs to satisfy the lowerShare/ADS Subscription Condition.
F-59
Table of Contents
In connection with the capital increase, in accordance with Chilean law, Enel Chile made a preemptive rights offering, in which shareholders or third parties could exercise their carrying amountsubscription rights and fair value less costs of disposal. Electrogas S.A. does not represent a separate major line of businesspay Ch$82 per share subscribed for Enel Generación Chile shares and ADSs.
iii)Merger
After the Tender Offer was declared successful, EGPL merged with Enel Chile (the “Merger”). Consequently, the renewable assets held by EGPL were integrated into Enel Chile.
On December 20, 2017, the Extraordinary Shareholders’ Meeting of Enel Chile approved the Reorganization, subject to compliance with the conditions established for the Public Offering, Capital Increase and Merger. The Board also approved the capital increase of Enel Chile in the amount of Ch$1,891,727,278,668, through the issuance of 23,069,844,862 new common shares, all of the same series and without par value, at the price and other conditions approved by the Board.
Finally, on March 25, 2018, the amendments to Enel Chile’s by-laws were approved to reflect the merger, capital increase and expansion of Enel Chile’s corporate purpose, among other provisions. The preemptive rights offering took place between February 16 and March 22, 2018; the shares were subscribed between February 15 and March 16, 2018 to cover the capital increase; and the Reorganization (including the Merger) was completed and became effective as of April 2, 2018 and resulted in an increase of Enel Chile’s ownership in Enel Generación Chile from 59.98% to 93.55% and the merger of Enel Chile with EGPL effective as from this date, a process whereby Enel S.p.A. increased its total interest in Enel Chile to 61.93%.
Since the date of acquisition, EGP Chile Group has contributed revenue of ThCh$52.892.734 and pretax income of ThCh$30.471.438 to the profit and loss of Enel Chile for the period ended December 31, 2018. If the acquisition had occurred on January 1, 2018, it is estimated that the consolidated revenue for the year ended December 31, 2018 would have increased by ThCh$71.072.559 and the consolidated gain before tax would have increased by ThCh$43.360.620.
Carrying amount of the assets and liabilities of EGPL at merger date:
Identifiable net assets acquired |
| ThCh$ |
|
Cash and cash equivalents | | 12,173,982 | |
Other current financial assets | | 8,460 | |
Other current non-financial assets | | 3,832,583 | |
Trade and other current receivables | | 27,414,273 | |
Current accounts receivables to related parties | | 73,749,131 | |
Inventories | | 2,851,171 | |
Current tax assets | | 2,750,250 | |
Other non-current financial assets | | 5,685,422 | |
Other non-current non-financial assets | | 262,878 | |
Trade and other non-current receivables | | 43,829,961 | |
Intangible assets other than goodwill | | 41,786,159 | |
Goodwill | | 6,652,935 | |
Property, plant and equipment | | 1,365,850,084 | |
Deferred tax assets | | 21,246,605 | |
Other current financial liabilities | | (62,444,763 | ) |
Trade and other current payables | | (49,109,886 | ) |
Current accounts payable to related parties | | (33,381,911 | ) |
Current tax liabilities | | (347,483 | ) |
Other non-current financial liabilities | | (259,856,654 | ) |
Non-current accounts payable to related parties | | (396,081,972 | ) |
Other non-current provision | | (9,169,918 | ) |
Deferred tax liabilities | | (58,067,689 | ) |
Provisions for non-current employee benefits | | (603,109 | ) |
| | | |
Net identifiable assets acquired | | 739,030,509 | |
F-60
Table of Contents
7. ARGENTINA’S HYPERINFLATIONARY ECONOMY.
Since July 2018, Argentina’s economy is considered hyper-inflationary under the provisions of IAS 29 - Financial Reporting in Hyperinflationary Economies. A number of qualitative and quantitative criteria led to this qualification; chief among them is the cumulative inflation rate over three years exceeding 100%.
In accordance with the provisions of IAS 29, the financial statements of the companies in Argentina in which Enel Chile has an interest have been retrospectively restated by applying a general price index to the historical cost, in order to reflect changes in the purchasing power of the Argentine currency as of the closing date of these financial statements.
Considering that Enel Chile’s functional and presentation currency is not that of a hyper-inflationary economy, according to the guidelines of IAS 29, the restatement of comparative periods is not required in the Group’s consolidated financial statements.
The general price indices used at the close of the reporting periods are as follows:
|
| General price index |
|
From January 2015 to December 2017 | | 85.52 | % |
From January to December 2018 | | 47.83 | % |
The following table sets forthis a summary of the carrying amounteffect in the Consolidated Statements of Electrogas S.A.Comprehensive Income of Enel Chile:
|
| Balances as of |
|
|
| 12/31/2018 |
|
Result due to Hyperinflation |
| ThCh$ |
|
Intangible assets other than goodwill | | 180 | |
Property, plant and equipment | | 1,035,084 | |
Equity | | (3,743,959 | ) |
Other Services Provision | | (1,189,452 | ) |
Other Variable Provisioning and Services | | 21,503 | |
Employee benefits expenses | | 143,148 | |
Other Fixed Operating Expenses | | 147,975 | |
Financial income | | (268,511 | ) |
Financial costs | | 67,707 | |
| | | |
Result due to Hyperinflation * | | (3,786,325 | ) |
(*) Corresponds to the financial effect derived from the application of IAS 29 Financial Information in Hyperinflationary Economies, which is derived from the results arising from the net position of monetary assets and liabilities. This result is determined through the restatement of non-monetary assets and liabilities, as well as those income statements that are not determined from an updated base (see Note 34).
The cumulative effects of adoption IAS 29 as of January 1, 2018 on the financial statements of Enel Chile’s Argentine subsidiary was a credit of ThCh$664,470, net of tax, and was recognized as an adjustment to beginning retained earnings. (See Note 2.7.4).
F-61
Table of Contents
8. CASH AND CASH EQUIVALENTS.
a) The detail of cash and cash equivalents as of December 31, 2016, which has been classified2018 and 2017, is as non-current assets held for sale:follows:
| | | | |
| | | | |
Equity of Electrogas S.A. | | Ownership Interest | | Carrying Amount of Investment in Electrogas S.A. |
ThCh$ | | % | | ThCh$ |
| | | | |
30,571,784 | | 42.5 | | 12,993,008 |
| | | | |
6.
| CASH AND CASH EQUIVALENTS.
|
| | As of December 31, | | | | 2018 | | 2017 | | Cash and Cash Equivalents | | ThCh$ | | ThCh$ | | Cash balances | | 44,326 | | 53,875 | | Bank balances | | 98,395,997 | | 35,208,300 | | Time deposits | | 5,782,252 | | 11,155,249 | | Other fixed-income instruments | | 140,949,349 | | 373,038,602 | | Total | | 245,171,924 | | 419,456,026 | |
| a)
| The detail of cash and cash equivalents as of December 31, 2016 and 2015, is as follows:
|
| | As of December 31, |
| | 2016 | | 2015 |
Cash and Cash Equivalents | | ThCh$ | | ThCh$ |
Cash balances | | 48,002 | | 10,232 |
Bank balances | | 48,556,736 | | 29,297,784 |
Time deposits | | 17,325,478 | | 25,504,488 |
Other fixed-income instruments | | 180,068,976 | | 89,449,341 |
| | | | |
Total | | 245,999,192 | | 144,261,845 |
Time deposits have a maturity of three months or less from their date of acquisition and accrue the market interest for this type of short-term investment. Other fixed-income investmentsinstruments, are mainly comprised of repurchase agreements with original maturitiesmaturing in 90 days or less from the date of less than or equalinvestment. There are no restrictions for significants amounts of cash availability.
b) The detail of cash and cash equivalents by currency is as follows:
| | As of December 31, | |
| | 2018 | | 2017 | |
Currency | | ThCh$ | | ThCh$ | |
Chilean peso | | 222,434,412 | | 399,164,753 | |
Argentine peso | | 6,057,793 | | 6,263,344 | |
Euros | | 103,847 | | 11,594 | |
U.S. dollar | | 16,575,872 | | 14,016,335 | |
Total | | 245,171,924 | | 419,456,026 | |
c) No payments have been made to 90 days.obtain control of consolidated entities as of December 31, 2018 and 2017.
| b)
| The detail of cash and cash equivalents by currency is as follows:
|
d) The following tables sets forth cash and cash equivalents that have been received from the sale of shares of associates during the years ended December 31, 2018, 2017 and 2016:
| | 2018 | | 2017 (*) | | 2016 (**) | |
Loss of control at Associates | | ThCh$ | | ThCh$ | | ThCh$ | |
Amounts received for the sale of Associates (*) | | — | | 115,582,806 | | 132,820,800 | |
Total | | — | | 115,582,806 | | 132,820,800 | |
| | As of December 31, |
| | 2016 | | 2015 |
Currency | | ThCh$ | | ThCh$ |
Chilean peso | | 235,993,647 | | 130,044,183 |
Argentine peso | | 4,807,406 | | 5,531,184 |
U.S. dollar | | 5,198,139 | | 8,686,478 |
| | | | |
Total | | 245,999,192 | | 144,261,845 |
(*) See Note 5.
(**) See Note 15.1.c.
F-62
| c)
| The following table sets forth cash and cash equivalents that have been received from the sale of shares of subsidiaries:
|
Table of Contents
e) Reconciliation of liabilities arising from financing activities:
| | | | Financing Cash Flows | | | | | | Non-Cash
Changes | | | | | | | |
Liabilities arising | | Balance as of
1-1-2018 (1) | | From | | Used | | Interest
paid | | Total | | Acquisition of
subsidiaries | | Changes
in fair
value | | Foreign
exchange
differences | | Financial
costs
(2) | | Other changes | | Balance as of
12-31-2018 (1) | |
from financing activities | | ThCh$ | | ThCh$ | | ThCh$ | | ThCh$ | | ThCh$ | | ThCh$ | | ThCh$ | | ThCh$ | | ThCh$ | | ThCh$ | | ThCh$ | |
Bank loans (Note 21.1) | | 122 | | 940,414,450 | | (812,568,125 | ) | (22,902,945 | ) | 104,943,380 | | 322,301,558 | | — | | 51,622,432 | | 27,929,781 | | 5,750,445 | | 512,547,718 | |
Unsecured obligations (Note 21.1) | | 763,579,584 | | 625,368,154 | | (5,654,112 | ) | (59,362,432 | ) | 560,351,610 | | — | | — | | 128,056,234 | | 64,400,703 | | (11,106,048 | ) | 1,505,282,083 | |
Finance leases (Note 21.1) | | 14,608,914 | | — | | (1,889,685 | ) | (739,070 | ) | (2,628,755 | ) | — | | — | | 1,757,221 | | 739,070 | | — | | 14,476,450 | |
Other liabilities (Note 18.1) | | — | | — | | (1,303,692 | ) | | | (1,303,692 | ) | | | | | 52,972 | | | | 1,250,720 | | — | |
Financial derivatives for hedging (Note 9 y 21) | | (29,478,642 | ) | — | | — | | (3,496,889 | ) | (3,496,889 | ) | (5,495,214 | ) | 48,389,489 | | 32,202,403 | | 3,569,025 | | (5,078,247 | ) | 40,611,925 | |
Loans to related parties (Nota 12.1.b) | | — | | — | | — | | (30,039,555 | ) | (30,039,555 | ) | 398,462,271 | | — | | 51,063,262 | | 29,906,460 | | (2,074,657 | ) | 447,317,781 | |
Other obligations | | — | | — | | (23,307,842 | ) | — | | (23,307,842 | ) | — | | — | | — | | 23,307,842 | | — | | — | |
Total | | 748,709,978 | | 1,565,782,604 | | (844,723,456 | ) | (116,540,891 | ) | 604,518,257 | | 715,268,615 | | 48,389,489 | | 264,754,524 | | 149,852,881 | | (11,257,787 | ) | 2,520,235,957 | |
| | | | Financing Cash Flows | | | | | | Non-Cash
Changes | | | | | | | |
Liabilities arising | | Balance as of
1-1-2017 (1) | | From | | Used | | Interest
paid | | Total | | Acquisition of
subsidiaries | | Changes
in fair
value | | Foreign
exchange
differences | | Financial
costs
(2) | | Other changes | | Balance as of
12-31-2017 (1) | |
from financing activities | | ThCh$ | | ThCh$ | | ThCh$ | | ThCh$ | | ThCh$ | | ThCh$ | | ThCh$ | | ThCh$ | | ThCh$ | | ThCh$ | | ThCh$ | |
Bank loans (Note 21.1) | | 4,274 | | — | | (4,156 | ) | (12,581 | ) | (16,737 | ) | — | | — | | — | | 12,585 | | — | | 122 | |
Unsecured obligations (Note 21.1) | | 802,306,160 | | — | | (5,530,327 | ) | (43,514,578 | ) | (49,044,905 | ) | — | | — | | (33,226,098 | ) | 43,544,427 | | — | | 763,579,584 | |
Finance leases (Note 21.1) | | 17,749,647 | | — | | (2,592,236 | ) | — | | (2,592,236 | ) | — | | — | | (1,359,668 | ) | 811,171 | | — | | 14,608,914 | |
Financial derivatives for hedging (Note 9 y 21) | | 23,640,892 | | — | | (3,543,399 | ) | — | | (3,543,399 | ) | — | | (25,059,561 | ) | (23,488,917 | ) | 3,473,938 | | (4,501,595 | ) | (29,478,642 | ) |
Loans to related parties (Nota 12.1.b) | | — | | 150,000,000 | | (150,000,000 | ) | (289,800 | ) | (289,800 | ) | — | | — | | — | | 289,800 | | — | | — | |
Other obligations | | — | | — | | (1,305,389 | ) | — | | (1,305,389 | ) | — | | — | | — | | 1,305,389 | | — | | — | |
Total | | 843,700,973 | | 150,000,000 | | (162,975,507 | ) | (43,816,959 | ) | (56,792,466 | ) | — | | (25,059,561 | ) | (58,074,683 | ) | 49,437,310 | | (4,501,595 | ) | 748,709,978 | |
| | As of December 31, |
| | 2016 | | 2015 | | 2014 |
Loss of control at Subsidiaries | | ThCh$ | | ThCh$ | | ThCh$ |
Amounts received for the sale of subsidiaries (*) | | - | | 25,000,000 | | 57,173,142 |
Amounts of cash and cash equivalents in entities sold | | - | | (18,360,347) | | (16,311,571) |
Total net | | - | | 6,639,653 | | 40,861,571 |
(1)Balance corresponds to current and non-current portion. (2)Other changes include interest accruals 9. OTHER FINANCIAL ASSETS. | (*)
| See Note 2.4.1.
|
7.
| OTHER FINANCIAL ASSETS.
|
The detail of other financial assets as of December 31, 20162018 and 2015,2017 is as follows:
| | Current | | Non-current | |
| | 12-31-2018 | | 12-31-2017 | | 12-31-2018 | | 12-31-2017 | |
Other Financial Assets | | ThCh$ | | ThCh$ | | ThCh$ | | ThCh$ | |
Financial assets at fair value with changes in results | | 90,839 | | — | | — | | 33,158 | |
Financial assets at fair value with change in other comprehensive income | | 269,031 | | — | | 2,352,894 | | 2,595,343 | |
Financial assets held to maturity | | 880,268 | | 185,913 | | 689,146 | | — | |
Hedging derivatives | | 39,022,012 | | 20,038,433 | | 4,191,543 | | 30,789,703 | |
Non-Hedging derivatives | | 41,023 | | 402,716 | | 36,086 | | — | |
Total | | 40,303,173 | | 20,627,062 | | 7,269,669 | | 33,418,204 | |
10.OTHER NON-FINANCIAL ASSETS AND LIABILITIES
a)Other non-financial assets
Details of other non-financial assets as of December 31, 2018 and 2017 are as follows:
| | Currrent | | Non-Current | |
| | 12-31-18 | | 12-31-17 | | 12-31-18 | | 12-31-17 | |
Other non-financial assets | | ThCh$ | | ThCh$ | | ThCh$ | | ThCh$ | |
VAT Tax Credit and Other Taxes | | 11,281,502 | | 12,727,682 | | 29,198,027 | | — | |
Prepaid expenses | | 4,711,173 | | 2,867,826 | | — | | — | |
Guarantee deposit | | — | | — | | 1,902,479 | | 2,165,040 | |
PPM water rights | | — | | — | | 6,544,100 | | 5,300,052 | |
Spare parts with consumption schedule over 12 months | | — | | — | | 4,324,153 | | 5,444,789 | |
Other | | 6,413,413 | | 3,190,383 | | 2,639,253 | | 903,258 | |
Total | | 22,406,088 | | 18,785,891 | | 44,608,012 | | 13,813,139 | |
F-63
| | Current | | Non-current |
| | 12-31-2016 | | 12-31-2015 | | 12-31-2016 | | 12-31-2015 |
Other Financial Assets | | ThCh$ | | ThCh$ | | ThCh$ | | ThCh$ |
| | | | | | | | |
Available-for-sale financial investments – unquoted equity securities or with limited liquidity | | - | | - | | 2,616,239 | | 3,001,868 |
Available-for-sale financial investments – quoted equity securities | | - | | - | | 25,381 | | 32,121 |
Financial assets held to maturity (*) | | 462,801 | | 16,236,490 | | 652,733 | | - |
Hedging derivatives | | 121,443 | | 76,704 | | 25,533,189 | | 18,716,463 |
Total | | 584,244 | | 16,313,194 | | 28,827,542 | | 21,750,452 |
Table of Contents
b)Other non-financial liabilities
Details of other non-financial liabilities as of December 31, 2018 and 2017 are as follows:
| | Currrent | | Non-Current | |
| | 12-31-18 | | 12-31-17 | | 12-31-18 | | 12-31-17 | |
Other non-financial liabilities | | ThCh$ | | ThCh$ | | ThCh$ | | ThCh$ | |
VAT and Other Taxes due | | 56,341,865 | | 31,669,402 | | — | | — | |
Tax Due for payment realted to Central Eólica Canela S.A. | | — | | 6,795,376 | | — | | — | |
Reimbursable financial contributions | | — | | — | | 226,653 | | 309,776 | |
Splices | | 10,456,081 | | 7,884,841 | | — | | — | |
Transfer of networks | | 1,786,635 | | 1,811,479 | | — | | — | |
Products and services | | 1,502,411 | | 937,259 | | — | | — | |
Other | | 1,221,990 | | 647,673 | | — | | — | |
Total | | 71,308,982 | | 49,746,030 | | 226,653 | | 309,776 | |
11. TRADE AND OTHER RECEIVABLES.
a)The amounts included in “financial assets held to maturity” correspond mainly to time depositsdetail of trade and other highly liquid investments that are readily convertible to cashreceivables as of December 31, 2018 and subject to a low risk of changes in value, but that do not fulfill the definition of cash equivalent2017, is as defined in Note 3.g.2 (e.g. with maturity over 90 days from time of investment).follows:
8.
| TRADE AND OTHER RECEIVABLES.
|
| a)
| The detail of trade and other receivables as of December 31, 2016 and 2015, is as follows:
|
| | As of December 31, | |
| | 2018 | | 2017 | |
| | Current | | Non-current | | Current | | Non-current | |
Trade and Other Receivables, Gross | | ThCh$ | | ThCh$ | | ThCh$ | | ThCh$ | |
Trade and other receivables, gross | | 527,649,947 | | 60,527,843 | | 463,626,345 | | 36,182,399 | |
Trade receivables, gross (2) | | 457,053,617 | | 2,046,845 | | 415,039,522 | | 1,917,828 | |
Other receivables, gross (1) | | 70,596,330 | | 58,480,998 | | 48,586,823 | | 34,264,571 | |
| | As of December 31, | |
| | 2018 | | 2017 | |
| | Current | | Non-current | | Current | | Non-current | |
Trade and Other Receivables, Net | | ThCh$ | | ThCh$ | | ThCh$ | | ThCh$ | |
Trade and other receivables, net | | 478,170,067 | | 60,527,843 | | 406,968,537 | | 36,182,399 | |
Trade and other receivables, net (2) | | 417,927,182 | | 2,046,845 | | 380,379,326 | | 1,917,828 | |
Other receivables, net (1) | | 60,242,885 | | 58,480,998 | | 26,589,211 | | 34,264,571 | |
| | As of December 31, |
| | 2016 | | 2015 |
| | Current | | Non-current | | Current | | Non-current |
Trade and Other Receivables, Gross | | ThCh$ | | ThCh$ | | ThCh$ | | ThCh$ |
Trade and other receivables, gross | | 484,533,736 | | 33,500,105 | | 632,241,957 | | 14,392,223 |
Trade receivables, gross (2) | | 414,184,116 | | 8,369,878 | | 510,503,498 | | 2,892,026 |
Other receivables, gross (1) | | 70,349,620 | | 25,130,227 | | 121,738,459 | | 11,500,197 |
| | | | | | | | |
| | As of December 31, |
| | 2016 | | 2015 |
| | Current | | Non-current | | Current | | Non-current |
Trade and Other Receivables, Net | | ThCh$ | | ThCh$ | | ThCh$ | | ThCh$ |
Trade and other receivables, net | | 445,071,856 | | 33,500,105 | | 596,364,467 | | 14,392,223 |
Trade and other receivables, net (2) | | 382,487,300 | | 8,369,878 | | 482,788,831 | | 2,892,026 |
Other receivables, net (1) | | 62,584,556 | | 25,130,227 | | 113,575,636 | | 11,500,197 |
| (1)
| As of December 31, 2016, it mainly includes accounts receivable related to loans and advances to employees for ThCh$11,167,266 (ThCh$13,949,748 as of December 31, 2015); and Recoverable taxes (VAT) of ThCh$18,658,849 (ThCh$77,116,709 as of December 31, 2015).
|
| (2)
| As of December 31, 2016, our subsidiary Enel Distribución Chile S.A. recognized unbilled revenue and trade and other accounts receivable for the difference between current and effective Average Node Prices for ThCh$8,581,761 (ThCh$33,649,923 as of December 31, 2015) to be billed and charge to regulated end-customers.
|
(1) This includes, as of December 31, 2018, recoveries from insurance companies for claims of ThCh$18,805,057 (ThCh$1,048,903 as of December 31, 2017), accounts receivable from employees of ThCh$11,663,906 (ThCh$9,709,051 as of December 31, 2017), advances to suppliers and creditors of ThCh$19,639,578 (ThCh$5,360,307 as of December 31, 2017), leasing debtors of ThCh$61,753,441 (ThCh$34,550,131 as of December 31, 2017) and others of ThCh$6,861,901 (ThCh$10,185,390).
(2)There are no significant trade and other receivables balances held by the Group that are not available for its use.
The Group does not have customers with sales representing 10% or more of its total consolidated revenues for the years ended December 31, 2016, 20152018 and 2014.
2017. Refer to Note 9.112.1 for detailed information on amounts, terms and conditions associated with accounts receivable from related parties.
F-64
Table of Contents
b) Lease receivables
As of December 31, 2018 and 2017, the present value of minimum lease payments receivable is as follows:
| | 12-31-2018 | | 12-31-2017 | |
| | Gross | | Interest | | Present Value | | Gross | | Interest | | Present Value | |
| | ThCh$ | | ThCh$ | | ThCh$ | | ThCh$ | | ThCh$ | | ThCh$ | |
Less than one year | | 8,033,838 | | 1,932,026 | | 6,101,812 | | 4,380,499 | | 944,578 | | 3,435,921 | |
From one to five years | | 32,135,353 | | 5,678,839 | | 26,456,514 | | 17,521,998 | | 3,617,167 | | 13,904,831 | |
More than five years | | 31,861,803 | | 2,666,687 | | 29,195,116 | | 18,127,398 | | 918,019 | | 17,209,379 | |
Total | | 72,030,994 | | 10,277,552 | | 61,753,442 | | 40,029,895 | | 5,479,764 | | 34,550,131 | |
Lease arrangements are related to public lightning developments mainly to municipalities.
c) As of December 31, 2018 and 2017, the balance of past due but not impaired trade receivables is as follows
| | As of December 31, | |
| | 2018 | | 2017 | |
Trade Receivables Past Due But Not Impaired (*) | | ThCh$ | | ThCh$ | |
Less than three months | | 37,711,262 | | 54,488,473 | |
Between three and six months | | 3,916,489 | | 9,008,195 | |
Between six and twelve months | | 5,312,988 | | 7,123,391 | |
More than twelve months | | 11,328,175 | | 16,067,867 | |
Total | | 58,268,914 | | 86,687,926 | |
(*) These balances correspond to non-impaired past due accounts and the portion does not affect the provision of other accounts due receivable.
d) The reconciliation of changes in the allowance for impairment of trade receivables is as follows:
| b)
| As of December 31, 2016Current and 2015, the balance of past due but not impaired trade receivables is as follows
|
| | As of December 31, |
| | 2016 | | 2015 |
Trade Receivables Past Due But Not Impaired | | ThCh$ | | ThCh$ |
Less than three months | | 52,259,795 | | 51,739,295 |
Between three and six months | | 10,795,139 | | 6,917,165 |
Between six and twelve months | | 15,842,450 | | 3,795,722 |
More than twelve months | | 23,338,216 | | 19,423,526 |
Total | | 102,235,600 | | 81,875,708 |
| c)
| The reconciliation of changes in the allowance for impairment of trade receivables is as follows:
|
| | Current and
|
|
| Non-current |
|
Trade Receivables Past Due and Impaired |
| ThCh$ |
|
Balance at December 31, 2016 | | ThCh$
|
Balance at January 1, 201439,461,880
| | 30,886,147
|
Increases (decreases) for the year (*) | | 655,6007,937,817
| |
Amounts written off | | (1,706,580)(3,525,638
| ) |
Balance at December 31, 20142017 | | 29,835,16743,874,059
| |
Initial balance adjustment for IFRS 9 | | 4,673,467 | |
Increases (decreases) for the year (*) | | 7,110,3084,777,708
| |
Amounts written off | | (1,067,985)(3,863,702
| ) |
Balance at December 31, 2015Other movements
| | 35,877,49018,348
| |
Increases (decreases) for the year (*)Balance at December 31, 2018
| | 5,141,179
|
Amounts written off49,479,880
| | (1,556,789)
|
Balance at December 31, 2016
| | 39,461,880
|
| (*)
| See Note 28 for impairment of financial assets.
|
(*) See Note 31 for impairment of financial assets.
Write-offs for past due receivables
Past due receivables are written off once all collection procedures and legal proceedings have been exhausted and the debtors’ insolvency has been demonstrated. In our power generation business, this process normally takes at least one year. In our distribution business the process takes at least twenty four months. Overall, the risk of writing off our trade receivables is limited (See Notes 3.g.3 19.5 and Appendices 6 and 6.1)22.5)
e) Additional information:
· Additional statistical information required under Official Bulletin 715 of the CMF, of February 3, 2012 (XBRL Taxonomy). See Appendix 2.
· Supplementary information on trade receivables. See Appendix 2.1.
F-65
9.
| BALANCES AND TRANSACTIONS WITH RELATED PARTIES.
|
Related party transactions are performed at current market conditions.
Transactions between the Group and its subsidiaries, associates and joint ventures have been eliminated on consolidation and are not itemized in this note.
As of the date of these financial statements, no guarantees have been given or received nor has any allowance for bad or doubtful accounts been recorded with respect to receivable balances for related party transactions.
The controlling shareholder of the Company is the Italian corporation Enel S.p.A.S.p.A..
9.112.1 Balances and transactionstransactions with related parties
The balances of accounts receivable and payable between the Group and its non-consolidated related companies are as follows:
a) Receivables from related parties
| | | | | | | | | | | | | | Current | | Non-current | |
Taxpayer ID | | | | | | | | | | | | | | 12-31-2018 | | 12-31-2017 | | 12-31-2018 | | 12-31-2017 | |
Number | | Company | | Country | | Relationship | | Currency | | Description of transaction | | Term of transaction | | ThCh$ | | ThCh$ | | ThCh$ | | ThCh$ | |
Foreign | | Endesa España | | Spain | | Common Immediate Parent | | CH$ | | Other services | | Less than 90 days | | — | | 70,371 | | — | | — | |
Foreign | | Endesa España | | Spain | | Common Immediate Parent | | Euros | | Other services | | Less than 90 days | | 27,023 | | 13,077 | | — | | — | |
96.524.140-K | | Empresa Electrica Panguipulli S.A. | | Chile | | Common Immediate Parent | | CH$ | | Energy sales | | Less than 90 days | | — | | 1,031,125 | | — | | — | |
96.524.140-K | | Empresa Electrica Panguipulli S.A. | | Chile | | Common Immediate Parent | | CH$ | | Tolls | | Less than 90 days | | — | | 79,217 | | — | | — | |
96.524.140-K | | Empresa Electrica Panguipulli S.A. | | Chile | | Common Immediate Parent | | CH$ | | Other services | | Less than 90 days | | — | | 86,089 | | — | | — | |
76.418.940-K | | GNL Chile S.A. | | Chile | | Associate | | CH$ | | Gas Purchase | | Less than 90 days | | 14,666,414 | | 18,793,098 | | — | | — | |
76.418.940-K | | GNL Chile S.A. | | Chile | | Associate | | CH$ | | Dividends | | Less than 90 days | | 788,336 | | — | | — | | — | |
Foreign | | Endesa Generación | | Spain | | Common Immediate Parent | | Euros | | Other services | | Less than 90 days | | 41,820 | | 36,067 | | — | | — | |
Foreign | | Enel Italia SrL. | | Italy | | Common Immediate Parent | | Euros | | Other services | | Less than 90 days | | 295,892 | | 8,144 | | — | | — | |
Foreign | | Enel Italia SrL. | | Italy | | Common Immediate Parent | | Euros | | Other services | | Less than 90 days | | — | | 290,838 | | — | | — | |
Foreign | | Enel Global Trading S.p.A. IT | | Italy | | Common Immediate Parent | | Euros | | Other services | | Less than 90 days | | 44,675 | | 8,511 | | — | | — | |
Foreign | | Enel Global Trading S.p.A. IT | | Italy | | Common Immediate Parent | | Euros | | Gas sales | | Less than 90 days | | 18,565,698 | | 21,484,590 | | — | | — | |
Foreign | | Enel Global Trading S.p.A. IT | | Italy | | Common Immediate Parent | | Euros | | Commodity derivatives | | Less than 90 days | | 3,671,446 | | 20,751,714 | | — | | — | |
76.126.507-5 | | Parque Eolico Talinay Oriente SA | | Chile | | Common Immediate Parent | | CH$ | | Energy sales | | Less than 90 days | | — | | 16,994 | | — | | — | |
76.126.507-5 | | Parque Eolico Talinay Oriente SA | | Chile | | Common Immediate Parent | | CH$ | | Tolls | | Less than 90 days | | — | | 134 | | — | | — | |
76.126.507-5 | | Parque Eolico Talinay Oriente SA | | Chile | | Common Immediate Parent | | CH$ | | Other services | | Less than 90 days | | — | | 49,677 | | — | | — | |
76.321.458-3 | | Sociedad Almeyda Solar SpA | | Chile | | Common Immediate Parent | | CH$ | | Energy sales | | Less than 90 days | | — | | 50,594 | | — | | — | |
76.321.458-3 | | Sociedad Almeyda Solar SpA | | Chile | | Common Immediate Parent | | CH$ | | Tolls | | Less than 90 days | | — | | 35,572 | | — | | — | |
76.321.458-3 | | Sociedad Almeyda Solar SpA | | Chile | | Common Immediate Parent | | CH$ | | Other services | | Less than 90 days | | — | | 19,877 | | — | | — | |
76.179.024-2 | | Parque Eolico Tal Tal S.A. | | Chile | | Common Immediate Parent | | CH$ | | Energy sales | | Less than 90 days | | — | | 41,487 | | — | | — | |
76.179.024-2 | | Parque Eolico Tal Tal S.A. | | Chile | | Common Immediate Parent | | CH$ | | Tolls | | Less than 90 days | | — | | 425 | | — | | — | |
76.179.024-2 | | Parque Eolico Tal Tal S.A. | | Chile | | Common Immediate Parent | | CH$ | | Other services | | Less than 90 days | | — | | 54,638 | | — | | — | |
Foreign | | Enel S.p.A. | | Italy | | Parent | | CH$ | | Other services | | Less than 90 days | | — | | 157,701 | | — | | — | |
Foreign | | Enel S.p.A. | | Italy | | Parent | | Euros | | Other services | | Less than 90 days | | 415,200 | | 215,289 | | — | | — | |
76.052.206-6 | | Parque Eolico Valle de los Vientos S.A. | | Chile | | Common Immediate Parent | | CH$ | | Energy sales | | Less than 90 days | | — | | 75,956 | | — | | — | |
76.052.206-6 | | Parque Eolico Valle de los Vientos S.A. | | Chile | | Common Immediate Parent | | CH$ | | Other services | | Less than 90 days | | — | | 49,677 | | — | | — | |
76.412.562-2 | | Enel Green Power del Sur SPA | | Chile | | Common Immediate Parent | | CH$ | | Energy sales | | Less than 90 days | | — | | 28,835 | | — | | — | |
76.412.562-2 | | Enel Green Power del Sur SPA | | Chile | | Common Immediate Parent | | CH$ | | Tolls | | Less than 90 days | | — | | 3,443 | | — | | — | |
76.412.562-2 | | Enel Green Power del Sur SPA | | Chile | | Common Immediate Parent | | CH$ | | Other services | | Less than 90 days | | — | | 310,179 | | — | | — | |
96.920.110-0 | | Enel Green Power Chile Ltda. | | Chile | | Common Immediate Parent | | CH$ | | Other services | | Less than 90 days | | — | | 162,594 | | — | | — | |
Foreign | | Enel Brasil S.A. | | Brasil | | Common Immediate Parent | | CH$ | | Other services | | Less than 90 days | | 281,002 | | 47,998 | | — | | — | |
Foreign | | Enel Brasil S.A. | | Brasil | | Common Immediate Parent | | Euros | | Other services | | Less than 90 days | | | | 116,436 | | — | | — | |
Foreign | | Enel Brasil S.A. | | Brasil | | Common Immediate Parent | | US$ | | Other services | | Less than 90 days | | 173,300 | | 2,068,594 | | — | | — | |
Foreign | | PH Chucas Costa Rica | | Costa Rica | | Common Immediate Parent | | CH$ | | Other services | | Less than 90 days | | — | | 432,233 | | — | | — | |
Foreign | | Emgesa S.A. E.S.P. | | Colombia | | Common Immediate Parent | | US$ | | Other services | | Less than 90 days | | 703,368 | | — | | — | | — | |
Foreign | | Emgesa S.A. E.S.P. | | Colombia | | Common Immediate Parent | | $ Col | | Other services | | Less than 90 days | | — | | 13,746 | | — | | — | |
Foreign | | Codensa S.A. | | Colombia | | Common Immediate Parent | | CH$ | | Other services | | Less than 90 days | | — | | 791,622 | | — | | — | |
Foreign | | Codensa S.A. | | Colombia | | Common Immediate Parent | | Euros | | Other services | | Less than 90 days | | — | | 29,221 | | — | | — | |
Foreign | | Codensa S.A. | | Colombia | | Common Immediate Parent | | US$ | | Other services | | Less than 90 days | | 427,882 | | — | | — | | — | |
Foreign | | Enel Generación Perú S.A. | | Perú | | Common Immediate Parent | | CH$ | | Other services | | Less than 90 days | | — | | 15,192 | | — | | — | |
Foreign | | Enel Generación Perú S.A. | | Perú | | Common Immediate Parent | | US$ | | Other services | | Less than 90 days | | 973,873 | | 758,841 | | — | | — | |
94.271.000-3 | | Enel Américas S.A. | | Chile | | Common Immediate Parent | | US$ | | Other services | | Less than 90 days | | 107,071 | | — | | — | | — | |
94.271.000-3 | | Enel Américas S.A. | | Chile | | Common Immediate Parent | | CH$ | | Other services | | Less than 90 days | | 4,197,951 | | 1,487,709 | | — | | — | |
94.271.000-3 | | Enel Américas S.A. | | Chile | | Common Immediate Parent | | CH$ | | Other services | | Less than 90 days | | — | | 54,949 | | — | | — | |
Foreign | | Enel Green Power Colombia SAS | | Colombia | | Common Immediate Parent | | US$ | | Other services | | Less than 90 days | | 419,032 | | 46,557 | | — | | — | |
Foreign | | Enel Generación Piura S.A. | | Perú | | Common Immediate Parent | | US$ | | Other services | | Less than 90 days | | 89,545 | | 165,875 | | — | | — | |
Foreign | | Chinango S.A.C. | | Perú | | Common Immediate Parent | | CH$ | | Other services | | Less than 90 days | | — | | 17,410 | | — | | — | |
Foreign | | Enel Green Power Italia | | Italy | | Common Immediate Parent | | CH$ | | Other services | | Less than 90 days | | — | | 262,694 | | — | | — | |
Foreign | | Enel Green Power Spa IT | | Italy | | Common Immediate Parent | | Euros | | Other services | | Less than 90 days | | 2,405,958 | | — | | — | | — | |
96.971.330-6 | | Geotérmica del Norte | | Chile | | Common Immediate Parent | | US$ | | Other services | | Less than 90 days | | — | | 82,830 | | — | | — | |
96.971.330-6 | | Geotérmica del Norte | | Chile | | Common Immediate Parent | | CH$ | | Energy sales | | Less than 90 days | | — | | 10,096 | | — | | — | |
Foreign | | Enel Distribución Perú S.A. | | Perú | | Common Immediate Parent | | CH$ | | Other services | | Less than 90 days | | 354,283 | | 354,283 | | — | | — | |
Foreign | | Enel Green Power Mexico | | México | | Common Immediate Parent | | US$ | | Other services | | Less than 90 days | | 98,519 | | 152,495 | | — | | — | |
Foreign | | Enel Green Power Perú | | Perú | | Common Immediate Parent | | US$ | | Other services | | Less than 90 days | | 1,959,124 | | 177,478 | | — | | — | |
Foreign | | Enel Green Power Brasil | | Brasil | | Common Immediate Parent | | US$ | | Other services | | Less than 90 days | | — | | 37,936 | | — | | — | |
Foreign | | Energía Nueva Energía Limpia Mexico S.R.L | | México | | Common Immediate Parent | | US$ | | Other services | | Less than 90 days | | 52,241 | | — | | — | | — | |
Foreign | | Proyectos y Soluciones Renovables S.A.C. | | Perú | | Common Immediate Parent | | US$ | | Other services | | Less than 90 days | | 29,054 | | — | | — | | — | |
Foreign | | Enel Generacion Costanera S.A. | | Argentina | | Common Immediate Parent | | US$ | | Other services | | Less than 90 days | | 32,264 | | — | | — | | — | |
Foreign | | Enel Generacion El Chocon S.A. | | Perú | | Common Immediate Parent | | US$ | | Other services | | Less than 90 days | | 13,367 | | — | | — | | — | |
Foreign | | Enel Green Power Brasil Participacoes LTDA. | | Brasil | | Common Immediate Parent | | US$ | | Other services | | Less than 90 days | | 52,215 | | 9,188 | | — | | — | |
Foreign | | Enel Green Power Brasil Participacoes LTDA. | | Brasil | | Common Immediate Parent | | Real | | Other services | | Less than 90 days | | 23,329 | | — | | — | | — | |
Foreign | | Enel Finance International NV (*) | | Holanda | | Common Immediate Parent | | US$ | | Loan | | Less than 90 days | | 1,008,208 | | — | | — | | — | |
Foreign | | Enel Power Argentina | | Argentina | | Common Immediate Parent | | US$ | | Other services | | Less than 90 days | | 276,607 | | — | | — | | — | |
Foreign | | Energetica Monzon S.A.C. | | Perú | | Common Immediate Parent | | US$ | | Other services | | Less than 90 days | | 601,512 | | — | | — | | — | |
Foreign | | Enel Green Power RSA (PTY) LTD | | South Africa | | Common Immediate Parent | | US$ | | Other services | | Less than 90 days | | 466,281 | | — | | — | | — | |
Foreign | | Enel Green Power North America Inc | | United States | | Common Immediate Parent | | US$ | | Other services | | Less than 90 days | | 57,761 | | — | | — | | — | |
Foreign | | Empresa Distribuidora Sur S.A. | | Argentina | | Common Immediate Parent | | CH$ | | Other services | | Less than 90 days | | 23,077 | | 796,750 | | — | | — | |
Foreign | | Empresa Distribuidora Sur S.A. | | Argentina | | Common Immediate Parent | | US$ | | Other services | | Less than 90 days | | 464,846 | | — | | — | | — | |
76.201.136-0 | | Energía y Servicios South America Spa | | Chile | | Common Immediate Parent | | CH$ | | Mercantile Current Account | | Less than 90 days | | 166,870 | | — | | — | | — | |
76.201.136-0 | | Energía y Servicios South America Spa | | Chile | | Common Immediate Parent | | CH$ | | Other services | | Less than 90 days | | 142,847 | | — | | — | | — | |
Foreign | | Enel X SLR | | Italy | | Common Immediate Parent | | CH$ | | Other services | | Less than 90 days | | 14,233 | | — | | — | | — | |
Foreign | | ENEL MAP | | Italy | | Common Immediate Parent | | CH$ | | Other services | | Less than 90 days | | 10,365 | | — | | — | | — | |
76.091.585-5 | | Aysén Energìa | | Chile | | Common Immediate Parent | | CH$ | | Other services | | Less than 90 days | | 14,286 | | — | | — | | — | |
76.041.891-9 | | Aysén Transmisiòn | | Chile | | Common Immediate Parent | | CH$ | | Other services | | Less than 90 days | | 14,285 | | — | | — | | — | |
| | | | | | | | | | | | Total | | 54,171,060 | | 71,856,046 | | — | | — | |
F-66
| a)
| Receivables from related parties
|
Table of Contents
b) Accounts payable to related parties
| | | | | | | | | | | | | | Current | | Non-current | |
Taxpayer ID | | | | | | | | | | | | | | 12-31-2018 | | 12-31-2017 | | 12-31-2018 | | 12-31-2017 | |
Number | | Company | | Country | | Relationship | | Currency | | Description of transaction | | Terms of transaction | | ThCh$ | | ThCh$ | | ThCh$ | | ThCh$ | |
Foreign | | Endesa España | | Spain | | Common Immediate Parent | | Euros | | Other services | | Less than 90 days | | 159,940 | | 277,868 | | — | | — | |
Foreign | | Enel Brasil S.A. | | Brasil | | Common Immediate Parent | | US$ | | Other services | | Less than 90 days | | 74,949 | | 77,680 | | — | | — | |
Foreign | | Enel Trading Argentina S.R.L. | | Argentina | | Common Immediate Parent | | US$ | | Other services | | Less than 90 days | | 77,624 | | — | | — | | — | |
Foreign | | Enel Trading Argentina S.R.L. | | Argentina | | Common Immediate Parent | | AR$ | | Other services | | Less than 90 days | | — | | 74,740 | | — | | — | |
Foreign | | Emgesa S.A. E.S.P. | | Colombia | | Common Immediate Parent | | Col$ | | Other services | | Less than 90 days | | 4,723 | | 4,551 | | — | | — | |
94.271.000-3 | | Enel Américas S.A. | | Chile | | Common Immediate Parent | | CH$ | | Other services | | Less than 90 days | | 1,461,815 | | 4,650 | | — | | — | |
94.271.000-3 | | Enel Américas S.A. | | Chile | | Common Immediate Parent | | US$ | | Other services | | Less than 90 days | | 1,987 | | 912,731 | | — | | — | |
Foreign | | Enel Distribución Perú S.A. | | Perú | | Common Immediate Parent | | US$ | | Other services | | Less than 90 days | | 2,291 | | — | | — | | — | |
Foreign | | Enel Distribución Perú S.A. | | Perú | | Common Immediate Parent | | CH$ | | Other services | | Less than 90 days | | — | | 2,110 | | — | | — | |
96.524.140-K | | Empresa Electrica Panguipulli S.A. | | Chile | | Common Immediate Parent | | CH$ | | Energy purchase | | Less than 90 days | | — | | 3,175,956 | | — | | — | |
96.524.140-K | | Empresa Electrica Panguipulli S.A. | | Chile | | Common Immediate Parent | | CH$ | | Tolls | | Less than 90 days | | — | | 71,648 | | — | | — | |
76.418.940-K | | GNL Chile S.A. | | Chile | | Associate | | US$ | | Gas Purchase | | Less than 90 days | | 5,935,652 | | 8,100,426 | | — | | — | |
76.418.940-k | | GNL Chile S.A. | | Chile | | Associate | | CH$ | | Other services | | Less than 90 days | | 12,389 | | — | | — | | — | |
Foreign | | Endesa Generación | | Spain | | Common Immediate Parent | | CH$ | | Other services | | Less than 90 days | | — | | 22,257 | | — | | — | |
Foreign | | Endesa Generación | | Spain | | Common Immediate Parent | | Euros | | Other services | | Less than 90 days | | 702,702 | | 214,667 | | — | | — | |
Foreign | | Enel Iberoamérica S.R.L | | Spain | | Parent | | Euros | | Other services | | Less than 90 days | | — | | 749,834 | | — | | — | |
Foreign | | Enel Iberoamérica S.R.L | | Spain | | Parent | | CH$ | | Other services | | Less than 90 days | | — | | 35 | | — | | — | |
Foreign | | Enel Iberia SRL | | Italy | | Common Immediate Parent | | CH$ | | Other services | | Less than 90 days | | 35 | | — | | — | | — | |
Foreign | | Enel Iberia SRL | | Italy | | Common Immediate Parent | | Euros | | Other services | | Less than 90 days | | 820,642 | | — | | — | | — | |
Foreign | | E-Distribuzione Spa | | Italy | | Common Immediate Parent | | Euros | | Other services | | Less than 90 days | | 336,814 | | 3,187,971 | | — | | — | |
Foreign | | Enel Produzione | | Italy | | Common Immediate Parent | | Euros | | Other services | | Less than 90 days | | 7,482,038 | | 10,501,963 | | — | | 318,518 | |
Foreign | | Enel Energía | | Italy | | Common Immediate Parent | | Euros | | Other services | | Less than 90 days | | 452,289 | | 348,370 | | — | | — | |
76.321.458-3 | | Sociedad Almeyda Solar Spa | | Chile | | Common Immediate Parent | | CH$ | | Energy purchase | | Less than 90 days | | — | | 371,339 | | — | | — | |
76.321.458-3 | | Sociedad Almeyda Solar Spa | | Chile | | Common Immediate Parent | | CH$ | | Tolls | | Less than 90 days | | — | | 64,484 | | — | | — | |
77.017.930-0 | | Transmisora Eléctrica de Quillota Ltda. | | Chile | | Joint venture | | CH$ | | Tolls | | Less than 90 days | | 13,887 | | 72,965 | | — | | — | |
77.017.930-0 | | Transmisora Eléctrica de Quillota Ltda. | | Chile | | Joint venture | | CH$ | | Energy purchase | | Less than 90 days | | — | | 70,984 | | — | | — | |
76.126.507-5 | | Parque Eolico Talinay Oriente SA | | Chile | | Common Immediate Parent | | CH$ | | Energy purchase | | Less than 90 days | | — | | 65,829 | | — | | — | |
76.126.507-5 | | Parque Eolico Talinay Oriente SA | | Chile | | Common Immediate Parent | | CH$ | | Tolls | | Less than 90 days | | — | | 258 | | — | | — | |
Foreign | | Enel Green Power España SL | | Spain | | Common Immediate Parent | | Euros | | Other services | | Less than 90 days | | 217,859 | | — | | — | | — | |
Foreign | | Enel Global Trading S.p.A. IT | | Italy | | Common Immediate Parent | | Euros | | Other services | | Less than 90 days | | 2,258,059 | | 924,051 | | — | | — | |
Foreign | | Enel Global Trading S.p.A. IT | | Italy | | Common Immediate Parent | | Euros | | Commodity derivatives | | Less than 90 days | | 9,849,260 | | 4,184,469 | | — | | — | |
76.179.024-2 | | Parque Eolico Tal Tal S.A. | | Chile | | Common Immediate Parent | | CH$ | | Energy purchase | | Less than 90 days | | — | | 2,105,042 | | — | | — | |
76.179.024-2 | | Parque Eolico Tal Tal S.A. | | Chile | | Common Immediate Parent | | CH$ | | Tolls | | Less than 90 days | | — | | 484 | | — | | — | |
76.412.562-2 | | Enel Green Power del Sur SPA | | Chile | | Common Immediate Parent | | CH$ | | Energy purchase | | Less than 90 days | | — | | 10,323,531 | | — | | — | |
76.412.562-2 | | Enel Green Power del Sur SPA | | Chile | | Common Immediate Parent | | CH$ | | Tolls | | Less than 90 days | | — | | 853 | | — | | — | |
96.920.110-0 | | Enel Green Power Chile Ltda. | | Chile | | Common Immediate Parent | | CH$ | | Other services | | Less than 90 days | | — | | 90,134 | | — | | — | |
Foreign | | Enel S.p.A. | | Italy | | Parent | | Euros | | Other services | | Less than 90 days | | — | | 77,415 | | — | | — | |
Foreign | | Enel S.p.A. | | Italy | | Parent | | CH$ | | Dividens | | Less than 90 days | | 67,197,814 | | 63,543,371 | | — | | — | |
Foreign | | Enel S.p.A. | | Italy | | Parent | | Euros | | Other services | | Less than 90 days | | 5,866,256 | | 1,583,058 | | — | | — | |
76.052.206-6 | | Parque Eolico Valle de los Vientos S.A. | | Chile | | Common Immediate Parent | | CH$ | | Energy purchase | | Less than 90 days | | — | | 1,261,153 | | — | | — | |
Foreign | | Enel Italia SrL. | | Italy | | Common Immediate Parent | | CH$ | | Other services | | Less than 90 days | | — | | 4,591,580 | | — | | — | |
Foreign | | Enel Italia SrL. | | Italy | | Common Immediate Parent | | Euros | | Other services | | Less than 90 days | | 12,186,715 | | 2,089,122 | | — | | — | |
Foreign | | Codensa S.A. | | Colombia | | Common Immediate Parent | | US$ | | Other services | | Less than 90 days | | — | | 7,936 | | — | | — | |
Foreign | | Codensa S.A. | | Colombia | | Common Immediate Parent | | US$ | | Other services | | Less than 90 days | | 13,579 | | — | | — | | — | |
Foreign | | Enel Global Thermal Generation S.r.l. | | Italy | | Common Immediate Parent | | Euros | | Other services | | Less than 90 days | | 2,199,811 | | — | | — | | — | |
Foreign | | ENEL MAP | | Italy | | Common Immediate Parent | | Euros | | Other services | | Less than 90 days | | 1,235,525 | | — | | — | | — | |
Foreign | | Enel Green Power Spa IT | | Italy | | Common Immediate Parent | | Euros | | Other services | | Less than 90 days | | 30,353,425 | | — | | — | | — | |
Foreign | | Enel Green Power North America Inc | | United States | | Common Immediate Parent | | US$ | | Other services | | Less than 90 days | | 149,591 | | — | | — | | — | |
Foreign | | Enel Finance International NV | | Holland | | Common Immediate Parent | | US$ | | Loan | | Less than 90 days | | 123,979 | | — | | 447,193,802 | | — | |
Foreign | | Enel Green Power Italia | | Italy | | Common Immediate Parent | | CH$ | | Other services | | Less than 90 days | | — | | 457,457 | | — | | — | |
76.201.136-0 | | Energía y Servicios South America Spa | | Chile | | Common Immediate Parent | | CH$ | | Other services | | Less than 90 days | | 370,028 | | — | | — | | — | |
Foreign | | Enel X SLR | | Italy | | Common Immediate Parent | | Euros | | Other services | | Less than 90 days | | 40,656 | | — | | — | | — | |
Foreign | | Cesi S.p.A. | | Italy | | Common Immediate Parent | | Euros | | Other services | | Less than 90 days | | 458,228 | | — | | — | | — | |
Foreign | | Tecnatom SA | | Italy | | Common Immediate Parent | | Euros | | Other services | | Less than 90 days | | 102,962 | | — | | — | | — | |
Foreign | | Enel Green Power Spa GLO | | Italy | | Common Immediate Parent | | Euros | | Other services | | Less than 90 days | | 7,772,801 | | — | | — | | | |
| | | | | | | | | | | | Total | | 157,936,325 | | 119,612,972 | | 447,193,802 | | 318,518 | |
| | | | | | | | | | | | | | Current | | Non-current |
Taxpayer ID Number (RUT) | | Company | | Country | | Relationship | | Currency | | Description of transaction | | Term of transaction | | 12-31-2016 | | 12-31-2015 | | 12-31-2016 | | 12-31-2015 |
| | | | | | | ThCh$ | | ThCh$ | | ThCh$ | | ThCh$ |
Foreign | | Enel Iberoamérica SRL (former Enel Latinoamerica) | | Spain | | Common Immediate Parent | | CH$ | | Other services | | Less than 90 days | | - | | 47,244 | | - | | - |
Foreign | | Endesa, S.A. | | Spain | | Common Immediate Parent | | CH$ | | Other services | | More than 90 days | | 83,448 | | 74,601 | | - | | - |
96.524.140-K | | Empresa Electrica Panguipulli S.A. | | Chile | | Common Immediate Parent | | CH$ | | Energy sales | | Less than 90 days | | 129,755 | | 86,713 | | - | | - |
96.524.140-K | | Empresa Electrica Panguipulli S.A. | | Chile | | Common Immediate Parent | | CH$ | | Tolls | | Less than 90 days | | 57,827 | | 68,184 | | - | | - |
96.880.800-1 | | Empresa Electrica Puyehue S.A. | | Chile | | Common Immediate Parent | | CH$ | | Energy sales | | Less than 90 days | | 64 | | 64 | | - | | - |
Foreign | | Endesa Energía S.A. | | Chile | | Common Immediate Parent | | CH$ | | Gas sales | | Less than 90 days | | - | | 232,867 | | - | | - |
96.806.130-5 | | Electrogas S.A. | | Chile | | Associate | | CH$ | | Dividends | | Less than 90 days | | - | | 1,849,765 | | - | | - |
76.788.080-4 | | GNL Quintero S.A. | | Chile | | Associate | | CH$ | | Energy sales | | Less than 90 days | | - | | 571,118 | | - | | - |
76.418.940-k | | GNL Chile S.A. | | Chile | | Associate | | US$ | | Advance natural gas purchase | | Less than 90 days | | 16,780,275 | | 15,570,315 | | - | | - |
76.418.940-k | | GNL Chile S.A. | | Chile | | Associate | | US$ | | Loan | | Less than 90 days | | - | | 1,498,339 | | - | | - |
Foreign | | Endesa Generación | | Spain | | Common Immediate Parent | | US$ | | Other services | | Less than 90 days | | 36,067 | | - | | - | | - |
Foreign | | Endesa Generación | | Spain | | Common Immediate Parent | | CH$ | | Commodity derivatives | | Less than 90 days | | 587,224 | | 1,858,366 | | - | | - |
Foreign | | Enel Italia Servizi SRL | | Italy | | Common Immediate Parent | | CH$ | | Other services | | Less than 90 days | | 8,144 | | 18,228 | | - | | - |
Foreign | | Enel Italia Servizi SRL | | Italy | | Common Immediate Parent | | Euros | | Other services | | Less than 90 days | | 278,834 | | - | | - | | - |
Foreign | | Enel Trade S.p.A. | | Italy | | Common Immediate Parent | | CH$ | | Commodity derivatives | | Less than 90 days | | 22,321,017 | | 20,397 | | - | | - |
76.126.507-5 | | Parque Eolico Talinay Oriente SA | | Chile | | Common Immediate Parent | | CH$ | | Energy sales | | Less than 90 days | | 142,926 | | 59,785 | | - | | - |
76.126.507-5 | | Parque Eolico Talinay Oriente SA | | Chile | | Common Immediate Parent | | CH$ | | Tolls | | Less than 90 days | | 8 | | - | | - | | - |
76.321.458-3 | | Sociedad Almeyda Solar SpA | | Chile | | Common Immediate Parent | | CH$ | | Energy sales | | Less than 90 days | | 98,353 | | 125,314 | | - | | - |
76.321.458-3 | | Sociedad Almeyda Solar SpA | | Chile | | Common Immediate Parent | | CH$ | | Tolls | | Less than 90 days | | 21,774 | | - | | - | | - |
76.179.024-2 | | Parque Eolico Tal Tal S.A. | | Chile | | Common Immediate Parent | | CH$ | | Energy sales | | Less than 90 days | | 243,946 | | 215,977 | | - | | - |
Foreign | | Enel SpA | | Italy | | Parent | | CH$ | | Other services | | Less than 90 days | | 194,879 | | - | | - | | - |
Foreign | | Enel SpA | | Italy | | Parent | | Euros | | Other services | | Less than 90 days | | 145,858 | | - | | - | | - |
76.052.206-6 | | Parque Eolico Valle de los Vientos S.A. | | Chile | | Common Immediate Parent | | CH$ | | Energy sales | | Less than 90 days | | 81,377 | | 125,728 | | - | | - |
Foreign | | Distrilec | | Argentina | | Common Immediate Parent | | CH$ | | Other services | | Less than 90 days | | - | | 1,014 | | - | | - |
76.412.562-2 | | Enel Green Power del Sur SpA | | Chile | | Common Immediate Parent | | CH$ | | Energy sales | | Less than 90 days | | 25,559 | | - | | - | | - |
96.210.110-10 | | Enel Green Power Chile S.A. | | Chile | | Common Immediate Parent | | CH$ | | Other services | | Less than 90 days | | 34,851 | | - | | - | | - |
Foreign | | Enel Brasil S.A. | | Brazil | | Common Immediate Parent | | CH$ | | Other services | | Less than 90 days | | 2,121,609 | | - | | - | | - |
Foreign | | Enel Brasil S.A. | | Brazil | | Common Immediate Parent | | Real | | Other services | | Less than 90 days | | 36,276 | | - | | - | | - |
76.532.379-7 | | Chilectra Inversud | | Chile | | Common Immediate Parent | | CH$ | | Other services | | Less than 90 days | | 150,246 | | 149,609 | | - | | - |
Foreign | | PH Chucas Costa Rica | | Costa Rica | | Common Immediate Parent | | CP | | Other services | | Less than 90 days | | 1,614,168 | | 1,188,564 | | - | | - |
Foreign | | Emgesa S.A. E.S.P. | | Colombia | | Common Immediate Parent | | CH$ | | Other services | | Less than 90 days | | 29,989 | | - | | - | | - |
Foreign | | Emgesa S.A. E.S.P. | | Colombia | | Common Immediate Parent | | CP | | Other services | | Less than 90 days | | 13,327 | | - | | - | | - |
Foreign | | Codensa S.A. | | Colombia | | Common Immediate Parent | | CH$ | | Other services | | Less than 90 days | | 423,462 | | 254,126 | | - | | - |
Foreign | | Enel Generación Perú S.A. | | Peru | | Common Immediate Parent | | CH$ | | Other services | | Less than 90 days | | 1,328,268 | | - | | - | | - |
Foreign | | Enel Generación Perú S.A. | | Peru | | Common Immediate Parent | | Soles | | Other services | | Less than 90 days | | 15,192 | | - | | - | | - |
94.271.000-3 | | Enel Américas S.A. | | Chile | | Common Immediate Parent | | CH$ | | Mercantile current account | | Less than 90 days | | 519,570 | | - | | - | | - |
94.271.000-3 | | Enel Américas S.A. | | Chile | | Common Immediate Parent | | CH$ | | Other services | | Less than 90 days | | 2,356,523 | | 354,473 | | - | | - |
76.532.379-7 | | Chilectra Américas (*) | | Chile | | Common Immediate Parent | | CH$ | | Other services | | Less than 90 days | | - | | 636,116 | | - | | - |
76.536.351-9 | | Endesa Américas (*) | | Chile | | Common Immediate Parent | | CH$ | | Other services | | Less than 90 days | | - | | 5,861 | | - | | - |
Foreign | | Enel Generación Piura S.A. | | Peru | | Common Immediate Parent | | CH$ | | Other services | | Less than 90 days | | 346,061 | | - | | - | | - |
Foreign | | Generalima S.A.C. | | Peru | | Common Immediate Parent | | CH$ | | Other services | | Less than 90 days | | 341,948 | | - | | - | | - |
Foreign | | Compañía Energética Veracruz S.A.C. | | Peru | | Common Immediate Parent | | CH$ | | Other services | | Less than 90 days | | 639,233 | | - | | - | | - |
Foreign | | Enel Distribución Perú S.A. | | Peru | | Common Immediate Parent | | CH$ | | Other services | | Less than 90 days | | 1,251,369 | | 131,791 | | - | | - |
Foreign | | Empresa Distribuidora del Sur S.A. | | Argentina | | Common Immediate Parent | | CH$ | | Other services | | Less than 90 days | | 398,957 | | - | | - | | - |
| | | | | | | | | | | | Total | | 52,858,384 | | 25,144,559 | | - | | - |
(*)See section d) below.
F-67
| (*)
| Entities merged with and into Enel Américas S.A.
|
| b)
| Accounts payable to related parties
|
| | | | | | | | | | | | | | Current | | Non-current |
Taxpayer ID Number (RUT) | | Company | | Country | | Relationship | | Currency | | Description of transaction | | Terms of transaction | | 12-31-2016 | | 12-31-2015 | | 12-31-2016 | | 12-31-2015 |
| | | | | | | ThCh$ | | ThCh$ | | ThCh$ | | ThCh$ |
Foreign | | Endesa, S.A. | | Spain | | Common Immediate Parent | | CH$ | | Other services | | Less than 90 days | | 273,569 | | 409,738 | | - | | - |
Foreign | | Enel Brasil | | Brazil | | Common Immediate Parent | | CH$ | | Other services | | Less than 90 days | | 85,864 | | 74,911 | | - | | - |
Foreign | | Enel Trading Argentina S.R.L. | | Argentina | | Common Immediate Parent | | US$ | | Other services | | Less than 90 days | | 63,992 | | - | | - | | - |
Foreign | | Enel Trading Argentina S.R.L. | | Argentina | | Common Immediate Parent | | CH$ | | Other services | | Less than 90 days | | 13,574 | | - | | - | | - |
Foreign | | Emgesa S.A. E.S.P. | | Colombia | | Common Immediate Parent | | CP | | Other services | | Less than 90 days | | 5,461 | | 1,619 | | - | | - |
94.271.000-2 | | Enel Américas | | Chile | | Common Immediate Parent | | CH$ | | Loan | | Less than 90 days | | - | | 177,642,086 | | - | | - |
94.271.000-2 | | Enel Américas | | Chile | | Common Immediate Parent | | CH$ | | Other services | | Less than 90 days | | 974,374 | | - | | - | | - |
Foreign | | Enel Distribución Perú S.A. | | Peru | | Common Immediate Parent | | Soles | | Other services | | Less than 90 days | | 2,239 | | 2,084 | | - | | - |
96.524.140-K | | Empresa Electrica Panguipulli S.A. | | Chile | | Common Immediate Parent | | CH$ | | Energy purchase | | Less than 90 days | | 1,695,658 | | 776,882 | | - | | - |
96.524.140-K | | Empresa Electrica Panguipulli S.A. | | Chile | | Common Immediate Parent | | CH$ | | Tolls | | Less than 90 days | | 92,005 | | 70,821 | | - | | - |
96.806.130-5 | | Electrogas S.A. | | Chile | | Associate | | CH$ | | Tolls | | Less than 90 days | | 331,447 | | 718,163 | | - | | - |
76.418.940-k | | GNL Chile S.A. | | Chile | | Associate | | US$ | | Gas Purchase | | Less than 90 days | | 4,872,264 | | 6,357,467 | | - | | - |
Foreign | | Endesa Generación | | Spain | | Common Immediate Parent | | CH$ | | Coal Purchase | | Less than 90 days | | 486,180 | | 2,899,021 | | - | | - |
Foreign | | Endesa Generación | | Spain | | Common Immediate Parent | | US$ | | Other services | | Less than 90 days | | - | | 309,558 | | - | | - |
Foreign | | Endesa Generación | | Spain | | Common Immediate Parent | | CH$ | | Other services | | Less than 90 days | | 379,731 | | 482,211 | | - | | - |
Foreign | | Enel Iberoamérica S.R.L | | Spain | | Parent | | Euros | | Other services | | Less than 90 days | | 158,909 | | 796,386 | | - | | - |
Foreign | | Enel Iberoamérica S.R.L | | Spain | | Parent | | CH$ | | Dividends | | Less than 90 days | | 57,755,885 | | 31,768,503 | | - | | - |
Foreign | | Enel Iberoamérica S.R.L | | Spain | | Parent | | CH$ | | Other services | | Less than 90 days | | 867,838 | | 62,717 | | - | | - |
Foreign | | Enel Distribuzione | | Italy | | Common Immediate Parent | | CH$ | | Other services | | Less than 90 days | | 705,730 | | 331,906 | | - | | - |
Foreign | | Enel Produzione | | Italia | | Common Immediate Parent | | Ar$ | | Mercantile current account | | Less than 90 days | | - | | 216,599 | | - | | 97,186 |
Foreign | | Enel Produzione | | Italy | | Common Immediate Parent | | Euros | | Other services | | Less than 90 days | | 118,261 | | 104,623 | | - | | - |
Foreign | | Enel Produzione | | Italy | | Common Immediate Parent | | CH$ | | Other services | | Less than 90 days | | 483,665 | | - | | - | | - |
Foreign | | Enel Ingegneria e Ricerca | | Italy | | Common Immediate Parent | | CH$ | | Other services | | Less than 90 days | | 6,343,845 | | 4,316,487 | | 251,527 | | - |
Foreign | | Enel Energía | | Italy | | Common Immediate Parent | | CH$ | | Other services | | Less than 90 days | | 163,911 | | - | | - | | - |
76.321.458-3 | | Sociedad Almeyda Solar Spa | | Chile | | Common Immediate Parent | | CH$ | | Energy purchase | | Less than 90 days | | 379,716 | | 442,876 | | - | | - |
76.321.458-3 | | Sociedad Almeyda Solar Spa | | Chile | | Common Immediate Parent | | CH$ | | Tolls | | Less than 90 days | | 45,153 | | | | - | | - |
77.017.930-0 | | Transmisora Eléctrica de Quillota Ltda. | | Chile | | Joint Venture | | CH$ | | Tolls | | Less than 90 days | | 332,709 | | 258,625 | | - | | - |
76.126.507-5 | | Parque Eólico Talinay Oriente SA | | Chile | | Common Immediate Parent | | CH$ | | Energy purchase | | Less than 90 days | | 48,434 | | 50,933 | | - | | - |
76.126.507-5 | | Parque Eólico Talinay Oriente SA | | Chile | | Common Immediate Parent | | CH$ | | Tolls | | Less than 90 days | | 301 | | - | | - | | - |
Foreign | | Enel Trade S.p.A. | | Italy | | Common Immediate Parent | | CH$ | | Other services | | Less than 90 days | | 589,896 | | 237,624 | | - | | - |
Foreign | | Enel Trade S.p.A. | | Italy | | Common Immediate Parent | | CH$ | | Commodity derivatives | | Less than 90 days | | 1,103,206 | | - | | - | | - |
76.179.024-2 | | Parque Eólico Tal S.A. | | Chile | | Common Immediate Parent | | CH$ | | Energy purchase | | Less than 90 days | | 2,171,864 | | 2,197,002 | | - | | - |
76.179.024-2 | | Parque Eolico Tal Tal S.A. | | Chile | | Common Immediate Parent | | CH$ | | Tolls | | Less than 90 days | | 333 | | - | | - | | - |
76.412.562-2 | | Enel Green Power del Sur SpA | | Chile | | Common Immediate Parent | | CH$ | | Energy purchase | | Less than 90 days | | 7,406,880 | | - | | - | | - |
76.412.562-2 | | Enel Green Power del Sur SpA | | Chile | | Common Immediate Parent | | CH$ | | Other services | | Less than 90 days | | 87,448 | | - | | - | | - |
76.412.562-2 | | Enel Green Power del Sur SpA | | Chile | | Common Immediate Parent | | CH$ | | Tolls | | Less than 90 days | | 42,901 | | - | | - | | - |
Foreign | | Enel S.p.A. | | Italy | | Parent | | CH$ | | Other services | | Less than 90 days | | 120,296 | | 11,849 | | - | | - |
Foreign | | Enel S.p.A. | | Italy | | Parent | | Euros | | Other services | | Less than 90 days | | 564,764 | | 1,153,428 | | - | | - |
76.052.206-6 | | Parque Eólico Valle de los Vientos S.A. | | Chile | | Common Immediate Parent | | CH$ | | Other services | | Less than 90 days | | 477 | | 1,163,000 | | - | | - |
Foreign | | Endesa Cemsa S.A. | | Argentina | | Associate | | CH$ | | Other services | | Less than 90 days | | - | | 84,748 | | - | | - |
Foreign | | Endesa Energía S.A. | | Spain | | Common Immediate Parent | | CH$ | | Other services | | Less than 90 days | | - | | 36,158 | | - | | - |
Foreign | | Enel Green Power España SL | | Spain | | Common Immediate Parent | | CH$ | | Other services | | Less than 90 days | | - | | - | | - | | - |
99.573.910-0 | | Chilectra Inversud S.A. | | Chile | | Common Immediate Parent | | CH$ | | Current Account | | Less than 90 days | | - | | 110,537 | | - | | - |
Foreign | | Enel Italia Servizi SRL | | Italy | | Common Immediate Parent | | CH$ | | Other services | | Less than 90 days | | 1,660,149 | | 66,354 | | - | | - |
| | | | | | | | | | | | Total | | 90,428,929 | | 233,154,916 | | 251,527 | | 97,186 |
| c)
| Significant transactions and effects on income/expenses:
|
Transactions with related companies that are not consolidated and their effects on profit or loss are as follows:
| | | | | | | | | | For the years ended December 31, | |
| | | | | | | | | | 2018 | | 2017 | | 2016 | |
Taxpayer ID Number | | Company | | Country | | Relationship | | Description of transaction | | ThCh$ | | ThCh$ | | ThCh$ | |
Foreign | | Endesa Energía S.A. | | Spain | | Common Immediate Parent | | Gas Sales | | — | | 10,394,146 | | 18,655,911 | |
Foreign | | Endesa Energía S.A. | | Spain | | Common Immediate Parent | | Fuel consumption | | — | | — | | (134,393 | ) |
Foreign | | Endesa Generación | | Spain | | Common Immediate Parent | | Other fixed operating expenses | | — | | — | | — | |
Foreign | | Endesa Generación | | Spain | | Common Immediate Parent | | Fuel consumption | | — | | — | | (54,818,466 | ) |
Foreign | | Endesa Generación | | Spain | | Common Immediate Parent | | Other fixed operating expenses | | (158,128 | ) | — | | — | |
Foreign | | Enel Perú S.A.C. | | Perú | | Common Immediate Parent | | Other services rendered | | 8,832 | | 7,405 | | 68,066 | |
Foreign | | Enel Perú S.A.C. | | Perú | | Common Immediate Parent | | Financial expense | | — | | (181 | ) | — | |
94.271.000-3 | | Enel Américas S.A. | | Chile | | Common Immediate Parent | | Financial expense | | — | | (289,800 | ) | (1,933,040 | ) |
94.271.000-3 | | Enel Américas S.A. | | Chile | | Common Immediate Parent | | Financial income | | — | | 144,404 | | 540,259 | |
94.271.000-3 | | Enel Américas S.A. | | Chile | | Common Immediate Parent | | Other services rendered | | 5,071,453 | | 4,737,522 | | 4,822,344 | |
94.271.000-3 | | Enel Américas S.A. | | Chile | | Common Immediate Parent | | Other variable expenses | | — | | — | | (352 | ) |
94.271.000-3 | | Enel Américas S.A. | | Chile | | Common Immediate Parent | | Other operating income | | — | | — | | 182,091 | |
94.271.000-3 | | Enel Américas S.A. | | Chile | | Common Immediate Parent | | Other fixed operating expenses | | — | | — | | (1,546,751 | ) |
Foreign | | Codensa | | Colombia | | Common Immediate Parent | | Other operating income | | — | | — | | (709 | ) |
Foreign | | Codensa | | Colombia | | Common Immediate Parent | | Other services rendered | | 441,519 | | 399,432 | | 141,664 | |
Foreign | | Enel Brasil S.A. | | Brasil | | Common Immediate Parent | | Other fixed operating expenses | | — | | — | | (35,949 | ) |
Foreign | | Enel Brasil S.A. | | Brasil | | Common Immediate Parent | | Other services rendered | | — | | — | | 2,044,935 | |
Foreign | | Enel Brasil S.A. | | Brasil | | Common Immediate Parent | | Financial income | | (55 | ) | — | | — | |
Foreign | | Enel Brasil S.A. | | Brasil | | Common Immediate Parent | | Other fixed operating expenses | | (207,967 | ) | — | | — | |
76.418.940-K | | GNL Chile S.A. | | Chile | | Associate | | Gas consumption | | (81,890,342 | ) | (146,507,390 | ) | (102,686,858 | ) |
76.418.940-K | | GNL Chile S.A. | | Chile | | Associate | | Gas transportation | | (49,631,647 | ) | (47,656,002 | ) | (40,494,275 | ) |
76.418.940-K | | GNL Chile S.A. | | Chile | | Associate | | Other services rendered | | (71,770 | ) | 85,274 | | 82,762 | |
76.788.080-4 | | GNLQuintero S.A | | Chile | | Associate | | Other operating income | | — | | — | | (1,539 | ) |
76.788.080-4 | | GNLQuintero S.A | | Chile | | Associate | | Energy sales | | — | | — | | 1,912,448 | |
76.788.080-4 | | GNLQuintero S.A | | Chile | | Associate | | Electricity tolls | | — | | — | | 79,203 | |
76.788.080-4 | | GNLQuintero S.A | | Chile | | Associate | | Other services rendered | | — | | — | | 960,390 | |
96.524.140-K | | Empresa Eléctrica Panguipulli S.A. | | Chile | | Common Immediate Parent | | Energy purchases | | (1,954,523 | ) | (11,758,824 | ) | (8,803,274 | ) |
96.524.140-K | | Empresa Eléctrica Panguipulli S.A. | | Chile | | Common Immediate Parent | | Electricity tolls | | (8,973 | ) | (254,065 | ) | (235,950 | ) |
96.524.140-K | | Empresa Eléctrica Panguipulli S.A. | | Chile | | Common Immediate Parent | | Other services rendered | | 142,757 | | 415,162 | | 281,190 | |
96.524.140-K | | Empresa Eléctrica Panguipulli S.A. | | Chile | | Common Immediate Parent | | Energy sales | | 18,201 | | 1,242,092 | | 116,726 | |
Foreign | | Empresa Distribuidora Sur S.A. | | Argentina | | Common Immediate Parent | | Other services rendered | | 424,664 | | 409,823 | | 398,957 | |
Foreign | | Enel Distribución Perú S.A. | | Perú | | Common Immediate Parent | | Other services rendered | | — | | 176,867 | | 70,415 | |
Foreign | | Enel Iberoamérica S.R.L | | Spain | | Parent | | Other services rendered | | — | | (6,085 | ) | — | |
96.806.130-5 | | Electrogas S.A. | | Chile | | Associate | | Gas tolls | | — | | (251,099 | ) | (2,750,858 | ) |
96.806.130-5 | | Electrogas S.A. | | Chile | | Associate | | Fuel consumption | | — | | (25,025 | ) | (717,599 | ) |
Foreign | | Emgesa S.A. E.S.P. | | Colombia | | Common Immediate Parent | | Otros ingresos de explotación | | 622,686 | | 1,866 | | (2,645 | ) |
Foreign | | Enel Argentina S.A | | Argentina | | Common Immediate Parent | | Other fixed operating expenses | | — | | — | | (970 | ) |
Foreign | | Enel Generación Perú S.A. | | Perú | | Common Immediate Parent | | Other services rendered | | — | | — | | (96,109 | ) |
Foreign | | Enel Generación Perú S.A. | | Perú | | Common Immediate Parent | | Other services income | | 1,139,809 | | 745,818 | | — | |
Foreign | | Enel Generación Perú S.A. | | Perú | | Common Immediate Parent | | Financial expense | | — | | (349 | ) | — | |
Foreign | | Enel Generación Perú S.A. | | Perú | | Common Immediate Parent | | Other operating income | | — | | — | | (9,253 | ) |
Foreign | | Enel Generación Piura S.A. | | Perú | | Common Immediate Parent | | Other services rendered | | — | | 98,421 | | 168,961 | |
Foreign | | Enel Generación Piura S.A. | | Perú | | Common Immediate Parent | | Other fixed operating expenses | | (57,180 | ) | — | | | |
Foreign | | Enel Generación Piura S.A. | | Perú | | Common Immediate Parent | | Financial expense | | (57 | ) | (135 | ) | | |
77.017.930-0 | | Transmisora Eléctrica de Quillota Ltda. | | Chile | | Joint venture | | Electricity tolls | | (142,469 | ) | (1,383,710 | ) | (1,291,995 | ) |
99.573.910-0 | | Chilectra Inversud S.A | | Chile | | Common Immediate Parent | | Other operating income | | — | | — | | 637 | |
76.532.379-7 | | Chilectra Americas S.A | | Chile | | Common Immediate Parent | | Other services rendered | | — | | — | | 289,994 | |
76.536.351-9 | | Endesa Americas S.A | | Chile | | Common Immediate Parent | | Other services rendered | | — | | — | | 1,260,448 | |
77.017.930-0 | | Transmisora Eléctrica de Quillota Ltda. | | Chile | | Joint venture | | Energy purchases | | (100,418 | ) | — | | | |
Foreign | | PH Chucas Costa Rica | | Costa Rica | | Common Immediate Parent | | Other services rendered | | — | | 6,629 | | 425,604 | |
Foreign | | PH Chucas Costa Rica | | Costa Rica | | Common Immediate Parent | | Other fixed operating expenses | | (79,327 | ) | — | | — | |
Foreign | | PH Chucas Costa Rica | | Costa Rica | | Common Immediate Parent | | Financial expense | | — | | (162,177 | ) | — | |
Foreign | | Compañía Energetica Veracruz S.A.C. | | Perú | | Common Immediate Parent | | Other services rendered | | — | | 283,346 | | 42,890 | |
Foreign | | Enel Trade S.p.A | | Italia | | Common Immediate Parent | | Financial expense | | (13 | ) | — | | | |
Foreign | | Enel Trade S.p.A | | Italia | | Common Immediate Parent | | Otros Aprovisionamientos | | (1,213,116 | ) | — | | | |
Foreign | | Enel Trade S.p.A | | Italia | | Common Immediate Parent | | Derivados de commodities | | 10,565,377 | | 19,941,617 | | | |
76.321.458-3 | | Sociedad Almeyda Solar Spa | | Chile | | Common Immediate Parent | | Energy purchases | | (1,052,840 | ) | (4,306,145 | ) | (3,674,821 | ) |
76.321.458-3 | | Sociedad Almeyda Solar Spa | | Chile | | Common Immediate Parent | | Electricity tolls | | 63,155 | | (212,402 | ) | (188,859 | ) |
76.321.458-3 | | Sociedad Almeyda Solar Spa | | Chile | | Common Immediate Parent | | Other services rendered | | 14,129 | | 40,643 | | 152,419 | |
76.321.458-3 | | Sociedad Almeyda Solar Spa | | Chile | | Common Immediate Parent | | Energy sales | | (4,325 | ) | 344,090 | | 64,174 | |
76.052.206-6 | | Parque Eolico Valle de los Vientos S.A. | | Chile | | Common Immediate Parent | | Energy purchases | | (3,349,525 | ) | (16,630,422 | ) | (11,992,799 | ) |
76.052.206-6 | | Parque Eolico Valle de los Vientos S.A. | | Chile | | Common Immediate Parent | | Other services rendered | | 35,317 | | 101,595 | | — | |
76.052.206-6 | | Parque Eolico Valle de los Vientos S.A. | | Chile | | Common Immediate Parent | | Energy sales | | (63,086 | ) | 144,589 | | 558,966 | |
Foreign | | Enel S.p.A. | | Italia | | Parent | | Other fixed operating expenses | | (1,082,418 | ) | (658,611 | ) | (34,700 | ) |
Foreign | | Enel S.p.A. | | Italia | | Parent | | financial expense | | (1,057,535 | ) | — | | — | |
Foreign | | Enel Italia Servizi | | Chile | | Common Immediate Parent | | Other fixed operating expenses | | — | | (2,230,668 | ) | (1,547,695 | ) |
76.412.562-2 | | Enel Green Power del Sur SPA | | Chile | | Common Immediate Parent | | Energy purchases | | (30,205,373 | ) | (104,865,684 | ) | (34,952,571 | ) |
76.412.562-2 | | Enel Green Power del Sur SPA | | Chile | | Common Immediate Parent | | Energy sales | | 25,918 | | 528,740 | | 48,322 | |
76.412.562-2 | | Enel Green Power del Sur SPA | | Chile | | Common Immediate Parent | | Electricity tolls | | 3,531 | | 3,730 | | (2,323 | ) |
76.412.562-2 | | Enel Green Power del Sur SPA | | Chile | | Common Immediate Parent | | Other services rendered | | 220,518 | | 634,361 | | 15 | |
76.179.024-2 | | Parque Eolico Tal Tal S.A. | | Chile | | Common Immediate Parent | | Energy purchases | | (4,448,833 | ) | (25,959,608 | ) | (22,415,584 | ) |
76.179.024-2 | | Parque Eolico Tal Tal S.A. | | Chile | | Common Immediate Parent | | Electricity tolls | | (51 | ) | 250 | | — | |
76.179.024-2 | | Parque Eolico Tal Tal S.A. | | Chile | | Common Immediate Parent | | Other services rendered | | 38,846 | | 111,748 | | — | |
76.179.024-2 | | Parque Eolico Tal Tal S.A. | | Chile | | Common Immediate Parent | | Energy sales | | 18,960 | | 109,643 | | 23,932 | |
96.920.110-0 | | Enel Green Power Chile Ltda | | Chile | | Common Immediate Parent | | Other services rendered | | 102,298 | | 162,848 | | 34,855 | |
Foreign | | Energía Nueva Energía Limpia Mexico S.R.L | | Mexico | | Common Immediate Parent | | Other services rendered | | 67,919 | | — | | — | |
Foreign | | Enel Produzione | | Italia | | Common Immediate Parent | | Other fixed operating expenses | | — | | 94,045 | | — | |
Foreign | | Enel Distribuzione | | Italia | | Common Immediate Parent | | Other fixed operating expenses | | — | | — | | (654,622 | ) |
Foreign | | Enel Ingeneria e Innovazione | | Italia | | Common Immediate Parent | | Other services rendered | | — | | — | | 30,806 | |
Foreign | | Enel Ingeneria e Innovazione | | Italia | | Common Immediate Parent | | Other fixed operating expenses | | — | | — | | (328,310 | ) |
Foreign | | Enel Global Trading S.p.A | | Italia | | Common Immediate Parent | | Other operating income | | — | | — | | 9,191,693 | |
Foreign | | Enel Global Trading S.p.A | | Italia | | Common Immediate Parent | | Other variable expenses | | — | | — | | (2,120,323 | ) |
Foreign | | E-Distribuzione Spa | | Italia | | Common Immediate Parent | | Other fixed operating expenses | | (76,905 | ) | — | | — | |
Foreign | | Enel Trading Argentina S.R.L | | Argentina | | Common Immediate Parent | | Other services rendered | | — | | 11,488 | | — | |
Foreign | | Enel Green Power Italia | | Italia | | Common Immediate Parent | | Other services rendered | | — | | 262,694 | | — | |
Foreign | | Enel Green Power Perú | | Perú | | Common Immediate Parent | | Other services rendered | | 258,120 | | 177,478 | | — | |
Foreign | | Enel Green Power Brasil | | Brasil | | Common Immediate Parent | | Other services rendered | | — | | 37,936 | | — | |
Foreign | | Enel Green Power Brasil Participacoes Ltda. | | Brasil | | Common Immediate Parent | | Other services rendered | | 23,828 | | 9,188 | | — | |
Foreign | | Enel Green Power Mexico | | Mexico | | Common Immediate Parent | | Other services rendered | | — | | 152,495 | | — | |
Foreign | | Enel Green Power Mexico | | Mexico | | Common Immediate Parent | | Other fixed operating expenses | | (53,976 | ) | — | | — | |
96.971.330-6 | | Geotérmica del Norte | | Chile | | Common Immediate Parent | | Energy purchases | | (1,929 | ) | (456 | ) | — | |
96.971.330-6 | | Geotérmica del Norte | | Chile | | Common Immediate Parent | | Energy sales | | 33,607 | | 10,552 | | — | |
96.971.330-6 | | Geotérmica del Norte | | Chile | | Common Immediate Parent | | Other services rendered | | — | | 69,605 | | — | |
Foreign | | Chinango S.A.C. | | Perú | | Common Immediate Parent | | Other services rendered | | 39,759 | | 18,516 | | — | |
Foreign | | Enel Green Power Colombia SAS | | Colombia | | Common Immediate Parent | | Other services rendered | | 302,992 | | 46,557 | | — | |
Foreign | | Enel Finance International NV | | Holland | | Common Immediate Parent | | Financial income | | 570,591 | | — | | — | |
Foreign | | Enel Finance International NV | | Holland | | Common Immediate Parent | | Other financial expense | | (23,253,535 | ) | — | | — | |
Foreign | | Enel Green Power Argentina | | Argentina | | Common Immediate Parent | | Other services rendered | | 871 | | — | | — | |
Foreign | | Energetica Monzon S.A.C. | | Perú | | Common Immediate Parent | | Other services rendered | | 114,660 | | — | | — | |
Foreign | | Enel Green Power España SL | | Spain | | Common Immediate Parent | | Other fixed operating expenses | | (61,372 | ) | — | | — | |
Foreign | | Enel Green Power RSA (PTY) Ltd | | South Africa | | Common Immediate Parent | | Other services rendered | | 875 | | — | | — | |
Foreign | | Enel Green Power NA, Inc. | | United States | | Common Immediate Parent | | Other services rendered | | 40,519 | | — | | — | |
Foreign | | Enel Map | | Italia | | Common Immediate Parent | | Other fixed operating expenses | | (343,645 | ) | — | | — | |
76.126.507-5 | | Parque Eolico Talinay Oriente SA | | Chile | | Common Immediate Parent | | Energy sales | | 19,952 | | 128,626 | | 89,710 | |
76.126.507-5 | | Parque Eolico Talinay Oriente SA | | Chile | | Common Immediate Parent | | Electricity tolls | | 165 | | 144 | | — | |
76.126.507-5 | | Parque Eolico Talinay Oriente SA | | Chile | | Common Immediate Parent | | Other services rendered | | 35,317 | | 101,595 | | — | |
76.126.507-5 | | Parque Eolico Talinay Oriente SA | | Chile | | Common Immediate Parent | | Energy purchases | | (214,455 | ) | (539,646 | ) | (370,964 | ) |
Foreign | | Enel Generacion Costanera S.A. | | Argentina | | Common Immediate Parent | | Other services rendered | | 28,106 | | — | | — | |
Foreign | | Enel Italia IT | | Italia | | Common Immediate Parent | | Other fixed operating expenses | | (4,111,525 | ) | — | | — | |
Foreign | | Enel Global Thermal Generation S.r.l. | | Italia | | Common Immediate Parent | | Other fixed operating expenses | | (1,845,425 | ) | — | | — | |
99.577.350-3 | | Empresa Nacional de Geotermia S.A. | | Chile | | Common Immediate Parent | | Energy sales | | 1,857 | | — | | — | |
Foreign | | Enel Green Power Spa IT | | Italia | | Common Immediate Parent | | Other services rendered | | 698,380 | | — | | — | |
Foreign | | Enel Green Power Spa IT | | Italia | | Common Immediate Parent | | Other fixed operating expenses | | (4,257,363 | ) | — | | — | |
Foreign | | Enel Green Power Spa IT | | Italia | | Common Immediate Parent | | Financial expense | | (2 | ) | | | — | |
Foreign | | Enel Iberia SRL | | Italia | | Common Immediate Parent | | Other fixed operating expenses | | (29,015 | ) | — | | — | |
Foreign | | Enel Generacion El Chocon S.A. | | Argentina | | Common Immediate Parent | | Other services rendered | | 10,176 | | — | | — | |
76.201.136-0 | | Energía y Servicios South America Spa | | Chile | | Common Immediate Parent | | Other services rendered | | 82,081 | | | | — | |
| | | | | | | | Total | | (189,741,373 | ) | (321,305,504 | ) | (251,103,769 | ) |
F-68
Taxpayer ID Number | | Company | | Country | | Relationship | | Description of transaction | | For the years ended December 31, |
| | | | | 2016 | | 2015 | | 2014 |
| | | | | ThCh$ | | ThCh$ | | ThCh$ |
Foreign | | Endesa Energía S.A. | | Spain | | Common Immediate Parent | | Other operating income | | - | | 232,867 | | - |
Foreign | | Endesa Energía S.A. | | Spain | | Common Immediate Parent | | Gas Sales | | 18,655,911 | | 14,604,841 | | - |
Foreign | | Endesa Energía S.A. | | Spain | | Common Immediate Parent | | Fuel consumption | | (134,393) | | (10,451,242) | | - |
Foreign | | Enel Latinoamérica S.A | | Spain | | Common Immediate Parent | | Interests financial debt | | - | | (18,684) | | - |
Foreign | | Endesa Generación | | Spain | | Common Immediate Parent | | Fuel consumption | | (66,297,066) | | (15,030,911) | | (30,318,202) |
Foreign | | Endesa Generación | | Spain | | Common Immediate Parent | | Other fixed operating expenses | | - | | (23,329) | | - |
Foreign | | Endesa Generación | | Spain | | Common Immediate Parent | | Commodity derivatives | | - | | (2,144,063) | | (2,521,138) |
Foreign | | Generalima S.A.C. | | Peru | | Common Immediate Parent | | Other services rendered | | 108,817 | | - | | - |
94.271.000-3 | | Enel Américas | | Chile | | Common Immediate Parent | | Other financial expense | | (2,477,009) | | (4,709,312) | | (15,437,257) |
94.271.000-3 | | Enel Américas | | Chile | | Common Immediate Parent | | Financial income | | 761,921 | | - | | - |
94.271.000-3 | | Enel Américas | | Chile | | Common Immediate Parent | | Other services rendered | | 4,817,607 | | - | | - |
94.271.000-3 | | Enel Américas | | Chile | | Common Immediate Parent | | Other variable expenses | | (352) | | - | | - |
94.271.000-3 | | Enel Américas | | Chile | | Common Immediate Parent | | Other operating income | | 498,284 | | - | | - |
94.271.000-3 | | Enel Américas | | Chile | | Common Immediate Parent | | Other fixed operating expenses | | (2,736,796) | | - | | - |
Foreign | | Codensa S.A. | | Colombia | | Common Immediate Parent | | Other services rendered | | 141,664 | | - | | - |
Foreign | | Endesa Brasil | | Brazil | | Common Immediate Parent | | Other fixed operating expenses | | (35,949) | | - | | - |
Foreign | | Endesa Brasil | | Brazil | | Common Immediate Parent | | Other services rendered | | 2,044,935 | | | | |
76.418.940-k | | GNL Chile S.A. | | Chile | | Associate | | Gas consumption | | (116,391,268) | | (123,964,573) | | (114,115,041) |
76.418.940-k | | GNL Chile S.A. | | Chile | | Associate | | Gas transportation | | (49,418,058) | | (52,195,582) | | (39,638,398) |
76.418.940-k | | GNL Chile S.A. | | Chile | | Associate | | Other services rendered | | 82,762 | | 54,377 | | 56,042 |
76.418.940-k | | GNL Chile S.A. | | Chile | | Associate | | Other operating income | | (436) | | 81,749 | | 58,169 |
76.788.080-4 | | GNL Quintero S.A. | | Chile | | Associate | | Energy sales | | 2,356,971 | | 3,260,734 | | 2,671,120 |
76.788.080-4 | | GNL Quintero S.A. | | Chile | | Associate | | Electricity tolls | | (71,599) | | 151,088 | | 47,263 |
76.788.080-4 | | GNL Quintero S.A. | | Chile | | Associate | | Other services rendered | | 923,228 | | 650,390 | | 956,854 |
96.880.800-1 | | Empresa Eléctrica Puyehue S.A. | | Chile | | Common Immediate Parent | | Energy purchases | | - | | - | | (1,407,349) |
96.880.800-1 | | Empresa Eléctrica Puyehue S.A. | | Chile | | Common Immediate Parent | | Electricity tolls | | - | | - | | (3,805) |
96.880.800-1 | | Empresa Eléctrica Puyehue S.A. | | Chile | | Common Immediate Parent | | Energy sales | | - | | - | | (12,399) |
96.524.140-K | | Empresa Eléctrica Panguipulli S.A. | | Chile | | Common Immediate Parent | | Energy purchases | | (10,287,370) | | (10,597,853) | | (10,113,496) |
96.524.140-K | | Empresa Eléctrica Panguipulli S.A. | | Chile | | Common Immediate Parent | | Electricity tolls | | (278,706) | | (294,910) | | (260,495) |
96.524.140-K | | Empresa Eléctrica Panguipulli S.A. | | Chile | | Common Immediate Parent | | Other services rendered | | 341,014 | | 392,168 | | 197,812 |
96.524.140-K | | Empresa Eléctrica Panguipulli S.A. | | Chile | | Common Immediate Parent | | Energy sales | | 248,135 | | 286,977 | | 942,615 |
Foreign | | Empresa Distribuidora del Sur S.A. | | Argentina | | Common Immediate Parent | | Other services rendered | | 398,957 | | - | | - |
Foreign | | Enel Distribución Perú S.A. | | Peru | | Common Immediate Parent | | Other services rendered | | 70,415 | | - | | - |
Foreign | | Enel Iberoamérica S.R.L | | Spain | | Parent | | Other fixed operating expenses | | - | | (402,833) | | (2,860,930) |
96.806.130-5 | | Electrogas S.A. | | Chile | | Associate | | Gas tolls | | (3,636,239) | | (3,296,951) | | (3,409,581) |
96.806.130-5 | | Electrogas S.A. | | Chile | | Associate | | Fuel consumption | | (542,767) | | (952,044) | | (434,289) |
Foreign | | Enel Argentina S.A. | | Argentina | | Common Immediate Parent | | Other fixed operating expenses | | (970) | | - | | - |
Foreign | | Enel Generación Perú S.A. | | Peru | | Common Immediate Parent | | Other services rendered | | (115,816) | | - | | - |
Foreign | | Enel Generación Perú S.A. | | Peru | | Common Immediate Parent | | Other operating income | | (9,253) | | - | | - |
Foreign | | Enel Generación Perú S.A. | | Peru | | Common Immediate Parent | | Other services rendered | | 168,961 | | - | | - |
77.017.930-0 | | Transmisora Eléctrica de Quillota Ltda. | | Chile | | Joint venture | | Electricity tolls | | (1,537,963) | | (1,473,974) | | (1,378,743) |
Foreign | | PH Chucas Costa Rica | | Costa Rica | | Common Immediate Parent | | Other services rendered | | 425,604 | | 1,188,564 | | - |
Foreign | | Compañía Energética Veracruz S.A.C. | | Peru | | Common Immediate Parent | | Other services rendered | | 52,524 | | - | | - |
76.321.458-3 | | Sociedad Almeyda Solar Spa | | Chile | | Common Immediate Parent | | Energy purchases | | (4,491,980) | | (3,264,764) | | - |
76.321.458-3 | | Sociedad Almeyda Solar Spa | | Chile | | Common Immediate Parent | | Electricity tolls | | (229,379) | | (153,929) | | - |
76.321.458-3 | | Sociedad Almeyda Solar Spa | | Chile | | Common Immediate Parent | | Other services rendered | | 188,184 | | 109,891 | | - |
76.321.458-3 | | Sociedad Almeyda Solar Spa | | Chile | | Common Immediate Parent | | Energy sales | | 98,994 | | 87,062 | | - |
76.052.206-6 | | Parque Eólico Valle de los Vientos S.A. | | Chile | | Common Immediate Parent | | Energy purchases | | (14,802,199) | | (14,929,463) | | - |
76.052.206-6 | | Parque Eólico Valle de los Vientos S.A. | | Chile | | Common Immediate Parent | | Energy sales | | 697,969 | | 670,035 | | - |
Foreign | | Enel SpA | | Italy | | Parent | | Other fixed operating expenses | | (34,700) | | - | | - |
Foreign | | Enel Italia | | Chile | | Common Immediate Parent | | Other fixed operating expenses | | (1,547,695) | | - | | - |
Foreign | | Enel Ingegneria e Innovazione | | Italy | | Common Immediate Parent | | Other services rendered | | 30,806 | | 35,773 | | - |
Foreign | | Enel Ingegneria e Innovazione | | Italy | | Common Immediate Parent | | Other fixed operating expenses | | (771,231) | | (1,354,650) | | - |
76.652.400-1 | | Centrales Hidroeléctricas De Aysén S.A. | | Chile | | Joint Venture | | Other services rendered | | - | | 260,275 | | 23,891 |
Foreign | | Endesa, S.A. | | Spain | | Common Immediate Parent | | Other operating income | | - | | - | | 57,623 |
Foreign | | Enel Trade S.p.A | | Italy | | Common Immediate Parent | | Other fixed operating expenses | | - | | (216,437) | | - |
Foreign | | Enel Trade S.p.A | | Italy | | Common Immediate Parent | | Commodity derivatives | | - | | (833,366) | | - |
Foreign | | Enel Trade S.p.A | | Italy | | Common Immediate Parent | | Other operating income | | - | | - | | 3,222 |
Foreign | | Enel Global Trading S.p.A. | | Italy | | Common Immediate Parent | | Other operating income | | 9,239,926 | | - | | - |
Foreign | | Enel Global Trading S.p.A. | | Italy | | Common Immediate Parent | | Other variable expenses | | (2,227,046) | | - | | - |
76.412.562-2 | | Enel Green Power del Sur S.p.A | | Chile | | Common Immediate Parent | | Energy purchases | | (34,952,571) | | - | | - |
76.412.562-2 | | Enel Green Power del Sur S.p.A | | Chile | | Common Immediate Parent | | Energy sales | | 48,322 | | - | | - |
76.412.562-2 | | Enel Green Power del Sur S.p.A | | Chile | | Common Immediate Parent | | Electricity tolls | | (2,323) | | - | | - |
76.412.562-2 | | Enel Green Power del Sur S.p.A | | Chile | | Common Immediate Parent | | Other services rendered | | 15 | | - | | - |
76.179.024-2 | | Parque Eolico Tal Tal S.A. | | Chile | | Common Immediate Parent | | Energy purchases | | (26,797,609) | | (26,456,188) | | - |
76.179.024-2 | | Parque Eolico Tal Tal S.A. | | Chile | | Common Immediate Parent | | Energy sales | | 49,477 | | 217,448 | | - |
96.920.110-0 | | Enel Green Power Chile Ltda. | | Chile | | Common Immediate Parent | | Other services rendered | | 34,855 | | - | | - |
76536351-9 | | Endesa Américas | | Chile | | Common Immediate Parent | | Other services rendered | | 1,260,448 | | 343,881 | | - |
76352379-7 | | Chilectra Américas | | Chile | | Common Immediate Parent | | Other financial expense | | - | | (375,037) | | - |
76532379-7 | | Chilectra Américas | | Chile | | Common Immediate Parent | | Other services rendered | | 301,749 | | 686,249 | | - |
Foreign | | Enel Distribuzione | | Italy | | Common Immediate Parent | | Other fixed operating expenses | | (654,109) | | - | | - |
99.573.910-0 | | Chilectra Inversud S.A. | | Chile | | Common Immediate Parent | | Other operating income | | 521 | | - | | - |
99.573.910-0 | | Chilectra Inversud S.A. | | Chile | | Common Immediate Parent | | Other financial expense | | - | | - | | (645,276) |
Foreign | | Enel Trading Argentina S.r.L. | | Argentina | | Common Immediate Parent | | Other variable expenses | | 4,262 | | - | | - |
Foreign | | Endesa Cemsa S.A. | | Argentina | | Common Immediate Parent | | Other fixed operating expenses | | - | | (11,862) | | - |
Foreign | | Enel Produzione | | Italy | | Common Immediate Parent | | Other fixed operating expenses | | - | | (206,912) | | - |
Foreign | | Enel Energy Europe | | Italy | | Common Immediate Parent | | Other services rendered | | - | | (69,202) | | - |
76.126.507-5 | | Parque Eólico Talinay Oriente S.A. | | Chile | | Common Immediate Parent | | Energy sales | | 129,418 | | 153,158 | | - |
76.126.507-5 | | Parque Eólico Talinay Oriente S.A. | | Chile | | Common Immediate Parent | | Energy purchases | | (472,529) | | (505,404) | | (5,141,912) |
| | | | | | | | Total | | (296,772,725) | | (250,465,948) | | (222,683,700) |
Table of Contents
Transfers of short-term funds between related companies are treated asstructured through current accounts, changes, with variable interest rates based on market conditions used for the monthly balance. The resulting amounts receivable or payable balances are usually at 30 days term, with automatic rollover for the same periods and amortization in line with cash flows.
9.2d) Significant transactions
i) Enel Chile
· In May 2017, Enel Chile S.A. received short-term loans of ThCh$150,000,000 from Enel Américas S.A., which were fully amortized on May 25, 2017. These loans accrued a TIP rate of interest + 0.05% per month. As of December 31, 2018, there was no outstanding debt between Enel Chile S.A. and Enel Américas S.A.
ii) EGP Chile Group
· On December 31, 2015, Enel Green Power International B.V. (currently Enel Finance International NV) granted Parque Eólico Renaico SpA (currently Enel Green Power del Sur SpA.) a US dollar loan for a committed amount of up to US$650 million equivalent to ThCh$451,600,500, at a variable interest rate of Libor 6M plus a margin of 4.94% per annum, with semi-annual interest payment and maturity on December 31, 2027. The credit agreement allowed Enel Green Power del Sur SpA to make indefinite drafts up to the amount committed until December 31, 2017, defined as the availability period, during which Enel Green Power del Sur SpA paid an annual availability fee equivalent to 35% of the margin on the undrawn amount. The balance of the debt at December 31, 2018 amounts to US$644 million equivalent to ThCh$447,431,880 (US$644 million at December 31, 2017 equivalent to ThCh$395,899,000).
· On December 20, 2012, Enel Green Power International B.V. (currently Enel Finance International NV) formalized with Enel Latin America Ltda. (currently Enel Green Power Chile) a revolving credit line in U.S. dollars for an amount of up to US$250 million, at a Libor 3M variable interest rate plus a margin of 2.50% per annum, with quarterly interest payment and maturity on December 31, 2013. This contract was renewed annually and increased during 2015 to US$ 800 million and during the first half of 2017, the amount committed was reduced to US$50 million. On March 28, 2018, the margin was reduced to 1.35% per annum. On October 10, 2018, the contract, which did not have associated debts, was terminated early.
· On February 25, 2011, Enel Green Power International B.V. (currently Enel Finance International NV) formalized with Enel Latin America Ltda. (currently Enel Green Power Chile) a mercantile mandate contract by means of which it could invest the funds and surpluses generated by the latter. The currency used for the movements was the U.S. dollar. This contract established annual extensions, and has been renewed and periodically amended. The conditions in force during 2018 of the contract established a variable interest rate of Libor 1M plus a margin of 0.80% per annum, the balance placed by Enel Green Power Chile at December 31, 2018 amounted to US$1,453 million equivalent to ThCh$1,008,208 (US$78 million at December 31, 2017 equivalent to ThCh$47,950,500). The contract expired on December 31, 2018 and was not renewed. On February 12, 2019 the amount was repaid in full.
12.2 Board of Directors and Key management personnel
The Company is managed by a Board of Directors which consists of seven members. Each director serves for a three-year term after which they can be reelected.
The Board of Directors as of December 31, 2016,2018, was elected at the Ordinary Shareholders Meeting held on April 28, 2016.25, 2018. At thea Board of Directors Meeting held on April 29, 2016 were designated the same date the current Board Chairman and Vice Chairman.Secretary were appointed.
F-69
| a)
| Receivables from related parties
|
Table of Contents
a) Account receivable and payable and other transactions
·Accounts receivable and payable
There are no outstanding amounts receivable or payable between the Company and the members or the Board of Directors and key management personnel.
No transactions other than the payment of compensation have taken place between the Company and the members of the Board of Directors and key management personnel and other than transactions in the normal course of business-electricity supply.
b) Compensation for directors | b)
| Compensation for directors
|
In accordance with Article 33 of Law No. 18.04618,046 governing shock corporations, the compensation of Directors is established each year at the Ordinary Shareholders Meeting of the Company.
The compensationcompensantion consists of paying a variable annual compensation equal to one one-thousandth of the profit for the year (attributable to shareholders of Enel Chile). Also, each member of the Board will be paidof Director a monthly compensation, onepayment in a part a fixed monthly feeto all and another part dependent on meetings attended.eventual event. The breakdown of this compensation is as follows:
- 180 U.F.
· UF 216 as a fixed monthly fee;fee in all event; and
- 66 U.F.
· UF 79.2 as per diem for each Board meeting attended, all with a maximum of sixteen sessions in total, includes ordinary and extraordinary meetings attended in a year.
The amounts paid for the monthly fee will be treated as payment in advance of the variable annual compensation described above.
As stated in the by-laws, the compensation for the Chairman of the Board will be 50% higher thanthe double that of a Director.
Any advance payments received will be deducted from the annual variable compensation, with no reimbursement if the annual variable compensation is lower than the total amount paid in advances. The variable compensation will be paid, when appropriate, after the Ordinary Shareholders’ Meeting approves the Annual Report, Balance Sheet and Financial Statements, and the Independent Auditors’ Reports and Account Inspectors’ Reports for the year ended December 31, 2016.
If any Director of the Company is a member of more than one Board in any Chilean or foreign subsidiaries and/or associates, or holds the position of director or advisor in other Chilean or foreign companies or legal entities in which Enel AméricasChile S.A. has a direct or indirect ownership interest, that Director can be compensated for his/her participation in only one of those Boards or Management Committees.
The Executive Officers of the Company and/or any of its Chilean or foreign subsidiaries or associates will not receive any compensation or per diem if they hold the position of director in any of the Chilean or foreign subsidiaries or associates of the Company. Nevertheless, the executives may receive such compensation or per diem, provided there is prior express authorization, as a payment in advance of the variable portion of their compensation received from the respective companies through which they are employed.
Directors’ Committee:
Each member of the Directors’ Committee will receive a variable compensation equal to 0.11765 thousandth of the profit for the year (attributable to shareholders of Enel Américas). Also each member will be paid a monthly compensation, one part in a fixed monthly fee and another part dependent on meetings attended.attended as follows:
This compensation is broken down as follows:
-
60.00· UF 72 as a fixed monthly fee, and
-
22.00· UF 26.4 as per diem for each Board meeting attended.attended, all with a maximum of sixteen sessions in total, whether ordinary or extraordinary, in the corresponding year.
F-70
Table of Contents
The amounts paid for the monthly fee will be treated as payment in advance of the variable annual compensation described above.
Any advance payments received will be deducted from the annual variable compensation, with no reimbursement if the annual variable compensation is lower than the total amount paid in advances. The variable compensation will be paid, when appropriate, after the Ordinary Shareholders’ Meeting approves the Annual Report, Balance Sheet and Financial Statements, and the Independent Auditors’ Reports and Account Inspectors’ Reports for the year ended December 31, 2016.
The following tables show details of the compensation paid to the members of the Board of Directors of the Company for the year ended December 31, 2016:2018 and 2017:
| | | | | | | | | | December 31, 2018 | | | |
| | | | | | | | Enel Chile Board | | Board of subsidiaries | | Directors’ Committee | |
Taxpayer ID No. | | Name | | Position | | Period in position | | ThCh$ | | ThCh$ | | ThCh$ | |
4.975.992-4 | | Hermán Chadwick Piñera | | Chairman | | January - December 2018 | | 181,789 | | — | | — | |
Foreigner | | Giulio Fazio | | Director | | January - December 2018 | | — | | — | | — | |
4.461.192-9 | | Fernán Gazmuri Plaza | | Director | | January - December 2018 | | 90,894 | | — | | 31,018 | |
4.774.797-K | | Pedro Pablo Cabrera Gaete | | Director | | January - December 2018 | | 90,894 | | — | | 31,018 | |
5.672.444-3 | | Juan Gerardo Jofré Miranda | | Director | | January - December 2018 | | 90,894 | | — | | 31,018 | |
Foreigner | | Daniel Caprini (1) | | Director | | April - December 2018 | | — | | — | | — | |
Foreigner | | Salvatore Bernabei | | Director | | January - December 2018 | | — | | — | | — | |
| | | | | | Total | | 454,471 | | — | | 93,054 | |
| | | | | | | | December 31, 2016 (*) |
Taxpayer ID No. | | Name | | Position | | Period in position | | Enel Chile Board | | Board of subsidiaries | | Directors' Committee |
| | | | ThCh$ | | ThCh$ | | ThCh$ |
4.975.992-4 | | Hermán Chadwick Piñera | | Chairman | | March - December 2016 | | 129,578 | | - | | - |
Foreigner | | Giulio Fazio | | Vice Chairman | | March - December 2016 | | - | | - | | - |
4.461.192-9 | | Fernán Gazmuri Plaza | | Director | | March - December 2016 | | 80,864 | | - | | 25,250 |
4.774.797-K | | Pedro Pablo Cabrera Gaete | | Director | | March - December 2016 | | 80,864 | | - | | 25,250 |
5.672.444-3 | | Juan Gerardo Jofré Miranda | | Director | | March - December 2016 | | 80,864 | | - | | 25,250 |
Foreigner | | Vicenzo Ranieri | | Director | | March - December 2016 | | - | | - | | - |
Foreigner | | Salvatore Bernabei | | Director | | March - December 2016 | | - | | - | | - |
| | | | | | | | | | | | |
| | | | | | Total | | 372,170 | | - | | 75,750 |
(*) The(1)On April 25, 2018 Mr. Daniel Caprini took over as Director for Mr. Vicenzo Ranieri
| | | | | | | | December 31, 2017 |
| | | | | | | | Enel Chile Board | | Board of subsidiaries | | Directors’ Committee |
Taxpayer ID No. | | Name | | Position | | Period in position | | ThCh$ | | ThCh$ | | ThCh$ |
4.975.992-4 | | Hermán Chadwick Piñera | | Chairman | | January - December 2016 | | 178,065 | | — | | — |
Foreigner | | Giulio Fazio | | Director | | January - December 2016 | | — | | — | | — |
4.461.192-9 | | Fernán Gazmuri Plaza | | Director | | January - December 2016 | | 89,032 | | — | | 28,504 |
4.774.797-K | | Pedro Pablo Cabrera Gaete | | Director | | January - December 2016 | | 89,032 | | — | | 28,504 |
5.672.444-3 | | Juan Gerardo Jofré Miranda | | Director | | January - December 2016 | | 89,032 | | — | | 28,504 |
Foreigner | | Vicenzo Ranieri | | Director | | January - December 2016 | | — | | — | | — |
Foreigner | | Salvatore Bernabei | | Director | | January - December 2016 | | — | | — | | — |
| | | | | | Total | | 445,161 | | — | | 85,512 |
c) Guarantees given by the Company was initially created on January 22, 2016.in favor of the directors
| c)
| Guarantees given by the Company in favor of the directors
|
No guarantees have been given in favor of the directors.
9.3
12.3 Compensation for key management personnel
a) Compensation received by key management personnel
| a)
| Compensation received by key management personnel
|
Key Management Personnel |
|
Taxpayer ID No. | | Name | | Position |
| | | | |
Foreigner | | Nicola CotugnoPalloti Paolo (1)
| | Chief Executive Officer | |
7.625.745-0Foreigner
| | De Jesus Marcelo Antonio Barreda Toledo | | Procurement Officer
|
24.950.967-1
| | Raffaele Grandi(2)
| | Administration, Finance and Control Officer | |
15.307.846-7 | | Jose Miranda Montecinos | | Communications Officer | |
24.166.243-813.903.626-3
| | Alain Rosolino (2)Liliana Schnaidt Hagedorn (3)
| | Human Resources and Organization Officer | |
6.973.465-0 | | Domingo Valdés Prieto | | General Counsel and Secretary to the Board | |
Foreigner | | Raffael Cutrignelli (3) | | Internal Audit Officer | |
11.625.161-2 | | Pedro Urzúa Frei | | Institutional Relations Officer | |
12.494.825-8 | | (1)Claudia Navarrete Campos (4)
| On August 16, 2016, Mr. Nicola Cotugno became CEO replacing Mr. Luca D’Agnese who submitted his voluntarily resignation from the Company, and served until that date.
|
| (2)Planning and control Officer
| On October 1, 2016, Mr. Alain Rosolino became Human Resources and Organization Officer replacing Ms. Paola Visintini Vacarezza.
|
13.848.428-9 | | (3)Alison Dunsmore M. (5)
| On October 1, 2016, Mr. Raffaele Cutrignelli became Internal Audit
| Services Officer replacing Mr. Alain Rosolino. | |
25.566.577-4 | | Juan Jose Bonilla Andrino | | Supply Manager | |
13.686.119-0 | | Andres Pinto Bonta | | Security manager | |
23.819.804-6 | | Antonella Pellegrini | | Manager of Sustainability and Community Relations | |
25.629.782-5 | | Monica de Martino (5) | | Regulation Officer | |
10.761.436-2 | | Barrios Ramon Angel | | ICT Officer | |
(1) On September 27, 2018, Mr. Nicola Cotugno resigned as Chief Executive Officer of the Company, but stayed in office until the September 30. On the same date, September 27, 2018, the Board of Directors of Enel Chile appointed Mr. Paolo Pallotti as the new Chief Executive Officer of Enel Chile, effective October 1, 2018.
(2) On September 27, 2018, Mr. Raffaele Grandi resigned as Administration, Finance and Control Manager, effective November 1, 2018. On the same date, September 27, 2018, the Board of Directors of Enel Chile appointed Marcelo Antonio de Jesus as the new Administration, Finance and Control Manager, on November 1, 2018.
(3) On February 1, 2018, Mrs. Liliana Schnaidt H. was appointed as Human Resources and Organization Manager replacing Mr. Alain Rosolino.
(4) On August 1, 2018, Ms. Claudia Navarrete C. was appointed as Planning and Control Manager, replacing Mr. Bruno Stella.
(5) On May 1, 2018, Mrs. Alison Dunsmore M. was appointed as Service Manager, replacing Mr. Francisco Silva B.
F-71
Table of Contents
12. 4 Incentive plans for key management personnel
The Company has implemented an annual bonus plan for its executives based on meeting company-wide objectives and on the level of their individual contribution in achieving the overall goals of the Company. The plan provides for a range of bonus amounts according to seniority level. The bonuses paid to the executives consist of a certain number of monthly gross compensation.
Compensation received by key management personnel is the following:
| | December 31, 2018 | | December 31, 2017 | | | | ThCh$ | | ThCh$ | | Cash compensation | | 2,959,019 | | 2,959,467 | | Short-term benefits for employees | | 497,424 | | 557,122 | | Other long-term benefits | | 322,865 | | 183,453 | | Total | | 3,779,308 | | 3,700,042 | |
Guarantees established by the Company in favor of key management personnel | | |
| | December 31, 2016
|
| ThCh$
|
| | |
Cash compensation
| | 1,486,703
|
Short-term benefits for employees
| | 341,203
|
Other long-term benefits
| | 295,321
|
| | |
Total
| | 2,123,227
|
| b)
| Guarantees established by the Company in favor of key management personnel
|
No guarantees have been given to key management personnel.
9.4
12.5 Compensation plans linked to share price
There are no payment plans granted to the Directors or key management personnel based on the share price of the Company.
10.
13. INVENTORIES. | INVENTORIES.
|
The detail of inventories as of December 31, 20162018 and 2015,2017, is as follows:
| | As of December 31, | | As of December 31, | |
| | 2016 | | 2015 | | 2018 | | 2017 | |
Classes of Inventories | | ThCh$ | | ThCh$ | | ThCh$ | | ThCh$ | |
Supplies for Production | | 12,377,179 | | 17,838,253 | | 34,384,582 | | 16,879,260 | |
Gas | | 2,159,901 | | 3,882,410 | | 5,712,978 | | 2,301,172 | |
Oil | | 2,556,438 | | 3,183,800 | | 2,684,688 | | 2,593,806 | |
Coal | | 7,660,840 | | 10,772,043 | | 25,986,916 | | 11,984,282 | |
Other inventories (*) | | 25,162,417 | | 24,778,362 | |
Total | | 37,539,596 | | 42,616,615 | |
| | | | | |
(*) Other inventories | | 25,162,417 | | 24,778,362 | |
Supplies for projects and spare parts | | 17,076,698 | | 15,396,862 | | 14,354,027 | | 12,311,718 | |
Electrical materials | | 8,085,719 | | 9,381,500 | | 8,223,034 | | 10,495,964 | |
Total | | | 56,961,643 | | 39,686,942 | |
There are no inventories pledged as security for liabilities.
For the years ended December 31, 2016, 20152018 and 2014,2017, raw materials and consumables recognized as fuel expenses were ThCh$295,148,838, ThCh$327,502,996231,028,169 and ThCh$305,480,260,280,739,362, respectively. See Note 26.29.
As
F-72
Table of December 31, 2016 and 2015, no inventories have been written down due to obsolescence.Contents
11.
14. CURRENT TAX ASSETS AND LIABILITIES. | CURRENT TAX ASSETS AND LIABILITIES.
|
The detail of current tax assets and liabilities as of December 31, 20162018 and 2015,2017, is as follows:
| | As of December 31, | | As of December 31, | |
| | 2016 | | 2015 | | 2018 | | 2017 | |
Tax Receivables | | ThCh$ | | ThCh$ | | ThCh$ | | ThCh$ | |
Monthly provisional tax payments | | 43,862,763 | | 17,969,326 | | 52,950,410 | | 63,942,847 | |
Tax credit for absorbed profits | | 11,398,609 | | 9,597 | | 46,343,265 | | 13,433,962 | |
Tax credit for training expenses | | 241,700 | | 157,500 | | 470,142 | | 261,000 | |
Tax credits from dividends received abroad | | - | | 1,095 | |
Other | | 146,099 | | 2,168,694 | | — | | 118,239 | |
Total | | 55,649,171 | | 20,306,212 | | 99,763,817 | | 77,756,048 | |
| | | | | |
| | As of December 31, | |
| | 2016 | | 2015 | |
Tax Payables | | ThCh$ | | ThCh$ | |
Income tax | | 61,599,415 | | 15,119,789 | |
Total | | 61,599,415 | | 15,119,789 | |
The details of accounts payable associated with current taxes as of December 31, 2018 and 2017 are as follows:
| | As of December 31, | |
| | 2018 | | 2017 | |
Tax Payables | | ThCh$ | | ThCh$ | |
Income tax | | 17,677,920 | | 67,027,507 | |
Total | | 17,677,920 | | 67,027,507 | |
F-73
Table of Contents
12.
| INVESTMENTS ACCOUNTED FOR USING THE EQUITY METHOD.
|
15. INVESTMENTS ACCOUNTED FOR USING THE EQUITY METHOD.12.1.
15.1. Investments accounted for using the equity method
| a.
| The following tables present the changes in investments in associates and joint ventures accounted for using the equity method as of December 31, 2016 and 2015:
|
a. The following tables present the changes in investments in associates and joint ventures accounted for using the equity method as of December 31, 2018 and 2017:
Taxpayer ID | | | | | | | | Ownership | | Balance as of
1-1-2018 | | Additions | | Share of
Profit
(Loss) | | Dividends
Declared | | Foreign
Currency
Translation | | Other
Comprehensive
Income | | Other
Increase
(Decrease) | | Balance as
of
12-31-2018 | |
Number | | Associates and Joint Ventures | | Country | | Currency | | Interest | | ThCh$ | | ThCh$ | | ThCh$ | | ThCh$ | | ThCh$ | | ThCh$ | | ThCh$ | | ThCh$ | |
76.418.940-K | | GNL Chile S.A. | | Chile | | U.S. dollar | | 33.33 | % | 3,783,316 | | — | | 805,972 | | (1,884,140 | ) | 347,835 | | — | | — | | 3,052,983 | |
76.652.400-1 | | Centrales Hidroeléctricas De Aysén S.A. (*) | | Chile | | Chilean peso | | — | | 4,205,233 | | — | | 1,734,508 | | — | | — | | — | | (5,939,741 | ) | — | |
77.017.930-0 | | Transmisora Eléctrica de Quillota Ltda. | | Chile | | Chilean peso | | 0.08 | % | 8,818,759 | | — | | 654,952 | | — | | — | | — | | — | | 9,473,711 | |
Foreign | | Enel Argentina S.A. | | Argentina | | Argentine peso | | 0.12 | % | 105,146 | | — | | 86,021 | | — | | (108,069 | ) | — | | 217,100 | | 300,198 | |
76.364.085-K | | Energía Marina SpA | | Chile | | Chilean peso | | 25.00 | % | — | | | | (91,213 | ) | | | | | | | 137,852 | | 46,639 | |
| | | | | | | | TOTAL | | 16,912,454 | | — | | 3,190,240 | | (1,884,140 | ) | 239,766 | | — | | (5,584,789 | ) | 12,873,531 | |
Taxpayer ID | | | | | | | | Ownership | | Balance as of
1-1-2017 | | Additions | | Share of
Profit
(Loss) | | Dividends
Declared | | Foreign
Currency
Translation | | Other
Comprehensive
Income | | Other
Increase
(Decrease) | | Balance as
of
12-31-2017 | |
Number | | Associates and Joint Ventures | | Country | | Currency | | Interest | | ThCh$ | | ThCh$ | | ThCh$ | | ThCh$ | | ThCh$ | | ThCh$ | | ThCh$ | | ThCh$ | |
76.418.940-K | | GNL Chile S.A. | | Chile | | U.S. dollar | | 33.33 | % | 3,982,934 | | — | | 841,957 | | (743,734 | ) | (297,841 | ) | — | | — | | 3,783,316 | |
76.652.400-1 | | Centrales Hidroeléctricas De Aysén S.A. (*) | | Chile | | Chilean peso | | 51.00 | % | 6,441,166 | | 1,943,100 | | (4,179,033 | ) | — | | — | | — | | — | | 4,205,233 | |
77.017.930-0 | | Transmisora Eléctrica de Quillota Ltda. | | Chile | | Chilean peso | | 50.00 | % | 8,222,763 | | — | | 595,996 | | — | | — | | — | | — | | 8,818,759 | |
Foreign | | Enel Argentina S.A. | | Argentina | | Argentine peso | | 0.12 | % | 91,335 | | — | | 44,176 | | — | | (29,198 | ) | (1,490 | ) | 323 | | 105,146 | |
| | | | | | | | TOTAL | | 18,738,198 | | 1,943,100 | | (2,696,904 | ) | (743,734 | ) | (327,039 | ) | (1,490 | ) | 323 | | 16,912,454 | |
Taxpayer ID Number | Associates and Joint Ventures | Relationship | Country | Currency | Ownership Interest | | Balance as of 01-01-2016 | | Additions | | Share of Profit (Loss) | | Dividends Declared | | Foreign Currency Translation | | Other Comprehensive Income | | Other Increase (Decrease) | | Balance as of 12-31-2016 |
| | | | | | | |
| | | | | | | |
| ThCh$ | | ThCh$ | | ThCh$ | | ThCh$ | | ThCh$ | | ThCh$ | | ThCh$ | | ThCh$ |
96.806.130-5 | Electrogas S.A. (1) | Associate | Chile | U.S. dollar | 42.50% | | 12,042,873 | | - | | 5,166,226 | | (3,979,095) | | (844,372) | | 607,375 | | (12,993,007) | | - |
76.788.080-4 | GNL Quintero S.A. (2) | Associate | Chile | U.S. dollar | 20.00% | | 17,137,023 | | - | | 2,750,075 | | (2,598,035) | | (816,094) | | (12,298,165) | | (4,174,804) | | - |
76.418.940-K | GNL Chile S.A. | Associate | Chile | U.S. dollar | 33.33% | | 2,662,029 | | - | | 1,491,025 | | - | | (170,120) | | - | | - | | 3,982,934 |
76.652.400-1 | Centrales Hidroeléctricas De Aysén S.A. | Joint Venture | Chile | Chilean peso | 51.00% | | 6,280,293 | | 2,346,000 | | (2,185,127) | | - | | - | | - | | - | | 6,441,166 |
77.017.930-0 | Transmisora Eléctrica de Quillota Ltda. | Joint Venture | Chile | Chilean peso | 50.00% | | 7,594,153 | | - | | 628,610 | | - | | - | | - | | - | | 8,222,763 |
Foreign | Enel Argentina S.A. | Associate | Argentina | Argentine peso | 0.12% | | - | | 235,090 | | 23,610 | | - | | (21,044) | | (656) | | (145,665) | | 91,335 |
Foreign | Southern Cone S.A. | Associate | Argentina | Argentine peso | 2.00% | | - | | 3,326 | | 3,780 | | - | | (1,080) | | (63) | | (5,963) | | - |
| | | | | TOTAL | | 45,716,371 | | 2,584,416 | | 7,878,199 | | (6,577,130) | | (1,852,710) | | (11,691,509) | | (17,319,439) | | 18,738,198 |
| | | | | | | | | | | | | | | | | | | | | |
Taxpayer ID Number | Associates and Joint Ventures | Relationship | Country | Currency | Ownership Interest | | Balance as of 01-01-2015 | | Additions | | Share of Profit (Loss) | | Dividends Declared | | Foreign Currency Translation | | Other Comprehensive Income | | Other Increase (Decrease) | | Balance as of 12-31-2015 |
| | | | | | | |
| | | | | | | |
| ThCh$ | | ThCh$ | | ThCh$ | | ThCh$ | | ThCh$ | | ThCh$ | | ThCh$ | | ThCh$ |
96.806.130-5 | Electrogas S.A. | Associate | Chile | U.S. dollar | 42.50% | | 10,777,659 | | - | | 5,121,427 | | (4,398,423) | | 1,120,072 | | (577,862) | | - | | 12,042,873 |
76.788.080-4 | GNL Quintero S.A. | Associate | Chile | U.S. dollar | 20.00% | | 15,198,935 | | - | | 4,534,344 | | (4,449,179) | | 1,852,923 | | - | | - | | 17,137,023 |
76.418.940-K | GNL Chile S.A. | Associate | Chile | U.S. dollar | 33.33% | | 1,818,168 | | - | | 495,389 | | - | | 348,472 | | - | | - | | 2,662,029 |
76.652.400-1 | Centrales Hidroeléctricas De Aysén S.A. | Joint Venture | Chile | Chilean peso | 51.00% | | 6,144,557 | | 2,550,000 | | (2,414,264) | | - | | - | | - | | - | | 6,280,293 |
77.017.930-0 | Transmisora Eléctrica de Quillota Ltda. | Joint Venture | Chile | Chilean peso | 50.00% | | 6,426,004 | | - | | 1,168,149 | | - | | - | | - | | - | | 7,594,153 |
| | | | | TOTAL | | 40,365,323 | | 2,550,000 | | 8,905,045 | | (8,847,602) | | 3,321,467 | | (577,862) | | - | | 45,716,371 |
(*) See section b) below
| (2)
| On June 9, 2016, our subsidiary Enel Generación Chile S.A. signed an agreement to sell all shares of its equity method investee GNL Quintero S.A., equivalent to a 20% ownership interest, to Enagás Chile SpA (“Enagás Chile”) which is a wholly-owned subsidiary of Enagás S.A.
|
F-74
Table of Contents
b.Centrales Hidroeléctricas de Aysén S.A. (Hidroaysén)
In May 2014, the Committee of Ministers revoked the Environmental Qualification Resolution (“RCA”) of the Centrales Hidroeléctricas de Aysén S.A. project, in which the Company participates by accepting some of the claims filed against this project. It is a public information that this decision was resorted before the Environmental Courts in Valdivia and Santiago. On January 28, 2015, it was made public that the water rights request made by Centrales Hidroeléctricas de Aysén S.A. has been partially rejected in 2008.
The Company had expressed its intention to promote at Centrales Hidroeléctricas de Aysén S.A. the defense for water rights and the environmental qualification granted to the project in the corresponding instances, continuing with the judicial actions already started or implementing new administrative or judicial actions that are necessary to this end, and it maintained the belief that hydric resources of the Aysén region are important for the energy development of the country.
Nevertheless, there was uncertainty on the recoverability of the investment made so far at Centrales Hidroeléctricas de Aysén S.A., since it depended both on judicial decisions and on definitions in the energy agenda which could not been foreseen , consequently the investment was not included in the portfolio of the Company’s immediate projects. At closing date of fiscal year 2014, the Company recognized an impairment of its participation in Centrales Hidroeléctricas de Aysén S.A. amounting to ThCh$ 69,066,857.
On December 7, 2017, an Extraordinary Meeting of shareholders of Centrales Hidroeléctricas de Aysén S.A. was held, in which the early dissolution of the same was agreed and how the liquidation process of the assets of the company will be carried out. The liquidation process contemplated a distribution of assets to its shareholders Enel Generación and Colbún according to their stakes of 51% and 49% respectively. This liquidation process and the corresponding distribution took place on September 7, 2018.
The following is the individual balance sheet considered for the liquidation process:
| | Liquidation
Balance | | Recognized by Enel
Generación (51%) | |
| | 09-07-18 | | 09-07-18 | |
CENTRALES HIDROELECTRICAS DE AYSEN S.A. | | ThCh$ | | ThCh$ | |
ASSETS | | | | | |
| | | | | |
CURRENT ASSETS | | | | | |
| | | | | |
Cash and cash equivalents | | 72,339 | | 36,892 | |
Current accounts receivable from related parties | | 56,021 | | 28,571 | |
| | | | | |
TOTAL CURRENT ASSETS | | 128,360 | | 65,463 | |
| | | | | |
NON-CURRENT ASSETS | | | | | |
| | | | | |
Property, plant and equipment | | 11,603,281 | | 5,917,673 | |
| | | | | |
TOTAL NON-CURRENT ASSETS | | 11,603,281 | | 5,917,673 | |
| | | | | |
TOTAL ASSETS | | 11,731,641 | | 5,983,136 | |
| | | | | |
| | 09-07-18 | | 09-07-18 | |
| | ThCh$ | | ThCh$ | |
CURRENT LIABILITIES | | | | | |
| | | | | |
Other current provisions | | 83,403 | | 42,535 | |
| | | | | |
TOTAL CURRENT LIABILITIES | | 83,403 | | 42,535 | |
| | | | | |
EQUITY | | | | | |
Issued capital | | 188,855,665 | | 96,316,389 | |
Retained earnings | | (177,207,427 | ) | (90,375,788 | ) |
| | | | | |
TOTAL EQUITY | | 11,648,238 | | 5,940,601 | |
| | | | | |
TOTAL LIABILITIES AND EQUITY | | 11,731,641 | | 5,983,136 | |
F-75
Table of Contents
c.Sale GNL Quintero S.A.
On June 9, 2016, our subsidiary Enel Generación Chile S.A. agreed and signed a share purchase agreement with Enagás Chile S.p.A. (“Enagás Chile”), a company 100% controlled by Enagás S.A., through which Enagás Chile would acquire all of Enel Generación Chile S.A.’s interest in the associated company GNL Quintero S.A., representing 20% of that company’s capital..
The sale of this interest to Enagás Chile was subject to compliance with the usual conditions for this type of transactions, including the failure of the other shareholders of GNL Quintero S.A. to exercise their preferential acquisition right, in accordance with the terms and conditions established in the shareholders’ agreement subscribed between the shareholders of said company.
On September 14, 2016, after compliance with allthe conditions agreed between the parties the sale transaction was completed andhad been met, Enel Generación Chile S.A. transferred its’s shares ofin GNL Quintero S.A. were definitively sold and transferred to Enagás Chile. The total salepurchase price wasamounted to US$ 197,365,113.2197,365,113 (ThCh$132,820,800) (See Note 30).
GNL Quintero S.A. operates a storage and regasification of Liquefied Natural Gas (LNG) plant and its related land-based Terminal for loading and unloading LNG, including facilities and network necessary to deliver LNG, through a LNG truck loading facility and delivery point’s pipelines.
| b.
| Additional financial information on investments in associates and joint ventures
|
12.2.15.2. Investments with significant influence
The following tables show financial information as of December 31, 20162018 and 2015,2017, from the financial statements of the investments in associates where the Group has significant influence:
| | As of December 31, 2016 |
Investments with Significant Influence | | % Ownership Interest Direct / Indirect | | Current Assets | | Non-current Assets | | Current Liabilities | | Non-current Liabilities | | Revenues | | Expenses | | Profit (Loss) | | Other Comprehensive Income | | Comprehensive Income |
| | | | | | | | | |
| | ThCh$ | | ThCh$ | | ThCh$ | | ThCh$ | | ThCh$ | | ThCh$ | | ThCh$ | | ThCh$ | | ThCh$ |
GNL Chile S.A | | 33.33% | | 90,283,944 | | 117,703 | | 78,452,153 | | - | | 615,229,994 | | (610,756,322) | | 4,473,672 | | (510,406) | | 3,963,266 |
GNL Quintero S.A. | | 20.00% | | - | | - | | - | | - | | 86,471,706 | | (72,752,059) | | 13,719,647 | | (65,571,292) | | (51,851,645) |
Electrogas S.A. | | 42.50% | | 9,318,456 | | 40,746,438 | | 5,683,680 | | 13,809,430 | | 24,126,070 | | (11,970,244) | | 12,155,826 | | (347,369) | | 11,808,457 |
| | | | | | | | | | | | | | | | | | | | |
| | As of December 31, 2015 |
Investments with Significant Influence | | % Ownership Interest Direct / Indirect | | Current Assets | | Non-current Assets | | Current Liabilities | | Non-current Liabilities | | Revenues | | Expenses | | Profit (Loss) | | Other Comprehensive Income | | Comprehensive Income |
| | | | | | | | | |
| | ThCh$ | | ThCh$ | | ThCh$ | | ThCh$ | | ThCh$ | | ThCh$ | | ThCh$ | | ThCh$ | | ThCh$ |
GNL Chile S.A | | 33.33% | | 73,289,529 | | 19,843,392 | | 59,207,958 | | 25,938,077 | | 655,759,390 | | (654,273,074) | | 1,486,316 | | 1,045,519 | | 2,531,835 |
GNL Quintero S.A. | | 20.00% | | 154,169,202 | | 679,246,875 | | 22,104,679 | | 725,626,283 | | 130,540,774 | | (107,869,054) | | 22,671,720 | | 9,264,617 | | 31,936,337 |
Electrogas S.A. | | 42.50% | | 9,800,475 | | 46,815,192 | | 12,191,561 | | 16,087,934 | | 23,546,048 | | (10,624,229) | | 12,921,819 | | 1,275,795 | | 14,197,614 |
| | As of December 31, 2018 | |
Investments with Significant | | % Ownership
Interest Direct / | | Current Assets | | Non-
current
Assets | | Current Liabilities | | Non-
current
Liabilities | | Revenues | | Expenses | | Profit (Loss) | | Other
Comprehensive
Income | | Comprehensive
Income | |
Influence | | Indirect | | ThCh$ | | ThCh$ | | ThCh$ | | ThCh$ | | ThCh$ | | ThCh$ | | ThCh$ | | ThCh$ | | ThCh$ | |
GNL Chile S.A | | 33.33 | % | 75,571,058 | | 267,884 | | 66,679,077 | | — | | 707,597,382 | | (705,179,062 | ) | 2,418,157 | | 1,043,609 | | 3,461,766 | |
| | As of December 31, 2017 | |
Investments with Significant | | % Ownership
Interest Direct / | | Current Assets | | Non-
current
Assets | | Current Liabilities | | Non-
current
Liabilities | | Revenues | | Expenses | | Profit (Loss) | | Other
Comprehensive
Income | | Comprehensive
Income | |
Influence | | Indirect | | ThCh$ | | ThCh$ | | ThCh$ | | ThCh$ | | ThCh$ | | ThCh$ | | ThCh$ | | ThCh$ | | ThCh$ | |
GNL Chile S.A | | 33.33 | % | 71,254,956 | | 148,950 | | 60,052,823 | | — | | 687,399,254 | | (684,873,130 | ) | 2,526,124 | | (24,472 | ) | 2,501,652 | |
Appendix 3 to these consolidated financial statements provides information on the main activities of our associates and the ownership interest that the Group holds in them.
None of our associates have published price quotations
F-76
Table of Contents
15.3. Joint ventures12.3. Joint ventures
The following tables present information from the financial statements as of December 31, 20162018 and 2015,2017, on the main joint ventures:
| | Centrales Hidroeléctricas | | Transmisora Eléctrica | | Centrales Hidroeléctricas | | Transmisora Eléctrica | |
| | de Aysén S.A. | | de Quillota Ltda. | | de Aysén S.A. (*) | | de Quillota Ltda. | |
| | 51.0% | | 51.0% | | 50.0% | | 50.0% | | (—)% | | 51.0% | | 50.0% | | 50.0% | |
| | 12-31-2016 | | 12-31-2015 | | 12-31-2016 | | 12-31-2015 | | 12-31-2018 | | 12-31-2017 | | 12-31-2018 | | 12-31-2017 | |
Financial statement items | | ThCh$ | | ThCh$ | | ThCh$ | | ThCh$ | | ThCh$ | | ThCh$ | | ThCh$ | | ThCh$ | |
Total current assets | | 863,962 | | 502,938 | | 6,366,378 | | 5,336,516 | | — | | 355,835 | | 9,360,553 | | 7,793,702 | |
Total non-current assets | | 15,159,321 | | 15,159,321 | | 12,034,576 | | 12,148,544 | | — | | 8,030,172 | | 11,530,788 | | 12,036,201 | |
Total current liabilities | | 3,324,706 | | 3,290,947 | | 245,025 | | 466,485 | | — | | 139,182 | | 235,264 | | 440,426 | |
Total non-current liabilities | | 68,081 | | 56,685 | | 1,710,406 | | 1,830,272 | | — | | — | | 1,708,660 | | 1,751,963 | |
Cash and cash equivalents | | 860,719 | | 428,440 | | 5,716,196 | | 4,884,645 | | — | | 355,446 | | 8,185,391 | | 7,310,296 | |
Revenues | | - | | - | | 2,774,316 | | 2,852,803 | | — | | — | | 3,003,757 | | 2,813,493 | |
Other fixed operating expenses | | | (125,182 | ) | (8,144,855 | ) | (758,607 | ) | (525,471 | ) |
Depreciation and amortization expense | | - | | - | | (773,093) | | (748,171) | | — | | — | | (784,364 | ) | (782,322 | ) |
Impairment losses | | - | | - | | - | | - | |
Other Income | | | 3,526,179 | | — | | — | | — | |
Interest income | | 42,046 | | 20,009 | | 134,995 | | 1,678,801 | | — | | 24,829 | | 187,601 | | — | |
Income tax expense | | (7,070) | | (8,586) | | (225,008) | | (679,715) | | — | | — | | (349,848 | ) | (313,709 | ) |
Profit (loss) | | (4,284,131) | | (4,733,482) | | 1,257,220 | | 2,336,297 | | 3,400,997 | | (8,193,671 | ) | 1,309,903 | | 1,191,991 | |
Other comprehensive income | | - | | - | | - | | - | | — | | — | | — | | — | |
Comprehensive income | | (4,284,131) | | (4,733,482) | | 1,257,220 | | 2,336,297 | | 3,400,997 | | (8,193,671 | ) | 1,309,903 | | 1,191,991 | |
(*) See Notes 2.6 and 15.1.b. ·There are no significant commitments and contingencies, or restrictions on funds transfers to its owners in associates and joint ventures. 16. INTANGIBLE ASSETS OTHER THAN GOODWILL. | c.
| There are no significant commitments and contingencies, or restrictions on funds transfers to its owners in associates and joint ventures.
|
13.
| INTANGIBLE ASSETS OTHER THAN GOODWILL.
|
The following table presents intangible assets as of December 31, 20162018 and 2015:2017:
| | | As of December 31, | |
| | As of December 31, | | 2018 | | 2017 | |
Intangible Assets, Net | | 2016 | | 2015 | | ThCh$ | | ThCh$ | |
| ThCh$ | | ThCh$ | | 115,372,393 | | 55,170,904 | |
| | | |
Intangible Assets, Net | | 44,470,750 | | 42,879,326 | |
Easements and water rights | | 12,564,076 | | 14,575,473 | | 17,736,954 | | 12,608,950 | |
Concessions | | | 25,953,878 | | — | |
Patents, Registered Trademarks and Other Rights | | | 7,394 | | — | |
Computer software | | 27,591,694 | | 27,824,092 | | 60,067,635 | | 38,254,793 | |
Other identifiable intangible assets | | 4,314,980 | | 479,761 | | 11,606,532 | | 4,307,161 | |
| | | |
Intangible Assets, Gross | | 2016 | | 2015 | |
| ThCh$ | | ThCh$ | |
| | | |
Intangible Assets, Gross | | 101,092,918 | | 93,575,139 | |
Easements and water rights | | 14,553,826 | | 16,565,224 | |
Computer software | | 75,793,919 | | 70,101,954 | |
Other identifiable intangible assets | | 10,745,173 | | 6,907,961 | |
| | | |
Intangible Assets, Amortization and Impairment | | 2016 | | 2015 | |
| ThCh$ | | ThCh$ | |
| | | |
Accumulated Amortization and Impairment, Total | | (56,622,168) | | (50,695,813) | |
Identifiable intangible assets | | (56,622,168) | | (50,695,813) | |
Easements and water rights | | (1,989,750) | | (1,989,751) | |
Computer software | | (48,202,225) | | (42,277,862) | |
Other identifiable intangible assets | | (6,430,193) | | (6,428,200) | |
| | 2018 | | 2017 | |
Intangible Assets, Gross | | ThCh$ | | ThCh$ | |
Intangible Assets, Gross | | 206,047,864 | | 118,593,240 | |
Easements and water rights | | 22,011,401 | | 14,598,701 | |
Concessions | | 32,055,825 | | — | |
Patents, Registered Trademarks and Other Rights | | 12,484 | | — | |
Computer software | | 133,931,876 | | 93,260,355 | |
Other identifiable intangible assets | | 18,036,278 | | 10,734,184 | |
F-77
Table of Contents
| | 2018 | | 2017 | |
Intangible Assets, Amortization and Impairment | | ThCh$ | | ThCh$ | |
Accumulated Amortization and Impairment, Total | | (90,675,471 | ) | (63,422,336 | ) |
Easements and water rights | | (4,274,447 | ) | (1,989,751 | ) |
Concessions | | (6,101,947 | ) | — | |
Patents, Registered Trademarks and Other Rights | | (5,090 | ) | — | |
Computer software | | (73,864,241 | ) | (55,005,562 | ) |
Other identifiable intangible assets | | (6,429,746 | ) | (6,427,023 | ) |
The reconciliations of the carrying amounts of intangible assets at December 31, 20162018 and 20152017 are as follows:
| | | Easements | | Concessions | | Patents,
Registered
Trademarks
and Other
Rights | | Computer
Software | | Other Identifiable
Intangible Assets | | Intangibles Assets,
Net | |
Changes in Intangible Assets | | Easements | | Computer Software | | Other Identifiable Intangible Assets | | Intangibles Assets, Net | | ThCh$ | | ThCh$ | | ThCh$ | | ThCh$ | | ThCh$ | | ThCh$ | |
| | |
| ThCh$ | | ThCh$ | | ThCh$ | | ThCh$ | |
Opening balance January 1, 2016 | | 14,575,473 | | 27,824,092 | | 479,761 | | 42,879,326 | |
Opening balance January 1, 2018 | | | 12,608,950 | | — | | — | | 38,254,793 | | 4,307,161 | | 55,170,904 | |
Changes in identifiable intangible assets | | | | | | | | | | | | | | | |
Increases (decreases) other than from business combinations | | 540,052 | | 5,690,091 | | 3,851,635 | | 10,081,778 | | 2,721 | | — | | 12,484 | | 25,759,609 | | — | | 25,774,814 | |
Acquisitions made through business combination | | | — | | 30,077,961 | | — | | 2,113,933 | | 9,594,267 | | 41,786,161 | |
Increase (decrease) from exchange differences, net | | - | | - | | 2,897 | | 2,897 | | 769,421 | | 2,033,761 | | — | | 4,111,021 | | — | | 6,914,203 | |
Amortization (1) | | - | | (5,815,030) | | (18,961) | | (5,833,991) | | (347,397 | ) | (4,109,453 | ) | (5,090 | ) | (7,750,745 | ) | (2,723 | ) | (12,215,408 | ) |
Increases (decreases) from transfers and other changes | | 352 | | - | | (352) | | - | | 5,213,240 | | 2,048,391 | | — | | (866,790 | ) | (2,298,059 | ) | — | |
Increases (decreases) from transfers | | 352 | | - | | (352) | | - | | 5,213,240 | | 2,048,391 | | — | | (866,790 | ) | (2,298,059 | ) | — | |
Increases (decreases) from other changes | | - | | - | | - | | - | |
Disposals and removals from service | | (2,549,926) | | - | | - | | (2,549,926) | |
Disposals | | (2,549,926) | | - | | - | | (2,549,926) | |
Disposals and removal from service | | | (509,981 | ) | — | | — | | — | | — | | (509,981 | ) |
Removals from service | | - | | - | | - | | - | | (509,981 | ) | — | | — | | — | | — | | (509,981 | ) |
Other increases (decreases) | | (1,875) | | (107,459) | | - | | (109,334) | |
Decreases to be classified as held for sale | | | — | | — | | — | | — | | — | | — | |
Argentina Hyperinflation Effect | | | — | | — | | — | | 180 | | — | | 180 | |
Increase (decrease) | | | — | | — | | — | | (1,554,366 | ) | 5,886 | | (1,548,480 | ) |
Total changes in identifiable intangible assets | | (2,011,397) | | (232,398) | | 3,835,219 | | 1,591,424 | | 5,128,004 | | 25,953,878 | | 7,394 | | 21,812,842 | | 7,299,371 | | 60,201,489 | |
Closing balance December 31, 2016 | | 12,564,076 | | 27,591,694 | | 4,314,980 | | 44,470,750 | |
Closing balance December 31, 2018 | | | 17,736,954 | | 25,953,878 | | 7,394 | | 60,067,635 | | 11,606,532 | | 115,372,393 | |
| | Easements | | Concessions | | Patents,
Registered
Trademarks
and Other
Rights | | Computer
Software | | Other Identifiable
Intangible Assets | | Intangibles Assets,
Net | |
Changes in Intangible Assets | | ThCh$ | | ThCh$ | | ThCh$ | | ThCh$ | | ThCh$ | | ThCh$ | |
Opening balance January 1, 2017 | | 12,564,076 | | — | | — | | 27,591,694 | | 4,314,980 | | 44,470,750 | |
Changes in identifiable intangible assets | | | | | | | | | | | | | |
Increases (decreases) other than from business combinations | | 295,588 | | — | | — | | 17,466,436 | | — | | 17,762,024 | |
Increase (decrease) from exchange differences, net | | — | | — | | — | | — | | (115 | ) | (115 | ) |
Amortization (1) | | — | | — | | — | | (6,803,337 | ) | (7,704 | ) | (6,811,041 | ) |
Increases (decreases) from transfers and other changes | | (250,714 | ) | — | | — | | — | | — | | (250,714 | ) |
Increases (decreases) from transfers | | (250,714 | ) | — | | — | | — | | — | | (250,714 | ) |
Total changes in identifiable intangible assets | | 44,874 | | — | | — | | 10,663,099 | | (7,819 | ) | 10,700,154 | |
Closing balance December 31, 2017 | | 12,608,950 | | — | | — | | 38,254,793 | | 4,307,161 | | 55,170,904 | |
Changes in Intangible Assets | | Easements | | Computer Software | | Other Identifiable Intangible Assets | | Intangibles Assets, Net |
| | | |
| ThCh$ | | ThCh$ | | ThCh$ | | ThCh$ |
Opening balance January 1, 2015 | | 14,692,984 | | 21,651,862 | | 180,676 | | 36,525,522 |
Changes in identifiable intangible assets | | | | | | | | |
Increases (decreases) other than from business combinations | | 209,063 | | 10,397,910 | | - | | 10,606,973 |
Increase (decrease) from exchange differences, net | | - | | 4,295 | | 31,388 | | 35,683 |
Amortization (1) | | - | | (4,760,002) | | (20,146) | | (4,780,148) |
Increases (decreases) from transfers and other changes | | (246,574) | | 530,027 | | 287,843 | | 571,296 |
Increases (decreases) from transfers | | - | | - | | - | | - |
Increases (decreases) from other changes | | (246,574) | | 530,027 | | 287,843 | | 571,296 |
Disposals and removals from service | | (80,000) | | - | | - | | (80,000) |
Disposals | | - | | - | | - | | - |
Removals from service | | (80,000) | | - | | - | | (80,000) |
Total changes in identifiable intangible assets | | (117,511) | | 6,172,230 | | 299,085 | | 6,353,804 |
Closing balance December 31, 2015 | | 14,575,473 | | 27,824,092 | | 479,761 | | 42,879,326 |
(1) See Note 28.31.
(2) See Note 15.e).x)
According to the Group management’s estimates and projections, the expected future cash flows attributable to intangible assets allow the recovery of the carrying amount of these assets recorded as of December 31, 20162018 (See Note 3.e).
As of December 31, 20162018 and 2015,2017, there are no significant intangible assets with an indefinite useful life.
F-78
The following table shows goodwill by the Cash-Generating Unit or group of Cash-Generating Units to which it belongs and changes as of December 31, 20162018 and 2015:2017:
Company | Cash Generating Unit | | Opening Balance
01-01-2015 | | Increase/ (Decrease) | | Closing Balance 12/31/2015 | | Increase/ (Decrease) | | Closing Balance 12/31/2016 | |
| | |
| | |
| | | | Opening Balance
01-01-2017 | | Increase/
(Decrease) | | Closing Balance
12/31/2017 | | Increase/
(Decrease) | | Foreign currency
exchange difference | | Closing Balance
12-31-2018 | |
Company | Cash Generating Unit | | ThCh$ | | | | ThCh$ | | ThCh$ | | ThCh$ | | Cash Generating Unit | | ThCh$ | | ThCh$ | | ThCh$ | | ThCh$ | | ThCh$ | | ThCh$ | |
| 2,240,478 | | - | | 2,240,478 | | - | | 2,240,478 | | Empresa Eléctrica de Colina Ltda. | | 2,240,478 | | — | | 2,240,478 | | — | | — | | 2,240,478 | |
| 4,656,105 | | - | | 4,656,105 | | (4,656,105) | | - | |
| 128,374,362 | | - | | 128,374,362 | | - | | 128,374,362 | | Enel Distribución Chile | | 128,374,362 | | — | | 128,374,362 | | — | | — | | 128,374,362 | |
Enel Generación Chile S.A. | Enel Generación Chile | | 731,782,459 | | - | | 731,782,459 | | - | | 731,782,459 | | Enel Generación Chile | | 731,782,459 | | — | | 731,782,459 | | — | | — | | 731,782,459 | |
GasAtacama Chile (1) | Enel Generación Chile | | 20,204,251 | | - | | 20,204,251 | | 4,656,105 | | 24,860,356 | |
GasAtacama Chile | | | Enel Generación Chile | | 24,860,356 | | — | | 24,860,356 | | — | | — | | 24,860,356 | |
Enel Chile S.A. | | | Empresa Eléctrica Panguipulli S.A | | — | | — | | — | | 17,543,347 | | 2,603,476 | | 20,146,823 | |
Enel Green power Chile Ltda. | | | Geotérmica del Norte | | — | | — | | — | | 65,871 | | 9,775 | | 75,646 | |
Enel Green power Chile Ltda. | | | Parque Eólico Talinay Oriente | | — | | — | | — | | 6,587,064 | | 977,537 | | 7,564,601 | |
| Total | | 887,257,655 | | - | | 887,257,655 | | - | | 887,257,655 | | Total | | 887,257,655 | | — | | 887,257,655 | | 24,196,282 | | 3,590,788 | | 915,044,725 | |
| (1)
| On November 1, 2016, Compañía Eléctrica Tarapacá S.A. was merged with GasAtacama S.A., being the latter the surviving company.
|
According to the Group management’s estimates and projections, the expected future cash flows projections attributable to the Cash-Generating Units or groups of Cash-Generating Units, to which the acquired goodwill has been allocated, allow recovery of its carrying amount as of December 31, 20162018 (See Note 3.e).
The origin of the goodwill is detailed below:
1.- Empresa Eléctrica de Colina Ltda.
On DecemberSeptember 30, 1996, Enel Distribución Chile S.A. acquired 100% of Empresa Eléctrica de Colina Ltda. from the investment company Saint Thomas S.A., which is neither directly nor indirectly related to Enel Distribución Chile S.A.
2.- Empresa Eléctrica Pangue S.A.
On July 12, 2002, Enel Generación Chile S.A. acquired 2.51% of the shares of Empresa Eléctrica Pangue S.A. through a put option held by the minority shareholder International Finance Corporation (IFC).
On May 2, 2012, Empresa Eléctrica Pangue S.A. merged with Compañía Eléctrica San Isidro S.A.; with the latter company being the surviving entity.
3.- Compañía Eléctrica San Isidro S.A.
On August 11, 2005, Enel Generación Chile S.A. acquired the shares of Inversiones Lo Venecia Ltda., whose only asset was a 25% interest in Compañía Eléctrica San Isidro S.A. (acquisition of non-controlling interests). On September 1, 2013, Compañía Eléctrica San Isidro S.A. was merged with Endesa Eco S.A., being the latter the surviving entity. On November 1, 2013, Endesa Eco S.A. was merged with Compañía Eléctrica Tarapacá, being the latter the surviving entity. Subsequently, on November 1, 2016, Compañía Eléctrica Tarapacá S.A. was merged with GasAtacama S.A., being the latter the surviving company.
4.-2.- Enel Distribución Chile S.A. (Formerly named Chilectra S.A.)
In November 2000, Enel Américas S.A. (formerly named Enersis Américas S.A.) acquired an additional 25.4% ownership interest in Enel Distribución Chile S.A. in a public bidding process, reaching a 99.99% ownership interest in the company.company.
5.- Endesa
3.- Enel Generación Chile S.A. (Formerly named Endesa Chile S.A.)
On May 11, 1999, Enel Américas S.A. (formerly named Enersis Américas) acquired an additional 35% in Enel Generación Chile S.A. in a public bidding process on the Santiago Stock Exchange and by buying shares in the U.S. (30% and 5%, respectively), reaching a 60% ownership interest in the generation company.
6.-
4.- GasAtacama Chile S.A. (Formerly named Inversiones GasAtacama Holding Limitada)
On April 22, 2014, Enel Generación Chile S.A. acquired the remaining 50% equity interest in GasAtacama Chile S.A that was owned at that time by Southern Cross Latin America Private Equity Fund III L.P.
5.- Empresa Eléctrica Pangue S.A. (Currently named GasAtacama Chile S.A.)
On July 12, 2002, Enel Generación Chile S.A. acquired 2.51% of the shares of Empresa Eléctrica Pangue S.A. through a put option held by the minority shareholder International Finance Corporation (IFC).
On May 2, 2012, Empresa Eléctrica Pangue S.A. merged with Compañía Eléctrica San Isidro S.A., with the latter company being the surviving entity.
6.- Compañía Eléctrica San Isidro S.A. (Currently named GasAtacama Chile S.A.)
On August 11, 2005, Enel Generación Chile S.A. acquired the shares of Inversiones Lo Venecia Ltda., whose only asset was a 25% interest in Compañía Eléctrica San Isidro S.A. (acquisition of non-controlling interests). On
F-79
15.
Table of Contents September 1, 2013, Compañía Eléctrica San Isidro S.A. was merged with Endesa Eco S.A., the latter being the surviving entity. On November 1, 2013, Endesa Eco S.A. was merged with Compañía Eléctrica Tarapacá, the latter being the surviving entity. Subsequently, on November 1, 2016, Compañía Eléctrica Tarapacá S.A. was merged with GasAtacama Chile S.A. with the latter being the surviving company. 7.- Enel Green Power Chile Ltda. On March 26, 2013, Enel Green Power Chile Ltda. acquired an ownership interest in Parque Eólico Talinay Oriente S.A.. On August 6, 2001, Enel Green Power Chile Ltda. acquired an ownership interest in Empresa Eléctrica Panguipulli S.A. and Empresa Eléctrica Puyehue S.A., which later merged with Panguipulli, with the latter being the legal surviving company. 18. PROPERTY, PLANT AND EQUIPMENT. | PROPERTY, PLANT AND EQUIPMENT.
|
The following table shows property, plant and equipment as of December 31, 20162018 and 2015:2017:
| | As of December 31, | |
| | 2018 | | 2017 | |
Classes of Property, Plant and Equipment, Net | | ThCh$ | | ThCh$ | |
Property, Plant and Equipment, Net | | 5,308,647,633 | | 3,585,687,137 | |
Construction in progress | | 862,274,093 | | 666,590,543 | |
Land | | 74,753,283 | | 67,485,380 | |
Buildings | | 384,027,047 | | 12,793,641 | |
Generation Plant and equipment | | 3,143,869,929 | | 2,080,903,064 | |
Network infrastructure | | 764,095,247 | | 683,120,815 | |
Fixtures and fittings | | 61,973,362 | | 56,284,762 | |
Other property, plant and equipment under financial lease | | 17,654,672 | | 18,508,932 | |
| | 2018 | | 2017 | |
Classes of Property, Plant and Equipment, Gross | | ThCh$ | | ThCh$ | |
Property, Plant and Equipment, Gross | | 8,747,182,818 | | 6,726,796,186 | |
Construction in progress | | 862,274,093 | | 666,590,543 | |
Land | | 74,753,283 | | 67,485,380 | |
Buildings | | 470,833,768 | | 28,382,234 | |
Generation Plant and equipment | | 5,824,130,347 | | 4,636,175,749 | |
Network infrastructure | | 1,318,208,218 | | 1,151,951,280 | |
Fixtures and fittings | | 168,223,078 | | 147,450,968 | |
Other property, plant and equipment under financial lease | | 28,760,031 | | 28,760,032 | |
Classes of Accumulated Depreciation and Impairment in Property, | | 2018 | | 2017 | |
Plant and Equipment | | ThCh$ | | ThCh$ | |
Total Accumulated Depreciation and Impairment in Property, Plant and Equipment | | (3,438,535,185 | ) | (3,141,109,049 | ) |
Buildings | | (86,806,721 | ) | (15,588,593 | ) |
Generation Plant and equipment | | (2,680,260,418 | ) | (2,555,272,685 | ) |
Network infrastructure | | (554,112,971 | ) | (468,830,465 | ) |
Fixtures and fittings | | (106,249,716 | ) | (91,166,206 | ) |
Other property, plant and equipment under financial lease | | (11,105,359 | ) | (10,251,100 | ) |
F-80
| | As of December 31, |
Classes of Property, Plant and Equipment, Net | | 2016 | | 2015 |
| ThCh$ | | ThCh$ |
| | | | |
Property, Plant and Equipment, Net | | 3,476,128,634 | | 3,429,167,797 |
Construction in progress | | 688,387,124 | | 622,058,677 |
Land | | 66,868,119 | | 72,344,242 |
Buildings | | 13,020,474 | | 13,557,151 |
Plant and equipment | | 2,647,164,028 | | 2,662,706,232 |
Fixtures and fittings | | 41,325,699 | | 38,284,047 |
Other property, plant and equipment under financial lease | | 19,363,190 | | 20,217,448 |
| | | | |
Classes of Property, Plant and Equipment, Gross | | 2016 | | 2015 |
| ThCh$ | | ThCh$ |
| | | | |
Property, Plant and Equipment, Gross | | 6,471,364,618 | | 6,322,959,570 |
Construction in progress | | 688,387,124 | | 622,058,677 |
Land | | 66,868,119 | | 72,344,242 |
Buildings | | 27,891,216 | | 27,388,999 |
Plant and equipment | | 5,531,913,583 | | 5,452,268,802 |
Fixtures and fittings | | 127,544,544 | | 120,138,818 |
Other property, plant and equipment under financial lease | | 28,760,032 | | 28,760,032 |
| | | | |
| | | | |
Classes of Accumulated Depreciation and Impairment in Property, Plant and Equipment | | 2016 | | 2015 |
| ThCh$ | | ThCh$ |
| | | | |
Total Accumulated Depreciation and Impairment in Property, Plant and Equipment | | (2,995,235,984) | | (2,893,791,773) |
Buildings | | (14,870,742) | | (13,831,848) |
Plant and equipment | | (2,884,749,555) | | (2,789,562,570) |
Fixtures and fittings | | (86,218,845) | | (81,854,771) |
Other property, plant and equipment under financial lease | | (9,396,842) | | (8,542,584) |
Table of Contents
The detail and changes in property, plant, and equipment at December 31, 20162018 and 2015,2017, are as follows:
Changes in 2016 | | Construction in progress | | Land | | Buildings | | Plant and Equipment | | Fixtures and Fittings | | Other Property, Plant and Equipment under Financial Lease | | Property, Plant and Equipment, Net | |
| | | | | |
| | | | | |
| ThCh$ | | ThCh$ | | ThCh$ | | ThCh$ | | ThCh$ | | ThCh$ | | ThCh$ | |
Opening balance January 1, 2016 | | 622,058,677 | | 72,344,242 | | 13,557,151 | | 2,662,706,232 | | 38,284,047 | | 20,217,448 | | 3,429,167,797 | |
| | | Construction
in progress | | Land | | Buildings | | Generation
Plant and
Equipment | | Network
infrastructure | | Fixtures and
Fittings | | Other Property,
Plant and
Equipment under
Financial Lease | | Property, Plant and
Equipment, Net | |
Changes in 2018 | | | ThCh$ | | ThCh$ | | ThCh$ | | ThCh$ | | ThCh$ | | ThCh$ | | ThCh$ | | ThCh$ | |
Opening balance January 1, 2018 | | | 666,590,543 | | 67,485,380 | | 12,793,641 | | 2,080,903,064 | | 683,120,815 | | 56,284,762 | | 18,508,932 | | 3,585,687,137 | |
Changes: | | | | | | | | | | | | | | | | | | | | | | | | | | | | | | |
Increases other than from business combinations | | 262,518,418 | | - | | 24,934 | | 1,443,508 | | 3,126,832 | | - | | 267,113,692 | | 321,183,398 | | 5,893,739 | | 1,000,411 | | 1,638,436 | | 2,455 | | 1,079,102 | | — | | 330,797,541 | |
Acquisitions through business combinations | | | 44,088,988 | | 623,052 | | 329,152,208 | | 941,871,560 | | 47,727,579 | | 2,018,760 | | 368,008 | | 1,365,850,155 | |
Increases (decreases) from exchange differences, net | | (186,893) | | (32,814) | | (59,699) | | (361,199) | | (153,858) | | - | | (794,463) | | 14,849,366 | | 50,004 | | 46,040,633 | | 128,411,179 | | 6,928,376 | | 1,320,949 | | 22,471 | | 197,622,978 | |
Depreciation (1) | | - | | - | | (745,000) | | (149,161,383) | | (5,065,979) | | (854,258) | | (155,826,620) | | — | | — | | (13,795,237 | ) | (149,266,709 | ) | (32,011,964 | ) | (7,040,907 | ) | (857,075 | ) | (202,971,892 | ) |
Impairment losses recognized in profit or loss (2) | | (30,785,531) | | - | | - | | - | | - | | - | | (30,785,531) | |
Increases (decreases) from transfers and other changes | | (131,287,250) | | (5,443,309) | | 243,088 | | 131,239,384 | | 5,248,087 | | - | | - | | (193,895,804 | ) | — | | 12,450,092 | | 146,447,942 | | 32,105,004 | | 2,914,698 | | (21,932 | ) | — | |
Increases (decreases) for transfers | | (131,287,250) | | (5,443,309) | | 243,088 | | 131,239,384 | | 5,248,087 | | - | | - | | (193,895,804 | ) | — | | 12,450,092 | | 146,447,942 | | 32,105,004 | | 2,914,698 | | (21,932 | ) | — | |
Increases (decreases) from transfers from constructions in progress | | (131,287,250) | | (5,443,309) | | 243,088 | | 131,239,384 | | 5,248,087 | | - | | - | |
Increases (decreases) from other changes | | - | | - | | - | | - | | - | | - | | - | |
Disposals and removals from service | | (33,930,297) | | - | | - | | (456,398) | | (113,430) | | - | | (34,500,125) | | — | | (5,411 | ) | — | | (90,513 | ) | (1,132,103 | ) | (1 | ) | — | | (1,228,028 | ) |
Disposals | | - | | - | | - | | - | | - | | - | | - | | — | | — | | — | | (90,513 | ) | (436,956 | ) | — | | — | | (527,469 | ) |
Removals from service | | (33,930,297) | | - | | - | | (456,398) | | (113,430) | | - | | (34,500,125) | | — | | (5,411 | ) | — | | — | | (695,147 | ) | (1 | ) | — | | (700,559 | ) |
Other increases (decreases) | | - | | - | | - | | 1,753,884 | | - | | - | | 1,753,884 | | 9,457,602 | | 706,519 | | (3,614,701 | ) | (7,957,859 | ) | 27,355,085 | | 5,395,999 | | (365,732 | ) | 30,976,913 | |
Argentina Hyperinflationary Effect | | | — | | — | | — | | 1,912,829 | | — | | — | | — | | 1,912,829 | |
Total changes | | 66,328,447 | | (5,476,123) | | (536,677) | | (15,542,204) | | 3,041,652 | | (854,258) | | 46,960,837 | | 195,683,550 | | 7,267,903 | | 371,233,406 | | 1,062,966,865 | | 80,974,432 | | 5,688,600 | | (854,260 | ) | 1,722,960,496 | |
Closing balance December 31, 2016 | | 688,387,124 | | 66,868,119 | | 13,020,474 | | 2,647,164,028 | | 41,325,699 | | 19,363,190 | | 3,476,128,634 | |
Closing balance December 31, 2018 | | | 862,274,093 | | 74,753,283 | | 384,027,047 | | 3,143,869,929 | | 764,095,247 | | 61,973,362 | | 17,654,672 | | 5,308,647,633 | |
| | Construction
in progress | | Land | | Buildings | | Generation
Plant and
Equipment | | Network
infrastructure | | Fixtures and
Fittings | | Other Property,
Plant and
Equipment under
Financial Lease | | Property, Plant and
Equipment, Net | |
Changes in 2017 | | ThCh$ | | ThCh$ | | ThCh$ | | ThCh$ | | ThCh$ | | ThCh$ | | ThCh$ | | ThCh$ | |
Opening balance January 1, 2017 | | 688,387,124 | | 66,868,119 | | 13,020,474 | | 2,033,720,809 | | 613,443,219 | | 41,325,699 | | 19,363,190 | | 3,476,128,634 | |
Changes: | | | | | | | | | | | | | | | | | |
Increases other than from business combinations | | 281,007,995 | | — | | — | | — | | — | | 2,811,255 | | — | | 283,819,250 | |
Increases (decreases) from exchange differences, net | | (101,444 | ) | (25,624 | ) | (44,699 | ) | (336,622 | ) | — | | (83,651 | ) | — | | (592,040 | ) |
Depreciation (1) | | — | | — | | (717,851 | ) | (107,292,353 | ) | (32,061,242 | ) | (4,947,361 | ) | (854,258 | ) | (145,873,065 | ) |
Increases (decreases) from transfers and other changes | | (273,509,759 | ) | 776,933 | | 439,284 | | 155,711,630 | | 99,419,024 | | 17,162,888 | | — | | — | |
Increases (decreases) from transfers from constructions in progress | | (273,509,759 | ) | 776,933 | | 439,284 | | 155,711,630 | | 99,419,024 | | 17,162,888 | | — | | — | |
Increases (decreases) from other changes | | — | | — | | — | | — | | — | | — | | — | | — | |
Disposals and removals from service | | (30,255,180 | ) | (31,447 | ) | (154,623 | ) | (1,704,924 | ) | (1,023,777 | ) | (22,280 | ) | — | | (33,192,231 | ) |
Disposals | | (5,099,800 | ) | (31,447 | ) | — | | (435,327 | ) | (18,555 | ) | — | | — | | (5,585,129 | ) |
Removals from service | | (25,155,380 | ) | — | | (154,623 | ) | (1,269,597 | ) | (1,005,222 | ) | (22,280 | ) | — | | (27,607,102 | ) |
Other increases (decreases) | | 1,061,807 | | (102,601 | ) | 251,056 | | 804,524 | | 3,343,591 | | 38,212 | | — | | 5,396,589 | |
Total changes | | (21,796,581 | ) | 617,261 | | (226,833 | ) | 47,182,255 | | 69,677,596 | | 14,959,063 | | (854,258 | ) | 109,558,503 | |
Closing balance December 31, 2017 | | 666,590,543 | | 67,485,380 | | 12,793,641 | | 2,080,903,064 | | 683,120,815 | | 56,284,762 | | 18,508,932 | | 3,585,687,137 | |
| (2)
| See Note 15.e).viii) and xi).
|
(1)See Note 31.
Changes in 2015 | | Construction in progress | | Land | | Buildings | | Plant and Equipment | | Fixtures and Fittings | | Other Property, Plant and Equipment under Financial Lease | | Property, Plant and Equipment, Net |
| | | | | | |
| | | | | | |
| ThCh$ | | ThCh$ | | ThCh$ | | ThCh$ | | ThCh$ | | ThCh$ | | ThCh$ |
Opening balance January 1, 2015 | | 526,367,579 | | 61,050,488 | | 10,149,650 | | 2,626,471,521 | | 38,649,832 | | 21,071,706 | | 3,283,760,776 |
Changes: | | | | | | | | | | | | | | |
Increases other than from business combinations | | 263,590,479 | | - | | - | | - | | 3,554,463 | | - | | 267,144,942 |
Increases (decreases) from exchange differences, net | | (370,570) | | (40,734) | | (74,215) | | 1,610,821 | | (628,647) | | - | | 496,655 |
Depreciation (1) | | - | | - | | (714,915) | | (140,774,709) | | (6,077,632) | | (854,258) | | (148,421,514) |
Impairment losses recognized in profit or loss | | (2,522,445) | | - | | - | | - | | - | | - | | (2,522,445) |
Reversals of impairment losses recognized in profit or loss (2) | | - | | - | | - | | 12,687,656 | | - | | - | | 12,687,656 |
Increases (decreases) from transfers and other changes | | (162,010,141) | | 12,014,081 | | 4,196,631 | | 167,198,022 | | 3,005,646 | | - | | 24,404,239 |
Increases (decreases) for transfers | | (170,862,689) | | 4,864,327 | | 851,988 | | 166,577,154 | | 1,773,900 | | (3,204,680) | | - |
Increases (decreases) from transfers from constructions in progress | | (170,862,689) | | 4,864,327 | | 851,988 | | 166,577,154 | | 1,773,900 | | (3,204,680) | | - |
Increases (decreases) from other changes (3) | | 8,852,548 | | 7,149,754 | | 3,344,643 | | 620,868 | | 1,231,746 | | 3,204,680 | | 24,404,239 |
Disposals and removals from service | | (2,996,225) | | (679,593) | | - | | (4,487,079) | | (219,615) | | - | | (8,382,512) |
Disposals | | - | | - | | - | | - | | - | | - | | - |
Removals from service | | (2,996,225) | | (679,593) | | - | | (4,487,079) | | (219,615) | | - | | (8,382,512) |
Other increases (decreases) | | - | | - | | - | | - | | - | | - | | - |
Total changes | | 95,691,098 | | 11,293,754 | | 3,407,501 | | 36,234,711 | | (365,785) | | (854,258) | | 145,407,021 |
Closing balance December 31, 2015 | | 622,058,677 | | 72,344,242 | | 13,557,151 | | 2,662,706,232 | | 38,284,047 | | 20,217,448 | | 3,429,167,797 |
| (3)
| Correspond mainly to increases in provision for decommissioning or restoration in the Bocamina II project (Endesa Chile) and San Isidro Power Plant (Celta).
|
Additional information on property, plant and equipment, net
a) Main investments | a)
| Main investments
|
Major additions to property, plant and equipment are investments in operating plants and new projects amounting to ThCh$267,113,692330,797,541 and ThCh$267,144,942 as of283,819,250 for the years ended December 31, 20162018 and 2015,2017, respectively. In the generation business the main investments include maintenanceadvances in the new capacity program are included such as the advances in the construction of the Los Cóndores Hydroelectric Plant, which will use the resources of the Maule Lagoon and will have an installed capacity of approximately 150 MW. Additions related to plants ofthis project amounted ThCh$189,259,095 and ThCh$204,350,080 as of142,578,993 for the year ended December 31, 2016 and 2015, respectively. In2018 (ThCh$102,515,924 for the year ended December 31, 2017), while in the distribution business, majorthe main investments are network extensions and investments in networks to optimize their operation, in order to improve the efficiency and quality of service amounting tolevel, for ThCh$76,355,399 and ThCh$62,794,862 as of84,727,900 for the year ended December 31, 20162018 (ThCh$79,028,802 for the year ended December 31, 2017). In the case of Grupo Enel Green Power Chile, the main projects correspond to Cerro Pabellón and 2015,Renaico, with investments of ThCh$1,709,473 (ThUS$2,463) and ThCh$322,993 (ThUS$465) for the year ended December 31, 2018, belonging to the subsidiaries Geotérmica del Norte S.A. and Enel Green Power del Sur SpA, respectively.
F-81
Table of Contents
b) Capitalized expenses
b.1) Borrowing costs
Capitalized borrowing costs were ThCh$3,001,211, ThCh$2,221,329,6,435,646 and ThCh$1,817,2834,078,463 for the years ended December 31, 2016, 20152018 and 2014,2017 respectively (See Note 31)34). The weighted average borrowing rate was in a range of 7.5%7.71% and 9%7.12% as of December 31, 2016 (9%2018 (7.12% and 7.95% as of December 31, 2015).2017)
b.2) Employee expenses capitalized
Employee expenses capitalized that are directly attributable to constructions in progress were ThCh$16,096,852,16,710,963, ThCh$21,004,05314,388,987 and ThCh$21,505,56816,096,852 during the years ended December 31, 2018,2017 and 2016, 2015, and 2014, respectively.
c) Finance leases | c)
| Finance leases
|
As of December 31, 20162018 and 2015,2017, property, plant and equipment includes ThCh$19,363,19017,654,672 and ThCh$20,217,448,18,508,932 respectively, in leased assets classified as finance leases.
The present value of future lease payments derived from these finance leases is as follows:
| | As of December 31, | |
| | 2016 | | 2015 | | As of December 31, | |
| | Gross | | Interest | | Present Value | | Gross | | Interest | | Present Value | | 2018 | | 2017 | |
| | ThCh$ | | ThCh$ | | ThCh$ | | ThCh$ | | ThCh$ | | ThCh$ | | Gross | | Interest | | Present Value | | Gross | | Interest | | Present Value | |
| | | | ThCh$ | | ThCh$ | | ThCh$ | | ThCh$ | | ThCh$ | | ThCh$ | |
Less than one year | | 2,677,881 | | 837,514 | | 1,840,367 | | 2,840,640 | | 1,007,567 | | 1,833,073 | | 2,779,080 | | 612,806 | | 2,166,274 | | 2,459,000 | | 659,212 | | 1,799,788 | |
From one to five years | | 10,711,519 | | 1,763,190 | | 8,948,329 | | 14,203,200 | | 2,758,773 | | 11,444,427 | | 13,284,596 | | 974,420 | | 12,310,176 | | 9,836,000 | | 1,244,808 | | 8,591,192 | |
More than five years | | 7,445,079 | | 484,128 | | 6,960,951 | | 7,897,586 | | 513,553 | | 7,384,033 | | — | | — | | — | | 4,377,544 | | 159,610 | | 4,217,934 | |
Total | | 20,834,479 | | 3,084,832 | | 17,749,647 | | 24,941,426 | | 4,279,893 | | 20,661,533 | | 16,063,676 | | 1,587,227 | | 14,476,450 | | 16,672,544 | | 2,063,630 | | 14,608,914 | |
Leased assets primarily relate to a lease agreement for Electric Transmission Lines and Installations (Ralco-Charrúa 2X220 KV) entered into between Enel Generación Chile S.A. and Transelec S.A. The lease agreement has a 20-year maturity and bears interest at an annual rate of 6.5%.
d)Operating leases | d)
| Operating leases
|
The consolidated statements of income for the years ended December 31, 2016, 20152018 and 20142017 include ThCh$3,250,503,4,494,358, ThCh$10,098,166 and ThCh$6,734,776,2,969,436 respectively, corresponding to operating lease contracts for material assets in operation.
As of December 31, 20162018 and 2015,2017, the total future lease payments under those contracts are as follows:
| | As of December 31, | |
| | 2016 | | 2015 | | As of December 31, | |
| | ThCh$ | | ThCh$ | | 2018 | | 2017 | |
| | | | | | ThCh$ | | ThCh$ | |
Less than one year | | 7,133,186 | | 6,462,373 | | 3,234,700 | | 1,975,728 | |
From one to five years | | 11,998,147 | | 15,168,177 | | 10,943,060 | | 6,954,425 | |
More than five years | | 9,015,356 | | 8,769,808 | | 33,237,374 | | 1,345,183 | |
Total | | 28,146,689 | | 30,400,358 | | 47,415,134 | | 10,275,337 | |
| (i)
| As of December 31, 2016 and 2015, the Group had contractual commitments for the acquisition of property, plant and equipment amounting to ThCh$416,684,117 and ThCh$297,847,453, respectively.
|
| (ii)
| As of December 31, 2016 and 2015, the Group does not have property, plant and equipment pledged as security for liabilities. The Company is co-debtor in relation to the domestic bonds of Enel Américas S.A., the outstanding amounts of the liability as of December 31, 2016 is ThCh$22,393,639.
|
| (iii)
| The Group and its consolidated entities have insurance policies for all risks, earthquake and machinery breakdown and damages for business interruption with a €1,000 million (ThCh$734,346,811) limit in the case of generating companies and a €50 million (ThCh$36,775,023) limit for distribution companies, including business interruption coverage. Additionally, the Group has Civil Liability insurance to meet claims from third parties with a €500 million (ThCh$367,750,231) limit. The insurance premiums associated with these policies are presented proportionally for each company in the caption “Prepaid expenses”.
|
| (iv)
| The condition of certain assets of our subsidiary Enel Generación Chile S.A. changed, primarily works and infrastructure for facilities built to support power generation in the SIC grid in 1998, due primarily to the installation in the SIC of new thermoelectric plants, the arrival of LNG, and new other projects. As such, a new supply configuration for the upcoming years, in which it is expected that these facilities will not be used. Therefore, in 2009, Enel Generación Chile S.A. recognized an impairment loss of ThCh$43,999,600 for these assets, which is still has not reversed.
|
| (v)
| On October 16, 2012, Enel Generación Chile S.A. began the collection process on all of the bank performance bonds guaranteeing compliance with the works and correct, timely execution of these works as specified in the agreement “Bocamina Thermal Plant Expansion Project”, contract ACP-003.06. This is a turnkey project for a 350 MW coal-fired thermal generation plant (“the contract”) signed on July 25, 2007 between Enel Generación Chile S.A. (“the owner”) and the consortium consisting of (i) the Chilean company Ingeniería y Construcción Tecnimont Chile y Compañía Limitada; (ii) the Italian company Tecnimont SpA; (iii) the Brazilian company Tecnimont do Brasil Construcao e Administracao de Projetos Ltda; (iv) the Slovakian company Slovenske Energeticke Strojarne a.s. (“SES”); and (v) the Chilean company Ingeniería y Construcción SES Chile Limitada; (all referred to collectively as “the Contractor” or “the Consortium”).
|
These performance bonds amounted to US$74,795,164.44 and UF 796,594.29 (approximately US$38,200,000).e)Other information
(i) As of December 31, 2012, US$93,992,5542018 and 2017, the Group had contractual commitments for the acquisition of these performance bonds was collected. Collection made on these bank performance bonds reducedproperty, plant and equipment amounting to ThCh$269,176,169 and ThCh$376,627,392, respectively.
(ii) As of December 31, 2018 and 2017, the capitalized cost overruns incurred by the company due to breachGroup does not have property, plant and equipment pledged as security for liabilities.
F-82
Table of contract.Contents
On October 17, 2012,
(iii) The Group and its consolidated entities have insurance policies for all risks, earthquake and machinery breakdown and damages for business interruption with a €1,000 million (ThCh$794,750,000) limit in the case of generating companies and a €50 million (ThCh$39,737,500) limit for distribution companies and a €1,000 million (ThCh$$794,750,000) limit for EGP Group, including business interruption coverage. Additionally, the Group has Civil Liability insurance to meet claims from third parties with a €500 million (ThCh$397,375,000) limit and environmental damages amounting to M€20 (ThCh$15,895,000). The insurance premiums associated with these policies are presented proportionally for each company in the caption “Prepaid expenses”.
(iv) The condition of certain assets of our subsidiary Enel Generación Chile S.A. filedchanged, primarily works and infrastructure for facilities built to support power generation in the SIC grid in 1998, due primarily to the installation in the SIC of new thermoelectric plants, the arrival of LNG, and new other projects. As such, a new supply configuration for the upcoming years, in which it is expected that these facilities will not be used. Therefore, in 2009, Enel Generación Chile S.A. recognized an arbitration request with the International Chamberimpairment loss of Arbitration of Paris in order to enforce the rights conferred upon it under the Contract. On December 29, 2014, Endesa’s Board of Directors accepted and approved an agreement with the Consortium that finalizes the arbitration process and grants full reciprocal settlement of the obligations. Consequently, as a result of final agreement reached atThCh$43,999,600 for these assets, which is still has not reversed.
(v) At the end of 2014, the Group recognized US$ 125 million (approximatelyan impairment loss of ThCh$75,843,750) as part12,581,947 related to the Punta Alcalde project. This impairment loss was triggered because the current definition of the acquisition costproject is not fully aligned with the strategy that the Company is reformulating; particularly, with regard to technological leadership, and to community and environmental sustainability. The Company has decided to suspend the project as its profitability is still unclear (see note 3.e).
(vi) As of property, plant and equipment. The paymentDecember 31, 2015, Enel Generación Chile recognized an impairment loss of these costs was made on April 6, 2015.
| (vi)
| At the end of 2012, our subsidiary Compañía Eléctrica Tarapacá S.A. (“Celta”, a company merged with GasAtacama Chile on November 1, 2016), recognized an impairment loss of ThCh$12,578,098, to adjust the carrying amount of certain specific assets operating in the SING grid to its recoverable amount.
|
At the closing of 2015, were approved certain regulatory developmentsThCh$2,522,445 related to the Chilean energy industry, which after being evaluatedwind project Waiwen. This loss was a result of new assessment of the feasibility of the project performed by the Company resultedand a conclusion that, under existing conditions to date, its profitability is uncertain.
(vii) In line with its sustainability strategy and in the identification of a new single CGU for all generation assets in Chile. The analysis took into account the fact thatorder to develop community relationships, Enel Generación Chile S.A. performed an optimization and management of all its assets relatedhas decided to its generation business, it had a centralized trade policy, with sales contracts agreed at company level and not assigned to power plants. Therefore, generation of cash flows depended on all the assets as a whole.
Previously, the company identified a CGUresearch new design alternatives for the assets operatingNeltume project, in particular regarding the issue of the discharge of Lake Neltume, which has been raised by the communities in the SIC grid and another one for the assets operating in the SING, under the consideration that there were two separate markets. The new scheme, approved in 2015, posed by the interconnectionvarious instances of SIC and SING, unifies markets and considers a single determination of prices, which was illustrated by latest bids for energy supply to regulated customers.dialogue.
Therefore, these new conditions indicated that the recognized impairment loss mentioned above has been reversed. This was based, inter alia, on the generation of additional value by the interconnection project between the SIC and SING which is expected to be operational in 2019, by improved utilization of reserves, by expanding the potential market for specific impaired assets and decreasing overall risk of the portfolio. The effects of the interconnection are considered in the five-year projections used by the company to perform impairment tests (see Note 3.e).
| (vii)
| At the end of 2014, Enel Generación Chile S.A. recognized an impairment loss of ThCh$12,581,947 related to the Punta Alcalde project. This impairment loss was triggered because the current definition of the project was not fully aligned with the strategy that the Company was reformulating, particularly, with regard to technological leadership, and to community and environmental sustainability. Enel Generación Chile S.A. has decided to suspend the project pending clarification of its profitability (see Note 3.e).
|
| (viii)
| In line with its sustainability strategy and in order to develop community relationships, Enel Generación Chile S.A. has decided to research new design alternatives for the Neltume project, in particular regarding the issue of the discharge of Lake Neltume, which has been raised by the communities in the various instances of dialogue.
|
To start a new phase of research of an alternative project, which includes the discharge of water on the Fuy River in late December 2015, the Company withdrew the Environmental Impact Study. This decision applies only to the portion of the Neltume project related to the power plant and not to portion related to the transmission project, which continues its course on handling in the Environmental Assessment Service.
As a result of the above, as of December 31, 2015, Enel Generación Chile S.A. recognized a loss of ThCh$2,706,830, associated with the write down of certain assets related to Environmental Impact Study, which has been withdrawn and to other studies directly linked to the old design of assets.
Consequently, in line with the new sustainability strategy and as a result of sustained dialog with the communities, Enel Generación Chile’s projects in the territory, namely Neltume and Choshuenco, have good prospects from a social community point of view. Nonetheless, given the current condition of the Chilean electricity market, expected profitability of the Neltume and Choshuenco projects is lower than the total capitalized investment in them. As a result, at the end of 2016, Enel Generación Chile recognized an impairment loss of ThCh$20,459,461 associated with the Neltume project and ThCh$3,748,124 associated with the Choshuenco project.
At the end of the fiscal year 2017, following an analysis during the last months, Enel Generación Chile determined to abandon the Neltume project; a decision justified mainly by the high-sustained competitiveness in the Chilean electricity market, which was ratified in November 2017 with the result of the last tender of Electric Distributors. Added to the above, there is the time associated with developing the alternative water discharge, considering a period of no less than 5 years, given the necessity to request and obtain a transfer of the current Water Right and commission a new study for environmental impact. The abandonment implied the recognition of a ThCh$21,975,641 loss, with the purpose of reducing to zero the net book value of the assets associated with the project.
F-83
| (ix)
| As of December 31, 2015, Enel Generación Chile recognized an impairment loss of ThCh$2,522,445 related to the wind project Waiwen. This loss was a result of new assessment of the feasibility of the project performed by the Company and a conclusion that, under existing conditions to date, its profitability is uncertain.
|
| (x)
| Table of Contents Additionally, the Company also decided to abandon the Choshuenco project, mainly because the strong synergies considered with the Neltume hydroelectric project would not exist anymore and make it not viable. This decision involved recognizing a loss of ThCh$3,130,270, with the purpose of reducing the net book value of the assets associated with the project to zero. (viii)On August 31, 2016, Enel Generación Chile decided to withdraw from the water rights associated with the hydroelectric projects Bardón, Chillan 1, Chillan 2, Futaleufú, Hechún and Puelo. This decision was made because of, among other evaluation aspects, the high annual maintenance cost of these unused water rights, lack of technical and economic feasibility |
| | and insufficient local communities support. As a result, the Group wrote off a total amount of ThCh$ 32,834,160 of property, plant and equipment and ThCh$ 2,549,926 of intangible assets, which represent 100% of the related costs previously capitalized (see Note 29).
|
| (xi)
| As of December 31, 2016, Enel Generación Chile recognized an impairment loss of ThCh$ 6,577,946 associated with certain Non-Conventional Renewable Energy (“NCRE”) initiatives, such as wind, mini-hydro, biomass and solar projects. These initiatives deal with collection of natural resources data (wind speed, solar radiation, etc.) as well as engineering studies enabling the Company to perform and support technical and economical assessments in order to visualize their perspectives and decide on future steps. The results of the studies have not been entirely satisfactory, mainly due to the current conditions in the Chilean electricity market, as future viability of the NCRE projects is uncertain. As a result, Enel Generación Chile recognized an impairment loss for 100% of the capitalized investments to date in NCRE projects.
|
On the other hand, the Enel Generación Chile decided to write-offwithdraw from the water rights associated with the hydroelectric projects Bardón, Chillan 1, Chillan 2, Futaleufú, Hechún and Puelo. This decision was made because of, among other evaluation aspects, the high annual maintenance cost of these unused water rights, lack of technical and economic feasibility and insufficient local communities support. As a result, the Group wrote off a total amount of ThCh$ 32,834,160 of property, plant and equipment and ThCh$ 2,549,926 of intangible assets, which represent 100% of the related costs previously capitalized.
(ix) As of December 31, 2016, Enel Generación Chile recognized an impairment loss of ThCh$ 6,577,946 associated with certain Non-Conventional Renewable Energy (“NCRE”) initiatives, such as wind, mini-hydro, biomass and solar projects. These initiatives deal with collection of natural resources data (wind speed, solar radiation, etc.) as well as engineering studies enabling the Company to perform and support technical and economical assessments in order to visualize their perspectives and decide on future steps. The results of the studies have not been entirely satisfactory, mainly due to the current conditions in the Chilean electricity market, as future viability of the NCRE projects is uncertain. As a result, Enel Generación Chile recognized an impairment loss for 100% of the capitalized investments to date in NCRE projects.
On the other hand, Enel Generación Chile decided to write off 100% of capitalized investment in two thermal projects that until now were held in its portfolio. These are the Tames 2 and Totoralillo projects, which were being developed within the framework of the public land concessions bidden by the National Heritage Ministry in 2013. The amount of the write-off was ThCh$ 1,096,137 and arose as a result of the current conditions in the Chilean electricity market, lack of future viability of this type of technology (steam-coal) and high development costs, which make these projects unfeasible. In addition, Enel Generación Chile recognized a provision of ThCh$ 2,245,0002,244,900 for the fines to be paid upon withdrawing from the concessions related to these projects. During fiscal year 2017, the Ministry of National Assets and Enel Generación Chile resolved to extinguish the onerous concessions by mutual agreement, and fines were not applied.
16.
19. INVESTMENT PROPERTY. | INVESTMENT PROPERTY.
|
The detail and changes in investment property during the years ended December 31, 20162018 and 2015,2017, are as follows:
| | Investment
Properties, Gross | | Accumulated
Depreciation,
Amortization and
Impairment | | Investment
Properties, Net | |
Investment Properties | | ThCh$ | | ThCh$ | | ThCh$ | |
Balance at January 1, 2017 | | 8,938,662 | | (810,140 | ) | 8,128,522 | |
Depreciation expense | | — | | (22,465 | ) | (22,465 | ) |
Other increases (decreases) | | 250,715 | | — | | 250,715 | |
Balance at December 31, 2017 | | 9,189,377 | | (832,605 | ) | 8,356,772 | |
Depreciation expense | | — | | (19,591 | ) | (19,591 | ) |
Impairment (*) | | — | | (779,825 | ) | (779,825 | ) |
Balance at December 31, 2018 | | 9,189,377 | | (1,632,021 | ) | 7,557,356 | |
Investment Properties | | Investment Properties, Gross | | Accumulated Depreciation, Amortization and Impairment | | Investment Properties, Net |
| | |
| ThCh$ | | ThCh$ | | ThCh$ |
Balance at January 1, 2015 | | 10,663,474 | | (2,148,912) | | 8,514,562 |
Disposals | | (1,724,812) | | 1,387,042 | | (337,770) |
Depreciation expense | | - | | (25,805) | | (25,805) |
Balance at December 31, 2015 | | 8,938,662 | | (787,675) | | 8,150,987 |
Depreciation expense | | - | | (22,465) | | (22,465) |
Balance at December 31, 2016 | | 8,938,662 | | (810,140) | | 8,128,522 |
(*) See Note 31.
The sale prices ofThere were no investment properties disposed of during the yearsperiods ended December 31, 2016, 20152018 and 2014 were ThCh$0, ThCh$1,800,933 and ThCh$9,363,249, respectively.2017.
F-84
Table of Contents
Fair value measurement and hierarchy
As of December 31, 2016,2018, the fair value of the Group’s investment properties was ThCh$11,567,7588,228,673 (ThCh$11,113,1079,758,782 as of December 31, 2015)2017) which was determined using independent appraisals.
The fair value measurement for these investment properties was categorized as Level 3 within the fair value hierarchy.
The following is the fair value hierarchy of investment properties:
|
| Fair value measured at the end of the reporting period using: |
|
|
| Level 1 |
| Level 2 |
| Level 3 |
|
| | ThCh$ | | ThCh$ | | ThCh$ | |
Investment properties | | — | | — | | 8,228,673 | |
See Note 3.h.
For the years ended December 31, 2016, 20152018, 2017 and 2014,2016, the detail of income and expenses from investment properties is as follows:
Income and expense from investment properties | | For the years ended December 31, | |
| 2016 | | 2015 | | 2014 | |
| | For the years ended December 31, | |
| | | 2018 | | 2017 | | 2016 | |
Income and expense from investment properties | | ThCh$ | | ThCh$ | | ThCh$ | | ThCh$ | | ThCh$ | | ThCh$ | |
| 167,429 | | 163,660 | | 263,643 | | 204,166 | | 192,719 | | 167,429 | |
| - | | 1,800,933 | | 9,363,249 | |
Direct operating expense from investment properties generating rental income | | (71,339) | | (163,767) | | (328,590) | | (56,327 | ) | (78,367 | ) | (71,339 | ) |
Direct operating expense from investment properties not generating rental income (*) | | - | | (337,770) | | (1,806,675) | |
Total | | 96,090 | | 1,463,056 | | 7,491,627 | | 147,839 | | 114,352 | | 96,090 | |
The Group has no repair, maintenance, acquisition, construction or development agreements that represent future obligations for the Group as of December 31, 2016 and 2015.2018.
The Group has insurance policies to cover operational risks of its investment properties, as well as to cover legal claims against the Group that could potentially arise from exercising its business activity. Management considers that the insurance policy coverage is sufficient against the risks involved.
17.
20. INCOME TAX AND DEFERRED TAXES. a) Income taxes | INCOME TAXES.
|
The following table presents the components of the income tax expense / (benefit) for the years ended December 31, 2016, 20152018, 2017 and 2014:2016:
| | For the years ended December 31, | | For the years ended December 31, | |
Current Income Tax and Adjustments to Current Income Tax for Previous Periods | | 2016 | | 2015 | | 2014 | |
| ThCh$ | | ThCh$ | | ThCh$ | |
| | | | |
Current Income Tax and Adjustments to Current Income Tax for Previous | | | 2018 | | 2017 | | 2016 | |
Periods | | | ThCh$ | | ThCh$ | | ThCh$ | |
Current income tax | | (162,033,295) | | (84,003,064) | | (75,830,800) | | (47,354,780 | ) | (162,820,181 | ) | (162,033,295 | ) |
Adjustments to current tax from the previous period | | (710,740) | | (7,307,511) | | (7,073,017) | | (6,304,285 | ) | (1,127,646 | ) | (710,740 | ) |
(Benefit) / expense for current income tax due to changes in tax rates or the introduction of new taxes | | - | | - | | (4,245,607) | |
Other current tax benefit / (expense) | | 21,380,071 | | (34,995,137) | | (3,302,112) | | (61,507,252 | ) | 15,934,106 | | 21,380,071 | |
Current tax expense, net | | (141,363,964) | | (126,305,712) | | (90,451,536) | | (115,166,317 | ) | (148,013,721 | ) | (141,363,964 | ) |
Benefit / (expense) from deferred taxes for origination and reversal of temporary differences | | 29,960,782 | | 16,693,113 | | 22,315,523 | | (43,134,500 | ) | 4,671,420 | | 29,960,782 | |
Benefit / (expense) from deferred taxes due to changes in tax rates or the introduction of new taxes | | - | | - | | (64,551,120) | |
Adjustments to deferred taxes from the previous period | | | 4,818,298 | | — | | — | |
Total deferred tax benefit / (expense) | | 29,960,782 | | 16,693,113 | | (42,235,597) | | (38,316,202 | ) | 4,671,420 | | 29,960,782 | |
Income tax expense | | (111,403,182) | | (109,612,599) | | (132,687,133) | | (153,482,519 | ) | (143,342,301 | ) | (111,403,182 | ) |
F-85
Table of Contents
The following table reconciles income taxes resulting from applying the local current tax rate to “Net income before taxes” and the actual income tax expense recorded in the accompanyingaccompany Consolidated Statement of Comprehensive Income for the years ended December 31, 2016, 20152018, 2017 and 2014:2016:
Reconciliation of Tax Expense | | Rate | | 12-31-2016 | | Rate | | 12-31-2015 | | Rate | | 12-31-2014 | |
| | ThCh$ | | ThCh$ | | ThCh$ | |
Reconciliation of Tax | | | | | 12-31-2018 | | | | 12-31-2017 | | | | 12-31-2016 | |
Expense | | | Rate | | ThCh$ | | Rate | | ThCh$ | | Rate | | ThCh$ | |
ACCOUNTING INCOME BEFORE TAX | | | 676,674,298 | | 456,580,763 | | | 332,246,550 | | | | 566,330,276 | | | | 666,760,212 | | | | 676,674,298 | |
Total tax income (expense) using statutory rate | | (24.00%) | | (162,401,830) | | (22.50%) | | (102,730,671) | | (21.00%) | | (69,771,775) | | (27.00 | )% | (152,909,175 | ) | (25.50 | )% | (170,023,854 | ) | (24.00 | )% | (162,401,830 | ) |
Tax effect of non-taxable revenues | | 6.53% | | 44,163,296 | | 2.12% | | 9,674,087 | | 4.43% | | 14,714,272 | |
Tax effect of rates applied in other countries | | | — | | — | | 0.05 | % | 328,968 | | | | | |
Tax effect of non-taxable operations | | | 0.31 | % | 1,746,052 | | 5.67 | % | 37,774,743 | | 6.53 | % | 44,163,296 | |
Tax effect of non-tax-deductible expenses | | (2.13%) | | (14,392,926) | | (4.61%) | | (21,060,811) | | (4.12%) | | (13,691,638) | | (2.26 | )% | (12,786,965 | ) | (3.11 | )% | (20,737,858 | ) | (2.13 | )% | (14,392,926 | ) |
Tax effect of changes in income tax rates (*) | | - | | - | | - | | - | | (20.71%) | | (68,796,727) | |
Tax effect of adjustments to taxes in previous periods | | (0.11%) | | (710,740) | | (1.60%) | | (7,307,511) | | (2.13%) | | (7,073,017) | | (1.11 | )% | (6,304,285 | ) | (0.17 | )% | (1,127,646 | ) | (0.11 | )% | (710,740 | ) |
Adjustments for prior periods deferred taxes | | | 0.85 | % | 4,818,298 | | — | | — | | — | | — | |
Price level restatement for tax purposes (investments and equity) | | (3.24%) | | 21,939,018 | | 2.58% | | 11,812,307 | | 3.59% | | 11,931,752 | | 2.11 | % | 11,953,556 | | 1.57 | % | 10,443,346 | | 3.24 | % | 21,939,018 | |
Total adjustments to tax expense using statutory rate | | 7.53% | | 50,998,648 | | (1.51%) | | (6,881,928) | | (18.94%) | | (62,915,358) | | (0.10 | )% | (573,344 | ) | 4.00 | % | 26,681,553 | | 7.53 | % | 50,998,648 | |
Income tax benefit (expense) | | (16.47%) | | (111,403,182) | | (24.01%) | | (109,612,599) | | (39.94%) | | (132,687,133) | | (27.10 | )% | (153,482,519 | ) | (21.50 | )% | (143,342,301 | ) | (16.47 | )% | (111,403,182 | ) |
The principal temporary differences are detailed in below.b) Deferred taxes
The origination and changes in deferred tax assets and liabilities as of December 31, 20162018 and 2015,2017, are as follows:
| | Deferred Tax Assets Relating To | | |
Deferred Tax Assets | | Accumulated depreciation | | Provisions | | Post-employment benefit obligations | | Tax loss carryforwards | | Other | | Deferred Tax Assets |
| ThCh$ | | ThCh$ | | ThCh$ | | ThCh$ | | ThCh$ | | ThCh$ |
Opening balance January 1, 2016 | | 4,982,473 | | 2,784,374 | | 401,076 | | 12,720,468 | | 1,503,948 | | 22,392,339 |
Increase (decrease) in profit or loss | | 487,371 | | 2,614,331 | | (962,948) | | (809,016) | | 134,913 | | 1,464,651 |
Increase (decrease) in other comprehensive income | | - | | - | | 1,792,845 | | - | | - | | 1,792,845 |
Foreign currency translation | | - | | - | | - | | - | | 12,645 | | 12,645 |
Transfers to (from) non-current assets and disposals group held for sale | | - | | 172,013 | | 357,597 | | - | | (184,462) | | 345,148 |
Other increases (decreases) (1) | | (281,458) | | (2,505,481) | | (796,051) | | (55) | | (628,066) | | (4,211,111) |
Closing balance December 31, 2016 | | 5,188,386 | | 3,065,237 | | 792,519 | | 11,911,397 | | 838,978 | | 21,796,517 |
| | | | | | | | | | | | |
| | Deferred Tax Assets Relating To | | |
Deferred Tax Assets | | Accumulated depreciation | | Provisions | | Post-employment benefit obligations | | Tax loss carryforwards | | Other | | Deferred Tax Assets |
| ThCh$ | | ThCh$ | | ThCh$ | | ThCh$ | | ThCh$ | | ThCh$ |
Opening balance January 1, 2015 | | 190,823 | | 5,798,306 | | 162,365 | | 4,851,839 | | 1,961,762 | | 12,965,095 |
Increase (decrease) in profit or loss | | 4,791,650 | | 7,205,222 | | (706,253) | | 7,868,629 | | 101,729 | | 19,260,977 |
Increase (decrease) in other comprehensive income | | - | | - | | 1,524,720 | | - | | - | | 1,524,720 |
Foreign currency translation | | - | | - | | - | | - | | - | | - |
Other increases (decreases) (1) | | - | | (10,219,154) | | (579,756) | | - | | (559,543) | | (11,358,453) |
Closing balance December 31, 2015 | | 4,982,473 | | 2,784,374 | | 401,076 | | 12,720,468 | | 1,503,948 | | 22,392,339 |
| | December 31, 2018 | | December 31, 2017 | |
| | Assets | | Liabilities | | Assets | | Liabilities | |
Deferred Tax Assets (Liabilities) | | ThCh$ | | ThCh$ | | ThCh$ | | ThCh$ | |
Accumulated depreciation | | 9,636,857 | | (359,613,258 | ) | 162,315 | | (263,847,598 | ) |
Post-employment benefit obligations | | 6,131,110 | | (421,462 | ) | 6,336,920 | | (364,925 | ) |
Tax loss carryforwards | | 36,921,157 | | — | | 9,536,102 | | — | |
Provisions | | 55,080,385 | | — | | 39,890,472 | | — | |
Dismantling Provision | | 23,627,264 | | — | | 17,411,395 | | — | |
Provision for Civil Contingencies | | 4,108,710 | | — | | 3,762,772 | | — | |
Provision Contingencies Workers | | 430,900 | | — | | 5,989 | | — | |
Provision for doubtful trade accounts | | 13,253,612 | | — | | 11,976,401 | | — | |
Provision of Human Resources accounts | | 7,432,939 | | — | | 6,497,206 | | — | |
Other Provisions | | 6,226,960 | | — | | 236,709 | | — | |
Other Deferred Taxes | | 14,277,897 | | (20,921,510 | ) | 49,635,500 | | (10,734,675 | ) |
Capitalization of financial expenses | | — | | (11,202,063 | ) | — | | (4,780,923 | ) |
Recoverable taxes | | — | | — | | 10,491,314 | | — | |
Investments accounted for using the equity method - Hidroaysen | | — | | — | | 30,938,736 | | — | |
Argentina Hyperinflationary Effect | | — | | (425,687 | ) | — | | — | |
Other Deferred Taxes | | 14,277,897 | | (9,293,760 | ) | 8,205,450 | | (5,953,752 | ) |
Deferred Tax Assets/Liabilities before compensation | | 122,047,406 | | (380,956,230 | ) | 105,561,309 | | (274,947,198 | ) |
Compensation of Assets (Liabilities) for deferred taxes | | (102,876,176 | ) | 102,876,176 | | (102,723,517 | ) | 102,723,517 | |
Deferred Tax Assets (Liabilities) after compensation | | 19,171,230 | | (278,080,054 | ) | 2,837,792 | | (172,223,681 | ) |
F-86
| | Deferred Tax Liabilities Relating to | | |
Deferred Tax Liabilities | | Accumulated depreciation | | Provisions | | Post-employment benefit obligation | | Other | | Deferred Tax Liabilities |
| ThCh$ | | ThCh$ | | ThCh$ | | ThCh$ | | ThCh$ |
Opening balance January 1, 2016 | | 234,023,374 | | 285,255 | | 679 | | 792,048 | | 235,101,356 |
Increase (decrease) in profit or loss | | (27,763,098) | | - | | 147,580 | | (880,613) | | (28,496,131) |
Increase (decrease) in other comprehensive income | | - | | - | | 5,847 | | (1,819) | | 4,028 |
Foreign currency translation | | (79,558) | | - | | - | | - | | (79,558) |
Other increases (decreases) (1) | | (10,945,785) | | - | | (153,655) | | 3,934,539 | | (7,164,901) |
Closing balance December 31, 2016 | | 195,234,933 | | 285,255 | | 451 | | 3,844,155 | | 199,364,794 |
| | | | | | | | | | |
| | | | | | | | | | |
| | Deferred Tax Liabilities Relating to | | |
Deferred Tax Liabilities | | Accumulated depreciation | | Provisions | | Post-employment benefit obligation | | Other | | Deferred Tax Liabilities |
| ThCh$ | | ThCh$ | | ThCh$ | | ThCh$ | | ThCh$ |
Opening balance January 1, 2015 | | 252,995,247 | | 379 | | 16,498 | | 2,210,542 | | 255,222,666 |
Increase (decrease) in profit or loss | | (6,487,557) | | 284,991 | | 431,306 | | 8,339,124 | | 2,567,864 |
Increase (decrease) in other comprehensive income | | - | | - | | 426 | | (200,133) | | (199,707) |
Foreign currency translation | | (113,895) | | - | | - | | - | | (113,895) |
Other increases (decreases) (1) | | (12,370,421) | | (115) | | (447,551) | | (9,557,485) | | (22,375,572) |
Closing balance December 31, 2015 | | 234,023,374 | | 285,255 | | 679 | | 792,048 | | 235,101,356 |
Table of Contents
| | | | | | | | Changes 2018 | | | | | | Opening balance
January 1, 2018 | | Effects first
application
IFRS 9 and
IAS 29 | | Net balance
restated as of
January 1,
2018 | | Increase
(decrease) in
profit or loss | | Increase (decrease)
in other
comprehensive
income | | Acquisitions
Through
Business
Combinations | | Foreign
currency translation | | Other
increases
(decreases) | | Closing balance
December 31, 2018 | | Deferred Tax Assets (Liabilities) | | ThCh$ | | ThCh$ | | ThCh$ | | ThCh$ | | ThCh$ | | ThCh$ | | ThCh$ | | ThCh$ | | ThCh$ | | Accumulated depreciation | | (263,685,283 | ) | — | | (263,685,283 | ) | (3,851,978 | ) | — | | (74,336,810 | ) | (10,342,994 | ) | 2,240,664 | | (349,976,401 | ) | Post-employment benefit obligations | | 5,971,995 | | — | | 5,971,995 | | (250,223 | ) | (10,228 | ) | — | | — | | (1,896 | ) | 5,709,648 | | Tax loss carryforwards | | 9,536,102 | | — | | 9,536,102 | | (3,278,563 | ) | | | 32,058,724 | | 2,831,404 | | (4,226,510 | ) | 36,921,157 | | Provisions | | 39,890,472 | | 1,261,836 | | 41,152,308 | | 4,032,271 | | — | | 5,183,782 | | 973,961 | | 3,738,063 | | 55,080,385 | | Dismantling Provision | | 17,411,395 | | — | | 17,411,395 | | 4,442,928 | | — | | 1,707,519 | | 59,520 | | 5,902 | | 23,627,264 | | Provision for Civil Contingencies | | 3,762,772 | | — | | 3,762,772 | | 306,893 | | — | | — | | 39,045 | | — | | 4,108,710 | | Provision Contingencies Workers | | 5,989 | | — | | 5,989 | | 333,704 | | — | | 8,016 | | 83,191 | | — | | 430,900 | | Provision for doubtful trade accounts | | 11,976,401 | | 1,261,836 | | 13,238,237 | | 13,646 | | — | | 3,434 | | 989 | | (2,694 | ) | 13,253,612 | | Provision of Human Resources accounts | | 6,497,206 | | — | | 6,497,206 | | 178,162 | | — | | 70,795 | | 686,776 | | — | | 7,432,939 | | Other Provisions | | 236,709 | | | | 236,709 | | (1,243,062 | ) | — | | 3,394,018 | | 104,440 | | 3,734,855 | | 6,226,960 | | Other Deferred Taxes | | 38,900,825 | | (213,442 | ) | 38,687,383 | | (34,967,709 | ) | 111 | | — | | — | | (10,363,398 | ) | (6,643,613 | ) | Capitalization of financial expenses | | (4,780,923 | ) | — | | (4,780,923 | ) | (6,421,139 | ) | — | | — | | — | | — | | (11,202,062 | ) | Investments accounted for using the equity method - Hidroaysen | | 10,491,314 | | — | | 10,491,314 | | — | | — | | — | | — | | (10,491,314 | ) | — | | Recoverable taxes | | 30,938,736 | | — | | 30,938,736 | | (30,938,736 | ) | — | | — | | — | | — | | — | | Argentina Hyperinflation Effect | | — | | (213,442 | ) | (213,442 | ) | (212,245 | ) | — | | — | | — | | — | | (425,687 | ) | Other Deferred Taxes | | 2,251,698 | | — | | 2,251,698 | | 2,604,411 | | 111 | | — | | — | | 127,916 | | 4,984,136 | | Deferred Tax Assets (Liabilities) | | (169,385,889 | ) | 1,048,394 | | (168,337,495 | ) | (38,316,202 | ) | (10,117 | ) | (37,094,304 | ) | (6,537,629 | ) | (8,613,077 | ) | (258,908,824 | ) |
| | | | Changes 2017 | | | | | | Opening balance
January 1, 2017 | | Increase (decrease) in
profit or loss | | Increase (decrease) in
other
comprehensive income | | Acquisitions
Through Business
Combinations | | Foreign
currency
translation | | Other increases
(decreases) | | Closing balance
December 31, 2017 | | Deferred Tax Assets (Liabilities) | | ThCh$ | | ThCh$ | | ThCh$ | | ThCh$ | | ThCh$ | | ThCh$ | | ThCh$ | | Accumulated depreciation | | (240,908,311 | ) | (22,836,691 | ) | — | | — | | 61,222 | | (1,503 | ) | (263,685,283 | ) | Post-employment benefit obligations | | 6,215,828 | | 976,808 | | (463,556 | ) | — | | — | | (757,085 | ) | 5,971,995 | | Tax loss carryforwards | | 11,911,396 | | (2,375,294 | ) | — | | — | | — | | — | | 9,536,102 | | Provisions | | 36,443,610 | | 2,940,867 | | — | | — | | — | | 505,995 | | 39,890,472 | | Dismantling Provision | | 15,605,650 | | 1,805,745 | | — | | — | | — | | — | | 17,411,395 | | Provision for Civil Contingencies | | 1,433,216 | | 2,329,556 | | — | | — | | — | | — | | 3,762,772 | | Provision Contingencies Workers | | — | | 5,989 | | — | | — | | — | | — | | 5,989 | | Provision for doubtful trade accounts | | 10,812,893 | | 1,163,508 | | — | | — | | — | | — | | 11,976,401 | | Provision of Human Resources accounts | | 6,675,436 | | (81,698 | ) | — | | — | | — | | (96,532 | ) | 6,497,206 | | Other Provisions | | 1,916,415 | | (2,282,233 | ) | — | | — | | — | | 602,527 | | 236,709 | | Other Deferred Taxes | | 8,769,200 | | 25,965,730 | | (497 | ) | — | | (28,356 | ) | 4,194,748 | | 38,900,825 | | Capitalization of financial expenses | | (5,101,367 | ) | 320,444 | | — | | — | | — | | — | | (4,780,923 | ) | Recoverable taxes | | 10,295,696 | | — | | — | | — | | — | | 195,618 | | 10,491,314 | | Investments accounted for using the equity method - Hidroaysen | | — | | 30,938,736 | | — | | — | | — | | — | | 30,938,736 | | Other Deferred Taxes | | 3,574,871 | | (5,293,450 | ) | (497 | ) | — | | (28,356 | ) | 3,999,130 | | 2,251,698 | | Deferred Tax Assets (Liabilities) | | (177,568,277 | ) | 4,671,420 | | (464,053 | ) | — | | 32,866 | | 3,942,155 | | (169,385,889 | ) |
| (1)
| Corresponds mainly to the offset of deferred tax assets and deferred tax liabilities.
|
Recovery of deferred tax assets will depend on whether sufficient tax profits will be obtained in the future. The Group believes that the future profit projections for its subsidiaries will allow these assets to be recovered.
c) As of December 31, 2018 and 2017, the Group has not recognized deferred tax assets related to tax losses in the amount of ThCh $ 3,930,370 (ThCh $ 0 as of December 31, 2017) (See Note 3.p). | a.
| As of December 31, 2016 and 2015, the Group does not have unrecognized deferred tax assets related to tax loss carryforwards. See Note 3.o.
|
The Group has not recognized deferred tax liabilities for taxable temporary differences associated with investments in subsidiaries and joint ventures, as it is able to control the timing of the reversal of the temporary differences and considers that it is probable that such temporary differences will not reverse in the foreseeable future. As of December 31, 20162018 and 2015,2017, the aggregate of taxable temporary differences associated with investments in subsidiaries and joint ventures for which deferred tax liabilities have not been recognized totaled ThCh$1,145,437,791896,532,229 and ThCh$855,628,553,1,143,608,396, respectively. Additionally, the Group has not recognized deferred tax asset for deductible temporary differences which as of December 31, 20162018 and 2015,2017, totaled ThCh$399,626,044744,768,294 and ThCh$463,809,815,257,883,751, respectively, as it is not probable that sufficient future taxable profits exist to recover such temporary differences.
The Group entities are potentially subject to income tax audits by the Chilean tax regulator and are limited to three tax years after which tax audits over those years can no longer be performed. Tax audits by nature are often complex and can require several years to complete. The tax years potentially subject to examination are 20122016 through 2015.2018.
The Company came into legal existence
Enel Chile was incorporated on March 1, 2016, therefore, it does not have prior periodsthe tax years potentially subject to income tax audits. Nonetheless, as a result ofaudit are the Spin-Off, it is liable for any probable tax contingencies for the open tax audit periods at the investments it received as part of the Spin-Off.years 2016 to 2018.
Given the range of possible interpretations of tax standards, the results of any future inspections carried out by Chilean tax authority for the years subject to audit can give rise to tax liabilities that cannot currently be quantified objectively. Nevertheless, management estimates that the liabilities, if any, that may arise from such tax audits, would not significantly impact the Group’s future results.
F-87
Table of Contents
The effects of deferred tax on the components of other comprehensive income for the years ended December 31, 2016, 20152018 and 2014,2017, are as follows:
| | For the years ended December 31, | | For the years ended December 31, | |
Effects of Deferred Tax on the Components of Other Comprehensive Income | | 2016 | | 2015 | | 2014 | |
| Amount Before Tax | | Income Tax Expense (Benefit) | | Amount After Tax | | Amount Before Tax | | Income Tax Expense (Benefit) | | Amount After Tax | | Amount Before Tax | | Income Tax Expense (Benefit) | | Amount After Tax | |
| ThCh$ | | ThCh$ | | ThCh$ | | ThCh$ | | ThCh$ | | ThCh$ | | ThCh$ | | ThCh$ | | ThCh$ | |
| | | 2018 | | 2017 | | 2016 | |
Effects of Deferred Tax on the
Components of | | | Amount Before
Tax | | Income Tax
Expense
(Benefit) | | Amount After
Tax | | Amount Before
Tax | | Income Tax
Expense
(Benefit) | | Amount After
Tax | | Amount
Before
Tax | | Income Tax
Expense
(Benefit) | | Amount After
Tax | |
Other Comprehensive Income | | | ThCh$ | | ThCh$ | | ThCh$ | | ThCh$ | | ThCh$ | | ThCh$ | | ThCh$ | | ThCh$ | | ThCh$ | |
Available-for-sale financial assets | | (6,740) | | 1,820 | | (4,920) | | 1,077 | | (290) | | 787 | | 1,849 | | (1,462) | | 387 | | (411 | ) | 111 | | (300 | ) | 1,840 | | (497 | ) | 1,343 | | (6,740 | ) | 1,820 | | (4,920 | ) |
Cash flow hedge | | 89,068,357 | | (21,116,232) | | 67,952,125 | | (122,593,576) | | 31,868,299 | | (90,725,277) | | (131,355,881) | | 31,585,153 | | (99,770,728) | | (221,906,855 | ) | 60,650,786 | | (161,256,069 | ) | 97,558,961 | | (25,701,599 | ) | 71,857,362 | | 89,068,357 | | (21,116,232 | ) | 67,952,125 | |
Share of other comprehensive income from associates and joint ventures accounted for using the equity method | | (11,691,075) | | - | | (11,691,075) | | (577,862) | | - | | (577,862) | | 13,476,871 | | - | | 13,476,871 | | | | — | | — | | (1,490 | ) | — | | (1,490 | ) | (11,691,509 | ) | — | | (11,691,075 | ) |
Foreign currency translation | | (3,532,844) | | - | | (3,532,844) | | 162,373 | | - | | 162,373 | | 12,473,950 | | - | | 12,473,950 | | 107,492,316 | | — | | 107,492,316 | | (3,686,549 | ) | — | | (3,686,549 | ) | (3,532,410 | ) | — | | (3,532,844 | ) |
Actuarial gains(losses) on defined-benefit pension plans | | (6,618,514) | | 1,786,999 | | (4,831,515) | | (5,645,532) | | 1,325,242 | | (4,320,290) | | (12,692,856) | | 4,527,209 | | (8,165,647) | | 37,881 | | (10,228 | ) | 27,653 | | 1,716,875 | | (463,556 | ) | 1,253,319 | | (6,618,514 | ) | 1,786,999 | | (4,831,515 | ) |
Income tax related to components of other comprehensive income | | 67,219,184 | | (19,327,413) | | 47,891,771 | | (128,653,520) | | 33,193,251 | | (95,460,269) | | (118,096,067) | | 36,110,900 | | (81,985,167) | | (114,377,069 | ) | 60,640,669 | | (53,736,400 | ) | 95,589,637 | | (26,165,652 | ) | 69,423,985 | | 67,219,184 | | (19,327,413 | ) | 47,891,771 | |
The movements infollowing table is a reconciliation of the movement of deferred taxes forbetween the components ofbalance sheet and income taxes in other comprehensive income for the years endedas of December 31, 2016, 20152018 and 2014, are as follows:2017.
Reconciliation of changes in deferred taxes of components of other comprehensive income | | For the years ended December 31, | |
| 2016 | | 2015 | | 2014 | |
| ThCh$ | | ThCh$ | | ThCh$ | |
| | | For the years ended December 31, | |
Reconciliation of changes in deferred taxes of components of | | | 2018 | | 2017 | | 2016 | |
other comprehensive income | | | ThCh$ | | ThCh$ | | ThCh$ | |
Total increases (decreases) for deferred taxes of other comprehensive income from continuing operations | | 1,788,821 | | 1,724,427 | | 3,951,968 | | (10,117 | ) | (464,053 | ) | 1,788,821 | |
Income tax of changes in cash flow hedge transactions | | (21,116,234) | | 31,468,824 | | 32,158,932 | | 60,650,786 | | (25,701,599 | ) | (21,116,234 | ) |
Total income tax relating to components of other comprehensive income | | (19,327,413) | | 33,193,251 | | 36,110,900 | | 60,640,669 | | (26,165,652 | ) | (19,327,413 | ) |
a) In Chile, Law No. 20,780 was published in the Official Gazette on September 29, 2014. It changes the income tax system and other taxes, by replacing the current tax system in 2017 with two alternative tax systems: the attributed income system and partially integrated system. | b.
| In Chile, Law No. 20,780 was published in the Official Gazette on September 29, 2014. It changes the income tax system and other taxes, by replacing the current tax system in 2017 with two alternative tax systems: the attributed income system and partially integrated system.
|
This Lawlaw gradually increases the rate of income tax on corporate income. Thus, it will increaseincreased to 21% in 2014, to 22.5% in 2015 and to 24% in 2016. As fromFrom 2017 taxpayers choosing the attributed income system will beare subject to a rate of 25%, while companies choosing the partially integrated system will beare subject to a rate of 25.5% in 2017 and 27% in 2018.
Furthermore, this Law establishes
The law also states that corporations will automatically be subject to the partially integrated system will apply by default to open stock companies, unless a future Extraordinary Shareholders’ Meeting agrees to adoptselect the attributed income system.
The Group assumes that, since an Extraordinary Shareholders’ Meeting has not agreed to adopt
Law No. 20,899 was published on February 8, 2016, simplifying the alternative system, theincome tax system. This law among its main modifications imposed a partially integrated system applies by default. Therefore, changes in deferred tax assets and liabilities as a direct effect ofmandatory for corporations, cancelling the increase in the corporatepreviously available attributed income tax rate have been recognized in profit or loss. Specifically, for the year ended December 31, 2014, the net charge against income was a loss of ThCh$66,669,816.system option.
F-88
18.
| OTHER FINANCIAL LIABILITIES.
|
The balances of other financial liabilities as of December 31, 20162018 and 2015,2017, are as follows:
| | | As of December 31, | |
| | | 2018 | | 2017 | |
| As of December 31, | | Current | | Non-current | | Current | | Non-current | |
Other financial liabilities | 2016 | | 2015 | | ThCh$ | | ThCh$ | | ThCh$ | | ThCh$ | |
Current | | Non-current | | Current | | Non-current | |
ThCh$ | | ThCh$ | | ThCh | | ThCh$ | |
| | | | | | | | |
Interest –bearing borrowings | 18,013,114 | | 802,046,968 | | 18,446,637 | | 826,380,628 | |
Interest —bearing borrowings | | | 329,262,093 | | 1,703,044,158 | | 17,255,692 | | 760,932,929 | |
Hedging derivatives (*) | 313,571 | | 48,981,953 | | 328,414 | | 78,768,620 | | 81,195,765 | | 2,629,715 | | 304,278 | | 21,045,216 | |
Non-hedging derivatives (**) | 7,369,481 | | 2,987,830 | | 9,146,674 | | 12,048,542 | | 207,957 | | 159,630 | | 1,255,478 | | — | |
Total | 25,696,166 | | 854,016,751 | | 27,921,725 | | 917,197,790 | | 410,665,815 | | 1,705,833,503 | | 18,815,448 | | 781,978,145 | |
18.1(*) See Note 23.2.a
(**) See Note 23.2.b
21.1 Interest-bearing borrowings
The detail of current and non-current interest-bearing borrowings as of December 31, 20162018 and 2015,2017, is as follows:
| | As of December 31, | |
| | 2018 | | 2017 | |
| | Current | | Non-current | | Current | | Non-current | |
Classes of Interest-bearing borrowings | | ThCh$ | | ThCh$ | | ThCh$ | | ThCh$ | |
Bank loans | | 283,527,689 | | 229,020,029 | | 122 | | — | |
Unsecured obligations | | 43,568,129 | | 1,461,713,954 | | 15,455,782 | | 748,123,803 | |
Financial leases | | 2,166,275 | | 12,310,175 | | 1,799,788 | | 12,809,126 | |
Total | | 329,262,093 | | 1,703,044,158 | | 17,255,692 | | 760,932,929 | |
F-89
Classes of Interest-bearing borrowings | | As of December 31, |
| 2016 | | 2015 |
| Current | | Non-current | | Current | | Non-current |
| ThCh$ | | ThCh$ | | ThCh$ | | ThCh$ |
Bank loans | | 4,274 | | - | | 218 | | - |
Unsecured obligations | | 16,168,473 | | 786,137,688 | | 16,613,346 | | 807,552,168 |
Financial leases | | 1,840,367 | | 15,909,280 | | 1,833,073 | | 18,828,460 |
Total | | 18,013,114 | | 802,046,968 | | 18,446,637 | | 826,380,628 |
Table of Contents
Bank loans by currency and contractual maturity as of December 31, 20162018 and 2015,2017, are as follows:
Summary of bank loans by currency and maturity
Country | | Currency | | Nominal Interest Rate | | Secured/ Unsecured | | Current | | Non-current | |
| | Maturity | | Total Current 12/31/2016 | | Maturity | | Total Non-Current 12/31/2016 | |
| | One to three months | | Three to twelve months | | One to two years | | Two to three years | | Three to four years | | Four to five years | | Over five years | | |
| | ThCh$ | | ThCh$ | | ThCh$ | | ThCh$ | | ThCh$ | | ThCh$ | | ThCh$ | | ThCh$ | | ThCh$ | |
Chile | | US$ | | 6.00% | | Unsecured | | 4,274 | | - | | 4,274 | | - | | - | | - | | - | | - | | - | |
| | | | | | | | | | | Current | | Non-current | |
| | Total | | 4,274 | | - | | 4,274 | | - | | - | | - | | - | | - | | - | | | | | | | | | | Maturity | | | | Maturity | | Total Non- | |
| | | | | | | Effective
Interest | | Nominal
Interest | | Secured / | | One to three
months | | Three to twelve
months | | Total Current
12/31/2018 | | One to two
years | | Two to three
years | | Three to four
years | | Four to five
years | | Over five years | | Current
12-31-2018 | |
Country | | Currency | | Nominal Interest Rate | | Secured/ Unsecured | | Current | | Non-current | | Currency | | Rate | | Rate | | Unsecured | | ThCh$ | | ThCh$ | | ThCh$ | | ThCh$ | | ThCh$ | | ThCh$ | | ThCh$ | | ThCh$ | | ThCh$ | |
| | | Maturity | | Total Current 12/31/2015 | | Maturity | | Total Non-Current 12/31/2015 | |
| | | One to three months | | Three to twelve months | | One to two years | | Two to three years | | Three to four years | | Four to five years | | Over five years | | |
| | | ThCh$ | | ThCh$ | | ThCh$ | | ThCh$ | | ThCh$ | | ThCh$ | | ThCh$ | | ThCh$ | | ThCh$ | |
Chile | | | US$ | | 3.51 | % | 3.51 | % | Unsecured | | 1,350,861 | | 69,439,914 | | 70,790,775 | | — | | 104,100,014 | | 124,920,015 | | — | | — | | 229,020,029 | |
Chile | | US$ | | 5.98 % | | Unsecured | | 218 | | - | | 218 | | - | | - | | - | | - | | - | | - | | Ch$ | | 4.71 | % | 4.30 | % | Unsecured | | 6 | | 212,736,908 | | 212,736,914 | | — | | — | | — | | | | | | — | |
| | Total | | 218 | | - | | 218 | | - | | - | | - | | - | | - | | - | | | | | | | | Total | | 1,350,867 | | 282,176,822 | | 283,527,689 | | — | | 104,100,014 | | 124,920,015 | | — | | — | | 229,020,029 | |
| | | | | | | | | | Current | | Non-current | |
| | | | | | | | | | Maturity | | | | Maturity | | Total Non- | |
| | | | Effective
Interest | | Nominal
Interest | | Secured / | | One to three
months | | Three to twelve
months | | Total Current
12/31/2017 | | One to two
years | | Two to three
years | | Three to four
years | | Four to five
years | | Over five years | | Current
12-31-2017 | |
Country | | Currency | | Rate | | Rate | | Unsecured | | ThCh$ | | ThCh$ | | ThCh$ | | ThCh$ | | ThCh$ | | ThCh$ | | ThCh$ | | ThCh$ | | ThCh$ | |
Chile | | Ch$ | | 6.00 | % | 6.00 | % | Unsecured | | 122 | | — | | 122 | | — | | — | | — | | — | | — | | — | |
| | | | | | | | Total | | 122 | | — | | 122 | | — | | — | | — | | — | | — | | — | |
Fair value measurement and hierarchy
The fair value of current and non-current bank borrowings as of December 31, 20162018 and 2015,2017 totaled ThCh$0509,822,541 and ThCh$218,122, respectively. The fair value measurement of borrowings has been categorized as Level 2 (see Note 3.h).
Identification of bank borrowings by company
Appendix No.4, letter a), presents details of estimated future cash flows (undiscounted) that the Group will have to disburse to settle the bank loans detailed above.
| | | | | | | | | | | | | | | | | | | | December 31, 2016 |
| | | | | | | | | | | | | | | | | | | | Current | | Non-current |
Taxpayer ID Number | | Company | | Country | | Taxpayer ID Number | | Financial Institution | | Country | | Currency | | Effective Interest Rate | | Nominal Interest Rate | | Amortization | | Less than 90 days | | More than 90 days | | Total Current | | One to two years | | Two to three years | | Three to four years | | Four to five years | | More than five years | | Total Non-Current |
| | | | | | | | | | ThCh$ | | ThCh$ | | ThCh$ | | ThCh$ | | ThCh$ | | ThCh$ | | ThCh$ | | ThCh$ | | ThCh$ |
96.800.570-7 | Enel Distribución Chile S.A. | | Chile | | 97.006.000-6 | | Banco de Crédito e Inversiones | | Chile | | Ch$ | | 6.00 % | | 6.00 % | | At maturity | | 102 | | - | | 102 | | - | | - | | - | | - | | - | | - |
91.081.000-6 | | Enel Generación Chile S.A. | | Chile | | 97.006.000-6 | | Banco de Crédito e Inversiones | | Chile | | Ch$ | | 6.00 % | | 6.00 % | | At maturity | | 2,037 | | - | | 2,037 | | - | | - | | - | | - | | - | | - |
91.081.000-6 | | Enel Generación Chile S.A. | | Chile | | 97.036.000-K | | Banco Santander | | Chile | | Ch$ | | 6.00 % | | 6.00 % | | At maturity | | 2,135 | | - | | 2,135 | | - | | - | | - | | - | | - | | - |
| | | | | | | | | | | | | | | | | | Total | | 4,274 | | - | | 4,274 | | - | | - | | - | | - | | - | | - |
| | | | | | | | | | | | | | | | | | | | | | | | | | | | | | | | | | | | |
| | | | | | | | | | | | | | | | | | | | December 31, 2015 |
| | | | | | | | | | | | | | | | | | | | Current | | Non-current |
Taxpayer ID Number | | Company | | Country | | Taxpayer ID Number | | Financial Institution | | Country | | Currency | | Effective Interest Rate | | Nominal Interest Rate | | Amortization | | Less than 90 days | | More than 90 days | | Total Current | | One to two years | | Two to three years | | Three to four years | | Four to five years | | More than five years | | Total Non-Current |
| | | | | | | | | | ThCh$ | | ThCh$ | | ThCh$ | | ThCh$ | | ThCh$ | | ThCh$ | | ThCh$ | | ThCh$ | | ThCh$ |
96.800.570-7 | Enel Distribución Chile S.A. | | Chile | | 97.004.000-5 | | Lines of Credit | | Chile | | Ch$ | | 6.00 % | | 6.00 % | | Other | | 96 | | - | | 96 | | - | | - | | - | | - | | - | | - |
91.081.000-6 | | Enel Generación Chile S.A. | | Chile | | 97.004.000-5 | | Banco Santander | | Chile | | Ch$ | | 6.00% | | 6.00% | | Monthly | | 58 | | - | | 58 | | - | | - | | - | | - | | - | | - |
94.271.000-3 | | Enel Américas S.A. | | Chile | | 97.004.000-5 | | Banco Santander | | Chile | | Ch$ | | 4.50 % | | 4.50 % | | At maturity | | 64 | | - | | 64 | | - | | - | | - | | - | | - | | - |
| | | | | | | | | | | | | | | | | | Total | | 218 | | - | | 218 | | - | | - | | - | | - | | - | | - |
F-90
Table of Contents
| | | | | | | | | | | | | | | | | | | | December 31, 2018 | |
| | | | | | | | | | | | | | | | | | | | Current | | Non-current | |
Taxpayer ID | | | | | | Taxpayer ID | | | | | | | | Effective
Interest | | Nominal
Interest | | | | Less than
90 days | | More
than 90
days | | Total
Current | | One to
two
years | | Two to
three
years | | Three to
four
years | | Four to
five
years | | More
than five
years | | Total Non-
Current | |
Number | | Company | | Country | | Number | | Financial Institution | | Country | | Currency | | Rate | | Rate | | Amortization | | ThCh$ | | ThCh$ | | ThCh$ | | ThCh$ | | ThCh$ | | ThCh$ | | ThCh$ | | ThCh$ | | ThCh$ | |
96.800.570-7 | | Enel Distribución Chile S.A. | | Chile | | 97.006.000-6 | | Linea sobregiro (Banco Santander) | | Chile | | Ch$ | | 6.00 | % | 6.00 | % | At maturity | | 2 | | — | | 2 | | — | | — | | — | | — | | — | | — | |
91.081.000-6 | | Enel Generación Chile S.A. | | Chile | | 97.036.000-K | | Linea sobregiro (Banco Santander) | | Chile | | Ch$ | | 6.00 | % | 6.00 | % | At maturity | | 4 | | — | | 4 | | — | | — | | — | | — | | — | | — | |
76.536.353-5 | | Enel Chile S.A | | Chile | | 97.036.000-K | | Banco Santander | | Chile | | Ch$ | | 3.85 | % | 3.17 | % | At maturity | | — | | 65,829,996 | | 65,829,996 | | — | | — | | — | | — | | — | | — | |
76.536.353-5 | | Enel Chile S.A | | Chile | | 97.004.000-5 | | Banco de Chile | | Chile | | Ch$ | | 3.85 | % | 3.17 | % | At maturity | | — | | 73,453,456 | | 73,453,456 | | — | | — | | — | | — | | — | | — | |
76.536.353-5 | | Enel Chile S.A | | Chile | | 97.018.001-1 | | Scotiabank Chile | | Chile | | Ch$ | | 3.85 | % | 3.17 | % | At maturity | | — | | 73,453,456 | | 73,453,456 | | — | | — | | — | | — | | — | | — | |
96.920.110-0 | | Enel Green Power Chile Ltda | | Chile | | 97.080.000-K | | BBVA | | Chile | | US$ | | 4.14 | % | 4.14 | % | At maturity | | 814,628 | | 69,400,009 | | 70,214,637 | | — | | — | | — | | — | | — | | — | |
96.920.110-0 | | Enel Green Power Chile Ltda | | Chile | | 97.080.000-K | | BBVA | | Chile | | US$ | | 4.17 | % | 4.17 | % | At maturity | | 158,913 | | — | | 158,913 | | — | | 104,100,014 | | — | | — | | — | | 104,100,014 | |
96.920.110-0 | | Enel Green Power Chile Ltda | | Chile | | 59.054.440-K | | INTER-AMERICAN INVESTIMENT CORPORATION | | E.E.U.U | | US$ | | 1.50 | % | 1.50 | % | At maturity | | — | | 39,905 | | 39,905 | | — | | — | | 20,820,002 | | — | | — | | 20,820,002 | |
95.524.140-K | | Empresa Electrica Panguipulli S.A | | Chile | | 97.080.000-K | | BBVA | | Chile | | US$ | | 4.25 | % | 4.25 | % | At maturity | | 377,320 | | — | | 377,320 | | — | | — | | 104,100,013 | | — | | — | | 104,100,013 | |
| | | | | | | | | | | | | | | | | | Total | | 1,350,867 | | 282,176,822 | | 283,527,689 | | — | | 104,100,014 | | 124,920,015 | | — | | — | | 229,020,029 | |
| | | | | | | | | | | | | | | | | | | | December 31, 2017 | |
| | | | | | | | | | | | | | | | | | | | Current | | Non-current | |
Taxpayer ID | | | | | | Taxpayer ID | | | | | | | | Effective
Interest | | Nominal
Interest | | | | Less than
90 days | | More
than 90
days | | Total
Current | | One to
two
years | | Two to
three
years | | Three to
four
years | | Four to
five
years | | More
than five
years | | Total Non-
Current | |
Number | | Company | | Country | | Number | | Financial Institution | | Country | | Currency | | Rate | | Rate | | Amortization | | ThCh$ | | ThCh$ | | ThCh$ | | ThCh$ | | ThCh$ | | ThCh$ | | ThCh$ | | ThCh$ | | ThCh$ | |
96.800.570-7 | | Enel Distribución Chile S.A. | | Chile | | 97.006.000-6 | | Banco de Crédito e Inversiones | | Chile | | Ch$ | | 6.00 | % | 6.00 | % | At maturity | | 13 | | — | | 13 | | — | | — | | — | | — | | — | | — | |
91.081.000-6 | | Enel Generación Chile S.A. | | Chile | | 97.006.000-6 | | Banco de Crédito e Inversiones | | Chile | | Ch$ | | 6.00 | % | 6.00 | % | At maturity | | 97 | | — | | 97 | | — | | — | | — | | — | | — | | — | |
91.081.000-6 | | Enel Generación Chile S.A. | | Chile | | 97.036.000-K | | Banco Santander | | Chile | | Ch$ | | 6.00 | % | 6.00 | % | At maturity | | 12 | | — | | 12 | | — | | — | | — | | — | | — | | — | |
| | | | | | | | | | | | | | | | | | Total | | 122 | | — | | 122 | | — | | — | | — | | — | | — | | — | |
F-91
Table of Contents
18.2
21.2 Unsecured liabilities
The detail of Unsecured Liabilities by currency and maturity as of December 31, 20162018 and 2015,2017, is as follows:
Summary of public unsecured liabilities by currency and maturity
| | | Current | | Non-Current | | | | | | | | | | Current | | Non-Current | |
| | | | Maturity | | Total Current 12/31/2016 | | Maturity | | Total Non-Current 12/31/2016 | | | | | | | | | | Maturity | | | | Maturity | | Total Non- | |
Country | | Currency | | Effective Interest Rate | | Nominal Annual Rate | | Secured/ Unsecured | | One to three months | | Three to Twelve months | | One to two years | | Two to three years | | Three to four years | | Four to five years | | More than five years | | |
| | | | Effective Interest | | Nominal Annual | | Secured/ | | One to three
months | | Three to Twelve
months | | Total Current
12-31-2018 | | One to two years | | Two to three
years | | Three to four
years | | Four to five years | | More than five
years | | Current
12/31/2018 | |
Country | | Currency | | Effective Interest Rate | | Nominal Annual Rate | | Secured/ Unsecured | | ThCh$ | | ThCh$ | | ThCh$ | | ThCh$ | | ThCh$ | | ThCh$ | | ThCh$ | | ThCh$ | | ThCh$ | | Currency | | Rate | | Rate | | Unsecured | | ThCh$ | | ThCh$ | | ThCh$ | | ThCh$ | | ThCh$ | | ThCh$ | | ThCh$ | | ThCh$ | | ThCh$ | |
| | | 6,884,819 | | 2,402,653 | | 9,287,472 | | - | | - | | - | | - | | 468,578,474 | | 468,578,474 | | US$ | | 6.59 | % | 6.49 | % | Unsecured | | 7,144,997 | | 4,281,038 | | 11,426,035 | | — | | — | | — | | — | | 1,164,595,519 | | 1,164,595,519 | |
Chile | | U.F. | | 6.00% | | 5.48% | | Unsecured | | - | | 6,881,001 | | 6,881,001 | | 5,480,380 | | 5,480,380 | | 5,480,380 | | 5,480,380 | | 295,637,694 | | 317,559,214 | | U.F. | | 6.00 | % | 5.48 | % | Unsecured | | — | | 32,142,094 | | 32,142,094 | | 30,793,493 | | 30,793,493 | | 30,793,493 | | 30,793,493 | | 173,944,463 | | 297,118,435 | |
| | Total | | 6,884,819 | | 9,283,654 | | 16,168,473 | | 5,480,380 | | 5,480,380 | | 5,480,380 | | 5,480,380 | | 764,216,168 | | 786,137,688 | | | | | | | | Total | | 7,144,997 | | 36,423,132 | | 43,568,129 | | 30,793,493 | | 30,793,493 | | 30,793,493 | | 30,793,493 | | 1,338,539,982 | | 1,461,713,954 | |
| | | | |
| | | Current | | Non-Current | |
| | | | Maturity | | Total Current 12/31/2015 | | Maturity | | Total Non-Current 12/31/2015 | |
Country | | Currency | | Effective Interest Rate | | Nominal Annual Rate | | Secured/ Unsecured | | One to three months | | Three to Twelve months | | One to two years | | Two to three years | | Three to four years | | Four to five years | | More than five years | | |
| | ThCh$ | | ThCh$ | | ThCh$ | | ThCh$ | | ThCh$ | | ThCh$ | | ThCh$ | | ThCh$ | | ThCh$ | |
Chile | | US$ | | 7.24 % | | 7.24 % | | Unsecured | | 7,303,274 | | 2,548,685 | | 9,851,959 | | - | | - | | - | | - | | 493,795,141 | | 493,795,141 | |
Chile | | U.F. | | 6.34 % | | 6.34 % | | Unsecured | | - | | 6,761,387 | | 6,761,387 | | 5,330,851 | | 5,330,851 | | 5,330,851 | | 5,330,851 | | 292,433,623 | | 313,757,027 | |
| | Total | | 7,303,274 | | 9,310,072 | | 16,613,346 | | 5,330,851 | | 5,330,851 | | 5,330,851 | | 5,330,851 | | 786,228,764 | | 807,552,168 | |
| | | | | | | | | | Current | | Non-Current | |
| | | | | | | | | | Maturity | | | | Maturity | | | |
| | | | Effective
Interest | | Nominal Annual | | Secured/ | | One to three
months | | Three to Twelve
months | | Total Current
12-31-2017 | | One to two years | | Two to three
years | | Three to four
years | | Four to five years | | More than five
years | | Total Non-
Current
12/31/2017 | |
Country | | Currency | | Rate | | Rate | | Unsecured | | ThCh$ | | ThCh$ | | ThCh$ | | ThCh$ | | ThCh$ | | ThCh$ | | ThCh$ | | ThCh$ | | ThCh$ | |
Chile | | US$ | | 6.99 | % | 6.90 | % | Unsecured | | 6,322,081 | | 2,206,269 | | 8,528,350 | | — | | — | | — | | — | | 430,228,859 | | 430,228,859 | |
Chile | | U.F. | | 6.00 | % | 5.48 | % | Unsecured | | — | | 6,927,432 | | 6,927,432 | | 5,574,013 | | 5,574,013 | | 5,574,013 | | 5,574,013 | | 295,598,892 | | 317,894,944 | |
| | | | | | | | Total | | 6,322,081 | | 9,133,701 | | 15,455,782 | | 5,574,013 | | 5,574,013 | | 5,574,013 | | 5,574,013 | | 725,827,751 | | 748,123,803 | |
Summary of public unsecured liabilities by currency and maturity
| | | | | | | | | | | | | | | | | | | | December 31, 2018 | |
| | | | | | | | | | | | | | | | | | | | Current | | Non-Current | |
Taxpayer ID | | | | | | Taxpayer ID | | | | | | | | Effective
Interest | | Nominal
Interest | | | | Less than
90 days | | More
than 90
days | | Total
Current | | One to
two
years | | Two to
three
years | | Three to
four
years | | Four to
five
years | | More
than five
years | | Total Non-
Current | |
Number | | Company | | Country | | Number | | Financial Institution | | Country | | Currency | | Rate | | Rate | | Secured | | ThCh$ | | ThCh$ | | ThCh$ | | ThCh$ | | ThCh$ | | ThCh$ | | ThCh$ | | ThCh$ | | ThCh$ | |
91.081.000-6 | | Enel Generación Chile S.A. | | Chile | | Foreign | | BNY Mellon -Primera Emisión S-1 | | USA | | US$ | | 7.96 | % | 7.88 | % | No | | 4,693,498 | | — | | 4,693,498 | | — | | — | | — | | — | | 142,300,747 | | 142,300,747 | |
91.081.000-6 | | Enel Generación Chile S.A. | | Chile | | Foreign | | BNY Mellon - Primera Emisión S-2 | | USA | | US$ | | 7.40 | % | 7.33 | % | No | | 1,500,880 | | — | | 1,500,880 | | — | | — | | — | | — | | 48,131,124 | | 48,131,124 | |
91.081.000-6 | | Enel Generación Chile S.A. | | Chile | | Foreign | | BNY Mellon - Primera Emisión S-3 | | USA | | US$ | | 8.26 | % | 8.13 | % | No | | 950,619 | | — | | 950,619 | | — | | — | | — | | — | | 22,694,249 | | 22,694,249 | |
91.081.000-6 | | Enel Generación Chile S.A. | | Chile | | Foreign | | BNY Mellon - Única 24296 | | USA | | US$ | | 4.32 | % | 4.25 | % | No | | — | | 2,493,452 | | 2,493,452 | | — | | — | | — | | — | | 274,469,150 | | 274,469,150 | |
91.081.000-6 | | Enel Generación Chile S.A. | | Chile | | 97.004.000-5 | | Banco Santander -317 Serie-H | | Chile | | U.F. | | 7.17 | % | 6.20 | % | No | | — | | 6,513,162 | | 6,513,162 | | 5,733,684 | | 5,733,684 | | 5,733,684 | | 5,733,684 | | 25,386,928 | | 48,321,664 | |
91.081.000-6 | | Enel Generación Chile S.A. | | Chile | | 97.004.000-5 | | Banco Santander 522 Serie-M | | Chile | | U.F. | | 4.82 | % | 4.75 | % | No | | — | | 25,628,932 | | 25,628,932 | | 25,059,809 | | 25,059,809 | | 25,059,809 | | 25,059,809 | | 148,557,535 | | 248,796,771 | |
76.536.353-5 | | Enel Chile S.A | | Chile | | Foreign | | BNY Mellon - Unica | | E.E.U.U | | US$ | | 5.03 | % | 4.88 | % | No | | | | 1,787,586 | | 1,787,586 | | | | | | | | | | 677,000,249 | | 677,000,249 | |
| | | | | | | | | | | | | | | | Total Unsecured Bonds | | 7,144,997 | | 36,423,132 | | 43,568,129 | | 30,793,493 | | 30,793,493 | | 30,793,493 | | 30,793,493 | | 1,338,539,982 | | 1,461,713,954 | |
| | | | | | | | | | | | | | | | | | | | | | | | | | | | | | | | | | | | | |
| | | | | | | | | | | | | | | | | | | | December 31, 2017 | |
| | | | | | | | | | | | | | | | | | | | Current | | Non-Current | |
Taxpayer ID | | | | | | Taxpayer ID | | | | | | | | Effective
Interest | | Nominal
Interest | | | | Less than
90 days | | More
than 90
days | | Total
Current | | One to
two
years | | Two to
three
years | | Three to
four
years | | Four to
five
years | | More
than five
years | | Total Non-
Current | |
Number | | Company | | Country | | Number | | Financial Institution | | Country | | Currency | | Rate | | Rate | | Secured | | ThCh$ | | ThCh$ | | ThCh$ | | ThCh$ | | ThCh$ | | ThCh$ | | ThCh$ | | ThCh$ | | ThCh$ | |
91.081.000-6 | | Enel Generación Chile S.A. | | Chile | | Foreign | | BNY Mellon -Primera Emisión S-1 | | USA | | US$ | | 7.96 | % | 7.88 | % | No | | 4,152,926 | | — | | 4,152,926 | | — | | — | | — | | — | | 125,566,611 | | 125,566,611 | |
91.081.000-6 | | Enel Generación Chile S.A. | | Chile | | Foreign | | BNY Mellon - Primera Emisión S-2 | | USA | | US$ | | 7.40 | % | 7.33 | % | No | | 1,328,023 | | — | | 1,328,023 | | — | | — | | — | | — | | 42,902,198 | | 42,902,198 | |
91.081.000-6 | | Enel Generación Chile S.A. | | Chile | | Foreign | | BNY Mellon - Primera Emisión S-3 | | USA | | US$ | | 8.26 | % | 8.13 | % | No | | 841,132 | | — | | 841,132 | | — | | — | | — | | — | | 19,398,499 | | 19,398,499 | |
91.081.000-6 | | Enel Generación Chile S.A. | | Chile | | Foreign | | BNY Mellon - Única 24296 | | USA | | US$ | | 4.32 | % | 4.25 | % | No | | — | | 2,206,269 | | 2,206,269 | | — | | — | | — | | — | | 242,361,551 | | 242,361,551 | |
91.081.000-6 | | Enel Generación Chile S.A. | | Chile | | 97.004.000-5 | | Banco Santander -317 Serie-H | | Chile | | U.F. | | 7.17 | % | 6.20 | % | No | | — | | 6,374,051 | | 6,374,051 | | 5,574,013 | | 5,574,013 | | 5,574,013 | | 5,574,013 | | 30,872,536 | | 53,168,588 | |
91.081.000-6 | | Enel Generación Chile S.A. | | Chile | | 97.004.000-5 | | Banco Santander 522 Serie-M | | Chile | | U.F. | | 4.82 | % | 4.75 | % | No | | — | | 553,381 | | 553,381 | | — | | — | | — | | — | | 264,726,356 | | 264,726,356 | |
| | | | | | | | | | | | | | | | Total Unsecured Bonds | | 6,322,081 | | 9,133,701 | | 15,455,782 | | 5,574,013 | | 5,574,013 | | 5,574,013 | | 5,574,013 | | 725,827,751 | | 748,123,803 | |
F-92
Table of Contents18.3
21.3 Secured liabilities
As of December 31, 20162018 and 2015,2017, there were no secured liabilities.
Fair value measurement and hierarchy
The fair value of current and non-current unsecured liabilities as of December 31, 20162018 and 2015,2017 totaled ThCh$998,383,0471,685,679,241 and ThCh$981,390,150,947,565,989, respectively. The fair value measurement of these liabilities has been categorized as Level 2 (See Note 3.h). It is important to note that these financial assets are measured at amortized cost (See Note 3.g.4).
21.4 Detail of finance lease obligationsUnsecured liabilities by company
Appendix No. 4, letter b) presents details of estimated future cash flows (undiscounted) that the Group will have to disburse to settle the secured and unsecured liabilities detailed above.
| | | | | | | | | | | | | | | | | | | | December 31, 2016 |
| | | | | | | | | | | | | | | | | | | | Current | | Non-Current |
Taxpayer ID Number | | Company | | Country | | Taxpayer ID Number | | Financial Institution | | Country | | Currency | | Effective Interest Rate | | Nominal Interest Rate | | Secured | | Less than 90 days | | More than 90 days | | Total Current | | One to two years | | Two to three years | | Three to four years | | Four to five years | | More than five years | | Total Non-Current |
| | | | | | | | | | ThCh$ | | ThCh$ | | ThCh$ | | ThCh$ | | ThCh$ | | ThCh$ | | ThCh$ | | ThCh$ | | ThCh$ |
91.081.000-6 | | Enel Generación Chile S.A. | | Chile | | Foreign | | BNY Mellon -Primera Emisión S-1 | | USA | | US$ | | 7.96 % | | 7.88 % | | No | | 4,522,585 | | - | | 4,522,585 | | - | | - | | - | | - | | 136,759,395 | | 136,759,395 |
91.081.000-6 | | Enel Generación Chile S.A. | | Chile | | Foreign | | BNY Mellon - Primera Emisión S-2 | | USA | | US$ | | 7.40 % | | 7.33 % | | No | | 1,446,232 | | - | | 1,446,232 | | - | | - | | - | | - | | 46,792,429 | | 46,792,429 |
91.081.000-6 | | Enel Generación Chile S.A. | | Chile | | Foreign | | BNY Mellon - Primera Emisión S-3 | | USA | | US$ | | 8.26 % | | 8.13 % | | No | | 916,002 | | - | | 916,002 | | - | | - | | - | | - | | 21,608,757 | | 21,608,757 |
91.081.000-6 | | Enel Generación Chile S.A. | | Chile | | Foreign | | BNY Mellon - Única 24296 | | USA | | US$ | | 4.32 % | | 4.25 % | | No | | - | | 2,402,653 | | 2,402,653 | | - | | - | | - | | - | | 263,417,893 | | 263,417,893 |
91.081.000-6 | | Enel Generación Chile S.A. | | Chile | | 97.004.000-5 | | Banco Santander -317 Serie-H | | Chile | | U.F. | | 7.17 % | | 6.20 % | | No | | - | | 6,337,021 | | 6,337,021 | | 5,480,380 | | 5,480,380 | | 5,480,380 | | 5,480,380 | | 35,587,764 | | 57,509,284 |
91.081.000-6 | | Enel Generación Chile S.A. | | Chile | | 97.004.000-5 | | Banco Santander 522 Serie-M (*) | | Chile | | U.F. | | 4.82 % | | 4.75 % | | No | | - | | 543,980 | | 543,980 | | - | | - | | - | | - | | 260,049,930 | | 260,049,930 |
| | | | | | | | | | Total Unsecured Bonds | | 6,884,819 | | 9,283,654 | | 16,168,473 | | 5,480,380 | | 5,480,380 | | 5,480,380 | | 5,480,380 | | 764,216,168 | | 786,137,688 |
| | | | | | | | | | | | | | | | | | | | | | | | | | | | | | | | | | | | |
| | | | | | | | | | | | | | | | | | | | | | | | | | | | | | | | | | | | |
| | | | | | | | | | | | | | | | | | | | December 31, 2015 |
| | | | | | | | | | | | | | | | | | | | Current | | Non-Current |
Taxpayer ID Number | | Company | | Country | | Taxpayer ID Number | | Financial Institution | | Country | | Currency | | Effective Interest Rate | | Nominal Interest Rate | | Secured | | Less than 90 days | | More than 90 days | | Total Current | | One to two years | | Two to three years | | Three to four years | | Four to five years | | More than five years | | Total Non-Current |
| | | | | | | | | | ThCh$ | | ThCh$ | | ThCh$ | | ThCh$ | | ThCh$ | | ThCh$ | | ThCh$ | | ThCh$ | | ThCh$ |
91.081.000-6 | | Enel Generación Chile S.A. | | Chile | | Foreign | | BNY Mellon -Primera Emisión S-1 | | USA | | US$ | | 7.96 % | | 7.88 % | | No | | 4,797,465 | | - | | 4,797,465 | | - | | - | | - | | - | | 145,068,065 | | 145,068,065 |
91.081.000-6 | | Enel Generación Chile S.A. | | Chile | | Foreign | | BNY Mellon - Primera Emisión S-2 | | USA | | US$ | | 7.40 % | | 7.33 % | | No | | 1,534,133 | | - | | 1,534,133 | | - | | - | | - | | - | | 49,690,671 | | 49,690,671 |
91.081.000-6 | | Enel Generación Chile S.A. | | Chile | | Foreign | | BNY Mellon - Primera Emisión S-3 | | USA | | US$ | | 8.26 % | | 8.13 % | | No | | 971,676 | | - | | 971,676 | | - | | - | | - | | - | | 23,252,023 | | 23,252,023 |
91.081.000-6 | | Enel Generación Chile S.A. | | Chile | | Foreign | | BNY Mellon - Única 24296 | | USA | | US$ | | 4.32 % | | 4.25 % | | No | | - | | 2,548,685 | | 2,548,685 | | - | | - | | - | | - | | 275,784,382 | | 275,784,382 |
91.081.000-6 | | Enel Generación Chile S.A. | | Chile | | 97.004.000-5 | | Banco Santander -317 Serie-H | | Chile | | U.F. | | 7.17 % | | 6.20 % | | No | | - | | 6,232,249 | | 6,232,249 | | 5,330,851 | | 5,330,851 | | 5,330,851 | | 5,330,851 | | 39,700,607 | | 61,024,011 |
91.081.000-6 | | Enel Generación Chile S.A. | | Chile | | 97.004.000-5 | | Banco Santander 522 Serie-M | | Chile | | U.F. | | 4.82 % | | 4.75 % | | No | | - | | 529,138 | | 529,138 | | - | | - | | - | | - | | 252,733,016 | | 252,733,016 |
| | | | | | | | | | Total Unsecured Bonds | | 7,303,274 | | 9,310,072 | | 16,613,346 | | 5,330,851 | | 5,330,851 | | 5,330,851 | | 5,330,851 | | 786,228,764 | | 807,552,168 |
Detail of finance lease obligationsobligations:
Appendix No. 4 letter c) presents details of estimated future cash flows (undiscounted) that the Group will have to disburse to settle the finance lease obligations detailed above.
| | | | | | | | | | | | | | | | December 31, 2016 |
| | | | | | | | | | | | | | | | Current | | Non-Current ThCh$ |
Taxpayer ID Number | | Company | | Country | | Taxpayer ID Number | | Financial Institution | | Country | | Currency | | Nominal Interest Rate | | Less than 90 days | | More than 90 days | | Total Current | | One to two years | | Two to three years | | Three to four years | | Four to five years | | More than five years | | Total Non-Current |
| | | | | | | | ThCh$ | | ThCh$ | | ThCh$ | | ThCh$ | | ThCh$ | | ThCh$ | | ThCh$ | | ThCh$ | | ThCh$ |
91.081.000-6 | | Enel Generación Chile S.A. | | Chile | | 87.509.100-K | | Transelec S.A. | | Chile | | US$ | | 6.50 % | | 449,283 | | 1,391,084 | | 1,840,367 | | 2,677,880 | | 2,677,880 | | 1,959,990 | | 2,087,390 | | 6,506,140 | | 15,909,280 |
| | | | | | | | | | | | | | Total Leasing | | 449,283 | | 1,391,084 | | 1,840,367 | | 2,677,880 | | 2,677,880 | | 1,959,990 | | 2,087,390 | | 6,506,140 | | 15,909,280 |
| | | | | | | | | | | | | | | | | | | | | | | | | | | | | | | | |
| | | | | | | | | | | | | | | | December 31, 2015 |
| | | | | | | | | | | | | | | | Current | | Non-Current ThCh$ |
Taxpayer ID Number | | Company | | Country | | Taxpayer ID Number | | Financial Institution | | Country | | Currency | | Nominal Interest Rate | | Less than 90 days | | More than 90 days | | Total Current | | One to two years | | Two to three years | | Three to four years | | Four to five years | | More than five years | | Total Non-Current |
| | | | | | | | ThCh$ | | ThCh$ | | ThCh$ | | ThCh$ | | ThCh$ | | ThCh$ | | ThCh$ | | ThCh$ | | ThCh$ |
91.081.000-6 | | Enel Generación Chile S.A. | | Chile | | 87.509.100-K | | Abengoa Chile | | Chile | | US$ | | 6.50 % | | - | | 1,833,073 | | 1,833,073 | | 2,840,640 | | 1,952,223 | | 2,079,117 | | 2,214,260 | | 9,742,220 | | 18,828,460 |
| | | | | | | | | | | | | | Total Leasing | | - | | 1,833,073 | | 1,833,073 | | 2,840,640 | | 1,952,223 | | 2,079,117 | | 2,214,260 | | 9,742,220 | | 18,828,460 |
| | | | | | | | | | | | | | | | December 31, 2018 | |
| | | | | | | | | | | | | | | | Current | | Non-Current ThCh$ | |
Taxpayer ID | | | | | | Taxpayer ID | | | | | | | | Nominal
Interest | | Less than
90 days | | More
than 90
days | | Total
Current | | One to
two
years | | Two to
three
years | | Three to
four
years | | Four to
five
years | | More
than five
years | | Total Non-
Current | |
Number | | Company | | Country | | Number | | Financial Institution | | Country | | Currency | | Rate | | ThCh$ | | ThCh$ | | ThCh$ | | ThCh$ | | ThCh$ | | ThCh$ | �� | ThCh$ | | ThCh$ | | ThCh$ | |
91.081.000-6 | | Enel Generación Chile S.A. | | Chile | | 76.555.400-4 | | Transelec S.A. | | Chile | | US$ | | 6.50 | % | 528,847 | | 1,637,428 | | 2,166,275 | | 2,307,082 | | 2,457,043 | | 2,616,750 | | 4,929,300 | | — | | 12,310,175 | |
| | | | | | | | | | | | Total Leasing | | 528,847 | | 1,637,428 | | 2,166,275 | | 2,307,082 | | 2,457,043 | | 2,616,750 | | 4,929,300 | | — | | 12,310,175 | |
| | | | | | | | | | | | | | | | December 31, 2017 | |
| | | | | | | | | | | | | | | | Current | | Non-Current ThCh$ | |
Taxpayer ID | | | | | | Taxpayer ID | | | | | | | | Nominal
Interest | | Less than
90 days | | More
than 90
days | | Total
Current | | One to
two
years | | Two to
three
years | | Three to
four
years | | Four to
five
years | | More
than five
years | | Total Non-
Current | |
Number | | Company | | Country | | Number | | Financial Institution | | Country | | Currency | | Rate | | ThCh$ | | ThCh$ | | ThCh$ | | ThCh$ | | ThCh$ | | ThCh$ | | ThCh$ | | ThCh$ | | ThCh$ | |
91.081.000-6 | | Enel Generación Chile S.A. | | Chile | | 76.555.400-4 | | Transelec S.A. | | Chile | | US$ | | 6.50 | % | 439,377 | | 1,360,411 | | 1,799,788 | | 2,459,000 | | 1,916,774 | | 2,041,364 | | 2,174,053 | | 4,217,935 | | 12,809,126 | |
| | | | | | | | | | | | Total Leasing | | 439,377 | | 1,360,411 | | 1,799,788 | | 2,459,000 | | 1,916,774 | | 2,041,364 | | 2,174,053 | | 4,217,935 | | 12,809,126 | |
21.5 Hedged debt18.4 Hedged debt
The U.S. dollar denominated debt of the Group as of December 31, 20162018 and 2015,2017, that is designated as cash flow hedge to hedge the portion of revenue from its consolidated entities that is directly linked to variations in the U.S. dollar, as referenced in Note 3.m,3.g.5, was ThCh$480,061,5391,192,973,584 and ThCh$814,080,185,440,823,086, respectively.
The following table details changes in “Reserve for cash flow hedges” as of December 31, 20162018 and 2015,2017, due to exchange differences of this debt:
| | For the years ended December 31, | | For the years ended December 31, | |
| | 2016 | | 2015 | | 2014 | | 2018 | | 2017 | | 2016 | |
| ThCh$ | | ThCh$ | | ThCh$ | | ThCh$ | | ThCh$ | | ThCh$ | |
Balance in hedging reserves (hedging income) at the beginning of the period, net | | (74,953,393) | | (39,805,098) | | (217,637) | | (27,168,008 | ) | (52,747,646 | ) | (74,953,393 | ) |
Foreign currency exchange differences recognized in equity, net | | 14,317,257 | | (38,579,730) | | (30,045,776) | | (101,790,308 | ) | 17,321,594 | | 14,317,257 | |
Foreign currency exchange differences recognized in profit and loss, net | | 7,888,490 | | 3,431,435 | | (9,541,685) | | 12,478,369 | | 8,258,044 | | 7,888,490 | |
Others (Tender Offer 33.57% 02.04.2018 on Enel Generacion Chile) | | | (11,028,906 | ) | — | | — | |
Balance in hedging reserves (hedging income) at the end of the period, net | | (52,747,646) | | (74,953,393) | | (39,805,098) | | (127,508,853 | ) | (27,168,008 | ) | (52,747,646 | ) |
F-93
Table of Contents18.5
21.6 Other information
As of December 31, 20162018 and 2015,2017, the Group has undrawn line of credits available for use amounting to ThCh$342,827,047416,862,000 and ThCh$142,032,000,199,271,103, respectively.
21.7 Future undiscounted debt flow
The following tables are the estimates of undiscounted flows by type of financial debt:
a) Bank loans
| | | | | | | | Non-Current | | Current | | Non-Current | |
| | | | | | | | | | Total Current | | Maturity | | Total No
Current | | | | | | Total Current | | Maturity | | Total No
Current | |
| | | | Nominal | | One to Three
Months | | Three to
twelve months | | as of 12-31-
2018 | | One to two
years | | Two to Three
Years | | Three to Four
Years | | Four to Five
Years | | More than Five
Years | | as of 12-31-
2018 | | One to Three
Months | | Three to twelve
months | | as of 12-31-
2017 | | One to two
years | | Two to Three
Years | | Three to Four
Years | | Four to Five
Years | | More than Five
Years | | as of
12/31/2017 | |
Country | | Currency | | Interest Rate | | ThCh$ | | ThCh$ | | ThCh$ | | ThCh$ | | ThCh$ | | ThCh$ | | ThCh$ | | ThCh$ | | ThCh$ | | ThCh$ | | ThCh$ | | ThCh$ | | ThCh$ | | ThCh$ | | ThCh$ | | ThCh$ | | ThCh$ | | ThCh$ | |
| | | | | | | | | | | | | | | | | | | | | | | | | | | | | | | | | | | | | | | | | |
Chile | | US$ | | 3.51 | % | 1,985,915 | | 75,074,314 | | 77,060,229 | | 110,909,917 | | 106,335,361 | | 21,112,380 | | — | | — | | 238,357,658 | | — | | — | | — | | — | | — | | — | | — | | — | | — | |
Chile | | Ch$ | | 4.30 | % | 1,798,705 | | 215,920,510 | | 217,719,215 | | — | | — | | — | | — | | — | | — | | 122 | | — | | 122 | | — | | — | | — | | — | | — | | — | |
| | | | | | | | | | | | | | | | | | | | | | | | | | | | | | | | | | | | | | | | | |
| | Totals | | 3,784,620 | | 290,994,824 | | 294,779,444 | | 110,909,917 | | 106,335,361 | | 21,112,380 | | — | | — | | 238,357,658 | | 122 | | — | | 122 | | — | | — | | — | | — | | — | | — | |
| | | | | | | | | | | | | | | | | | | | | | | | | | | | | | | | | | | | | | | | | | |
b) Guaranteed and unsecured obligations
| | | | | | | | | | | | Non-Current | | Current | | Non-Current | |
| | | | | | Maturity | | Total Current | | Maturity | | Total No
Current | | Maturity | | Total Current | | Maturity | | Total No
Current | |
| | | | Nominal | | One to Three
Months | | Three to twelve
months | | as of 12-31-
2018 | | One to two
years | | Two to Three
Years | | Three to Four
Years | | Four to Five
Years | | More than Five
Years | | as of 12-31-
2018 | | One to Three
Months | | Three to twelve
months | | as of 12-31-
2017 | | One to two
years | | Two to Three
Years | | Three to Four
Years | | Four to Five
Years | | More than Five
Years | | as of 12/31/
2017 | |
Country | | Currency | | Interest Rate | | ThCh$ | | ThCh$ | | ThCh$ | | ThCh$ | | ThCh$ | | ThCh$ | | ThCh$ | | ThCh$ | | ThCh$ | | ThCh$ | | ThCh$ | | ThCh$ | | ThCh$ | | ThCh$ | | ThCh$ | | ThCh$ | | ThCh$ | | ThCh$ | |
| | | | | | | | | | | | | | | | | | | | | | | | | | | | | | | | | | | | | | | | | |
Chile | | US$ | | 6.49 | % | 16,173,722 | | 48,521,166 | | 64,694,888 | | 64,694,887 | | 64,694,887 | | 64,694,887 | | 64,694,887 | | 1,612,310,243 | | 1,871,089,791 | | 6,697,979 | | 20,093,935 | | 26,791,914 | | 26,791,913 | | 26,791,913 | | 26,791,913 | | 26,791,913 | | 703,872,066 | | 811,039,718 | |
Chile | | U.F. | | 5.48 | % | 6,603,562 | | 49,871,556 | | 56,475,118 | | 54,036,540 | | 51,597,963 | | 49,159,386 | | 46,720,808 | | 224,787,689 | | 426,302,386 | | 5,775,038 | | 22,689,438 | | 28,464,476 | | 51,927,014 | | 49,837,566 | | 47,748,117 | | 45,658,669 | | 256,892,562 | | 452,063,928 | |
| | | | | | | | | | | | | | | | | | | | | | | | | | | | | | | | | | | | | | | | | |
| | Totals | | 22,777,284 | | 98,392,722 | | 121,170,006 | | 118,731,427 | | 116,292,850 | | 113,854,273 | | 111,415,695 | | 1,837,097,932 | | 2,297,392,177 | | 12,473,017 | | 42,783,373 | | 55,256,390 | | 78,718,927 | | 76,629,479 | | 74,540,030 | | 72,450,582 | | 960,764,628 | | 1,263,103,646 | |
c) Financial leases
| | | | | | | | | | | | Non-Current | | Current | | Non-Current | |
| | | | | | | | | | Total Current | | Maturity | | Total No
Current | | | | | | Total Current | | Maturity | | Total No
Current | |
| | | | Nominal | | One to Three
Months | | Three to
twelve months | | as of 12-31-
2018 | | One to two
years | | Two to Three
Years | | Three to Four
Years | | Four to Five
Years | | More than Five
Years | | as of 12-31-
2018 | | One to Three
Months | | Three to
twelve months | | as of 12-31-
2017 | | One to two
years | | Two to Three
Years | | Three to Four
Years | | Four to Five
Years | | More than
Five Years | | as of 12-31-
2017 | |
Country | | Currency | | Interest Rate | | ThCh$ | | ThCh$ | | ThCh$ | | ThCh$ | | ThCh$ | | ThCh$ | | ThCh$ | | ThCh$ | | ThCh$ | | ThCh$ | | ThCh$ | | ThCh$ | | ThCh$ | | ThCh$ | | ThCh$ | | ThCh$ | | ThCh$ | | ThCh$ | |
Chile | | US$ | | 6.50 | % | 760,090 | | 2,278,842 | | 3,038,932 | | 3,034,977 | | 3,030,765 | | 3,026,279 | | 5,044,764 | | — | | 14,136,785 | | 685,232 | | 2,052,448 | | 2,737,680 | | 2,728,693 | | 2,719,123 | | 2,708,931 | | 2,698,076 | | 4,473,883 | | 15,328,706 | |
| | Totals | | 760,090 | | 2,278,842 | | 3,038,932 | | 3,034,977 | | 3,030,765 | | 3,026,279 | | 5,044,764 | | — | | 14,136,785 | | 685,232 | | 2,052,448 | | 2,737,680 | | 2,728,693 | | 2,719,123 | | 2,708,931 | | 2,698,076 | | 4,473,883 | | 15,328,706 | |
F-94
19.
| RISK MANAGEMENT POLICY.
|
The Group’s companies are exposed to certain risks that are managed by systems that identify, measure, limit concentration of, and monitor these risks.
The main principles in the Group’s risk management policy include the following:
·Compliance with good corporate governance standards.
·Strict compliance with all the Group’s internal policies.
·Each business and corporate area determines:
| I.
| The markets in which it can operate based on its knowledge and ability to ensure effective risk management;
|
| II.
| Criteria regarding counterparts;
|
| III.
| Authorized operators.
|
I. The markets in which it can operate based on its knowledge and ability to ensure effective risk management;
II. Criteria regarding counterparties and
III. Authorized operators.
·Business and corporate areas establish their risk tolerance in a manner consistent with the defined strategy for each market in which they operate.
·All of the operations of the businesses and corporate areas are conducted within the limits approved for each case.
·Businesses, corporate areas, lines of business and companies design the risk management controls necessary to ensure that transactions in the markets are conducted in accordance with the EnersisEnel Chile’s policies, standards, and procedures.
19.1
22.1 Interest rate risk
Changes in interest rates affect the fair value of assets and liabilities bearing fixed interest rates, as well as the expected future cash flows of assets and liabilities subject to floating interest rates.
The objective of managing interest rate risk exposure is to achieve a balance in the debt structure to minimize the cost of debt with reduced volatility in profit or loss.
The comparative structure of the financial debt structure measuredof the Enel Chile Group according to the fixed and / or protected interest rate on the gross debt, after derivatives contracted, is as hedged fixed debt on total debt was 92% as of December 31, 2016 (92% as of December 31, 2015):follows:
Gross position:
| | For the years ended December 31, | |
| | 2018 | | 2017 | |
| | % | | % | |
Fixed interest rate | | 71 | % | 92 | % |
Depending on the Group’s estimates and on the objectives of the debt structure, hedging transactions are performed by entering into derivatives contracts that mitigate interest rate risk.
19.2
22.2 Exchange rate risk
Exchange rate risks involve basically the following transactions:
·Debt taken on by the Group’s companies that is denominated in a currency other than that in which its cash flows are indexed.
F-95
Table of Contents
·Payments to be made for the acquisition of project-related materials and for corporate insurance policies in a currency other than that in which its cash flows are indexed.
·Revenues in the Group companies directly linked to changes in currencies other than that of its cash flows.
In order to mitigate foreign currency risk, the Group’s foreign currency risk management policy is based on cash flows and includes maintaining a balance between U.S. dollar flows and the levels of assets and liabilities denominated in this currency. The objective is to minimize the exposure to variability in cash flows that are attributable to foreign exchange risk.
The hedging instruments currently being used to comply with the policy are currency swaps and forward exchange contracts. In addition, the policy seeks to refinance debt in the functional currency of each of the Group’s companies.
19.3
22.3 Commodities risk
The Group has a risk exposure to price fluctuations in certain commodities, basically due to:
·Purchases of fuel used to generate electricity.
· Energy purchase/sale transactions that take place in local markets. | •
| Energy purchase/sale transactions that take place in local markets.
|
In order to reduce the risk in situations of extreme drought, the Group has designed a commercial policy that defines the levels of sales commitments in line with the capacity of its generating power plants in a dry year. It also includes risk mitigation terms in certain contracts with unregulated customers and with regulated customers subject to long-term tender processes, establishing indexation polynomials that allow for reducing commodities exposure risk.
Considering the operating conditions faced by the power generation market in Chile, with drought and highly volatile commodity prices on international markets, the Group is constantly verifying the advisability of using hedging to lessen the impacts that these price swings have on its results.
As of December 31, 2016,2018 there were swap hedgescurrent transactions for 2.9 million barrels432 kTon of API2 to be settled in 2019, 994 kBbl of Brent oil for November 2017to be settled in 2019, 225 kTon of BCI7 to be settled in 2019 and 3.3 million MMTBU0.2 TBtu of Henry Hub gas swap for dates between January and September 2017. HH to be settled in 2019 (figures considered net hedged position).
As of December 31, 2015,2017, the Group had swap hedges for 133 thousand barrels of Brent oil for dates between February and November 2016.2.3 million MMBTU to be settled at January 2018.
19.4
Depending on operating conditions, which are constantly being updated, these hedges may be modified or may cover other commodities.
22.4 Liquidity risk
The Group maintains a liquidity risk management policy that consists of entering into long-term committed banking facilities and temporary financial investments for amounts that cover the projected needs over a period of time that is determined based on the situation and expectations for debt and capital markets.
The projected needs mentioned above include maturities of financial debt, net of financial derivatives. For further details regarding the features and conditions of financial obligations and financial derivatives. See Notes 1821 and 20, and Appendix No. 4.23.
As of December 31, 20162018 the Group’s liquidity is as follows: cash and 2015,cash equivalents for ThCh$245,171,924 and unconditionally available lines of long-term credit for ThCh$416,862,000. As of December 31, 2017 the Group hashad cash and cash equivalent totaling ThCh$245,999,192 and ThCh$144,261,845, respectively,419,456,026 and unconditionally available lines of long-term credit totaling ThCh$342,827,047 and ThCh$142,032,000, respectively.199,271,103.
F-96
Table of Contents19.5
22.5 Credit risk
The Group closely monitors its credit risk.
Trade receivables:
The credit risk for receivables from the Group’s commercial activity has historically been very low, due to the short term period of collections from customers, resulting in non-significant cumulative receivables amounts. This situation applies to both the electricity generation and distribution lines of business.
In the electricity generation and distribution lines of business, regulations allow the suspension of energy service to customers with outstanding payments, and the contracts have termination clauses for payment default. The Group monitors its credit risk on an ongoing basis and measures its maximum exposure to payment default risk, which, as stated above, is very limited.
In the case of our electricity distribution company, the suspension of energy service to customers, is a right available to the company in case of breaches by our clients, which is applied according to the current regulation, which facilitates the process of evaluation and control of credit risk, which by the way is limited.
Financial assets:
Cash surpluses are invested in the highest-rated local and foreign financial entities (with risk rating equivalent to investment grade where possible) with thresholds established for each entity.
In selecting banks to make investments, the Group considers those banks with investment grade ratings granted by main international rating agencies (Moody’s, S&P and Fitch).
Investments may be backed with treasury bonds from the countries in which the Group operates and/or with commercial papers issued by the highest rated banks; the latter are preferred, as they offer higher returns (always in line with current investment policies).
Derivative instruments are entered into with entities with solid creditworthiness; all derivative transactions are performed with entities with investment grade ratings.
19.622.6 Risk measurement
The Group measures the Value at Risk (VaR) of its debt positions and financial derivatives in order to monitor the risk assumed by the Group, thereby reducing volatility in the income statement.
The portfolio of positions included for the purposes of the calculations of this value at risk include:
· Hedging derivatives for debt. | •
| Hedging derivatives for debt.
|
The VaR determined represents the potential variation in value of the portfolio of positions described above in one quarter with a 95% confidence level. To determine the VaR, we take into account the volatility of the risk variables affecting the value of the portfolio of positions including:
·U.S. dollar Libor interest rate.
The various currencies in which our companies operate, the usual local rates banking practice.
·The exchange rates of the various currencies used in the calculation.
The calculation of VaR is based on generating possible future scenarios (at one quarter) of market values (both spot and term) for the risk variables based on the scenarios with observable inputs for a same period (quarter) during five years.
The one-quarter 95%-confidence VaR number is calculated as the 5% percentile of the potential variations in the fair value of the portfolio in one quarter.
Taking into account the assumptions described above, the one-quarter VaR was ThCh$73,197,508.
318,820,121. This amount represents the potential increase of the Debt and Derivatives’ Portfolio, thus these Values at Risk are inherently related, among other factors, to the Portfolio’s value at each quarter’ end.
20.
| FINANCIAL INSTRUMENTS.
|
F-97
Table of Contents
23.FINANCIAL INSTRUMENTS.20.1
23.1 Financial instruments, classified by type and category
| a)
| The detail of financial assets, classified by type and category, as of December 31, 2016 and 2015, is as follows:
|
| | December 31, 2016 |
| | Held-to-maturity investments | | Loans and receivables | | Available-for-sale financial assets | | Financial derivatives for hedging |
| | ThCh$ | | ThCh$ | | ThCh$ | | ThCh$ |
Derivative instruments | | - | | - | | - | | 121,443 |
Other financial assets | | 462,801 | | 464,235,411 | | - | | - |
Total Current | | 462,801 | | 464,235,411 | | - | | 121,443 |
| | | | | | | | |
Equity instruments | | - | | - | | 2,641,620 | | - |
Derivative instruments | | - | | - | | - | | 25,533,189 |
Other financial assets | | 652,733 | | 33,500,105 | | - | | - |
Total Non-current | | 652,733 | | 33,500,105 | | 2,641,620 | | 25,533,189 |
| | | | | | | | |
Total | | 1,115,534 | | 497,735,516 | | 2,641,620 | | 25,654,632 |
| | |
| | December 31, 2015 |
| | Held-to-maturity investments | | Loans and receivables | | Available-for-sale financial assets | | Financial derivatives for hedging |
| | ThCh$ | | ThCh$ | | ThCh$ | | ThCh$ |
Derivative instruments | | - | | - | | - | | 76,704 |
Other financial assets | | 16,236,490 | | 544,338,480 | | - | | - |
Total Current | | 16,236,490 | | 544,338,480 | | - | | 76,704 |
| | | | | | | | |
Equity instruments | | - | | - | | 3,033,989 | | - |
Derivative instruments | | - | | - | | - | | 18,716,463 |
Other financial assets | | - | | 14,392,223 | | - | | - |
Total Non-current | | - | | 14,392,223 | | 3,033,989 | | 18,716,463 |
| | | | | | | | |
Total | | 16,236,490 | | 558,730,703 | | 3,033,989 | | 18,793,167 |
| b)
| The detail of financial liabilities, classified by type and category, as of December 31, 2016 and 2015, is as follows:
|
| | December 31, 2016 |
| | Financial liabilities held for trading | | Loans and payables | | Financial derivatives for hedging |
| ThCh$ | | ThCh$ | | ThCh$ |
Interest-bearing loans | | - | | 18,013,114 | | - |
Derivative instruments | | 7,369,481 | | - | | 313,571 |
Other financial liabilities | | - | | 617,955,794 | | - |
Total Current | | 7,369,481 | | 635,968,908 | | 313,571 |
| | | | | | |
Interest-bearing loans | | - | | 802,046,968 | | - |
Derivative instruments | | 2,987,830 | | - | | 48,981,953 |
Other financial liabilities | | - | | 1,734,640 | | - |
Total Non-current | | 2,987,830 | | 803,781,608 | | 48,981,953 |
| | | | | | |
Total | | 10,357,311 | | 1,439,750,516 | | 49,295,524 |
| | |
| | |
| | December 31, 2015 |
| | Financial liabilities held for trading | | Loans and payables | | Financial derivatives for hedging |
| ThCh$ | | ThCh$ | | ThCh$ |
Interest-bearing loans | | - | | 18,446,636 | | - |
Derivative instruments | | 9,146,674 | | - | | 328,414 |
Other financial liabilities | | - | | 764,596,868 | | - |
Total Current | | 9,146,674 | | 783,043,504 | | 328,414 |
| | | | | | |
Interest-bearing loans | | - | | 826,380,628 | | - |
Derivative instruments | | 12,048,542 | | - | | 78,768,620 |
Other financial liabilities | | - | | 6,131,402 | | - |
Total Non-current | | 12,048,542 | | 832,512,030 | | 78,768,620 |
| | | | | | |
Total | | 21,195,216 | | 1,615,555,534 | | 79,097,034 |
a) The detail of financial assets, classified by type and category, as of December 31, 2018 and 2017, is as follows:
| | | | December 31, 2018 | |
| | Financial assets
at fair value
through profit
and loss | | Financial
assets
measured at
amortized cost | | Financial assets
at fair value with
changes in other
comprehensive
income | | Financial
derivatives
for hedging | |
| | ThCh$ | | ThCh$ | | ThCh$ | | ThCh$ | |
Equity instruments | | 90,839 | | — | | 269,031 | | — | |
Trade accounts receivable and other accounts receivable | | — | | 529,467,040 | | — | | — | |
Derivative instruments | | 1,491,497 | | — | | 1,423,613 | | 39,022,012 | |
Other financial assets | | — | | 880,268 | | — | | — | |
Total Current | | 1,582,336 | | 530,347,308 | | 1,692,644 | | 39,022,012 | |
| | | | | | | | | |
Equity instruments | | — | | — | | 2,352,894 | | — | |
Trade accounts receivable and other accounts receivable | | — | | 60,527,843 | | | | | |
Derivative instruments | | 36,086 | | — | | — | | 4,191,543 | |
Other financial assets | | — | | 689,146 | | — | | — | |
Total Non-current | | 36,086 | | 61,216,989 | | 2,352,894 | | 4,191,543 | |
| | | | | | | | | |
Total | | 1,618,422 | | 591,564,297 | | 4,045,538 | | 43,213,555 | |
| | | | December 31, 2017 | |
| | Financial assets
at fair value
through profit
and loss | | Financial
assets
measured at
amortized cost | | Financial assets
at fair value with
changes in other
comprehensive
income | | Financial
derivatives
for hedging | |
| | ThCh$ | | ThCh$ | | ThCh$ | | ThCh$ | |
Trade accounts receivable and other accounts receivable | | — | | 463,197,062 | | — | | — | |
Derivative instruments | | 402,716 | | — | | — | | 20,038,433 | |
Other financial assets | | 9,940,955 | | 185,913 | | 5,742,633 | | — | |
Total Current | | 10,343,671 | | 463,382,975 | | 5,742,633 | | 20,038,433 | |
| | | | | | | | | |
Equity instruments | | 33,158 | | — | | 2,595,343 | | — | |
Trade accounts receivable and other accounts receivable | | — | | 36,182,399 | | | | | |
Derivative instruments | | — | | — | | — | | 30,789,703 | |
Other financial assets | | — | | — | | — | | — | |
Total Non-current | | 33,158 | | 36,182,399 | | 2,595,343 | | 30,789,703 | |
| | | | | | | | | |
Total | | 10,376,829 | | 499,565,374 | | 8,337,976 | | 50,828,136 | |
The book value of trade accounts receivable and payable approximates their fair value.
F-98
Table of Contents20.2
b) The detail of financial liabilities, classified by type and category, as of December 31, 2018 and 2017, is as follows:
| | December 31, 2018 | |
| | Financial liabilities
held for trading | | Loans and payables | | Financial
Liabilities at fair
value with changes
in other result | | Financial derivatives
for hedging | |
| | ThCh$ | | ThCh$ | | ThCh$ | | ThCh$ | |
Interest-bearing loans | | — | | 329,262,093 | | — | | — | |
Commercial accounts and other accounts payable | | — | | 702,770,048 | | — | | — | |
Derivative instruments | | 756,005 | | — | | 7,161,949 | | 81,195,765 | |
Total Current | | 756,005 | | 1,032,032,141 | | 7,161,949 | | 81,195,765 | |
| | | | | | | | | |
Interest-bearing loans | | — | | 1,703,044,158 | | — | | — | |
Commercial accounts and other accounts payable | | — | | 449,777,982 | | — | | — | |
Derivative instruments | | 159,630 | | — | | | | 2,629,715 | |
Total Non-current | | 159,630 | | 2,152,822,140 | | — | | 2,629,715 | |
| | | | | | | | | |
Total | | 915,635 | | 3,184,854,281 | | 7,161,949 | | 83,825,480 | |
| | December 31, 2017 | |
| | Financial liabilities
held for trading | | Loans and payables | | Financial
Liabilities at fair
value with changes
in other result | | Financial derivatives
for hedging | |
| | ThCh$ | | ThCh$ | | ThCh$ | | ThCh$ | |
Interest-bearing loans | | — | | 17,255,692 | | — | | — | |
Commercial accounts and other accounts payable | | — | | 669,753,051 | | — | | — | |
Derivative instruments | | 1,255,478 | | — | | — | | 304,278 | |
Other financial liabilities | | 889,026 | | — | | — | | — | |
Total Current | | 2,144,504 | | 687,008,743 | | — | | 304,278 | |
| | | | | | | | | |
Interest-bearing loans | | — | | 760,932,929 | | — | | — | |
Derivative instruments | | — | | — | | — | | 21,045,216 | |
Other financial liabilities | | — | | 978,342 | | — | | — | |
Total Non-current | | — | | 761,911,271 | | — | | 21,045,216 | |
| | | | | | | | | |
Total | | 2,144,504 | | 1,448,920,014 | | — | | 21,349,494 | |
23.2 Derivative instruments
The risk management policy of the Group uses primarily interest rate and foreign exchange rate derivatives to hedge its exposure to interest rate and foreign currency risks.
The Group classifies its derivatives as follows:
·Cash flow hedges: Those that hedge the cash flows of the underlying hedged item.
·Fair value hedges: Those that hedge the fair value of the underlying hedged item.
·Non-hedge derivatives: Financial derivatives that do not meet the requirements established by IFRS to be designated as hedge instruments are recorded at fair value with changes in net income (assets held for trading).
F-99
Table of Contents a)Assets and liabilities for hedge derivative instruments | a)
| Assets and liabilities for hedge derivative instruments
|
As of December 31, 20162018 and 2015,2017, financial derivative transactions qualifying as hedge instruments resulted in recognition of the following assets and liabilities in the consolidated statement of financial position:
| | December 31, 2016 | | December 31, 2018 | |
| | Assets | | Liabilities | | Assets | | Liabilities | |
| | Current | | Non-current | | Current | | Non-current | | Current | | Non-current | | Current | | Non-current | |
| ThCh$ | | ThCh$ | | ThCh$ | | ThCh$ | | ThCh$ | | ThCh$ | | ThCh$ | | ThCh$ | |
Interest rate hedge: | | | 852,119 | | 4,191,543 | | | | | |
Cash flow hedge | | | 852,119 | | 4,191,543 | | | | | |
Exchange rate hedge: | | 121,443 | | 25,533,189 | | 313,571 | | 48,981,953 | | 38,169,893 | | — | | 81,195,765 | | 2,629,715 | |
Cash flow hedge | | 121,443 | | 25,533,189 | | 313,571 | | 48,981,953 | | 38,169,893 | | — | | 81,195,765 | | 2,629,715 | |
Total | | 121,443 | | 25,533,189 | | 313,571 | | 48,981,953 | | 39,022,012 | | 4,191,543 | | 81,195,765 | | 2,629,715 | |
| | | | | | | | | |
| | December 31, 2015 | |
| | Assets | | Liabilities | |
| | Current | | Non-current | | Current | | Non-current | |
| ThCh$ | | ThCh$ | | ThCh$ | | ThCh$ | |
Exchange rate hedge: | | 76,704 | | 18,716,463 | | 328,414 | | 78,768,620 | |
Cash flow hedge | | 76,704 | | 18,716,463 | | 328,414 | | 78,768,620 | |
Total | | 76,704 | | 18,716,463 | | 328,414 | | 78,768,620 | |
| | December 31, 2017 | |
| | Assets | | Liabilities | |
| | Current | | Non-current | | Current | | Non-current | |
| | ThCh$ | | ThCh$ | | ThCh$ | | ThCh$ | |
Exchange rate hedge: | | 20,038,433 | | 30,789,703 | | 304,278 | | 21,045,216 | |
Cash flow hedge | | 20,038,433 | | 30,789,703 | | 304,278 | | 21,045,216 | |
Total | | 20,038,433 | | 30,789,703 | | 304,278 | | 21,045,216 | |
General information on hedge derivative instruments
Hedge derivative instruments and their corresponding hedged instruments are shown in the following table:
| | | | | | Fair value of | | Fair value of | | | |
| | | | | | hedged item | | hedged item | | | |
Detail of hedging
instrument | | | | | | 12-31-2018 | | 12-31-2017 | | | |
| Description of hedging instrument | | Description of hedged item | | ThCh$ | | ThCh$ | | Type of risk hedged | |
SWAP | | Exchange rate | | Unsecured obligations (bonds) (*) | | (18,892,400 | ) | 7,696,061 | | Cash Flow | |
SWAP | | Interest rate | | Bank loans | | 5,043,662 | | — | | Cash Flow | |
FORWARD | | Exchange rate | | Revenues | | (26,763,187 | ) | 21,782,581 | | Cash Flow | |
Detail of hedging instrument | | Description of hedging instrument | | Description of hedged item | | Fair value of hedged item | | Fair value of hedged item |
| | | 12-31-2016 | | 12-31-2015 |
| | | ThCh$ | | ThCh$ |
SWAP | | Exchange rate | | Unsecured obligations (bonds) | | (23,640,892) | | (60,303,867) |
(*) See note 22.2.
For the years ended December 31, 2016, 20152018 and 2014,2017 the Group hasdid not recognizedrecognize gains or losses for ineffective cash flow hedges.
The Group has not entered into any fair value hedges for any of the periods reported.
b)Financial derivative instrument assets and liabilities at fair value through profit or loss | b)
| Financial derivative instrument assets and liabilities at fair value through profit or loss
|
As of December 31, 20162018 and 2015,2017, financial derivative transactions recorded at fair value through profit or loss, resulted in the recognition of the following assets and liabilities in the statement of financial position:
| | December 31, 2016 | | December 31, 2015 |
| | Current Assets | | Current Liabilities | | Non-Current Assets | | Non-Current Liabilities | | Current Assets | | Current Liabilities | | Non-Current Assets | | Non-Current Liabilities |
| ThCh$ | | ThCh$ | | ThCh$ | | ThCh$ | | ThCh$ | | ThCh$ | | ThCh$ | | ThCh$ |
Non-hedging derivative instrument | | - | | 7,369,481 | | - | | 2,987,830 | | - | | 9,146,674 | | - | | 12,048,542 |
| | December 31, 2018 | | December 31, 2017 | |
| | Current
Assets | | Current
Liabilities (*) | | Non-
Current
Assets | | Non-Current
Liabilities (*) | | Current
Assets | | Current
Liabilities (*) | | Non-
Current
Assets | | Non-Current
Liabilities (*) | |
| | ThCh$ | | ThCh$ | | ThCh$ | | ThCh$ | | ThCh$ | | ThCh$ | | ThCh$ | | ThCh$ | |
Non-hedging derivative instrument | | 41,023 | | 207,957 | | 36,086 | | 159,630 | | 402,716 | | 1,255,478 | | — | | — | |
F-100
Table of Contents These derivative instruments correspond to forward contracts entered into by the Group, whose purpose is to hedge the exchange rate risk related to future obligations arising from civil works contracts linked to the construction of the Los Cóndores Plant. Although these hedges have an economic substance, they do not qualify for hedge accounting because they do not strictly comply with the hedge accounting requirements established in IFRS 9 Financial Instruments. c)Other information on derivatives: | c)
| Other information on derivatives:
|
The following tables present the fair value of hedging and non-hedging derivatives entered into by the Group as well as the remaining contractual maturities as of December 31, 20162018 and 2015:2017:
| | December 31, 2016 | | December 31, 2018 | |
| | | Notional Amount | | | | Notional Amount | |
Financial derivatives | | Fair value | | Less than 1 year | | 1-2 years | | 2-3 years | | 3-4 years | | 4-5 years | | Total | |
| | Fair value | | Less than 1 year | | 1-2 years | | 2-3 years | | 3-4 years | | 4-5 years | | Total | |
Financial derivatives | | ThCh$ | | ThCh$ | | ThCh$ | | ThCh$ | | ThCh$ | | ThCh$ | | ThCh$ | | ThCh$ | | ThCh$ | | ThCh$ | | ThCh$ | | ThCh$ | | ThCh$ | | ThCh$ | |
| - | | - | | - | | - | | - | | - | | - | | 5,043,662 | | 69,477,000 | | 104,215,500 | | 104,215,500 | | — | | — | | 277,908,000 | |
Cash flow hedge | | - | | - | | - | | - | | - | | - | | - | | 5,043,662 | | 69,477,000 | | 104,215,500 | | 104,215,500 | | — | | — | | 277,908,000 | |
Exchange rate hedge: | | (23,640,892) | | - | | - | | 523,686,966 | | - | | - | | 523,686,966 | | (45,655,587 | ) | 1,227,557,071 | | 76,355,223 | | — | | — | | — | | 1,303,912,294 | |
Cash flow hedge | | (23,640,892) | | - | | - | | 523,686,966 | | - | | - | | 523,686,966 | | (45,655,587 | ) | 1,227,557,071 | | 76,355,223 | | — | | — | | — | | 1,303,912,294 | |
Derivatives not designated for hedge accounting | | (10,357,311) | | 49,738,751 | | 21,434,625 | | - | | - | | - | | 71,173,376 | | (290,478 | ) | 34,525,045 | | 29,457,793 | | 1,913,220 | | — | | — | | 65,896,058 | |
Total | | (33,998,203) | | 49,738,751 | | 21,434,625 | | 523,686,966 | | - | | - | | 594,860,342 | | (40,902,403 | ) | 1,331,559,116 | | 210,028,516 | | 106,128,720 | | — | | — | | 1,647,716,352 | |
| | | |
| | December 31, 2015 | |
| | | Notional Amount | |
Financial derivatives | | Fair value | | Less than 1 year | | 1-2 years | | 2-3 years | | 3-4 years | | 4-5 years | | Total | |
| ThCh$ | | ThCh$ | | ThCh$ | | ThCh$ | | ThCh$ | | ThCh$ | | ThCh$ | |
Interest rate hedge: | | - | | - | | - | | - | | - | | - | | - | |
Cash flow hedge | | - | | - | | - | | - | | - | | - | | - | |
Exchange rate hedge: | | (60,303,867) | | - | | - | | - | | 541,153,412 | | - | | 541,153,412 | |
Cash flow hedge | | (60,303,867) | | - | | - | | - | | 541,153,412 | | - | | 541,153,412 | |
Derivatives not designated for hedge accounting | | (21,195,216) | | 55,337,986 | | 52,761,844 | | 22,737,409 | | - | | - | | 130,837,239 | |
Total | | (81,499,083) | | 55,337,986 | | 52,761,844 | | 22,737,409 | | 541,153,412 | | - | | 671,990,651 | |
| | December 31, 2017 | |
| | | | Notional Amount | |
| | Fair value | | Less than 1 year | | 1-2 years | | 2-3 years | | 3-4 years | | 4-5 years | | Total | |
Financial derivatives | | ThCh$ | | ThCh$ | | ThCh$ | | ThCh$ | | ThCh$ | | ThCh$ | | ThCh$ | |
Interest rate hedge: | | — | | — | | — | | — | | — | | — | | — | |
Cash flow hedge | | — | | — | | — | | — | | — | | — | | — | |
Exchange rate hedge: | | 29,478,642 | | 306,350,419 | | 525,812,635 | | — | | — | | — | | 832,163,054 | |
Cash flow hedge | | 29,478,642 | | 306,350,419 | | 525,812,635 | | — | | — | | — | | 832,163,054 | |
Derivatives not designated for hedge accounting | | (852,762 | ) | 19,682,638 | | — | | — | | — | | — | | 19,682,638 | |
Total | | 28,625,880 | | 326,033,057 | | 525,812,635 | | — | | — | | — | | 851,845,692 | |
The hedging and non-hedging derivatives contractual maturities do not represent the Group’s total risk exposure, as the amounts presented in the above tables have been drawn up based on undiscounted contractual cash inflows and outflows for their settlement.
20.3
23.3 Fair value hierarchy
Financial instruments recognized at fair value in the consolidated statement of financial position are classified, based on the hierarchy described in Note 3.h.
F-101
Table of Contents
The following table presents financial assets and liabilities measured at fair value as of December 31, 20162018 and 2015:2017:
| | | | Fair Value Measured at End of Reporting Period Using: | | | | Fair Value Measured at End of Reporting Period Using: | |
Financial Instruments Measured at Fair Value | | 12-31-2016 | | Level 1 | | Level 2 | | Level 3 | |
| | 12-31-2018 | | Level 1 | | Level 2 | | Level 3 | |
Financial Instruments Measured at Fair Value | | ThCh$ | | ThCh$ | | ThCh$ | | ThCh$ | | ThCh$ | | ThCh$ | | ThCh$ | | ThCh$ | |
| | | | | | | | | | | | | | | | |
Financial derivatives designated as cash flow hedges | | 25,654,632 | | - | | 25,654,632 | | - | | 43,213,555 | | — | | 43,213,555 | | — | |
Commodity derivatives not designated for hedge accounting | | 875,841 | | - | | 875,841 | | - | |
Financial derivatives not designated for hedge accounting | | | 77,109 | | — | | 77,109 | | — | |
Commodity derivatives not designated as cash flow hedges | | | 1,450,474 | | — | | 1,450,474 | | — | |
Commodity derivatives designated as cash flow hedges | | 16,159,565 | | - | | 16,159,565 | | - | | 1,423,613 | | — | | 1,423,613 | | | |
Available-for-sale financial assets, non-current | | 25,381 | | 25,381 | | - | | - | | 359,870 | | — | | 359,870 | | — | |
Total | | 42,715,419 | | 25,381 | | 42,690,038 | | - | | 46,524,621 | | — | | 46,524,621 | | — | |
Financial Liabilities: | | | | | | | | | | | | | | | | | |
Financial derivatives designated as cash flow hedges | | 49,295,524 | | - | | 49,295,524 | | - | | 83,825,480 | | — | | 83,825,480 | | — | |
Financial derivatives not designated for hedge accounting | | 10,357,311 | | - | | 10,357,311 | | - | | 367,587 | | — | | 367,587 | | — | |
Commodity derivatives not designated for hedge accounting | | 40,013 | | - | | 40,013 | | - | | 548,048 | | — | | 548,048 | | — | |
Commodity derivatives designated as cash flow hedges | | 1,063,193 | | - | | 1,063,193 | | - | | 7,161,949 | | — | | 7,161,949 | | — | |
Total | | 60,756,041 | | - | | 60,756,041 | | - | | 91,903,064 | | — | | 91,903,064 | | — | |
| | | | | | | | | |
| | | | | | | Fair Value Measured at End of Reporting Period Using: | |
| | | | Fair Value Measured at End of Reporting Period Using: | |
Financial Instruments Measured at Fair Value | | 12-31-2015 | | Level 1 | | Level 2 | | Level 3 | |
| ThCh$ | | ThCh$ | | ThCh$ | | ThCh$ | |
Financial Instruments Measured at Fair | | | 12-31-2017 | | Level 1 | | Level 2 | | Level 3 | |
Value | | | ThCh$ | | ThCh$ | | ThCh$ | | ThCh$ | |
Financial Assets: | | | | | | | | | | | | | | | | | |
Financial derivatives designated as cash flow hedges | | 18,793,167 | | - | | 18,793,167 | | - | | 50,828,136 | | — | | 50,828,136 | | — | |
Financial derivatives not designated for hedge accounting | | 20,397 | | - | | 20,397 | | - | | 402,716 | | — | | 402,716 | | — | |
Commodity derivatives not designated as cash flow hedges | | | 9,940,955 | | — | | 9,940,955 | | — | |
Commodity derivatives designated as cash flow hedges | | | 5,742,633 | | — | | 5,742,633 | | | |
Available-for-sale financial assets, non-current | | 32,121 | | 32,121 | | - | | - | | 33,158 | | 33,158 | | — | | — | |
Total | | 18,845,685 | | 32,121 | | 18,813,564 | | - | | 66,947,598 | | 33,158 | | 66,914,440 | | — | |
Financial Liabilities: | | | | | | | | | | | | | | | | | |
Financial derivatives designated as cash flow hedges | | 79,097,034 | | - | | 79,097,034 | | - | | 21,349,494 | | — | | 21,349,494 | | — | |
Financial derivatives not designated for hedge accounting | | 21,195,216 | | - | | 21,195,216 | | - | | 1,255,478 | | — | | 1,255,478 | | — | |
Commodity derivatives not designated for hedge accounting | | | — | | — | | — | | — | |
Commodity derivatives designated as cash flow hedges | | | 889,026 | | — | | 889,026 | | — | |
Total | | 100,292,250 | | - | | 100,292,250 | | - | | 23,493,998 | | — | | 23,493,998 | | — | |
20.3.123.4 Financial instruments whose fair value measurement is classified as Level 3.
The Group entered into certain transaction that resulted in the recognition of a financial liability measured at fair value. The Level 3 fair value is calculated by applying a traditional discounted cash flow method. These projected cash flows include assumptions internally developed by the Company that are primarily based on estimates for prices and levels of energy production and firm capacity, as well as the costs of operating and maintaining some of our power plants.
None of the possible reasonable scenarios foreseeable in the assumptions mentioned in the above paragraph would result in a significant change in the fair value of the financial instruments included at this level. As of December 31, 2016 and 2015, there are nodoes not have any financial instruments whose fair value measurement is classified as Level 3.
F-102
21.
| TRADE AND OTHER CURRENT PAYABLES.
|
The breakdownTable of Trade and Other Payables as of December 31, 2016 and 2015, is as follows:Contents
| | Current | | Non-current |
Trade and other payables | | 12-31-2016 | | 12-31-2015 | | 12-31-2016 | | 12-31-2015 |
| ThCh$ | | ThCh$ | | ThCh$ | | ThCh$ |
Trade payables | | 158,763,714 | | 204,495,990 | | - | | - |
Other payables (1) | | 402,741,569 | | 350,419,981 | | 1,483,113 | | 6,034,216 |
Total | | 561,505,283 | | 554,915,971 | | 1,483,113 | | 6,034,216 |
24.TRADE AND OTHER CURRENT PAYABLES.
| (1)
| Chilectra recognized costs and trade and other payables for the difference between current and effective Short Term Node Prices for ThCh$4,367,657 as of December 31, 2016 (ThCh$31,959,398 as of December 31, 2015) to be paid to generation companies.
|
The detail of Trade and Other Current Payables as of December 31, 20162018 and 2015,2017, is as follows:
| | | | | | | | Current | | Non-current | |
| | Current | | Non-current | | 12-31-2018 | | 12-31-2017 | | 12-31-2018 | | 12-31-2017 | |
Trade and other payables | | 12-31-2016 | | 12-31-2015 | | 12-31-2016 | | 12-31-2015 | |
| ThCh$ | | ThCh$ | | ThCh$ | | ThCh$ | |
Trade and Other Payables | | | ThCh$ | | ThCh$ | | ThCh$ | | ThCh$ | |
Energy suppliers | | 140,739,018 | | 161,801,253 | | - | | - | | 155,123,059 | | 172,042,187 | | — | | — | |
Fuel and gas suppliers | | 18,024,696 | | 42,694,736 | | - | | - | | 39,787,839 | | 13,300,051 | | — | | — | |
Payables for goods and services | | 230,906,671 | | 230,999,488 | | 40,256 | | - | | 155,054,466 | | 149,301,377 | | 6,766 | | 4,485 | |
Dividends payable to non-controlling interests | | 97,094,197 | | 56,428,785 | | - | | - | |
Payables for assets acquisition | | | 116,157,897 | | 92,806,426 | | 2,106,099 | | — | |
Subtotal Trade Payables | | | 466,123,261 | | 427,450,041 | | 2,112,865 | | 4,485 | |
Other Payables | | | | | | | | | | |
Dividends payable to third parties | | | 52,059,048 | | 95,150,149 | | — | | — | |
Warranty deposits | | | 365,857 | | 402,107 | | — | | — | |
Fines and complaints | | | 165,102 | | — | | — | | — | |
Taxes payables other than income tax | | 11,581,921 | | 10,870,376 | | - | | - | | 1,742,603 | | 4,894,779 | | — | | — | |
VAT debit | | 22,396,497 | | 11,306,810 | | - | | - | |
Mitsubishi contract (LTSA) | | 10,582,997 | | 6,402,157 | | - | | - | |
Obligations for social programs | | 28,952,388 | | 580,706 | | - | | - | |
Accounts payable to staff | | | 30,686,679 | | 27,466,888 | | — | | — | |
Other payables | | 1,226,898 | | 33,831,660 | | 1,442,857 | | 6,034,216 | | 3,143,774 | | 614,554 | | 471,315 | | 655,339 | |
Subtotal Other current payables | | | 88,163,063 | | 128,528,477 | | 471,315 | | 655,339 | |
Total | | 561,505,283 | | 554,915,971 | | 1,483,113 | | 6,034,216 | | 554,286,324 | | 555,978,518 | | 2,584,180 | | 659,824 | |
See Note 19.422.4 for the description of the liquidity risk management policy.
The detail of trade payables, both non-past due and past due as of December 31, 20162018 and 2015,2017, are presented in Appendix 7.3.
| a)
| The breakdown of provisions as of December 31, 2016 and 2015, is as follows:
|
25.PROVISIONS.
a) The breakdown of provisions as of December 31, 2018 and 2017, is as follows:
| | Current | | Non-current | |
| | 12-31-2018 | | 12-31-2017 | | 12-31-2018 | | 12-31-2017 | |
Provisions | | ThCh$ | | ThCh$ | | ThCh$ | | ThCh$ | |
Provision for legal proceedings | | 3,884,018 | | 3,497,786 | | 13,468,858 | | 13,936,190 | |
Decommissioning or restoration (1) | | — | | — | | 92,402,517 | | 64,486,647 | |
Other provisions | | 1,704,768 | | 2,138,385 | | — | | — | |
Total | | 5,588,786 | | 5,636,171 | | 105,871,375 | | 78,422,837 | |
| | Current | | Non-current |
Provisions | | 12-31-2016 | | 12-31-2015 | | 12-31-2016 | | 12-31-2015 |
| ThCh$ | | ThCh$ | | ThCh$ | | ThCh$ |
Provision for legal proceedings (2) | | 4,694,579 | | 9,798,766 | | 5,308,206 | | 5,030,598 |
Decommissioning or restoration (1) | | - | | - | | 57,798,702 | | 51,085,542 |
Other provisions | | 1,798,953 | | 6,530,429 | | - | | - |
Total | | 6,493,532 | | 16,329,195 | | 63,106,908 | | 56,116,140 |
(1) See Note 3.
The provisions for decommissioning originate from the fact that, considering the new environmental institutions in Chile, the scope of the rights and obligations associated with environmental licenses have been clarified in recent times. In light of the foregoing, the provisions have been adjusted to reflect the best estimate at the closing date of the financial statements.
F-103
| (1)
| Provision for decommissioning or restorations arises from the Bocamina II project and San Isidro Power Plant.
|
| (2)
| Provision for legal proceedings mainly consist of the contingencies related to lawsuits on administrative sanctions from our regulators.
|
The expected timingamount and amounttiming of any cash outflowsdisbursements related to the aboveforegoing provisions is uncertain and depends on the resolution of specific issues related to each of them. For example, in the specific case of litigation, this depends on the final resolution of the provisioned matters.corresponding legal claim. Management considers that the provisions recognized in the financial statements adequately cover the corresponding risks.
| b)
| Changes in provisions as of December 31, 2016 and 2015, are as follows:
|
b) Changes in provisions as of December 31, 2018 and 2017, are as follows:
| | Legal
Proceedings | | Decommissioning or
Restoration | | Environment
and Other
Provisions | | Total | |
Changes in Provisions | | ThCh$ | | ThCh$ | | ThCh$ | | ThCh$ | |
Balance at January 1, 2018 | | 17,433,976 | | 64,486,647 | | 2,138,385 | | 84,059,008 | |
Increase (decrease) in existing provisions (2) | | 1,842,257 | | 23,395,295 | | (253,939 | ) | 24,983,613 | |
Provisions used | | (1,150,386 | ) | — | | (501,234 | ) | (1,651,620 | ) |
Reversal of unused provision | | (743,927 | ) | — | | — | | (743,927 | ) |
Increase from adjustment to time value of money (1) | | — | | 3,176,001 | | — | | 3,176,001 | |
Foreign currency translation | | (29,044 | ) | 1,344,574 | | 321,556 | | 1,637,086 | |
Total changes in provisions | | (81,100 | ) | 27,915,870 | | (433,617 | ) | 27,401,153 | |
Balance at December 31, 2018 | | 17,352,876 | | 92,402,517 | | 1,704,768 | | 111,460,161 | |
| | Legal
Proceedings | | Decommissioning or
Restoration | | Other
Provisions | | Total | |
Changes in Provisions | | ThCh$ | | ThCh$ | | ThCh$ | | ThCh$ | |
Balance at January 1, 2017 | | 10,002,785 | | 57,798,702 | | 1,798,953 | | 69,600,440 | |
Increase (decrease) in existing provisions (2) | | 12,159,920 | | 4,340,858 | | 339,432 | | 16,840,210 | |
Provisions used | | (2,995,017 | ) | — | | — | | (2,995,017 | ) |
Reversal of unused provision | | (1,728,788 | ) | — | | — | | (1,728,788 | ) |
Increase from adjustment to time value of money (1) | | — | | 2,347,087 | | — | | 2,347,087 | |
Foreign currency translation | | (4,924 | ) | — | | — | | (4,924 | ) |
Total changes in provisions | | 7,431,191 | | 6,687,945 | | 339,432 | | 14,458,568 | |
Balance at December 31, 2017 | | 17,433,976 | | 64,486,647 | | 2,138,385 | | 84,059,008 | |
Changes in Provisions | | Legal
Proceedings | | Decommissioning or Restoration (1) | | Other Provisions | | Total |
| ThCh$ | | ThCh$ | | ThCh$ | | ThCh$ |
Balance at January 1, 2016 | | 14,829,364 | | 51,085,542 | | 6,530,429 | | 72,445,335 |
Increase (decrease) in existing provisions | | 111,723 | | 4,161,948 | | (4,731,476) | | (457,805) |
Provisions used | | (4,948,439) | | - | | - | | (4,948,439) |
Increase from adjustment to time value of money (1) | | - | | 2,551,212 | | - | | 2,551,212 |
Foreign currency translation | | 10,137 | | - | | - | | 10,137 |
Total changes in provisions | | (4,826,579) | | 6,713,160 | | (4,731,476) | | (2,844,895) |
Balance at December 31, 2016 | | 10,002,785 | | 57,798,702 | | 1,798,953 | | 69,600,440 |
| | | | | | | | |
Changes in Provisions | | Legal
Proceedings | | Decommissioning or Restoration (1) | | Other Provisions | | Total |
| ThCh$ | | ThCh$ | | ThCh$ | | ThCh$ |
Balance at January 1, 2015 | | 7,511,235 | | 25,572,428 | | 6,509,786 | | 39,593,449 |
Increase (decrease) in existing provisions | | 7,321,430 | | 23,631,287 | | 20,643 | | 30,973,360 |
Provisions used | | - | | - | | - | | - |
Increase from adjustment to time value of money (1) | | - | | 1,881,827 | | - | | 1,881,827 |
Foreign currency translation | | (3,301) | | - | | - | | (3,301) |
Total changes in provisions | | 7,318,129 | | 25,513,114 | | 20,643 | | 32,851,886 |
Balance at December 31, 2015 | | 14,829,364 | | 51,085,542 | | 6,530,429 | | 72,445,335 |
(1) Corresponds to a financially updated amount (see note 34)
(2) Figure involves basically provisions for penalties issued by the Secretary of Energy and Fuels, See note 38.3.
26.EMPLOYEE BENEFIT OBLIGATIONS. 26.1 General information: | (1)
| See Note 31.
|
23.
| EMPLOYEE BENEFIT OBLIGATIONS.
|
23.1General information:
The Group provides various post-employment benefits for all or some of their active or retired employees. These benefits are calculated and recorded in the financial statements according to the criteria described in Note 3.l.1,3.m.1, and include primarily the following:
Defined benefit plans: | a)
| Defined benefit plans:
|
·Complementary pension: The beneficiary is entitled to receive a monthly amount that supplements the pension obtained from the respective social security system.
F-104
Table of Contents
·Employee severance indemnities: The beneficiary receives a certain number of contractual salaries upon retirement. Such benefit is subject to a minimum vesting minimum service requirement period, which depending on the Group, varies within a range from 5 to 15 years.
·Electricity: The beneficiary receives a monthly bonus to cover a portion of their billed residential electricity consumption.
·Health benefit: The beneficiary receives health coverage in addition to that to which they are entitled to under applicable social security regime.system.
23.2
26.2Details, changes and presentation in financial statements:
a) The post-employment obligations associated with the defined benefits plan as of December 31, 2018, 2017 and 2016, are as follows: | a)
| The post-employment obligations associated with the defined benefits plan as of December 31, 2016 and 2015, are as follows:
|
General ledger accounts:
| | 12-31-2016 | | 12-31-2015 | | 12-31-2018 | | 12-31-2017 | | 12-31-2016 | |
| ThCh$ | | ThCh$ | | ThCh$ | | ThCh$ | | ThCh$ | |
Post-employment obligations | | 59,934,127 | | 55,023,456 | | 56,602,664 | | 57,081,924 | | 59,934,127 | |
Total | | 59,934,127 | | 55,023,456 | | 56,602,664 | | 57,081,924 | | 59,934,127 | |
Total post-employment obligations, net | | 59,934,127 | | 55,023,456 | | 56,602,664 | | 57,081,924 | | 59,934,127 | |
b) The following amounts were recognized in the consolidated statement of comprehensive income for the years ended December 31, 2018, 2017 and 2016:
| | For the years ended December 31, | |
Expense Recognized in the Statement of | | 2018 | | 2017 | | 2016 | |
Comprehensive Income | | ThCh$ | | ThCh$ | | ThCh$ | |
Current service cost for defined benefits plan | | 1,920,262 | | 2,091,205 | | 1,899,660 | |
Interest cost for defined benefits plan (1) | | 2,750,376 | | 2,678,300 | | 2,517,406 | |
Past service cost | | (39,060 | ) | — | | — | |
Expenses recognized in the Statement of Income | | 4,631,578 | | 4,769,505 | | 4,417,066 | |
Gains (losses) from remeasurement of defined benefit plans | | (37,881 | ) | (1,716,875 | ) | 6,618,514 | |
Total expense recognized in the Statement of Comprehensive Income | | 4,593,697 | | 3,052,630 | | 11,035,580 | |
(1) See Note 34
F-105
Table of Contents
c) The balance and changes in post-employment defined benefit obligations as of and for the years ended December 31, 2018, 2017 and 2016, are as follows:
| b)
| The following amounts were recognized in the consolidated statement of comprehensive income for the years ended December 31, 2016, 2015 and 2014:
|
| | For the years ended December 31, |
Expense Recognized in the Statement of Comprehensive Income | | 2016 | | 2015 | | 2014 |
| ThCh$ | | ThCh$ | | ThCh$ |
Current service cost for defined benefits plan | | 1,899,660 | | 2,282,226 | | 1,642,846 |
Interest cost for defined benefits plan | | 2,517,406 | | 2,299,944 | | 2,139,043 |
Past service costs | | - | | - | | 667,153 |
Expenses recognized in the Statement of Income | | 4,417,066 | | 4,582,170 | | 4,449,042 |
Gains (losses) from remeasurement of defined benefit plans | | 6,618,514 | | 5,645,532 | | 12,692,856 |
Total expense recognized in the Statement of Comprehensive Income | | 11,035,580 | | 10,227,702 | | 17,141,898 |
| c)
| The balance and changes in post-employment defined benefit obligations as of and for the years ended December 31, 201, 2015 and 2014, are as follows:
|
Actuarial Value of Post-employment Obligations |
| ThCh$ |
|
Balance at January 1, 2016 | | ThCh$
|
Balance at January 1, 201455,023,456
| | 41,495,612
|
Current service cost
| | 1,642,846
|
Net Interest cost
| | 2,139,043
|
Actuarial (gains) losses from changes in financial assumptions
| | 6,190,052
|
Actuarial (gains) losses from changes in experience adjustments
| | 6,502,804
|
Benefits paid
| | (5,007,250)
|
Foreign currency translation
| | (273,590)
|
Past service cost
| | 667,153
|
Defined benefit plan obligations from business combinations
| | 1,297,048
|
Transfers of employees
| | (102,423)
|
Other
| | (613,453)
|
Balance at December 31, 2014
| | 53,937,842
|
Current service cost
| | 2,282,226
|
Net Interest cost
| | 2,299,944
|
Actuarial (gains) losses from changes in financial assumptions
| | 2,549,816
|
Actuarial (gains) losses from changes in experience adjustments
| | 3,095,716
|
Foreign currency translation
| | (697)
|
Benefits paid
| | (9,008,811)
|
Other
| | (132,580)
|
Balance at December 31, 2015
| | 55,023,456
|
Current service cost | | 1,899,660 | |
Net Interest cost | | 2,517,406 | |
Actuarial (gains) losses from changes in financial assumptions | | 1,073,475 | |
Actuarial (gains) losses from changes in experience adjustments | | 5,545,039 | |
Benefits paid | | (7,771,781)(7,771,781
| ) |
Transfers of employees | | 1,337,621 | |
Other | | 309,251 | |
Balance at December 31, 2016 | | 59,934,127 | |
Current service cost | | 2,091,205 | |
Net Interest cost | | 2,678,300 | |
Actuarial (gains) losses from changes in financial assumptions | | (1,414,201 | ) |
Actuarial (gains) losses from changes in experience adjustments | | (302,674 | ) |
Benefits paid | | (5,917,552 | ) |
Transfers of employees | | 12,719 | |
Other | | — | |
Balance at December 31, 2017 | | 57,081,924 | |
Current service cost | | 1,920,262 | |
Net Interest cost | | 2,750,376 | |
Actuarial (gains) losses from changes in financial assumptions | | 789,809 | |
Actuarial (gains) losses from changes in experience adjustments | | (827,690 | ) |
Foreign currency translation | | 124,929 | |
Benefits paid | | (5,469,357 | ) |
Past service cost of Defined Benefit Plan Obligations | | (39,060 | ) |
Defined benefit plan obligations from business combinations | | 602,816 | |
Transfers of employees | | (331,345 | ) |
Balance at December 31, 2018 | | 56,602,664 | |
The Group companies make no contributions to fund for financing the payment of these benefits.
26.3 Other disclosures:
As of December 31, 20162018, 2017 and 2015,2016, the following assumptions were used in the actuarial calculation of defined benefits:
| | 12-31-2016 | | 12-31-2015 | | 12-31-2014 | | 12-31-2018 | | 12-31-2017 | | 12-31-2016 | |
Discount rates used | | 4.70% | | 5.00% | | 4.60% | | 4.70% | | 5.00% | | 4.70% | |
Expected rate of salary increases | | 4.00% | | 4.00% | | 4.00% | | 3.80% | | 4.00% | | 4.00% | |
Turnover rate | | 4.72% | | 4.89% | | 5,22% | | 4.40% | | 4.57% | | 4.72% | |
Mortality tables | | CB-H-2014 / RV-M-2014 | | RV-2009 | | RV-2009 | | CB-H-2014 / RV-M-2014 | | CB-H-2014 / RV-M-2014 | | CB-H-2014 / RV-M-2014 | |
As of December 31, 20162018 and 2015,2017, the sensitivity value of the actuarial liability for post-employment benefits to variations of 100 basis points in the discount rate assumes a decrease of ThCh$4,665,9154,296,927 and ThCh$4,077,537,4,269,704, respectively, if the rate rises, and an increase of ThCh$5,241,3954,773,734 and ThCh$4,727,816,4,773,942, respectively, if the rate falls.
F-106
The estimates available indicate that ThCh$5,898,0625,801,478 will be disbursed for defined benefit plans in the next year. Benefit payments are made directly by the Company and its subsidiaries, as there is no trust fund established for the benefit plans and therefore no plan assets.
·Term of commitments | •
| Term of commitments
|
The Group’s obligations have a weighted average length of 9.368.36 years, and the flow for benefits for the next fiveten years and more is expected to be as follows:
Years | | ThCh$ | | ThCh$ | |
1 | | 5,898,062 | | 5,801,478 | |
2 | | 4,526,285 | | 4,270,340 | |
3 | | 5,091,426 | | 4,984,423 | |
4 | | 4,277,891 | | 4,777,882 | |
5 | | 5,204,425 | | 4,099,105 | |
Over 5 | | 24,683,618 | | 23,557,891 | |
27.EQUITY.24.1
27.1 Equity attributable to the shareholders of Enel Chile
The issued capital of the Company for the year endedEnel Chile as of December 31, 20162018 is Ch$2,229,108,974,538ThCh$3,954,491,479 and is divided into 70,134,077,818 authorized, subscribed and paid-in shares. The capital of Enel Chile as of December 31, 2017 was ThCh$2,229,108,975 and was divided into 49,092,772,762 shares. The Company was initially incorporated on January 22, 2016 underAll the name of Enersisshares issued by Enel Chile S.A.are subscribed and its shares began topaid in and can be traded on the Santiago Stock Exchange, the Chilean Electronic Stock Exchange, the Valparaíso Stock Exchange and the New York Stock Exchange (NYSE).
27.1.2 Treasury shares
The treasury shares for the year ended December 31, 2018 are ThCh$72,388,009 divided into 967,520,598 shares, and were acquired as part of the merger process with Enel Green Power Latin América Ltda. (“EGPL”).
27.1.3 Changes in the Capital Issued as a result of the Corporate Reorganization
As a result of the corporate reorganization (as described in note 6), the Company increased its share capital through the voluntary Tender Offer of Shares on the shares of the subsidiary Enel Generación Chile (Enel Generación) and the merger with EGPL, whereby the renewable assets of Enel S.p.A. in Chile are incorporated into Enel Chile
·Tender Offer over Enel Generación:
During the Tender Offer period, the Company received acceptances and sale orders for a total of 2,582,336,287 shares of Enel Generación and 5,691,996 ADSs equivalent to 170,759,880 shares of Enel Generación. As a result, the Company increased its interest, becoming the holder of 2,753,096,167 shares issued by Enel Generación. In accordance with the terms and conditions set forth in the transaction, the shareholders of Enel Generación who agreed to sell their shares were allocated 40% of the established purchase price (Ch$590 per share) to subscribe to first issue shares of Enel Chile, receiving for said 40% of the established purchase price, 2.87807 shares of Enel Chile for each share issued by Enel Generación sold in the offer. As a result, the shareholders of Enel Generación received Ch$1,624,326,738,530 in cash, divided into Ch$1,523,578,409,330 to domestic shareholders and Ch$100,748,329,200 to foreign shareholders. In turn, these shareholders subscribed to shares of Enel Chile for a total of Ch$649,730,695,412 equivalent to 7,923,600,070 shares.
F-107
Table of Contents
·Pre-emptive subscription right:
The Corporations Law gives existing shareholders of a Company a preemptive right to subscribe for shares issued in a capital increase, in proportion to their interest in the company.
Any shareholder existing at the date of Enel Chile’s capital increase was able to exercise such right by paying exclusively in cash for those shares.
As of the closing date of these financial statements, the number of shares that have exercised their preemptive subscription rights is 47,860,124 shares, paying for each share Ch$82.00, and therefore the capital increased by Ch$3,924,530,168.
·Merger with Enel Green Power Latin America:
The reorganization resulted in the merger of EGPL with Enel Chile, a process that took place after the tender offer was declared successful, which took effect on April 21, 2016.2, 2018. As a result of this merger, Enel Chile’s capital stock increased by Ch$1,071,727,278,668, equivalent to 13,069,844,862 shares, corresponding to 827,205,371 shares of EGPL owned by Enel S.p.A., using an exchange of 15.8 shares of Enel Chile for 1 share of EGPL.
As stated
The movements in Note 2.1 “Basisthe number of preparation”shares of Enel Chile as a result of the corporate reorganization process described above are detailed below:
Number of outstanding shares of Enel Chile prior to the reorganization | | | | 49,092,772,762 | |
| | Number of
shares | | Ratio for
exchange of
shares | | Number of
shares | |
Public Offer of Shares in Generation Chile (1): | | | | | | | |
Purchased shares - national market | | 2,582,336,287 | | 2.88 | | 7,432,144,598 | |
Purchased shares - ADS | | 170,759,880 | | 2.88 | | 491,455,473 | |
Total Public Offer of Shares | | 2,753,096,167 | | | | 7,923,600,071 | |
| | | | | | | |
Preferential right shares Enel Chile (2): | | | | | | | |
Shares paid for by shareholders | | 47,860,124 | | | | 47,860,124 | |
Total preferential right | | 47,860,124 | | | | 47,860,124 | |
| | | | | | | |
Merger with EGPL (3): | | | | | | | |
Enel SpA shares | | 827,205,371 | | 15.8 | | 13,069,844,861 | |
Total Merger with EGPL | | 827,205,371 | | | | 13,069,844,861 | |
| | | | | | | |
Repurchase of shares (4): | | | | | | | |
Rights exercised for withdrawal by minority shareholders of Enel Chile | | (967,520,598 | ) | | | (967,520,598 | ) |
Total repurchase of shares | | (967,520,598 | ) | | | (967,520,598 | ) |
| | | | | | | |
Number of issued shares in Enel Chile after merger | | | | | | 69,166,557,220 | |
| | | | | | | |
Total number of capital shares issued | | | | | | 70,134,077,818 | |
Total number of own shares in portfolio | | | | | | (967,520,598 | ) |
Number of issued shares in Enel Chile after merger | | | | | | 69,166,557,220 | |
(1) The total amount associated with the issuance of these new shares was ThCh$649,730,695.
(2) The payment made by minority shareholders of Enel Chile was ThCh$3,924,530.
(3) The valuation of the capital increase due to the merger was ThCh$1,071,727,279.
(4) The total amount paid for the periods priorshare repurchase was ThCh$72,388,009.
F-108
Table of Contents
Subsequent to the Separation,corporate reorganization process, Enel SpA will continue to be the Company does not represent a group for consolidated financial statements reporting purposesultimate controlling parent, through its majority shareholding in accordanceEnel Chile, and the former minority shareholders of Enel Generación Chile, together with IFRS 10 Consolidated Financial Statements and was presented on the basiscurrent minority shareholders of the aggregation of the net assets of the legal entities of the Enersis group locatedEnel Chile, will have their corresponding non-controlling interests in Enel Chile.
The issued capital and retained earnings (including net income) of Enersis S.A. for the periods prior to the Separation were divided for the purpose of the presentation of the combined financial statements based on the net assets book value ratio assigned to the Company.
24.2 Dividends
The following table sets forth the dividends distributed in 2016:
Dividend No. | | Type of Dividend | | Payment Date | | Pesos per Share | | Charged to |
1 | | Final | | 05-24-2016 | | 2.09338 | | 2015 |
2 | | Interim | | 01-27-2017 | | 0.75884 | | 2016 |
27.2 Dividends
Dividend No. | | Type of
Dividend | | Payment Date | | Pesos per
Share | | Charged to | |
1 | | Final | | 05-24-2016 | | 2.09338 | | 2015 | |
2 | | Interim | | 01-27-2017 | | 0.75884 | | 2016 | |
3 | | Final | | 05-26-2017 | | 2.47546 | | 2016 | |
4 | | Interim | | 01-26-2018 | | 0.75642 | | 2017 | |
5 | | Final | | 05-18-2018 | | 2.24134 | | 2017 | |
6 | | Interim | | 01-25-2019 | | 0.45236 | | 2018 | |
24.327.3 Foreign currency translation reserves
The following table sets forth foreign currency translation adjustments attributable to the shareholders of the Company for the years ended December 31, 2016, 20152018 and 2014:2017
| | | For the years ended December 31, | |
| | For the years ended December 31, | | 2018 | | 2017 | |
Reserves for Accumulated Currency Translation Differences | | 2016 | | 2015 | | 2014 | | ThCh$ | | ThCh$ | |
| ThCh$ | | ThCh$ | | ThCh$ | |
GasAtacama Chile S.A. (1) | | 8,484,094 | | 9,582,184 | | 11,500,876 | | 302,222 | | 6,416,189 | |
Electrogas (2) | | - | | 1,875,303 | | 780,876 | |
GNL Chile S.A. | | 738,839 | | 328,447 | | 119,434 | | 900,483 | | 560,194 | |
GNL Quintero S.A. (3) | | - | | 637,758 | | (957,220) | |
Enel Green Power Chile Group | | | 100,452,131 | | — | |
TOTAL | | 9,222,933 | | 12,423,692 | | 11,443,966 | | 101,654,836 | | 6,976,383 | |
| (1)
| From 1 January 2015, there was a change in the functional currency for this entity from the US dollar to the Chilean peso
|
24.427.4 Restrictions on consolidated subsidiariessubsidiaries transferring funds to the parent
Certain of the Group’s subsidiaries must comply with financial ratio covenants which require them to have a minimum level of equity or other requirements that restrict the transferring of assets to the Company. The Group’s restricted net assets as of December 31, 20162018 and 20152017 from its subsidiary Enel Generación Chile S.A. totaled ThCh$458,309,294712,519,037 and ThCh$513,400,473,456,844,078, respectively.
F-109
Table of Contents24.5
27.5 Other reserves
Other reserves within Equity attributable to Enel Chile for the years ended December 31, 2016, 20152018 and 20142017, are as follows:
Other reserves | | Balance at January 1, 2016 | | 2016 Changes | | Balance at December 31, 2016 | |
| ThCh$ | | ThCh$ | | ThCh$ | |
Exchange differences on translation (a) | | 12,423,692 | | (3,200,759) | | 9,222,933 | |
Cash flow hedges (b) | | (121,503,052) | | 45,284,582 | | (76,218,470) | |
Available-for-sale financial assets | | 14,835 | | (4,880) | | 9,955 | |
Other comprehensive income from non-current assets held for sale (d) | | - | | 1,632,724 | | 1,632,724 | |
Other miscellaneous reserves (c) | | (849,525,427) | | (120,214,693) | | (969,740,120) | |
TOTAL | | (958,589,952) | | (76,503,026) | | (1,035,092,978) | |
| | | | | | | | Balance at
January 1, 2018 | | 2018 Changes | | Balance at
December 31, 2018 | |
Other reserves | | Balance at January 1, 2015 | | 2015 Changes | | Balance at December 31, 2015 | |
| ThCh$ | | ThCh$ | | ThCh$ | | ThCh$ | | ThCh$ | | ThCh$ | |
Exchange differences on translation (a) | | 11,443,966 | | 979,726 | | 12,423,692 | | 6,976,383 | | 94,678,453 | | 101,654,836 | |
Cash flow hedges (b) | | (66,850,863) | | (54,652,189) | | (121,503,052) | | (32,849,736 | ) | (159,020,809 | ) | (191,870,545 | ) |
Available-for-sale financial assets | | 14,046 | | 789 | | 14,835 | | 11,284 | | (243 | ) | 11,041 | |
Other miscellaneous reserves (c) | | (873,486,367) | | 23,960,940 | | (849,525,427) | | (971,468,479 | ) | (1,313,999,417 | ) | (2,285,467,896 | ) |
TOTAL | | (928,879,218) | | (29,710,734) | | (958,589,952) | | (997,330,548 | ) | (1,378,342,016 | ) | (2,375,672,564 | ) |
| | | | | | | |
Other reserves | | Balance at January 1, 2014 | | 2014 Changes | | Balance at December 31, 2014 | |
| ThCh$ | | ThCh$ | | ThCh$ | |
Exchange differences on translation (a) | | 3,628,184 | | 7,815,782 | | 11,443,966 | |
Cash flow hedges (b) | | (6,258,379) | | (60,592,484) | | (66,850,863) | |
Available-for-sale financial assets | | 11,811 | | 2,235 | | 14,046 | |
Other miscellaneous reserves (c) | | (877,246,493) | | 3,760,126 | | (873,486,367) | |
TOTAL | | (879,864,877) | | (49,014,341) | | (928,879,218) | |
| | Balance at
January 1, 2017 | | 2017 Changes | | Balance at
December 31, 2017 | |
Other reserves | | ThCh$ | | ThCh$ | | ThCh$ | |
Exchange differences on translation (a) | | 9,222,933 | | (2,246,550 | ) | 6,976,383 | |
Cash flow hedges (b) | | (76,218,470 | ) | 43,368,734 | | (32,849,736 | ) |
Available-for-sale financial assets | | 9,955 | | 1,329 | | 11,284 | |
Other comprehensive income from non-current assets held for sale (*) | | 1,632,724 | | (1,632,724 | ) | — | |
Other miscellaneous reserves (c) | | (969,740,120 | ) | (1,728,359 | ) | (971,468,479 | ) |
TOTAL | | (1,035,092,978 | ) | 37,762,430 | | (997,330,548 | ) |
(*) See note 5. | a)
| Exchange differences on translation: These reserves arise primarily from exchange differences relating to: (i) Translation of the financial statements of our subsidiaries from their functional currencies to our presentation currency (i.e. Chilean peso) (see Note 2.7.3); and (ii) Translation of goodwill arising from the acquisition of Chilean operations with a functional currency other than the Chilean peso.
|
| b)
| Cash flow hedging reserves: These reserves represent the cumulative effective portion of gains and losses recognized in cash flow hedges (see Note 3.g.5 and 3.h).
|
| c)
| Other miscellaneous reserves
|
a)Exchange differences on translation: These reserves arise primarily from exchange differences relating to: (i) Translation of the financial statements of our subsidiaries from their functional currencies to our presentation currency (i.e. Chilean peso) (see Note 2.7.3).
b)Cash flow hedging reserves: These reserves represent the cumulative effective portion of gains and losses recognized in cash flow hedges (see Note 3.g.5 and 3.h).
c)Other miscellaneous reserves:The main items and their effects are the following:
| | For the years ended | |
| | 2018 | | 2017 | | 2016 | |
Other Miscellaneous Reserves | | ThCh$ | | ThCh$ | | ThCh$ | |
Reserve for corporate reorganization (“Spin-Off”) (i) | | (534,057,733 | ) | (534,057,733 | ) | (532,330,290 | ) |
Reserve for transition to IFRS (ii) | | (457,221,836 | ) | (457,221,836 | ) | (457,221,836 | ) |
Reserve for subsidiaries transactions (iii) | | 12,502,494 | | 12,502,494 | | 12,502,494 | |
Reserves for Tender Offer of Enel Generation “Reorganization of Renewable Assets” (iv) | | (910,437,224 | ) | — | | — | |
Reserves “Reorganization of Renewable Assets” (v) | | (407,354,462 | ) | — | | — | |
Other Miscellaneous Reserves (iv) | | 11,100,865 | | 7,308,596 | | 7,309,512 | |
TOTAL | | (2,285,467,896 | ) | (971,468,479 | ) | (969,740,120 | ) |
| | For the years ended December 31, 2016 |
Other Miscellaneous Reserves | | 2016 | | 2015 | | 2014 |
| ThCh$ | | ThCh$ | | ThCh$ |
Reserve for corporate reorganization ("Spin-Off") (i) | | (532,330,290) | | (421,335,641) | | (445,523,972) |
Reserve for transition to IFRS (ii) | | (457,221,836) | | (457,221,836) | | (457,221,836) |
Reserve for subsidiaries transactions (iii) | | 12,502,494 | | 12,502,494 | | 12,541,669 |
Other Miscellaneous Reserves (iv) | | 7,309,512 | | 16,529,556 | | 16,717,772 |
TOTAL | | (969,740,120) | | (849,525,427) | | (873,486,367) |
(i) Reserve for corporate reorganization (“Spin-Off”): Corresponds to the effects from the corporate reorganization of the Company, as described in Note 1, and the separation of the foreign business in Enel Américas. This reserve includes the effect of the taxes that Enel Generación Chile (formerly named Endesa Chile) and Enel Distribución Chile (formerly named Chilectra Chile) paid in Peru for transferring their investments to Endesa Américas and Chilectra Américas. The tax payments made by Enel Generación Chile,
F-110
| (i)
| Reserve for corporate reorganization (“Spin-Off”): Corresponds to the effects from the corporate reorganization of the Company, as described in Note 1, and the separation of the foreign business in Enel Américas. This reserve includes the effect of the taxes that Enel Generación Chile (formerly named Endesa Chile) and Enel Distribución Chile (formerly named Chilectra Chile) paid in Peru for transferring their investments to Endesa Américas and Chilectra Américas. The tax payments made by Enel Generación Chile, in March 2016, and Enel Distribución Chile, in April 2016, were S/. 577 million (ThCh$100,978,571) and S/. 74 million (ThCh$15,193,186), respectively. These taxes, according to Peruvian tax laws, are applied to capital gains generated by the difference between the value of disposal and the cost of acquisition of these investments.
|
| (ii)
| Reserve for transition to IFRS: In accordance with Official Bulletin No. 456 from the SVS (Superintendencia de Valores y Seguros de Chile), included in this line item is the monetary correction corresponding to the accumulated paid-up capital from the date of our transition to IFRS, January 1, 2004, to December 31, 2008.
|
| (iii)
| Reserve for subsidiaries transactions: Corresponds to the effect of acquisition of equity interests in subsidiaries that were accounted for as transactions between entities under common control.
|
| (iv)
| Other miscellaneous reserves from transactions made in prior years.
|
Table of Contents24.6
in March 2016, and Enel Distribución Chile, in April 2016, were 577 million Soles (ThCh$100,978,571) and 74 million Soles (ThCh$15,193,186), respectively. The calculation basis for determining the tax corresponds to the difference between the market value of the investments, to the date of the transfer, and the cost of tax acquisition of the participations. The net economic effect on the opening equity was ThCh$90,274,727. It should be noted that, being directly linked to the split transaction, the accounting record of this tax has been made directly in equity, specifically in Other reserves, following the nature of the main transaction (transaction with shareholders), (See Notes 1 and 2).
(ii) Reserve for transition to IFRS: In accordance with Official Bulletin No. 456 from the CMF, included in this line item is the monetary correction corresponding to the accumulated paid-up capital from the date of our transition to IFRS, January 1, 2004, to December 31, 2008.
(iii) Reserve for subsidiaries transactions: Corresponds to the effect of acquisition of equity interests in subsidiaries entities under common control.
(iv) Reserve Tender Offer Enel Generación “Reorganization”: Represents the difference between the book value of the non-controlling interests acquired as part of the Tender Offer directed at the acquisition of all the shares issued by the subsidiary Enel Generación (see Note 6.i).
(v) Reserve “Reorganization”: Corresponds to the reserve constituted by the merger of Enel Green Power Latin America with Enel Chile, materialized on April 2, 2018. It represents the recognition of the resulting difference between the capital increase in Enel Chile (correspond to market value participation over Enel Green Power Chile and subsidiaries) and the carrying amount of Enel Green Power Latin America that became part of the share capital in the distributable net assets to the owners of Enel Chile, as a result of the merger (see Note 6. iii).
(vi) Other miscellaneous reserves from transactions made in prior years.
27.6 Non-controlling Interests
The detail of non-controlling interests for the years ended December 31, 2016, 2015 and 2014, is as follows:
| | | | | Non-controlling Interests | |
| | | Non-controlling Interests | | | | Equity | | Profit (Loss) | |
| | Equity | | Profit (Loss) | | 12-31-2018 | | 12-31-2018 | | 12-31-2017 | | 12-31-2016 | | 12-31-2018 | | 12-31-2017 | | 12-31-2016 | |
Companies | | 12-31-2016 | | 12-31-2016 | | 12-31-2015 | | 12-31-2014 | | 12-31-2016 | | 12-31-2015 | | 12-31-2014 | | % | | ThCh$ | | ThCh$ | | ThCh$ | | ThCh$ | | ThCh$ | | ThCh$ | |
| % | | ThCh$ | | ThCh$ | | ThCh$ | | ThCh$ | | ThCh$ | | ThCh$ | |
| | | |
Enel Distribución Chile S.A. | | 0.91% | | 6,441,611 | | 5,751,343 | | 6,096,609 | | 1,210,871 | | 1,294,111 | | 1,134,243 | | 0.91 | % | 6,965,769 | | 6,223,363 | | 6,441,611 | | 1,112,709 | | 961,490 | | 1,210,871 | |
Enel Generación Chile S.A. | | 40.02% | | 680,725,188 | | 590,091,089 | | 590,523,470 | | 173,299,349 | | 84,976,889 | | 22,360,050 | | 6.45 | % | 127,136,175 | | 784,999,394 | | 680,725,188 | | 42,883,953 | | 167,465,216 | | 173,299,349 | |
Empresa Eléctrica Pehuenche S.A. | | 7.35% | | 10,008,502 | | 10,900,863 | | 12,597,077 | | 6,512,893 | | 8,674,207 | | 9,526,574 | | 7.35 | % | 10,310,215 | | 9,963,472 | | 10,008,502 | | 6,885,422 | | 5,649,253 | | 6,512,893 | |
Sociedad Agrícola de Cameros Ltda. | | 42.50% | | 2,636,470 | | 2,675,177 | | 2,483,339 | | (38,707) | | 191,838 | | (49,305) | | 42.50 | % | 2,342,160 | | 2,596,764 | | 2,636,470 | | (254,604 | ) | (39,706 | ) | (38,707 | ) |
Constructora y Proyectos Los Maitenes S.A. | | 0.00% | | - | | - | | - | | - | | - | | 3,948,804 | |
Geotermica del Norte SA | | | 15.41 | % | 53,693,407 | | — | | — | | (187,989 | ) | — | | — | |
Empresa Nacional de Geotermia SA | | | 49.00 | % | 993,295 | | — | | — | | 41,780 | | — | | — | |
Parque Eolico Talinay Oriente SA | | | 38.63 | % | 51,702,606 | | — | | — | | 662,374 | | — | | — | |
Other | | | (209,417) | | (199,191) | | 163,862 | | 126,845 | | (7,291) | | 180,012 | | | | (208,365 | ) | (205,346 | ) | (209,417 | ) | (5,825 | ) | (984 | ) | 126,845 | |
TOTAL | TOTAL | | 699,602,354 | | 609,219,281 | | 611,864,357 | | 181,111,251 | | 95,129,754 | | 37,100,378 | | | | 252,935,262 | | 803,577,647 | | 699,602,354 | | 51,137,820 | | 174,035,269 | | 181,111,251 | |
F-111
25.
| REVENUE AND OTHER OPERATING INCOME.
|
The detail of revenues for the years ended December 31, 2016, 20152018, 2017 and 2014,2016, is as follows:
| | For the years ended December 31, |
Revenues | | 2016 | | 2015 | | 2014 |
| ThCh$ | | ThCh$ | | ThCh$ |
| | | | | | |
Energy sales | | 2,312,643,619 | | 2,247,363,757 | | 1,886,300,883 |
| | | | | | |
Generation | | 1,141,725,803 | | 1,134,450,921 | | 888,464,799 |
Regulated customers | | 805,079,958 | | 726,264,558 | | 498,286,123 |
Non-regulated customers | | 234,641,908 | | 264,113,111 | | 274,937,535 |
Spot market sales | | 102,003,937 | | 140,339,722 | | 98,642,810 |
Other customers | | - | | 3,733,530 | | 16,598,331 |
Distribution | | 1,170,917,816 | | 1,112,912,836 | | 997,836,084 |
Residential | | 431,610,828 | | 407,435,626 | | 335,917,449 |
Business | | 379,037,776 | | 350,157,120 | | 281,978,818 |
Industrial | | 229,878,875 | | 230,416,697 | | 196,219,296 |
Other consumers (1) | | 130,390,337 | | 124,903,393 | | 183,720,521 |
| | | | | | |
Other sales | | 73,607,457 | | 32,057,524 | | 26,677,747 |
Natural gas sales | | 64,443,715 | | 12,582,771 | | 4,721,304 |
Sales of products and services | | 9,163,742 | | 19,474,753 | | 21,956,443 |
| | | | | | |
Revenue from other services | | 129,592,804 | | 104,871,908 | | 101,885,268 |
Tolls and transmission | | 51,014,073 | | 37,958,975 | | 32,836,510 |
Metering equipment leases | | 4,555,779 | | 4,415,191 | | 4,188,416 |
Public lighting | | 12,660,894 | | 10,859,012 | | 9,558,413 |
Engineering and consulting services | | 14,304,336 | | 1,817,284 | | 290,889 |
Other services (2) | | 47,057,722 | | 49,821,446 | | 55,011,040 |
| | | | | | |
Total Revenues | | 2,515,843,880 | | 2,384,293,189 | | 2,014,863,898 |
| | | | | | |
Other Operating Income | | ThCh$ | | ThCh$ | | ThCh$ |
Mutual support | | - | | 14,563 | | 1,136,352 |
Leases | | - | | - | | 680,168 |
Commodity derivatives | | 10,794,682 | | 1,820,371 | | 2,549,925 |
Other income (3) | | 14,928,257 | | 12,901,017 | | 29,834,942 |
Total other income | | 25,722,939 | | 14,735,951 | | 34,201,387 |
| | | | | | |
Total Revenues and Other Operating Income | | 2,541,566,819 | | 2,399,029,140 | | 2,049,065,285 |
| (1)
| For the year ended December 31, 2016, it includes revenues from energy sales to municipalities of ThCh$37,338,741; government entities of ThCh$18,333,375 and agricultural sector entities of ThCh$5,377,993. For the year ended December 31, 2015, it includes revenues from energy sales to municipalities of ThCh$39,405,365; government entities of ThCh$18,631,045; agricultural sector entities of ThCh$5,356,396; and other of ThCh$61,510,586. For the year ended December 31, 2014, it includes revenues from energy sales to municipalities of ThCh$68,818,164; government entities of ThCh$33,329,550; hospitals and other related public health entities of ThCh$22,821,228; distribution companies of ThCh$43,305,906; agricultural sector entities of ThCh$8,079,571; and other of ThCh$7,366,103.
|
| (2)
| For the year ended December 31, 2016, it includes services for construction of junctions of ThCh$14,359,194; works in specific facilities and networks of ThCh$21,397,176; and other services of ThCh$11,301,352. For the year ended December 31, 2015, it includes services for construction of junctions of ThCh$16,289,581; works in specific facilities and networks of ThCh$16,736,234; and other services of ThCh$11,741,987. For the year ended December 31, 2014, it includes services for construction of junctions of ThCh$14,189,316; tolls from concessions of ThCh$10,531,493; works in specific facilities and networks of ThCh$20,399,104; and other services of ThCh$9,891,127.
|
| (3)
| For the year ended December 31, 2016, it includes revenues from energy losses recoveries of ThCh$1,344,529; revenues from outdated collection of invoices of ThCh$1,540,348; and revenues from other services of ThCh$12,043,380. For the year ended December 31, 2015, it mainly related to revenues from water sales of ThCh$823,821; and revenues from other services for ThCh$4,877,987. For the year ended December 31, 2014, it includes indemnifications received from third-parties for breach of contracts of ThCh$23,721,999.
|
| | For the years ended December 31, | |
| | 2018 | | 2017 | | 2016 | |
Revenues | | ThCh$ | | ThCh$ | | ThCh$ | |
Energy sales | | 2,202,078,088 | | 2,262,090,558 | | 2,312,643,619 | |
Generation | | 1,034,975,160 | | 1,082,749,256 | | 1,141,725,803 | |
Regulated customers | | 643,494,066 | | 726,166,640 | | 805,079,958 | |
Non-regulated customers | | 357,725,928 | | 285,623,737 | | 234,641,908 | |
Spot market sales | | 33,755,166 | | 70,958,879 | | 102,003,937 | |
Distribution | | 1,167,102,928 | | 1,179,341,302 | | 1,170,917,816 | |
Residential | | 455,840,910 | | 435,769,231 | | 431,610,828 | |
Business | | 378,092,990 | | 386,608,105 | | 379,037,776 | |
Industrial | | 209,252,478 | | 225,736,231 | | 229,878,875 | |
Other consumers (1) | | 123,916,550 | | 131,227,735 | | 130,390,337 | |
Other sales | | 123,345,383 | | 107,362,797 | | 73,607,457 | |
Natural gas sales | | 103,717,558 | | 91,652,707 | | 64,443,715 | |
Sales of products and services | | 19,627,825 | | 15,710,090 | | 9,163,742 | |
Revenue from other services | | 84,936,988 | | 114,648,227 | | 129,592,804 | |
Tolls and transmission | | 20,311,403 | | 39,812,005 | | 51,014,073 | |
Metering equipment leases | | 5,024,944 | | 4,945,609 | | 4,555,779 | |
Public lighting | | 12,181,969 | | 13,449,852 | | 12,660,894 | |
Engineering and consulting services | | 10,027,472 | | 3,414,472 | | 14,304,336 | |
Services for construction of junctions | | 14,711,796 | | 15,514,433 | | 14,359,194 | |
Works in specific facilities and networks | | 8,425,251 | | 13,932,537 | | 21,397,176 | |
Other services | | 14,254,153 | | 23,579,319 | | 11,301,352 | |
Total Revenues | | 2,410,360,459 | | 2,484,101,582 | | 2,515,843,880 | |
Other Operating Income | | ThCh$ | | ThCh$ | | ThCh$ | |
Commodity derivatives | | 9,819,777 | | 20,328,649 | | 10,794,682 | |
Other income (2) | | 36,981,190 | | 18,548,051 | | 14,928,257 | |
Total other income | | 46,800,967 | | 38,876,700 | | 25,722,939 | |
(1) For the year ended December 31, 2018, it includes revenues from energy sales to municipalities of ThCh$36,878,861; government entities of ThCh$20,246,633; agricultural sector entities of ThCh$6,173,077, and other of ThCh$60,617,979. For the year ended December 31, 2017, it includes revenues from energy sales to municipalities of ThCh$36,165,698; government entities of ThCh$20,080,121; agricultural sector entities of ThCh$5,811,319; and other of ThCh$69,170,597.
(2) For the year ended December 31, 2018, this includes Central Tarapacá indemnization for ThCh$21,987,899, (ThCh$0 for 2017), recovery of revenue from customers with unrecorded consumption for ThCh$2,847,740 (ThCh$1,968,203 for 2017), late payment income for ThCh$675,202 (ThCh$1,299,470 for 2017), and other income for ThCh$11,470,349 (ThCh$15,280,378 for 2017).
F-112
26.
| RAW MATERIALS AND CONSUMABLES USED.
|
The detail of raw materials and consumables used for the years ended December 31, 2016, 20152018, 2017 and 2014,2016, is as follows:
| | For the years ended December 31, |
Raw materials and consumables used | | 2016 | | 2015 | | 2014 |
| ThCh$ | | ThCh$ | | ThCh$ |
Energy purchases | | (891,746,884) | | (860,203,181) | | (788,420,653) |
Fuel consumption | | (295,148,838) | | (327,502,996) | | (305,480,260) |
Transportation costs | | (195,123,118) | | (182,453,155) | | (151,948,779) |
Other raw materials and consumables | | (115,400,740) | | (111,826,227) | | (63,552,591) |
Total | | (1,497,419,580) | | (1,481,985,559) | | (1,309,402,283) |
27. | | For the years ended December 31, | | | | 2018 | | 2017 | | 2016 | | Raw materials and consumables used | | ThCh$ | | ThCh$ | | ThCh$ | | Energy purchases | | (747,646,603 | ) | (902,434,871 | ) | (891,746,884 | ) | Fuel consumption | | (231,028,169 | ) | (280,739,362 | ) | (295,148,838 | ) | Transportation costs | | (166,875,801 | ) | (155,879,249 | ) | (195,123,118 | ) | Other raw materials and consumables | | (146,626,543 | ) | (175,733,439 | ) | (115,400,740 | ) | Total | | (1,292,177,116 | ) | (1,514,786,921 | ) | (1,497,419,580 | ) |
30. EMPLOYEE BENEFITS EXPENSE. | EMPLOYEE BENEFITS EXPENSE.
|
Employee expenses for the years ended December 31, 2016, 20152018, 2017 and 2014,2016, are as follows:
| | For the years ended December 31, |
Employee Benefits Expense | | 2016 | | 2015 | | 2014 |
| ThCh$ | | ThCh$ | | ThCh$ |
Wages and salaries | | (100,938,761) | | (115,982,152) | | (113,865,986) |
Post-employment benefit obligations expense | | (1,899,660) | | (2,282,226) | | (2,309,999) |
Social security and other contributions | | (21,260,007) | | (18,290,343) | | (10,165,378) |
Total | | (124,098,428) | | (136,554,721) | | (126,341,363) |
28. | | For the years ended December 31, | | | | 2018 | | 2017 | | 2016 | | Employee Benefits Expense | | ThCh$ | | ThCh$ | | ThCh$ | | Wages and salaries | | (102,897,710 | ) | (100,653,880 | ) | (100,938,761 | ) | Post-employment benefit obligations expense | | (1,881,202 | ) | (2,091,205 | ) | (1,899,660 | ) | Social security and other contributions | | (13,405,944 | ) | (13,150,402 | ) | (21,260,007 | ) | Other employee expenses | | (4,945,478 | ) | (5,608,290 | ) | — | | Total | | (123,130,334 | ) | (121,503,777 | ) | (124,098,428 | ) |
31. DEPRECIATION, AMORTIZATION AND IMPAIRMENT LOSSES. | DEPRECIATION, AMORTIZATION AND IMPAIRMENT LOSSES.
|
The detail of depreciation, amortization and impairment losses for the years ended December 31, 2016, 20152018, 2017 and 2014,2016, are as follows:
| | For the years ended December 31, | | For the years ended December 31, | |
| | 2016 | | 2015 | | 2014 | | 2018 | | 2017 | | 2016 | |
| ThCh$ | | ThCh$ | | ThCh$ | | ThCh$ | | ThCh$ | | ThCh$ | |
Depreciation | | (155,826,620) | | (148,421,514) | | (122,483,044) | | (202,971,892 | ) | (145,873,065 | ) | (155,826,620 | ) |
Amortization | | (5,833,990) | | (4,780,148) | | (5,954,110) | | (12,215,408 | ) | (6,811,041 | ) | (5,833,990 | ) |
Subtotal | | (161,660,610) | | (153,201,662) | | (128,437,154) | | (215,187,300 | ) | (152,684,106 | ) | (161,660,610 | ) |
Reversal (losses) from impairment (*) | | (35,926,710) | | 3,054,903 | | (13,185,420) | |
Impairment (Losses) Reversals (*) | | | (5,562,897 | ) | (7,937,817 | ) | (35,926,710 | ) |
Total | | (197,587,320) | | (150,146,759) | | (141,622,574) | | (220,750,197 | ) | (160,621,923 | ) | (197,587,320 | ) |
| | | | | | | |
| | For the years ended December 31, | |
(*) Impairment Losses | | 2016 | | 2015 | | 2014 | |
| ThCh$ | | ThCh$ | | ThCh$ | |
Impairment losses of financial assets (See Note 8.c) | | (5,141,179) | | (7,110,308) | | (655,600) | |
Impairment losses of property, plant and equipment (See Note 15) | | (30,785,531) | | 10,165,211 | | (12,529,820) | |
Total | | (35,926,710) | | 3,054,903 | | (13,185,420) | |
| | For the years ended December 31, | |
| | Generation | | Distribution | | Other | | Total | |
| | 2018 | | 2017 | | 2016 | | 2018 | | 2017 | | 2016 | | 2018 | | 2017 | | 2016 | | 2018 | | 2017 | | 2016 | |
(*) Impairment Losses | | ThCh$ | | ThCh$ | | ThCh$ | | ThCh$ | | ThCh$ | | ThCh$ | | ThCh$ | | ThCh$ | | ThCh$ | | ThCh$ | | ThCh$ | | ThCh$ | |
Impairment losses of financial assets (See Note 11.d) | | (100,900 | ) | 55,494 | | — | | (4,676,808 | ) | (7,993,311 | ) | (5,141,179 | ) | — | | — | | — | | (4,777,708 | ) | (7,937,817 | ) | (5,141,179 | ) |
Investment property (See Note 1.p and 19) | | — | | — | | — | | — | | | | | | (779,825 | ) | — | | — | | (779,825 | ) | — | | — | |
Impairment losses of other assets | | (5,364 | ) | — | | (30,785,531 | ) | — | | — | | — | | — | | — | | — | | (5,364 | ) | — | | (30,785,531 | ) |
Total | | (106,264 | ) | 55,494 | | (30,785,531 | ) | (4,676,808 | ) | (7,993,311 | ) | (5,141,179 | ) | (779,825 | ) | — | | — | | (5,562,897 | ) | (7,937,817 | ) | (35,926,710 | ) |
F-113
Other miscellaneous operating expenses for the years ended December 31, 2016, 20152018, 2017 and 2014,2016, are as follows:
| | For the years ended December 31, | |
| | 2018 | | 2017 | | 2016 | |
Other Expenses | | ThCh$ | | ThCh$ | | ThCh$ | |
Other supplies and services | | (22,910,010 | ) | (17,064,008 | ) | (23,962,717 | ) |
Professional, outsourced and other services | | (43,762,468 | ) | (58,622,123 | ) | (55,571,694 | ) |
Repairs and maintenance | | (49,671,615 | ) | (13,999,283 | ) | (11,030,522 | ) |
Indemnities and fines | | (455,825 | ) | (776,011 | ) | (3,046,557 | ) |
Taxes and charges | | (4,415,819 | ) | (5,105,235 | ) | (4,972,995 | ) |
Insurance premiums | | (15,794,761 | ) | (13,277,718 | ) | (17,148,278 | ) |
Leases and rental costs | | (4,494,358 | ) | (2,969,436 | ) | (3,250,503 | ) |
Marketing, public relations and advertising | | (2,440,070 | ) | (2,501,027 | ) | (3,736,414 | ) |
Written-off Huechún and Chillán projects (*) | | — | | — | | (36,480,223 | ) |
Written-off projects in progress (*) | | — | | (25,105,911 | ) | — | |
Other supplies | | (10,774,808 | ) | (11,188,148 | ) | (6,132,681 | ) |
Travel expenses | | (2,825,604 | ) | (3,445,944 | ) | (3,190,662 | ) |
Environmental expenses | | (9,664,683 | ) | (7,769,230 | ) | (2,245,891 | ) |
Total | | (167,210,021 | ) | (161,824,074 | ) | (170,769,137 | ) |
| | For the years ended December 31, |
Other Expenses | | 2016 | | 2015 | | 2014 |
| ThCh$ | | ThCh$ | | ThCh$ |
Other supplies and services | | (23,962,717) | | (16,365,050) | | (15,630,380) |
Professional, outsourced and other services | | (55,571,694) | | (43,006,875) | | (44,418,344) |
Repairs and maintenance | | (11,030,522) | | (14,034,924) | | (11,867,380) |
Indemnities and fines | | (3,046,557) | | (1,754,069) | | (781,069) |
Taxes and charges | | (4,972,995) | | (7,406,215) | | (6,239,456) |
Insurance premiums | | (17,148,278) | | (15,942,047) | | (12,212,488) |
Leases and rental costs | | (3,250,503) | | (10,098,166) | | (6,734,776) |
Projects written-off (1) | | (36,480,223) | | - | | - |
Marketing, public relations and advertising | | (3,736,414) | | (3,166,181) | | (3,765,455) |
Other supplies | | (6,132,681) | | (6,168,091) | | (1,781,536) |
Travel expenses | | (3,190,662) | | (4,103,471) | | (4,153,233) |
Environmental expenses | | (2,245,891) | | (3,812,308) | | (2,870,098) |
Total | | (170,769,137) | | (125,857,397) | | (110,454,215) |
(*) See Note 18.e.viii. 33. OTHER GAINS (LOSSES). | (1)
| See Note 15.e).x).
|
Other gains (losses) for the years ended December 31, 2016, 20152018, 2017 and 2014,2016, are as follows:
| | For the years ended December 31, | |
| | 2018 | | 2017 | | 2016 | |
Other Gains (Losses) | | ThCh$ | | ThCh$ | | ThCh$ | |
Gain on sale of GNL Quintero S.A. (**) | | — | | — | | 121,325,018 | |
Gain on sale of Electrogas (*) | | — | | 105,311,912 | | — | |
Gain on sale of assets | | 3,024,549 | | 7,779,531 | | — | |
Other | | 385,830 | | 149,753 | | 165,044 | |
Total | | 3,410,379 | | 113,241,196 | | 121,490,062 | |
| | For the years ended December 31, |
Other Gains (Losses) | | 2016 | | 2015 | | 2014 |
| ThCh$ | | ThCh$ | | ThCh$ |
Gain on sale of building (Alonso de Cordova) | | - | | 14,610,544 | | - |
Gain on sale of Tunel El Melón (1) | | - | | 4,207,167 | | - |
Gain on sale of GNL Quintero S.A. (3) | | 121,325,018 | | - | | - |
Gain on sale of investment properties (2) | | - | | 1,463,163 | | 7,556,574 |
Gain on remeasuring pre-existing interest held in Inversiones GasAtacama Holding Ltda. (4) | | - | | - | | 21,546,320 |
Reclassification of translation difference reserve on the pre-existing interest held in Inversiones GasAtacama Holding Ltda. (4) | | - | | - | | 21,006,456 |
Gain on sale of equity interest in Maitenes and Aguas Santiago Poniente (1) | | - | | - | | 21,077,900 |
Other | | 165,044 | | (225,129) | | (293,987) |
Total | | 121,490,062 | | 20,055,745 | | 70,893,263 |
(*) See Note 5. (**) See Note 15. 34. FINANCIAL RESULTS. | (1)
| See Note 2.4.1
|
| (4)
| On April 22, 2014, Enel Generación Chile acquired the remaining 50% ownership interest in Inversiones GasAtacama Holding Ltda. Consequently, the Group obtained 100% control over that company.
|
Financial income and costs for the years ended December 31, 2016, 20152018, 2017 and 2014,2016, are as follows:
| | For the years ended December 31, | |
| | 2018 | | 2017 | | 2016 | |
Financial Income | | ThCh$ | | ThCh$ | | ThCh$ | |
Income from deposits and other financial instruments | | 9,612,575 | | 8,377,023 | | 5,733,428 | |
Interests charged to customers in energy accounts and billing | | 7,140,984 | | 8,556,587 | | — | |
Other financial income | | 3,180,909 | | 4,729,078 | | 17,372,473 | |
Total Financial Income | | 19,934,468 | | 21,662,688 | | 23,105,901 | |
F-114
| | For the years ended December 31, |
Financial Income | | 2016 | | 2015 | | 2014 |
| ThCh$ | | ThCh$ | | ThCh$ |
| | | | | | |
Income from deposits and other financial instruments | | 5,733,428 | | 2,566,017 | | 2,813,132 |
Other financial income | | 17,372,473 | | 12,704,152 | | 11,949,383 |
Total Financial Income | | 23,105,901 | | 15,270,169 | | 14,762,515 |
Table of Contents
| | For the years ended December 31, | |
| | 2018 | | 2017 | | 2016 | |
Financial Costs | | ThCh$ | | ThCh$ | | ThCh$ | |
Financial Costs | | (122,184,189 | ) | (53,510,882 | ) | (58,199,382 | ) |
Bank loans | | (20,701,774 | ) | (12,585 | ) | (2,034,277 | ) |
Secured and unsecured obligations | | (62,255,300 | ) | (42,708,253 | ) | (44,268,489 | ) |
Financial leasing | | (739,069 | ) | (811,172 | ) | (780,953 | ) |
Valuation of financial derivatives | | 1,183,228 | | (1,067,820 | ) | (824,922 | ) |
Financial provisions (1) | | (3,176,001 | ) | (2,347,087 | ) | (2,551,211 | ) |
Post-employment benefit obligations (2) | | (2,750,376 | ) | (2,678,300 | ) | (2,517,406 | ) |
Debt formalization expenses and other associated expenses | | (9,373,412 | ) | (836,174 | ) | — | |
Capitalized borrowing costs | | 6,435,646 | | 4,078,463 | | 3,001,211 | |
Other financial costs (3) | | (30,807,131 | ) | (7,127,954 | ) | (8,223,335 | ) |
Loss from indexed assets and liabilities (*) | | (818,146 | ) | 916,666 | | 1,631,840 | |
Foreign currency exchange differences (**) | | (7,807,197 | ) | 8,516,874 | | 12,978,471 | |
Total Financial Costs | | (130,809,532 | ) | (44,077,342 | ) | (43,589,071 | ) |
| | | | | | | |
Total Financial Results | | (110,875,064 | ) | (22,414,654 | ) | (20,483,170 | ) |
| | For the years ended December 31, |
Financial Costs | | 2016 | | 2015 | | 2014 |
| ThCh$ | | ThCh$ | | ThCh$ |
| | | | | | |
Financial Costs | | (58,199,382) | | (66,700,698) | | (75,626,488) |
Bank loans | | (2,034,277) | | (131,502) | | (619,079) |
Secured and unsecured obligations | | (44,268,489) | | (51,697,708) | | (48,046,358) |
Financial leasing | | (780,953) | | (1,039,013) | | (989,288) |
Valuation of financial derivatives | | (824,922) | | (1,725,211) | | (2,634,032) |
Financial provisions | | (2,551,211) | | (1,881,826) | | (1,049,996) |
Post-employment benefit obligations | | (2,517,406) | | (2,299,944) | | (2,139,043) |
Capitalized borrowing costs | | 3,001,211 | | 2,221,329 | | 1,817,283 |
Other financial costs | | (8,223,335) | | (10,146,823) | | (21,965,976) |
Loss from indexed assets and liabilities (*) | | 1,631,840 | | 4,839,077 | | 15,263,623 |
Foreign currency exchange differences (**) | | 12,978,471 | | (51,277,332) | | (21,444,198) |
Total Financial Costs | | (43,589,071) | | (113,138,953) | | (81,807,064) |
| | | | | | |
Total Financial Results | | (20,483,170) | | (97,868,784) | | (67,044,549) |
(1) See note 25.
(2) See note 26.
(3) For the year ended December 31, 2018, interest cost of ThCh$23,253,535 were incurred with Enel Finance International NV (ThCh$0 in 2017).
F-115
Table of Contents
The effects on financial results from exchange differences and the application of indexed assets and liabilities and exchange differences originated from the following:following
| | For the years ended December 31, | |
| | 2018 | | 2017 | | 2016 | |
Profit (losses) from Indexed Assets and Liabilities (*) | | ThCh$ | | ThCh$ | | ThCh$ | |
Other financial assets | | 7,676,500 | | 4,659,933 | | 7,237,000 | |
Trade and other receivables | | 1,197,498 | | 155,158 | | 1,077,086 | |
Current tax assets and liabilities | | 3,469,752 | | 1,654,538 | | 2,349,415 | |
Other financial liabilities (financial debt and derivative instruments) | | (9,390,716 | ) | (5,551,163 | ) | (9,014,858 | ) |
Trade and other payables | | 15,145 | | (1,800 | ) | (16,803 | ) |
Result for hyperinflation (1) | | (3,786,325 | ) | — | | — | |
Total | | (818,146 | ) | 916,666 | | 1,631,840 | |
| | For the years ended December 31, | |
| | 2018 | | 2017 | | 2016 | |
Foreign Currency Exchange Differences (**) | | ThCh$ | | ThCh$ | | ThCh$ | |
Cash and cash equivalents | | (415,962 | ) | 2,931,086 | | 240,451 | |
Other financial assets | | 5,733,173 | | 10,895,862 | | 25,476,638 | |
Trade and other receivables | | 191,946 | | 390,764 | | 2,595,997 | |
Current tax assets and liabilities | | (1,903,963 | ) | (188,270 | ) | — | |
Other financial liabilities (financial debt and derivative instruments) | | (5,726,246 | ) | (4,358,937 | ) | (18,538,354 | ) |
Trade and other payables | | (5,379,210 | ) | (1,152,505 | ) | 3,203,739 | |
Other non-financial liabilities | | (306,935 | ) | (1,126 | ) | — | |
Total | | (7,807,197 | ) | 8,516,874 | | 12,978,471 | |
(1) Corresponds to the financial effect from the application of IAS 29 Financial Reporting in Hyperinflationary Economies on the branch owned by GasAtacama Group in Argentina (See Note 7)
F-116
Table of Contents
| | For the years ended December 31, |
Profit (losses) from Indexed Assets and Liabilities (*) | | 2016 | | 2015 | | 2014 |
| ThCh$ | | ThCh$ | | ThCh$ |
Other financial assets | | 7,237,000 | | 10,153,342 | | 23,240,913 |
Other non-financial assets | | - | | 840,108 | | 115,593 |
Trade and other receivables | | 1,077,086 | | 745,270 | | 185,459 |
Current tax assets and liabilities | | 2,349,415 | | 6,052,524 | | 9,415,017 |
Other financial liabilities (financial debt and derivative instruments) | | (9,014,858) | | (12,864,959) | | (17,623,602) |
Trade and other payables | | (16,803) | | (73,133) | | (3,757) |
Other provisions | | - | | (14,075) | | (66,000) |
Other non-financial liabilities | | - | | - | | - |
Total | | 1,631,840 | | 4,839,077 | | 15,263,623 |
| | | | | | |
| | For the years ended December 31, |
Foreign Currency Exchange Differences (**) | | 2016 | | 2015 | | 2014 |
| ThCh$ | | ThCh$ | | ThCh$ |
Cash and cash equivalents | | 240,451 | | 5,021,381 | | 385,881 |
Other financial assets | | 25,476,638 | | 10,637,768 | | (23,775,272) |
Other non-financial assets | | - | | - | | 23,905 |
Trade and other receivables | | 2,595,997 | | 10,313,151 | | 2,580,400 |
Current tax assets and liabilities | | - | | - | | (1,076,322) |
Other financial liabilities (financial debt and derivative instruments) | | (18,538,354) | | (30,533,746) | | (2,694,805) |
Trade and other payables | | 3,203,739 | | (46,715,886) | | 3,841,715 |
Other non-financial liabilities | | - | | - | | (729,700) |
Total | | 12,978,471 | | (51,277,332) | | (21,444,198) |
35. INFORMATION BY SEGMENT
32.
| INFORMATION BY SEGMENT.
|
32.135.1 Basis of segmentation
The Group’s activities operate under a matrix management structure with dual and cross management responsibilities (based on businesses), and its subsidiaries are engaged in either the Generation Business or the Distribution Business.Business.
The Group adopted a “bottom-up” approach to determine its reportable segments. The Generation and the Distribution reportable segments have been defined based on IFRS 8.9 and on the criteria described in IFRS 8.12.
Generation Business:The Generation Reportable Segment is comprised of a group of electricity companies that own electricity generating plants, whose energy is transmitted and distributed to end customerscustomers. The generation business is conducted in four different countries.
The Generation Business is conductedChile by our subsidiaries Enel Generación Chile S.A., Empresa Eléctrica Pehuenche S.A., GasAtacama and Gasatacama Chile S.A., and Centralour group engaged in the development and exploitation of renewable energies with wind energy subsidiaries: Parque Eólica Canela S.A.lico Tal Tal S.A., Parque Eólico Valle de los Vientos S.A. and Parque Talinay Oriente S.A., geothermal subsidiaries: Geotérmica del Norte S.A. and Empresa Nacional de Geotermia S.A., wind and solar energy subsidiaries from Enel Green Power del Sur SpA, and subsidiary Empresa Eléctrica Panguipulli S.A. engaged in hydroelectric, solar and wind generation. The rest are engaged in diverse projects and are: Diego de Almagro Matriz SpA, Almeyda Solar SpA.
Distribution Business:The Distribution Reportable Segment is comprised of a group of electricity companies operating under a public utility concession, with service obligations and regulated tariffs for supplying regulated customers.customers.
The Distribution Business is conducted by our subsidiary Enel Distribución Chile S.A. and its subsidiaries.
Each of the operating segments generates separate financial information, which is aggregated into one combined set of information for the Generation Business, and another set of combined information for the Distribution Business at the reportable segment level. In addition, in order to assist the decision maker process, the Planning & Control Department at the Parent Company level prepares internal reports containing combined information at the reportable segment level about the main key performance indicators (KPIs), such as: EBITDA, Gross Margin, Total Capex, Total Opex, Net income, Total Energy Generation, among others. The presentation of information under this business/countrybusiness approach has been made taking into consideration that the KPIs are similar and comparable in all countries,segments, in each of the following aspects:
| (a)
| the nature of the activities: Generation on one hand, and Distribution on the other;
|
| (b)
| the nature of the production processes: the Generation Business deals with the generation of electricity, while the Distribution Business does not generate electricity, but distributes electricity to end customers;
|
| (c)
| the type or class of customer for their products and services: the Generation Business provides services mainly to unregulated customers, while the Distribution Business provides energy to regulated customers;
|
| (d)
| the methods used to distribute their products or provide their services: generators generally sell the energy through energy auctions, while distributors provide energy in their concession area; and
|
| (e)
| the nature of the regulatory environment (public utilities): the regulatory frameworks differs in the Generation Business and Distribution Business
|
(a) the nature of the activities: Generation on one hand, and Distribution on the other;
(b) the nature of the production processes: the Generation Business deals with the generation of electricity, while the Distribution Business does not generate electricity, but distributes electricity to end customers;
(c) the type or class of customer for their products and services: the Generation Business provides services mainly to unregulated customers, while the Distribution Business provides energy to regulated customers;
(d) the methods used to distribute their products or provide their services: generators generally sell the energy through energy auctions, while distributors provide energy in their concession area; and
(e) the nature of the regulatory environment (public utilities): the regulatory frameworks differs in the Generation Business and Distribution Business
The Company’s chief operating decision maker (CODM) in conjunction with the Chile manager reviews on a monthly basis these internal reports and uses the KPI information to make decisions on the allocation of resources and the assessment of the performance of the operating segments for each reportable segment.
The information disclosed in the following tables is based on the financial information of the companies forming each segment. The accounting policies used to determine the segment information are the same as those used in the preparation of the Group’s consolidated financial statements.
The following tables present details of this information by segment:
F-117
Table of Contents32.2
35.2 Generation, distribution and others
| | | Generation | | Distribution | | Holdings, eliminations and others | | Total | |
| | | 12-31-2018 | | 12-31-2017 | | 12-31-2018 | | 12-31-2017 | | 12-31-2018 | | 12-31-2017 | | 12-31-2018 | | 12-31-2017 | |
Line of Business | | Generation | | Distribution | | Holdings, eliminations and others | | Total | | ThCh$ | | ThCh$ | | ThCh$ | | ThCh$ | | ThCh$ | | ThCh$ | | ThCh$ | | ThCh$ | |
ASSETS | | 12-31-2016 | | 12-31-2015 | | 12-31-2016 | | 12-31-2015 | | 12-31-2016 | | 12-31-2015 | | 12-31-2016 | | 12-31-2015 | | | | | | | | | | | | | | | | | |
| ThCh$ | | ThCh$ | | ThCh$ | | ThCh$ | | ThCh$ | | ThCh$ | | ThCh$ | | ThCh$ | |
| | | | | | | | | | | | | | | | | |
CURRENT ASSETS | | 543,372,955 | | 522,859,190 | | 245,122,733 | | 282,843,282 | | 78,031,249 | | 43,289,363 | | 866,526,937 | | 848,991,835 | | 997,843,912 | | 658,599,127 | | 296,453,471 | | 261,378,069 | | (297,349,611 | ) | 135,159,356 | | 996,947,772 | | 1,055,136,552 | |
Cash and cash equivalents | | 114,486,479 | | 37,425,233 | | 23,378,615 | | 18,429,619 | | 108,134,098 | | 88,406,993 | | 245,999,192 | | 144,261,845 | | 155,591,949 | | 211,027,141 | | 4,969,412 | | 42,594,390 | | 84,610,563 | | 165,834,495 | | 245,171,924 | | 419,456,026 | |
Other current financial assets | | 487,106 | | 1,011,555 | | 47,517 | | 15,259,790 | | 49,621 | | 41,849 | | 584,244 | | 16,313,194 | | 39,507,485 | | 20,523,276 | | 62,226 | | 61,887 | | 733,462 | | 41,899 | | 40,303,173 | | 20,627,062 | |
Other current non-financial assets | | 4,409,288 | | 462,748 | | 11,091,061 | | 3,392,969 | | 331,137 | | 129,226 | | 15,831,486 | | 3,984,943 | | 14,074,044 | | 13,136,459 | | 5,648,807 | | 4,940,347 | | 2,683,237 | | 709,085 | | 22,406,088 | | 18,785,891 | |
Trade and other current receivables | | 260,440,086 | | 363,475,276 | | 180,290,279 | | 227,262,809 | | 4,341,491 | | 5,626,382 | | 445,071,856 | | 596,364,467 | | 254,374,451 | | 207,208,820 | | 218,310,327 | | 195,505,229 | | 5,485,289 | | 4,254,488 | | 478,170,067 | | 406,968,537 | |
Current accounts receivable from related companies | | 82,727,781 | | 68,871,507 | | 8,895,440 | | 9,992,096 | | (38,764,837) | | (53,719,044) | | 52,858,384 | | 25,144,559 | | 422,492,265 | | 109,797,820 | | 59,827,152 | | 6,305,806 | | (428,148,357 | ) | (44,247,580 | ) | 54,171,060 | | 71,856,046 | |
Inventories | | 33,390,799 | | 36,755,409 | | 1,878,072 | | 3,076,250 | | 2,270,725 | | 2,784,956 | | 37,539,596 | | 42,616,615 | | 48,221,915 | | 31,740,903 | | 3,528,174 | | 3,049,576 | | 5,211,554 | | 4,896,463 | | 56,961,643 | | 39,686,942 | |
Current tax assets | | 34,438,408 | | 14,857,462 | | 19,541,749 | | 5,429,749 | | 1,669,014 | | 19,001 | | 55,649,171 | | 20,306,212 | | 63,581,803 | | 65,164,708 | | 4,107,373 | | 8,920,834 | | 32,074,641 | | 3,670,506 | | 99,763,817 | | 77,756,048 | |
Non-current assets classified as held for sale | | 12,993,008 | | - | | - | | - | | - | | - | | 12,993,008 | | - | | — | | — | | — | | — | | — | | — | | — | | — | |
| | | | | | | | | | | | | | | | | | | | | | | | | | | | | | | | | |
NON-CURRENT ASSETS | | 2,856,309,537 | | 2,866,208,896 | | 829,203,115 | | 766,740,396 | | 846,671,423 | | 843,527,743 | | 4,532,184,075 | | 4,476,477,035 | | 4,625,205,545 | | 2,895,863,063 | | 982,926,699 | | 893,633,579 | | 882,940,148 | | 850,139,814 | | 6,491,072,392 | | 4,639,636,456 | |
Other non-current financial assets | | 28,802,569 | | 21,718,720 | | 24,973 | | 31,732 | | - | | - | | 28,827,542 | | 21,750,452 | | 6,554,114 | | 33,391,398 | | 26,410 | | 26,806 | | 689,145 | | — | | 7,269,669 | | 33,418,204 | |
Other non-current non-financial assets | | 12,318,444 | | 3,387,709 | | 1,019,050 | | 997,470 | | (1,342) | | 384,706 | | 13,336,152 | | 4,769,885 | | 42,006,844 | | 12,853,460 | | 2,600,071 | | 959,679 | | 1,097 | | — | | 44,608,012 | | 13,813,139 | |
Trade and other non-current receivables | | 6,788,437 | | 35,901 | | 24,978,209 | | 14,214,946 | | 1,733,459 | | 141,376 | | 33,500,105 | | 14,392,223 | | 1,565,812 | | 1,032,922 | | 41,993,899 | | 34,272,234 | | 16,968,132 | | 877,243 | | 60,527,843 | | 36,182,399 | |
Investments accounted for using the equity method | | 18,738,198 | | 45,716,373 | | 60,325 | | 58,695 | | (60,325) | | (58,697) | | 18,738,198 | | 45,716,371 | | 12,873,531 | | 16,912,454 | | — | | — | | — | | — | | 12,873,531 | | 16,912,454 | |
Intangible assets other than goodwill | | 19,266,874 | | 20,905,426 | | 25,430,420 | | 22,935,431 | | (226,544) | | (961,531) | | 44,470,750 | | 42,879,326 | | 68,776,401 | | 18,607,972 | | 41,963,796 | | 34,236,891 | | 4,632,196 | | 2,326,041 | | 115,372,393 | | 55,170,904 | |
Goodwill | | 24,860,356 | | 24,860,356 | | 2,240,478 | | 2,240,478 | | 860,156,821 | | 860,156,821 | | 887,257,655 | | 887,257,655 | | 32,500,603 | | 24,860,356 | | 2,240,478 | | 2,240,478 | | 880,303,644 | | 860,156,821 | | 915,044,725 | | 887,257,655 | |
Property, plant and equipment | | 2,726,838,536 | | 2,729,717,093 | | 774,999,730 | | 725,957,956 | | (25,709,632) | | (26,507,252) | | 3,476,128,634 | | 3,429,167,797 | | 4,442,872,809 | | 2,788,204,501 | | 893,246,804 | | 821,234,672 | | (27,471,980 | ) | (23,752,036 | ) | 5,308,647,633 | | 3,585,687,137 | |
Investment property | | - | | - | | - | | - | | 8,128,522 | | 8,150,987 | | 8,128,522 | | 8,150,987 | | — | | — | | — | | — | | 7,557,356 | | 8,356,772 | | 7,557,356 | | 8,356,772 | |
Deferred tax assets | | 18,696,123 | | 19,867,318 | | 449,930 | | 303,688 | | 2,650,464 | | 2,221,333 | | 21,796,517 | | 22,392,339 | | 18,055,431 | | — | | 855,241 | | 662,819 | | 260,558 | | 2,174,973 | | 19,171,230 | | 2,837,792 | |
| | | | | | | | | | | | | | | | | | | | | | | | | | | | | | | | | |
TOTAL ASSETS | | 3,399,682,492 | | 3,389,068,086 | | 1,074,325,848 | | 1,049,583,678 | | 924,702,672 | | 886,817,106 | | 5,398,711,012 | | 5,325,468,870 | | 5,623,049,457 | | 3,554,462,190 | | 1,279,380,170 | | 1,155,011,648 | | 585,590,537 | | 985,299,170 | | 7,488,020,164 | | 5,694,773,008 | |
F-118
Line of Business | | Generation | | Distribution | | Holdings, eliminations and others | | Total |
LIABILITIES AND EQUITY | | 12-31-2016 | | 12-31-2015 | | 12-31-2016 | | 12-31-2015 | | 12-31-2016 | | 12-31-2015 | | 12-31-2016 | | 12-31-2015 |
| ThCh$ | | ThCh$ | | ThCh$ | | ThCh$ | | ThCh$ | | ThCh$ | | ThCh$ | | ThCh$ |
| | | | | | | | | | | | | | | | |
CURRENT LIABILITIES | | 555,777,465 | | 676,091,596 | | 259,684,837 | | 362,300,842 | | (58,215,655) | | (184,830,184) | | 757,246,647 | | 853,562,254 |
Other current financial liabilities | | 25,696,064 | | 27,921,565 | | 102 | | 95 | | - | | 65 | | 25,696,166 | | 27,921,725 |
Trade and other current payables | | 341,088,664 | | 360,459,608 | | 151,549,875 | | 149,694,893 | | 68,866,744 | | 44,761,470 | | 561,505,283 | | 554,915,971 |
Current accounts payable to related companies | | 121,018,039 | | 257,584,742 | | 96,520,909 | | 206,456,139 | | (127,110,019) | | (230,885,965) | | 90,428,929 | | 233,154,916 |
Other current provisions | | 6,493,428 | | 15,617,614 | | 104 | | 36,140 | | - | | 675,441 | | 6,493,532 | | 16,329,195 |
Current tax liabilities | | 61,457,940 | | 14,484,736 | | 113,855 | | 16,248 | | 27,620 | | 618,805 | | 61,599,415 | | 15,119,789 |
Other current non-financial liabilities | | 23,330 | | 23,331 | | 11,499,992 | | 6,097,327 | | - | | - | | 11,523,322 | | 6,120,658 |
| | | | | | | | | | | | | | | | |
NON-CURRENT LIABILITIES | | 1,114,144,775 | | 1,207,004,762 | | 106,283,505 | | 54,831,046 | | (41,957,557) | | 8,170,025 | | 1,178,470,723 | | 1,270,005,833 |
Other non-current financial liabilities | | 854,016,751 | | 917,197,790 | | - | | - | | - | | - | | 854,016,751 | | 917,197,790 |
Trade and other non-current payables | | 1,453,022 | | 5,975,687 | | 30,091 | | 54,166 | | - | | 4,363 | | 1,483,113 | | 6,034,216 |
Non-current accounts payable to related companies | | 251,527 | | 97,187 | | 50,000,180 | | - | | (50,000,180) | | (1) | | 251,527 | | 97,186 |
Other long-term provisions | | 57,325,914 | | 50,702,975 | | 5,780,994 | | 5,413,165 | | - | | - | | 63,106,908 | | 56,116,140 |
Deferred tax liabilities | | 185,277,004 | | 217,759,706 | | 20,502,853 | | 21,992,030 | | (6,415,063) | | (4,650,380) | | 199,364,794 | | 235,101,356 |
Non-current provisions for employee benefits | | 15,820,557 | | 15,271,417 | | 29,655,884 | | 26,935,996 | | 14,457,686 | | 12,816,043 | | 59,934,127 | | 55,023,456 |
Other non-current non-financial liabilities | | - | | - | | 313,503 | | 435,689 | | - | | - | | 313,503 | | 435,689 |
| | | | | | | | | | | | | | | | |
EQUITY | | 1,729,760,252 | | 1,505,971,728 | | 708,357,506 | | 632,451,790 | | 1,024,875,884 | | 1,063,477,265 | | 3,462,993,642 | | 3,201,900,783 |
Equity attributable to Enel Chile | | 1,729,760,252 | | 1,505,971,728 | | 708,357,506 | | 632,451,790 | | 1,024,875,884 | | 1,063,477,265 | | 2,763,391,288 | | 2,592,681,502 |
Issued capital | | 552,777,321 | | 638,288,813 | | 230,137,980 | | 230,492,200 | | 1,446,193,674 | | 1,360,327,962 | | 2,229,108,975 | | 2,229,108,975 |
Retained earnings | | 1,199,429,221 | | 943,344,263 | | 794,856,204 | | 696,334,837 | | (424,910,134) | | (317,516,621) | | 1,569,375,291 | | 1,322,162,479 |
Other reserves | | (22,446,290) | | (75,661,348) | | (316,636,678) | | (294,375,247) | | 3,592,344 | | 20,665,924 | | (1,035,092,978) | | (958,589,952) |
Non-controlling interests | | - | | - | | - | | - | | - | | - | | 699,602,354 | | 609,219,281 |
| | | | | | | | | | | | | | | | |
Total Liabilities and Equity | | 3,399,682,492 | | 3,389,068,086 | | 1,074,325,848 | | 1,049,583,678 | | 924,702,672 | | 886,817,106 | | 5,398,711,012 | | 5,325,468,870 |
The holdings, eliminations and others column corresponds to transactions between companies in different linesTable of business, primarily purchases and sales of energy and services.Contents
| | Generation | | Distribution | | Holdings, eliminations and others | | Total | |
| | 12-31-2018 | | 12-31-2017 | | 12-31-2018 | | 12-31-2017 | | 12-31-2018 | | 12-31-2017 | | 12-31-2018 | | 12-31-2017 | |
Line of Business | | ThCh$ | | ThCh$ | | ThCh$ | | ThCh$ | | ThCh$ | | ThCh$ | | ThCh$ | | ThCh$ | |
LIABILITIES AND EQUITY | | | | | | | | | | | | | | | | | |
CURRENT LIABILITIES | | 909,428,562 | | 543,356,500 | | 450,182,594 | | 408,687,871 | | (142,147,004 | ) | (135,227,725 | ) | 1,217,464,152 | | 816,816,646 | |
Other current financial liabilities | | 196,141,320 | | 18,815,434 | | 2 | | 14 | | 214,524,493 | | — | | 410,665,815 | | 18,815,448 | |
Trade and other current payables | | 317,337,886 | | 309,883,528 | | 156,939,551 | | 176,411,186 | | 80,008,887 | | 69,683,804 | | 554,286,324 | | 555,978,518 | |
Current accounts payable to related companies | | 337,986,306 | | 122,862,944 | | 258,410,862 | | 207,909,593 | | (438,460,843 | ) | (211,159,565 | ) | 157,936,325 | | 119,612,972 | |
Other current provisions | | 5,195,377 | | 5,296,635 | | — | | — | | 393,409 | | 339,536 | | 5,588,786 | | 5,636,171 | |
Current tax liabilities | | 12,563,801 | | 66,933,261 | | 5,114,119 | | 94,246 | | — | | — | | 17,677,920 | | 67,027,507 | |
Other current non-financial liabilities | | 40,203,872 | | 19,564,698 | | 29,718,060 | | 24,272,832 | | 1,387,050 | | 5,908,500 | | 71,308,982 | | 49,746,030 | |
| | | | | | | | | | | | | | | | | |
NON-CURRENT LIABILITIES | | 1,846,575,202 | | 1,022,091,736 | | 63,065,351 | | 61,965,918 | | 686,751,678 | | 6,937,051 | | 2,596,392,231 | | 1,090,994,705 | |
Other non-current financial liabilities | | 1,028,833,254 | | 781,978,145 | | — | | — | | 677,000,249 | | — | | 1,705,833,503 | | 781,978,145 | |
Trade and other non-current payables | | 2,556,521 | | 632,642 | | 27,172 | | 27,182 | | 487 | | — | | 2,584,180 | | 659,824 | |
Non-current accounts payable to related companies | | 447,193,802 | | 318,518 | | — | | — | | — | | — | | 447,193,802 | | 318,518 | |
Other long-term provisions | | 91,898,262 | | 63,992,567 | | 13,973,113 | | 14,430,270 | | — | | — | | 105,871,375 | | 78,422,837 | |
Deferred tax liabilities | | 260,950,163 | | 160,293,916 | | 21,335,014 | | 18,786,185 | | (4,205,123 | ) | (6,856,420 | ) | 278,080,054 | | 172,223,681 | |
Non-current provisions for employee benefits | | 15,143,200 | | 14,875,948 | | 27,503,399 | | 28,412,505 | | 13,956,065 | | 13,793,471 | | 56,602,664 | | 57,081,924 | |
Other non-current non-financial liabilities | | — | | — | | 226,653 | | 309,776 | | — | | — | | 226,653 | | 309,776 | |
| | | | | | | | | | | | | | | | | |
EQUITY | | 2,867,045,693 | | 1,989,013,954 | | 766,132,225 | | 684,357,859 | | 40,985,863 | | 1,113,589,844 | | 3,674,163,781 | | 3,786,961,657 | |
Equity attributable to Enel Chile | | 2,867,045,693 | | 1,989,013,954 | | 766,132,225 | | 684,357,859 | | 40,985,863 | | 1,113,589,844 | | 3,421,228,519 | | 2,983,384,010 | |
Issued capital | | 1,137,185,366 | | 552,777,321 | | 230,137,980 | | 230,137,980 | | 2,587,168,133 | | 1,446,193,674 | | 3,954,491,479 | | 2,229,108,975 | |
Retained earnings | | 1,626,928,911 | | 1,398,018,156 | | 852,296,368 | | 769,928,443 | | (564,427,666 | ) | (416,341,016 | ) | 1,914,797,613 | | 1,751,605,583 | |
Share Premium | | 85,511,492 | | 85,511,492 | | 354,220 | | 354,220 | | (85,865,712 | ) | (85,865,712 | ) | — | | — | |
Treasury shares | | — | | — | | — | | | | (72,388,009 | ) | — | | (72,388,009 | ) | | |
Other reserves | | 17,419,924 | | (47,293,015 | ) | (316,656,343 | ) | (316,062,784 | ) | (1,823,500,883 | ) | 169,602,898 | | (2,375,672,564 | ) | (997,330,548 | ) |
Non-controlling interests | | — | | — | | — | | — | | — | | — | | 252,935,262 | | 803,577,647 | |
| | | | | | | | | | | | | | | | | |
Total Liabilities and Equity | | 5,623,049,457 | | 3,554,462,190 | | 1,279,380,170 | | 1,155,011,648 | | 585,590,537 | | 985,299,170 | | 7,488,020,164 | | 5,694,773,008 | |
F-119
Line of Business | | Generation | | Distribution | | Holdings, eliminations and others | | Total |
STATEMENT OF COMPREHENSIVE INCOME | | 12-31-2016 | | 12-31-2015 | | 12-31-2014 | | 12-31-2016 | | 12-31-2015 | | 12-31-2014 | | 12-31-2016 | | 12-31-2015 | | 12-31-2014 | | 12-31-2016 | | 12-31-2015 | | 12-31-2014 |
| ThCh$ | | ThCh$ | | ThCh$ | | ThCh$ | | ThCh$ | | ThCh$ | | ThCh$ | | ThCh$ | | ThCh$ | | ThCh$ | | ThCh$ | | ThCh$ |
| | | | | | | | | | | | | | | | | | | | | | | | |
REVENUES AND OTHER OPERATING INCOME | | 1,659,727,329 | | 1,543,812,461 | | 1,220,566,158 | | 1,315,760,852 | | 1,257,732,165 | | 1,127,892,544 | | (433,921,362) | | (402,515,486) | | (299,393,417) | | 2,541,566,819 | | 2,399,029,140 | | 2,049,065,285 |
Revenues | | 1,639,959,816 | | 1,539,991,519 | | 1,199,341,011 | | 1,310,175,226 | | 1,247,900,614 | | 1,116,092,610 | | (434,291,162) | | (403,598,944) | | (300,569,723) | | 2,515,843,880 | | 2,384,293,189 | | 2,014,863,898 |
Energy sales | | 1,516,688,442 | | 1,474,818,366 | | 1,155,805,379 | | 1,172,700,558 | | 1,112,912,836 | | 997,836,084 | | (376,745,382) | | (340,367,445) | | (267,340,580) | | 2,312,643,618 | | 2,247,363,757 | | 1,886,300,883 |
Other sales | | 64,638,599 | | 24,293,133 | | 11,062,697 | | 8,968,859 | | 7,769,616 | | 7,396,980 | | - | | (5,225) | | 8,218,070 | | 73,607,458 | | 32,057,524 | | 26,677,747 |
Other services rendered | | 58,632,775 | | 40,880,020 | | 32,472,935 | | 128,505,809 | | 127,218,162 | | 110,859,546 | | (57,545,780) | | (63,226,274) | | (41,447,213) | | 129,592,804 | | 104,871,908 | | 101,885,268 |
Other operating income | | 19,767,513 | | 3,820,942 | | 21,225,147 | | 5,585,626 | | 9,831,551 | | 11,799,934 | | 369,800 | | 1,083,458 | | 1,176,306 | | 25,722,939 | | 14,735,951 | | 34,201,387 |
RAW MATERIALS AND CONSUMABLES USED | | (895,060,114) | | (880,891,222) | | (750,212,920) | | (1,042,329,385) | | (983,732,902) | | (855,757,752) | | 439,969,919 | | 382,638,565 | | 296,568,389 | | (1,497,419,580) | | (1,481,985,559) | | (1,309,402,283) |
Energy purchases | | (335,731,822) | | (320,731,795) | | (288,442,686) | | (936,965,119) | | (881,589,779) | | (766,324,946) | | 380,950,057 | | 342,118,393 | | 266,346,979 | | (891,746,884) | | (860,203,181) | | (788,420,653) |
Fuel consumption | | (295,148,838) | | (327,502,995) | | (305,475,422) | | - | | - | | - | | - | | - | | (4,838) | | (295,148,838) | | (327,502,995) | | (305,480,260) |
Transportation expenses | | (192,502,995) | | (179,691,471) | | (142,831,143) | | (60,454,433) | | (60,901,746) | | (56,360,475) | | 57,834,310 | | 58,140,062 | | 47,242,839 | | (195,123,118) | | (182,453,155) | | (151,948,779) |
Other miscellaneous supplies and services | | (71,676,459) | | (52,964,961) | | (13,463,669) | | (44,909,833) | | (41,241,377) | | (33,072,331) | | 1,185,552 | | (17,619,890) | | (17,016,591) | | (115,400,740) | | (111,826,228) | | (63,552,591) |
CONTRIBUTION MARGIN | | 764,667,215 | | 662,921,239 | | 470,353,238 | | 273,431,467 | | 273,999,263 | | 272,134,792 | | 6,048,557 | | (19,876,921) | | (2,825,028) | | 1,044,147,239 | | 917,043,581 | | 739,663,002 |
Other work performed by the entity and capitalized | | 9,758,304 | | 15,250,811 | | 16,466,172 | | 6,338,547 | | 5,753,242 | | 5,039,396 | | 1 | | - | | - | | 16,096,852 | | 21,004,053 | | 21,505,568 |
Employee benefits expense | | (60,350,072) | | (70,969,357) | | (64,466,875) | | (35,557,457) | | (32,454,962) | | (31,386,273) | | (28,190,899) | | (33,130,402) | | (30,488,215) | | (124,098,428) | | (136,554,721) | | (126,341,363) |
Other expenses | | (119,303,215) | | (90,327,960) | | (65,464,992) | | (52,077,948) | | (62,182,651) | | (63,527,130) | | 612,026 | | 26,653,214 | | 18,537,907 | | (170,769,137) | | (125,857,397) | | (110,454,215) |
GROSS OPERATING INCOME | | 594,772,232 | | 516,874,733 | | 356,887,543 | | 192,134,609 | | 185,114,892 | | 182,260,785 | | (21,530,315) | | (26,354,109) | | (14,775,336) | | 765,376,526 | | 675,635,516 | | 524,372,992 |
Depreciation and amortization expense | | (132,600,381) | | (124,835,559) | | (98,700,534) | | (30,399,304) | | (29,082,449) | | (27,377,925) | | 1,339,075 | | 716,346 | | (2,358,695) | | (161,660,610) | | (153,201,662) | | (128,437,154) |
Impairment losses (reversal of impairment losses) recognized in profit or loss | | (30,785,531) | | 9,793,653 | | (12,461,456) | | (5,141,179) | | (6,738,750) | | (776,091) | | - | | - | | 52,127 | | (35,926,710) | | 3,054,903 | | (13,185,420) |
OPERATING INCOME | | 431,386,320 | | 401,832,827 | | 245,725,553 | | 156,594,126 | | 149,293,693 | | 154,106,769 | | (20,191,240) | | (25,637,763) | | (17,081,904) | | 567,789,206 | | 525,488,757 | | 382,750,418 |
FINANCIAL RESULT | | (35,678,632) | | (114,252,182) | | (77,428,301) | | 8,579,316 | | 12,294,531 | | 8,282,495 | | 6,616,146 | | 4,088,867 | | 2,101,257 | | (20,483,170) | | (97,868,784) | | (67,044,549) |
Financial income | | 6,150,751 | | 234,822 | | 1,576,923 | | 14,289,185 | | 13,308,032 | | 11,638,248 | | 2,665,965 | | 1,727,315 | | 1,547,344 | | 23,105,901 | | 15,270,169 | | 14,762,515 |
Cash and cash equivalents | | 2,150,797 | | 152,518 | | 1,282,705 | | 1,680,365 | | 634,961 | | 91,399 | | - | | 1,778,538 | | 1,439,028 | | 3,831,162 | | 2,566,017 | | 2,813,132 |
Other financial income | | 3,999,954 | | 82,304 | | 294,218 | | 12,608,820 | | 12,673,071 | | 11,546,849 | | 2,665,965 | | (51,223) | | 108,316 | | 19,274,739 | | 12,704,152 | | 11,949,383 |
Financial costs | | (55,701,778) | | (64,206,719) | | (72,106,182) | | (6,488,659) | | (1,801,829) | | (4,109,576) | | 3,991,055 | | (692,150) | | 589,269 | | (58,199,382) | | (66,700,698) | | (75,626,489) |
Bank borrowings | | (2,033,835) | | (129,350) | | (612,003) | | (476) | | (1,659) | | (5,291) | | - | | (494) | | (1,785) | | (2,034,311) | | (131,503) | | (619,079) |
Secured and unsecured obligations | | (44,268,489) | | (51,697,708) | | (48,046,358) | | - | | - | | - | | - | | - | | - | | (44,268,489) | | (51,697,708) | | (48,046,358) |
Other | | (9,399,454) | | (12,379,661) | | (23,447,821) | | (6,488,183) | | (1,800,170) | | (4,104,285) | | 3,991,055 | | (691,656) | | 591,054 | | (11,896,582) | | (14,871,487) | | (26,961,052) |
Profit (loss) from indexed assets and liabilities | | 606,075 | | 3,600,187 | | 14,341,214 | | 974,891 | | 973,087 | | 632,973 | | 50,874 | | 265,803 | | 289,436 | | 1,631,840 | | 4,839,077 | | 15,263,623 |
Foreign currency exchange differences | | 13,266,320 | | (53,880,472) | | (21,240,256) | | (196,101) | | (184,759) | | 120,850 | | (91,748) | | 2,787,899 | | (324,792) | | 12,978,471 | | (51,277,332) | | (21,444,198) |
Positive | | 48,546,664 | | 26,738,738 | | 17,473,317 | | 609,359 | | (235,571) | | 194,226 | | 65,643 | | 3,930,935 | | 1,966,549 | | 49,221,666 | | 30,434,102 | | 19,634,092 |
Negative | | (35,280,344) | | (80,619,210) | | (38,713,573) | | (805,460) | | 50,812 | | (73,376) | | (157,391) | | (1,143,036) | | (2,291,341) | | (36,243,195) | | (81,711,434) | | (41,078,290) |
Share of profit of associates accounted for using the equity method | | 7,878,201 | | 8,905,045 | | (54,413,310) | | 1,818 | | 5,248 | | - | | (1,819) | | (5,248) | | - | | 7,878,200 | | 8,905,045 | | (54,413,310) |
Other gains (losses) | | 121,490,974 | | 4,015,401 | | 42,651,567 | | (831) | | 14,660,351 | | (392,778) | | (81) | | 1,379,993 | | 28,634,474 | | 121,490,062 | | 20,055,745 | | 70,893,263 |
Gain (loss) from other investments | | 121,457,430 | | 4,309,205 | | 42,651,567 | | (831) | | - | | - | | (81) | | (346) | | 21,077,899 | | 121,456,518 | | 4,308,859 | | 63,729,466 |
Gain (loss) from the sale of property, plant and equipment | | 33,544 | | (293,804) | | - | | - | | 14,660,351 | | (392,778) | | - | | 1,380,339 | | 7,556,575 | | 33,544 | | 15,746,886 | | 7,163,797 |
Income before tax | | 525,076,863 | | 300,501,091 | | 156,535,509 | | 165,174,429 | | 176,253,823 | | 161,996,486 | | (13,576,994) | | (20,174,151) | | 13,653,827 | | 676,674,298 | | 456,580,763 | | 332,185,822 |
Income tax | | (83,216,935) | | (76,655,819) | | (34,098,106) | | (32,589,362) | | (36,956,051) | | (28,575,963) | | 4,403,115 | | 3,999,271 | | (3,343,248) | | (111,403,182) | | (109,612,599) | | (132,687,133) |
Net income from continuing operations | | 441,859,928 | | 223,845,272 | | 122,437,403 | | 132,585,067 | | 139,297,772 | | 133,420,523 | | (9,173,879) | | (16,174,880) | | 10,310,579 | | 565,271,116 | | 346,968,164 | | 199,559,417 |
Net income from discontinued operations | | - | | - | | - | | - | | - | | | | - | | - | | - | | - | | - | | - |
NET INCOME | | 441,859,928 | | 223,845,272 | | 122,437,403 | | 132,585,067 | | 139,297,772 | | 133,420,523 | | (9,173,879) | | (16,174,880) | | 10,310,579 | | 565,271,116 | | 346,968,164 | | 199,559,417 |
Net income attributable to: | | 441,859,928 | | 223,845,272 | | 122,437,403 | | 132,585,067 | | 139,297,772 | | 133,420,523 | | (9,173,879) | | (16,174,880) | | 10,310,579 | | 565,271,116 | | 346,968,164 | | 199,559,417 |
Shareholders of Enel Chile | | - | | - | | - | | - | | - | | - | | - | | - | | - | | 384,159,865 | | 251,838,410 | | 162,459,039 |
Non-controlling interests | | - | | - | | - | | - | | - | | - | | - | | - | | - | | 181,111,251 | | 95,129,754 | | 37,100,378 |
| | | | | | | | | | | | | | | | | | | | | | | | |
Line of Business | | Generation | | Distribution | | Holdings, eliminations and others | | Total |
| | 12-31-2016 | | 12-31-2015 | | 12-31-2014 | | 12-31-2016 | | 12-31-2015 | | 12-31-2014 | | 12-31-2016 | | 12-31-2015 | | 12-31-2014 | | 12-31-2016 | | 12-31-2015 | | 12-31-2014 |
STATEMENT OF CASH FLOWS | | ThCh$ | | ThCh$ | | ThCh$ | | ThCh$ | | ThCh$ | | ThCh$ | | ThCh$ | | ThCh$ | | ThCh$ | | ThCh$ | | ThCh$ | | ThCh$ |
Cash flows from (used in) operating activities | | 490,177,558 | | 428,211,622 | | 239,770,586 | | 148,354,968 | | 194,756,025 | | 37,181,550 | | (23,847,670) | | (46,436,120) | | (12,005,255) | | 614,684,856 | | 576,531,527 | | 264,946,881 |
Cash flows from (used in) investing activities | | (34,631,759) | | (255,251,615) | | (190,799,690) | | (55,007,620) | | (82,947,418) | | (52,663,122) | | 26,150,787 | | 41,457,691 | | 54,724,341 | | (63,488,592) | | (296,741,342) | | (188,738,471) |
Cash flows from (used in) financing activities | | (374,835,378) | | (175,094,207) | | (49,531,606) | | (88,519,047) | | (98,304,569) | | 8,796,278 | | 17,487,453 | | (43,674) | | (118,409,153) | | (445,866,972) | | (273,442,450) | | (159,144,481) |
Table of Contents
| | Generation | | Distribution | | Holdings, eliminations and others | | Total | |
| | 12-31-2018 | | 12-31-2017 | | 12-31-2016 | | 12-31-2018 | | 12-31-2017 | | 12-31-2016 | | 12-31-2018 | | 12-31-2017 | | 12-31-2016 | | 12-31-2018 | | 12-31-2017 | | 12-31-2016 | |
Line of Business | | ThCh$ | | ThCh$ | | ThCh$ | | ThCh$ | | ThCh$ | | ThCh$ | | ThCh$ | | ThCh$ | | ThCh$ | | ThCh$ | | ThCh$ | | ThCh$ | |
STATEMENT OF COMPREHENSIVE INCOME | | | | | | | | | | | | | | | | | | | | | | | | | |
REVENUES AND OTHER OPERATING INCOME | | 1,580,653,088 | | 1,634,937,087 | | 1,659,727,329 | | 1,263,224,072 | | 1,326,658,860 | | 1,315,760,852 | | (386,715,734 | ) | (438,617,665 | ) | (433,921,362 | ) | 2,457,161,426 | | 2,522,978,282 | | 2,541,566,819 | |
Revenues | | 1,540,352,133 | | 1,599,032,140 | | 1,639,959,816 | | 1,254,943,604 | | 1,322,422,609 | | 1,310,175,226 | | (384,935,278 | ) | (437,353,167 | ) | (434,291,162 | ) | 2,410,360,459 | | 2,484,101,582 | | 2,515,843,880 | |
Energy sales | | 1,425,942,129 | | 1,457,671,722 | | 1,516,688,442 | | 1,170,129,333 | | 1,180,426,814 | | 1,172,700,558 | | (393,993,374 | ) | (376,007,978 | ) | (376,745,382 | ) | 2,202,078,088 | | 2,262,090,558 | | 2,312,643,618 | |
Other sales | | 103,779,801 | | 94,452,287 | | 64,638,599 | | 16,411,425 | | 12,741,568 | | 8,968,859 | | 3,154,157 | | 168,942 | | — | | 123,345,383 | | 107,362,797 | | 73,607,458 | |
Other services rendered | | 10,630,203 | | 46,908,131 | | 58,632,775 | | 68,402,846 | | 129,254,227 | | 128,505,809 | | 5,903,939 | | (61,514,131 | ) | (57,545,780 | ) | 84,936,988 | | 114,648,227 | | 129,592,804 | |
Other operating income | | 40,300,955 | | 35,904,947 | | 19,767,513 | | 8,280,468 | | 4,236,251 | | 5,585,626 | | (1,780,456 | ) | (1,264,498 | ) | 369,800 | | 46,800,967 | | 38,876,700 | | 25,722,939 | |
RAW MATERIALS AND CONSUMABLES USED | | (709,506,221 | ) | (903,978,006 | ) | (895,060,114 | ) | (972,499,918 | ) | (1,055,708,050 | ) | (1,042,329,385 | ) | 389,829,023 | | 444,899,135 | | 439,969,919 | | (1,292,177,116 | )0 | (1,514,786,921 | )0 | (1,497,419,580 | ) |
Energy purchases | | (213,114,437 | ) | (346,954,692 | ) | (335,731,822 | ) | (926,385,346 | ) | (938,067,783 | ) | (936,965,119 | ) | 391,853,181 | | 382,587,604 | | 380,950,057 | | (747,646,602 | )0 | (902,434,871 | )0 | (891,746,884 | ) |
Fuel consumption | | (231,028,169 | ) | (280,739,362 | ) | (295,148,838 | ) | — | | — | | — | | — | | — | | — | | (231,028,169 | )0 | (280,739,362 | )0 | (295,148,838 | ) |
Transportation expenses | | (154,044,158 | ) | (152,869,838 | ) | (192,502,995 | ) | (9,816,883 | ) | (63,009,956 | ) | (60,454,433 | ) | (3,014,761 | ) | 60,000,545 | | 57,834,310 | | (166,875,802 | )0 | (155,879,249 | )0 | (195,123,118 | ) |
Other miscellaneous supplies and services | | (111,319,457 | ) | (123,414,114 | ) | (71,676,459 | ) | (36,297,689 | ) | (54,630,311 | ) | (44,909,833 | ) | 990,603 | | 2,310,986 | | 1,185,552 | | (146,626,543 | )0 | (175,733,439 | )0 | (115,400,740 | ) |
CONTRIBUTION MARGIN | | 871,146,867 | | 730,959,081 | | 764,667,215 | | 290,724,154 | | 270,950,810 | | 273,431,467 | | 3,113,289 | | 6,281,470 | | 6,048,557 | | 1,164,984,310 | | 1,008,191,361 | | 1,044,147,239 | |
Other work performed by the entity and capitalized | | 8,663,737 | | 7,226,484 | | 9,758,304 | | 6,667,947 | | 6,630,130 | | 6,338,547 | | 1,379,279 | | 532,373 | | 1 | | 16,710,963 | | 14,388,987 | | 16,096,852 | |
Employee benefits expense | | (61,991,737 | ) | (54,222,470 | ) | (60,350,072 | ) | (32,598,818 | ) | (38,449,551 | ) | (35,557,457 | ) | (28,539,779 | ) | (28,831,756 | ) | (28,190,899 | ) | (123,130,334 | ) | (121,503,777 | ) | (124,098,428 | ) |
Other expenses | | (104,190,567 | ) | (102,821,020 | ) | (119,303,215 | ) | (64,179,201 | ) | (61,942,592 | ) | (52,077,948 | ) | 1,159,747 | | 2,939,538 | | 612,026 | | (167,210,021 | ) | (161,824,074 | ) | (170,769,137 | ) |
GROSS OPERATING INCOME | | 713,628,300 | | 581,142,075 | | 594,772,232 | | 200,614,082 | | 177,188,797 | | 192,134,609 | | (22,887,464 | ) | (19,078,375 | ) | (21,530,315 | ) | 891,354,918 | | 739,252,497 | | 765,376,526 | |
Depreciation and amortization expense | | (179,901,682 | ) | (117,337,553 | ) | (132,600,381 | ) | (36,677,957 | ) | (36,685,324 | ) | (30,399,304 | ) | 1,392,339 | | 1,338,771 | | 1,339,075 | | (215,187,300 | ) | (152,684,106 | ) | (161,660,610 | ) |
Impairment losses (reversal of impairment losses) recognized in profit or loss | | (106,264 | ) | 55,494 | | (30,785,531 | ) | (4,676,808 | ) | (7,993,311 | ) | (5,141,179 | ) | (779,825 | ) | — | | — | | (5,562,897 | ) | (7,937,817 | ) | (35,926,710 | ) |
OPERATING INCOME | | 533,620,354 | | 463,860,016 | | 431,386,320 | | 159,259,317 | | 132,510,162 | | 156,594,126 | | (22,274,950 | ) | (17,739,604 | ) | (20,191,240 | ) | 670,604,721 | | 578,630,574 | | 567,789,206 | |
FINANCIAL RESULT | | (86,621,659 | ) | (36,610,248 | ) | (35,678,632 | ) | 6,088,801 | | 6,411,837 | | 8,579,316 | | (30,342,206 | ) | 7,783,757 | | 6,616,146 | | (110,875,064 | ) | (22,414,654 | ) | (20,483,170 | ) |
Financial income | | 8,727,356 | | 5,273,672 | | 6,150,751 | | 11,166,433 | | 12,894,635 | | 14,289,185 | | 40,679 | | 3,494,381 | | 2,665,965 | | 19,934,468 | | 21,662,688 | | 23,105,901 | |
Cash and cash equivalents | | 5,673,621 | | 3,077,708 | | 2,150,797 | | 1,633,373 | | 1,975,564 | | 1,680,365 | | 2,305,581 | | 3,323,751 | | — | | 9,612,575 | | 8,377,023 | | 3,831,162 | |
Other financial income | | 3,053,735 | | 2,195,964 | | 3,999,954 | | 9,533,060 | | 10,919,071 | | 12,608,820 | | (2,264,902 | ) | 170,630 | | 2,665,965 | | 10,321,893 | | 13,285,665 | | 19,274,739 | |
Financial costs | | (82,878,715 | ) | (50,851,829 | ) | (55,701,778 | ) | (6,724,490 | ) | (7,094,366 | ) | (6,488,659 | ) | (32,580,984 | ) | 4,435,313 | | 3,991,055 | | (122,184,189 | ) | (53,510,882 | ) | (58,199,382 | ) |
Bank borrowings | | (9,269,535 | ) | (261 | ) | (2,033,835 | ) | (5,374 | ) | (12,299 | ) | (476 | ) | (11,426,865 | ) | (25 | ) | — | | (20,701,774 | ) | (12,585 | ) | (2,034,311 | ) |
Secured and unsecured obligations | | (43,965,839 | ) | (42,708,253 | ) | (44,268,489 | ) | — | | — | | — | | (18,289,461 | ) | — | | — | | (62,255,300 | ) | (42,708,253 | ) | (44,268,489 | ) |
Other | | (29,643,341 | ) | (8,143,315 | ) | (9,399,454 | ) | (6,719,116 | ) | (7,082,067 | ) | (6,488,183 | ) | (2,864,658 | ) | 4,435,338 | | 3,991,055 | | (39,227,115 | ) | (10,790,044 | ) | (11,896,582 | ) |
Profit (loss) from indexed assets and liabilities | | (2,480,291 | ) | 145,608 | | 606,075 | | 1,616,607 | | 761,262 | | 974,891 | | 45,538 | | 9,796 | | 50,874 | | (818,146 | ) | 916,666 | | 1,631,840 | |
Foreign currency exchange differences | | (9,990,009 | ) | 8,822,301 | | 13,266,320 | | 30,251 | | (149,694 | ) | (196,101 | ) | 2,152,561 | | (155,733 | ) | (91,748 | ) | (7,807,197 | ) | 8,516,874 | | 12,978,471 | |
Positive | | 26,031,044 | | 19,563,838 | | 48,546,664 | | 209,555 | | 58,288 | | 609,359 | | 3,851,302 | | 134,942 | | 65,643 | | 30,091,901 | | 19,757,068 | | 49,221,666 | |
Negative | | (36,021,053 | ) | (10,741,537 | ) | (35,280,344 | ) | (179,304 | ) | (207,982 | ) | (805,460 | ) | (1,698,741 | ) | (290,675 | ) | (157,391 | ) | (37,899,098 | ) | (11,240,194 | ) | (36,243,195 | ) |
Share of profit of associates accounted for using the equity method | | 3,190,240 | | (2,696,904 | ) | 7,878,201 | | — | | — | | 1,818 | | — | | — | | (1,819 | ) | 3,190,240 | | (2,696,904 | ) | 7,878,200 | |
Other gains (losses) | | 3,434,503 | | 113,088,869 | | 121,490,974 | | — | | 157,458 | | (831 | ) | (24,124 | ) | (5,131 | ) | (81 | ) | 3,410,379 | | 113,241,196 | | 121,490,062 | |
Gain (loss) from other investments | | 409,954 | | 105,462,769 | | 121,457,430 | | — | | 4,026 | | (831 | ) | (24,124 | ) | (5,131 | ) | (81 | ) | 385,830 | | 105,461,664 | | 121,456,518 | |
Gain (loss) from the sale of property, plant and equipment | | 3,024,549 | | 7,626,100 | | 33,544 | | — | | 153,432 | | — | | — | | — | | — | | 3,024,549 | | 7,779,532 | | 33,544 | |
Income before tax | | 453,623,438 | | 537,641,733 | | 525,076,863 | | 165,348,118 | | 139,079,457 | | 165,174,429 | | (52,641,280 | ) | (9,960,978 | ) | (13,576,994 | ) | 566,330,276 | | 666,760,212 | | 676,674,298 | |
Income tax | | (113,783,941 | ) | (112,099,519 | ) | (83,216,935 | ) | (42,967,123 | ) | (34,030,322 | ) | (32,589,362 | ) | 3,268,545 | | 2,787,540 | | 4,403,115 | | (153,482,519 | ) | (143,342,301 | ) | (111,403,182 | ) |
Net income from continuing operations | | 339,839,497 | | 425,542,214 | | 441,859,928 | | 122,380,995 | | 105,049,135 | | 132,585,067 | | (49,372,735 | ) | (7,173,438 | ) | (9,173,879 | ) | 412,847,757 | | 523,417,911 | | 565,271,116 | |
Net income from discontinued operations | | — | | — | | — | | — | | — | | — | | — | | — | | — | | — | | — | | — | |
NET INCOME | | 339,839,497 | | 425,542,214 | | 441,859,928 | | 122,380,995 | | 105,049,135 | | 132,585,067 | | (49,372,735 | ) | (7,173,438 | ) | (9,173,879 | ) | 412,847,757 | | 523,417,911 | | 565,271,116 | |
Net income attributable to: | | 339,839,497 | | 425,542,214 | | 441,859,928 | | 122,380,995 | | 105,049,135 | | 132,585,067 | | (49,372,735 | ) | (7,173,438 | ) | (9,173,879 | ) | 412,847,757 | | 523,417,911 | | 565,271,116 | |
Shareholders of Enel Chile | | — | | — | | — | | — | | — | | — | | — | | — | | — | | 361,709,937 | | 349,382,642 | | 384,159,865 | |
Non-controlling interests | | — | | — | | — | | — | | — | | — | | — | | — | | — | | 51,137,820 | | 174,035,269 | | 181,111,251 | |
| | Generation | | Distribution | | Holdings, eliminations and others | | Total | |
| | 12-31-2018 | | 12-31-2017 | | 12-31-2016 | | 12-31-2018 | | 12-31-2017 | | 12-31-2016 | | 12-31-2018 | | 12-31-2017 | | 12-31-2016 | | 12-31-2018 | | 12-31-2017 | | 12-31-2016 | |
Line of Business | | ThCh$ | | ThCh$ | | ThCh$ | | ThCh$ | | ThCh$ | | ThCh$ | | ThCh$ | | ThCh$ | | ThCh$ | | ThCh$ | | ThCh$ | | ThCh$ | |
STATEMENT OF CASH FLOWS | | | | | | | | | | | | | | | | | | | | | | | | | |
Cash flows from (used in) operating activities | | 638,607,494 | | 488,167,382 | | 490,177,558 | | 117,692,384 | | 170,628,958 | | 148,354,968 | | (20,774,356 | ) | (23,182,620 | ) | (23,847,670 | ) | 735,525,522 | | 635,613,720 | | 614,684,856 | |
Cash flows from (used in) investing activities | | (451,284,432 | ) | (91,867,647 | ) | (34,631,759 | ) | (123,070,452 | ) | (74,464,531 | ) | (55,007,620 | ) | (1,307,204,810 | ) | 19,866,401 | | 26,150,787 | | (1,881,559,694 | ) | (146,465,777 | ) | (63,488,592 | ) |
Cash flows from (used in) financing activities | | (249,051,150 | ) | (301,835,211 | ) | (374,835,378 | ) | (32,268,227 | ) | (76,923,085 | ) | (88,519,047 | ) | 1,247,896,253 | | 61,162,775 | | 17,487,453 | | 966,576,876 | | (317,595,521 | ) | (445,866,972 | ) |
The holdings, eliminations and others column corresponds to transactions between companies in different lines of business, primarily purchases and sales of energy and services.services
F-120
33.
| THIRD PARTY GUARANTEES, OTHER CONTINGENT ASSETS AND LIABILITIES, AND OTHER COMMITMENTS.
|
Table of Contents
36.THIRD PARTY GUARANTEES, OTHER CONTINGENT ASSETS AND LIABILITIES, AND OTHER COMMITMENTS.33.1
36.1 Direct guarantees.
As of December 31, 2016, there are no direct guarantees.
As of December 31, 2015, the direct guarantees, were as follows:
Creditor Of Guarantee | | Debtor | | Type of Guarantee | | Assets Committed | | Outstanding balance as of |
| Company | | Relationship | | | Type | | Currency | | Carrying Amount | | Currency | | 12-31-2015 |
Deutsche Bank / Santander Benelux | | Enel Chile S.A. | | Creditor | | Deposit account | | Deposit account | | ThCh$ | | 11,930,477 | | ThCh$ | | 40,354,434 |
For the years ended December 31, 20162018 and 2015,2017, the Group had future energy purchase commitments amounting to ThCh$18,694,023,941,8,404,005 and ThCh$10,546,696,825,16,493,309, respectively.
33.2
36.2 Indirect guarantees
Type
| | Contract
| | Maturity
| | Creditor of Guarantee
| | Debtor
| | Type of Guarantee
| | Outstanding balance as of
|
| | | | Company
| | Relationship
| | | Currency
| | 12-31-2016
| | 12-31-2015
|
| | | | | | | | | | | | | | | | | | |
Secured
| | Bonds Serie B
| | October 2028
| | Bondholders of Enel Américas' Bonds
| | Enel Américas S.A.
| | Entities demerged from original debtor Enersis S.A. (codebtor Enel Chile S.A.) (1)
| | Codebtor
| | ThCh$
| | 22,393,639
| | -
|
| | | | | | | | | | | | Total
| | 22,393,639
| | -
|
| (1)
| As a result of the Enersis’ Spin-Off and in accordance with the bond indenture, all entities arising from the demerger are liable for the debt, regardless that the payment obligation remains in Enel Américas S.A.
|
| | | | | | | | Debtor | | | | Outstanding balance as of | |
Type | | Contract | | Maturity | | Creditor of Guarantee | | Company | | Relationship | | Type of Guarantee | | Currency | | 12-31-2018 | | 12-31-2017 | |
Secured | | Bonds Serie B (1) | | October 2028 | | Bondholders of Enel Américas’ Bonds | | Enel Américas S.A. | | Entities demerged from original debtor Enersis S.A. (codebtor Enel Chile S.A.) (1) | | Codebtor | | USD | | 22,798 | | 31,294 | |
Aval | | Credit Opening Agreement | | September 2019 | | Bilbao Viscaya Argentina Bank, Chile | | Enel Green Power Chile Limitada | | Subsidiary | | Codebtor | | USD | | 100,000 | | | |
Aval | | Credit Opening Agreement | | December 2020 | | Bilbao Viscaya Argentina Bank, Chile | | Enel Green Power Chile Limitada | | Subsidiary | | Codebtor | | USD | | 150,000 | | | |
Aval | | Credit Opening Agreement | | December 2021 | | Bilbao Viscaya Argentina Bank, Chile | | Empresa Electrica Panguipulli S.A | | Subsidiary | | Codebtor | | USD | | 150,000 | | | |
(1)As a result of the Enersis’ Spin-Off and in accordance with the bond indenture, all entities arising from the demerger are liable for the debt, regardless that the payment obligation remains in Enel Américas S.A.
33.3
36.3 Lawsuits and Arbitration Proceedings.
As of the date of these consolidated financial statements, the most relevant litigation involving the Company and its subsidiaries are as follows:
1. In 2005, three lawsuits were filed Enel Chile S.A.
1.1. Inversiones Tricahue S.A., a minority shareholder of Empresa Eléctrica Pehuenche S.A., requested in the 22nd Civil Court of Santiago the appointment of an arbitrator, to hear and resolve the arbitration claim that Inversiones Tricahue S.A. seeks to bring against Empresa Eléctrica Pehuenche S.A., Enel Generación Chile S.A., the Chilean TreasuryEnel Chile S.A., and the Chilean Water Authority (DGA, in its Spanish acronym), which are currently being treateddirectors of these three companies, for the alleged damages that the Pehuenche management allegedly inflicted on the minority shareholders, as a single proceeding, requesting that DGA Resolution No. 134,result of the Project Elqui reorganization and the development of Pehuenche’s electricity generation business.
Once the request for the appointment of an arbitrator was presented, the three defendant companies and their directors submitted numerous objections, all of which established non-consumptive water rights in favorwere rejected by the ruling of Enel Generación Chile S.A. to build the Neltume hydroelectric power plant project be declared nullJune, 2018. Subsequently, Mr. Nelson Contador was designated as a matterreferee judge whom accepted the position. The companies and their directors appealed the appointment of public policy, with compensation for damages. Alternatively, the lawsuits request the compensation for damages for the losses allegedly sustained by the plaintiffs due to the loss of their status as riparian owners along Pirihueico Lake, as well as due to the devaluation of their properties. The defendants have rejected these allegations, contending that the DGA Resolution complies with all legal requirements, and that the exercise of this right does not cause any detriment to the plaintiffs, among other arguments. The sums involved in these suits are undetermined. This case was joined with two other cases: the first one is captioned “Arrieta v. the State and Others”arbitrator judge, granting said recourse in the 9th Civil Court, docket 15279-2005 andonly devolutive effect. Against this resolution, the second is captioned “Jordán v. the State and Others,” in the 10th Civil Court, docket 1608-2005. With regard to these cases, an injunction has been ordered against entering into any acts and contracts concerning Enel Generación Chile S.A.’s water rights related to the Neltume project. On September 25, 2014, the Court of Law issued an unfavorable ruling against Enel Generación Chile S.A. that in essence declared the right to use water established by DGA Resolution No. 134 illegal and orders its cancellation in the corresponding Water Rights Register of the correspondent Real Estate Registrar. Enel Generación Chile S.A.defendants filed an appeal and cassationto the ruling claiming that said appeal should have been granted in both cases ordering the suspension of the sentence while the appeals are resolved. On the other hand, the plaintiff also filed an appeal to the ruling, urging that the appeals granted not be processed, as far as it seems, the resolution that the arbitrator appointed does not admit an appeal. Both resources with the Santiago Court of Appeals, which are still pending.pending resolution.
2. On May 12, 2014, Compañía Eléctrica Tarapacá S.A., (hereinafter “Celta”), a subsidiary that was merged into GasAtacama Chile S.A. on November 1, 2016 formally filed an arbitration claim against Compañía Minera Doña Inés de Collahuasi, requesting that the Arbitration Court of Law declare that through the contracts entered into in 1995 and 2001, the parties have established a long-term contractual relation, characterized by the economic balance that there must be in their reciprocal services supplied and that, due to the above, greater costs corresponding to the investment that must be made to comply with the emission standard contained in DS (Supreme Decree) (MMA) No. 13 of 2011 must be shared by the parties. Based on this, the defendant should start paying up to the maturity is the aggregate of the contract, a fixed monthly charge that through March 31, 2020 would amounts to US$ 72,275,000 (approximately ThCh$ 48,385,944), for the proportional part of the investments that the defendant must pay due to the Supreme Decree mentioned above.
The claim was notified on July 3, 2014. On August 8, 2014, Collahuasi contested Celta’s claim and filed a counterclaim against Celta requesting that the Court declare that Celta has violated the prohibition to call on as precedent what was agreed to in the modifications of the 2009 supply contracts, reserving the right to discuss and prove the amount of damages. On August 26, 2014, Celta filed its response to the main claim and contested the counterclaim. On September 11, 2014 Collahuasi filed its rejoinder to the main claim and its response to the counterclaim. On October 1, 2014, Celta filed its response to the counterclaim. Additionally, the Arbitration Judge formulated a questionnaire with questions separately to each one of the parties and also with common questions for both.
Once the parties responded to the questions, the arbitrator gave the parties a deadline of January 16, 2015 to contest or observe the answers provided and the documents attached specifying the contrary. The arbitrator gave the parties for their study a base for an agreement, which was analyzed and accepted by the parties in November 2016, resulting in final disposition of the lawsuit.
3. In August 2013, the Chilean Superintendence of the Environment (“SMA” in its Spanish acronym) filed charges against Enel Generación Chile alleging several violations of Exempt Resolution No. 206, dated August 2, 2007 and its supplementary and explanatory resolutions that environmentally certified the Bocamina Thermal Power Plant Extension Project. These alleged violations are related to the cooling system discharge channel, an inoperative Bocamina I desulphurizer, non-compliance with information delivery obligations, surpassing CO limits, failures in the acoustic perimeter fence of Bocamina I, excessive noise levels and having no technological barriers that prevent the massive entry of biomass in the intake of the central power plant. Enel Generación Chile submitted a compliance program that was not approved. On November 27, 2013, SMA added two additional violations to its charges. Enel Generación Chile presented its defense in December 2013, partially recognizing some of these violations (which could reduce the fine by 25% in case of recognition) and contesting the remainder. On August 11, 2014, the SMA passed Resolution No. 421 that fined Enel Generación Chile UTA 8,640.4 for environmental non-compliances that are the subject matter of the sanction proceeding. Enel Generación Chile filed an illegality claim against the SMA before the Third Environmental Court of Valdivia which on March 27, 2015 issued a ruling that partially annulled the sanctions imposed of by the SMA, instructing it to consider aggravating circumstances evidenced in connection with the calculation of the fine imposed. Enel Generación Chile filed a writ of reversal in substance before the Chilean Supreme Court, which was rejected, confirming the imposed fine except for a UTA 1,477 fine, in respect of which the decision was postponed until December 13, 2016, the date on which the decision of the Supreme Court was notified, confirming the totality of the fine. The imposed sanction confirmed in 2015 was paid in 2015. The UTA 1,477 fine was fully paid in December 2016, finalizing the lawsuit.
4. On May 23, 2016 the Superintendence of Electricity and Fuels by2.1. By means of ORD No. 5,705 of May 23, 2016, the Superintendency of Electricity and Fuels, filed charges against GasAtacama Chile S.A., for providing allegedly erroneous information to national centralizingthe centralized operating agent of the national CDEC-SING regardingwith respect to the Technical Minimum Technical (MT) and Average Time of the Operation parameters (TMO) parameters during the period frombetween January 1, 2011 toand October 29, 2015.2015, GasAtacama Chile S.A. presented its objections, which were rejected by the Superintendency’s Resolution No. 014606 of August 4 of 2016, which imposed a fine of 120,000 UTM (ThCh $5,802,360). In opposition to the above mentioned resolution of the Superintendency that applied the fine, GasAtacama Chile S.A. submitted its denials, which were rejected through notification by the Superintendence’s Resolution No. 014606 dated August 4, 2016, setting a finerequest for UTM 120,000. Disagreeing with the Superintendence’s resolution applying the fine in question, GasAtacama Chile S.A. filed an appeal for reinstatement filedreconsideration before the Superintendence,Superintendency, which was rejected by the Superintendence through Resolution No. 15908, dated November 2, 2016, confirmingwhich confirms the totality of the fine imposed. In opposition to the aforementioned resolution, GasAtacama Chile S.A. filed ana claim of illegality claim before the Court of Appeals of Santiago, recognizing a provision for 25% of the fine. To date,The Court of Appeals of Santiago, meanwhile, on April 9, 2019, issued a ruling that reduced the claimfine imposed from 10,000 UTA (120,000 UTM) to 500 UTA. Both the Superintendency of illegalityElectricity and Fuels and GasAtacama Chile S.A. filed appeals before the Supreme Court against this ruling, which is pending admissibility, hearing and resolution.
F-121
Table of Contents
3. Enel Distribución Chile S.A.
3.1 The attorney, Ms. Nicole Vasseur Porcel, as legal representative of Ms. Camila Paz Castillo Abarca and her minor daughter Ms. Kimora Belén Fernández Castillo, and Ms. Graciela Rodríguez Mundaca, filed a lawsuit against Chilectra S.A. (now Enel Distribución Chile S.A.) for a total amount of ThCh$600,000 (ThCh$200,000 each) for alleged punitive damages due to death of her spouse, father and son, respectively, Mr. Patricio Javier Fernández Rodríguez (deceased), which occurred on February 21, 2012 as a result of the injuries suffered by his fall from a street lighting pole after a truck passing through hooked the power lines attached to such a pole and caused it to fall. On February 24, 2016, Enel Distribución Chile requested the abandonment of the legal proceeding (together with the suspension of the proceeding and the file), before which the plaintiff did not make any presentation. The request for abandonment of the proceeding is still pending resolution.
3.2 Ms. Evelyn del Carmen Molina González, on her own behalf and on behalf of her minor daughters Maite Alué Letelier Molina and Daniela Anaís Letelier Molina, filed a lawsuit against Chilectra S.A. (now Enel Distribución Chile S.A.) and its subcontractor Sociedad de Servicios Personales para el Área Eléctrica Limitada (“SSPAEL”) for a total amount of ThCh$2,000,000 (ThCh$1,000,000 for the first plaintiff and ThCh$500,000 for each of the latter two plaintiffs) for punitive damages due to death of their spouse and father, respectively, Mr. David Letelier Riveros (deceased), which occurred on May 25, 2013 as a result of the injuries suffered by electrocution and falling from a street lightning pole on which he was working. On November 24, 2017 Enel Distribución Chile filed an appeal against the ruling, raising the antecedents to the Court of Appeals of Santiago on December 4, 2017, in relation to the case since December 20, 2017. On December 21, 2018 the sentence is confirmed by the Court of Appeals.
3.3 A class action lawsuit sponsored by the National Consumer Board (SERNAC) for alleged breach of the collective, diffuse interest of the consumers as provided for in the Consumer Protection Law, for which they petitioned that Enel Distribución Chile S.A. should be fined for the breach of the above-mentioned law, and also that it should be ordered to pay compensation for damages caused to all of the consumers as a result of the interruption of the electricity supply that affected a large part of the Metropolitan Region as a result of the inclement weather front, specifically a snowstorm, in July 2017. On November 13, 2017 Enel Distribución Chile answered the complaint. Enel Distribución Chile believes that the expected outcome of the litigation is remote, considering the background that is at hand. It is worth mentioning that in this case the amount of compensation claimed is indeterminate. Besides, 35 new consumers have joined the lawsuit. A summons to a conciliation hearing is pending.
3.4 Ms. Ximena Acevedo Herrera, Benjamín Jiménez Acevedo, Francisco Jiménez Acevedo, Nancy Garrido Muñoz, Juan Carlos Jiménez Rocuant, Carolina Jiménez Garrido and Natalia Jiménez Garrido filed a lawsuit against Ingeniería Eléctrica Azeta Ltda and Enel Distribución Chile S.A. for a total amount of ThCh$878,227 (ThCh$28,226 for lost profits and ThCh$850,000 for punitive damages) due to the death of their spouse, father, son, and brother, Mr. Juan Pablo Jiménez Garrido (deceased), which occurred on February 22, 2013 as a result of a head trauma caused by a bullet. Enel Distribución Chile is a defendant in its capacity as the contractor of Azeta. On May 31, 2018, the plaintiff requested nullity of the hearing of the case due to the impediment of appearing due to force majeure, evacuating the transfer of Enel Distribución Chile on June 15, 2018, which was rejected on June 28, 2018.
3.5 Mr. Víctor Hugo Coronado González; Ms. Francia Magali Bustos Uribe, both on their behalf and on behalf of their minor daughter Nicolson Rocío Coronado Bustos, and of Víctor Ignacio Coronado Bustos, filed a lawsuit against Enel Distribución Chile for a total amount of ThCh$704,860 (ThCh$264,860 for lost profits
F-122
Table of Contents
and ThCh$440,000 for punitive damages) due to the accident that occurred on June 22, 2015 and affected Mr. Víctor Hugo Coronado González who received an electrical discharge and suffered severe injuries. On July 30, 2018, the confessional evidence was presented by the plaintiff. On August 9, 2018 the expert report was released. On August 14, 2018 the plaintiff presented its observations of the evidence. On August 23, 2018 the court summoned the parties to hear the ruling. Enel Distribución Chile filed a request for reconsideration against the resolution summoned the parties to hear the ruling alleging that there was evidence pending. However, the court rejected the request for reconsideration.
3.6 By means of Exempt Resolution No. 21,036 of November 3, 2017, the Superintendency of Electricity and Fuels confirmed the fine of 35,611 UTM imposed on Enel Distribución Chile S.A., when it ruled against the request for reconsideration of the ruling filed on January 14, 2016, against Exempt Resolution No. 11,750 of December 29, 2015 because it considered that, in the period 2013-2014, Enel Distribución Chile had repeatedly exceeded the supply continuity indices stipulated in the law. In opposition to the aforementioned ruling, Enel Distribución presented an appeal before the Court of Appeals of Santiago on November 28, 2017. On July 12, 2018, the expert (appointed by the Court) summoned the recognition hearing, which was rejected by the Court in a ruling dated July 26, 2018. On August 1, 2018, Enel Distribución Chile filed a request for reconsideration against said ruling. On August 8, 2018, the expert informed the Court that he had assumed a public position that disqualified him from providing the expert testimony, which the Court took into account in a ruling dated August 9, 2018. On the same date, Enel Distribución Chile requested a hearing for the appointment of a new expert, which hearing was held on September 21, 2018, because the Superintendency of Electricity and Fuels did not appear at the hearing.
3.7 By means of Exempt Resolution No. 24805 dated July 20, 2018, the Superintendency of Electricity and Fuels confirmed the fine imposed on Enel Distribución Chile S.A. for 80,000 UTM, when it rejected the request for reconsideration filed against Exempt Resolution No. 21788 of December 29, 2017 based on the fact that Enel Distribución Chile kept more than 100,000 customers without electricity supply for a period exceeding 20 hours, in relation to the power outage that occurred on July 15, 2017 (the snowstorm event). In opposition to the aforementioned resolution, Enel Distribución Chile presented an appeal before the Court of Appeals of Santiago on August 7, 2018. On August 21, 2018, the Court heard the appeal, requesting a report from the Superintendency of Electricity and Fuels, which was released on September 7, 2018. On September 10, 2018, Enel Distribución Chile requested that a probationary period be opened. On September 26, 2018 the parties were summoned to make their closing arguments, and the Court rejected the request to open a probationary period.
3.8 By means of Exempt Resolution No. 24821 dated July 23, 2018, the Superintendency of Electricity and Fuels confirmed the fine imposed on Enel Distribución Chile S.A. for 10,000 UTM, when it rejected the request for reconsideration against Exempt Resolution No. 21790 dated December 29, 2017 based on the fact that Enel Distribución Chile did not provide an adequate and timely customer service to the power outage that occurred on July 15, 2017 (the snowstorm event), which resulted from not having adequate customer service and information systems. In opposition to the aforementioned resolution, Enel Distribución Chile filed an appeal with the Court of Appeals of Santiago on August 7, 2018.
3.9 By means of Exempt Resolution No. 19,939 dated August 11, 2017, the Superintendency of Electricity and Fuels imposed a fine of 70,000 UTM on Enel Distribución Chile for the delay of more than 20 hours in the restoration of the electricity supply for 23,359 customers with respect to the inclement weather front that occurred June 16, 2017. On August 23, 2018, Enel Distribución Chile filed a request for reconsideration against this resolution. On July 9, 2018, Enel Distribución Chile filed an appeal before the Court of Appeals of Santiago. The contingency loss ratingBy resolution of July 23, 2018, the Court heard the appeal, requesting a report from the Superintendency of Electricity and Fuels, which was released on this issue is likely.August 8, 2018. By resolution of August 13, 2018, the parties were summoned to make their closing arguments. On August 14, 2018, Enel Distribución Chile requested the opening of a probationary period, which the court rejected in a decision dated August 28, 2018. On August 29, 2018, Enel Distribución Chile filed a request for reconsideration against said decision, which was also rejected on September 11, 2018.
F-123
Table of Contents
The
In relation to the litigation described above, the Group has established provisions for ThCh $12,634,688 as of December 31, 2018 (see Note 25). Although there are other lawsuits that also have associated provisions but are not described in this note because they individually represent immaterial amounts, the management of the Company considers that the provisions recorded in the consolidated financial statements are adequate to cover the risks resulting from litigation described in this Note. Itbecause it does not consider there to be any additional liabilities other than those specified.
Given the characteristics of the risks covered by these provisions, it is not possible to determine a reasonable schedule of payment dates if there are any.
33.4
36.4 Financial restrictions.
As of December 31, 2016, the Company, on a stand-alone basis, had no debt obligations and was therefore not subject to any covenants or events of default. However, a
A number of the Group’s subsidiaries’ loan agreements, include the obligation to comply with certain financial ratios, which is normal in contracts of this nature. There are also affirmative and negative covenants requiring the monitoring of these commitments. In addition, there are restrictions in the events-of-default clauses of the agreements which require compliance.
1. Cross Default | 1.
| Cross Default
|
Some of the financial debt contracts of Enel Generación Chile contain cross default clauses.clauses, Enel Chile’s bank credit under the law of the State of New York, signed in January 2018 and that expires in July 2019, does not refer to any of its subsidiaries. Therefore, the cross default can only be caused by default on another debt of Enel Chile. For the acceleration of the debt in this loan due to the cross default originating in other debts, the amount in default, whether at individual or aggregate debt level, must exceed US $ 100 million, or its equivalent in other currencies, and other additional conditions must be met, including the expiry of grace periods (if any in the contract in default) and formal notice of the intention to accelerate the debt by creditors representing more than 50% of the amount owed or committed. This loan was obtained in March 2018. As of December 31, 2018, the outstanding amount for this loan was ThUS$212,736,908.
Regarding the Enel Chile bond registered with the SEC, commonly called “Yankee bonds”, a cross default might be triggered by another debt of the Company on an individual level, or of any Chilean subsidiary, for any amount overdue provided that the principal of the debt giving rise to the cross default exceeds US$150 million, or its equivalent in other currencies. Debt acceleration due to cross default does not occur automatically but has to be demanded by the holders of at least 25% of the bonds of the specific series of Yankee bonds. The Yankee bond of Enel Chile matures in 2028. As of December 31, 2018, the outstanding amount for the Yankee Bond was ThUS$678,787,835.
The credit line agreement governed by Chilean law, which Enel Generación Chile signed in March 2016, and wich expired on March 2019,for U.F.UF 2.8 million, stipulates that cross default is only triggered in the event of non-compliance by the borrower itself, i.e., Enel Generación Chile, with no reference made to its subsidiaries. In order to accelerate payment of the debt in this credit line due to cross default originated from other debt, the amount in default must exceed US$50 million, , or the equivalent in other currencies, and other additional conditions must be met such as the expiration of any grace periods. Since being signed, this credit line has not been used. Enel Generación Chile’s international credit linesagreement governed by New York State law, which werewas signed in July 2014 and inFebruary 2016 expiring in July 2019 and February 2020, respectively, also makes no reference to its subsidiaries, thus, cross default is only triggered in the event of non-compliance by the borrower itself. For the repayment of debt to be accelerated under these credit lines due to cross default originated from other debt the amount in default must exceed US$50 million or its equivalent in other currencies, and other additional conditions must be met, including the expiration of grace periods (if any), and a formal notice of intent to accelerate the debt repayment must have been served by creditors representing more than 50% of the amount owed or committed in the contract. As of December 31, 2016,2018, these credit lines have not been drawn upon.
In relation to the bond issues of Enel Generación Chile registered with the United States Securities and Exchange Commission (the “SEC”),SEC, commonly called “Yankee bonds”, a cross default can be triggered by another debt of the same company or of any of their subsidiaries, for
F-124
Table of Contents
any amount overdue provided that the principal of the debt giving rise to the cross default exceeds US$30 million or its equivalent in other currencies. Debt acceleration due to cross default does not occur automatically but has to be demanded by at least 25% of the bondholders of a certain series of Yankee bonds. The Yankee bonds of Enel Generación Chile mature in 2024, 2027, 2037 and 2097. For the specific Yankee Bondbond that was issued in April 2014 andwith maturity in 2024, the threshold for triggering cross default increased to US$50 million or its equivalent in other currencies. As of December 31, 2016,2018, the outstanding amount of the Yankee bonds was ThCh$477,865,946 (ThCh$503,647,100 as of December 31, 2015). 497,233,719.
The Enel Generación Chile bonds issued in Chile state that cross default can be triggered only by the default of the issuer when the amount in default exceeds US$50 million or its equivalent in other currencies. Debt acceleration requires the agreement of at least 50% of the bondholders of a certain series. As of December 31, 2016,2018, the outstanding amount of the local bonds was ThCh$324,440,215 (ThCh$320,518,414329,260,529.
The bank loan that Enel Green Power Chile took out in February 2017 for US$30 million states that the cross default is triggered by default of the debtor itself, i.e. Enel Green Power Chile, or any material subsidiary, as defined contractually . For the acceleration of the debt of this debt due to the cross default arising from another debt, the amount in default, either on an individualor aggregate debt level , must exceed US$50 million, or its equivalent in other currency. As of December 31, 2015).2018, the outstanding amount for this loan was ThUS20,859,907.
2. Financial covenants | 2.
| Financial covenants
|
Financial covenants are contractual commitments with respect to minimum or maximum financial ratios that a company is obliged to meet at certain periods of time (quarterly, annually, etc.), and in certain cases upon compliance with certain conditions. Most of the financial covenants of the Group limit the level of indebtedness and evaluate the ability to generate cash flows in order to service the companies’ debts. Various companies are also required to certify these covenants periodically. The types of covenants and their respective limits vary based on debt and contract type.
The Enel Generación Chile bonds issued in Chile include the following financial covenants whose definitions and calculation formulas are established in the respective indentures:
Series H
·Consolidated Debt Ratio: The consolidated debt ratio, which is Financial Debt to Capitalization, must be no more than 0.64. Financial debt is the sum of Interest-bearing loans, current; Interest-bearing loans, non-current; Other financial liabilities, current; Other financial liabilities, non-current; and Other obligations guaranteed by the issuer or its subsidiaries; while Capitalization is the sum of Financial liabilities and Total Equity. As of December 31, 2016,2018, the ratio was 0.32.0.30.
·Consolidated Equity: A minimum Equity of Ch$761,661 million must be maintained; this limit is adjusted at the end of each year as established in the indenture. Equity corresponds to Equity attributable to the shareholders of Enel Generación Chile. As of December 31, 2015,2018, the equity of Enel Generación Chile was Ch$1,700,9621,970,521 million.
·Financial Expense Coverage: A financial expense coverage ratio of at least 1.85 must be maintained. Financial expense coverage is the quotient between i) the gross margin plus financial income and dividends received from investments in associates, and ii) financial expenses; both items refer to the period of four consecutive quarters ending on the quarter being reported. For the year ended December 31, 2016,2018, this ratio was 10.92.12.23.
·Net Asset Position with Related Companies: A net asset position with related companies of no more than US$100 million must be maintained. The Net asset position with related companies is the difference between i) the sum of current accounts receivable from related parties, non-current accounts receivable from related parties, less transactions in the ordinary course of business at less than 180 days term, short-term transactions of
F-125
Table of Contents
associates of Enel Generación Chile in which Enel Américas has no participation, and long-term transactions of associates of Enel Generación Chile in which Enel Américas has no participation; and ii) the sum of current accounts payable to related parties; non-current accounts payable to related parties, less transactions in the ordinary course of business at less than 180 days term; short-term transactions of associates of Enel Generación Chile in which Enel Américas has no participation; and long-term transactions of associates of Enel Generación Chile in which Enel Américas has no participation. As of December 31, 2016,2018, using the exchange rate prevailing on that date, the Net asset position with related companies was a negative US$117.29125 million, indicating that Enel Américas is a net debtorcreditor of Enel Generación Chile rather than a net creditor.debtor.
Series M
·Consolidated Debt Ratio: The consolidated debt ratio, which is Financial debt to Capitalization, must be no more than 0.64. Financial debt is the sum of Interest-bearing loans, current; Interest-bearing loans, non-current; Other financial liabilities, current; and Other financial liabilities, non-current; while Capitalization is the sum of Financial liabilities, Equity attributable to the shareholders of the Company and Non-controlling interests. As of December 31, 2016,2018, the debt ratio was 0.32.0.30.
·Consolidated Equity: Same as for Series H.
·Financial Expense Coverage Ratio: Same as for Series H.H
·Enel Generación Chile’s domestic (governed by Chilean law, maturity in April 2019) and international (governed by New York State law, maturity in July 2019 and February 2020) credit lines include the following covenants whose definitions and formulas, identical to each other, are established in the respective contracts:
·Debt Equity Ratio: The debt equity ratio, which is Financial debt to Net Equity, must be no more than 1.4. Financial debt is the sum of Interest-bearing loans, current; Interest-bearing loans, non-current; while Net Equity is the sum of the Equity attributable to the shareholders of Enel Generación Chile, and Non-controlling interests. As of December 31, 2016,2018, the ratio was 0.47.0.42.
·Debt Repayment Capacity (Debt/EBITDA Ratio): The ratio between Financial Debt and EBITDA must be no more than 6.5. Financial Debt is the sum of interest-bearing loans, current; and interest-bearing loans, non-current; while EBITDA is the operating income excluding depreciation and amortization expense and impairment losses / (reversal of impairment losses) for the four mobile quarters ended on the calculation date. As of December 31, 2016,2018, the Debt/EBITDA ratio was 1.38.1.44.
Yankee Bondsbonds are not subject to financial covenants.
As of December 31, 2016,2018, the most restrictive financial covenant for Enel Generación Chile was the Debt Equity Ratio requirement for threetwo credit lines.
The other Group companies not mentioned in this Note, are not subject to compliance with financial covenants.
Lastly, in most of the contracts, debt acceleration for non-compliance with these covenants does not occur automatically, but is subject to certain conditions, such as a cure period.
As of December 31, 20162018 and 2015,2017, neither the Company nor any company of the Group was in default under their financial obligations summarized herein or other financial obligations whose defaults might trigger the acceleration of their financial commitments.
F-126
Table of Contents
37. PERSONNEL FIGURES33.5 Other Information
Centrales Hidroeléctricas de Aysén, S.A.
In May 2014, the Committee of Ministers revoked the Environmental Qualification Resolution (RCA) of Hidroaysén project, in which our subsidiary Enel Generación Chile participates, by accepting some of the claims filed against this project. It is of public knowledge that this decision was reported before the environmental courts of Valdivia and Santiago. On January 28, 2015, it was made public that the water rights request made by Centrales Hidroeléctricas de Aysén S.A. (hereinafter “Hidroaysén”) had been partially denied in 2008.
Enel Generación Chile has expressed its intention to thrive at Hidroaysén the defense for water rights and the environmental qualification granted to the project in the corresponding instances, continuing with the judicial actions already started or implementing new administrative or judicial actions that are necessary to this end, and it maintains the belief that hydric resources of Aysén region are important for the energy development of the country.
Nevertheless, given the current situation, there is uncertainty on the recovery of the investment made so far at Hidroaysén, since it depends both on judicial decisions and on definitions in the energy agenda which currently cannot be foreseen, therefore, the investment is not included in the portfolio of Enel Generación Chile’s immediate projects. Consequently, at the end of year 2014, Enel Generación Chile recognized an impairment loss for its participation in Hidroaysén S.A. amounting to Ch$ 69,066 million (approximately US$ 121 million).
The financial and accounting effects for the Company related to the impairment loss recognized at Enel Generación Chile for its participation in Hidroaysén project resulted in a charge of Ch$ 41,426 million (approximately US$ 73 million) against net income attributable to the shareholders of Enel Chile.
The Company’s personnel as of December 31, 2016,2018 and 2017, is distributed as follows:
Country | | December 31, 2016 | | Annual Average | |
| | December 31, 2018 | | | |
Country | | Managers and key executives | | Professionals and Technicians | | Staff and others | | Total | | Annual Average | | Managers
and key
executives | | Professionals
and
Technicians | | Staff and
others | | Total | | Annual
Average | |
| 62 | | 1,709 | | 213 | | 1,984 | | | 57 | | 1,824 | | 155 | | 2,036 | | 2,070 | |
Argentina | | - | | 24 | | 2 | | 26 | | 27 | | — | | 7 | | 19 | | 26 | | 26 | |
| | | | 3 | | | | | | | |
Total | | 62 | | 1,733 | | 215 | | 2,010 | | 2,015 | | 57 | | 1,831 | | 174 | | 2,062 | | 2,096 | |
For periods prior to the Separation, the Company did not represent a separate legal group for consolidated financial statements reporting purposes and was presented on the basis of the aggregation of the net assets of the legal entities of the Enersis group located in Chile (See Note 2.1).
35. | | December 31, 2017 | | | | Country | | Managers
and key
executives | | Professionals
and
Technicians | | Staff and
others | | Total | | Annual
Average | | Chile | | 63 | | 1,747 | | 113 | | 1,923 | | 1,968 | | Argentina | | — | | 23 | | 2 | | 25 | | 25 | | Total | | 63 | | 1,770 | | 115 | | 1,948 | | 1,993 | |
38. SANCTIONS. | SANCTIONS.
|
The following Group’s subsidiariesGroup companies have received sanctions from administrative authorities:
Subsidiaries
1. Enel Generación Chile S.A.
In 2016,
As of December 31, 2018, the illegality claims against Resolution No. 2658 of the Bío Bío Regional Health Ministry, which imposed a fine of 500 UTM (ThCh$24,177) for alleged infractions by Enel Generación Chile S.A. paidfor alleged violations to the followingasbestos removal approved by the health authority are still pending.
The request for reconsideration of the sanctioning process before the Bío Bío Regional Health Ministry, initiated by Act 180566, for an amount of 500 UTM (ThCh$24,177), for alleged infringements in compliance with obligations related to waste disposal regulations in the Cantarrana landfill is also pending.
Likewise, the Valparaíso Regional Health Ministry initiated sanction proceedings for inspection report No. 1705213, for alleged breaches of obligations and regulations related to the Noise Exposure Protocols and other health surveillance regulations at the Quintero plant. The amount of this sanction is 500 UTM (ThCh$24,177).
2. GasAtacama Chile S.A.
As of December 31, 2018, there are pending two requests for reconsideration claimed against the Tarapacá Regional Health Ministry’s resolutions, through inspection records Nos. 011599 and 766, that imposed fines on GasAtacama Chile S.A. for 500 UTM each (ThCh$24,177).
In addition, there is pending resolution before the Coquimbo Regional Health Ministry a health summary for an amount of 500 UTM (ThCh$24,177).
3. Enel Distribución Chile S.A.
As of Dember 31, 2018, the administrative reconsideration filed by Enel Distribución Chile against resolutions issued by the Superintendency of Electricity and Fuels which imposed fines for a total of 20,000 UTM (ThCh$967,060) related to various infractions as a result of the snowstorm that occurred in connectionSantiago on July 15, 2017, is still pending.
F-127
Table of Contents
Also, the resolution of a request for reconsideration filed by Enel Distribución Chile against the Superintendency of Electricity and Fuels Resolution No. 13,630 dated May 23, 2016, which imposed a fine of 2,000 UTM (ThCh$96,706) for infractions related to improper maintenance of the facilities, is still pending
By means of Exempt Resolution No. 24,870 dated July 25, 2018, the Superintendency of Electricity and Fuels imposed on Enel Distribución Chile S.A. a fine equivalent to 6,000 UTM (ThCh$290,118) for the accident that occurred on July 15, 2017 in the property located at calle Bombero Núñez No. 40 in the Commune of Recoleta, in which the underground distribution network of Enel Distribución Chile was linked. Enel Distribución filed a request for reconsideration against this resolution, which to date is pending resolution.
The judicial claim filed against Exempt Resolution No. 16,475 of the Superintendency of Electricity and Fuels, which imposed a fine of 2,000 UTM (ThCh$96,706), and which was confirmed by Exempt Resolution No. 21,129, is also pending resolution.
Finally, through Exempt Resolution No. 19154 dated June 22, 2017, the Superintendency of Electricity and Fuels imposed on Enel Distribución Chile S.A. a fine equivalent to 1,500 UTM (ThCh$72,530), for failing to comply with the terminationobligation to preserve the security and maintenance of sanction proceedings that were initiated by the Superintendence of the Environment (“SMA” for its Spanish acronym): ThCh$ 818,547 for proceeding F-13 “SMA Central Bocamina Enel Generación” and ThCh$ 303,446 for proceedings F-3 and F-15 “SMA Huasco y Diego de Almagro Enel Generación”. Enel Generación Chile also paid ThCh$ 1,387facilities, as a fine toresult of a failure that affected the Quilicura substation. An illegality claim was filed in the Court of Appeals of Santiago, which was rejected on August 2, 2018. On August 14, 2018, an appeal was filed before the Supreme Court, which is pending resolution.
4. Enel Green Power Chile Ltda.
By means of Exempt Resolution No. 23787 dated May 14, 2018, the Superintendence of Electricity and Fuels for failure to respond to an information request.
Additionally, the Health SEREMI (Regional Ministerial Office) of Bío brought two sanctioning proceedings against Enel Generación Chile S.A., both related to health protection deficiencies detected in the Bocamina power plant. The first fine for ThCh$ 23,115 is at the ordinary court complaint stage, and the second fine for ThCh$ 9,246, is at the appeal resolution stage.
2. GasAtacama Chile S.A.
In 2016, GasAtacama Chile S.A. paid the following fines in connection with the termination of sanction proceedings that were initiated by the Superintendence of the Environment (“SMA” for its acronym in Spanish): ThCh$ 30,749 for proceeding F-14 “CELTA (GAS ATACAMA) SMA” and ThCh$ 6,099 for proceeding F-17 “SMA Central San Isidro”. In addition, GasAtacama Chile S.A. paid UTM 400, equivalent of ThCh$ 18,492 of fine imposed by Superintendence of Electricity and Fuels. Also, GasAtacama Chile S.A. filed an illegality claim against the Superintendence of Electricity and Fuels (“SEC” for its acronym in
Spanish) resolution No. 15,908 “CELTA” dated November 2, 2016. This resolution imposes a fine of 1,000 UTM 120,000, equivalent(ThCh$48,353) on Enel Green Power del Sur SpA for having infringed an alleged duty of coordination during failures that occurred on May 7 and 13 and June 1, 2016 on the Los Buenos Aires-Nahuelbuta line, associated with the Los Buenos Aires wind plant, owned by Enel Green Power del Sur SpA. A request for reconsideration was filed against the aforementioned resolution based on the fact that the supposed duty of coordination did not exist.
By means of Exempt Resolution No. 4372 dated September 7, 2018, which ratified a fine of US$ 173,250 imposed by the Regional Ministry of National Property of Antofagasta (“Seremi”) against Parque Eólico Taltal SA due to ThCh$ 5,541,960.a delay in the construction of the wind farm of the same name. The claimfine is pending.based on the Heavy Use Concession Contract signed with the Seremi with respect to the land where the wind farm is located. This contract provided for a maximum construction term, which was exceeded by 14 days.
3. Enel Distribución Chile S.A.
AsIn relation to the sanctions described above, the Group has established provisions for ThCh$1,818,688 as of December 31, 2016,2018 (see Note 25). Although there are fiveother sanctions initiated bythat also have associated provisions but are not described in this note because they individually represent immaterial amounts, the Superintendencemanagement of Electricity and Fuels for a total amountthe Company considers that the provisions recorded in the consolidated financial statements are adequate to cover the risks resulting from sanctions because it does not consider there to be any additional liabilities other than those specified.
F-128
Table of ThCh$1,848,752, which are pending resolution.Contents
The Group has not received any other fines from the SVS or from any other administrative authorities.
36.
39. ENVIRONMENT. | ENVIRONMENT.
|
Environmental expenses for the years ended December 31, 2016, 20152018 and 2014,2017 are as follows:
| | | | For the years ended December 31, |
Company Incurring the Cost | | Project | | 2016 | | 2015 | | 2014 |
| | ThCh$ | | ThCh$ | | ThCh$ |
Enel Generación Chile and subsidiaries | | Studies, monitoring, laboratory analysis, removal and final disposal of solid waste at hydroelectric power stations (HPS), thermoelectric power stations and combine cycle power stations. | | 1,341,773 | | 2,679,888 | | 2,066,568 |
Enel Distribución Chile | | Santa Elena Substation noise modeling, environmental consulting on the new Lo Aguirre-Cerro Navia line project, Santa Elena Substation noise mitigation project, ISO 14001 environmental compliance at substations, SpaceCab and preliminary assembly. Hazardous waste management, pruning of trees and vegetation near high voltage, garden maintenance and weed removal at substations. | | 904,118 | | 1,132,420 | | 793,447 |
| | Total | | 2,245,891 | | 3,812,308 | | 2,860,015 |
| | | | | | | | 12-31-2018 | | 12-31-2017 |
| | | | | | Project Status
(Finished, In | | Total
Disbursements | | Amounts
Capitalized | | Expenses | | Disbursement
amount in the
future | | Estimated
future
disbursement
date | | Total
Disbursements | | Total
Disbursements |
Company Incurring the Cost | | Name | | Project | | progress) | | ThCh$ | | ThCh$ | | ThCh$ | | ThCh$ | | ThCh$ | | ThCh$ | | ThCh$ |
Pehuenche | | Hydroelectric Central Environmental Expenditures | | C.H. Pehuenche E E Pehuenche S.A. Supply of flow measurement equipment. | | In progress | | 48,574 | | 48,574 | | — | | — | | — | | 48,574 | | 6,787 |
| | | | Studies, monitoring, laboratory analysis, removal and final disposal of solid waste at hydroelectric power stations (HPS), thermoelectric power stations and combine cycle power stations. | | In progress | | 62,560 | | — | | 62,560 | | — | | | | 62,560 | | — |
Enel Distribución Chile S.A. | | Vegetation Control In Redesat | | It consists of cutting branches until the safety conditions to which the foliage must be left with respect to the drivers. | | In progress | | 134,394 | | — | | 134,394 | | 19,654 | | | | 154,048 | | 306,419 |
| | | | Pruning of trees near the medium voltage network | | In progress | | 5,790,042 | | 2,472,768 | | 3,317,274 | | 502,599 | | 31/03/2019 | | 6,292,641 | | |
| | Management Respel | | Dangerous waste management | | Finished | | 1,780 | | — | | 1,780 | | — | | 30/06/2018 | | 1,780 | | |
| | Environmental management in Ssee | | The service consists of the maintenance of green areas with replacement of species and turf in Enel substations enclosures | | Finished | | 15,383 | | — | | 15,383 | | 36,633 | | 31/12/2018 | | 52,016 | | |
| | | | The service consists in the weeding and control of weeds in electric power substations in order to keep the enclosures free of weeds, ensuring a good operation of these facilities. | | In progress | | 46,339 | | — | | 46,339 | | 568 | | 31/03/2018 | | 46,907 | | |
| | ENVIRONMENTAL PERMITS | | Environmental Impact Statement: 1) New Lampa Sectioning Substation and 2) Ochagavia - Florida Line, Sanjon La Aguada Section | | In progress | | 1,767 | | 1,767 | | — | | 5,203 | | 31/03/2019 | | 6,970 | | |
| | VEGETATION CONTROL IN MT / BT NETWORKS | | Improvement in the traditional network by calpe (pre-assembled aluminum cable) | | In progress | | 19,416 | | 19,416 | | — | | 373,059 | | 31/03/2019 | | 392,475 | | |
| | IMPROVEMENTS IN THE MT NETWORK | | Network replacement for weardown MT protected cable | | In progress | | 158,086 | | 158,086 | | — | | 18,056 | | 31/03/2019 | | 176,142 | | |
| | CHANGE OF TRAD X CALPE NETWORK | | Traditional network replacement by Calpe (Pre-assembled aluminum cable) BT | | In progress | | 851,792 | | 851,792 | | — | | 530,712 | | 31/03/2019 | | 1,382,504 | | |
| | REPLACEMENT TD DAE CONCENTRICA X TD. TRIF. RED CALPE | | Concentrical network replacement by Calpe (Pre-assembled aluminum cable) BT | | In progress | | 712,455 | | 712,455 | | — | | 295,961 | | 31/03/2019 | | 1,008,416 | | |
| | REPLACE TRIFAS TRANSFORMERS MEJ QUALITY BT | | Replacement of transformers with chargeability problems | | | | 1,288,155 | | 1,288,155 | | — | | 1,353,909 | | 31/03/2019 | | 2,642,064 | | |
| | ENVIRONMENTAL MANAGEMENT | | Environmental Management of Reforestation in Cerro Chena and Metropolitan Park. | | | | 5,831 | | — | | 5,831 | | 803 | | 31/03/2019 | | 6,634 | | |
| | Removal of Asbestos from Underground Cables | | Removal of flame retardant tape with asbestos from the underground network MT. | | In progress | | 265,577 | | 146,300 | | 119,277 | | 118,337 | | 31/03/2019 | | 383,914 | | 203,724 |
Gas Atacama Chile | | Environmental monitoring | | Environmental monitoring with SK Ecología operation and maintenance CEMS. | | In progress | | 797,543 | | — | | 797,543 | | — | | | | 797,543 | | 1,463,204 |
| | Standardization Cems | | Normalización bodegas, gestión ambiental. | | In progress | | 645,302 | | 645,302 | | — | | — | | | | 645,302 | | 1,021,630 |
| | Hydraulic power stations | | Waste management and sanitation | | In progress | | 11,567 | | — | | 11,567 | | | | | | 11,567 | | |
Enel Generación Chile S.A. | | ENVIRONMENTAL EXPENSES CC.TT. | | The main expenses incurred are: Bocamina U1-2: Operation and maintenance monitoring of air and meteorological quality stations, Environmental audit, monitoring network 1 a year, Annual CEMS Validation, Biomass Protocol Service, Environmental Materials (magazine, books), Isokinetic Measurements , SGI Works (Objective NC, inspections, audits and inspection) ISO 14001, OHSAS certification, Operation and Maintenance Service CEMS. | | In progress | | 2,102,056 | | — | | 2,102,056 | | — | | | | 2,102,056 | | 1,252,355 |
| | | | Studies, monitoring, laboratory analysis, removal and final disposal of solid waste in thermoelectric plants (C.T.) | | In progress | | 2,867,523 | | — | | 2,867,523 | | — | | | | 2,867,523 | | 251,277 |
| | ENVIRONMENTAL EXPENSES CC.HH. | | Studies, monitoring, laboratory analysis, removal and final disposal of solid waste in hydroelectric power plants (C.H.) | | In progress | | 183,156 | | — | | 183,156 | | — | | | | 183,156 | | 870,281 |
| | C.H. Ralco | | Plan Ralco: Reforestation according to Agreement with the Catholic University and Electrification of housing in Ayin Maipu | | In progress | | 4,542,216 | | 4,542,216 | | — | | — | | | | 4,542,216 | | 5,075,137 |
| | Central Quintero | | CEMS Central Quinteros | | In progress | | 417,194 | | 417,194 | | — | | — | | | | 417,194 | | 1,290,133 |
| | | | Total | | | | 20,968,708 | | 11,304,025 | | 9,664,683 | | 3,255,494 | | | | 24,224,202 | | 11,740,947 |
F-129
Table of Contents
| | | | | | 12-31-2017 |
| | | | | | Project Status
(Finished, In | | Total
Disbursements | | Amounts
Capitalized | | Expenses | | Disbursement
amount in the
future | | Estimated
future
disbursement
date | | Total
Disbursements |
Company Incurring the Cost | | Name | | Project | | progress) | | ThCh$ | | ThCh$ | | ThCh$ | | ThCh$ | | ThCh$ | | ThCh$ |
Pehuenche | | Hydroelectric Central Environmental Expenditures | | Studies, monitoring, laboratory analysis, removal and final disposal of solid waste at hydroelectric power stations (HPS), thermoelectric power stations and combine cycle power stations. | | In progress | | 6,786 | | — | | 6,786 | | — | | | | 6,787 |
Enel Distribución Chile S.A. | | Vegetation Control In Redesat | | This activity contemplates the maintenance of the band of easement of high voltage lines between 34,5 y 500kv. | | In progress | | 306,419 | | — | | 306,419 | | — | | 31/12/2017 | | 306,419 |
| | Management Respel | | Dangerous waste management | | Finished | | 265 | | — | | 265 | | — | | 30/09/2017 | | 265 |
| | Environmental management in Ssee | | Tree maintenance of SSEE and removal of brush, debris and garbage, outer perimeter. | | In progress | | 239,285 | | — | | 239,285 | | 18,644 | | | | 257,929 |
| | | | Consider all the environmental work that is done inside and outside of SSEE, as fumigation, placement and/or repair of rodent baits, irrigation system repair, waste removal, environmental inspections, garden | | Finished | | 46,771 | | — | | 46,771 | | — | | 31/12/2017 | | 46,771 |
| | Improvements in the Network M T/Bt | | Traditional network replacement by protected, concentric, other | | Finished | | 3,066,846 | | 3,066,846 | | — | | 1,957,246 | | 30/09/2017 | | 5,024,092 |
| | Environmental Permits | | Baseline for Environmental Impact Study, execution RCA and normative, preparation of reports and sectoral permits. | | In progress | | 68,001 | | 68,001 | | — | | 34,811 | | 31/03/2018 | | 102,812 |
| | Vegetation Control in Networks Mt/Bt | | Pruning of trees near the media network and low voltage. | | In progress | | 3,313,454 | | — | | 3,313,454 | | — | | 31/12/2017 | | 3,313,454 |
| | Noise Control | | Noise measurement and electromagnetic fields in substation, lines and other facilities. | | In progress | | 786 | | — | | 786 | | — | | 31/12/2017 | | 786 |
| | Asbestos Removal from Underground Cables | | Removal of fireproof tape with asbestos from the underground network MT. | | In progress | | 166,434 | | 166,434 | | — | | 37,290 | | 31/12/2017 | | 203,724 |
| | Arborizations of Substations and Sat Line | | Forest management plans, reforestations, construction and maintenance of tree-lined belts in substation. | | In progress | | 251,740 | | 251,740 | | — | | 20,390 | | 31/12/2017 | | 272,130 |
Gas Atacama Chile | | Environmental monitoring | | Environmental monitoring with SK Ecología operation and maintenance CEMS. | | In progress | | 1,463,204 | | — | | 1,463,204 | | — | | | | 1,463,204 |
| | Standardization Cems | | Normalización bodegas, gestión ambiental. | | In progress | | 1,021,630 | | 1,021,630 | | — | | — | | | | 1,021,630 |
Eolica Canela | | Environmental expenditures in power plants | | Water quality analysis and monitoring and Higenization Canela | | In progress | | 18,347 | | — | | 18,347 | | — | | | | 18,347 |
Enel Generación Chile S.A. | | Environmental costs in combined cycle plants | | The main expenses incurred are: Bocamina U1-2: Operation and maintenance, monitoring stations air quality and meteorology, Environmental audit monitoring network 1 per year. Annual Validation CEMS, Protocol Service Biomasa Environmental Materials (magazine, books) Isokinetic Measurements. Jobs SGI (Objetive NC, inspections, audits and fizcalization) ISO 14001, certification OHSAS, Operation and Maintenance Service CEMS. | | In progress | | 1,252,355 | | — | | 1,252,355 | | — | | | | 1,252,355 |
| | Environmental costs in thermal plants | | Studies, monitoring, laboratory analysis, retirement and final disposal of solid waste in thermoelectric plants (C.T.) | | In progress | | 870,281 | | — | | 870,281 | | — | | | | 870,281 |
| | Environmental costs in hydroelectric plants | | Studies, monitoring, laboratory analysis, retirement and final disposal of solid waste in hydroelectric power plants (C.H.) | | In progress | | 251,277 | | — | | 251,277 | | — | | | | 251,277 |
| | Ralco Hydroelectric Plant | | Reforestation according to the agreement with the Catholic University and Electrification of housing in Ayin Maipu. | | In progress | | 5,075,137 | | 5,075,137 | | — | | — | | | | 5,075,137 |
| | Tal Tal Thermal Plant | | Dejection Nox TalTal: Engineering Civil Works and permits | | In progress | | 1,290,133 | | 1,290,133 | | — | | — | | | | 1,290,133 |
| | El Toro Hydroelectric Plant | | Withdrawal Domestic and Industrial Waste | | In progress | | — | | — | | — | | — | | | | — |
| | | | Total | | | | 18,709,151 | | 10,939,921 | | 7,769,230 | | 2,068,381 | | | | 20,777,533 |
F-130
37.
| SUMMARIZED FINANCIAL INFORMATION OF SUBSIDIARIES
|
As of December 31, 20162018 and 2015,2017, summarized financial information of our principal subsidiaries is as follows:
| | December 31, 2016 |
| | Type of Financial Statements | | Current Assets | | Non-Current Assets | | Total Assets | | Current Liabilities | | Non-Current Liabilities | | Equity | | Total Equity and Liabilities | | Revenues | | Raw Materials and Consumables Used | | Contribution Margin | | Gross Operating Income | | Operating Income | | Financial Results | | Income before Taxes | | Income Taxes | | Profit (Loss) | | Other Comprehensive Income | | Total Comprehensive Income |
| | | ThCh$ | | ThCh$ | | ThCh$ | | ThCh$ | | ThCh$ | | ThCh$ | | ThCh$ | | ThCh$ | | ThCh$ | | ThCh$ | | ThCh$ | | ThCh$ | | ThCh$ | | ThCh$ | | ThCh$ | | ThCh$ | | ThCh$ | | ThCh$ |
Enel Distribución Chile S.A. | | Consolidated | | 245,122,732 | | 829,203,115 | | 1,074,325,847 | | 259,684,836 | | 106,283,505 | | 708,357,506 | | 1,074,325,847 | | 1,315,760,851 | | (1,042,329,385) | | 273,431,466 | | 192,134,608 | | 156,594,125 | | 8,579,317 | | 165,174,429 | | (32,589,362) | | 132,585,067 | | (21,284,665) | | 111,300,402 |
Grupo Servicios Informaticos e Inmobiliarios Ltda. | | Consolidated | | 57,558,313 | | 11,654,352 | | 69,212,665 | | 6,711,190 | | 1,466,867 | | 61,034,608 | | 69,212,665 | | 10,983,012 | | - | | 10,983,012 | | (674,755) | | (736,519) | | 2,565,301 | | 1,828,782 | | (107,413) | | 1,721,370 | | - | | 1,721,370 |
Enel Generación Chile S.A. | | Consolidated | | 543,372,956 | | 2,856,309,537 | | 3,399,682,493 | | 555,777,465 | | 1,114,144,776 | | 1,729,760,252 | | 3,399,682,493 | | 1,659,727,329 | | (895,060,114) | | 764,667,215 | | 594,772,233 | | 431,386,321 | | (35,678,633) | | 525,076,864 | | (83,216,935) | | 441,859,929 | | (86,682,199) | | 355,177,730 |
Empresa Eléctrica Pehuenche S.A. | | Separate | | 35,730,340 | | 193,496,141 | | 229,226,481 | | 43,012,321 | | 50,044,060 | | 136,170,100 | | 229,226,481 | | 155,568,982 | | (23,529,448) | | 132,039,534 | | 125,454,246 | | 116,789,055 | | 24,333 | | 116,813,388 | | (28,202,602) | | 88,610,786 | | - | | 88,610,786 |
Compañĺa Eléctrica Tarapacá S.A. | | Separate | | - | | - | | - | | - | | - | | - | | - | | 219,980,554 | | (139,960,874) | | 80,019,680 | | 62,455,761 | | 36,937,980 | | (2,519,836) | | 51,585,349 | | 10,396,319 | | 61,981,668 | | (924,812) | | 61,056,856 |
Grupo GasAtacama Chile S.A.. | | Consolidated | | 194,264,349 | | 663,665,991 | | 857,930,340 | | 86,380,336 | | 89,573,088 | | 681,976,916 | | 857,930,340 | | 173,489,754 | | (87,098,923) | | 86,390,831 | | 67,795,883 | | 45,426,269 | | 6,453,677 | | 53,666,618 | | (10,337,536) | | 43,329,082 | | (1,779,413) | | 41,549,669 |
| | | | | | | | | | | | | | | | | | | | | | | | | | | | | | | | | | | | | | |
| | December 31, 2015 |
| | Type of Financial Statements | | Current Assets | | Non-Current Assets | | Total Assets | | Current Liabilities | | Non-Current Liabilities | | Equity | | Total Equity and Liabilities | | Revenues | | Raw Materials and Consumables Used | | Contribution Margin | | Gross Operating Income | | Operating Income | | Financial Results | | Income before Taxes | | Income Taxes | | Profit (Loss) | | Other Comprehensive Income | | Total Comprehensive Income |
| | | ThCh$ | | ThCh$ | | ThCh$ | | ThCh$ | | ThCh$ | | ThCh$ | | ThCh$ | | ThCh$ | | ThCh$ | | ThCh$ | | ThCh$ | | ThCh$ | | ThCh$ | | ThCh$ | | ThCh$ | | ThCh$ | | ThCh$ | | ThCh$ |
Enel Distribución Chile S.A. | | Combined | | 282,843,284 | | 766,740,394 | | 1,049,583,678 | | 362,300,844 | | 54,831,045 | | 632,451,789 | | 1,049,583,678 | | 1,257,732,165 | | (983,732,902) | | 273,999,263 | | 185,114,893 | | 149,293,694 | | 12,294,530 | | 176,253,823 | | (36,956,051) | | 139,297,772 | | (2,241,285) | | 137,056,487 |
Grupo Servicios Informaticos e Inmobiliarios Ltda. | | Combined | | 54,816,036 | | 11,561,339 | | 66,377,375 | | 5,586,878 | | 1,305,133 | | 59,485,364 | | 66,377,375 | | 8,660,778 | | - | | 8,660,778 | | (397,888) | | (511,775) | | 2,260,216 | | 6,041,979 | | (765,180) | | 5,276,799 | | (76,578) | | 5,200,221 |
Enel Generación Chile S.A. | | Combined | | 522,858,936 | | 2,866,208,893 | | 3,389,067,829 | | 676,091,341 | | 1,207,004,759 | | 1,505,971,729 | | 3,389,067,829 | | 1,543,824,325 | | (880,891,223) | | 662,933,102 | | 516,874,733 | | 401,832,826 | | (114,252,183) | | 300,501,089 | | (76,655,819) | | 223,845,270 | | (88,863,913) | | 134,981,357 |
Empresa Eléctrica Pehuenche S.A. | | Separate | | 63,745,589 | | 201,366,300 | | 265,111,889 | | 64,820,897 | | 51,972,920 | | 148,318,072 | | 265,111,889 | | 193,189,705 | | (28,569,912) | | 164,619,793 | | 159,244,283 | | 150,615,199 | | 2,049,116 | | 152,664,315 | | (34,647,895) | | 118,016,421 | | 33,526 | | 84,154,773 |
Compañĺa Eléctrica Tarapacá S.A. | | Separate | | 82,875,363 | | 509,275,829 | | 592,151,192 | | 115,138,485 | | 44,379,433 | | 432,633,274 | | 592,151,192 | | 230,852,534 | | (139,555,849) | | 91,296,685 | | 73,665,446 | | 64,306,244 | | 24,323,943 | | 88,341,669 | | (18,079,279) | | 70,262,390 | | (624) | | 49,416,976 |
Grupo GasAtacama Chile S.A.. | | Combined | | 245,456,212 | | 207,236,190 | | 452,692,402 | | 24,048,629 | | 49,959,438 | | 378,684,335 | | 452,692,402 | | 183,015,183 | | (110,330,364) | | 72,684,819 | | 57,943,644 | | 46,360,426 | | 10,304,578 | | 56,660,371 | | (10,444,811) | | 46,215,560 | | (3,059,806) | | 34,177,657 |
| | December 31, 2018 | |
| | Type of Financial | | Current
Assets | | Non-Current
Assets | | Total Assets | | Current
Liabilities | | Non-Current
Liabilities | | Equity | | Total Equity and
Liabilities | | Revenues | | Raw Materials and
Consumables Used | | Contribution
Margin | | Gross
Operating
Income | | Operating
Income | | Financial
Results | | Income
before
Taxes | | Income
Taxes | | Profit
(Loss) | | Other
Comprehensive
Income | | Total
Comprehensive
Income | |
| | Statements | | ThCh$ | | ThCh$ | | ThCh$ | | ThCh$ | | ThCh$ | | ThCh$ | | ThCh$ | | ThCh$ | | ThCh$ | | ThCh$ | | ThCh$ | | ThCh$ | | ThCh$ | | ThCh$ | | ThCh$ | | ThCh$ | | ThCh$ | | ThCh$ | |
Grupo Enel Distribución Chile | | Consolidated | | 296,453,470 | | 982,926,699 | | 1,279,380,169 | | 450,182,594 | | 63,065,351 | | 766,132,224 | | 1,279,380,169 | | 1,263,224,070 | | (972,499,916 | ) | 290,724,154 | | 200,614,083 | | 159,259,319 | | 6,088,801 | | 165,348,120 | | (42,967,123 | ) | 122,380,997 | | (600,422 | ) | 121,780,574 | |
Enel Generación Chile | | Separate | | 548,220,314 | | 2,725,004,288 | | 3,273,224,602 | | 569,928,285 | | 938,139,971 | | 1,765,156,347 | | 3,273,224,603 | | 1,454,348,386 | | (1,051,644,602 | ) | 402,703,784 | | 300,148,133 | | 226,154,177 | | (49,980,539 | ) | 378,187,852 | | (42,255,124 | ) | 335,932,728 | | (101,720,204 | ) | 234,212,523 | |
Enel Distribución Chile | | Separate | | 288,632,068 | | 975,441,251 | | 1,264,073,319 | | 424,550,547 | | 62,721,352 | | 776,801,421 | | 1,264,073,320 | | 1,259,689,827 | | (971,366,398 | ) | 288,323,429 | | 199,676,810 | | 159,625,438 | | 5,418,883 | | 165,044,321 | | (43,812,619 | ) | 121,231,702 | | (598,985 | ) | 120,632,717 | |
Empresa Eléctrica Pehuenche S.A. | | Separate | | 51,279,432 | | 179,693,183 | | 230,972,615 | | 44,459,384 | | 46,238,191 | | 140,275,039 | | 230,972,614 | | 162,768,188 | | (21,539,174 | ) | 141,229,014 | | 135,558,558 | | 128,068,159 | | 224,543 | | 128,348,399 | | (34,669,191 | ) | 93,679,208 | | — | | 93,679,208 | |
Enel Green Power Chile Ltda. | | Separate | | 162,710,963 | | 669,741,595 | | 832,452,558 | | 113,123,832 | | 125,240,941 | | 594,087,786 | | 832,452,559 | | 12,831,131 | | (15,655 | ) | 12,815,476 | | 2,521,606 | | 1,702,927 | | (5,337,680 | ) | 71,323,446 | | 1,601,922 | | 72,925,368 | | 71,701,018 | | 144,626,386 | |
Empresa Electrica Panguipulli S.A. | | Separate | | 16,052,462 | | 255,481,676 | | 271,534,138 | | 59,681,465 | | 131,671,924 | | 80,180,749 | | 271,534,138 | | 45,097,744 | | (5,320,421 | ) | 39,777,323 | | 32,476,777 | | 18,680,884 | | (1,954,238 | ) | 16,726,646 | | (2,647,884 | ) | 14,078,762 | | (3,643,974 | ) | 10,434,788 | |
Geotermica del Norte S.A. | | Separate | | 21,765,295 | | 347,871,452 | | 369,636,747 | | 20,910,840 | | 293,675 | | 348,432,232 | | 369,636,747 | | 17,023,794 | | (2,109,769 | ) | 14,914,025 | | 13,168,978 | | 2,001,882 | | (3,676,151 | ) | (1,674,269 | ) | 454,355 | | (1,219,914 | ) | 45,243,420 | | 44,023,506 | |
Parque Eolico Talinay Oriente S.A. | | Separate | | 63,831,605 | | 87,493,829 | | 151,325,434 | | 6,173,259 | | 18,876,242 | | 126,275,934 | | 151,325,435 | | 10,058,036 | | (2,434,415 | ) | 7,623,621 | | 5,310,400 | | 1,014,857 | | 1,312,902 | | 2,327,759 | | (613,097 | ) | 1,714,661 | | 16,552,523 | | 18,267,184 | |
Enel Green Power del Sur | | Separate | | 129,849,852 | | 655,431,547 | | 785,281,399 | | 44,078,091 | | 467,399,245 | | 273,804,063 | | 785,281,399 | | 94,473,391 | | (21,024,045 | ) | 73,449,346 | | 60,053,812 | | 37,537,228 | | (24,991,814 | ) | 12,545,413 | | (3,455,173 | ) | 9,090,240 | | 34,497,623 | | 43,587,863 | |
Grupo Enel Green Power | | Consolidated | | 344,469,181 | | 1,628,444,820 | | 1,972,914,001 | | 334,639,971 | | 768,719,376 | | 869,554,654 | | 1,972,914,001 | | 183,008,879 | | (22,330,367 | ) | 160,678,512 | | 131,378,740 | | 69,236,957 | | (38,674,306 | ) | 30,471,438 | | (8,837,176 | ) | 21,634,262 | | 173,923,954 | | 195,558,216 | |
Grupo Enel Generación Chile | | Consolidated | | 672,467,353 | | 2,996,760,726 | | 3,669,228,079 | | 593,881,208 | | 1,077,855,824 | | 1,997,491,047 | | 3,669,228,079 | | 1,529,364,081 | | (818,284,050 | ) | 711,080,031 | | 582,249,559 | | 464,383,396 | | (47,947,351 | ) | 423,152,001 | | (104,946,765 | ) | 318,205,236 | | (106,994,091 | ) | 211,211,145 | |
Grupo GasAtacama Chile S.A. | | Consolidated | | 154,726,337 | | 601,914,918 | | 756,641,255 | | 61,155,091 | | 94,466,222 | | 601,019,942 | | 756,641,255 | | 271,433,789 | | (94,746,408 | ) | 176,687,381 | | 146,123,452 | | 109,465,013 | | 1,808,644 | | 115,039,230 | | (27,946,019 | ) | 87,093,211 | | (5,273,886 | ) | 81,819,325 | |
| | December 31, 2017 | |
| | Type of Financial | | Current
Assets | | Non-Current
Assets | | Total Assets | | Current
Liabilities | | Non-Current
Liabilities | | Equity | | Total Equity and
Liabilities | | Revenues | | Raw Materials and
Consumables Used | | Contribution
Margin | | Gross
Operating
Income | | Operating
Income | | Financial
Results | | Income
before
Taxes | | Income
Taxes | | Profit
(Loss) | | Other
Comprehensive
Income | | Total
Comprehensive
Income | |
| | Statements | | ThCh$ | | ThCh$ | | ThCh$ | | ThCh$ | | ThCh$ | | ThCh$ | | ThCh$ | | ThCh$ | | ThCh$ | | ThCh$ | | ThCh$ | | ThCh$ | | ThCh$ | | ThCh$ | | ThCh$ | | ThCh$ | | ThCh$ | | ThCh$ | |
Grupo Enel Distribución Chile S.A. | | Consolidated | | 261,378,069 | | 893,633,580 | | 1,155,011,649 | | 408,687,866 | | 61,965,918 | | 684,357,865 | | 1,155,011,649 | | 1,333,027,456 | | (1,062,076,645 | ) | 270,950,811 | | 177,188,798 | | 132,510,164 | | 6,411,839 | | 139,079,732 | | (34,030,322 | ) | 105,049,408 | | 1,515,176 | | 106,564,584 | |
Enel Generación Chile S.A. | | Separate | | 590,543,532 | | 2,602,962,586 | | 3,193,506,118 | | 489,875,667 | | 891,083,155 | | 1,812,547,296 | | 3,193,506,118 | | 1,629,277,585 | | (1,140,707,431 | ) | 488,570,154 | | 364,131,027 | | 285,498,271 | | (37,647,691 | ) | 528,254,308 | | (60,153,339 | ) | 468,100,969 | | 72,617,351 | | 540,718,320 | |
Enel Distribucion Chile S.A. | | Separate | | 257,229,219 | | 887,681,380 | | 1,144,910,599 | | 393,273,852 | | 61,523,557 | | 690,113,190 | | 1,144,910,599 | | 1,330,023,450 | | (1,060,875,186 | ) | 269,148,264 | | 176,635,873 | | 133,340,940 | | 5,252,070 | | 138,806,087 | | (35,037,127 | ) | 103,768,960 | | 1,543,151 | | 105,312,110 | |
Empresa Eléctrica Pehuenche S.A. | | Separate | | 35,369,243 | | 186,760,346 | | 222,129,589 | | 38,310,560 | | 48,261,590 | | 135,557,439 | | 222,129,589 | | 152,501,383 | | (36,289,330 | ) | 116,212,053 | | 110,957,039 | | 103,556,904 | | (395,231 | ) | 103,206,672 | | (26,346,081 | ) | 76,860,591 | | — | | 76,860,591 | |
Grupo Enel Generación Chile S.A. | | Consolidated | | 662,804,359 | | 2,891,657,830 | | 3,554,462,189 | | 543,356,500 | | 1,022,091,737 | | 1,989,013,952 | | 3,554,462,189 | | 1,634,937,088 | | (903,978,007 | ) | 730,959,081 | | 581,142,074 | | 463,860,015 | | (36,610,248 | ) | 537,641,733 | | (112,099,519 | ) | 425,542,214 | | 67,663,516 | | 493,205,730 | |
Grupo GasAtacama Chile S.A. | | Consolidated | | 182,143,224 | | 611,319,090 | | 793,462,314 | | 75,370,131 | | 83,894,880 | | 634,197,303 | | 793,462,314 | | 307,272,380 | | (170,752,796 | ) | 136,519,584 | | 106,213,750 | | 70,509,184 | | 1,432,674 | | 80,142,531 | | (25,417,139 | ) | 54,725,392 | | (3,338,115 | ) | 51,387,277 | |
F-131
SaleTable of Electrogas:Contents
41. SUBSEQUENT EVENTS.
Enel Generación Chile
On February 7, 2017,April 24, 2019, Enel Generación Chile completedS.A. (“Enel Generación”) announced in a significant event filing that in connection with the contracts for the purchase and sale of its investment in Electrogas S.A, representingpower and electricity informed through a 42.5%significant event issued on May 5, 2016, Anglo American Sur S.A. (“AngloAmerican”) and Enel Generación have signed an Agreement called “Payment of Compensation for Exit Clause, Settlement and Transaction for Contracts for the Purchase and Sale of Power and Electricity for Los Bronces, El Soldado and Chagres” (the “Agreement”), by virtue of which it has been agreed to anticipate the date of termination of the issued capitalcontracts as of February 20, 2020 and the payment of the respective exit compensation that company,corresponds to Aerio Chile (see Note 5).
InEnel Generación, in accordance with both the terms and conditionsprovisions of the share purchase agreement,contracts and the sale price was US$ 180 million which was paid onaforementioned Agreement.
As of this date, it is not possible to reasonably quantify the same date. The financial effect of the operation forearly termination date in the results of Enel Generación Chile, adjusted byn. The financial effects will depend on factors that affect the prevailing exchange rate at thisbehavior of the electricity market, such as, among others, the price of fuels; the hydrological conditions; growth of demand and international inflation rates, which to date was a gain on sale of approximately US$ 121 million (ThCh$81,005,870).are not possible to determine.
There have been no other significantsubsequent events between January 1, 20172019 and the issuance date of these consolidated financial statements were approved for issuance by the directors of the Company.statements.
F-132
APPENDIX 1 ENEL CHILE GROUP SUBSIDIARIES:
This appendix is partTable of Note 2.4, “Subsidiaries”.
It discloses the Group’s percentage of control in each company.
| | | | | | Percentage of control at 12/31/2016 | | Percentage of control at 12/31/2015 | | | | | | |
Taxpayer ID No. (RUT) | | Company | | Currency | | Direct | | Indirect | | Total | | Direct | | Indirect | | Total | | Type of Relationship | | Country | | Activity |
76.003.204-2 | | Central Eólica Canela S.A. | | Chilean peso | | - | | 75.00% | | 75.00% | | - | | 75.00% | | 75.00% | | Subsidiary | | Chile | | Promotion and development of renewable energy projects |
96.800.570-7 | | Enel Distribución Chile S.A. (formerly named Chilectra S.A.) | | Chilean peso | | 99.08% | | 0.01% | | 99.09% | | 99.08% | | 0.01% | | 99.09% | | Subsidiary | | Chile | | Ownership interest in companies of any nature |
96.770.940-9 | | Compañía Eléctrica Tarapacá S.A. (4) | | Chilean peso | | - | | - | | - | | 3.78% | | 96.21% | | 99.99% | | Subsidiary | | Chile | | Complete electric energy cycle |
96.783.910-8 | | Empresa Eléctrica de Colina Ltda. | | Chilean peso | | - | | 100.00% | | 100.00% | | - | | 100.00% | | 100.00% | | Subsidiary | | Chile | | Complete energy cycle and related supplies |
96.504.980-0 | | Empresa Eléctrica Pehuenche S.A. | | Chilean peso | | - | | 92.65% | | 92.65% | | - | | 92.65% | | 92.65% | | Subsidiary | | Chile | | Complete electric energy cycle |
91.081.000-6 | | Enel Generación Chile S.A. (formerly named Endesa Chile S.A.) | | Chilean peso | | 59.98% | | - | | 59.98% | | 59.98% | | - | | 59.98% | | Subsidiary | | Chile | | Complete electric energy cycle |
76.014.570-K | | Inversiones GasAtacama Holding Ltda. (1)(3)(4) | | Chilean peso | | - | | - | | - | | - | | 100.00% | | 100.00% | | Subsidiary | | Chile | | Natural gas transportation |
96.830.980-3 | | GasAtacama S.A. (3)(4) | | Chilean peso | | - | | - | | - | | - | | 100.00% | | 100.00% | | Subsidiary | | Chile | | Exploitation, generation, transmission and distribution of electric energy and natural gas |
78.932.860-9 | | GasAtacama Chile S.A. (3)(4) | | Chilean peso | | 2.63% | | 97.37% | | 100.00% | | - | | 100.00% | | 100.00% | | Subsidiary | | Chile | | Company management |
77.032.280-4 | | Gasoducto TalTal S.A. (3)(4) | | Chilean peso | | - | | - | | - | | - | | 100.00% | | 100.00% | | Subsidiary | | Chile | | Natural gas transportation, sale and distribution |
78.952.420-3 | | Gasoducto Atacama Argentina S.A. (3) | | Chilean peso | | - | | 100.00% | | 100.00% | | - | | 100.00% | | 100.00% | | Subsidiary | | Chile | | Natural gas exploitation and transportation |
76.676.750-8 | | GNL Norte S.A. (4) | | Chilean peso | | - | | - | | - | | - | | 100.00% | | 100.00% | | Subsidiary | | Chile | | Energy and fuel production, transportation and distribution |
76.107.186-6 | | Servicios Informáticos e Inmobiliarios Ltda. (2) | | Chilean peso | | 99.00% | | 1.00% | | 100.00% | | 99.00% | | 1.00% | | 100.00% | | Subsidiary | | Chile | | Information Technology services |
96.800.460-3 | | Luz Andes Ltda. | | Chilean peso | | - | | 100.00% | | 100.00% | | - | | 100.00% | | 100.00% | | Subsidiary | | Chile | | Energy and fuel transportation, distribution and sales |
96.905.700-K | | Progas S.A. (4) | | Chilean peso | | - | | - | | - | | - | | 100.00% | | 100.00% | | Subsidiary | | Chile | | Purchase, production, transportation and commercial distribution of natural gas |
77.047.280-6 | | Sociedad Agrícola de Cameros Ltda. | | Chilean peso | | - | | 57.50% | | 57.50% | | - | | 57.50% | | 57.50% | | Subsidiary | | Chile | | Financial investments |
| (1)
| On April 22, 2014, Enel Generación Chile acquired the remaining 50% equity interest in Inversiones GasAtacama Holding Limitada.
|
| (2)
| On December 31, 2014, Inmobiliaria Manso de Velasco was merged with ICT, the latter being the surviving company under the corporate name of Servicios Informáticos e Inmobiliarios Ltda.
|
| (3)
| On January 1, 2015, there was a change in functional currency for these entities from the US dollar to the Chilean peso.
|
| (4)
| On September 1, 2016, Gasoducto TalTal S.A. and Progas S.A. were merged in and with GasAtacama Chile S.A., being the latter the surviving company.
|
| | On September 12, 2016, GNL Norte S.A. was merged in and with GasAtacama Chile S.A., being the latter the surviving company.
|
| | On October 1, 2016, Inversiones GasAtacama Holding Ltda. and GasAtacama S.A were merged in and with Compañía Eléctrica Tarapacá S.A., being the latter the surviving company. Subsequently, on November 1, 2016, Compañía Eléctrica Tarapacá was merged in and with GasAtacama Chile S.A., being the latter the surviving company.
|
Contents
APPENDIX 2 CHANGES IN THE SCOPE OF CONSOLIDATION:
This appendix is part of Note 2.4.1 “Changes in the scope of consolidation”.
As of December 31, 2016 and 2015, there were no incorporations of entities into the scope of consolidation:
Companies eliminated from the scope of consolidation:
| | December 31, 2016 | | December 31, 2015 |
Company | | Ownership Interest | | Ownership Interest |
| Direct | | Indirect | | Total | | Consolidation Method | | Direct | | Indirect | | Total | | Consolidation Method |
Gasoducto TalTal S.A. | | - | | 100.00 % | | 100.00 % | | Full integration | | - | | - | | - | | - |
GNL Norte S.A. | | - | | 100.00 % | | 100.00 % | | Full integration | | - | | - | | - | | - |
Progas S.A. | | - | | 100.00 % | | 100.00 % | | Full integration | | - | | - | | - | | - |
GNL Quintero S.A. | | - | | 20.00% | | 20.00% | | Equity method | | - | | - | | - | | - |
Compañía Eléctrica Tarapacá S.A. | | 3.78% | | 96.21% | | 99.99% | | Full integration | | - | | - | | - | | - |
Inversiones GasAtacama Holding Ltda. | | - | | 100.00 % | | 100.00 % | | Full integration | | - | | - | | - | | - |
GasAtacama S.A. | | - | | 100.00 % | | 100.00 % | | Full integration | | - | | - | | - | | - |
APPENDIX 3 ASSOCIATES AND JOINT VENTURES:
This appendix is part of Note 3.i, “Investments accounted for using the equity method”.
Taxpayer ID No. (RUT) | | Company | | Currency | | Ownership Interest at 12/31/2016 | | Ownership Interest at 12/31/2015 | | Type of Relationship | | Country | | Activity |
| | | Direct | | Indirect | | Total | | Direct | | Indirect | | Total | | | |
96.806.130-5 | | Electrogas S.A. | | U.S. dollar | | - | | 42.50% | | 42.50% | | - | | 42.50% | | 42.50% | | Associate | | Chile | | Portfolio company |
76.418.940-K | | GNL Chile S.A. | | U.S. dollar | | - | | 33.33% | | 33.33% | | - | | 33.33% | | 33.33% | | Associate | | Chile | | Promotion of liquefied natural gas supply project |
76.788.080-4 | | GNL Quintero S.A. (1) | | U.S. dollar | | - | | 0.00% | | 0.00% | | - | | 20.00% | | 20.00% | | Associate | | Chile | | Development, design and supply of liquid natural gas regasifying terminal |
76.652.400-1 | | Centrales Hidroeléctricas De Aysén S.A. | | Chilean peso | | - | | 51.00% | | 51.00% | | - | | 51.00% | | 51.00% | | Joint venture | | Chile | | Development and operation of a hydroelectric plant |
76.041.891-9 | | Aysén Transmisión S.A. | | Chilean peso | | - | | 51.00% | | 51.00% | | - | | 51.00% | | 51.00% | | Joint venture | | Chile | | Development and operation of a hydroelectric plant |
76.091.595-5 | | Aysén Energía S.A. | | Chilean peso | | - | | 51.00% | | 51.00% | | - | | 51.00% | | 51.00% | | Joint venture | | Chile | | Development and operation of a hydroelectric plant |
77.017.930-0 | | Transmisora Eléctrica de Quillota Ltda. | | Chilean peso | | - | | 50.00% | | 50.00% | | - | | 50.00% | | 50.00% | | Joint venture | | Chile | | Electric energy transportation and distribution |
| (1)
| On September 14, 2016, GNL Quintero S.A. was sold to Enagás S.A. (See Note 12.b).
|
APPENDIX 4 ADDITIONAL INFORMATION ON FINANCIAL DEBT:
This appendix is part of Note 18, “Other financial liabilities.” The following tables present the contractual undiscounted cash flows by type of financial debt:
1. Summary of bank borrowings by currency and maturity
| | | | | | Current | | Non-current | | Current | | Non-current |
| | | | | | Maturity | | | | Maturity | | | | Maturity | | | | Maturity | | |
Country | | Currency | | Nominal Interest Rate | | One to three months | | Three to twelve months | | Total Current at 12/31/2016 | | One to two years | | Two to three years | | Three to four years | | Four to five years | | More than five years | | Total Non-Current at 12/31/2016 | | One to three months | | Three to twelve months | | Total Current at 12/31/2015 | | One to two years | | Two to three years | | Three to four years | | Four to five years | | More than five years | | Total Non-Current at 12/31/2015 |
| | | | | | ThCh$ | | ThCh$ | | ThCh$ | | ThCh$ | | ThCh$ | | ThCh$ | | ThCh$ | | ThCh$ | | ThCh$ | | ThCh$ | | ThCh$ | | ThCh$ | | ThCh$ | | ThCh$ | | ThCh$ | | ThCh$ | | ThCh$ | | ThCh$ |
Chile | | Ch$ | | 6.00% | | 4,283 | | - | | 4,283 | | - | | - | | - | | - | | - | | - | | 4 | | - | | 4 | | - | | - | | - | | - | | - | | - |
| | | | Total | | 4,283 | | - | | 4,283 | | - | | - | | - | | - | | - | | - | | 4 | | - | | 4 | | - | | - | | - | | - | | - | | - |
2. Identification of bank borrowings by company
| | | | | | | | | | | | | | December 31, 2016 |
| | | | | | | | | | | | | | Current | | Non-current |
Taxpayer ID No. (RUT) | | Company | | Country | | Financial Institution | | Currency | | Effective Interest Rate | | Nominal Interest Rate | | Less than 90 days | | More than 90 days | | Total Current | | One to two years | | Two to three years | | Three to four years | | Four to five years | | More than five years | | Total Non-Current |
| | | | | | | | | | | | | | ThCh$ | | ThCh$ | | ThCh$ | | ThCh$ | | ThCh$ | | ThCh$ | | ThCh$ | | ThCh$ | | ThCh$ |
96.800.570-7 | | Enel Distribución Chile S.A. | | Chile | | Banco de Crédito e Inversiones | | Ch$ | | 6.00 % | | 6.00 % | | 102 | | - | | 102 | | - | | - | | - | | - | | - | | - |
91.081.000-6 | | Enel Generación Chile S.A. | | Chile | | Banco de Crédito e Inversiones | | Ch$ | | 6.00 % | | 6.00 % | | 2,048 | | - | | 2,048 | | - | | - | | - | | - | | - | | - |
91.081.000-6 | | Enel Generación Chile S.A. | | Chile | | Banco Santander | | Ch$ | | 6.00 % | | 6.00 % | | 2,133 | | - | | 2,133 | | - | | - | | - | | - | | - | | - |
| | | | | | Total | | 4,283 | | - | | 4,283 | | - | | - | | - | | - | | - | | - |
| | | | | | | | | | | | | | | | | | | | | | | | | | | | | | |
| | | | | | | | | | | | | | | | | | | | | | | | | | | | | | |
| | | | | | | | | | | | | | December 31, 2015 |
| | | | | | | | | | | | | | Current | | Non-current |
Taxpayer ID No. (RUT) | | Company | | Country | | Financial Institution | | Currency | | Effective Interest Rate | | Nominal Interest Rate | | Less than 90 days | | More than 90 days | | Total Current | | One to two years | | Two to three years | | Three to four years | | Four to five years | | More than five years | | Total Non-Current |
| | | | | | | | | | | | | | ThCh$ | | ThCh$ | | ThCh$ | | ThCh$ | | ThCh$ | | ThCh$ | | ThCh$ | | ThCh$ | | ThCh$ |
91.081.000-6 | | Enel Generación Chile S.A. | | Chile | | Banco Santander | | Ch$ | | 6.00 % | | 6.00 % | | 4 | | - | | 4 | | - | | - | | - | | - | | - | | - |
| | | | | | Total | | 4 | | - | | 4 | | - | | - | | - | | - | | - | | - |
| b)
| Secured and unsecured liabilities
|
1. Summary of secured and unsecured liabilities by currency and maturity
| | | | | | Current | | Non-current | | Current | | Non-current |
| | | | | | Maturity | | | | Maturity | | | | Maturity | | | | Maturity | | |
Country | | Currency | | Nominal Interest Rate | | One to three months | | Three to twelve months | | Total Current at 12/31/2016 | | One to two years | | Two to three years | | Three to four years | | Four to five years | | More than five years | | Total Non-Current at 12/31/2016 | | One to three months | | Three to twelve months | | Total Current at 12/31/2015 | | One to two years | | Two to three years | | Three to four years | | Four to five years | | More than five years | | Total Non-Current at 12/31/2015 |
| | | | | | ThCh$ | | ThCh$ | | ThCh$ | | ThCh$ | | ThCh$ | | ThCh$ | | ThCh$ | | ThCh$ | | ThCh$ | | ThCh$ | | ThCh$ | | ThCh$ | | ThCh$ | | ThCh$ | | ThCh$ | | ThCh$ | | ThCh$ | | ThCh$ |
Chile | | US$ | | 6.90% | | 7,264,786 | | 21,794,359 | | 29,059,145 | | 29,059,146 | | 29,059,146 | | 29,059,146 | | 29,059,146 | | 641,348,382 | | 757,584,966 | | 7,318,857 | | 21,956,571 | | 29,275,428 | | 29,275,427 | | 29,275,427 | | 29,275,427 | | 29,275,427 | | 827,386,294 | | 944,488,002 |
Chile | | U.F. | | 5.48% | | 6,466,160 | | 24,665,200 | | 31,131,360 | | 30,632,431 | | 53,611,843 | | 51,316,337 | | 49,020,830 | | 305,390,728 | | 489,972,169 | | 7,420,915 | | 27,355,985 | | 34,776,900 | | 34,213,890 | | 33,650,880 | | 55,868,495 | | 53,284,158 | | 359,246,902 | | 536,264,325 |
| | | | Total | | 13,730,946 | | 46,459,559 | | 60,190,505 | | 59,691,577 | | 82,670,989 | | 80,375,483 | | 78,079,976 | | 946,739,110 | | 1,247,557,135 | | 14,739,772 | | 49,312,556 | | 64,052,328 | | 63,489,317 | | 62,926,307 | | 85,143,922 | | 82,559,585 | | 1,186,633,196 | | 1,480,752,327 |
2. Secured and unsecured liabilities by company
| | | | | | | | December 31, 2016 |
| | | | | | | | Current | Non-Current |
Taxpayer ID No. (RUT) | Company | Country | Financial Institution | Country | Currency | Effective Interest Rate | Nominal Interest Rate | Less than 90 days | More than 90 days | Total Current | One to two years | Two to three years | Three to four years | Four to five years | More than five years | Total Non-Current |
| | | | | | | | ThCh$ | ThCh$ | ThCh$ | ThCh$ | ThCh$ | ThCh$ | ThCh$ | ThCh$ | ThCh$ |
91.081.000-6 | Enel Generación Chile S.A. | Chile | BNY Mellon - Primera Emisión S-1 | U.S.A. | US$ | 7.96 % | 7.88 % | 2,832,647 | 8,497,942 | 11,330,589 | 11,330,590 | 11,330,590 | 11,330,590 | 11,330,590 | 196,227,387 | 241,549,747 |
91.081.000-6 | Enel Generación Chile S.A. | Chile | BNY Mellon - Primera Emisión S-2 | U.S.A. | US$ | 7.40 % | 7.33 % | 903,234 | 2,709,703 | 3,612,937 | 3,612,937 | 3,612,937 | 3,612,937 | 3,612,937 | 93,701,216 | 108,152,964 |
91.081.000-6 | Enel Generación Chile S.A. | Chile | BNY Mellon - Primera Emisión S-3 | U.S.A. | US$ | 8.26 % | 8.13 % | 574,765 | 1,724,294 | 2,299,059 | 2,299,059 | 2,299,059 | 2,299,059 | 2,299,059 | 56,341,806 | 65,538,042 |
91.081.000-6 | Enel Generación Chile S.A. | Chile | BNY Mellon - Unica 24296 | U.S.A. | US$ | 4.32 % | 4.25 % | 2,954,140 | 8,862,420 | 11,816,560 | 11,816,560 | 11,816,560 | 11,816,560 | 11,816,560 | 295,077,973 | 342,344,213 |
91.081.000-6 | Enel Generación Chile S.A. | Chile | Banco Santander -317 Serie-H | Chile | U.F. | 7.17 % | 6.20 % | 1,525,571 | 9,843,433 | 11,369,004 | 10,870,075 | 10,371,146 | 9,872,218 | 9,373,289 | 52,887,199 | 93,373,927 |
91.081.000-6 | Enel Generación Chile S.A. | Chile | Banco Santander 522 Serie-M | Chile | U.F. | 4.82 % | 4.75 % | 4,940,589 | 14,821,767 | 19,762,356 | 19,762,356 | 43,240,697 | 41,444,119 | 39,647,541 | 252,503,529 | 396,598,242 |
| | | | | | | Total | 13,730,946 | 46,459,559 | 60,190,505 | 59,691,577 | 82,670,989 | 80,375,483 | 78,079,976 | 946,739,110 | 1,247,557,135 |
| | | | | | | | | | | | | | | | |
| | | | | | | | | | | | | | | | |
| | | | | | | | December 31, 2015 |
| | | | | | | | Current | Non-Current |
Taxpayer ID No. (RUT) | Company | Country | Financial Institution | Country | Currency | Effective Interest Rate | Nominal Interest Rate | Less than 90 days | More than 90 days | Total Current | One to two years | Two to three years | Three to four years | Four to five years | More than five years | Total Non-Current |
| | | | | | | | ThCh$ | ThCh$ | ThCh$ | ThCh$ | ThCh$ | ThCh$ | ThCh$ | ThCh$ | ThCh$ |
91.081.000-6 | Enel Generación Chile S.A. | Chile | BNY Mellon - Primera Emisión S-1 | U.S.A. | US$ | 7.96 % | 7.88 % | 2,879,332 | 8,637,995 | 11,517,327 | 11,517,326 | 11,517,326 | 11,517,326 | 11,517,326 | 217,149,037 | 263,218,341 |
91.081.000-6 | Enel Generación Chile S.A. | Chile | BNY Mellon - Primera EmisiónS-2 | U.S.A. | US$ | 7.40 % | 7.33 % | 919,193 | 2,757,578 | 3,676,771 | 3,676,770 | 3,676,770 | 3,676,770 | 3,676,770 | 90,711,728 | 105,418,808 |
91.081.000-6 | Enel Generación Chile S.A. | Chile | BNY Mellon - Primera Emisión S-3 | U.S.A. | US$ | 8.26 % | 8.13 % | 584,223 | 1,752,670 | 2,336,893 | 2,336,894 | 2,336,894 | 2,336,894 | 2,336,894 | 196,474,523 | 205,822,099 |
91.081.000-6 | Enel Generación Chile S.A. | Chile | BNY Mellon - Única 24296 | U.S.A. | US$ | 4.32 % | 4.25 % | 2,936,109 | 8,808,328 | 11,744,437 | 11,744,437 | 11,744,437 | 11,744,437 | 11,744,437 | 323,051,006 | 370,028,754 |
91.081.000-6 | Enel Generación Chile S.A. | Chile | Banco Santander -317 Serie-H | Chile | U.F. | 7.17 % | 6.20 % | 1,862,265 | 10,680,034 | 12,542,299 | 11,979,289 | 11,416,279 | 10,853,268 | 10,290,258 | 63,261,536 | 107,800,630 |
91.081.000-6 | Enel Generación Chile S.A. | Chile | Banco Santander 522 Serie-M | Chile | U.F. | 4.82 % | 4.75 % | 5,558,650 | 16,675,951 | 22,234,601 | 22,234,601 | 22,234,601 | 45,015,227 | 42,993,900 | 295,985,366 | 428,463,695 |
| | | | | | | Total | 14,739,772 | 49,312,556 | 64,052,328 | 63,489,317 | 62,926,307 | 85,143,922 | 82,559,585 | 1,186,633,196 | 1,480,752,327 |
| c)
| Financial lease obligations
|
1. Financial lease obligations by company
| | | | | | | | | | | | | | | | December 31, 2016 |
| | | | | | | | | | | | | | | | Current | | Non-Current |
Taxpayer ID No. (RUT) | | Company | | Country | | Taxpayer ID No. (RUT) | | Financial Institution | | Country | | Currency | | Nominal Interest Rate | | Less than 90 days | | More than 90 days | | Total Current | | One to two years | | Two to three years | | Three to four years | | Four to five years | | More than five years | | Total Non-Current |
| | | | | | | | | | | | | | | | ThCh$ | | ThCh$ | | ThCh$ | | ThCh$ | | ThCh$ | | ThCh$ | | ThCh$ | | ThCh$ | | ThCh$ |
91.081.000-6 | | Enel Generación Chile S.A. | | Chile | | 87.509.100-K | | Transelec S.A. | | Chile | | US$ | | 6.50 % | | 734,006 | | 2,200,827 | | 2,934,833 | | 2,931,533 | | 2,928,019 | | 2,924,276 | | 2,920,289 | | 7,777,314 | | 19,481,431 |
| | | | | | | | | | | | | | Total | | 734,006 | | 2,200,827 | | 2,934,833 | | 2,931,533 | | 2,928,019 | | 2,924,276 | | 2,920,289 | | 7,777,314 | | 19,481,431 |
| | | | | | | | | | | | | | | | | | | | | | | | | | | | | | | | |
| | | | | | | | | | | | | | | | | | | | | | | | | | | | | | | | |
| | | | | | | | | | | | | | | | December 31, 2015 |
| | | | | | | | | | | | | | | | Current | | Non-Current |
Taxpayer ID No. (RUT) | | Company | | Country | | Taxpayer ID No. (RUT) | | Financial Institution | | Country | | Currency | | Nominal Interest Rate | | Less than 90 days | | More than 90 days | | Total Current | | One to two years | | Two to three years | | Three to four years | | Four to five years | | More than five years | | Total Non-Current |
| | | | | | | | | | | | | | | | ThCh$ | | ThCh$ | | ThCh$ | | ThCh$ | | ThCh$ | | ThCh$ | | ThCh$ | | ThCh$ | | ThCh$ |
91.081.000-6 | | Enel Generación Chile S.A. | | Chile | | 87.509.100-K | | Abengoa Chile | | Chile | | US$ | | 6.50 % | | 732,936 | | 2,203,853 | | 2,936,789 | | 2,950,745 | | 2,965,609 | | 2,981,438 | | 2,998,297 | | 11,193,448 | | 23,089,537 |
| | | | | | | | | | | | | | Total | | 732,936 | | 2,203,853 | | 2,936,789 | | 2,950,745 | | 2,965,609 | | 2,981,438 | | 2,998,297 | | 11,193,448 | | 23,089,537 |
APPENDIX 51 DETAILS OF ASSETS AND LIABILITIES IN FOREIGN CURRENCY:
This appendix forms an integral part of the Group’s consolidated financial statements.
The detail of assets and liabilities denominated in foreign currenciescurrency is the following:as follows:
ASSETS | | Foreign Currency | | Functional Currency | | 12-31-2016 | | 12-31-2015 |
| | | ThCh$ | | ThCh$ |
Cash and cash equivalents | | U.S. dollar | | Chilean peso | | 5,198,139 | | 8,686,478 |
| | Argentine peso | | Chilean peso | | 4,807,406 | | 5,531,184 |
| | | | | | | | |
Trade and other current receivables | | U.S. dollar | | Chilean peso | | 50,976,270 | | - |
Current accounts receivable from related companies | | U.S. dollar | | Chilean peso | | 16,780,275 | | - |
TOTAL CURRENT ASSETS | | | | | | 77,762,090 | | 14,217,662 |
| | | | | | | | |
Investments accounted for using the equity method | | U.S. dollar | | Chilean peso | | - | | 31,841,928 |
TOTAL NON-CURRENT ASSETS | | | | | | - | | 31,841,928 |
| | | | | | | | |
TOTAL ASSETS | | | | | | 77,762,090 | | 46,059,590 |
| | | | | | December 31, 2016 | | December 31, 2015 |
| | | | | | Current Liabilities | | Non-current Liabilities | | Current Liabilities | | Non-current Liabilities |
| | Foreign Currency | | Functional Currency | | 90 days or less | | 91 days to 1 year | | Total Current | | One to two years | | Two to three years | | Three to four years | | Four to five years | | More than five years | | Total Non-Current | | 90 days or less | | 91 days to 1 year | | Total Current | | One to two years | | Two to three years | | Three to four years | | Four to five years | | More than five years | | Total Non-Current |
| | | | ThCh$ | | ThCh$ | | ThCh$ | | ThCh$ | | ThCh$ | | ThCh$ | | ThCh$ | | ThCh$ | | ThCh$ | | ThCh$ | | ThCh$ | | ThCh$ | | ThCh$ | | ThCh$ | | ThCh$ | | ThCh$ | | ThCh$ | | ThCh$ |
LIABILITIES | | | | | | | | | | | | | | | | | | | | | | | | | | | | | | | | | | | | | | | | |
Other current financial liabilities | | U.S. dollar | | Chilean peso | | 7,998,792 | | 23,995,186 | | 31,993,978 | | 31,990,679 | | 31,987,165 | | 31,983,422 | | 31,979,435 | | 649,125,696 | | 777,066,397 | | 8,051,793 | | 24,160,424 | | 32,212,217 | | 32,226,172 | | 32,241,036 | | 32,256,865 | | 32,273,724 | | 838,579,742 | | 967,577,539 |
TOTAL LIABILITIES | | | | | | 7,998,792 | | 23,995,186 | | 31,993,978 | | 31,990,679 | | 31,987,165 | | 31,983,422 | | 31,979,435 | | 649,125,696 | | 777,066,397 | | 8,051,793 | | 24,160,424 | | 32,212,217 | | 32,226,172 | | 32,241,036 | | 32,256,865 | | 32,273,724 | | 838,579,742 | | 967,577,539 |
| | | | 12-31-2018 | | 12-31-2017 | |
ASSETS | | Foreign Currency | | ThCh$ | | ThCh$ | |
Cash and cash equivalents | | | | 245,171,924 | | 419,456,026 | |
| | U.S. dollar | | 16,575,872 | | 14,016,336 | |
| | Euros | | 103,847 | | 11,594 | |
| | Argentine peso | | 6,057,793 | | 6,263,345 | |
| | Chilean peso non-adjustable | | 222,434,412 | | 399,164,751 | |
Other current financial assets | | | | 40,303,173 | | 20,627,062 | |
| | U.S. dollar | | 38,969,410 | | 20,441,150 | |
| | Chilean peso non-adjustable | | 644,618 | | 185,912 | |
| | U.F. | | 689,145 | | — | |
Other current non- financial assets | | | | 22,406,088 | | 18,785,891 | |
| | U.S. dollar | | 2,832,782 | | 902,026 | |
| | Argentine peso | | 917,718 | | 32,621 | |
| | Chilean peso non-adjustable | | 17,838,717 | | 17,851,244 | |
| | U.F. | | 816,871 | | — | |
Trade and other current receivables | | | | 478,170,067 | | 406,968,537 | |
| | U.S. dollar | | 3,193,959 | | 5,273,104 | |
| | Euros | | 3,905 | | — | |
| | Argentine peso | | 30,517 | | 1,073,072 | |
| | Chilean peso non-adjustable | | 474,941,686 | | 399,483,872 | |
| | U.F. | | — | | 1,138,489 | |
Current accounts receivable from related companies | | | | 54,171,060 | | 71,856,046 | |
| | U.S. dollar | | 6,997,861 | | 22,793,820 | |
| | Euros | | 26,475,919 | | 42,663,049 | |
| | Real | | 23,329 | | — | |
| | Chilean peso non-adjustable | | 20,673,951 | | 6,399,177 | |
Inventories | | | | 56,961,643 | | 39,686,942 | |
| | U.S. dollar | | 4,451,134 | | — | |
| | Chilean peso non-adjustable | | 52,510,509 | | 39,686,942 | |
Current tax assets | | | | 99,763,817 | | 77,756,048 | |
| | U.S. dollar | | 3,678 | | — | |
| | Argentine peso | | 145,845 | | 146,525 | |
| | Chilean peso non-adjustable | | 99,614,294 | | 77,609,523 | |
TOTAL CURRENT ASSETS | | | | 996,947,772 | | 1,055,136,552 | |
F-133
Table of Contents
NON-CURRENT ASSETS | | Foreign Currency | | 12-31-2018 | | 12-31-2017 | |
Other non-current financial assets | | | | 7,269,669 | | 33,418,204 | |
| | U.S. dollar | | 4,227,628 | | 30,789,705 | |
| | Chilean peso non-adjustable | | 2,352,896 | | 2,628,499 | |
| | U.F. | | 689,145 | | — | |
Other non-current non-financial assets | | | | 44,608,012 | | 13,813,139 | |
| | U.S. dollar | | 28,884,680 | | 322,744 | |
| | Argentine peso | | 218,003 | | 378,940 | |
| | Chilean peso non-adjustable | | 15,505,329 | | 12,326,385 | |
| | U.F. | | — | | 785,070 | |
Trade and other non-current receivables | | | | 60,527,843 | | 36,182,399 | |
| | U.S. dollar | | 17,074,839 | | — | |
| | Argentine peso | | 21,255 | | 62,563 | |
| | Chilean peso non-adjustable | | 33,425,943 | | 25,228,146 | |
| | U.F. | | 10,005,806 | | 10,891,690 | |
Investments accounted for using the equity method | | | | 12,873,531 | | 16,912,454 | |
| | U.S. dollar | | 46,639 | | 3,783,316 | |
| | Argentine peso | | — | | 105,151 | |
| | Chilean peso non-adjustable | | 12,826,892 | | 13,023,987 | |
Intangible assets other than goodwill | | | | 115,372,393 | | 55,170,904 | |
| | U.S. dollar | | 44,865,424 | | — | |
| | Argentine peso | | 259,479 | | 253,849 | |
| | Chilean peso non-adjustable | | 70,247,490 | | 54,917,055 | |
Goodwill | | | | 915,044,725 | | 887,257,655 | |
| | Chilean peso non-adjustable | | 915,044,725 | | 887,257,655 | |
Property, plant and equipment | | | | 5,308,647,633 | | 3,585,687,137 | |
| | U.S. dollar | | 1,523,774,815 | | — | |
| | Argentine peso | | 15,562,121 | | 15,450,783 | |
| | Chilean peso non-adjustable | | 3,769,310,697 | | 3,570,236,354 | |
Investment property | | | | 7,557,356 | | 8,356,772 | |
| | Chilean peso non-adjustable | | 7,557,356 | | 8,356,772 | |
Deferred tax assets | | | | 19,171,230 | | 2,837,792 | |
| | U.S. dollar | | 18,055,431 | | — | |
| | Chilean peso non-adjustable | | 1,115,799 | | 2,837,792 | |
TOTAL NON-CURRENT ASSETS | | | | 6,491,072,392 | | 4,639,636,456 | |
| | | | | | | |
TOTAL ASSETS | | | | 7,488,020,164 | | 5,694,773,008 | |
F-134
Table of Contents
| | | | 12-31-2018 | | 12-31-2017 | |
| | | | Less than 90 days | | More than 90
days | | Less than 90 days | | More than 90
days | |
LIABILITIES | | Foreign Currency | | ThCh$ | | ThCh$ | | ThCh$ | | ThCh$ | |
Other Current financial liabilities | | | | 161,482,001 | | 249,183,814 | | 7,999,866 | | 10,815,582 | |
| | U.S. dollar | | 161,481,999 | | 4,304,811 | | 7,999,743 | | 3,888,150 | |
| | Chilean peso non-adjustable | | 2 | | 212,736,909 | | 123 | | — | |
| | U.F. | | — | | 32,142,094 | | — | | 6,927,432 | |
Trade and other current payables | | | | 554,286,324 | | — | | 552,328,594 | | 3,649,924 | |
| | U.S. dollar | | 44,138,753 | | — | | 16,184,962 | | — | |
| | Euros | | 2,347,924 | | — | | 3,174,586 | | — | |
| | Argentine peso | | 511,460 | | — | | 732,777 | | — | |
| | Chilean peso non-adjustable | | 503,689,338 | | — | | 532,236,269 | | 3,649,924 | |
| | U.F. | | 3,598,849 | | — | | — | | — | |
Current accounts payable to related parties | | | | 157,936,325 | | — | | 119,612,972 | | — | |
| | U.S. dollar | | 324,743 | | — | | 9,090,837 | | — | |
| | Euros | | 82,619,960 | | — | | 28,830,246 | | — | |
| | Colombian peso | | — | | — | | 12,487 | | — | |
| | Soles | | — | | — | | 2,110 | | — | |
| | Argentine peso | | — | | — | | 74,740 | | — | |
| | Chilean peso non-adjustable | | 74,991,622 | | — | | 81,602,552 | | — | |
Other current provisions | | | | 3,413,966 | | 2,174,820 | | 384,955 | | 5,251,216 | |
| | U.S. dollar | | 12,510 | | — | | — | | — | |
| | Argentine peso | | 24,667 | | — | | 45,419 | | — | |
| | Chilean peso non-adjustable | | 3,376,789 | | 2,174,820 | | 339,536 | | 5,251,216 | |
Current tax liabilities | | | | 9,725,475 | | 7,952,445 | | 904,248 | | 66,123,259 | |
| | U.S. dollar | | 22,626 | | | | — | | — | |
| | Argentine peso | | — | | 411,577 | | 146,769 | | — | |
| | Chilean peso non-adjustable | | 9,702,849 | | 7,540,868 | | 757,479 | | 66,123,259 | |
Other current non-financial liabilities | | | | 71,308,982 | | — | | 38,520,088 | | 11,225,942 | |
| | U.S. dollar | | 2,766,862 | | — | | — | | — | |
| | Argentine peso | | 10,061 | | — | | — | | — | |
| | Chilean peso non-adjustable | | 68,532,059 | | — | | 38,520,088 | | 11,225,942 | |
TOTAL CURRENT LIABILITIES | | | | 958,153,073 | | 259,311,079 | | 719,750,723 | | 97,065,923 | |
F-135
Table of Contents
| | | | 12-31-2018 | | 12-31-2017 | |
| | | | One to five years | | More than five years | | One to five years | | More than five years | |
LIABILITIES | | Foreign Currency | | ThCh$ | | ThCh$ | | ThCh$ | | ThCh$ | |
Other non-current financial liabilities | | | | 367,293,521 | | 1,338,539,982 | | 51,932,458 | | 730,045,687 | |
| | U.S. dollar | | 244,119,549 | | 1,164,595,519 | | 29,636,407 | | 434,446,795 | |
| | Chilean peso non-adjustable | | — | | — | | — | | — | |
| | U.F. | | 123,173,972 | | 173,944,463 | | 22,296,051 | | 295,598,892 | |
Trade and other non-current payables | | | | 2,584,180 | | — | | 659,824 | | — | |
| | U.S. dollar | | 31,124 | | — | | 947 | | — | |
| | Argentine peso | | — | | — | | 173,343 | | — | |
| | Chilean peso non-adjustable | | 2,553,056 | | — | | 485,534 | | — | |
Current account payable to related parties | | | | 447,193,802 | | — | | 318,518 | | — | |
| | U.S. dollar | | 447,193,802 | | — | | 318,518 | | — | |
Other long-term provisions | | | | 42,349,208 | | 63,522,167 | | 52,318 | | 78,370,519 | |
| | U.S. dollar | | 12,392,385 | | | | | | — | |
| | Chilean peso non-adjustable | | 29,956,823 | | 63,522,167 | | 52,318 | | 78,370,519 | |
Deferred tax liabilities | | | | 134,078,768 | | 144,001,286 | | 55,844,982 | | 116,378,699 | |
| | U.S. dollar | | 74,730,155 | | — | | — | | — | |
| | Argentine peso | | — | | — | | 4,459,081 | | — | |
| | Chilean peso non-adjustable | | 59,348,613 | | 144,001,286 | | 51,385,901 | | 116,378,699 | |
Non- current provisions for employee benefits | | | | 4,116,090 | | 52,486,574 | | 3,434,185 | | 53,647,739 | |
| | U.S. dollar | | 532,225 | | — | | — | | — | |
| | Chilean peso non-adjustable | | 3,583,865 | | 52,486,574 | | 3,434,185 | | 53,647,739 | |
Other non-current non financial liabilities | | | | 226,653 | | — | | 309,776 | | — | |
| | Chilean peso non-adjustable | | 226,653 | | — | | 309,776 | | — | |
TOTAL NON-CURRENT LIABILITIES | | | | 997,842,222 | | 1,598,550,009 | | 112,552,061 | | 978,442,644 | |
| | | | | | | | | | | |
TOTAL LIABILITIES | | | | 1,955,995,295 | | 1,857,861,088 | | 832,302,784 | | 1,075,508,567 | |
F-136
Table of Contents
APPENDIX 62 ADDITIONAL INFORMATION OFICIO CIRCULAR (OFFICIAL BULLETIN) No. 715 OF FEBRUARY 3, 2012:
This appendix forms an integral part of the Group’sthese consolidated financial statements.
| a)
| Portfolio stratification
|
a) Portfolio stratification
·Trade and other receivables by aging:
| | As of December 31, 2016 | | As of December 31, 2018 | |
Trade and Other Receivables | | Current Portfolio | | 1-30 days | | 31-60 days | | 61-90 days | | 91-120 days | | 121-150 days | | 151-180 days | | 181-210 days | | 211-250 days | | More than 251 days | | Total Current | | Total Non-Current | |
| | Current
Portfolio | | 1-30 days | | 31-60 days | | 61-90 days | | 91-120 days | | 121-150
days | | 151-180
days | | 181-210
days | | 211-250
days | | More than
251 days | | Total
Current | | Total Non-
Current | |
Trade and Other Receivables | | ThCh$ | | ThCh$ | | ThCh$ | | ThCh$ | | ThCh$ | | ThCh$ | | ThCh$ | | ThCh$ | | ThCh$ | | ThCh$ | | ThCh$ | | ThCh$ | | ThCh$ | | ThCh$ | | ThCh$ | | ThCh$ | | ThCh$ | | ThCh$ | | ThCh$ | | ThCh$ | | ThCh$ | | ThCh$ | | ThCh$ | | ThCh$ | |
| 280,408,709 | | 34,119,100 | | 14,480,516 | | 4,262,852 | | 2,265,532 | | 5,983,874 | | 2,940,939 | | 2,126,283 | | 4,246,731 | | 63,349,580 | | 414,184,116 | | 8,369,878 | | 360,967,952 | | 26,520,834 | | 8,065,762 | | 3,947,386 | | 2,096,447 | | 1,400,998 | | 1,945,691 | | 1,528,489 | | 2,863,502 | | 47,716,556 | | 457,053,617 | | 2,046,845 | |
Allowance for doubtful accounts | | (157,009) | | (221,810) | | (212,406) | | (168,457) | | (109,571) | | (110,910) | | (174,725) | | (766,217) | | (103,001) | | (29,672,710) | | (31,696,816) | | - | | (1,309,684 | ) | (244,773 | ) | (260,401 | ) | (317,546 | ) | (419,163 | ) | (523,349 | ) | (584,135 | ) | (634,104 | ) | (2,085,824 | ) | (32,774,456 | ) | (39,153,435 | ) | — | |
Other receivables, gross | | 62,584,556 | | - | | - | | - | | - | | - | | - | | - | | - | | 7,765,064 | | 70,349,620 | | 25,130,227 | | 60,242,885 | | — | | — | | — | | — | | — | | — | | — | | — | | 10,353,445 | | 70,596,330 | | 58,480,998 | |
Allowance for doubtful accounts | | - | | - | | - | | - | | - | | - | | - | | - | | - | | (7,765,064) | | (7,765,064) | | - | | — | | — | | — | | — | | — | | — | | — | | — | | — | | (10,353,445 | ) | (10,353,445 | ) | — | |
Total | | 342,836,256 | | 33,897,290 | | 14,268,110 | | 4,094,395 | | 2,155,961 | | 5,872,964 | | 2,766,214 | | 1,360,066 | | 4,143,730 | | 33,676,870 | | 445,071,856 | | 33,500,105 | | 419,901,153 | | 26,276,061 | | 7,805,361 | | 3,629,840 | | 1,677,284 | | 877,649 | | 1,361,556 | | 894,385 | | 777,678 | | 14,942,100 | | 478,143,067 | | 60,527,843 | |
| | | | | | | | | | | | | | | | | | | | | | | | | | | |
| | | As of December 31, 2017 | |
| | As of December 31, 2015 | | Current
Portfolio | | 1-30 days | | 31-60 days | | 61-90 days | | 91-120 days | | 121-150
days | | 151-180
days | | 181-210
days | | 211-250
days | | More than
251 days | | Total
Current | | Total Non-
Current | |
Trade and Other Receivables | | Current Portfolio | | 1-30 days | | 31-60 days | | 61-90 days | | 91-120 days | | 121-150 days | | 151-180 days | | 181-210 days | | 211-250 days | | More than 251 days | | Total Current | | Total Non-Current | | ThCh$ | | ThCh$ | | ThCh$ | | ThCh$ | | ThCh$ | | ThCh$ | | ThCh$ | | ThCh$ | | ThCh$ | | ThCh$ | | ThCh$ | | ThCh$ | |
| ThCh$ | | ThCh$ | | ThCh$ | | ThCh$ | | ThCh$ | | ThCh$ | | ThCh$ | | ThCh$ | | ThCh$ | | ThCh$ | | ThCh$ | | ThCh$ | |
Trade receivables, gross | | 401,114,021 | | 35,394,440 | | 14,405,933 | | 2,544,979 | | 2,252,342 | | 2,872,208 | | 2,167,993 | | 1,442,766 | | 1,033,292 | | 47,275,524 | | 510,503,498 | | 2,892,026 | | 291,417,828 | | 33,630,393 | | 17,506,620 | | 3,996,144 | | 2,189,405 | | 4,565,337 | | 2,861,581 | | 2,470,973 | | 1,796,958 | | 54,604,283 | | 415,039,522 | | 1,917,828 | |
Allowance for doubtful accounts | | (200,898) | | (240,905) | | (228,765) | | (136,387) | | (117,416) | | (157,109) | | (100,853) | | (712,740) | | (87,660) | | (25,731,934) | | (26,994,307) | | - | | (89,762 | ) | (231,131 | ) | (213,455 | ) | (200,097 | ) | (223,821 | ) | (176,789 | ) | (207,518 | ) | (914,480 | ) | (133,045 | ) | (32,270,098 | ) | (34,660,196 | ) | — | |
Other receivables, gross | | 121,738,459 | | - | | - | | - | | - | | - | | - | | - | | - | | - | | 121,738,459 | | 11,500,197 | | 26,589,211 | | — | | — | | — | | — | | — | | — | | — | | — | | 9,213,863 | | 35,803,074 | | 34,264,571 | |
Allowance for doubtful accounts | | (8,162,823) | | - | | - | | - | | - | | - | | - | | - | | - | | - | | (8,162,823) | | - | | — | | — | | — | | — | | — | | — | | — | | — | | — | | (9,213,863 | ) | (9,213,863 | ) | — | |
Total | | 514,488,759 | | 35,153,535 | | 14,177,168 | | 2,408,592 | | 2,134,926 | | 2,715,099 | | 2,067,140 | | 730,026 | | 945,632 | | 21,543,590 | | 597,084,827 | | 14,392,223 | | 317,917,277 | | 33,399,262 | | 17,293,165 | | 3,796,047 | | 1,965,584 | | 4,388,548 | | 2,654,063 | | 1,556,493 | | 1,663,913 | | 22,334,185 | | 406,968,537 | | 36,182,399 | |
| | December 31, 2016 | | December 31, 2015 | | December 31, 2018 | | December 31, 2017 | |
| | Non-renegotiated Portfolio | | Renegotiated Portfolio | | Total Gross Portfolio | | Non-renegotiated Portfolio | | Renegotiated Portfolio | | Total Gross Portfolio | | Non-
renegotiated Portfolio | | Renegotiated Portfolio | | Total Gross Portfolio | | Non-renegotiated Portfolio | | Renegotiated Portfolio | | Total Gross Portfolio | |
Aging of balances | | Number of Customers | | Gross Amount | | Number of Customers | | Gross Amount | | Number of Customers | | Gross Amount | | Number of Customers | | Gross Amount | | Number of Customers | | Gross Amount | | Number of Customers | | Gross Amount | |
| | Number of | | Gross
Amount | | Number of | | Gross
Amount | | Number of | | Gross
Amount | | Number of | | Gross
Amount | | Number of | | Gross
Amount | | Number of | | Gross
Amount | |
Aging of balances | | | | ThCh$ | | | | ThCh$ | | | | ThCh$ | | | | ThCh$ | | | | ThCh$ | | | | ThCh$ | | Customers | | ThCh$ | | Customers | | ThCh$ | | Customers | | ThCh$ | | Customers | | ThCh$ | | Customers | | ThCh$ | | Customers | | ThCh$ | |
| 1,157,940 | | 281,705,071 | | 60,278 | | 5,850,339 | | 1,218,218 | | 287,555,410 | | 1,210,185 | | 398,258,364 | | 52,166 | | 5,747,683 | | 1,262,351 | | 404,006,047 | | 1,370,536 | | 353,865,825 | | 42,898 | | 9,101,666 | | 1,413,434 | | 362,967,491 | | 1,145,472 | | 288,681,858 | | 52,679 | | 4,653,798 | | 1,198,151 | | 293,335,656 | |
1 to 30 days | | 414,617 | | 30,167,962 | | 22,459 | | 3,951,138 | | 437,076 | | 34,119,100 | | 436,876 | | 31,915,015 | | 25,066 | | 3,479,425 | | 461,942 | | 35,394,440 | | 390,536 | | 25,894,683 | | 19,304 | | 626,151 | | 409,840 | | 26,520,834 | | 451,929 | | 30,202,328 | | 22,869 | | 3,428,065 | | 474,798 | | 33,630,393 | |
31 to 60 days | | 107,539 | | 12,724,070 | | 8,312 | | 1,756,446 | | 115,851 | | 14,480,516 | | 107,438 | | 11,584,123 | | 8,583 | | 2,821,810 | | 116,021 | | 14,405,933 | | 83,029 | | 7,864,638 | | 6,649 | | 201,124 | | 89,678 | | 8,065,762 | | 133,114 | | 15,573,493 | | 8,780 | | 1,933,127 | | 141,894 | | 17,506,620 | |
61 to 90 days | | 18,344 | | 3,813,933 | | 2,128 | | 448,919 | | 20,472 | | 4,262,852 | | 14,831 | | 2,130,751 | | 1,802 | | 414,228 | | 16,633 | | 2,544,979 | | 14,466 | | 3,827,182 | | 2,014 | | 120,204 | | 16,480 | | 3,947,386 | | 22,305 | | 3,228,258 | | 2,795 | | 767,886 | | 25,100 | | 3,996,144 | |
91 to 120 days | | 8,987 | | 1,978,892 | | 1,049 | | 286,640 | | 10,036 | | 2,265,532 | | 7,761 | | 1,998,462 | | 936 | | 253,880 | | 8,697 | | 2,252,342 | | 7,515 | | 2,007,221 | | 1,182 | | 89,226 | | 8,697 | | 2,096,447 | | 9,505 | | 1,817,086 | | 1,422 | | 372,319 | | 10,927 | | 2,189,405 | |
121 to 150 days | | 5,866 | | 5,753,020 | | 656 | | 230,854 | | 6,522 | | 5,983,874 | | 5,749 | | 2,661,078 | | 574 | | 211,130 | | 6,323 | | 2,872,208 | | 4,393 | | 1,266,995 | | 892 | | 134,003 | | 5,285 | | 1,400,998 | | 7,118 | | 4,216,619 | | 1,093 | | 348,718 | | 8,211 | | 4,565,337 | |
151 to 180 days | | 4,671 | | 2,415,755 | | 442 | | 525,184 | | 5,113 | | 2,940,939 | | 4,305 | | 2,055,028 | | 324 | | 112,965 | | 4,629 | | 2,167,993 | | 3,007 | | 1,697,721 | | 459 | | 247,970 | | 3,466 | | 1,945,691 | | 5,333 | | 2,526,954 | | 699 | | 334,627 | | 6,032 | | 2,861,581 | |
181 to 210 days | | 20,001 | | 2,016,444 | | 275 | | 109,839 | | 20,276 | | 2,126,283 | | 17,458 | | 1,369,535 | | 219 | | 73,231 | | 17,677 | | 1,442,766 | | 2,805 | | 1,446,409 | | 311 | | 82,080 | | 3,116 | | 1,528,489 | | 10,103 | | 2,127,005 | | 446 | | 343,968 | | 10,549 | | 2,470,973 | |
211 to 250 days | | 3,535 | | 4,163,062 | | 217 | | 83,669 | | 3,752 | | 4,246,731 | | 3,429 | | 952,381 | | 226 | | 80,911 | | 3,655 | | 1,033,292 | | 3,237 | | 2,772,883 | | 311 | | 90,619 | | 3,548 | | 2,863,502 | | 3,979 | | 1,599,571 | | 394 | | 197,387 | | 4,373 | | 1,796,958 | |
More than 251 days | | 123,301 | | 60,447,048 | | 3,613 | | 4,125,709 | | 126,914 | | 64,572,757 | | 10,159 | | 44,797,554 | | 591 | | 2,477,970 | | 10,750 | | 47,275,524 | | 20,876 | | 47,255,348 | | 5,769 | | 508,514 | | 26,645 | | 47,763,862 | | 125,590 | | 48,307,224 | | 5,593 | | 6,297,059 | | 131,183 | | 54,604,283 | |
Total | | 1,864,801 | | 405,185,257 | | 99,429 | | 17,368,737 | | 1,964,230 | | 422,553,994 | | 1,818,191 | | 497,722,291 | | 90,487 | | 15,673,233 | | 1,908,678 | | 513,395,524 | | 1,900,400 | | 447,898,905 | | 79,789 | | 11,201,557 | | 1,980,189 | | 459,100,462 | | 1,914,448 | | 398,280,396 | | 96,770 | | 18,676,954 | | 2,011,218 | | 416,957,350 | |
F-137
Table of Contents
b) Portfolio in default and in legal collection process
| b)
| Portfolio in default and in legal collection process
|
| | As of December 31, | |
| | 2018 | | 2017 | |
| | Number of | | Amount | | Number of | | Amount | |
Portfolio in Default and in Legal Collection Process | | Customers | | ThCh$ | | Customers | | ThCh$ | |
Notes receivable in default | | 1,876 | | 258,372 | | 1,902 | | 259,560 | |
Notes receivable in legal collection process (*) | | 2,238 | | 10,450,383 | | 2,744 | | 6,041,670 | |
Total | | 4,114 | | 10,708,755 | | 4,646 | | 6,301,230 | |
| | As of December 31, |
| | 2016 | | 2015 |
Portfolio in Default and in Legal Collection Process | | Number of Customers | | Amount | | Number of Customers | | Amount |
| | ThCh$ | | | ThCh$ |
Notes receivable in default | | 1,949 | | 262,912 | | 2,013 | | 267,573 |
Notes receivable in legal collection process (*) | | 3,608 | | 7,049,869 | | 3,923 | | 7,093,235 |
Total | | 5,557 | | 7,312,781 | | 5,936 | | 7,360,808 |
| (*)
| (*)Legal collections are included in the portfolio in arrears. |
| c)
| Provisions and write-offs
|
| | As of December 31, |
Provisions and Write-offs | | 2016 | | 2015 |
| ThCh$ | | ThCh$ |
Provision for non-renegotiated portfolio | | 4,919,244 | | 12,451,270 |
Provision for renegotiated portfolio | | (746,953) | | (5,340,962) |
Total | | 4,172,291 | | 7,110,308 |
| d)
| Number and value of operations
|
| | December 31, 2016 | | December 31, 2015 |
Number and Value of Operations | | Total detail by type of operation | | Total detail by type of operation | | Total detail by type of operation | | Total detail by type of operation |
| Last Quarter | | Year-to-date | | Last Quarter | | Year-to-date |
Impairment provisions and recoveries: | | | | | | | | |
Number of operations | | 11,092 | | 1,949,771 | | 1,907,922 | | 1,907,922 |
Value of operations, in ThCh$ | | 74,563 | | 4,172,291 | | 7,110,308 | | 7,110,308 |
c) Provisions and write-offs
| | As of December 31, | |
| | 2018 | | 2017 | |
Provisions and Write-offs | | ThCh$ | | ThCh$ | |
Provision for non-renegotiated portfolio | | 2,312,966 | | 7,928,877 | |
Provision for renegotiated portfolio | | 2,461,643 | | 8,940 | |
Recoveries of the period | | 3,099 | | — | |
Total | | 4,777,708 | | 7,937,817 | |
d) Number and value of operations
| | December 31, 2018 | | December 31, 2017 | |
| | Total detail by
type of operation | | Total detail by
type of operation | | Total detail by
type of operation | | Total detail by
type of operation | |
Number and Value of Operations | | Last Quarter | | Year-to-date | | Last Quarter | | Year-to-date | |
Impairment provisions and recoveries: | | | | | | | | | |
Number of operations | | 7,357 | | 19,810 | | 5,376 | | 46,484 | |
Value of operations, in ThCh$ | | 1,596,443 | | 4,777,708 | | 4,058,212 | | 7,937,817 | |
F-138
Table of Contents
APPENDIX 6.12.1 SUPPLEMENTARY INFORMATIONINFORMATION ON TRADE RECEIVABLES:
This appendix forms an integral part of the Group’sthese consolidated financial statements.
| a)
| Portfolio stratification
|
a)Portfolio stratification
·Trade receivables by aging:
| | | | | | | | | | | | | | | | | | | | | | | | | | |
| | December 31, 2016 |
Trade and other current receivables | | Current Portfolio | | 1-30 days | | 31-60 days | | 61-90 days | | 91-120 days | | 121-150 days | | 151-180 days | | 181-210 days | | 211-250 days | | More than 251 days | | More than 365 days | | Total Current | | Total Non-Current |
| ThCh$ | | ThCh$ | | ThCh$ | | ThCh$ | | ThCh$ | | ThCh$ | | ThCh$ | | ThCh$ | | ThCh$ | | ThCh$ | | ThCh$ | | ThCh$ | | ThCh$ |
Trade receivables, generation | | 179,498,353 | | 2,770,582 | | 1,165,177 | | 773,502 | | 900,093 | | 5,101,117 | | 13,609 | | 553,986 | | 3,593,733 | | 9,600,268 | | 10,508,696 | | 214,479,116 | | 5,751,509 |
- Large customers | | 179,482,501 | | 2,770,582 | | 1,165,177 | | 773,502 | | 900,093 | | 5,101,117 | | 13,609 | | 553,986 | | 3,593,733 | | 9,600,268 | | 10,508,696 | | 214,463,264 | | 5,723,942 |
- Institutional customers | | - | | - | | - | | - | | - | | - | | - | | - | | - | | - | | - | | - | | - |
- Others | | 15,852 | | - | | - | | - | | - | | - | | - | | - | | - | | - | | - | | 15,852 | | 27,567 |
Allowance for doubtful accounts | | - | | - | | - | | - | | - | | - | | - | | - | | - | | (1,314,310) | | - | | (1,314,310) | | - |
| | | | | | | | | | | | | | | | | | | | | | | | | | |
Unbilled services | | 125,367,509 | | - | | - | | - | | - | | - | | - | | - | | - | | - | | - | | 125,367,509 | | 3,308,454 |
Services billed | | 54,130,844 | | 2,770,582 | | 1,165,177 | | 773,502 | | 900,093 | | 5,101,117 | | 13,609 | | 553,986 | | 3,593,733 | | 9,600,268 | | 10,508,696 | | 89,111,607 | | 2,443,055 |
| | | | | | | | | | | | | | | | | | | | | | | | | | |
Trade receivables, distribution | | 100,910,356 | | 31,348,518 | | 13,315,339 | | 3,489,350 | | 1,365,439 | | 882,757 | | 2,927,330 | | 1,572,297 | | 652,998 | | 2,667,650 | | 40,572,966 | | 199,705,000 | | 2,618,369 |
-Mass-market customers | | 74,735,718 | | 23,318,881 | | 9,558,288 | | 1,981,025 | | 862,071 | | 615,659 | | 534,796 | | 779,941 | | 347,398 | | 1,202,738 | | 23,490,230 | | 137,426,745 | | 2,164,930 |
- Large customers | | 23,586,354 | | 6,566,919 | | 2,148,243 | | 1,231,708 | | 209,825 | | 172,851 | | 1,174,012 | | 46,128 | | 2,424 | | 766,851 | | 10,154,924 | | 46,060,239 | | 34,602 |
- Institutional customers | | 2,588,284 | | 1,462,718 | | 1,608,808 | | 276,617 | | 293,543 | | 94,247 | | 1,218,522 | | 746,228 | | 303,176 | | 698,061 | | 6,927,812 | | 16,218,016 | | 418,837 |
Allowance for doubtful accounts | | (157,009) | | (221,810) | | (212,406) | | (168,457) | | (109,571) | | (110,910) | | (174,725) | | (766,217) | | (103,001) | | (614,954) | | (27,743,446) | | (30,382,506) | | - |
| | | | | | | | | | | | | | | | | | | | | | | | | | |
Unbilled services | | 61,742,593 | | - | | - | | - | | - | | - | | - | | - | | - | | - | | - | | 61,742,593 | | 149,508 |
Services billed | | 39,167,763 | | 31,348,518 | | 13,315,339 | | 3,489,350 | | 1,365,439 | | 882,757 | | 2,927,330 | | 1,572,297 | | 652,998 | | 2,667,650 | | 40,572,966 | | 137,962,407 | | 2,465,400 |
| | | | | | | | | | | | | | | | | | | | | | | | | | |
Total Trade Receivables, Gross | | 280,408,709 | | 34,119,100 | | 14,480,516 | | 4,262,852 | | 2,265,532 | | 5,983,874 | | 2,940,939 | | 2,126,283 | | 4,246,731 | | 12,267,918 | | 51,081,662 | | 414,184,116 | | 8,369,878 |
Total Allowance for Doubtful Accounts | | (157,009) | | (221,810) | | (212,406) | | (168,457) | | (109,571) | | (110,910) | | (174,725) | | (766,217) | | (103,001) | | (1,929,264) | | (27,743,446) | | (31,696,816) | | - |
| | | | | | | | | | | | | | | | | | | | | | | | | | |
Total Trade Receivables, Net | | 280,251,700 | | 33,897,290 | | 14,268,110 | | 4,094,395 | | 2,155,961 | | 5,872,964 | | 2,766,214 | | 1,360,066 | | 4,143,730 | | 10,338,654 | | 23,338,216 | | 382,487,300 | | 8,369,878 |
| | December 31, 2018 | |
| | Current
Portfolio | | 1-30 days | | 31-60 days | | 61-90 days | | 91-
120 days | | 121-
150 days | | 151-
180 days | | 181-
210 days | | 211-
250 days | | More than
251 days | | Total
Current
Gross
Portfolio | | Total Non-
Current
Gross
Portfolio | |
Type of Portfolio | | ThCh$ | | ThCh$ | | ThCh$ | | ThCh$ | | ThCh$ | | ThCh$ | | ThCh$ | | ThCh$ | | ThCh$ | | ThCh$ | | ThCh$ | | ThCh$ | |
GENERATION | | | | | | | | | | | | | | | | | | | | | | | | | |
Non-renegotiated portfolio | | 206,893,035 | | 1,155,988 | | 1,453,308 | | 708,552 | | 203,487 | | 7,836 | | 39,787 | | 483,751 | | 153,929 | | 6,715,665 | | 217,815,338 | | 21,255 | |
- Large customers | | 198,424,050 | | 671,037 | | 248,135 | | 140,571 | | 224 | | 7,274 | | 39,001 | | 43,681 | | 56,046 | | 5,835,279 | | 205,465,298 | | — | |
- Institutional customers | | — | | — | | — | | — | | — | | — | | — | | — | | — | | — | | — | | — | |
- Others | | 8,468,985 | | 484,951 | | 1,205,173 | | 567,981 | | 203,263 | | 562 | | 786 | | 440,070 | | 97,883 | | 880,386 | | 12,350,040 | | 21,255 | |
Allowance for impairment | | (21,736 | ) | — | | — | | — | | — | | — | | — | | — | | — | | (1,505,948 | ) | (1,527,684 | ) | — | |
DISTRIBUTION | | | | | | | | | | | | | | | | | | | | | | | | | |
Non-renegotiated portfolio | | 154,074,917 | | 25,364,846 | | 6,612,454 | | 3,238,834 | | 1,892,960 | | 1,393,162 | | 1,905,904 | | 1,044,738 | | 2,709,573 | | 41,000,891 | | 239,238,279 | | 2,025,590 | |
- Mass-market customers | | 108,952,722 | | 16,661,831 | | 3,571,670 | | 1,427,141 | | 1,076,288 | | 850,571 | | 715,174 | | 531,508 | | 2,195,894 | | 25,496,293 | | 161,479,092 | | 2,000,955 | |
- Large customers | | 38,529,866 | | 6,924,749 | | 1,662,569 | | 1,225,278 | | 102,522 | | 475 | | 918,487 | | 124,385 | | 164,424 | | 7,945,564 | | 57,598,319 | | 24,635 | |
- Institutional customers | | 6,592,329 | | 1,778,266 | | 1,378,215 | | 586,415 | | 714,150 | | 542,116 | | 272,243 | | 388,845 | | 349,255 | | 7,559,034 | | 20,160,868 | | — | |
Allowance for impairment | | (1,287,948 | ) | (244,773 | ) | (260,401 | ) | (317,546 | ) | (419,163 | ) | (523,349 | ) | (584,135 | ) | (634,104 | ) | (2,085,824 | ) | (31,241,508 | ) | (37,598,751 | ) | | |
| | | | | | | | | | | | | | | | | | | | | | | | | |
Total Gross Portfolio | | 360,967,952 | | 26,520,834 | | 8,065,762 | | 3,947,386 | | 2,096,447 | | 1,400,998 | | 1,945,691 | | 1,528,489 | | 2,863,502 | | 47,716,556 | | 457,053,617 | | 2,046,845 | |
Total allowance for impairment | | (1,309,684 | ) | (244,773 | ) | (260,401 | ) | (317,546 | ) | (419,163 | ) | (523,349 | ) | (584,135 | ) | (634,104 | ) | (2,085,824 | ) | (32,747,456 | ) | (39,126,435 | ) | — | |
Total Net Portfolio | | 359,658,268 | | 26,276,061 | | 7,805,361 | | 3,629,840 | | 1,677,284 | | 877,649 | | 1,361,556 | | 894,385 | | 777,678 | | 14,969,100 | | 417,927,182 | | 2,046,845 | |
| | December 31, 2017 | |
| | Current
Portfolio | | 1-30 days | | 31-60 days | | 61-90 days | | 91-
120 days | | 121-
150 days | | 151-
180 days | | 181-
210 days | | 211-
250 days | | More than
251 days | | Total
Current
Gross
Portfolio | | Total Non-
Current
Gross
Portfolio | |
Type of Portfolio | | ThCh$ | | ThCh$ | | ThCh$ | | ThCh$ | | ThCh$ | | ThCh$ | | ThCh$ | | ThCh$ | | ThCh$ | | ThCh$ | | ThCh$ | | ThCh$ | |
GENERATION | | | | | | | | | | | | | | | | | | | | | | | | | |
Non-renegotiated portfolio | | 186,769,753 | | 3,057,994 | | 333,079 | | 279,100 | | 10,021 | | 42,015 | | 334,298 | | 399,552 | | 228,498 | | 2,857,223 | | 194,311,533 | | 62,563 | |
- Large customers | | 186,724,468 | | 3,057,994 | | 333,079 | | 279,100 | | 10,021 | | 42,015 | | 334,298 | | 399,552 | | 228,498 | | 4,116,040 | | 195,525,065 | | — | |
- Institutional customers | | — | | — | | — | | — | | — | | — | | — | | — | | — | | — | | — | | — | |
- Others | | 45,285 | | — | | — | | — | | — | | — | | — | | — | | — | | — | | 45,285 | | 62,563 | |
Allowance for impairment | | — | | — | | — | | — | | — | | — | | — | | — | | — | | (1,258,817 | ) | (1,258,817 | ) | — | |
DISTRIBUTION | | | | | | | | | | | | | | | | | | | | | | | | | |
Non-renegotiated portfolio | | 104,648,075 | | 30,572,399 | | 17,173,541 | | 3,717,044 | | 2,179,384 | | 4,523,322 | | 2,527,283 | | 2,071,421 | | 1,568,460 | | 50,488,243 | | 219,469,172 | | 1,855,265 | |
- Mass-market customers | | 84,591,816 | | 22,148,005 | | 10,699,951 | | 2,264,627 | | 1,657,978 | | 1,231,644 | | 918,357 | | 1,700,605 | | 567,152 | | 27,150,498 | | 152,930,633 | | 1,781,421 | |
- Large customers | | 17,771,942 | | 6,565,888 | | 4,987,871 | | 940,754 | | 168,838 | | 1,809,919 | | 357,379 | | 30,481 | | 7,237 | | 13,628,346 | | 46,268,655 | | — | |
- Institutional customers | | 2,284,317 | | 1,858,506 | | 1,485,719 | | 511,663 | | 352,568 | | 1,481,759 | | 1,251,547 | | 340,335 | | 994,071 | | 9,709,399 | | 20,269,884 | | 73,844 | |
Allowance for impairment | | (89,762 | ) | (231,131 | ) | (213,455 | ) | (200,097 | ) | (223,821 | ) | (176,789 | ) | (207,518 | ) | (914,480 | ) | (133,045 | ) | (31,011,281 | ) | (33,401,379 | ) | — | |
| | | | | | | | | | | | | | | | | | | | | | | | | |
Total Gross Portfolio | | 291,417,828 | | 33,630,393 | | 17,506,620 | | 3,996,144 | | 2,189,405 | | 4,565,337 | | 2,861,581 | | 2,470,973 | | 1,796,958 | | 54,604,283 | | 415,039,522 | | 1,917,828 | |
Total allowance for impairment | | (89,762 | ) | (231,131 | ) | (213,455 | ) | (200,097 | ) | (223,821 | ) | (176,789 | ) | (207,518 | ) | (914,480 | ) | (133,045 | ) | (32,270,098 | ) | (34,660,196 | ) | — | |
Total Net Portfolio | | 291,328,066 | | 33,399,262 | | 17,293,165 | | 3,796,047 | | 1,965,584 | | 4,388,548 | | 2,654,063 | | 1,556,493 | | 1,663,913 | | 22,334,185 | | 380,379,326 | | 1,917,828 | |
Since not all of our commercial databases in our Group’s subsidiaries distinguish whether the final electricity service consumer is a natural or legal person, the main management segmentation used by all the consolidated entities to monitor and follow up on trade receivables is the following:
| | | | | | | | | | | | | | | | | | | | | | | | | | |
| | December 31, 2015 |
Trade and other current receivables | | Current Portfolio | | 1-30 days | | 31-60 days | | 61-90 days | | 91-120 days | | 121-150 days | | 151-180 days | | 181-210 days | | 211-250 days | | More than 251 days | | More than 365 days | | Total Current | | Total Non-Current |
| ThCh$ | | ThCh$ | | ThCh$ | | ThCh$ | | ThCh$ | | ThCh$ | | ThCh$ | | ThCh$ | | ThCh$ | | ThCh$ | | ThCh$ | | ThCh$ | | ThCh$ |
Trade receivables, generation | | 268,755,088 | | 1,110,952 | | 199 | | 11,659 | | 175 | | 345 | | 2 | | 12 | | 36,166 | | 1,868,906 | | - | | 271,783,504 | | 35,901 |
- Large customers | | 268,735,519 | | 1,110,952 | | 199 | | 11,659 | | 175 | | 345 | | 2 | | 12 | | 36,166 | | 1,868,906 | | - | | 271,763,935 | | - |
- Institutional customers | | - | | - | | - | | - | | - | | - | | - | | - | | - | | - | | - | | - | | - |
- Others | | 19,569 | | - | | - | | - | | - | | - | | - | | - | | - | | - | | - | | 19,569 | | 35,901 |
Allowance for doubtful accounts | | (55,494) | | - | | - | | - | | - | | - | | - | | - | | - | | (1,493,699) | | - | | (1,549,193) | | - |
| | | | | | | | | | | | | | | | | | | | | | | | | | |
Unbilled services | | 169,489,605 | | - | | - | | - | | - | | - | | - | | - | | - | | 390,612 | | - | | 169,880,217 | | - |
Services billed | | 99,265,483 | | 1,110,952 | | 199 | | 11,659 | | 175 | | 345 | | 2 | | 12 | | 36,166 | | 1,478,294 | | - | | 101,903,287 | | 35,901 |
| | | | | | | | | | | | | | | | | | | | | | | | | | |
Trade receivables, distribution | | 132,358,933 | | 34,283,488 | | 14,405,734 | | 2,533,320 | | 2,252,167 | | 2,871,863 | | 2,167,991 | | 1,442,754 | | 997,126 | | 45,406,618 | | - | | 238,719,994 | | 2,856,125 |
-Mass-market customers | | 105,514,865 | | 24,413,913 | | 9,116,008 | | 1,502,443 | | 739,664 | | 562,527 | | 338,903 | | 700,991 | | 239,222 | | 19,537,967 | | - | | 162,666,503 | | 2,154,988 |
- Large customers | | 25,725,150 | | 8,438,301 | | 3,266,323 | | 681,137 | | 336,747 | | 1,117,152 | | 36,850 | | 98,340 | | 45,797 | | 13,673,554 | | - | | 53,419,351 | | 44,269 |
- Institutional customers | | 1,118,918 | | 1,431,274 | | 2,023,403 | | 349,740 | | 1,175,756 | | 1,192,184 | | 1,792,238 | | 643,423 | | 712,107 | | 12,195,097 | | - | | 22,634,140 | | 656,868 |
Allowance for doubtful accounts | | (145,404) | | (240,905) | | (228,765) | | (136,387) | | (117,416) | | (157,109) | | (100,853) | | (712,740) | | (87,660) | | (24,238,235) | | - | | (26,165,474) | | - |
| | | | | | | | | | | | | | | | | | | | | | | | | | |
Unbilled services | | 97,651,950 | | - | | - | | - | | - | | - | | - | | - | | - | | - | | - | | 97,651,950 | | 141,376 |
Services billed | | 34,706,983 | | 34,283,488 | | 14,405,734 | | 2,533,320 | | 2,252,167 | | 2,871,863 | | 2,167,991 | | 1,442,754 | | 997,126 | | 45,406,618 | | - | | 141,068,044 | | 2,714,749 |
Total Trade Receivables, Gross | | 401,114,021 | | 35,394,440 | | 14,405,933 | | 2,544,979 | | 2,252,342 | | 2,872,208 | | 2,167,993 | | 1,442,766 | | 1,033,292 | | 47,275,524 | | - | | 510,503,498 | | 2,892,026 |
Total Allowance for Doubtful Accounts | | (200,898) | | (240,905) | | (228,765) | | (136,387) | | (117,416) | | (157,109) | | (100,853) | | (712,740) | | (87,660) | | (25,731,934) | | - | | (27,714,667) | | - |
| | | | | | | | | | | | | | | | | | | | | | | | | | |
Total Trade Receivables, Net | | 400,913,123 | | 35,153,535 | | 14,177,168 | | 2,408,592 | | 2,134,926 | | 2,715,099 | | 2,067,140 | | 730,026 | | 945,632 | | 21,543,590 | | - | | 482,788,831 | | 2,892,026 |
· Mass-market customers
· Large customers
· Institutional customers
F-139
| | | | | | | | | | | | | | | | | | | | | | | | | | December 31, 2018 | |
| | December 31, 2016 | | Current
Portfolio | | 1-30 days | | 31-60 days | | 61-90 days | | 91-
120 days | | 121-
150 days | | 151-
180 days | | 181-
210 days | | 211-
250 days | | More than
251 days | | Total
Current
Gross
Portfolio | | Total Non-
Current
Gross
Portfolio | |
Type of Portfolio | | Current Portfolio | | 1-30 days | | 31-60 days | | 61-90 days | | 91-120 days | | 121-150 days | | 151-180 days | | 181-210 days | | 211-250 days | | More than 251 days | | Total Current Gross Portfolio | | Total Non-Current Gross Portfolio | |
| ThCh$ | | ThCh$ | | ThCh$ | | ThCh$ | | ThCh$ | | ThCh$ | | ThCh$ | | ThCh$ | | ThCh$ | | ThCh$ | | ThCh$ | | ThCh$ | | ThCh$ | | ThCh$ | | ThCh$ | | ThCh$ | | ThCh$ | | ThCh$ | | ThCh$ | | ThCh$ | | ThCh$ | | ThCh$ | | ThCh$ | | ThCh$ | |
GENERATION | | | | | | | | | | | | | | | | | | | | | | | | | | | | |
Non-renegotiated portfolio | | 179,498,353 | | 2,770,582 | | 1,165,177 | | 773,502 | | 900,093 | | 5,101,117 | | 13,609 | | 553,986 | | 3,593,733 | | 20,108,963 | | 214,479,115 | | 5,751,509 | | 206,862,868 | | 1,155,988 | | 1,453,308 | | 708,552 | | 203,487 | | 7,836 | | 39,787 | | 483,751 | | 153,929 | | 6,715,665 | | 217,785,171 | | — | |
- Large customers | | 179,482,501 | | 2,770,582 | | 1,165,177 | | 773,502 | | 900,093 | | 5,101,117 | | 13,609 | | 553,986 | | 3,593,733 | | 20,108,963 | | 214,463,263 | | 5,723,942 | | 198,424,050 | | 671,037 | | 248,135 | | 140,571 | | 224 | | 7,274 | | 39,001 | | 43,681 | | 56,046 | | 5,835,279 | | 205,465,298 | | — | |
- Institutional customers | | - | | - | | - | | - | | - | | - | | - | | - | | - | | - | | - | | - | | — | | — | | — | | — | | — | | — | | — | | — | | — | | — | | — | | — | |
- Others | | 15,852 | | - | | - | | - | | - | | - | | - | | - | | - | | - | | 15,852 | | 27,567 | | 8,438,818 | | 484,951 | | 1,205,173 | | 567,981 | | 203,263 | | 562 | | 786 | | 440,070 | | 97,883 | | 880,386 | | 12,319,873 | | — | |
Renegotiated portfolio | | - | | - | | - | | - | | - | | - | | - | | - | | - | | - | | - | | - | | 30,167 | | — | | — | | — | | — | | — | | — | | — | | — | | — | | 30,167 | | 21,255 | |
- Large customers | | - | | - | | - | | - | | - | | - | | - | | - | | - | | - | | - | | - | | — | | — | | — | | — | | — | | — | | — | | — | | — | | — | | — | | — | |
- Institutional customers | | - | | - | | - | | - | | - | | - | | - | | - | | - | | - | | - | | - | | — | | — | | — | | — | | — | | — | | — | | — | | — | | — | | — | | — | |
- Others | | - | | - | | - | | - | | - | | - | | - | | - | | - | | - | | - | | - | | 30,167 | | — | | — | | — | | — | | — | | — | | — | | — | | — | | 30,167 | | 21,255 | |
DISTRIBUTION | | | | | | | | | | | | | | | | | | | | | | | | | | | | |
Non-renegotiated portfolio | | 96,922,455 | | 27,397,380 | | 11,558,893 | | 3,040,431 | | 1,078,799 | | 651,903 | | 2,402,146 | | 1,462,458 | | 569,329 | | 39,114,907 | | 184,198,701 | | 755,931 | | 146,934,065 | | 24,738,695 | | 6,411,330 | | 3,118,630 | | 1,803,734 | | 1,259,159 | | 1,657,934 | | 962,658 | | 2,618,954 | | 40,492,377 | | 229,997,536 | | 116,198 | |
-Mass-market customers | | 71,334,454 | | 20,155,266 | | 8,134,561 | | 1,532,106 | | 575,781 | | 410,789 | | 377,710 | | 670,102 | | 265,574 | | 20,582,480 | | 124,038,823 | | 721,329 | |
- Mass-market customers | | | 101,990,338 | | 16,096,927 | | 3,374,622 | | 1,306,937 | | 987,071 | | 716,568 | | 577,969 | | 449,428 | | 2,105,275 | | 25,035,379 | | 152,640,514 | | 116,198 | |
- Large customers | | 23,376,286 | | 6,499,554 | | 2,148,243 | | 1,231,708 | | 209,825 | | 146,867 | | 1,174,012 | | 46,128 | | 2,424 | | 10,921,775 | | 45,756,822 | | 34,602 | | 38,401,049 | | 6,873,601 | | 1,662,570 | | 1,225,278 | | 102,522 | | 475 | | 918,487 | | 124,385 | | 164,424 | | 7,898,789 | | 57,371,580 | | — | |
- Institutional customers | | 2,211,715 | | 742,560 | | 1,276,089 | | 276,617 | | 293,193 | | 94,247 | | 850,424 | | 746,228 | | 301,331 | | 7,610,652 | | 14,403,056 | | - | | 6,542,678 | | 1,768,167 | | 1,374,138 | | 586,415 | | 714,141 | | 542,116 | | 161,478 | | 388,845 | | 349,255 | | 7,558,209 | | 19,985,442 | | — | |
Renegotiated portfolio | | 3,987,901 | | 3,951,138 | | 1,756,446 | | 448,919 | | 286,640 | | 230,854 | | 525,184 | | 109,839 | | 83,669 | | 4,125,709 | | 15,506,299 | | 1,862,438 | | 7,140,852 | | 626,151 | | 201,124 | | 120,204 | | 89,226 | | 134,003 | | 247,970 | | 82,080 | | 90,619 | | 508,514 | | 9,240,743 | | 1,909,392 | |
-Mass-market customers | | 3,401,264 | | 3,163,614 | | 1,423,727 | | 448,919 | | 286,290 | | 204,870 | | 157,086 | | 109,839 | | 81,824 | | 4,110,488 | | 13,387,921 | | 1,443,601 | |
- Mass-market customers | | | 6,962,383 | | 564,903 | | 197,048 | | 120,204 | | 89,217 | | 134,003 | | 137,205 | | 82,080 | | 90,619 | | 460,914 | | 8,838,576 | | 1,884,757 | |
- Large Customers | | 210,068 | | 67,366 | | - | | - | | - | | 25,984 | | - | | - | | - | | - | | 303,418 | | - | | 128,817 | | 51,148 | | — | | — | | — | | — | | — | | — | | — | | 46,775 | | 226,740 | | 24,635 | |
- Institutional Customers | | 376,569 | | 720,158 | | 332,719 | | - | | 350 | | - | | 368,098 | | - | | 1,845 | | 15,221 | | 1,814,960 | | 418,837 | | 49,652 | | 10,100 | | 4,076 | | — | | 9 | | — | | 110,765 | | — | | — | | 825 | | 175,427 | | — | |
| | | | | | | | | | | | | | | | | | | | | | | | | | | | |
Total Gross Portfolio | | 280,408,709 | | 34,119,100 | | 14,480,516 | | 4,262,852 | | 2,265,532 | | 5,983,874 | | 2,940,939 | | 2,126,283 | | 4,246,731 | | 63,349,579 | | 414,184,115 | | 8,369,878 | | 360,967,952 | | 26,520,834 | | 8,065,762 | | 3,947,386 | | 2,096,447 | | 1,400,998 | | 1,945,691 | | 1,528,489 | | 2,863,502 | | 47,716,556 | | 457,053,617 | | 2,046,845 | |
| | December 31, 2017 | |
| | Current
Portfolio | | 1-30 days | | 31-60 days | | 61-90 days | | 91-
120 days | | 121-
150 days | | 151-
180 days | | 181-
210 days | | 211-
250 days | | More than
251 days | | Total
Current
Gross
Portfolio | | Total Non-
Current
Gross
Portfolio | |
Type of Portfolio | | ThCh$ | | ThCh$ | | ThCh$ | | ThCh$ | | ThCh$ | | ThCh$ | | ThCh$ | | ThCh$ | | ThCh$ | | ThCh$ | | ThCh$ | | ThCh$ | |
GENERATION | | | | | | | | | | | | | | | | | | | | | | | | | |
Non-renegotiated portfolio | | 186,724,468 | | 3,057,994 | | 333,079 | | 279,100 | | 10,021 | | 42,015 | | 334,298 | | 399,552 | | 228,498 | | 4,116,040 | | 195,525,065 | | — | |
- Large customers | | 186,724,468 | | 3,057,994 | | 333,079 | | 279,100 | | 10,021 | | 42,015 | | 334,298 | | 399,552 | | 228,498 | | 4,116,040 | | 195,525,065 | | — | |
- Institutional customers | | — | | — | | — | | — | | — | | — | | — | | — | | — | | — | | — | | — | |
- Others | | — | | — | | — | | — | | — | | — | | — | | — | | — | | — | | — | | — | |
Renegotiated portfolio | | 45,285 | | — | | — | | — | | — | | — | | — | | — | | — | | — | | 45,285 | | 62,563 | |
- Large customers | | — | | — | | — | | — | | — | | — | | — | | — | | — | | — | | — | | — | |
- Institutional customers | | — | | — | | — | | — | | — | | — | | — | | — | | — | | — | | — | | — | |
- Others | | 45,285 | | — | | — | | — | | — | | — | | — | | — | | — | | — | | 45,285 | | 62,563 | |
DISTRIBUTION | | | | | | | | | | | | | | | | | | | | | | | | | |
Non-renegotiated portfolio | | 101,580,927 | | 27,144,334 | | 15,240,414 | | 2,949,158 | | 1,807,065 | | 4,174,604 | | 2,192,656 | | 1,727,453 | | 1,371,073 | | 44,191,184 | | 202,378,868 | | 376,463 | |
- Mass-market customers | | 81,786,896 | | 19,120,060 | | 9,323,291 | | 1,705,992 | | 1,285,659 | | 882,926 | | 671,894 | | 1,554,175 | | 423,730 | | 20,987,147 | | 137,741,770 | | 342,063 | |
- Large customers | | 17,522,970 | | 6,565,888 | | 4,590,254 | | 940,754 | | 168,838 | | 1,809,919 | | 357,379 | | 30,481 | | 7,237 | | 13,521,914 | | 45,515,634 | | — | |
- Institutional customers | | 2,271,061 | | 1,458,386 | | 1,326,869 | | 302,412 | | 352,568 | | 1,481,759 | | 1,163,383 | | 142,797 | | 940,106 | | 9,682,123 | | 19,121,464 | | 34,400 | |
Renegotiated portfolio | | 3,067,148 | | 3,428,065 | | 1,933,127 | | 767,886 | | 372,319 | | 348,718 | | 334,627 | | 343,968 | | 197,387 | | 6,297,059 | | 17,090,304 | | 1,478,802 | |
- Mass-market customers | | 2,804,920 | | 3,027,945 | | 1,376,659 | | 558,635 | | 372,319 | | 348,718 | | 246,463 | | 146,430 | | 143,422 | | 6,163,350 | | 15,188,861 | | 1,439,358 | |
- Large Customers | | 248,972 | | — | | 397,617 | | — | | — | | — | | — | | — | | — | | 106,433 | | 753,022 | | — | |
- Institutional Customers | | 13,256 | | 400,120 | | 158,851 | | 209,251 | | — | | — | | 88,164 | | 197,538 | | 53,965 | | 27,276 | | 1,148,421 | | 39,444 | |
| | | | | | | | | | | | | | | | | | | | | | | | | |
Total Gross Portfolio | | 291,372,543 | | 33,630,393 | | 17,506,620 | | 3,996,144 | | 2,189,405 | | 4,565,337 | | 2,861,581 | | 2,470,973 | | 1,796,958 | | 54,604,283 | | 415,039,522 | | 1,917,828 | |
F-140
Table of Contents
| | December 31, 2015 |
Type of Portfolio | | Current Portfolio | | 1-30 days | | 31-60 days | | 61-90 days | | 91-120 days | | 121-150 days | | 151-180 days | | 181-210 days | | 211-250 days | | More than 251 days | | Total Current Gross Portfolio | | Total Non-Current Gross Portfolio |
| ThCh$ | | ThCh$ | | ThCh$ | | ThCh$ | | ThCh$ | | ThCh$ | | ThCh$ | | ThCh$ | | ThCh$ | | ThCh$ | | ThCh$ | | ThCh$ |
GENERATION | | | | | | | | | | | | | | | | | | | | | | | | |
Non-renegotiated portfolio | | 268,755,088 | | 1,110,952 | | 199 | | 11,659 | | 175 | | 345 | | 2 | | 12 | | 36,166 | | 1,868,906 | | 271,783,504 | | 35,901 |
- Large customers | | 268,735,519 | | 1,110,952 | | 199 | | 11,659 | | 175 | | 345 | | 2 | | 12 | | 36,166 | | 1,868,906 | | 271,763,935 | | |
- Institutional customers | | - | | - | | - | | - | | - | | - | | - | | - | | - | | - | | - | | |
- Others | | 19,569 | | - | | - | | - | | - | | - | | - | | - | | - | | - | | 19,569 | | 35,901 |
Renegotiated portfolio | | - | | - | | - | | - | | - | | - | | - | | - | | - | | - | | - | | |
- Large customers | | - | | - | | - | | - | | - | | - | | - | | - | | - | | - | | - | | |
- Institutional customers | | - | | - | | - | | - | | - | | - | | - | | - | | - | | - | | - | | |
- Others | | - | | - | | - | | - | | - | | - | | - | | - | | - | | - | | - | | |
DISTRIBUTION | | | | | | | | | | | | | | | | | | | | | | | | |
Non-renegotiated portfolio | | 128,877,232 | | 30,804,063 | | 11,583,924 | | 2,119,092 | | 1,998,287 | | 2,660,733 | | 2,055,026 | | 1,369,523 | | 916,215 | | 42,928,648 | | 225,312,743 | | 590,143 |
-Mass-market customers | | 101,838,550 | | 20,997,170 | | 7,650,851 | | 1,088,488 | | 486,054 | | 353,194 | | 225,938 | | 627,942 | | 158,685 | | 17,414,188 | | 150,841,060 | | 499,328 |
- Large customers | | 25,311,864 | | 8,377,250 | | 3,250,212 | | 681,137 | | 336,747 | | 1,117,152 | | 36,850 | | 98,340 | | 45,797 | | 13,673,554 | | 52,928,903 | | 44,269 |
- Institutional customers | | 1,726,818 | | 1,429,643 | | 682,861 | | 349,467 | | 1,175,486 | | 1,190,387 | | 1,792,238 | | 643,241 | | 711,733 | | 11,840,906 | | 21,542,780 | | 46,546 |
Renegotiated portfolio | | 3,481,701 | | 3,479,425 | | 2,821,810 | | 414,228 | | 253,880 | | 211,130 | | 112,965 | | 73,231 | | 80,911 | | 2,477,970 | | 13,407,251 | | 2,265,982 |
-Mass-market customers | | 3,676,315 | | 3,416,743 | | 1,465,157 | | 413,955 | | 253,611 | | 209,333 | | 112,965 | | 73,048 | | 80,537 | | 2,123,778 | | 11,825,442 | | 1,655,660 |
- Large Customers | | 413,286 | | 61,052 | | 16,111 | | - | | - | | - | | - | | - | | - | | - | | 490,449 | | - |
- Institutional Customers | | (607,900) | | 1,630 | | 1,340,542 | | 273 | | 269 | | 1,797 | | - | | 183 | | 374 | | 354,192 | | 1,091,360 | | 610,322 |
| | | | | | | | | | | | | | | | | | | | | | | | |
Total Gross Portfolio | | 401,114,021 | | 35,394,440 | | 14,405,933 | | 2,544,979 | | 2,252,342 | | 2,872,208 | | 2,167,993 | | 1,442,766 | | 1,033,292 | | 47,275,524 | | 510,503,498 | | 2,892,026 |
APPENDIX 6.22.2 ESTIMATED SALES AND PURCHASES OF ENERGY AND CAPACITY:
This appendix forms an integral part of the Group’sthese consolidated financial statements.
| | 12-31-2016 | | 12-31-2015 | | 12-31-2018 | | 12-31-2017 | |
BALANCE | | Energy and Tolls | | Capacity | | Energy and Tolls | | Capacity | |
| ThCh$ | | ThCh$ | | ThCh$ | | ThCh$ | |
| | | Energy and Capacity | | Tolls | | Energy and Capacity | | Tolls | |
STATEMENT OF FINANCIAL POSITION | | | ThCh$ | | ThCh$ | | ThCh$ | | ThCh$ | |
Current accounts receivable from related companies | | 590,636 | | 21,774 | | 609,558 | | 453,635 | | — | | — | | 5,518,711 | | 466,031 | |
Trade and other current receivables | | 168,833,728 | | 23,276,222 | | 216,299,319 | | 34,232,853 | | 209,288,934 | | 46,336,070 | | 177,886,960 | | 48,122,678 | |
Total Estimated Assets | | 169,424,364 | | 23,297,996 | | 216,908,877 | | 34,686,488 | | 209,288,934 | | 46,336,070 | | 183,405,671 | | 48,588,709 | |
Current accounts payable to related companies | | 13,459,812 | | 191,936 | | 4,483,837 | | 365,221 | | — | | — | | 21,818,299 | | 177,839 | |
Trade and other current payables | | 85,425,025 | | 42,571,883 | | 97,438,789 | | 43,570,267 | | 106,633,306 | | 37,530,511 | | 120,451,406 | | 47,893,119 | |
Total Estimated Liabilities | | 98,884,837 | | 42,763,819 | | 101,922,626 | | 43,935,488 | | 106,633,306 | | 37,530,511 | | 142,269,705 | | 48,070,958 | |
| | 12-31-2016 | | 12-31-2015 | | 12-31-2014 | | 12-31-2018 | | 12-31-2017 | | 12-31-2016 | |
INCOME STATEMENT | | Energy and Tolls | | Capacity | | Energy and Tolls | | Capacity | | Energy and Tolls | | Capacity | |
| | Energy and Capacity | | Tolls | | Energy and Capacity | | Tolls | | Energy and Tolls | | Capacity | |
INCOME STATEMENT | | ThCh$ | | ThCh$ | | ThCh$ | | ThCh$ | | ThCh$ | | ThCh$ | | ThCh$ | | ThCh$ | | ThCh$ | | ThCh$ | | ThCh$ | | ThCh$ | |
| 169,424,364 | | 23,297,996 | | 216,908,877 | | 34,686,488 | | 245,942,416 | | 14,884,597 | | 209,288,934 | | 46,336,070 | | 183,405,671 | | 48,588,709 | | 169,424,364 | | 23,297,996 | |
Energy Purchases | | 98,884,837 | | 42,763,819 | | 101,922,626 | | 43,935,488 | | 77,476,480 | | 26,257,026 | | 106,633,306 | | 37,530,511 | | 142,269,706 | | 48,070,958 | | 98,884,837 | | 42,763,819 | |
F-141
Table of Contents
APPENDIX 73 DETAILS OF DUE DATESDATES OF PAYMENTS TO SUPPLIERS:
This appendix forms an integral part of the Group’sthese consolidated financial statements.
| | December 31, 2016 | | December 31, 2015 | | December 31, 2018 | | December 31, 2017 | |
Suppliers with Current Payments | | Goods | | Services | | Other | | Total | | Goods | | Services | | Other | | Total | |
| | Goods | | Services | | Other | | Total | | Goods | | Services | | Other | | Total | |
Suppliers with Current Payments | | ThCh$ | | ThCh$ | | ThCh$ | | ThCh$ | | ThCh$ | | ThCh$ | | ThCh$ | | ThCh$ | | ThCh$ | | ThCh$ | | ThCh$ | | ThCh$ | | ThCh$ | | ThCh$ | | ThCh$ | | ThCh$ | |
| - | | 90,386,018 | | 68,377,696 | | 158,763,714 | | - | | 122,490,301 | | 82,005,689 | | 204,495,990 | | 45,355,153 | | 230,133,777 | | 78,973,248 | | 354,462,178 | | 71,248,286 | | 264,992,418 | | 91,209,336 | | 427,450,040 | |
From 31 to 60 days | | - | | - | | - | | - | | - | | - | | - | | - | | 4,284,025 | | 19,179,502 | | 71,745,150 | | 95,208,677 | | — | | — | | — | | — | |
From 61 to 90 days | | - | | - | | - | | - | | - | | - | | - | | - | | 16,452,406 | | — | | — | | 16,452,406 | | — | | — | | — | | — | |
From 91 to 120 days | | - | | - | | - | | - | | - | | - | | - | | - | | — | | — | | — | | — | | — | | — | | — | | — | |
From 121 to 365 days | | - | | - | | - | | - | | - | | - | | - | | - | | — | | — | | — | | — | | — | | — | | — | | — | |
More than 365 days | | - | | - | | - | | - | | - | | - | | - | | - | | — | | 6,766 | | 2,106,099 | | 2,112,865 | | — | | 4,485 | | — | | 4,485 | |
Total | | - | | 90,386,018 | | 68,377,696 | | 158,763,714 | | - | | 122,490,301 | | 82,005,689 | | 204,495,990 | | 66,091,584 | | 249,320,045 | | 152,824,497 | | 468,236,126 | | 71,248,286 | | 264,996,903 | | 91,209,336 | | 427,454,525 | |
The accompanying notes are an integral part of these consolidated financial statementsF-142
F-111