|
|
|
|
| For the Year Ended December 31, |
| |||||||||||||
| 2020 |
| 2019 (3) |
| 2018 (2) |
| 2017 |
| 2016 |
| |||||
| (in US$ thousands, except for earnings per share) |
| |||||||||||||
Income Statement Data: |
|
|
|
|
|
|
|
|
|
|
|
|
|
|
|
Revenue | $ | 313,564 |
| $ | 338,160 |
| $ | 425,940 |
| $ | 425,215 |
| $ | 384,565 |
|
Costs of sales |
| (279,686 | ) |
| (313,373 | ) |
| (389,692 | ) |
| (385,527 | ) |
| (352,957 | ) |
Gross profit |
| 33,878 |
|
| 24,787 |
|
| 36,248 |
|
| 39,688 |
|
| 31,608 |
|
Other operating income |
| 814 |
|
| 385 |
|
| 805 |
|
| 5,084 |
|
| 5,441 |
|
Selling, general & administrative expenses |
| (27,006 | ) |
| (25,051 | ) |
| (26,924 | ) |
| (27,248 | ) |
| (26,325 | ) |
Other operating expenses |
| (129 | ) |
| (770 | ) |
| (1,445 | ) |
| (909 | ) |
| (3,386 | ) |
Operating profit/(loss) |
| 7,557 |
|
| (649 | ) |
| 8,684 |
|
| 16,615 |
|
| 7,338 |
|
Finance costs |
| (744 | ) |
| (1,012 | ) |
| (1,378 | ) |
| (1,221 | ) |
| (1,147 | ) |
Finance income |
| 320 |
|
| 506 |
|
| 482 |
|
| 876 |
|
| 1,045 |
|
Share of loss of associates |
| (1 | ) |
| (3 | ) |
| (3 | ) |
| (3 | ) |
| (710 | ) |
Impairment of investment in associates |
| — |
|
| — |
|
| — |
|
| — |
|
| (126 | ) |
Loss on liquidation of a subsidiary |
| — |
|
| — |
|
| — |
|
| (261 | ) |
| — |
|
Exchange (loss)/gain |
| (579 | ) |
| 1,550 |
|
| 1,741 |
|
| 2,784 |
|
| (38 | ) |
Other income |
| 1,173 |
|
| 717 |
|
| 1,817 |
|
| 214 |
|
| 267 |
|
Other expense |
| (1 | ) |
| (3 | ) |
| (11 | ) |
| (336 | ) |
| (94 | ) |
Profit before taxes |
| 7,725 |
|
| 1,106 |
|
| 11,332 |
|
| 18,668 |
|
| 6,535 |
|
Income taxes expense |
| (4,016 | ) |
| (2,057 | ) |
| (3,886 | ) |
| (5,140 | ) |
| (510 | ) |
Profit/(Loss) for the year | $ | 3,709 |
| $ | (951 | ) | $ | 7,446 |
| $ | 13,528 |
| $ | 6,025 |
|
Attributable to: |
|
|
|
|
|
|
|
|
|
|
|
|
|
|
|
Equity holders of APWC | $ | (552 | ) | $ | (1,632 | ) | $ | 2,928 |
| $ | 8,720 |
| $ | 2,853 |
|
Non-controlling interests | $ | 4,261 |
| $ | 681 |
| $ | 4,518 |
| $ | 4,808 |
| $ | 3,172 |
|
Earnings per share (1) |
|
|
|
|
|
|
|
|
|
|
|
|
|
|
|
Basic and diluted (loss)/profit for the year attributable to equity holders of the parent | $ | (0.04 | ) | $ | (0.12 | ) | $ | 0.21 |
| $ | 0.63 |
| $ | 0.21 |
|
5
| As of December 31, |
| |||||||||||||
| 2020 |
| 2019 (3) |
| 2018 (2) |
| 2017 |
| 2016 |
| |||||
| (in US$ thousands) |
| |||||||||||||
Balance Sheet Data: |
|
|
|
|
|
|
|
|
|
|
|
|
|
|
|
Cash and cash equivalents | $ | 52,237 |
| $ | 53,673 |
| $ | 60,778 |
| $ | 46,093 |
| $ | 48,231 |
|
Working capital |
| 180,323 |
|
| 185,855 |
|
| 182,410 |
|
| 181,752 |
|
| 157,012 |
|
Total assets |
| 338,119 |
|
| 298,911 |
|
| 305,798 |
|
| 334,843 |
|
| 293,596 |
|
Total debts |
| 13,781 |
|
| 11,356 |
|
| 24,814 |
|
| 42,688 |
|
| 29,762 |
|
Net assets |
| 234,875 |
|
| 228,435 |
|
| 221,816 |
|
| 222,826 |
|
| 197,175 |
|
Capital stock |
| 138 |
|
| 138 |
|
| 138 |
|
| 138 |
|
| 138 |
|
Total APWC shareholders’ equity |
| 157,860 |
|
| 153,854 |
|
| 150,028 |
|
| 153,328 |
|
| 135,950 |
|
|
| ||||||||||||||||||||||||||||||||||||||||||||||||||||||||||||||||||||||||||||||||||||||||||||||||||||||||||||||||||||||||||||||||||||||||||||||||||||||||||||||||||||||||||||||||||||||||||||||||||||||||||||||||||||||||||||||||||||||||||||||||||||||||||||||||||||||||||||||||||||||||||||||||||||||||||||||||||||||||||||||||||||||||||||||||||||||||||||||||||||||||||||||||||||||||||||||||||||||||||||||||||||||||||||||||||||||||||||||||||||||||||||||||||||||||||||||||||||||||||||||||||||||||||||||||||||||||||||||||||||||||||||||||||||||||||||||||||||||||||||||||||||||||||||||||||||||||||||||||||||||||||||||||||||||||||||||||||||||||||||||||||||||||||||||||||||||||||||||||||||||||||||||||||||||||||||||||||||||||||||||||||||||||||||||||||||||||||||||||||||||||||||||||||||||||||||||||||||||||||||||||||||||||||||||||||||||||||||||||||||||||||||||||||||||||||||||||||||||||||||||||||||||||||||||||||||||||||||||||||||||||||||||||||||||||||||||||||||||||||||||||||||||||||||||||||||||||||||||||||||||
|
|
|
|
Exchange Rate Information
Unless otherwise noted, for the convenienceyear ended December 31, 2023. For the year ended December 31, 2022, it was based on 20,020,364 basic and diluted weighted Common Shares issued and outstanding; and was based on 13,819,669 basic and diluted weighted Common Shares issued and outstanding for each of the reader, translations of amounts from Baht, Singapore dollars, Renminbi and Australian dollars to U.S. dollars have been made at the respective noon buying rates in New York City for cable transfers in those currencies as certified for customs purposes by the Federal Reserve Bank of New York (the “Noon Buying Rate”) onyear ended December 31, 2020. The respective Noon Buying Rates on December 31,2021, 2020, were US$ 1.00 = Bt 30.02; S$ 1.321; RMB 6.525; and A$ 1.297. The respective Noon Buying Rates on March 31, 2021,2019.
Sources: Federal Reserve Bulletin, Board of Governorsimpact of the Federal Reserve System. Federal Reserve Statistical Release H.10, from the websiteapplication of the Board of Governors of the Federal Reserve System at http://www.federalreserve.gov.
Thailand
The Thai Baht is convertible into foreign currenciesIFRS 16.
Year Ended December 31, | At Period End |
| Average(1) |
| High |
| Low |
| ||||
| (Bt per $1.00) |
| ||||||||||
2016 |
| 35.81 |
|
| 35.22 |
|
| 36.33 |
|
| 34.54 |
|
2017 |
| 32.56 |
|
| 33.75 |
|
| 35.89 |
|
| 32.49 |
|
2018 |
| 32.31 |
|
| 32.27 |
|
| 33.44 |
|
| 31.11 |
|
2019 |
| 29.75 |
|
| 30.89 |
|
| 32.26 |
|
| 29.75 |
|
2020 |
| 30.02 |
|
| 31.32 |
|
| 33.04 |
|
| 29.79 |
|
|
|
6
The high and low exchange rates for the six months preceding the date of this Annual Report were:
Month | High |
| Low |
| ||
October 2020 |
| 31.56 |
|
| 31.02 |
|
November 2020 |
| 31.13 |
|
| 30.18 |
|
December 2020 |
| 30.27 |
|
| 29.79 |
|
January 2021 |
| 30.14 |
|
| 29.89 |
|
February 2021 |
| 30.46 |
|
| 29.86 |
|
March 2021 |
| 31.30 |
|
| 30.21 |
|
Sources: Federal Reserve Bulletin, Board of Governors of the Federal Reserve System. Federal Reserve Statistical Release H.10, from the website of the Board of Governors of the Federal Reserve System at http://www.federalreserve.gov.
Singapore
The Singapore dollar is convertible into foreign currencies and floats against a trade-weighted basket of foreign currencies, the composition of which is not made public by Singapore’s central bank, the Monetary Authority of Singapore, but of which the U.S. dollar is a component. The following tables set forth, for the periods indicated, certain information concerning the Noon Buying Rate of the Singapore dollar. No representation is made that the Singapore dollar or U.S. dollar amounts referred to herein could have been or could be converted into U.S. dollars or Singapore dollars, as the case may be, at any particular rate or at all.
Year Ended December 31, | At Period End |
| Average(1) |
| High |
| Low |
| ||||
| (S$ per $1.00) |
| ||||||||||
2016 |
| 1.447 |
|
| 1.382 |
|
| 1.452 |
|
| 1.337 |
|
2017 |
| 1.336 |
|
| 1.373 |
|
| 1.450 |
|
| 1.336 |
|
2018 |
| 1.362 |
|
| 1.350 |
|
| 1.384 |
|
| 1.304 |
|
2019 |
| 1.345 |
|
| 1.363 |
|
| 1.391 |
|
| 1.345 |
|
2020 |
| 1.321 |
|
| 1.337 |
|
| 1.461 |
|
| 1.321 |
|
|
|
The high and low exchange rates for the six months preceding the date of this Annual Report were:
Month | High |
| Low |
| ||
October 2020 |
| 1.368 |
|
| 1.353 |
|
November 2020 |
| 1.366 |
|
| 1.340 |
|
December 2020 |
| 1.338 |
|
| 1.321 |
|
January 2021 |
| 1.329 |
|
| 1.318 |
|
February 2021 |
| 1.337 |
|
| 1.320 |
|
March 2021 |
| 1.350 |
|
| 1.329 |
|
Sources: Federal Reserve Bulletin, Board of Governors of the Federal Reserve System. Federal Reserve Statistical Release H.10, from the website of the Board of Governors of the Federal Reserve System at http://www.federalreserve.gov.
7
China
The PRC government imposes control over its foreign currency reserves in part through direct regulation of the conversion of Renminbi into foreign currencies, including the conversion rate limitations on capital transfers and through restrictions on foreign trade and other regulatory impediments to the free transferability of capital. The following tables set forth, for the periods indicated, certain information concerning the Noon Buying Rate of the Renminbi. No representation is made that the Renminbi or U.S. dollar amounts referred to herein could have been or could be converted into U.S. dollars or Renminbi, as the case may be, at any particular rate or at all.
Year Ended December 31, | At Period End |
| Average(1) |
| High |
| Low |
| ||||
| (RMB per $1.00) |
| ||||||||||
2016 |
| 6.943 |
|
| 6.655 |
|
| 6.958 |
|
| 6.448 |
|
2017 |
| 6.506 |
|
| 6.735 |
|
| 6.958 |
|
| 6.477 |
|
2018 |
| 6.876 |
|
| 6.629 |
|
| 6.974 |
|
| 6.265 |
|
2019 |
| 6.962 |
|
| 6.901 |
|
| 7.179 |
|
| 6.682 |
|
2020 |
| 6.525 |
|
| 6.888 |
|
| 7.168 |
|
| 6.521 |
|
|
|
The high and low exchange rates for the six months preceding the date of this Annual Report were:
Month | High |
| Low |
| ||
October 2020 |
| 6.790 |
|
| 6.650 |
|
November 2020 |
| 6.690 |
|
| 6.556 |
|
December 2020 |
| 6.571 |
|
| 6.521 |
|
January 2021 |
| 6.482 |
|
| 6.428 |
|
February 2021 |
| 6.487 |
|
| 6.434 |
|
March 2021 |
| 6.572 |
|
| 6.465 |
|
Sources: Federal Reserve Bulletin, Board of Governors of the Federal Reserve System. Federal Reserve Statistical Release H.10, from the website of the Board of Governors of the Federal Reserve System at http://www.federalreserve.gov.
Australia
The following tables set forth, for the periods indicated, certain information concerning the Noon Buying Rate of the Australian dollar. No representation is made that the Australian dollar or U.S. dollar amounts referred to herein could have been or could be converted into U.S. dollars or Australian dollars, as the case may be, at any particular rate or at all.
Year Ended December 31, | At Period End |
| Average(1) |
| High |
| Low |
| ||||
| (A$ per $1.00) |
| ||||||||||
2016 |
| 1.383 |
|
| 1.346 |
|
| 1.459 |
|
| 1.279 |
|
2017 |
| 1.280 |
|
| 1.301 |
|
| 1.383 |
|
| 1.239 |
|
2018 |
| 1.419 |
|
| 1.344 |
|
| 1.425 |
|
| 1.234 |
|
2019 |
| 1.423 |
|
| 1.438 |
|
| 1.493 |
|
| 1.373 |
|
2020 |
| 1.297 |
|
| 1.448 |
|
| 1.738 |
|
| 1.297 |
|
|
|
8
The high and low exchange rates for the six months preceding the date of this Annual Report were:
Month | High |
| Low |
| ||
October 2020 |
| 1.427 |
|
| 1.382 |
|
November 2020 |
| 1.419 |
|
| 1.359 |
|
December 2020 |
| 1.360 |
|
| 1.297 |
|
January 2021 |
| 1.306 |
|
| 1.284 |
|
February 2021 |
| 1.318 |
|
| 1.257 |
|
March 2021 |
| 1.321 |
|
| 1.278 |
|
Sources: Federal Reserve Bulletin, Board of Governors of the Federal Reserve System. Federal Reserve Statistical Release H.10, from the website of the Board of Governors of the Federal Reserve System at http://www.federalreserve.gov.
|
|
Not applicable
|
|
Not applicable.
|
|
Risks Relating to Our Business
COVID-19 Could Have a Material Adverse Effect on Our Business, Financial Condition and Results of Operations
The outbreak of the Coronavirus Disease 2019 (“COVID-19”), which has been declared by the World Health Organization to be a “public health emergency of international concern,” has spread across the globe and is impacting worldwide economic activity and financial markets. We are facing significant adverse risks related to the spread of COVID-19, and the recent developments surrounding the global pandemic have had, and are expected to continue to have, significant adverse effects onadversely affect our business, financial condition, results of operations and cash flows. Asflows, and could result in a result,loss of all or part of your investment.
DuePRC can change quickly with little advance notice. Uncertainties exist with respect to the measures institutedinterpretation and implementation of the PRC laws regarding foreign investment, cybersecurity, personal data protection and anti-monopoly, and any change in Chinagovernment interpretation or enforcement could implicate our PRC subsidiaries and have a material adverse effect on us.
which could materially and adversely affect our corporate governance.
The Singapore government implemented a partial lockdown, also known
The impact of COVID-19 is constantly changing. Our operations in Thailand and Australia could be materially and adversely affected if an outbreak recurs in these regions. Although we are monitoring the situation, the extent to which COVID-19 impacts our business will depend on future developments, which are uncertain and unpredictable in nature.
We are facing increased operational challenges as we take measures to support and protect employee health and safety as a result of COVID-19. For example, in order to protect the employees from COVID-19, the Company has taken measures to protect its employees, including temperature checks before entering the workplace, mandatory mask-wearing, social distancing, and work from home. We have also implemented staggered work hours to lower the risk that our employees might get infected on public transportations if they commute during peak hours. In particular, our remote work arrangements, coupled with stay-at-home orders and quarantines, pose challenges to our employees and our IT systems, and the extension of remote work arrangements could increase operational risk, including cyber security and IT systems management risks, and impair our ability to manage our business. The increased operational challenges could have a material and adverse effect on our business, financial conditions, and, results of operations.
If COVID-19 continues to adverselyseverity, could materially affect our business, operationsfinancial condition, and financial results the probability of the occurrence of other risks describedoperations.
Risks Relating to Copper
Company’s profitability.
10
periodic intervals to the then net realizable value, which could be below cost. Copper prices have been subject to considerable volatility, and it is not always possible to manage our copper purchases and inventory so as to neutralize the impact of copper price volatility. In addition, an excessive increase in the price of copper could result in fewer orders from customers or increased cost of sales given agreed sales prices, and negatively impact theour Company. Accordingly, significant volatility in copper prices could have a material adverse effect on our business, financial condition and results of operations.
Competition
transmission technologies, such as wireless telecommunications, could materially reduce sales of our telecommunications products.
highly concentrated end markets.
11
PEWC May
Agreement.
our business risks.
Employees’ Unions
Some of APWC’s operating subsidiaries have a large
Employees
retain qualified personnel.
12
Environmental Liabilities
operations.
Cyber security Because there is no unified framework for administering information systems amongst APWC’s subsidiaries, our competitors with a unified framework for administering information systems across their subsidiaries may have a competitive advantage over us and may be able to more efficiently administer such systems and respond to incidents and minimize risk to their business.
13
make any such payment could have a material adverse effect on our liquidity, business, financial condition and results of operations.
In addition our debt agreements contain restrictive covenants and default provisions. Covenants in the agreements governing our existing debt, and debt we may incur in the future, may materially restrict our operations, including our ability to incur debt, pay dividends, make certain investments and payments, and encumber or dispose of assets. In addition, any global economic deterioration may cause us to incur significant net losses or force us to assume considerable liabilities. We cannot assure youmake assurances that we will be able to remain in compliance with our financial covenants, which, as a result, may lead to a default. ThisAny such default may thereby restrict our ability to access unutilized credit facilities or the global capital markets to meet our liquidity needs. Furthermore, a default under any agreementcertain debt agreements by APWC or APWC’s subsidiaries may trigger cross-defaults under our other debt agreements. In the event of default, we may not be able to cure the default or obtain a waiver on a timely basis.waiver. An event of default under any agreement timely governing our existing or future debt, if not cured or timely waived, could have a material adverse effect on our liquidity, business, financial condition and results of operations. Please see Section 5.b.5.B. (“Liquidity and Capital Resources”) of this Annual Report and Note 27(c) of our consolidated financial statements referenced in Item 18 of this Annual Report for a further discussion of our secured and unsecured indebtedness, including with respect to the loan agreement pursuant to which APWC borrowed $6 million from PEWC (which loan is secured by a pledge of APWC’s 98.3% ownership interest inindebtedness.
We Face Uncertainties Relating to the Phasing Out of LIBOR
In July 2017, the U.K. Financial Conduct Authority, which regulates the London interbank offered rate (LIBOR), announced that it intends to phase out LIBOR by the end of 2021. Discontinuation of LIBORfinancial performance and uncertainty as to the nature of such potential changes, alternative reference rates or other reforms may adversely affect the amounts of interest we pay under our debt arrangements and materially adversely affect our business, financial condition and results of operations.
Risks Relating to Our Exposure to Foreign Exchange Fluctuations
condition.
The
14
Impairment Charges
Risks Relating
our operations in Thailand.
Our auditor’ In addition, our Thai operations could be materially adversely impacted if low margin wire and cable manufacturers from China, affiliate, like other independent registered public accounting firm operating in China,including SOEs, were to enter the Thailand market.
Our auditor, the independent registered public accounting firm that issued the audit report included elsewhere in this annual report, as auditor of companies that are traded publiclyenforce agreements in the United StatesPRC with third parties; and firm registered withchanges in policies, laws, rules and regulations in the Public Company Accounting Oversight Board (United States), or PCAOB, isPRC could adversely affect us.
In December 2020, the United States enacted the Holding Foreign Companies Accountable Act (the “HFCAA”). The HFCAA requires that the SEC identify issuers that retain an auditor that has a branch or office that is located in a foreign jurisdiction and that the PCAOB determines it is unable to inspect or investigate completely because of a position taken by an authority in that foreign jurisdiction. Amongst other things, the HFCAA also requires the SEC to prohibit the securities of any issuer from being traded on any of the U.S. national securities exchanges, such as Nasdaq, or on the U.S. “over-the-counter” markets, if the auditor of the issuer’s financial statements is not subject to PCAOB inspections for three consecutive “non-inspection” years after the law became effective.
15
On April 5, 2021, the SEC’s interim final rule to implement the disclosure and submission requirements of the HFCAA was published in the U.S. Federal Register, along with the SEC’s request for public comment on the interim final rule. Regarding how the term “retain” should be interpreted for purposes of determining whether an issuer has retained an auditor that has a branch or office that is located in a foreign jurisdiction and that the PCAOB determines it is unable to inspect or investigate completely because of a position taken by an authority in that foreign jurisdiction, the SEC noted in the interim final rule that the HFCAA does not define the term “retain”, and requested comment on how the term “retain” should be understood for purposes of the HFCAA.
The auditor of our PRC-based subsidiaries is located in the PRC and that auditor is an affiliate of APWC’s Taiwan-based auditor that signs APWC’s audit report. Given the current question as to how “retain” should be understood for purposes of the HFCAA, we cannot assure you that we will not be identified by the SEC as an issuer that has retained an auditor that has a branch or office that is located in a foreign jurisdiction that the PCAOB determines it is unable to inspect or investigate completely because of a position taken by an authority in that foreign jurisdiction as a result of the fact that the auditor of our China affiliates is located in, and organized under the laws of, the PRC. In addition, there can be no assurance that, if we have a “non-inspection” year, we will be able to take remedial measures in response thereto. Given the foregoing, we cannot assure you that we will be able to maintain the listing of the Common Shares on Nasdaq or that you will be allowed to trade the Common Shares in the United States on the “over-the-counter” markets or otherwise. Should the Common Shares not be listed or tradeable in the United States, the value of the Common Shares could be materially affected.
This lack of PCAOB inspections in China prevents the PCAOB from fully evaluating audits and quality control procedures of our independent registered public accounting firm. As a result, we and investors in the Common Shares are deprived of the benefits of such PCAOB inspections. The inability of the PCAOB to conduct inspections of auditors in China makes it more difficult to evaluate the effectiveness of our independent registered public accounting firm’s China affiliate’s audit procedures or quality control procedures as compared to auditor outside of China that are subject to PCAOB inspections, which could cause investors and potential investors in the Common Shares to lose confidence in our audit procedures and reported financial information and the quality of our financial statements.
The PRC Legal System May Limit the Company’s Remedies
China. The PRC legal system is a civil law system based on written statutes. Prior court decisions may be cited for reference but have limited precedential value. Since the late 1970s, the PRC central government has promulgated a comprehensive system of laws, rules and regulations governing economic matters. However, China has not developed a fully integrated legal system. Recentlysystem and enacted laws, rules and regulations may not sufficiently cover all aspects of economic activities or may be subject to a significant degree of interpretation by PRC regulatory agencies and courts
On January 1, 2020, theGovernance.
16
Regulations are relatively new, uncertainties still exist in relation to its interpretation and implementation. The Foreign Investment Law andOld FIL Laws were repealed at the Implementation Regulations may affect our relevant corporate governance practices and increase our compliance costs. For instance,same time the Foreign Investment Law and the Implementation Regulations require thatFIL became effective, foreign-invested enterprises established before the Foreign Investment Law(“
In addition, the Foreign Investment Law and the Implementation Regulations imposedomestic investors alike. The FIL imposes information reporting requirements on foreign investors and foreign-invested enterprises. Any foreign investors or foreign-invested enterprisesFIEs and any found to be non-compliant with these reporting obligations may be subject to fines or administrative liabilities.
business.
operations.
17
unpredictable actions by PRC government officials. For example, APWC’s principal office is located in Taipei, Taiwan, and any escalation in political tensions between the PRC and the government of Taiwan could materially adversely impact our ability to manage our operations in the PRC efficiently or without third party interference. The PRC government has long advocated a one-China policy with regard to the Republic of China. Any overtly aggressive actions by the PRC towards Taiwan could have a materially destabilizing impact on Taiwan generally, and on our business in particular, and could materially and adversely affect our business, financial condition and results of operations.
SOEs have competitive advantages and our business and operations may be materially and adversely affected in the event we must compete with such SOEs.
18
delisted, APWC expects its Common Shares would be quoted on an over-the-counter market. If this were to occur, APWC’s shareholders could face significant material adverse consequences, including the need to receive permission from the BMA to transfer the Common Shares, limited availability of market quotations for the Common Shares and reduced liquidity for the trading of the Common Shares. In addition, APWC could experience a decreased ability to issue additional securities and obtain additional financing in the future.
decrease.
may not be liquid, which could cause volatility and adversely affect our prevailing market price.
19
APWC May Not Be Able
leadership arising from an activist campaign could cause our stock price to experience periods of enhanced volatility or harm our ability to raise capital.
Holding Company Structure; Potential Restrictions
dividends could materially adversely affect our market price.
Corporate Matters; Limited Recourse; Limited Enforceability
Such restrictions on payments involving entities organized in PRC could adversely affect our liquidity, our business results and thus, the price of our Common Shares.
20
The Common Shares currently remain tradedAPWC relies on Nasdaq. However, as APWC has aNasdaq’s controlled company and foreign private issuer exemptions, all of which could materially and adversely affect our corporate governance.
directors could adversely affect our corporate governance.
21
cost-effective control system, misstatements due to error or fraud may occur and not be detected. As a result, even effective internal controls are able to provide only reasonable assurance with respect to the preparation and fair presentation of financial statements. Any failure in our internal control could result in a material adverse effect on our business and a decline of investor confidence in the reliability of our financial statements, which could materially adversely affect the market price of the Common Shares.
financial condition.
International Business Risks
|
|
|
|
22
States is Pacific Holdings Group, with an address at 2901 Dallas Parkway, Suite 360, Plano, Texas 75093.
North Asia in 2023.
The
|
|
|
|
Theour Company is principally engaged in the manufacture and distribution of telecommunications (primarily copper, but also fiber optic),enameled wire, power cable, and enameled wiretelecommunications products in Thailand, Singapore, Australia, PRC, Hong Kong and certain other markets in the Asia Pacific region, primarily in Thailand, China, Singapore and Australia. Theregion. Our Company also provides project engineering services in supply, delivery and installation of power cable (“SDI”). Our Company’s major customers include appliance component manufacturers, electrical contracting firms, state owned entities, wire and cable dealers and factories.
holders of our Common Shares since 2019, APWC’s ability to pay any dividends in the future, as well as to meet its other obligations and to fund operations, depends upon the amount of distributions, if any, received from its direct and indirect operating subsidiaries and other holdings and investments. APWC’s operating subsidiaries and other holdings and investments, from time to time, may be subject to restrictions on their ability to make distributions to APWC, including as a result of restrictive covenants contained in loan agreements, restrictions on the conversion of local currency earnings into U.S. dollars or other hard currency and other regulatory restrictions applicable to the countries in which our subsidiaries are formed and conduct their business. For further discussion of the risks created by these restrictions and limitations, see “Risk Factors-Risks Related to our Financial Activities” and “Risk Factors-Risks Relating to the Regions in which We Operate.”
| Year ended December 31, 2023 | North Asia | Thailand | ROW | Total segments Consolidated | |||||||||||||||||||
| US$’000 | US$’000 | US$’000 | US$’000 | ||||||||||||||||||||
| Revenue from external customers | |||||||||||||||||||||||
| Power | 9 | 80,564 | 140,501 | 221,075 | |||||||||||||||||||
| Enamel | 55,959 | 79,510 | 1,972 | 137,441 | |||||||||||||||||||
| SDI | 2,667 | — | 55,028 | 57,695 | |||||||||||||||||||
| Others* | 14 | 6,851 | 2,697 | 9,562 | |||||||||||||||||||
| 58,649 | 166,925 | 200,198 | 425,772 | ||||||||||||||||||||
| Year ended December 31, 2022 | North Asia | Thailand | ROW | Total segments Consolidated | |||||||||||||||||||
| US$’000 | US$’000 | US$’000 | US$’000 | ||||||||||||||||||||
| Revenue from external customers | |||||||||||||||||||||||
| Power | 92 | 46,340 | 135,739 | 182,171 | |||||||||||||||||||
| Enamel | 76,002 | 102,122 | — | 178,124 | |||||||||||||||||||
| SDI | 1,209 | — | 44,722 | 45,931 | |||||||||||||||||||
| Others* | 26 | 23,379 | 4,262 | 27,667 | |||||||||||||||||||
| 77,329 | 171,841 | 184,723 | 433,893 | ||||||||||||||||||||
| Year ended December 31, 2021 | North Asia | Thailand | ROW | Total segments Consolidated | |||||||||||||||||||
| US$’000 | US$’000 | US$’000 | US$’000 | ||||||||||||||||||||
| Revenue from external customers | |||||||||||||||||||||||
| Power | — | 63,629 | 127,891 | 191,520 | |||||||||||||||||||
| Enamel | 107,027 | 105,749 | — | 212,776 | |||||||||||||||||||
| Fabrication | — | — | 39,476 | 39,476 | |||||||||||||||||||
| Others* | 5 | 28,401 | 4,481 | 32,887 | |||||||||||||||||||
| 107,032 | 197,779 | 171,848 | 476,659 | ||||||||||||||||||||
23
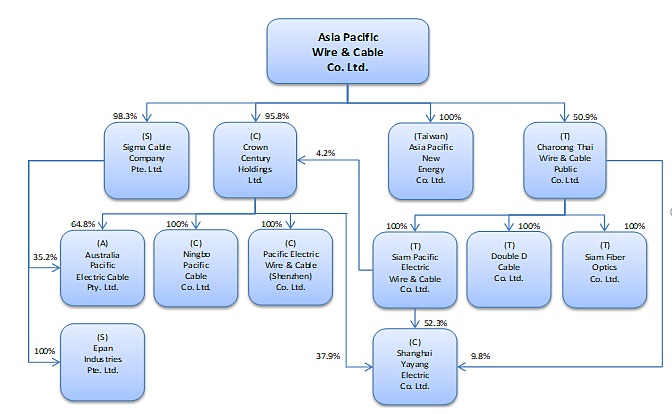
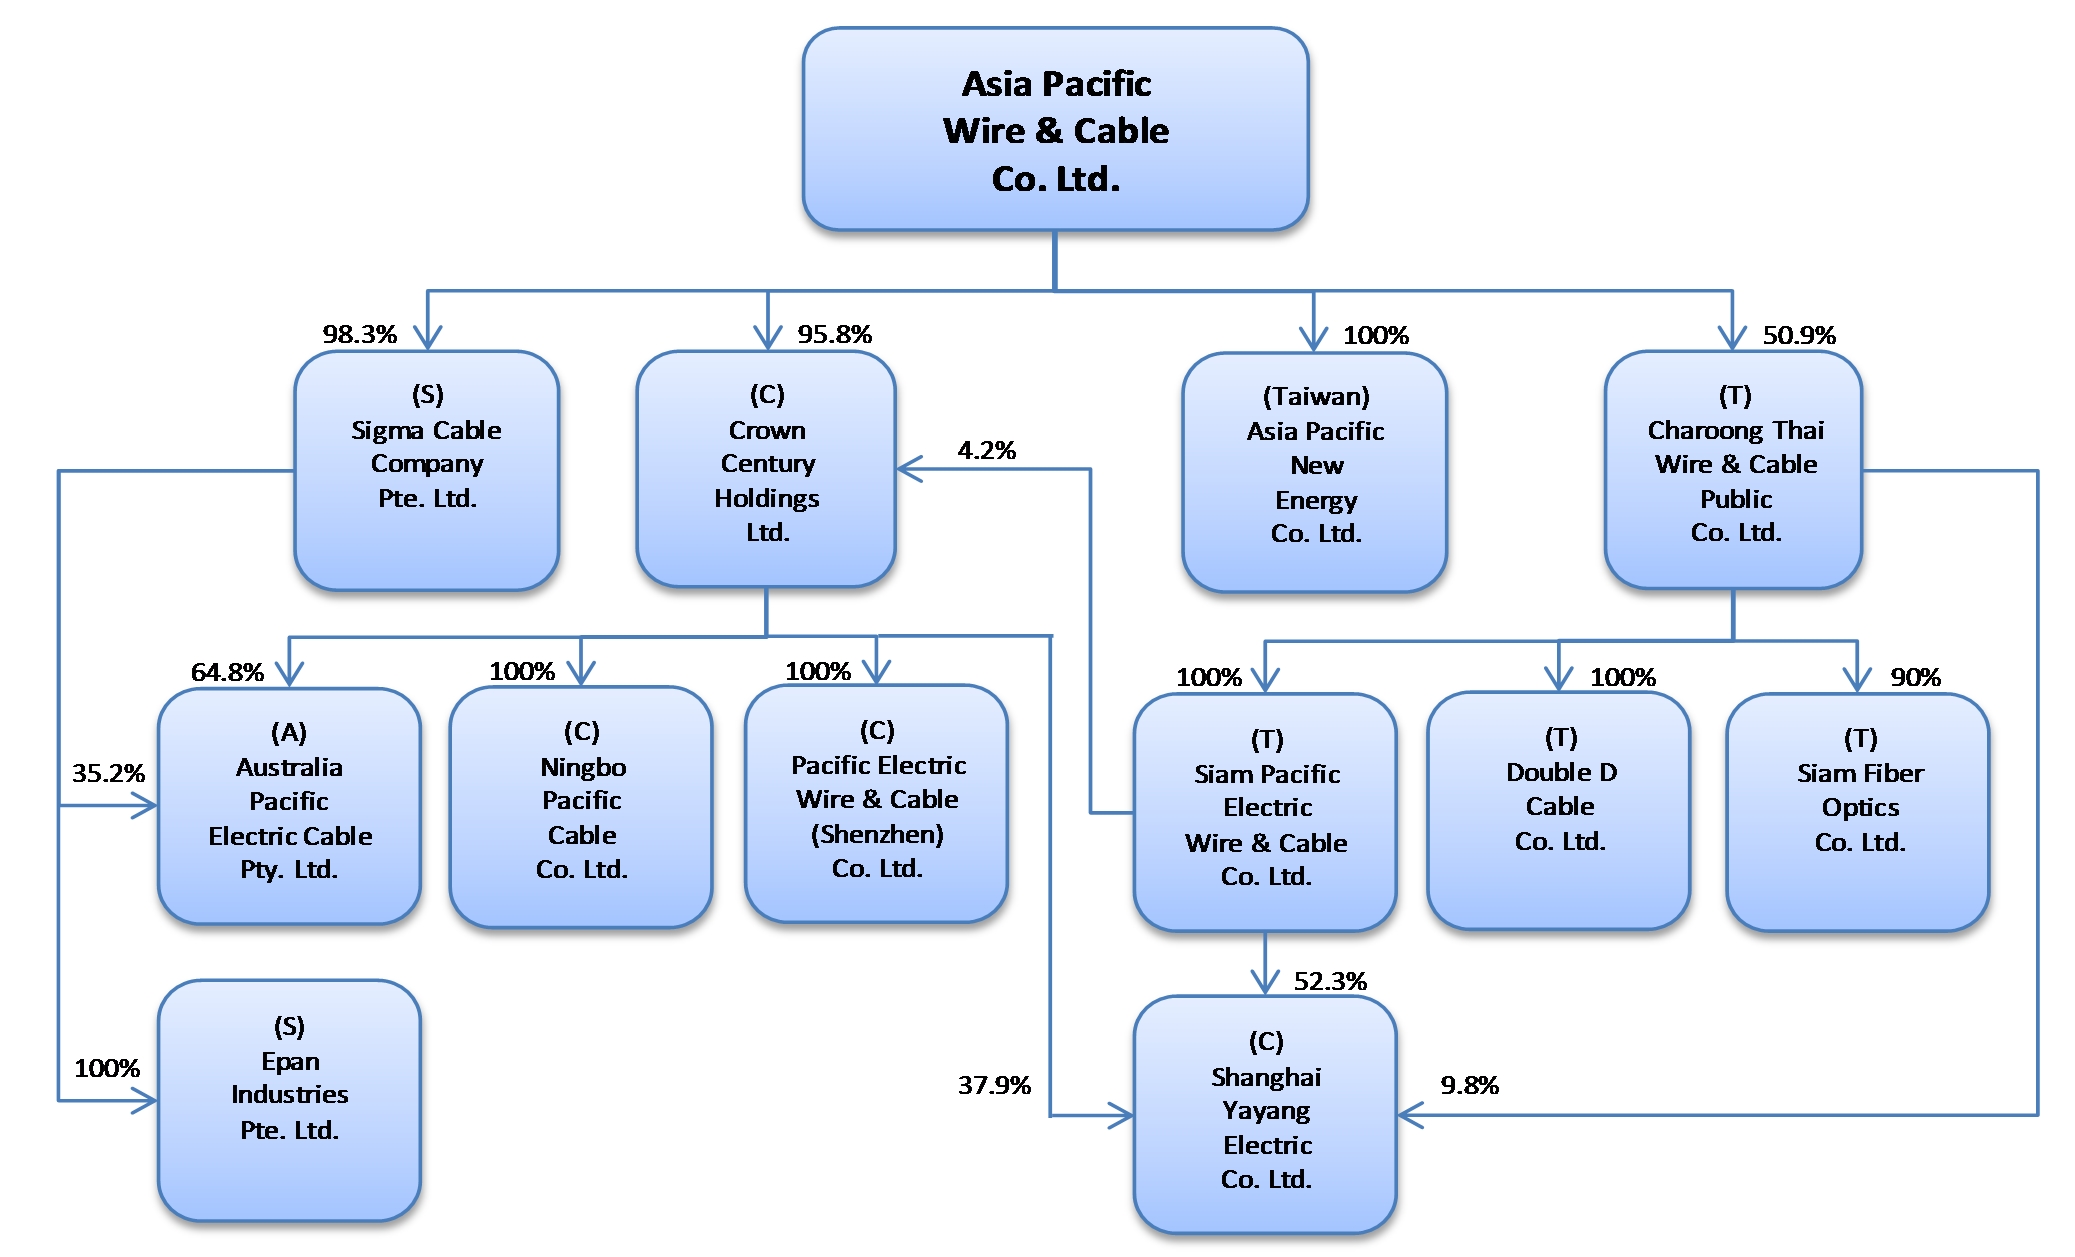
During 2020, the Company’sAPWC has four principal operations in North Asia were conducted through four business entities – subsidiaries:
The Company has an effective holding of 97.93% (including holdings through Siam Pacific) of the capital stock of CCH HK, a Hong Kong registered company, and its wholly-owned subsidiary company, PEWSC. PEWSC manufactures enameled wires for electric, video and audio products for the south China market.
Ningbo is currently a dormant entity. TheOur Company continues to indirectly own the equity of Ningbo, which still holds its government-granted business license. TheOur Company has disposed of all of the buildings and most of the equipment and the land use rights for the property where Ningbo’s operations had been situated. The principal machinery utilized at the Ningbo facility has either been sold or stored at other operating facilities of our Company.
TheROW, APWC has three principal subsidiaries:
24
dividends paid by a company to any individual or corporate payee overseas are subject to a withholding tax of 10%. Under the current Singapore corporate tax system, dividends paid by a Singapore resident company are tax exempt, and are not subject to withholding taxes. In Australia, dividends paid to non-residents are exempt from dividend withholding taxes except when dividends are paid out of profit that is not taxed by Australian income tax.
Charoong Thai is a publicly-traded Thai corporation, the shares of which are listed on the Stock Exchange of Thailand (“SET”). It manufactures aluminum and copper electric wire, medium and high voltage power cables and telecommunications cables. It has subsidiaries and affiliates in the businesses of fiber optic cable manufacturing and telecommunication and network services. Charoong Thai was established in Thailand in 1967 as a limited public company. As of December 31, 2020, the Company effectively owned 50.93% of the issued and outstanding shares of Charoong Thai. The Company’s present intention is to maintain majority ownership of the voting securities of Charoong Thai. The board of directors of Charoong Thai may authorize the issuance of additional shares of common stock of Charoong Thai. The Company has preemptive rights to purchase its pro rata share of any additional authorized shares, less amounts reserved for Charoong Thai’s directors, officers or employees. In the event the board of Charoong Thai decides to cause it to issue additional shares, the Company may decide not to exercise the Company’s preemptive rights, in which case its interest may be diluted.
Siam Pacific was established in 1988 as a joint venture between PEWC and Italian-Thai Development Plc. Siam Pacific is now a 100%-owned subsidiary of Charoong Thai and focuses on the manufacture of telecommunications cables, and enameled wires.
Rest of the World (“ROW”) Region
The Company’s ROW region currently consists of its Singapore and Australian operations.
The Company’s Singapore operations are principally conducted through“Siam Pacific” trade name. Products manufactured by Sigma Cable Company (Private) Limited (“Sigmaare sold under the “Sigma Cable”), an indirectly 98.3%-owned subsidiary of the Company. The Company believes that Sigma Cable is one of the major suppliers of power cable products in Singapore. Sigma Cable manufactures brand.
Sigma Cable also has project engineering operations in Singapore to supply, deliver and install (referred to as “SDI”) primarily medium and high voltage cables to power transmission projects. While the Company currently obtains its supply of medium and high voltage power cables for its SDI operations from PEWC, other suppliers are also available if necessary.
Sigma Cable owns 100% of the capital stock of Epan Industries Pte. Ltd. (“Epan”) a Singaporean Company. Currently, Epan is acting as the distributor of Sigma Cable products and those of other third party suppliers.
The Company’s business in Australia is conducted by Australia Pacific Electric Cable Pty. Ltd. (“APEC”). The Company’s indirect ownership interest in APEC is 98.06%. APEC is located near Brisbane and is one of three major wire and cable manufacturers in Australia. APEC possesses a substantial marketing and distribution infrastructure with a network of sales offices and warehouses in the cities of Brisbane, Sydney, Melbourne and Perth.
25
Services
|
|
Across theour Company’s three reporting segments, the Company engages in three principal business lines that consist of manufacturing and distributing wire and cable products and providing fabrication or project engineering services to certain customers. Theour Company manufactures and sells a wide variety of wire and cable products in primarily three general categories: enameled wire, power cable, and telecommunications cables, power transmission cables, and enameled wires. The Company’s telecommunications and power cables are used in a range of infrastructure projects and in commercial and residential developments. Thecable. Our Company’s enameled wires are used in the manufacturing of components and sub-components of a number of household appliances and small machinery. Our Company’s telecommunications and power cables are used in a range of infrastructure projects and in commercial and residential developments. In addition, theour Company acts as a distributor in Singapore of wire and cable products manufactured by PEWC and other third party suppliers in Singapore. ThePEWC. Our Company also offers SDI project engineering services of medium and high voltage cables for power transmission projects in Singapore.
Services
Fabrication
The Company performs fabrication services for its customers, converting raw materials to wire and cable products. Raw materials, such as copper, aluminum, polyvinyl chloride, polyethylene and optic fibers, are commodities traded on global markets with anticipated price fluctuations and currency risk. Given these risks, the Company provides fabrication services using customer-owned materials in order to limit exposure to these risks.
SDI Project Engineering Services
Given government and private sector infrastructure projects and residential and commercial buildings activity in Singapore, the Company anticipates modest demand for medium and high voltage power and for value added services in the power supply industry. To take advantage of these opportunities, the Company has developed an SDI project engineering capability. This SDI project engineering involves supply, delivery and installation of primarily medium and high voltage cables to power transmission projects in Singapore. In entering into a contract to supply, deliver and install cables for a power transmission project, the Company delivers medium and high voltage cables and enters into subcontracting agreements with local companies to install the cables as required by the project
The
26
Power Cable
The
Production of unarmored cables begins by drawing and annealingimpact of copper rods. The drawn copper wires are then stranded or “bunched” into round or sector-shaped conductors in sizes ranging from 1.5 square millimeters to 1000 square millimeters. The copper conductors are then covered in an extrusion process with a plastic insulator such as PVC, after which 2-5 conductors are twisted into a circular cable core in a cabling process and covered by a plastic outer cover.
Unarmored cables are composed of one or more cores of copper wire, insulated by substances such as PVC. Armored cables are produced in the same manner and the same range of configurations as unarmored cables, but with the addition of an outer layer of galvanized steel or iron wires to protect the cables from damage.
Enameled Wire
The Company also produces several varieties of enameled wires. Enameled wires are copper wires varnished, in an enameling process, by insulating materials. The enameling process makes the wires more resistant to oil, heat, friction and fusion, and therefore suitable for use in machinery and components and sub-components of manufactured goods. The Company manufactures enameled wires in sizes that range from 0.02 mm to 4.00 mm in diameter, varnished by various types of petroleum insulation materials including polyvinyl formal, polyurethane wires and polyester. Enameled wire products are used in the assembly of a wide range of electrical products, including oil-filled transformers, refrigerator motors, telephones, radios, televisions, fan motors, air conditioner compressors and other electric appliances.
27
|
|
Copper is the principal raw material used by the Company for copper-based products. Theprice fluctuations, our Company typically purchases copper at prices based on the average prevailing international spot market prices on the LME for copper for the one month prior to purchase. The price of copper is influenced heavily by global supply and demand as well as speculative trading. As with other costs of production, changes in the price of copper can affect theour Company’s cost of sales. Whether this has a material impact on theour Company’s operating margins and financial results depends primarily on theour Company’s ability to adjust selling prices to its customers, such that increases and decreases in the price of copper are reflected in those selling prices. In the cases when we enter into a long-term sales contract at fixed selling prices, rising copper prices could render this contract onerous and our Company would be required to recognize losses from this onerous contract in the income statement. Most sales of theour Company’s manufactured products reflect copper prices prevailing at the time the products are ordered. A long-term decrease in the price of copper would require theour Company to revalue the value of its inventory at periodic intervals to the then net realizable value, which could be below cost.
The
The Company imports both copper cathodes and copper rods in Thailand, with copper cathodes subjected to lower import duty than copper rods. The
The (See Item 3D: Risk Factors-Risks Relating to our Business: “The ability of suppliers to deliver raw materials, parts and components and energy resources could affect our Company’s ability to manufacture products without disruption and in turn negatively affect our operations.”).
28
|
|
UL Solutions.
|
|
The Company’s telecommunications cable and power cable products are primarily sold in the domestic markets of the countries where they are manufactured, whereas a portion of the enameled wires manufactured by the Company in Thailand are exported, primarily to customers throughout Southeast Asia. The following table sets forth the Company’s sales revenues for the periods indicated in its three reporting segments – North Asia region, Thailand region and ROW region for its three principal product lines, i.e., power, enameled and others together with their respective percentage share of total sales by reporting segment for such periods.
Year ended December 31, 2020 | North Asia |
| Thailand |
| ROW |
| Total segments Consolidated |
| ||||
| US$’000 |
| US$’000 |
| US$’000 |
| US$’000 |
| ||||
Revenue from external customers |
|
|
|
|
|
|
|
|
|
|
|
|
Power |
| — |
|
| 48,851 |
|
| 78,779 |
|
| 127,630 |
|
Enamel |
| 73,179 |
|
| 57,971 |
|
| — |
|
| 131,150 |
|
Fabrication |
| — |
|
| 33,101 |
|
| — |
|
| 33,101 |
|
Others* |
| 20 |
|
| 3,724 |
|
| 17,939 |
|
| 21,683 |
|
|
| 73,199 |
|
| 143,647 |
|
| 96,718 |
|
| 313,564 |
|
*include revenues from SDI service contracts (which amounted to US$15.6 million in 2020), and sale of other wires and cables products.
Year ended December 31, 2019 | North Asia |
| Thailand |
| ROW |
| Total segments Consolidated |
| ||||
| US$’000 |
| US$’000 |
| US$’000 |
| US$’000 |
| ||||
Revenue from external customers |
|
|
|
|
|
|
|
|
|
|
|
|
Power |
| — |
|
| 49,493 |
|
| 78,686 |
|
| 128,179 |
|
Enamel |
| 76,575 |
|
| 102,997 |
|
| — |
|
| 179,572 |
|
Others* |
| — |
|
| 19,889 |
|
| 10,520 |
|
| 30,409 |
|
|
| 76,575 |
|
| 172,379 |
|
| 89,206 |
|
| 338,160 |
|
*include revenues from SDI service contracts (which amounted to US$7.6 million in 2019), fabrication service contracts, and sale of other wires and cables products.
29
Year ended December 31, 2018 | North Asia |
| Thailand |
| ROW |
| Total segments Consolidated |
| ||||
| US$’000 |
| US$’000 |
| US$’000 |
| US$’000 |
| ||||
Revenue from external customers |
|
|
|
|
|
|
|
|
|
|
|
|
Power |
| — |
|
| 64,771 |
|
| 92,130 |
|
| 156,901 |
|
Enamel |
| 103,647 |
|
| 114,247 |
|
| — |
|
| 217,894 |
|
Others* |
| — |
|
| 34,406 |
|
| 16,739 |
|
| 51,145 |
|
|
| 103,647 |
|
| 213,424 |
|
| 108,869 |
|
| 425,940 |
|
* include revenues from SDI service contracts (which amounted to US$16.7 million in 2018), fabrication service contracts, and sale of other wires and cables products.
APWC’s operating subsidiaries are also responsible for sales planning, marketing strategy and customer liaison. The Company’s sales staff is knowledgeable about the Company’s products and also renders technical assistance, consulting services and repair and maintenance services to the Company’s customers. The Company does not conduct sales through independent sales agents on a commission basis but uses its own sales employees located at APWC’s operating subsidiaries.
As copper constitutes the most significant component of the Company’s wire and cable products, the price of the Company’s products depends primarily upon the price of copper. In order to minimize the impact of copper price fluctuations, the Company attempts to determine the prices of its products based on the prevailing market price of copper. The Company may be affected by significant fluctuations in the price of copper.
Payment methods for the Company’s products vary with markets and customers. The majority of sales by the Company requires payment within 90 days, but may vary depending on the customer and payment record. Sales pursuant to a successful project tender or sales to governmental or public utilities are conducted in accordance with the tender or other applicable regulations. In connection with the distribution of medium and high voltage power cables manufactured by PEWC, the Company is required to pay PEWC 90% of the cost of the products either within 30 days of receipt of the product or, in the case of SDI products, upon installation, with the remaining 10% in either case to be paid within one year. In connection with a purchase of copper rod, the Company is required to pay PEWC the cost of the copper rod within 30 days from obtaining the products from PEWC. For the export market, payment is usually made by prior delivery of an irrevocable letter of credit. Neither APWC nor its operating subsidiaries offers financing for purchases of the Company’s products. Company employees engaged in sales and marketing are paid a salary and may also receive a bonus based on performance.
Products are marketed under the respective names of the operating subsidiaries. For instance, products manufactured by Siam Pacific are marketed under the “Siam Pacific” trade name. Products manufactured by Sigma Cable are sold under the “Sigma Cable” brand.
North Asia
The Company produces and sells enameled wires in China. The Company’s principal China operations are conducted through China-based business entities. The Company generally sells enameled wires directly to manufacturers of electric motors for use in various consumer appliances.
Thailand
The Company produces and sells telecommunication cables, enameled wires and power cables in Thailand. Charoong Thai is one of the leading cable manufacturers in Thailand. Our distribution channels include both direct sales to government entities and private sector participants in the infrastructure sector, and sales to agents for governmental entities. Sales within the Thailand region are made directly by the sales department of the APWC’s operating subsidiaries in accordance with terms and pricing set by the local subsidiaries. The major customers of the Company include clients working with the government and its contractors.
30
ROW
The Company produces and sells low voltage power cables in Singapore and Australia. In addition, the Company sells a wide range of wire and cable products produced by third party suppliers and PEWC. The Company also offers SDI project engineering services for medium and high voltage power cables to power transmission projects in Singapore. SP Power Assets Ltd. has historically been the principal customer for the Company’s SDI services, accounting for nearly all of our SDI sales. Sales to SP Power Assets Ltd. are under a comprehensive contract, with purchase orders placed from time to time.
|
|
The wire and cable industry in the Asia Pacific region is highly competitive. TheOur Company’s competitors include a large number of independent domestic and foreign suppliers. Certain competitors in each of theour Company’s markets have substantially greater manufacturing, sales, research and financial resources than the Company. Theus. Our Company and other wire and cable producers primarily compete on the basis of product quality and performance, reliability of supply, customer service, and price.
31
| Regional Considerations |
The
| Insurance |
The
32
| Environmental Regulations |
The
|
|
|
|
The
presently encumbered.
The loan agreements were renewed for one year and are set to expire in March 2024.
|
|
33
|
|
|
|
5.a.1.Disclosures of Critical Accounting Policies
The critical
5.a.2.Report, which are prepared in accordance with IFRS as issued by the IASB.
| For the year ended December 31, | |||||||||||||||||
| 2023 | 2022 | 2021 | |||||||||||||||
| (US$’000 except for percentages) | |||||||||||||||||
| Net Sales: | |||||||||||||||||
| North Asia region | $ | 58,649 | $ | 77,329 | $ | 107,032 | |||||||||||
| Thailand region | 166,925 | 171,841 | 197,779 | ||||||||||||||
| ROW region | 200,198 | 184,723 | 171,848 | ||||||||||||||
| Total | $ | 425,772 | $ | 433,893 | $ | 476,659 | |||||||||||
| Operating profit/(loss): | |||||||||||||||||
| North Asia region | $ | 1,794 | $ | 241 | $ | 4,523 | |||||||||||
| Thailand region | (2,119) | 2,636 | (13,537) | ||||||||||||||
| ROW region | 8,628 | 7,768 | 6,690 | ||||||||||||||
| Corporate expenses & adjustments | (6,755) | (2,578) | (2,649) | ||||||||||||||
| Total operating (loss)/profit | $ | 1,548 | $ | 8,067 | $ | (4,973) | |||||||||||
| Operating profit/(loss) margin: | |||||||||||||||||
| North Asia region | 3.06 | % | 0.31 | % | 4.23 | % | |||||||||||
| Thailand region | (1.27) | % | 1.53 | % | (6.84) | % | |||||||||||
| ROW region | 4.31 | % | 4.21 | % | 3.89 | % | |||||||||||
|
|
| For the year ended December 31, |
| |||||||
| 2020 |
| 2019 |
| 2018 |
| |||
| (US$’000 except for percentages) |
| |||||||
Net Sales: |
|
|
|
|
|
|
|
|
|
North Asia region | $ | 73,199 |
| $ | 76,575 |
| $ | 103,647 |
|
Thailand region |
| 143,647 |
|
| 172,379 |
|
| 213,424 |
|
ROW region |
| 96,718 |
|
| 89,206 |
|
| 108,869 |
|
Total | $ | 313,564 |
| $ | 338,160 |
| $ | 425,940 |
|
Operating profit (loss): |
|
|
|
|
|
|
|
|
|
North Asia region | $ | 3,087 |
| $ | 1,237 |
| $ | 5,234 |
|
Thailand region |
| 11,250 |
|
| 3,042 |
|
| 9,539 |
|
ROW region |
| (4,492 | ) |
| (1,659 | ) |
| (2,306 | ) |
Corporate expenses & adjustments |
| (2,288 | ) |
| (3,269 | ) |
| (3,783 | ) |
Total operating profit (loss) | $ | 7,557 |
| $ | (649 | ) | $ | 8,684 |
|
Operating profit (loss) margin: |
|
|
|
|
|
|
|
|
|
North Asia region |
| 4.22 | % |
| 1.62 | % |
| 5.05 | % |
Thailand region |
| 7.83 | % |
| 1.76 | % |
| 4.47 | % |
ROW region |
| (4.64 | )% |
| (1.86 | )% |
| (2.12 | )% |
December 31, 2023, APWC is approximately 75.5%80.96% beneficially owned and is controlled by PEWC, a Taiwanese company. Thewith the remaining approximately 24.5%19.04% of the issued and outstanding Common Shares arebeing publicly-traded in the United States and listed on Nasdaq. Based upon a review of Schedule 13D and 13G filings made with the SEC by shareholders, and a review of the share register maintained by APWC’s transfer agents in Bermuda and the U.S., the Company iswe are not aware of any shareholders residentresiding in the jurisdictions where theour Company has business operations. While theour Company’s operations and results are impacted by economic, fiscal, monetary and political policies of the respective governments in the countries where theour Company operates, that impact is not a function of APWC’s shareholder base.
34
|
|
| For the Year Ended December 31, |
|
|
|
|
|
|
| ||||
| 2020 |
| 2019 |
| Changes |
| Changes |
| ||||
| US$’000 |
| US$’000 |
| US$’000 |
| % |
| ||||
Income Statement Data: |
|
|
|
|
|
|
|
|
|
|
|
|
Revenue | $ | 313,564 |
| $ | 338,160 |
| $ | (24,596 | ) |
| (7.3 | ) |
Costs of sales |
| (279,686 | ) |
| (313,373 | ) |
| 33,687 |
|
| 10.7 |
|
Gross profit |
| 33,878 |
|
| 24,787 |
|
| 9,091 |
|
| 36.7 |
|
Other operating income |
| 814 |
|
| 385 |
|
| 429 |
|
| 111.4 |
|
Selling, general and administrative expenses |
| (27,006 | ) |
| (25,051 | ) |
| (1,955 | ) |
| (7.8 | ) |
Other operating expenses |
| (129 | ) |
| (770 | ) |
| 641 |
|
| 83.2 |
|
Operating profit /(loss) |
| 7,557 |
|
| (649 | ) |
| 8,206 |
|
| 1,264.4 |
|
Finance costs |
| (744 | ) |
| (1,012 | ) |
| 268 |
|
| 26.5 |
|
Finance income |
| 320 |
|
| 506 |
|
| (186 | ) |
| (36.8 | ) |
Share of loss of associates |
| (1 | ) |
| (3 | ) |
| 2 |
|
| 66.7 |
|
Exchange (loss)/gain |
| (579 | ) |
| 1,550 |
|
| (2,129 | ) |
| (137.4 | ) |
Other income |
| 1,173 |
|
| 717 |
|
| 456 |
|
| 63.6 |
|
Other expense |
| (1 | ) |
| (3 | ) |
| 2 |
|
| 66.7 |
|
Profit before tax |
| 7,725 |
|
| 1,106 |
|
| 6,619 |
|
| 598.5 |
|
Income taxes expense |
| (4,016 | ) |
| (2,057 | ) |
| (1,959 | ) |
| (95.2 | ) |
Profit/(Loss) for the year |
| 3,709 |
|
| (951 | ) |
| 4,660 |
|
| 490.0 |
|
Attributable to: |
|
|
|
|
|
|
|
|
|
|
|
|
Equity holders of APWC |
| (552 | ) |
| (1,632 | ) |
| 1,080 |
|
| 66.2 |
|
Non-controlling interests |
| 4,261 |
|
| 681 |
|
| 3,580 |
|
| 525.7 |
|
| For the Year Ended December 31, | |||||||||||||||||||||||
| 2023 | 2022 | Changes | Changes | ||||||||||||||||||||
| US$’000 | US$’000 | US$’000 | % | ||||||||||||||||||||
| Income Statement Data: | |||||||||||||||||||||||
| Revenue | $ | 425,772 | $ | 433,893 | $ | (8,121) | (1.9) | ||||||||||||||||
| Costs of sales | (395,545) | (401,363) | 5,818 | (1.4) | |||||||||||||||||||
| Gross profit | 30,227 | 32,530 | (2,303) | (7.1) | |||||||||||||||||||
| Other operating income | 433 | 1,026 | (593) | (57.8) | |||||||||||||||||||
| Selling, general and administrative, research and development expenses | (24,472) | (24,978) | 506 | (2.0) | |||||||||||||||||||
| Other operating expenses | — | (3) | 3 | (100.0) | |||||||||||||||||||
| Net impairment loss on financial and contract assets | (4,640) | (508) | (4,132) | 813.4 | |||||||||||||||||||
| Operating profit | 1,548 | 8,067 | (6,519) | (80.8) | |||||||||||||||||||
| Finance costs | (2,527) | (1,650) | (877) | 53.2 | |||||||||||||||||||
| Finance income | 205 | 120 | 85 | 70.8 | |||||||||||||||||||
| Share of loss of associates | (2) | (1) | (1) | 100.0 | |||||||||||||||||||
| Exchange gain | 679 | 143 | 536 | 374.8 | |||||||||||||||||||
| Other income | 570 | 889 | (319) | (35.9) | |||||||||||||||||||
| Other expense | (9) | (3) | (6) | 200.0 | |||||||||||||||||||
| Profit before tax | 464 | 7,565 | (7,101) | (93.9) | |||||||||||||||||||
| Income taxes expense | (162) | (2,808) | 2,646 | (94.2) | |||||||||||||||||||
| Profit for the year | 302 | 4,757 | (4,455) | (93.7) | |||||||||||||||||||
| Attributable to: | |||||||||||||||||||||||
| Equity holders of APWC | 3,867 | 3,874 | (7) | (0.2) | |||||||||||||||||||
| Non-controlling interests | (3,565) | 883 | (4,448) | (503.7) | |||||||||||||||||||
2022.
|
| 2020 |
| 2019 |
| ||
Average LME copper price ($/Ton) | Q1 |
| 5,638 |
|
| 6,220 |
|
| Q2 |
| 5,341 |
|
| 6,114 |
|
| Q3 |
| 6,521 |
|
| 5,798 |
|
| Q4 |
| 7,174 |
|
| 5,888 |
|
| Year |
| 6,169 |
|
| 6,005 |
|
| 2023 | 2022 | ||||||||||
| Average LME copper price ($/Ton) | Q1 | 8,929 | 9,984 | ||||||||
| Q2 | 8,478 | 9,525 | |||||||||
| Q3 | 8,355 | 7,741 | |||||||||
| Q4 | 8,169 | 8,005 | |||||||||
| Year | 8,483 | 8,814 | |||||||||
35
Total sales in
a decline in sales compared with the previous period.
the decrease in government spending on infrastructure and delay in government projects.
the completion of public sector projects in Singapore.
onerous contracts in the Thailand region.
2022.
our products.
volume in enameled wire as well as loss from onerous contracts.
the increased loss allowance provided for the delinquent accounts.
increase in interest rates in various countries.
Finance
both 2022 and 2023.
The
36
| As of December 31, |
| ||||||||||||||||||||||||||
| 2020 |
| 2019 |
| ||||||||||||||||||||||||
| As of December 31, | As of December 31, | |||||||||||||||||||||||||||
| 2023 | 2023 | 2022 | ||||||||||||||||||||||||||
Foreign currency to US$1: |
|
|
|
|
|
| ||||||||||||||||||||||
| Thai Baht | ||||||||||||||||||||||||||||
| Thai Baht | ||||||||||||||||||||||||||||
Thai Baht |
| 30.02 |
| 29.75 |
| |||||||||||||||||||||||
Singapore $ |
| 1.321 |
| 1.345 |
| |||||||||||||||||||||||
Australian $ |
| 1.297 |
| 1.423 |
| |||||||||||||||||||||||
Chinese RMB |
| 6.525 |
| 6.962 |
| |||||||||||||||||||||||
|
|
| For the Year Ended December 31, |
|
|
|
|
|
|
| ||||
| 2019 |
| 2018 |
| Changes |
| Changes |
| ||||
| US$’000 |
| US$’000 |
| US$’000 |
| % |
| ||||
Income Statement Data: |
|
|
|
|
|
|
|
|
|
|
|
|
Revenue | $ | 338,160 |
| $ | 425,940 |
| $ | (87,780 | ) |
| (20.6 | ) |
Costs of sales |
| (313,373 | ) |
| (389,692 | ) |
| 76,319 |
|
| 19.6 |
|
Gross profit |
| 24,787 |
|
| 36,248 |
|
| (11,461 | ) |
| (31.6 | ) |
Other operating income |
| 385 |
|
| 805 |
|
| (420 | ) |
| (52.2 | ) |
Selling, general and administrative expenses |
| (25,051 | ) |
| (26,924 | ) |
| 1,873 |
|
| 7.0 |
|
Other operating expenses |
| (770 | ) |
| (1,445 | ) |
| 675 |
|
| 46.7 |
|
Operating (loss)/profit |
| (649 | ) |
| 8,684 |
|
| (9,333 | ) |
| (107.5 | ) |
Finance costs |
| (1,012 | ) |
| (1,378 | ) |
| 366 |
|
| 26.6 |
|
Finance income |
| 506 |
|
| 482 |
|
| 24 |
|
| 5.0 |
|
Share of loss of associates |
| (3 | ) |
| (3 | ) |
| — |
|
| — |
|
Exchange gain |
| 1,550 |
|
| 1,741 |
|
| (191 | ) |
| (11.0 | ) |
Other income |
| 717 |
|
| 1,817 |
|
| (1,100 | ) |
| (60.5 | ) |
Other expense |
| (3 | ) |
| (11 | ) |
| 8 |
|
| 72.7 |
|
Profit before tax |
| 1,106 |
|
| 11,332 |
|
| (10,226 | ) |
| (90.2 | ) |
Income taxes expense |
| (2,057 | ) |
| (3,886 | ) |
| 1,829 |
|
| 47.1 |
|
(Loss)/Profit for the year | $ | (951 | ) | $ | 7,446 |
|
| (8,397 | ) |
| (112.8 | ) |
Attributable to: |
|
|
|
|
|
|
|
|
|
|
|
|
Equity holders of APWC |
| (1,632 | ) |
| 2,928 |
|
| (4,560 | ) |
| (155.7 | ) |
Non-controlling interests |
| 681 |
|
| 4,518 |
|
| (3,837 | ) |
| (84.9 | ) |
| For the Year Ended December 31, | |||||||||||||||||||||||
| 2022 | 2021 | Changes | Changes | ||||||||||||||||||||
| US$’000 | US$’000 | US$’000 | % | ||||||||||||||||||||
| Income Statement Data: | |||||||||||||||||||||||
| Revenue | $ | 433,893 | $ | 476,659 | $ | (42,766) | (9.0) | ||||||||||||||||
| Costs of sales | (401,363) | (455,508) | 54,145 | 10.7 | |||||||||||||||||||
| Gross profit | 32,530 | 21,151 | 11,379 | 53.8 | |||||||||||||||||||
| Other operating income | 1,026 | 587 | 439 | 74.8 | |||||||||||||||||||
| Selling, general and administrative expenses | (24,978) | (26,484) | 1,506 | (7.8) | |||||||||||||||||||
| Other operating expenses | (3) | (7) | 4 | 83.2 | |||||||||||||||||||
| Net impairment loss on financial and contract assets | (508) | (220) | (288) | 130.9 | |||||||||||||||||||
| Operating (loss)/profit | 8,067 | (4,973) | 13,040 | 1264.4 | |||||||||||||||||||
| Finance costs | (1,650) | (1,251) | (399) | 26.5 | |||||||||||||||||||
| Finance income | 120 | 123 | (3) | (2.4) | |||||||||||||||||||
| Share of loss of associates | (1) | (1) | — | 66.7 | |||||||||||||||||||
| Exchange gain/(loss) | 143 | (4,425) | 4,568 | (103.2) | |||||||||||||||||||
| Other income | 889 | 671 | 218 | 32.5 | |||||||||||||||||||
| Other expense | (3) | (1) | (2) | 66.7 | |||||||||||||||||||
| Profit before tax | 7,565 | (9,857) | 17,422 | (176.7) | |||||||||||||||||||
| Income taxes expense | (2,808) | 1,345 | (4,153) | (95.2) | |||||||||||||||||||
| Profit/(loss) for the year | 4,757 | (8,512) | 13,269 | 490.0 | |||||||||||||||||||
| Attributable to: | |||||||||||||||||||||||
| Equity holders of APWC | 3,874 | (2,642) | 6,516 | 66.2 | |||||||||||||||||||
| Non-controlling interests | 883 | (5,870) | 6,753 | (115.0) | |||||||||||||||||||
37
2021.
Copper prices indicated in this Annual Report are quoted from the index published by the LME. The 20192022 and 20182021 average copper prices were as follows:
|
| 2019 |
| 2018 |
| ||
Average LME copper price ($/Ton) | Q1 |
| 6,220 |
|
| 6,959 |
|
| Q2 |
| 6,114 |
|
| 6,872 |
|
| Q3 |
| 5,798 |
|
| 6,103 |
|
| Q4 |
| 5,888 |
|
| 6,168 |
|
| Year |
| 6,005 |
|
| 6,525 |
|
| 2022 | 2021 | ||||||||||
| Average LME copper price ($/Ton) | Q1 | 9,984 | 8,479 | ||||||||
| Q2 | 9,525 | 9,711 | |||||||||
| Q3 | 7,741 | 9,371 | |||||||||
| Q4 | 8,005 | 9,697 | |||||||||
| Year | 8,814 | 9,314 | |||||||||
The average copper price in March 2020 on the LME was $5,179 per metric ton.
Total sales in
world economy.
Revenue fromdemand for cables decreased the ROW region decreasedrevenues in Australia.
Gross Profit
While fluctuations in raw material acquisition are preferably placed upon the customer, limiting factors reduced the effects of this strategycopper price fluctuations, which decreased loss on onerous contracts and impacted Gross Profit. A decreasediminution in average copper prices per metric tonthe value of 7.97% plusinventory in 2022 in the intense competition and market slowdown primarily due to the trade war between USA and China all led to the material change in GrossThailand region.
Operating (Loss)
Operating (loss) for 20192022 was $(0.6)$8.1 million, representing a decrease by $9.3an increase of $13 million, or (107.5)%262.2%, from the operating profitloss of $8.7$(5) million in 2018.
2021.
copper prices.
2021.
38
Singapore.
the required working capital due to the decrease in revenue.
The
both 2021 and 2022.
The
| As of December 31, |
| ||||||||||
| 2019 |
| 2018 |
| ||||||||
| As of December 31, | ||||||||||||
| 2022 | ||||||||||||
| 2022 | ||||||||||||
| 2022 | ||||||||||||
| Foreign currency to US$1: | ||||||||||||
| Foreign currency to US$1: | ||||||||||||
Foreign currency to US$1: |
|
|
|
|
|
| ||||||
Thai Baht |
| 29.75 |
| 32.31 |
| |||||||
| Thai Baht | ||||||||||||
| Thai Baht | ||||||||||||
| Singapore $ | ||||||||||||
| Singapore $ | ||||||||||||
Singapore $ |
| 1.345 |
| 1.362 |
| |||||||
Australian $ |
| 1.423 |
| 1.419 |
| |||||||
| Australian $ | ||||||||||||
| Australian $ | ||||||||||||
Chinese RMB |
| 6.962 |
| 6.876 |
| |||||||
| Chinese RMB | ||||||||||||
| Chinese RMB | ||||||||||||
39
better earnings in Thailand in 2022.
|
|
For details of our Company’s bank loans and borrowings, see Note 11(b) to our consolidated financial statements. As of December 31, 2023, a majority of the short-term bank loans and borrowings were held at variable interest rates, whereas the long-term bank loans were held at a fix interest rate.
shares pledged as collateral are unencumbered.
several factors, including decreased net profit, and increased trade receivables, compared to 2022.
40
2021.
equipment in 2023.
equipment in 2022.
Net cash used in financing activities was $17.9 million in 2019. In 2019, net cash used in financing activities reflected primarily the repayment of borrowings.
|
|
The
| Payments due by period | |||||||||||||||||||||||
Contractual obligations (In thousands of US$) | Total | Less than 1 year | 1-5 years | More than 5 years | |||||||||||||||||||
| Interest-bearing loans and borrowings | $ | 57,170 | 57,170 | — | — | ||||||||||||||||||
| Lease obligations | 2,090 | 676 | 1,059 | 355 | |||||||||||||||||||
| Capital commitment relating to factory building improvement and acquisition of machinery | 735 | 725 | 10 | — | |||||||||||||||||||
| Purchase obligations for raw materials | 146,839 | 146,839 | — | — | |||||||||||||||||||
| $ | 206,834 | 205,410 | 1,069 | 355 | |||||||||||||||||||
|
|
•Uncertainty arising from the volatility in the cost of copper, our principal raw material. In 2020, the The yearly average copper price went upper ton decreased from $6,005 (yearly average for 2019) per metric ton$9,314 in 2021 to $6,169 per metric ton (yearly average for 2020).$8,814 in 2022, and to $8,483 in 2023. Under our business model, theour Company, like other companies in the industry, is affected by movements in the price of copper, our principal raw material.
•Fluctuations in the demand for our products in the markets in which we do business. Demand for our products in the markets in which we do business fluctuates based upon variations in the level of governmental and private investments in communications, power and industrial projects and programs that utilize our products. We are not an end-user of our products and, therefore, we depend upon the requirements of our customers to generate sales.
41
|
|
|
|
The following table sets forth the Company’s contractual obligations asNote 3.23 of December 31, 2020:
| Payments due by period |
| ||||||||||
Contractual obligations (In thousands of US$) | Total |
| Less than 1 year |
| 1-5 years |
| More than 5 years |
| ||||
Interest-bearing loans and borrowings | $ | 15,428 |
|
| 10,279 |
|
| 925 |
|
| 4,224 |
|
Lease obligations |
| 2,621 |
|
| 613 |
|
| 1,015 |
|
| 993 |
|
Capital commitment relating to factory building improvement and acquisition of machinery |
| 2,541 |
|
| 2,520 |
|
| 21 |
|
| — |
|
Purchase obligations for raw materials |
| 251,001 |
|
| 251,001 |
|
| — |
|
| — |
|
| $ | 271,591 |
|
| 264,413 |
|
| 1,961 |
|
| 5,217 |
|
For more details on financial commitments and contingencies, please refer to our audited consolidated financial statements and the notes thereto referenced in Item 18: “Financial Statements”.
|
|
Please see the section18 of this report entitled “Cautionary Statement Regarding Forward-Looking Statements”
|
|
|
|
There is only
| Name | Date of Birth | Position | ||||||||||||
Ocorian Services (Bermuda) Limited. | N/A | Resident Assistant | ||||||||||||
Anson Chan | November 3, 1963 | Independent director, Audit Committee Chairman | ||||||||||||
|
|
| ||||||||||||
|
|
| ||||||||||||
|
|
| ||||||||||||
Lambert L. Ding | October 12, 1959 | Independent director, Audit Committee Member | ||||||||||||
42
|
|
| ||||||||||||
Yichin Lee | January 4, 1961 | Independent director, Audit Committee Member | ||||||||||||
|
|
| ||||||||||||
David Sun | December 22, 1953 | Director | ||||||||||||
George Sun | April 4, 1951 | Director | ||||||||||||
| Lee Gai Poo | February 28, 1957 | Director | ||||||||||||
| Yuan Chun Tang | November 26, 1960 | Director, Chief Executive Officer | ||||||||||||
|
|
| ||||||||||||
Ivan Hsia | August 14, 1973 | Chief Financial Officer | ||||||||||||
| Daphne Hsu | August 12, 1962 | Financial Controller | ||||||||||||
Mr. Andy C.C. Cheng was a member of APWC’s Board of Directors from 2004 to 2005 and was re-elected in 2007. Mr. Cheng was appointed as Chairman of the Board in 2009. From 1987 to 2003, Mr. Cheng served as Vice President in charge of procurement at PEWC. Mr. Cheng has been an Executive Vice President at PEWC since 2004 and Chairman of each of the investment divisions of PEWC, Tai Ho Investment Co., Ltd. and You Chi Investment Co., Ltd., since June 2008. Mr. Andy C.C. Cheng is not related to Mr. Fang Hsiung Cheng. Mr. Cheng currently is also a member of PEWC’s Board of Directors.
Mr. Fang Hsiung Cheng has been a member of APWC’s Board of Directors since 2006. He also serves as Assistant Vice President of PEWC. Mr. Fang Hsiung Cheng is not related to Mr. Andy C.C. Cheng.
Ms. Daphne Hsu has been Financial Controller of APWC since March 2005, prior to which she served as Financial Controller for ten years in Taiwan and China at a Thomson SA joint venture.
Mr. Michael C. Lee has been a member of APWC’s Board of Directors since 2004 and is also Chief Executive Officer of PEWC and Chairman of Pacific USA Holdings, Ltd. Mr. Michael C. Lee is not related to Dr. Yichin Lee. Mr. Lee currently is also a member of PEWC’s Board of Directors.
Compensation Committee.
Mr. Alex Chen has beenLee, a member of APWC’sformer Board of Directors since 2015. He also served as Chief Marketing Officer of APWC from July 1, 2015 until December 31, 2019. Mr. Chen was first assigned to PEWC as Engineer, Assistant to General Manager, and later Manager of Quality Assurance Department from 1983 to 2008. He was Managing Director of Siam Pacific Electric Wire & Cable Co. Ltd. in Thailand from 2008 to 2015. Mr. Chen also serves as Vice President and General Division Manager of the General Sales Division of PEWC, and as a Director of the Taiwan Electric Research & Testing Center.
member.
43
Mr. George Sun are siblings.
Mr. William Gong Wei has been Chief Operating Officer since April 1, 2013. He was first assigned to Charoong Thai Wire and Cable Pte. Co. Ltd. as Engineer, Assistant Plant Manager, and later consultant to the high voltage cable division from 1991 to 2000. Thereafter, Mr. Gong Wei left Charoong Thai to pursue other professional activities and rejoined the Company in 2009. In April 2009 he was appointed as General Manager of Sigma Cable in Singapore. Mr. Gong Wei holds a master’s degree from the Asian Institute of Technology in Bangkok, Thailand.
Taiwan.
| Board Diversity Matrix (As of December 31, 2023) | |||||
| Country of Principal Executive Offices: |
| ||||
| Foreign Private Issuer | Yes | ||||
| Disclosure Prohibited under Home Country Law | No | ||||
| Total Number of Directors | 7 | ||||
| Female | Male | Non-Binary | Did Not Disclose Gender | ||||||||||||||||||||
| Part I: Gender Identity | |||||||||||||||||||||||
| Directors | — | 7 | — | — | |||||||||||||||||||
| Part II: Demographic Background | |||||||||||||||||||||||
| Underrepresented Individual in Home Country Jurisdiction | — | — | — | — | |||||||||||||||||||
| LGBTQ+ | — | — | — | — | |||||||||||||||||||
| Did Not Disclose Demographic Background | — | 7 | — | — | |||||||||||||||||||
44
|
|
|
|
The Audit Committee also oversees the appointment and remuneration of the Company's independent auditors.
| Compensation Committee |
|
|
The
The Company employed a total
The Company employed a total of 1,326 employees16.6% as of December 31, 2018, of which about 13.3% were administrative2022; 66.5%, 17.9%, and management personnel, with the balance being production personnel. As15.6% as of December 31, 2018, approximately 60.6% of employees were located in the Thailand region, 24.6 % in the North Asia region and 14.8% in the ROW region. Production personnel are usually organized into two 12-hour shifts or three 8-hour shifts to allow continuous factory operations.
45
The2021.
The
The
|
|
|
|
|
|
A totalNo equity compensation, including options, is included as part of 11,100 Common Shares are now issued but not outstanding and are booked as treasury shares. Excluding these treasury shares,the compensation for directors or senior management.
46
Identity of Person or Group | Number of Shares |
| Percent of Class |
| Identity of Person or Group | Number of Shares | Percent of Class | |||||||||||||
Pacific Electric Wire & Cable Co., Ltd.(1) |
| 10,430,769 |
|
| 75.478 | % | ||||||||||||||
| Pacific Electric Wire & Cable Co., Ltd.(1) | Pacific Electric Wire & Cable Co., Ltd.(1) | 16,690,693 | 80.959 | % | ||||||||||||||||
Directors and Executive Officers (Senior Management Members) of APWC |
| 97,834 |
| 0.708 | % | Directors and Executive Officers (Senior Management Members) of APWC | 246,541 | 1.196 | % | |||||||||||
|
|
APWC has 6,166,154
|
|
The
On July 10, 2020, the CompanyComposite Services Agreement dated November 7, 1996 between APWC and PEWC entered into a secured loan agreement pursuant to(the “Composite Services Agreement” or “CSA”), which theour Company borrowed the principal amount of $6 million from PEWC (the “Secured Loan”). The Secured Loan carries a 3% interest rate and is secured by a pledge of the Company’s 98.3% ownership stake in Sigma Cable. The Secured Loan’s scheduled maturity date is the date which is twelve months after July 10, 2020, but may be repaid (in whole or in part) before such date by the Companyhas renewed annually, at its option. The principal amount currently outstandingComposite Services Agreement contains provisions that define the relationship and the conduct of the respective businesses of our Company and PEWC and confers certain preferential benefits on our Company. For a description of the Secured Loan is $6 million.
The Company used the proceeds from the related party loan described above for working capital and purchases of capital equipment. The terms of borrowing by APWC or any of its subsidiaries from PEWC are on terms at least as favorable as terms available in arms-length transactions with unaffiliated parties.
Composite Services Agreement, see Item 10.C.
47
From time2021.
terms no less favorable than those available from unaffiliated third parties.
|
|
|
|
|
|
| Legal Proceedings |
| Dividend Policy |
In November 2016, APWC announced
At this time,
we do not anticipate paying any dividends, or otherwise making any distributions or transfers, to our shareholders in 2024.
|
|
48
|
|
|
|
|
|
|
|
|
|
| Description of Shareholder Rights Attaching to the Common Shares |
•Holders of the Common Shares have no preemptive, redemption, conversion or sinking fund rights.
•Holders of the Common Shares are entitled to one vote per share on all matters submitted to a poll vote of holders of Common Shares and do not have any cumulative voting rights.
•In the event of APWC’s liquidation, dissolution or winding-up and subject to any alternative resolution that may be pursued by APWC’s shareholders, the holders of Common Shares are entitled to share ratably in APWC’s assets, if any, remaining after the payment of all of APWC’s debts and liabilities.
•APWC’s issued and outstanding Common Shares are fully paid and non-assessable.
•Additional authorized but unissued Common Shares, and issued shares held in treasury, may be issued or conveyed by the Board of Directors without the approval of the shareholders.
•APWC is, or after the payment would be, unable to pay its liabilities as they become due; or
•the realizable value of APWC’s assets after such payment or distribution would be less than the aggregate amount of its liabilities.
The following is a summary of provisions of Bermuda law and APWC’s organizational documents, including APWC’s memorandum of association and Bye-Laws. We refer you to APWC’s memorandum of association and Bye-Laws, copies of which have been filed with the SEC. You are urged to read these documents in their entirety for a complete understanding of the terms thereof.
49
|
|
APWC’s authorized capital consists of one class of Common Shares. Under APWC’s Bye-Laws, APWC’sour Board of Directors has the power to issue any authorized and unissued shares on such terms and conditions as it may determine. Any shares or class of shares may be issued with such preferred, deferred, qualified or other special rights or any restrictions with regard to such matters, whether in regard to dividend, voting, return of capital or otherwise, as APWC may from time to time by resolution of the shareholders prescribe, or in the absence of such shareholder direction, as the Board of Directors may determine. This
| Voting Rights |
For purposes of determining the number of votes cast with respect to any proposal, only those votes cast “for” or “against” shall be included. An “abstain” vote will not count as votes cast on any such proposal.
•the chairman of the meeting;
•at least three shareholders present in person or represented by proxy;
•any shareholder or shareholders present in person or represented by proxy and holding between them not less than one-tenth of the total voting rights of all shareholders having voting rights; or
•a shareholder or shareholders present in person or represented by proxy holding Common Shares conferring the right to vote on which an aggregate sum has been paid up equal to not less than one-tenth of the total sum paid up on all Common Shares.
| Dividend Rights |
50
| Purchases by APWC of its own Common Shares |
|
|
| Variation of Rights |
•with the consent in writing of the holders of more than fifty percent of the issued shares of that class; or
•pursuant to a resolution of the holders of such shares.
| Transfer of Common Shares |
| Transfer Restrictions |
•the instrument of transfer is duly stamped, if required by law, and lodged with APWC;
•the instrument is accompanied by the relevant share certificate for the shares to which it relates, and such other evidence as the Board of Directors shall reasonably require to show the right of the transferor to make the transfer;
•the instrument of transfer is in respect of only one class of shares;
•where applicable, the permission of the Bermuda Monetary AuthorityBMA with respect thereto has been obtained; and
51
•subject to the Companies Act, the Bye-Laws and any directions of the Board of Directors from time to time in force, the secretary of APWC may exercise the powers and discretions of the Board of Directors with respect to: (i) the transfer of shares by a shareholder by way of an instrument of transfer in the usual common form and (ii) sending to a notice of refusal to register a transfer of shares where the Board of Directors declines to register such transfer, within three months after the date on which the instrument of transfer was lodged.
| Transmission of Shares |
| Disclosure of Interests |
| Rights in Liquidation |
52
| Meetings of Shareholders |
|
|
53
| Election or Removal of Directors |
•if he resigns his office by notice in writing to be delivered to APWC’s registered office or tendered at a meeting of the Board of Directors;
•if he becomes of unsound mind or a patient for any purpose under any statute or applicable law relating to mental health and the Board of Directors resolves that his office is vacated;
•if he becomes bankrupt or enters into a general settlement with his creditors;
•if he is prohibited by law from being a director; or
•if he ceases to be a director by virtue of the Companies Act or is removed from office pursuant to the Bye-Laws.
|
|
•an aggregate of not less than twenty percent in par value of a company’s issued share capital or any class thereof; or
•not less in the aggregate than twenty percent of the company’s debentures entitled to object to amendments to its memorandum of association,
54
| Merger or Amalgamation |
|
|
55
| Personal Liability of Directors and Indemnity |
10.b.21.Other
10.c.Material
The
•PEWC agrees to (a) sell copper rod to theour Company, upon theour Company’s request, (i) at a price consisting of the spot price of copper on the LME plus an agreed upon premium and (ii) at prices and on terms at least as favorable as PEWC provides copper rod to other purchasers of similar amounts of copper rod in the same markets, and (b) give priority in the supply of copper rod to theour Company over other purchasers of copper rod from PEWC.
The•Our Company has the right to distribute any wire or cable product manufactured by PEWC in all markets in which theour Company presently distributes or develops the capability to distribute in the future such products on such terms as have historically been in effect or on terms at least as favorable as PEWC grants to third parties that distribute such products in such markets. However, PEWC is not required to grant to theour Company the right to distribute products manufactured by PEWC in the future in markets where theour Company does not currently have the capability to distribute unless and until PEWC has no pre-existing contractual rights which would conflict with the grant of such right to theour Company.
56
•Each of PEWC and theour Company will offer the other party the right to participate in any negotiations with a third party concerning the establishment of any facility or similar venture to manufacture or distribute any wire or cable product outside of the markets where theour Company currently manufactures or distributes, or intends to develop the capability to manufacture or distribute, any wire or cable product. Unless theour Company and PEWC mutually agree otherwise, theour Company has the right of first refusal to enter into any definitive agreement with such third party. If, however, such third party would not agree to the substitution of theour Company for PEWC or such substitution would prevent the successful completion of the facility or venture, PEWC has agreed to arrange for theour Company to participate to the extent possible.
•PEWC agrees to make available to theour Company, upon theour Company’s request and on terms to be mutually agreed between PEWC and theour Company from time to time, certain services and technology with respect to the design and manufacture of wire and cable products (including fiber optic products), and certain services with respect to computerization, inventory control, purchasing, internal auditing, quality control, emergency back-up services, and recruitment and training of personnel; such services may include the training of theour Company’s employees and managers at PEWC facilities and the secondment of PEWC employees and managers to theour Company.
•Without the consent of theour Company, PEWC will not compete with respect to the manufacture or distribution of wire and cable products in any market in which theour Company is manufacturing or has taken significant steps to commence manufacturing.
•For purposes of the Composite Services Agreement, each province in China is considered the equivalent of a country.
To
10.d.a copy of which has been filed with the SEC
|
|
57
For the purposes of this summary, the term “U.S. Holder” means a beneficial owner of Common Shares that is (i) an individual citizen or resident of the United States, (ii) a corporation (including any entity treated as a corporation for U.S. federal income tax purposes) organized under the laws of the United States or any state (or the District of Columbia), or any entity taxable as a United States corporation, (iii) an estate, the income of which is subject to United States federal income tax regardless of its source, or (iv) a trust that is subject to the primary supervision of a U.S. court and the control of one or more U.S. persons, or that has a valid election in effect under applicable Treasury regulations to be treated as a U.S. person. For the purposes of this summary, the term “Non-U.S. Holder” means a beneficial owner of Common Shares that is not a U.S. Holder. The tax consequences to a Non-U.S. Holder may differ substantially from the tax consequences to a U.S. Holder. Non-U.S. Holders are strongly urged to consult their own tax advisors regarding their overall tax consequences of owning and disposing of Common Shares.
US Dollar.
The
Taxation of Dividends
Distributions received by U.S. Holders with respect to the Common Shares out of APWC’s current or accumulated earnings and profits will constitute foreign-source dividend income for U.S. federal income tax purposes. APWC does not to maintain records of earnings and profits in accordance with U.S. federal income tax principles, and therefore it is expected that APWC’s distributions will generally be reported to U.S. Holders as dividends. If you are a U.S. Holder, the dividend will be ordinary dividend income for U.S. federal income tax purposes.
58
Dividends received by an individual will be taxed at the preferential rates applicable to long-term capital gains, provided the individual has held the shares for more than 60 days during the 121-day period beginning 60 days before the ex-dividend date, that APWC is aA qualified foreign corporation and that certain other conditions are satisfied. APWC isincludes a qualified foreignnon-U.S. corporation for this purpose.
A foreign corporation is treated as a qualified foreign corporation with respect to dividends paid on stock that is readily tradable on a securities market in the United States, such as the NASDAQ Capital Market, whereif (1) its shares (including the Common Shares are traded. For so long as the Common Shares continue to be traded on Nasdaq, orShares) are readily tradable on any otheran established securities market in the United States any dividends paid by APWC should qualify for the reduced tax rates.
The dividend will not beor (2) it is eligible for the dividends-received deduction generally allowed tobenefits of a comprehensive income tax treaty with the United States that meets certain requirements. However, a corporation is not a qualified foreign corporation if it is a “passive foreign investment company” (as discussed below) for the taxable year in which the dividend is paid or the preceding taxable year. The Common Shares are traded on the Nasdaq Capital Market, an established securities market. The United States does not have a comprehensive income tax treaty with
and such holder's eligibility for a reduced rate of taxation.
A
Special
In general, a non-U.S. company will be treated If we are classified as a PFIC for U.S. federal income tax purposes, for any taxable year if either (i) at least 75% of its gross income is passive income (sucha U.S. Shareholder that does not make an election to treat us as dividends, interest, rentsa “qualified electing fund” and royalties) or (ii) at least 50% of the average quarterly value of its assets is attributable to assets that produce or are held for the production of passive income.
If APWC were determined to bedid not make a PFIC, U.S. Holders would“mark-to-market” election, each as described below, will be subject to additional U.S. federal income taxes on gain recognized with respect to the common shares and on certain distributions. In addition, an interest charge would apply to the portion of thefollowing U.S. federal income tax liability on such gains or distributions treated under the PFIC rules as having been deferred by the U.S. Holder. Moreover, dividends that a non-corporate U.S. Holder receives from APWC would not be eligible for the reduced U.S. federal income tax rates on dividends described above if APWC was a PFIC, either in the taxable year of the dividend or the preceding taxable year. Ifconsequences:
and the possibility of making certain elections designed to lessen those adverse consequences.
Payments of dividends and sales proceeds that are made within the United States or through certain U.S.-related financial intermediaries generally are
withholding requirements. Backup withholding is not an additional tax and any amounts withheld as backup withholding may be refunded (or credited against a holder’sthe U.S. Shareholder’s U.S. federal income tax liability. A holder may obtain a refund of any excess amounts withheld underliability, if any), provided that certain required information is furnished to the backup withholding rules by timely filing the appropriate claim for refund with the Internal Revenue Service and furnishing any required information.
59
Shareholders may be subject to other U.S.IRS. The information reporting requirements and should consult their own tax advisors for applicationmay apply regardless of these reporting requirements to their own facts and circumstances.
| Bermuda Taxation |
10.f.
10.g.
|
|
10.i.
60
|
|
The
|
|
The
|
|
The
|
|
61
|
|
The
|
|
|
|
|
|
|
|
|
|
2023.
The Company’s
The Company’s
63
|
|
|
|
|
|
|
|
|
|
64
|
|
The Common Shares of APWC are currently traded on the Nasdaq Capital Market tier. However, as APWC has a
|
|
Not applicable
65
|
|
The
|
|
|
|
|
|
2021
2021
2022
2021
2021
1.1 | Memorandum of Association of Asia Pacific Wire & Cable Corporation Limited (incorporated by reference to Exhibit 1.1 of the Company’s annual report on Form 20-F filed with the Securities and Exchange Commission on June 21, 2001). (P) | |||||
1.2 | ||||||
| 2.1 | ||||||
4.1 | Composite Services Agreement (incorporated by reference to Exhibit 10.1 of the Company’s Form F-1 filed with the Securities and Exchange Commission on November 13, 1996). (P) | |||||
8 | ||||||
11 | ||||||
12.1 | ||||||
12.2 | ||||||
13.1 | ||||||
66
13.2 | ||||||
15.1 | ||||||
| 97.1 | ||||||
| 101.INS* | Inline XBRL Instance Document. | |||||
| 101.SCH* | Inline XBRL Taxonomy Extension Schema Document. | |||||
| 101.CAL* | Inline XBRL Taxonomy Extension Calculation Linkbase Document. | |||||
| 101.DEF* | Inline XBRL Taxonomy Extension Definition Linkbase Document. | |||||
| 101.LAB* | Inline XBRL Taxonomy Extension Label Linkbase Document. | |||||
| 101.PRE* | Inline XBRL Taxonomy Extension Presentation Linkbase Document. | |||||
| 104* | Cover Page Interactive Data File (embedded within the Inline XBRL document). | |||||
ASIA PACIFIC WIRE & CABLE CORPORATION LIMITED | |||||||||
April | /s/ Yuan Chun Tang | ||||||||
| Name: |
| Yuan Chun Tang | |||||||
| Title: |
| Chief Executive Officer | |||||||
68
Asia Pacific Wire
C
ABLE CORPORATION LIMITED2022
Reports of independent registered public accounting firm(PCAOB ID 1345) | F- | ||||
F- | |||||
F- | |||||
F- | |||||
F- | |||||
F- | |||||
F-10 | |||||
2.1 | Preparation | ||||||
Change in Accounting Principle
As discussed in Note 4.1 the consolidated financial statements, the Company changed the manner in which it accounts for leases in 2019.
F-2
| 2023 | 2022 | 2021 | ||||||||||||||||||
| Note | US$’000 | US$’000 | US$’000 | |||||||||||||||||
| Revenue | 5(e) | 425,772 | 433,893 | 476,659 | ||||||||||||||||
| Cost of sales | 7(g),13 | (395,545) | (401,363) | (455,508) | ||||||||||||||||
| Gross profit | 30,227 | 32,530 | 21,151 | |||||||||||||||||
| Other operating income | 7(a) | 433 | 1,026 | 587 | ||||||||||||||||
| Selling, general and administrative, research and development expenses | (24,472) | (24,978) | (26,484) | |||||||||||||||||
| Other operating expenses | 7(b) | — | (3) | (7) | ||||||||||||||||
| Net impairment loss on financial and contract assets | 7(c) | (4,640) | (508) | (220) | ||||||||||||||||
| Operating profit/(loss) | 1,548 | 8,067 | (4,973) | |||||||||||||||||
| Finance costs | 7(d) | (2,527) | (1,650) | (1,251) | ||||||||||||||||
| Finance income | 7(e) | 205 | 120 | 123 | ||||||||||||||||
| Share of loss of associates | 19 | (2) | (1) | (1) | ||||||||||||||||
| Exchange gain/(loss) | 679 | 143 | (4,425) | |||||||||||||||||
| Other income | 7(f) | 570 | 889 | 671 | ||||||||||||||||
| Other expenses | (9) | (3) | (1) | |||||||||||||||||
| Profit/(loss) before tax | 464 | 7,565 | (9,857) | |||||||||||||||||
| Income tax (expense)/benefit | 8 | (162) | (2,808) | 1,345 | ||||||||||||||||
| Profit/(loss) for the year | 302 | 4,757 | (8,512) | |||||||||||||||||
| Attributable to: | ||||||||||||||||||||
| Equity holders of the parent | 3,867 | 3,874 | (2,642) | |||||||||||||||||
| Non-controlling interests | (3,565) | 883 | (5,870) | |||||||||||||||||
| 302 | 4,757 | (8,512) | ||||||||||||||||||
| Earnings/(loss) per share | ||||||||||||||||||||
| Basic and diluted profit/(loss) for the year attributable to equity holders of the parent | 9 | $ | 0.19 | $ | 0.19 | $ | (0.19) | |||||||||||||
| 2023 | 2022 | 2021 | ||||||||||||||||||
| Note | US$’000 | US$’000 | US$’000 | |||||||||||||||||
| Profit/(loss) for the year | 302 | 4,757 | (8,512) | |||||||||||||||||
| Other comprehensive income/(loss) | ||||||||||||||||||||
| Other comprehensive income/(loss) to be reclassified to profit or loss in subsequent periods: | ||||||||||||||||||||
| Exchange differences on translation of foreign operations, net of tax of $0 | 23(c) | 784 | (9,506) | (15,028) | ||||||||||||||||
| 784 | (9,506) | (15,028) | ||||||||||||||||||
| Other comprehensive income/(loss) not to be reclassified to profit or loss in subsequent periods: | ||||||||||||||||||||
| Changes in the fair value of equity instruments measured at fair value through other comprehensive income | 11(d) | 1,104 | (1,352) | 734 | ||||||||||||||||
| Income tax effect | 8 | (221) | 270 | (147) | ||||||||||||||||
| Other comprehensive income/(loss) from equity instruments measured at fair value, net of tax | 23(c) | 883 | (1,082) | 587 | ||||||||||||||||
| Re-measuring income on defined benefit plans | 21 | 1,885 | 732 | 559 | ||||||||||||||||
| Income tax effect | 8 | (377) | (147) | (112) | ||||||||||||||||
| Defined benefit pension plan, net of tax | 23(c) | 1,508 | 585 | 447 | ||||||||||||||||
| Other comprehensive income/(loss) for the year, net of tax | 3,175 | (10,003) | (13,994) | |||||||||||||||||
| Total comprehensive income/(loss) for the year, net of tax | 3,477 | (5,246) | (22,506) | |||||||||||||||||
| Attributable to: | ||||||||||||||||||||
| Equity holders of the parent | 5,464 | (3,827) | (10,193) | |||||||||||||||||
| Non-controlling interests | (1,987) | (1,419) | (12,313) | |||||||||||||||||
| 3,477 | (5,246) | (22,506) | ||||||||||||||||||
| As of December 31, | |||||||||||||||||
| 2023 | 2022 | ||||||||||||||||
| Note | US$’000 | US$’000 | |||||||||||||||
| Assets | |||||||||||||||||
| Current assets | |||||||||||||||||
| Cash and cash equivalents (excluding bank overdrafts) | 10 | 37,970 | 54,017 | ||||||||||||||
| Financial assets at fair value through profit or loss | 11 | 307 | 39 | ||||||||||||||
| Trade receivables | 12 | 104,955 | 81,982 | ||||||||||||||
| Other receivables | 12,27(e) | 1,670 | 2,397 | ||||||||||||||
| Contract assets | 14 | 13,946 | 12,450 | ||||||||||||||
| Due from related parties | 24 | 1,368 | 11,018 | ||||||||||||||
| Inventories | 13 | 128,230 | 130,608 | ||||||||||||||
| Prepayments | 2,595 | 3,341 | |||||||||||||||
| Other current assets | 3,909 | 3,673 | |||||||||||||||
| 294,950 | 299,525 | ||||||||||||||||
| Non-current assets | |||||||||||||||||
| Financial assets at fair value through other comprehensive income | 11,26 | 2,902 | 1,553 | ||||||||||||||
| Property, plant and equipment | 15,27(e) | 49,941 | 50,713 | ||||||||||||||
| Right of use assets | 16(a) | 2,825 | 3,432 | ||||||||||||||
| Investment properties | 17,26 | 5,112 | 5,250 | ||||||||||||||
| Intangible assets | 18 | 124 | 139 | ||||||||||||||
| Investments in associates | 19 | 810 | 805 | ||||||||||||||
| Deferred tax assets | 8 | 7,799 | 7,143 | ||||||||||||||
| Other non-current assets | 2,201 | 2,459 | |||||||||||||||
| 71,714 | 71,494 | ||||||||||||||||
| Total assets | 366,664 | 371,019 | |||||||||||||||
| Liabilities | |||||||||||||||||
| Current liabilities | |||||||||||||||||
| Interest-bearing loans and borrowings | 11(b) | 53,737 | 45,576 | ||||||||||||||
| Trade and other payables | 20 | 51,743 | 39,891 | ||||||||||||||
| Due to related parties | 24 | 7,941 | 16,613 | ||||||||||||||
| Financial liabilities at fair value through profit or loss | 11,26 | 74 | 6 | ||||||||||||||
| Accruals | 15,250 | 21,218 | |||||||||||||||
| Current tax liabilities | 2,116 | 2,432 | |||||||||||||||
| Employee benefit liabilities | 21 | 1,839 | 1,947 | ||||||||||||||
| Lease liabilities | 638 | 627 | |||||||||||||||
| Other current liabilities | 22 | 7,235 | 5,289 | ||||||||||||||
| 140,573 | 133,599 | ||||||||||||||||
| Non-current liabilities | |||||||||||||||||
| Interest-bearing loans and borrowings | 11(b) | — | 12,155 | ||||||||||||||
| Employee benefit liabilities | 21 | 5,997 | 7,693 | ||||||||||||||
| Lease liabilities | 1,445 | 1,947 | |||||||||||||||
| Deferred tax liabilities | 8 | 3,840 | 4,197 | ||||||||||||||
| Other non-current liabilities | 3 | 188 | — | ||||||||||||||
| 11,470 | 25,992 | ||||||||||||||||
| Total liabilities | 152,043 | 159,591 | |||||||||||||||
| Equity | 23 | ||||||||||||||||
| Issued capital | 206 | 206 | |||||||||||||||
| Additional paid-in capital | 118,103 | 118,103 | |||||||||||||||
| Treasury shares | (38) | (38) | |||||||||||||||
| Retained earnings | 57,931 | 54,064 | |||||||||||||||
| Other components of equity | (19,143) | (20,740) | |||||||||||||||
| Equity attributable to equity holders of the parent | 157,059 | 151,595 | |||||||||||||||
| Non-controlling interests | 6 | 57,562 | 59,833 | ||||||||||||||
| Total equity | 214,621 | 211,428 | |||||||||||||||
| Total liabilities and equity | 366,664 | 371,019 | |||||||||||||||
| Attributable to the equity holders of the parent | ||||||||||||||||||||||||||||||||||||||||||||||||||||||||||||||
| Issued capital | Additional paid-in capital | Treasury shares | Retained earnings | Remeasurement of defined benefit plans | Financial assets at FVOCI reserve | Foreign currency translation reserve | Total | Non-controlling interests | Total equity | |||||||||||||||||||||||||||||||||||||||||||||||||||||
| Note | US$’000 | US$’000 | US$’000 | US$’000 | US$’000 | US$’000 | US$’000 | US$’000 | US$’000 | US$’000 | ||||||||||||||||||||||||||||||||||||||||||||||||||||
| Balance at January 1, 2021 | 138 | 110,416 | (38) | 52,832 | (1,540) | 655 | (4,603) | 157,860 | 77,015 | 234,875 | ||||||||||||||||||||||||||||||||||||||||||||||||||||
| Net profit | — | — | — | (2,642) | — | — | — | (2,642) | (5,870) | (8,512) | ||||||||||||||||||||||||||||||||||||||||||||||||||||
| Other comprehensive income/(loss) | 23 | — | — | — | — | 228 | 300 | (8,079) | (7,551) | (6,443) | (13,994) | |||||||||||||||||||||||||||||||||||||||||||||||||||
| Total comprehensive income/(loss) | — | — | — | (2,642) | 228 | 300 | (8,079) | (10,193) | (12,313) | (22,506) | ||||||||||||||||||||||||||||||||||||||||||||||||||||
| Dividends paid | 23 | — | — | — | — | — | — | — | — | (2,817) | (2,817) | |||||||||||||||||||||||||||||||||||||||||||||||||||
| Effect from the changes in shareholding percentage in subsidiary | 23 | (167) | (167) | (68) | (235) | |||||||||||||||||||||||||||||||||||||||||||||||||||||||||
| Balance at December 31, 2021 | 138 | 110,249 | (38) | 50,190 | (1,312) | 955 | (12,682) | 147,500 | 61,817 | 209,317 | ||||||||||||||||||||||||||||||||||||||||||||||||||||
| Net loss | — | — | — | 3,874 | — | — | — | 3,874 | 883 | 4,757 | ||||||||||||||||||||||||||||||||||||||||||||||||||||
| Other comprehensive income/(loss) | 23 | — | — | — | — | 298 | (551) | (7,448) | (7,701) | (2,302) | (10,003) | |||||||||||||||||||||||||||||||||||||||||||||||||||
| Total comprehensive income/(loss) | — | — | — | 3,874 | 298 | (551) | (7,448) | (3,827) | (1,419) | (5,246) | ||||||||||||||||||||||||||||||||||||||||||||||||||||
| Dividends paid | 23 | — | — | — | — | — | — | — | — | (565) | (565) | |||||||||||||||||||||||||||||||||||||||||||||||||||
| Issuance of common stock for cash | 23 | 68 | 7,854 | — | — | — | — | — | 7,922 | — | 7,922 | |||||||||||||||||||||||||||||||||||||||||||||||||||
| Balance at December 31, 2022 | 206 | 118,103 | (38) | 54,064 | (1,014) | 404 | (20,130) | 151,595 | 59,833 | 211,428 | ||||||||||||||||||||||||||||||||||||||||||||||||||||
| Net profit | — | — | — | 3,867 | — | — | — | 3,867 | (3,565) | 302 | ||||||||||||||||||||||||||||||||||||||||||||||||||||
| Other comprehensive income/(loss) | 23 | — | — | — | — | 768 | 450 | 379 | 1,597 | 1,578 | 3,175 | |||||||||||||||||||||||||||||||||||||||||||||||||||
| Total comprehensive income/(loss) | — | — | — | 3,867 | 768 | 450 | 379 | 5,464 | (1,987) | 3,477 | ||||||||||||||||||||||||||||||||||||||||||||||||||||
| Dividends paid | 23 | — | — | — | — | — | — | — | — | (284) | (284) | |||||||||||||||||||||||||||||||||||||||||||||||||||
| Balance at December 31, 2023 | 206 | 118,103 | (38) | 57,931 | (246) | 854 | (19,751) | 157,059 | 57,562 | 214,621 | ||||||||||||||||||||||||||||||||||||||||||||||||||||
| 2023 | 2022 | 2021 | ||||||||||||||||||
| Note | US$’000 | US$’000 | US$’000 | |||||||||||||||||
| Operating activities: | ||||||||||||||||||||
| Profit/(loss) before tax | 464 | 7,565 | (9,857) | |||||||||||||||||
| Adjustments to reconcile profit before tax to net cash provided by operating activities: | ||||||||||||||||||||
| Depreciation | 15,16,17 | 6,157 | 5,790 | 5,447 | ||||||||||||||||
| Impairment of property, plant and equipment | 15 | — | — | 7 | ||||||||||||||||
| Amortization of intangible assets | 18 | 54 | 45 | 47 | ||||||||||||||||
| Gain on disposal of property, plant and equipment | 7(a) | (39) | (132) | (318) | ||||||||||||||||
| Gain on disposal of assets classified as held for sale | 7(a) | — | (240) | — | ||||||||||||||||
| Gain on disposal of investment property | 7(a) | — | (271) | — | ||||||||||||||||
| Adjustment for on fair value of derivatives | 7(f) | (196) | (33) | (259) | ||||||||||||||||
| Dividend income | 7(f) | (97) | (97) | (106) | ||||||||||||||||
| Finance income | 7(e) | (205) | (120) | (123) | ||||||||||||||||
| Finance costs | 7(d) | 2,527 | 1,650 | 1,251 | ||||||||||||||||
| Share of loss of associates | 19 | 2 | 1 | 1 | ||||||||||||||||
| Impairment for trade receivables | 7(b),12(a) | 75 | 509 | 205 | ||||||||||||||||
| Impairment (reversal of impairment) for trade receivables for related parties | 7(a),7(b),7(c) | 4,565 | (1) | 15 | ||||||||||||||||
| Impairment (write-back of impairment) of inventories | 13 | (10,255) | (1,119) | 14,136 | ||||||||||||||||
| Unrealized foreign exchange difference, net | (325) | 245 | 1,784 | |||||||||||||||||
| (Gain) on lease modification | — | (74) | (2) | |||||||||||||||||
| Changes in operating assets and liabilities | ||||||||||||||||||||
| Trade and other receivable | (21,003) | 16,720 | (25,739) | |||||||||||||||||
| Contract assets | (1,236) | (952) | (1,387) | |||||||||||||||||
| Inventories | 13,917 | (4,389) | (53,857) | |||||||||||||||||
| Prepayment and other current assets | 820 | (35) | (886) | |||||||||||||||||
| Amounts due to/from related parties | (3,772) | 807 | 3,911 | |||||||||||||||||
| Other non-current assets | 195 | (54) | (169) | |||||||||||||||||
| Trade and other payables, accruals, other current liabilities and other non-current liabilities | 6,659 | (14,035) | 28,896 | |||||||||||||||||
| Net cash flows (used in)/provided by operating activities | (1,693) | 11,780 | (37,003) | |||||||||||||||||
| Dividend received | 97 | 97 | 106 | |||||||||||||||||
| Interest received | 205 | 119 | 131 | |||||||||||||||||
| Interest paid | (2,381) | (1,475) | (1,078) | |||||||||||||||||
| Income tax paid | (2,318) | (3,955) | (3,768) | |||||||||||||||||
| Net cash (used in)/provided by operating activities | (6,090) | 6,566 | (41,612) | |||||||||||||||||
| Investing activities: | ||||||||||||||||||||
| Purchases of property, plant and equipment | 28 | (4,254) | (3,746) | (8,547) | ||||||||||||||||
| Purchases of intangible assets | 18 | (40) | (62) | (4) | ||||||||||||||||
| Purchases of investment properties | 17 | — | (12) | — | ||||||||||||||||
| Purchases of long-term bank deposits | (87) | — | (38) | |||||||||||||||||
| Purchases of short-term bank deposits | (407) | — | (1,364) | |||||||||||||||||
| (Investment in) financial assets at fair value through OCI | 11 | (240) | — | — | ||||||||||||||||
| Proceeds from disposal of held for sale assets | — | 241 | — | |||||||||||||||||
| Proceeds from disposal of property, plant and equipment | 168 | 204 | 399 | |||||||||||||||||
| Proceeds from disposal of investment property | — | 301 | — | |||||||||||||||||
| Proceeds from maturities of long-term bank deposits | — | 307 | — | |||||||||||||||||
| Proceeds from maturities of short-term bank deposits | — | 112 | 3,401 | |||||||||||||||||
| Net cash used in investing activities | (4,860) | (2,655) | (6,153) | |||||||||||||||||
| 2023 | 2022 | 2021 | ||||||||||||||||||
| Note | US$’000 | US$’000 | US$’000 | |||||||||||||||||
| Financing activities: | ||||||||||||||||||||
| Dividend paid to non-controlling shareholders of subsidiaries | 28 | (357) | (565) | (2,817) | ||||||||||||||||
| Issuance of common stock for cash | 23 | — | 7,922 | — | ||||||||||||||||
| Repayments of borrowings | 28 | (7,256) | (19,278) | (11,819) | ||||||||||||||||
| Repayments of borrowings - related parties | — | — | (6,000) | |||||||||||||||||
| Proceeds from borrowings | 28 | 2,799 | 22,167 | 63,915 | ||||||||||||||||
| Principal elements of lease payments | 28 | (691) | (616) | (632) | ||||||||||||||||
| Effect from the changes in shareholding percentage in subsidiary | — | — | (235) | |||||||||||||||||
| Net cash (used in)/provided by financing activities | (5,505) | 9,630 | 42,412 | |||||||||||||||||
| Effect of exchange rate | 408 | (2,036) | (4,372) | |||||||||||||||||
| Net (decrease) increase in cash and cash equivalents | (16,047) | 11,505 | (9,725) | |||||||||||||||||
| Cash and cash equivalents at beginning of year | 10 | 54,017 | 42,512 | 52,237 | ||||||||||||||||
| Cash and cash equivalents at end of year | 10 | 37,970 | 54,017 | 42,512 | ||||||||||||||||
| Percentage of equity interest | ||||||||||||||
| Place of incorporation and operations | 2023 | 2022 | ||||||||||||
| The British Virgin Islands | ||||||||||||||
| APWC General Holdings Limited | 100 | % | 100 | % | ||||||||||
| PRC (APWC) Holding Ltd. | 100 | % | 100 | % | ||||||||||
| Samray Inc. | 100 | % | 100 | % | ||||||||||
| Siam (APWC) Holdings Ltd. | 100 | % | 100 | % | ||||||||||
| Moon View Ltd. | 100 | % | 100 | % | ||||||||||
| Trigent Investment Holdings Limited | 100 | % | 100 | % | ||||||||||
| Crown Century Holdings Ltd. | 100 | % | 100 | % | ||||||||||
| Singapore | ||||||||||||||
| Sigma Cable Company (Private) Limited (“Sigma Cable”) | 98.30 | % | 98.30 | % | ||||||||||
| Epan Industries Pte Ltd. | 98.30 | % | 98.30 | % | ||||||||||
| Singvale Pte Ltd. | 100 | % | 100 | % | ||||||||||
| The People’s Republic of China (“PRC”) | ||||||||||||||
| Ningbo Pacific Cable Co., Ltd. (“Ningbo Pacific”) | 97.93 | % | 97.93 | % | ||||||||||
| Shanghai Yayang Electric Co., Ltd. (“SYE”) | 68.75 | % | 68.75 | % | ||||||||||
| Pacific Electric Wire & Cable (Shenzhen) Co., Ltd. (“PEWS”) | 97.93 | % | 97.93 | % | ||||||||||
| Hong Kong | ||||||||||||||
| Crown Century Holdings Limited (“CCH (HK)”) | 97.93 | % | 97.93 | % | ||||||||||
| Australia | ||||||||||||||
| Australia Pacific Electric Cable Pty Limited (“APEC”) | 98.06 | % | 98.06 | % | ||||||||||
| Thailand | ||||||||||||||
| Charoong Thai Wire and Cable Public Company Limited (“Charoong Thai”) (i) | 50.93 | % | 50.93 | % | ||||||||||
| Siam Pacific Electric Wire & Cable Company Limited (“Siam Pacific”) | 50.93 | % | 50.93 | % | ||||||||||
| Double D Cable Company Limited (“Double D”) | 50.93 | % | 50.93 | % | ||||||||||
| Hard Lek Limited. | 73.98 | % | 73.98 | % | ||||||||||
| APWC (Thailand) Co., Ltd. | 99.48 | % | 99.48 | % | ||||||||||
| PEWC (Thailand) Co., Ltd. | 99.48 | % | 99.48 | % | ||||||||||
| CTW Beta Co., Ltd. | 50.89 | % | 50.89 | % | ||||||||||
| Siam Fiber Optics Co., Ltd. (“SFO”) | 50.93 | % | 50.93 | % | ||||||||||
| Taiwan | ||||||||||||||
| Asia Pacific New Energy Corporation Limited ("APNEC") (ii) | 100.00 | % | 100.00 | % | ||||||||||
| Pacific Smart System Corporation Limited ("PSSC") (ii) (Formerly YASHIN Energy Corporation Limited) | 100.00 | % | 100.00 | % | ||||||||||
| YADING Energy Corporation Limited ("YADING") | 100.00 | % | 100.00 | % | ||||||||||
| ► Buildings | 15-30 years | ||||
| ► Building improvement | 2-20 years | ||||
| ► Machinery and equipment | 4-20 years | ||||
| ► Motor vehicles | 3-10 years | ||||
| ► Office equipment | 3-20 years | ||||
| ►Land use right | 2 to 37 years | ||||
| ►Buildings | 2 to 3 years | ||||
| ►Motor vehicles | 2 to 3 years | ||||
| ►Office equipment | 3 to 5 years | ||||
The principal considerations for our determination that performing procedures relating to revenue recognition – estimating measure of progress for supply, delivery and installation is a critical audit matter are there was significant judgment by management when determining the total expected input costs toward complete satisfaction of performance obligation. This in turn led to a high degree of auditor judgment, subjectivity and effort in performing audit procedures and in evaluating audit evidence relating to revenue generated from SDI contracts.
Addressing the matter involved performing procedures and evaluating audit evidence in connection with forming our overall opinion on the consolidated financial statements. These procedures included, among others, (i) testing management’s process for determining the estimate of total costs to complete its contracts, which included evaluating the reasonableness of significant assumptions made by management including materials, direct labor and third party-costs; (ii) evaluating the appropriateness of changes to management’s estimate of total costs to complete throughout the duration of the contract, testing actual direct costs incurred; and (iii) evaluating management’s ability to reasonably estimate the total expected costs to complete contracts, which included performing a comparison of management’s prior period cost estimates to final actual costs.
/s/ PricewaterhouseCoopers, Taiwan
Taipei, Taiwan
Republic of China
April 29, 2021
We have served as the Company's auditor since 2017.
F-3
ASIA PACIFIC WIRE & CABLE CORPORATION LIMITED
CONSOLIDATED INCOME STATEMENTS
For the years ended December 31, 2020, 2019 and 2018
|
|
|
| 2020 |
| 2019 |
| 2018 |
| |||
| Note |
| US$’000 |
| US$’000 |
| US$’000 |
| ||||
Revenue | 5(e) |
|
| 313,564 |
|
| 338,160 |
|
| 425,940 |
| |
|
|
|
|
|
|
|
|
|
|
|
|
|
Cost of sales | 7(g),13 |
|
| (279,686 | ) |
| (313,373 | ) |
| (389,692 | ) | |
Gross profit |
|
|
|
| 33,878 |
|
| 24,787 |
|
| 36,248 |
|
|
|
|
|
|
|
|
|
|
|
|
|
|
Other operating income | 7(a) |
|
| 814 |
|
| 385 |
|
| 805 |
| |
Selling, general and administrative expenses | 7(g) |
|
| (27,006 | ) |
| (25,051 | ) |
| (26,924 | ) | |
Other operating expenses | 7(b) |
|
| (129 | ) |
| (770 | ) |
| (1,445 | ) | |
Operating profit /(loss) |
|
|
|
| 7,557 |
|
| (649 | ) |
| 8,684 |
|
|
|
|
|
|
|
|
|
|
|
|
|
|
Finance costs | 7(c) |
|
| (744 | ) |
| (1,012 | ) |
| (1,378 | ) | |
Finance income | 7(d) |
|
| 320 |
|
| 506 |
|
| 482 |
| |
Share of loss of associates |
| 19 |
|
| (1 | ) |
| (3 | ) |
| (3 | ) |
Exchange (loss)/gain |
|
|
|
| (579 | ) |
| 1,550 |
|
| 1,741 |
|
Other income | 7(e) |
|
| 1,173 |
|
| 717 |
|
| 1,817 |
| |
Other expense | 7(f) |
|
| (1 | ) |
| (3 | ) |
| (11 | ) | |
Profit before tax |
|
|
|
| 7,725 |
|
| 1,106 |
|
| 11,332 |
|
|
|
|
|
|
|
|
|
|
|
|
|
|
Income tax expense |
| 8 |
|
| (4,016 | ) |
| (2,057 | ) |
| (3,886 | ) |
Profit/(Loss) for the year |
|
|
|
| 3,709 |
|
| (951 | ) |
| 7,446 |
|
|
|
|
|
|
|
|
|
|
|
|
|
|
Attributable to: |
|
|
|
|
|
|
|
|
|
|
|
|
Equity holders of the parent |
|
|
|
| (552 | ) |
| (1,632 | ) |
| 2,928 |
|
Non-controlling interests |
|
|
|
| 4,261 |
|
| 681 |
|
| 4,518 |
|
|
|
|
|
| 3,709 |
|
| (951 | ) |
| 7,446 |
|
|
|
|
|
|
|
|
|
|
|
|
|
|
(Loss) /earnings per share |
|
|
|
|
|
|
|
|
|
|
|
|
Basic and diluted (loss) / profit for the year attributable to equity holders of the parent |
| 9 |
| $ | (0.04 | ) | $ | (0.12 | ) | $ | 0.21 |
|
The accompanying notes are an integral part of these consolidated financial statements.
F-4
ASIA PACIFIC WIRE & CABLE CORPORATION LIMITED
CONSOLIDATED STATEMENTS OF COMPREHENSIVE INCOME
For the years ended December 31, 2020, 2019 and 2018
|
|
|
| 2020 |
| 2019 |
| 2018 |
| |||
| Note |
| US$’000 |
| US$’000 |
| US$’000 |
| ||||
Profit /(loss) for the year |
|
|
|
| 3,709 |
|
| (951 | ) |
| 7,446 |
|
Other comprehensive income/(loss) |
|
|
|
|
|
|
|
|
|
|
|
|
Other comprehensive income /(loss) to be reclassified to profit or loss in subsequent periods: |
|
|
|
|
|
|
|
|
|
|
|
|
|
|
|
|
|
|
|
|
|
|
|
|
|
Exchange differences on translation of foreign operations, net of tax of $0 | 23(c) |
|
| 5,211 |
|
| 10,677 |
|
| (4,388 | ) | |
|
|
|
|
| 5,211 |
|
| 10,677 |
|
| (4,388 | ) |
|
|
|
|
|
|
|
|
|
|
|
|
|
Other comprehensive income/(loss) not to be reclassified to profit or loss in subsequent periods: |
|
|
|
|
|
|
|
|
|
|
|
|
|
|
|
|
|
|
|
|
|
|
|
|
|
Changes in the fair value of equity instruments measured at fair value through other comprehensive income | 11(d) |
|
| (1,789 | ) |
| 1,670 |
|
| (419 | ) | |
Income tax effect |
| 8 |
|
| 358 |
|
| (334 | ) |
| 84 |
|
Other comprehensive income from equity instruments measured at fair value, net of tax | 23(c) |
|
| (1,431 | ) |
| 1,336 |
|
| (335 | ) | |
Re-measuring income/(loss) on defined benefit plans |
| 21 |
|
| 199 |
|
| (1,727 | ) |
| (410 | ) |
Income tax effect |
| 8 |
|
| (40 | ) |
| 345 |
|
| 82 |
|
Defined benefit pension plan, net of tax | 23(c) |
|
| 159 |
|
| (1,382 | ) |
| (328 | ) | |
|
|
|
|
|
|
|
|
|
|
|
|
|
Other comprehensive income/(loss) for the year, net of tax |
|
|
|
| 3,939 |
|
| 10,631 |
|
| (5,051 | ) |
|
|
|
|
|
|
|
|
|
|
|
|
|
Total comprehensive income for the year, net of tax |
|
|
|
| 7,648 |
|
| 9,680 |
|
| 2,395 |
|
|
|
|
|
|
|
|
|
|
|
|
|
|
Attributable to: |
|
|
|
|
|
|
|
|
|
|
|
|
Equity holders of the parent |
|
|
|
| 4,006 |
|
| 3,786 |
|
| (2,038 | ) |
Non-controlling interests |
|
|
|
| 3,642 |
|
| 5,894 |
|
| 4,433 |
|
|
|
|
|
| 7,648 |
|
| 9,680 |
|
| 2,395 |
|
The accompanying notes are an integral part of these consolidated financial statements.
F-5
ASIA PACIFIC WIRE & CABLE CORPORATION LIMITED
As of December 31, 2020 and 2019
|
|
|
| As of December 31, |
| ||||
|
|
|
| 2020 |
| 2019 |
| ||
| Note |
| US$’000 |
| US$’000 |
| |||
Assets |
|
|
|
|
|
|
|
|
|
Current assets |
|
|
|
|
|
|
|
|
|
Cash and cash equivalents |
| 10 |
|
| 52,237 |
|
| 53,673 |
|
Trade receivables |
| 12 |
|
| 82,071 |
|
| 74,077 |
|
Other receivables | 12,27(e) |
|
| 6,192 |
|
| 6,868 |
| |
Contract assets |
| 14 |
|
| 10,245 |
|
| 4,686 |
|
Due from related parties |
| 24 |
|
| 10,982 |
|
| 11,566 |
|
Inventories |
| 13 |
|
| 96,371 |
|
| 85,187 |
|
Prepayments |
|
|
|
| 4,055 |
|
| 1,926 |
|
Other current assets |
|
|
|
| 1,546 |
|
| 1,521 |
|
|
|
|
|
| 263,699 |
|
| 239,504 |
|
Non-current assets |
|
|
|
|
|
|
|
|
|
Financial assets at fair value through other comprehensive income | 11,26 |
|
| 2,271 |
|
| 4,062 |
| |
Property, plant and equipment | 15,27(e) |
|
| 54,700 |
|
| 41,747 |
| |
Right of use assets | 16(a) |
|
| 3,248 |
|
| 3,735 |
| |
Investment properties | 7(a),17,26 |
|
| 6,378 |
|
| 730 |
| |
Intangible assets |
| 18 |
|
| 180 |
|
| 128 |
|
Investments in associates |
| 19 |
|
| 930 |
|
| 935 |
|
Deferred tax assets |
| 8 |
|
| 3,889 |
|
| 3,939 |
|
Other non-current assets |
|
|
|
| 2,824 |
|
| 4,131 |
|
|
|
|
|
| 74,420 |
|
| 59,407 |
|
Total assets |
|
|
|
| 338,119 |
|
| 298,911 |
|
|
|
|
|
|
|
|
|
|
|
Liabilities |
|
|
|
|
|
|
|
|
|
Current liabilities |
|
|
|
|
|
|
|
|
|
Interest-bearing loans and borrowings | 11(b) |
|
| 10,131 |
|
| 11,356 |
| |
Trade and other payables |
| 20 |
|
| 27,370 |
|
| 16,879 |
|
Due to related parties |
| 24 |
|
| 10,620 |
|
| 3,284 |
|
Financial liabilities at fair value through profit or loss | 11,26 |
|
| — |
|
| 3 |
| |
Accruals |
|
|
|
| 21,361 |
|
| 14,437 |
|
Current tax liabilities |
| 8 |
|
| 3,567 |
|
| 2,872 |
|
Employee benefit liabilities |
| 21 |
|
| 1,950 |
|
| 1,888 |
|
Lease liabilities | 11(d) |
|
| 551 |
|
| 574 |
| |
Other current liabilities | 22 |
|
| 7,826 |
|
| 2,356 |
| |
|
|
|
|
| 83,376 |
|
| 53,649 |
|
Non-current liabilities |
|
|
|
|
|
|
|
|
|
Interest-bearing loans and borrowings | 11(b) |
|
| 3,650 |
|
| — |
| |
Employee benefit liabilities |
| 21 |
|
| 10,027 |
|
| 10,434 |
|
Lease liabilities | 11(d) |
|
| 1,783 |
|
| 2,254 |
| |
Deferred tax liabilities |
| 8 |
|
| 4,408 |
|
| 4,139 |
|
|
|
|
|
| 19,868 |
|
| 16,827 |
|
Total liabilities |
|
|
|
| 103,244 |
|
| 70,476 |
|
|
|
|
|
|
|
|
|
|
|
Equity |
| 23 |
|
|
|
|
|
|
|
Issued capital |
|
|
|
| 138 |
|
| 138 |
|
Additional paid-in capital |
|
|
|
| 110,416 |
|
| 110,416 |
|
Treasury shares |
|
|
|
| (38 | ) |
| (38 | ) |
Retained earnings |
|
|
|
| 52,832 |
|
| 53,384 |
|
Other components of equity |
|
|
|
| (5,488 | ) |
| (10,046 | ) |
Equity attributable to equity holders of the parent |
|
|
|
| 157,860 |
|
| 153,854 |
|
Non-controlling interests |
| 6 |
|
| 77,015 |
|
| 74,581 |
|
Total equity |
|
|
|
| 234,875 |
|
| 228,435 |
|
Total liabilities and equity |
|
|
|
| 338,119 |
|
| 298,911 |
|
The accompanying notes are an integral part of these consolidated financial statements.
F-6
ASIA PACIFIC WIRE & CABLE CORPORATION LIMITED
CONSOLIDATED STATEMENTS OF CHANGES IN EQUITY
For the years ended December 31, 2020, 2019 and 2018
|
| Attributable to the equity holders of the parent |
|
|
|
|
|
|
| ||||||||||||||||||||||
|
| Issued capital |
| Additional paid-in capital |
| Treasury shares |
| Retained earnings |
| Remeasurement of defined benefit plans |
| Financial assets at FVOCI reserve |
| Foreign currency translation reserve |
| Total |
| Non-controlling interests |
| Total equity |
| ||||||||||
| Note | US$’000 |
| US$’000 |
| US$’000 |
| US$’000 |
| US$’000 |
| US$’000 |
| US$’000 |
| US$’000 |
| US$’000 |
| US$’000 |
| ||||||||||
Balance at January 1, 2018 |
|
| 138 |
|
| 110,376 |
|
| (38 | ) |
| 53,194 |
|
| (750 | ) |
| 874 |
|
| (10,622 | ) |
| 153,172 |
|
| 69,561 |
|
| 222,733 |
|
Net profit |
|
| — |
|
| — |
|
| — |
|
| 2,928 |
|
| — |
|
| — |
|
| — |
|
| 2,928 |
|
| 4,518 |
|
| 7,446 |
|
Other comprehensive income/(loss) | 23 |
| — |
|
| — |
|
| — |
|
| — |
|
| (167 | ) |
| (170 | ) |
| (4,629 | ) |
| (4,966 | ) |
| (85 | ) |
| (5,051 | ) |
Total comprehensive income/(loss) |
|
| — |
|
| — |
|
| — |
|
| 2,928 |
|
| (167 | ) |
| (170 | ) |
| (4,629 | ) |
| (2,038 | ) |
| 4,433 |
|
| 2,395 |
|
Dividend paid | 23 |
| — |
|
| — |
|
| — |
|
| (1,106 | ) |
| — |
|
| — |
|
| — |
|
| (1,106 | ) |
| (2,206 | ) |
| (3,312 | ) |
Balance at December 31, 2018 |
|
| 138 |
|
| 110,376 |
|
| (38 | ) |
| 55,016 |
|
| (917 | ) |
| 704 |
|
| (15,251 | ) |
| 150,028 |
|
| 71,788 |
|
| 221,816 |
|
Net loss |
|
| — |
|
| — |
|
| — |
|
| (1,632 | ) |
| — |
|
| — |
|
| — |
|
| (1,632 | ) |
| 681 |
|
| (951 | ) |
Other comprehensive income/(loss) | 23 |
| — |
|
| — |
|
| — |
|
| — |
|
| (704 | ) |
| 680 |
|
| 5,442 |
|
| 5,418 |
|
| 5,213 |
|
| 10,631 |
|
Total comprehensive income/(loss) |
|
| — |
|
| — |
|
| — |
|
| (1,632 | ) |
| (704 | ) |
| 680 |
|
| 5,442 |
|
| 3,786 |
|
| 5,894 |
|
| 9,680 |
|
Dividends paid | 23 |
| — |
|
| — |
|
| — |
|
| — |
|
| — |
|
| — |
|
| — |
|
| — |
|
| (2,763 | ) |
| (2,763 | ) |
Effect from the changes in shareholding percentage in subsidiary |
|
| — |
|
| 40 |
|
| — |
|
| — |
|
| — |
|
| — |
|
| — |
|
| 40 |
|
| (338 | ) |
| (298 | ) |
Balance at December 31, 2019 |
|
| 138 |
|
| 110,416 |
|
| (38 | ) |
| 53,384 |
|
| (1,621 | ) |
| 1,384 |
|
| (9,809 | ) |
| 153,854 |
|
| 74,581 |
|
| 228,435 |
|
Net profit |
|
| — |
|
| — |
|
| — |
|
| (552 | ) |
| — |
|
| — |
|
| — |
|
| (552 | ) |
| 4,261 |
|
| 3,709 |
|
Other comprehensive income/(loss) | 23 |
| — |
|
| — |
|
| — |
|
| — |
|
| 81 |
|
| (729 | ) |
| 5,206 |
|
| 4,558 |
|
| (619 | ) |
| 3,939 |
|
Total comprehensive income/(loss) |
|
| — |
|
| — |
|
| — |
|
| (552 | ) |
| 81 |
|
| (729 | ) |
| 5,206 |
|
| 4,006 |
|
| 3,642 |
|
| 7,648 |
|
Dividends paid | 23 |
| — |
|
| — |
|
| — |
|
| — |
|
| — |
|
| — |
|
| — |
|
| — |
|
| (1,208 | ) |
| (1,208 | ) |
Balance at December 31, 2020 |
|
| 138 |
|
| 110,416 |
|
| (38 | ) |
| 52,832 |
|
| (1,540 | ) |
| 655 |
|
| (4,603 | ) |
| 157,860 |
|
| 77,015 |
|
| 234,875 |
|
The accompanying notes are an integral part of these consolidated financial statements.
F-7
ASIA PACIFIC WIRE & CABLE CORPORATION LIMITED
CONSOLIDATED STATEMENTS OF CASH FLOWS
For the years ended December 31, 2020, 2019, and 2018
|
|
|
| 2020 |
| 2019 |
| 2018 |
| |||
| Note |
| US$’000 |
| US$’000 |
| US$’000 |
| ||||
Operating activities: |
|
|
|
|
|
|
|
|
|
|
|
|
Profit before tax |
|
|
|
| 7,725 |
|
| 1,106 |
|
| 11,332 |
|
Adjustments to reconcile profit before tax to net cash provided by operating activities: |
|
|
|
|
|
|
|
|
|
|
|
|
Depreciation | 15,16,17 |
|
| 5,340 |
|
| 5,274 |
|
| 4,936 |
| |
Impairment of property, plant and equipment |
| 15 |
|
| 202 |
|
| 546 |
|
| 11 |
|
Amortization of prepaid land lease payments |
| 16 |
|
| — |
|
| — |
|
| 38 |
|
Amortization of intangible assets |
| 18 |
|
| 62 |
|
| 50 |
|
| 44 |
|
Gain on disposal of property, plant and equipment | 7(a) |
|
| (239 | ) |
| (88 | ) |
| (93 | ) | |
Adjustment for (gain) loss on fair value of derivatives | 7(e),7(f) |
|
| (3 | ) |
| (146 | ) |
| 2 |
| |
Dividend income | 7(e) |
|
| (108 | ) |
| (109 | ) |
| (105 | ) | |
Finance income | 7(d) |
|
| (320 | ) |
| (506 | ) |
| (482 | ) | |
Finance costs | 7(c) |
|
| 744 |
|
| 1,012 |
|
| 1,378 |
| |
Share of loss of associates |
| 19 |
|
| 1 |
|
| 3 |
|
| 3 |
|
Impairment (reversal of impairment) for trade receivables | 7(b),12(a) |
|
| 124 |
|
| (122 | ) |
| 570 |
| |
(Reversal of impairment) impairment for trade receivables for related parties | 7(a),7(b) |
|
| (11 | ) |
| — |
|
| 1 |
| |
(Reversal of impairment) impairment of other receivable | 7(a),7(b) |
|
| (80 | ) |
| 30 |
|
| 53 |
| |
(Write-back of impairment) impairment of inventories |
| 13 |
|
| (240 | ) |
| (322 | ) |
| 1,613 |
|
Unrealized foreign exchange difference, net |
|
|
|
| 411 |
|
| (503 | ) |
| (742 | ) |
Noncash other operating income |
|
|
|
| (60 | ) |
| — |
|
| — |
|
Changes in operating assets and liabilities |
|
|
|
|
|
|
|
|
|
|
|
|
Trade and other receivable, net |
|
|
|
| (1,899 | ) |
| 16,031 |
|
| 27,993 |
|
Contract assets |
|
|
|
| (5,242 | ) |
| (3,160 | ) |
| (1,317 | ) |
Inventories |
|
|
|
| (8,828 | ) |
| 3,166 |
|
| 10,339 |
|
Prepayment and other current assets |
|
|
|
| (1,928 | ) |
| 484 |
|
| 133 |
|
Amounts due to/from related parties |
|
|
|
| 2,777 |
|
| 1,177 |
|
| (1,422 | ) |
Other non-current assets |
|
|
|
| 42 |
|
| (238 | ) |
| (55 | ) |
Trade and other payables, accruals, other current liabilities and other non-current liabilities |
|
|
|
| 19,917 |
|
| (5,527 | ) |
| (8,518 | ) |
Net cash flows provided by operating activities |
|
|
|
| 18,387 |
|
| 18,158 |
|
| 45,712 |
|
Dividend received |
|
|
|
| 108 |
|
| 109 |
|
| 105 |
|
Interest received |
|
|
|
| 1,199 |
|
| 457 |
|
| 405 |
|
Interest paid |
|
|
|
| (613 | ) |
| (894 | ) |
| (1,216 | ) |
Income tax paid |
|
|
|
| (2,706 | ) |
| (2,690 | ) |
| (4,357 | ) |
Net cash provided by operating activities |
|
|
|
| 16,375 |
|
| 15,140 |
|
| 40,649 |
|
Investing activities: |
|
|
|
|
|
|
|
|
|
|
|
|
Purchases of property, plant and equipment |
| 28 |
|
| (14,537 | ) |
| (5,442 | ) |
| (4,441 | ) |
Purchases of intangible assets |
| 18 |
|
| (67 | ) |
| (20 | ) |
| (67 | ) |
Purchases of investment properties |
| 28 |
|
| (1,762 | ) |
| — |
|
| — |
|
Purchases of long-term bank deposits |
|
|
|
| (610 | ) |
| (272 | ) |
| (410 | ) |
Purchases of short-term bank deposits |
|
|
|
| (3,617 | ) |
| (835 | ) |
| — |
|
Proceeds from disposal of property, plant and equipment |
|
|
|
| 297 |
|
| 171 |
|
| 100 |
|
Net cash used in by investing activities |
|
|
|
| (20,296 | ) |
| (6,398 | ) |
| (4,818 | ) |
Financing activities: |
|
|
|
|
|
|
|
|
|
|
|
|
Dividend paid to non-controlling shareholders of subsidiaries |
|
|
|
| (1,208 | ) |
| (2,763 | ) |
| (2,206 | ) |
Dividend paid to company's shareholders | 23(b) |
|
| — |
|
| — |
|
| (1,106 | ) | |
Repayments of borrowings |
|
|
|
| (5,037 | ) |
| (19,811 | ) |
| (25,737 | ) |
Repayments of borrowings - related parties |
|
|
|
| (639 | ) |
| — |
|
| — |
|
Proceeds from borrowings |
|
|
|
| 3,531 |
|
| 5,349 |
|
| 9,517 |
|
Proceeds from borrowings - related parties |
|
|
|
| 6,000 |
|
| — |
|
| — |
|
Change in financial lease liabilities |
|
|
|
| — |
|
| — |
|
| (46 | ) |
Principal elements of lease payments |
| 28 |
|
| (586 | ) |
| (426 | ) |
| — |
|
Effect from the changes in shareholding percentage in subsidiary |
|
|
|
| — |
|
| (298 | ) |
| — |
|
Net cash provided by (used in) financing activities |
|
|
|
| 2,061 |
|
| (17,949 | ) |
| (19,578 | ) |
Effect of exchange rate |
|
|
|
| 424 |
|
| 2,102 |
|
| (1,568 | ) |
Net (decrease) increase in cash and cash equivalents |
|
|
|
| (1,436 | ) |
| (7,105 | ) |
| 14,685 |
|
Cash and cash equivalents at beginning of year |
| 10 |
|
| 53,673 |
|
| 60,778 |
|
| 46,093 |
|
Cash and cash equivalents at end of year |
| 10 |
|
| 52,237 |
|
| 53,673 |
|
| 60,778 |
|
The accompanying notes are an integral part of these consolidated financial statements.
F-8
ASIA PACIFIC WIRE & CABLE CORPORATION LIMITED
NOTES TO THE CONSOLIDATED FINANCIAL STATEMENTS
Asia Pacific Wire & Cable Corporation Limited (“APWC”), which is a subsidiary of Pacific Electric Wire & Cable Co., Ltd. (“PEWC”), a Taiwanese company, was incorporated as an exempted company in Bermuda on September 19, 1996 under the Companies Act 1981 of Bermuda (as amended) for the purpose of acting as a holding company. APWC is principally engaged in owning operating companies engaged in the power cable, telecommunication cable, enameled wire and electronic cable industry. APWC’s registered office is located at Victoria Place, 5th Floor, 31 Victoria Street, Hamilton HM 10, Bermuda. APWC’s executive business office is presently located in Taipei, Taiwan.
APWC’s operating subsidiaries (the “Operating Subsidiaries”) are engaged in the manufacturing and distribution of telecommunications, power cable and enameled wire products in Singapore, Thailand, Australia, the People’s Republic of China (“PRC”) and other markets in the Asia Pacific region. Major customers of the Operating Subsidiaries include government organizations, electric contracting firms, electrical dealers, and wire and cable factories. The Operating Subsidiaries also engage in the distribution of certain wire and cable products manufactured by PEWC and third parties. The Operating Subsidiaries also provides project engineering services in supply, delivery and installation (the “SDI”) of power cable to certain of its customers.
Since 1997, APWC has been a U.S. public company with its common shares registered with the Securities and Exchange Commission (the “SEC” or the “Commission”). On April 29, 2011, APWC’s common shares commenced trading on Nasdaq Capital Market tier. On February 15, 2013, APWC’s common shares started trading on the Nasdaq Global Market tier. On July 24, 2020, APWC transferred its listing of common shares to the Nasdaq Capital Market tier because of failing to meet the minimum Market Value of Publicly Held Shares ("MVPHS") requirement to continue listing on the Nasdaq Global Market.
PEWC is currently holding 75.5% of the equity of APWC and is APWC’s ultimate parent company
Share Capital Repurchase Program
APWC’s Board of Directors authorized a share capital repurchase program on August 28, 2012. During 2012 and 2013, APWC repurchased 11,100 shares with total considerations of $38 until APWC suspended the share capital repurchase program as of June 30, 2013. APWC records the value of its common shares held in the treasury at cost.
On August 13, 2014, APWC announced that its Board of Directors authorized the future implementation of a share repurchase program of up to $1 million worth of its Common Shares. APWC did not announce a commencement date for that future share repurchase program, and, to date, it has not yet been implemented, and no financial liability has been recognized.
F-9
ASIA PACIFIC WIRE & CABLE CORPORATION LIMITED
NOTES TO THE CONSOLIDATED FINANCIAL STATEMENTS
|
|
The consolidated financial statements have been prepared on a historical basis except where otherwise disclosed in the accounting policies. The consolidated financial statements are presented in U.S. dollars and all values are rounded to the nearest thousand (US$’000), except when otherwise indicated.
The consolidated financial statements comprise the financial statements of APWC and its subsidiaries (collectively as the “Company”) as of December 31, 2020 and 2019, and the results of operations of the Company for the years ended December 31, 2020, 2019 and 2018.
Subsidiaries are fully consolidated from the date of acquisition (the date on which the Company obtains control), and continue to be consolidated until the date that such control ceases. The Company controls an entity when the Company is exposed to, or has rights to, variable returns from its involvement with the entity and has the ability to affect those returns through its power over the entity. The financial statements of the subsidiaries are prepared for the same reporting period as the parent company, using consistent accounting policies. All intra-group balances, transactions, unrealized gains and losses and dividends resulting from intra-group transactions are eliminated in full.
Non-controlling interests in the results and equity of subsidiaries are shown separately in the consolidated income statements, statements of comprehensive income, statements of changes in equity and balance sheets, respectively. Total comprehensive income (loss) within a subsidiary is attributed to the non-controlling interest even if it results in a deficit balance.
A change in the ownership interest of a subsidiary, without a loss of control, is accounted for as an equity transaction. If the Company loses control over a subsidiary, it:
|
|
|
|
|
|
|
|
|
|
|
|
|
|
F-10
ASIA PACIFIC WIRE & CABLE CORPORATION LIMITED
NOTES TO THE CONSOLIDATED FINANCIAL STATEMENTS
|
|
|
|
The subsidiaries of the Company are set out below:
|
| Percentage of equity interest |
| |||||
Place of incorporation and operations |
| 2020 |
|
| 2019 |
| ||
The British Virgin Islands |
|
|
|
|
|
|
|
|
APWC General Holdings Limited |
|
| 100 | % |
|
| 100 | % |
PRC (APWC) Holding Ltd. |
|
| 100 | % |
|
| 100 | % |
Samray Inc. |
|
| 100 | % |
|
| 100 | % |
Siam (APWC) Holdings Ltd. |
|
| 100 | % |
|
| 100 | % |
Moon View Ltd. |
|
| 100 | % |
|
| 100 | % |
Trigent Investment Holdings Limited |
|
| 100 | % |
|
| 100 | % |
Crown Century Holdings Ltd. |
|
| 100 | % |
|
| 100 | % |
Singapore |
|
|
|
|
|
|
|
|
Sigma Cable Company (Private) Limited (“Sigma Cable”) |
|
| 98.30 | % |
|
| 98.30 | % |
Epan Industries Pte Ltd. |
|
| 98.30 | % |
|
| 98.30 | % |
Singvale Pte Ltd. |
|
| 100 | % |
|
| 100 | % |
The People’s Republic of China (“PRC”) |
|
|
|
|
|
|
|
|
Ningbo Pacific Cable Co., Ltd. (“Ningbo Pacific”) |
|
| 97.93 | % |
|
| 97.93 | % |
Shanghai Yayang Electric Co., Ltd. (“SYE”) |
|
| 68.75 | % |
|
| 68.75 | % |
Pacific Electric Wire & Cable (Shenzhen) Co., Ltd. (“PEWS”) |
|
| 97.93 | % |
|
| 97.93 | % |
Hong Kong |
|
|
|
|
|
|
|
|
Crown Century Holdings Limited (“CCH (HK)”) |
|
| 97.93 | % |
|
| 97.93 | % |
Australia |
|
|
|
|
|
|
|
|
Australia Pacific Electric Cable Pty Limited (“APEC”) |
|
| 98.06 | % |
|
| 98.06 | % |
Thailand |
|
|
|
|
|
|
|
|
Charoong Thai Wire and Cable Public Company Limited (“Charoong Thai”) (i) |
|
| 50.93 | % |
|
| 50.93 | % |
Siam Pacific Electric Wire & Cable Company Limited (“Siam Pacific”) |
|
| 50.93 | % |
|
| 50.93 | % |
Double D Cable Company Limited (“Double D”) |
|
| 50.93 | % |
|
| 50.93 | % |
Hard Lek Limited. |
|
| 73.98 | % |
|
| 73.98 | % |
APWC (Thailand) Co., Ltd. |
|
| 99.48 | % |
|
| 99.48 | % |
PEWC (Thailand) Co., Ltd. |
|
| 99.48 | % |
|
| 99.48 | % |
CTW Beta Co., Ltd. |
|
| 50.89 | % |
|
| 50.89 | % |
Siam Fiber Optics Co., Ltd. (“SFO”) (ii) |
|
| 45.84 | % |
|
| 45.84 | % |
Taiwan |
|
|
|
|
|
|
|
|
Asia Pacific New Energy Corporation Limited ("APNEC") (iii) |
|
| 100.00 | % |
|
| 100.00 | % |
YASHIN Energy Corporation Limited ("YASHIN") (iii) |
|
| 100.00 | % |
|
| 100.00 | % |
YADING Energy Corporation Limited ("YADING") (iii) |
|
| 100.00 | % |
|
| 100.00 | % |
F-11
ASIA PACIFIC WIRE & CABLE CORPORATION LIMITED
NOTES TO THE CONSOLIDATED FINANCIAL STATEMENTS
|
|
|
|
|
|
|
|
On October 30, 2019, Charoong Thai acquired additional 30% interest in SFO for a total consideration of THB 9 million, thereby increasing the Company’s interest in SFO from 30.56% to 45.84%. The Company recorded the effect of change in shareholding of the subsidiaries, amounting to $40 under the caption of “Additional paid-in capital” in the consolidated statement of change in equity.
F-12
ASIA PACIFIC WIRE & CABLE CORPORATION LIMITED
NOTES TO THE CONSOLIDATED FINANCIAL STATEMENTS
3.SUMMARY OF SIGNIFICANT ACCOUNTING POLICIES
The Company has consistently applied the following accounting policies to all periods presented in these consolidated financial statements, except as mentioned otherwise (see also Note 4.1).
|
|
The Company presents assets and liabilities in the balance sheets based on current and non-current classification. An asset is current when it is:
Expected to be realized or intended to be sold or consumed in the normal operating cycle;
|
|
|
|
|
|
All other assets are classified as non-current.
A liability is current when:
It is expected to be settled in a normal operating cycle;
|
|
|
|
|
|
The Company classifies all other liabilities as non-current.
Deferred tax assets and liabilities are classified as non-current assets and liabilities.
|
|
The operating profit is the profit earned from core business operations, and it does not include any profit earned from investment and the effects of interest and taxes.
|
|
The Company measures financial instruments at fair value at each balance sheet date. In addition, fair values of financial instruments measured at amortized cost are disclosed in Note 11(d).
Fair value is the price that would be received to sell an asset or paid to transfer a liability in an orderly transaction between market participants at the measurement date. The fair value measurement is based on the presumption that the transaction to sell the asset or transfer the liability takes place either:
|
|
|
|
The principal or the most advantageous market must be accessible to by the Company.
The fair value of an asset or a liability is measured using the assumptions that market participants would use when pricing the asset or liability, assuming that market participants act in their economic best interest.
F-13
ASIA PACIFIC WIRE & CABLE CORPORATION LIMITED
NOTES TO THE CONSOLIDATED FINANCIAL STATEMENTS
|
|
|
|
A fair value measurement of a non-financial asset takes into account a market participant's ability to generate economic benefits by using the asset in its highest and best use or by selling it to another market participant that would use the asset in its highest and best use.
The Company uses valuation techniques that are appropriate in the circumstances and for which sufficient data are available to measure fair value, maximizing the use of relevant observable inputs and minimizing the use of unobservable inputs.
All assets and liabilities for which fair value is measured or disclosed in the financial statements are categorized within the fair value hierarchy, described as follows, based on the lowest level input that is significant to the fair value measurement as a whole:
|
|
|
|
|
|
For assets and liabilities that are recognized in the financial statements on a recurring basis, the Company determines whether transfers have occurred between levels in the hierarchy by re-assessing categorization (based on the lowest level input that is significant to the fair value measurement as a whole) at the end of each reporting period.
For the purpose of fair value disclosures, the Company has determined classes of assets and liabilities on the basis of the nature, characteristics and risks of the asset or liability and the level of the fair value hierarchy as explained above.
|
|
Cash and cash equivalents in the consolidated balance sheet comprise of cash at banks and highly liquid investments with purchased maturities of three months or less, which are subject to an insignificant risk of change in value.
For the purpose of the consolidated statements of cash flows, cash and cash equivalents are net of outstanding bank overdrafts as they are considered an integral part of the Company’s cash management.
The balance of bank overdraft was nil as of December 31, 2020 and 2019.
|
|
Inventories are stated at the lower of cost and net realizable value. Cost of manufactured goods is determined on the weighted average basis and, in the case of work in progress and finished goods, comprises direct materials, direct labor and an appropriate proportion of overheads based on the normal operating capacity. Cost of distributed goods is determined on the weighted average basis. Net realizable value is based on estimated selling prices less any estimated costs to be incurred to completion and the estimated cost necessary to make the sale.
F-14
ASIA PACIFIC WIRE & CABLE CORPORATION LIMITED
NOTES TO THE CONSOLIDATED FINANCIAL STATEMENTS
|
|
|
|
Property, plant and equipment is stated at cost, net of accumulated depreciation and any accumulated impairment losses. Such cost includes the cost of replacing part of the property, plant and equipment and borrowing costs for long-term construction projects if the recognition criteria are met.
Expenditure incurred after items of property, plant and equipment have been put into operation, such as repairs and maintenance, is normally charged to profit or loss in the period in which it is incurred. In situations where the recognition criteria are satisfied, the expenditure for a major inspection is capitalized in the carrying amount of the asset as a replacement. When significant parts of property, plant and equipment are required to be replaced at intervals, the Company recognizes such parts as individual assets with specific useful lives and depreciates them accordingly.
Spare parts and servicing equipment are usually carried as inventory and recognized in profit or loss as consumed. However, major spare parts and stand-by equipment qualify as property, plant and equipment when an entity expects to use them for more than one year.
The present value of the expected cost for the decommissioning of an asset after its use is included in the cost of the respective asset if the recognition criteria for a provision are met. A provision shall be recognized when:
|
|
|
|
|
|
If these conditions are not met, no provision shall be recognized.
Depreciation
Depreciation is calculated on a straight-line basis over the estimated useful lives of the assets as follows:
|
|
|
|
|
|
|
|
|
|
An item of property, plant and equipment and any significant part initially recognized is derecognized upon disposal or when no future economic benefits are expected from its use or disposal. Any gain or loss arising on derecognition of the asset (calculated as the difference between the net disposal proceeds and the carrying amount of the asset) is included in the income statement when the asset is derecognized.
The assets’ residual values, useful lives and methods of depreciation are reviewed at each financial year end, and adjusted prospectively, if appropriate.
F-15
ASIA PACIFIC WIRE & CABLE CORPORATION LIMITED
NOTES TO THE CONSOLIDATED FINANCIAL STATEMENTS
|
|
|
|
Impairment
If circumstances arise which indicate assets might be impaired, a review should be undertaken of their cash generating abilities through either use or sales. This review will produce an amount, which should be compared with the asset’s carrying value, and if the carrying value is higher, the difference must be written off as an impairment adjustment in the income statement. Further detailed methodology used for an impairment test is given in Note 3.11 - Impairment of non-financial assets.
|
|
From January 1, 2019
The Company assesses at contract inception whether a contract is, or contains, a lease. That is, the Company assesses whether the contract conveys the right to control the use of an identified asset for a period of time in exchange for consideration.
The Company as a lessee
The Company, as a lessee, applies a single accounting model to recognize assets and liabilities for all leases, except for the lease term is 12 months or less or the underlying asset has a low value. The Company recognizes lease liabilities to make lease payment and right-of-use assets representing the right to use the underlying assets.
(i) Right-of-use assets
The Company recognizes right-of-use assets at the commencement date of the lease (i.e., the date the underlying asset is available for use). Right-of-use assets are measured at cost, less any accumulated depreciation and impairment losses, and adjusted for any remeasurement of lease liabilities. The cost of right-of-use assets includes the amount of lease liabilities recognized, initial direct costs incurred, and lease payment made at or before the commencement date less any lease incentives received. Right-of-use assets are depreciated on a straight-line basis over the shorter of the lease term and the estimated useful lives of the assets, as follows:
|
|
|
|
|
|
|
|
If the ownership of the leased asset transfers to the Company at the end of the lease term or the cost reflects the exercise of a purchase option, depreciation is calculated using the estimated useful life of the asset.
The right-of-use assets are also subject to impairment. Refer to the accounting policies Note 3.11 impairment of non-financial assets.
F-16
ASIA PACIFIC WIRE & CABLE CORPORATION LIMITED
NOTES TO THE CONSOLIDATED FINANCIAL STATEMENTS
|
|
|
|
(ii) Lease liabilities
At the commencement date of the lease, the Company recognizes lease liabilities measured at the present value of lease payment to be made over the lease term. The lease payments include fixed payments (including in-substance fixed payments) less any lease incentives receivable, variable lease payments that depend on an index or a rate, and amounts expected to be paid under residual value guarantees. The lease payments also include the exercise price of a purchase option reasonably certain to be exercised by the Company and payments of penalties for terminating the lease, if the lease term reflects the Company exercising the option to terminate. Variable lease payments that do not depend on an index or a rate are recognized as expenses in the period in which the event or condition that triggers the payment occurs.
In calculating the present value of lease payments, the Company uses its incremental borrowing rate at the lease commencement date because the interest rate implicit in the lease is not readily determinable. After the commencement date, the amount of lease liabilities is increased to reflect the accretion of interest and reduced for the lease payments made. In addition, the carrying amount of lease liabilities is remeasured if there is a modification, a change in the lease term, a change in the lease payments (e.g. changes to future payments resulting from a change in an index or rate used to determine such lease payment) or a change in the assessment of an option to purchase the underlying asset.
(iii) Short-term leases and leases of low-value assets
The Company applies the short-term lease recognition exemption to its short-term leases. It also applies the lease of low-value assets recognition exemption to its leases that are considered of low value. Lease payments on short-term leases and leases of low-value assets are recognized as expense on a straight-line basis over the lease term.
The Company as a lessor
Leases for which the Company is a lessor are classified each of its leases as either an operating lease or finance lease.
Finance lease
Whenever the terms of the lease transfer substantially all the risks and rewards incidental to ownership of an underlying asset, the lease is classified as a finance lease. Amount due from lessees under finance lease are recognized as receivables at the amount of the Company’s net investment in the leases. Finance lease income is allocated to accounting periods so as to reflect a constant periodic rate of return on the Company’s net investment outstanding in respect of the leases.
Operating lease
Leases in which the Company does not transfer substantially all the risks and rewards incidental to ownership of an asset are classified as operating leases. Rental income arising is accounted for on a straight-line basis over the lease terms and is included in revenue in the consolidated income statements due to its operating nature. Initial direct costs incurred in negotiating and arranging an operating lease are added to the carrying amount of the leased asset and recognized over the lease term on the same basis as rental income. Contingent rents are recognized as revenue in the period in which they are earned.
Property (land and/or a building, or part of a building) subject to an operating lease shall be recognized as an investment property.
F-17
ASIA PACIFIC WIRE & CABLE CORPORATION LIMITED
NOTES TO THE CONSOLIDATED FINANCIAL STATEMENTS
|
|
|
|
Prior to January 1, 2019
The determination of whether an arrangement is, or contains, a lease is based on the substance of the arrangement at the inception date. The arrangement is assessed for whether fulfillment of the arrangement is dependent on the use of a specific asset or assets or the arrangement conveys a right to use the asset or assets, even if that right is not explicitly specified in an arrangement.
Finance leases
Finance leases that transfer substantially all the risks and benefits incidental to ownership of the leased item to the Company, are capitalized at the commencement of the lease at the fair value of the leased property or, if lower, at the present value of the minimum lease payments. Lease payments are apportioned between the finance charges and reduction of the lease liability to achieve a constant rate of interest on the remaining balance of the liability. Finance charges are recognized in finance costs in the income statement.
A leased asset is depreciated over the useful life of the asset. However, if there is no reasonable certainty that the Company will obtain ownership by the end of the lease term, the asset is depreciated over the shorter of the estimated useful life of the asset and the lease term.
Operating leases
Operating lease payments are recognized as an operating expense in the income statement on a straight-line basis over the lease term.
Prepaid land lease payments under operating leases are initially stated at cost and subsequently recognized on the straight-line basis over the lease terms. The prepaid land lease payments are presented as current or non-current assets on the face of balance sheet, depending on the amount to be recognized less or more than twelve months after the reporting period.
|
|
Borrowing costs are required to be capitalized as part of the cost of the asset if they are directly attributable to the acquisition, construction or productions of a qualifying asset (whether or not the funds have been borrowed specifically). All other borrowing costs are recognized as an expense in the period in which they are incurred.
A qualifying asset is an asset that necessarily takes a substantial period to get ready for its intended use or sale.
Borrowing costs consist of interest and other costs that an entity incurs in connection with the borrowing of funds.
F-18
ASIA PACIFIC WIRE & CABLE CORPORATION LIMITED
NOTES TO THE CONSOLIDATED FINANCIAL STATEMENTS
|
|
|
|
Borrowing costs include:
|
|
|
|
|
|
For specific borrowings, the borrowing costs eligible for capitalization are the actual borrowing costs incurred related to funds that are borrowed specifically to obtain a qualifying asset less any investment income earned on the temporary investment of those borrowings.
For general borrowings, the capitalization rate applied to borrowing costs on the consolidation level will be based on cash management strategy, which might be the weighted average of the group borrowings outstanding during the period.
|
|
Investment properties are properties held to earn rentals and/or for capital appreciation (including property under construction for such purposes). Investment properties are measured initially at cost, including transaction costs. Subsequent to initial recognition, investment properties are carried at historical cost less provisions for depreciation and impairment. Additional costs incurred subsequent to the acquisition of an asset increase the carrying amount of the asset or recognized as a separate asset if it is probable that future economic benefits associated with the assets will flow into the Company and the cost of an asset can be measured reliably. Routine maintenance and repairs are expensed as incurred. While land is not depreciated, all other investment property is depreciated based on the respective assets estimated useful lives ranging from 20 to 40 years using the straight-line method.
The estimated useful lives, residual values and depreciation method are reviewed at the end of each reporting period, with the effect of any changes in estimate accounted for on a prospective basis. An investment property is derecognized upon disposal or when the investment property is permanently withdrawn from use and no future economic benefits are expected from the disposal. Any gain or loss arising on derecognition of the property (calculated as the difference between the net disposal proceeds and the carrying amount of the asset) is included in income or loss in the period in which the property is derecognized.
International Accounting Standards (“IAS”) 40 requires disclosures about the fair value of any investment property recorded at cost. See Note 17 – Investment Properties.
F-19
ASIA PACIFIC WIRE & CABLE CORPORATION LIMITED
NOTES TO THE CONSOLIDATED FINANCIAL STATEMENTS
|
|
|
|
|
(i) Financial assets
Classification and measurement
Except for certain trade receivables, the company initially measures a financial asset at its fair value plus, in the case of a financial asset not at fair value through profit or loss, transaction costs directly attributable to the acquisition or issue of the financial asset. Financial instruments are subsequently measured at amortized cost, fair value through other comprehensive income (FVOCI) or fair value through profit or loss (FVPL). The classification is based on two criteria: the objective of the company’s business model for managing the assets; and whether the instruments’ contractual cash flows represent ‘solely payments of principal and interest’ on the principal amount outstanding (the ‘SPPI criterion’).
The classification and measurement of financial assets is as follows:
|
|
Financial assets meeting both conditions: (i) held within a business model whose objective is to hold financial assets in order to collect contractual cash flows, and (ii) the contractual terms of the financial assets give arise on specified dates to cash flows that are solely payments of principal and interest on the principal amount outstanding, are measured subsequent to initial recognition at amortized cost.
The amortized cost of a financial asset is the amount at which the financial asset is measured at initial recognition minus the principal repayments, plus the cumulative amortization using the effective interest rate (“EIR”) method of any difference between that initial amount and the maturity amount, adjusted for any loss allowance. Interest income, foreign exchange gains and losses, and any impairment charges for such instruments are recognized in profit or loss.
The Company’s financial assets at amortized costs include cash and cash equivalents, trade receivables, other receivable, and the receivable from related party.
|
|
Financial assets that are held within a business model whose objective is to hold financial assets in order to both collecting contractual cash flows and selling financial assets, and that the contractual terms of the financial assets give rise on specified dates to cash flows that are solely payments of principal and interest on the principal amount outstanding. Interest income, foreign exchange gains and losses, and any impairment charges on such instruments are recognized in profit or loss. All other fair value gains and losses are recognized in OCI. On disposal of these debt instruments, any related balance with FVOCI reserve is reclassified to profit or loss.
F-20
ASIA PACIFIC WIRE & CABLE CORPORATION LIMITED
NOTES TO THE CONSOLIDATED FINANCIAL STATEMENTS
|
|
|
|
(i) Financial assets (continued)
|
|
These instruments are undertakings in which the Company does not have significant influence or control, generally evidenced by ownership of less than 20% of the voting rights. The Company designates these investments on an instrument by instrument basis as equity securities at FVOCI because they represent investments held for long term strategic purposes.
Investments in equity instruments at FVOCI are initially measured at fair value plus transaction costs. Subsequently, they are measured at fair value with gains and losses arising from changes in fair value recognized in OCI. These investments are not subject to impairment testing and upon disposal, the cumulative gain or loss in OCI is not reclassified to profit or loss on disposal. Dividends from such investments continue to be recognized in profit or loss when the Company’s right to receive payments is established.
The Company elected to classify irrevocably its non-listed equity investments under this category.
|
|
Assets that do not meet the criteria for amortized cost or FVOCI are measured at FVPL. A gain or loss on a debt instrument that is subsequently measured at FVPL is recognized in profit or loss in the period in which it arises.
Even if an instrument meets the two requirements to be measured at amortized cost or FVOCI, the Company may, at initial recognition, irrevocably designate a financial asset as measured at FVPL if doing so eliminates or significantly reduces a measurement or recognition inconsistency.
Changes in the fair value of financial assets at FVPL are recognized in the statement of profit or loss as applicable.
Reclassification
When, and only, the Company changes its business model for managing financial assets it shall reclassify all affected financial assets according to the classification and measurement criteria discussed earlier. If the Company reclassifies financial assets, it shall apply the reclassification prospectively from the reclassification date and shall not restate any previously recognized gains, losses (including impairment gains or losses) or interest.
F-21
ASIA PACIFIC WIRE & CABLE CORPORATION LIMITED
NOTES TO THE CONSOLIDATED FINANCIAL STATEMENTS
|
|
|
|
(i) Financial assets (continued)
Derecognition
A financial asset (or, where applicable, a part of a financial asset or part of a group of similar financial assets) is primarily derecognized (i.e. removed from the Company’s consolidated balance sheet) when and only when:
(a) the rights to receive cash flows from the asset have expired, or
(b) the Company has transferred its rights to receive cash flows from the asset, or has assumed an obligation to pay the received cash flows in full without material delay to one or more recipients under a “pass-through” arrangement; and either (i) the Company has transferred substantially all the risks and rewards of the asset, or (ii) the Company has neither transferred nor retained substantially all the risks and rewards of the asset but has transferred control of the asset.
When the Company has transferred its rights to receive cash flows from an asset or has entered into a pass-through arrangement, it evaluates the extent to which, it has retained the risks and rewards of ownership. When it has neither transferred nor retained substantially all of the risks and rewards of the asset and has not transferred the control of the assets, the Company continues to recognize the transferred asset to the extent of its continuing involvement. In that case, the Company also recognizes an associated liability. The transferred asset and the associated liability are measured on a basis that reflects the rights and obligations that the Company has retained.
Continuing involvement that takes the form of a guarantee over the transferred asset is measured at the lower of the original carrying amount of the asset and the maximum amount of consideration that the Company could be required to repay (“the guarantee amount”).
(ii) Financial liabilities
Classification and measurement
Financial liabilities are classified, at initial recognition, as financial liabilities at fair value through profit or loss, loans and borrowings, payables, or as derivatives designated as hedging instruments in an effective hedge, as appropriate.
All financial liabilities are recognized initially at fair value and, net of directly attributable transaction costs in the case of loans and borrowings.
The Company’s financial liabilities include trade and other payables, bank overdrafts and interest-being loans and borrowings. These financial liabilities represent liabilities for goods and services provided to the Company and refund liabilities arising from contracts with customers. Trade payable are non-interest bearing and are normally settled on 60-day terms. The refund liabilities are rebate and discounts for the sale of goods to external customers in the ordinary course of the Company’s activities. Trade and other payables are presented as current liabilities unless payment is not due within 12 months after the reporting period. They are recognized initially at fair value and subsequently measured at amortized cost using the EIR method.
After initial recognition, interest-bearing loans and borrowings are subsequently measured at amortized cost using the EIR method. Gains and losses are recognized in profit or loss when the liabilities are derecognized as well as through the EIR amortization process.
F-22
ASIA PACIFIC WIRE & CABLE CORPORATION LIMITED
NOTES TO THE CONSOLIDATED FINANCIAL STATEMENTS
|
|
|
|
(ii) Financial liabilities (continued)
Classification and measurement (continued)
Amortized cost is calculated by taking into account any discount or premium on acquisition and fees or costs that are an integral part of the EIR. The EIR amortization is included as finance costs in the income statement.
Derecognition
A financial liability is derecognized when the obligation under the liability is discharged, cancelled, or expires. When an existing financial liability is replaced by another from the same lender on substantially different terms or the terms of an existing liability are substantially modified, such an exchange or modification is treated as the derecognition of the original liability and the recognition of a new liability. The difference in the respective carrying amounts is recognized in the income statement.
(iii) Foreign currency forward contracts
Non-hedging derivatives are initially recognized at fair value on the date a derivative contract is entered into and recorded as financial assets or financial liabilities at fair value through profit or loss. They are subsequently re-measured at fair value, and the gains or losses are recognized in profit or loss.
(iv) Impairment of financial instruments
The following financial instruments are included within the scope of the impairment requirements in IFRS 9 Financial Instruments:
(a) Financial assets measured at amortized cost;
(b) Financial assets mandatorily measured at FVOCI;
(c) Loan commitments when there is a present obligation to extend credit (except where these are
measured at FVPL);
(d) Financial guarantee contracts to which IFRS 9 is applied (except those measured at FVPL);
(e) Lease receivables within the scope of IFRS 16 Leases from January 1, 2019 and IAS 17 prior to
January 1, 2019.
(f) Contract assets within the scope of IFRS 15 Revenue from Contracts with Customers.
From January 1, 2018, the Company assesses on a forward looking basis the expected credit losses (ECLs) associated with its debt instruments carried at amortized cost and FVOCI. The impairment methodology applied depends on whether there has been a significant increase in credit risk.
With the exception of purchased or originated credit impaired financial assets, ECLs are required to be measured through a loss allowance at an amount equal to:
(a) credit risk has not increased significantly since initial recognition – recognize 12-month ECLs , and recognize interest on a gross basis; or
(b) credit risk has increased significantly since initial recognition – recognize lifetime ECL, and recognize interest on a gross basis.
A loss allowance for full lifetime ECLs is required for contract assets or trade receivables that do not constitute a financing transaction in accordance with IFRS 15. The Company may select its accounting policy for contract assets and trade receivables, containing a significant financing component and lease receivables to measure the loss allowance at an amount equal to lifetime ECLs.
F-23
ASIA PACIFIC WIRE & CABLE CORPORATION LIMITED
NOTES TO THE CONSOLIDATED FINANCIAL STATEMENTS
|
|
|
|
For trade receivables and contract assets, the Company applies the simplified approach permitted by IFRS 9, which requires expected lifetime losses to be recognized from initial recognition of the receivables, see Note 12(c) for further details.
The Company recognizes in profit or loss, the amount of expected credit losses (or reversal) that is required to adjust the loss allowance at the reporting date to the amount that is required to be recognized.
(v) Offsetting of financial instruments
Financial assets and financial liabilities are offset and the net amount is reported in the consolidated statement of financial position if when the following conditions are met: (i) there is a currently enforceable legal right to offset the recognized amounts; and (ii) there is an intention to settle on a net basis, to realize the assets and settle the liabilities simultaneously.
(vi) Fair value of financial instruments
The fair value of financial instruments that are traded in active markets at each reporting date is determined by reference to quoted market prices or dealer price quotations (bid price for long positions and ask price for short positions), without any deduction for transaction costs.
For financial instruments not traded in an active market, the fair value is determined using appropriate valuation techniques. Such techniques may include:
|
|
|
|
|
|
F-24
ASIA PACIFIC WIRE & CABLE CORPORATION LIMITED
NOTES TO THE CONSOLIDATED FINANCIAL STATEMENTS
|
|
|
|
The Company assesses, at each reporting date, whether there is an indication that an asset may be impaired. If any indication exists, or when annual impairment testing for an asset is required, the Company estimates the asset’s recoverable amount. An asset’s recoverable amount is the higher of an asset’s or cash-generating unit’s (“CGU”) fair value less costs to sell and its value in use. A CGU is the smallest group of assets that generates cash inflows that are largely independent of the cash flows from other assets or groups of assets. Recoverable amount is determined for an individual asset, unless the asset does not generate cash inflows that are largely independent of those from other assets or Company of assets. When the carrying amount of an asset or CGU exceeds its recoverable amount, the asset is considered impaired and is written down to its recoverable amount.
In assessing value in use, the estimated future cash flows are discounted to their present value using a pre-tax discount rate that reflects current market assessments of the time value of money and the risks specific to the asset. In determining fair value less costs to sell, recent market transactions are taken into account. If no such transactions can be identified, an appropriate valuation model is used. These calculations are corroborated by valuation multiples, quoted share prices for publicly traded companies or other available fair value indicators.
The Company bases its impairment calculation on detailed budgets and forecast calculations, which are prepared separately for each of the Company’s CGUs to which the individual assets are allocated. These budgets and forecast calculations generally cover a period of five years. For longer periods, a long-term growth rate is calculated and applied to project future cash flows after the fifth year.
Impairment losses of continuing operations are recognized in the income statement in expense categories consistent with the function of the impaired asset.
For assets excluding goodwill, an assessment is made at each reporting date to determine whether there is an indication that previously recognized impairment losses no longer exist or have decreased. If such indication exists, the Company estimates the asset’s or CGU’s recoverable amount. A previously recognized impairment loss is reversed only if there has been a change in the assumptions used to determine the asset’s recoverable amount since the last impairment loss was recognized. The reversal is limited so that the carrying amount of the asset does not exceed its recoverable amount, nor exceed the carrying amount that would have been determined, net of depreciation, had no impairment loss been recognized for the asset in prior years. Such reversal is recognized in the consolidated income statement.
F-25
ASIA PACIFIC WIRE & CABLE CORPORATION LIMITED
NOTES TO THE CONSOLIDATED FINANCIAL STATEMENTS
|
|
|
|
Computer software
The costs of acquiring software is capitalized separately as an intangible asset on the basis of the costs incurred to acquire and bring to use the specific software. Acquired software (licenses) is stated at cost less accumulated amortization and impairment losses.
Amortization of software applications is charged to operating expenses and/or cost on a straight-line basis over 2 to 10 years from the date they are available for use.
The residual values and useful lives are reviewed at each balance sheet date and adjusted, if appropriate.
|
|
Current income tax
Current income tax assets and liabilities for the current period are measured at the amount expected to be recovered from or paid to the taxation authorities. The tax rates and tax laws used to compute the amount are those that are enacted or substantively enacted, at the reporting date in the countries where the Company operates.
Current income tax relating to items recognized directly in equity is recognized in equity and not in the income statement. Management periodically evaluates positions taken in the tax returns with respect to situations in which applicable tax regulations are subject to interpretation and establishes provisions where appropriate.
Deferred tax
Deferred tax is provided using the liability method on temporary differences between the tax bases of assets and liabilities and their carrying amounts for financial reporting purposes at the reporting date.
Deferred tax liabilities are recognized for all taxable temporary differences, except:
|
|
|
|
Deferred tax assets are recognized for all deductible temporary differences, the carry forward of unused tax credits and any unused tax losses. Deferred tax assets are recognized to the extent that it is probable that taxable profit will be available against which the deductible temporary differences, and the carry forward of unused tax credits and unused tax losses can be utilized, except:
|
|
F-26
ASIA PACIFIC WIRE & CABLE CORPORATION LIMITED
NOTES TO THE CONSOLIDATED FINANCIAL STATEMENTS
|
|
|
|
Deferred tax (continued)
|
|
The carrying amount of deferred tax assets is reviewed at each reporting date and reduced to the extent that it is no longer probable that sufficient taxable profit will be available to allow all or part of the deferred tax asset to be utilized. Unrecognized deferred tax assets are reassessed at each reporting date and are recognized to the extent that it has become probable that future taxable profits will allow the deferred tax asset to be recovered.
Deferred tax assets and liabilities are measured at the tax rates that are expected to apply in the year when the asset is realized or the liability is settled, based on tax rates (and tax laws) that have been enacted or substantively enacted at the reporting date.
The tax expense for the period comprises current and deferred tax. Tax is recognized in profit or loss, except to the extent that it relates to items recognized in other comprehensive income or items recognized directly in equity, in which cases the tax is recognized in other comprehensive income or equity. Deferred tax relating to items recognized outside profit or loss is recognized outside profit or loss.
Deferred tax assets and deferred tax liabilities are offset if a legally enforceable right exists to set off current tax assets against current income tax liabilities and the deferred taxes relate to the same taxable entity and the same taxation authority.
Uncertain tax position
An entity’s tax position might be uncertain; for example, where the tax treatment of an item of expense or structured transaction may be challenged by the tax authorities.
The Company considers each uncertain tax positions individually, by first considering whether each position taken in the tax return is probable of being sustained on examination by the taxing authority, and recognizing a liability for each item that is not probable of being sustained. The liability then is measured using a single best estimate of the most likely outcome. The uncertain tax positions are presented in the current tax liabilities.
F-27
ASIA PACIFIC WIRE & CABLE CORPORATION LIMITED
NOTES TO THE CONSOLIDATED FINANCIAL STATEMENTS
|
|
|
|
The Company generates revenue primarily from the sales of wires and cables and supply, delivery and installation services to its customers (see Note 5(e)).
Revenue from contract with customers is recognized when (or as) control of the goods or services (i.e. assets) are transferred to the customer at an amount that reflects the consideration to which the Company expects to be entitled in exchange for those goods or services. The Company has concluded that it is the principal in its revenue arrangements because it controls the goods or services before transferring them to the customer. The Company has certain contracts with customers to perform fabrication services for its customers, converting customer-owned raw materials to wire and cable products. The Company is responsible for fulfilling the promise to provide the specified services.
Revenue is recognized as control is passed, either over time or at a point in time.
The Company recognizes revenue over time if one of the following criteria is met:
(a) the customer simultaneously receives and consumes the benefits provided by the Company’s performance as the entity performs;
(b) the Company’s performance creates or enhances an asset (for example, work in progress) that the customer controls as the asset is created or enhanced; or
(c) the Company’s performance does not create an asset with an alternative use to the Company and the Company has an enforceable right to payment for performance completed to date.
If the Company does not satisfy its performance obligation over time, it satisfies it at a point in time. Revenue will therefore be recognized when control is passed at a certain point in time. Factors that may indicate the point in time at which control passes include, but are not limited to:
(a) the entity has a present right to payment for the asset;
(b) the customer has legal title to the asset;
(c) the entity has transferred physical possession of the asset;
(d) the customer has the significant risks and rewards of ownership of the asset; or
(e) the customer has accepted the asset.
When (or as) a performance obligation is satisfied, the Company recognizes as revenue the amount of the transaction price that is allocated to that performance obligation.
While deferred payment terms may be agreed in certain circumstances, the deferral never exceeds twelve months. The Company applies the practical expedient not to adjust the promised amount of consideration for the effects of a significant financing component if the Company expects, at contract inception, that the period between when the Company transfers a promised good or service to a customer and when the customer pays for that good or service will be one year or less.
F-28
ASIA PACIFIC WIRE & CABLE CORPORATION LIMITED
NOTES TO THE CONSOLIDATED FINANCIAL STATEMENTS
|
|
|
|
Sales of wires and cables
Revenue from sales of wires and cables is recognized at the point in time when control of the asset is transferred to the customer, generally on delivery of the wires and cables.
Variable consideration
If the consideration in a contract includes a variable amount, the Company estimates the amount of consideration to which it will be entitled in exchange for transferring the goods to the customer. The variable consideration is estimated at a contract inception and constrained until it is highly probable that a significant revenue reversal in the amount of cumulative revenue recognized will not occur when the associated uncertainty with the variable consideration is subsequently resolved.
The amount of consideration can vary because of discounts, rebates, refunds, credits, price concessions, incentives, performance bonuses, penalties or other similar items. The promised consideration can also vary if a Company’s entitlement to the consideration is contingent on the occurrence or non-occurrence of a future event.
The Company estimates an amount of variable consideration by using either of (a) the expected value, or (b) the most likely amount, depending on which the Company expects to better predict the amount of consideration to which it will be entitled.
At the end of each reporting period, the Company updates the estimated transaction price (including updating its assessment of whether an estimate of variable consideration is constrained) to represent faithfully the circumstances present at the end of the reporting period and the changes in circumstances during the reporting period. The Company allocates any subsequent changes in the transaction price to the performance obligations on the same basis as at contract inception.
SDI
The Company’s supply, delivery and installation services are closely interrelated in terms of their ultimate purpose or use and the customer is able to specify the major structural elements of the design. Revenue from SDI is recognized when the Company satisfies performance obligations which occurs when the control of either goods or services are transferred to the customer. Transfer of control to a customer can occur either over a period of time or at a single point in time, and the transfer of controls depends on the scope of service work orders.
Service work order that involves supply of cables, installation and/or labor (e.g. maintenance or repairing service) are not distinct and are identified to be one performance obligation satisfied over time since the elements of the service work order are highly interrelated, customized and modified for the customer. The Company selects an input method (cost-to-cost) to measure the progress toward satisfaction of the performance obligation. The Company’s estimate about revenue, costs and progress towards complete satisfaction of a performance obligation may revise when there is a change in circumstances. Any increase or decrease in revenue or costs due to an estimate revision is reflected in profit or loss during the period when the management become aware of the changes in circumstances.
F-29
ASIA PACIFIC WIRE & CABLE CORPORATION LIMITED
NOTES TO THE CONSOLIDATED FINANCIAL STATEMENTS
|
|
|
|
Custodial and transportation services under bill and hold arrangement
A bill and hold arrangement is a contract under which an entity bills a customer for a product but the entity retains physical possession of the product until it is transferred to the customer at a point in time in the future. The Company identifies multiple performance obligations for its bill and hold arrangements, including sales of wires and cables, custodial service and transportation service.
Sales of wires and cables are recognized revenue when the products are placed into warehouse and the customer has accepted the products because the control of the products has transferred to the customer.
Custodial service revenue and transportation service are recognized over time. The transaction price allocated to these services is recognized as a contract liability at the time of the initial sales transaction and released on actual basis over the period of services.
Onerous operating contracts
Onerous contract is a type of contract in which the costs of meeting the obligations under the contract are higher than the economic benefits received under the contract.
The Company has contracts to supply products that may become onerous due to changing circumstances. The Company establishes the unavoidable costs of meeting the obligations under the contract as an accrued liability for the contractual responsibilities. For example, when rising copper price renders a contract onerous, the liability is calculated based on the difference between the lock-in purchase copper price, or the copper price on the London Metal Exchange (the “LME”) at reporting date and the prices determined in the contracts, if the difference exceeds the profit of the original contract. The unavoidable costs exceeding the profit of the contract is recognized in cost of sales or other operating expense based on the nature of the unavoidable costs.
F-30
ASIA PACIFIC WIRE & CABLE CORPORATION LIMITED
NOTES TO THE CONSOLIDATED FINANCIAL STATEMENTS
|
|
|
|
The Company’s consolidated financial statements are presented in USD, which is also the parent company’s functional currency. For each entity the Company determines the functional currency and items included in the financial statements of each entity are measured using that functional currency.
Transactions and balances
Transactions in foreign currencies are initially recorded by the Company’s entities at their respective functional currency spot rates at the date the transaction first qualifies for recognition.
Monetary assets and liabilities denominated in foreign currencies are translated at the functional currency spot rates of exchange at the reporting date.
Differences arising on settlement or translation of monetary items are recognized in profit or loss with the exception of monetary items that are designated as part of the hedge of the Company’s net investment of a foreign operation. These are recognized in other comprehensive income until the net investment is disposed of, at which time, the cumulative amount is reclassified to profit or loss. Tax charges and credits attributable to exchange differences on those monetary items are also recorded in other comprehensive income.
Non-monetary items that are measured in terms of historical cost in a foreign currency are translated using the exchange rates at the dates of the initial transactions. Non-monetary items measured at fair value in a foreign currency are translated using the exchange rates at the date when the fair value is determined. The gain or loss arising on translation of non-monetary items measured at fair value is treated in line with the recognition of gain or loss on change in fair value of the item (i.e., translation differences on items whose fair value gain or loss is recognized in other comprehensive income or profit or loss are also recognized in other comprehensive income or profit or loss, respectively).
Translation to the presentation currency
The results and financial position of an entity whose functional currency are translated into a different presentation currency using the following procedures:
|
|
|
|
|
|
|
|
F-31
ASIA PACIFIC WIRE & CABLE CORPORATION LIMITED
NOTES TO THE CONSOLIDATED FINANCIAL STATEMENTS
|
|
|
|
The Company has both defined contribution and defined benefit obligation. The liabilities of the Company arising from defined benefit obligations, and the related current service cost, are determined using the projected unit credit method.
For defined benefit plans, the cost charged to the income statement consists of current service cost, net interest cost and past service cost. Remeasurements comprising of actuarial gains and losses are recognized in the period in which they occur, directly in other comprehensive income. They are included in other comprehensive income in the statement of changes in equity and in balance sheet. Remeasurements are not reclassified to profit or loss in subsequent periods. Contributions to defined contribution plans are charged to the income statement as incurred. All past service costs are recognized at the earlier of when the amendment occurs.
Compensated absence
The cost of accumulating paid absences is recognized when employees render the service that increases their entitlement to future paid absences.
The cost of accumulating paid absences is measured as the additional amount that the entity expects to pay as a result of the unused entitlement that has accumulated at the end of the reporting period.
|
|
The Company presents basic and diluted earnings per share (“EPS”) data for its common shares. Basic EPS is calculated by dividing the net income attributable to shareholders of the Company by the weighted average number of common shares outstanding during the period, adjusted for own shares held.
In calculating diluted EPS, the number of shares should be that used in calculating the basic EPS, plus the weighted average number of shares that would be issued on the conversion of all the dilutive potential common shares into common shares. The earnings figure should be that used for basic EPS adjusted to reflect any post-tax effects from changes that would arise if the potential shares outstanding in the period were actually issued.
F-32
ASIA PACIFIC WIRE & CABLE CORPORATION LIMITED
NOTES TO THE CONSOLIDATED FINANCIAL STATEMENTS
|
|
|
|
Own equity instruments that are reacquired (treasury shares) are recognized at cost and deducted from equity. No gain or loss is recognized in the profit or loss on the purchase, sale, issue or cancellation of the Company’s own equity instruments. Any difference between the carrying amount and the consideration, if reissued, is recognized in additional paid-in capital. Voting rights related to treasury shares are nullified and no dividends are allocated to them.
|
|
The Company’s investment in its associates are accounted for using the equity method. An associate is an entity in which the Company has significant influence. Under the equity method, the investment is initially recognized at cost. The carrying amount of the investment is adjusted to recognize changes in the Company’s share of net assets of the associate since the acquisition date. Goodwill relating to the associate is included in the carrying amount of the investment and is neither amortized nor individually tested for impairment.
The income statement reflects the Company’s share of the results of operations of the associate. Any change in other comprehensive income of those investees is presented as part of the Company’s other comprehensive income. When there has been a change recognized directly in the equity of the associate, the Company recognizes its share of any changes, when applicable, in the statement of changes in equity. Unrealized gains and losses resulting from transactions between the Company and the associate are eliminated to the extent of the interest in the associate.
The Company’s share of profit or loss of an associate is shown on the face of the income statement and represents profits or loss after tax and non-controlling interests in the subsidiaries of the associate.
The financial statements of the associate are prepared for the same reporting period as the Company. When necessary, adjustments are made to bring the accounting policies in line with those of the Company.
After application of the equity method, the Company determines whether it is necessary to recognize an impairment loss on its investment in its associate. The Company determines at each reporting date whether there is any objective evidence that the investment in associates is impaired. If this is the case, the Company calculates the amount of impairment as the difference between the recoverable amount of the associate and its carrying value and recognizes the amount in share of losses of associates in the income statement.
Upon loss of significant influence over the associate, the Company measures and recognizes any retained investment at its fair value. Any difference between the carrying amount of the associate upon loss of significant influence and the fair value of the retaining investment and proceeds from disposal is recognized in profit or loss.
F-33
ASIA PACIFIC WIRE & CABLE CORPORATION LIMITED
NOTES TO THE CONSOLIDATED FINANCIAL STATEMENTS
|
|
|
|
Government grants are recognized where there is reasonable assurance that the grant will be received and all attached conditions will be complied with. When the grant relates to an expense item, it is recognized as other income on a systematic basis over the periods that the related costs, which it is intended to compensate, are expensed. When the grant relates to an asset, it is recognized as a liability in equal amounts over the expected useful life of the related asset.
For the year ended December 31, 2020, 2019 and 2018, the government grant received $973, $425 and $106, respectively, the Company recognized in the line item of other income, refer to Note 7(e).
|
|
The Company classifies non-current assets and disposal groups as held for sale/distribution to owners if their carrying amounts will be recovered principally through a sale/distribution rather than through continuing use. Non-current assets and disposal groups are measured at the lower of their carrying amount and fair value less costs to sell. The criteria for held for sale classification is regarded met only when the sale is highly probable and the asset or disposal group is available for immediate sale in its present condition. Management must be committed to the sale, which should be expected to qualify for recognition as a completed sale within one year from the date of classification.
Property, plant and equipment and intangible assets once classified as held for sale/distribution to owners are not depreciated or amortized.
When equity method investments are classified as held for sale, the investor discontinues the use of the equity method from the date that the investment (or the portion of it) is classified as held for sale; instead, the associate or joint venture is then measured at the lower of its carrying amount and fair value less cost to sell.
|
|
Interest income
Interest revenue shall be calculated by using the effective interest method. This shall be calculated by applying the effective interest rate to the gross carrying amount of a financial asset except for:
(a) purchased or originated credit-impaired financial assets. For those financial assets, the entity shall apply the credit-adjusted effective interest rate to the amortized cost of the financial asset from initial recognition.
(b) financial assets that are not purchased or originated credit-impaired financial assets but subsequently have become credit-impaired financial assets. For those financial assets, the Company applies the effective interest rate to the amortized cost of the financial asset in subsequent reporting periods.
Rental income
Rental income arising from operating leases on investment properties is accounted for on a straight-line basis over the lease terms and is included in other operating income due to its operating nature.
Dividends
Revenue is recognized when the company’s right to receive the payment is established, which is generally when shareholders approve the dividend.
F-34
ASIA PACIFIC WIRE & CABLE CORPORATION LIMITED
NOTES TO THE CONSOLIDATED FINANCIAL STATEMENTS
|
|
|
|
The preparation of the Company’s consolidated financial statements requires management to make judgements, estimates and assumptions that affect the reported amounts of revenues, expenses, assets and liabilities, and the accompanying disclosures, and the disclosure of contingent liabilities. Uncertainty about these assumptions and estimates could result in outcomes that require a material adjustment to the carrying amount of assets or liabilities affected in future periods.
Judgements
In the process of applying the Company’s accounting policies, management has made the following judgements, which have the most significant effect on the amounts recognized in the consolidated financial statements:
Revenue recognition - identifying single performance obligation in SDI projects
SDI projects comprise various activities such as supply cables, installation, jointing services and testing services. Those tasks are activities to fulfil the cable management service (supply and installation) and not a separate promise within the context of the contract. The Company determines the supply cables and installation services are not capable of being distinct and identifies to be one performance obligation because of (i) the customer could not benefit from the installed cables on its own, neither using it or to sell it for an amount greater than scrap value; (ii) the Company is providing a significant integration service, and it would not be able to fulfil its promise to transfer the cables separately from its promise to the subsequent installation; (iii) the cables and installation are highly interrelated, and the customer could not benefit from the cables being delivered without subsequent installation.
Estimates and assumptions
The key assumptions concerning the future and other key sources of estimation uncertainty at the reporting date, that have a significant risk of causing a material adjustment to the carrying amounts of assets and liabilities within the next financial year, are described below. The Company based its assumptions and estimates on parameters available when the consolidated financial statements were prepared. Existing circumstances and assumptions about future developments, however, may change due to market changes or circumstances arising beyond the control of the Company. Such changes are reflected in the assumptions when they occur.
Impairment of non-financial assets
At each reporting date or whenever events indicate that the asset’s value has declined or significant changes in the market with an adverse effect have taken place, the Company assesses whether there is an indication that an asset in the scope of IAS 36 may be impaired. If any indication exists, the Company completes impairment testing for the CGU to which the individual assets belong. Where the carrying amount of an asset or CGU exceeds its recoverable amount, the asset is considered impaired and is written down to its recoverable amount. The recoverable amount of an individual asset or CGU is the higher of fair value less costs to sell and its value in use. The fair value less costs of disposal (FVLCD) calculation is based on available data from binding sale arrangements, conducted at arm’s length, for similar assets or observable market prices less incremental costs for disposal of the assets. The value in use (VIU) is measured at the net present value of the future cash flows the entity expects to derive from the asset or CGU. Cash flow projection involves subjective judgments and estimates which include the estimated useful lives of property, plant and equipment, capacity that generates future cash flows, capacity of physical output, potential fluctuations of economic cycle in the industry and the Company’s operating situation.
F-35
ASIA PACIFIC WIRE & CABLE CORPORATION LIMITED
NOTES TO THE CONSOLIDATED FINANCIAL STATEMENTS
|
|
|
|
Impairment of non-financial assets (continued)
Due to the implications of COVID-19 on global asset prices, availability of capital and risk appetites of market participants, the price may appear to be “distress sale” requiring adjustment in the fair value estimation. However, other than in extreme cases, such decreases in value should not be adjusted for a lack of current information or declines in trading. In addition, the FVLCD may not have the quoted price for the calculation because there may have been a significant reduction in trading volumes for a particular asset listed on a public market. Due to the difficulties in determining FVLCD, it is therefore more practical, where possible, to use VIU as recoverable amount.
When determining VIU, it is important that the estimates of future cash flows are realistic. However,, in the current environment, models of the future will need to incorporate unprecedented shock, as decreases in asset values, decline in demand for goods and services and supply chain disruptions may be dissimilar to any previously encountered scenario. This will make forecasting particularly difficult.
The Company recognized an impairment loss of $198 at Sigma Cable due to lack of profitability and certain machinery and equipment would not generate the expected future cash flows. See Note 15 – Property, Plant and Equipment.
Fair value of financial instruments
Where the fair values of financial assets and financial liabilities recorded in the balance sheet cannot be derived from active markets, they are determined using valuation techniques including income approach (for example, the discounted cash flows model) or the market approach. Changes in assumptions about these factors could affect the reported fair value of the financial instruments. Please refer to Note 11 for more details.
Measurement of ECL allowance for trade receivables
The Company applies the IFRS 9 simplified approach to measure lifetime expected loss allowance for trade receivables. To measure the expected credit losses, trade receivables have been grouped based on shared credit risk characteristics and the days past due. The expected loss rates are based on the payment profiles of the sales over a period of 36 month before December 31, 2020 and the historical credit loss experience within this period. The historical loss rates are adjusted to reflect current and forward-looking information on general economic conditions affecting the ability of the customers to settle the receivables. The Company has identified the default rate of the countries where it sells the goods and services as the most relevant factor and adjusts the historical loss rates based on the expected changes accordingly.
In addition, COVID-19 has impacted the ability of certain customers to settle the trade receivables, it may lead to a significant increase in the loss rate for trade receivables. Therefore, the Company considered how the timing and amount of cash flows generated by outstanding trade receivables might be affected and increase loss rates as necessary. The Company may consider a longer time horizon when payment dates are deferred for a significant period.
Refer to Note 12 and Note 27 for more information regarding the impairment of trade receivables and the related credit risks.
Net realizable value of inventory
Net realized value is the estimated selling price in the ordinary course of business less estimated costs to completion and the estimated costs necessary to make the sale. Management makes reference to actual sales prices after reporting date when making their estimate of net realizable value.
Refer to Note 13 for more information regarding the net realizable value of inventory.
F-36
ASIA PACIFIC WIRE & CABLE CORPORATION LIMITED
NOTES TO THE CONSOLIDATED FINANCIAL STATEMENTS
|
|
|
|
Taxes
Uncertainties exist with respect to the interpretation of complex tax regulations, changes in tax laws, and the amount and timing of future taxable income. Given the wide range of international business relationships and the long-term nature and complexity of existing contractual agreements, differences arising between the actual results and the assumptions made, or future changes to such assumptions, could necessitate future adjustments to tax income and expense already recorded. The Company establishes provisions, based on reasonable estimates, for possible consequences of audits by the tax authorities of the respective countries in which it operates. The amount of such provisions is based on various factors, such as experience of previous tax audits and differing interpretations of tax regulations by the taxable entity and the taxing authority. Such differences of interpretation may arise on a wide variety of issues depending on the conditions prevailing in the respective domicile of the companies.
Deferred tax assets are recognized for unused tax losses to the extent that it is probable that taxable profit will be available against which the losses can be utilized. Significant management judgement is required to determine the amount of deferred tax assets that can be recognized, based upon the likely timing and the level of future taxable profits together with future tax planning strategies.
As of December 31, 2020, the Company has $17,298 (2019: $20,580 ) of tax losses carried forward. These losses related to subsidiaries that have a history of losses, do not expire and may not be used to offset taxable income elsewhere in the Company except for $54 (2019: $546 ) that will be realized. The subsidiaries do not have any tax planning opportunities available that could support the recognition of these losses as deferred tax assets. On this basis, the Company has determined that it cannot recognize deferred tax assets on the tax losses carried forward.
If the Company was able to recognize all unrecognized deferred tax assets, profit and equity would have increased by $5,617 (2019: $5,068; 2018: $3,876). Further details on taxes are disclosed in Note 8.
Post-employment benefits under defined benefit plans
In accordance with the Thailand labor law, Charoong Thai and its subsidiaries are obliged to make payment to retiring employees, at rate of 1 to 13 times of their final monthly salary rate, depending on the length of service. In addition, Charoong Thai also has the extra benefit plan to make payment to qualified retiring employees at rates of 1 to 26 times of their final monthly salary.
The cost of the defined benefit pension plan and the present value of the pension obligation are determined using actuarial valuations. An actuarial valuation involves making various assumptions that may differ from actual developments in the future. These include the determination of the discount rate, future salary increases and mortality rates. Due to the complexity of the valuation and its long-term nature, a defined benefit obligation is highly sensitive to changes in these assumptions. All assumptions are reviewed at each reporting date.
In determining the appropriate discount rate, management considers the inactive corporate bond trading in Thailand, taken into account the yields on Thai Government Bonds and extrapolated maturity corresponding to the expected duration of the defined benefit obligation.
The mortality rate is based on most recent mortality investigation on policyholders of life insurance companies in Thailand. Future salary increases and pension increases are based on expected future inflation rates derived from external economic data, together with historical experience of Charoong Thai.
Further details about the assumptions used, including a sensitivity analysis, are given in Note 21.
F-37
ASIA PACIFIC WIRE & CABLE CORPORATION LIMITED
NOTES TO THE CONSOLIDATED FINANCIAL STATEMENTS
|
|
|
|
Revenue recognition of SDI projects
Revenue occurs when control transfers to the customer, either over a period of time or at a single point in time, depending on the scope of each individual contract. When the transfer of control to the customer occurs over a period of time, revenue of SDI is accounted for using an input method (input costs to total expected input costs) to measure the progress used to determine the amount of related revenue. When the comparison of total contract revenue to total expected input cost indicates a loss, a provision for the entire loss on the contract shall be made in the period in which they become known. Due to the individual nature of the work to be performed on each SDI contract, management’s estimation of total expected input costs is complex and requires significant judgment.
The carrying amount of theour Company’s gross amounts due from customers for contract work-in-progress is disclosed in Note 14.
F-38
| 4.1 Recently |
(a) New and amended standard applied effective in 2019
accounting pronouncements (continued)
IFRS 16 Leases
IFRS 16 supersedes IAS 17, Leases and related interpretation, and it sets out the requirements for the recognition, measurement, presentation and disclosure of leases. IFRS 16 provides a single lessee accounting model, requiring lessees to recognize assets and liabilities for all leases unless the lease term is 12 months or less or the underlying asset has a low value. Lessor accounting still uses the dual classification approach to classify each lease as an operating lease or a finance lease.
The Company applied IFRS 16 initially on January 1, 2019 using the modified retrospective method. In accordance with the IFRS 16 transition guidance, the cumulative effect of adopting the new standard is recognized as an adjustment to the opening balance of retained earnings at January 1, 2019, withamendments listed above had no restatement of comparative information.
Upon the application of IFRS 16 on January 1, 2019, the Company applied the following practical expedients permitted by the standard:
►the use of a single discount rate to a portfolio of leases with reasonably similar characteristics
|
|
|
|
|
|
F-39
ASIA PACIFIC WIRE & CABLE CORPORATION LIMITED
NOTES TO THE CONSOLIDATED FINANCIAL STATEMENTS
|
|
|
|
(a) New and amended standard applied effective in 2019 (continued)
The significant effects of adopting the IFRS 16 as of January 1, 2019 are summarized as below:
Affected items of consolidated balance sheet | As of December 31, 2018 |
| Effect of application of new standards |
| As of January 1, 2019 |
| Remarks | |||
| US$’000 |
| US$’000 |
| US$’000 |
|
| |||
Assets |
|
|
|
|
|
|
|
|
|
|
Prepayments |
| 1,140 |
|
| (59 | ) |
| 1,081 |
| B |
Lease assets* |
| 66 |
|
| (66 | ) |
| — |
| A |
Right-of-use assets |
| — |
|
| 3,801 |
|
| 3,801 |
| A, B, C |
Prepaid land lease payments |
| 978 |
|
| (978 | ) |
| — |
| B |
Total affected assets |
| 2,184 |
|
| 2,698 |
|
| 4,882 |
|
|
Liabilities |
|
|
|
|
|
|
|
|
|
|
Financial lease liabilities - current |
| 44 |
|
| 362 |
|
| 406 |
| C |
Financial lease liabilities - non-current |
| 46 |
|
| 2,336 |
|
| 2,382 |
| C |
Total affected liabilities |
| 90 |
|
| 2,698 |
|
| 2,788 |
|
|
* included in the line "Property, plant and equipment" in the balance sheet | ||||||||||
A. Lease assets of $66 previously recognized under finance leases were reclassified from property, plant and equipment to right-of-use assets.
B. Prepaid land lease payments of $59 and $978 previously classified as prepayment under current assets and prepaid land lease payments under non-current assets were reclassified to right-of-use assets.
C. The Company recognized right-of-use assets and lease liabilities for those leases previously classified as operating leases under IAS 17, except for short-term leases and leases of low-value asset. The Company recognized right-of-use assets basedimpact on the amount equalconsolidated financial statements of our Company in prior periods and are not expected to significantly affect the lease liabilities. Lease liabilities were recognized based on the present value of the remaining lease payments, discounted using the lessee’s incremental borrowing rate at January 1, 2019.
Additionally, operating cash flows increased and financing cash flows decreased by $354 for the year ended December 31, 2019 as repayments on the principal portion of non-finance lease liabilities were classified as cash flows from financing activities for the year ended December 31, 2019, where previously it was classified as operating cash flows.
F-40
ASIA PACIFIC WIRE & CABLE CORPORATION LIMITED
NOTES TO THE CONSOLIDATED FINANCIAL STATEMENTS
|
|
|
|
|
|
Reconciliation of IAS 17 non-cancelled operating lease commitment to IFRS 16 lease liability:
| |||
| |||
|
| ||
|
| ||
|
|
| |
| |||
|
|
| |
|
|
| |
|
| ||
As of January 1, 2019, the weighted average discount rate was 3.48%.
|
|
The standards and interpretations that are issued, but not yet effective, up to the date of issuance of theour Company’s financial statements are disclosed below. TheOur Company intends to adopt these standards, if applicable, when they become effective.
The
On
They:
|
|
|
|
F-41
ASIA PACIFIC WIRE & CABLE CORPORATION LIMITED
NOTES TO THE CONSOLIDATED FINANCIAL STATEMENTS
4.NEW STANDARDS AND INTERPRETATIONS (continued)
4.2New accounting pronouncements
impact its classification.
The amendment could affect the classification of liabilities, particularly for previously considered management’s intention to determine classification and for some liabilities that can be converted into equity. The Our Company is based on the contractual arrangement in place at the reporting date for the classification, thus, thetherefore, our Company does not expect the
ReferenceOur Company will disclose the information required when the non-current liabilities are subject to the conceptual framework:future covenants.
7
The Company does not expect the amendments to have an impact on its consolidated financial statements.
Property, plant and equipment: proceeds before intended use – Amendments to IAS 16
On May 14, 2020, the IASB issued Property, Plant and Equipment: Proceeds before Intended Use, which prohibits entities deducting from the cost of an item of property, plant and equipment, any proceeds from selling items produced while bringing that asset to the location and condition necessary for it to be capable of operating in the manner intended by management. Instead, an entity recognizes the proceeds from selling such items, and the costs of producing those items, in profit or loss.
The amendments are effective for annual reporting periods beginning on or after January 1, 2022 and are to be applied retrospectively. Earlier application is permitted. An entity applies the amendments retrospectively only to items of property, plant and equipment that are brought to the location and condition necessary for them to be capable of operating in the manner intended by management on or after the beginning of the earliest period presented in the financial statements in which the entity first applies the amendments.
The Company does not expect the amendments to have an impact on its consolidated financial statements.
.
Onerous contracts – Amendments to IAS 37
On May 14, 2020, the IASB issued amendments to IAS 37 to specify which costs an entity needs to include when assessing whether a contract is onerous or loss-making. The amendments apply a “directly related cost approach”. The costs that related directly to a contract to provide goods or services include both incremental costs and allocation of costs directly related to contract activities. General and administrative costs do not relate directly to a contract and excluded unless they are explicitly chargeable to the counterparty under the contract. The amendments apply to contracts for which the entity has not yet fulfilled all its obligations at the beginning of the annual reporting period in which the entity first applies the amendments. Comparatives are not restated. The amendments are effective for annual reporting periods beginning on or after January 1, 2022. Early application is permitted.
F-42
ASIA PACIFIC WIRE & CABLE CORPORATION LIMITED
NOTES TO THE CONSOLIDATED FINANCIAL STATEMENTS
4.NEW STANDARDS AND INTERPRETATIONS (continued)
4.2New accounting pronouncements not effective (continued)
The Company will apply these amendments to contacts for which the Company has not yet fulfilled all its obligations at the beginning of the annual reporting period in which it first applies the amendments.
Interest rate benchmark reform Phase 2 – Amendments to IFRS 9, IAS 37, IFRS 7, IFRS 4 and IFRS 16
On August 27, 2020, the IASB issued Interest rate benchmark reform Phase 2 – Amendments to IFRS 9, IAS 37, IFRS 7, IFRS 4 and IFRS 16. The Phase 2 amendments address issues that arise from implementation of the reforms, including the replacement of one benchmark with an alternative one. A practical expedient is provided such that the change to contractual cash flows for financial assets and liabilities (including lease liabilities) is accounted for prospectively by revising the effective interest rate. In addition, hedge accounting will not be discontinued solely because of the IBOR reform. The amendments are effective for annual periods beginning on or after January 1, 2021 and are to be applied retrospectively. Early application is permitted. Restatement of prior periods is not required, however, an entity may restate prior periods if, and only if, it is possible without the use of hindsight.
Thedisclosed.
The
Year ended December 31, 2020 | North Asia |
| Thailand |
| ROW |
| Total segments |
| Corporate expense adjustments and eliminations |
| Consolidated |
| ||||||||||||||||||||||||||||||||||||||||||||||||||||||||
| US$’000 |
| US$’000 |
| US$’000 |
| US$’000 |
| US$’000 |
| US$’000 |
| ||||||||||||||||||||||||||||||||||||||||||||||||||||||||
| Year ended December 31, 2023 | Year ended December 31, 2023 | North Asia | Thailand | ROW | Total segments | Corporate expense adjustments and eliminations | Consolidated | |||||||||||||||||||||||||||||||||||||||||||||||||||||||||||||
| US$’000 | US$’000 | |||||||||||||||||||||||||||||||||||||||||||||||||||||||||||||||||||
Revenues |
|
|
|
|
|
|
|
|
|
|
|
|
| |||||||||||||||||||||||||||||||||||||||||||||||||||||||
| External customers | ||||||||||||||||||||||||||||||||||||||||||||||||||||||||||||||||||||
| External customers | ||||||||||||||||||||||||||||||||||||||||||||||||||||||||||||||||||||
External customers |
| 73,199 |
| 143,647 |
| 96,718 |
| 313,564 |
|
| — |
|
| 313,564 |
| |||||||||||||||||||||||||||||||||||||||||||||||||||||
Inter-segment |
| — |
|
| — |
|
| — |
|
| — |
| — |
|
| — |
| |||||||||||||||||||||||||||||||||||||||||||||||||||
Segment operating profit/(loss) |
| 3,087 |
| 11,250 |
| (4,492 | ) |
| 9,845 |
| (2,973 | ) |
| 6,872 |
| |||||||||||||||||||||||||||||||||||||||||||||||||||||
Depreciation and amortization(Included depreciation from right of use assets) |
| (796 | ) |
| (2,773 | ) |
| (1,715 | ) |
| (5,284 | ) |
| (118 | ) |
| (5,402 | ) | ||||||||||||||||||||||||||||||||||||||||||||||||||
Depreciation from right of use assets |
| (46 | ) |
| — |
|
| (504 | ) |
| (550 | ) |
| (71 | ) |
| (621 | ) | ||||||||||||||||||||||||||||||||||||||||||||||||||
| Depreciation and amortization (including depreciation from right of use assets) | ||||||||||||||||||||||||||||||||||||||||||||||||||||||||||||||||||||
Impairment of property, plant and equipment |
| — |
| (4 | ) |
| (198 | ) |
| (202 | ) |
| — |
|
| (202 | ) | |||||||||||||||||||||||||||||||||||||||||||||||||||
| Impairment loss on financial assets | ||||||||||||||||||||||||||||||||||||||||||||||||||||||||||||||||||||
Interest income |
| 94 |
| 192 |
| 33 |
| 319 |
|
| 1 |
|
| 320 |
| |||||||||||||||||||||||||||||||||||||||||||||||||||||
Interest expense |
| (178 | ) |
| (105 | ) |
| (257 | ) |
| (540 | ) |
| (75 | ) |
| (615 | ) | ||||||||||||||||||||||||||||||||||||||||||||||||||
Income tax (expense)/benefit |
| (791 | ) |
| (2,344 | ) |
| (714 | ) |
| (3,849 | ) |
| (167 | ) |
| (4,016 | ) | ||||||||||||||||||||||||||||||||||||||||||||||||||
|
|
|
|
|
|
|
|
|
|
|
|
|
| |||||||||||||||||||||||||||||||||||||||||||||||||||||||
Other disclosures |
|
|
|
|
|
|
|
|
|
|
|
|
| |||||||||||||||||||||||||||||||||||||||||||||||||||||||
| Other disclosures | ||||||||||||||||||||||||||||||||||||||||||||||||||||||||||||||||||||
| Other disclosures | ||||||||||||||||||||||||||||||||||||||||||||||||||||||||||||||||||||
Capital expenditure |
| 3,763 |
| 10,674 |
| 167 |
| 14,604 |
| — |
| 14,604 |
| |||||||||||||||||||||||||||||||||||||||||||||||||||||||
| Capital expenditure | ||||||||||||||||||||||||||||||||||||||||||||||||||||||||||||||||||||
| Capital expenditure | ||||||||||||||||||||||||||||||||||||||||||||||||||||||||||||||||||||
F-44
| 5. SEGMENT INFORMATION (continued) |
Year ended December 31, 2019 | North Asia |
| Thailand |
| ROW |
| Total segments |
| Corporate expense adjustments and eliminations |
| Consolidated |
| ||||||||||||||||||||||||||||||||||||||||||||||||||||||||
| US$’000 |
| US$’000 |
| US$’000 |
| US$’000 |
| US$’000 |
| US$’000 |
| ||||||||||||||||||||||||||||||||||||||||||||||||||||||||
| Year ended December 31, 2022 | Year ended December 31, 2022 | North Asia | Thailand | ROW | Total segments | Corporate expense adjustments and eliminations | Consolidated | |||||||||||||||||||||||||||||||||||||||||||||||||||||||||||||
| US$’000 | US$’000 | |||||||||||||||||||||||||||||||||||||||||||||||||||||||||||||||||||
Revenues |
|
|
|
|
|
|
|
|
|
|
|
|
| |||||||||||||||||||||||||||||||||||||||||||||||||||||||
| External customers | ||||||||||||||||||||||||||||||||||||||||||||||||||||||||||||||||||||
| External customers | ||||||||||||||||||||||||||||||||||||||||||||||||||||||||||||||||||||
External customers |
| 76,575 |
| 172,379 |
| 89,206 |
| 338,160 |
| — |
| 338,160 |
| |||||||||||||||||||||||||||||||||||||||||||||||||||||||
Inter-segment |
| — |
| 6 |
| — |
| 6 |
| (6 | ) |
| — |
| ||||||||||||||||||||||||||||||||||||||||||||||||||||||
Segment operating profit/(loss) |
| 1,237 |
| 3,042 |
| (1,659 | ) |
| 2,620 |
| (2,884 | ) |
| (264 | ) | |||||||||||||||||||||||||||||||||||||||||||||||||||||
Depreciation and amortization(Included depreciation from right of use assets) |
| (811 | ) |
| (2,842 | ) |
| (1,613 | ) |
| (5,266 | ) |
| (58 | ) |
| (5,324 | ) | ||||||||||||||||||||||||||||||||||||||||||||||||||
Depreciation from right of use assets |
| (44 | ) |
| — |
| (441 | ) |
| (485 | ) |
| (22 | ) |
| (507 | ) | |||||||||||||||||||||||||||||||||||||||||||||||||||
| Depreciation and amortization (including depreciation from right of use assets) | ||||||||||||||||||||||||||||||||||||||||||||||||||||||||||||||||||||
Impairment of property, plant and equipment |
| (549 | ) |
| 3 |
| — |
| (546 | ) |
| — |
| (546 | ) | |||||||||||||||||||||||||||||||||||||||||||||||||||||
Interest income |
| 57 |
| 403 |
| 45 |
| 505 |
| 1 |
| 506 |
| |||||||||||||||||||||||||||||||||||||||||||||||||||||||
Interest expense |
| (239 | ) |
| (481 | ) |
| (102 | ) |
| (822 | ) |
| (23 | ) |
| (845 | ) | ||||||||||||||||||||||||||||||||||||||||||||||||||
Income tax (expense)/benefit |
| (561 | ) |
| (1,235 | ) |
| 105 |
| (1,691 | ) |
| (366 | ) |
| (2,057 | ) | |||||||||||||||||||||||||||||||||||||||||||||||||||
| Income tax expense | ||||||||||||||||||||||||||||||||||||||||||||||||||||||||||||||||||||
|
|
|
|
|
|
|
|
|
|
|
|
|
| |||||||||||||||||||||||||||||||||||||||||||||||||||||||
Other disclosures |
|
|
|
|
|
|
|
|
|
|
|
|
| |||||||||||||||||||||||||||||||||||||||||||||||||||||||
| Other disclosures | ||||||||||||||||||||||||||||||||||||||||||||||||||||||||||||||||||||
| Other disclosures | ||||||||||||||||||||||||||||||||||||||||||||||||||||||||||||||||||||
Capital expenditure |
| 552 |
| 4,590 |
| 242 |
| 5,384 |
| 78 |
| 5,462 |
| |||||||||||||||||||||||||||||||||||||||||||||||||||||||
| Capital expenditure | ||||||||||||||||||||||||||||||||||||||||||||||||||||||||||||||||||||
| Capital expenditure | ||||||||||||||||||||||||||||||||||||||||||||||||||||||||||||||||||||
Year ended December 31, 2018 | North Asia |
| Thailand |
| ROW |
| Total segments |
| Corporate expense adjustments and eliminations |
| Consolidated |
| ||||||
| US$’000 |
| US$’000 |
| US$’000 |
| US$’000 |
| US$’000 |
| US$’000 |
| ||||||
Revenues |
|
|
|
|
|
|
|
|
|
|
|
|
|
|
|
|
|
|
External customers |
| 103,647 |
|
| 213,424 |
|
| 108,869 |
|
| 425,940 |
|
| — |
|
| 425,940 |
|
Inter-segment |
| 4,076 |
|
| 392 |
|
| 6,308 |
|
| 10,776 |
|
| (10,776 | ) |
| — |
|
Segment operating profit/(loss) |
| 5,234 |
|
| 9,539 |
|
| (2,306 | ) |
| 12,467 |
|
| (3,143 | ) |
| 9,324 |
|
Depreciation and amortization |
| (829 | ) |
| (2,836 | ) |
| (1,333 | ) |
| (4,998 | ) |
| (20 | ) |
| (5,018 | ) |
Impairment of property, plant and equipment |
| — |
|
| (11 | ) |
| — |
|
| (11 | ) |
| — |
|
| (11 | ) |
Interest income |
| 117 |
|
| 611 |
|
| 42 |
|
| 770 |
|
| (288 | ) |
| 482 |
|
Interest expense |
| (397 | ) |
| (748 | ) |
| (34 | ) |
| (1,179 | ) |
| (21 | ) |
| (1,200 | ) |
Income tax (expense)/benefit |
| (1,212 | ) |
| (2,152 | ) |
| 384 |
|
| (2,980 | ) |
| (906 | ) |
| (3,886 | ) |
|
|
|
|
|
|
|
|
|
|
|
|
|
|
|
|
|
|
|
Other disclosures |
|
|
|
|
|
|
|
|
|
|
|
|
|
|
|
|
|
|
Capital expenditure |
| 1,188 |
|
| 2,859 |
|
| 451 |
|
| 4,498 |
|
| 10 |
|
| 4,508 |
|
| Year ended December 31, 2021 | North Asia | Thailand | ROW | Total segments | Corporate expense adjustments and eliminations | Consolidated | |||||||||||||||||||||||||||||
| US$’000 | US$’000 | US$’000 | US$’000 | US$’000 | US$’000 | ||||||||||||||||||||||||||||||
| Revenues | |||||||||||||||||||||||||||||||||||
| External customers | 107,032 | 197,779 | 171,848 | 476,659 | — | 476,659 | |||||||||||||||||||||||||||||
| Inter-segment | — | 7 | — | 7 | (7) | — | |||||||||||||||||||||||||||||
| Segment operating profit/(loss) | 4,523 | (13,537) | 6,690 | (2,324) | (3,009) | (5,333) | |||||||||||||||||||||||||||||
| Depreciation and amortization (including depreciation from right of use assets) | (1,074) | (2,752) | (1,566) | (5,392) | (102) | (5,494) | |||||||||||||||||||||||||||||
| Impairment of property, plant and equipment | — | (7) | — | (7) | — | (7) | |||||||||||||||||||||||||||||
| Interest income | 43 | 76 | 3 | 122 | 1 | 123 | |||||||||||||||||||||||||||||
| Interest expense | (285) | (380) | (340) | (1,005) | (92) | (1,097) | |||||||||||||||||||||||||||||
| Income tax (expense)/benefit | (2,104) | 4,223 | (1,539) | 580 | 765 | 1,345 | |||||||||||||||||||||||||||||
| Other disclosures | |||||||||||||||||||||||||||||||||||
| Capital expenditure | 11 | 5,585 | 2,018 | 7,614 | 937 | 8,551 | |||||||||||||||||||||||||||||
F-45
| 5. SEGMENT INFORMATION (continued) |
| For the year ended December 31, |
| |||||||||||||||||||||||||||||||||||||||||
| 2020 |
| 2019 |
| 2018 |
| |||||||||||||||||||||||||||||||||||||
| US$’000 |
| US$’000 |
| US$’000 |
| |||||||||||||||||||||||||||||||||||||
Segment operating profit |
| 9,845 |
| 2,620 |
| 12,467 |
| ||||||||||||||||||||||||||||||||||||
Corporate expenses adjustments and eliminations |
| (2,973 | ) |
| (2,884 | ) |
| (3,143 | ) | ||||||||||||||||||||||||||||||||||
|
| 6,872 |
|
| (264 | ) |
| 9,324 |
| ||||||||||||||||||||||||||||||||||
| For the year ended December 31, | For the year ended December 31, | ||||||||||||||||||||||||||||||||||||||||||
| 2023 | 2023 | 2022 | 2021 | ||||||||||||||||||||||||||||||||||||||||
| US$’000 | US$’000 | ||||||||||||||||||||||||||||||||||||||||||
| Segment operating profit/(loss) | |||||||||||||||||||||||||||||||||||||||||||
| Corporate expenses and others | |||||||||||||||||||||||||||||||||||||||||||
| 5,755 | |||||||||||||||||||||||||||||||||||||||||||
Other operating income |
| 814 |
| 385 |
| 805 |
| ||||||||||||||||||||||||||||||||||||
Other operating expenses |
| (129 | ) |
| (770 | ) |
| (1,445 | ) | ||||||||||||||||||||||||||||||||||
Operating profit |
| 7,557 |
|
| (649 | ) |
| 8,684 |
| ||||||||||||||||||||||||||||||||||
| Net impairment loss on financial and contract assets | |||||||||||||||||||||||||||||||||||||||||||
| Operating profit/(loss) | |||||||||||||||||||||||||||||||||||||||||||
Finance costs |
| (744 | ) |
| (1,012 | ) |
| (1,378 | ) | ||||||||||||||||||||||||||||||||||
Finance income |
| 320 |
| 506 |
| 482 |
| ||||||||||||||||||||||||||||||||||||
Share of loss of associates |
| (1 | ) |
| (3 | ) |
| (3 | ) | ||||||||||||||||||||||||||||||||||
Exchange (loss)/gain |
| (579 | ) |
| 1,550 |
| 1,741 |
| |||||||||||||||||||||||||||||||||||
| Exchange gain/(loss) | |||||||||||||||||||||||||||||||||||||||||||
Other income |
| 1,173 |
| 717 |
| 1,817 |
| ||||||||||||||||||||||||||||||||||||
Other expense |
| (1 | ) |
| (3 | ) |
| (11 | ) | ||||||||||||||||||||||||||||||||||
Profit before tax |
| 7,725 |
|
| 1,106 |
|
| 11,332 |
| ||||||||||||||||||||||||||||||||||
| Profit/(loss) before tax | |||||||||||||||||||||||||||||||||||||||||||
|
|
|
|
|
|
|
|
|
| Corporate |
|
|
| ||||||||||||||||||||||||||||||||||||||||||||||||||||||||||||
|
|
|
|
|
|
|
|
|
| adjustments |
|
|
| ||||||||||||||||||||||||||||||||||||||||||||||||||||||||||||
| North Asia |
| Thailand |
| ROW |
| Total segments |
| and eliminations |
| Consolidated |
| |||||||||||||||||||||||||||||||||||||||||||||||||||||||||||||
| US$’000 |
| US$’000 |
| US$’000 |
| US$’000 |
| US$’000 |
| US$’000 |
| |||||||||||||||||||||||||||||||||||||||||||||||||||||||||||||
As of December 31, 2020 |
|
|
|
|
|
|
|
|
|
|
|
|
| ||||||||||||||||||||||||||||||||||||||||||||||||||||||||||||
| North Asia | North Asia | Thailand | ROW | Total segments | Corporate adjustments and eliminations | Consolidated | |||||||||||||||||||||||||||||||||||||||||||||||||||||||||||||||||||
| US$’000 | US$’000 | ||||||||||||||||||||||||||||||||||||||||||||||||||||||||||||||||||||||||
| As of December 31, 2023 | |||||||||||||||||||||||||||||||||||||||||||||||||||||||||||||||||||||||||
| Total assets | |||||||||||||||||||||||||||||||||||||||||||||||||||||||||||||||||||||||||
| Total assets | |||||||||||||||||||||||||||||||||||||||||||||||||||||||||||||||||||||||||
Total assets |
| 52,436 |
|
| 173,967 |
|
| 100,823 |
|
| 327,226 |
|
| 10,893 |
|
| 338,119 |
| |||||||||||||||||||||||||||||||||||||||||||||||||||||||
Total liabilities |
| 12,647 |
|
| 29,911 |
|
| 47,132 |
|
| 89,690 |
|
| 13,554 |
|
| 103,244 |
| |||||||||||||||||||||||||||||||||||||||||||||||||||||||
As of December 31, 2019 |
|
|
|
|
|
|
|
|
|
|
|
|
|
|
|
|
|
| |||||||||||||||||||||||||||||||||||||||||||||||||||||||
| As of December 31, 2022 | |||||||||||||||||||||||||||||||||||||||||||||||||||||||||||||||||||||||||
| Total assets | |||||||||||||||||||||||||||||||||||||||||||||||||||||||||||||||||||||||||
| Total assets | |||||||||||||||||||||||||||||||||||||||||||||||||||||||||||||||||||||||||
Total assets |
| 49,379 |
|
| 165,579 |
|
| 76,618 |
|
| 291,576 |
|
| 7,335 |
|
| 298,911 |
| |||||||||||||||||||||||||||||||||||||||||||||||||||||||
Total liabilities |
| 14,212 |
|
| 26,706 |
|
| 21,834 |
|
| 62,752 |
|
| 7,724 |
|
| 70,476 |
| |||||||||||||||||||||||||||||||||||||||||||||||||||||||
Reconciliation
| As of December 31, |
| ||||
| 2020 |
| 2019 |
| ||
| US$’000 |
| US$’000 |
| ||
Segment operating assets |
| 327,226 |
|
| 291,576 |
|
Corporate and other assets |
| 6,074 |
|
| 2,466 |
|
Investment in associates |
| 930 |
|
| 935 |
|
Deferred tax assets |
| 3,889 |
|
| 3,939 |
|
Inter-segment elimination |
| — |
|
| (5 | ) |
Total assets |
| 338,119 |
|
| 298,911 |
|
F-46
ASIA PACIFIC WIRE & CABLE CORPORATION LIMITED
| 5. SEGMENT INFORMATION (continued) |
| As of December 31, | |||||||||||
| 2023 | 2022 | ||||||||||
| US$’000 | US$’000 | ||||||||||
| Segment operating assets | 353,844 | 356,473 | |||||||||
| Corporate and other assets | 4,211 | 6,598 | |||||||||
| Investment in associates | 810 | 805 | |||||||||
| Deferred tax assets | 7,799 | 7,143 | |||||||||
| Total assets | 366,664 | 371,019 | |||||||||
| As of December 31, |
| ||||||||||||||||||||||||||
| 2020 |
| 2019 |
| ||||||||||||||||||||||||
| US$’000 |
| US$’000 |
| ||||||||||||||||||||||||
| As of December 31, | As of December 31, | |||||||||||||||||||||||||||
| 2023 | 2023 | 2022 | ||||||||||||||||||||||||||
| US$’000 | US$’000 | |||||||||||||||||||||||||||
Segment operating liabilities |
| 89,690 |
| 62,752 |
| |||||||||||||||||||||||
Corporate liabilities |
| 9,146 |
| 3,591 |
| |||||||||||||||||||||||
Deferred tax liabilities |
| 4,408 |
| 4,139 |
| |||||||||||||||||||||||
Inter-segment elimination |
| — |
|
| (6 | ) | ||||||||||||||||||||||
Total liabilities |
| 103,244 |
|
| 70,476 |
| ||||||||||||||||||||||