Page
CAUTIONARY STATEMENT CONCERNING FORWARD-LOOKING STATEMENTS
We have made statements in this Annual Report on Form 20-F that constitute forward-looking statements within the meaning of Section 27A of the Securities Act of 1933, as amended, Section 21E of the Securities Exchange Act of 1934, as amended, and the safe harbor provisions of the Private Securities Litigation Reform Act of 1995. These statements appear throughout this report and include statements regarding our intent, belief or current expectations regarding:
| · | asset growth and alternative sources of funding |
| · | growth of our fee-based business |
| · | financing plans |
| · | impact of competition |
| · | impact of regulation |
| · | exposure to market risks including: |
| · | interest rate risk |
| · | foreign exchange risk |
| · | equity price risk |
| · | projected capital expenditures |
| · | liquidity |
| · | trends affecting: |
| · | our financial condition |
| · | our results of operation |
The sections of this Annual Report which contain forward-looking statements include, without limitation, “Item 3. Key Information—Risk Factors,” “Item 4. Information on the Company—C.B. Business Overview—Competition,” “Item 5. Operating and Financial Review and Prospects,” “Item 8. Financial Information—A. Consolidated Statements and Other Financial Information—Legal Proceedings,” and “Item 11. Quantitative and Qualitative Disclosures About Market Risk.” Our forward-looking statements also may be identified by words such as “believes,” “expects,” “anticipates,” “projects,” “intends,” “should,” “could,” “may,” “seeks,” “aim,” “combined,” “estimates,” “probability,” “risk,” “VaR,” “target,” “goal,” “objective,” “future” or similar expressions.
You should understand that the following important factors, in addition to those discussed elsewhere in this Annual Report and in the documents which are incorporated by reference, could affect our future results and could cause those results or other outcomes to differ materially from those expressed in our forward-looking statements:
| · | changes in capital markets in general that may affect policies or attitudes towards lending to Chile or Chilean companies; |
| · | changes in economic conditions; |
| · | the monetary and interest rate policies of Central Bank (as defined below); |
| · | inflation; |
| · | deflation; |
| · | unemployment; |
| · | increases in defaults by our customers and in impairment losses; |
| · | decreases in deposits; |
| · | customer loss or revenue loss; |
| · | unanticipated turbulence in interest rates; |
| · | movements in foreign exchange rates; |
| · | movements in equity prices or other rates or prices; |
| · | the effects of non-linear market behavior that cannot be captured by linear statistical models, such as the VaR model we use; |
| · | changes in Chilean and foreign laws and regulations; |
| · | changes in taxes; |
| · | competition, changes in competition and pricing environments; |
| · | our inability to hedge certain risks economically; |
| · | the adequacy of loss allowances; |
| · | technological changes; |
| · | changes in consumer spending and saving habits; |
| · | changes in demographics, consumer spending, investment or saving habits; |
| · | increased costs; |
| · | unanticipated increases in financing and other costs or the inability to obtain additional debt or equity financing on attractive terms; |
| · | changes in, or failure to comply with, banking regulations; |
| · | acquisitions or restructurings of businesses that may not perform in accordance with our expectations; |
| · | our ability to successfully market and sell additional services to our existing customers; |
| · | disruptions in client service; |
| · | damage to our reputation; |
| · | natural disasters; |
| · | implementation of new technologies; |
| · | the Group’s exposure to operational losses (e.g., failed internal or external processes, people and systems); and |
| · | an inaccurate or ineffective client segmentation model. |
You should not place undue reliance on such statements, which speak only as of the date at which they were made. The forward-looking statements contained in this report speak only as of the date of this Annual Report, and we do not undertake to update any forward-looking statement to reflect events or circumstances after the date hereof or to reflect the occurrence of unanticipated events.
As used in this annual report (the “Annual Report”), “Santander-Chile”, “the Bank”, “we,” “our” and “us” or similar terms refer to Banco Santander-Chile together with its consolidated subsidiaries.
When we refer to “Santander Spain,” we refer to our parent company, Banco Santander, S.A. References to “the Group,” “Santander Group” or “Grupo Santander” mean the worldwide operations of the Santander Spain conglomerate, as indirectly controlled by Santander Spain and its consolidated subsidiaries, including Santander-Chile.
As used in this Annual Report, the term “billion” means one thousand million (1,000,000,000).
In this Annual Report, references to “$”, “U.S.$”, “U.S. dollars” and “dollars” are to United States dollars; references to “Chilean pesos,” “pesos” or “Ch$” are to Chilean pesos; references to “CHF” or “CHF$” are to Swiss francs; references to “CNY” or “CNY$” are to Chinese yuan renminbi); and references to “UF” are toUnidades de Fomento. The UF is an inflation-indexed Chilean monetary unit with a value in Chilean pesos that changes daily to reflect changes in the official Consumer Price Index (“CPI”) of theInstituto Nacional de Estadísticas (the Chilean National Institute of Statistics) for the previous month. See “Item 3. Key Information—A. Selected Financial Data—Exchange Rates” for information regarding exchange rates.
As used in this Annual Report, the terms “write-offs” and “charge-offs” are synonyms.
In this Annual Report, references to the Audit Committee are to the Bank’sComité de Directores y Auditoría.
In this Annual Report, references to “BIS” are to the Bank for International Settlement, and references to “BIS ratio” are to the capital adequacy ratio as calculated in accordance with the Basel Capital Accord. References to the “Central Bank” are to theBanco Central de Chile. References to the SBIF are to the Superintendency of Banks and Financial Institutions.
Certain figures included in this Annual Report have been subject to rounding adjustments. Accordingly, figures shown as totals in certain tables may not be an arithmetic aggregation of the figures that precede them.
PRESENTATION OF FINANCIAL INFORMATION
Santander-Chile is a Chilean bank and maintains its financial books and records in Chilean pesos and prepares its consolidated financial statements in accordance with International Financial Reporting Standards (“IFRS”) as issued by the International Accounting Standards Board (“IASB”). Any reference to IFRS in this document is to IFRS as issued by the IASB.
As required by local regulations, our locally filed consolidated financial statements have been prepared in accordance with Chilean accounting principles issued by the SBIF (“Chilean Bank GAAP”). Therefore, our locally filed consolidated financial statements have been adjusted to IFRS in order to comply with the requirements of the Securities and Exchange Commission (the “SEC”). Chilean Bank GAAP principles are substantially similar to IFRS but there are some exceptions. For further details and a discussion of the main differences between Chilean Bank GAAP and IFRS, see to “Item 5. Operating and Financial Review and Prospects—A. Accounting Standards Applied in 2013.2015.”
This Annual Report contains our consolidated financial statements as of December 31, 2013, 20122015 and 20112014 and for the years then ended December 31, 2015, 2014 and 2013 (the “Audited Consolidated Financial Statements”). Such Audited Consolidated Financial Statements have been prepared in accordance with IFRS as issued by the IASB, and have been audited by Deloitte Auditores y Consultores Limitada, independent registered public accountants.accounting firm. See page F-1F-2 of the Audited Consolidated Financial
Statements for the 2013, 2012 and 20112015 report prepared by Deloitte Auditores y Consultores Limitada. The Audited Consolidated Financial Statements have been prepared from accounting records maintained by the Bank and its subsidiaries.
The notes to the Audited Consolidated Financial Statements contain information in addition to that presented inform an integral part of the Audited Consolidated Financial Statements which provideand contain additional information and narrative descriptions or details of these financial statements.
We have formatted our financial information according to the classification format for banks used in Chile.Chile for purposes of IFRS. We have not reclassified the line items to comply with Article 9 of Regulation S-X. Article 9 is a regulation of the SEC that contains formatting requirements for bank holding company financial statements.
Functional and Presentation Currency
The Chilean peso is the currency of the primary economic environment in which the Bank operates and the currency that influences its structure of costs and revenues, and in accordance with International Accounting Standard 21 –The Effects of Changes in Foreign Exchange Rates has been defined as the functional and presentation currency. Accordingly, all balances and transactions denominated in currencies other than the Chilean peso are treated as “foreign currency.”
For presentational purposes, we have translated millions of Chilean pesos (Ch$ million) into thousands of USU.S. dollars (U.S.$ thousand) using the rate as indicated below under “Exchange Rates,” for the financial information included in this Annual Report. See “Note 1—Summary of Significant Accounting Principles—e) Functional and presentation currency.”
Loans
Unless otherwise specified, all references herein (except in the Audited Consolidated Financial Statements) to loans are to loans and financial leases before deduction for loan loss allowance, and, except as otherwise specified, all market share data presented herein is based on information published periodically by the SBIF. Non-performing loans include the entire principal amount and accrued but unpaid interest on loans for which either principal or interest is past-due for 90 days or more and which do not accrue interest. Restructured loans for which no payments are past-due are not ordinarily classified as non-performing loans. See “Item 5. Operating and Financial Review and Prospects—F.C. Selected Statistical Information—Classification of Loan Portfolio Based on the Borrower’s Payment Performance.”
Under IFRS, a loan is evaluated on each financial statement reporting date to determine whether objective evidence of impairment exists. A loan will be impaired if, and only if, objective evidence of impairment exists as a result of one or more events that occurred after the initial recognition of the loan, and such event or events have an impact on the estimated future cash flows of such loan that can be reliably estimated. It may not be possible to identify a single event that was the individual cause of the impairment.
An impairment loss relating to aan individually significant loan recorded at amortized cost which has experienced objective evidence of impairment is calculated as the difference between the carryingrecorded amount of the financial assetloan and the presentfair value of estimated future cash flows discounted at the effective interest rate.collateral less costs to sell (practical expedient as allowed under IAS 39, “Financial Instruments”, Application Guidance paragraph 84).
Individually significantThose loans individually assessed for impairment and found not to be individually impaired are included in the loans collectively assessed for impairment (so that the collective assessment includes both the remainder of the loans not individually tested for impairment. The remaining financial assets are evaluated collectively in groups withassessed and those not found to be individually impaired) where grouping of such loans on a collective basis is performed using similar credit risk characteristics.
The reversal of an impairment loss occurs only if it can be objectively related to an event occurring after the initial impairment loss was recorded. In the case of loans recorded at amortized cost, the reversal is recorded in income. See “Item 5. Operating and Financial Review and Prospects—F.C. Selected Statistical Information—Analysis of Loan Loss Allowances.”
Outstanding loans and the related percentages of our loan portfolio consisting of corporate and consumer loans in the section entitled “Item 4. Information on the Company—C.B. Business Overview” are categorized based on the nature of the borrower. Outstanding loans and related percentages of our loan portfolio consisting of corporate and consumer loans in the section entitled “Item 5. Operating and Financial Review and Prospects—F.C. Selected Statistical Information” are categorized in accordance with the reporting requirements of the SBIF, which are based on the type and term of loans. This disclosure is consistent with IFRS.
Effect of Rounding
Certain figures included in this Annual Report and in the Audited Consolidated Financial Statements have been rounded up for ease of presentation. Percentage figures included in this Annual Report have not in all cases been calculated on the basis of such rounded figures but on the basis of such amounts prior to rounding. For this reason, certain percentage amounts in this Annual Report may vary from those obtained by performing the same calculations using the figures in the Audited Consolidated Financial Statements. Certain other amounts that appear in this Annual Report may not sum due to rounding.
Economic and Market Data
In this Annual Report, unless otherwise indicated, all macroeconomic data related to the Chilean economy is based on information published by the Central Bank, and all market share and other data related to the Chilean financial system is based on information published by the SBIF and our analysis of such information. Information regarding the consolidated risk index of the Chilean financial system as a whole is not available.
Exchange Rates
This Annual Report contains translations of certain Chilean peso amounts into U.S. dollars at specified rates solely for the convenience of the reader. These translations should not be construed as representations that the Chilean peso amounts actually represent such U.S. dollar amounts, were converted from U.S. dollars at the rate indicated in preparing the Audited Consolidated Financial Statements, could be converted into U.S. dollars at the rate indicated, were converted or will be converted at all.
Unless otherwise indicated, all U.S. dollar amounts at any year end, for any period have been translated from Chilean pesos based on the interbank market rate published by Reuters at 1:30 pm on the last business day of the period. On December 31, 20122014 and 2013,2015 the exchange rate in the Informal Exchange Market as published by Reuters at 1:30 pm on these days was Ch$478.85608.33 and Ch$524.20707.80 respectively, or 0.05% less0.16% and 0.08%0.06% more, respectively, than the published observed exchange rate published by the Central Bank for such date of Ch$478.60607,38 and Ch$523.76,707.34 respectively, per U.S.$1.00. The Federal Reserve Bank of New York does not report a noon buying rate for the Chilean peso. For more information on the observed exchange rate, see “Item 3. Key Information—A. Selected Financial Data—Exchange Rates” of the Annual Report.
As of December 31, 20122014 and 2013,2015, one UF was equivalent to Ch$ 22,840.7524,627.10 and Ch$ 23,309.5625,629.09, respectively. The U.S. dollar equivalent of one UF was U.S.$44.5036.21 as of December 31, 2013,2015, using the observed exchange rate reported by the Central Bank as of December 31, 2013,30, 2015 of Ch$ 523.7636.23 per U.S.$1.00.
ITEM 1. IDENTITY OF DIRECTORS, SENIOR MANAGEMENT AND ADVISORSADVISERS
Not applicable.
ITEM 2. OFFER STATISTICS AND EXPECTED TIMETABLE
Not applicable.
A. Selected Financial Data
The following table presents selected historical financial information for Santander-Chile as of the dates and for each of the periods indicated. Financial information for Santander-Chile as of and for the years ended December 31, 2015, 2014, 2013, 2012, 2011, 2010, and 20092011 has been derived from our audited consolidated financial statementsAudited Consolidated Financial Statements prepared in accordance with IFRS. In the F-pages of this Annual Report on Form 20-F, our audited financial statements for the years 2015, 2014 and 2013 are presented. The audited financial statements for 2012 and 2011 are not included in this document, but they can be found in our previous Annual Reports on Form 20-F. These consolidated financial statements differ in some respects from our locally filed financial statements at and for the years ended December 31, 2015, 2014, 2013, 2012, 2011, 2010, and 20092011 prepared in accordance with Chilean Bank GAAP.
The following table should be read in conjunction with, and is qualified in its entirety by reference to, our Audited Consolidated Financial Statements appearing elsewhere in this Annual Report.
| As of and for the years ended December 31, | ||||||
2013 | 2013 | 2012 | 2011 | 2010 | 2009 | |
| In U.S.$ thousands (1) | In Ch$ millions (2) | |||||
| CONSOLIDATED STATEMENT OF INCOME DATA (IFRS) | ||||||
| Net interest income | 2,054,106 | 1,076,762 | 1,042,734 | 972,300 | 939,719 | 856,516 |
| Provision for loan losses | (708,626) | (371,462) | (403,692) | (316,137) | (253,915) | (333,145) |
| Net fee and commission income | 438,451 | 229,836 | 270,572 | 277,836 | 263,582 | 254,130 |
| Operating costs (3) | (1,064,199) | (557,853) | (539,742) | (500,447) | (451,936) | (407,894) |
| Other income, net (4) | 308,423 | 161,676 | 36,034 | 50,878 | 95,365 | 155,927 |
| Income before tax | 1,028,155 | 538,959 | 405,906 | 484,430 | 592,815 | 525,534 |
| Income tax expense | (180,332) | (94,530) | (44,473) | (77,308) | (85,343) | (88,924) |
| Net income for the year | 847,823 | 444,429 | 361,433 | 407,122 | 507,472 | 436,610 |
| Net income attributable to: | ||||||
| Bank shareholders | 843,750 | 442,294 | 356,808 | 402,191 | 505,393 | 431,557 |
| Non-controlling interests | 4,073 | 2,135 | 4,625 | 4,931 | 2,079 | 5,053 |
| Net income attributable to Bank shareholders per share | 4.48 | 2.35 | 1.89 | 2.13 | 2.68 | 2.29 |
| Net income attributable to Bank shareholders per ADS (5) | 1.79 | 938.83 | 757.37 | 2,217.48 | 2,786.48 | 2,379.39 |
| Weighted-average shares outstanding (in millions) | 188,446.1 | 188,446.1 | 188,446.1 | 188,446.1 | 188,446.1 | 188,446.1 |
| Weighted-average ADS outstanding (in millions) (5) | 471.1 | 471.1 | 471.1 | 181.4 | 181.4 | 181.4 |
| CONSOLIDATED STATEMENT OF FINANCIAL POSITION DATA (IFRS) | ||||||
| Cash and deposits in banks | 2,998,493 | 1,571,810 | 1,250,414 | 2,793,701 | 1,762,198 | 2,043,458 |
| Financial investments (6) | 3,826,839 | 2,006,029 | 2,171,438 | 2,084,002 | 2,024,635 | 2,642,649 |
| Loans before allowance from loan losses | 40,176,958 | 21,060,761 | 18,966,652 | 17,434,782 | 15,727,282 | 13,751,276 |
| Loan loss allowance | (1,173,089) | (614,933) | (550,048) | (488,468) | (425,447) | (349,527) |
| Financial derivative contracts (assets) | 2,850,092 | 1,494,018 | 1,293,212 | 1,601,896 | 1,624,378 | 1,393,878 |
| Other assets (7) | 3,060,934 | 1,604,542 | 1,627,434 | 1,241,979 | 1,377,668 | 1,291,141 |
| Total assets | 51,740,227 | 27,122,227 | 24,759,102 | 24,667,892 | 22,090,714 | 20,772,875 |
| Deposits (8) | 29,179,769 | 15,296,035 | 14,082,232 | 13,334,929 | 11,495,191 | 10,708,791 |
| Other interest bearing liabilities (9) | 13,887,424 | 7,279,788 | 6,506,020 | 7,264,311 | 6,235,959 | 6,232,982 |
| Financial derivative contracts (liabilities) | 2,464,297 | 1,291,785 | 1,146,161 | 1,292,402 | 1,643,979 | 1,348,906 |
| Total equity (10) | 4,525,860 | 2,372,456 | 2,196,501 | 2,093,280 | 1,937,977 | 1,689,903 |
| Equity attributable to Bank shareholders | 4,471,484 | 2,343,952 | 2,162,236 | 2,059,479 | 1,906,168 | 1,660,104 |
As of and for the years ended December 31, | |||||
2013 | 2012 | 2011 | 2010 | 2009 | |
| CONSOLIDATED RATIOS | |||||
| (IFRS) | |||||
| Profitability and performance: | |||||
| Net interest margin (11) | 4.6% | 4.8% | 4.8% | 5.4% | 5.3% |
| Return on average total assets (12) | 1.6% | 1.4% | 1.7% | 2.4% | 2.2% |
| Return on average equity (13) | 18.9% | 16.5% | 20.4% | 29.0% | 27.3% |
| Capital: | |||||
| Average equity as a percentage of average total assets (14) | 8.7% | 8.7% | 8.3% | 8.4% | 8.0% |
| Total liabilities as a multiple of equity (15) | 10.4 | 10.3 | 10.8 | 10.4 | 11.3 |
| Credit Quality: | |||||
| Non-performing loans as a percentage of total loans (16) | 2.9% | 3.2% | 2.9% | 2.7% | 3.0% |
| Allowance for loan losses as percentage of total loans | 2.9% | 2.9% | 2.8% | 2.7% | 2.5% |
| Operating Ratios: | |||||
| Operating expenses /operating revenue (17) | 40.2% | 42.5% | 41.4% | 37.0% | 34.2% |
| Operating expenses /average total assets | 2.3% | 2.4% | 2.3% | 2.2% | 2.2% |
| OTHER DATA | |||||
| CPI Inflation Rate (18) | 3.0% | 1.5% | 4.4% | 3.0% | -1.4% |
| Revaluation (devaluation) rate (Ch$/U.S.$) at year end (18) | 9.4% | -8.2% | 11.3% | -7.5% | -19.5% |
| Number of employees at period end | 11,516 | 11,713 | 11,566 | 11,001 | 11,118 |
| Number of branches and offices at period end | 493 | 504 | 499 | 504 | 498 |
| As of and for the years ended December 31, | ||||||||||||||||||||||||
| 2015 | 2015 | 2014 | 2013 | 2012 | 2011 | |||||||||||||||||||
| In U.S.$ thousands(1) | In Ch$ millions (2) | |||||||||||||||||||||||
| CONSOLIDATED STATEMENT OF INCOME DATA (IFRS) | ||||||||||||||||||||||||
| Net interest income | 1,773,391 | 1,255,206 | 1,317,104 | 1,076,762 | 1,042,734 | 972,300 | ||||||||||||||||||
| Net fee and commission income | 335,727 | 237,627 | 227,283 | 229,836 | 270,572 | 277,836 | ||||||||||||||||||
| Financial transactions, net | 205,565 | 145,499 | 112,565 | 124,437 | 82,299 | 94,197 | ||||||||||||||||||
| Other operating income | 9,097 | 6,439 | 6,545 | 88,155 | 13,105 | 18,749 | ||||||||||||||||||
| Net operating profit before provision for loan losses | 2,323,780 | 1,644,771 | 1,663,497 | 1,519,190 | 1,408,710 | 1,363,082 | ||||||||||||||||||
| Provision for loan losses | (564,110 | ) | (399,277 | ) | (354,903 | ) | (371,462 | ) | (403,692 | ) | (316,137 | ) | ||||||||||||
| Net operating profit | 1,759,670 | 1,245,494 | 1,308,594 | 1,147,728 | 1,005,018 | 1,046,945 | ||||||||||||||||||
| Total operating expenses | (1,017,177 | ) | (719,958 | ) | (683,819 | ) | (610,191 | ) | (599,379 | ) | (564,655 | ) | ||||||||||||
| Operating income | 742,493 | 525,536 | 624,775 | 537,537 | 405,639 | 482,290 | ||||||||||||||||||
| Income from investments in associates and other companies | 3,656 | 2,588 | 2,165 | 1,422 | 267 | 2,140 | ||||||||||||||||||
| Income before tax | 746,149 | 528,124 | 626,940 | 538,959 | 405,906 | 484,430 | ||||||||||||||||||
| Income tax expense | (107,933 | ) | (76,395 | ) | (51,050 | ) | (94,530 | ) | (44,473 | ) | (77,308 | ) | ||||||||||||
| Net income for the year | 638,216 | 451,729 | 575,890 | 444,429 | 361,433 | 407,122 | ||||||||||||||||||
| Net income for the period attributable to: | ||||||||||||||||||||||||
| Equity holders of the Bank | 633,606 | 448,466 | 569,910 | 442,294 | 356,808 | 402,191 | ||||||||||||||||||
| Non-controlling interests | 4,610 | 3,263 | 5,980 | 2,135 | 4,625 | 4,931 | ||||||||||||||||||
| Net income attributable to Equity holders of the Bank per share | 3.36 | 2.38 | 3.02 | 2.35 | 1.89 | 2.13 | ||||||||||||||||||
| Net income attributable to Equity holders of the Bank per ADS (3) | 1,344.90 | 951.92 | 1,208.00 | 938.83 | 757.37 | 2,217.48 | ||||||||||||||||||
| Weighted-average shares outstanding (in millions) | 188,446.1 | 188,446.1 | 188,446.1 | 188,446.1 | 188,446.1 | 188,446.1 | ||||||||||||||||||
| Weighted-average ADS outstanding (in millions) (3) | 471.1 | 471.1 | 471.1 | 471.1 | 471.1 | 181.4 | ||||||||||||||||||
| CONSOLIDATED STATEMENT OF FINANCIAL POSITION DATA (IFRS) | ||||||||||||||||||||||||
| Cash and deposits in banks | 2,917,217 | 2,064,806 | 1,608,888 | 1,571,810 | 1,250,414 | 2,793,701 | ||||||||||||||||||
| Cash items in process of collection | 1,023,624 | 724,521 | 531,373 | 604,077 | 520,267 | 276,454 | ||||||||||||||||||
| Trading investments | 458,139 | 324,271 | 774,815 | 287,567 | 338,287 | 409,763 | ||||||||||||||||||
| Investments under resale agreements | 3,480 | 2,463 | - | 17,469 | 6,993 | 12,928 | ||||||||||||||||||
| Financial derivative contracts | 4,529,424 | 3,205,926 | 2,727,563 | 1,494,018 | 1,293,212 | 1,601,896 | ||||||||||||||||||
| Interbank loans, net | 13,720 | 9,711 | 11,942 | 124,954 | 90,414 | 87,677 | ||||||||||||||||||
| Loans and accounts receivable from customers, net | 34,654,910 | 24,528,745 | 22,196,390 | 20,320,874 | 18,326,190 | 16,858,637 | ||||||||||||||||||
| Available for sale investments | 2,888,402 | 2,044,411 | 1,651,598 | 1,700,993 | 1,826,158 | 1,661,311 | ||||||||||||||||||
| Investments in associates and other companies | 28,693 | 20,309 | 17,914 | 9,681 | 7,614 | 8,728 | ||||||||||||||||||
| Intangible assets | 72,248 | 51,137 | 40,983 | 66,703 | 87,347 | 80,739 | ||||||||||||||||||
| Property, plant, and equipment | 340,010 | 240,659 | 211,561 | 180,215 | 162,214 | 153,059 | ||||||||||||||||||
| Current taxes | - | - | 2,241 | 1,643 | 10,227 | 37,253 | ||||||||||||||||||
| Deferred taxes | 452,850 | 320,527 | 272,118 | 227,285 | 181,875 | 136,521 | ||||||||||||||||||
| Other assets | 1,554,357 | 1,100,174 | 927,961 | 514,938 | 657,890 | 550,326 | ||||||||||||||||||
| TOTAL ASSETS | 48,937,074 | 34,637,660 | 30,975,347 | 27,122,227 | 24,759,102 | 24,668,993 | ||||||||||||||||||
| Deposits and other demand liabilities | 10,392,937 | 7,356,121 | 6,480,497 | 5,620,763 | 4,970,019 | 4,413,815 | ||||||||||||||||||
| Cash items in process of being cleared | 652,949 | 462,157 | 281,259 | 276,379 | 284,953 | 89,486 | ||||||||||||||||||
| Obligations under repurchase agreements | 203,008 | 143,689 | 392,126 | 208,972 | 304,117 | 544,381 | ||||||||||||||||||
| Time deposits and other time liabilities | 17,212,160 | 12,182,767 | 10,413,940 | 9,675,272 | 9,112,213 | 8,921,114 | ||||||||||||||||||
| Financial derivative contracts | 4,044,371 | 2,862,606 | 2,561,384 | 1,291,785 | 1,146,161 | 1,292,402 | ||||||||||||||||||
| Interbank borrowing s | 1,847,378 | 1,307,574 | 1,231,601 | 1,682,377 | 1,438,003 | 1,920,092 | ||||||||||||||||||
| Issued debt instruments | 8,416,353 | 5,957,095 | 5,785,112 | 5,198,658 | 4,571,289 | 4,623,239 | ||||||||||||||||||
| Other financial liabilities | 311,567 | 220,527 | 205,125 | 189,781 | 192,611 | 176,599 | ||||||||||||||||||
| Current taxes | 25,143 | 17,796 | 1,077 | 50,242 | 525 | 1,498 | ||||||||||||||||||
| Deferred taxes | 5,519 | 3,906 | 7,631 | 26,753 | 9,544 | 5,315 | ||||||||||||||||||
| Provisions | 388,525 | 274,998 | 285,970 | 217,310 | 191,892 | 187,557 | ||||||||||||||||||
| Other liabilities | 1,477,634 | 1,045,869 | 654,557 | 311,479 | 341,274 | 398,977 | ||||||||||||||||||
| TOTAL LIABILITIES | 44,977,544 | 31,835,105 | 28,300,279 | 24,749,771 | 22,562,601 | 22,574,475 | ||||||||||||||||||
| Capital | 1,259,258 | 891,303 | 891,303 | 891,303 | 891,303 | 891,303 | ||||||||||||||||||
| Reserves | 2,158,651 | 1,527,893 | 1,307,761 | 1,130,991 | 975,460 | 802,528 | ||||||||||||||||||
| Valuation adjustments | 1,820 | 1,288 | 25,600 | (5,964 | ) | (3,781 | ) | 2,832 | ||||||||||||||||
| Retained earnings | 497,160 | 351,890 | 417,321 | 327,622 | 299,254 | 364,054 | ||||||||||||||||||
| Attributable to Equity holders of the Bank | 3,916,889 | 2,772,374 | 2,641,985 | 2,343,952 | 2,162,236 | 2,060,717 | ||||||||||||||||||
| Non-controlling interest | 42,641 | 30,181 | 33,083 | 28,504 | 34,265 | 33,801 | ||||||||||||||||||
| TOTAL EQUITY | 3,959,530 | 2,802,555 | 2,675,068 | 2,372,456 | 2,196,501 | 2,094,518 | ||||||||||||||||||
| TOTAL LIABILITIES AND EQUITY | 48,937,074 | 34,637,660 | 30,975,347 | 27,122,227 | 24,759,102 | 24,668,933 | ||||||||||||||||||
| As of and for the years ended December 31, | ||||||||||||||||||||
| 2015 | 2014 | 2013 | 2012 | 2011 | ||||||||||||||||
| CONSOLIDATED RATIOS | ||||||||||||||||||||
| (IFRS) | ||||||||||||||||||||
| Profitability and performance: | ||||||||||||||||||||
| Net interest margin (5) | 4.4 | % | 4.9 | % | 4.6 | % | 4.8 | % | 4.8 | % | ||||||||||
| Return on average total assets (6) | 1.3 | % | 1.8 | % | 1.6 | % | 1.4 | % | 1.7 | % | ||||||||||
| Return on average equity (7) | 16.0 | % | 21.4 | % | 18.9 | % | 16.5 | % | 20.4 | % | ||||||||||
| Capital: | ||||||||||||||||||||
| Average equity as a percentage of average total assets (8) | 8.2 | % | 8.2 | % | 8.7 | % | 8.7 | % | 8.3 | % | ||||||||||
| Total liabilities as a multiple of equity (9) | 11.4 | 10.6 | 10.4 | 10.3 | 10.8 | |||||||||||||||
| Credit Quality: | ||||||||||||||||||||
| Non-performing loans as a percentage of total loans (10) | 2.5 | % | 2.8 | % | 2.9 | % | 3.2 | % | 2.9 | % | ||||||||||
| Allowance for loan losses as percentage of total loans | 3.0 | % | 2.9 | % | 2.9 | % | 2.9 | % | 2.8 | % | ||||||||||
| Operating Ratios: | ||||||||||||||||||||
| Operating expenses /operating revenue (11) | 43.8 | % | 41.1 | % | 40.2 | % | 42.5 | % | 41.4 | % | ||||||||||
| Operating expenses /average total assets | 2.1 | % | 2.1 | % | 2.3 | % | 2.4 | % | 2.3 | % | ||||||||||
| OTHER DATA | ||||||||||||||||||||
| CPI Inflation Rate (12) | 4.4 | % | 4.7 | % | 3.0 | % | 1.5 | % | 4.4 | % | ||||||||||
| Revaluation (devaluation) rate (Ch$/U.S.$) at year end (12) | (16.5 | %) | (16.0 | %) | (9.4 | %) | 8.2 | % | (11.3 | %) | ||||||||||
| Number of employees at period end | 11,723 | 11,478 | 11,516 | 11,713 | 11,566 | |||||||||||||||
| Number of branches and offices at period end | 471 | 474 | 493 | 504 | 499 | |||||||||||||||
| (1) | Amounts stated in U.S. dollars at and for the year ended December 31, | |
| (2) | Except per share data, percentages and ratios, share numbers, employee numbers and branch numbers. | |
| (3) | ||
| On October 22, 2012 the Bank performed an ADR split: for each old ADR, an ADR holder received 2.5975 new ADRs, and the ratio of ADS to shares became 1 ADS = 400 shares. For the years | ||
| interests. |
| Net interest income divided by average interest earning assets (as presented in “Item 5. Operating and Financial Review and Prospects— | ||
| Net income for the year divided by average total assets (as presented in “Item 5. Operating and Financial Review and Prospects— | ||
| Net income for the year divided by average equity (as presented in “Item 5. Operating and Financial Review and Prospects— | ||
| This ratio is calculated using total average equity (as presented in “Item 5. Operating and Financial Review and Prospects— C. Selected Statistical Information”) including non-controlling interest. | ||
| Total liabilities divided by equity. | ||
| Non-performing loans include the aggregate unpaid principal and accrued but unpaid interest on all loans with at least one installment over 90 days past-due. | ||
| The efficiency ratio is equal to operating expenses over operating income. Operating expenses includes personnel salaries and expenses, administrative expenses, depreciation and amortization, impairment and other operating expenses. Operating income includes net interest income, net fee and commission income, net income from financial operations (net trading income), foreign exchange profit (loss), net and other operating income. | ||
| Based on information published by the Central Bank. |
Exchange Rates
Chile has two currency markets, theMercado Cambiario Formal, or the Formal Exchange Market, and theMercado Cambiario Informal, or the Informal Exchange Market. According to Law 18,840, the organic law of the Central Bank and the Central Bank Act (Ley Orgánica Constitucional del Banco Central de Chile), the Central Bank determines which purchases and sales of foreign currencies must be carried out in the Formal Exchange Market. Pursuant to Central Bank regulations currently in effect, all payments, remittances or transfers of foreign currency abroad which are required to be effected through the Formal Exchange Market may be effected with foreign currency procured outside the Formal Exchange Market. The Formal Exchange Market is comprised of the banks and other entities so authorized by the Central Bank. The Informal Exchange Market is comprised of entities that are not expressly authorized to operate in the Formal Exchange Market, such as certain foreign exchange houses and travel agencies, among others. The Central Bank is empowered to require that certain purchases and sales of foreign currencies be carried out on the Formal Exchange Market. The conversion from pesos to U.S. dollars of all payments and distributions with respect to the ADSs described in this Annual Report must be transacted at the spot market rate in the Formal Exchange Market.
Both the Formal and Informal Exchange Markets are driven by free market forces. Current regulations require that the Central Bank be informed of certain transactions and that they be effected through the Formal Exchange Market. In order to keep the average exchange rate within certain limits, the Central Bank may intervene by buying or selling foreign currency on the Formal Exchange Market.
The U.S.$ Observed Exchange Rate (dólar observado), which is reported by the Central Bank and published daily in the Chilean newspapers, is the weighted average exchange rate of the previous business day’s transactions in the Formal Exchange Market. The Central Bank has the power to intervene by buying or selling foreign currency on the Formal Exchange Market to attempt to maintain the Observed Exchange Rate within a desired range. Even though the Central Bank is authorized to carry out its transactions at the Observed Exchange Rate, it generally uses spot rates for its transactions. Other banks generally carry out authorized transactions at spot rates as well.
Purchases and sales of foreign currencies may be legally carried out in the Informal Exchange Market. The Informal Exchange Market reflects transactions carried out at informal exchange rates by entities not expressly authorized to operate in the Formal Exchange Market. There are no limits imposed on the extent to which the rate of exchange in the Informal Exchange Market can fluctuate above or below the Observed Exchange Rate. In recent years, the variation between the Observed Exchange Rate and the Informal Exchange Rate has not been significant. On December 31, 20122014 and 2013,2015 the exchange rate in the Informal Exchange Market as published by Reuters at 1:30 pm on these days was Ch$478.85608.33 and Ch$524.20707.80 respectively, or 0.05% less0.16% and 0.08%0.06% more, respectively, than the Central Bank’s published observed exchange rate for such date of Ch$478.60607.38 and Ch$523.76,707.34, respectively, per U.S.$1.00.
The following table sets forth the annual low, high, average and period-end observed exchange rate for U.S. dollars for each of the following periods, as reported by the Central Bank. We make no representation that the Chilean peso or the U.S. dollar amounts referred to herein actually represent, could have been or could be converted into U.S. dollars or Chilean pesos, as the case may be, at the rates indicated, at any particular rate or at all. The Federal Reserve Bank of New York does not report a noon buying rate for pesos.
Daily Observed Exchange Rate Ch$ Per U.S.$(1) | ||||
Year | Low(2) | High(2) | Average(3) | Period End |
| 2009 | 491.09 | 643.87 | 559.67 | 506.43 |
| 2010 | 468.37 | 549.17 | 510.38 | 468.37 |
| 2011 | 455.91 | 533.74 | 483.36 | 521.46 |
| 2012 | 469.65 | 519.69 | 494.99 | 478.60 |
| 2013 | 466.50 | 533.95 | 495.09 | 523.76 |
| Daily Observed Exchange Rate Ch$ Per U.S.$(1) | ||||||||||||||||||
| Year | Low(2) | High(2) | Average(3) | Period End | ||||||||||||||
| 2011 | 455.91 | 533.74 | 483.36 | 521.46 | ||||||||||||||
| 2012 | 469.65 | 519.69 | 494.99 | 478.60 | ||||||||||||||
| 2013 | 466.50 | 533.95 | 495.09 | 523.76 | ||||||||||||||
| 2014 | 524.61 | 621.41 | 570.01 | 607.38 | ||||||||||||||
| 2015 | 597.10 | 715.66 | 654.25 | 707.34 | ||||||||||||||
9
Daily Observed Exchange Rate Ch$ Per U.S.$(1) | ||||
Month | Low(2) | High(2) | Average(3) | Period End |
| October 2013 | 493.36 | 508.58 | 500.81 | 508.58 |
| November 2013 | 507.64 | 528.19 | 519.25 | 528.19 |
| December 2013 | 523.76 | 533.95 | 529.45 | 523.76 |
| January 2014 | 524.61 | 550.53 | 537.03 | 547.22 |
| February 2014 | 546.94 | 563.32 | 554.41 | 563.32 |
| March 2014 | 550.53 | 573.24 | 563.84 | 550.53 |
| April 2014 (until April 28, 2014) | 544.96 | 563.76 | 554.07 | 560.36 |
| Daily Observed Exchange Rate Ch$ Per U.S.$(1) | ||||||||||||||||||
| Month | Low(2) | High(2) | Average(3) | Period End | ||||||||||||||
| October 2015 | 673.91 | 698.72 | 685.31 | 690.34 | ||||||||||||||
| November 2015 | 688.94 | 715.66 | 704.00 | 712.63 | ||||||||||||||
| December 2015 | 693.72 | 711.52 | 704.24 | 707.34 | ||||||||||||||
| January 2016 | 710.16 | 730.31 | 721.95 | 711.72 | ||||||||||||||
| February 2016 | 689.18 | 715.41 | 703.51 | 689.18 | ||||||||||||||
| March 2016 | 671.97 | 694.82 | 682.07 | 675.10 | ||||||||||||||
| April 2016 (until April 28, 2016) | 657.90 | 682.45 | 670.26 | 668.49 | ||||||||||||||
Source: Central Bank.
| (1) | Nominal figures. | |
| (2) | Exchange rates are the actual low and high, on a day-by-day basis for each period. | |
| (3) | The average of monthly average rates during the year. |
Dividends
Under the current General Banking Law, a Chilean bank may only pay a single dividend per year (i.e.(i.e., interim dividends are not permitted). Santander-Chile’s annual dividend is proposed by its Board of Directors and is approved by the shareholders at the annual ordinary shareholders’ meeting held the year following that in which the dividend is generated. For example, the 20132015 dividend must be proposed and approved during the first four months of 2014.2016. Following shareholder approval, the proposed dividend is declared and paid. Historically, the dividend for a particular year has been declared and paid no later than one month following the shareholders’ meeting. Dividends are paid to shareholders of record on the fifth day preceding the date set for payment of the dividend. The applicable record dates for the payment of dividends to holders of ADSs will, to the extent practicable, be the same.
Under the General Banking Law, a bank must distribute cash dividends in respect of any fiscal year in an amount equal to at least 30% of its net income for that year, as long as the dividend does not result in the infringement of minimum capital requirements. The balances of our distributable net income are generally retained for use in our business (including for the maintenance of any required legal reserves). Although our Board of Directors currently intends to pay regular annual dividends, the amount of dividend payments will depend upon, among other factors, our then current level of earnings, capital and legal reserve requirements, as well as market conditions, and there can be no assurance as to the amount or timing of future dividends.
Dividends payable to holders of ADSs are net of foreign currency conversion expenses of JPMorgan ChaseThe Bank N.A.,of New York Mellon, as depositary (the “Depositary”) and will be subject to the Chilean withholding tax currently at the rate of 35% (subject to credits in certain cases as described in “Item 10. Additional Information—E. Taxation—Material Tax Consequences of Owning Shares of Our Common Stock or ADSs”).
Under the Foreign Investment Contract (as defined herein), the Depositary, on behalf of ADS holders, is granted access to the Formal Exchange Market to convert cash dividends from Chilean pesos to U.S. dollars and to pay such U.S. dollars to ADS holders outside Chile, net of taxes, and no separate registration by ADS holders is required. In the past, Chilean law required that holders of shares of Chilean companies who were not residents of Chile to register as foreign investors under one of the foreign investment regimes contemplated by Chilean law in order to have dividends, sale proceeds or other amounts with respect to their shares remitted outside Chile through the Formal Exchange Market. On April 19, 2001, the Central Bank deregulated the Exchange Market and eliminated the need to obtain approval from the Central Bank in order to remit dividends, but at the same time this eliminated the possibility of accessing the Formal Exchange Market. These changes do not affect the current Foreign Investment Contract, which was signed prior to April 19, 2001, which grants access to the Formal Exchange Market with prior approval of the Central Bank. See “Item 10. Additional Information—D. Exchange Controls.”
The following table presents dividends declared and paid by us in nominal terms in the past four years:
Year | Dividend | Per share | Per ADR | % over | % over |
| 2010 | 258,752 | 1.37 | 1,426.63 | 60 | 60 |
| 2011 | 286,294 | 1.52 | 1,578.48 | 60 | 57 |
| 2012 | 261,051 | 1.39 | 1,439.08 | 60 | 65 |
| 2013 | 232,780 | 1.24 | 494.10 | 60 | 65 |
| 2014(6) | 265,156 | 1.41 | 562.83 | 60 | 60 |
| Year | Dividend Ch$ mn (1) | Dividend US$ mn (2) | Per share Ch$/share (3) | Per ADS US$/ADS (4) | % over earnings (5) | % over earnings (6) | ||||||||||||||||||||
| 2012 | 261,051 | 533.1 | 1.39 | 2.94 | 60 | 65 | ||||||||||||||||||||
| 2013 | 232,780 | 493.1 | 1.24 | 1.05 | 60 | 65 | ||||||||||||||||||||
| 2014 | 265,156 | 476.0 | 1.41 | 1.01 | 60 | 60 | ||||||||||||||||||||
| 2015 | 330,198 | 540.4 | 1.75 | 1.15 | 60 | 58 | ||||||||||||||||||||
| 2016 (6) | 336,659 | 503.7 | 1.79 | 1.07 | 75 | 75 | ||||||||||||||||||||
| (1) | ||
| (2) | Millions of US$ using the observed exchange rate of the day the dividend was approved in the annual shareholders meeting. |
| (3) | Calculated on the basis of 188,446 million shares. | |
| ADS. |
| (5) | Calculated by dividing dividend paid in the year by net income attributable to | |
| Chilean GAAP. |
| (6) |
B. Capitalization and Indebtedness
| B. | Capitalization and Indebtedness |
Not applicable.
C. Reasons for the Offer and Use of Proceeds
| C. | Reasons for the Offer and Use of Proceeds |
Not applicable.
D. Risk Factors
| D. | Risk Factors |
You should carefully consider the following risk factors, which should be read in conjunction with all the other information presented in this Annual Report. The risks and uncertainties described below are not the only ones that we face. Additional risks and uncertainties that we do not know about or that we currently think are immaterial may also impair our business operations. Any of the following risks, if they actually occur, could materially and adversely affect our business, results of operations, prospects and financial condition.
We are subject to market risks that are presented both in this subsection and in “Item 5. Operating and Financial Review and Prospects” and “Item 11. Quantitative and Qualitative Disclosures about Market Risk.”
Risks Associated with Our Business
We are vulnerable to the current disruptions and volatility in the global financial markets.
In the recent past, six years, financial systems worldwide have experienced difficult credit and liquidity conditions and disruptions leading to less liquidity, greater volatility general widening of spreads(such as volatility in spreads) and, in some cases, lack of price transparency on interbank lending rates. Global economic conditions deteriorated significantly between 2007 and 2009, and many countries fell into recession. Recessionary conditions continue in some countries.Although most countries have begun to recover, this recovery may not be sustainable. Many major financial institutions, including some of the world’s largest global commercial banks, investment banks, mortgage lenders, mortgage guarantors and insurance companies experienced, and some continue to experience, significant difficulties. Around the world, there have also been runs on deposits at several financial institutions, numerous institutions have sought additional capital or have been assisted by governments, and many lenders and institutional investors have reduced or ceased providing funding to borrowers (including to other financial institutions).
Increased disruption and volatility in the global financial markets could have a material adverse effect on us, including our ability to access capital and liquidity on financial terms acceptable to us, if at all. If capital markets financing ceases to become available, or becomes excessively expensive, we may be forced to raise the rates we pay on deposits to attract more customers and become unable to maintain certain liability maturities. Any such increase in capital markets funding availability or costs or in deposit rates could have a material adverse effect on our interest margins and liquidity.
In particular, we may face, among others, the following risks related to the economic downturn:risks:
| · | Increased regulation of our industry. Compliance with such regulation will increase our costs and may affect the pricing for our products and services and limit our ability to pursue business opportunities. |
| · | Reduced demand for our products and services. |
| · | Inability of our borrowers to timely or fully comply with their existing obligations. |
| · | The process we use to estimate losses inherent in our credit exposure requires complex judgments, including forecasts of economic conditions and how these economic conditions might impair the ability of our borrowers to repay their loans. The degree of uncertainty concerning economic conditions may adversely affect the accuracy of our estimates, which may, in turn, impact the reliability of the process and the sufficiency of our loan loss allowances. |
| · | The value and liquidity of the portfolio of investment securities that we hold may be adversely affected. |
| · | Any worsening of global economic conditions may delay the recovery of the international financial industry and impact our financial condition and results of operations. |
| · | The recoverability of our retail loans in particular may be increasingly vulnerable to macroeconomic shocks that could negatively impact the household income of our retail customers and result in increased loan losses. |
SomeDespite recent improvements in certain segments of the global economy, uncertainty remains concerning the future economic environment. While certainThere can be no assurance that economic conditions in these segments ofwill continue to improve or that the global economy have experiencedeconomic condition as a moderate recovery, we expect suchwhole will improve significantly. Such economic uncertainty will continue, which could have a negative impact on our business and results of operations. Investors remain cautious. A slowing or failing of the economic recovery would likely aggravate the adverse effects of these difficult economic and market conditions on us and on others in the financial services industry.
Increased disruption and volatility in the global financial markets could have a material adverse effect on us, including our ability to access capital and liquidity on financial terms acceptable to us, if at all. If capital markets financing ceases to become available, or becomes excessively expensive, we may be forced to raise the rates we pay on deposits to attract more customers and become unable to maintain certain liability maturities. Any such increase in capital markets funding availability or costs or in deposit rates could have a material adverse effect on our interest margins and liquidity.
If all or some of the foregoing risks were to materialize, this could have a material adverse effect on us.
Credit, market and liquidity risk may have an adverse effect on our credit ratings and our cost of funds. Any downgrading in Chile’s, our controlling shareholder’sshareholders or our credit rating would likely increase our cost of funding, require us to post additional collateral or take other actions under some of our derivative contracts and adversely affect our interest margins and results of operations.
Credit ratings affect the cost and other terms upon which we are able to obtain funding. Rating agencies regularly evaluate us, and their ratings of our long-term debt are based on a number of factors, including our financial strength, conditions that affect the financial services industry generally and the economic environment in which the company operates. In addition, due to the methodology of the main rating agencies, our credit rating is affected by the rating of Chile’s sovereign debt. If Chile’s sovereign debt is downgraded, our credit rating would also likely be downgraded by an equivalent amount.
In addition, our ratings may be adversely affected by any downgrade in the ratings of our parent company, Santander Spain. The long-term debt of Santander Spain is currently rated investment grade by the major rating agencies—A3 by Moody’s Investors Service España, S.A., (“Moody’s”) A- by Standard & Poor’s Ratings Services (“S&P”) and A- by Fitch Ratings Ltd. (“Fitch”)—all of which have a stable outlook due to the gradual economic improvement in Spain.
Any downgrade in our debt credit ratings would likely increase our borrowing costs and require us to post additional collateral or take other actions under some of our derivative contracts, and could limit our access to capital markets and adversely affect our commercial business. For example, a ratings downgrade could adversely affect our ability to sell or market certain of our products, engage in certain longer-term and derivatives transactions and retain our customers, particularly customers who need a minimum rating threshold in order to invest. In addition, under the terms of certain of our derivative contracts, we may be required to maintain a minimum credit rating or terminate such contracts. Any of these results of a ratings downgrade, in turn, could reduce our liquidity and have an adverse effect on us, including our operating results and financial condition.
The long-term debt of Santander Spain is currently rated investment grade by the major rating agencies—Baa2 by Moody’s Investors Service España, S.A., (“Moody’s”) BBB by Standard & Poor’s Ratings Services (“S&P”) and BBB+ by Fitch Ratings Ltd. (“Fitch”)—all of which have a stable outlook due to the gradual economic improvement in Spain.
All three agencies had downgraded Santander Spain’s rating in February 2012 together with that of the other main Spanish banks, due to the weaker-than-previously-anticipated macroeconomic and financial environment in Spain with dimming growth prospects in the near term, depressed real estate market activity and heightened turbulence in the capital markets. In addition, S&P downgraded Santander Spain’s rating by two notches in April 2012 together with that of 15 other Spanish banks following that rating agency’s decision to downgrade Spain’s sovereign debt rating by two notches. Moody’s Investors Service España, S.A. further downgraded Santander Spain’s rating in May 2012, together with downgrades of 15 other Spanish banks and Santander UK plc, a United Kingdom-domiciled subsidiary of Santander Spain. In June 2012, Fitch cut the rating of Spanish sovereign debt three notches to BBB- with a negative outlook, and Moody’s followed shortly thereafter by downgrading Spanish sovereign debt three notches to Baa3, its lowest investment grade rating. Following its downgrade of Spanish sovereign debt, Fitch further downgraded Santander Spain’s rating on June 11, 2012 from A to BBB+, with a negative outlook. Moody’s downgraded Santander Spain’s rating on June 25, 2012 from A3 to Baa2, with a negative outlook. On October 15, 2012, S&P further downgraded Santander Spain’s rating from A- to BBB, with a negative outlook, following S&P’s additional downgrade of the Spanish sovereign debt rating.
Recently the ratings agencies have acknowledged the gradual improvement in Spain’s economic conditions which have in turn improved the outlook for Santander Spain’s long-term debt. Accordingly, the ratings agencies have each changed their outlook on Santander Spain’s long-term debt to stable, from negative. Moreover, Fitch and S&P affirmed their BBB+ and BBB ratings on November 8, 2013 and December 20, 2013, respectively. In addition, on March 12, 2014, Moody’s raised its rating to Baa1, from Baa2. However, we can provide no assurances that ratings agencies will not change their view based on changes in economic conditions or otherwise.
Following these downgrades, Moody’s placed our short- and long-term ratings on outlook negative. Fitch placed our long-term ratings on outlook negative. S&P downgraded our long-term foreign issuer credit rating by one notch to A in February 2012, and in June 2012, placed our long-term ratings on outlook negative. By March 2014, all three rating agencies that rate us have placed our ratings on outlook stable.
While certain potential impacts of these downgrades are contractual and quantifiable, the full consequences of a credit rating downgrade are inherently uncertain, as they depend upon numerous dynamic, complex and inter-related factors and assumptions, including market conditions at the time of any downgrade, whether any downgrade of a firm’s long-term credit rating precipitates downgrades to its short-term credit rating, and assumptions about the potential behaviors of various customers, investors and counterparties. Actual outflows could be higher or lower than this hypothetical example, depending upon certain factors including which credit rating agency downgrades our credit rating, any management or restructuring actions that could be taken to reduce cash outflows and the potential liquidity impact from loss of unsecured funding (such as from money market funds) or loss of secured funding capacity. Although, unsecured and secured funding stresses are included in our stress testing scenarios and a portion of our total liquid assets is held against these risks, it is still the case that a credit rating downgrade could have a material adverse effect on us.
In addition, if we were required to cancel our derivatives contracts with certain counterparties and were unable to replace such contracts, our market risk profile could be altered.
In light of the difficulties in the financial services industry and the financial markets, there can be no assurance that the rating agencies will maintain the current ratings or outlooks. Failure to maintain favorable ratings and outlooks would likely increase the cost of funding to us and adversely affect interest margins, which could have a material adverse effect on us.
Increased competition and industry consolidation may adversely affect our results of operations.
The Chilean market for financial services is highly competitive. We compete with other private sector Chilean and non-Chilean banks, with Banco del Estado de Chile, the principal government-owned sector bank, with department stores and with larger supermarket chains that make consumer loans and sell other financial products to a large portion of the Chilean population. The lower to middle-income segments of the Chilean population and the small- and mid- sized corporate segments have become the target markets of several banks and competition in these segments may increase. We also face competition from non-bank (such as department stores, insurance companies,cajas de compensaciónand cooperativas) and non-finance competitors (principally department stores and larger supermarket chains) with respect to some of our credit products, such as credit cards, consumer loans and insurance brokerage. In addition, we face competition from non-bank finance competitors, such as leasing, factoring and automobile finance companies, with respect to credit products, and from mutual funds, pension funds and insurance companies with respect to savings products.Increasing competition could require that we increase our rates offered on deposits or lower the rates we charge on
loans, which could also have a material adverse effect on us, including our profitability. It may also negatively affect our business results and prospects by, among other things, limiting our ability to increase our customer base and expand our operations and increasing competition for investment opportunities.
Non-traditional providers of banking services, such as Internet based e-commerce providers, mobile telephone companies and internet search engines may offer and/or increase their offerings of financial products and services directly to customers. These non-traditional providers of banking services currently have an advantage over traditional providers because they are not subject to banking regulation. Several of these competitors may have long operating histories, large customer bases, strong brand recognition and significant financial, marketing and other resources. They may adopt more aggressive pricing and rates and devote more resources to technology, infrastructure and marketing. New competitors may enter the market or existing competitors may adjust their services with unique product or service offerings or approaches to providing banking services. If we are unable to successfully compete with current and new competitors, or if we are unable to anticipate and adapt our offerings to changing banking industry trends, including technological changes, our business may be adversely affected. In addition, our failure to effectively anticipate or adapt to emerging technologies or changes in customer behavior,
including among younger customers, could delay or prevent our access to new digital-based markets which would in turn have an adverse effect on our competitive position and business.
The increase in competition within the Chilean banking industry in recent years has led to consolidation in the industry. We expect the trends of increased competition and consolidation to continue and to result in the formation of large new financial groupswith which we must now compete. There can be no assurance that this increased competition will not adversely affect our growth prospects, and therefore our operations.
In addition, if our customer service levels were perceived by the market to be materially below those of our competitor financial institutions, we could lose existing and potential business. If we are not successful in retaining and strengthening customer relationships, we may lose market share, incur losses on some or all of our activities or fail to attract new deposits or retain existing deposits, which could have a material adverse effect on our operating results, financial condition and prospects.
Our ability to maintain our competitive position depends, in part, on the success of new products and services we offer our clients and our ability to continue offering products and services from third parties, and we may not be able to manage various risks we face as we expand our range of products and services that could have a material adverse effect on us.
The success of our operations and our profitability depends, in part, on the success of new products and services we offer our clients and our ability to continue offering products and services from third parties. However, we cannot guarantee that our new products and services will be responsive to client demands or successful once they are offered to our clients, or that they will be successful in the future. In addition, our clients’ needs or desires may change over time, and such changes may render our products and services obsolete, outdated or unattractive and we may not be able to develop new products that meet our clients’ changing needs. Our success is also dependent on our ability to anticipate and leverage new and existing technologies that may have an impact on products and services in the banking industry. Technological changes may further intensify and complicate the competitive landscape and influence client behavior. If our products and services employ technology that is not as attractive to our clients as that employed by our competitors, if we fail to employ technologies desired by our clients before our competitors do so, or if we fail to execute effectively on targeted strategic technology initiatives, our business and results could be adversely affected. In addition, if we cannot respond in a timely fashion to the changing needs of our clients, we may lose clients, which could in turn materially and adversely affect us.
As we expand the range of our products and services, some of which may be at an early stage of development in the markets of certain regions where we operate, we will be exposed to new and potentially increasingly complex risks and development expenses in those markets, with respect to which our experience and the experience of our partners may not be helpful.sufficient. Our employees and our risk management systems may not be adequate to handle or manage such risks. In addition, the cost of developing products that are not launched is likely to affect our results of operations. Any or all of these factors, individually or collectively, could have a material adverse effect on us.
Our strong position in the credit card market is in part due to our credit card co-branding agreement with Chile’s largest airline. This agreement expires in August 20152020 and no assurance can be given that it will be renewed, which may materially and adversely affect our results of operations and financial condition in the credit card business.
Further, our customers may issue complaints and seek redress if they consider that they have suffered loss from our products and services, for example, as a result of any alleged mis-selling or incorrect application of the terms and conditions of a particular product. This could in turn subject us to risks of potential legal action by our customers and intervention by our regulators. For further detail on our legal and regulatory risk exposures, please see the risk factor entitled “We are exposed to risk of loss from legal and regulatory proceedings.”
The financial problems faced by our customers could adversely affect us.
Market turmoil and economic recession could materially and adversely affect the liquidity, credit ratings, businesses and/or financial conditions of our borrowers, which could in turn increase our own non-performing loan ratios, impair our loan and other financial assets and result in decreased demand for borrowings in general. In addition, our customers may further significantly decrease their risk tolerance to non-deposit investments such as stocks, bonds and mutual funds, which would adversely affect our fee and commission income. We may also be adversely affected by the negative effects of the heightened regulatory environment on our customers due to the high
costs associated with regulatory compliance and proceedings. Any of the conditions described above could have a material adverse effect on our business, financial condition and results of operations.
We may generate lower revenues from fee and commission based businesses.
The fees and commissions that we earn from the different banking and other financial services that we provide represent a significant source of our revenues. Market downturns have led, and are likely to continue to lead, to a decline in the volume of transactions that we execute for ourOur customers and, therefore, to a decline in our non-interest revenues. In addition, because the fees that we charge for managing our clients’ portfolios are in many cases based on
the value or performance of those portfolios, a market downturn that reduces the value of our clients’ portfolios or increases the amount of withdrawals would reduce the revenues we receive from our asset management, private banking and custody businesses and adversely affect our results of operations. Moreover, our customers may further significantly decrease their risk tolerance to non-deposit investments such as stocks, bonds and mutual funds for a number of reasons, including a market downturn, which would adversely affect us, including our fee and commission income.
EvenBanco Santander Chile sold its asset management business in 2013 and signed a management service agreement for a 10 year-period with the acquirer of this business in which we sell asset management funds on their behalf. Therefore, even in the absence of a market downturn, below-market performance by the mutual funds of the firm we broker for may result in increased withdrawals and reduced inflows, which would reduce thea reduction in revenue we receive from theselling asset management business we brokerfunds and adversely affect our results of operations.
Market conditions have resulted, and could result, in material changes to the estimated fair values of our financial assets. Negative fair value adjustments could have a material adverse effect on our operating results, financial condition and prospects.
In the recent past, six years, financial markets have been subject to significant stress resulting in steep falls in perceived or actual financial asset values, particularly due to volatility in global financial markets and the resulting widening of credit spreads. We have material exposures to securities and other investments that are recorded at fair value and are therefore exposed to potential negative fair value adjustments. Asset valuations in future periods, reflecting then-prevailing market conditions, may result in negative changes in the fair values of our financial assets and these may also translate into increased impairments. In addition, the value ultimately realized by us on disposal may be lower than the current fair value. Any of these factors could require us to record negative fair value adjustments, which may have a material adverse effect on our operating results, financial condition or prospects.
In addition, to the extent that fair values are determined using financial valuation models, such values may be inaccurate or subject to change, as the data used by such models may not be available or may become unavailable due to changes in market conditions, particularly for illiquid assets, and particularly in times of economic instability. In such circumstances, our valuation methodologies require us to make assumptions, judgments and estimates in order to establish fair value, and reliable assumptions are difficult to make and are inherently uncertain and valuation models are complex, making them inherently imperfect predictors of actual results. Any consequential impairments or write-downs could have a material adverse effect on our operating results, financial condition and prospects.
If we are unable to effectively control the level of non-performing or poor credit quality loans in the future, or if our loan loss reserves are insufficient to cover future loan losses, this could have a material adverse effect on us.
Risks arising from changes in credit quality and the recoverability of loans and amounts due from counterparties are inherent in a wide range of our businesses. Non-performing or low credit quality loans have in the past and can continue to negatively impact our results of operations. We cannot assure you that we will be able to effectively control the level of the impaired loans in our total loan portfolio. In particular, the amount of our reported non-performing loans may increase in the future as a result of growth in our total loan portfolio, including as a result of loan portfolios that we may acquire in the future, or factors beyond our control, such as adverse changes in the credit quality of our borrowers and counterparties or a general deterioration in economic conditions in Chile or global economic conditions, impact of political events, events affecting certain industries or events affecting financial markets and global economies.
As of December 31, 2013,2015, our non-performing loans were Ch$613,301643,468 million, and the ratio of our non-performing loans to total loans was 2.91%2.5%. As of December 31, 2013,2015, our allowance for loan losses was Ch$614,933762,301 million, and the ratio of our allowance for loan losses to total loans was 2.92%3.0%. For additional information on our asset quality, see “Item 5. Operating and Financial Review and Prospects— F.C. Selected Statistical Information–Classification of Loan Portfolio Based on the Borrower’s Payment Performance.”
Our current allowance for loan losses may not be adequate to cover an increase in the amount of non-performing loans or any future deterioration in the overall credit quality of our total loan portfolio. Our allowance for loan losses is based on our current assessment of and expectations concerning various factors affecting us, including the quality of our loan portfolio. These factors include, among other things, our borrowers’ financial condition, repayment abilities and repayment intentions, the realizable value of any collateral, the prospects for support from any guarantor, Chile’s economy, government macroeconomic policies, interest rates and the legal and regulatory environment. As the recent global financial crisis has demonstrated, many of these factors are beyond our control. In addition, as these factors
evolve, the models we use to determine the appropriate level of allowance for loan losses and other assets require recalibration, which can lead to increased provision expense. See “Item 5. Operating and Financial Review and Prospects—C.A. Operating Results–Results of Operations for the Years ended December 31, 2013, 20122015, 2014 and 2011—2013—Provision for loan losses, net of recoveries.”
As a result, there is no precise method for predicting loan and credit losses, and we cannot assure you that our allowance for loan losses will be sufficient in the future to cover actual loan and credit losses. If our assessment of and expectations concerning the above-mentioned factors differ from actual developments, if the quality of our total loan portfolio deteriorates, for any reason, including the increase in lending to individuals and SMEs,small and medium enterprises, the volume increase in the consumer loan portfolio and the introduction of new products, or if the future actual losses exceed our estimates of incurred losses, we may be required to increase our provisions and allowance for loan losses, which may adversely affect us. If we are unable to control or reduce the level of our non-performing or poor credit quality loans, this could have a material adverse effect on us.
The value of the collateral securing our loans may not be sufficient, and we may be unable to realize the full value of the collateral securing our loan portfolio.
The value of the collateral securing our loan portfolio may significantly fluctuate or decline due to factors beyond our control, including macroeconomic factors affecting Chile’s economy. The value of the collateral securing our loan portfolio may be adversely affected by force majeure events, such as natural disasters, particularly in locations where a significant portion of our loan portfolio is composed of real estate loans. Natural disasters such as earthquakes and floods may cause widespread damage, which could impair the asset quality of our loan portfolio and could have an adverse impact on Chile’s economy. The real estate market is particularly vulnerable in the current economic climate and this may affect us, as real estate represents a significant portion of the collateral securing our residential mortgage loan portfolio. We may also not have sufficiently recent information on the value of collateral, which may result in an inaccurate assessment for impairment losses of our loans secured by such collateral. If this were to occur, we may need to make additional provisions to cover actual impairment losses of our loans, which may materially and adversely affect our results of operations and financial condition.
Additionally, there are certain provisions under Chilean law that may affect our ability to foreclose or liquidate residential mortgages if the real estate in question has been declared as “family property” by a court. Family Property refers to a legal term in which a Family Court may declare a residential property as family property in a divorce or separation case. If this occurs, in the deed of the residence, a clause is included identifying the residence as family property and any process of change in ownership or foreclosure must have the consent of both the husband and the wife. This may limit our ability to foreclose on property with this legal status.
The growth of our loan portfolio may expose us to increased loan losses. Our exposure to individuals and small and mid-sized businesses could lead to higher levels of past due loans, allowances for loan losses and charge-offs.
The further expansion of our loan portfolio (particularly in the consumer, small- and mid-sized companies and real estate segments) can be expected to expose us to a higher level of loan losses and require us to establish higher levels of provisions for loan losses. See “Note 9—8—Interbank Loans” and “Note 10—9—Loans and Accounts Receivables from Customers” in our Audited Consolidated Financial Statements for a description and presentation of our loan portfolio as well as “Item 5-Selected Statistical Information—Loan Portfolio.”
A substantial number of ourRetail customers consist of individuals (approximately 49.5%represent 66.36% of the value of the total loan portfolio as of December 31, 2013, if interbank loans are included) and, to a lesser extent, small- and mid-sized companies (those with annual revenues of less than U.S.$2.3 million), which comprised approximately 15.3% of the value of the total loan portfolio as of December 31, 2013.2015. As part of our business strategy, we seek to increase lending and other services to small companies and individuals. Small companies and lower- to middle-income individualsretail clients, which are however, more likely to be adversely affected by downturns in the Chilean economy than large corporations and higher-income individuals.economy. In addition, as of December 31, 2013,2015, our residential mortgage loan portfolio totaled Ch$5,625,8127,812,850 million, representing 26.7%30.9% of our total loans. See “Note 10—9—Loans and Accounts Receivables from Customers” in our Audited Consolidated Financial Statements for a description and presentation of our residential mortgage loan portfolio. If the economy and real estate market in Chile experience a significant downturn, this could materially adversely affect the liquidity, businesses and financial conditions of our customers, which may in turn cause us to experience higher levels of past-due loans, thereby resulting in higher provisions for loan losses and subsequent charge-offs. This may materially and adversely affect our asset quality, results of operations and financial condition.
Our loan portfolio may not continue to grow at the same rate and economic turmoil may lead to a contraction in our loan portfolio.
There can be no assurance that our loan portfolio will continue to grow at similar rates to the historical growth rate described above. A reversal of the rate of growth of the Chilean economy, a slowdown in the growth of customer demand, an increase in market competition or changes in governmental regulations could adversely affect the rate of growth of our loan portfolio and our risk index and, accordingly, increase our required allowances for loan losses. An economic turmoil could materially adversely affect the liquidity, businesses and financial condition of our customers as well as lead to a general decline in consumer spending and a rise in unemployment. All this could in turn lead to decreased demand for borrowings in general.
Our financial results are constantly exposed to market risk. We are subject to fluctuations in interest rates and other market risks, which may materially and adversely affect us.
Market risk refers to the probability of variations in our net interest income or in the market value of our assets and liabilities due to volatility of interest rate, inflation, exchange rate or equity price. Changes in interest rates affect the following areas, among others, of our business:
| · | net interest income; |
| · | the volume of loans originated; |
| · | volatility of credit spreads; |
| · | the market value of our securities holdings; |
| · | gains from sales of loans and |
| · | gains and losses from derivatives. |
Variations in short-term interest rates could affect our net interest income, which comprises the majority of our revenue. Interest rate variations could adversely affect us, including our net interest income, reducing our growth rate or even resulting in losses. When interest rates rise, we may be required to pay higher interest on our floating-rate borrowings while interest earned on our predominately fixed-rate assets doesmay not rise as quickly, which could cause profits to grow at a reduced rate or decline in some parts of our portfolio. Interest rates are highly sensitive to many factors beyond our control, including increased regulation of the financial sector, the reserve policies of the Central Bank, deregulation of the financial sector in Chile, monetary policies, domestic and international economic and political conditions and other factors.
Increases in interest rates may reduce the volume of loans we originate. Sustained high interest rates have historically discouraged customers from borrowing and have resulted in increased delinquencies in outstanding loans and deterioration in the quality of assets. Increases in interest rates may also reduce the propensity of our customers to prepay or refinance fixed-rate loans. Increases in interest rates may reduce the value of our financial assets and may reduce gains or require us to record losses on sales of our loans or securities.
If interest rates decrease, although this is likely to decrease our funding costs, it is likely to adversely impact the income we receive arising from our investments in securities as well as loans with similar maturities. In addition, we may also experience increased delinquencies in a low interest rate environment when such an environment is accompanied by high unemployment and recessionary conditions.
The market value of a security with a fixed interest rate generally decreases when the prevailing interest rates rise, which may have an adverse effect on our earnings and financial condition. In addition, we may incur costs (which, in turn, will impact our results) as we implement strategies to reduce future interest rate exposure. The market value of an obligation with a floating interest rate can be adversely affected when interest rates increase, due to a lag in the implementation of repricing terms or an inability to refinance at lower rates.
We are also exposed to foreign exchange rate risk as a result of mismatches between assets and liabilities denominated in different currencies. Fluctuations in the exchange rate between currencies may negatively affect our earnings and value of our assets and securities.Therefore, while the Bank seeks not to maintain aavoid significant mismatch inmismatches between assets and liabilities due to foreign currency exposure, from time to time, we may have a mismatch.mismatches. “See Item 11. Quantitative and Qualitative Disclosure About Market Risks— E. Market Risks—Foreign exchange fluctuations.”
We are also exposed to equity price risk in connection with our trading investments in equity securities.securities in the banking book and in the trading portfolio. The performance of financial markets may cause changes in the value of our investment and trading portfolios. The volatility of world equity markets due to the continued economic uncertainty and sovereign debt crisis has had a particularly strong impact on the financial sector. Continued volatility may affect the value of our investments in entities in this sectorequity securities and, depending on their fair value and future recovery expectations, could become a permanent impairment which would be subject to write-offs against our results. To the extent any of these risks materialize, our net interest income or the market value of our assets and liabilities could be materially adversely affected.
Failure to successfully implement and continue to improve our risk management policies, procedures and methods, including our credit risk management system, could materially and adversely affect us, and we may be exposed to unidentified or unanticipated risks.
The management of risk is an integral part of our activities. We seek to monitor and manage our risk exposure through a variety of separate but complementary financial, credit, market, operational, compliance and legal reporting systems. While we employ a broad and diversified set of risk monitoring and risk mitigation techniques, such techniques and strategies may not be fully effective in mitigating our risk exposure in all economic market environments or against all types of risk, including risks that we fail to identify or anticipate.
Some of our qualitative tools and metrics for managing risk are based upon our use of observed historical market behavior. We apply statistical and other tools to these observations to arrive at quantifications of our risk exposures. These qualitative tools and metrics may fail to predict future risk exposures. These risk exposures could, for example, arise from factors we did not anticipate or correctly evaluate in our statistical models. This would limit our ability to manage our risks. Our losses thus could be significantly greater than the historical measures indicate. In addition, our quantified modeling does not take all risks into account. Our more qualitative approach to managing those risks could prove insufficient, exposing us to material unanticipated losses. IfWe could face adverse consequences as a result of decisions, which may lead to actions by management, based on models that are poorly developed, implemented or used, or as a result of the modelled outcome being misunderstood or the use of such information for purposes for which it was not designed. In addition, if existing or potential customers or counterparties believe our risk management is inadequate, they could take their business elsewhere.elsewhere or seek to limit their transactions with us. This could harm our reputation as well as our revenuesoperating results, financial condition and profits.prospects.
As a commercial bank, one of the main types of risks inherent in our business is credit risk. For example, an important feature of our credit risk management system is to employ an internal credit rating system to assess the particular risk profile of a customer. As this process involves detailed analyses of the customer, taking into account both quantitative and qualitative factors, it is subject to human error.or IT systems errors. In exercising their judgment on current or future credit risk behavior of our customers, our employees may not always be able to assign an accurate credit rating, to a customer or credit risk, which may result in our exposure to higher credit risks than indicated by our risk rating system.
In addition, we continue to refine our credit policies and guidelines to address potential risks associated with particular industries or types of customers. However, we may not be able to timely detect theseall possible risks before they occur, or due to limited tools available to us, our employees may not be able to effectively implement them, which may increase our credit risk. Failure to effectively implement, consistently follow or continuously refine our credit risk management system may result in an increase in the level of non-performing loans and a higher risk exposure for us, which could have a material adverse effect on us.
The effectiveness of our credit risk management is affected by the quality and scope of information available in Chile.
In assessing customers’ creditworthiness, we rely largely on the credit information available from our own internal databases, the SBIF, Dicom en Capital, a Chilean nationwide credit bureau, and other sources. Due to limitations in the availability of information and the developing information infrastructure in Chile, our assessment of credit risk associated with a particular customer may not be based on complete, accurate or reliable information. In addition, although we have been improving our credit scoring systems to better assess borrowers’ credit risk profiles, we cannot assure you that our credit scoring systems will collect complete or accurate information reflecting the actual behavior of customers or that their credit risk can be assessed correctly. Without complete, accurate and reliable information, we will have to rely on other publicly available resources and our internal resources, which may not be effective. As a result, our ability to effectively manage our credit risk and subsequently our loan loss allowances may be materially adversely affected.
Liquidity and funding risks are inherent in our business and could have a material adverse effect on us.
Liquidity risk is the risk that we either do not have available sufficient financial resources to meet our obligations as they fall due or can secure them only at excessive cost. This risk is inherent in any retail and commercial banking business and can be heightened by a number of enterprise-specific factors, including over-reliance on a particular source of funding, changes in credit ratings or market-wide phenomena such as market dislocation. While we implement liquidity management processes to seek to mitigate and control these risks, unforeseen systemic market factors in particular make it difficult to eliminate completely these risks. Adverse and continued constraints in the supply of liquidity, including inter-bank lending, has affected and may materially and adversely affect the cost of funding our business, and extreme liquidity constraints may affect our current operations and our ability to fulfill regulatory liquidity requirements as well as limit growth possibilities.
Continued or worsening disruptionDisruption and volatility in the global financial markets could have a material adverse effect on our ability to access capital and liquidity on financial terms acceptable to us.
Our cost of obtaining funding is directly related to prevailing market interest rates and to our credit spreads. Increases in interest rates and our credit spreads can significantly increase the cost of our funding. Changes in our credit spreads are market-driven, and may be influenced by market perceptions of our creditworthiness. Changes to interest rates and our credit spreads occur continuously and may be unpredictable and highly volatile.
If wholesale markets financing ceases to become available, or becomes excessively expensive, we may be forced to raise the rates we pay on deposits, with a view to attracting more customers, and/or to sell assets, potentially at depressed prices. The persistence or worsening of these adverse market conditions or an increase in base interest rates could have a material adverse effect on our ability to access liquidity and cost of funding (whether directly or indirectly).funding.
We rely, and will continue to rely, primarily on commercial deposits to fund lending activities. The ongoing availability of this type of funding is sensitive to a variety of factors outside our control, such as general economic conditions and the confidence of commercial depositors in the economy, in general, and the financial services industry in particular, and the availability and extent of deposit guarantees, as well as competition between banks for deposits. Any of these factors could significantly increase the amount of commercial deposit withdrawals in a short period of time, thereby reducing our ability to access commercial deposit funding on appropriate terms, or at all, in the future. If these circumstances were to arise, this could have a material adverse effect on our operating results, financial condition and prospects.
We anticipate that our customers will continue, in the near future, to make short-term deposits (particularly demand deposits and short-term time deposits), and we intend to maintain our emphasis on the use of banking deposits as a source of funds. As of December 31, 2013, 99.1%2015, 98.5% of our customer deposits had remaining maturities of one year or less, or were payable on demand. A significant portion of our assets have longer maturities, resulting in a mismatch between the maturities of liabilities and the maturities of assets. Historically, one of our principal sources of funds has been time deposits. Time deposits represented 35.7%35.2% and 36.8%33.6% of our total liabilities and equity as of December 31, 20132015 and 2012,2014, respectively. The Chilean time deposit market is concentrated given the importance in size of various large institutional investors such as pension funds and corporations relative to the total size of the economy. As of December 31, 2013,2015, the Bank’s top 20 time deposits represented 27.4%39.6% of total time deposits, or 9.8% of total liabilities and equity, and totaled U.S.$5,065 million.6.8 billion. No assurance can be given that future economic
stability in the Chilean market will not negatively affect our ability to continue funding our business or to maintain our current levels of funding without incurringincreased funding costs, a reduction in the term of funding instruments or the liquidation of certain assets. If this were to happen, we could be materially adversely affected.
The short-term nature of this funding source could cause liquidity problems for us in the future if deposits are not made in the volumes we expect or are not renewed. If a substantial number of our depositors withdraw their demand deposits or do not roll over their time deposits upon maturity, we may be materially and adversely affected.
We are subject to regulatory capital and liquidity requirements that could limit our operations, and changes to these requirements may further limit and adversely affect our operating results, financial condition and prospects.
Chilean banks are required by the General Banking Law to maintain regulatory capital of at least 8% of risk-weighted assets, net of required loan loss allowance and deductions, and paid-in capital and reserves (“basic capital”) of at least 3% of total assets, net of required loan loss allowances. As we are the result of the merger between two predecessors with a relevant market share in the Chilean market, we are currently required to maintain a minimum regulatory capital to risk-weighted assets ratio of 11%. As of December 31, 2013,2015, the ratio of our regulatory capital to risk-weighted assets, net of loan loss allowance and deductions, was 13.82%13.4%. Certain developments could affect our ability to continue to satisfy the current capital adequacy requirements applicable to us, including:
| · | the increase of risk-weighted assets as a result of the expansion of our business or regulatory changes; |
• the increase of risk-weighted assets as a result of the expansion of our business or regulatory changes;
| · | the failure to increase our capital correspondingly; |
| · | losses resulting from a deterioration in our asset quality; |
| · | declines in the value of our investment instrument portfolio; |
| · | changes in accounting standards; |
| · | changes in provisioning guidelines that are charged directly against our equity or net income; and |
| · | changes in the guidelines regarding the calculation of the capital adequacy ratios of banks in Chile. |
• the failure to increase our capital correspondingly;
• losses resulting from a deterioration in our asset quality;
• declines in the value of our investment instrument portfolio;
• changes in accounting rules;
• changes in provisioning guidelines that are charged directly against our equity or net income; and
• changes in the guidelines regarding the calculation of the capital adequacy ratios of banks in Chile.
Starting in the second half of 2014, Chilean banks will most likely beare gradually being required to gradually adopt the guidelines set forth under the Basel III Capital Accord with adjustments incorporated by the SBIF once these changes are approved by the Chilean Congress.Congress in 2015 or 2016. Following this approval, Chilean banks will most likely have to fully comply with Basel III requirements by 2018 or 2019. This could result in a different level of minimum capital required to be maintained by us. According to initial estimates of the impact of market risk on regulatory capital, published by the SBIF for informational purposes only, our ratio of regulatory capital to risk-weighted assets, net of loan loss allowance and deductions, including an initial estimate of the adjustments for market risk was 12.57%12.0% as of December 31, 2013.2015. No assurance can be given that the adoption of the Basel IIIII capital requirements will not have a material impact on our capitalization ratio.
We may also be required to raise additional capital in the future in order to maintain our capital adequacy ratios above the minimum required levels. Our ability to raise additional capital may be limited by numerous factors, including: our future financial condition, results of operations and cash flows; any necessary government regulatory approvals; our credit ratings; general market conditions for capital raising activities by commercial banks and other financial institutions; and domestic and international economic, political and other conditions. If we require additional capital in the future, we cannot assure you that we will be able to obtain such capital on favorable terms, in a timely manner or at all. Furthermore, the SBIF may increase the minimum capital adequacy requirements applicable to us. Accordingly, although we currently meet the applicable capital adequacy requirements, we may face difficulties in meeting these requirements in the future. If we fail to meet the capital adequacy requirements, we may be required to take corrective actions. These measures could materially and adversely affect our business reputation, financial condition and results of operations. In addition, if we are unable to raise sufficient capital in a timely manner, the growth of our loan portfolio and other risk-weighted assets may be restricted, and we may face significant challenges in implementing our business strategy. As a result, our prospects, results of operations and financial condition could be materially and adversely affected.
The SBIF and the Central Bank published new liquidity standards in 2015 and ratios that must be implemented and calculated by all banks. These will eventually replace the current regulatory limits imposed by the SBIF and the Central Bank described above. These new liquidity standards are in line with those established in Basel III. The most important liquidity ratios that will eventually be adopted by Chilean banks are:
| · | Liability concentration per institutional and wholesale counterparty. Banks will have to calculate the percentage of their liabilities coming from institutional and wholesale counterparties, including ratios regarding renovation, renewals, restructurings, maturity and product concentration of these counterparties. |
| · | Liquidity coverage ratio (LCR), which measures the percentage of liquid Assets over net cash outflows. The new guidelines also define liquid assets and the formulas for calculating net cash outflows. |
| · | Net Stable Funding Ratio (NSFR) which will measure a bank’s available stable funding relative to its required stable funding. Both concepts are also defined in the new regulations. |
Beginning on March 30, 2016, banks must report these ratios to the Central Bank and the SBIF. The evolution of these indicators will be monitored for a 12 month period and adjustments to the required ratios could be made. The final limits and results should begin to be published in the second half of 2016. The initial limits banks must meet in order to comply with these new ratios have not been published yet. For this reason, we cannot yet determine the effect that the implementation of these models will have on our business. Such effect could be material and adverse if it materially increases the liquidity we are required to maintain.
We are subject to regulatory risk, or the risk of not being able to meet all of the applicable regulatory requirements and guidelines.
As a financial institution, we are subject to extensive regulation, inspections, examinations, inquiries, audits and other regulatory requirements by Chilean regulatory authorities, which materially affect our businesses. We cannot assure you that we will be able to meet all of the applicable regulatory requirements and guidelines, or that we will not be subject to sanctions, fines, restrictions on our business or other penalties in the future as a result of noncompliance. If sanctions, fines, restrictions on our business or other penalties are imposed on us for failure to comply with applicable requirements, guidelines or regulations, our business, financial condition, results of operations and our reputation and ability to engage in business may be materially and adversely affected.
Changes in regulations may also cause us to face increased compliance costs and limitations on our ability to pursue certain business opportunities and provide certain products and services. As some of the banking laws and regulations have been recently adopted, the manner in which those laws and related regulations are applied to the operations of financial institutions is still evolving. Moreover, to the extent these recently adopted regulations are implemented inconsistently in the various jurisdictions in which we operate, it may face higher compliance costs. No assurance can be given generally that laws or regulations will be adopted, enforced or interpreted in a manner that will not have a material adverse effect on our business and results of operations.
Modifications to reserve requirements may affect our business.
Deposits are subject to a reserve requirement of 9.0% for demand deposits and 3.6% for time deposits (with terms of less than one year). The Central Bank has statutory authority to require banks to maintain reserves of up to an average of 40.0% for demand deposits and up to 20.0% for time deposits (irrespective, in each case, of the currency in which these deposits are denominated) to implement monetary policy. In addition, to the extent that the aggregate amount of the following types of liabilities exceeds 2.5 times the amount of a bank’s regulatory capital, a bank must maintain a 100% “technical reserve” against them: demand deposits, deposits in checking accounts, obligations payable on sight incurred in the ordinary course of business and, in general, all deposits unconditionally payable immediately. If the Central Bank were to increase reserve requirements, this could lead to lower loan growth and have a negative effect on our business.
Our business could be affected if its capital is not managed effectively or if changes limiting our ability to manage our capital position are adopted.
Effective management of our capital position is important to our ability to operate our business, to continue to grow organically and to pursue our business strategy. However, in response to the global financial crisis, a number of changes to the regulatory capital framework have been adopted or continue to be considered. As these and other changes are implemented or future changes are considered or adopted that limit our ability to manage our balance sheet and capital resources effectively or to access funding on commercially acceptable terms, we may experience a material adverse effect on our financial condition and regulatory capital position.
The legal restrictions on the exposure of Chilean pension funds to different asset classes may affect our access to funding.
Chilean regulations impose a series of restrictions on how Chilean pension fund management companies (Administradora de Fondos de Pensión, or “AFPs”) may allocate their assets. In the particular case of financial issuers’ there are three restrictions, each involving different assets and different limits determined by the amount of assets in each fund and the market and book value of the issuer’s equity. As a consequence, limits vary within funds of AFPs and issuers. As of December 31, 2013, the latest information available,2015, the AFP system had US$3,7323,630 million invested in the Bank withvia equity, deposits and fixed income. According to the latest information published in December 2015, the AFPs still had the possibility of being able to invest another 8.9% of its assets under managementUS$11,066 million in Santander-Chile.the Bank. If the exposure of any AFP to Santander-Chile exceeds the regulatory limits, we would need to seek alternative sources of funding, which could be more expensive and, as a consequence, may have a material adverse effect on our financial condition and results of operations.
Our financial statements are based in part on assumptions and estimates which, if inaccurate, could cause material misstatement of the results of our operations and financial position.
The preparation of financial statements requires management to make judgments, estimates and assumptions that affect the reported amounts of assets, liabilities, income and expenses. Due to the inherent uncertainty in making estimates, actual results reported in future periods may be based upon amounts which differ from those estimates. Estimates, judgments and assumptions are continually evaluated and are based on historical experience and other factors, including expectations of future events that are believed to be reasonable under the circumstances. Revisions to accounting estimates are recognized in the period in which the estimate is revised and in any future periods affected. The accounting policies deemed critical to our results and financial position, based upon materiality and significant judgments and estimates, include impairment of loans and advances, goodwill impairment, valuation of financial instruments, impairment of available-for-sale financial assets, deferred tax assets and provision for liabilities.
The valuation of financial instruments measured at fair value can be subjective, in particular where models are used which include unobservable inputs. Given the uncertainty and subjectivity associated with valuing such instruments it is possible that the results of our operations and financial position could be materially misstated if the estimates and assumptions used prove to be inaccurate.
If the judgment, estimates and assumptions we use in preparing our consolidated financial statements are subsequently found to be incorrect, there could be a material effect on our results of operations and a corresponding effect on our funding requirements and capital ratios.
Changes in accounting standards could impact reported earnings.
The accounting standard setters and other regulatory bodies periodically change the financial accounting and reporting standards that govern the preparation of our consolidated financial statements. These changes can materially impact how we record and report our financial condition and results of operations. In some cases, we could be required to apply a new or revised standard retroactively, resulting in the restatement of prior period financial statements.
The preparation of our tax returns requires the use of estimates and interpretations of complex tax laws and regulations and is subject to review by taxing authorities.
We are subject to the income tax laws of Chile and certain foreign countries. These tax laws are complex and subject to different interpretations by the taxpayer and relevant governmental taxing authorities, which are sometimes subject to prolonged evaluation periods until a final resolution is reached. In establishing a provision for income tax expense and filing returns, we must make judgments and interpretations about the application of these inherently complex tax laws.
If the judgment, estimates and assumptions we use in preparing our tax returns are subsequently found to be incorrect, there could be a material adverse effect on our results of operations..operations.
Disclosure controls and procedures over financial reporting may not prevent or detect all errors or acts of fraud.
Disclosure controls and procedures over financial reporting are designed to provide reasonably assureassurance that information required to be disclosed by the company in reports filed or submitted under the Securities Exchange Act is accumulated and communicated to management, and recorded, processed, summarized and reported within the time periods specified in the SEC’s rules and forms. Any disclosure controls and procedures over financial reporting or internal controls and procedures, no matter how well conceived and operated, can provide only reasonable, not absolute, assurance that the objectives of the control system are met.
These disclosure controls and procedures have inherent limitations, which include the realitiespossibility that judgments in decision-making can be faulty, and that breakdowns can occur because of simple error or mistake. Additionally, controls can be circumvented by the individual acts of some persons, by collusion of two or more people or by any unauthorized override of the controls. Consequently, our businesses are exposed to risk from potential non-compliance with policies, employee misconduct or negligence and fraud, which could result in regulatory sanctions and serious reputational or financial harm. In recent years, a number of multinational financial institutions have suffered material losses due to the actions of ‘rogue traders’ or other employees. It is not always possible to deter employee misconduct and the precautions we take to
prevent and detect this activity may not always be effective. Accordingly, because of the inherent limitations in the control system, misstatements due to error or fraud may occur and not be detected.
We engage in transactions with related parties that others may not consider to bewe believe are on an arm’s-length basis.basis but others may use different criteria for determining that a transaction is at arm’s-length.
We and our affiliates have entered into a number of services agreements pursuant to which we render services, such as administrative, accounting, finance, treasury, legal services and others.
Chilean law applicable to public companies and financial groups and institutions as well asand our bylaws provide for several procedures designed to ensure that the transactions entered into with or among our financial subsidiaries and/or affiliates do not deviate from prevailing market conditions for those types of transactions, including the requirement that our board of directors approve such transactions. Furthermore, all significant related party transactions must be approved by the Audit Committee and the Board. These significant transactions are also reported in our annual shareholders meeting. Please see note 34 of our Audited Consolidated Financial Statements and “Item 7. Major Shareholders and Related Party Transactions.”
We are likely to continue to engage in transactions with our affiliates. Future conflicts of interests between us and any of affiliates, or among our affiliates, may arise, which conflicts are not required to be and may not be resolved in our favor.
Operational risks, including risks relating to data collection, processing and storage systems and security are inherent in our business.
OurLike other financial institutions with a large customer base, we manage and hold confidential personal information of customers in the conduct of our banking operations, as well as a large number of assets. Accordingly, our businesses depend on the ability to process a large number of transactions efficiently and accurately, and on our ability to rely on our digital technologies, computer and email services, software and networks, as well as on the secure processing, storage and transmission of confidential and other information in our
computer systems and networks. The proper functioning of financial control, accounting or other data collection and processing systems is critical to our businesses and to our ability to compete effectively. Losses can result from inadequate personnel, inadequate or failed internal control processes and systems, or from external events that interrupt normal business operations. We also face the risk that the design of our controls and procedures prove to be inadequate or are circumvented. Although we work with our clients, vendors, service providers, counterparties and other third parties to develop secure transmission capabilities and prevent against information security risk and cyber-attacks, we routinely exchange personal, confidential and proprietary information by electronic means, and we may be the target of attempted cyber-attacks. If we cannot maintain an effective data collection, management and processing system, we may be materially and adversely affected.
We take protective measures and continuously monitor and develop our systems to protect our technology infrastructure and data from misappropriation or corruption, but our systems, software and networks nevertheless may be vulnerable to unauthorized access, misuse, computer viruses or other malicious code and other events that could have a security impact. An interception, misuse or mishandling of personal, confidential or proprietary information sent to or received from a client, vendor, service provider, counterparty or third party could result in legal liability, regulatory action and reputational harm. There can be no assurance that we will not suffer material losses from operational risk in the future, including those relating to cyber-attacks or other such security breaches. Further, as cyber-attacks continue to evolve, we may incur significant costs in its attempt to modify or enhance our protective measures or investigate or remediate any vulnerability. Any material disruption or slowdown of our systems could cause information, including data related to customer requests, to be lost or to be delivered to our clients with delays or errors, which could reduce demand for our services and products and could materially and adversely affect us.
We have seen in recent years computer systems of companies and organizations being targeted, not only by cyber criminals, but also by activists and rogue states. We have been and continue to be subject to a range of cyber-attacks, such as denial of service, malware and phishing. Cyber-attacks could give rise to the loss of significant amounts of customer data and other sensitive information, as well as significant levels of liquid assets (including cash). In addition, cyber-attacks could give rise to the disablement of our information technology systems used to service our customers. As attempted attacks continue to evolve in scope and sophistication, we may incur significant costs in our attempt to modify or enhance our protective measures against such attacks, or to investigate or remediate any vulnerability or resulting breach, or in communicating cyber-attacks to our customers. If we fail to effectively manage our cyber security risk, e.g. by failing to update our systems and processes in response to new threats, this could harm our reputation and adversely affect our operating results, financial condition and prospects through the payment of customer compensation, regulatory penalties and fines and/or through the loss of assets. In addition, we may also be subject to cyber-attacks against the critical infrastructure of Chile. Our information technology systems are dependent on such national critical infrastructure and any cyber-attack against such critical infrastructure could negatively affect our ability to service our customers. As we do not operate such national critical infrastructure, we have limited ability to protect our information technology systems from the adverse effects of such a cyber-attack.
We manage and hold confidential personal information of customers in the conduct of our banking operations. Although we have procedures and controls to safeguard personal information in our possession, unauthorized disclosures could subject us to legal actions and administrative sanctions as well as damages that could materially and adversely affect our results of operations, financial condition and financial condition.prospects.
In addition, our businesses are exposed to risk from potential non-compliance with policies, employee misconduct or negligence and fraud, which could result in regulatory sanctions and serious reputational or financial harm. In recent years, a number of multinational financial institutions have suffered material losses due to the actions of ‘rogue traders’ or other employees. It is not always possible to deter or prevent employee misconduct, and the precautions we take to prevent and detect this activity may not always be effective.
In addition, we may be required to report events related to information security issues (including any cyber security issues), events where customer information may be compromised, unauthorized access and other security breaches, to the regulatory authorities.
Any failure to effectively improve or upgrade our information technology infrastructure and management information systems in a timely manner could have a material adverse effect on us.
Our ability to remain competitive depends in part on our ability to upgrade our information technology on a timely and cost-effective basis. We must continually make significant investments and improvements in our information technology infrastructure in order to remain competitive. We cannot assure you that in the future we will be able to maintain the level of capital expenditures necessary to support the improvement or upgrading of our information technology infrastructure. Any failure to effectively improve or upgrade our information technology infrastructure and management information systems in a timely manner could have a material adverse effect on us.
We rely on third parties for important products and services.
Third party vendors provide key components of our business infrastructure such as loan and deposit servicing systems, internet connections and network access. Third parties can be sources of operational risk to us, including with respect to security breaches affecting such parties. We are also subject to risk with respect to security breaches affecting the vendors and other parties that interact with our third party vendors. As our interconnectivity with these third parties increases, we increasingly face the risk of operational failure with respect to their systems. We may be required to take steps to protect the integrity of our operational systems, thereby increasing our operational costs and potentially decreasing customer satisfaction. Any problems caused by these third parties, including as a result of their not providing us their services for any reason, or their performing their services poorly or employee misconduct, could adversely affect our ability to deliver products and services to customers and otherwise to conduct business. Replacing these third party vendors could also entail significant delays and expense.
Damage to our reputation could cause harm to our business prospects.
Maintaining a positive reputation is critical to our attracting and maintaining customers, investors and employees. Damage to our reputation can therefore cause significant harm to our business and prospects. Harm to our reputation can arise from numerous sources, including, among others, employee misconduct, litigation or regulatory outcomes, failure to deliver minimum standards of service and quality, compliance failures, unethical behavior, and the activities of customers and counterparties. Further, negative publicity regarding us, whether or not true, may result in harm to our prospects.
Actions by the financial services industry generally or by certain members of, or individuals in, the industry can also affect our reputation. For example, the role played by financial services firms in the financial crisis and the seeming shift toward increasing regulatory supervision and enforcement has caused public perception of us and others in the financial services industry to decline.
We could suffer significant reputational harm if we fail to properly identify and manage potential conflicts of interest. Management of potential conflicts of interest has become increasingly complex as we expand our business activities through more numerous transactions, obligations and interests with and among our clients. The failure to adequately address or the perceived failure to adequately address, conflicts of interest could affect the willingness of clients to deal with us, or give rise to litigation or enforcement actions against us. Therefore, there can be no assurance that conflicts of interest will not arise in the future that could cause material harm to us.
We rely on recruiting, retaining and developing appropriate senior management and skilled personnel.
Our continued success depends in part on the continued service of key members of our management team. The ability to continue to attract, train, motivate and retain highly qualified professionals is a key element of our strategy. The successful implementation of our growth strategy depends on the availability of skilled management, both at our head office and at each of our business units. If we or one of our business units or other functions fails to staff its operations appropriately or loses one or more of its key senior executives and fails to replace them in a satisfactory and timely manner, our business, financial condition and results of operations, including control and operational risks, may be adversely affected.
In addition, the financial industry has and may continue to experience more stringent regulation of employee compensation, which could have an adverse effect on our ability to hire or retain the most qualified employees. If we fail or are unable to attract and appropriately train, motivate and retain qualified professionals, our business may also be adversely affected.
We may not be able to detect or prevent money laundering and other illegal or improperfinancial crime activities fully or on a timely basis, which could expose us to additional liability and could have a material adverse effect on us.
We are required to comply with applicable anti-money laundering (“AML”), anti-terrorism, sanctions and other laws and regulations in the jurisdictions in which we operate. These laws and regulations require us, among other things, to adoptconduct full customer due diligence regarding sanctions and enforce “know-your-customer”politically-exposed person screening, keep our customer, account and transaction information up to date and have implemented effective financial crime policies and procedures detailing what is required from those responsible. Our requirements also include AML training for our employees, reporting suspicious transactions and activity to report suspiciousappropriate law enforcement following full investigation by our AML team.
Financial crime has become the subject of enhanced regulatory scrutiny and large transactions to the applicable regulatory authorities. Thesesupervision by regulators globally. AML sanctions, laws and regulations have becomeare increasingly complex and detailed require improved systems and sophisticated monitoring and compliance personnel and have become the subject of enhanced government supervision.regulatory supervision, requiring improved systems, sophisticated monitoring and skilled compliance personnel.
While weWe have adopteddeveloped policies and procedures aimed at detecting and preventing the use of our banking network for money laundering and other financial crime related activities, such policiesactivities. These require implementation and procedures haveembedding within our business effective controls and monitoring, which in some cases only been recently adoptedturn requires on-going changes to systems and may not completely eliminateoperational activities. Financial crime is continually evolving and subject to increasingly stringent regulatory oversight and focus. This requires proactive and adaptable responses from us so that we are able to effectively deter threats and criminality. Even known threats can never be fully eliminated, and there will be instances where we may be used by other parties to engage in money laundering and other illegal or improper activities. ToIn addition, we rely heavily on our employees to assist us by spotting such activities and reporting them, and our employees have varying degrees of experience in recognizing criminal tactics and understanding the extentlevel of sophistication of criminal organizations. Where we failoutsource any of our customer due diligence, customer screening or anti financial crime operations, we remain responsible and accountable for full compliance and any breaches. If we are unable to apply the necessary scrutiny and oversight, there remains a risk of regulatory breach.
If we are unable to fully comply with applicable laws, regulations and regulations, theexpectations, our regulators and relevant governmentlaw enforcement agencies to which we report have the powerability and authority to impose significant fines and other penalties on us, including requiring a complete review of our business systems, day-to-day supervision by external consultants and ultimately the revocation of licenses. In addition,our banking license.
The reputational damage to our business and global brand would be severe if we were found to have breached AML or sanctions requirements. Our reputation could also suffer if we are unable to protect our customers useor our banking networkbusiness from being used by criminals for money laundering or illegal or improper purposes.
In addition, while we review our relevant counterparties’ internal policies and procedures with respect to such matters, we, to a large degree, rely upon our relevant counterparties to maintain and properly apply their own appropriate anti-money laundering procedures. Such measures, procedures and compliance may not be completely effective in preventing third parties from using our (and our relevant counterparties’) services as a conduit for money laundering (including illegal cash operations) without our (and our relevant counterparties’) knowledge. If we are associated with, or even accused of being associated with, or become a party to, money laundering, then our reputation could suffer and/or we could become subject to fines, sanctions and/or legal enforcement (including being added to any “black lists” that would prohibit certain parties from engaging in transactions with us), any one of which could have a material adverse effect on our operating results, financial condition and prospects.
Any such risks could have a material adverse effect on our operating results, financial condition and prospects.
We are exposed to risk of loss from legal and regulatory proceedings.
We face risk of loss from legal and regulatory proceedings, including tax proceedings, that could subject us to monetary judgments, regulatory enforcement actions, fines and penalties. The current regulatory environment in the jurisdictions in which we operate which reflects an increased supervisory focus on enforcement, combined with uncertainty about the evolution of the regulatory regime, and may lead to material operational and compliance costs.
We are from time to time subject to certain claims and partiesparty to certain legal proceedings incidental to the normal course of our business, including in connection with conflicts of interest, lending activities, relationships
with our employees and other commercial or tax matters. In view of the inherent difficulty of predicting the outcome of legal matters, particularly where the claimants seek very large or indeterminate damages, or where the cases present novel legal theories, involve a large number of parties or are in the early stages of discovery, we cannot state with confidence what the eventual outcome of these pending matters will be or what the eventual loss, fines or penalties related to each pending matter may be. We believe that we have made adequate reserves related to the costs anticipated to be incurred in connection with these various claims and legal proceedings. See note 20 of our Audited Consolidated Financial Statements. However, the amount of these provisions is substantially less than the total amount of the claims asserted against us and in light of the uncertainties involved in such claims and proceedings, there is no assurance that the ultimate resolution of these matters will not significantly exceed the reserves currently accrued by us. As a result, the outcome of a particular matter may be material to our operating results for a particular period, depending upon, among other factors, the size of the loss or liability imposed and our level of income for that period.
We are subject to market, operational and other related risks associated with our derivative transactions that could have a material adverse effect on us.
We enter into derivative transactions for trading purposes as well as for hedging purposes. We are subject to market, credit and operational risks associated with these transactions, including basis risk (the risk of loss associated with variations in the spread between the asset yield and the funding and/or hedge cost) and credit or default risk (the risk of insolvency or other inability of the counterparty to a particular transaction to perform its obligations thereunder, including providing sufficient collateral).
Market practices and documentation for derivative transactions in Chile may differ from those in other countries. For example, documentation may not incorporate terms and conditions of derivatives transactions as commonly understood in other countries. In addition, the execution and performance of these transactions dependsdepend on our ability to maintain adequate control and administration systems and to hire and retain qualified personnel. Moreover, our ability to adequately monitor, analyze and report derivative transactions continues to depend, to a great extent, on our information technology systems. This factor further increases the risks associated with these transactions and could have a material adverse effect on us.
We are subject to counterparty risk in our banking business.
We are exposed to counterparty risk in addition to credit risks associated with lending activities. Counterparty risk may arise from, for example, investing in securities of third parties, entering into derivative contracts under which counterparties have obligations to make payments to us or executing securities, futures, currency or commodity trades from proprietary trading activities that fail to settle at the required time due to non-delivery by the counterparty or systems failure by clearing agents, clearing houses or other financial intermediaries.
We routinely transact with counterparties in the financial services industry, including brokers and dealers, commercial banks, investment banks, mutual funds, hedge funds and other institutional clients. Defaults by, and even rumors or questions about the solvency of, certain financial institutions and the financial services industry generally have led to market-wide liquidity problems and could lead to losses or defaults by other institutions. Many of the routine transactions we enter into expose us to significant credit risk in the event of default by one of our significant counterparties.
Our loan and investment portfolios are subject to risk of prepayment, which could have a material adverse effect on us.
Our fixed rate loan and investment portfolios are subject to prepayment risk, which results from the ability of a borrower or issuer to pay a debt obligation prior to maturity. Generally, in a declining interest rate environment, prepayment activity increases, which reduces the weighted average lives of our earning assets and could have a material adverse effect on us. We would also be required to amortize net premiums into income over a shorter period of time, thereby reducing the corresponding asset yield and net interest income. Prepayment risk also has a significant adverse impact on credit card and collateralized mortgage loans, since prepayments could shorten the weighted average life of these assets, which may result in a mismatch in our funding obligations and reinvestment at lower yields. Prepayment risk is inherent to our commercial activity and an increase in prepayments could have a material adverse effect on us.
Current economic conditions may make it more difficult for us to continue funding our business on favorable terms with institutional investors.
Large-denominations of funding from time deposits from institutional investors may, under some circumstances, be a less stable source of funding than savings and bonds, such as during periods of significant changes in market interest rates for these types of deposit products and any resulting increased competition for such funds. As of December 31, 20132015 short-term funding from institutional investors totaled US$4.0 3.0 billion or 7.7%6.1% of total liabilities and equity. The liquidity crisis triggered by the U.S. subprime market impacted global markets and affected sources of funding, including time deposits. Although our results of operations and financial position have not suffered a significant impact as a consequence of the recent credit market instability in the U.S., future market instability in the U.S. or in European markets, specifically the Spanish market, may negatively affect our ability to continue funding our business or maintain our current levels of funding without incurring higher funding costs or having to liquidate certain assets.
If we are unable to manage the growth of our operations, this could have an adverse impact on our profitability.
We allocate management and planning resources to develop strategic plans for organic growth, and to identify possible acquisitions and disposals and areas for restructuring our businesses. From time to time, we evaluate acquisition and partnership opportunities that we believe offer additional value to our shareholders and are consistent with our business strategy. However, we may not be able to identify suitable acquisition or partnership candidates, and
our ability to benefit from any such acquisitions and partnerships will depend in part on our successful integration of those businesses. Any such integration entails significant risks such as unforeseen difficulties in integrating operations and systems and unexpected liabilities or contingencies relating to the acquired businesses, including legal claims. We can give no assurances that our expectations with regards to integration and synergies will materialize. We also cannot provide assurance that we will, in all cases, be able to manage our growth effectively or deliver our strategic growth objectives. Challenges that may result from our strategic growth decisions include our ability to:
| · | manage efficiently the operations and employees of expanding businesses; |
| · | maintain or grow our existing customer base; |
| · | assess the value, strengths and weaknesses of investment or acquisition |
| · | finance strategic investments or acquisitions; |
| · | fully integrate strategic investments, or newly-established entities or acquisitions in line with its strategy; |
| · | align our current information technology systems adequately with those of an enlarged group; |
| · | apply our risk management policy effectively to an enlarged group; and |
| · | manage a growing number of entities without over-committing management or losing key personnel. |
Any failure to manage growth effectively, including relating to any or all of the above challenges associated with our growth plans, could have a material adverse effect on our operating results, financial condition and prospects.
In addition, any acquisition or venture could result in the loss of key employees and inconsistencies in standards, controls, procedures and policies.
Moreover, the success of the acquisition or venture will at least in part be subject to a number of political, economic and other factors that are beyond our control. Any of these factors, individually or collectively, could have a material adverse effect on us.
Risks Relating to Chile
Portions of our loan portfolio are subject to risks relating to force majeure events and any such event could materially adversely affect our operating results.
Chile lies on the Nazca tectonic plate, making it one of the world’s most seismically active regions. Our financial and operating performance may be adversely affected by force majeure events, such as natural disasters, particularly in locations where a significant portion of our loan portfolio is composed of real estate loans. Natural disasters such as earthquakes and floods may cause widespread damage which could impair the asset quality of our loan portfolio and could have an adverse impact on the economy of the affected region.
Changes in taxes, including the corporate tax rate, in Chile may have an adverse effect on us and our clients.
The Chilean Government regularly enacts reformsenacted in 2014 and again in 2015 a reform to the tax and other assessment regimes to which we and our customers are subject.subject in order to finance greater expenditure in education. The current statutory corporate tax rate in Chile is 20%. Legislation currently being discussed in Congress may gradually increase this to 25% by 2017. In addition other taxes may be modified, the most important being:changes approved were:
| 1. |
| 2. |
| 3. | Decree-Law 600, which gives foreign investors certain tax and other guarantees, will be replaced by a new law, yet to be designed. |
| 4. | The maximum personal income tax rate will be reduced from 40% to 35%, starting in 2018. |
| 5. | An increase in stamp tax from 0.45% to 0.8% in 2016. |
| 6. | Lowering of VAT exemption for construction of houses up to 2,000 |
| Charge VAT tax on |
| 9. | Withholding tax on dividends paid to ADR holders remains unchanged at 35% |
We cannot predict at this time if these reforms will have a material impact on our business or clients or if further tax reforms will be implemented in the future. The effects of these changes, if enacted, and any other changes that could result fromBanco Santander Chile’s effective corporate tax rate should rise in the enactment of additional tax reforms, cannot be quantified at this time, butfuture, which may have an adverse impact on our results of operationsoperations. Please see “Item 10-Additional information-E. Taxation” for more information regarding the impacts of this tax reform on ADR holders. This may have an adverse effect on the growth rate of mortgage loans and our clients.could slow down the rate of economic growth if tax receipts are not spent efficiently or for their intended purposes.
Our growth, asset quality and profitability may be adversely affected by macroeconomic and political conditions in Chile.
A substantial amount of our loans is to borrowers doing business in Chile. Chile’s economy has experienced significant volatility in recent decades, characterized, in some cases, by slow or regressive growth, declining investment and hyperinflation. This volatility resulted in fluctuations in the levels of deposits and in the relative economic strength of various segments of the economies to which we lend. In line with the global economic climate, Chile’s economy contracted 2.3% in 2009 for the first time since 1999. Since then, the Chilean economy has recovered significantly; however, theThe Chilean economy may not continue to grow at similar rates as in the futurepast or future developments may negatively affect Chile’s overall levels of economic activity.
Negative and fluctuating economic conditions, such as slowing or negative growth and a changing interest rate and inflationary environment, impact our profitability by causing lending margins to decrease and credit quality to decline and leading to decreased demand for higher margin products and services. Negative and fluctuating economic conditions in Chile could also result in government defaults on public debt. This could affect us in two ways: directly, through portfolio losses, and indirectly, through instabilities that a default in public debt could cause to the banking system as a whole, particularly since commercial banks’ exposure to government debt is high in Chile.
In addition, our revenues are subject to risk of loss from unfavorable political and diplomatic developments, social instability, and changes in governmental policies, including expropriation, nationalization, international ownership legislation, interest-rate caps and tax policies.
No assurance can be given that our growth, asset quality and profitability will not be adversely affected by volatile macroeconomic and political conditions in Chile.
Developments in other countries may affect us, including the prices for our securities.
The prices of securities issued by Chilean companies, including banks, are influenced to varying degrees by economic and market considerations in other countries. We cannot assure you that future developments in or affecting the Chilean economy, including consequences of economic difficulties in other markets, will not materially and adversely affect our business, financial condition or results of operations.
We are exposed to risks related to the weakness and volatility of the economic and political situation in Asia, the United States, Europe (including Spain, where Santander Spain, our controlling shareholder, is based), Brazil, Argentina and other nations. Even though the world economy and the financial and capital markets hadhave been recovering from the 2008 crisis throughout 2010 and early 2011, the conditions of the global markets again deteriorated in 2011 and continued through 2012. European countries encountered serious fiscal problems, including high debt levels that impaired growth and increased the risk of sovereign default. Also in 2011, the United States faced fiscal difficulties, which culminated in the downgrade of the U.S. long-term sovereign credit rating by S&P. Ongoing political debates in 2012 with respect to how the United States government would address the so-called “fiscal cliff” contributed to economic uncertainty. In 2012, spillovers from the crisis in Europe weighed negatively on activity and confidence and the global recovery slowed. In 2013, a general recovery was observed in the Eurozone and US economies. Although economic conditions in Europe and the United States may differ significantly from economic conditions in Chile, investors’ reactions to developments in these other countries may have an adverse effect on the market value of securities of Chilean issuers. In particular, investor perceptions of the risks associated with our securities may be affected by perception of risk conditions in Spain.
If these nations’ economic conditions deteriorate, the economy in Chile, as both a neighboring country and a trading partner, could also be affected and could experience slower growth than in recent years, with possible adverse impact on our borrowers and counterparties. If this were to occur, we would potentially need to increase our allowances for loan losses, thus affecting our financial results, our results of operations and the price of our securities. As of December 31, 2013,2015, approximately 3.3%4.3% of our assets were held abroad. There can be no assurance that the ongoing effects of the global financial crisis will not negatively impact growth, consumption, unemployment, investment and the price of exports in Chile. Crises and political uncertainties in other Latin American countries could also have an adverse effect on Chile, the price of our securities or our business.
Chile has considerable economic ties with China. In 2013, 24.9%2015, 26.3% of Chile’s exports went to China, mainly copper. China’s economy has grown at a strong pace in recent times, but a slowdown in economic activity in China may affect Chile’s GDP and export growth as well as the price of copper, which is Chile’s main export.
Chile is also involved in an international litigation with Bolivia regarding maritime borders. We cannot assure you that crises and political uncertainty in other Latin American countries will not have an adverse effect on Chile, the price of our securities or our business.
Fluctuations in the rate of inflation may affect our results of operations.
High levels of inflation in Chile could adversely affect the Chilean economy and have an adverse effect on our business, financial condition and results of operations. Extended periods of deflation could also have an adverse effect on our business, financial condition and results of operations. In 2009, Chile experienced deflation of 1.4% as the global economy contracted. In 2013,2015, CPI inflation was 3.0%4.4% compared to 1.5%4.7% in 2012.2014.
Our assets and liabilities are denominated in Chilean pesos, UF and foreign currencies. The UF is revalued in monthly cycles. On each day in the period beginning on the tenth day of any given month through the ninth day of the succeeding month, the nominal peso value of the UF is indexed up (or down in the event of deflation) in order to reflect a proportionate amount of the change in the Chilean Consumer Price Index during the prior calendar month. For more information regarding the UF, see “Item 5. Operating and Financial Review and Prospects—C.A. Operating Results—Impact of Inflation.” Although we benefit from inflation in Chile due to the current structure of our assets and liabilities (i.e., a significant portion of our loans are indexed to the inflation rate, but there are no corresponding features in deposits, or other funding sources that would increase the size of our funding base), there can be no assurance that our business, financial condition and result of operations in the future will not be adversely affected by changing levels of inflation, including from extended periods of inflation that adversely affect economic growth or periods of deflation.
Any change in the methodology of how the CPI index or the UF is calculated could also adversely affect our business, financial condition and results of operations.
Currency fluctuations could adversely affect our financial condition and results of operations and the value of our securities.
Any future changes in the value of the Chilean peso against the U.S. dollar will affect the U.S. dollar value of our securities. The Chilean peso has been subject to large devaluations and appreciations in the past and could be subject to significant fluctuations in the future. Our results of operations may be affected by fluctuations in the exchange rates between the peso and the dollar despite our policy and Chilean regulations relating to the general avoidance of material exchange rate exposure. In order to avoid material exchange rate exposure, we enter into forward exchange transactions. The following table shows the value of the Chilean peso relative to the U.S. dollar as reported by the Central Bank at year end for the last five years and the devaluation or appreciation of the peso relative to the U.S. dollar in each of those years.
Year | Exchange rate | Devaluation |
| 2009 | 506.43 | (19.5) |
| 2010 | 468.37 | (7.5) |
| 2011 | 521.46 | 11.3 |
| 2012 | 478.60 | (8.2) |
| 2013 | 523.76 | 9.4 |
| 2014 (until April 28, 2014) | 560.36 | 6.5 |
| Year | Exchange rate (Ch$) at year end | Devaluation (Appreciation) (%) | ||||||||
| 2011 | 521.46 | 11.3 | ||||||||
| 2012 | 478.60 | (8.2 | ) | |||||||
| 2013 | 523.76 | 9.4 | ||||||||
| 2014 | 607.38 | 16.0 | ||||||||
| 2015 | 707.34 | 16.5 | ||||||||
| 2016 (until April 28, 2016) | 668.49 | 5.5 | ||||||||
Source: Central Bank.
We may decide to change our policy regarding exchange rate exposure. Regulations that limit such exposures may also be amended or eliminated. Greater exchange rate risk will increase our exposure to the devaluation of the peso, and any such devaluation may impair our capacity to service foreign currency obligations and may, therefore,
materially and adversely affect our financial condition and results of operations. Notwithstanding the existence of general policies and regulations that limit material exchange rate exposures, the economic policies of the Chilean government and any future fluctuations of the peso against the dollar could affect our financial condition and results of operations.
Banking regulations and other regulatory factors may restrict our operations and thereby adversely affect our financial condition and results of operations.
We are subject to regulation by the SBIF. In addition, we are subject to regulation by the Central Bank with regard to certain matters, including reserve requirements, interest rates, foreign exchange mismatches and market risks. Changes in banking regulations may materially and adversely affect our business, financial condition and results of operations. Chilean laws, regulations, policies and interpretations of laws relating to the banking sector and financial institutions are continually evolving and changing. These new reforms could result in increased competition in the industry and thus may have a material adverse effect on our financial condition and results of operations.
As a result of the recent global financial crisis, there has been an increase in government regulation of the financial services industry in many countries. Such regulation may also be increased in Chile, including the imposition of higher capital requirements, heightened disclosure standards and restrictions on certain types of transaction structures. In addition, novel regulatory proposals abound in the current environment. If enacted, new regulations could require us to inject further capital into our business as well as in businesses we acquire, restrict the type or volume of transactions we enter into, or set limits on or require the modification of rates or fees that we charge on certain loans or other products, any of which could lower the return on our investments, assets and equity. Changes in regulations may also cause us to face increased compliance costs. As some of the banking laws and regulations have been recently adopted, the manner in which those laws and related regulations are applied to the operations of financial institutions is still evolving. Moreover, to the extent these recently adopted regulations are implemented inconsistently in the various jurisdictions in which we operate, it may face higher compliance costs. No assurance can be given generally that laws or regulations will be adopted, enforced or interpreted in a manner that will not have a material adverse effect on our business and results of operations.
In addition, extensive legislation affecting the financial services industry has recently been adopted in regions that directly or indirectly affect our business, including Spain, the United States and the European Union and other jurisdictions, and regulations are in the process of being implemented.
Pursuant to the General Banking Law, all Chilean banks may, subject to the approval of the SBIF, engage in certain businesses other than commercial banking depending on the risk associated with such business and their financial strength. Such additional businesses include securities brokerage, mutual fund management, securitization, insurance brokerage, leasing, factoring, financial advisory, custody and transportation of securities, loan collection and financial services. The General Banking Law also applies to the Chilean banking system a modified version of the capital adequacy guidelines issued by the Basel Committee on Banking Regulation and Supervisory Practices and limits the discretion of the SBIF to deny new banking licenses. There can be no assurance that regulators will not in the future impose more restrictive limitations on the activities of banks, including us. Any such change could have a material adverse effect on our financial condition or results of operations.
Historically, Chilean banks have not paid interest on amounts deposited in checking accounts. We have begun to pay interest on some checking accounts under certain conditions. If competition or other factors lead us to pay higher interest rates on checking accounts, to relax the conditions under which we pay interest or to increase the number of checking accounts on which we pay interest, any such change could have a material adverse effect on our financial condition or results of operations.
On November 20, 2013, the Chilean Congress approved new legislation to reduce the maximum rates that can be charged on loans. This new legislation is aimed at loans of less than UF 200 (U.S.$8,900)7,241) and with a term of more than 90 days, and thus includes consumer loans in installments, lines of credit and credit card lines. Previously, the maximum interest rate for loans of less than UF 200 and with a term of more than 90 days was calculated as the average rate of all transactions undertaken within the banking industry over the previous month of loans of less than UF 200 and with a term of more than 90 days, multiplied by a factor of 1.5. The average and maximum rates are published daily by the SBIF. As of September 30, 2013, the average annual interest rate for this type of loan reached 35.90%, and the maximum annual interest rate reached 53.85%.
On December 13, 2013, the SBIF published the new maximum rates for loans between UF 0 and UF 50 (US$2,225)1,810). The new maximum rate was 47.91%, compared to 53.85% as of September 30, 2013. Further reductions of 2% will be implemented gradually every 12 weeks in 2014 untilThe objective is to lower the maximum rate is equalto a level closer to the average interest rate for loans between UF 200 (US$8,900)7,241) to UF 5,000 (US$222,500)181,047) plus 21%, unless the flow of new loans in the industry decreases by 10%-20%, in which case the reduction will be partially or completely suspended until the next period. We estimate that it will take 20 months forAs of December 31, 2014, the maximum rate for loans between UF 0 and UF 50 (US$1,810) was 38.63%. By year-end 2015 the maximum rate was 36.66%, close to reach the 37% level the authorities are seeking for loans of this size.
On December 13, 2013, the SBIF published the new maximum rates for loans between UF 50 (US$2,225)1,810) and UF 200 (US$8,900)7,241). The new maximum rate was 45.91%, compared to 53.85% as of September 30, 2013. Further reductions of 2% will be implemented gradually every 12 weeks untilThe objective is to lower the maximum rate is equalto a level closer to the average interest rate for loans between UF 200 (US$8,900)7,241) to UF 5,000 (US$222,500)181,047) plus 14%, unless the flow of new loans in the industry decreases by 10%-20%, in which case the reduction will be partially or completely suspended until the next period. We estimate that it will take 26 months forAs of December 31, 2014, the maximum rate for loans between UF 50 and UF 200 (US$7,241) was 36.63%. By year-end 2015 the maximum rate was 36.66%, close to reach the 31% level the authorities are seeking for loans of this size.
We estimate that in 2014, this bill could lower our net interest margin by 15-20 basis points, or approximately Ch$40-50 billion. This estimate is only preliminary, as it is difficult to estimate the speed of implementation of the reduction and the effect on loan volumes
In March 2012, a bill aimed at giving additional enforcement powers to the SERNAC (Chile’s Consumer Protection Agency) regarding financial services became effective and created the SERNAC Financiero, a specific consumer protection agency for the financial industry. The SERNAC Financiero has powers to supervise and regulate Bank products and services. The creation of the SERNAC Financiero has also resulted in additional scrutiny regarding prices and contracts for financial products and services, making it more difficult to raise prices and increasing competition among bank and non-bank competitors. The government is currently discussing with the Chilean Congress a bill to again reform the SERNAC Financiero and its powers. No assurance can be given that these changes will not have a material impact on our fee income.
In July 2012,The SBIF and the Ministry of Finance are currently drafting a new regulations regarding the selling of mandatory insurance for loans introducedGeneral Banking Law that will increase competition and that could lower our fees from collecting these premiums. This had a negative impact on fees in 2013 in an amount we estimatedis expected to be approximately Ch$6 billion. In 2014, we again auctioned our mortgage P&L insurance provider and prices fell once more. We expect thissubmitted to have an impact of Ch$8-10 billionthe Chilean Congress in 2014, subject2016. Among other things, the new banking law is expected to further changes in estimate.
In line withinclude clearer guidelines for the future adoption of Basel III regulations in Chile and new regulations regarding the SBIF has recently proposed to increase the minimum regulatory capital ratio from 8% to 10%, which would require an amendment to the General Banking Law.SBIF’s corporate governance. Although we currently have a regulatory capital ratio of 13.82%13.4% as of December 31, 2013,2015, this change could require us to inject additional capital to our business in the future. According to initial estimates of the impact of market risk on regulatory capital, published for informational purposes only by the SBIF, our ratio of regulatory capital to risk-weighted assets, net of loan loss allowance and deductions, including an initial estimate of the adjustments for market risk was 12.57%12.0% as of December 31, 2013.2015. No assurance can be given that these changes will not have a material impact on our capitalization ratio.
On December 18, 2013, the SBIF published new guidelines for provisioningA change in labor laws in Chile or a bank’s residential mortgage loan portfolio. These new regulations are currently open for debate and the final versions are expected to be published in 2014. The drafts of these new regulations include:
These above changes will be implemented gradually by the SBIF once the final rules are published, which is expected by January 2015. At this time, we are unable to estimate the impact these new regulations will have on our loan loss allowance levels for mortgage loans or our net income under IFRS.
A worsening of labor relations in Chilethe Bank could impact our business.
As of December 31, 20132015 on a consolidated basis, we had 11,51611,723 employees, of which 75.9%71.3% were unionized. In March 2014, a new collective bargaining agreement was signed with the main unions, which will becomebecame effective on OctoberJanuary 1, 2014, and which will expire on December 31, 2018. We generally apply the terms of our collective bargaining agreement to unionized and non-unionized employees. We have traditionally had good relations with our employees and their unions, but we cannot assure you that in the future, a strengthening of cross-industry labor movements will not materially and adversely affect our business, financial condition or results of operations.
Congress passed a new labor law in 2016. The main points included in this law are:
| · | Expands the scope of collective bargaining. Currently some groups of workers are excluded from the collective bargaining process. |
| · | Legalizes industry-wide unions. |
| · | Gives union has sole collective bargaining rights. The ability of non-union groups to negotiate a collective bargaining agreement is eliminated. |
| · | Expands workers ability to switch unions and gives workers the same rights under a collective bargaining agreement if they affiliate themselves post-negotiations. |
| · | Expand the right to greater information of unions including the wages of each worker included in a collective bargaining agreement. |
| · | Simplifies the standard collective bargaining process. |
| · | Collective bargaining agreements must last maximum three years instead of four. |
| · | Eliminate the ability of the employer to replace workers on strike and establishes minimum service guidelines that workers must respect. |
| · | Establishes the current collective bargaining agreement as the bargaining floor for future collective bargaining agreements. |
| · | Amplifies the matters that can be negotiated in collective bargaining. |
| · | Greater hours for training of union representatives. |
| · | Strengthen the participation of women in unions. |
The Bank currently has a high unionization level and good labor relations. At this time, we are unable to estimate the impact these new regulations will have on labor relations and costs. The current project may also suffer additional modification will being discussed in Congress.
These and any additional legislative or regulatory actions in Chile, Spain, the European Union, the United States or other countries, and any required changes to our business operations resulting from such legislation and regulations, could result in reduced capital availability, significant loss of revenue, limit our ability to continue organic growth (including increased lending), pursue business opportunities in which we might otherwise consider engaging and provide certain products and services, affect the value of assets that we hold, require us to increase our prices and therefore reduce demand for our products, impose additional costs on us or otherwise adversely affect our businesses. Accordingly, we cannot provide assurance that any such new legislation or regulations would not have an adverse effect on our business, results of operations or financial condition in the future.
Our corporate disclosure may differ from disclosure regularly published by issuers of securities in other countries, including the United States.
Issuers of securities in Chile are required to make public disclosures that are different from, and that may be reported under presentations that are not consistent with, disclosures required in the United States and other countries. In particular, as a Chilean regulated financial institution, we are required to submit to the SBIF on a monthly basis unaudited consolidated balance sheets and income statements, excluding any note disclosure, prepared in accordance with Chilean Bank GAAP and the rules of the SBIF. This disclosure differs in a number of significant respects from generally accepted accounting principles in the United States and information generally available in the United States with respect to U.S. financial institutions.In addition, as a foreign private issuer, we are not subject to the same disclosure requirements in the United States as a domestic U.S. registrant under the Exchange Act, including the requirements to prepare and issue quarterly reports, or the proxy rules applicable to domestic U.S. registrants under Section 14 of the Exchange Act or the insider reporting and short-swing profit rules under Section 16 of the Exchange Act. Accordingly, the information about us available to you will not be the same as the information available to shareholders of a U.S. company and may be reported in a manner that you are not familiar with.
Chile imposes controls on foreign investment and repatriation of investments that may affect your investment in, and earnings from, our ADSs.
Equity investments in Chile by persons who are not Chilean residents have generally been subject to various exchange control regulations, which restrict the repatriation of the investments and earnings therefrom. In April 2001, the Central Bank eliminated the regulations that affected foreign investors, except that investors are still required to provide the Central Bank with information relating to equity investments and conduct such operations within Chile’s Formal Exchange Market. The ADSs are subject to a contract, dated May 17, 1994, among the Depositary, us and the Central Bank (the “Foreign Investment Contract”) that remains in full force and effect. The ADSs continue to be governed by the provisions of the Foreign Investment Contract subject to the regulations in existence prior to April 2001. The Foreign Investment Contract grants the Depositary and the holders of the ADSs access to the Formal Exchange Market, which permits the Depositary to remit dividends it receives from us to the holders of the ADSs. The Foreign Investment Contract also permits ADS holders to repatriate the proceeds from the sale of shares of our common stock withdrawn from the ADR facility, or that have been received free of payment as a consequence of spin offs, mergers, capital increases, wind ups, share dividends or preemptive rights transfers, enabling them to acquire the foreign currency necessary to repatriate earnings from such investments. Pursuant to Chilean law, the Foreign Investment Contract cannot be amended unilaterally by the Central Bank, and there are judicial precedents (although not binding with respect to future judicial decisions) indicating that contracts of this type may not be abrogated by future legislative changes or resolutions of the Advisory Council of the Central Bank. Holders of shares of our
common stock, except for shares of our common stock withdrawn from the ADS facility or
received in the manner described above, are not entitled to the benefits of the Foreign Investment Contract, may not have access to the Formal Exchange Market, and may have restrictions on their ability to repatriate investments in shares of our common stock and earnings therefrom.
Holders of ADSs are entitled to receive dividends on the underlying shares to the same extent as the holders of shares. Dividends received by holders of ADSs will be paid net of foreign currency exchange fees and expenses of the Depositary and will be subject to Chilean withholding tax, currently imposed at a rate of 35.0% (subject to credits in certain cases). If for any reason, including changes in Chilean law, the Depositary were unable to convert Chilean pesos to U.S. dollars, investors would receive dividends and other distributions, if any, in Chilean pesos.
We cannot assure you that additional Chilean restrictions applicable to holders of our ADSs, the disposition of the shares underlying them or the repatriation of the proceeds from such disposition or the payment of dividends will not be imposed in the future, nor can we advise you as to the duration or impact of such restrictions if imposed.
Investors may find it difficult to enforce civil liabilities against us or our directors, officers and controlling persons.
We are a Chilean corporation. None of our directors are residents of the United States and most of our executive officers reside outside the United States. In addition, a substantial portion of our assets and the assets of our directors and executive officers are located outside the United States.Although we have appointed an agent for service of process in any action against us in the United States with respect to our ADSs, none of our directors, officers or controlling persons has consented to service of process in the United States or to the jurisdiction of any United States court. As a result, it may be difficult for investors to effect service of process within the United States on such persons.
It may also be difficult for ADS holders to enforce in the United States or in Chilean courts money judgments obtained in United States courts against us or our directors and executive officers based on civil liability provisions of the U.S. federal securities laws. If a U.S. court grants a final money judgment in an action based on the civil liability provisions of the federal securities laws of the United States, enforceability of this money judgment in Chile will be subject to the obtaining of the relevant “exequatur” (i.e., recognition and enforcement of the foreign judgment) according to Chilean civil procedure law currently in force, and consequently, subject to the satisfaction of certain factors. The most important of these factors are the existence of reciprocity, the absence of a conflicting judgment by a Chilean court relating to the same parties and arising from the same facts and circumstances and the Chilean courts’ determination that the U.S. courts had jurisdiction, that process was appropriately served on the defendant and that enforcement would not violate Chilean public policy. Failure to satisfy any of such requirements may result in non-enforcement of your rights.
Risks Relating to Our Controlling Shareholder and our ADSs
Our controlling shareholder has a great deal of influence over our business and its interests could conflict with yours.
Santander Spain, our controlling shareholder, controls Santander-Chile through its holdings in Teatinos Siglo XXI Inversiones S.A. and Santander Chile Holding S.A., which are controlled subsidiaries. Santander Spain has control over 67.18% of our shares and actual participation, excluding non-controlling shareholders that participate in Santander Chile Holding, S.A. of 67.01%67.12%.
Due to its share ownership, our controlling shareholder has the ability to control us and our subsidiaries, including the ability to:
| · | elect the majority of the directors and exercise control over our company and subsidiaries; |
| · | cause the appointment of our principal officers; |
| · | declare the payment of any dividends; |
| · | agree to sell or otherwise transfer its controlling stake in us; and |
| · | determine the outcome of substantially all actions requiring shareholder approval, including amendments of our bylaws, transactions with related parties, corporate reorganizations, acquisitions and disposals of assets and issuance of additional equity securities, if any. |
In December 2012, primarily in response to the requirements of the European Banking Authority, the Bank of Spain and regulators in various jurisdictions, Santander Spain adopted a corporate governance framework (Marco de Gobierno Interno del Grupo Santander). The purpose of the framework is to organize and standardize the corporate governance practices of Santander Spain and its most significant subsidiaries, including us. (Our Board of Directors approved the adoption of this corporate governance framework in AprilJuly 2013,) subject to certain overarching principles, such as the precedence of applicable laws and regulations over the framework to the extent they are in conflict. See “Item 16G. Corporate Governance.” Our adoption of this framework may increase Santander Spain’s control over us.
We operate as a stand-alone subsidiary within the Santander Group. Our controlling shareholder has no liability for our banking operations, except for the amount of its holdings of our capital stock. The interests of Santander Spain may differ from the interests of our other shareholders, and the concentration of control in Santander Spain may differ from the interests of our other shareholders, and the concentration of control in Santander Spain will limit other shareholders’ ability to influence corporate matters. As a result, we may take actions that our other shareholders do not view as beneficial.
Our status as a controlled company and a foreign private issuer exempts us from certain of the corporate governance standards of the New York Stock Exchange (“NYSE”), limiting the protections afforded to investors.
We are a “controlled company” and a “foreign private issuer” within the meaning of the NYSE corporate governance standards. Under the NYSE rules, a controlled company is exempt from certain NYSE corporate governance requirements. In addition, a foreign private issuer may elect to comply with the practice of its home country and not to comply with certain NYSE corporate governance requirements, including the requirements that (1) a majority of the board of directors consist of independent directors, (2) a nominating and corporate governance committee be established that is composed entirely of independent directors and has a written charter addressing the committee’s purpose and responsibilities, (3) a compensation committee be established that is composed entirely of independent directors and has a written charter addressing the committee’s purpose and responsibilities and (4) an annual performance evaluation of the nominating and corporate governance and compensation committees be undertaken. Although we have similar practices, they do not entirely conform to the NYSE requirements for U.S. issuers; therefore we currently use these exemptions and intend to continue using them. Accordingly, you will not have the same protections afforded to shareholders of companies that are subject to all NYSE corporate governance requirements.
There may be a lack of liquidity and market for our shares and ADSs.
Our ADSs are listed and traded on the NYSE. Our common stock is listed and traded on the Santiago Stock Exchange, the Chile Electronic Stock Exchange and the Valparaiso Stock Exchange, which we refer to collectively as the Chilean Stock Exchanges, although the trading market for the common stock is small by international standards. At December 31, 2013,2015, we had 188,446,126,794 shares of common stock outstanding. The Chilean securities markets are substantially smaller, less liquid and more volatile than major securities markets in the United States. According to Article 14 of the Ley de Mercado de Valores, Ley No. 18,045, or the Chilean Securities Market Law, the Superintendencia de Valores y Seguros, or the Superintendency of Securities and Insurance, may suspend the offer, quotation or trading of shares of any company listed on one or more Chilean Stock Exchanges for up to 30 days if, in its opinion, such suspension is necessary to protect investors or is justified for reasons of public interest. Such suspension may be extended for up to 120 days. If, at the expiration of the extension, the circumstances giving rise to the original suspension have not changed, the Superintendency of Securities and Insurance will then cancel the relevant listing in the registry of securities. In addition, the Santiago Stock Exchange may inquire as to any movement in the price of any securities in excess of 10% and suspend trading in such securities for a day if it deems necessary.
Although our common stock is traded on the Chilean Stock Exchanges, there can be no assurance that a liquid trading market for our common stock will continue to exist. Approximately 33.0% of our outstanding common stock is held by the public (i.e., shareholders other than Santander Spain and its affiliates), including our shares that are represented by ADSs trading on the NYSE. A limited trading market in general and our concentrated ownership in particular may impair the ability of an ADS holder to sell in the Chilean market shares of common stock obtained
upon withdrawal of such shares from the ADR facility in the amount and at the price and time such holder desires, and could increase the volatility of the price of the ADSs.
You may be unable to exercise preemptive rights.
TheLey Sobre Sociedades Anónimas, Ley No. 18,046 and theReglamento de Sociedades Anónimas, which we refer to collectively as the Chilean Companies Law, and applicable regulations require that whenever we issue new common stock for cash, we grant preemptive rights to all of our shareholders (including holders of ADSs), giving them the right to purchase a sufficient number of shares to maintain their existing ownership percentage. Such an offering would not be possible in the United States unless a registration statement under the U.S. Securities Act of 1933 (“Securities Act”), as amended, were effective with respect to such rights and common stock or an exemption from the registration requirements thereunder were available.
Since we are not obligated to make a registration statement available with respect to such rights and the common stock, you may not be able to exercise your preemptive rights in the United States. If a registration statement is not filed or an applicable exemption is not available under U.S. securities law, the Depositary will sell such holders’ preemptive rights and distribute the proceeds thereof if a premium can be recognized over the cost of any such sale.
As a holder of ADSs you will have different shareholders’ rights than in the United States and certain other jurisdictions.
Our corporate affairs are governed by our estatutos, or by-laws, and the laws of Chile, which may differ from the legal principles that would apply if we were incorporated in a jurisdiction in the United States or in certain other jurisdictions outside Chile. Under Chilean corporate law, you may have fewer and less well-defined rights to protect your interests relative to actions taken by our board of directors or the holders of our common shares than under the laws of other jurisdictions outside Chile. For example, under legislation applicable to Chilean banks, our shareholders would not be entitled to appraisal rights in the event of a merger or other business combination undertaken by us.
Although Chilean corporate law imposes restrictions on insider trading and price manipulation, the form of these regulations and the manner of their enforcement may differ from that in the U.S. securities markets or markets in certain other jurisdictions. In addition, in Chile, self-dealing and the preservation of shareholder interests may be regulated differently, which could potentially disadvantage you as a holder of the shares underlying ADSs.
Holders of ADSs may find it difficult to exercise voting rights at our shareholders’ meetings.
Holders of ADSs will not be our direct shareholders and will be unable to enforce directly the rights of shareholders under our by-laws and the laws of Chile. Holders of ADSs may exercise voting rights with respect to the common stock represented by ADSs only in accordance with the deposit agreement governing the ADSs. Holders of ADSs will face practical limitations in exercising their voting rights because of the additional steps involved in our communications with ADS holders. Holders of our common stock will be able to exercise their voting rights by attending a shareholders’ meeting in person or voting by proxy. By contrast, holders of ADSs will receive notice of a shareholders’ meeting by mail from the Depositary following our notice to the Depositary requesting the Depository to do so. To exercise their voting rights, holders of ADSs must instruct the Depositary on a timely basis on how they wish to vote. This voting process necessarily will take longer for holders of ADSs than for holders of our common stock. If the Depositary fails to receive timely voting instructions for all or part of the ADSs, the Depositary will assume that the holders of those ADSs are instructing it to give a discretionary proxy to a person designated by us to vote their ADSs, except in limited circumstances.
Holders of ADSs also may not receive the voting materials in time to instruct the Depositary to vote the common stock underlying their ADSs. In addition, the Depositary and its agents are not responsible for failing to carry out voting instructions of the holders of ADSs or for the manner of carrying out those voting instructions. Accordingly, holders of ADSs may not be able to exercise voting rights, and they will have little, if any, recourse if the common stocks underlying their ADSs are not voted as requested.
ADS holders may be subject to additional risks related to holding ADSs rather than shares.
Because ADS holders do not hold their shares directly, they are subject to the following additional risks, among others:
| · | as an ADS holder, we will not treat you as one of our direct shareholders and you may not be able to exercise shareholder rights; |
| · | we and the depositary may amend or terminate the deposit agreement without the ADS holders’ consent in a manner that could prejudice ADS holders or that could affect the ability of ADS holders to transfer ADSs; and |
| · | the depositary may take or be required to take actions under the Deposit Agreement that may have adverse consequences for some ADS holders in their particular circumstances. |
ITEM 4. INFORMATION ON THE COMPANY
A. History and Development of the Company
| A. | History and Development of the Company |
Overview
We are the largest bank in Chile in terms of total assets and equity.loans. As of December 31, 2013,2015, we had total assets of Ch$27,122,22734,637,660 million (U.S.$51,74048,937 million), outstanding loans and interbank loans, net of allowances for loan losses of Ch$20,445,82824,538,456 million (U.S.$39,00434,669 million), total deposits of Ch$15,296,03519,538,888 million (U.S.$29,180 27,605 million) and equity of Ch$2,372,4562,802,555 million (U.S.$4,5263,960 million). As of December 31, 2013,2015, we employed 11,516 people11,723 people. We have a leading presence in all the major business segments in Chile, and had the largest privatedistribution network with national coverage spanning across all the country, including the only privately owned bank with a branch network in Chile, with 493 branches.Easter Island. We offer unique transaction capabilities to clients through our 471 branches and 1,536 ATMs. Our headquarters are located in Santiago and we operate in every major region of Chile.
We provide a broad range of commercial and retail banking services to our customers, including Chilean peso and foreign currency denominated loans to finance a variety of commercial transactions, trade, foreign currency forward contracts and credit lines and a variety of retail banking services, including mortgage financing. We seek to offer our customers a wide range of products while providing high levels of service. In addition to our traditional banking operations, we offer a variety of financial services, including financial leasing, financial advisory services, mutual fund management, securities brokerage, insurance brokerage and investment management.
The legal predecessor of Santander-Chile was Banco Santiago (“Santiago”). Santiago was incorporated by public deed dated September 7, 1977 granted at the Notary Office of Alfredo Astaburuaga Gálvez. Santiago received its permission to incorporate and function as a bank by Resolution No. 118 of the SBIF on October 27, 1977. Santiago’s by-laws were approved by Resolution No. 103 of the SBIF on September 22, 1977. In January 1997, Santiago merged with Banco O’Higgins, with Santiago being the surviving entity. In 1999, Santiago became a controlled subsidiary of Santander Spain. As of June 30, 2002, Santiago was the second-largest private sector bank in Chile in terms of total assets, deposits, loans and shareholders’ equity.
Old Santander-Chile was established as a subsidiary of Santander Spain in 1978. In 1982, Old Santander-Chile acquired a significant portion of the assets and liabilities of Banco Español-Chile, a domestic bank that had become insolvent. In July 1996, Old Santander-Chile was merged into Banco Osorno y la Unión, becoming “Banco Santander-Chile,” the third-largest private bank in terms of outstanding loans at that date.
On August 1, 2002, Santiago and Old Santander Chile merged, whereby the latter ceased to exist and Santander-Chile (formerly known as Santiago) being the surviving entity.
Our principal executive offices are located at Bandera 140, 20th floor, Santiago, Chile. Our telephone number is +562-320-2000 and our website is www.santander.cl. None of the information contained on our website is incorporated by reference into, or forms part of, this Annual Report. Our agent for service of process in the United States is CT Corporation, located at 111 Eighth Avenue, 13th Floor, New York, New York 10011.
Relationship with Santander Spain
We believe that our relationship with our controlling shareholder, Santander Spain, offers us a significant competitive advantage over our peer Chilean banks. Santander Spain is one of the largest financial groups in Brazil and the rest of Latin America, in terms of total assets measured on a regional basis. It is the largest financial group in Spain and is a major player elsewhere in Europe, including the United Kingdom, Poland and Portugal, where it is the third-largest banking group. Through Santander Consumer, it also operates a leading consumer finance franchise in the United States, as well as in Germany, Italy, Spain, and several other European countries.
Our relationship with Santander Spain provides us with access to the group’s client base, while its multinational focus allows us to offer international solutions to our clients’ financial needs. We also have the benefit of selectively borrowing from Santander Spain’s product offerings in other countries, as well as of its know-how in systems management. We believe that our relationship with Santander Spain will also enhance our ability to manage credit and market risks by adopting policies and knowledge developed by Santander Spain. In addition, our internal auditing function has been strengthened as a result of the addition of an internal auditing department that concurrently reports
directly to our Audit Committee and the audit committee of Santander Spain. We believe that this structure leads to improved monitoring and control of our exposure to operational risks.
Santander Spain’s support of Santander-Chile includes the assignment of managerial personnel to key supervisory areas of Santander-Chile, such as risks, auditing, accounting and financial control. Santander-Chile does not pay any management or other fees to Santander Spain in connection with these support services.
B. Organizational Structure
Santander Spain controls Santander-Chile through its holdings in Teatinos Siglo XXI Inversiones Ltda. and Santander Chile Holding S.A. which are controlled subsidiaries. In 2011, Santander Spain sold 9.7% of its ownership through Teatinos Siglo XXI Inversiones S.A. in the market. This gave Santander Spain control over 67.18% of our shares and actual participation when excluding non-controlling interests participating in Santander Chile Holding S.A. of 67.01%.
Shareholder | Number of Shares | Percentage |
| Santander Chile Holding S.A. | 66,822,519,695 | 35.46 |
| Teatinos Siglo XXI Inversiones S.A. | 59,770,481,573 | 31.72 |
The chart below sets forth the names and areas of responsibility of our senior managers as of April 2014.
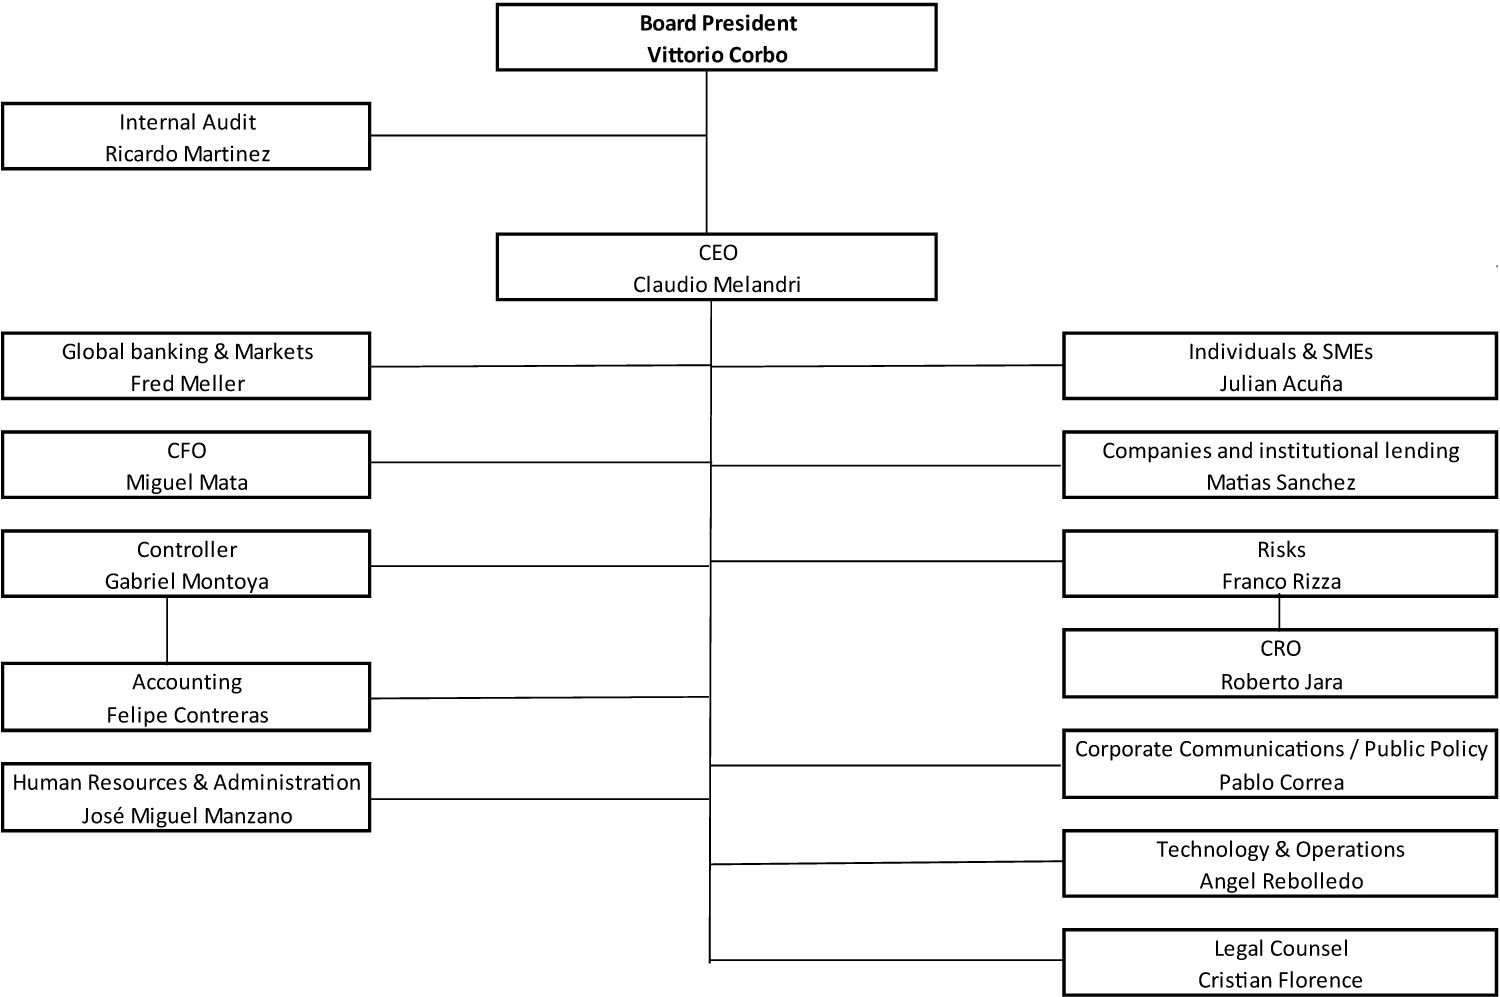
| B. | Business Overview |
C. Business Overview
We have 493471 total branches, 282276 of which are operated under the Santander brand name, with the remaining branches under certain specialty brand names, including 7767 under theSantander Banefe brand name, 41 under theSuperCaja brand name, 4653 under the Select brand name, 8 specialized branches for the Middle Market and 4767 as auxiliary and payment centers. We provide a full range of financial services to corporate and individual customers. We divide our clients into the following segments:groups: (i) CommercialRetail banking, (ii) Middle-market, (iii) Global Corporate Banking and (ii) Global Banking and Markets. (iv) Corporate Activities (“Other”).
The Bank has the following operating segments:reportable segments noted below (see “Segmentation Criteria” for further information):
Retail Banking
Consists of individuals and small to middle-sized entities (SMEs) with annual sales less than Ch$2,000 million (US$2.8 million). This segment gives customers a variety of services, including consumer loans, credit cards, auto loans, commercial loans, foreign exchange, mortgage loans, debit cards, checking accounts, savings products, mutual funds, stock brokerage, and insurance brokerage. Additionally, the SME clients are offered government-guaranteed loans, leasing and factoring.
Middle-market
This segment serves companies and large corporations with annual sales exceeding Ch$2,000 million (US$2.8 million). It serves institutions such as universities, government entities, local and regional governments and companies engaged in the real estate industry who carry out projects to sell properties to third parties and annual sales exceeding Ch$800 million (US$1.1million) with no upper limit. The companies within this segment have access to many products including commercial loans, leasing, factoring, foreign trade, credit cards, mortgage loans, checking accounts, transactional services, treasury services, financial consulting, savings products, mutual funds, and insurance brokerage. Also companies in the real estate industry are offered specialized services to finance projects, chiefly residential, with the aim of expanding sales of mortgage loans.
Global Corporate Banking
This segment consists of foreign and domestic multinational companies with sales over Ch$10,000 million. The companies within this segment have access to many products including commercial loans, leasing, factoring, foreign trade, credit cards, mortgage loans, checking accounts, transactional services, treasury services, financial consulting, investments, savings products, mutual funds and insurance brokerage.
This segment also consists of a Treasury Division which provides sophisticated financial products, mainly to companies in the Middle-market segment and Global Corporate Banking. These include products such as short-term financing and fund raising, brokerage services, derivatives, securitization and other tailor-made products. The Treasury Division may broker transactions and also manages the Bank’s investment portfolio.
Corporate Activities (“Other”)
This segment mainly includes our Financial Management Division, which develops global management functions, including managing inflation rate risk, foreign currency gaps, interest rate risk and liquidity risk. Liquidity risk is managed mainly through wholesale deposits, debt issuances and the Bank’s available-for-sale portfolio. This segment also manages capital allocation by unit. These activities usually result in a negative contribution to income.
In addition, we have a Corporate Activitiesthis segment comprised ofencompasses all other operationalthe intra-segment income and administrativeall the activities that are not assigned to a specificgiven segment or product mentioned above. This segment includeswith customers. The segments’ accounting policies are those described in the Financial Management Division (Gestión Financiera), which manages global functions such assummary of accounting policies. The Bank earns most of its income in the managementform of our structural foreign exchange gap position, our structural position in inflation-indexed assetsinterest income, fee and liabilities, our structuralcommission income and income from financial operations. To evaluate a segment’s financial performance and make decisions regarding the resources to be assigned to segments, the Chief Operating Decision Maker (CODM) bases his assessment on the segment's interest rate riskincome, fee and our liquidity risk. The Financial Management Division also oversees the use of our resources, the distribution of capital among our different unitscommission income, and the overall financing cost of investments. The aim of the Financial Management Division is to inject stability and recurrence into the net income of commercial activities and to assure we comply with internal and regulatory limits regarding liquidity, regulatory capital, reserve requirements and market risk.expenses.
The tabletables below sets forth our lines of business and certain statistical information relating to each of themshow the Bank’s results by reporting segment for the year ended December 31, 2013. Please see “Note 4—Business Segments”2015, in addition to our Audited Consolidated Financial Statementsthe corresponding balances of loans and accounts receivable from customers:
| As of December 31, 2015 | ||||||||
Loans and accounts receivable from customers (1) | Net interest income | Net fee and commission income | Financial transactions, net (2) | Provision for loan losses | Support expenses (3) | Segment`s contribution | ||
| Ch$mn | ||||||||
| Retail Banking | 17,034,707 | 873,026 | 190,380 | 16,245 | (332,657) | (533,086) | 213,908 | |
| Middle-market | 6,006,282 | 229,812 | 28,537 | 17,897 | (26,147) | (77,261) | 172,838 | |
| Global Corporate Banking | 2,178,643 | 85,553 | 15,231 | 50,327 | (28,426) | (49,533) | 73,152 | |
| Other | 81,125 | 66,815 | 3,479 | 61,030 | (12,047) | (1,328) | 117,949 | |
| Total | 25,300,757 | 1,255,206 | 237,627 | 145,499 | (399,277) | (661,208) | 577,847 | |
| Other operating income | 6,439 | |||||||
| Other operating expenses and impairment | (58,750) | |||||||
| Income from investments in associates and other companies | 2,588 | |||||||
| Income tax expense | (76,395) | |||||||
| Net income for the year | 451,729 | |||||||
(1) Corresponds to loans and accounts receivable from customers, without deducting their allowances for details of revenue by business segment in the last three years.loan losses.
| As of December 31, 2013 | ||||||||||
Loans and accounts receivable from customers (1) | Net interest income |
Net fee and commission income | Financial transactions, net (2) |
Provision for loan losses | Support (3) | Segment’s net contribution | ||||
| Ch$mn | Ch$mn | Ch$mn | Ch$mn | Ch$mn | Ch$mn | Ch$mn | ||||
| Segments | ||||||||||
| Individuals + SMEs | ||||||||||
| Santander Banefe | 727,452 | 99,182 | 25,648 | 1,614 | (56,309) | (52,370) | 17,765 | |||
| Commercial Banking | 9,710,249 | 506,192 | 123,496 | 7,118 | (157,697) | (298,173) | 180,936 | |||
| Small and mid-sized companies (SMEs) | 3,223,215 | 260,856 | 37,641 | 4,798 | (101,611) | (79,633) | 122,051 | |||
| Subtotal | 13,660,916 | 866,230 | 186,785 | 13,530 | (315,617) | (430,176) | 320,752 | |||
| Companies and institutional | ||||||||||
| Companies | 1,757,586 | 73,906 | 14,020 | 7,457 | (21,364) | (27,947) | 46,072 | |||
| Large Corporations | 1,923,810 | 62,953 | 9,026 | 5,930 | (15,296) | (19,937) | 42,676 | |||
| Real estate | 996,847 | 26,607 | 3,588 | 287 | (5,098) | (6,055) | 19,329 | |||
| Institutional | 353,509 | 30,283 | 2,615 | 562 | 261 | (15,889) | 17,832 | |||
| Subtotal | 5,031,752 | 193,749 | 29,249 | 14,236 | (41,497) | (69,828) | 125,909 | |||
| Subtotal Commercial Banking | 18,692,668 | 1,059,979 | 216,034 | 27,766 | (357,114) | (500,004) | 446,661 | |||
| Global Banking and Markets | ||||||||||
| Corporate | 2,219,045 | 63,036 | 16,295 | 9,011 | (14,739) | (19,802) | 53,801 | |||
| Treasury | - | 9,896 | 1,727 | 41,706 | - | (17,926) | 35,403 | |||
| Subtotal | 2,219,045 | 72,932 | 18,022 | 50,717 | (14,739) | (37,728) | 89,204 | |||
| Other | 149,048 | (56,149) | (4,220) | 45,954 | 391 | (20,121) | (34,145) | |||
| Total | 21,060,761 | 1,076,762 | 229,836 | 124,437 | (371,462) | (557,853) | 501,720 | |||
| Other operating income | 88,155 | |||||||||
| Other operating expenses | (52,338) | |||||||||
| Income from investments in associates and other companies | 1,422 | |||||||||
| Income tax expense | (94,530) | |||||||||
| Net income for the year | 444,429 | |||||||||
(2) Corresponds to the sum of the net income from financial operations and the foreign exchange profit or loss.
(3) Corresponds to the sum of personnel salaries and expenses, administrative expenses, depreciation and amortization.
Operations through Subsidiaries
Today, the General Banking Law permits us to directly provide the leasing and financial advisory services that we could formerly offer only through our subsidiaries, to offer investment advisory services outside of Chile and to undertake activities that we could not formerly offer directly or through subsidiaries, such as factoring, securitization, foreign investment funds, custody and transport of securities and insurance brokerage services. For the twelve–month period ended December 31, 2013,2015, our subsidiaries collectively accounted for 1.6%0.8% of our total consolidated assets.
| Name of the subsidiary | Percent ownership share | ||||||||||||
| As of December 31 | |||||||||||||
| 2013 | 2012 | 2011 | |||||||||||
| Direct | Indirect | Total | Direct | Indirect | Total | Direct | Indirect | Total | |||||
| Main activity | % | % | % | % | % | % | % | % | % | ||||
| Santander Corredora de Seguros Limitada | Insurance brokerage | 99.75 | 0.01 | 99.76 | 99.75 | 0.01 | 99.76 | 99.75 | 0.01 | 99.76 | |||
| Santander S.A. Corredores de Bolsa | Financial instruments brokerage | 50.59 | 0.41 | 51.00 | 50.59 | 0.41 | 51.00 | 50.59 | 0.41 | 51.00 | |||
| Santander Asset Management S.A. Administradora General de Fondos (*) | Third-party funds administration | - | - | - | 99.96 | 0.02 | 99.98 | 99.96 | 0.02 | 99.98 | |||
| Santander Agente de Valores Limitada | Securities brokerage | 99.03 | - | 99.03 | 99.03 | - | 99.03 | 99.03 | - | 99.03 | |||
| Santander S.A. Sociedad Securitizadora | Purchase of credits and issuance of debt instruments | 99.64 | - | 99.64 | 99.64 | - | 99.64 | 99.64 | - | 99.64 | |||
| Santander Servicios de Recaudación y Pagos Limitada | Support society, making and receiving payments | 99.90 | 0.10 | 100.00 | 99.90 | 0.10 | 100.00 | 99.90 | 0.10 | 100.00 | |||
Percent ownership share As of December 31, | ||||||||||
2015 | 2014 | 2013 | ||||||||
Name of the Subsidiary | Main activity | Direct | Indirect | Total | Direct | Indirect | Total | Direct | Indirect | Total |
| % | % | % | % | % | % | % | % | % | ||
| Santander Corredora de Seguros Limitada | Insurance brokerage | 99.75 | 0.01 | 99.76 | 99.75 | 0.01 | 99.76 | 99.75 | 0.01 | 99.76 |
| Santander Corredores de Bolsa Limitada(*) | Financial instruments brokerage | 50.59 | 0.41 | 51.00 | 50.59 | 0.41 | 51.00 | 50.59 | 0.41 | 51.00 |
| Santander Agente de Valores Limitada | Securities brokerage | 99.03 | - | 99.03 | 99.03 | – | 99.03 | 99.03 | – | 99.03 |
| Santander S.A. Sociedad Securitizadora | Purchase of credits and issuance of debt instruments | 99.64 | - | 99.64 | 99.64 | – | 99.64 | 99.64 | – | 99.64 |
| Santander Servicios de Recaudación y Pagos Limitada (**) | Support society, making and receiving payments | - | - | - | – | – | – | 99.90 | 0.10 | 100.00 |
| (*) | On June 19, 2015, Santander Corredores de Bolsa Limitada, our stock brokerage company changed its corporate structure to that of a limited liability company. |
(*)Santander Asset Management S.A. Administradora General de Fondos was sold in December 2013, see Note 03 - Significant events to the Audited Consolidated Financial Statements.
| (**) | From May 1, 2014, this entity was absorbed by the Bank, with authorization for this transaction obtained from the SBIF on March 26, 2014. |
The following companies have been consolidated based on the determination that they are controlled by the Bank, has control as described in note 10 to the Audited Consolidated Financial Statements and in accordance with IFRS 10Consolidated Financial Statements:Statements:
| Santander Gestión de Recaudación y Cobranza Limitada (collection services) |
| Bansa Santander S.A. (management of repossessed assets and leasing of properties) |
During 2015, Multinegocios S.A. (management of sales force), Servicios Administrativos y Financieros Limitada (management of sales force) and Multiservicios de Negocios Limitada (call center) have ceased rendering sales services to the Bank and the Bank no longer controls their relevant activities. Therefore as of June 30, 2015, these entities have not been consolidated. As of August 1, 2014, Servicios de Cobranza Fiscalex Limitada was absorbed by Santander Gestión de Recaudación y Cobranza Limitada.
Competition
Overview
The Chilean financial services market consists of a variety of largely distinct sectors. The most important sector, commercial banking, includes a number of privately-owned banks and one public–sector bank, Banco del Estado de Chile (which operates within the same legal and regulatory framework as the private sector banks). The private-sector banks include local banks and a number of foreign-owned banks operating in Chile. The Chilean banking system is
comprised of 24 banks, including one public-sector bank. The fivefour largest banks accounted for 72.5%64.2% of all outstanding loans by Chilean financial institutions as of December 31, 20132015 (excluding Corpbanca’s subsidiary in Colombia)assets held abroad by Chilean banks).
The Chilean banking system has experienced increased competition in recent years, largely due to consolidation in the industry and new legislation. We also face competition from non-bank and non-finance competitors, principally department stores, credit unions and cajas de compensación with respect to some of our credit products, such as credit cards, consumer loans and insurance brokerage. In addition, we face competition from non–bank finance competitors, such as leasing, factoring and automobile finance companies, with respect to credit products, and mutual funds, pension funds and insurance companies, with respect to savings products. Currently, banks continue to be the main suppliers of leasing, factoring and mutual funds, and the insurance sales business has grown rapidly.
All the competition data in the following sections is based on Chilean Bank GAAP.
The following tables set out certain statistics comparing our market position to that of our peer group, defined as the five largest banks in Chile in terms of total loans as of December 31, 2013.2015 (excluding assets held by Chilean banks abroad).
As of December 31, 2013, | ||
Market Share | Rank | |
| Commercial loans | 17.4% | 2 |
| Consumer loans | 24.6% | 1 |
| Residential mortgage loans | 20.7% | 1 |
| Total loans(1) | 19.1% | 2 |
| Deposits | 16.6% | 3 |
| Credit card accounts | 27.5% | 1 |
| Checking accounts | 23.3% | 2 |
| Branches(3) | 18.9% | 1 |
As of December 31, 2015, | ||
Market Share | Rank | |
| Commercial loans | 17.2% | 2 |
| Consumer loans | 23.3% | 1 |
| Residential mortgage loans | 21.5% | 1 |
| Total loans | 19.1% | 1 |
| Deposits | 18.4% | 1 |
| Credit card issued | 15.4% | 3 |
| Checking accounts | 20.1% | 3 |
| Branches | 20.2% | 1 |
Source: SBIF excludes Corpbanca Colombia.
Loans
As of December 31, 2013,2015, our loan portfolio was the second-largestlargest among Chilean banks. Our loan portfolio, on a stand–alone basisincluding interbank loans, represented 19.1% of the market for loans in the Chilean financial system as of such date. The following table sets forth our and our peer group’s market shares in terms of loans (excluding Corpbanca Colombia)assets held by Chilean banks abroad).
As of December 31, 2013 | |||
Loans | Ch$ million | U.S.$ million | Market |
| Santander-Chile | 21,060,761 | 40,177 | 19.1% |
| Banco de Chile | 21,332,278 | 40,695 | 19.3% |
| Banco del Estado | 15,024,048 | 28,661 | 13.6% |
| Banco de Crédito e Inversiones | 14,529,713 | 27,718 | 13.2% |
| Corpbanca | 7,972,440 | 15,209 | 7.2% |
| BBVA, Chile | 7,588,852 | 14,477 | 6.9% |
| Others | 22,742,617 | 43,385 | 20.6% |
| Chilean financial system | 110,250,709 | 210,322 | 100.0% |
| As of December 31, 2015 | ||||||||||||
| Loans | Ch$ million | U.S.$ million | Market Share | |||||||||
| Santander-Chile | 25,300,757 | $ | 35,746 | 19.1 | % | |||||||
| Banco de Chile | 24,953,505 | $ | 35,255 | 18.8 | % | |||||||
| Banco del Estado de Chile | 18,349,962 | $ | 25,925 | 13.8 | % | |||||||
| Banco de Crédito e Inversiones | 16,610,278 | $ | 23,467 | 12.5 | % | |||||||
| Corpbanca | 9,049,012 | $ | 12,785 | 6.8 | % | |||||||
| BBVA, Chile | 9,030,380 | $ | 12,758 | 6.8 | % | |||||||
| Others | 29,371,427 | $ | 41,497 | 22.2 | % | |||||||
| Chilean financial system | 132,665,321 | $ | 187,433 | 100.0 | % | |||||||
Source: SBIF.SBIF
Deposits
On a stand-alone basis, weWe had a 16.6%18.4% market share in deposits, ranking thirdfirst among banks in Chile as of December 31, 2013.2015. Deposit market share is based on total time and demand deposits as of the respective dates. The following table sets forth our and our peer group’s market shares in terms of deposits (excluding Corpbanca Colombia)assets held by Chilean banks abroad).
As of December 31, 2013 | |||
Deposits | Ch$ million | U.S.$ million | Market Share |
| Santander-Chile | 15,296,035 | 29,180 | 16.6% |
| Banco del Estado | 18,369,535 | 35,043 | 19.9% |
| Banco de Chile | 16,387,057 | 31,261 | 17.8% |
| Banco de Crédito e Inversiones | 11,628,315 | 22,183 | 12.6% |
| BBVA, Chile | 5,912,767 | 11,280 | 6.4% |
| Corpbanca | 5,759,167 | 10,987 | 6.3% |
| Others | 18,768,859 | 35,805 | 20.4% |
| Chilean financial system | 92,121,735 | 175,738 | 100.0% |
| As of December 31, 2015 | ||||||||||||
| Deposits | Ch$ million | U.S.$ million | Market Share | |||||||||
| Santander-Chile | 19,538,888 | $ | 27,605 | 18.4 | % | |||||||
| Banco de Chile | 18,234,740 | $ | 25,763 | 17.1 | % | |||||||
| Banco del Estado de Chile | 19,155,750 | $ | 27,064 | 18.0 | % | |||||||
| Banco de Crédito e Inversiones | 13,256,952 | $ | 18,730 | 12.5 | % | |||||||
| Corpbanca | 6,908,722 | $ | 9,761 | 6.5 | % | |||||||
| BBVA, Chile | 6,689,730 | $ | 9,451 | 6.3 | % | |||||||
| Others | 22,541,487 | $ | 31,847 | 21.2 | % | |||||||
| Chilean financial system | 106,326,269 | $ | 150,221 | 100.0 | % | |||||||
Source: SBIF. Information as of Dec. 2015, except for information for Banco de Crédito e Inversiones, which is as of Nov. 2015 due to incorrect figures published by the SBIF for Banco de Crédito e Inversiones for Dec. 2015.
Total equity
With Ch$2,354,1822,764,880 million (U.S.$4,4913,906 million) in equity in Chilean Bank GAAP as of December 31, 2013,2015, we were the largest commercial bank in Chile in terms of shareholders’ equity. The following table sets forth our and our peer group’s shareholders’ equity.
As of December 31, 2013 | |||
Total Equity | Ch$ million | U.S.$ million | Market Share |
| Santander-Chile | 2,354,182 | 4,491 | 18.2% |
| Banco de Chile | 2,284,316 | 4,358 | 17.7% |
| Banco del Estado | 1,082,294 | 2,065 | 8.4% |
| Banco de Crédito e Inversiones | 1,582,100 | 3,018 | 12.3% |
| Corpbanca | 1,717,039 | 3,276 | 13.3% |
| BBVA, Chile | 666,730 | 1,272 | 5.2% |
| Others | 3,215,015 | 6,133 | 24.9% |
| Chilean financial system | 12,901,676 | 24,613 | 100.0% |
| As of December 31, 2015 | ||||||||||||
| Total Equity | Ch$ million | U.S.$ million | Market Share | |||||||||
| Santander-Chile | 2,764,880 | 3,906 | 17.9 | % | ||||||||
| Banco de Chile | 2,740,087 | 3,871 | 17.8 | % | ||||||||
| Banco del Estado de Chile | 1,493,967 | 2,111 | 9.7 | % | ||||||||
| Banco de Crédito e Inversiones | 2,000,525 | 2,826 | 13.0 | % | ||||||||
| Corpbanca | 1,497,579 | 2,116 | 9.7 | % | ||||||||
| BBVA, Chile | 766,384 | 1,083 | 5.0 | % | ||||||||
| Others | 4,149,232 | 5,862 | 26.9 | % | ||||||||
| Chilean financial system | 15,412,654 | 21,775 | 100.0 | % | ||||||||
Source: SBIF.
Efficiency
As of December 31, 2013,2015, we were the most efficient bank in our peer group. The following table sets forth our and our peer group’s efficiency ratio (defined as operating expenses as a percentage of operating revenue, which is the aggregate of net interest income, fees and income from services (net), net gains from mark–to–market and trading, exchange differences (net) and other operating income (net)) in 2013.2015.
Efficiency ratio as defined by the SBIF | As of |
| Santander-Chile | |
| Banco de Chile | |
| Banco del Estado de Chile | |
| Banco de Crédito e Inversiones | |
| BBVA, Chile | |
| Corpbanca | |
| Chilean financial system |
Source: SBIF.
Net income for the period attributable to shareholdersequity holders
In 2013,2015, we were the second largest bank in Chile in terms of net income attributable to shareholders of Ch$444,061448,878 million (U.S.$847634 million) measured under Chilean Bank GAAP. The following table sets forth our and our peer group’s net income.
As of December 31, 2013 | |||
Net income for the year (1) | Ch$ million | U.S.$ million | Market Share |
| Santander-Chile | 444,061 | 847 | 23.2% |
| Banco de Chile | 513,603 | 980 | 26.8% |
| Banco de Crédito e Inversiones | 300,294 | 573 | 15.7% |
| Corpbanca | 167,910 | 320 | 8.8% |
| BBVA, Chile | 50,474 | 96 | 2.6% |
| Banco del Estado | 115,356 | 220 | 6.0% |
| Others | 324,294 | 619 | 16.9% |
| Chilean financial system | 1,915,992 | 3,655 | 100.0% |
| As of December 31, 2015 | ||||||||||||
| Net income attributable to equity holders | Ch$ million | U.S.$ million | Market Share | |||||||||
| Santander-Chile | 448,878 | 634 | 20.9 | % | ||||||||
| Banco de Chile | 558,995 | 790 | 26.1 | % | ||||||||
| Banco de Crédito e Inversiones | 330,819 | 467 | 15.4 | % | ||||||||
| Corpbanca | 201,771 | 285 | 9.4 | % | ||||||||
| BBVA, Chile | 89,063 | 126 | 4.2 | % | ||||||||
| Banco del Estado de Chile | 112,583 | 159 | 5.3 | % | ||||||||
| Others | 401,600 | 567 | 18.7 | % | ||||||||
| Chilean financial system | 2,143,709 | 3,028 | 100.0 | % | ||||||||
Source: SBIF.
Return on equity
As of December 31, 2013,2015, we were the third most profitable bank in our peer group (as measured by return on period-end equity under Chilean Bank GAAP) and the most capitalized bank as measured by the Chilean BIS ratio. The following table sets forth our and our peer group’s return on average equity and BIS ratio.
Return on period-end | BIS Ratio as of | |
| Santander-Chile | 18.9% | 13.8% |
| Banco de Chile | 22.5% | 13.1% |
| Banco del Estado | 10.7% | 11.3% |
| Banco de Crédito e Inversiones | 19.0% | 13.4% |
| BBVA, Chile | 7.6% | 11.9% |
| Corpbanca | 9.8% | 13.2% |
| Chilean Financial System | 14.9% | 12.8% |
Return on period-end equity as of December 31, 2015 | BIS Ratio as of December 31, 2015 | |
| Santander-Chile | 16.4% | 13.4% |
| Banco de Chile | 20.4% | 12.6% |
| Banco del Estado de Chile | 8.2% | 11.7% |
| Banco de Crédito e Inversiones | 16.5% | 12.0% |
| BBVA, Chile | 11.6% | 11.5% |
| Corpbanca | 15.0% | 9.5% |
| Chilean Financial System | 14.2% | 12.6% |
Source: SBIF.
Asset Quality
As of December 31, 2013,2015, we had the second-highest non-performing loan to loan ratio in our peer group. The following table sets forth our and our peer group’s non-performing loan ratio as defined by the SBIF as of December 31, 2013.2015.
Non-performing loans / total | |
| Santander-Chile | |
| Banco de Chile | |
| Banco del Estado de Chile | |
| Banco de Crédito e Inversiones | |
| BBVA, Chile | |
| Corpbanca | |
| Chilean financial system |
Source: SBIF.
| (1) |
Regulation and Supervision
General
In Chile, only banks may maintain checking accounts for their customers, conduct foreign trade operations, and, together with non-banking financial institutions, accept time deposits. The principal authorities that regulate financial institutions in Chile are the SBIF and the Central Bank. Chilean banks are primarily subject to the General Banking Law, and secondarily subject, to the extent not inconsistent with this statute, the provisions of the Chilean Companies Law governing public corporations, except for certain provisions which are expressly excluded.
The modern Chilean banking system dates from 1925 and has been characterized by periods of substantial regulation and state intervention, as well as periods of deregulation. The most recent period of deregulation commenced in 1975 and culminated in the adoption of a series of amendments to General Banking Law. That law, amended most recently in 2001, granted additional powers to banks, including general underwriting powers for new issues of certain debt and equity securities and the power to create subsidiaries to engage in activities related to banking, such as brokerage, investment advisory and mutual fund services, administration of investment funds, factoring, securitization products and financial leasing services.
The Central Bank
The Central Bank is an autonomous legal entity created by the Chilean Constitution. It is subject to the Chilean Constitution and its ownley orgánica constitucional, or organic constitutional law. To the extent not inconsistent with the Chilean Constitution or the Central Bank’s organic constitutional law, the Central Bank is also subject to private sector laws (but in no event is it subject to the laws applicable to the public sector). It is directed and administered by a Board of Directors composed of five members designated by the President of Chile, subject to the approval of the Chilean Senate.
The legal purpose of the Central Bank is to maintain the stability of the Chilean peso and the orderly functioning of Chile’s internal and external payment systems. The Central Bank’s powers include setting reserve requirements, regulating the amount of money and credit in circulation, establishing regulations and guidelines regarding finance companies, foreign exchange (including the Formal Exchange Market) and banks’ deposit-taking activities.
The SBIF
Banks are supervised and controlled by the SBIF, an independent Chilean governmental agency. The SBIF authorizes the creation of new banks and has broad powers to interpret and enforce legal and regulatory requirements applicable to banks and financial companies. Furthermore, in cases of noncompliance with such legal and regulatory requirements, the SBIF has the ability to impose sanctions. In extreme cases, it can appoint, with the
prior approval of the Board of Directors of the Central Bank, a provisional administrator to manage a bank. It must also approve any amendment to a bank’s by-laws or any increase in its capital.
The SBIF examines all banks from time to time, generally at least once a year. Banks are also required to submit their financial statements monthly to the SBIF, and a bank’s financial statements are published at least four times a year in a newspaper with countrywide coverage. In addition, banks are required to provide extensive information regarding their operations at various periodic intervals to the SBIF. A bank’s annual financial statements and the opinion of its independent auditors must also be submitted to the SBIF.
Any person wishing to acquire, directly or indirectly, 10.0% or more of the share capital of a bank must obtain the prior approval of the SBIF. Absent such approval, the acquiroracquirer of shares so acquired will not have the right to vote. The SBIF may only refuse to grant its approval, based on specific grounds set forth in the General Banking Law.
According to Article 35bis of the General Banking Law, the prior authorization of the SBIF is required for:
| · | the merger of two or more banks; |
| · | the acquisition of all or a substantial portion of a bank’s assets and liabilities by another bank; |
| · | the control by the same person, or controlling group, of two or more banks; or |
| · | a substantial increase in the existing control of a bank by a controlling shareholder of that bank. |
Such prior authorization is required solely when the acquiring bank or the resulting group of banks would own a significant market share in loans, defined by the SBIF to be more than 15.0% of all loans in the Chilean banking system. The intended purchase, merger or expansion may be denied by the SBIF; or, if the acquiring bank or resulting group would own a market share in loans determined to be more than 20.0% of all loans in the Chilean banking system, the purchase, merger or expansion may be conditioned on one or more of the following:
| · | that the bank or banks maintain regulatory capital higher than 8.0% and up to 14.0% of their risk-weighted assets; |
| · | that the technical reserve established in Article 65 of the General Banking Law be applicable when deposits exceed one and a half times the resulting bank’s paid-in capital and reserves; or |
| · | that the margin for interbank loans be reduced to 20.0% of the resulting bank’s regulatory capital. |
If the acquiring bank or resulting group would own a market share in loans determined by the SBIF to be more than 15% but less than 20%, the authorization will be conditioned on the bank or banks maintaining a regulatory capital not lower than 10% of their risks-weighted assets for the period specified by the SBIF, which may not be less than one year. The calculation of the risk-weighted assets is based on a five-category risk classification system applied to a bank’s assets that is based on the Basel Committee recommendations.
Pursuant to the regulations of the SBIF, the following ownership disclosures are required:
| · | a bank is required to inform the SBIF of the identity of any person owning, directly or indirectly, 5.0% or more of such banks’ shares; |
| · | holders of ADSs must disclose to the Depositary the identity of beneficial owners of ADSs registered under such holders’ names; |
| · | the Depositary is required to notify the bank as to the identity of beneficial owners of ADSs which such Depositary has registered and the bank, in turn, is required to notify the SBIF as to the identity of the beneficial owners of the ADSs representing 5.0% or more of such banks’ shares; and |
| · | bank shareholders who individually hold 10.0% or more of a bank’s capital stock and who are controlling shareholders must periodically inform the SBIF of their financial condition. |
Limitations on Types of Activities
Chilean banks can only conduct those activities allowed by the General Banking Law: making loans, accepting deposits and, subject to limitations, making investments and performing financial services. Investments are restricted to real estate for the bank’s own use, gold, foreign exchange and debt securities. Through subsidiaries, banks may also engage in other specific financial service activities such as securities brokerage services, equity investments, securities, mutual fund management, investment fund management, financial advisory and leasing activities. Subject to specific limitations and the prior approval of the SBIF and the Central Bank, Chilean banks may own majority or non-controlling interests in foreign banks.
Since June 1, 2002, Chilean banks are allowed to offer a new checking account product that pays interest. The SBIF also stated that these accounts may be subject to minimum balance limits and different interest rates depending on average balances held in the account and that banks may also charge fees for the use of this new product. For banks with a solvency score of less than A, the Central Bank has also imposed additional caps to the interest rate that can be paid.
On June 5, 2007, pursuant to Law 20.190, new regulations became effective authorizing banks to enter into transactions involving a wider range of derivatives, such as futures, options, swaps, forwards and other derivative
instruments or contracts subject to specific limitations established by the Central Bank of Chile. Previously, banks were able to enter into transactions involving derivatives, but subject to more restrictive guidelines.
Deposit Insurance
The Chilean government guarantees up to 90.0% of the principal amount of certain time and demand deposits and savings accounts held by natural persons with a maximum value of UF120 per person (Ch$2,797,1473,075,490 or U.S.$5,3364,345 as of December 31, 2013)2015) per calendar year in the entire financial system.
Reserve Requirements
Deposits are subject to a reserve requirement of 9.0% for demand deposits and 3.6% for time deposits (with terms of less than one year). For purposes of calculating the reserve obligation, banks are authorized to deduct daily from their foreign currency denominated liabilities, the balance in foreign currency of certain loans and financial investments held outside of Chile, the most relevant of which include:
| · | cash clearance account, which should be deducted from demand deposit for calculating reserve requirement; |
| · | certain payment orders issued by pension providers; and |
| · | the amount set aside for “technical reserve” (as described below), which can be deducted from reserve requirement. |
The Central Bank has statutory authority to require banks to maintain reserves of up to an average of 40.0% for demand deposits and up to 20.0% for time deposits (irrespective, in each case, of the currency in which they are denominated) to implement monetary policy. In addition, to the extent that the aggregate amount of the following types of liabilities exceeds 2.5 times the amount of a bank’s regulatory capital, a bank must maintain a 100% “technical reserve” against them: demand deposits, deposits in checking accounts, or obligations payable on sight incurred in the ordinary course of business, and in general all deposits unconditionally payable immediately but excluding interbank demand deposits.
Minimum Capital
Under the General Banking Law, a bank is required to have a minimum of UF800,000 (approximately Ch$18,64820,503,272 million or U.S.$35.628.9 million as of December 31, 2013)2015) of paid-in capital and reserves, calculated in accordance with Chilean GAAP, regulatory capital of at least 8% of its risk weighted assets, net of required allowances, and paid in capital and reserves of at least 3% of its total assets, net of required allowances.allowances, as calculated in accordance with Chilean GAAP.
Regulatory capital is defined as the aggregate of:
• a bank’s paid-in capital and reserves, excluding capital attributable to subsidiaries and foreign branches orcapital básico;
| · | a bank’s paid-in capital and reserves, excluding capital attributable to subsidiaries and foreign branches orcapital básico; |
• its subordinated bonds, valued at their placement price (but decreasing by 20.0% for each year during the period commencing six years prior to maturity), for an amount up to 50.0% of its basic capital; and
| · | its subordinated bonds, valued at their placement price (but decreasing by 20.0% for each year during the period commencing six years prior to maturity), for an amount up to 50.0% of its basic capital; and |
• its voluntary allowances for loan losses for an amount of up to 1.25% of risk weighted-assets.
| · | its voluntary allowances for loan losses for an amount of up to 1.25% of risk weighted-assets. |
Capital Adequacy Requirements
According to the General Banking Law, each bank should have regulatory capital of at least 8.0% of its risk-weighted assets, net of required allowances. The calculation of risk weighted assets is based on a five-category risk classification system for bank assets that is based on the Basel Committee recommendations. The SBIF is expected to implement in 2014 or 20152016 the application of the third pillar of Basel IIIII capital standards in Chile, which will includes the implementation of capital limits with market risk and operational risk-weighted assets. These changes must be approved by the Chilean Congress, as it involves a modification to the General Banking Law.
Banks should also havecapital básico, or basic capital, of at least 3.0% of their total assets, net of allowances. Basic capital is defined to include shareholders’ equity.
Within the scope of Basel IIIII in Chile, further changes in regulation may occur. See “Item 3. Key Information—D. Risk Factors—Risks Relating to Chile—Banking regulations may restrict our operations and thereby adversely affect our financial condition and results of operations.”
Lending Limits
Under the General Banking Law, Chilean banks are subject to certain lending limits, including the following material limits:
| · | A bank may not extend to any entity or individual (or any one group of related entities), except for another financial institution, directly or indirectly, unsecured credit in an amount that exceeds 10.0% of the bank’s regulatory capital, or in an amount that exceeds 30.0% of its regulatory capital if the excess over 10.0% is secured by certain assets with a value equal to or higher than such excess. These limits were raised from 5.0% and 25.0%, respectively, in 2007 by theReformas al Mercado de Capitales II (also known as MK2). In the case of financing infrastructure projects built by government concession, the 10.0% ceiling for unsecured credits is raised to 15.0% if secured by a pledge over the concession, or if granted by two or more banks or finance companies which have executed a credit agreement with the builder or holder of the concession; |
| · | a bank may not extend loans to another financial institution subject to the General Banking Law in an aggregate amount exceeding 30.0% of its regulatory capital; |
| · | a bank may not directly or indirectly grant a loan whose purpose is to allow an individual or entity to acquire shares of the lender bank; |
| · | a bank may not lend, directly or indirectly, to a director or any other person who has the power to act on behalf of the bank; and |
| · | a bank may not grant loans to related parties (including holders of more than 1.0% of its shares) on more favorable terms than those generally offered to non-related parties. Loans granted to related parties are subject to the limitations described in the first bullet point above. In addition, the aggregate amount of loans to related parties may not exceed a bank’s regulatory capital. |
In addition, the General Banking Law limits the aggregate amount of loans that a bank may grant to its employees to 1.5% of its regulatory capital, and provides that no individual employee may receive loans in excess of 10.0% of this 1.5% limit. Notwithstanding these limitations, a bank may grant to each of its employees a single residential mortgage loan for personal use once during such employee’s term of employment.
Allowance for Loan Losses
Chilean banks are required to provide to the SBIF detailed information regarding their loan portfolio on a monthly basis. The SBIF examines and evaluates each financial institution’s credit management process, including its compliance with the loan classification guidelines. Banks are classified into four categories: 1, 2, 3 and 4. Each bank’s category depends on the models and methods used by the bank to classify its loan portfolio, as determined by the SBIF. Category 1 banks are those banks whose methods and models are satisfactory to the SBIF. Category 1 banks will be entitled to continue using the same methods and models they currently have in place. A bank classified as a category 2 bank will have to maintain the minimum levels of reserves established by the SBIF while its Board of Directors will be made aware of the problems detected by the SBIF and required to take steps to correct them. Banks classified as categories 3 and 4 will have to maintain the minimum levels of reserves established by the SBIF until they are authorized by the SBIF to do otherwise. Santander-Chile is categorized as a “Category 1” bank.
Differences between IFRS and Chilean Bank GAAP
As stated above, Chilean Bank GAAP, as prescribed by theCompendium of Accounting Standards(the “Compendium”), differs in certain respects from IFRS. The main differences that should be considered by an investor are the following:
Suspension of Income Recognition on Accrual Basis
In accordance with the Compendium, financial institutions must suspend recognition of income on an accrual basis in their statements of income for certain loans included in the impaired portfolio. IFRS does not allow the suspension of accrual of interest on financial assets for which an impairment loss has been determined. We do not believe that this difference materially impacts our financial statements.
Charge-offs and Accounts Receivable
The Compendium requires companies to establish deadlines for the charge-off of loans and accounts receivable. IFRS does not require any such deadline for charge-offs. A detailed descriptioncharge-off due to impairment would be recorded, if and only if, all efforts at collection of the modelsloan or account receivable had been exhausted. We do not believe that this difference materially impacts our financial statements.
Assets Received in Lieu of Payment
The Compendium requires that the initial value of assets received in lieu of payment be the value agreed upon with a debtor as a result of the loan settlement or the value awarded in an auction, as applicable. These assets are required to be written off one year after their acquisition, if the assets have not been previously disposed of. IFRS requires that assets received in lieu of payment be initially accounted for at fair value. Subsequently, asset valuation depends on the classification provided by the entity for that type of asset. No deadline is established for determiningcharging-off an asset.
Goodwill and Intangible Assets
With respect to goodwill and intangible assets, the Compendium provides that:
| · | The value of “goodwill” and other depreciable intangible assets will be supported by two reports issued by specialists independent from the (i) bank, (ii) the bank’s external auditors, and (iii) each other. |
With respect to goodwill and intangible assets, IFRS provides that:
| · | The use of independent experts’ valuations is not mandatory. |
Since we have no goodwill, we do not believe that this difference impacts our financial statements.
Fair Value Option with Respect to Financial Assets and Liabilities
According to the Compendium, banks are not allowed to value assets or liabilities at their fair value in place of the amortized cost method.
IFRS allows an entity to designate a financial asset or liability (or a group of financial assets or liabilities, or both), on initial recognition as one to be measured at fair value, with changes in fair value to be recognized in profit or loss. Once this option has been taken, it is irrevocable. The fair value option is not applicable to investments in capital instruments which do not have a quoted market price in an active market, and whose fair value cannot be reliably measured.
We do not believe that this difference impacts our financial statements because this accounting treatment is optional.
Loan loss allowances
The main difference between Chilean bank GAAP and IFRS regarding loan loss allowances is set forththat under Chilean Bank GAAP, we use an expected loss model, and under IFRS, we use an incurred loss approach. Additionally, Chilean Bank GAAP includes the following norms, which are not included in “Item 5. Operating and Financial Review and Prospects—F. Selected Statistical Information—Classification of Loan Portfolio” and in “Note 1—Summary of Significant Accounting Policies” of our Audited Consolidated Financial Statements.IFRS loan loss allowance:
On December 29, 2009, the SBIF issued Circular No. 3,489, which incorporates changes to several provisions of the Compendium. Among other changes, it states that effective January 2010, companies must complement the basis on which insolvency provisions related to contingent operations are determined, including unrestricted lines of credit, other contingent loans, and other loan commitments. In addition, companies should also apply the changes in risk exposure applicable to contingent loans, found in Chapter B-3 of the Compendium. According to specific instructions from the SBIF in Letter to Management No. 10 dated December 21, 2010, the SBIF stated that it would not be necessary to calculate the adjustment retrospectively for 2009. On June 10, 2010, the SBIF issued Circular No. 3,502 which, among other things, requires that Banks maintain a 0.5% minimum provision for the non-impaired part of the loan portfolio analyzed on an individual basis. In addition, on December 21, 2010, in the Letter to Management No. 9, the SBIF specified that the accounting treatment for the effects originating from the application of this minimum provision is to record it in the income for the period. However, the Bank reverses this minimum provision for purposes of its IFRS consolidated financial statements.
On August 12, 2010, Circular No. 3,503 was issued, which modified how we must classify loans included in Chapters B-1, B-2, B-3 and C1 of the Compendium of Accounting Standards, which are loans analyzed on an individual basis. Such modifications were effective from January 1, 2011, except for those modifications relating to additional provisions included in the Letter to Management No. 9 relating to Chapter B-1 which took effect in 2010. As a supplement to the Circular, the Letter to Management No. 9 was issued on December 21, 2010, which specifies that adjustments resulting from the adoption of these modifications starting on January 1, 2011 could be recorded during the first quarter of 2011; however, entities may anticipate recognition of the impact of these adjustments, in whole or in part, in 2010. As of December 31, 2010, we have chosen to recognize the entire provision adjustments aforementioned.
On December 30, 2014, the SBIF published new guidelines for provisioning a bank’s residential mortgage loan portfolio. The regulations include:
| · | an expected loss model to calculate allowances for housing mortgage loans that explicitly considers loan delinquency and loan / collateral (LTV) ratios, in order to promote active management of credit risk; and |
| · | proposal for a new way of |
These above changes have been implemented in 2016. We also expect the SBIF in 2016 to publish new expected loss models for consumer and commercial loans assessed on a group basis.
Capital Markets
Under the General Banking Law, banks in Chile may purchase, sell, place, underwrite and act as paying agents with respect to certain debt securities. Likewise, banks in Chile may place and underwrite certain equity securities. Bank subsidiaries may also engage in debt placement and dealing, equity issuance advice and securities brokerage, as well as in financial leasing, mutual fund and investment fund administration, investment advisory services and
merger and acquisition services. These subsidiaries are regulated by the SBIF and, in some cases, also by the Superintendency of Securities and Insurance, the regulator of the Chilean securities market, open-stock corporations and insurance companies.
Legal Provisions Regarding Banking Institutions with Economic Difficulties
The General Banking Law provides that if specified adverse circumstances exist at any bank, its Board of Directors must correct the situation within 30 days from the date of receipt of the relevant financial statements. If the Board of Directors is unable to do so, it must call a special shareholders’ meeting to increase the capital of the bank by the amount necessary to return the bank to financial stability. If the shareholders reject the capital increase, or if it is not effected within the term and in the manner agreed to at the meeting, or if the SBIF does not approve the Board of Directors’ proposal, the bank will be barred from increasing its loan portfolio beyond that stated in the financial statements presented to the Board of Directors and from making any further investments in any instrument other than in instruments issued by the Central Bank. In such a case, or in the event that a bank is unable to make timely payment in respect of its obligations, or if a bank is under provisional administration of the SBIF, the General Banking Law provides that the bank may receive a two-year term loan from another bank. The terms and conditions of such a loan must be approved by the directors of both banks, as well as by the SBIF, but need not be submitted to the borrowing bank’s shareholders for their approval. In any event, a creditor bank cannot grant interbank loans to an insolvent bank in an amount exceeding 25.0% of the creditor bank’s regulatory capital. The Board of Directors of a bank that is unable to make timely payment of its obligations must present a reorganization plan to its creditors in order to capitalize the credits, extend their respective terms, condone debts or take other measures for the payment of the debts. If the Board of Directors of a bank submits a reorganization plan to its creditors and such arrangement is approved, all subordinated debt issued by the bank, whether or not matured, will be converted by operation of law into common stock in the amount required for the ratio of regulatory capital to risk-weighted assets to be not lower than 12.0%. If a bank fails to pay an obligation, it must notify the SBIF, which shall determine if the bank is solvent.
Compendium of Accounting Standards(the “Compendium”), differs in certain respects from IFRS. The main differences that should be considered by an investor are the following:
Dissolution
Suspension of Income Recognition on Accrual Basis
In accordance with the Compendium, financial institutions must suspend recognition of income on an accrual basis in their statements of income for certain loans included in the impaired portfolio. IFRS does not allow the suspension of accrual of interest on financial assets for which an impairment loss has been determined. We do not believe that this difference materially impacts our financial statements.
Charge-offs and Liquidation of BanksAccounts Receivable
The SBIF mayCompendium requires companies to establish that a bank should be liquidateddeadlines for the benefitcharge-off of its depositors or other creditors when such bankloans and accounts receivable. IFRS does not haverequire any such deadline for charge-offs. A charge-off due to impairment would be recorded, if and only if, all efforts at collection of the necessary solvency to continue its operations. In such case,loan or account receivable had been exhausted. We do not believe that this difference materially impacts our financial statements.
Assets Received in Lieu of Payment
The Compendium requires that the SBIF must revoke a bank’s authorization to exist and order its mandatory liquidation, subject to agreement by the Central Bank. The SBIF must also revoke a bank’s authorization if the reorganization planinitial value of such bank has been rejected twice. The resolution by the SBIF must state the reason for ordering the liquidation and must name a liquidator, unless the SBIF assumes this responsibility. When a liquidation is declared, all checking accounts and other demand depositsassets received in lieu of payment be the ordinary coursevalue agreed upon with a debtor as a result of business,the loan settlement or the value awarded in an auction, as applicable. These assets are required to be paidwritten off one year after their acquisition, if the assets have not been previously disposed of. IFRS requires that assets received in lieu of payment be initially accounted for at fair value. Subsequently, asset valuation depends on the classification provided by using existing fundsthe entity for that type of the bank, its deposits with the Central Bank or its investments in instruments that represent its reserves. If these funds are insufficient to pay these obligations, the liquidator may seize the rest of the bank’s assets, as needed. If necessary and in specified circumstances, the Central Bank will lend the bank the funds necessary to pay these obligations. Any such loans are preferential to any claims of other creditors of the liquidated bank.asset. No deadline is established for charging-off an asset.
Obligations Denominated in Foreign CurrenciesGoodwill and Intangible Assets
Santander-Chile must also comply with various regulatoryWith respect to goodwill and internal limits regarding exposure to movements in foreign exchange rates (See “Item 11. Quantitative and Qualitative Disclosures About Market Risk”).intangible assets, the Compendium provides that:
Loans and Investments in Foreign Securities
Under current Chilean banking regulations, banks in Chile may grant loans to foreign individuals and entities and invest in certain securities of foreign issuers. Banks may grant commercial loans and foreign trade loans, and can buy loans granted by banks abroad. Banks in Chile may also invest in debt securities traded in formal secondary markets. Such debt securities must be (1) securities issued or guaranteed by foreign sovereign states or their central banks or
| The value of |
other foreign or international financial entities, and (2) bonds issued by foreign companies. If the sum of investment in foreign securities and loans granted outside of Chile surpasses 70% of regulatory capital, the amount that exceeds 70% is subject to a mandatory reserve of 100%.
Table 1
|
|
|
In the event that the sum of: (a) loans granted abroad that are notWith respect to subsidiaries of Chilean companies,goodwill and that have a rating of BB- or less and do not trade on a foreign stock exchange, and (b) the investments in foreign securities which have a rating that is below that indicated in Table 1 above, but is equal to or exceeds the ratings mentioned in the Table 2 below and exceeds 20% (and 30% for banks with a BIS ratio equal or exceeding 10% of the regulatory capital of such bank), the excess is subject to a mandatory reserve of 100%.intangible assets, IFRS provides that:
Table 2
|
|
|
In addition,Since we have no goodwill, we do not believe that this difference impacts our financial statements.
Fair Value Option with Respect to Financial Assets and Liabilities
According to the Compendium, banks may investare not allowed to value assets or liabilities at their fair value in foreign securities whose ratings are equalplace of the amortized cost method.
IFRS allows an entity to designate a financial asset or exceeds those mentionedliability (or a group of financial assets or liabilities, or both), on initial recognition as one to be measured at fair value, with changes in Table 3 below for an additional amount equalfair value to 70% of their regulatory capital. This limit constitutes an additional margin andbe recognized in profit or loss. Once this option has been taken, it is irrevocable. The fair value option is not subjectapplicable to the 100% mandatory reserve.
Additionally, a Chilean bank may investinvestments in foreign securities whose rating is equal to or exceeds those mentioned in Table 3 below in: (i) sight deposits with foreign banks, including overnight deposits in a single entity; and (ii) securities issued or guaranteed by sovereign states or their central banks or securities issued or guaranteed by foreign entities within the Chilean State, though investment will be subject to the limits by issuer up to 30% and 50%, respectively, of the regulatory capital of the Chilean bank that makes the investment. If these foreign securitiesinstruments which do not have a rating, the individual limit willquoted market price in an active market, and whose fair value cannot be 10% of regulatory capital.
Table 3
|
|
|
Moreover, the sum of all demand deposits with foreign banks, including overnight deposits to related parties, as defined by the Central Bank and the SBIF, cannot surpass 25% of a bank’s regulatory capital. This limit excludes foreign branches of Chilean banks or their subsidiaries, but must include amounts deposited by these entities in related parties abroad.reliably measured.
Chilean banks may only invest in equity securities of foreign banks and certain other foreign companies which may be affiliates of the bank or which would be complementary to the bank’s business if such companies were incorporated in Chile.
New Regulations for “Mortgage Bonds”We do not believe that this difference impacts our financial statements because this accounting treatment is optional.
In 2012,Loan loss allowances
The main difference between Chilean bank GAAP and IFRS regarding loan loss allowances is that under Chilean Bank GAAP, we use an expected loss model, and under IFRS, we use an incurred loss approach. Additionally, Chilean Bank GAAP includes the mortgage-covered bond legislation was approved by the Chilean congress. The new class of bonds, known as “mortgage bonds,” are debt backed by the company that sells them, as well as by a pool of mortgages that in the event of insolvency the pool of mortgages are auctioned with the corresponding mortgage bond. Unlike covered bonds, theyfollowing norms, which are not be limited to banks. These bonds, if bought by banks, will be available for immediate liquidityincluded in the Central Bank liquidity window and will have other restrictions as to the type of mortgage they will be funding, i.e. mortgage loans with loan-to-values of maximum 80%.
U.S. Banking Regulation - Volcker Ruleour IFRS loan loss allowance:
On JulyDecember 29, 2009, the SBIF issued Circular No. 3,489, which incorporates changes to several provisions of the Compendium. Among other changes, it states that effective January 2010, companies must complement the basis on which insolvency provisions related to contingent operations are determined, including unrestricted lines of credit, other contingent loans, and other loan commitments. In addition, companies should also apply the changes in risk exposure applicable to contingent loans, found in Chapter B-3 of the Compendium. According to specific instructions from the SBIF in Letter to Management No. 10 dated December 21, 2010, the United States enactedSBIF stated that it would not be necessary to calculate the Dodd-Frank Wall Street Reform and Consumer Protection Act (the “Dodd-Frank Act”),adjustment retrospectively for 2009. On June 10, 2010, the SBIF issued Circular No. 3,502 which, providesamong other things, requires that Banks maintain a broad framework for significant regulatory changes that extend to almost every area of U.S. financial regulation. Within the Dodd-Frank Act, the Volcker Rule prohibits “banking entities” from engaging in certain forms of proprietary trading or from sponsoring or investing in certain covered funds, in each case subject to certain limited exceptions. The Volcker Rule became effective on July 21, 2012 and on December 10, 2013, U.S. regulators issued final rules implementing the Volcker Rule. The final rules also limit the ability of banking entities and their affiliates to enter into certain transactions with such funds with which they or their affiliates have certain relationships. The final rules contain exclusions and certain exemptions for market-making, hedging, underwriting, trading in U.S. government and agency obligations as well as certain foreign government obligations, trading solely outside the United States, and also permits certain ownership interests in certain types of funds to be retained. The final rules implementing the Volcker Rule extended the period for all banking entities to conform with the Volcker Rule and implement a compliance program until July 21, 2015, and additional extensions are possible. Banking entities such as Santander Spain must bring their activities and investments worldwide into compliance with the requirements of the Volcker Rule by the end of the conformance period. Santander Spain is assessing how the final rules implementing the Volcker Rule will affect its businesses, including Santander-Chile, and is developing and implementing plans to bring affected businesses into compliance.
U.S. Anti-Money Laundering, Anti-Terrorist Financing, and Foreign Corrupt Practices Act Regulations
The Bank, as a foreign private issuer whose securities are registered under the U.S. Securities Exchange Act of 1934, is subject to the U.S. Foreign Corrupt Practices Act (the “FCPA”). The FCPA generally prohibits such issuers and their directors, officers, employees and agents from using any means or instrumentality of U.S. interstate commerce in furtherance of any offer or payment of money to any foreign official or political party0.5% minimum provision for the purpose of influencing a decision of such person in order to obtain or retain business. It also requires that the issuer maintain books and records and a system of internal accounting controls sufficient to provide reasonable assurance that accountability of assets is maintained and accurate financial statements can be prepared. Penalties, fines and imprisonment of the Bank’s officers and/or directors can be imposed for violations of the FCPA.
Furthermore, the Bank is subject to a variety of U.S. anti-money laundering and anti-terrorist financing laws and regulations, such as the Bank Secrecy Act of 1970, as amended, and the USA PATRIOT ACT of 2001, as amended, and a violation of such laws and regulations may result in substantial penalties, fines and imprisonment of the Bank’s officers and/or directors.
Disclosure pursuant to Section 219 of the Iran Threat Reduction and Syria Human Rights Act
Santander-Chile has no exposure to Iran or Syria. As we are part of Grupo Santander, we must disclose the exposure of other entities of the Group to Iran and Syria.
Pursuant to Section 219 of the Iran Threat Reduction and Syria Human Rights Act of 2012, which added Section 13(r) to the Securities Exchange Act of 1934, as amended (the “Exchange Act”), an issuer is required to disclose in its annual or quarterly reports, as applicable, whether it or any of its affiliates knowingly engaged in certain activities, transactions or dealings relating to Iran or with individuals or entities designated pursuant to certain Executive Orders. Disclosure is generally required even where the activities, transactions or dealings were conducted in compliance with applicable law.
The following activities are disclosed in response to Section 13(r) with respect to affiliates of Santander UK within the Santander Group:
During the period covered by this report:
(a) A Santander UK customer, being an Iranian national resident in the U.K., was designated in September 2013 as acting for or on behalf of the Government of Iran. This accountholder’s current account and credit card with Santander UK were closed in December 2013. No revenue was generated by Santander UK on these products.
(b) In early October 2013, Santander UK opened an account for a Tunisian national, resident in the U.K., who is currently designated by the U.S. for terrorism. After becoming aware of this customer’s designation, Santander UK exited the relationship later in October 2013. No revenue was generated by Santander UK on these accounts.
(c) Santander UK holds frozen savings and current accounts for three customers resident in the U.K. who are currently designated by the U.S. for terrorism. The accounts held by each customer were blocked after the customer’s designation and have remained blocked and dormant throughout 2013. No revenue was generated by Santander UK on these accounts.
(d) A U.K. company maintained two commercial accounts at Santander UK that were used to provide payroll processing services for a U.K. entity that is currently designated by the U.S. under the Iran sanctions regime. The accounts may have been used to provide payroll services to other Iranian clients. Santander UK became aware of this account activity in September 2013 and exited the relationship in January 2014. No revenue was generated by Santander UK on these accounts.
(e) An Iranian national, resident in the U.K., who is currently designated by the U.S. and the U.K. under the Iran Sanctions regime held a mortgage with Santander UK that was issued prior to any such designation. No further drawdown has been made (or would be allowed) under this mortgage although we continue to receive repayment installments. In 2013, total revenue in connection with the mortgage was £10,421 whilst net profits were negligible relative to the overall profits of Santander UK. Santander UK does not intend to enter into any new relationships with this customer, and any disbursements will only be made in accordance with applicable sanctions. The same Iranian national also holds two investment accounts with Santander Asset Management UK Limited, which was anon-impaired part of the Group until December. The accounts have remained frozen throughout 2013. The investment returns are being automatically reinvested, and no disbursements have been madeloan portfolio analyzed on an individual basis. In addition, on December 21, 2010, in the Letter to Management No. 9, the customer. Total revenueSBIF specified that the accounting treatment for the Groupeffects originating from the application of this minimum provision is to record it in connection with the investment accounts was £247 whilst net profits in 2013 were negligible relative toincome for the overall profitsperiod. However, the Bank reverses this minimum provision for purposes of Santander Spain.its IFRS consolidated financial statements.
In addition,On August 12, 2010, Circular No. 3,503 was issued, which modified how we must classify loans included in Chapters B-1, B-2, B-3 and C1 of the Group has certain legacy export credits and performance guarantees with Bank Mellat,Compendium of Accounting Standards, which are loans analyzed on an individual basis. Such modifications were effective from January 1, 2011, except for those modifications relating to additional provisions included in the U.S. DepartmentLetter to Management No. 9 relating to Chapter B-1 which took effect in 2010. As a supplement to the Circular, the Letter to Management No. 9 was issued on December 21, 2010, which specifies that adjustments resulting from the adoption of these modifications starting on January 1, 2011 could be recorded during the first quarter of 2011; however, entities may anticipate recognition of the Treasury’s Officeimpact of Foreign Assets Control’s Specially Designated Nationals and Blocked Persons List. The Bank entered into two bilateral credit facilitiesthese adjustments, in February 2000whole or in an aggregate principal amount of €25.9 million. Both credit facilities maturedpart, in 2012. In addition, in 2005 Santander Spain participated in a syndicated credit facility for Bank Mellat of €15.5 million, which matures on July 6, 2015.2010. As of December 31, 2013,2010, we have chosen to recognize the Group was owed €4.3 million under this credit facility.entire provision adjustments aforementioned.
Bank Mellat has been in default under all of these agreements in recent years and Santander Spain has been and expects to continue to be repaid any amounts due by official export credit agencies, which insure between 95% and 99% ofOn December 30, 2014, the outstanding amounts under these credit facilities. No funds have been extended by Santander under these facilities since they were granted.
SBIF published new guidelines for provisioning a bank’s residential mortgage loan portfolio. The Group also has certain legacy performance guarantees for the benefit of Bank Sepah and Bank Mellat (stand-by letters of credit to guarantee the obligations – either under tender documents or under contracting agreements – of contractors who participated in public bids in Iran) that were in place prior to April 27, 2007. However, should any of the contractors default in their obligations under the public bids, the Group would not be able to pay any amounts due to Bank Sepah or Bank Mellat because any such payments would be frozen pursuant to Council Regulation (EU) No. 961/2010.
In the aggregate, all of the transactions described above resulted in approximately €72,000 gross revenues and approximately €123,000 net loss to the Group in 2013, all of which resulted from the performance of export credit
agencies rather than any Iranian entity. The Group has undertaken significant steps to withdraw from the Iranian market such as closing its representative office in Iran and ceasing all banking activities therein, including correspondent relationships, deposit taking from Iranian entities and issuing export letters of credit, except for the legacy transactions described above. The Group is not contractually permitted to cancel these arrangements without either (i) paying the guaranteed amount – which payment would be frozen as explained above (in the case of the performance guarantees), or (ii) forfeiting the outstanding amounts due to it (in the case of the export credits). As such, the Group intends to continue to provide the guarantees and hold these assets in accordance with company policy and applicable laws.
D. Property, Plant and Equipment
We are domiciled in Chile and own our principal executive offices located at Bandera 140, Santiago, Chile. We also own twelve other buildings in the vicinity of our headquarters, and we rent six other buildings. At December 31, 2013, we owned the locations at which 25.4% of our branches were located. The remaining branches operate at rented locations. We believe that our existing physical facilities are adequate for our needs.regulations include:
| · | an expected loss model to calculate allowances for housing mortgage loans that explicitly considers loan delinquency and loan / collateral (LTV) ratios, in order to promote active management of |
|
The following table sets forthThese above changes have been implemented in 2016. We also expect the SBIF in 2016 to publish new expected loss models for consumer and commercial loans assessed on a summary of the main computer hardware and other systems-equipment that we own.
|
|
|
The main software systems that we use are:
|
|
|
ITEM 4A. UNRESOLVED STAFF COMMENTSgroup basis.
None.
ITEM 5. OPERATING AND FINANCIAL REVIEW AND PROSPECTSCapital Markets
A. Accounting Standards Applied in 2013
Santander-Chile is a Chilean bank and maintains its financial books and records in Chilean pesos and prepares its consolidated financial statements in accordance with IFRS-IASB in order to comply with requirements of the SEC. As required byUnder the General Banking Law, which subjectsbanks in Chile may purchase, sell, place, underwrite and act as paying agents with respect to certain debt securities. Likewise, banks in Chile may place and underwrite certain equity securities. Bank subsidiaries may also engage in debt placement and dealing, equity issuance advice and securities brokerage, as well as in financial leasing, mutual fund and investment fund administration, investment advisory services and
merger and acquisition services. These subsidiaries are regulated by the SBIF and, in some cases, also by the Superintendency of Securities and Insurance, the regulator of the Chilean bankssecurities market, open-stock corporations and insurance companies.
Legal Provisions Regarding Banking Institutions with Economic Difficulties
The General Banking Law provides that if specified adverse circumstances exist at any bank, its Board of Directors must correct the situation within 30 days from the date of receipt of the relevant financial statements. If the Board of Directors is unable to do so, it must call a special shareholders’ meeting to increase the capital of the bank by the amount necessary to return the bank to financial stability. If the shareholders reject the capital increase, or if it is not effected within the term and in the manner agreed to at the meeting, or if the SBIF does not approve the Board of Directors’ proposal, the bank will be barred from increasing its loan portfolio beyond that stated in the financial statements presented to the regulatory supervisionBoard of Directors and from making any further investments in any instrument other than in instruments issued by the Central Bank. In such a case, or in the event that a bank is unable to make timely payment in respect of its obligations, or if a bank is under provisional administration of the SBIF, the General Banking Law provides that the bank may receive a two-year term loan from another bank. The terms and which mandates that Chilean banks abideconditions of such a loan must be approved by the accounting standards stipulateddirectors of both banks, as well as by the SBIF, our locally-filed consolidated financial statements have been preparedbut need not be submitted to the borrowing bank’s shareholders for their approval. In any event, a creditor bank cannot grant interbank loans to an insolvent bank in accordance with Chilean Bank GAAP asan amount exceeding 25.0% of the creditor bank’s regulatory capital. The Board of Directors of a bank that is unable to make timely payment of its obligations must present a reorganization plan to its creditors in order to capitalize the credits, extend their respective terms, condone debts or take other measures for the payment of the debts. If the Board of Directors of a bank submits a reorganization plan to its creditors and such arrangement is approved, all subordinated debt issued by the SBIF. The accounting principles issuedbank, whether or not matured, will be converted by operation of law into common stock in the amount required for the ratio of regulatory capital to risk-weighted assets to be not lower than 12.0%. If a bank fails to pay an obligation, it must notify the SBIF, are substantially similar to IFRS but there are some exceptions, as described further below. Therefore, our locally-filed consolidated financial statements have been adjusted according to IFRS as issued bywhich shall determine if the IASB.bank is solvent.
Santander-Chile’s transition date to IFRS was January 1, 2008. The Bank prepared its opening balance under these standards as of such date. Consequently, the date of adoption of the new standards by the Bank and its subsidiaries was January 1, 2009.
Differences between IFRS and Chilean Bank GAAP
As stated above, Chilean Bank GAAP, as prescribed by theCompendium of Accounting Standards(the “Compendium”), differs in certain respects from IFRS. The main differences that should be considered by an investor are the following:
Suspension of Income Recognition on Accrual Basis
In accordance with the Compendium, financial institutions must suspend recognition of income on an accrual basis in their statements of income for certain loans included in the impaired portfolio. IFRS does not allow the suspension of accrual of interest on financial assets for which an impairment loss has been determined. We do not believe that this difference materially impacts our financial statements.
Charge-offs and Accounts Receivable
The Compendium requires companies to establish deadlines for the charge-off of loans and accounts receivable. IFRS does not require any such deadline for charge-offs. A charge-off due to impairment would be recorded, if and only if, all efforts at collection of the loan or account receivable had been exhausted. We do not believe that this difference materially impacts our financial statements.
Assets Received in Lieu of Payment
The Compendium requires that the initial value of assets received in lieu of payment be the value agreed upon with a debtor as a result of the loan settlement or the value awarded in an auction, as applicable. These assets are required to be written off one year after their acquisition, if the assets have not been previously disposed of. IFRS requires that assets received in lieu of payment be initially accounted for at fair value. Subsequently, asset valuation depends on the classification provided by the entity for that type of asset. No deadline is established for charging-off an asset. The restatement of gains and losses from repossessed assets would have an impact on the restatement of financial statements under IFRS guidelines although we would not expect it to be material.
Goodwill and Intangible Assets
With respect to goodwill and intangible assets, the Compendium provides that:
| · | The value of “goodwill” and other depreciable intangible assets will be supported by two reports issued by specialists independent from the (i) bank, (ii) the bank’s external auditors, and (iii) each other. |
With respect to goodwill and intangible assets, IFRS provides that:
| · | The use of independent experts’ valuations is not mandatory. |
Since we have no goodwill, we do not believe that this difference impacts our financial statements.
Fair Value Option with Respect to Financial Assets and Liabilities
According to the Compendium, banks are not allowed to value assets or liabilities at their fair value in place of the depreciatedamortized cost method.
IFRS allows an entity to valuedesignate a financial asset or liability (or a group of financial assets or liabilities, or both), on the officialinitial recognition date,as one to be measured at fair value, with changes in fair value to be recognized in its financial statements.profit or loss. Once this option has been made,taken, it is irrevocable. The fair value option is not applicable to investments in capital instruments withoutwhich do not have a quoted market price available in an active market, and thus whose fair value cannot be estimated in a reliable way.reliably measured.
We do not believe that this difference impacts our financial statements because this accounting treatment is optional.
Loan loss allowances
The main difference between Chilean bank GAAP and IFRsIFRS regarding loan loss allowances is that under Chilean Bank GAAP, we use an expected loss model, and under IFRS, we use an incurred loss approach. Additionally, Chilean Bank GAAP includes the following norms, which are not included in our IFRS loan loss allowance:
On December 29, 2009, the SBIF issued Circular No. 3,489, which incorporates changes to several provisions of the Compendium. Among other changes, it states that effective January 2010, companies must complement the basis on which insolvency provisions related to contingent operations are determined, including unrestricted lines of credit, other contingent loans, and other loan commitments. In addition, companies should also apply the changes in risk exposure applicable to contingent loans, found in Chapter B-3 of the Compendium. According to specific instructions from the SBIF in Letter to Management No. 10 dated December 21, 2010, the SBIF stated that it would not be necessary to calculate the adjustment retrospectively for 2009. On June 10, 2010, the SBIF issued Circular No. 3,502 which, among other things, requires that Banks maintain a 0.5% minimum provision for the non-impaired part of the loan portfolio analyzed on an individual basis. In addition, on December 21, 2010, in the Letter to Management No. 9, the SBIF specified that the accounting treatment for the effects originating from the application of this minimum provision is to record it in the income for the period. However, the Bank reverses this minimum provision for purposes of its IFRS consolidated financial statements.
On August 12, 2010, Circular No. 3,503 was issued, which modified how we must classify loans included in Chapters B-1, B-2, B-3 and C1 of the Compendium of Accounting Standards, which are loans analyzed on an individual basis. Such modifications were effective from January 1, 2011, except for those modifications relating to additional provisions included in the Letter to Management No. 9 relating to Chapter B-1 which took effect in 2010. As a supplement to the Circular, the Letter to Management No. 9 was issued on December 21, 2010, which specifies that adjustments resulting from the adoption of these modifications starting on January 1, 2011 could be recorded during the first quarter of 2011; however, entities may anticipate recognition of the impact of these adjustments, in
whole or in part, in 2010. As of December 31, 2010, we have chosen to recognize the entire provision adjustments aforementioned.
Considering our incurredOn December 30, 2014, the SBIF published new guidelines for provisioning a bank’s residential mortgage loan portfolio. The regulations include:
| · | an expected loss model to calculate allowances for housing mortgage loans that explicitly considers loan delinquency and loan / collateral (LTV) ratios, in order to promote active management of credit risk; and |
| · | proposal for a new way of evaluating collateral in the context of determining provisions, which would specify certain required conditions that would need to be met by an asset in order for it to be eligible to be used as collateral for mitigating credit risk, as well as more specific requirements of how collateral would be valued for purposes of setting loan loss levels. |
These above changes have been implemented in 2016. We also expect the SBIF in 2016 to publish new expected loss approachmodels for IFRS purposesconsumer and commercial loans assessed on a group basis.
Capital Markets
Under the General Banking Law, banks in Chile may purchase, sell, place, underwrite and act as paying agents with respect to certain debt securities. Likewise, banks in Chile may place and underwrite certain equity securities. Bank subsidiaries may also engage in debt placement and dealing, equity issuance advice and securities brokerage, as well as in financial leasing, mutual fund and investment fund administration, investment advisory services and
merger and acquisition services. These subsidiaries are regulated by the SBIF and, in some cases, also by the Superintendency of Securities and Insurance, the regulator of the Chilean securities market, open-stock corporations and insurance companies.
Legal Provisions Regarding Banking Institutions with Economic Difficulties
The General Banking Law provides that if specified adverse circumstances exist at any bank, its Board of Directors must correct the situation within 30 days from the date of receipt of the relevant financial statements. If the Board of Directors is unable to do so, it must call a special shareholders’ meeting to increase the capital of the bank by the amount necessary to return the bank to financial stability. If the shareholders reject the capital increase, or if it is not effected within the term and in the manner agreed to at the meeting, or if the SBIF does not approve the Board of Directors’ proposal, the bank will be barred from increasing its loan portfolio beyond that stated in the financial statements presented to the Board of Directors and from making any further investments in any instrument other than in instruments issued by the Central Bank. In such a case, or in the event that a bank is unable to make timely payment in respect of its obligations, or if a bank is under provisional administration of the SBIF, the General Banking Law provides that the bank may receive a two-year term loan from another bank. The terms and conditions of such a loan must be approved by the directors of both banks, as well as by the SBIF, but need not be submitted to the borrowing bank’s shareholders for their approval. In any event, a creditor bank cannot grant interbank loans to an insolvent bank in an amount exceeding 25.0% of the creditor bank’s regulatory capital. The Board of Directors of a bank that is unable to make timely payment of its obligations must present a reorganization plan to its creditors in order to capitalize the credits, extend their respective terms, condone debts or take other measures for the payment of the debts. If the Board of Directors of a bank submits a reorganization plan to its creditors and such arrangement is approved, all subordinated debt issued by the bank, whether or not matured, will be converted by operation of law into common stock in the amount required for the ratio of regulatory capital to risk-weighted assets to be not lower than 12.0%. If a bank fails to pay an obligation, it must notify the SBIF, which shall determine if the bank is solvent.
Dissolution and Liquidation of Banks
The SBIF may establish that a bank should be liquidated for the benefit of its depositors or other creditors when such bank does not have the necessary solvency to continue its operations. In such case, the SBIF must revoke a bank’s authorization to exist and order its mandatory liquidation, subject to agreement by the Central Bank. The SBIF must also revoke a bank’s authorization if the reorganization plan of such bank has been rejected twice. The resolution by the SBIF must state the reason for ordering the liquidation and must name a liquidator, unless the SBIF assumes this responsibility. When a liquidation is declared, all checking accounts and other demand deposits received in the ordinary course of business, are required to be paid by using our internally developed models, all differencesexisting funds of the bank, its deposits with the Central Bank or its investments in instruments that represent its reserves. If these funds are insufficient to pay these obligations, the liquidator may seize the rest of the bank’s assets, as needed. If necessary and in specified circumstances, the Central Bank will lend the bank the funds necessary to pay these obligations. Any such loans are preferential to any claims of other creditors of the liquidated bank.
Obligations Denominated in Foreign Currencies
Santander-Chile must also comply with various regulatory and internal limits regarding exposure to movements in foreign exchange rates (See “Item 11. Quantitative and Qualitative Disclosures About Market Risk”).
Loans and Investments in Foreign Securities
Under current Chilean banking regulations, banks in Chile may grant loans to foreign individuals and entities and invest in certain securities of foreign issuers. Banks may grant commercial loans and foreign trade loans, and can buy loans granted by banks abroad. Banks in Chile may also invest in debt securities traded in formal secondary markets. Such debt securities must be (1) securities issued or guaranteed by foreign sovereign states or their central banks or other foreign or international financial entities, and (2) bonds issued by foreign companies. If the sum of investment in foreign securities and loans granted outside of Chile surpasses 70% of regulatory capital, the amount that exceeds 70% is subject to a mandatory reserve of 100%.
Table 1
Rating Agency | Short Term | Long Term |
| Moody’s | P2 | Baa3 |
| Standard and Poor’s | A3 | BBB- |
| Fitch | F2 | BBB- |
| Dominion Bond Rating (DBRS) | R-2 | BBB (low) |
In the event that the sum of: (a) loans granted abroad that are not to subsidiaries of Chilean companies, and that have a rating of BB- or less and do not trade on a foreign stock exchange, and (b) the investments in foreign securities which have a rating that is below that indicated in Table 1 above, but is equal to or exceeds the ratings mentioned in the Table 2 below and exceeds 20% (and 30% for banks with a BIS ratio equal or exceeding 10% of the regulatory capital of such bank), the excess is subject to a mandatory reserve of 100%.
Table 2
Rating Agency | Short Term | Long Term |
| Moody’s | P2 | Ba3 |
| Standard and Poor’s | A-2 | BB- |
| Fitch | F2 | BB- |
| Dominion Bond Rating (DBRS) | R-2 | BB (low) |
In addition, banks may invest in foreign securities whose ratings are equal or exceeds those mentioned in Table 3 below for an additional amount equal to 70% of their regulatory capital. This limit constitutes an additional margin and is not subject to the 100% mandatory reserve.
Additionally, a Chilean bank may invest in foreign securities whose rating is equal to or exceeds those mentioned in Table 3 below in: (i) demand deposits with foreign banks, including overnight deposits in a single entity; and (ii) securities issued or guaranteed by sovereign states or their central banks or securities issued or guaranteed by foreign entities within the Chilean State, though investment will be subject to the limits by issuer up to 30% and 50%, respectively, of the regulatory capital of the Chilean bank that makes the investment. If these foreign securities do not have a rating, the individual limit will be 10% of regulatory capital.
Table 3
Rating Agency | Short Term | Long Term |
| Moody’s | P1 | Aa3 |
| Standard and Poor’s | A1+ | AA- |
| Fitch | F1+ | AA- |
| DBRS | R-1 (high) | AA(low) |
Moreover, the sum of all demand deposits with foreign banks, including overnight deposits to related parties, as defined by the Central Bank and the SBIF, modelscannot surpass 25% of a bank’s regulatory capital. This limit excludes foreign branches of Chilean banks or their subsidiaries, but must include amounts deposited by these entities in related parties abroad.
Chilean banks may only invest in equity securities of foreign banks and certain other foreign companies which may be affiliates of the bank or which would be complementary to the bank’s business if such companies were incorporated in Chile.
“Mortgage Bonds”
In 2012, the mortgage-covered bond legislation was approved by the Chilean Congress. These bonds, known as “mortgage bonds,” are debt backed by the company that sells them, as well as by a pool of mortgages that in the event of insolvency the pool of mortgages are auctioned with the corresponding mortgage bond. Unlike covered bonds, they are not be limited to banks. These bonds, if bought by banks, are available for immediate liquidity in the
Central Bank liquidity window and have other restrictions as to the type of mortgage they will be funding, i.e. mortgage loans with loan-to-values of maximum 80%.
U.S. Banking Regulation - Volcker Rule
On July 21, 2010, the United States enacted the Dodd-Frank Wall Street Reform and Consumer Protection Act (the “Dodd-Frank Act”), which provides a broad framework for significant regulatory changes that extend to almost every area of U.S. financial regulation. Within the Dodd-Frank Act, the Volcker Rule prohibits “banking entities” from engaging in certain forms of proprietary trading or from sponsoring, investing in or entering into certain credit-related transactions with related covered funds, in each case subject to certain limited exceptions.The term “covered fund” is defined very broadly to include traditional hedge funds, private equity funds, certain securitization vehicles and other entities that must rely on Section 3(c)(1) or 3(c)(7) of the U.S. Investment Company Act of 1940 for an exemption under that Act, as well as certain similar foreign funds. The Volcker Rule became effective in July, 2012 and in December, 2013 U.S. regulators issued final rules implementing the Volcker Rule. The statute and final rules also contain exclusions and certain exemptions for market-making, hedging, underwriting, trading in U.S. government and agency obligations as well as certain foreign government obligations, and trading solely outside the United States, and also permit certain ownership interests in certain types of funds to be retained. Banking entities such as Banco Santander Parent must bring their activities and investments worldwide into compliance with the requirements of the Volcker Rule by the end of the conformance period applicable to each requirement.
In general, all banking entities were required to conform to the requirements of the Volcker Rule, except for provisions related to certain funds, and to implement a compliance program by July 21, 2015. In December 2014, the Federal Reserve Board issued an order extending the Volcker Rule’s general conformance period until July 21, 2016 for investments in and relationships with covered funds and certain foreign funds that were in place on or prior to December 31, 2013 (“legacy covered funds”), and stated its intention to grant a final one-year extension of the general conformance period, to July 21, 2017, for banking entities to conform ownership interests in and relationships with legacy covered funds. This extension of the conformance period does not apply to the July 21, 2015 imposition of the Volcker Rule’s prohibitions on proprietary trading or to any investments in and relationships with covered funds put in place after December 31, 2013. Banco Santander Parent, including Santander Chile, has assessed how the final rules implementing the Volcker Rule affect the group’s businesses and has adopted or is in the process of adopting the necessary measures to bring its activities into compliance with the rules and the applicable conformance period.
U.S. Anti-Money Laundering, Anti-Terrorist Financing, and Foreign Corrupt Practices Act Regulations
The Bank, as a foreign private issuer whose securities are registered under the U.S. Securities Exchange Act of 1934, is subject to the U.S. Foreign Corrupt Practices Act (the “FCPA”). The FCPA generally prohibits such issuers and their directors, officers, employees and agents from using any means or instrumentality of U.S. interstate commerce in furtherance of any offer or payment of money to any foreign official or political party for the purpose of influencing a decision of such person in order to obtain or retain business. It also requires that the issuer maintain books and records and a system of internal accounting controls sufficient to provide reasonable assurance that accountability of assets is maintained and accurate financial statements can be prepared. Penalties, fines and imprisonment of the Bank’s officers and/or directors can be imposed for violations of the FCPA.
Furthermore, the Bank is subject to a variety of U.S. anti-money laundering and anti-terrorist financing laws and regulations, such as the Bank Secrecy Act of 1970, as amended, and the USA PATRIOT ACT of 2001, as amended, and a violation of such laws and regulations may result in substantial penalties, fines and imprisonment of the Bank’s officers and/or directors.
Disclosure pursuant to Section 219 of the Iran Threat Reduction and Syria Human Rights Act
Santander-Chile has no exposure to Iran or Syria. As we are part of Grupo Santander, we must disclose the exposure of other entities of the Group to Iran and Syria.
Pursuant to Section 219 of the Iran Threat Reduction and Syria Human Rights Act of 2012, which added Section 13(r) to the Securities Exchange Act of 1934, as amended (the “Exchange Act”), an issuer is required to disclose in its annual or quarterly reports, as applicable, whether it or any of its affiliates knowingly engaged in certain activities, transactions or dealings relating to Iran or with individuals or entities designated pursuant to
certain Executive Orders. Disclosure is generally required even where the activities, transactions or dealings were conducted in compliance with applicable law.
The following activities are disclosed in response to Section 13(r) with respect to affiliates of Santander UK within the Santander Group. During the period covered by this annual report:
(a) Santander UK holds frozen savings accounts and one current account for two customers resident in the U.K. who are currently designated by the U.S. for terrorism. The accounts held by each customer were blocked after the customer’s designation and have remained blocked and dormant throughout 2015. Revenue generated by Santander UK on these accounts is negligible.
(b) An Iranian national, resident in the U.K., who is currently designated by the U.S. under the Iranian Financial Sanctions Regulations and the Non-Proliferation of Weapons of Mass Destruction (“NPWMD”) designation, holds a mortgage with Santander UK that was issued prior to any such designation. No further drawdown has been made (or would be allowed) under this mortgage although we continue to receive repayment instalments. In 2015, total revenue in connection with the mortgage was approximately £3,876 while net profits were negligible relative to the overall profits of Santander UK. Santander UK does not intend to enter into any new relationships with this customer, and any disbursements will only be made in accordance with applicable sanctions. The same Iranian national also holds two investment accounts with Santander ISA Managers Limited. The funds within both accounts are invested in the same portfolio fund. The accounts have remained frozen during 2015. The investment returns are being automatically reinvested, and no disbursements have been reversedmade to the customer. Total revenue for the Santander Group in respectconnection with the investment accounts was approximately £188 while net profits in 2015 were negligible relative to our Consolidated Financial Statements prepared under IFRS.the overall profits of Santander Spain.
B. (c) During the third quarter of 2015 two additional Santander UK customers were designated. A UK national is designated by the U.S. under the Specially Designated Global Terrorist (“SDGT”) sanctions program and is on the U.S. Department of the Treasury’s Office of Foreign Assets Control’s Specially Designated Nationals and Blocked Persons (“SDN”) List. This customer holds a bank account which generated revenue of approximately £180 during the third and fourth quarter of 2015. The account is blocked. Net profits in the third and fourth quarter of 2015 in connection with this account were negligible relative to the overall profits of Santander Spain. A second UK national is designated by the U.S. under the SDGT sanctions program and is on the U.S. SDN List. No transactions were made in the third and fourth quarter of 2015 and his account is blocked and in arrears.
(d) In addition, during the fourth quarter of 2015, Santander UK has identified one additional customer. A UK national is designated by the U.S. under the SDGT sanctions program and is on the U.S. SDN List. The customer holds a bank account which generated negligible revenue during the fourth quarter of 2015. The account was closed during the fourth quarter of 2015. Net profits in the fourth quarter of 2015 were negligible relative to the overall profits of Santander Spain.
In addition, the Santander Group has an outstanding legacy export credit facility with Bank Mellat, which was in the U.S. SDN List at December 31, 2015. In 2005, Santander Spain participated in a syndicated credit facility for Bank Mellat of €15.5 million, which matured on July 6, 2015. As of December 31, 2015, the Santander Group was owed €0.3 million not paid at maturity under this credit facility and 95% covered by official export credit agencies.
Santander Spain has not been receiving payments from Bank Mellat under this or other credit facilities in recent years. Santander Spain has been and expects to continue to be repaid any amounts due by official export credit agencies. No funds have been extended by Santander Spain under this facility since it was granted.
The Santander Group also has certain legacy performance guarantees for the benefit of Bank Sepah and Bank Mellat (stand-by letters of credit to guarantee the obligations – either under tender documents or under contracting agreements – of contractors who participated in public bids in Iran) that were in place prior to April 27, 2007. However, should any of the contractors default in their obligations under the public bids, the Santander Group would need prior approval from the Spanish Government to pay any amounts due to Bank Sepah or Bank Mellat pursuant to Council Regulation (EU) No.2015/1861.
In the aggregate, all of the transactions described above resulted in approximately €15,000 gross revenues and approximately €77,000 net loss to the Santander Group in 2015, all of which resulted from the performance of export credit agencies rather than any Iranian entity. The Santander Group has undertaken significant steps to withdraw from the Iranian market such as closing its representative office in Iran and ceasing all banking activities therein, including correspondent relationships, deposit taking from Iranian entities and issuing export letters of credit, except for the legacy transactions described above. The Santander Group is not contractually permitted to cancel these arrangements without either (i) paying the guaranteed amount – which payment would be subject to prior approval (in the case of the performance guarantees), or (ii) forfeiting the outstanding amounts due to it (in the case of the export credits). As such, the Santander Group intends to continue to provide the guarantees and hold these assets in accordance with company policy and applicable laws.
C. Organizational Structure
Santander Spain controls Santander-Chile through its holdings in Teatinos Siglo XXI Inversiones S.A. and Santander Chile Holding S.A. which are controlled subsidiaries. Santander Spain control over 67.18% of our shares and actual participation when excluding non-controlling interests participating in Santander Chile Holding S.A. of 67.12%.
Shareholder | Number of Shares | Percentage |
| Santander Chile Holding S.A. | 66,822,519,695 | 35.46 |
| Teatinos Siglo XXI Inversiones S.A. | 59,770,481,573 | 31.72 |
The chart below sets forth the names and areas of responsibility of our senior managers as of April 2016.
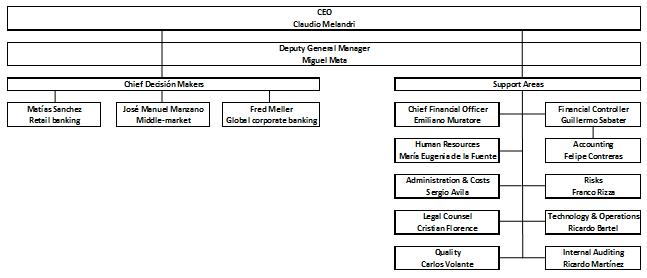
| D. | Property, Plant and Equipment |
We are domiciled in Chile and own our principal executive offices located at Bandera 140, 20th floor, Santiago, Chile. We also own twelve other buildings in the vicinity of our headquarters, and we rent six other buildings. At December 31, 2015, we owned the locations at which 23% of our branches were located. The remaining branches operate at rented locations. We believe that our existing physical facilities are adequate for our needs.
Main properties as of December 31, 2015 | Number |
| Central Offices | |
| Owned | 4 |
| Rented | 6 |
| Total | 10 |
| Branches(1) | |
| Owned | 110 |
| Rented | 362 |
| Total | 472 |
| Other property(2) | |
| Owned | 77 |
| Rented | 36 |
| Total | 113 |
| (1) | Some branches are located inside central office buildings and other properties. Including these branches, the total number of branches is 472. Special payment centers are included in Other property. |
| (2) | Consists mainly of parking lots, mini-branches and property owned by our subsidiaries. |
The following table sets forth a summary of the main computer hardware and other systems-equipment that we own.
Category | Brand | Application |
| Mainframe | IBM | Back-end, Core-System Altair, Payment means and foreign trade. |
| Midrange | IBM | Interconnections between Mainframe and mid-range |
| Midrange | SUN/Unix | Interconnections applications Credit & debit cards |
| SUN/UNIX | Treasury, MIS, Work Flow, Accounting | |
| Midrange | IBM | WEB |
| Desktop | HP/Lenovo | Platform applications |
| Call Center | Avaya | Telephone system |
| Genesys | Integration Voice/data | |
| Nice | Voice recorder | |
| Nortel | IVR |
The main software systems that we use are:
Category | Product | Origin |
| Core-System | ALTAIR | Accenture |
| Data base | DB2 | IBM |
| Data base | Oracle | Oracle |
| Data base | SQL Server | Microsoft |
| WEB Service | Internet Information Server | Microsoft |
| Message Service | MQSeries | IBM |
| Transformation | MQIntegrator | IBM |
ITEM 4A. UNRESOLVED STAFF COMMENTS
None.
ITEM 5. OPERATING AND FINANCIAL REVIEW AND PROSPECTS
Accounting Standards Applied in 2015
Santander-Chile is a Chilean bank and maintains its financial books and records in Chilean pesos and prepares its consolidated financial statements in accordance with IFRS-IASB in order to comply with requirements of the SEC. As required by the General Banking Law, which subjects Chilean banks to the regulatory supervision of the SBIF, and which mandates that Chilean banks abide by the accounting standards stipulated by the SBIF, our locally-filed consolidated financial statements have been prepared in accordance with Chilean Bank GAAP as issued by the SBIF. The accounting principles issued by the SBIF are substantially similar to IFRS but there are some exceptions, as described in Item 4. Therefore, our locally-filed consolidated financial statements have been adjusted according to IFRS as issued by the IASB.
Santander-Chile’s transition date to IFRS was January 1, 2008. The Bank prepared its opening balance under these standards as of such date. Consequently, the date of adoption of the new standards by the Bank and its subsidiaries was January 1, 2009.
Critical Accounting Policies
Our consolidated financial statements include various estimates and assumptions, including but not limited to the adequacy of the allowance for loan losses, estimates of the fair value of certain financial instruments and the selection of useful lives of certain assets.
We evaluate these estimates and assumptions on an ongoing basis. Management bases its estimates and assumptions on historical experience and on various other factors that it believes to be reasonable under the circumstances. Actual results in future periods could differ from those estimates and assumptions, and if these differences were significant enough, our reported results of operations would be affected materially. We believe that the following are the moremost critical judgment areas or involve a higher degree of complexity in the application of the accounting policies that currently affect our financial condition and results of operations.
Allowance for loan losses
The Bank records its allowances following its internal models for the recording of incurred debt. These models have been approved by the Board. To establish impairment losses, the Bank carries out an evaluation of outstanding loans and accounts receivable from customers, as detailed below:
| · | Individual assessment of debtors: when debtors are recorded as individually significant,i.e., when they have significant debt levels or, even for those that do not have these levels, could be classified in a group of financial assets with similar credit risk features and who, due to the size, complexity or level of exposure, require detailed information. See “Item 5. Operating and Financial Review and Prospects— |
| · | Group assessment of debtors: when there is no evidence of impairment for individually-assessed |
Derivative activities
As of December 31, 2013, 2012, and 2011, derivativesDerivatives are measured at fair value on the statement of financial position and the net unrealized gain (loss) on derivatives is classified as a separate line item within the income statement. Under IFRS, banks must mark-to-market derivatives. A derivative financial instrument held for trading purposes must be marked to market and the
unrealized gain or loss must be recognized in the income statement. The Bank recognizes three kinds of hedge accounting: (i) cash flow hedges, (ii) fair value hedges and (iii) hedging of foreign net investments.
| · | When a cash flow hedge exists, the fair value movements on the part of the hedging instrument and the hedged item that is effective are recognized in |
| · | When a fair value hedge exists, the fair value movements on the hedging instrument and the |
| · | When a hedge of net investment in a foreign operation exists, |
In 2013, the derivatives classified as held for trading include the debit value adjustments (DVA) for those derivatives in which the Bank has a net liability position with its counterparty. This resulted in income of Ch$8,324 million in 2013.
Accounting changes
IAS 19 – “Employee Benefits Revised” was implemented as of January 1, 2013. Regarding the Pension Plan (Defined benefits), the main change of the new version of the IAS 19 is the inability to defer the costs of ‘past services’ of the defined benefit plans, (immediate recognition is required) as well as the recognition of actuarial gains and losses in other comprehensive income and the elimination of the “corridor approach.” The amendments require an accounting change that must be applied retroactively following IAS 8 “Accounting Policies, Changes in Accounting Estimates and Errors”. The required adjustments to comply with the IAS 19 - Employee Benefits amendments within the Consolidated Balance Sheet as of December 31, 2012 are as follows:
Closing balance as of December 31, |
Adjustments
| Adjusted balance as of December 31, | |||
| Consolidated Statement of Financial Position | 2012 | 2012 | |||
| Ch$mn | Ch$mn | Ch$mn | |||
| Asset | |||||
| Deferred taxes | 181,678 | 197 | 181,875 | ||
| Other assets | 658,873 | (983) | (*) | 657,090 | |
| Total Assets | 840,551 | (786) | 839,765 | ||
| Liabilities | |||||
| Provisions | 191,796 | 96 | 191,892 | ||
| Total Liabilities | 191,796 | 96 | 191,892 | ||
| Equity | |||||
| Reserves | 976,561 | (1,101) | (**) | 975,460 | |
| Income for the period | 356,493 | 315 | (***) | 356,808 | |
| Minus: Provision for mandatory dividends | (106,948) | (96) | (107,044) | ||
| Total Equity | 1,226,106 | (882) | 1,225,224 | ||
(*) Corresponds to decrease in deferred past service costs
(**) Corresponds to the effect, net of taxes, on pension plans that was deferred as of December 31, 2011
(***) Corresponds to an effect on income for the period
The adjustments required by the IAS 19 modifications as of January 1, 2012 are as follows:
Opening balance as of January 1, |
Adjustments
| Adjusted balance as of January 1, | |||
| Consolidated Statement of Financial Position | 2012 | 2012 | |||
| Ch$mn | Ch$mn | Ch$mn | |||
| Assets | |||||
| Deferred taxes | 136,521 | 276 | 136,797 | ||
| Other assets | 550,326 | (1,377) | (*) | 548,949 | |
| Total Assets | 686,847 | (1,101) | 685,746 | ||
| Equity | |||||
| Reserves | 802,528 | (1,101) | (**) | 801,427 | |
| Total Equity | 802,528 | (1,101) | 801,427 |
(*) Corresponds to decrease in pension plan for deferred pension costs
(**) Corresponds to pension plans amount pending of deferral as of December 31, 2011 (net of income tax)
| A. | Operating Results |
The adjusted Consolidated Balance Sheet with modifications required by IAS 19 - Employee Benefits are as follows:
Closing balance as of December 31, | IAS 19 adjustments
| Adjusted balance as of December 31, | ||||
| 2012 | 2012 | |||||
| Ch$mn | Ch$mn | Ch$mn | ||||
| ASSETS | ||||||
| Cash and deposits in banks | 1,250,414 | - | 1,250,414 | |||
| Cash items in process of collection | 520,267 | - | 520,267 | |||
| Trading investments | 338,287 | - | 338,287 | |||
| Investments under resale agreements | 6,993 | - | 6,993 | |||
| Financial derivative contracts | 1,293,212 | - | 1,293,212 | |||
| Interbank loans, net | 90,414 | - | 90,414 | |||
| Loans and accounts receivable from customers | 18,326,190 | - | 18,326,190 | |||
| Available for sale investments | 1,826,158 | - | 1,826,158 | |||
| Held to maturity investments | - | - | - | |||
| Investments in associates and other companies | 7,614 | - | 7,614 | |||
| Intangible assets | 87,347 | - | 87,347 | |||
| Property, plant, and equipment | 162,214 | - | 162,214 | |||
| Current taxes | 10,227 | - | 10,227 | |||
| Deferred taxes | 181,678 | 197 | 181,875 | |||
| Other assets | 658,873 | (983) | 657,890 | |||
| TOTAL ASSETS | 24,759,888 | (786) | 24,759,102 | |||
| LIABILITIES | ||||||
| Deposits and other demand liabilities | 4,970,019 | - | 4,970,019 | |||
| Cash items in process of being cleared | 284,953 | - | 284,953 | |||
| Obligations under repurchase agreements | 304,117 | - | 304,117 | |||
| Time deposits and other time liabilities | 9,112,213 | - | 9,112,213 | |||
| Financial derivative contracts | 1,146,161 | - | 1,146,161 | |||
| Interbank borrowings | 1,438,003 | - | 1,438,003 | |||
| Issued debt instruments | 4,571,289 | - | 4,571,289 | |||
| Other financial liabilities | 192,611 | - | 192,611 | |||
| Current taxes | 525 | - | 525 | |||
| Deferred taxes | 9,544 | - | 9,544 | |||
| Provisions | 191,796 | 96 | 191,892 | |||
| Other liabilities | 341,274 | - | 341,274 | |||
| TOTAL LIABILITIES | 22,562,505 | 96 | 22,562,601 | |||
| EQUITY | ||||||
| Attributable to the Bank’s shareholders: | 2,163,118 | (882) | 2,162,236 | |||
| Capital | 891,303 | - | 891,303 | |||
| Reserves | 976,561 | (1,101) | 975,460 | |||
| Valuation adjustments | (3,781) | - | (3,781) | |||
| Retained earnings | 299,035 | 219 | 299,254 | |||
| Retained earnings of prior years | 49,490 | - | 49,490 | |||
| Income for the period | 356,493 | 315 | 356,808 | |||
| Minus: Provision for mandatory dividends | (106,948) | (96) | (107,044) | |||
| Non-controlling interest | 34,265 | - | 34,265 | |||
| TOTAL EQUITY | 2,197,383 | (882) | 2,196,501 | |||
| TOTAL LIABILITIES AND EQUITY | 24,759,888 | (786) | 24,759,102 | |||
The necessary adjustments made to the Income Statement for comparative purposes as of December 31, 2012 are detailed below:
Closing balance as December 31 |
IAS 19 adjustments | Adjusted balance as of December 31 | |
| 2012 | 2012 | ||
| Ch$mn | Ch$mn | Ch$mn | |
| OPERATING INCOME | |||
| Interest income | 1,890,953 | - | 1,890,953 |
| Interest expense | (848,219) | - | (848,219) |
| Net interest income | 1,042,734 | - | 1,042,734 |
| Fee and commission income | 360,427 | - | 360,467 |
| Fees and commissions expense | (89,855) | - | (89,855) |
| Net fee and commission income | 270,572 | - | 270,572 |
| Net income from financial operations | (64,079) | - | (64,079) |
| Foreign exchange profit (loss), net | 146,378 | - | 146,378 |
| Other operating income | 13,105 | - | 13,105 |
| Net operating profit before provision for loan losses | 1,408,710 | - | 1,408,710 |
| Provisions for loan losses | (403,692) | - | (403,692) |
| NET OPERATING PROFIT | 1,005,018 | - | 1,005,018 |
| Personnel salaries and expenses | (300,298) | 394 | (299,904) |
| Administrative expenses | (183,379) | - | (183,379) |
| Depreciation and amortization | (56,369) | - | (56,369) |
| Impairment | (90) | - | (90) |
| Other operational expenses | (59,637) | - | (59,637) |
| TOTAL OPERATIONAL EXPENSES | (599,773) | 394 | (599,379) |
| OPERATING INCOME | 405,245 | 394 | 405,639 |
| Income from investments in associates and other companies | 267 | - | 267 |
| Income before tax | 405,512 | 394 | 405,906 |
| Income tax expense | (44,394) | (79) | (44,473) |
| NET INCOME FOR THE PERIOD | 361,118 | 315 | 361,433 |
| Attributable to: | |||
| Bank shareholders | 356,493 | 315 | 356,808 |
| Non-controlling interest | 4,625 | - | 4,625 |
Earnings per share attributable to Bank shareholders: (expressed in Chilean pesos) | |||
| Basic earnings | 1.892 | 0.001 | 1.893 |
| Diluted earnings | 1.892 | 0.001 | 1.893 |
The adjustments required by IAS 19 as of December 31, 2011 are detailed below:
Closing balance as of December 31, 2011 |
IAS 19 adjustments | Adjusted balance as of December 31, 2011 | |
| MCh$ | MCh$ | MCh$ | |
| OPERATING INCOME | |||
| Interest income | 1,768,735 | - | 1,768,735 |
| Interest expense | (796,435) | - | (796,435) |
| Net interest income | 972,300 | - | 972,300 |
| Fee and commission income | 363,041 | - | 363,041 |
| Fees and commissions expense | (85,205) | - | (85,205) |
| Net fee and commission income | 277,836 | - | 277,836 |
| Net income from financial operations | 170,857 | - | 170,857 |
| Foreign exchange profit (loss), net | (76,660) | - | (76,660) |
| Other operating income | 18,749 | - | 18,749 |
| Net operating profit before provision for loan losses | 1,363,082 | - | 1,363,082 |
| Provisions for loan losses | (316,137) | - | (316,137) |
| NET OPERATING PROFIT | 1,046,945 | - | 1,046,945 |
| Personnel salaries and expenses | (280,613) | 573 | (280,040) |
| Administrative expenses | (166,825) | - | (166,825) |
| Depreciation and amortization | (53,466) | - | (53,466) |
| Impairment | (116) | - | (116) |
| Other operational expenses | (64,208) | - | (64,208) |
| TOTAL OPERATIONAL EXPENSES | (565,228) | 573 | (564,655) |
| OPERATING INCOME | 481,717 | - | 482,290 |
| Income from investments in associates and other companies | 2,140 | - | 2,140 |
| Income before tax | 483,857 | 573 | 484,430 |
| Income tax expense | (77,193) | (115) | (77,308) |
| NET INCOME FOR THE PERIOD | 406,664 | 458 | 407,122 |
| Attributable to: | |||
| Bank shareholders | 401,733 | 458 | 402,191 |
| Non-controlling interest | 4,931 | - | 4,931 |
Earnings per share attributable to Bank shareholders: (expressed in Chilean pesos) | |||
| Basic earnings | 2.132 | 0.002 | 2.134 |
| Diluted earnings | 2.132 | 0.002 | 2.134 |
C. Operating Results
Chilean Economy
All of our operations and substantially all of our customers are located in Chile. Accordingly, our financial condition and results of operations are substantially dependent upon economic conditions prevailing in Chile. In 2013,2015, the Chilean economy grew approximately 4.1%2.1% compared to 5.5%1.9% in 20122014 and 6.0%4.0% in 2011.2013. In the same period, internal demand increased 3.4% with increases1.8% compared to a decrease of 0.4%0.3% in 2014 and increase of 3.6% in 2013. The growth of internal demand was led by growth of total consumption, which was up 5.8% while investment and 5.6%decreased 1.5% in 2015 compared to 2014. The reduction of household consumption. investments was mainly due to a fall in investments in the mining sector due to concerns regarding global economic growth, especially growth in China.
As of December 2013,2015, the unemployment rate was 5.7%5.8% compared to 6.1% as of December 20126.0% in 2014 and 6.6% as of December 2011.5.7% in 2013. The exchange rate depreciated in 20132015 by 9.4%.16.5% and by 16.0% in 2014. As a result of this depreciation of the peso, CPI inflation reached 4.4% in 2015 compared to 4.7% in 2014 and 3.0% in 2013, as the peso depreciated, compared to CPI2013. As a result of 1.5%high inflation rates in 20122014 and 4.4% in 2011. Despite the higher inflation rate,2015, the Central Bank commenced a process of loweringgradually raising interest rates asdespite low economic growth. At year-end 2014, the economy began to show signs of deceleration, especially in investment levels. In January 2012, the Central Bank policy rate was set at 5.0%,3.0% and had been reducedthis was increased to 4.5%3.50% by year-end 2013. As of the date of this report, the rate was 4.0%.2015. Going forward, economic activity is expected to continue to increase, but possibly at a slower pace.with continued uncertainty regarding global growth, especially in growth in China, which impacts Chile’s mining sector, and internal political issues.
The growth of the Chilean banking sector evolved in line with overall economic developments, with an increase in the volume of loans and deposits. Total loans as of December 31, 20132015 in the Chilean financial system were Ch$110,250,707132,665,321 million (US$210187 billion), excluding Corpbanca’s banking operations in Colombia, an increaseloans held by subsidiaries of 10.2%Chilean banks abroad, grew 8.3% in the last twelve months. Total customer deposits (defined as time deposits plus checking accounts), excluding Corpbanca’s operationsloans held by subsidiaries of Chilean banks abroad grew 5.9% in Colombia,2015 compared to 2014 and totaled Ch$92,121,735106,326,269 million (US$176150 billion) as of December 31, 2013, an increase of 8.5% in the last twelve months.2015. The non-performing loan (defined as loans with an installment that is at least 90 days past-due) to total loans ratio has remained constantdecreased to 1.9% at 2.2% as of December 31, 2013year-end 2015 compared to 2.1% as of December 31, 2012.in 2014.
Impact of Inflationinflation
Our assets and liabilities are denominated in Chilean pesos, Unidades de Fomento (UF) and foreign currencies. The Bank no longer recognizes inflation accounting and has eliminated price-level restatement in line with IFRS, but inflation impacts our results of operations as some loan and deposit products are contracted in UF. The UF is revalued in monthly cycles. Each day in the period beginning on the tenth day of the current month through the ninth day of the succeeding month, the nominal peso value of the UF is indexed up (or down in the event of deflation) in order to reflect a proportionate amount of the change in the Chilean Consumer Price Index during the prior calendar month. One UF equaled Ch$ 23.309,5625,629.09 at December 31, 2013,2015, Ch$22,840.7524,627.10 at December 31, 2012,2014 and Ch$22,294.0323,309.56 at December 31, 2011.2013. High levels of inflation in Chile could adversely affect the Chilean economy and could have an adverse effect on our business, financial condition and results of operations. Negative inflation rates also negatively impact our results. Inflation measured as the annual variation of the UF was 4.1% in 2015, 5.7% in 2014 and 2.1% in 2013, 2.5% in 2012, and 3.9% in 2011.2013. There can be no assurance that Chilean inflation will not change significantly from the current level. Although we currently benefit from moderate levels of inflation, due to the current structure of our assets and liabilities (i.e., a significant portion of our loans are indexed to the inflation rate, but there are no
corresponding features in deposits or other funding sources that would increase the size of our funding base), there can be no assurance that our business, financial condition and result of operations in the future will not be adversely affected by changing levels of inflation. In summary:
| · | UF-denominated assets and liabilities. The effect of any changes in the nominal peso value of our UF-denominated interest earning assets and interest bearing liabilities is reflected in our results of operations as an increase (or decrease, in the event of deflation) in interest income and expense, respectively. Our net interest income will be positively affected by an inflationary environment to the extent that our average UF-denominated interest earning assets exceed our average UF-denominated interest bearing liabilities. Our net interest income will be positively affected by deflation in any period in which our average UF-denominated interest bearing liabilities exceed our average UF-denominated interest earning assets. Our net interest income will be negatively affected in a deflationary environment if our average UF-denominated interest earning assets exceed our average UF-denominated interest bearing liabilities. |
| · | Inflation and interest rate hedge. A key component of our asset and liability policy is the management of interest rate risk. The Bank’s assets generally have a longer maturity than our liabilities. As the Bank’s mortgage portfolio grows, the maturity gap tends to rise as these loans, which are contracted in UF, have a |
| longer maturity than the average maturity of our funding base. As most of our long term financial instruments and mortgage loans are contracted in UF and most of our deposits are in nominal pesos, the rise in mortgage lending increases the Bank’s exposure to inflation and to interest rate risk. The size of this gap is limited by internal and regulatory guidelines in order to avoid excessive potential losses due to strong shifts in interest |
| 2013. The average gap between our |
| · | The financial impact of the |
As of December 31, | % Change | % Change | |||
Inflation sensitive income | 2013 | 2012 | 2011 | 2013/2012 | 2012/2011 |
| (In millions of Ch$) | |||||
| Interest earned on UF assets(1) | 631,953 | 648,594 | 703,286 | (2.6%) | (7.8%) |
| Interest paid on UF liabilities(1) | (218,304) | (280,695) | (388,349) | (22.2%) | (27.7%) |
| Hedging results | (67,239) | (57,118) | (58,775) | 17.7% | (2.8%) |
| Net gain | 346,410 | 310,781 | 256,162 | 11.5% | 21.3% |
| As of December 31, | % Change | % Change | ||||||||||||||||||
| Impact of inflation on net interest income | 2015 | 2014 | 2013 | 2015/2014 | 2014/2013 | |||||||||||||||
| (In millions of Ch$) | ||||||||||||||||||||
| Results from UF GAP (1) | 130,666 | 229,946 | 71,842 | (43.2 | %) | 220.1 | % | |||||||||||||
| Annual UF inflation | 4.1 | % | 5.7 | % | 2.1 | % | ||||||||||||||
| (1) |
| · | Peso-denominated assets and liabilities. Interest rates prevailing in Chile during any period primarily reflect the inflation rate during the period and the expectations of future inflation. The sensitivity of our peso-denominated interest earning assets and interest bearing liabilities to changes to such prevailing rates varies. See “Item 5. Operating and Financial Review and Prospects— |
Interest Rates
Interest rates earned and paid on our assets and liabilities reflect, to a certain degree, inflation, expectations regarding inflation, changes in short term interest rates set by the Central Bank and movements in long term real rates. The Central Bank manages short term interest rates based on its objectives of balancing low inflation and economic growth. Because our liabilities are generally re-priced sooner than our assets, changes in the rate of inflation or short term rates in the economy are reflected in the rates of interest paid by us on our liabilities before such changes are reflected in the rates of interest earned by us on our assets. Therefore, when short term interest rates fall, our net interest margin is positively impacted, but when short term rates increase, our interest margin is negatively affected. At the same time, our net interest margin tends to be adversely affected in the short term by a decrease in inflation rates since generally our UF-denominated assets exceed our UF-denominated liabilities. See “Item 5. Operating and Financial Review and Prospects—C.A. Operating Results—Impact of Inflation—Peso-denominated assets and liabilities.” An increase in long term rates has a positive effect on our net interest margin, because our interest earning assets generally have longer terms than our interest bearing liabilities. In addition, because our peso-denominated liabilities have relatively short re-pricing periods, they are generally more responsive to changes in inflation or short term rates than our UF-denominated liabilities. As a result, during periods when current inflation or expected inflation
exceeds the previous period’s inflation, customers often switch funds from UF-denominated deposits to peso-denominated deposits, which generally bear higher interest rates, thereby adversely affecting our net interest margin.
Foreign Exchange Fluctuations
The Chilean government’s economic policies and any future changes in the value of the Chilean peso against the U.S. dollar could adversely affect our financial condition and results of operations. The Chilean peso has been subject to significant devaluation in the past and may be subject to significant fluctuations in the future. The Central Bank exchange rate depreciated 9.4%16.5% in 2013, which led to a pickup2015 and 16.0% in CPI inflation in 2013.2014. See “Item 3. Key Information—A. Selected Financial Data—Exchange Rates.” A significant portion of our assets and liabilities are denominated in foreign currencies, principally the U.S. dollar, and we historically have maintained and may continue to maintain material gaps between the balances of such assets and liabilities. Our current strategy is not to maintain a significant difference between the balances of our assets and liabilities in foreign currencies. In 2013, 20122015, 2014 and 2011,2013, the Bank, in its spot position, held more liabilities than assets in foreign currencies, mainly the U.S. dollar, as a result of an ample supply of U.S. dollar deposits from companies that receive export revenues, foreign correspondent bank loans and bonds issued abroad. This difference is usually hedged using forwards and cross-currency swaps. Including derivatives, the Bank seeks to run no foreign currency risk in its non-trading balance sheet. Because such assets and liabilities, as well as interest earned or paid on such assets and liabilities, and gains and losses realized upon the sale of such assets, are translated to Chilean pesos in preparing our financial statements, our reported income is affected by changes in the value of the Chilean peso relative to foreign currencies (principally the U.S. dollar). The translation gain or loss over assets and liabilities (excluding derivatives held for trading) is included as foreign exchange transactions in the income statement. The translation and mark-to-market of foreign currency derivatives held for trading is recognized as a gain or loss in the net results from mark-to-market and trading. See “Item 11. Quantitative and Qualitative Disclosures About Market Risk—E. Market Risks—Foreign exchange fluctuations” for more detail on the Bank’s exposure to foreign currency.
The Bank also uses a sensitivity analysis with both internal limits and regulatory limits to seek to manage the potential loss in net interest income resulting from fluctuations of interest rates on U.S. dollar denominated assets and liabilities and a VaR model to limit foreign currency trading risk.
We also set an absolute limit on the size of Santander-Chile’s consolidated net foreign currency trading position. At December 31, 2013,2015, the Bank’s consolidated net foreign currency position was equal to US$20081.4 million. As the Bank’s non-trading portfolio has no net exposure to foreign currency risk, the Bank’s total exposure to foreign currency is reflected in the trading portfolio exposure to foreign currency. The Bank’s average exposure to foreign currency was US$1.542 million in 2013.2015. See “Item 11. Quantitative and Qualitative Disclosures About Market Risk—Volume limits.” The limit on the size of the net foreign currency position is determined by the Asset and Liability Committee and is calculated and monitored by our Market Risk and Control Department.
Segmentation criteria
The accounting policies used to determine the Bank’s income and expenses by businessreporting segment are the same as those described in the summary of accounting policies in “Note 1—Summary of Significant Accounting Policies” of the Bank’s Consolidated Financial Statements, and are customized to meet the needs of the Bank’s management. The Bank earns most of its income in the form of interest income, fee and commission income and income from financial operations.
To evaluate a segment’s financial performance and make decisions regarding the highest decision-making authority forresources to be assigned to segments, the segmentChief Operating Decision Maker (CODM) bases his assessment on the segment’ssegment's interest income, fee and commission income, and expenses. This assessment helpsDue to changes aimed at improving relations with its customers, streamlining processes and saving costs, the Bank make decisions overhas simplified its internal structure in 2015. For this reason, the resources that will be allocateddisclosure has been simplified to reflect how the Bank is currently managed. The Bank’s reporting segments have three Chief Operating Decision Makers: (i) Director of Retail banking, (ii) the Director of the Middle-market segment and (iii) the Director of Global corporate banking, each segment.of which report to our Chief Executive Officer. All reporting segment information is presented following this structure.
During the second half of 2013, the Institutional segment was moved from Individual and SME DivisionDue to changes aimed at allocating customers to the Companiessegment best capable of servicing them and institutional Division. All prior yearstreamlining processes, the Bank has modified its internal structure in 2015. This change in composition of the segments resulted in the following:
| · | commissions paid in “Net fee and commission income “were reassigned among segments to more appropriately reflect the distributions in accordance with the management of each segment; |
| · | the effects of changes in foreign exchange rates of provisions were reallocated to the line item “Other” to more appropriately reflect the effects directly attributable to the respective segments; and |
| · | the improvement of the allocation of interest costs at the time of placement of the loan. |
Under IFRS 8, the Bank has aggregated operating segments with similar economic characteristics according to the aggregation criteria specified in the standard. A reporting segment consists of clients that are offered differentiated but, considering how their performance is measured, homogenous services based on IFRS 8 aggregation criteria, thus they form part of the same reporting segment. Overall, this aggregation has no significant impact on the understanding of the nature and effects of the Bank’s business activities and the economic environment. The information relating to 2014 and 2013 has been prepared using the above-mentioned current criteria so that the figures presented under the revised division definitions.are comparable.
The Bank’s reportable segments are (i) Retail banking, (ii) Middle-market, (iii) Global Corporate Banking and (iv) Corporate Activities (“Other”).
Results of Operations for the Years Ended December 31, 2013, 20122015, 2014 and 20112013
The following discussion is based upon and should be read in conjunction with the Audited Consolidated Financial Statements. The Audited Consolidated Financial Statements have been prepared in accordance with IFRS as issued by the IASB. The following table sets forth the principal components of our net income for the years ended December 31, 2013, 20122015, 2014 and 2011.2013.
2013 | 2013 | 2012 | 2011 | % Change | % Change | ||
CONSOLIDATED INCOME STATEMENT DATA | (ThU.S.$)(1) | (Ch$ million) | |||||
| IFRS: | |||||||
| Interest income and expense | |||||||
| Interest income | 3,569,638 | 1,871,204 | 1,890,953 | 1,768,735 | (1.0%) | 6.9% | |
| Interest expense | (1,515,532) | (794,442) | (848,219) | (796,435) | (6.3%) | 6.5% | |
| Net interest income | 2,054,106 | 1,076,762 | 1,042,734 | 972,300 | 3.3% | 7.2% | |
| Fees and income from services | |||||||
| Fees and commission income | 660,282 | 346,120 | 360,427 | 363,041 | (4.0%) | (0.7%) | |
| Fees and commission expense | (221,831) | (116,284) | (89,855) | (85,205) | (10%) | 8.8% | |
| Total net fees and commission income | 438,451 | 229,836 | 270,572 | 277,836 | (15.1%) | (2.6%) | |
| Other operating income | |||||||
| Net income from financial operations | (38,705) | (20,289) | (64,079) | 170,857 | (68.3%) | –% | |
| Foreign exchange profit (loss), net | 276,089 | 144,726 | 146,378 | (76,660) | (1.1%) | –% | |
| Financial transactions, net | 237,384 | 124,437 | 82,299 | 94,197 | 51.2% | (12.6%) | |
| Other operating income | 168,170 | 88,155 | 13,105 | 18,749 | 572.7% | (30.1%) | |
| Total other operating income | 405,554 | 212,592 | 95,404 | 112,946 | 122.8% | (15.5%) | |
| Net operating profit before loan losses | 2,898,111 | 1,519,190 | 1,408,710 | 1,363,082 | 7.8% | 3.3% | |
| Provision for loan losses | (708,626) | (371,462) | (403,692) | (316,137) | (8.0%) | 27.7% | |
| Net operating profit | 2,189,485 | 1,147,728 | 1,005,018 | 1,046,945 | 14.2% | (4.0%) | |
| Operating expenses | |||||||
| Personnel salaries and expenses | (588,218) | (308,344) | (299,904) | (280,040) | 2.8% | 7.1% | |
| Administrative expenses | (359,007) | (188,191) | (183,379) | (166,825) | 2.6% | 9.9% | |
| Depreciation and amortization | (116,509) | (61,074) | (56,369) | (53,466) | 8.3% | 5.4% | |
| Impairment of property, plan and equipment | (465) | (244) | (90) | (116) | 171.1% | (22.4%) | |
| Other operating expenses | (99,844) | (52,338) | (59,637) | (64,208) | (12.2%) | (7.1%) | |
| Total operating expenses | (1,164,043) | (610,191) | (599,379) | (564,655) | 1.8% | 6.1% | |
| Operating income | 1,025,442 | 537,537 | 405,639 | 482,290 | 32.5% | (15.9%) | |
| Other non-operating results | |||||||
| Income from investments in associates and other companies | 2,713 | 1,422 | 267 | 2,140 | 432.6% | (87.5%) | |
| Total other non-operating results | 2,713 | 1,422 | 267 | 2,140 | 432.6% | (87.5%) | |
| Income before tax | 1,028,155 | 538,959 | 405,906 | 484,430 | 32.8% | (16.2%) | |
| Income tax | (180,332) | (94,530) | (44,473) | (77,308) | 112.6% | (42.5%) | |
| Net income for the year | 847,823 | 444,429 | 361,433 | 407,122 | 23.0% | (11.2%) | |
| Net income for the period attributable to: | |||||||
| Equity holders of the Bank | 843,750 | 442,294 | 356,808 | 402,191 | 24.0% | (11.3%) | |
| Non-controlling interests | 4,073 | 2,135 | 4,625 | 4,931 | (53.8%) | (6.2%) | |
| 2015 | 2015 | 2014 | 2013 | % Change | ||||||||||||||||||||
| CONSOLIDATED INCOME STATEMENT DATA | (ThU.S.$)(1) | (Ch$ million) | 2014 / 2013 | |||||||||||||||||||||
| IFRS: | ||||||||||||||||||||||||
| Interest income and expense | ||||||||||||||||||||||||
| Interest income | 2,947,143 | 2,085,988 | 2,227,018 | 1,871,204 | (6.3 | %) | 19.0 | % | ||||||||||||||||
| Interest expense | (1,173,752 | ) | (830,782 | ) | (909,914 | ) | (794,442 | ) | (8.7 | %) | 14.5 | % | ||||||||||||
| Net interest income | 1,773,391 | 1,255,206 | 1,317,104 | 1,076,762 | (4.7 | %) | 22.3 | % | ||||||||||||||||
| Fees and income from services | ||||||||||||||||||||||||
| Fees and commission income | 569,229 | 402,900 | 366,729 | 346,120 | 9.9 | % | 6.0 | % | ||||||||||||||||
| Fees and commission expense | (233,502 | ) | (165,273 | ) | (139,446 | ) | (116,284 | ) | 18.5 | % | 19.9 | % | ||||||||||||
| Total net fees and commission income | 335,727 | 237,627 | 227,283 | 229,836 | 4.6 | % | (1.1 | %) | ||||||||||||||||
| Financial transactions, net | ||||||||||||||||||||||||
| Net income (expense) from financial operations | (646,930 | ) | (457,897 | ) | (159,647 | ) | (20,289 | ) | 186.8 | % | 686.9 | % | ||||||||||||
| Net foreign exchange gain (loss) | 852,495 | 603,396 | 272,212 | 144,726 | 121.7 | % | 88.1 | % | ||||||||||||||||
| Financial transactions, net | 205,565 | 145,499 | 112,565 | 124,437 | 29.3 | % | (9.5 | %) | ||||||||||||||||
| Other operating income | 9,097 | 6,439 | 6,545 | 88,155 | (1.6 | %) | (92.6 | %) | ||||||||||||||||
| Net operating profit before provision for loan losses | 2,323,780 | 1,644,771 | 1,663,497 | 1,519,190 | (1.1 | %) | 9.5 | % | ||||||||||||||||
| Provision for loan losses | (564,110 | ) | (399,277 | ) | (354,903 | ) | (371,462 | ) | 12.5 | % | (4.5 | %) | ||||||||||||
| Net operating profit | 1,759,670 | 1,245,494 | 1,308,594 | 1,147,728 | (4.8 | %) | 14.0 | % | ||||||||||||||||
| Operating expenses | ||||||||||||||||||||||||
| Personnel salaries and expenses | (546,854 | ) | (387,063 | ) | (338,888 | ) | (308,344 | ) | 14.2 | % | 9.9 | % | ||||||||||||
| Administrative expenses | (311,572 | ) | (220,531 | ) | (205,149 | ) | (188,191 | ) | 7.5 | % | 9.0 | % | ||||||||||||
| Depreciation and amortization | (75,747 | ) | (53,614 | ) | (44,172 | ) | (61,074 | ) | 21.4 | % | (27.7 | %) | ||||||||||||
| Impairment of property, plant and equipment | (30 | ) | (21 | ) | (36,664 | ) | (244 | ) | (99.9 | %) | 14,926.2 | % | ||||||||||||
| Other operating expenses | (82,974 | ) | (58,729 | ) | (58,946 | ) | (52,338 | ) | (0.4 | %) | 12.6 | % | ||||||||||||
| Total operating expenses | (1,017,177 | ) | (719,958 | ) | (683,819 | ) | (610,191 | ) | 5.3 | % | 12.1 | % | ||||||||||||
| Net Operating income | 742,493 | 525,536 | 624,775 | 537,537 | (15.9 | %) | 16.2 | % | ||||||||||||||||
| Income from investments in associates and other companies | 3,656 | 2,588 | 2,165 | 1,422 | 19.5 | % | 52.3 | % | ||||||||||||||||
| Income before tax | 746,149 | 528,124 | 626,940 | 538,959 | (15.8 | %) | 16.3 | % | ||||||||||||||||
| Income tax expense | (107,933 | ) | (76,395 | ) | (51,050 | ) | (94,530 | ) | 49.6 | % | (46.0 | %) | ||||||||||||
| Consolidated Net income for the year | 638,216 | 451,729 | 575,890 | 444,429 | (21.6 | %) | 29.6 | % | ||||||||||||||||
| Net income for the year attributable to: | ||||||||||||||||||||||||
| Equity holders of the Bank | 633,606 | 448,466 | 569,910 | 442,294 | (21.3 | %) | 28.9 | % | ||||||||||||||||
| Non-controlling interests | 4,610 | 3,263 | 5,980 | 2,135 | (45.4 | %) | 180.1 | % | ||||||||||||||||
| (1) | Amounts stated in U.S. dollars at and for the year ended December 31, |
Results of operations for the years ended December 31, 20132015 and 20122014. NetConsolidated net income for the year ended December 31, 2013 increased 23.0%2015 decreased 21.6% to Ch$444,429451,729 million. Our return on annualized average equity was 18.9%16.0% in 20132015 compared to 16.5%21.0% in 2012.2014.
In 2013,2015,net operating profit before loan losses was Ch$1,519,1901,644,771 million, a decrease of 1.1% compared to 2014. Our net interest income decreased 4.7% to Ch$1,255,206 million in 2015 compared to 2014. Our net interest margin decreased to 4.40% in 2015 from 4.92% in 2014. Net interest margins were negatively affected by the lower UF inflation rate in 2015 compared to 2014.
Net fees and commission income increased 4.6% to Ch$237,627 million in the twelve-month period ended December 31, 2015 compared to the same period in 2014. In 2015, the Bank continued to experience positive client base and product usage growth. This has driven growth of fees in Retail banking that rose 8.8% in 2015 and the Middle-market segment in which fees increased 5.5% in the period being analyzed. This was partially offset by the 31.8% decrease in fees from Global corporate banking which were negatively affected by the slower economic growth environment that lowered investment banking revenue.
Total financial transactions, net, which is the sum of net income from financial operations and foreign exchange gain (loss), totaled Ch$145,499 million in the year ended December 31, 2015, an increase of 29.3% compared to the same period in 2014. These results include the results of our Treasury Division’s trading business and financial transactions with customers, as well the results of our non-client treasury operations, mainly the Financial Management Division. The results from our Client treasury business were flat compared to 2014 and totaled Ch$83,845 million. The results from Santander Global Connect and market-making mainly include the results from the sale of derivatives, foreign exchange and fixed income instruments to our client base. In 2015, the results from Santander Global Connect increased 20.2%. The depreciation of the peso and higher market volatility led to a larger demand for hedging from our Corporate and Middle-market clients, driving this income line. The results from market-making with client services decreased 31.0% in 2014, mainly due to lower business volumes of tailor-made treasury services sold to specific corporate clients.
Results from non-client treasury income in 2015 increased 114.6% and totaled Ch$61,654 million. This higher result was mainly due to larger realized gains from the available for sale portfolio. The results from our available for sale portfolio increased 241.1% in 2015 compared to 2014 and totaled Ch$23,655 million. This higher gain arose from the decline in long-term interest rates, especially in the first quarter of 2015.
Other operating income totaled a gain of Ch$6,439 million in the year ended December 31, 2015, a 1.6% decrease compared to 2014. The main reasons for this decrease was lower income received from assets received in lieu of payment which decreased 12.7%.
Provisions for loan losses, net of recoveries totaled Ch$399,277 million in 2015 and increased 12.5% compared to the amount of provisions recorded in 2014. Provision for loan losses totaled Ch$454,462 million in 2015 compared to Ch$403,069 million in 2014 and increased 12.8%.
Provisions established for the Bank’s consumer loans increased by 27.8% to Ch$230,811 million in 2015 compared to 2014. This rise was mainly due to the release of consumer provisions of Ch$26,563 million during the second half of 2014 as a result of a re-calibration of the allowances model for consumer loans. Excluding this effect in 2014, consumer loan loss provisions grew 11.4%. This rise was mainly due to: (i) consumer loan growth, which reached 5.9% year over year in 2015 compared to 2014, and (ii) greater charge-offs of consumer loans assessed on a group basis. In light of lower economic growth, the Bank restricted renegotiations of consumer loans for customers presenting payment difficulties and this resulted in higher charge-offs.
Provision expense in commercial lending decreased 3.1% in 2015 compared to 2014. During the second half of 2014, and as a response to the ongoing improvement of the allowances models for loans, the Bank updated its allowances model for commercial loans analyzed on a group basis. This resulted in the recognition of Ch$45,141 million in provisions for our commercial loan book in 2014. Excluding this impact, provisions for commercial loans grew 24.6% in the period being analyzed. This rise was mainly due to higher provisions in Global corporate banking as the Bank downgraded various corporate clients affected by the slower economic environment, but which have not yet entered non-performing status. On the other hand, improvements in asset quality of middle-market and SME customers in the retail banking segment led to an improvement in commercial NPLs and impaired loans. The total NPL ratio in commercial loans decreased from 3.0% in 2014 to 2.6% in 2015 mainly due to improvements in asset quality of the middle-market customers and SMEs in the retail banking segment. The impaired commercial loan ratio reached 7.1% in 2015 compared to 7.2% at year-end 2014 due to improvements in asset quality among SME clients in retail banking.
Provisions for mortgage loans increased 48.1% in 2015 compared to 2014. This rise was mainly due to: (i) mortgage loan growth, which increased 17.8% in the period being analyzed, and (ii) greater charge-offs of mortgage loans. In light of lower economic growth, the Bank has been restricting the renegotiations of mortgage loans for customers presenting payment difficulties and this resulted in higher charge-offs. This is also leading to higher recoveries, which in the case of mortgage loans, increased 27.7% in 2015 compared to 2014. The Bank also focused mortgage loan growth on higher income earners that in general are less risky. As a result of the change in the loan mix and the higher charge-offs, mortgage loan asset quality improved in 2015 compared to 2014. Mortgage loan asset quality improved in 2015 compared to 2014. The non-performing ratio for mortgage loans declined from 2.7% in 2014 to 2.1% in 2015. The impaired mortgage loans ratio also improved from 5.6% in 2014 to 5.1% in 2015.
Additionally, the lower economic growth in 2015 resulted in a rise in charge-off of loans analyzed on an individual basis that totaled Ch$12,955 million in 2015 and rose 19.8% compared to 2014.
Recoveries on loans previously charged-off increased 15.5% in 2015 compared to 2014 (see “Provision for loan losses” in the table above). This was due to higher recoveries of charged-off commercial and residential mortgage loans mainly due to improved recovery efforts, especially in the Middle-market segment. As the Bank has improved the asset quality in consumer lending, the growth rate of recoveries has also diminished.
As a result of the factors mentioned above,net operating profit decreased 4.8% in 2015 compared to 2014 and totaled Ch$1,245,494 million.
Operating expenses increased 5.3% compared to 2014. The efficiency ratio was 43.8% in 2015 compared to 41.1% in 2014. The 14.2% increase in personnel salaries and expenses was mainly due to an increase in personnel compensation, higher severance payments and greater costs related to benefits included in the Bank’s collective bargaining agreement. Severance payments increased 222.4% to Ch$34,051 million. The Bank in 2015 executed a program to eliminate high level management positions in order to mitigate cost growth which entailed greater severance payments. In March 2014, a new collective bargaining agreement was signed with the main unions, which became effective on October 1, 2014, and which will expire on December 31, 2018. This resulted in an increase in certain benefits related to the Bank’s health insurance fund and other benefits.
Administrative expenses increased 7.5% in the year ended December 31, 2015 compared to the corresponding period in 2014. The increase in administrative expenses was mainly due to the 14.3% increase in maintenance, repair of property, plant and equipment, which totaled Ch$20,002 million. In 2015, the Bank continued to refurbish branches, open new Santander Select branches, expand the number of Middle-market centers and close Santander Banefe branches and other payment centers.
Impairment charges totaled Ch$21 million in 2015 compared to Ch$36,664 million in 2014. In 2014, the Bank initiated a plan to transform its business and operating model with a better focus on the client. In 2014, the Bank evaluated a number of applications that were in use or in development and tested them for impairment. Following the testing, in accordance with IAS 36, the Bank has recognized an impairment of Ch$36,556 million in 2014 due to the abandonment of unnecessary systems.
Depreciation and amortization expense increased 21.4% in 2015 compared to 2014 and totaled Ch$53,614 million. This rise was mainly due to the increase in depreciation of equipment that reached Ch$18,417 million in 2015 compared to Ch$12,331 million in 2014. This in line with the greater investments in hardware and other equipment as the Bank modernizes its branch network and systems.
Other operating expenses were Ch$58,729 million in 2015, a 0.4% decrease compared to 2014. In 2015, customer service expenses, which are related to our phone banking service, decreased 60.6% due to cost restructurings. Additionally in 2015, the Bank had less expenses related to adopting chip technology on cards. These lower other operating expenses were offset by greater provisions for assets received in lieu of payment.
Total income taxexpense in 2015 totaled Ch$76,395 million a 49.6% increase compared to 2014. This rise was mainly due to the higher effective tax rate paid by the Bank, which in 2015 reached 14.5% compared to 8.1% in 2014. The higher effective tax rate was mainly due to the higher statutory corporate tax rate which increased from 21% in 2014 to 22.5% in 2015. In 2015, the Bank also recognized lower credits from deferred tax assets that totaled Ch$10,600 million in 2015 compared to Ch$39,262 million in 2014. Finally, the lower CPI inflation rate in 2015 compared to 2014 also resulted in higher income tax expense since the Bank, for Chilean tax purposes, must re-value its capital each year for the variation in CPI inflation.
Results of operations for the years ended December 31, 2014 and 2013. Consolidated net income for the year ended December 31, 2014 increased 29.6% to Ch$575,890 million. Our return on annualized average equity was 21.4% in 2014 compared to 18.9% in 2013.
In 2014,net operating profit before loan losses was Ch$1,663,497 million, an increase of 7.8%9.5% compared to 2012.2013. Our net interest income increased 3.3%22.3% to Ch$1,076,7621,317,104 million in 2013 from Ch$1,042,734 million in 2012.2014 compared to 2013. The average balance of our interest-earning assets increased by 7.6%15.0% in 20132014 compared to 2012.2013. Our net interest margin decreasedincreased to 4.92% in 2014 compared to 4.63% in 2013 from 4.82% in 2012.2013. Net interest margins were negativelypositively affected by the fall inincrease of the average nominal rate we earned on our interest earning assets. This was mainly due to: (i)to a switchrise in the
UF inflation rate in 2014 compared to 2013 and higher loan mix away from higher yielding, but riskier segments such as Banefe,yields in Companies and institutions and Global banking and markets. This was only partially offset by the negative impact of maximum rate regulation on consumer loan yields, a lower interest rate environment and a declineloan growth focused in the UF inflation rate in 2013 compared to 2012.lower yielding, but less risky segments.
Net fees and commission income decreased 15.1%1.1% to Ch$229,836227,283 million in the yeartwelve-month period ended December 31, 20132014 compared to the same period in 2012. Fees in 2013 were negatively affected2013. In 2014, the Bank continued to experience positive client base and product growth. These positive commercial efforts continued to be offset by new regulations that lowered brokerage fees from brokering mandatory insurance for mortgage loans (mainly fire and earthquake insurance) and the difficulties in increasing fees following stricter regulations issued by the SERNAC Financiero, the newly formed consumer protection agency for financial services.
Results ofTotal financial transactions, net, which is the sum of net profitincome from financial operations and net foreign exchange gainsprofit (loss), totaled Ch$124,437112,565 million in the year ended December 31, 2013, an increase2014, a decrease of 51.2%9.5% compared to the same period in 2012.2013. These results include the results of our Treasury Division’s trading business and financial transactions with customers, as well the results of our non-client treasury operations, mainly the Financial Management Division. Client treasury services decreased 9.8% in 2013The positive results from our client Treasury business, which increased 6.0% compared to 20122013 and represented the majority of our financial transaction income. In 2013, the results from Santander Global Connect decreased 14.9% compared to 2012. In the first half of 2013, demand for hedging and derivative products on behalf of our clients was low given the low volatility of the exchange rate. Once the U.S. federal reserve announced the tapering of quantitative easing, the volatility of the exchange rate increased and business volumes recovered. The results from market-making with client services decreased 2.1%totaled Ch$83,837 million, were offset by a 36.6% decrease in 2013, mainly due to lower business volumes of tailor-made treasury services sold to specific corporate clients, especially in the first half of the year. The results from non-client treasury income, which totaled a gain of Ch$45,31928,728 million in 2013 compared2014. The fall in results from non-client treasury income was mainly due to a loss of Ch$5,395 million in 2012. In 2013,lower gains obtained from short-term interest rate differential between the net results of our Financial Management Division were positive, since theU.S. dollar and Chilean peso. The Bank has a greater spot position in liabilities denominated in foreign currency thanas compared to assets. These principally U.S. dollar-denominated liabilities are hedged through derivatives, (short term foreign currency swaps) withleaving minimal foreign currency exposure, but this does result in the existence of a short-term interest rate differential between US dollarsthe U.S. dollar and Chilean pesos,peso, which produces athe financial result registered in financial transactions, net.discussed here. This result is positive when interest rates in the USUnited States are trending up and local rates are falling and vice versa.is negative when the opposite occurs. In 2014 and 2013, local rates especially in the second half of the year decreased relative to US rates.U.S. rates, but this impact was more significant in 2013 when the end of quantitative easing was announced.
Other operating income totaled a gain of Ch$88,1556,545 million in the year ended December 31, 2013,2014, a 572.7% increase from the corresponding period in 2012.92.6% decrease compared to 2013. The main reasons for this increasedecrease was the gain of Ch$78,122 million recognized from the sale of our asset management subsidiary, Santander Asset Management S.A. Administradora General de Fondos.Fondos in 2013.
Provisions for loan losses, net of recoveries totaled Ch$371,462354,903 million in 20132014 and decreased 8.0%4.5% compared to the amount of provisions recorded in 2012.2013. This declinedecrease was mainly due to better asset quality in consumer and mortgage lending.
Provisions established for the Bank’s consumer loans decreased by 19.0% to Ch$180,666 million in 2014 compared to 2013. The non-performing ratio for consumer loans declined from 2.6% in 2013 to 2.5% in 2014 and the impaired mortgage loans ratio also improved from 9.7% in 2013 to 9.3% in 2014. This reduction in provision expense in consumer lending was also due to the ongoing improvement performed on the allowances models for consumer loans analyzed on a group basis. The model was calibrated with the aim of improving the prediction of client behavior and maintaining statistical and management standards. Part of these improvements consisted of the advancement of the models’ governance allowing technical and decisional approvals at different points of the approval process, more robust statistical processes and more historical information, allowing stronger parameters of the Probability of Non-Performance (PNP) and the Severity (SEV) involved in the provision calculation. These changes resulted in a reversal of provisions for consumer loans of Ch$26,563 million in 2014.
Provisions for mortgage loans decreased 44.9% in 2014 compared to 2013. The non-performing ratio for mortgage loans declined from 2.8% in 2013 to 2.7% in 2014 and the impaired mortgage loans ratio also improved from 5.7% in 2013 to 5.6% in 2014.
This reduction in provision expense in consumer lending was offset by the 29.1% rise in provision for loan losses in commercial lending, which totaled Ch$203,454 million in 2014. This was mainly due to the 20.4% decreaseongoing improvement performed on the allowances models for commercial loans analyzed on a group basis. The model was calibrated with the aim of improving the prediction of client behavior and maintaining statistical and management standards. Part of these improvements consisted of the advancement of the models’ governance allowing technical and decisional approvals at different points of the approval process, more robust statistical processes and more historical information, allowing stronger parameters of the Probability of Non-Performance (PNP) and the Severity (SEV) involved in netthe provision expense from consumer loans. In June 2012,calculation. These changes resulted in an increase in provisions for commercial loans of Ch$45,141 million in 2014.
Additionally, the Bank updated its allowance model for consumer loans, which mainly impacted the provisions established for renegotiated loans, andlower economic growth in 2014 resulted in a provisionrise in charge-off of Ch$24,753 million. Excluding this effect, provisions for consumer loans decreased 12.7%analyzed on an individual basis that totaled Ch$10,811 million in 20132014 and rose 33.9% compared to 2012. In 2013, the Bank2013.
Recoveries on loans previously charged-off increased 6.7% in order2014 compared to lower credit risk in its consumer loan book modified its strategy by focusing growth in less risky segments2013. This was due to individuals in Commercial banking and by decreasing consumerhigher recoveries of charged-off commercial loans, in Santander Banefe. As a result of this shifthigher recovery of charge-offs in strategy, impaired consumer loans decreased 11.1% and non-performing consumer loans decreased 21.1% in 2013 compared to 2012.the SME segment.
As a result of the factors mentioned above, net operating profit increased 14.2%14.0% in 20132014 compared to 20122013 and totaled Ch$1,147,7281,308,594 million.
Operating expenses increased 1.8%12.1% compared to 2012.2013. The efficiency ratio was 41.1% in 2014 compared to 40.2% in 2013 compared to 42.5% in 2012.2013. The 2.8%9.9% increase in personnel salaries and expenses was mainly due to higher salaries.salaries and bonuses. Total salary expenses includingand bonuses increased 4.0%9.4% in 20132014 compared to 2012,2013, totaling Ch$265,500290,509 million.
Administrative expenses increased 2.6%9.0% in 2013the year ended December 31, 2014 compared to 2012.the corresponding period in 2013. The increase in administrative expenses was mainly due to: (i)to the 33.1%13.9% increase in maintenance, repair of property, plant and equipment, which totaled Ch$17,498 million and the 7.6% rise in security and valuable transport services which increased fromexpenses that totaled Ch$11,929 million in 2012 to Ch$15,879 million in 2013.17,089 million. In 20132014, the Bank hadcontinued to increase the expenditure dedicated to securingrefurbish branches, open new Santander Select branches and protecting ATM machines given the increase in theftclose Santander Banefe branches.
Depreciation and more regulations regarding ATM security, (ii) the 17.2% increase in expenses relating to IT and communication systems from Ch$24,873 million in 2013 to Ch$29,144 million in 2012, in line with the Bank’s improvements of its CRM systems, phone banking and internet banking services; (iii) the 15.0% increase in expenses relating to outsourced computer services related to various IT upgrades, (iv) a 7.1% rise in branch rental expensesamortization expense decreased 27.7%, mainly due to the greaterlower depreciation and amortization of intangible assets. In 2014, the Bank, following an extensive analysis of its intangible assets, performed an extraordinary charge-off of those intangible assets, mainly software, that were obsolete or were not contributing to the Bank’s business or earnings.
Impairment charges increased 14,926.2% in 2014 compared to 2013 and totaled Ch$36,664 million. The Bank, in its strategic objectives, initiated a plan to transform its business and operating model with a better focus on the client. Therefore, there have arisen a number of branches rented following the sale of branches in 2012 and
2011 and (v) a 7.5% rise in expenses relating to the maintenance and repair of property asnew requirements for the Bank refurbished branchesto adapt to changing customer demands and introduced itsestablish new brand Santander Select and transformed 44 branches intoways to interact with customers. In conjunction with this new formatchange in strategic focus, we tested a number of applications that were in use or in development for mid-higher income clients.impairment. Following the testing, in accordance with IAS 36, the Bank has recognized an impairment of Ch$36,556 million in 2014.
Other operating expenses were Ch$52,33858,946 million in 2013,2014, a 12.2% decrease12.6% increase compared to 2012.2013. This decreaseincrease was mainly due to lowerhigher provisions and expenses for repossessed assetscontingencies that totaled Ch$4,82413,080 million in 20132014 compared to Ch$10,1765,805 million in 2012. This2013. Compared to 2013, the rise in provision for contingencies was offset by higher customer service expenses that includesdue to Ch$5 billion for future severance payments and Ch$2.4 billion for future costs related to our call center and higher other costs, which increased due to the Ch$2,283 million in expenses recorded in 2013 from the costs incurred in adopting chip technology for cards. This reflects the pending expense for customers that have yet to change their debit or credit card with the new chip technology, which is an on-going process. See “Note 33—Other operating income and expenses” and “Note 20-Provisions” to our ATM and credit cards.Audited Consolidated Financial Statements for more detail on Other operating expenses.
OurTotal income taxexpense in 2014 totaled Ch$51,050 million a 46.0% decrease compared to 2013. The Bank paid an effective tax rate of 8.1% in 2014 compared to 17.5% in 2013. The Chilean Government enacted in 2014 a reform to the corporate tax structure. The statutory corporate tax rate increased from 20% to 21% in 2014 and will rise to 22.5% in 2015. By the end of 2016 a corporation’s shareholders must opt between two new tax systems for a minimum period of five years. In one, the statutory income tax expense increased by 112.6%rate will rise to 24% in 2016 and 25% in 2017 and onward. In the year ended December 31, 2013 comparedother system, the statutory tax rate will rise to the same period25.5% in 2012. 2016 and 27% in 2017 and onward.
The lower effective tax rate was 17.5% in 2013 compared to 11.0% in 2012. The higher effective tax rate in 2013 compared to 2012 wasmainly due to the fact that in September 2012, the statutory tax rate was increased from 18.5% to 20.0% and this created an income tax reversalexpenses in 2014 included a one-time non-cash gain of Ch$16,22139,262 million in 2012, correspondingfrom the re-adjustments made to the adjustmentBank’s deferred tax asset base following passage of the new tax law. The Bank has more deferred tax assets than liabilities. This gain arises from the difference between the Bank’s accounting and tax books regarding how provisions and charge-offs are recognized. When the statutory rates were modified, the Bank’s net deferred tax assets increased as the future tax rates used to thecalculate this asset were gradually increased from 20% to 27%. Also, higher statutory rate.
Results of operations for the years ended December 31, 2012 and 2011. Consolidated net income for the year ended December 31, 2012 decreased 11.2% to Ch$361,433 million. Our return on annualized average equity was 16.5%CPI inflation resulted in 2012 compared to 20.4% in 2011.
In 2012,net operating profit before loan losses was Ch$1,408,710 million, an increase of 3.3% compared to 2011. Our net interest income increased 7.2% to Ch$1,042,734 million in 2012 from Ch$972,300 million in 2011. The average balancea greater revaluation of our interest-earning assets increased by 6.2% in 2012 compared to 2011. Our net interest margin improved 4 basis points to 4.82% in 2012 from 4.78% in 2011. This was mainly due to stricter pricing policy on our loans and an improved funding mix, partially offset by the lower yield earned on UF interest earning assets, which was mainly due to lower UF inflation in the year.
Net fees and commission income decreased 2.6% to Ch$270,572 million in the year ended December 31, 2012 compared to the same period in 2011. In 2012, the Bank executed a profound overhaul of its Client Relationship Management (CRM) systems and other changes to its commercial team front-office functions. The Bank expects this to improve productivity in the future, but in the short-term, this caused some disruptions in business activity due to training and other factors, which negatively affected fee income in the Commercial banking segment. At the same time, the Bank modified its admission policies for loan origination,capital, which resulted in lower business activity and client growth, especially in the individuals segment. Finally, the negative effects of the SERNAC Financiero increased the difficulty of rising fees.
Results of financial transactions, net, which is the sum of net profit from financial operations and net foreign exchange profits, totaled Ch$82,299 million in the year ended December 31, 2012, a decrease of 12.6% compared to the same period in 2011. These results include the results of our Treasury Division’s trading business and financial transactions with customers as well the results of our Financial Management Division. Client treasury services decreased 1.0% in 2012 compared to 2011 and represented the majority of our financial transaction income. In 2012, the results from Santander Global Connect (“SGC”) totaled Ch$52,703 million and decreased 15.8% compared to 2011, as 2011 figures included large non-recurring operations. Santander Global Connect is a specialized platform designed to facilitate the sale of derivatives to a broad range of companies in all segments and through the branch network. The results from market-making with client services increased 34.9% in 2012 compared to 2011, totaling Ch$34,991 million. This was mainly due to growth in tailor-made treasury services sold to specific corporate clients. The results from non-client Treasury Division income totaled a loss of Ch$5,395 million in 2012 compared to a gain of Ch$5,642 million in 2011. The non-client Treasury Division figures in 2011 included larger gains from the sale of loans compared to 2012 and the gain of Ch$5,705 million recorded from the sale of shares in Visa Inc.
Other operating income totaled a gain of Ch$13,105 million in the year ended December 31, 2012, and decreased 30.1% compared to 2011. The main reasons for this decrease were the lower gains from income from assets received in lieu of payments and lower income from the sale of branches. Branches are risk weighted at 100% and, therefore, from a regulatory capital perspective, it is more efficient to rent them than to own them.
Provisions for loan losses totaled Ch$403,692 million in 2012 and increased 27.7% compared to the amount of provisions recorded in 2011. The increase was mainly due to a rise in net provision expense of consumer loans. Net provisions established for the Bank’s consumer loans increased by 36.4% to Ch$280,094 million in 2012 compared to 2011. In June 2012, the Bank updated its allowance model for consumer loans, which mainly impacted the provisions established for renegotiated loans, and resulted in a provision of Ch$24,753 million. At the same time, the increase was also due to the tightening of renegotiation policies for consumer loans that led to a greater amount of impaired consumer loans entering non-performing status and subsequently being charged-off. The negative effects of the Ley Dicom, which reduced the effectiveness of the negative credit bureau data used in our credit scoring models, also impacted provisions and charge-offs in 2012.
As a result of the factors mentioned above, net operating profit decreased 4.0% in 2012 compared to 2011 and totaled Ch$1,005,018 million.
Operating expenses increased 6.1% in 2012 and totaled Ch$599,379 million compared to the corresponding period in 2011. Personnel salaries and expenses increased by 7.1% from the corresponding period in 2011 mainly due to higher salaries and headcount. Administrative expenses increased 9.9% in the year ended December 31, 2012 compared to the corresponding period in 2011. In 2012, the Bank focused on its Transformation Plan, which is a broad overhaul and improvement of our retail banking activities, especially among Individuals in Commercial banking and SMEs. This also entails greater expenses related to IT projects being carried out to improve productivity. Our efficiency ratio was 42.5% in 2012 and 41.4% in 2011.
Other operating expenses were Ch$59,637 million in 2012, a 7.1% decrease compared to 2011. This decrease was mainly due to: (i) lower provisions and expenses for repossessed assets that totaled Ch$10,176 million in 2012, compared to Ch$12,782 million in 2011 and (ii) lower operating charge-offs that totaled Ch$8,366 million in 2012, compared to Ch$9,884 million in 2011.
Ourincome tax expense decreased by 42.5% in the year ended December 31, 2012 compared to the same period in 2011. The effective tax rate was 11.0% in 2012 compared to 16.0% in 2011. In September 2012, the statutory tax rate was permanently increased from 18.5% to 20% and this created an income tax reversal of Ch$16,221 million in 2012, corresponding to the adjustment of deferred tax assets to the higher statutory rate.
Net interest income
Year ended December 31, | % Change | ||||
2013 | 2012 | 2011 | 2013/2012 | 2012/2011 | |
| (in millions of Ch$, except percentages) | |||||
| Individuals (Commercial banking) | 506,192 | 499,422 | 453,139 | 1.4% | 10.2% |
| Individuals (Santander Banefe) | 99,182 | 123,043 | 117,154 | (19.4%) | 5.0% |
| Small and mid-sized companies | 260,856 | 233,622 | 207,008 | 11.7% | 12.9% |
| Companies and institutional | 193,749 | 176,649 | 167,674 | 9.7% | 5.4% |
| Total commercial banking | 1,059,979 | 1,032,736 | 944,975 | 2.6% | 9.3% |
| Global banking & markets | 72,932 | 50,477 | 48,942 | 44.5% | 3.1% |
| Other (1) | (56,149) | (40,479) | (21,617) | 38.7% | 87.3% |
| Net interest income | 1,076,762 | 1,042,734 | 972,300 | 3.3% | 7.2% |
| Average interest-earning assets | 23,267,735 | 21,620,090 | 20,355,039 | 7.6% | 6.2% |
| Average non-interest-bearing demand deposits | 4,620,849 | 4,177,432 | 3,575,544 | 10.6% | 16.8% |
| Net interest margin (2) | 4.63% | 4.82% | 4.78% | ||
| Average shareholders’ equity and average non-interest-bearing demand deposits to total average interest-earning assets | 30.0% | 29.4% | 27.4% | ||
| Year ended December 31, | % Change | |||||||||||||||||||
| 2015 | 2014 | 2013 | 2015/2014 | 2014/2013 | ||||||||||||||||
| (in millions of Ch$, except percentages) | ||||||||||||||||||||
| Retail banking | 873,026 | 833,139 | 865,220 | 4.8 | % | (3.7 | %) | |||||||||||||
| Middle-market | 229,812 | 200,675 | 193,454 | 14.5 | % | 3.7 | % | |||||||||||||
| Total commercial banking | 1,102,838 | 1,033,814 | 1,058,674 | 6.7 | % | (2.3 | %) | |||||||||||||
| Global corporate banking | 85,553 | 71,992 | 72,659 | 18.8 | % | (0.9 | %) | |||||||||||||
| Other (1) | 66,815 | 211,298 | (54,571 | ) | (68.4 | %) | --% | |||||||||||||
| Net interest income | 1,255,206 | 1,317,104 | 1,076,762 | (4.7 | %) | 22.3 | % | |||||||||||||
| Average interest-earning assets | 28,523,005 | 26,759,696 | 23,267,735 | 6.6 | % | 15.0 | % | |||||||||||||
| Average non-interest-bearing demand deposits | 5,719,889 | 5,386,272 | 4,620,849 | 6.2 | % | 16.6 | % | |||||||||||||
| Net interest margin (2) | 4.40 | % | 4.92 | % | 4.63 | % | ||||||||||||||
| Average shareholders’ equity and average non-interest-bearing demand deposits to total average interest-earning assets | 29.9 | % | 30.2 | % | 30.0 | % | ||||||||||||||
| (1) | Consists mainly of net interest income from the Financial Management Division and the cost of funding our fixed income trading portfolio. Each segment obtains funding from its clients. Any surplus deposits are transferred to the Financial Management Division, which in turn makes such excess available to other areas that need funding. The Financial Management Division also sells the funds it obtains in the institutional funding market at a transfer price equal to the market price of the funds. |
| (2) | Net interest margin is net interest income divided by average interest-earning assets. |
For the years ended December 31, 20132015 and 20122014. Our net interest income totaled Ch$1,076,7621,255,206 million in the year ended December 31, 2013, an increase2015, a decrease of 3.3%4.7% from Ch$1,042,7341,317,104 million in 2012.2014. Average interest earning assets increased 7.6%6.6% in the same period, driven mainly by lending to Individuals in commercialthe Retail banking Companies and institutional lending, SME and Global banking & markets and a decrease in loans to individuals in Santander Banefe.Middle-market segments. Net interest margin in 20132015 was 4.63%4.40% compared to 4.82%4.92% in 2012.2014. Net interest margins were negatively affected by the decrease of the average nominal rate we earned on our interest earning assets. This was mainly due to: (i)to a switch in the loan mix away from higher yielding, but riskier segments such as Banefe, (ii) a lower interest rate environment and (iii) a declinedecrease in the UF inflation rate in 20132015 compared to 2012.2014, which in turn lowered the average nominal rate earned on UF denominated interest earning assets. This impact is more relevant than the decrease in funding cost of liabilities linked to the UF since the Bank has more assets than liabilities linked to the UF. We also earned a lower nominal rate on our peso-denominated interest earning assets. This was mainly due to loan growth focused in lower yielding, but less risky loans. This was reflected in the decrease in the average nominal interest rate earned on our peso denominated consumer loans that decreased from 17.2% in 2014 to 14.0% in 2015.
Average nominal interest rate earned on interest earning assets | 2013 | 2012 | 2011 | 2015 | 2014 | 2013 | |||||||||
| Ch$ | 11.7% | 12.2% | 11.2% | 9.6 | % | 10.3 | % | 11.7 | % | ||||||
| UF | 6.5% | 7.1% | 8.4% | 7.6 | % | 9.3 | % | 6.5 | % | ||||||
| Foreign currencies | 1.7% | 2.0% | 0.8% | 1.8 | % | 1.5 | % | 1.7 | % | ||||||
| Total | 8.0% | 8.8% | 8.7% | 7.3 | % | 8.3 | % | 8.0 | % | ||||||
The average rate paid on our interest bearing liabilities decreased from 5.3%4.7% in 20122014 to 4.6%4.0% in 2013.2015. This was mainly due to a lower rate paid on UF denominated liabilities as a result of the lower UF inflation in the year. The Bank’s funding mix also improvedAs a result, the average nominal rate paid on interest bearing liabilities denominated in 2013. The ratio of average shareholders’ equity and average non-interest bearing demand depositsUF decreased to total average interest earning assets increased from 29.4%7.2% in 2012 to 30.0% in 2013. Average non-interest bearing demand deposits increased 10.6% in 20132015 compared to 2012.8.4% in 2014. At the same time and despite rising short-term interest rates, the average nominal rate paid on peso denominated interest bearing liabilities also decreased from 6.0% in 2014 to 4.4% in 2015, reflecting positive management of time deposits costs with our clients.
Average nominal interest rate paid on interest bearing liabilities | 2013 | 2012 | 2011 |
| Ch$ | 6.0% | 6.2% | 6.3% |
| UF | 5.9% | 6.6% | 8.1% |
| Foreign currencies | 1.9% | 2.7% | 0.9% |
| Total | 4.6% | 5.3% | 5.1% |
| Average nominal interest rate paid on interest bearing liabilities | 2015 | 2014 | 2013 | |||||||||
| Ch$ | 4.4 | % | 6.0 | % | 6.0 | % | ||||||
| UF | 7.2 | % | 8.4 | % | 5.9 | % | ||||||
| Foreign currencies | 1.3 | % | 0.7 | % | 1.9 | % | ||||||
| Total | 4.0 | % | 4.7 | % | 4.6 | % | ||||||
The changes in net interest income by sub-segmentsegment in 20132015 as compared to 20122014 were as follows:
| · | Net interest income from |
| · | Net interest income from |
| · | Net interest income from |
| · | Other net interest income consists mainly of net interest income from the available for sale investment portfolio and deposits in the Central Bank and the financial cost of supporting our cash position and investment portfolio for trading, the interest income from which is recognized as net income from financial operations and not interest income. The result of the Bank’s inflation gap is also included in this line. The net interest income included as “other” totaled a |
| 2014. |
The following table shows our balances of loans and accounts receivable from customers and interbank loans by segment and sub-segment at the dates indicated.
Year ended December 31, | % Change | ||||
2013 | 2012 | 2011 | 2013/2012 | 2012/2011 | |
| (in millions of Ch$, except percentages) | |||||
| Individuals (Commercial banking) | 9,710,249 | 8,941,860 | 8,484,493 | 8.6% | 5.4% |
| Individuals (Santander Banefe) | 727,452 | 730,362 | 804,852 | (0.4%) | (9.3%) |
| Small and mid-sized companies | 3,223,215 | 2,890,251 | 2,560,736 | 11.5% | 12.9% |
| Companies and institutional | 5,031,752 | 4,414,211 | 4,005,908 | 14.0% | 10.2% |
| Global banking & markets | 2,219,045 | 1,863,595 | 1,494,752 | 19.1% | 24.7% |
| Other (1) | 149,048 | 126,373 | 84,041 | 17.9% | 50.4% |
| Total loans | 21,060,761 | 18,966,652 | 17,434,782 | 11.1% | 8.8% |
| Year ended December 31, | % Change | |||||||||||||||||||
| 2015 | 2014 | 2013 | 2015/2014 | 2014/2013 | ||||||||||||||||
| (in millions of Ch$, except percentages) | ||||||||||||||||||||
| Retail banking | 17,034,707 | 15,191,808 | 13,703,528 | 12.1 | % | 10.9 | % | |||||||||||||
| Middle-market | 6,006,282 | 5,443,983 | 5,035,780 | 10.3 | % | 8.1 | % | |||||||||||||
| Global corporate banking | 2,178,643 | 2,201,913 | 2,268,440 | (1.1 | %) | (2.9 | %) | |||||||||||||
| Other (1) | 81,125 | 54,945 | 53,013 | 47.6 | % | 3.6 | % | |||||||||||||
| Total loans | 25,300,757 | 22,892,649 | 21,060,761 | 10.5 | % | 8.7 | % | |||||||||||||
| (1) | Includes interbank loans. |
For the years ended December 31, 20122014 and 20112013. Our net interest income totaled Ch$1,042,7341,317,104 million in the year ended December 31, 2012,2014, an increase of 7.2%22.3% from Ch$972,3001,076,762 million in 2011.2013. Average interest earning assets increased 6.2%15.0% in the same period, driven mainly by lending to Companies, SMEin the Middle-market and GlobalRetail banking & markets.segments. Net interest margin in 20122014 was 4.82%4.92% compared to 4.78%4.63% in 2011.2013. Net interest margins were positively affected by the increase of the average nominal rate we earned on our non-inflation linked interest earning assets. This was mainly due to a stricter pricing policy on our loans.rise in the UF inflation rate in 2014 compared to 2013 and higher loan yields in the Middle-market segment and Global corporate banking. As financing sources from abroad became more expensive for Chilean companies, this permitted higher loan yields locally. This was only partially offset by the negative impacts of maximum rate regulation on consumer loan yields, a lower yield earned on UF interest earning assets, which decreased from 8.4%rate environment and loan growth focused in 2011 to 7.1% in 2012, mainly due to lower UF inflation in the year.yielding, but less risky segments.
Average nominal interest rate earned on interest earning assets | 2013 | 2012 | 2011 |
| Ch$ | 11.7% | 12.2% | 11.2% |
| UF | 6.5% | 7.1% | 8.4% |
| Foreign currencies | 1.7% | 2.0% | 0.8% |
| Total | 8.0% | 8.7% | 8.7% |
The average rate paid on our interest bearing liabilities increased from 5.1%4.6% in 20112013 to 5.3%4.7% in 2012.2014. This was mainly due to a higher rate paid on UF denominated liabilities as a result of the higher UF inflation in the year. The Bank’s funding mix also improved in 2012 and the2014. The ratio of average shareholders’ equity and average non-interest bearing demand deposits to total average interest earning assets increased from 27.4%30.0% in 20112013 to 29.4%30.2% in 2012.2014. Average non-interest bearing demand deposits increased 16.8%16.6% in 20122014 compared to 2011.2013.
The changes in net interest income by sub-segmentsegment in 20122014 as compared to 20112013 were as follows:
| · | Net interest income from |
| · | Net interest income from |
| · | Net interest income from |
| · | Other net interest income consists mainly of net interest income from the available for sale investment portfolio and deposits in the Central Bank and the financial cost of supporting our cash position and investment portfolio for trading, the interest income from which is recognized as net income from financial operations and not interest income. The result of the Bank’s inflation gap is also included in this line. The net interest income included as “other” totaled a |
Fee and commission income
For the years ended December 31, 20132015 and 20122014. Net fees and commission income decreased 15.1%increased 4.6% to Ch$229,836237,627 million in the twelve-month period ended December 31, 20132015 compared to the same period in 2012.2014. In 2013,2015, the Bank completedcontinued to experience positive client base and product growth that drove fee growth in various products. The following table sets forth certain components of our income from services (net of fees paid to third parties directly connected to providing those services, principally fees relating to credit card processing and ATM network administration) in the years ended December 31, 2015, 2014 and 2013.
| Year ended December 31, | % Change | |||||||||||||||||||
| 2015 | 2014 | 2013 | 2015/2014 | 2014/2013 | ||||||||||||||||
| (in millions of Ch$) | ||||||||||||||||||||
| Credit, debit and ATM cards | 46,066 | 43,161 | 39,325 | 6.7 | % | 9.8 | % | |||||||||||||
| Collections | 30,399 | 35,355 | 45,190 | (14.0 | %) | (21.8 | %) | |||||||||||||
| Insurance brokerage | 39,252 | 34,695 | 32,253 | 13.1 | % | 7.6 | % | |||||||||||||
| Letters of credit | 35,276 | 32,403 | 30,131 | 8.9 | % | 7.5 | % | |||||||||||||
| Checking accounts | 30,291 | 29,031 | 28,044 | 4.3 | % | 3.5 | % | |||||||||||||
| Custody and brokerage services | 8,685 | 8,307 | 6,195 | 4.6 | % | 34.1 | % | |||||||||||||
| Lines of credit | 6,597 | 7,015 | 7,025 | (6.0 | %) | (0.1 | %) | |||||||||||||
| Asset management | – | – | 31,154 | – | (100.0 | %) | ||||||||||||||
| Others | 41,061 | 37,316 | 10,519 | 10.0 | % | 254.7 | % | |||||||||||||
| Total fees and commission income, net | 237,627 | 227,283 | 229,836 | 4.6 | % | (1.1 | %) | |||||||||||||
Fees from credit, debit and ATM cards increased by 6.7% in 2015, reflecting the positive growth of the usage of the Bank’s credit and debit cards. Active credit cards totaled 1,936,697 as of October 2015, the latest market data available and increased 3.1% compared to the same period in 2014.
Fees from collections decreased by 14.0% in 2015 compared to 2014. In 2015, we once again auctioned to the lowest bidder the mandatory insurance products that are sold with mortgage loans. This negatively impacted collection fees where this income is recognized.
Insurance brokerage fees increased 13.1% as business volumes recovered in line with a recovery in client and product growth.
Fees from letters of credit and other contingent operations increased 8.9% in 2015. This increase was mainly due to positive performance of our international and foreign trade financing businesses with clients and also due to the depreciation of the peso against the U.S. dollar since this business is mainly transacted in foreign currency.
Fees from checking accounts increased 4.3% in 2015 compared to 2014. This was mainly due to a rise in the Bank’s checking account base. According to the latest data published by the SBIF as of December 2015, the Bank’s checking accounts totaled 852,492 compared to 815,182 in 2014 or a growth of 5.5%. Higher checking account balances both in retail banking as well as an increase in corporate cash management services also boosted fee growth in this product.
Brokerage and custody fees increased 4.6% in 2015 as compared to 2014. Despite lack luster performance of local equity markets, which hurt brokerage activity, the depreciation of the peso against the dollar positively affected brokerage and custody fees. The Bank also saw an increase in custody services with corporate clients.
Fees from lines of credit decreased 6.0% in 2015 compared to 2014. Lower spending on behalf of individuals resulted in less usage of lines of credit attached to checking accounts. At the same time, as the Bank continued to de-risk its retail loan book, it reduced its exposure of lines of credit among low income earners.
Fees from our asset management business totaled Ch$0 in 2015 and 2014. In December 2013, our Asset Management business was sold. In 2014 and 2015, the Bank continued to broker asset management products for Santander Asset Management. These brokerage fees are included as other income from fees.
The rise in other fee income of 10.0% in 2015 compared to 2014 was mainly due to higher fees from the brokerage of asset management services. As mentioned in the paragraph above, the Bank is no longer in the asset management business, but serves as an exclusive broker for Santander Asset Management, the acquirer of our asset management business. In 2015, asset management brokerage fees totaled Ch$36,182 million and increased 16.8% compared to 2014. The positive growth of our client base among high income earners led to higher brokerage fees of asset management products.
The following table sets forth, for the periods indicated our fee income broken down by segment and sub-segment for the periods indicated:
| Year ended December 31, | % Change | % Change | ||||||||||||||||||
| 2015 | 2014 | 2013 | 2015/2014 | 2014/2013 | ||||||||||||||||
| (in millions of Ch$) | ||||||||||||||||||||
| Retail banking | 190,380 | 175,007 | 184,766 | 8.8 | % | (5.3 | %) | |||||||||||||
| Middle-market | 28,537 | 27,055 | 29,199 | 5.5 | % | (7.3 | %) | |||||||||||||
| Global corporate banking | 15,231 | 22,338 | 17,432 | (31.8 | %) | 28.1 | % | |||||||||||||
| Other | 3,479 | 2,883 | (1,561 | ) | 20.7 | % | --% | |||||||||||||
| Total fees and commission income, net | 237,627 | 227,283 | 229,836 | 4.6 | % | (1.1 | %) | |||||||||||||
Fees from Retail banking increased 8.8% in 2015 compared to 2014. Since mid-2013, the Bank has been executing a profound overhaul of its Client Relationship Management (CRM) systems, client service and other changes to its commercial team front-office functions.functions, which has continued to increase product sales and usage. This has resultedled to high fee growth among retail bank clients, especially cards, insurance brokerage, brokerage of asset management products and checking accounts. Total retail clients reached 3.38 million at year-end 2015 and increased 1.6%. Total retail clients with a checking account increased 6.4% to 692,359 and loyal retail clients (a new internal measure that considers the amount of products a client has, uses and their profitability) increased 4.8% to 519,889 by year-end 2015.
The 5.5% increase in fees from the Middle-market segment was mainly due to the positive expansion of business volumes in this segment, which led to greater product usage.
Fees from the Global corporate banking segment decreased 31.8% in 2015 compared to 2014. In 2015, this segment saw a reduction in investment banking activities such as bond issuances and financial advisory, mainly due to the slower economic growth.
For the years ended December 31, 2014 and 2013. Net fees and commission income decreased 1.1% to Ch$227,283 million in the twelve-month period ended December 31, 2014 compared to the same period in 2013. In 2014, the Bank continued to experience positive client base and product growth. This wasThese positive commercial efforts continued to be offset by the new regulations that lowered fees from brokeringcollecting mandatory insurance for mortgage loans (mainly fire and earthquake insurance) and the difficulties in increasing fees following stricter regulations issued by the SERNAC Financiero, the newly formed consumer protection agency for financial services. See “Item 3. Key Information—D. Risk Factors—Chile’s banking regulatory and capital markets environment is continually evolving and may change.”
The following table sets forth certain components of our incomeFees from services (net of fees paid to third parties directly connected to providing those services, principally fees relating to credit, card processingdebit and ATM network administration)cards increased by 9.8% in 2014, reflecting the years ended December 31, 2013, 2012positive growth of the usage of the Bank’s credit and 2011.debit cards. Active credit cards totaled 1,877,589 at year-end 2014 and increased 3.3% compared to year-end 2013.
Year ended December 31, | % Change | ||||
2013 | 2012 | 2011 | 2013/2012 | 2012/2011 | |
| (in millions of Ch$) | |||||
| Collections | 45,190 | 56,472 | 61,803 | (20.0%) | (8.6%) |
| Credit, debit and ATM cards | 39,325 | 53,934 | 59,525 | (27.1%) | (9.4%) |
| Insurance brokerage | 32,253 | 32,499 | 34,066 | (0.8%) | (4.6%) |
| Asset management | 31,154 | 33,414 | 37,618 | (6.8%) | (11.2%) |
| Letters of credit | 30,131 | 28,523 | 24,388 | 5.6% | 17.0% |
| Checking accounts | 28,044 | 28,755 | 28,725 | (2.5%) | 0.1% |
| Custody and brokerage services | 6,195 | 9,585 | 10,517 | (35.4%) | (8.9%) |
| Lines of credit | 7,025 | 9,296 | 11,602 | (24.4%) | (19.9%) |
| Others | 10,519 | 18,094 | 9,592 | (41.9%) | 88.6% |
| Total fees and commission income, net | 229,836 | 270,572 | 277,836 | (15.1%) | (2.6%) |
Fees from collections decreased by 20.0%21.8% in 20132014 compared to 2012.2013. In July 2012, new regulations regarding the sale of mandatory insurance for mortgage loans was introduced. At year-end 2012, as per new regulations,2014, we once again auctioned to the lowest bidder the mandatory insurance products that are sold with mortgage loans. This negatively impacted collection fees where this income is recognized.
Fees from credit, debit and ATM cards decreased At the same time in 2014, per new regulations, we began provisioning as a fee expense a portion of the life insurance fees collected by 27.1%, reflecting the reduction of clients in the Bank’s Santander Banefe unit, as the Bank reduced its exposure to clients with unhealthy financial behavior. This hadon behalf of insurance companies. We provisioned a negative impact on certaintotal of Ch$6.8 billion of such fees specifically credit card, checking account and linein 2014. Several of credit fees, butthe loan products that the Bank expects thissells, mainly consumer and mortgage loans, are sold with a life insurance that covers the value of the loan in case of death. This insurance premium is collected by the Bank on behalf of insurance companies upfront at the moment the loan is originated to havecover a positive impact on asset quality in this segment in future periods. The Bank also reduced or eliminatedperiod equal to the maturity of the loan. Therefore, if the client pre-pays the loan, we must return to the insurance company a portion of the fee collected. Insurance brokerage fees on ATM and debit cardsincreased 7.6% as business volumes recovered in line with the new guidelines set by the SBIFa recovery in client and Sernac Financiero.
Fees from our asset management business decreased 6.8% in 2013 compared to 2012 due to lower growth of equity funds given the poor performance of the local stock market. In December 2013, our Asset Management business was sold for a price of Ch$90,281 million. This operation generated Ch$78,122 million of profit recorded within Other operating income. Going forward, the Bank will continue to distribute asset management products, but will no longer manage the assets.
Insurance brokerage fees decreased by 0.8% in 2013. This was mainly due to lower business volumes in our insurance brokerage subsidiary.
Fees from checking accounts decreased 2.5% in 2013 compared to 2012. This was mainly due to competitive pressures on checking account maintenance fees and increased restrictions on the increase of fees following the creation of the SERNAC Financiero.product growth.
Fees from letters of credit and other contingent operations increased 5.6%7.5% in 2013.2014. This decreaseincrease was mainly due to positive performance of our international and foreign trade financing businesses with clients and also due to the depreciation of the peso against the U.S. dollar since this business is mainly transacted in foreign currency.
Fees from checking accounts increased 3.5% in 2014 compared to 2013. This was mainly due to a rise in the Bank’s checking account base. According to the latest data published by the SBIF as of November 2014, the Bank’s checking accounts totaled 815,182 compared to 772,436 in 2013 or a growth of 5.5%. This was due in part to the implementation of an improved customer relationship management system and better quality of service standards. Higher checking account balances both in retail banking as well as an increase in corporate cash management services also boosted fee growth in this product.
Brokerage and custody fees decreased 35.4%increased 34.1% in 20132014 as compared to 2012. This fall was mainly due to the poor2013. Despite lack luster performance of the local equity markets, which hurt brokerage activity.activity, the depreciation of the peso against the dollar positively affected brokerage and custody fees. At the same time the placing of local fixed income instruments on behalf of our clients drove income in this product as well.
Fees from lines of credit decreased 24.4% in 2013were essentially flat compared to 2012.2013. Fee income from this product has stabilized as the client base expanded in 2014. This decrease was mainlyfollowing various years of decline due to regulations, a decrease in lines of credit as the Bank reduced its exposure to clients with unhealthy financial behavior though the Bank expects this to have a positive impact on asset quality in the Individuals segment in future periods. The decrease was also due to increasedand restrictions on the increase of fees following the creation of the SERNAC Financiero.
Fees from our asset management business totaled Ch$0 in 2014. In December 2013, our Asset Management business was sold. In 2014, the Bank continued to broker asset management products for Santander Asset Management. These brokerage fees are included as other income from fees.
The fallrise in other fee income of 41.9%254.7% in 20132014 compared to 20122014 was mainly due to higher fee expenses paid higher expenses related to fees paid for our collection efforts. This was offset by higher feesfrom the brokerage of asset management services. As mentioned in our Companies, SMES and Institutional business segments asthe paragraph above, the Bank focused on increasing banking services and activities with these clients. Fees from foreign currency exchange services increased 9.9% to Ch$3,554 millionis no longer in 2013 compared to 2012. Financial advisorythe asset management business, but serves as an exclusive broker for Santander Asset Management, the acquirer of our asset management business. In 2014, asset management brokerage fees increased 5.8% to Ch$6,146 million in 2013 compared to 2012. Fees from office banking totaled Ch$1,812 million and increased 22.3% in 2013 compared to 2012 due to greater usage of this platform by Company30,984 million.
By reporting segment clients.
The following table sets forth, for the periods indicated our fee income broken down by segment and sub-segment forevolution was the periods indicated:following during 2014:
Year ended December 31, | % Change | % Change | |||
2013 | 2012 | 2011 | 2013/2012 | 2012/2011 | |
| (in millions of Ch$) | |||||
| Individuals (Commercial banking) | 123,496 | 141,946 | 149,970 | (13.0%) | (5.4%) |
| Individuals (Santander Banefe) | 25,648 | 33,853 | 37,206 | (24.2%) | (9.0%) |
| Small and mid-sized companies | 37,641 | 38,115 | 38,274 | (1.2%) | (0.4%) |
| Companies and institutional | 29,249 | 28,373 | 26,141 | 3.1% | 8.5% |
| Global banking and markets | 18,022 | 19,159 | 31,908 | (5.9%) | (40.0%) |
| Other | (4,220) | 9,126 | (5,663) | –% | –% |
| Total fees and commission income, net | 229,836 | 270,572 | 277,836 | (15.1%) | (2.6%) |
Fees from Individualsour Retail banking segment decreased 5.3% in Commercial banking decreased 13.0% in 20132014 compared to 2012. Fees from Individuals2013. This was mainly due to several regulations that affected fee income in Santander Banefe decreased 24.2% in the same period. As mentioned, the Bank executed a profound overhaul of its Client Relationship Management (CRM) systems and other changes to its commercial team front-office functions. At the same time, the Bank modified its admission policies for loan origination, which resulted in lower business activity and client growth, especially in lower income individuals.2014, mainly collection fees. Additionally, fees in this segment were impacted by the SERNAC Financiero’s restrictions on the increase of fees and the new regulations regarding the selling of mandatory insurance for mortgage loans.
The 1.2% decrease in fees in 2013 from Small and mid-sized companies was mainly due to the SERNAC Financiero’s restrictions on the increase of fees to higher business activity in various products and services.
The 3.1% increase in fees in Companies and institutional sub-segments, respectively, reflects the higher fees from letters of credits, office banking and foreign currency services, as well as greater business activity in general with these clients.
Fees from the Global banking and markets segment decreased by 5.9%, primarily due to a fall in volumes our brokerage unit and other corporate fees.
For the years ended December 31, 2012 and 2011. Net fees and commission income decreased 2.6% to Ch$270,572 million in the twelve-month period ended December 31, 2012 compared to the same period in 2011.
Fees from Individuals in Commercial banking decreased 5.4% in 2012 compared to 2011. Fees from Individuals in Santander Banefe decreased 9.0% in 2012 compared to 2011. In 2012, the Bank executed a profound overhaul of its Client Relationship Management (CRM) systems and other changes to its commercial team front-office functions. At the same time, the Bank modified its admission policies for loan origination,has de-emphasized growth among low income earners, which resulted in lower business activity and client growth especially in individuals. Additionally, these fees were impacted by the SERNAC Financiero’s restrictions on the increasethis segment, which is mainly dedicated to banking lower income individuals that generate high levels of fees.
Fees from Small and mid-sized companies decreased 0.4% in 2012 compared to 2011. Despite higher business activity more intense competition lowered fee income.
The 8.5% increases7.3% decrease in fees in the CompaniesMiddle-market segment reflects the timid increase in business activity in general in line with the overall growth of the economy in 2014 and institutions sub-segments reflect the Bank’s increased focus on increasing banking services and activities with these clients in 2012. This included increases in cash management fees, foreign currency operations, financial advisory services and other net corporate service fees.negative impact of insurance brokerage fee regulations.
Fees from Global corporate banking increased 28.1%. In 2014, this segment saw an important increase in cash management services, custody, financial advisory and other corporate services. Despite lower GDP growth in 2014, many Chilean companies performed various important transactions locally with the Global banking and marketsBank.
Other income fee income that was not attributed to any business segment decreased by 40.0%, primarilytotaled a gain of Ch$2,883 million in 2014 compared to a loss of Ch$1,561 million in 2013. This improvement was mainly due to a fallthe fact that in volumes our brokerage unit and several other large one-time transactions executed in 2011 and2014 various fee expenses that were not repeated in 2012.previously assigned to any specific reporting segment were distributed among the different lines of business.
Financial transactions, net
The following table sets forth information regarding our income (loss) from financial transactions for the years ended December 31, 2013, 20122015, 2014 and 2011.2013.
Year ended December 31, | % Change | Year ended December 31, | % Change | % Change | |||||||||||||||||||||
2013 | 2012 | 2011 | 2013/2012 | 2012/2011 | 2015 | 2014 | 2013 | 2015/2014 | 2014/2013 | ||||||||||||||||
| (in millions of Ch$) | (in millions of Ch$) | ||||||||||||||||||||||||
| Net income from financial operations | (20,289) | (64,079) | 170,857 | (68.3%) | -% | (457,897 | ) | (159,647 | ) | (20,289 | ) | 186.8 | % | 686.9 | % | ||||||||||
| Foreign exchange profit (loss), net | 144,726 | 146,378 | (76,660) | (1.1%) | -% | 603,396 | 272,212 | 144,726 | 121.7 | % | 88.1 | % | |||||||||||||
| Total financial transactions, net | 124,437 | 82,299 | 94,197 | 51.2% | (12.6%) | 145,499 | 112,565 | 124,437 | 29.3 | % | (9.5 | %) | |||||||||||||
For the years ended December 31, 20132015 and 20122014. Total financial transactions, net, which is the sum of trading activities, fair value adjustments in our securities portfolionet income from financial operations and foreign exchange transactions,profit (loss), totaled Ch$124,437145,499 million in the year ended December 31, 2013,2015, an increase of 51.2%29.3% compared to the same period in 2012.2014. These results include the results of our Treasury Division’s trading business and financial transactions with customers, as well the results of our Financial Management Division.
Net income from financial operations was a loss of Ch$20,289457,897 million in 20132015 compared to a loss of Ch$64,079159,647 million in 2012. 2014.
| Year ended December 31, | % Change | % Change | ||||||||||||||||||
| 2015 | 2014 | 2013 | 2015/2014 | 2014/2013 | ||||||||||||||||
| (in millions of Ch$) | ||||||||||||||||||||
| Derivatives classified as trading | (503,981 | ) | (224,015 | ) | (68,201 | ) | 125.0 | % | 228.5 | % | ||||||||||
| Trading investments | 21,505 | 45,952 | 29,985 | (53.2 | %) | 53.2 | % | |||||||||||||
| Sale of loans | 863 | 6,070 | 3,177 | (85.8 | %) | 91.1 | % | |||||||||||||
| Available-for-sale instruments sales | 23,655 | 6,934 | 10,258 | 241.1 | % | (32.4 | %) | |||||||||||||
| Other results | 61 | 5,412 | 4,492 | (98.9 | %) | 20.5 | % | |||||||||||||
| Net income (loss) from financial operations | (457,897 | ) | (159,647 | ) | (20,289 | ) | 186.8 | % | 686.9 | % | ||||||||||
The lowerhigher loss from financial operations in 2015 compared to 20122014 was mainly due to:
| (i) |
| (ii) | The 53.2% lower gain from trading investments was mainly due to the lower UF inflation rate in 2015 compared to 2014. In |
| (iii) |
Year ended December 31, | % Change | % Change | ||||
2013 | 2012 | 2011 | 2013/2012 | 2012/2011 | ||
| (in millions of Ch$) | ||||||
| Derivatives classified as trading | (68,201) | (104,344) | 116,877 | (34.6%) | -% | |
| Trading investments | 29,985 | 36,338 | 38,819 | (17.5%) | (6.4%) | |
| Sale of loans | 3,177 | 4,835 | 9,692 | (34.3%) | (50.1%) | |
| Available-for-sale instruments sales | 10,258 | (1,764) | (3,356) | -% | (47.4%) | |
| Other results | 4,492 | 856 | 8,825 | 424.8% | (90.3%) | |
| Net income (loss) from financial operations | (20,289) | (64,079) | 170,857 | (68.3%) | -% | |
The net result from foreign exchange transactions totaled a gain of Ch$144,726603,396 million in 2015 compared to Ch$272,212 million.
| Year ended December 31, | % Change | % Change | ||||||||||||||||||
| 2015 | 2014 | 2013 | 2015/2014 | 2014/2013 | ||||||||||||||||
| (in millions of Ch$) | ||||||||||||||||||||
| Net profit or loss from foreign currency exchange differences | (197,875 | ) | (370,282 | ) | (242,841 | ) | (46.6 | %) | 52.5 | % | ||||||||||
| Hedge-accounting derivatives | 777,254 | 621,767 | 379,910 | 25.0 | % | 63.7 | % | |||||||||||||
| Translation gains and losses over assets and liabilities indexed to foreign currencies, net | 24,017 | 20,727 | 7,657 | 15.9 | % | 170.7 | % | |||||||||||||
| Net results from foreign exchange profit (loss) | 603,396 | 272,212 | 144,726 | 121.7 | % | 88.1 | % | |||||||||||||
The net result from foreign exchange transactions totaled a gain of Ch$146,378603,396 million in 2012. As mentioned, in 2013, the period end exchange rate depreciated 9.4%2015 compared to Ch$272,212 million.
Included in these results is the period end exchange rate of 2012. The average exchange rate in 2013 depreciated 1.2% compared to the average exchange rate in 2012. Foreignsub-item Net profit or loss from foreign currency exchange differences which totaled a net loss of Ch$242,841197,875 million in 2013 compared to a gain of Ch$270,990 million2015. Since the Bank, in 2012. This difference was mainly the result ofits spot position has more liabilities than asset in foreign currency, the depreciation of the Chilean peso against the U.S. dollar in 2013 compared to an appreciation2015 resulted in 2012.a net loss in this sub-item.
Year ended December 31, | % Change | % Change | |||
2013 | 2012 | 2011 | 2013/2012 | 2012/2011 | |
| (in millions of Ch$) | |||||
| Net profit or loss from foreign currency exchange differences | (242,841) | 270,990 | (257,986) | -% | -% |
| Hedge-accounting derivatives | 379,910 | (120,610) | 177,553 | -% | -% |
| Translation gains and losses over assets and liabilities indexed to foreign currencies, net | 7,657 | (4,002) | 3,773 | -% | -% |
| Net results from foreign exchange profit (loss) | 144,726 | 146,378 | (76,660) | (1.1%) | -% |
The effects onIncluded in the net incomeresults from foreign exchange profit (loss) are the change in valueresults from hedge-accounting derivative that are used to hedge the foreign currency risk of our spotlong-term foreign currency position are generally positive if the peso appreciates and negative if the peso depreciates as our spot funding base in foreign currency is larger than our spot asset position in foreign currency. This increase was largely offset by the fair value of foreign exchange derivatives in net gains from trading and fair value, as described above in connection with net income from financial operations. The derivatives included in this line itemfunding. These are mainly cross-currency swaps that hedge the interest rate risk of bonds issued abroad. Excluding interest rate and other derivatives that qualify forare accounted under hedge accounting rules. These derivatives produced a gain of Ch$777,254 million in 2015.
Finally, the conversionBank has assets and fair value ofliabilities that are in Chilean pesos, but indexed to foreign currency. In this case, we have more asset than liabilities linked to foreign currency derivatives are forand when the most part recognized aspeso depreciates this produces a translation gain or losswhich in the net results from2015 totaled Ch$24,017 million. This exposure is also hedged.
fair valueFor more details, see “Item 11. Quantitative and trading and not as foreign exchange transactions. This distorts the results from fair value and tradingQualitative Disclosures About Market Risk—E. Market Risks—Market risk management— Market risk – local and foreign exchange transactions.financial management.”
In order to more easily compare the results from financial transactions, net, we present the following table that separates the results by linelines of business.business for 2015, 2014 and 2013.
| Year ended December 31, | % Change | ||||
| 2013 | 2012 | 2011 | 2013/2012 | 2012/2011 | |
| (in millions of Ch$) | |||||
| Santander Global Connect | 44,860 | 52,703 | 62,625 | (14.9%) | (15.8%) |
| Market-making with clients | 34,258 | 34,991 | 25,930 | (2.1%) | 34.9% |
| Client treasury services | 79,118 | 87,694 | 88,555 | (9.8%) | (1.0%) |
| Sale of loans and charged-off loans | 3,218 | 4,835 | 9,692 | (33.4%) | (50.1%) |
| Proprietary trading | (1,963) | 8,213 | 16,022 | -% | (48.7%) |
| Financial Management Division (1) | 44,064 | (18,443) | (20,072) | -% | (8.1%) |
| Non-client treasury income (loss) | 45,319 | (5,395) | 5,642 | -% | -% |
| Total financial transactions, net | 124,437 | 82,299 | 94,197 | 51.2% | (12.6%) |
(1) Year ended December 31, % Change 2015 2014 2013 2015/2014 2014/2013 (in millions of Ch$) Santander Global Connect 60,995 50,740 44,860 20.2 % 13.1 % Market-making with clients 22,850 33,097 34,258 (31.0 %) (3.4 %) Client treasury services 83,845 83,837 79,118 --% 6.0 % Sale of loans and charged-off loans 863 6,070 3,177 (85.8 %) 91.1 % Proprietary trading (567 ) (1,113 ) (1,963 ) (49.0 %) (43.3 %) Financial Management Division and others (1) 61,358 23,771 44,105 158.1 % (46.1 %) Non-client treasury income (loss) 61,654 28,728 45,319 114.6 % (36.6 %) Total financial transactions, net 145,499 112,565 124,437 29.3 % (9.5 %)
| (1) | The Financial Management Division manages the structural interest rate risk, the structural position in inflation-indexed assets and liabilities, capital requirements and liquidity levels. The aim of the Financial Management Division is to provide stability and continuity in our net interest income from commercial activities, and to ensure that we comply with internal and regulatory limits regarding liquidity, regulatory capital, reserve requirements and market risk. |
Client treasury services totaled Ch$83,845 million and were flat compared to 2014. The results from Santander Global Connect and market-making mainly include the results from the sale of derivatives, foreign exchange and fixed income instruments to our client base. In 2015, the results from Santander Global Connect increased 20.2%. The depreciation of the peso and higher market volatility led to a larger demand for hedging from our Corporate and Middle-market clients, driving this income line. The results from market-making with client services decreased 31.0% in 2014, mainly due to lower business volumes of tailor-made treasury services sold to specific corporate clients. These results may vary year-to-year as some large operations with corporate clients may not be repeated in subsequent years.
The results from non-client treasury income increased 114.6% and totaled a gain of Ch$61,654 million in 2015 compared to Ch$28,728 million in 2014. These results include the income from sale of loans, including charged-off loans, proprietary trading and the results from our Financial Management Division.
The results from the sale of loans decreased 85.8% to Ch$863 million in 2015. The results from proprietary trading totaled a loss of Ch$567 million. The Bank since year-end 2012, no longer has a proprietary trading area and these results are from residual positions that are being closed.
In 2015, income from the Bank’s Financial Management Division increased 158.1% to Ch$61,358 million. This department manages the structural interest rate risk, the structural position in inflation-indexed assets and liabilities, capital requirements and liquidity levels. The aim of the Financial Management Division is to provide stability and continuity in our net interest income from commercial activities, and to ensure that we comply with internal and regulatory limits regarding liquidity, regulatory capital, reserve requirements and market risk.
Client treasury services decreased 9.8% in 2013 compared This higher result was mainly due to 2012 and represented the majority oflarger realized gains from our financial transaction income.available for sale portfolio. The results from Santander Global Connectour available for sale portfolio increased 241.1% in 2015 compared to 2014 and market-making mainly include the resultstotaled Ch$23,655 million. This higher gain arose from the sale of derivatives, foreign exchange and fixed income instruments to our client base. In 2013, the results from Santander Global Connect decreased 14.9% compared to 2012. In the first half of 2013, demand for hedging and derivative products on behalf of our clients was low given the low volatility of the exchange rate. Once the U.S. federal reserve announced the tapering of quantitative easing, the volatility of the exchange rate increased and business volumes recovered (see Graph). The results from market-making with client services decreased 2.1%decline in 2013, mainly due to lower business volumes of tailor-made treasury services sold to specific corporate clients,long-term interest rates, especially in the first halfquarter of the year. These results may vary year-to-year as some large operations with corporate clients may not be repeated in subsequent years.
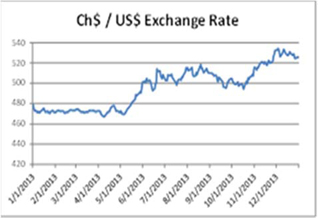
Source: Bloomberg
2015. The results from non-client treasury income totaled a gain of Ch$45,319 million in 2013 compared to a loss of Ch$5,395 million in 2012. In 2013, the net results of our Financial Management Division were positive, sincealso include the Bank has a greater spot position in liabilities denominatedoffset of the foreign currency impact on administrative expenses in foreign currency. As the peso depreciated against the Euro, the currency than assets. These principally U.S. dollar-denominated liabilitiesin which some of our IT costs are hedged through derivatives (short term foreign currency swaps) with minimal foreign currency exposure,denominated, this resulted in higher administrative expenses (See Item 5-Management Discussion and Analysis-Operating Expenses), but this does resultalso higher gains in the existence of a short-term interest rate differential between US dollars and Chilean pesos, which produces a financial result registered in financial transactions, net. This result is positive when interest rates in the US are trending up and local rates are falling and vice versa. In 2013, local rates, especially in the second half of the year began, to go down relative to US rates. This better result from our Financial Management division in this line is partially offset by lower net interest income where the interest earned on peso- or UF-denominated asset is declining and the interest expense of the lower-yielding U.S.$-denominated liabilities is rising. Division’s results.
For the years ended December 31, 20122014 and 20112013. Total financial transactions, net, which is the sum of trading activities, fair value adjustments in our securities portfolionet income from financial operations and foreign exchange transactions,profit (loss), totaled Ch$82,299
112,565 million in the year ended December 31, 2012,2014, a decrease of 12.6%9.5% compared to the same period in 2011.2013. These results include the results of our Treasury Division’s trading business and financial transactions with customers, as well the results of our Financial Management Division.
Net income from financial operations was a loss of Ch$64,079159,647 million in 20122014 compared to a gain of Ch$170,857 million in the corresponding period in 2011. In 2012, the Chilean peso appreciated 8.2%, compared to an 11.3% depreciation in 2011. This explains the difference in results from derivatives classified as trading, which totaled a loss of Ch$104,34420,289 million in 20122013. The higher loss from financial operations in 2014 compared to a gain of Ch$116,877 million in 2011. Derivatives are mainly composed of forward and swap contracts that hedge our spot position in foreign currency. Our spot position includes all assets and liabilities in foreign currency and assets and liabilities in Ch$ linked to U.S.$ that are not derivatives. For more details, see “Item 11. Quantitative and Qualitative Disclosures About Market Risk—E. Market Risks—Market risk management— Market risk – local and foreign financial management.” As the Chilean peso appreciates, we usually record a low or negative result from the fair value of derivatives held for trading. As the Chilean peso depreciates, we usually record a high result from the fair value of derivatives held for trading. This is offset by foreign exchange transaction results, which include the mark-to-market of our spot foreign currency position, net of hedge-accounted derivatives.
The lower results from trading investments are mainly due to lower interest income from this portfolio, as 94% of the assets in the portfolio are denominated in UFs and, therefore, when inflation decelerated in 2012, interest income from these assets decreased. The negative result from the available for sale portfolio is mainly due to higher long-term interest rates, which has a negative impact on the realized losses of these financial investments. The interest income from the available for sale portfolio is recorded as net interest income and interest income from the trading portfolio is recorded as income in net income from financial operations.
The income from the sale of loans totaled Ch$4,835 million in 2012 compared to Ch$9,692 million in 2011, mainly as a result of lower gains from the sale of loans that have been previously charged-off. The Bank has re-focused its collection efforts from selling charged-off loans to in-house collection efforts. These loans were sold to various non-related collection companies and asset managers.
The decrease in other results2013 was mainly due to the gain in 2011 of Ch$5,705 million recorded from the sale of all of the Bank’s shares in Visa Inc, which was included in other results in 2011.to:
| (i) | Higher losses from derivatives classified as trading. In 2014, the average yearly exchange rate depreciated 15.2% compared to 1.8% in 2013. Movements in foreign currency affect this line item because it includes the valuation adjustments of our derivatives classified as trading. The Bank’s spot position includes all assets and liabilities in foreign currency and assets and liabilities in Ch$ linked to U.S.$ that are not derivatives. Internal policy prohibits us from opening a large exposure in foreign currency, but we usually have more liabilities in foreign currency (mainly US$) than assets in our spot position due to our long-term funding in foreign currency and deposits denominated in foreign currencies from Chilean exporters. This net foreign currency liability spot position is hedged using different instruments. Our long-term foreign currency funding is hedged with cross-currency swaps that are matched and are accounted under hedge accounting rules. Therefore, the liability and the corresponding hedge are recognized in foreign exchange profits, described below and not in this line item. Excluding this part of our funding in foreign currency, we are left with the foreign currency deposits and other short-term foreign currency funding mechanisms, which are smaller than the foreign currency assets, mainly loans and cash. This difference is hedged with derivatives that are accounted as trading derivatives. As the peso depreciated against the dollar in 2014 at a higher rate than in 2013, the loss from derivatives classified as trading rose. For more details, see “Item 11. Quantitative and Qualitative Disclosures About Market Risk—E. Market Risks—Market risk management— Market risk – local and foreign financial management.” |
| (ii) | This was partially offset by higher gains from our investment portfolio classified as trading. In this line item the mark-to-market and interest income of the trading portfolio are recognized. In 2014, the higher UF inflation increased interest from this portfolio and falling interest rates increased the mark-to-market gains. This explains the 53.2% increase in results from the trading portfolio compared to 2013, which totaled Ch$45,952 million. |
The net result from foreign exchange transactions totaled a gain of Ch$146,378272,212 million in 20122014 compared to a loss of Ch$76,660144,726 million in 2011, due to the appreciation of the peso in 2012 compared to depreciation in 2011. Foreign currency exchange differences totaled a net gain of Ch$270,990 million in 2012 compared to a loss of Ch$257,986 million in 2011. This increasedifference was mainly the result of the appreciationgreater depreciation of the Chilean peso against the U.S. dollar in 20122014 compared to depreciation2013. This line item includes the net result of our spot position in 2011. foreign currency.
The effects on net income from the change in value of our spot foreign currency position are generally positive if the peso appreciates and negative if the peso depreciates as our spot funding base in foreign currency is larger than our spot asset position in foreign currency. This increase was largely offset by the fair value of foreign exchange derivatives in net gains from trading and fair value, as describedAs mentioned above, in connectiongeneral we do not open large exposures in foreign currency. The net foreign currency liability spot position is hedged using different instruments. Our long-term funding is hedged with net income from financial operations. The derivatives included in this line item are mainly cross-currency swaps that are matched and are accounted under hedge accounting rules. Therefore, the interest rate risk of bonds issued abroad. Excluding interest ratenet liability spot position and otherthe portion hedge with derivatives that qualify forare valued under hedge accounting are recognized in foreign exchange profits. The depreciation of the conversion and fair value of foreign currency derivatives are for the most part recognized aspeso in 2014 led to a gain orlarger loss in the net resultsprofit or loss from fairforeign currency exchange, which reflects the value and trading and not asof our spot foreign exchange transactions.currency position. This distortsloss totaled Ch$370,282 million in 2014 compared to a loss of Ch$242,841 million in 2013. At the same time, the results from fair valuehedge-accounting derivatives increased from Ch$379,910 million in 2013 to Ch$621,767 million in 2014 arising from the net long position we have in hedge accounting derivatives that hedge our long-term foreign currency funding. For more details, see “Item 11. Quantitative and tradingQualitative Disclosures About Market Risk—E. Market Risks—Market risk management— Market risk – local and foreign exchange transactions. In order to more easily compare the results from financial transactions, net, we present the following discussion bymanagement.”
By line of business.
Clientbusiness, client treasury services decreased 1.0%totaled Ch$83,837 million and increased 6.0% in 20122014 compared to 2011 and represented the majority of our financial transaction income.2013. The results from Santander Global Connect and market-making mainly include the results from the sale of derivatives, foreign exchange and fixed income instruments to our client base. In 2012,2014, the results from Santander Global Connect decreased 15.8% as 2011 figures included large non-recurring transactions that were not repeated in 2012 inincreased 13.1%. The depreciation of the Global bankingpeso led to a larger demand for hedging from our Corporate and markets segment.Companies clients driving this income line. The results from market-making with client services increased 34.9%decreased 3.4% in 2012,2014, mainly due to growth inlower business volumes of tailor-made treasury services sold to specific corporate clients. These results may vary year-to-year as some large operations with corporate clients may not be repeated in subsequent years.
The results from non-client treasury income decreased 36.6% and totaled a loss of Ch$5,395 million in 2012 compared to a gain of Ch$5,64228,728 million in 2011.2014 compared to Ch$45,319 million in 2013. These results include the income from sale of loans, including charged-off loans, proprietary trading and the results from our Financial Management Division. The non-client treasury figures in 2011 included larger gainsresults from the sale of loans comparedincreased 88.6% to Ch$6,070 million in 2014. The results from proprietary trading totaled a loss of Ch$1,113 million. The Bank since year-end 2012, no longer has a proprietary trading area and the gain recordedthese results are from residual positions that are being closed.
In 2014, income from the sale of shares in Visa Inc. Additionally, in 2012, the Bank reduced its involvement in proprietary trading activities, as this is not a core business unit.
Finally, in 2012, the net results of ourBank’s Financial Management Division were negative, sincedecreased 46.1% to Ch$23,771 million. This department manages the structural interest rate risk, the structural position in inflation-indexed assets and liabilities, capital requirements and liquidity levels. The aim of the Financial Management Division is to provide stability and continuity in our net interest income from commercial activities, and to ensure that we comply with internal and regulatory limits regarding liquidity, regulatory capital, reserve requirements and market risk. This lower result was mainly due to lower gains obtained from short-term interest rate differential between the U.S. dollar and the Chilean peso. As mentioned, the Bank has morea greater spot position in liabilities denominated in foreign currency than assets. These principally U.S. dollar-denominated liabilities are hedged through derivatives, (short term foreign currency swaps) withresulting in minimal foreign currency exposure, but due tothis does result in the existence of a short termshort-term interest rate differential between USU.S. dollars and Chilean pesos, thiswhich produces a financial costresult registered here. This result is positive when interest rates in financial transactions, net.the US are trending up and local rates are falling and vice versa. At the same time, our interest expense related to foreign currency exchange rose proportionally. In 2014 and 2013, local rates decreased relative to US rates, but this impact was more significant in 2013 when the end of quantitative easing was announced. This higher costlower result is also partially offset by higher yield on liquidity recognized in net interest income, wheresince the interestrise in inflation resulted in higher nominal yields earned onover the higher-yielding peso- or UF-denominated asset is recorded and the interest expense of the lower-yielding U.S.$-denominated liabilities is also recorded.Bank’s available for sale fixed income portfolio.
Other operating income
Year ended December 31, | % Change | Year ended December 31, | % Change | % Change | |||||||||||||||||||||
2013 | 2012 | 2011 | 2013/2012 | 2012/2011 | 2015 | 2014 | 2013 | 2015/2014 | 2014/2013 | ||||||||||||||||
| (In millions of Ch$) | (In millions of Ch$) | ||||||||||||||||||||||||
| Income from assets received in lieu of payment | 6,571 | 2,654 | 5,629 | 147.6% | (52.9%) | 2,455 | 2,811 | 6,571 | (12.7 | %) | (57.2 | %) | |||||||||||||
| Net results from sale of investment in other companies | 78,122 | 599 | - | 12942.1% | 100.0% | 617 | - | 78,122 | --% | --% | |||||||||||||||
| Operational leases | 328 | 142 | 305 | 131.0% | (53.4%) | 708 | 805 | 328 | (12.0 | %) | 145.4 | % | |||||||||||||
| Gain on sale of Bank property, plant and equipment | 176 | 9,194 | 11,863 | (98.1%) | (22.5%) | 381 | 687 | 176 | (44.5 | %) | 290.3 | % | |||||||||||||
| Recovery of generic provisions for contingencies | 77 | - | 100.0% | 0.0% | - | 315 | 77 | --% | 309.1 | % | |||||||||||||||
| Insurance coverage for earthquake | 725 | 262 | 437 | 176.7% | (40.0%) | 435 | 661 | 725 | (34.2 | %) | (8.8 | %) | |||||||||||||
| Other | 2,156 | 254 | 515 | 748.8% | (50.7%) | 1,843 | 1,266 | 2,156 | 45.6 | % | (41.3 | %) | |||||||||||||
| Sub-total other income | 3,462 | 9,852 | 13,120 | (64.9%) | (24.9%) | 3,367 | 3,734 | 3,462 | (9.8 | %) | 7.9 | % | |||||||||||||
| Total other operating income | 88,155 | 13,105 | 18,749 | 572.7% | (30.1%) | 6,439 | 6,545 | 88,155 | (1.6 | %) | (92.6 | %) | |||||||||||||
For the years ended December 31, 20132015 and 20122014. Total other operating income fell 1.6% in 2015 compared to 2014 and totaled a gain of Ch$88,155 million6,439 million. Other operating income was negatively affected by lower gains from income received from assets in lieu of payment, lower income from operational leases and less payments from insurance coverage for earthquake damages.
For the yearyears ended December 31, 2014 and 2013. Total other operating income fell 92.6% in 2014 compared to 2013 and totaled a 572.7% increase fromgain of Ch$6,545 million. This fall was mainly due to the corresponding periodfact that in 2012. The main reason for this increase was the2013 we recognized a non-recurring gain recognized from the sale of our asset management subsidiary, Santander Asset Management S.A. Administradora General de Fondos.
In December 2013 our subsidiary Santander Asset Management S.A. Administradora General de Fondos was sold through a formal offer of purchase received in May 2013. The sale price was Ch$90,281 million for 100% of the shares. 99.99% were acquired by SAM Investment Holdings Limited and the remaining 0.01% by Santander Asset Management UK Holdings Limited, both related to Grupo Santander. This operation generated a gain of Ch$78,122 million recorded within the net results from sale of investments in other companies. Additionally, the entities entered into a management service agreement for a 10-year period. TheThis transaction was reviewed by independent external evaluators who were of the opinion that the price offered was reasonable in consideration of their fair value appraisals. Based on this appraisal, the Audit Committee and the Board of Directors recommended the transaction. On December 5, 2013 an Extraordinary Shareholders’ meeting was held. The offer was accepted and thus, on December 6, 2013 the SBIF was informed of this transaction.
Apart from this item, other operating income was positivelynegatively affected by the higherlower gains from income received from assets in lieu of payment and negatively affected from lower gains from the sale of branches as we did2013 included various large operations that were not sell branchesrepeated in 2013.
Number of | Book value | Selling price | Profit | |
| (Ch$ millions) | ||||
| 2013 | – | – | – | – |
| 2012 | 17 | 6,367 | 14,931 | 8,564 |
| 2011 | 8 | 6,237 | 17,330 | 11,093 |
For the years ended December 31, 2012 and 2011. Total other operating income totaled a gain of Ch$13,105 million in the year ended December 31, 2012, a 30.1% decrease from the corresponding period in 2011. The main reasons for this decrease were the lower gains from income from assets received in lieu of payments and lower income from the sale of branches. In 2012, the profit from the sale of branches totaled Ch$8,564 million compared to Ch$11,093 million in 2011. Branches are risk weighted at 100% and, therefore, from a regulatory capital perspective, it is more efficient to rent them than to own them.
The decrease was partially offset by the Ch$ 599 million profit recognized from the sale of 7.71% of the Bank’s shares in Transbank S.A. to Banco BBVA. Transbank is the main credit card processor in Chile.2014.
Provision for loan losses
The following table sets forth, for the periods indicated, certain information relating to our provision for loan losses.
Year ended December 31, | % Change | % Change | ||||
2013 | 2012 | 2011 | 2013/2012 | 2012/2011 | ||
| (in millions of Ch$) | ||||||
| Provision for loan losses | (418,675) | (431,237) | (343,821) | (2.9%) | 25.4% | |
| Charge-off of loans analyzed on an individual basis (1) | (8,071) | (5,470) | (8,141) | 47.6% | (32.8%) | |
| Recoveries on loans previously charged-off | 55,284 | 33,015 | 35,825 | 67.5% | (7.8%) | |
| Provision for loan losses, net | (371,462) | (403,692) | (316,137) | (8.0%) | 27.7% | |
| Year end loans (2) | 21,060,761 | 18,966,652 | 17,434,782 | 11.0% | 8.8% | |
| Non-performing loans (3) | 613,301 | 597,767 | 511,357 | 2.6% | 16.9% | |
| Impaired loans (4) | 1,477,701 | 1,338,137 | 1,323,355 | 10.4% | 1.1% | |
| Allowance for loan losses (5) | 614,933 | 550,048 | 488,468 | 11.8% | 12.6% | |
| Impaired loans / Year end loans (4) | 7.02% | 7.06% | 7.59% | |||
| Non-performing loans / Year end loans (3) | 2.91% | 3.15% | 2.93% | |||
| Allowances for loan losses / Total loans | 2.92% | 2.90% | 2.80% | |||
| Coverage ratio non-performing loans (6) | 100.27% | 92.02% | 95.52% | |||
| Year ended December 31, | % Change | % Change | ||||||||||||||||||
| 2015 | 2014 | 2013 | 2015/2014 | 2014/2013 | ||||||||||||||||
| (in millions of Ch$) | ||||||||||||||||||||
| Provision for loan losses | (454,462 | ) | (403,069 | ) | (418,675 | ) | 12.8 | % | (3.7 | %) | ||||||||||
| Charge-off of loans analyzed on an individual basis | (12,955 | ) | (10,811 | ) | (8,071 | ) | 19.8 | % | 33.9 | % | ||||||||||
| Recoveries on loans previously charged-off | 68,140 | 58,977 | 55,284 | 15.5 | % | 6.7 | % | |||||||||||||
| Provision for loan losses, net | (399,277 | ) | (354,903 | ) | (371,462 | ) | 12.5 | % | (4.5 | %) | ||||||||||
| Year end loans (1) | 25,300,757 | 22,892,649 | 21,060,761 | 10.5 | % | 8.7 | % | |||||||||||||
| Non-performing loans (2) | 643,468 | 644,327 | 613,301 | (0.1 | %) | 5.1 | % | |||||||||||||
| Impaired loans (3) | 1,669,340 | 1,617,251 | 1,477,701 | 3.2 | % | 9.4 | % | |||||||||||||
| Allowance for loan losses (4) | 762,301 | 684,317 | 614,933 | 11.4 | % | 11.3 | % | |||||||||||||
| Impaired loans / Year end loans (5) | 6.60 | % | 7.06 | % | 7.02 | % | ||||||||||||||
| Non-performing loans / Year end loans (2) | 2.54 | % | 2.81 | % | 2.91 | % | ||||||||||||||
| Allowances for loan losses / Total loans | 3.01 | % | 2.99 | % | 2.92 | % | ||||||||||||||
| Coverage ratio non-performing loans (5) | 118.47 | % | 106.21 | % | 100.27 | % | ||||||||||||||
| (1) | ||
| Includes Ch$ | ||
| Non-performing loans include the aggregate unpaid principal and accrued but unpaid interest on all loans with at least one installment at least 90 days past-due. | ||
| Impaired loans | ||
| Includes Ch$ | ||
| Calculated as allowance for loan losses divided by non-performing loans. |
For the years ended December 31, 20132015 and 20122014. Provisions for loan losses, net of recoveries totaled Ch$371,462399,277 million in 20132015 and decreased 8.0%increased 12.5% compared to the amount of provisions recorded in 2012.2014.
Provision for loan losses, which includes the full amount of provisions recognized as a result of loan growth and change in risk classification as well as the net result of provisions and charge-offs of loans analyzed on a group basis, totaled Ch$418,675454,462 million in 20132015 compared to Ch$403,069 million in 2014 and decreased 2.9% from 2012.increased 12.8%. The following table breaks down provision for loans losses by loan product for the years ended December 31, 2013, 20122015, 2014 and 2011.2013.
% Change | |||||
2013 | 2012 | 2011 | 2013/2012 | 2012/2011 | |
| (in millions of Ch$) | |||||
| Interbank loans | (336) | (148) | 43 | 127.0% | -% |
| Commercial loans | (157,558) | (129,583) | (109,532) | 21.6% | 18.3% |
| Mortgage loans | (33,271) | (17,865) | (31,078) | 86.2% | (42.5%) |
| Consumer loans | (222,964) | (280,094) | (205,401) | (20.4%) | 36.4% |
| Contingent loans | (4,546) | (3,547) | 2,147 | 28.2% | (265.2%) |
| Total (1) | (418,675) | (431,237) | (343,821) | (2.9%) | 25.4% |
| % Change | ||||||||||||||||||||
| 2015 | 2014 | 2013 | 2015/2014 | 2014/2013 | ||||||||||||||||
| (in millions of Ch$) | ||||||||||||||||||||
| Interbank loans | (1,165 | ) | 494 | (336 | ) | --% | --% | |||||||||||||
| Commercial loans | (197,247 | ) | (203,454 | ) | (157,558 | ) | (3.1 | %) | 29.1 | % | ||||||||||
| Mortgage loans | (27,168 | ) | (18,346 | ) | (33,271 | ) | 48.1 | % | (44.9 | %) | ||||||||||
| Consumer loans | (230,811 | ) | (180,666 | ) | (222,964 | ) | 27.8 | % | (19.0 | %) | ||||||||||
| Contingent loans | 1,929 | (1,097 | ) | (4,546 | ) | (275.8 | %) | (75.9 | %) | |||||||||||
| Total(1) | (454,462 | ) | (403,069 | ) | (418,675 | ) | 12.8 | % | 3.7 | % | ||||||||||
| (1) | Includes the full amount of provisions recognized as a result of loan growth and change in risk classification as well as the net result of provisions and charge-offs of loans analyzed on a group basis |
Provisions established for the Bank’s consumer loans decreasedincreased by 20.4%27.8% to Ch$222,964230,811 million in 20132015 compared to 2012. In June 2012,2014. During the second half of 2014, and as a response to the ongoing improvement of the allowances models for loans, the Bank updated its allowanceallowances model for consumer loans, which mainly impactedloans. The models were calibrated with the provisions established for renegotiated loans,aim of improving the prediction of client behavior and resulted in a provisionmaintaining statistical and management standards. Part of Ch$24,753 million. Before
these improvements consisted of the June 2012 allowance model update, estimated loss rates were established byadvancement of the models’ governance allowing technical and decisional approvals at different points of the approval process, more robust statistical processes and more historical behavior of charge-offs net of recoveries for each risk profile. This methodology only considered historical charge-off data for each specific profile and did not include the use of any other statistical information. Since June 2012, the loss rate has been estimated as the productinformation, allowing stronger parameters of the Probability of Non-Performance (PNP) and the Severity (SEV). PNP and SEV have been established according to involved in the historical behaviorprovision calculation. These changes in 2014 resulted in the release of consumer provisions of Ch$26,563 million in 2014. As this is a change in estimation, this improvement was recognized under the profiles, and take into account a wider range"Provisions for loan losses" in the Consolidated Statement of variables.Income for the year in accordance with IAS 8. See “Item 5. Operating and Financial Review and Prospects—F.C. Selected Statistical Information-Classification of Loan Portfolio— Classification of Loan Portfolio-Loans analyzed on a group basis—Allowances for consumer loans.”
Excluding this effect in 2014, consumer loan loss provisions forgrew 11.4%. This rise was mainly due to: (i) consumer loan growth, which reached 5.9% year over year in 2015 compared to 2014, and (ii) greater charge-offs of consumer loans decreased 12.7% in 2013 compared to 2012.assessed on a group basis. In 2013,light of lower economic growth, the Bank in order to lower credit risk in its consumer loan book, modified its strategy by focusing growth in less risky segments to individuals in Commercial banking and by decreasingrestricted renegotiations of consumer loans for customers presenting payment difficulties and this resulted in Santander Banefe.higher charge-offs. As a result of this shiftpolicy, the consumer non-performing loans ratio reached 2.7% in strategy,2015 compared to 2.5% in 2014 as more clients became non-performing. Overall asset quality trends, measured according to the impaired consumer loansloan ratio, remained healthy in 2015. The impaired consumer loan ratio decreased 11.1% and non-performingfrom 9.3% in 2014 to 8.9% in 2015 as growth in the consumer loans decreased 21.1% in 2013 compared to 2012.loan book was focused on high income earners that are usually less risky.
Provision expense in commercial lending decreased 3.1% in 2015 compared to 2014. During the second half of 2014, and as a response to the ongoing improvement of the allowances models for loans, the Bank updated its allowances model for commercial loans increased 21.6%analyzed on a group basis. The models were calibrated with the aim of improving the prediction of client behavior and maintaining statistical and management standards. Part of these improvements consisted of the advancement of the models’ governance allowing technical and decisional approvals at different points of the approval process, more robust techniques of statistical processes and more historical information, allowing stronger parameters of the Probability of Non-Performance (PNP) and the Severity (SEV) involved in 2013 compared to 2012.the provision calculation. These changes resulted in an increase in commercial provisions of Ch$45,141 million. As this is a change in estimation, this impact was recognized under the "Provisions for loan losses" in the Consolidated Statement of Income for the year in accordance with IAS 8.
Excluding this impact, provisions for commercial loans grew 24.6% in the period being analyzed. This rise was mainly due to higher provisions in Global corporate banking as the Bank downgraded various corporate clients affected by the slower economic environment, but which have not yet entered non-performing status. On the other hand, asset quality in commercial loans in retail banking improved throughout 2015, as the Bank focused growth on less risky commercial retail customers. The NPL ratio in commercial loans decreased from 3.0% in 2014 to 2.6% in 2015 mainly due to improvements in asset quality in retail banking. The impaired commercial loan growth of 11.6%ratio reached 7.1% in the year, which increased gross provisions. At the same time, greater provisions were recognized as a result of the increase in the commercial impaired loan ratio from 6.8% in 20122015 compared to 6.9% in 2013. The ratio of non-performing commercial loans to total commercial loans remained stable7.2% at 3.1% in both periods.year-end 2014.
Provisions for mortgage loans increased 86.2%48.1% in 20132015 compared to 2012.2014. This rise was mainly due to an increaseto: (i) mortgage loan growth, which increased 17.8% in impairedthe period being analyzed, and (ii) greater charge-offs of mortgage loans. In light of lower economic growth, the Bank has been restricting the renegotiations of mortgage loans from 4.3%for customers presenting some payment difficulties and this resulted in 2012higher charge-offs. The Bank also focused mortgage loan growth on higher income earners that in general are less risky. As a result of the change in the loan mix and the higher charge-offs, mortgage loan asset quality improved in 2015 compared to 5.7% in 2013.2014. The non-performing ratio for mortgage loans declined from 3.0%2.7% in 20122014 to 2.8%2.1% in 2013. During the year, the indicators corresponding to the renegotiated (including renegotiated loans and modified loans, See “Item 5. Loan Portfolio—Renegotiated loans”) showed values that required updating of the model with more recent loan history and accordingly we updated it with the information available as of March, 2013. It should be noted that this loan category has changed materially in recent years, since after the earthquake of 2010, the Bank offered to its clients certain new restructuring solutions, which led to an increase in the2015. The impaired and modified mortgage loan portfolio from 5.9% in 2010 to 8.1% of our total loan portfolio by the end of 2013. Under this scenario the Risk Committee decided that the model needed to be updated in order to capture all relevant information associated with this fluctuation.
Simultaneously in 2013, the Bank resolved a class action suit brought forth by CONADECUS, a consumer protection group, and renegotiated a group of residential mortgage loans that had a bullet payment dueratio also improved from 5.6% in 2013, which
were offered2014 to clients5.1% in 2010, following the earthquake. This also led to the rise in impaired residential mortgage loans and provisions. The Bank’s non-renegotiated loan portfolio had a stable evolution in the year, reflecting the positive economic and employment environment.2015.
For a description of the provisions related to our residential mortgage loans and commercial loans analyzed on a group basis, please see “Item 5. Operating and Financial Review and Prospects—F.C. Selected Statistical Information—Classification of Loan Portfolio—Classification of Loan Portfolio—Loans analyzed on a group basis—Allowances for residential mortgage loans” and “—Loans analyzed on a group basis—Small and mid-sized commercial loans.”
Additionally, the lower economic growth in 2015 resulted in a rise in charge-off of loans analyzed on an individual basis that totaled Ch$12,955 million in 2015 and rose 19.8% compared to 2014.
Recoveries on loans previously charged-off increased 67.5%15.5% in 2015 compared to 2014. This was due to higher recoveries of charged-off commercial and residential mortgage loans mainly due to improved recovery efforts, especially in the year ended December 31, 2013 compared toMiddle-market segment. As the corresponding periodBank has improved the asset quality in 2012. This was a direct resultconsumer lending, the growth rate of higher incentives and a reorganization of our collection areas in 2012 and 2013 thatrecoveries has led to an overall improvement in recoveries.also diminished. The following table shows recoveries of loans previously charged-off by type of loan.
Year ended December 31, | % Change | Year ended December 31, | % Change | % Change | |||||||||||||||||||||
2013 | 2012 | 2011 | 2013/2012 | 2012/2011 | 2015 | 2014 | 2013 | 2015/2014 | 2014/2013 | ||||||||||||||||
| (in millions of Ch$) | (in millions of Ch$) | ||||||||||||||||||||||||
| Recovery of loans previously charged-off | |||||||||||||||||||||||||
| Consumer loans | 36,004 | 22,015 | 12,474 | 63.5% | 76.5% | 35,565 | 36,908 | 36,004 | (3.6 | %) | 2.5 | % | |||||||||||||
| Residential mortgage loans | 4,735 | 2,305 | 16,135 | 105.4% | (85.7%) | 6,543 | 5,122 | 4,735 | 27.7 | % | 8.2 | % | |||||||||||||
| Commercial loans | 14,545 | 8,695 | 7,216 | 67.3% | 20.5% | 26,032 | 16,947 | 14,545 | 53.6 | % | 16.5 | % | |||||||||||||
| Total recoveries | 55,284 | 33,015 | 35,825 | 67.5% | (7.8%) | 68,140 | 58,977 | 55,284 | 15.5 | % | 6.7 | % | |||||||||||||
In some instances, we will sell a portfolio of charged-off loans to a third party. Gain (loss) on these charged-off loans is recognized as net income from financial transactions as disclosed in “Note 28—27—Profit and Loss from Financial Operations” of our Audited Consolidated Financial Statements. The following table sets forth information about our sale of charged-off loans for the year ended December 31, 2013, 20122015, 2014 and 2011.2013.
Year ended December 31, | % Change | % Change | |||
2013 | 2012 | 2011 | 2013/2012 | 2012/2011 | |
| (in millions of Ch$) | |||||
| Gains on sale of loans previously charged-off | |||||
| Sale of charged-off loans | 1,500 | 2,090 | 7,324 | (28.2%) | (71.5%) |
| Year ended December 31, | % Change | % Change | ||||||||||||||||||
| 2015 | 2014 | 2013 | 2015/2014 | 2014/2013 | ||||||||||||||||
| (in millions of Ch$) | ||||||||||||||||||||
| Gains on sale of loans previously charged-off | (58 | ) | 4,809 | 1,500 | -% | 220.6 | % | |||||||||||||
The following table sets forth, for the periods indicated, our net provision expense broken down by business segment:
Year ended December 31, | % Change | % Change | |||
2013 | 2012 | 2011 | 2013/2012 | 2012/2011 | |
| (in millions of Ch$) | |||||
| Individuals (Commercial banking) | (157,697) | (229,958) | (185,885) | (31.4%) | 23.7% |
| Individuals (Santander Banefe) | (56,309) | (73,882) | (62,252) | (23.8%) | 18.7% |
| Small and mid-sized companies (SMEs) | (101,611) | (80,144) | (65,028) | 26.8% | 23.2% |
| Companies and institutional | (41,497) | (24,532) | (11,089) | 69.2% | 121.2% |
| Global banking & markets | (14,739) | 5,546 | 7,614 | -% | (27.2%) |
| Other | 391 | (722) | 503 | -% | -% |
| Total provisions, net | (371,462) | (403,692) | (316,137) | (8.0%) | 27.7% |
| Year ended December 31, | % Change | % Change | ||||||||||||||||||
| 2015 | 2014 | 2013 | 2015/2014 | 2014/2013 | ||||||||||||||||
| (in millions of Ch$) | ||||||||||||||||||||
| Retail banking | (332,657 | ) | (325,621 | ) | (315,982 | ) | 2.2 | % | 3.1 | % | ||||||||||
| Middle-market | (26,147 | ) | (22,034 | ) | (41,064 | ) | 18.7 | % | (46.3 | %) | ||||||||||
| Global corporate banking | (28,426 | ) | 1,924 | (14,697 | ) | --% | (113.1 | %) | ||||||||||||
| Other | (12,047 | ) | (9,172 | ) | 281 | 31.3 | % | --% | ||||||||||||
| Total provisions, net | (399,277 | ) | (354,903 | ) | (371,462 | ) | 12.5 | % | (4.5 | %) | ||||||||||
Net provisions expense from individuals bothretail banking increased 2.2% in commercial banking and Santander Banefe decreased in 20132015 compared to 2012 mainly due2014. Excluding the net impact of Ch$18,578 million as a result of modifications made to the lower provisions from consumerprovisioning models for loans as mentioned above.
Net provision expense from SMEs increased 26.8%. This was due to the 11.5% increase in lending and the increase in credit risk of SME loans and a slight deterioration in asset quality. This led to the 29.6% rise in provisions for commercial loans analyzedassessed on a group basis done in 2014, provision expense in retail banking increased 8.3%. This rise was mainly due to: (i) retail loan growth that totaled 12.1% in 2015 compared to 2014, and (ii) greater charge-offs. The Bank, in light of slower economic growth, restricted renegotiations of retail loans, which is mainly comprisedresulted in a greater amount of SMEs clients.loans being charged-off.
Net provision expense from Companies and institutionalin the Middle-market segment increased 69.2%. This was mainly due18.7% compared to 2014. In 2015, the 14.0% increase in lending and to the downgradeBank performed various downgrades of specific clients mainly in the salmon fishery, retail and construction sectors.industry.
Net provision expense from globalGlobal corporate banking and markets totaled a loss of Ch$14,73928,426 million compared to anet reversal of Ch$5,5461,924 million in 2012. This rise was mainly due to2014. In 2015, the downgrade ofBank downgraded specific clients in the constructionnon-bank financial sectors and retail sectors.a client in the agro-industrial sector due to company specific weaknesses.
Total provisions, net included in Others reached Ch$12,047 million compared to the Ch$9,172 million. In Other provision expense we include the impact of the fluctuation of the exchange rate on our provision expense. Of our total loan book, 13.3% is in foreign currency, mainly in dollars and consisting of short-term foreign trade loans. When the peso depreciates, as was the case in 2015 and 2014, the amount of provisions set aside for these loans translated to local currency rises. This impact has a corresponding hedge recognized in the results from financial transactions and for this reason it is not assigned to any reporting segment.
We believe that our loan loss allowances are currently adequate for all known and estimated incurred losses.
For the years ended December 31, 20122014 and 20112013. Provisions for loan losses, net of recoveries totaled Ch$403,692354,903 million in 20122013 and increased 27.7%decreased 4.5% compared to the amount of provisions recorded in 2011.2013.
Provision for loan losses, which includes the full amount of provisions recognized as a result of loan growth and change in risk classification as well as the net result of provisions and charge-offs of loans analyzed on a group basis, totaled Ch$431,237403,069 million in 20122014 compared to Ch$418,675 million in 2013 and increased 25.4% from 2011.decreased 3.7%.
Provisions established for the Bank’s consumer loans increaseddecreased by 36.4%19.0% to Ch$280,094180,666 million in 20122014 compared to 2011. As mentioned above,2013. It is also important to point out that since 2012, the Bank has been pursuing a strategy of growing in June 2012,higher income and less riskier segments in consumer lending and reducing relative exposure to the lower end of the consumer segment, which is mainly attended by Santander Banefe. This has resulted in improvements in asset quality of our consumer loan book. The non-performing ratio for consumer loans declined from 2.6% in 2013 to 2.5% in 2014 and the impaired mortgage loans ratio also improved from 9.7% in 2013 to 9.3% in 2014.
During the second half of 2014, and as a response to the ongoing improvement of the allowances models for loans, the Bank updated its allowanceallowances model for consumer loans, which mainly impactedloans. The models were calibrated with the provisions established for renegotiated loans,aim of improving the prediction of client behavior and maintaining statistical and management standards. Part of these improvements consisted of the advancement of the models’ governance allowing technical and decisional approvals at different points of the approval process, more robust statistical processes and more historical information, allowing stronger parameters of the Probability of Non-Performance (PNP) and the Severity (SEV) involved in the provision calculation. These changes resulted in a provisionthe release of consumer provisions of Ch$24,753 million.26,563 million in 2014. As this is a change in estimation, this improvement was recognized under the "Provisions for loan losses" in the Consolidated Statement of Income for the year in accordance with IAS 8. See “Item 5. Operating and Financial Review and Prospects—F.C. Selected Statistical Information-Classification of Loan Portfolio-ClassificationPortfolio— Classification of Loan Portfolio-Loans analyzed on a group basis-Allowancesbasis—Allowances for consumer loans.”
Other external factors also affected provisions and charge-offs for consumer loansThis reduction in 2012. In May 2011, Chile’s third-largest department store retailer, La Polar, experienced serious financial difficulties as a result of previously undisclosed and unsound credit practices that were made public once the financial situation of the firm was no longer sustainable. As was the case with other Chilean department stores, La Polar managed its own private label credit card business, which was fully integrated with its retail functions. In Chile, approximately 30-40% of all consumer loans are originated by non-bank entities, competing directly with our Santander Banefe segment. This event resulted in an increase in 2012 in the default rates in the consumer loan industry as banks and non-bank lenders simultaneously tightened credit policies, making credit less available to clients in this segment.
Additionally, this event also was an important trigger for the passage of the Ley Dicom. The Dicom database is a privately-run negative credit bureau database that stores an individual’s negative credit history for the past five years. This includes all past-due bank obligations, utilities bills and credit with retailers, bounced checks, past-due student loans and other past-due obligations. In February 2012, this Law was enacted and on a one-time basis, permanently eliminated from the Dicom database clients with negative credit history of Ch$2,400,000 (U.S.$4,800) or less. Before the Ley de Dicom was passed, 4.8 million names were listed in the Dicom database, and after its enactment, 2.3 million names were removed from the database. We estimate that 34% of all names of individuals originally removed from the Dicom database were back on by December 2012, and, therefore, we believe that the level of reliability of the Dicom database will be eventually restored. As of February 2012, the percentage of our loan portfolio to debtors that owed less than U.S.$4,800 was 4%. The enactment of the Ley de Dicom resulted in the removal of the names of 282,047 clients of the Bank from the Dicom negative credit bureau database, or the Dicom database, or 8% of our total clients. This also resulted in greater charge offs and provisionsprovision expense in consumer lending. For more information, please see “Item 3. Key Information—D. Risk Factors—Risks Associated with Our Business—The effectiveness of our credit risk management is affected by the quality and scope of information available in Chile.”
Provision expense for commercial loans increased 18.3% in 2012 compared to 2011. This rise was mainly due to commercial loan growth in the year in the Global banking & markets, Companies and SME segments. Thislending was offset by the update that was performed on29.1% rise in provision for loan losses in commercial lending, which totaled Ch$203,454 million in 2014. During the provisioningsecond half of 2014, and as a response to the ongoing improvement of the allowances models for loans, the Bank updated its allowances model for commercial loans analyzed on a group basisbasis. The models were calibrated with the aim of improving the prediction of client behavior and maintaining statistical and management standards. Part of these improvements consisted of the advancement of the models’ governance allowing technical and decisional approvals at different points of the approval process, more robust techniques of statistical processes and more historical information, allowing stronger parameters of the Probability of Non-Performance (PNP) and the Severity (SEV) involved in 2011. Before 2011,the provision calculation. These changes resulted in an increase in commercial provisions of Ch$45,141 million. As this is a change in estimation, this impact was recognized under the "Provisions for loan loss allowancelosses" in the Consolidated Statement of Income for this category of loans was mainly determined by the number of days a loan was past-due. Currently, provisions are set according to (i) performing status, (ii) if a client has been renegotiated or not,year in accordance with IAS 8.
(iii) whetherAt the clientsame time in 2014, the lower economic growth also negatively affected asset quality in commercial loans, especially in the SME segment. This is reflected in the ratio of commercial impaired loans to total commercial loans rose from 6.9% in 2013 to 7.2% in 2014, mainly due to a new client or an existing clientrise in impaired loans in the SME segment that is more sensitive to economic cycles and (iv) whether the client has collaterallower investment rates. In the middle-market and institutions and the global banking and markets segments, asset quality indicators were stable in connection with the loan. The total impact of this change on loan loss reserves was Ch$16,560 million in 2011.2014 compared to 2013.
Provisions established for mortgage loans decreased 42.5%44.9% in 20122014 compared to 2011. In June 2011,2013. This decrease was due to:
| (i) | The non-performing ratio for mortgage loans declined from 2.8% in 2013 to 2.7% in 2014 and the impaired mortgage loans ratio also improved from 5.7% in 2013 to 5.6% in 2014. |
| (ii) | Simultaneously in 2013, the Bank resolved a class action suit brought by CONADECUS, a consumer protection group, and renegotiated a group of residential mortgage loans that had a bullet payment due in 2013, which were offered to clients in 2010, following the earthquake. This also led to the rise in impaired residential mortgage loans and provisions in that year. |
For a description of the Bank modified its provisioning modelprovisions related to our residential mortgage loans and commercial loans analyzed on a group basis, please see “Item 5. Operating and Financial Review and Prospects—C. Selected Statistical Information—Classification of Loan Portfolio—Classification of Loan Portfolio—Loans analyzed on a group basis—Allowances for residential mortgage loans” and “—Loans analyzed on a group basis—Small and mid-sized commercial loans. As”
Additionally, the lower economic growth in 2014 resulted in a rise in charge-off of June 2011, residential mortgage loans are assignedanalyzed on an allowance level basedindividual basis that totaled Ch$10,811 million in 2014 and rose 33.9% compared to 2013.
Recoveries on credit risk profiles, which are determined utilizingloans previously charged-off increased 6.7% in 2014 compared to 2013. This was due to higher recoveries of charged-off commercial loans, indirectly a statistical model that considers: (i) a borrower’s credit history, (ii) whether the client is a new client or an existing client, (iii) whether the client is a Bank client or a Banefe client and (iv) whether this client has been renegotiatedreflection of higher charge-offs in the system. The total impactSME segment As the Bank has improved the asset quality in consumer lending, the growth rate of thisrecoveries has also diminished.
By business segments in 2014, net provision expense in retail banking grew 3.1% mainly due to the net effect of the change in provisioning models for loans assessed on loana group basis and weaker asset quality in SMEs. This was partially offset by improved credit quality of consumer loans.
Net provision expense from the Middle-market decreased 46.3%. In 2013, the Bank performed various downgrades of specific clients in the retails, salmon, fishery and construction sectors that were not repeated in 2014.
Net provision expense from Global corporate banking totaled a net reversal of Ch$1,924 million compared to a net loss reserves wasof Ch$16,25814,697 million in 2011.2013 when the Bank downgraded specific clients in the construction and retail sectors, which did not occur in 2014.
Operating expenses
The following table sets forth information regarding our operating expenses in the years ended December 31, 2013, 20122015, 2014 and 2011.2013.
Year ended December 31, | % Change | % Change | |||
2013 | 2012 | 2011 | 2013/2012 | 2012/2011 | |
| (in millions of Ch$) | |||||
| Personnel salaries and expenses | (308,344) | (299,904) | (280,040) | 2.8% | 7.1% |
| Administrative expenses | (188,191) | (183,379) | (166,825) | 2.6% | 9.9% |
| Depreciation and amortization | (61,074) | (56,369) | (53,466) | 8.3% | 5.4% |
| Impairment of property, plant and equipment | (244) | (90) | (116) | 171.1% | (22.4%) |
| Other operating expenses | (52,338) | (59,637) | (64,208) | (12.2%) | (7.1%) |
| Total operating expenses | (610,191) | (599,379) | (564,655) | 1.8% | 6.1% |
| Efficiency ratio(1) | 40.2% | 42.5% | 41.4% | ||
| Year ended December 31, | % Change | % Change | ||||||||||||||||||
| 2015 | 2014 | 2013 | 2015/2014 | 2014/2013 | ||||||||||||||||
| (in millions of Ch$) | ||||||||||||||||||||
| Personnel salaries and expenses | (387,063 | ) | (338,888 | ) | (308,344 | ) | 14.2 | % | 9.9 | % | ||||||||||
| Administrative expenses | (220,531 | ) | (205,149 | ) | (188,191 | ) | 7.5 | % | 9.0 | % | ||||||||||
| Depreciation and amortization | (53,614 | ) | (44,172 | ) | (61,074 | ) | 21.4 | % | (27.7 | %) | ||||||||||
| Impairment | (21 | ) | (36,664 | ) | (244 | ) | (99.9 | %) | 14,926.2 | % | ||||||||||
| Other operating expenses | (58,729 | ) | (58,946 | ) | (52,338 | ) | (0.4 | %) | 12.6 | % | ||||||||||
| Total operating expenses | (719,958 | ) | (683,819 | ) | (610,191 | ) | 5.3 | % | 12.1 | % | ||||||||||
| Efficiency ratio(1) | 43.8 | % | 41.1 | % | 40.2 | % | ||||||||||||||
| (1) | The efficiency ratio is the ratio of total operating expenses to total operating income. Total operating income consists of net interest income, fee income, financial transactions, net and other operating income. |
For the years ended December 31, 20132015 and 20122014. Operating expenses in the year ended December 31, 20132015 increased 1.8%5.3% compared to the corresponding period in 2012.2014. The efficiency ratio was 43.8% in 2015, 41.1% in 2014 and 40.2% in 2013 compared to 42.2% in 2012.2013.
The 2.8%14.2% increase in personnel salaries and expenses was mainly due to an increase in personnel compensation, higher salaries. Total salary expenses, including bonuses increased 4.0%severance payments and greater costs related to benefits included in 2013 comparedthe Bank’s collective bargaining agreement. The 9.5% increase in personnel compensation, which totaled Ch$233,707 million in 2015, was mainly due to: (i) growth in total headcount of 2.1% to 2012, totaling Ch$265,500 million. This rise was partially offset by lower costs11,723 people, (ii) the impact of the Bank’s stock based compensation plan asmeritocracy policies and (iii) the 2013 goals were not achievedimpact of CPI inflation on wages. In 2015, CPI inflation was 4.4% and lower costs ofall salaries are indexed to inflation per collective bargaining agreement. Severance payments increased 222.4% to Ch$34,051 million. The Bank in 2015 executed a program to eliminate high level management positions in order to mitigate cost growth which entailed greater severance payments. In March 2014, a new collective bargaining agreement was signed with the main unions, which became effective on October 1, 2014, and which will expire on December 31, 2018. This resulted in an increase in certain benefits related to the Bank’s pension plan. Some of the executives that qualified for this benefit are no longer employees for the Bank lowering the amount of this cost. Headcount as of December 31, 2013 totaled 11,516, a decrease of 1.7% from 2012. In December 2013, the Bank sold its asset management subsidiary which reduced headcount by 90 persons.health insurance fund and other benefits.
Administrative expenses increased 2.6%7.5% in the year ended December 31, 20132015 compared to the corresponding period in 2012.2014. The increase in administrative expenses was mainly due to: (i)to the 33.1%14.3% increase in securitymaintenance, repair of property, plant and valuable transportequipment, which totaled Ch$20,002 million. In 2015, the Bank continued to refurbish branches, open new Santander Select branches, expand the number of Middle-market centers and close Santander Banefe branches and other payment centers.
| Year ended December 31, | % Change | ||
| 2015 | 2014 | 2015/2014 | |
| Traditional branches | 276 | 273 | 1.1% |
| Middle-market centers | 8 | 5 | 60.0% |
| Santander Select | 53 | 51 | 3.9% |
| Banefe and other payment centers | 134 | 145 | (7.6%) |
| Total branches | 471 | 474 | (0.6%) |
The Bank’s total Outsourced service expenses increased 21.8% in 2015 compared to 2014 and totaled Ch$39,286 million. The Bank outsources various functions especially data processing and IT services. These increased as a result of the depreciation of the peso against the Euro, since several of the firms that provide the Bank with IT services which increasedare in Spain. Imbedded in the Bank results from financial transactions, net is an offsetting result, since this exposure to foreign currency is hedged. Finally the Bank marketing expenses rose 12.6% to Ch$11,92918,483 million as the Bank promoted more intensively various new products and was a sponsor for the Copa America tournament held in Chile in 2015.
Impairment charges totaled Ch$21 million in 20122015 compared to Ch$15,87936,664 million in 2013.2014. In 20132014, the Bank hadinitiated a plan to increasetransform its business and operating model with a better focus on the expenditure dedicated to securingclient. In 2014, the Bank evaluated a number of applications that were in use or in development and protecting ATM machines giventested them for impairment. Following the increasetesting, in theft and more regulations regarding ATM security, (ii)accordance with IAS 36, the 17.2% increase in expenses relating to the IT and communication systems fromBank has recognized an impairment of Ch$24,873 million to Ch$29,14436,556 million in 2013, in line with the Bank’s improvements of its CRM systems, phone banking and internet banking services; (iii) the 8.0% increase in expenses relating to outsourced services, (iv) a 7.1% rise in branch rental expenses2014 due to the greater numberabandonment of branches rented following the sale of branches in 2012 and 2011 and (v) a 7.5% rise in expenses relating to the maintenance and repair of property as the bank refurbished branches and introduced its new brand Santander Select and transformed 44 branches into this new format for mid-higher income clients.unnecessary systems.
Depreciation and amortization expense increased 8.3%,21.4% in 2015 compared to 2014 and totaled Ch$53,614 million. This rise was mainly due to higher amortization expensesthe increase in depreciation of intangible assets such as softwareequipment that reached Ch$18,417 million in 2015 compared to Ch$12,331 million in 2014. This in line with the greater investments in hardware and other computer systems that have been updated in recent periods.equipment as the Bank modernizes its branch network and systems.
Other operating expenses were Ch$58,729 million in 2015, a 0.4% decrease compared to 2014. In 2015, customer service expenses, which are related to our phone banking service, decreased 60.6% due to cost restructurings. Additionally in 2015, the Bank had less expenses related to adopting chip technology on cards. These lower other operating expenses were offset by greater provisions for assets received in lieu of payment. See “Note 33—Other operating income and expenses” to our Audited Consolidated Financial Statements for more detail on Other operating expenses.
The following table sets forth, for the periods indicated, our personnel salaries, administrative and depreciation and amortization expenses broken down by business segment. These amounts exclude impairment and other operating expenses.
Year ended December 31, | % Change | % Change | |||
2013 | 2012 | 2011 | 2013/2012 | 2012/2011 | |
| (in millions of Ch$) | |||||
| Individuals (Commercial banking) | (298,173) | (291,562) | (251,554) | 2.3% | 15.9% |
| Individuals (Santander Banefe) | (52,370) | (51,797) | (70,719) | 1.1% | (26.8%) |
| Small and mid-sized companies | (79,633) | (76,560) | (74,962) | 4.0% | 2.1% |
| Companies and institutional | (69,828) | (65,672) | (52,009) | 6.3% | 26.3% |
| Global banking and markets | (37,728) | (35,476) | (35,302) | 6.3% | 0.5% |
| Other | (20,121) | (18,675) | (15,901) | 7.7% | 17.4% |
| Total personnel, administrative expenses, depreciation and amortization and impairment(1) | (557,853) | (539,742) | (500,447) | 3.4% | 7.9% |
| Year ended December 31, | % Change | % Change | ||||||||||||||||||
| 2015 | 2014 | 2013 | 2015/2014 | 2014/2013 | ||||||||||||||||
| (in millions of Ch$) | ||||||||||||||||||||
| Retail banking | (533,086 | ) | (479,954 | ) | (435,837 | ) | 11.1 | % | 10.1 | % | ||||||||||
| Middle-market | (77,261 | ) | (66,321 | ) | (62,817 | ) | 16.5 | % | 5.6 | % | ||||||||||
| Global corporate banking | (49,533 | ) | (44,195 | ) | (38,270 | ) | 12.1 | % | 15.5 | % | ||||||||||
| Other | (1,328 | ) | 2,261 | (20,685 | ) | --% | (110.9 | %) | ||||||||||||
| Total personnel, administrative expenses, depreciation and amortization (1) | (661,208 | ) | (588,209 | ) | (557,609 | ) | 12.4 | % | 5.5 | % | ||||||||||
| (1) | Excludes impairment and other operating expenses. |
By business segment, the 3.4%12.4% increase in costs excluding impairment and other operating expenses in 20132015 compared to the corresponding period in 20122014 was mainly due to the 11.1% increase in costs incurred in Companiesretail banking. In 2015, the Bank continued with its strategy of shifting its strategic focus away from retail clients attended in the Santander Banefe branch network and institutional lendingmore towards high income earners and small and mid-sized enterprises. This implied additional costs mainly in our distribution network and technology. Costs in the Middle-market segment grew 16.5% in 2015 compared to 2014 as this segment was a growth priority during the year, increasing in terms of size of balance sheet and headcount. Finally, costs in Global corporate banking rose 12.1% in line with business growth in this segment, especially in transactional banking and markets. In 2013, the Bank in the companies and institutional segment, decided to place greater strategic emphasis on this segment in which we have a weaker relative position compared to our main competitors.cash management services that are intense
The following table sets forth information regarding Other operating expenses
in data processing. All segments costs were also affected by the depreciation of the peso against the euro in 2015, which as previously mentioned has a negative impact on IT costs denominated in that currency and that this foreign currency exposure is hedged, the results of which are recognized in financial transactions, net.
For the years ended December 31, 2013, 20122014 and 2011.2013. Operating expenses in the year ended December 31, 2014 increased 12.1% compared to the corresponding period in 2013. The 9.9% increase in personnel salaries and expenses was mainly due to: (i) a 7.9% increase in personnel compensation which totaled Ch$213,364 million in 2014. Total headcount fell 0.3% to 11,478 people, but the higher inflation rate resulted in larger wage increases as well as the impact of the Bank’s meritocracy policies; (ii) a 13.8% increase in bonuses which totaled Ch$77,145 million, following a positive year for the Bank both in terms of financial and business goals; (iii) severance payments increased 19.5% to Ch$10,551 million; and (iv) in March 2014, a new collective bargaining agreement was signed with the main unions, which became effective on October 1, 2014, and which will expire on December 31, 2018. This resulted in an increase in certain benefits related to the Bank’s health insurance fund and other benefits.
Year ended December 31, | % Change | % Change | |||
2013 | 2012 | 2011 | 2013/2012 | 2012/2011 | |
| (in millions of Ch$) | |||||
| Provisions and expenses for assets received in lieu of payment | 4,824 | 10,176 | 12,782 | (52.6%) | (20.4%) |
| Credit card expenses | 2,157 | 6,362 | 6,427 | (66.1%) | (1.0%) |
| Customer services | 10,954 | 8,674 | 8,965 | 26.3% | (3.2%) |
| Operating charge-offs | 8,222 | 8,366 | 9,884 | (1.7%) | (15.4%) |
| Life insurance and general product insurance policies | 7,348 | 7,211 | 6,524 | 1.9% | 10.5% |
| Additional tax on expenses paid overseas | 2,862 | 3,283 | 3,516 | (12.8%) | (6.6%) |
| Provisions for contingencies | 5,805 | 7,964 | 8,144 | (27.1%) | (2.2%) |
| Other | 10,166 | 7,601 | 7,966 | 33.7% | (4.6%) |
| Total | 52,338 | 59,637 | 64,208 | (12.2%) | (7.1%) |
Administrative expenses increased 9.0% in the year ended December 31, 2014 compared to the corresponding period in 2013. The increase in administrative expenses was mainly due to the 13.9% increase in maintenance, repair of property, plant and equipment, which totaled Ch$17,498 million and the 7.6% rise in security services expenses that totaled Ch$17,089 million. In 2014, the Bank continued to refurbish branches, open new Santander Select branches and close Santander Banefe branches. The Bank also had to continue to increase the expenditure dedicated to securing and protecting ATM machines given the increase in theft and more regulations regarding ATM security. The rise in costs was also due to the 8.6% increase in office lease due to the higher inflation rate as these contracts are indexed to inflation. The Bank’s total branch network decreased from 493 offices to 474, but increased in areas of higher leasing costs due to the strategic shift towards higher income clients.
Depreciation and amortization expense decreased 27.7%, mainly due to the lower depreciation and amortization of intangible assets. In 2014, the Bank, following an extensive analysis of its intangible assets, performed an extraordinary charge-off of those intangible assets, mainly software, that were obsolete or were not contributing to the Bank’s business or earnings.
Impairment charges increased 14,926.2% in 2014 compared to 2013 and totaled Ch$36,664 million. The Bank initiated a plan to transform its business and operating model with a better focus on the client. Therefore, there have arisen a number of new requirements for the Bank to adapt to changing customer demands and establish new ways to interact with them. As a result of this change in strategy, the Bank evaluated a number of applications that were in use or in development and tested them for impairment. Following the testing, in accordance with IAS 36, the Bank has recognized an impairment of Ch$36,556 million in 2014 due to the abandonment of unnecessary systems.
Other operating expenses were Ch$52,33858,946 million in 2013,2014, a 12.2% decrease12.6% increase compared to 2012.2013. This decreaseincrease was mainly due to lowerhigher provisions and expenses for repossessed assetscontingencies that totaled Ch$4,82413,080 million in 20132014 compared to Ch$10,1765,805 million in 2012. This2013. Compared to 2013, the rise in provision for contingencies was offset by higher customer service expenses that includesdue to Ch$5 billion for future severance payments and Ch$2.4 billion for future costs related to our call center and higher other costs, which increased due to the Ch$2,283 million in expenses recorded in 2013 from the costs incurred in adopting chip technology for our ATM andcards. This reflects the pending expense for customers that have yet to change their debit or credit cards.card with the new chip technology, which is an on-going process. See “Note 36—33—Other operating income and expenses” and “Note 20-Provisions” to our Audited Consolidated Financial Statements for more detail on Other operating expenses.
ForBy business segment, the years ended December 31, 20125.5% increase in costs excluding impairment and 2011. Operatingother operating expenses in the year ended December 31, 2012 increased 6.1%2014 compared to the corresponding period in 2011. The efficiency ratio was 42.5% in 2012 compared to 41.4% in 2011.
The 7.1% increase in personnel salaries and expenses2013 was mainly due to higher salaries and headcount. Total salary expenses, including bonuses increased 6.8% in 2012 compared to 2011, totaling Ch$255,229 million. Headcount as of December 31, 2012 totaled 11,713, an increase of 1.3% from 2011. Additionally, in April 2012, salaries were increased by the annual CPI index at 3.5% as mandated in the Bank’s collective bargaining agreements.
Administrative expenses increased 9.9% in the year ended December 31, 2012 compared to the corresponding period in 2011. In 2012 the Bank focused on its Transformation Plan, which is a broad overhaul and improvement of our retail banking activities, especially among Individuals in Commercial banking and SMEs. The plan also entails greater expenses related to IT projects being carried out to improve productivity. As a result this drove the following15.5% increase in administrative expenses: (i) the 17.4% risecosts incurred in expenses relating to the maintenance and repair of property as the bank refurbished branches; (ii) the 13.0% increase in expenses relating to the IT and communication systems,Global corporate banking in line with business growth in this segment. Costs in Retail banking increased 10.1% in 2014 compared to 2013. In 2014, the Bank’s improvementsBank continued with its strategy of its CRM systems, phone bankingincreasing presence in this segment, which implied additional costs as a result of this expansion plan mainly in our distribution network and internet banking services; and (iii) a 10.7% increasetechnology. Costs in marketing expenses in line with the Bank’s objective of improving client image.Middle-market segment increased 5.6% due to greater business activity.
Depreciation and amortization expense increased 5.4%, mainly due to higher amortization expenses of intangible assets such as software and other computer systems.
Income tax expense
Year ended December 31, | % Change | % Change | |||
2013 | 2012 | 2011 | 2013/2012 | 2012/2011 | |
| (in millions of Ch$) | |||||
| Net income before tax | 538,959 | 405,906 | 484,430 | 32.8% | (16.2%) |
| Income tax expense | (94,530) | (44,473) | (77,308) | 112.6% | (42.5%) |
| Effective tax rate(1) | 17.5% | 11.0% | 16.0% | ||
| Year ended December 31, | % Change | % Change | ||||||||||||||||||
| 2015 | 2014 | 2013 | 2015/2014 | 2014/2013 | ||||||||||||||||
| (in millions of Ch$) | ||||||||||||||||||||
| Net income before tax | 528,124 | 626,940 | 538,959 | (15.8 | %) | 16.3 | % | |||||||||||||
| Income tax expense | (76,395 | ) | (51,050 | ) | (94,530 | ) | 49.6 | % | (46.0 | %) | ||||||||||
| Effective tax rate(1) | 14.5 | % | 8.1 | % | 17.5 | % | ||||||||||||||
| (1) | The effective tax rate is the income tax expense divided by net income before tax. |
For the years ended December 31, 20132015 and 20122014. OurTotal income tax expense increased by 112.6%the Bank in the year ended December 31, 20132015 totaled Ch$76,395 million, a 49.6% increase compared to the same period in 2012.2014. The statutory corporate tax rate in 2013 and 2012 was 20%. The Bank’sBank paid an effective tax rate tends to be below the Chilean statutory rate because for tax purposes the Bank is still required to recognize the effects of price level restatement on equity. The effective tax rate was 17.5%14.5% in 20132015 compared to 11.0%8.1% in 2012.2014. The higher effective tax rate was mainly due to:
| (i) | the statutory corporate tax rate increased from 21% in 2014 to 22.5% in 2015. In 2016, the statutory corporate tax rate will rise to 24%, 25.5% in 2017 and 27% in 2018; |
| (ii) | income tax expenses in included non-cash income of Ch$10,600 million in 2015 from the re-adjustments made to the Bank’s deferred tax asset base following passage of the new tax law compared to Ch$39,262 million in 2014. The Bank has more deferred tax assets than liabilities. This gain arises from the difference between the Bank’s accounting and tax books regarding how provisions and charge-offs are recognized. When the statutory rates were modified, the Bank’s net deferred tax assets increased as the future tax rates used to calculate this asset were gradually increased from 20% to 27%; |
| (iii) | the lower CPI inflation rate in 2015 compared to 2014 also resulted in lower permanent differences since the Bank, for Chilean tax purposes, must re-value its capital each year for the variation in CPI inflation. The table below demonstrates the effective tax rate reconciliation. See “Note 14—Current and Deferred Taxes” of the Audited Consolidated Financial Statements for more detail on income tax expense. |
| As of December 31, | ||||||||||||||||
| 2015 | 2014 | |||||||||||||||
| Tax rate | Amount | Tax rate | Amount | |||||||||||||
| % | Ch$mn | % | Ch$mn | |||||||||||||
| Tax calculated over profit before tax | 22.5 | 118,828 | 21.0 | 131,657 | ||||||||||||
| Permanent differences | (5.4 | ) | (28,630 | ) | (6.2 | ) | (38,724 | ) | ||||||||
| Single penalty tax (rejected expenses) | 0.1 | 340 | 0.1 | 746 | ||||||||||||
| Effect of tax reform changes on deferred tax | (2.0 | ) | (10,600 | ) | (6.3 | ) | (39,262 | ) | ||||||||
| Real estate taxes | (0.7 | ) | (3,853 | ) | (0.5 | ) | (3,357 | ) | ||||||||
| Other | 0.1 | 310 | - | (10 | ) | |||||||||||
| Effective rates and expenses for income tax | 14.5 | 76,395 | 8.1 | 51,050 | ||||||||||||
For the years ended December 31, 2014 and 2013. Total income tax expense by the Bank in 20132014 totaled Ch$51,050 million, a 46.0% decrease compared to 2012 was due2013. The Bank paid an effective tax rate of 8.1% in 2014 compared to 17.5% in 2014. Income tax expenses in 2014 included a one-time non-cash income of Ch$39,262 million from the re-adjustments made to the fact that in September 2012,Bank’s deferred tax asset base following passage of the statutorynew tax rate was increased from 18.5% to 20.0% and this created an income tax reversal of Ch$16,221 million in 2012, corresponding to the adjustment oflaw. The Bank has more deferred tax assets than liabilities. This gain arises from the difference between the Bank’s accounting and tax books regarding how provisions and charge-offs are recognized. When the statutory rates were modified, the Bank’s net deferred tax assets increased as the future tax rates used to calculate this asset were gradually increased from 20% to 27%. The higher CPI inflation rate in 2014 compared to 2013 also resulted in greater permanent differences since the higher statutory rate.Bank, for Chilean tax purposes, must re-value its capital each year for the variation in CPI inflation. The table below demonstrates the effective tax rate reconciliation. See “Note 15—14—Current and Deferred Taxes” of the Audited Consolidated Financial Statements for more detail on income tax expense.
Congress is currently discussing a new tax reform that will change the corporate tax rate. If adopted, the statutory tax rate would be expected to increase to 21% in 2014, 22.5% in 2015, 24% in 2016 and 25% in 2017.
For the years ended December 31, 2012 and 2011. Our income tax expense decreased by 42.5% in the year ended December 31, 2012 compared to the same period in 2011. The effective tax rate was 11.0% in 2012 compared to 16.0% in 2011. In September 2012, the statutory tax rate to be applied in 2013 was permanently increased from 18.5% to 20.0% and this created an income tax reversal of Ch$16,221 million in 2012, corresponding to the adjustment of deferred tax assets to the higher statutory rate.
E. Liquidity and Capital Resources
| B. | Liquidity and Capital Resources |
Sources of Liquidity
Santander-Chile’s liquidity depends upon its (i) capital, (ii) reserves and (iii) financial investments, including investments in government securities. To cover any liquidity shortfalls and to augment its liquidity position, Santander-Chile has established lines of credit with foreign and domestic banks and also has access to Central Bank borrowings.
The following table sets forth our contractual obligations and commercial commitments by time remaining to maturity. As of the date of the filing of this Annual Report, the Bank does not have significant purchase obligations. As of December 31, 2013,2015, the scheduled maturities of our contractual obligations and of other commercial commitments, including accrued interest, were as follows:
Contractual Obligations | Demand | Up to 1 | Between 1 | Between 3 | Subtotal up | Between 1 | More than | Subtotal | Total |
| (in millions of Ch$) | |||||||||
| Obligations under repurchase agreements | - | 185,140 | 18,466 | 5,366 | 208,972 | - | - | - | 208,972 |
| Checking accounts, time deposits and other time liabilities (1) | 6,001,375 | 5,351,489 | 2,333,001 | 1,743,525 | 15,429,390 | 87,380 | 55,644 | 143,024 | 15,572,414 |
| Financial derivative contracts | - | 126,238 | 89,018 | 223,031 | 438,287 | 508,206 | 345,292 | 853,498 | 1,291,785 |
| Interbank borrowings | 8,199 | 104,490 | 216,472 | 1,201,070 | 1,530,231 | 152,146 | - | 152,146 | 1,682,377 |
| Issued debt instruments | - | 470,600 | 688,261 | 590,027 | 1,748,888 | 1,548,733 | 1,901,037 | 3,449,770 | 5,198,658 |
Other financial liabilities (2) | 97,027 | 568 | 1,111 | 2,992 | 101,698 | 29,685 | 58,398 | 88,083 | 189,781 |
| Subtotal | 6,106,601 | 6,238,545 | 3,346,329 | 3,766,011 | 19,457,466 | 2,326,150 | 2,360,371 | 4,686,521 | 24,143,987 |
| Contractual interest payments (3) | 2,748 | 32,671 | 88,135 | 331,006 | 454,560 | 943,260 | 609,308 | 1,552,568 | 2,007,128 |
| Total | 6,109,349 | 6,271,796 | 3,434,464 | 4,097,017 | 19,912,026 | 3,269,410 | 2,969,679 | 6,239,089 | 26,151,115 |
| Contractual Obligations | Demand | Up to 1 month | Between 1 and 3 months | Between 3 and 12 months | Subtotal up to 1 year | Between 1 and 5 years | More than 5 years | Subtotal after 1 year | Total | |||||||||||||||||||||||||||
| (in millions of Ch$) | ||||||||||||||||||||||||||||||||||||
| Obligations under repurchase agreements | - | 143,689 | - | - | 143,689 | - | - | - | 143,689 | |||||||||||||||||||||||||||
| Checking accounts, time deposits and other time liabilities (1) | 7,932,619 | 5,707,940 | 3,210,947 | 2,853,761 | 19,705,267 | 238,933 | 56,845 | 295,778 | 20,001,045 | |||||||||||||||||||||||||||
| Financial derivative contracts | - | 126,643 | 190,409 | 380,158 | 697,210 | 1,016,731 | 1,148,665 | 2,165,396 | 2,862,606 | |||||||||||||||||||||||||||
| Interbank borrowings | 27,323 | 7,946 | 148,509 | 684,819 | 868,597 | 438,977 | - | 438,977 | 1,307,574 | |||||||||||||||||||||||||||
| Issued debt instruments | 1,953 | 440,500 | 155,821 | 213,928 | 812,202 | 2,764,082 | 2,380,811 | 5,144,893 | 5,957,095 | |||||||||||||||||||||||||||
| Other financial liabilities (2) | 129,358 | 3,142 | 558 | 3,114 | 136,172 | 68,027 | 16,328 | 84,355 | 220,527 | |||||||||||||||||||||||||||
| Subtotal | 8,091,253 | �� | 6,429,860 | 3,706,244 | 4,135,780 | 22,363,137 | 4,526,750 | 3,602,649 | 8,129,399 | 30,492,536 | ||||||||||||||||||||||||||
| Contractual interest payments (3) | 2,075 | 66,964 | 141,529 | 553,736 | 764,304 | 1,814,540 | 905,460 | 2,720,000 | 3,484,304 | |||||||||||||||||||||||||||
| Total | 8,093,328 | 6,496,824 | 3,847,773 | 4,689,516 | 23,127,441 | 6,341,290 | 4,508,109 | 10,849,399 | 33,976,840 | |||||||||||||||||||||||||||
| (1) | Includes demand deposits and other demand liabilities, cash items in process of being cleared and time deposits and other time liabilities. | |
| (2) | Mainly includes amounts owed to credit card processors and to the Chilean Production Development Corporation (Corporación de Fomento de la Producción de Chile), the state development agency. | |
| (3) | The table above includes future cash interest payments. For variable rate obligations, we assume the same rate as the last rate known. Various of the payment obligations in the table above are variable debt instruments, since they are denominated in UF, for which we have estimated a long-term inflation rate equal to 3%, which is at the center of the Central Bank’s long-term inflation target. No exclusions requiring further explanation have been made in this table. |
Operational Leases
Certain bank premises and equipment are leased under various operating leases. Future minimum rental commitments as of December 31, 20132015 under non-cancelable leases are as follows:
| As of December 31, | ||||
| (in millions of Ch$) | ||||
| Due within 1 year | 22,303 | |||
| Due after 1 year but within 2 years | 20,862 | |||
| Due after 2 years but within 3 years | 19,499 | |||
| Due after 3 years but within 4 years | 17,215 | |||
| Due after 4 years but within 5 years | 14,154 | |||
| Due after 5 years | 55,561 | |||
| Total | 149,594 | |||
Other Commercial Commitments
As of December 31, 2013,2015, the scheduled maturities of other commercial commitments, including accrued interest, were as follows:
Other Commercial Commitments | Up to 1 month | Between 1 and | Between 3 and | Between 1 and | More than 5 | Total |
| (in millions of Ch$) | ||||||
| Guarantees | 128,171 | 145,878 | 493,530 | 419,414 | 25,806 | 1,212,799 |
| Confirmed foreign letters of credit | 17,347 | 50,984 | 24,639 | 26,543 | 8,087 | 127,600 |
Other Commercial Commitments | Up to 1 month | Between 1 and | Between 3 and | Between 1 and | More than 5 | Total | Up to 1 month | Between 1 and 3 months | Between 3 and 12 months | Between 1 and 5 years | More than 5 years | Total | ||||||||||||||||||
| (in millions of Ch$) | (in millions of Ch$) | |||||||||||||||||||||||||||||
| Guarantees | 89,430 | 142,285 | 714,747 | 709,844 | 28,541 | 1,684,847 | ||||||||||||||||||||||||
| Confirmed foreign letters of credit | 16,522 | 12,504 | 6,535 | 34,872 | - | 70,434 | ||||||||||||||||||||||||
| Letters of credit issued | 48,634 | 101,181 | 46,210 | 22,007 | - | 218,032 | 39,552 | 100,407 | 37,753 | 1,330 | - | 179,042 | ||||||||||||||||||
| Pledges and other commercial commitments | 7,745 | 9,292 | 137,269 | 19,001 | 8,109 | 181,416 | 11,935 | 11,179 | 58,629 | 82,212 | - | 163,955 | ||||||||||||||||||
| Total other commercial commitments | 201,897 | 307,335 | 701,648 | 486,965 | 42,002 | 1,739,847 | 157,440 | 266,375 | 817,664 | 828,258 | 28,541 | 2,098,278 | ||||||||||||||||||
Risk-Weighted Assets and Regulatory Capital
We currently have regulatory capital in excess of the minimum requirement under the current Chilean regulations. According to the General Banking Law, a bank is required to have regulatory capital of at least 8% of its risk-weighted assets, net of required loan loss allowances, and paid-in capital and reserves (i.e., basic capital) of at least 3% of its total assets, net of required loan loss allowances. For these purposes, the regulatory capital of a bank is the sum of: (1) the bank’s basic capital; (2) subordinated bonds issued by the bank valued at their placement price for an amount up to 50% of its basic capital, provided that the value of the bonds is required to be decreased by 20% for each year that elapses during the period commencing six years prior to their maturity; and (3) its voluntary allowances for loan losses, for an amount of up to 1.25% of its risk-weighted assets. Santander-Chile does not have goodwill, but if it did, this value would be required to be deducted from regulatory capital. When calculating risk weighted assets, we also include off-balance sheet contingent loans. The merger of Old Santander Chile and Santiago on August 1, 2002 required a special regulatory pre-approval of the SBIF, which was granted on May 16, 2002. The resolution granting this pre-approval imposed a regulatory capital to risk weighted assets ratio of 12% for the merged bank. This requirement was reduced to 11% by the SBIF effective January 1, 2005. For purposes of weighing the risk of a bank’s assets, the General Banking Law considers five different categories of assets, based on the nature of the issuer, the availability of funds, and the nature of the assets and the existence of collateral securing such assets.
The following table sets forth our consolidated and risk-weighted assets and regulatory capital as of December 31, 20132015 and 20122014 as required by the SBIF.
| Consolidated assets as of | Risk-weighted assets(1)
| |||||||||||||||
| December 31, 2015 | December 31, 2014 | December 31, 2015 | December 31, 2014 | |||||||||||||
| (Ch$ million) | ||||||||||||||||
| Asset Balance (Net of allowances) | ||||||||||||||||
| Cash and deposits in bank | 2,064,806 | 1,608,888 | - | — | ||||||||||||
| Unsettled transactions | 724,521 | 531,373 | 80,447 | 90,203 | ||||||||||||
| Trading investments | 324,271 | 774,815 | 57,796 | 89,605 | ||||||||||||
| Investments under resale agreements | 2,463 | — | 493 | — | ||||||||||||
| Financial derivative contracts(2) | 1,425,450 | 1,154,471 | 1,158,218 | 996,334 | ||||||||||||
| Interbank loans | 10,861 | 11,918 | 1,505 | 2,384 | ||||||||||||
| Loans and accounts receivables from customers | 24,535,201 | 22,179,938 | 21,480,044 | 19,519,483 | ||||||||||||
| Available for sale investments | 2,044,411 | 1,651,598 | 222,784 | 190,137 | ||||||||||||
| Investments in other companies | 20,309 | 17,914 | 20,309 | 17,914 | ||||||||||||
| Intangibles assets | 51,137 | 40,983 | 51,137 | 40,983 | ||||||||||||
| Property, plant and equipment | 240,659 | 211,561 | 240,659 | 211,561 | ||||||||||||
| Current taxes | - | 2,241 | - | 224 | ||||||||||||
| Deferred taxes | 331,714 | 282,173 | 33,171 | 28,221 | ||||||||||||
| Other assets | 1,097,826 | 493,173 | 603,503 | 493,173 | ||||||||||||
| Off-balance sheet assets | ||||||||||||||||
| Contingent loans | 4,516,319 | 3,976,465 | 2,507,530 | 2,265,904 | ||||||||||||
| Total | 37,389,948 | 32,937,549 | 26,457,596 | 23,946,126 | ||||||||||||
Consolidated assets as of | Risk-weighted assets(1) | |||||
December 31, | December 31, | December 31, | December 31, | |||
| (Ch$ million) | ||||||
| Asset Balance (Net of allowances) | ||||||
| Cash and deposits in bank | 1,571,810 | 1,250,414 | - | - | ||
| Unsettled transactions | 604,077 | 520,267 | 66,672 | 75,429 | ||
| Trading investments | 287,567 | 338,287 | 40,924 | 21,713 | ||
| Investments under resale agreements | 17,469 | 6,993 | 3,494 | 6,993 | ||
| Financial derivative contracts(4) | 1,008,026 | 937,291 | 862,810 | 830,133 | ||
| Interbank loans | 125,395 | 90,527 | 25,079 | 18,105 | ||
| Loans and accounts receivables from customers | 20,327,021 | 18,325,957 | 18,071,792 | 16,205,004 | ||
| Available for sale investments | 1,700,993 | 1,826,158 | 238,835 | 200,285 | ||
| Investments in other companies | 9,681 | 7,614 | 9,681 | 7,614 | ||
| Intangibles assets | 66,703 | 87,347 | 66,703 | 87,347 | ||
| Property, plant and equipment | 180,215 | 162,214 | 180,215 | 162,214 | ||
| Current taxes | 1,643 | 10,227 | 164 | 1,023 | ||
| Deferred taxes | 230,215 | 186,407 | 23,022 | 18,641 | ||
| Other assets | 400,025 | 655,217 | 346,533 | 402,547 | ||
| Off-balance sheet assets | ||||||
| Contingent loans | 3,436,773 | 3,201,028 | 2,013,057 | 1,903,368 | ||
| Total | 29,967,613 | 27,605,948 | 21,948,981 | 19,940,416 | ||
Ratio | ||||
December 31, | December 31, | December 31, | December 31, | |
| (Ch$ million) | % | % | ||
| Basic capital(2) | 2,325,678 | 2,134,778 | 7.76 | 7.73 |
| Regulatory capital(3) | 3,033,741 | 2,734,434 | 13.82 | 13.71 |
Ratio | ||||
December 31, 2015 | December 31, 2014 | December 31, 2015 | December 31, 2014 | |
| (Ch$ million) | % | % | ||
| Basic capital(3) | 2,734,699 | 2,609,896 | 7.31 | 7.92 |
| Regulatory capital(4) | 3,538,216 | 3,354,702 | 13.37 | 14.00 |
| (1) | As required by local regulations. |
| (2) | Derivatives are shown as required by Chapter 12-1 RAN of Chilean Bank GAAP guidelines |
| (3) | As a percentage of total assets. |
| As a percentage of risk weighted assets (BIS ratio). |
In line with the future adoption of Basel III regulations in Chile, the SBIF has recently discussed increasing the minimum regulatory capital ratio from 8% to 10.5%, which would require an amendment to the General Banking Law. Although we currently have a regulatory capital ratio of 13.82%, this change could require us to inject additional capital into our business in the future. According to initial estimates of the impact of market risk on regulatory capital, published by the SBIF, our regulatory capital to risk-weighted assets, net of loan loss allowance and deductions, including an initial estimate of the adjustments for market risk set forth under Basel III was 12.57% as of December 31, 2013 the latest data available. No assurance can be given that these changes will not have a material impact on our capitalization ratio.
Financial Investments
Financial assets are classified into the following specified categories: financial assets trading investments “atat fair value through profit or loss”loss (FVTPL), “held to maturity” investments, “available for sale investments” (AFS) financial assets and “loans and accounts receivable from customers.” The classification depends on the nature and purpose of the financial assets and is determined at the time of initial recognition. All regular way purchases or sales of financial assets are recognisedrecognized and derecognisedderecognized on a trade date basis. Regular way purchases or sales are purchases or sales of financial assets that require delivery of assets within the time frame established by regulation or convention in the marketplace.
Effective interest method
The effective interest method is a method of calculating the amortisedamortized cost of a debt instrument and of allocating interest income over the relevant period. The effective interest rate is the rate that exactly discounts estimated future cash receipts (including all fees and points paid or received that form an integral part of the effective interest rate, transaction costs and other premiums or discounts) through the expected life of the debt instrument, or, where appropriate, a shorter period, to the net carrying amount on initial recognition.
Income is recognisedrecognized on an effective interest basis for debt instruments other than those financial assets classified as at fair value through profit or loss.
Financial assets at FVTPL - Trading investments
Financial assets are classified as at FVTPL when the financial asset is either held for trading or it is designated as at fair value through profit or loss.
A financial asset is classified as held for trading if:
| · | it has been acquired principally for the purpose of selling it in the near term; or |
| · | on initial recognition it is part of a portfolio of identified financial instruments that the Bank manages together and has a recent actual pattern of short-term profit-taking; or |
| · | it is a derivative that is not designated and effective as a hedging instrument. |
A financial asset other than a financial asset held for trading may be designated as at FVTPL upon initial recognition if:
| · | such designation eliminates or significantly reduces a measurement or recognition inconsistency that would otherwise arise; or |
| · | the financial asset forms part of a group of financial assets or financial liabilities or both, which is managed and its performance is evaluated on a fair value basis, in accordance with the Bank's documented risk management or investment strategy, and information about the grouping is provided internally on that basis; or |
| · | it forms part of a contract containing one or more embedded derivatives, and IAS 39 permits the entire combined contract to be designated as at FVTPL. |
Financial assets at FVTPL are stated at fair value, with any gains or losses arising on remeasurement recognisedrecognized in profit or loss. The net gain or loss recognisedrecognized in profit or loss incorporates any dividend or interest earned on the financial asset and is included in the ‘net profit (loss)income (expense) from financial operations' line item
Held to maturity investments
Held-to-maturity investments are non-derivative financial assets with fixed or determinable payments and fixed maturity dates that the Bank has the positive intent and ability to hold to maturity. Subsequent to initial recognition, held-to-maturity investments are measured at amortisedamortized cost using the effective interest method less any impairment.
Available for sale investments (AFS investments)
AFS investments are non-derivatives that are either designated as AFS or are not classified as (a) loans and accounts receivable from customers, (b) held-to-maturity investments or (c) financial assets at fair value through profit or loss (trading investments).
Financial instruments held by the Bank that are traded in an active market are classified as AFS and are stated at fair value at the end of each reporting period. The Bank also has investments in financial instruments that are not traded in an active market but that are also classified as AFS investments and stated at fair value at the end of each reporting period (because the directors consider that fair value can be reliably measured). Changes in the carrying amount of AFS monetary financial assets relating to changes in foreign currency rates, interest income calculated using the effective interest method and dividends on AFS equity investments are recognisedrecognized in profit or loss. Other changes in the carrying amount of available for sale investments are recognisedrecognized in other comprehensive income and accumulated under the heading of Valuation Adjustment. When the investment is disposed of or is determined to be impaired, the cumulative gain or loss previously accumulated in the investments revaluation reserve is reclassified to profit or loss.
Dividends on AFS equity instruments are recognisedrecognized in profit or loss when the Bank's right to receive the dividends is established.
The fair value of AFS monetary financial assets denominated in a foreign currency is determined in that foreign currency and translated as the described in f) above. The foreign exchange gains and losses that are recognisedrecognized in profit or loss are determined based on the amortisedamortized cost of the monetary asset.
AFS equity investments that do not have a quoted market price in an active market and whose fair value cannot be reliably measured and derivatives that are linked to and must be settled by delivery of such unquoted equity investments are measured at cost less any identified impairment losses at the end of each reporting period.
a) Trading
As of December 31, | ||||
2013 | 2012 | 2011 | ||
| (in millions of Ch$) | ||||
| Central Bank and Government Securities | ||||
| Chilean Central Bank bonds | 75,577 | 267,008 | 311,503 | |
| Chilean Central Bank notes | 100 | 3,397 | 60,233 | |
| Other Chilean Central Bank and government securities | 189,962 | 48,160 | 15,789 | |
| Subtotal | 265,639 | 318,565 | 387,525 | |
| Other Chilean Securities | ||||
| Time deposits in Chilean financial institutions | - | 3,531 | - | |
| Mortgage bonds of Chilean financial institutions | - | - | - | |
| Chilean financial institutions bonds | 10,042 | - | - | |
| Chilean corporate bonds | 2,229 | - | - | |
| Other Chilean securities | - | - | - | |
| Subtotal | 12,271 | 3,531 | - | |
| Foreign securities | ||||
| Foreign Financial Securities | - | - | - | |
| Other foreign financial instruments | - | - | - | |
| Subtotal | - | - | - | |
| Investments in mutual funds | - | - | - | |
| Funds managed by related entities | 9,657 | 16,191 | 22,238 | |
| Subtotal | 9,657 | 16,191 | 22,238 | |
| Total | 287,567 | 338,287 | 409,763 | |
| As of December 31, | ||||||||||||
| 2015 | 2014 | 2013 | ||||||||||
| (in millions of Ch$) | ||||||||||||
| Central Bank and Government Securities | ||||||||||||
| Chilean Central Bank bonds | 159,767 | 270,004 | 75,577 | |||||||||
| Chilean Central Bank notes | - | – | 100 | |||||||||
| Other Chilean Central Bank and government securities | 123,468 | 461,340 | 189,962 | |||||||||
| Subtotal | 283,235 | 731,344 | 265,639 | |||||||||
| Other Chilean Securities | ||||||||||||
| Time deposits in Chilean financial institutions | - | – | – | |||||||||
| Mortgage bonds of Chilean financial institutions | - | – | – | |||||||||
| Chilean financial institutions bonds | - | – | 10,042 | |||||||||
| Chilean corporate bonds | 37,630 | 36,339 | 2,229 | |||||||||
| Other Chilean securities | - | – | – | |||||||||
| Subtotal | 37,630 | 36,339 | 12,271 | |||||||||
| Foreign securities | ||||||||||||
| Foreign Financial Securities | - | – | – | |||||||||
| Other foreign financial instruments | - | – | – | |||||||||
| Subtotal | - | – | ||||||||||
| Investments in mutual funds | - | – | – | |||||||||
| Funds managed by related entities | 3,406 | 7,132 | 9,657 | |||||||||
| Subtotal | 3,406 | 7,132 | 9,657 | |||||||||
| Total | 324,271 | 774,815 | 287,567 | |||||||||
b) Available for sale
As of December 31, | As of December 31, | ||||||||||||||
2013 | 2012 | 2011 | 2015 | 2014 | 2013 | ||||||||||
| (in millions of Ch$) | (in millions of Ch$) | ||||||||||||||
| Central Bank and Government Securities | |||||||||||||||
| Chilean Central Bank bonds | 364,821 | 712,278 | 570,573 | 687,292 | 381,117 | 364,821 | |||||||||
| Chilean Central Bank notes | 1,078 | 8,270 | 563,114 | - | 384 | 1,078 | |||||||||
| Other Chilean Central Bank and government securities | 146,295 | 296,010 | 173,839 | 145,603 | 353,419 | 146,295 | |||||||||
| Subtotal | 512,194 | 1,016,558 | 1,307,526 | 832,895 | 734,920 | 512,194 | |||||||||
| Other Chilean Securities | |||||||||||||||
| Time deposits in Chilean financial institutions | 1,011,354 | 756,136 | 275,022 | 712,859 | 590,382 | 1,011,354 | |||||||||
| Mortgage bonds of Chilean financial institutions | 33,856 | 37,319 | 66,806 | 29,025 | 31,693 | 33,856 | |||||||||
| Chilean financial institution bonds | - | - | – | – | |||||||||||
| Chilean corporate bonds | - | - | – | – | |||||||||||
| Other Chilean securities | - | 321 | 319 | - | – | – | |||||||||
| Subtotal | 1,045,210 | 793,776 | 342,147 | 741,884 | 622,075 | 1,045,210 | |||||||||
| Foreign Financial Securities | |||||||||||||||
| Central Bank and Government Foreign Securities | 143,589 | - | - | – | – | ||||||||||
| Other Foreign financial securities | - | 15,824 | 11,638 | 469,632 | 294,603 | 143,589 | |||||||||
| Subtotal | 143,589 | 15,824 | 11,638 | 469,632 | 294,603 | 143,589 | |||||||||
| Total | 1,700,993 | 1,826,158 | 1,661,311 | 2,044,411 | 1,651,598 | 1,700,993 | |||||||||
c) Held-to-maturity
No financial investments were classified as held-to-maturity as of December 31, 2013, 2012 or 2011.2015, 2014 and 2013.
The following table sets forth an analysis of our investments as of December 31, 20132015 by remaining maturity and the weighted average nominal rates of such investments.
Within | Weighted | After one | Weighted | After five | Weighted | After ten | Weighted | Total | Weighted | ||
| (in millions of Ch$ , except rates) | |||||||||||
| Trading | |||||||||||
| Central Bank and Government Securities | |||||||||||
| Central Bank bonds | 361 | 5.1 | 68,896 | 2.1 | 6,320 | 4.0 | - | - | 75,577 | 2.2 | |
| Central Bank notes | 17 | 1.9 | 83 | 2.4 | - | - | - | - | 100 | 2.3 | |
| Central Bank and government securities | - | - | 129,658 | 2.4 | 60,304 | 2.7 | - | - | 189,962 | 2.5 | |
| Subtotal | 378 | - | 198,637 | - | 66,624 | - | - | - | 265,639 | - | |
| Other Chilean Securities | |||||||||||
| Time deposits in Chilean financial institutions | - | - | - | - | - | - | - | - | - | - | |
| Mortgage bonds of Chilean financial institutions | - | - | - | - | - | - | - | - | - | - | |
| Chilean financial institutions bonds | - | - | 2,742 | 3.2 | 7,300 | 3.4 | - | - | 10,042 | 3.4 | |
| Chilean corporate bonds | - | - | 2,229 | 2.9 | - | - | - | - | 2,229 | 0.8 | |
| Other Chilean securities | - | - | - | - | - | - | - | - | - | - | |
| Subtotal | - | - | 4,971 | - | 7,300 | - | - | - | 12,271 | - | |
| Investment in mutual funds | |||||||||||
| Mutual funds administered by related parties | 9,657 | - | - | - | - | - | - | - | 9,657 | - | |
| Subtotal | 9,657 | - | - | - | - | - | - | - | 9,657 | - | |
| Total | 10,035 | - | 203,608 | - | 73,924 | - | - | - | 287,567 | - | |
| Within one year | Weighted average Nominal Rate | After one year but within five years | Weighted average Nominal Rate | After five years but within ten years | Weighted average Nominal Rate | After ten years | Weighted average Nominal Rate | Total | Weighted average Nominal Rate | |||||||||||||||||||||||||||||||
| (in millions of Ch$, except rates) | ||||||||||||||||||||||||||||||||||||||||
| Trading | ||||||||||||||||||||||||||||||||||||||||
| Central Bank and Government Securities | ||||||||||||||||||||||||||||||||||||||||
| Central Bank bonds | 144,470 | 3.9 | 9,249 | 4.3 | 5,753 | 2.0 | 295 | 1.7 | 159,767 | 3.8 | ||||||||||||||||||||||||||||||
| Central Bank notes | - | - | - | - | - | - | - | - | - | - | ||||||||||||||||||||||||||||||
| Central Bank and government securities | - | - | 78,486 | 4.3 | 12,325 | 3.0 | 32,657 | 3.7 | 123,468 | 4.0 | ||||||||||||||||||||||||||||||
| Subtotal | 144,470 | 87,735 | 18,078 | 32,952 | 283,235 | |||||||||||||||||||||||||||||||||||
| Other Chilean Securities | ||||||||||||||||||||||||||||||||||||||||
| Time deposits in Chilean financial institutions | - | - | - | - | - | - | - | - | - | - | ||||||||||||||||||||||||||||||
| Mortgage bonds of Chilean financial institutions | - | - | - | - | - | - | - | - | - | - | ||||||||||||||||||||||||||||||
| Chilean financial institutions bonds | - | - | - | - | - | - | - | - | - | - | ||||||||||||||||||||||||||||||
| Chilean corporate bonds | - | - | - | - | 23,000 | 2.7 | 14,630 | 2.7 | 37,630 | 2.7 | ||||||||||||||||||||||||||||||
| Other Chilean securities | - | - | - | - | - | - | - | - | - | - | ||||||||||||||||||||||||||||||
| Subtotal | - | - | 23,000 | 14,630 | 37,630 | |||||||||||||||||||||||||||||||||||
| Investment in mutual funds | ||||||||||||||||||||||||||||||||||||||||
| Mutual funds administered by related parties | 3,406 | 0.3 | - | - | - | - | - | - | 3,406 | 0.3 | ||||||||||||||||||||||||||||||
| Subtotal | 3,406 | - | - | - | 3,406 | |||||||||||||||||||||||||||||||||||
| Total | 147,876 | 87,735 | 41,078 | 47,582 | 324,271 | |||||||||||||||||||||||||||||||||||
Within | Weighted | After one | Weighted | After five | Weighted | After ten | Weighted | Total | Weighted | |
| (in millions of Ch$ , except rates) | ||||||||||
| Available for sale | ||||||||||
| Central Bank and Government Securities | ||||||||||
| Central Bank bonds | 73,613 | 4.6 | 181,906 | 4.3 | 109,302 | 4.6 | - | - | 364,821 | 4.4 |
| Central Bank notes | 214 | 2.1 | 864 | 2.9 | - | - | - | - | 1,078 | 2.7 |
| Central Bank and government securities | 10,815 | 4.5 | 91,007 | 4.5 | 44,273 | 5.1 | 201 | 3.4 | 146,295 | 4.7 |
| Subtotal | 84,642 | - | 273,777 | - | 153,575 | - | 201 | - | 512,194 | - |
| Other Chilean Securities | ||||||||||
| Time deposits in Chilean financial institutions | 1,011,354 | 1.1 | - | - | - | - | - | - | 1,011,354 | 1.1 |
| Mortgage bonds of Chilean financial institutions | 71 | 1.5 | 1,504 | 3.8 | 7,943 | 3.9 | 24,337 | 3.9 | 33,856 | 3.8 |
| Chilean financial institutions bonds | - | - | - | - | - | - | - | - | - | - |
| Chilean corporate bonds | - | - | - | - | - | - | - | - | - | - |
| Other Chilean securities | - | - | - | - | - | - | - | - | - | - |
| Subtotal | 1,011,425 | - | 1,504 | - | 7,943 | - | 24,337 | - | 1,045,210 | - |
| Other financial securities | ||||||||||
| Central Bank and Government Foreign Securities | - | - | - | - | 143,589 | 3.3 | - | - | 143,589 | 3.3 |
| Other Foreign financial securities | - | - | - | - | - | - | - | - | - | - |
| Subtotal | - | - | - | - | 143,589 | - | - | - | 143,589 | - |
| Total | 1,096,067 | - | 275,281 | - | 305,107 | - | 24,538 | - | 1,700,993 | - |
| Within one year | Weighted average Nominal Rate | After one year but within five years | Weighted average Nominal Rate | After five years but within ten years | Weighted average Nominal Rate | After ten years | Weighted average Nominal Rate | Total | Weighted average Nominal Rate | |||||||||||||||||||||||||||||||
| (in millions of Ch$, except rates) | ||||||||||||||||||||||||||||||||||||||||
| Available for sale | ||||||||||||||||||||||||||||||||||||||||
| Central Bank and Government Securities | ||||||||||||||||||||||||||||||||||||||||
| Central Bank bonds | 69,034 | 1.0 | 484,428 | 4.0 | 133,830 | 4.5 | - | - | 687,292 | 4.0 | ||||||||||||||||||||||||||||||
| Central Bank notes | - | - | - | - | - | - | - | - | - | - | ||||||||||||||||||||||||||||||
| Central Bank and government securities | 175 | 2.4 | 16,213 | 4.3 | 119,259 | 4.6 | 9,956 | 4.7 | 145,603 | 4.6 | ||||||||||||||||||||||||||||||
| Subtotal | 69,209 | 500,641 | 253,089 | 9,956 | 832,895 | |||||||||||||||||||||||||||||||||||
| Other Chilean Securities | ||||||||||||||||||||||||||||||||||||||||
| Time deposits in Chilean financial institutions | 712,859 | 0.4 | - | - | - | - | - | - | 712,859 | 0.4 | ||||||||||||||||||||||||||||||
| Mortgage bonds of Chilean financial institutions | 34 | 4.4 | 1,688 | 3.2 | 11,856 | 3.4 | 15,447 | 3.3 | 29,025 | 3.3 | ||||||||||||||||||||||||||||||
| Chilean financial institutions bonds | - | - | - | - | - | - | - | - | - | - | ||||||||||||||||||||||||||||||
| Chilean corporate bonds | - | - | - | - | - | - | - | - | - | - | ||||||||||||||||||||||||||||||
| Other Chilean securities | - | - | - | - | - | - | - | - | - | - | ||||||||||||||||||||||||||||||
| Subtotal | 712,893 | 1,688 | 11,856 | 15,447 | 741,884 | |||||||||||||||||||||||||||||||||||
| Other financial securities | ||||||||||||||||||||||||||||||||||||||||
| Central Bank and Government Foreign Securities | - | - | - | - | - | - | - | - | - | - | ||||||||||||||||||||||||||||||
| Other Foreign financial securities | 14,157 | 0.5 | 15,326 | 2.0 | 440,149 | 2.9 | - | - | 469,632 | 2.8 | ||||||||||||||||||||||||||||||
| Subtotal | 14,157 | 15,326 | 440,149 | - | 469,632 | |||||||||||||||||||||||||||||||||||
| Total | 796,259 | 517,655 | 705,094 | 25,403 | 2,044,411 | |||||||||||||||||||||||||||||||||||
Working Capital
As a bank, we satisfy our working capital needs through general funding, the majority of which derives from deposits and other borrowings from the public. (See “Item 5. Operating and Financial Review and Prospects—E.B. Liquidity and Capital Resources—Deposits and Other Borrowings”). In our opinion, our working capital is sufficient for our present needs.
Liquidity Management
Liquidity management seeks to ensure that, even under adverse conditions, we have access to the funds necessary to cover client needs, maturing liabilities and capital requirements. Liquidity risk arises in the general funding for our financing, trading and investment activities. It includes the risk of unexpected increases in the cost of funding the portfolio of assets at appropriate maturities and rates, the risk of being unable to liquidate a position
in a timely manner at a reasonable price and the risk that we will be required to repay liabilities earlier than anticipated.
The following table sets forth the balance of our liquidity portfolio managed by our Financial Management Division in the manner in which it is presented to the Asset and Liability Committee (ALCO) and the Board. The ALCO has determined that our liquidity portfolio must be comprised of cash plus assets that can be readily convertible into cash either through the Central Bank window, overnight deposits or instruments or the local secondary market. The management of the Bank’s liquidity portfolio is performed by the Financial Management Division under rules determined by the ALCO.
December 31, 2013 | December 31, 2012 | |
| Ch$ million | ||
| Balance as of (1): | ||
| Trading investments | 287,567 | 338,287 |
| Available for sale investments | 1,700,993 | 1,826,158 |
| Encumbered assets (net) (2) | (71,896) | (151,620) |
| Net cash (3) | 248,073 | (195) |
| Net interbank deposits (4) | 984,666 | 875,537 |
| Total liquidity portfolio | 3,149,403 | 2,888,167 |
December 31, 2013 | December 31, 2012 | |
| Ch$ million | ||
| Average balance as of: | ||
| Trading investments | 412,012 | 488,367 |
| Available for sale investments | 1,706,631 | 2,008,324 |
| Encumbered assets (net) (2) | (100,021) | (72,399) |
| Net cash (3) | 29,812 | 89,849 |
| Net interbank deposits (4) | 858,699 | 501,561 |
| Total liquidity portfolio | 2,907,133 | 3,015,702 |
| December 31, 2015 | December 31, 2014 | |||||||
| Ch$ million | ||||||||
| Balance as of: | ||||||||
| Financial investments for trading | 324,271 | 774,815 | ||||||
| Available for sale investments | 2,044,411 | 1,651,598 | ||||||
| Encumbered assets (net) (1) | (77,647 | ) | (112,015 | ) | ||||
| Net cash (2) | (315,415 | ) | 14,774 | |||||
| Net interbank deposits (3) | 1,683,208 | 890,274 | ||||||
| Total liquidity portfolio | 3,658,829 | 3,219,446 | ||||||
| (1) |
| Assets encumbered through repurchase agreements are deducted from the liquidity portfolio |
| Includes overnight deposits in the Central Bank, domestic banks and foreign banks |
| December 31, 2015 | December 31, 2014 | |||||||
| Ch$ million | ||||||||
| Average balance as of: | ||||||||
| Financial investments for trading | 405,352 | 571,479 | ||||||
| Available for sale investments | 1,902,050 | 1,673,423 | ||||||
| Encumbered assets (net) (1) | (74,664 | ) | (97,712 | ) | ||||
| Net cash (2) | (244,186 | ) | (50,554 | ) | ||||
| Net interbank deposits (3) | 1,197,325 | 788,958 | ||||||
| Total liquidity portfolio | 3,185,876 | 2,885,594 | ||||||
| (1) | Assets encumbered through repurchase agreements are deducted from the liquidity portfolio |
| (2) | Total cash minus reserve requirement of the Central Bank |
| (3) | Includes overnight deposits in the Central Bank, domestic banks and foreign banks |
Our general policy is to maintain liquidity adequate to ensure our ability to honor withdrawals of deposits, make repayments of other liabilities at maturity, extend loans and meet our own working capital needs. Our minimum amount of liquidity is determined by the statutory reserve requirements of the Central Bank. Deposits are subject to a statutory reserve requirement of 9% for demand deposits and 3.6% for Chilean peso-, UF- and foreign currency denominated time deposits with a term of less than a year. See “Item 4. Information on the Company—C.B. Business Overview—Competition—Regulation and Supervision.” The Central Bank has statutory authority to increase these percentages to up to 40% for demand deposits and up to 20% for time deposits. In addition, a 100% special reserve (reserva técnica) applies to demand deposits, deposits in checking accounts, other demand deposits received or
obligations payable on sight and incurred in the ordinary course of business, other than deposits unconditionally payable immediately. This special reserve requirement applies to the amount by which the total of such deposits exceeds 2.5 times the amount of a bank’s regulatory capital. Interbank loans are deemed to have a maturity of more than 30 days, even if payable within the following 10 days.
The Central Bank also requires us to comply with the following liquidity limits:
| · |
| · |
| · | The sum of the liabilities with a maturity of less than 90 days |
We have set other liquidity limits and ratios that minimize liquidity risk. See “Item 11. Quantitative and Qualitative Disclosures About Market Risk.”
Cash Flow
The tables below set forth our main sources of cash. The subsidiaries are not an important source of cash flow for us and therefore have no impact on our ability to meet our cash obligations. No legal or economic restrictions exist on the ability of subsidiaries to transfer funds to us in the form of loans or cash dividends as long as these subsidiaries abide by the regulations of theLey de Sociedad Anónimas regarding loans to related parties and minimum dividend payments. See our Consolidated Statements of Cash Flows in our Audited Consolidated Financial Statements for a detailed breakdown of the Bank’s cash flow.
Year ended December 31, | |||
2013 | 2012 | 2011 | |
| Millions of Ch$ | |||
| Net cash provided by (used in) operating activities | 645,166 | (1,153,932) | 1,556,890 |
| Year ended December 31, | ||||||||||||
| 2015 | 2014 | 2013 | ||||||||||
| Millions of Ch$ | ||||||||||||
| Net cash provided by (used in) operating activities | 687,796 | 282,423 | 645,166 | |||||||||
Our operating activities generated cash of Ch$645,166687,796 million in 2013.2015. The consumption of cash due to loan growth and interest paid was more than offset by growth of deposits and interest and fee income received. Cash flow provided by total deposits was Ch$2,513,690 million in 2015 compared to Ch$1,466,272 million in 2014. Our operating activities generated cash of Ch$282,423 million in 2014. The consumption of cash due to loan growth and the expansion of our financial investments was more than offset by growth of deposits and other liabilities.liabilities, but at a slower pace than in 2015. In 2012,2013, operating activities generated cash in an amount of Ch$645,166 million. In said year, loan growth was financed through income, deposits, a decline in financial investments and mortgage bond issuances.
| Year ended December 31, | ||||||||||||
| 2015 | 2013 | |||||||||||
| Millions of Ch$ | ||||||||||||
| Net cash (used in) provided by investment activities | (92,865 | ) | (92,666 | ) | 30,000 | |||||||
92
In 2015, the Bank’s investment activities consumed cash in an amount of Ch$1,153,932 million. In the fourth quarter of 2011 and first quarter of 2012, the Bank increased its cash position in light of greater market uncertainty abroad. As market conditions improved in the second half of 2012, the ALCO permitted the Financial Management Division to return to more normal levels of liquidity by prepaying costlier liabilities. Loan growth was also a factor in the consumption of cash in operating activities.
Year ended December 31, | ||||
2013 | 2012 | 2011 | ||
| Millions of Ch$ | ||||
| Net cash used in investment activities | 30,000 | (72,087) | (52,095) | |
In 2013, the Bank’s investment activities generated cash in an amount of Ch$30,00092,865 million. This was mainly due to the salepurchases of property, plant and equipment and the acquisition of intangibles. In 2014, the Bank’s investment activities consumed cash in an amount of Ch$92,666 million. This was also mainly due to the purchases of property, plant and equipment and the acquisition of intangibles. In 2013, we sold our asset management business for Ch$90,281 million. In 2012,million, resulting in a positive cash used in investing activities was Ch$72,087 million, mainly due to investments in property, equipment and technology as part offlow from investment programs to modernize and improve the efficiency in retail banking activities.
Year ended December 31, | |||
2013 | 2012 | 2011 | |
| Millions of Ch$ | |||
| Net cash used in financing activities | (240,687) | (265,258) | (289,416) |
| Year ended December 31, | ||||||||||||
| 2015 | 2014 | 2013 | ||||||||||
| Millions of Ch$ | ||||||||||||
| Net cash used in financing activities | (330,199 | ) | (265,156 | ) | (240,687 | ) | ||||||
In 2013, 20122015, 2014 and 2011,2013, the net cash used in financing activities can be explained by the Bank’s annual dividend payment each year partially offset by issuances of subordinated debt in 2013.year.
Deposits and Other Borrowings
The following table sets forth our average balance of liabilities for the years ended December 31, 2013, 20122015, 2014 and, 2011,2013, in each case together with the related average nominal interest rates paid thereon.
2013 | 2012 | 2011 | 2015 | 2014 | 2013 | ||||||||||||||||||||||||||||||||||||||||
Average | % of Total | Average | Average | % of Total | Average | Average | % of Total | Average | Average Balance | % of Total Average Liabilities | Average Nominal Rate | Average Balance | % of Total Average Liabilities | Average Nominal Rate | Average Balance | % of Total Average Liabilities | Average Nominal Rate | ||||||||||||||||||||||||||||
| (millions of Ch$, except percentages) | (millions of Ch$, except percentages) | ||||||||||||||||||||||||||||||||||||||||||||
| Interest-bearing liabilities | |||||||||||||||||||||||||||||||||||||||||||||
| Savings accounts | 103,760 | 0.4% | 1.9% | 102,420 | 0.4% | 2.5% | 103,085 | 0.4% | 3.6% | 114,330 | 0.3 | % | 3.4 | % | 108,185 | 0.3 | % | 5.0 | % | 103,760 | 0.4 | % | 1.9 | % | |||||||||||||||||||||
| Time deposits | 9,949,401 | 36.8% | 4.5% | 9,659,815 | 38.5% | 5.2% | 9,107,719 | 37.7% | 4.9% | 12,685,504 | 36.7 | % | 3.2 | % | 11,952,994 | 36.5 | % | 3.4 | % | 9,949,401 | 36.8 | % | 4.5 | % | |||||||||||||||||||||
| Central Bank borrowings | 221 | 0.0% | 6.3% | 4,469 | 0.0% | 5.2% | 3,097 | 0.0% | 6.0% | 4,891 | — | 1.0 | % | 6,906 | — | 0.2 | % | 221 | — | 6.3 | % | ||||||||||||||||||||||||
| Repurchase agreements | 266,883 | 1.0% | 5.6% | 369,338 | 1.5% | 4.2% | 249,174 | 1.0% | 3.5% | 228,050 | 0.7 | % | 3.1 | % | 413,263 | 1.3 | % | 2.0 | % | 266,883 | 1.0 | % | 5.6 | % | |||||||||||||||||||||
| Mortgage finance bonds | 102,778 | 0.4% | 8.0% | 131,070 | 0.5% | 8.6% | 174,224 | 0.7% | 9.2% | 63,061 | 0.2 | % | 10.2 | % | 81,805 | 0.2 | % | 11.9 | % | 102,778 | 0.4 | % | 8.0 | % | |||||||||||||||||||||
| Other interest bearing liabilities | 6,850,953 | 25.3% | 4.7% | 5,927,893 | 23.6% | 5.3% | 6,128,052 | 25.4% | 5.2% | 7,500,408 | 21.7 | % | 5.5 | % | 6,865,084 | 21.0 | % | 6.9 | % | 6,850,953 | 25.3 | % | 4.7 | % | |||||||||||||||||||||
| Subtotal interest-bearing liabilities | 17,273,996 | 63.9% | 4.6% | 16,195,005 | 64.5% | 5.3% | 15,765,351 | 65.2% | 5.1% | 20,596,244 | 59.6 | % | 4.0 | % | 19,428,237 | 59.4 | % | 4.6 | % | 17,273,996 | 63.9 | % | 4.6 | % | |||||||||||||||||||||
| Non-interest bearing liabilities | |||||||||||||||||||||||||||||||||||||||||||||
| Non-interest bearing deposits | 4,620,849 | 17.1% | 4,177,432 | 16.6% | 3,575,544 | 14.8% | 5,719,889 | 16.6 | % | 5,386,272 | 16.5 | % | 4,620,849 | 17.1 | % | ||||||||||||||||||||||||||||||
| Derivatives | 1,467,723 | 5.4% | 1,141,169 | 4.5% | 1,457,638 | 6.1% | 2,958,942 | 8.6 | % | 2,719,386 | 8.3 | % | 1,467,723 | 5.4 | % | ||||||||||||||||||||||||||||||
| Other non-interest bearing liabilities | 1,325,975 | 4.9% | 1,395,112 | 5.6% | 1,340,699 | 5.6% | 2,454,037 | 7.1 | % | 2,501,651 | 7.6 | % | 1,325,975 | 4.9 | % | ||||||||||||||||||||||||||||||
| Shareholders’ equity | 2,349,448 | 8.7% | 2,187,716 | 8.8% | 1,994,487 | 8.3% | 2,816,116 | 8.2 | % | 2,689,037 | 8.2 | % | 2,349,448 | 8.7 | % | ||||||||||||||||||||||||||||||
| Subtotal non-interest bearing liabilities | 9,763,995 | 36.1% | 8,901,429 | 35.5% | 8,368,368 | 34.8% | 13,948,984 | 40.4 | % | 13,296,346 | 40.6 | % | 9,763,995 | 36.1 | % | ||||||||||||||||||||||||||||||
| Total liabilities | 27,037,991 | 100.0% | 25,096,434 | 100.0% | 24,133,719 | 100.0% | 34,545,228 | 100.0 | % | 32,724,583 | 100.0 | % | 27,037,991 | 100.0 | % | ||||||||||||||||||||||||||||||
Our most important source of funding is our deposits. Average time deposits plus non-interest bearing demand deposits represented 53.8%53.3% of our average total liabilities and shareholders’ equity in 2013.2015. Our current funding strategy is to continue to utilize all sources of funding in accordance with their costs, their availability and our general asset and liability management strategy. Special emphasis is being placed on lengthening the maturities of funding with institutional clients, diversifying our bond holder base and broadening our core deposit funding. We believe that broadening our deposit base by increasing the number of account holders has created a more stable funding source.
Composition of Deposits
The following table sets forth the composition of our deposits and similar commitments at December 31, 2015, 2014, 2013, 2012 2011, 2010 and 2009.2011.
2013 | 2012 | 2011 | 2010 | 2009 | |
| (in millions of Ch$) | |||||
| Demand deposits and other demand obligations | |||||
| Current accounts | 4,403,526 | 4,006,143 | 3,543,776 | 3,330,352 | 2,776,607 |
| Other deposits and demand accounts | 569,395 | 455,315 | 350,519 | 368,934 | 303,495 |
| Other demand obligations | 647,842 | 508,561 | 519,520 | 537,148 | 453,432 |
| Subtotals | 5,620,763 | 4,970,019 | 4,413,815 | 4,236,434 | 3,533,534 |
| Time deposits and other time deposits | |||||
| Time deposits | 9,567,855 | 9,008,902 | 8,816,766 | 7,154,396 | 4,219,392 |
| Time saving accounts | 104,143 | 101,702 | 102,831 | 103,191 | 98,985 |
| Other time deposits | 3,274 | 1,609 | 1,517 | 1,170 | 2,856,880 |
| Subtotals | 9,675,272 | 9,112,213 | 8,921,114 | 7,258,757 | 7,175,257 |
| Total deposits and other commitments | 15,296,035 | 14,082,232 | 13,334,929 | 11,495,191 | 10,708,791 |
| 2015 | 2014 | 2013 | 2012 | 2011 | ||||||||||||||||
| (in millions of Ch$) | ||||||||||||||||||||
| Demand deposits and other demand obligations | ||||||||||||||||||||
| Current accounts | 5,875,992 | 5,131,130 | 4,403,526 | 4,006,143 | 3,543,776 | |||||||||||||||
| Other deposits and demand accounts | 577,077 | 554,785 | 569,395 | 455,315 | 350,519 | |||||||||||||||
| Other demand obligations | 903,052 | 794,582 | 647,842 | 508,561 | 519,520 | |||||||||||||||
| Subtotals | 7,356,121 | 6,480,497 | 5,620,763 | 4,970,019 | 4,413,815 | |||||||||||||||
| Time deposits and other time deposits | ||||||||||||||||||||
| Time deposits | 12,065,697 | 10,303,167 | 9,567,855 | 9,008,902 | 8,816,766 | |||||||||||||||
| Time saving accounts | 113,562 | 107,599 | 104,143 | 101,702 | 102,831 | |||||||||||||||
| Other time deposits | 3,508 | 3,174 | 3,274 | 1,609 | 1,517 | |||||||||||||||
| Subtotals | 12,182,767 | 10,413,940 | 9,675,272 | 9,112,213 | 8,921,114 | |||||||||||||||
| Total deposits and other commitments | 19,538,888 | 16,894,437 | 15,296,035 | 14,082,232 | 13,334,929 | |||||||||||||||
Maturity of Interest Bearing Deposits
The following table sets forth information regarding the currency and maturity of our interest bearing deposits as of December 31, 2013,2015, expressed in percentages of our total deposits in each currency category. UF-denominated deposits are similar to peso-denominated deposits in all respects, except that the principal is readjusted periodically based on variations in the Chilean consumer price index.
Ch$ | UF | Foreign Currencies | Total | Ch$ | UF | Foreign Currencies | Total | |||||||||||||
| Demand deposits | 0.03% | 0.14% | 0.00% | 0.03% | 0.02 | % | 0.11 | % | 0.01 | % | 0.03 | % | ||||||||
| Savings accounts | 0.01% | 9.95% | 0.00% | 1.09% | 0.02 | % | 10.06 | % | 0.00 | % | 0.93 | % | ||||||||
| Time deposits: | ||||||||||||||||||||
| Maturing within 3 months | 79.54% | 50.77% | 93.76% | 78.68% | 71.92 | % | 53.81 | % | 90.54 | % | 72.79 | % | ||||||||
| Maturing after 3 but within 6 months | 13.21% | 19.39% | 3.88% | 12.40% | 19.44 | % | 14.66 | % | 8.74 | % | 17.55 | % | ||||||||
| Maturing after 6 but within 12 months | 6.56% | 12.14% | 0.89% | 6.27% | 6.73 | % | 10.36 | % | 0.48 | % | 6.21 | % | ||||||||
| Maturing after 12 months | 0.65% | 7.61% | 1.47% | 1.53% | 1.87 | % | 11.01 | % | 0.23 | % | 2.48 | % | ||||||||
| Total time deposits | 99.96% | 89.91% | 100.00% | 98.88% | 99.96 | % | 89.83 | % | 99.99 | % | 99.04 | % | ||||||||
| Total deposits | 100.00% | 100.00 | % | 100.00 | % | 100.00 | % | 100.00 | % | |||||||||||
The following table sets forth information regarding the maturity of our outstanding time deposits in excess of U.S.$100,000 as of December 31, 2013.2015.
Ch$ | UF | Foreign Currencies | Total | Ch$ | UF | Foreign Currencies | Total | |||||||||||||
| (in millions of Ch$) | (in millions of Ch$) | |||||||||||||||||||
| Time deposits: | ||||||||||||||||||||
| Maturing within 3 months | 5,577,023 | 525,762 | 1,425,451 | 7,528,236 | 6,766,025 | 599,965 | 1,502,453 | 8,868,443 | ||||||||||||
| Maturing after 3 but within 6 months | 926,479 | 200,830 | 58,959 | 1,186,268 | 1,829,340 | 163,428 | 144,978 | 2,137,746 | ||||||||||||
| Maturing after 6 but within 12 months | 460,167 | 125,762 | 13,520 | 599,449 | 633,632 | 115,466 | 8,026 | 757,124 | ||||||||||||
| Maturing after 12 months | 45,291 | 78,820 | 22,375 | 146,486 | 175,889 | 122,731 | 3,764 | 302,384 | ||||||||||||
| Total time deposits | 7,008,960 | 931,174 | 1,520,305 | 9,460,439 | 9,404,887 | 1,001,590 | 1,659,221 | 12,065,697 | ||||||||||||
Short-term Borrowings
The principal categories of our short-term borrowings are repurchase agreements and interbank borrowings. The table below presents the amounts outstanding at each year-end indicated and the weighted-average nominal interest rate for each such year by type of short-term borrowing.
2013 | 2012 | 2011 | 2015 | 2014 | 2013 | |||||||||||||||||||||||||
Balance | Weighted- | Balance | Weighted- | Balance | Weighted- | Balance | Weighted-Average Nominal Interest Rate | Balance | Weighted-Average Nominal Interest Rate | Balance | Weighted-Average Nominal Interest Rate | |||||||||||||||||||
| (in millions of Ch$, except percentages) | (in millions of Ch$, except percentages) | |||||||||||||||||||||||||||||
| Obligations arising from repurchase agreements | 208,972 | 0.3% | 304,117 | 0.4% | 544,381 | 0.4% | 143,689 | 0.3 | % | 392,126 | 0.2 | % | 208,972 | 0.3 | % | |||||||||||||||
| Obligations with the Central Bank | 220 | 0.5% | 398 | 0.5% | 810 | 0.5% | 4 | 0.5 | % | 94 | 0.5 | % | 220 | 0.5 | % | |||||||||||||||
| Loans from domestic financial institutions | 500 | 0.0% | - | -% | - | -% | - | - | 66,006 | 0.2 | % | 500 | 0.1 | % | ||||||||||||||||
| Foreign obligations | 1,529,511 | 0.3% | 1,272,994 | 0.4% | 1,740,254 | 0.5% | 868,593 | 0.4 | % | 717,416 | 0.2 | % | 1,529,511 | 0.3 | % | |||||||||||||||
| Total short-term borrowings | 1,739,203 | 0.3% | 1,577,509 | 0.4% | 2,285,445 | 0.5% | 1,012,286 | 0.7 | % | 1,175,642 | 0.2 | % | 1,739,203 | 0.3 | % | |||||||||||||||
The following table shows the average balance and the average nominal rate for each short-term borrowing category for the years indicated.
2013 | 2012 | 2011 | 2015 | 2014 | 2013 | |||||||||||||||||||||||||
Average | Average | Average | Average | Average | Average | Average Balance | Average Nominal Interest Rate | Average Balance | Average Nominal Interest Rate | Average Balance | Average Nominal Interest Rate | |||||||||||||||||||
| (in millions of Ch$, except percentages) | (in millions of Ch$, except percentages) | |||||||||||||||||||||||||||||
| Obligations arising from repurchase agreements | 266,883 | 5.6% | 369,338 | 4.2% | 249,174 | 3.5% | 228,050 | 3.1 | % | 413,263 | 2.0 | % | 266,883 | 5.6 | % | |||||||||||||||
| Obligations with the Central Bank | 221 | 6.3% | 4,469 | 5.2% | 3,097 | 6.0% | 4,891 | 1.0 | % | 6,906 | 0.2 | % | 221 | 6.3 | % | |||||||||||||||
| Loans from domestic financial institutions | 33,834 | 4.6% | 6,171 | 3.7% | 24,912 | 3.0% | 88,296 | 0.6 | % | 100,513 | 4.9 | % | 33,834 | 4.6 | % | |||||||||||||||
| Foreign obligations | 1,543,337 | 1.0% | 1,578,051 | 0.8% | 1,812,802 | 1.3% | 1,038,686 | 0.8 | % | 1,508,559 | 1.3 | % | 1,543,337 | 1.0 | % | |||||||||||||||
| Total short-term borrowings | 1,844,275 | 1.8% | 1,958,029 | 1.4% | 2,089,985 | 1.6% | 1,359,923 | 1.1 | % | 2,029,241 | 1.6 | % | 1,844,275 | 1.8 | % | |||||||||||||||
The following table presents the maximum month-end balances of our principal sources of short-term borrowings during the years indicated.
Maximum | Maximum | Maximum | Maximum 2015 Month-End Balance | Maximum 2014 Month-End Balance | Maximum 2013 Month-End Balance | ||||||||||
| (in millions of Ch$) | (in millions of Ch$) | ||||||||||||||
| Obligations arising from repurchase agreements | 471,486 | 571,211 | 544,381 | 388,735 | 392,126 | 471,486 | |||||||||
| Obligations with the Central Bank | 370 | 766 | 1,241 | 85 | 205 | 370 | |||||||||
| Loans from domestic financial institutions | 251,600 | 70,000 | 244,071 | 205,069 | 206,530 | 251,600 | |||||||||
| Foreign obligations | 1,802,127 | 1,854,398 | 2,024,146 | 1,387,403 | 1,809,514 | 1,802,127 | |||||||||
| Total short-term borrowings | 2,525,583 | 2,496,375 | 2,813,839 | 1,981,292 | 2,408,375 | 2,525,583 | |||||||||
Total Borrowings
As of December 31, 2013 | As of December 31, 2015 | |||||||
Long-term | Short-term | Total | Long-term | Short-term | Total | |||
| (in millions of Ch$) | (in millions of Ch$) | |||||||
| Central Bank credit lines for renegotiations of loans (a) | - | 220 | 220 | — | 4 | 4 | ||
| Obligations under repurchase agreements | - | 208,972 | 208,972 | — | 143,689 | 143,689 | ||
| Mortgage finance bonds (b) | 6,493 | 95,174 | 101,667 | 57,314 | 5,544 | 62,858 | ||
| Senior bonds (c) | 1,603,929 | 2,586,989 | 4,190,918 | 4,245,624 | 796,012 | 5,041,636 | ||
| Mortgage bonds(d) | 70,339 | - | 70,339 | 103,519 | 4,063 | 107,582 | ||
| Subordinated bonds(e) | 138,466 | 697,268 | 835,734 | 738,436 | 6,583 | 745,019 | ||
| Borrowings from domestic financial institutions | - | 500 | 500 | — | — | |||
| Foreign borrowings(f) | 152,146 | 1,529,511 | 1,681,657 | 438,977 | 868,593 | 1,307,570 | ||
| Other obligations(g) | 101,698 | 88,083 | 189,781 | 84,355 | 136,172 | 220,527 | ||
| Total borrowings | 2,073,071 | 5,206,717 | 7,279,788 | 5,668,225 | 1,960,660 | 7,628,885 | ||
As of December 31, 2012 | |||
Long-term | Short-term | Total | |
| (in millions of Ch$) | |||
| Central Bank credit lines for renegotiations of loans | - | 398 | 398 |
| Obligations under repurchase agreements | - | 304,117 | 304,117 |
| Mortgage finance bonds | 6,863 | 121,223 | 128,086 |
| Senior bonds | 534,852 | 3,182,361 | 3,717,213 |
| Subordinated bonds | 16,037 | 709,953 | 725,990 |
| Borrowings from domestic financial institutions | - | - | - |
| Foreign borrowings | 164,611 | 1,272,994 | 1,437,605 |
| Other obligations | 101,335 | 91,276 | 192,611 |
| Total borrowings | 823,698 | 5,682,322 | 6,506,020 |
| As of December 31, 2014 | ||||||||||||
| Long-term | Short-term | Total | ||||||||||
| (in millions of Ch$) | ||||||||||||
| Central Bank credit lines for renegotiations of loans (a) | — | 94 | 94 | |||||||||
| Obligations under repurchase agreements | — | 392,126 | 392,126 | |||||||||
| Mortgage finance bonds (b) | 74,948 | 6,561 | 81,509 | |||||||||
| Senior bonds (c) | 3,701,885 | 1,166,602 | 4,868,487 | |||||||||
| Mortgage bonds(d) | 105,422 | 3,778 | 109,200 | |||||||||
| Subordinated bonds(e) | 715,465 | 10,451 | 725,916 | |||||||||
| Borrowings from domestic financial institutions | — | 66,006 | 66,006 | |||||||||
| Foreign borrowings(f) | 448,085 | 717,416 | 1,165,501 | |||||||||
| Other obligations(g) | 84,576 | 120,549 | 205,125 | |||||||||
| Total borrowings | 5,130,381 | 2,483,583 | 7,613,964 | |||||||||
As of December 31, 2011 | |||
Long-term | Short-term | Total | |
| (in millions of Ch$) | |||
| Central Bank credit lines for renegotiations of loans | - | 810 | 810 |
| Obligations under repurchase agreements | - | 544,381 | 544,381 |
| Mortgage finance bonds | 152,536 | 7,707 | 160,243 |
| Senior bonds | 2,851,785 | 749,340 | 3,601,125 |
| Subordinated bonds | 725,029 | 136,842 | 861,871 |
| Borrowings from domestic financial institutions | - | - | - |
| Foreign borrowings | 179,028 | 1,740,254 | 1,919,282 |
| Other obligations | 120,521 | 56,078 | 176,599 |
| Total borrowings | 4,028,899 | 3,235,412 | 7,264,311 |
| As of December 31, 2013 | ||||||||||||
| Long-term | Short-term | Total | ||||||||||
| (in millions of Ch$) | ||||||||||||
| Central Bank credit lines for renegotiations of loans (a) | — | 220 | 220 | |||||||||
| Obligations under repurchase agreements | — | 208,972 | 208,972 | |||||||||
| Mortgage finance bonds (b) | 95,174 | 6,493 | 101,667 | |||||||||
| Senior bonds (c) | 2,586,989 | 1,603,929 | 4,190,918 | |||||||||
| Mortgage bonds(d) | 70,339 | — | 70,339 | |||||||||
| Subordinated bonds(e) | 697,268 | 138,466 | 835,734 | |||||||||
| Borrowings from domestic financial institutions | — | 500 | 500 | |||||||||
| Foreign borrowings(f) | 152,146 | 1,529,511 | 1,681,657 | |||||||||
| Other obligations(g) | 88,083 | 101,698 | 189,781 | |||||||||
| Total borrowings | 3,689,999 | 3,589,789 | 7,279,788 | |||||||||
(a) Credit lines for renegotiations of loans
Central Bank borrowings include credit lines for the renegotiations of loans and other Central Bank borrowings. The maturities of the outstanding amounts due are as follows:
As of | As of | As of December 31, 2015 | As of December 31, 2014 | |||||||
| (in millions of Ch$) | (in millions of Ch$) | |||||||||
| Due within 1 year | 220 | 398 | 4 | 94 | ||||||
| Total | 220 | 398 | 4 | 94 | ||||||
(b) Mortgage finance bonds
These bonds are used to finance mortgage loans. Their principal amounts are amortized on a quarterly basis. The range of maturities of these bonds is between five and twenty years. Loans are indexed to UF and pay a yearly interest rate of 5.21% as of December 31, 2013.rate.
As of | |
| (in millions of Ch$) | |
| Due within 1 year | |
| Due after 1 year but within 2 years | |
| Due after 2 years but within 3 years | |
| Due after 3 years but within 4 years | |
| Due after 4 years but within 5 years | |
| Due after 5 years | |
| Total mortgage finance bonds |
(c) Senior Bondsbonds
The following table sets forth, at the dates indicated, our issued senior bonds. The bonds are denominated principally in UFs or U.S. dollars, and are principally used to fund assets with similar durations.
As of December 31, | ||||
2013 | 2012 | 2011 | ||
| (in millions of Ch$) | ||||
| Senior Bonds in UF | 1,964,905 | 2,025,105 | 2,001,713 | |
| Senior Bonds in U.S.$ | 1,658,789 | 1,269,454 | 1,268,763 | |
| As of December 31, | ||||||||||||
| 2015 | 2014 | 2013 | ||||||||||
| (in millions of Ch$) | ||||||||||||
| Senior Bonds in UF | 2,179,643 | 1,797,438 | 1,964,905 | |||||||||
| Senior Bonds in U.S.$ | 1,625,150 | 2,191,347 | 1,658,789 | |||||||||
| Senior Bonds in CHF | 535,448 | 443,186 | 246,284 | |||||||||
| Senior Bonds in Ch$ | 475,075 | 236,025 | 277,530 | |||||||||
| Senior Bonds in CNY | — | — | 43,410 | |||||||||
| Current bonds in AUD | 62,066 | 62,472 | — | |||||||||
| Santander bonds in JPY | 164,254 | 138,019 | — | |||||||||
| Total senior bonds | 5,041,636 | 4,868,487 | 4,190,918 | |||||||||
As of December 31, | |||
2013 | 2012 | 2011 | |
| (in millions of Ch$) | |||
| Senior Bonds in CHF | 246,284 | 90,249 | 119,394 |
| Senior Bonds in Ch$ | 277,530 | 293,933 | 211,255 |
| Senior Bonds in CNY | 43,410 | 38,472 | - |
| Total senior bonds | 4,190,918 | 3,717,213 | 3,601,125 |
The maturities of these bonds are as follows:
| As of December 31, | ||||
| (in millions of Ch$) | ||||
| Due within 1 year | 796,012 | |||
| Due after 1 year but within 2 years | 1,147,138 | |||
| Due after 2 years but within 3 years | 415,914 | |||
| Due after 3 years but within 4 years | 682,494 | |||
| Due after 4 years but within 5 years | 466,700 | |||
| Due after 5 years | 1,533,378 | |||
| Total bonds | 5,041,636 | |||
In 2013,2015, the Bank placedissued bonds for UF 13,768,000; Ch$ 32,500,000,000;UF22,000,000; CLP 200,000,000,000; CHF 300,000,000;150,000,000; and U.S.$ 250,000,000JPY 1,200,000,000 detailed as follows:
| Series | Currency | Amount | Term | Issuance rate | Series | Maturity date | |||||
| UF | 3,000,000 | 12 years | 3.30% per annum simple | 11-01-2014 | UF 3,000,000 | 11-01-2025 | |||||
| SF Series | UF | 3,000,000 | 5 years | UF | |||||||
| UF | 5 years | UF | |||||||||
| UF | 5 years | UF | |||||||||
| UF | 3,000,000 | 8 years | 2.40% per annum simple | 03-01-2015 | UF 3,000,000 | 09-01-2022 | |||||
| BSTDP8 Series | UF | 3,000,000 | 6 years | 2.25% per annum simple | 03-01-2015 | UF 3,000,000 | 09-01-2021 | ||||
| BSTDP9 Series | UF | 2,000,000 | 6 years | 2.60% per annum simple | 03-01-2015 | UF 5,000,000 | 09-01-2025 | ||||
| BSTDSA0714 Series | UF | 3,000,000 | 10 years | UF | |||||||
| UF Total | UF | ||||||||||
| CLP | 100,000,000,000 | 5 years | CLP | ||||||||
| CLP | 5 years | CLP | |||||||||
| CLP Total | CLP | 200,000,000,000 | |||||||||
| CHF | CHF | 150,000,000 | 7 years | 0.38% quarterly | 05-19-2015 | CHF 150,000,000 | |||||
| CHF Total | CHF | 150,000,000 | |||||||||
| 1,200,000,000 | 5 years | ||||||||||
| 1,200,000,000 |
97
During 2013, the Bank performed a partial repurchase of bonds for Ch$ 49,245,000,000
(d) Mortgage bonds
These bonds are used to finance mortgage loans with certain characteristics such as loan-to-value ratios below 80% and a debt servicing ratio of the client lower than 20%. All outstanding mortgage bonds are UF denominated.
The maturities of our mortgage bonds are as follows:
|
| ||
| As of December 31, | ||||||||
| 2015 | 2014 | |||||||
| Ch$mn | Ch$mn | |||||||
| Due within 1 year | 4,063 | 3,778 | ||||||
| Due after 1 year but within 2 years | 6,522 | 6,065 | ||||||
| Due after 2 year but within 3 years | 6,733 | 6,261 | ||||||
| Due after 3 year but within 4 years | 6,951 | 6,463 | ||||||
| Due after 4 year but within 5 years | 7,175 | 6,671 | ||||||
| Due after 5 years | 76,138 | 79,962 | ||||||
| Total mortgage bonds | 107,582 | 109,200 | ||||||
In 2013,
During 2015, the Bank issued bonds for UF 3,000,000, detailed as follows:has not placed any mortgage bonds.
(e) Subordinated bonds
The following table sets forth, at the dates indicated, the balances of our subordinated bonds. The following table sets forth, at the dates indicated, our issued subordinated bonds. The bonds are denominated principally in UFs or U.S. dollars, and are principally used to fund the Bank’s mortgage portfolio and are considered to be a part of our regulatory capital.
As of December 31, | As of December 31, | ||||||||||||||
2013 | 2012 | 2011 | 2015 | 2014 | 2013 | ||||||||||
| (in millions of Ch$) | (in millions of Ch$) | ||||||||||||||
| Subordinated bonds denominated in U.S.$ | 139,802 | 174,285 | 316,169 | - | 3 | 139,802 | |||||||||
| Subordinated bonds linked to the Ch$ | 6 | - | - | ||||||||||||
| Subordinated bonds linked to the UF | 695,932 | 551,705 | 545,702 | 745,013 | 725,913 | 695,932 | |||||||||
| Total subordinated bonds | 835,734 | 725,990 | 861,871 | 745,019 | 725,916 | 835,734 | |||||||||
The maturities of these bonds, which are considered long-term, are as follows.
| As of December 31, | ||||
| (in millions of Ch$) | ||||
| Due within 1 year | 6,583 | |||
| Due after 1 year but within 2 years | - | |||
| Due after 2 years but within 3 years | - | |||
| Due after 3 years but within 4 years | - | |||
| Due after 4 years but within 5 years | - | |||
| Due after 5 years | 738,436 | |||
| Total subordinated bonds | 745,019 | |||
During 2013,2015, the Bank issueddid not issue subordinated bonds in an aggregate principal amount of UF 5,900,000. The following chart shows details related to subordinated bond issuances:bonds.
(f) Foreign borrowings
These are short-term and long-term borrowings from foreign banks used to fund our foreign trade business. The maturities of these borrowings are as follows.
| As of December 31, | ||||
| (in millions of Ch$) | ||||
| Due within 1 year | 868,593 | |||
| Due after 1 year but within 2 years | 352,345 | |||
| Due after 2 years but within 3 years | 35,390 | |||
| Due after 3 years but within 4 years | 35,133 | |||
| Due after 5 years | 16,109 | |||
| Total loans from foreign financial institutions | 1,307,570 | |||
(f)(g) Other obligations
Other obligations are summarized as follows:
| As of December 31, | ||||
| MCh$ | ||||
| Long term obligations | ||||
| Due after 1 years but within 2 years | 3,497 | |||
| Due after 2 years but within 3 years | 20,240 | |||
| Due after 3 years but within 4 years | 16,063 | |||
| Due after 4 years but within 5 years | 28,227 | |||
| Due after 5 years | 16,328 | |||
| Long-term financial obligations subtotals | ||||
| 84,355 | ||||
| Short term obligations: | ||||
| Amounts due to credit card operators | 129,358 | |||
| Acceptance of letters of credit | 3,176 | |||
| Other long-term financial obligations, short-term portion | 3,638 | |||
| Short-term financial obligations subtotals | ||||
| 136,172 | ||||
| Other financial obligations totals | 220,527 | |||
Other Off-Balance Sheet Arrangements and Commitments
In the ordinarynormal course of our business, we are party to transactions with off-balance sheet risk in the normal course of our business.risk. These transactions expose us to credit risk in addition to amounts recognized in the consolidated financial statements. The most important off-balance sheet item is contingent loans. Contingent loans consist of guarantees granted by us in Ch$, UF and foreign currencies (principally U.S.$), unused letters of credit and commitments to extend credit such as overdraft protection and credit card lines of credit. Such commitments are agreements to lend to a customer at a future date, subject to the customer compliance with the contractual terms. Since a substantial portion of these commitments is expected to expire without being drawn upon, the total amount of commitments does not necessarily represent our actual future cash requirements. We use the same credit policies in making commitments to extend credit as we do for granting loans. Inloans, therefore, in the opinion of our management, our outstanding commitments do not represent an unusualnormal credit risk.
The following table presents the Bank’s outstanding contingent loans as of December 31, 2013, 20122015, 2014 and 2011:2013:
As of December 31, | |||
2013 | 2012 | 2011 | |
| (in millions of Ch$) | |||
| Issued and documented letters of credit | 218,032 | 199,420 | 184,649 |
| Confirmed foreign letters of credit | 127,600 | 113,878 | 52,889 |
| Documented guarantees | 1,212,799 | 1,046,114 | 920,986 |
| Other guarantees | 181,416 | 139,059 | 147,081 |
| Subtotals | 1,739,847 | 1,498,471 | 1,305,605 |
| Lines of credit with immediate availability | 5,141,831 | 4,933,335 | 4,673,525 |
| Other irrevocable obligation | 47,376 | 63,828 | 95,150 |
| Totals | 6,929,054 | 6,495,634 | 6,074,280 |
| As of December 31, | ||||||||||||
| 2015 | 2014 | 2013 | ||||||||||
| (in millions of Ch$) | ||||||||||||
| Issued and documented letters of credit | 179,042 | 205,920 | 218,032 | |||||||||
| Confirmed foreign letters of credit | 70,434 | 75,813 | 127,600 | |||||||||
| Documented guarantees | 1,684,847 | 1,481,154 | 1,212,799 | |||||||||
| Other guarantees | 163,955 | 262,169 | 181,416 | |||||||||
| Subtotals | 2,098,278 | 2,025,056 | 1,739,847 | |||||||||
| Lines of credit with immediate availability | 6,806,745 | 5,699,573 | 5,141,831 | |||||||||
| Other irrevocable obligation | 82,328 | 109,520 | 47,376 | |||||||||
| Totals | 8,987,351 | 7,834,149 | 6,929,054 | |||||||||
Asset and Liability Management
Please refer to “Item 11. Quantitative and Qualitative Disclosures about Market Risk” for information regarding our policies with respect to asset and liability management.
Capital Expenditures
The following table reflects capital expenditures in each of the three years ended December 31, 2013, 20122015, 2014 and 2011:2013:
Year Ended December 31, | |||
2013 | 2012 | 2011 | |
| (in millions of Ch$) | |||
| Land and Buildings | 17,470 | 17,177 | 8,326 |
| Machinery, Systems and Equipment | 20,171 | 14,570 | 8,503 |
| Furniture, Vehicles, Other(1) | 3,148 | 4,991 | 9,860 |
| Total | 40,789 | 36,738 | 26,689 |
| Year Ended December 31, | ||||||||||||
| 2015 | 2014 | 2013 | ||||||||||
| (in millions of Ch$) | ||||||||||||
| Land and Buildings | 27,781 | 24,957 | 17,470 | |||||||||
| Machinery, Systems and Equipment | 29,282 | 22,785 | 20,171 | |||||||||
| Furniture, Vehicles, Other(1) | 8,048 | 11,346 | 3,148 | |||||||||
| Total | 65,111 | 59,088 | 40,789 | |||||||||
| (1) | Includes assets ceded under operating leases. |
The increase in capital expenditures in 20132015 was mainly due to higher investments in IT hardware and software, and to refurbish branches as we launched the Santander Select branch model and we also closed or transformed 16 Santander Banefe branches.
F.C. Selected Statistical Information
The following information is included for analytical purposes and should be read in conjunction with our Audited Consolidated Financial Statements, as well as the discussion in this “Item 5. Item 5. Operating and Financial Review and Prospects.” The UF is linked to, and is adjusted daily to reflect changes in, the previous month’s Chilean consumer price index. See “Item 5. Operating and Financial Review and Prospects—C.A. Operating Results—Impact of Inflation.”
Average Balances, Income Earned from Interest-Earning Assets and Interest Paid on Interest-Bearing Liabilities
The average balances for interest-earning assets and interest-bearing liabilities, including interest and readjustments received and paid, have been calculated on the basis of daily balances for us on an unconsolidated basis. Such average balances are presented in Chilean pesos, UFs and in foreign currencies (principally U.S. dollars). Figures from our subsidiaries have been calculated on the basis of monthly balances. The average balances of our subsidiaries, except Santander S.A. Agente de Valores, have not been categorized by currency. As such it is not possible to calculate average balances by currency for such subsidiaries on the basis of daily, weekly or monthly balances.
The nominal interest rate has been calculated by dividing the amount of interest and principal readjustment due to changes in the UF index (gain or loss) during the period by the related average balance, both amounts expressed in constant pesos. The nominal rates calculated for each period have been converted into real rates using the following formulas:
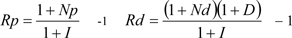
Where:
The real interest rate can be negative for a portfolio of peso-denominated loans when the inflation rate for the period is higher than the average nominal rate of the loan portfolio for the same period. A similar effect could occur for a portfolio of foreign currency denominated loans when the inflation rate for the period is higher than the sum of the devaluation rate for the period and the corresponding average nominal rate of the portfolio.
The formula for the average real rate for foreign currency denominated assets and liabilities (Rd) reflects a gain or loss in purchasing power caused by the difference between the devaluation rate of the Chilean peso and the inflation rate in Chile during the period. The following example illustrates the calculation of the real interest rate for a dollar-denominated asset bearing a nominal annual interest rate of 10.0% (Nd = 0.10), assuming a 5.0% annual devaluation rate (D = 0.05) and a 12.0% annual inflation rate (I = 0.12):
In the example, since the inflation rate was higher than the devaluation rate, the real rate is lower than the nominal rate in dollars. If, for example, the annual devaluation rate were 15.0%, using the same numbers, the real rate in Chilean pesos would be 12.9%, which is higher than the nominal rate in U.S. dollars. Using the same numbers, if the annual inflation rate were greater than 15.5%, the real rate would be negative.
Foreign exchange gains or losses on foreign currency-denominated assets and liabilities are not included in interest income or expense. Similarly, interest on the available for sale investment portfolio does not include trading or mark-to-market gains or losses on these investments. Interest is not recognized on non-performing loans. Non-performing loans that are past-due for 90 days or less have been included in each of the various categories of loans, and therefore affect the various averages. Non-performing loans consist of loans as to which either principal or interest is past-due (i.e., non-accrual loans) and restructured loans earning no interest.
Included in interbank deposits are checking accounts maintained in the Central Bank and foreign banks. Such assets have a distorting effect on the average interest rate earned on total interest-earning assets because currently balances maintained in Chilean peso amounts do not earn interest, and the only balances held in a foreign currency that earn interest are those maintained in U.S. dollars, but those only earn interest on the amounts that are legally required to be held for liquidity purposes. Additionally, this account includes interest earned by overnight investments. Consequently, the average interest earned on such assets is comparatively low. We maintain these deposits in these accounts to comply with statutory requirements and to facilitate international business, rather than to earn income.
The following tables show, by currency of denomination, average balances and, where applicable, interest amounts and real rates for our assets and liabilities for the years ended December 31, 2013, 20122015, 2014 and 2011.2013.
Year ended December 31, | ||||||||||||
2013 | 2012 | 2011 | ||||||||||
Average | Interest | Average | Average | Average | Interest | Average | Average | Average | Interest | Average | Average | |
| (in millions of Ch$, except for rate data) | ||||||||||||
| ASSETS | ||||||||||||
| Interest-earning assets | ||||||||||||
| Deposits in Central Bank | ||||||||||||
| Ch$ | 246,757 | 4,092 | (0.7%) | 1.7% | 528,682 | 18,346 | 2.0% | 3.5% | 497,897 | 16,005 | (1.2%) | 3.2% |
| UF | – | – | –% | –% | – | – | –% | –% | – | – | –% | –% |
| Foreign currencies | – | – | –% | –% | – | – | –% | –% | – | – | –% | –% |
| Subtotal | 246,757 | 4,092 | (0.7%) | 1.7% | 528,682 | 18,346 | 2.0% | 3.5% | 497,897 | 16,005 | (1.2%) | 3.2% |
| Financial investments | ||||||||||||
| Ch$ | 1,067,737 | 68,060 | 3.9% | 6.4% | 1,593,870 | 82,257 | 3.6% | 5.2% | 1,704,483 | 71,129 | (0.3%) | 4.2% |
| UF | 434,485 | 14,945 | 1.0% | 3.4% | 132,209 | 10,961 | 6.7% | 8.3% | 220,986 | 21,971 | 5.3% | 9.9% |
| Foreign currencies | 523,584 | 2,013 | 7.4% | 0.4% | 593,645 | 636 | (9.5%) | 0.1% | 854,965 | (25,201) | 3.5% | (2.9%) |
| Subtotal | 2,025,806 | 85,018 | 4.2% | 4.2% | 2,319,724 | 93,854 | 0.4% | 4.0% | 2,780,434 | 67,899 | 1.3% | 2.5% |
| Commercial Loans | ||||||||||||
| Ch$ | 5,474,890 | 496,055 | 6.5% | 9.1% | 4,874,036 | 559,194 | 9.8% | 11.5% | 4,491,613 | 409,074 | 4.5% | 9.2% |
| UF | 3,689,570 | 250,748 | 4.3% | 6.8% | 3,746,119 | 261,493 | 5.4% | 7.0% | 3,268,257 | 272,236 | 3.7% | 8.4% |
| Foreign currencies | 2,645,594 | 57,157 | 9.3% | 2.2% | 1,907,824 | 53,175 | (7.0%) | 2.8% | 1,662,095 | 44,586 | 9.5% | 2.7% |
| Subtotal | 11,810,054 | 803,960 | 6.4% | 6.8% | 10,527,979 | 873,862 | 5.2% | 8.3% | 9,421,965 | 725,896 | 5.1% | 7.8% |
| Consumer loans | ||||||||||||
| Ch$ | 3,196,286 | 607,136 | 16.2% | 19.0% | 2,735,628 | 525,209 | 17.4% | 19.2% | 2,526,772 | 539,961 | 16.2% | 21.4% |
| UF | 100,042 | 9,951 | 7.4% | 9.9% | 120,620 | 11,570 | 8.0% | 9.6% | 96,286 | 9,722 | 5.4% | 10.1% |
| Foreign currencies | 22,187 | 1 | 7.0% | –% | 16,009 | – | (9.6%) | -% | 14,374 | – | 6.6% | –% |
| Subtotal | 3,318,515 | 617,088 | 15.9% | 18.6% | 2,872,257 | 536,779 | 16.9% | 18.7% | 2,637,432 | 549,683 | 15.8% | 20.9% |
| Mortgage loans | ||||||||||||
| Ch$ | 31,403 | 2,267 | 4.7% | 7.2% | 28,170 | 2,236 | 6.4% | 7.9% | 27,811 | 2,626 | 4.8% | 9.4% |
| UF | 5,554,152 | 356,304 | 4.0% | 6.4% | 5,157,859 | 363,496 | 5.5% | 7.0% | 4,800,402 | 397,408 | 3.7% | 8.3% |
| Foreign currencies | – | – | –% | –% | – | – | -% | -% | – | – | –% | –% |
| Subtotal | 5,585,555 | 358,571 | 4.0% | 6.4% | 5,186,029 | 365,732 | 5.5% | 7.2% | 4,828,213 | 400,034 | 3.7% | 8.3% |
| Interbank Loans | ||||||||||||
| Ch$ | 5,102 | 195 | 1.4% | 3.8% | 214 | – | (1.5%) | -% | 73,505 | 3,486 | 0.3% | 4.7% |
| UF | – | – | –% | –% | – | – | -% | -% | – | – | –% | –% |
| Foreign currencies | 3 | – | 7.0% | –% | 129,581 | 790 | (9.0%) | 0.6% | 5,206 | – | 6.6% | –% |
| Subtotal | 5,105 | 195 | 1.4 | 3.8% | 129,795 | 790 | (9.0%) | 0.6% | 78,711 | 3,486 | 0.7% | 4.4% |
| Investments under agreements to resell | ||||||||||||
| Ch$ | 31,446 | 2,050 | 4.1% | 6.5% | 2,580 | 163 | 4.8% | 6.3% | 23,993 | 3,678 | 10.4% | 15.3% |
| UF | 90 | 5 | 3.1% | 5.6% | 17,900 | 1,074 | 4.4% | 6.0% | 35,009 | 1,949 | 1.1% | 5.6% |
| Foreign currencies | – | – | –% | –% | – | – | -% | -% | – | – | –% | –% |
| Subtotal | 31,536 | 2,055 | 4.1% | 6.5% | 20,480 | 1,237 | 4.5% | 6.0% | 59,002 | 5,627 | 4.9% | 9.5% |
| Threshold | ||||||||||||
| Ch$ | – | – | –% | –% | 2 | - | (1.5%) | -% | – | – | –% | –% |
| UF | – | – | –% | –% | - | - | -% | -% | – | – | –% | –% |
| Foreign currencies | 244,407 | 225 | 7.1% | 0.1% | 35,142 | 353 | (8.7%) | 1.0% | 51,385 | 105 | 6.8% | 0.2% |
| Subtotal | 244,407 | 225 | 7.1% | 0.1% | 35,144 | 353 | (8.7%) | 1.0% | 51,385 | 105 | 6.8% | 0.2% |
| Total interest-earning assets | ||||||||||||
| Ch$ | 10,053,621 | 1,179,855 | 9.1% | 11.7% | 9,763,182 | 1,187,405 | 10.5% | 12.2% | 9,346,074 | 1,045,959 | 6.5% | 11.2% |
| UF | 9,778,339 | 631,953 | 4.0% | 6.5% | 9,174,707 | 648,594 | 5.5% | 7.1% | 8,420,940 | 703,286 | 3.7% | 8.4% |
| Foreign currencies | 3,435,775 | 59,396 | 8.8% | 1.7% | 2,682,201 | 54,954 | (7.7%) | 2.0% | 2,588,025 | 19,490 | 7.4% | 0.8% |
| Subtotal | 23,267,735 | 1,871,204 | 6.9% | 8.0% | 21,620,090 | 1,890,353 | 6.1% | 8.8% | 20,355,039 | 1,768,735 | 5.5% | 8.7% |
Year ended December 31, | For the year ended December 31, | |||||||||||||||||||||||||||||||||||||||||||||||
2013 | 2012 | 2011 | 2015 | 2014 | 2013 | |||||||||||||||||||||||||||||||||||||||||||
Average | Interest | Average | Average | Average | Interest | Average | Average | Average | Interest | Average | Average | Average Balance | Interest Earned | Average Nominal Rate | Average Balance | Interest Earned | Average Nominal Rate | Average Balance | Interest Earned | Average Nominal Rate | ||||||||||||||||||||||||||||
| Assets | ||||||||||||||||||||||||||||||||||||||||||||||||
| Interest earning assets | ||||||||||||||||||||||||||||||||||||||||||||||||
| Deposits in Central Bank | ||||||||||||||||||||||||||||||||||||||||||||||||
| Ch$ | 283,376 | 7,246 | 2.6 | % | 477,977 | 8,728 | 1.8 | % | 246,757 | 4,092 | 1.7 | % | ||||||||||||||||||||||||||||||||||||
| UF | — | — | — | % | — | — | — | % | — | — | — | % | ||||||||||||||||||||||||||||||||||||
| Foreign currency | — | — | — | % | — | — | — | % | — | — | — | % | ||||||||||||||||||||||||||||||||||||
| Total | 283,376 | 7,246 | 2.6 | % | 477,977 | 8,728 | 1.8 | % | 246,757 | 4,092 | 1.7 | % | ||||||||||||||||||||||||||||||||||||
| Financial investments | ||||||||||||||||||||||||||||||||||||||||||||||||
| Ch$ | 1,323,540 | 29,488 | 2.2 | % | 1,339,117 | 40,701 | 3.0 | % | 1,067,737 | 68,060 | 6.4 | % | ||||||||||||||||||||||||||||||||||||
| UF | 139,394 | 9,583 | 6.9 | % | 295,570 | 38,906 | 13.2 | % | 434,485 | 14,945 | 3.4 | % | ||||||||||||||||||||||||||||||||||||
| Foreign currency | 1,054,110 | 10,784 | 1.0 | % | 1,368,089 | 6,047 | 0.4 | % | 523,584 | 2,013 | 0.4 | % | ||||||||||||||||||||||||||||||||||||
| Total | 2,517,044 | 49,855 | 2.0 | % | 3,002,776 | 85,654 | 2.8 | % | 2,025,806 | 85,018 | 4.2 | % | ||||||||||||||||||||||||||||||||||||
| Commercial Loans | ||||||||||||||||||||||||||||||||||||||||||||||||
| Ch$ | 5,679,661 | 502,137 | 8.8 | % | 5,658,176 | 474,537 | 8.4 | % | 5,474,890 | 496,055 | 9.1 | % | ||||||||||||||||||||||||||||||||||||
| UF | 4,466,365 | 352,466 | 7.9 | % | 4,077,560 | 381,244 | 9.3 | % | 3,689,570 | 250,748 | 6.8 | % | ||||||||||||||||||||||||||||||||||||
| Foreign currency | 3,388,381 | 78,552 | 2.3 | % | 2,874,210 | 67,140 | 2.3 | % | 2,645,594 | 57,157 | 2.2 | % | ||||||||||||||||||||||||||||||||||||
| Total | 13,534,407 | 933,155 | 6.9 | % | 12,609,946 | 922,921 | 7.3 | % | 11,810,054 | 803,960 | 6.8 | % | ||||||||||||||||||||||||||||||||||||
| Consumer loans | ||||||||||||||||||||||||||||||||||||||||||||||||
| Ch$ | 3,711,552 | 520,553 | 14.0 | % | 3,502,026 | 600,869 | 17.2 | % | 3,196,286 | 607,136 | 19.0 | % | ||||||||||||||||||||||||||||||||||||
| UF | 80,848 | 8,229 | 10.2 | % | 91,668 | 11,191 | 12.2 | % | 100,042 | 9,951 | 9.9 | % | ||||||||||||||||||||||||||||||||||||
| Foreign currency | 34,370 | — | — | % | 27,606 | — | — | % | 22,187 | 1 | — | % | ||||||||||||||||||||||||||||||||||||
| Total | 3,826,770 | 528,782 | 13.8 | % | 3,621,300 | 612,060 | 16.9 | % | 3,318,515 | 617,088 | 18.6 | % | ||||||||||||||||||||||||||||||||||||
| Mortgage loans | ||||||||||||||||||||||||||||||||||||||||||||||||
| Ch$ | 17,291 | 1,312 | 7.6 | % | 23,758 | 4,918 | 20.7 | % | 31,403 | 2,267 | 7.2 | % | ||||||||||||||||||||||||||||||||||||
| UF | 7,695,618 | 564,579 | 7.3 | % | 6,535,989 | 591,446 | 9.0 | % | 5,554,152 | 356,304 | 6.4 | % | ||||||||||||||||||||||||||||||||||||
| Foreign currency | — | — | — | % | — | — | — | % | — | — | — | % | ||||||||||||||||||||||||||||||||||||
| Total | 7,712,909 | 565,891 | 7.3 | % | 6,559,747 | 596,364 | 9.0 | % | 5,585,555 | 358,571 | 6.4 | % | ||||||||||||||||||||||||||||||||||||
| Interbank loans | ||||||||||||||||||||||||||||||||||||||||||||||||
| Ch$ | 2,271 | 364 | 16.0 | % | 4,356 | 139 | 3.2 | % | 5,102 | 195 | 3.8 | % | ||||||||||||||||||||||||||||||||||||
| UF | — | — | — | % | — | — | — | % | — | — | — | % | ||||||||||||||||||||||||||||||||||||
| Foreign currency | 3,327 | 11 | 0.3 | % | 1 | — | — | % | 3 | — | — | % | ||||||||||||||||||||||||||||||||||||
| Total | 5,598 | 375 | 6.7 | % | 4,357 | 139 | 3.2 | % | 5,105 | 195 | 3.8 | % | ||||||||||||||||||||||||||||||||||||
| Investment Agreements to resell | ||||||||||||||||||||||||||||||||||||||||||||||||
| Ch$ | 204 | 105 | 51.5 | % | 4,074 | 793 | 19.5 | % | 31,446 | 2,050 | 6.5 | % | ||||||||||||||||||||||||||||||||||||
| UF | — | 23 | — | % | — | 95 | — | % | 90 | 5 | 5.6 | % | ||||||||||||||||||||||||||||||||||||
| Foreign currency | — | — | — | % | — | — | — | % | — | — | — | % | ||||||||||||||||||||||||||||||||||||
| Total | 204 | 128 | 51.5 | % | 4,074 | 888 | 19.5 | % | 31,536 | 2,055 | 6.5 | % | ||||||||||||||||||||||||||||||||||||
| Threshold(1) | ||||||||||||||||||||||||||||||||||||||||||||||||
| Ch$ | 29,895 | 62 | 0.2 | % | 31 | — | — | % | — | — | — | % | ||||||||||||||||||||||||||||||||||||
| UF | — | — | — | % | — | — | — | % | — | — | — | % | ||||||||||||||||||||||||||||||||||||
| Foreign currency | 612,802 | 494 | 0.1 | % | 479,488 | 264 | 0.1 | % | 244,407 | 225 | 0.1 | % | ||||||||||||||||||||||||||||||||||||
| Total | 642,697 | 556 | 0.1 | % | 479,519 | 264 | 0.1 | % | 244,407 | 225 | 0.1 | % | ||||||||||||||||||||||||||||||||||||
| Total interest earning assets | ||||||||||||||||||||||||||||||||||||||||||||||||
| Ch$ | 11,047,790 | 1,061,267 | 9.6 | % | 11,009,515 | 1,130,685 | 10.3 | % | 10,053,621 | 1,179,855 | 11.7 | % | ||||||||||||||||||||||||||||||||||||
| UF | 12,382,225 | 934,880 | 7.6 | % | 11,000,787 | 1,022,882 | 9.3 | % | 9,778,339 | 631,953 | 6.5 | % | ||||||||||||||||||||||||||||||||||||
| Foreign currency | 5,092,990 | 89,841 | 1.8 | % | 4,749,394 | 73,451 | 1.5 | % | 3,435,775 | 59,396 | 1.7 | % | ||||||||||||||||||||||||||||||||||||
| Total | 28,523,005 | 2,085,988 | 7.3 | % | 26,759,696 | 2,227,018 | 8.3 | % | 23,267,735 | 1,871,204 | 8.0 | % | ||||||||||||||||||||||||||||||||||||
| (in millions of Ch$, except for rate data) | ||||||||||||||||||||||||||||||||||||||||||||||||
| ASSETS | ||||||||||||||||||||||||||||||||||||||||||||||||
| Non-interest earning assets | ||||||||||||||||||||||||||||||||||||||||||||||||
| Cash | ||||||||||||||||||||||||||||||||||||||||||||||||
| Ch$ | 678,021 | – | 544,044 | – | 448,889 | – | 715,484 | 677,003 | 678,021 | |||||||||||||||||||||||||||||||||||||||
| UF | – | – | – | — | — | — | ||||||||||||||||||||||||||||||||||||||||||
| Foreign currencies | 74,779 |
| – | 17,304 | – | 16,275 | – | |||||||||||||||||||||||||||||||||||||||||
| Subtotal | 752,800 |
| – | 561,348 | – | 465,164 | – | |||||||||||||||||||||||||||||||||||||||||
| Foreign currency | 98,936 | 78,195 | 74,779 | |||||||||||||||||||||||||||||||||||||||||||||
| Total | 814,420 | 755,198 | 752,800 | |||||||||||||||||||||||||||||||||||||||||||||
| Allowance for loan losses | ||||||||||||||||||||||||||||||||||||||||||||||||
| Ch$ | (625,960) | – | (582,581) | – | (535,656) | – | (805,244 | ) | (722,660 | ) | (625,960 | ) | ||||||||||||||||||||||||||||||||||||
| UF | – | – | – | — | — | — | ||||||||||||||||||||||||||||||||||||||||||
| Foreign currencies | – |
| – | – | ||||||||||||||||||||||||||||||||||||||||||||
| Subtotal | (625,960) |
| – | (582,581) | – | (535,656) | – | |||||||||||||||||||||||||||||||||||||||||
| Property, plant and equipment | ||||||||||||||||||||||||||||||||||||||||||||||||
| Foreign currency | (15 | ) | — | — | ||||||||||||||||||||||||||||||||||||||||||||
| Total | (805,259 | ) | (722,660 | ) | (625,960 | ) | ||||||||||||||||||||||||||||||||||||||||||
| Fixed assets | ||||||||||||||||||||||||||||||||||||||||||||||||
| Ch$ | 131,372 | – | 174,948 | – | 159,813 | – | 222,083 | 202,902 | 131,372 | |||||||||||||||||||||||||||||||||||||||
| UF | – | – | – | 40 | – | — | — | — | ||||||||||||||||||||||||||||||||||||||||
| Foreign currencies | – |
| – | – | ||||||||||||||||||||||||||||||||||||||||||||
| Subtotal | 131,372 |
| – | 174,948 | – | 159,853 | – | |||||||||||||||||||||||||||||||||||||||||
| Foreign currency | — | — | — | |||||||||||||||||||||||||||||||||||||||||||||
| Total | 222,083 | 202,902 | 131,372 | |||||||||||||||||||||||||||||||||||||||||||||
| Derivatives | – | |||||||||||||||||||||||||||||||||||||||||||||||
| Ch$ | 1,686,654 | – | 1,334,464 | – | 1,824,381 | – | 3,300,507 | 2,910,369 | 1,686,654 | |||||||||||||||||||||||||||||||||||||||
| UF | – | – | – | (178,373) | – | — | — | — | ||||||||||||||||||||||||||||||||||||||||
| Foreign currencies | 2,459 |
| – | (26,517) | – | (39,820) | – | |||||||||||||||||||||||||||||||||||||||||
| Subtotal | 1,689,113 |
| – | 1,307,847 | – | 1,606,188 | – | |||||||||||||||||||||||||||||||||||||||||
| Financial investments trading(1) | ||||||||||||||||||||||||||||||||||||||||||||||||
| Ch$ | 215,003 | – | 185,018 | – | 203,886 | – | ||||||||||||||||||||||||||||||||||||||||||
| UF | 166,124 | – | 257,719 | – | 436,435 | – | ||||||||||||||||||||||||||||||||||||||||||
| Foreign currencies | 86 |
| – | 4 | – | 9,791 | – | |||||||||||||||||||||||||||||||||||||||||
| Subtotal | 381,213 |
| – | 442,741 | – | 650,112 | – | |||||||||||||||||||||||||||||||||||||||||
| Other assets | ||||||||||||||||||||||||||||||||||||||||||||||||
| Ch$ | 952,902 | – | 975,585 | – | 979,549 | – | ||||||||||||||||||||||||||||||||||||||||||
| UF | 64,511 | – | 69,937 | – | 100,291 | – | ||||||||||||||||||||||||||||||||||||||||||
| Foreign currencies | 424,305 |
| – | 526,419 | – | 353,179 | – | |||||||||||||||||||||||||||||||||||||||||
| Subtotal | 1,441,718 |
| – | 1,571,941 | – | 1,433,019 | – | |||||||||||||||||||||||||||||||||||||||||
| Total noninterest earning assets | ||||||||||||||||||||||||||||||||||||||||||||||||
| Ch$ | 3,037,992 | – | 2,631,478 | – | 3,080,862 | – | ||||||||||||||||||||||||||||||||||||||||||
| UF | 230,635 | – | 327,656 | – | 358,393 | – | ||||||||||||||||||||||||||||||||||||||||||
| Foreign currencies | 501,629 |
| – | 517,210 | – | 339,425 | – | |||||||||||||||||||||||||||||||||||||||||
| Foreign currency | — | — | 2,459 | |||||||||||||||||||||||||||||||||||||||||||||
| Total | 3,770,256 |
| – | 3,476,344 | – | 3,778,680 | – | 3,300,507 | 2,910,369 | 1,689,113 | ||||||||||||||||||||||||||||||||||||||
| TOTAL ASSETS | ||||||||||||||||||||||||||||||||||||||||||||||||
| Ch$ | 13,091,613 | 1,179,855 | – | 12,394,660 | 1,187,405 | – | 12,426,936 | 1,045,959 | – | |||||||||||||||||||||||||||||||||||||||
| UF | 10,008,974 | 631,953 | – | 9,502,363 | 648,594 | – | 8,779,333 | 703,286 | – | |||||||||||||||||||||||||||||||||||||||
| Foreign currencies | 3,931,404 | 59,396 | – | 3,199,411 | 54,954 | – | 2,927,450 | 19,490 | – | |||||||||||||||||||||||||||||||||||||||
| Total | 27,037,991 | 1,871,204 |
| 25,096,434 | 1,890,953 |
| 24,133,719 | 1,768,735 | – | |||||||||||||||||||||||||||||||||||||||
Year ended December 31, | ||||||||||||
2013 | 2012 | 2011 | ||||||||||
Average | Interest | Average | Average | Average | Interest | Average | Average | Average | Interest | Average | Average | |
| (in millions of Ch$, except for rate data) | ||||||||||||
| LIABILITIES AND SHAREHOLDERS’ EQUITY | ||||||||||||
| Interest-bearing liabilities | ||||||||||||
| Savings accounts | ||||||||||||
| Ch$ | 1,105 | 3 | (2.0%) | 0.3% | 1,015 | 2 | (1.3%) | 0.2% | 1,092 | 3 | (4.0%) | 0.3% |
| UF | 102,655 | 1,906 | (0.5%) | 1.9% | 101,405 | 2,537 | 1.0% | 2.5% | 101,993 | 3,712 | (0.8%) | 3.6% |
| Foreign currencies | – | – | –% | –% | – | – | -% | -% | – | – | -% | -% |
| Subtotal | 103,760 | 1,909 | (0.5%) | 1.9% | 102,420 | 2,539 | 1.0% | 2.5% | 103,085 | 3,715 | 0.8% | 3.6% |
| Time deposits | ||||||||||||
| Ch$ | 7,148,978 | 386,545 | 3.0% | 5.4% | 6,383,384 | 384,895 | 4.5% | 6.0% | 5,187,931 | 288,282 | 1.1% | 5.6% |
| UF | 819,695 | 57,379 | 4.5% | 7.0% | 1,430,807 | 109,163 | 6.0% | 7.6% | 2,086,118 | 143,899 | 2.4% | 6.9% |
| Foreign currencies | 1,980,728 | 6,061 | 7.3% | 0.3% | 1,845,624 | 9,048 | (9.1%) | 0.5% | 1,833,670 | 13,392 | 7.4% | 0.7% |
| Subtotal | 9,949,401 | 449,985 | 4.0% | 4.5% | 9,659,815 | 503,106 | 2.1% | 5.2% | 9,107,719 | 445,573 | 2.7% | 4.9% |
| Central Bank borrowings | ||||||||||||
| Ch$ | – | – | –% | –% | 4,070 | 218 | 3.8% | 5.4% | 2,094 | 177 | 3.8% | 8.5% |
| UF | 221 | 14 | 3.9% | 6.3% | 399 | 14 | 2.0% | 3.5% | 1,003 | 8 | (3.5%) | 0.8% |
| Foreign currencies | – | – | –% | –% | – | – | -% | -% | – | – | –% | –% |
| Subtotal | 221 | 14 | 3.9% | 6.3% | 4,469 | 232 | 3.6% | 5.2% | 3,097 | 185 | 1.4% | 6.0% |
| Repurchase agreements | ||||||||||||
| Ch$ | 258,971 | 15,089 | 3.4% | 5.8% | 360,538 | 15,326 | 2.7% | 4.3% | 214,930 | 7,922 | (0.7%) | 3.7% |
| UF | – | – | –% | –% | – | – | –% | –% | 18,564 | 808 | (0.1%) | 4.4% |
| Foreign currencies | 7,912 | 9 | 7.1% | 0.1% | 8,800 | 73 | (8.8%) | 0.8% | 15,680 | 31 | 6.8% | 0.2% |
| Subtotal | 266,883 | 15,098 | 3.5% | 5.6% | 369,338 | 15,399 | 2.4% | 4.2% | 249,174 | 8,761 | (0.2%) | 3.5% |
| Mortgage finance bonds | ||||||||||||
| Ch$ | – | – | –% | –% | – | – | -% | -% | – | – | –% | –% |
| UF | 102,778 | 8,235 | 5.5% | 8.0% | 131,070 | 11,254 | 7.0% | 8.6% | 174,224 | 16,027 | 4.6% | 9.2% |
| Foreign currencies | – | – | –% | –% | – | – | -% | -% | – | – | –% | –% |
| Subtotal | 102,778 | 8,235 | 5.5% | 8.0% | 131,070 | 11,254 | 7.0% | 8.6% | 174,224 | 16,027 | 4.6% | 9.2% |
| Other interest-bearing liabilities | ||||||||||||
| Ch$ | 393,354 | 62,642 | 13.2% | 15.9% | 395,033 | 39,171 | 8.3% | 9.9% | 344,561 | 64,171 | 13.6% | 18.6% |
| UF | 2,654,931 | 150,770 | 3.2% | 5.7% | 2,570,059 | 157,727 | 4.6% | 6.1% | 2,427,992 | 223,895 | 4.6% | 9.2% |
| Foreign currencies | 3,802,668 | 105,789 | 10.0% | 2.8% | 2,962,081 | 118,791 | (5.9%) | 4.0% | 3,355,499 | 34,108 | 7.7% | 1.0% |
| Subtotal | 6,850,953 | 319,201 | 7.5% | 4.7% | 5,927,893 | 315,689 | (0.4%) | 5.3% | 6,128,052 | 322,174 | 6.8% | 5.2% |
| Total interest-bearing liabilities | ||||||||||||
| Ch$ | 7,802,408 | 464,279 | 3.5% | 6.0% | 7,144,040 | 439,612 | 4.6% | 6.2% | 5,750,608 | 360,555 | 1.8% | 6.3% |
| UF | 3,680,280 | 218,304 | 3.5% | 5.9% | 4,233,740 | 280,695 | 5.1% | 6.6% | 4,809,894 | 388,349 | 3.5% | 8.1% |
| Foreign currencies | 5,791,308 | 111,859 | 9.1% | 1.9% | 4,817,225 | 127,912 | (7.2%) | 2.7% | 5,204,849 | 47,531 | 7.6% | 0.9% |
| Total | 17,273,996 | 794,442 | 5.4% | 4.6% | 16,195,005 | 848,219 | 1.2% | 5.3% | 15,765,351 | 796,435 | 4.2% | 5.1% |
| For the year ended December 31, | ||||||||||||||||||||||||||||||||||||
| 2015 | 2014 | 2013 | ||||||||||||||||||||||||||||||||||
Average Balance | Interest Earned | Average Nominal Rate | Average Balance | Interest Earned | Average Nominal Rate | Average Balance | Interest Earned | Average Nominal Rate | ||||||||||||||||||||||||||||
| Financial Investment (Trading) | ||||||||||||||||||||||||||||||||||||
| Ch$ | 141,784 | 114,875 | 215,003 | |||||||||||||||||||||||||||||||||
| UF | 195,203 | 600,005 | 166,124 | |||||||||||||||||||||||||||||||||
| Foreign currency | 21,828 | 7 | 86 | |||||||||||||||||||||||||||||||||
| Total | 358,815 | 714,887 | 381,213 | |||||||||||||||||||||||||||||||||
| Other assets | ||||||||||||||||||||||||||||||||||||
| Ch$ | 1,215,289 | 1,065,307 | 952,902 | |||||||||||||||||||||||||||||||||
| UF | 69,534 | 71,241 | 64,511 | |||||||||||||||||||||||||||||||||
| Foreign currency | 846,834 | 967,643 | 424,305 | |||||||||||||||||||||||||||||||||
| Total | 2,131,657 | 2,104,191 | 1,441,718 | |||||||||||||||||||||||||||||||||
| Total non-interest earning assets | ||||||||||||||||||||||||||||||||||||
| Ch$ | 4,789,903 | 4,247,703 | 3,037,992 | |||||||||||||||||||||||||||||||||
| UF | 264,737 | 671,363 | 230,635 | |||||||||||||||||||||||||||||||||
| Foreign currency | 967,583 | 1,045,821 | 501,629 | |||||||||||||||||||||||||||||||||
| Total | 6,022,223 | 5,964,887 | 3,770,256 | |||||||||||||||||||||||||||||||||
| Total assets | ||||||||||||||||||||||||||||||||||||
| Ch$ | 15,837,693 | 1,061,266 | 15,257,218 | 1,130,685 | 13,091,613 | 1,179,855 | ||||||||||||||||||||||||||||||
| UF | 12,646,962 | 934,881 | 11,672,150 | 1,022,882 | 10,008,974 | 631,953 | ||||||||||||||||||||||||||||||
| Foreign currency | 6,060,573 | 89,841 | 5,795,215 | 73,451 | 3,937,404 | 59,396 | ||||||||||||||||||||||||||||||
| Total | 34,545,228 | 2,085,988 | 32,724,583 | 2,227,018 | 27,037,991 | 1,871,204 | ||||||||||||||||||||||||||||||
| Liabilities And Share-Holders’ Equity | ||||||||||||||||||||||||||||||||||||
| Interest bearing liabilities | ||||||||||||||||||||||||||||||||||||
| Savings accounts | ||||||||||||||||||||||||||||||||||||
| Ch$ | 1,413 | 5 | 0.4 | % | 1,213 | 3 | 0.2 | % | 1,105 | 3 | 0.3 | % | ||||||||||||||||||||||||
| UF | 112,917 | 3,937 | 3.5 | % | 106,972 | 5,461 | 5.1 | % | 102,655 | 1,906 | 1.9 | % | ||||||||||||||||||||||||
| Foreign currency | — | — | — | % | — | — | — | % | — | — | — | % | ||||||||||||||||||||||||
| Total | 114,330 | 3,942 | 3.4 | % | 108,185 | 5,464 | 5.0 | % | 103,760 | 1,909 | 1.9 | % | ||||||||||||||||||||||||
| Time deposits | ||||||||||||||||||||||||||||||||||||
| Ch$ | 9,260,339 | 334,259 | 3.6 | % | 7,891,805 | 307,868 | 3.9 | % | 7,148,978 | 386,545 | 5.4 | % | ||||||||||||||||||||||||
| UF | 965,138 | 63,857 | 6.6 | % | 1,345,965 | 93,624 | 7.0 | % | 819,695 | 57,379 | 7.0 | % | ||||||||||||||||||||||||
| Foreign currency | 2,460,027 | 5,303 | 0.2 | % | 2,715,224 | 8,443 | 0.3 | % | 1,980,728 | 6,061 | 0.3 | % | ||||||||||||||||||||||||
| Total | 12,685,504 | 403,419 | 3.2 | % | 11,952,994 | 409,935 | 3.4 | % | 9,949,401 | 449,985 | 4.5 | % | ||||||||||||||||||||||||
| Central bank borrowings | ||||||||||||||||||||||||||||||||||||
| Ch$ | 4,869 | 46 | 1.0 | % | 6,815 | 5 | 0.1 | % | — | — | — | % | ||||||||||||||||||||||||
| UF | 22 | 2 | 9.1 | % | 91 | 9 | 9.9 | % | 221 | 14 | 6.3 | % | ||||||||||||||||||||||||
| Foreign currency | — | — | 0.0 | % | — | — | — | % | — | — | — | % | ||||||||||||||||||||||||
| Total | 4,891 | 48 | 1.0 | % | 6,906 | 14 | 0.2 | % | 221 | 14 | 6.3 | % | ||||||||||||||||||||||||
| Repurchase Agreements | ||||||||||||||||||||||||||||||||||||
| Ch$ | 220,849 | 6,954 | 3.1 | % | 400,673 | 8,267 | 2.1 | % | 258,971 | 15,089 | 5.8 | % | ||||||||||||||||||||||||
| UF | — | 1 | — | % | — | — | — | % | — | 0 | — | % | ||||||||||||||||||||||||
| Foreign currency | 7,201 | 22 | 0.3 | % | 12,590 | 27 | 0.2 | % | 7,912 | 9 | 0.1 | % | ||||||||||||||||||||||||
| Total | 228,050 | 6,977 | 3.1 | % | 413,263 | 8,294 | 2.0 | % | 266,883 | 15,098 | 5.6 | % | ||||||||||||||||||||||||
| Mortgage finance bonds | ||||||||||||||||||||||||||||||||||||
| Ch$ | — | — | — | % | — | — | — | % | — | 0 | — | % | ||||||||||||||||||||||||
| UF | 63,061 | 6,420 | 10.2 | % | 81,805 | 9,698 | 11.9 | % | 102,778 | 8,235 | 8.0 | % | ||||||||||||||||||||||||
| Foreign currency | — | — | — | % | — | — | — | % | — | 0 | — | % | ||||||||||||||||||||||||
| Total | 63,061 | 6,420 | 10.2 | % | 81,805 | 9,698 | 11.9 | % | 102,778 | 8,235 | 8.0 | % | ||||||||||||||||||||||||
| Other interest bearing liabilities | ||||||||||||||||||||||||||||||||||||
| Ch$ | 677,014 | 109,455 | 16.2 | % | 409,021 | 203,374 | 49.7 | % | 393,354 | 62,642 | 15.9 | % | ||||||||||||||||||||||||
| UF | 3,020,987 | 227,384 | 7.5 | % | 2,538,094 | 234,284 | 9.2 | % | 2,654,931 | 150,770 | 5.7 | % | ||||||||||||||||||||||||
| Foreign currency | 3,802,407 | 73,137 | 1.9 | % | 3,917,969 | 38,851 | 1.0 | % | 3,802,668 | 105,789 | 2.8 | % | ||||||||||||||||||||||||
| Total | 7,500,408 | 409,976 | 5.5 | % | 6,865,084 | 476,509 | 6.9 | % | 6,850,953 | 319,201 | 4.7 | % | ||||||||||||||||||||||||
| Total interest bearing liabilities | ||||||||||||||||||||||||||||||||||||
| Ch$ | 10,164,484 | 450,719 | 4.4 | % | 8,709,527 | 519,517 | 6.0 | % | 7,802,408 | 464,279 | 6.0 | % | ||||||||||||||||||||||||
| UF | 4,162,125 | 301,601 | 7.2 | % | 4,072,927 | 343,076 | 8.4 | % | 3,680,280 | 218,304 | 5.9 | % | ||||||||||||||||||||||||
| Foreign currency | 6,269,635 | 78,462 | 1.3 | % | 6,645,783 | 47,321 | 0.7 | % | 5,791,308 | 111,859 | 1.9 | % | ||||||||||||||||||||||||
| Total | 20,596,244 | 830,782 | 4.0 | % | 19,428,237 | 909,914 | 4.7 | % | 17,273,996 | 794,442 | 4.6 | % | ||||||||||||||||||||||||
| Non interest bearing liabilities | ||||||||||||||||||||||||||||||||||||
| Non interest bearing demand deposits | ||||||||||||||||||||||||||||||||||||
| Ch$ | 5,617,012 | 5,282,135 | 4,520,789 | |||||||||||||||||||||||||||||||||
| UF | 35,163 | 35,333 | 32,787 | |||||||||||||||||||||||||||||||||
| Foreign currency | 67,714 | 68,804 | 67,273 | |||||||||||||||||||||||||||||||||
| Total | 5,719,889 | 5,386,272 | 4,620,849 | |||||||||||||||||||||||||||||||||
| For the year ended December 31, | ||||||||||||||||||||||||||||||||||||
| 2015 | 2014 | 2013 | ||||||||||||||||||||||||||||||||||
Average Balance | Interest Earned | Average Nominal Rate | Average Balance | Interest Earned | Average Nominal Rate | Average Balance | Interest Earned | Average Nominal Rate | ||||||||||||||||||||||||||||
| Derivatives | ||||||||||||||||||||||||||||||||||||
| Ch$ | 2,958,942 | 2,719,386 | 1,466,096 | |||||||||||||||||||||||||||||||||
| UF | — | — | — | |||||||||||||||||||||||||||||||||
| Foreign currency | — | — | 1,627 | |||||||||||||||||||||||||||||||||
| Total | 2,958,942 | 2,719,386 | 1,467,723 | |||||||||||||||||||||||||||||||||
| Other non-interest bearing liabilities | ||||||||||||||||||||||||||||||||||||
| Ch$ | 896,466 | 762,367 | 615,977 | |||||||||||||||||||||||||||||||||
| UF | 410,866 | 398,108 | 247,400 | |||||||||||||||||||||||||||||||||
| Foreign currency | 1,146,705 | 1,341,176 | 462,598 | |||||||||||||||||||||||||||||||||
| Total | 2,454,037 | 2,501,651 | 1,325,975 | |||||||||||||||||||||||||||||||||
| Shareholders’ equity | ||||||||||||||||||||||||||||||||||||
| Ch$ | 2,816,116 | 2,689,037 | 2,349,448 | |||||||||||||||||||||||||||||||||
| UF | — | — | — | |||||||||||||||||||||||||||||||||
| Foreign currency | — | — | — | |||||||||||||||||||||||||||||||||
| Total | 2,816,116 | 2,689,037 | 2,349,448 | |||||||||||||||||||||||||||||||||
| Total non-interest bearing liabilities and shareholders’ equity | ||||||||||||||||||||||||||||||||||||
| Ch$ | 12,288,536 | 11,452,925 | 8,952,310 | |||||||||||||||||||||||||||||||||
| UF | 446,029 | 433,441 | 280,187 | |||||||||||||||||||||||||||||||||
| Foreign currency | 1,214,419 | 1,409,980 | 531,498 | |||||||||||||||||||||||||||||||||
| Total | 13,948,984 | 13,296,346 | 9,763,995 | |||||||||||||||||||||||||||||||||
| Total Liabilities and Share-Holders’ Equity | ||||||||||||||||||||||||||||||||||||
| Ch$ | 22,453,020 | 450,719 | 20,162,452 | 519,517 | 16,754,718 | 464,279 | ||||||||||||||||||||||||||||||
| UF | 4,608,154 | 301,601 | 4,506,368 | 343,076 | 3,960,467 | 218,304 | ||||||||||||||||||||||||||||||
| Foreign currency | 7,484,054 | 78,462 | 8,055,763 | 47,321 | 6,322,806 | 111,859 | ||||||||||||||||||||||||||||||
| Total | 34,545,228 | 830,782 | 32,724,583 | 909,914 | 27,037,991 | 794,442 | ||||||||||||||||||||||||||||||
Year ended December 31, | ||||||||||||
2013 | 2012 | 2011 | ||||||||||
Average | Interest | Average | Average | Average | Interest | Average | Average | Average | Interest | Average | Average | |
| (in millions of Ch$, except for rate data) | ||||||||||||
| NON-INTEREST-BEARING LIABILITIES | ||||||||||||
| Non-interest bearing demand deposits | ||||||||||||
| Ch$ | 4,520,789 | – | – | – | 4,150,121 | – | – | – | 3,546,165 | – | – | – |
| UF | 32,787 | – | – | – | 23,047 | – | – | – | 17,115 | – | – | – |
| Foreign currencies | 67,273 | – | – | – | 4,264 | – | – | – | 12,264 | – | – | – |
| Subtotal | 4,620,849 | – | – | – | 4,177,432 | – | – | – | 3,575,544 | – | – | – |
| Derivatives | ||||||||||||
| Ch$ | 1,466,096 | – | – | – | 1,140,913 | – | – | – | 1,389,878 | – | – | – |
| UF | – | – | – | – | – | – | – | – | 35,145 | – | – | – |
| Foreign currencies | 1,627 | – | – | – | 256 | – | – | – | 32,615 | – | – | – |
| Subtotal | 1,467,723 | – | – | – | 1,141,169 | – | – | – | 1,457,638 | – | – | – |
| Other non-interest-bearing liabilities | ||||||||||||
| Ch$ | 615,977 | – | – | – | 621,920 | – | – | – | 637,053 | – | – | – |
| UF | 247,400 | – | – | – | 204,532 | – | – | – | 279,367 | – | – | – |
| Foreign currencies | 462,598 | – | – | – | 568,660 | – | – | – | 424,279 | – | – | – |
| Subtotal | 1,325,975 | – | – | – | 1,395,112 | – | – | – | 1,340,699 | – | – | – |
| Shareholders’ Equity | ||||||||||||
| Ch$ | 2,349,448 | – | – | – | 2,187,716 | – | – | – | 1,994,487 | – | – | – |
| UF | – | – | – | – | – | – | – | – | – | – | – | – |
| Foreign currencies | – | – | – | – | – | – | – | – | – | – | – | – |
| Subtotal | 2,349,448 | – | – | – | 2,187,716 | – | – | – | 1,994,487 | – | – | – |
| Total non-interest-bearing liabilities and shareholder’s equity | ||||||||||||
| Ch$ | 8,952,310 | – | – | – | 8,100,670 | – | – | – | 7,567,583 | – | – | – |
| UF | 280,187 | – | – | – | 227,579 | – | – | – | 331,627 | – | – | – |
| Foreign currencies | 531,498 | – | – | – | 573,180 | – | – | – | 469,158 | – | – | – |
| Subtotal | 9,763,995 | – | – | – | 8,901,429 | – | – | – | 8,368,368 | – | – | – |
| TOTAL LIABILITIES AND SHAREHOLDERS’ EQUITY | ||||||||||||
| Ch$ | 16,754,718 | 464,279 | – | – | 15,244,710 | 439,612 | – | – | 13,318,191 | 360,555 | – | – |
| UF | 3,960,467 | 218,304 | – | – | 4,461,319 | 280,695 | – | – | 5,141,521 | 388,349 | – | – |
| Foreign currencies | 6,322,806 | 111,859 | – | – | 5,390,405 | 127,912 | – | – | 5,674,007 | 47,531 | – | – |
| Total | 27,037,991 | 794,442 | – | – | 25,096,434 | 848,219 | – | – | 24,133,719 | 796,435 | – | – |
____________________
(1) Threshold is the asset generated when we post collateral for a derivative with a counterparty that has negative mark-to-market for us. Some CSD agreements permit this collateral to generate interest at the overnight rate and this is the source of interest income associated with this asset.
Changes in Net Interest Revenue and Interest Expense: Volume and Rate Analysis
The following table allocates, by currency of denomination, changes in our net interest revenue and interest expense between changes in the average volume of interest-earning assets and interest-bearing liabilities and changes in their respective nominal interest rates for 20132015 compared to 20122014 and 20122014 compared to 2011.2013. Volume and rate variances have been calculated based on movements in average balances over the period and changes in nominal interest rates on average interest-earning assets and average interest-bearing liabilities.
Increase (Decrease) from 2012 to 2013 | Increase (Decrease) from 2011 to 2012 | |||||||
Volume | Rate | Rate and | Net Change | Volume | Rate | Rate and | Net Change | |
| ASSETS | ||||||||
| Interest-earning assets | ||||||||
| Deposits in Central Bank | ||||||||
| Ch$ | (9,867) | (9,516) | 5,129 | (14,254) | 937 | 1,369 | 35 | 2,341 |
| UF | – | – | – | – | – | – | – | – |
| Foreign currencies | – | – | – | – | – | – | – | – |
| Total | (9,867) | (9,516) | 5,129 | (14,254) | 937 | 1,369 | 35 | 2,341 |
| Financial investments | ||||||||
| Ch$ | (27,359) | 19,126 | (5,964) | (14,197) | (4,824) | 17,296 | (1,344) | 11,128 |
| UF | 25,089 | (6,478) | (14,627) | 3,984 | (8,824) | (3,571) | 1,385 | (11,010) |
| Foreign currencies | (70) | 1,781 | (334) | 1,377 | 7,717 | 26,070 | (7,950) | 25,837 |
| Total | (2,340) | 14,429 | (20,925) | (8,836) | (5,931) | 39,795 | (7,909) | 25,955 |
| Commercial loans | ||||||||
| Ch$ | 69,098 | (116,977) | (15,260) | (63,139) | 39,470 | 98,926 | 11,724 | 150,120 |
| UF | (3,958) | (7,492) | 705 | (10,745) | 40,661 | (45,235) | (6,169) | (10,743) |
| Foreign currencies | 20,658 | (11,447) | (5,229) | 3,982 | 6,650 | 1,677 | 262 | 8,589 |
| Total | 85,798 | (135,916) | (19,784) | (69,902) | 86,781 | 55,368 | 5,817 | 147,966 |
| Consumer loans | ||||||||
| Ch$ | 88,446 | (5,471) | (1,048) | 81,927 | 44,621 | (54,832) | (4,541) | (14,752) |
| UF | (1,975) | 362 | (6) | (1,619) | 2,454 | (482) | (124) | 1,848 |
| Foreign currencies | – | – | 1 | 1 | – | – | – | – |
| Total | 86,471 | (5,109) | (1,053) | 80,309 | 47,075 | (55,314) | (4,665) | (12,904) |
| Mortgage loans | ||||||||
| Ch$ | 255 | (197) | (27) | 31 | 33 | (418) | (5) | (390) |
| UF | 27,741 | (32,555) | (2,378) | (7,192) | 30,826 | (61,248) | (3,490) | (33,912) |
| Foreign currencies | – | – | – | – | – | – | – | – |
| Total | 27,996 | (32,752) | (2,405) | (7,161) | 30,859 | (61,666) | (3,495) | (34,302) |
| Interbank loans | ||||||||
| Ch$ | – | 8 | 187 | 195 | (3,476) | (3,486) | 3,476 | (3,486) |
| UF | – | – | – | – | – | – | – | – |
| Foreign currencies | (777) | (777) | 764 | (790) | 4 | 35 | 751 | 790 |
| Total | (777) | (769) | 951 | (595) | (3,472) | (3,451) | 4,227 | (2,696) |
| Investments under agreements to resell | ||||||||
| Ch$ | 1,819 | 5 | 63 | 1,887 | (3,278) | (2,161) | 1,924 | (3,515) |
| UF | (1,069) | (72) | 72 | (1,069) | (954) | 144 | (65) | (875) |
| Foreign currencies | – | – | – | – | – | – | – | – |
| Total | 750 | (67) | 135 | 818 | (4,232) | (2,017) | 1,859 | (4,390) |
| Threshold | ||||||||
| Ch$ | – | – | – | – | – | – | – | – |
| UF | – | – | – | – | – | – | – | – |
| Foreign currencies | 2,093 | (316) | 1,905 | (128) | (33) | 411 | (130) | 248 |
| Total | 2,093 | (316) | 1,905 | (128) | (33) | 411 | (130) | 248 |
| Total interest-earning assets | ||||||||
| Ch$ | 122,392 | (113,022) | (16,920) | (7,550) | 73,483 | 56,694 | 11,268 | 141,446 |
| UF | 45,828 | (46,235) | (16,234) | (16,641) | 64,163 | (110,392) | (8,463) | (54,692) |
| Foreign currencies | 21,904 | (10,759) | (6,703) | 4,442 | 14,338 | 28,193 | (7,067) | 35,464 |
| Total | 190,124 | (170,016) | (39,857) | (19,749) | 151,984 | (25,505) | (4,262) | 122,218 |
| Increase (Decrease) from 2014 to 2015 Due to Changes in | Increase (Decrease) from 2013 to 2014 Due to Changes in | |||||||||||||||||||||||||||||||
| Volume | Rate | Rate and Volume | Net Change from 2014 to 2015 | Volume | Rate | Rate and Volume | Net Change from 2013 to 2014 | |||||||||||||||||||||||||
| Assets | ||||||||||||||||||||||||||||||||
| Interest earning assets | ||||||||||||||||||||||||||||||||
| Deposits in Central Bank | ||||||||||||||||||||||||||||||||
| Ch$ | (3,503 | ) | 3,824 | (1,803 | ) | (1,482 | ) | 3,931 | 247 | 458 | 4,636 | |||||||||||||||||||||
| UF | — | — | — | — | — | — | — | — | ||||||||||||||||||||||||
| Foreign currency | — | — | — | — | — | — | — | — | ||||||||||||||||||||||||
| Subtotal | (3,503 | ) | 3,824 | (1,803 | ) | (1,482 | ) | 3,931 | 247 | 458 | 4,636 | |||||||||||||||||||||
| Financial investments | ||||||||||||||||||||||||||||||||
| Ch$ | (467 | ) | (10,713 | ) | (33 | ) | (11,213 | ) | 17,368 | (36,303 | ) | (8,424 | ) | (27,359 | ) | |||||||||||||||||
| UF | (20,615 | ) | (18,621 | ) | 9,913 | (29,323 | ) | (4,723 | ) | 42,580 | (13,896 | ) | 23,961 | |||||||||||||||||||
| Foreign currency | (1,256 | ) | 8,209 | (2,216 | ) | 4,737 | 3,378 | — | 656 | 4,034 | ||||||||||||||||||||||
| Subtotal | (22,338 | ) | (21,125 | ) | 7,664 | (35,799 | ) | 16,023 | 6,277 | (21,664 | ) | 636 | ||||||||||||||||||||
| Commercial loans | ||||||||||||||||||||||||||||||||
| Ch$ | 1,805 | 22,633 | 3,162 | 27,600 | 16,679 | (38,324 | ) | 127 | (21,518 | ) | ||||||||||||||||||||||
| UF | 36,159 | (57,086 | ) | (7,851 | ) | (28,778 | ) | 26,383 | 92,239 | 11,874 | 130,496 | |||||||||||||||||||||
| Foreign currency | 11,826 | — | (414 | ) | 11,412 | 5,030 | 2,646 | 2,307 | 9,983 | |||||||||||||||||||||||
| Subtotal | 49,790 | (34,453 | ) | (5,103 | ) | 10,234 | 48,092 | 56,561 | 14,308 | 118,961 | ||||||||||||||||||||||
Increase (Decrease) from 2012 to 2013 | Increase (Decrease) from 2011 to 2012 | Increase (Decrease) from 2014 to 2015 Due to Changes in | Increase (Decrease) from 2013 to 2014 Due to Changes in | |||||||||||||||||||||||||||||||||||||
Volume | Rate | Rate and | Net Change | Volume | Rate | Rate and | Net Change | Volume | Rate | Rate and Volume | Net Change from 2014 to 2015 | Volume | Rate | Rate and Volume | Net Change from 2013 to 2014 | |||||||||||||||||||||||||
| LIABILITIES | ||||||||||||||||||||||||||||||||||||||||
| Interest-bearing liabilities | ||||||||||||||||||||||||||||||||||||||||
| Consumer loans | ||||||||||||||||||||||||||||||||||||||||
| Ch$ | 36,038 | (112,065 | ) | (4,289 | ) | (80,316 | ) | 58,091 | (57,533 | ) | (6,825 | ) | (6,267 | ) | ||||||||||||||||||||||||||
| UF | (1,320 | ) | (1,833 | ) | 191 | (2,962 | ) | (829 | ) | 2,301 | (232 | ) | 1,240 | |||||||||||||||||||||||||||
| Foreign currency | — | — | — | — | — | — | (1 | ) | (1 | ) | ||||||||||||||||||||||||||||||
| Subtotal | 34,718 | (113,898 | ) | (4,098 | ) | (83,278 | ) | 57,262 | (55,232 | ) | (7,058 | ) | (5,028 | ) | ||||||||||||||||||||||||||
| Mortgage loans | ||||||||||||||||||||||||||||||||||||||||
| Ch$ | (1,339 | ) | (3,112 | ) | 845 | (3,606 | ) | (550 | ) | 4,239 | (1,038 | ) | 2,651 | |||||||||||||||||||||||||||
| UF | 104,367 | (111,112 | ) | (20,122 | ) | (26,867 | ) | 62,838 | 144,408 | 27,896 | 235,142 | |||||||||||||||||||||||||||||
| Foreign currency | — | — | — | — | — | — | — | — | ||||||||||||||||||||||||||||||||
| Subtotal | 103,028 | (114,224 | ) | (19,277 | ) | (30,473 | ) | 62,288 | 148,647 | 26,858 | 237,793 | |||||||||||||||||||||||||||||
| Interbank loans | ||||||||||||||||||||||||||||||||||||||||
| Ch$ | (67 | ) | 558 | (266 | ) | 225 | (28 | ) | (31 | ) | 3 | (56 | ) | |||||||||||||||||||||||||||
| UF | - | - | - | - | — | — | — | — | ||||||||||||||||||||||||||||||||
| Foreign currency | — | — | 11 | 11 | — | — | — | — | ||||||||||||||||||||||||||||||||
| Subtotal | (67 | ) | 558 | (255 | ) | 236 | (28 | ) | (31 | ) | 3 | (56 | ) | |||||||||||||||||||||||||||
| Investment under agreement to resell | ||||||||||||||||||||||||||||||||||||||||
| Ch$ | (755 | ) | 1,304 | (1,237 | ) | (688 | ) | (1,779 | ) | 4,088 | (3,566 | ) | (1,257 | ) | ||||||||||||||||||||||||||
| UF | — | — | (72 | ) | (72 | ) | (5 | ) | (5 | ) | 100 | 90 | ||||||||||||||||||||||||||||
| Foreign currency | — | — | — | — | — | — | — | — | ||||||||||||||||||||||||||||||||
| Subtotal | (755 | ) | 1,304 | (1,309 | ) | (760 | ) | (1,784 | ) | 4,083 | (3,466 | ) | (1,167 | ) | ||||||||||||||||||||||||||
| Threshold | ||||||||||||||||||||||||||||||||||||||||
| Ch$ | — | — | 62 | 62 | — | — | — | — | ||||||||||||||||||||||||||||||||
| UF | — | — | — | — | — | — | — | — | ||||||||||||||||||||||||||||||||
| Foreign currency | 133 | — | 97 | 230 | 235 | — | (196 | ) | 39 | |||||||||||||||||||||||||||||||
| Subtotal | 133 | — | 159 | 292 | 235 | — | (196 | ) | 39 | |||||||||||||||||||||||||||||||
| Total interest earnings assets | ||||||||||||||||||||||||||||||||||||||||
| Ch$ | 31,712 | (97,571 | ) | (3,559 | ) | (69,418 | ) | 93,712 | (123,617 | ) | (19,265 | ) | (49,170 | ) | ||||||||||||||||||||||||||
| UF | 118,591 | (188,652 | ) | (17,941 | ) | (88,002 | ) | 83,664 | 281,523 | 25,742 | 390,929 | |||||||||||||||||||||||||||||
| Foreign currency | 10,703 | 8,209 | (2,522 | ) | 16,390 | 8,643 | 2,646 | 2,766 | 14,055 | |||||||||||||||||||||||||||||||
| Total | 161,006 | (278,014 | ) | (24,022 | ) | (141,030 | ) | 186,019 | 160,552 | 9,243 | 355,814 | |||||||||||||||||||||||||||||
| Liabilities and Shareholders’ Equity | ||||||||||||||||||||||||||||||||||||||||
| Interest bearing liabilities | ||||||||||||||||||||||||||||||||||||||||
| Savings accounts | ||||||||||||||||||||||||||||||||||||||||
| Ch$ | – | 1 | – | 1 | – | (1) | – | (1) | — | 2 | — | 2 | — | (1 | ) | 1 | — | |||||||||||||||||||||||
| UF | 31 | (608) | (54) | (631) | (34) | (1,135) | (6) | (1,175) | 303 | (1,712 | ) | (115 | ) | (1,524 | ) | 82 | 3,285 | 188 | 3,555 | |||||||||||||||||||||
| Foreign currencies | – | – | ||||||||||||||||||||||||||||||||||||||
| Total | 31 | (607) | (54) | (630) | (34) | (1,136) | (6) | (1,176) | ||||||||||||||||||||||||||||||||
| Foreign currency | — | — | — | — | — | — | — | — | ||||||||||||||||||||||||||||||||
| Subtotal | 303 | (1,710 | ) | (115 | ) | (1,522 | ) | 82 | 3,284 | 189 | 3,555 | |||||||||||||||||||||||||||||
| Time deposits | ||||||||||||||||||||||||||||||||||||||||
| Ch$ | 45,936 | (38,300) | (5,986) | 1,650 | 68,323 | 22,130 | 6,160 | 96,613 | 53,373 | (23,675 | ) | (3,307 | ) | 26,391 | 40,113 | (107,235 | ) | (11,555 | ) | (78,677 | ) | |||||||||||||||||||
| UF | (46,445) | (8,585) | 3,246 | (51,784) | (45,061) | 14,758 | (4,433) | (34,736) | (26,658 | ) | (5,384 | ) | 2,275 | (29,767 | ) | 36,839 | — | (594 | ) | 36,245 | ||||||||||||||||||||
| Foreign currencies | 676 | (3,691) | 28 | (2,987) | (162) | (3,913) | (269) | (4,344) | ||||||||||||||||||||||||||||||||
| Total | 167 | (50,576) | (2,712) | (53,121) | 23,100 | 32,975 | 1,458 | 57,533 | ||||||||||||||||||||||||||||||||
| Central Bank borrowings | ||||||||||||||||||||||||||||||||||||||||
| Foreign currency | (766 | ) | (2,715 | ) | 341 | (3,140 | ) | 2,203 | — | 179 | 2,382 | |||||||||||||||||||||||||||||
| Subtotal | 25,949 | (31,774 | ) | (691 | ) | (6,516 | ) | 79,155 | (107,235 | ) | (11,970 | ) | (40,050 | ) | ||||||||||||||||||||||||||
| Central bank borrowings | ||||||||||||||||||||||||||||||||||||||||
| Ch$ | (220) | 222 | (218) | 167 | (65) | (61) | 41 | (2 | ) | 61 | (18 | ) | 41 | — | — | 5 | 5 | |||||||||||||||||||||||
| UF | (6) | 11 | (5) | – | (5) | 27 | (16) | 6 | (7 | ) | (1 | ) | 1 | (7 | ) | (8 | ) | 8 | (5 | ) | (5 | ) | ||||||||||||||||||
| Foreign currencies | – | – | ||||||||||||||||||||||||||||||||||||||
| Total | (226) | (209) | 217 | (218) | 162 | (38) | (77) | 47 | ||||||||||||||||||||||||||||||||
| Foreign currency | — | — | — | — | — | — | — | — | ||||||||||||||||||||||||||||||||
| Subtotal | (9 | ) | 60 | (17 | ) | 34 | (8 | ) | 8 | — | — | |||||||||||||||||||||||||||||
| Repurchase agreements | ||||||||||||||||||||||||||||||||||||||||
| Ch$ | (4,367) | 5,408 | (1,278) | (237) | 5,338 | 1,241 | 825 | 7,404 | (3,776 | ) | 4,007 | (1,544 | ) | (1,313 | ) | 8,219 | (9,582 | ) | (5,459 | ) | (6,822 | ) | ||||||||||||||||||
| UF | – | (814) | 820 | (808) | - | - | 1 | 1 | — | — | — | — | ||||||||||||||||||||||||||||
| Foreign currencies | (7) | (62) | 5 | (64) | (13) | 95 | (40) | 42 | ||||||||||||||||||||||||||||||||
| Total | (4,374) | 5,346 | (1,273) | (301) | 4,511 | 522 | 1,605 | 6,638 | ||||||||||||||||||||||||||||||||
| Foreign currency | (11 | ) | 13 | (7 | ) | (5 | ) | 5 | 8 | 5 | 18 | |||||||||||||||||||||||||||||
| Subtotal | (3,787 | ) | 4,020 | (1,550 | ) | (1,317 | ) | 8,224 | (9,574 | ) | (5,454 | ) | (6,804 | ) | ||||||||||||||||||||||||||
| Mortgage finance bonds | ||||||||||||||||||||||||||||||||||||||||
| Ch$ | – | – | — | — | — | — | — | — | — | — | ||||||||||||||||||||||||||||||
| UF | (2,433) | (786) | 200 | (3,019) | (3,976) | (1,051) | 254 | (4,773) | (2,231 | ) | (1,391 | ) | 344 | (3,278 | ) | (1,678 | ) | 4,008 | (867 | ) | 1,463 | |||||||||||||||||||
| Foreign currencies | – | – | ||||||||||||||||||||||||||||||||||||||
| Total | (2,433) | (786) | 200 | (3,019) | (3,976) | (1,051) | 254 | (4,773) | ||||||||||||||||||||||||||||||||
| Other interest-bearing liabilities | ||||||||||||||||||||||||||||||||||||||||
| Ch$ | (166) | 23,702 | (65) | 23,471 | 9,381 | (29,984) | (4,397) | (25,000) | ||||||||||||||||||||||||||||||||
| UF | 5,177 | (10,280) | (1,854) | (6,957) | 13,215 | (75,123) | (4,260) | (66,168) | ||||||||||||||||||||||||||||||||
| Foreign currencies | 33,595 | (35,554) | (11,043) | (13,002) | (4,018) | 100,574 | (11,873) | 84,683 | ||||||||||||||||||||||||||||||||
| Total | 38,606 | (22,132) | (12,962) | 3,512 | 18,578 | (4,533) | (20,530) | (6,485) | ||||||||||||||||||||||||||||||||
| Total interest-bearing liabilities | ||||||||||||||||||||||||||||||||||||||||
| Ch$ | 41,183 | (9,409) | (7,107) | 24,667 | 83,209 | (6,679) | 2,527 | 79,057 | ||||||||||||||||||||||||||||||||
| UF | (43,676) | (20,248) | 1,533 | (62,391) | (36,675) | (63,338) | (7,641) | (107,654) | ||||||||||||||||||||||||||||||||
| Foreign currencies | 34,264 | (39,307) | (11,010) | (16,053) | (4,193) | 96,756 | (12,182) | 80,381 | ||||||||||||||||||||||||||||||||
| Total | 31,771 | (68,964) | (16,584) | (53,777) | 42,341 | 26,739 | (17,296) | 51,784 | ||||||||||||||||||||||||||||||||
| Foreign currency | — | — | — | — | — | — | — | — | ||||||||||||||||||||||||||||||||
| Subtotal | (2,231 | ) | (1,391 | ) | 344 | (3,278 | ) | (1,678 | ) | 4,008 | (867 | ) | 1,463 | |||||||||||||||||||||||||||
| Increase (Decrease) from 2014 to 2015 Due to Changes in | Increase (Decrease) from 2013 to 2014 Due to Changes in | |||||||||||||||||||||||||||||||
| Volume | Rate | Rate and Volume | Net Change from 2014 to 2015 | Volume | Rate | Rate and Volume | Net Change from 2013 to 2014 | |||||||||||||||||||||||||
| Other interest bearing liabilities | ||||||||||||||||||||||||||||||||
| Ch$ | 133,193 | (137,022 | ) | (90,090 | ) | (93,919 | ) | 2,491 | 132,954 | 5,287 | 140,732 | |||||||||||||||||||||
| UF | 44,426 | (43,148 | ) | (8,178 | ) | (6,900 | ) | (6,660 | ) | 92,923 | (2,749 | ) | 83,514 | |||||||||||||||||||
| Foreign currency | (1,156 | ) | 35,262 | 180 | 34,286 | 3,228 | (68,448 | ) | (1,718 | ) | (66,938 | ) | ||||||||||||||||||||
| Subtotal | 176,463 | (144,908 | ) | (98,088 | ) | (66,533 | ) | (941 | ) | 157,429 | 820 | 157,308 | ||||||||||||||||||||
| Total interest bearing liabilities | ||||||||||||||||||||||||||||||||
| Ch$ | 182,788 | (156,627 | ) | (94,959 | ) | (68,798 | ) | 50,823 | 16,136 | (11,721 | ) | 55,238 | ||||||||||||||||||||
| UF | 15,833 | (51,636 | ) | (5,672 | ) | (41,475 | ) | 28,575 | 100,224 | (4,027 | ) | 124,772 | ||||||||||||||||||||
| Foreign currency | (1,933 | ) | 32,560 | 514 | 31,141 | 5,436 | (68,440 | ) | (1,534 | ) | (64,538 | ) | ||||||||||||||||||||
| Total | 196,688 | (175,703 | ) | (100,117 | ) | (79,132 | ) | 84,834 | 47,920 | (17,282 | ) | 115,472 | ||||||||||||||||||||
Interest-Earning Assets: Net Interest Margin
The following table analyzes, by currency of denomination, the levels of average interest-earning assets and net interest earned by Santander-Chile, and illustrates the comparative net interest margins obtained, for each of the years indicated in the table.
Year ended December 31, | Year ended December 31, | ||||||||||||||
2013 | 2012 | 2011 | 2015 | 2014 | 2013 | ||||||||||
| (in millions of Ch$) | (in millions of Ch$) | ||||||||||||||
| Total average interest-earning assets | |||||||||||||||
| Ch$ | 10,053,621 | 9,763,182 | 9,346,074 | 11,047,790 | 11,009,515 | 10,053,621 | |||||||||
| UF | 9,778,339 | 9,174,707 | 8,420,940 | 12,382,225 | 11,000,787 | 9,778,339 | |||||||||
| Foreign currencies | 3,435,775 | 2,682,201 | 2,588,025 | 5,092,990 | 4,749,384 | 3,435,775 | |||||||||
| Total | 23,267,735 | 21,620,090 | 20,355,039 | 28,523,005 | 26,759,696 | 23,267,735 | |||||||||
| Net interest earned (1) | |||||||||||||||
| Ch$ | 715,576 | 747,793 | 685,404 | 610,548 | 611,168 | 715,576 | |||||||||
| UF | 413,649 | 367,899 | 314,937 | 633,279 | 679,806 | 413,649 | |||||||||
| Foreign currencies | (52,463) | (72,958) | (28,041) | 11,379 | 26,130 | (52,463 | ) | ||||||||
| Total | 1,076,762 | 1,042,734 | 972,300 | 1,255,206 | 1,317,104 | 1,076,762 | |||||||||
| Net interest margin (2) | |||||||||||||||
| Ch$ | 7.12% | 7.66% | 7.33% | 5.53 | % | 5.55 | % | 7.12 | % | ||||||
| UF | 4.23% | 4.01% | 3.74% | 5.11 | % | 6.18 | % | 4.23 | % | ||||||
| Foreign currencies | (1.53)% | (2.72%) | (1.08%) | 0.22 | % | 0.55 | % | (1.53 | )% | ||||||
| Total | 4.63% | 4.82% | 4.78% | 4.40 | % | 4.92 | % | 4.63 | % | ||||||
____________________
| (1) | Net interest earned is defined as interest revenue earned less interest expense incurred. |
| (2) | Net interest margin is defined as net interest earned divided by total average interest-earning assets. |
105
Return on Equity and Assets; Dividend Payout
The following table presents certain information and selected financial ratios for Santander-Chile for the years indicated.
Year ended December 31, | |||
Ch$ million | 2013 | 2012 | 2011 |
| Net income | 444,429 | 361,433 | 407,122 |
| Net income attributable to shareholders | 442,294 | 356,808 | 402,191 |
| Average total assets | 27,037,991 | 25,096,434 | 24,133,719 |
| Average equity | 2,349,448 | 2,187,716 | 1,994,487 |
| Net income as a percentage of: | |||
| Average total assets | 1.6% | 1.4% | 1.7% |
| Average equity | 18.9% | 16.5% | 20.4% |
| Average equity as a percentage of: | |||
| Average total assets | 8.7% | 8.7% | 8.3% |
| Cash dividend (1) | 265,156 | 232,780 | 261,051 |
| Dividend payout ratio, based on net income attributable to shareholders (1) | 60.0% | 65.2% | 64.9% |
| Year ended December 31, | ||||||||||||
| Ch$ million | 2015 | 2014 | 2013 | |||||||||
| Net income | 451,729 | 575,910 | 444,429 | |||||||||
| Net income attributable to shareholders | 448,466 | 569,910 | 442,294 | |||||||||
| Average total assets | 34,545,228 | 32,724,583 | 27,037,991 | |||||||||
| Average equity | 2,816,116 | 2,689,037 | 2,349,448 | |||||||||
| Net income as a percentage of: | ||||||||||||
| Average total assets | 1.3% | 1.8% | 1.6% | |||||||||
| Average equity | 16.0% | 21.4% | 18.9% | |||||||||
| Average equity as a percentage of: | ||||||||||||
| Average total assets | 8.2% | 8.2% | 8.7% | |||||||||
| Cash dividend (1) | 336,659 | 330,198 | 265,156 | |||||||||
| Dividend payout ratio, based on net income attributable to shareholders (1) | 75.0% | 58.0% | 60.0% | |||||||||
| (1) | Cash dividend for |
The following table presents dividends declared and paid by us in nominal terms in the followingpast four years:
Year | Dividend | Per share | Per ADR | % over | % over |
| 2010 | 258,752 | 1.37 | 1,426.6 | 60 | 60 |
| 2011 | 286,294 | 1.52 | 1,578.5 | 60 | 57 |
| 2012 | 261,051 | 1.39 | 1,439.1 | 60 | 65 |
| 2013 | 232,780 | 1.24 | 494.1 | 60 | 65 |
| 2014(6) | 265,156 | 1.41 | 562.8 | 60 | 60 |
| Year | Dividend Ch$ mn (1) | Dividend US$ mn (2) | Per share Ch$/share (3) | Per ADS US$/ADS (4) | % over earnings (5) | % over earnings (6) | ||||||||||||||||||||
| 2012 | 261,051 | 533.1 | 1.39 | 2.94 | 60 | 65 | ||||||||||||||||||||
| 2013 | 232,780 | 493.1 | 1.24 | 1.05 | 60 | 65 | ||||||||||||||||||||
| 2014 | 265,156 | 476.0 | 1.41 | 1.01 | 60 | 60 | ||||||||||||||||||||
| 2015 | 330,198 | 540.4 | 1.75 | 1.15 | 60 | 58 | ||||||||||||||||||||
| 2016 (6) | 336,659 | 503.7 | 1.79 | 1.07 | 75 | 75 | ||||||||||||||||||||
| (1) | Millions of nominal pesos. |
| (2) | Millions of US$ using the observed exchange rate of the day the dividend was approved in the annual shareholders meeting. |
| (3) | Calculated on the basis of 188,446 million shares. |
| (5) | Calculated by dividing dividend paid in the year by net income attributable to |
| (6) | Calculated by dividing dividend paid in the year by net income attributable to the equity holders of the Bank for the previous year under IFRS. |
106
Loan Portfolio
The following table analyzes our loans by product type. Except where otherwise specified, all loan amounts stated below are before deduction for loan loss allowances. Total loans reflect our loan portfolio, including principal amounts of past due loan and substandard loans. Any collateral provided generally consists of a mortgage on real estate, a pledge of marketable securities, a letter of credit or cash. The existence and amount of collateral generally vary from loan to loan.
As of December 31, | |||||
2013 | 2012 | 2011 | 2010 | 2009 | |
| (in millions of Ch$) | |||||
| Commercial Loans: | |||||
| Commercial loans | 7,797,682 | 7,316,417 | 6,602,372 | 6,107,117 | 5,489,595 |
| Foreign trade loans | 1,840,334 | 1,270,423 | 1,042,024 | 783,552 | 636,328 |
| Checking account debtors | 279,657 | 205,355 | 132,383 | 67,956 | 92,911 |
| Factoring transactions | 316,114 | 322,242 | 188,630 | 206,140 | 130,272 |
| Leasing transactions | 1,349,814 | 1,277,555 | 1,237,675 | 1,122,916 | 964,698 |
| Other loans and accounts receivable | 118,651 | 97,029 | 84,501 | 17,948 | 10,958 |
| Subtotal | 11,702,252 | 10,489,021 | 9,287,585 | 8,305,629 | 7,324,762 |
| Mortgage loans: | |||||
| Mortgage mutual loans | 71,833 | 46,105 | 71,878 | 184,364 | 175,592 |
| Mortgage finance bond backed loans | 72,297 | 92,204 | 113,858 | 138,094 | 199,139 |
| Other mortgage mutual loans | 5,481,682 | 5,133,272 | 4,929,927 | 4,328,679 | 3,784,322 |
| Subtotal | 5,625,812 | 5,271,581 | 5,115,663 | 4,651,137 | 4,159,053 |
| Consumer loans: | |||||
| Installment consumer loans | 2,168,121 | 1,857,657 | 1,808,594 | 1,604,603 | 1,378,044 |
| Credit card loans | 1,235,881 | 1,054,473 | 920,852 | 794,216 | 586,937 |
| Consumer leasing contracts | 3,451 | 3,688 | 3,727 | 3,735 | 3,835 |
| Other consumer loans | 199,795 | 199,659 | 210,673 | 298,236 | 275,233 |
| Subtotal | 3,607,248 | 3,115,477 | 2,943,846 | 2,700,790 | 2,244,049 |
| Subtotal Loans to customers | 20,935,312 | 18,876,079 | 17,347,094 | 15,657,556 | 13,727,864 |
| Interbank loans | 125,449 | 90,573 | 87,688 | 69,726 | 23,412 |
| Total | 21,060,761 | 18,966,652 | 17,434,782 | 15,727,282 | 13,751,276 |
| As of December 31, | ||||||||||||||||||||
| 2015 | 2014 | 2013 | 2012 | 2011 | ||||||||||||||||
| (in millions of Ch$) | ||||||||||||||||||||
| Commercial Loans: | ||||||||||||||||||||
| Commercial loans | 8,985,452 | 8,324,949 | 7,797,682 | 7,316,417 | 6,602,372 | |||||||||||||||
| Foreign trade loans | 2,152,570 | 1,786,232 | 1,840,334 | 1,270,423 | 1,042,024 | |||||||||||||||
| Checking account debtors | 234,723 | 266,231 | 279,657 | 205,355 | 132,383 | |||||||||||||||
| Factoring transactions | 275,647 | 327,841 | 316,114 | 322,242 | 188,630 | |||||||||||||||
| Leasing transactions | 1,534,192 | 1,489,384 | 1,349,814 | 1,277,555 | 1,237,675 | |||||||||||||||
| Other loans and accounts receivable | 143,775 | 135,663 | 118,651 | 97,029 | 84,501 | |||||||||||||||
| Subtotal | 13,326,359 | 12,330,300 | 11,702,252 | 10,489,021 | 9,287,585 | |||||||||||||||
| Mortgage loans: | ||||||||||||||||||||
| Mortgage finance bond backed loans | 134,105 | 116,150 | 72,297 | 92,204 | 113,858 | |||||||||||||||
| Mortgage mutual loans | 44,028 | 57,356 | 71,833 | 46,105 | 71,878 | |||||||||||||||
| Other mortgage mutual loans | 7,634,717 | 6,458,525 | 5,481,682 | 5,133,272 | 4,929,927 | |||||||||||||||
| Subtotal | 7,812,850 | 6,632,031 | 5,625,812 | 5,271,581 | 5,115,663 | |||||||||||||||
| Consumer loans: | ||||||||||||||||||||
| Installment consumer loans | 2,469,646 | 2,320,775 | 2,168,121 | 1,857,657 | 1,808,594 | |||||||||||||||
| Credit card loans | 1,434,609 | 1,362,587 | 1,235,881 | 1,054,473 | 920,852 | |||||||||||||||
| Consumer leasing contracts | 5,460 | 5,270 | 3,451 | 3,688 | 3,727 | |||||||||||||||
| Other consumer loans | 240,956 | 229,743 | 199,795 | 199,659 | 210,673 | |||||||||||||||
| Subtotal | 4,150,671 | 3,918,375 | 3,607,248 | 3,115,477 | 2,943,846 | |||||||||||||||
| Subtotal Loans to customers | 25,289,880 | 22,880,706 | 20,935,312 | 18,876,079 | 17,347,094 | |||||||||||||||
| Interbank loans | 10,877 | 11,943 | 125,449 | 90,573 | 87,688 | |||||||||||||||
| Total | 25,300,757 | 22,892,649 | 21,060,761 | 18,966,652 | 17,434,782 | |||||||||||||||
The loan categories are as follows:
Commercial loans
Commercial loans are long-term and short-term loans, including checking overdraft lines for companies, granted in Chilean pesos, inflation linked, U.S.$ linked or denominated in U.S.$. The interest on these loans is fixed or variable and is used primarily to finance working capital or investments. General commercial loans also include factoring operations.
Foreign tradeloans are fixed rate, short-term loans made in foreign currencies (principally U.S.$) to finance imports and exports.
Checking account debtors mainly include mortgage loans (fixed and variable rate) that are inflation-indexed long-term loans with monthly payments of principal and interest secured by a real property mortgage. These loans can be endorsed to a third party.
Factoring transactions mainly include short-term loans to companies with a fixed monthly nominal rate backed by a company invoice.
107
Leasing transactions are agreements for the financial leasing of capital equipment and other property.
Other loans and accounts receivable loansinclude other loans and accounts payable.
Mortgage loans
Mortgage mutual loans mainly include mortgage loans (fixed and variable rate) that are inflation-indexed long-term loans with monthly payments of principal and interest secured by a real property mortgage. These are financed by issuing mortgage bonds.
Mortgage finance bond backed loans are inflation-indexed, fixed or variable rate, long-term loans with monthly payments of principal and interest secured by a real property mortgage that are financed with mortgage finance bonds. At the time of approval, these types of mortgage loans cannot be more than 75% of the lower of the purchase price or the appraised value of the mortgaged property or such loan will be classified as a commercial loan. Mortgage bonds are our general obligations, and we are liable for all principal and accrued interest on such bonds. In addition, if the issuer of a mortgage finance bond becomes insolvent, the General Banking Law’s liquidation procedures provide that these types of mortgage loans with their corresponding mortgage bonds shall be auctioned as a unit and the acquirer must continue paying the mortgage finance bonds under the same conditions as the original issuer.
Other mortgage mutual loans mainly include mortgage loans (fixed and variable rate) that are inflation-indexed long-term loans with monthly payments of principal and interest secured by a real property mortgage. These are financed by our general borrowings.
Consumer loans
Installment consumer loans are loans to individuals, granted in Chilean pesos, generally on a fixed rate nominal basis, to finance the purchase of consumer goods or to pay for services.
Consumer loans through lines of creditare checking overdraft lines to individuals, granted in Chilean pesos, generally on a fixed rate nominal basis and linked to an individual’s checking account.
Credit card loans include credit card balances subject to nominal fixed rate interest charges.
Consumer leasing contracts are agreements for the financial leasing of automobiles and other property to individuals.
Other loans and accounts receivable from customers include draft lines for individuals.
Non-client loans
Interbank loans are fixed rate, short-term loans to financial institutions that operate in Chile.
Maturity and Interest Rate Sensitivity of Loans
The following table sets forth an analysis by type and time remaining to maturity of our loans as of December 31, 2013.2015.
Due in 1 year | Due after 1 | Due after 5 | Total balance | Due in 1 year or less | Due after 1 year through 5 years | Due after 5 years | Total balance as of December 31, 2015 | |||||||||||||
(in millions of Ch$) | (in millions of Ch$) | |||||||||||||||||||
| General commercial loans | 4,290,789 | 2,792,230 | 1,527,835 | 8,610,854 | 4,640,615 | 3,235,176 | 1,992,287 | 9,868,078 | ||||||||||||
| Foreign trade loans | 1,550,121 | 147,847 | 45,042 | 1,743,010 | 1,700,661 | 182,013 | 31,722 | 1,914,396 | ||||||||||||
| Leasing contracts | 318,102 | 654,147 | 369,706 | 1,341,955 | 327,331 | 744,243 | 466,277 | 1,537,851 | ||||||||||||
| Other outstanding loans | 6,433 | - | 6,433 | 6,034 | - | - | 6,034 | |||||||||||||
| Subtotal commercial loans | 6,165,445 | 3,594,224 | 1,942,583 | 11,702,252 | 6,674,641 | 4,161,432 | 2,490,286 | 13,326,359 | ||||||||||||
| Residential loans backed by mortgage bonds | 22,637 | 45,598 | 23,149 | 91,384 | 11,659 | 28,502 | 10,572 | 50,733 | ||||||||||||
| Other residential mortgage loans | 311,030 | 1,025,141 | 4,198,257 | 5,534,428 | 425,462 | 1,441,862 | 5,894,793 | 7,762,117 | ||||||||||||
| Subtotal residential mortgage loans | 333,667 | 1,070,739 | 4,221,406 | 5,625,812 | 437,121 | 1,470,364 | 5,905,365 | 7,812,850 | ||||||||||||
| Consumer loans | 1,757,349 | 1,702,907 | 146,992 | 3,607,248 | 2,160,811 | 1,867,006 | 122,854 | 4,150,671 | ||||||||||||
| Subtotal | 8,256,461 | 6,367,870 | 6,310,981 | 20,935,312 | 9,272,573 | 7,498,802 | 8,518,505 | 25,289,880 | ||||||||||||
| Interbank loans | 125,449 | - | 125,449 | 10,877 | - | - | 10,877 | |||||||||||||
| Total loans | 8,381,910 | 6,367,870 | 6,310,981 | 21,060,761 | 9,283,450 | 7,498,802 | 8,518,505 | 25,300,757 | ||||||||||||
The following tables present the interest rate sensitivitytotal amount of outstanding loans due after one year that have fixed and variable interest rates as of December 31, 2013.2015. See also “Item 5. Operating and Financial Review and Prospects –C.–A. Operating Results—Interest Rates.”
| As of December 31, | ||||
| (in millions of Ch$) | ||||
| Variable Rate | ||||
| Ch$ | 1,159 | |||
| UF | 623,256 | |||
| Foreign currencies | - | |||
| Subtotal | 624,415 | |||
| Fixed Rate | ||||
| Ch$ | 4,073,306 | |||
| UF | 10,408,698 | |||
| Foreign currencies | 910,887 | |||
| Subtotal | 15,392,891 | |||
| Total | 16,017,306 | |||
Loans by Economic Activity
The following table sets forth, at the dates indicated, an analysis of our client loan portfolio based on the borrower’s principal economic activity and geographic distribution. Loans to individuals for business purposes are allocated to their economic activity.
Domestic loans (*) as of December 31, | Foreign loans (**) as of December 31, | |||||||||
2013 | 2012 | 2011 | 2010 | 2009 | 2013 | 2012 | 2011 | 2010 | 2009 | |
| (in millions of Ch$) | (in millions of Ch$) | |||||||||
| Commercial loans | ||||||||||
| Manufacturing | 1,216,914 | 1,014,777 | 834,011 | 838,324 | 640,395 | – | – | – | – | – |
| Mining | 464,865 | 292,217 | 266,442 | 106,119 | 67,057 | – | – | – | – | – |
| Electricity, gas and water | 222,110 | 337,269 | 221,039 | 149,907 | 144,386 | – | – | – | – | – |
| Agriculture and livestock | 806,092 | 770,558 | 760,527 | 679,159 | 610,909 | – | – | – | – | – |
| Forestry | 183,716 | 120,002 | 89,353 | 84,375 | 71,085 | – | – | – | – | – |
| Fishing | 265,917 | 188,803 | 144,162 | 133,930 | 127,025 | – | – | – | – | – |
| Transport | 721,931 | 511,407 | 473,414 | 449,508 | 362,508 | – | – | – | – | – |
| Communications | 249,499 | 179,544 | 252,528 | 214,881 | 164,077 | – | – | – | – | – |
| Construction | 1,337,791 | 1,130,194 | 980,797 | 839,316 | 817,293 | – | – | – | – | – |
| Commerce | 2,578,979 | 2,396,428 | 1,916,400 | 1,732,800 | 1,650,903 | 125,383 | 90,546 | 87,041 | 69,709 | 23,409 |
| Services | 447,861 | 400,716 | 384,061 | 358,314 | 288,256 | – | – | – | – | – |
| Other | 3,206,643 | 3,147,133 | 2,965,498 | 2,719,013 | 2,380,871 | – | – | – | – | – |
| Subtotals | 11,702,318 | 10,489,048 | 9,288,232 | 8,305,646 | 7,324,765 | 125,383 | 90,546 | 87,041 | 69,709 | 23,409 |
| Mortgage loans | 5,625,812 | 5,271,581 | 5,115,663 | 4,651,137 | 4,159,053 | – | – | – | – | – |
| Consumer loans | 3,607,248 | 3,115,477 | 2,943,846 | 2,700,790 | 2,244,049 | – | – | – | – | – |
| Total | 20,935,378 | 18,876,106 | 17,347,741 | 15,657,573 | 13,727,867 | 125,383 | 90,546 | 87,041 | 69,709 | 23,409 |
109
Domestic loans (*) as of December 31, | Foreign loans (**) as of December 31, | |||||||||
2015 | 2014 | 2013 | 2012 | 2011 | 2015 | 2014 | 2013 | 2012 | 2011 | |
| (in millions of Ch$) | (in millions of Ch$) | |||||||||
| Commercial loans | ||||||||||
| Manufacturing | 1,171,830 | 1,126,268 | 1,216,914 | 1,014,777 | 834,011 | - | – | – | – | – |
| Mining | 510,467 | 428,847 | 464,865 | 292,217 | 266,442 | - | – | – | – | – |
| Electricity, gas and water | 454,456 | 567,548 | 222,110 | 337,269 | 221,039 | - | – | – | – | – |
| Agriculture and livestock | 1,019,922 | 871,247 | 806,092 | 770,558 | 760,527 | - | – | – | – | – |
| Forestry | 96,069 | 98,039 | 183,716 | 120,002 | 89,353 | - | – | – | – | – |
| Fishing | 344,496 | 256,818 | 265,917 | 188,803 | 144,162 | - | – | – | – | – |
| Transport | 876,329 | 758,339 | 721,931 | 511,407 | 473,414 | - | – | – | – | – |
| Communications | 160,135 | 167,004 | 249,499 | 179,544 | 252,528 | - | – | – | – | – |
| Construction | 1,462,535 | 1,365,841 | 1,337,791 | 1,130,194 | 980,797 | - | – | – | – | – |
| Commerce | 3,050,663 | 2,773,410 | 2,578,979 | 2,396,428 | 1,916,400 | 10,827 | 11,899 | 125,383 | 90,546 | 87,041 |
| Services | 483,516 | 469,141 | 447,861 | 400,716 | 384,061 | - | – | – | – | – |
| Other | 3,695,991 | 3,447,842 | 3,206,643 | 3,147,133 | 2,965,498 | - | – | – | – | – |
| Subtotals | 13,326,409 | 12,330,344 | 11,702,318 | 10,489,048 | 9,288,232 | 10,827 | 11,899 | 125,383 | 90,546 | 87,041 |
| Mortgage loans | 7,812,850 | 6,632,031 | 5,625,812 | 5,271,581 | 5,115,663 | – | – | – | – | – |
| Consumer loans | 4,150,671 | 3,918,375 | 3,607,248 | 3,115,477 | 2,943,846 | – | – | – | – | – |
| Total | 25,289,930 | 22,880,750 | 20,935,378 | 18,876,106 | 17,347,741 | 10,827 | 11,899 | 125,383 | 90,546 | 87,041 |
110
Total loans as of December 31, | % of total loans as of December 31, | |||||||||
2015 | 2014 | 2013 | 2012 | 2011 | 2015 | 2014 | 2013 | 2012 | 2011 | |
| (in millions of Ch$) | (in millions of Ch$) | |||||||||
| Commercial loans | ||||||||||
| Manufacturing | 1,171,830 | 1,126,268 | 1,216,914 | 1,014,777 | 834,011 | 4.63% | 4.92% | 5.78% | 5.35% | 4.78% |
| Mining | 510,467 | 428,847 | 464,865 | 292,217 | 266,442 | 2.02% | 1.87% | 2.21% | 1.54% | 1.53% |
| Electricity, gas and water | 454,456 | 567,548 | 222,110 | 337,269 | 221,039 | 1.80% | 2.48% | 1.05% | 1.78% | 1.27% |
| Agriculture and livestock | 1,019,922 | 871,247 | 806,092 | 770,558 | 760,527 | 4.03% | 3.81% | 3.83% | 4.06% | 4.36% |
| Forestry | 96,069 | 98,039 | 183,716 | 120,002 | 89,353 | 0.38% | 0.43% | 0.87% | 0.63% | 0.51% |
| Fishing | 344,496 | 256,818 | 265,917 | 188,803 | 144,162 | 1.36% | 1.12% | 1.26% | 1.00% | 0.83% |
| Transport | 876,329 | 758,339 | 721,931 | 511,407 | 473,414 | 3.46% | 3.31% | 3.43% | 2.70% | 2.72% |
| Communications | 160,135 | 167,004 | 249,499 | 179,544 | 252,528 | 0.63% | 0.73% | 1.18% | 0.95% | 1.45% |
| Construction | 1,462,535 | 1,365,841 | 1,337,791 | 1,130,194 | 980,797 | 5.78% | 5.97% | 6.35% | 5.96% | 5.63% |
| Commerce | 3,061,490 | 2,773,410 | 2,704,362 | 2,486,974 | 2,003,441 | 12.10% | 12.17% | 12.84% | 13.11% | 11.49% |
| Services | 483,516 | 469,141 | 447,861 | 400,716 | 384,061 | 1.91% | 2.05% | 2.13% | 2.11% | 2.20% |
| Other | 3,695,991 | 3,447,842 | 3,206,643 | 3,147,133 | 2,965,498 | 14.61% | 15.06% | 15.23% | 16.59% | 17.01% |
| Subtotals | 13,337,236 | 12,330,344 | 11,827,701 | 10,579,594 | 9,375,273 | 52.71% | 53.92% | 56.16% | 55.78% | 53.78% |
| Mortgage loans | 7,812,850 | 6,632,031 | 5,625,812 | 5,271,581 | 5,115,663 | 30.88% | 28.99% | 26.71% | 27.79% | 29.34% |
| Consumer loans | 4,150,671 | 3,918,375 | 3,607,248 | 3,115,477 | 2,943,846 | 16.41% | 17.17% | 17.13% | 16.43% | 16.88% |
| Total | 25,300,757 | 22,880,750 | 21,060,761 | 18,966,652 | 17,434,782 | 100.00% | 100.00% | 100.00% | 100.00% | 100.00% |
| (*) |
| (**) | Includes foreign interbank loans for Ch$ |
Total loans as of December 31, | % of total loans as of December 31, | |||||||||
2013 | 2012 | 2011 | 2010 | 2009 | 2013 | 2012 | 2011 | 2010 | 2009 | |
| (in millions of Ch$) | (in millions of Ch$) | |||||||||
| Commercial loans | ||||||||||
| Manufacturing | 1,216,914 | 1,014,777 | 834,011 | 838,324 | 640,395 | 5.78% | 5.35% | 4.78% | 5.33% | 4.66% |
| Mining | 464,865 | 292,217 | 266,442 | 106,119 | 67,057 | 2.21% | 1.54% | 1.53% | 0.67% | 0.49% |
| Electricity, gas and water | 222,110 | 337,269 | 221,039 | 149,907 | 144,386 | 1.05% | 1.78% | 1.27% | 0.95% | 1.05% |
| Agriculture and livestock | 806,092 | 770,558 | 760,527 | 679,159 | 610,909 | 3.83% | 4.06% | 4.36% | 4.32% | 4.44% |
| Forestry | 183,716 | 120,002 | 89,353 | 84,375 | 71,085 | 0.87% | 0.63% | 0.51% | 0.54% | 0.52% |
| Fishing | 265,917 | 188,803 | 144,162 | 133,930 | 127,025 | 1.26% | 1.00 % | 0.83% | 0.85% | 0.92% |
| Transport | 721,931 | 511,407 | 473,414 | 449,508 | 362,508 | 3.43% | 2.70% | 2.72% | 2.86% | 2.64% |
| Communications | 249,499 | 179,544 | 252,528 | 214,881 | 164,077 | 1.18% | 0.95% | 1.45% | 1.37% | 1.19% |
| Construction | 1,337,791 | 1,130,194 | 980,797 | 839,316 | 817,293 | 6.35% | 5.96% | 5.63% | 5.34% | 5.94% |
| Commerce | 2,704,362 | 2,486,974 | 2,003,441 | 1,802,509 | 1,674,312 | 12.84% | 13.11% | 11.49% | 11.46% | 12.18% |
| Services | 447,861 | 400,716 | 384,061 | 358,314 | 288,256 | 2.13% | 2.11% | 2.20% | 2.28% | 2.10% |
| Other | 3,206,643 | 3,147,133 | 2,965,498 | 2,719,013 | 2,380,871 | 15.23% | 16.59% | 17.01% | 17.29% | 17.31% |
| Subtotals | 11,827,701 | 10,579,594 | 9,375,273 | 8,375,355 | 7,348,174 | 56.16% | 55.78% | 53.78% | 53.26% | 53.44% |
| Mortgage loans | 5,625,812 | 5,271,581 | 5,115,663 | 4,651,137 | 4,159,053 | 26.71% | 27.79% | 29.34% | 29.57% | 30.24% |
| Consumer loans | 3,607,248 | 3,115,477 | 2,943,846 | 2,700,790 | 2,244,049 | 17.13% | 16.43% | 16.88% | 17.17% | 16.32% |
| Total | 21,060,761 | 18,966,652 | 17,434,782 | 15,727,282 | 13,751,276 | 100.00% | 100.00% | 100.00% | 100.00% | 100.00% |
111
Foreign Assets and Loans
Santander-Chile’s Asset and Liability Committee, or ALCO, is responsible for determining the maximum foreign country exposure the Bank is permitted to have. The ALCO has determined that the total foreign country exposure cannot be greater than 1-time regulatory capital. To determine this, each country is classified using a ranking system from 1 to 6 based on the definition promulgated by the SBIF, in which the main consideration is the international rating of each country. The ALCO has also set a higher limit if the foreign exposure is to related parties. As of
December 31, 2013,2015, the Bank’s foreign exposure, including the estimate of counterparty risk in our derivatives portfolio, was U.S.$1,7132,090 million, or 3.3%4.3% of our assets. For more information please See Note 40see note 37 of our Audited Consolidated Financial Statements.
Below, there are additional details regarding our exposure to Spain and Italy and other countries not classified in category 1.2 and 3, the riskiest categories we have exposure to as of December 31, 2015, considering fair value of derivative instruments. In this category Italy is the largest exposure and is also broke down below. We do not have sovereign exposure to Spain or Italy.
Country | Classification (1) | Derivative | Deposits | Loans | Financial | Total Exposure |
| Spain | 2 | 0.28 | 8.56 | 0.04 | – | 8.88 |
| Italy | 2 | 66.40 | 4.04 | 0.84 | – | 71.28 |
| Other | 2 | 5.08 | 0.17 | 0.98 | – | 6.23 |
| Total | 71.76 | 12.77 | 1.86 | – | 86.39 |
Country | Classification(1) | Derivative Instruments (adjusted to market) | Deposits | Loans | Financial Investments USD Mn | Total Exposure USD Mn |
USD Mn | USD Mn | USD Mn | ||||
| Colombia | 2 | 1.2 | - | - | - | 1.2 |
| Italy | 2 | 46.4 | 0.7 | - | - | 47.1 |
| Others | 3 | 1.3 | - | - | - | 1.3 |
| Total | 48.9 | 0.7 | - | - | 49.6 |
| (1) | Corresponds to country’s classification established in Chapter B-6 of the Compendium of Accounting Standards issued by the SBIF. |
Our exposure to Spain within the groupGrupo Santander is as follows:
Counterpart | Country | Classification | Derivative | Deposits | Loans | Financial | Total |
| Banco Santander España** | Spain | 2 | 0.28 | 8.56 | – | – | 8.84 |
| Counterpart | Country | Classification | Derivative instruments (market adjusted)* USD Mn | Deposits USD Mn | Loans USD Mn | Financial Investments USD Mn | Total Exposure USD Mn | |||||||||||||||||||||
| Banco Santander Spain** | Spain | 1 | 20.1 | 357.5 | - | - | 377.6 | |||||||||||||||||||||
| * | The total amount of this exposure to derivative instruments must be compensated daily with collateral and, therefore, the net credit exposure is |
| ** | We have included our exposure to Santander branches in New York and Hong Kong as exposure to Spain. |
Furthermore, is additional detail regarding our exposure to the United States, which is the only country with more than 1% of exposure over total assets. Below we detail exposure to assets in the USA as of December 31, 2013,2015, considering fair value of derivative instruments.
Country | Classification (1) | Derivative | Deposits | Loans | Financial | Total |
| USA | 1 | 107.8 | 1,158.1 | 0.00 | 0.00 | 1,269.9 |
| Country | Classification(1) | Derivative Instruments (adjusted to market) USD Mn | Deposits USD Mn | Loans USD Mn | Financial Investments USD Mn | Total Exposure USD Mn | ||||||||||||||||||||
| USA | 1 | 27.8 | 1,371.2 | - | 21.1 | 1,420.2 | ||||||||||||||||||||
As of December 31, 2013,2015, we had no applicable sovereign exposure, no unfunded exposure, no credit default protection and no current developments.
Classification of Loan Portfolio112
Credit Review Process
The Risk Division, our credit analysis and risk management group, is largely independent of our Commercial Division. Risk evaluation teams interact regularly with our clients. For larger transactions, risk teams in our headquarters work directly with clients when evaluating credit risks and preparing credit applications. Various credit approval committees, all of which include Risk Division and Commercial Division personnel, must verify that the appropriate qualitative and quantitative parameters are met by each applicant. Each committee’s powers are defined by our Board of Directors.
Santander-Chile’s governance rules have established the existence of two high-level committees to monitor and control credit risks: the Executive Credit Committee and the Risk Committee. See “Item 11. Quantitative and Qualitative Disclosures About Market Risk—A. Credit Risk” for more information.
Credit Approval
The following table lists our committees from which credit approval is required depending on total risk exposure for loans evaluated on an individual basis:
|
|
We also have a department designated to monitor the quality of the loan portfolio on a continuous basis. The purpose of this special supervision is to maintain constant scrutiny over the portions of the portfolio that represent the greatest risk and to anticipate any deterioration. Based on this ongoing review of the loan portfolio, we believe that we are able to detect potentially problematic loans and make a decision on a client’s status. This includes measures such as reducing or extinguishing a loan, or requiring better collateral from the client. The control systems require that these loans be reviewed at least three times per year for those clients in the lowest category of credit watch.
Credit Approval: Loans approved on an individual basis
In preparing a credit proposal for a corporate client whose loans are approved on an individual basis, Santander-Chile’s personnel verifies such parameters as debt servicing capacity (typically including projected cash flows), the company’s financial history and projections for the economic sector in which it operates. The Risk Division is closely involved in this process, and prepares the credit application for the client. All proposals contain an analysis of the client’s strengths and weaknesses, a rating and a recommendation. Credit limits are determined not on the basis of outstanding balances of individual clients, but on the direct and indirect credit risk of entire financial groups. For example, a corporation will be evaluated together with its subsidiaries and affiliates.
Credit Approval: Loans approved on a group basis
The majority of loans to individuals and small and mid-sized companies are approved by the Standardized Risk Area through an automated credit scoring system. This system is decentralized, automated and based on multiple parameters, including demographic and information regarding credit behavior from external sources and the SBIF.
Classification of Loan Portfolio
Credit Review Process
The Risk Division, our credit analysis and risk management group, is largely independent of our Commercial Division. Risk evaluation teams interact regularly with our clients. For larger transactions, risk teams in our headquarters work directly with clients when evaluating credit risks and preparing credit applications. Various credit approval committees, all of which include Risk Division and Commercial Division personnel, must verify that the appropriate qualitative and quantitative parameters are met by each applicant. Each committee’s powers are defined by our Board of Directors.
Santander-Chile’s governance rules have established the existence of two high-level committees to monitor and control credit risks: the Executive Credit Committee and the Risk Committee. See “Item 11. Quantitative and Qualitative Disclosures About Market Risk—A. Credit Risk” for more information.
Role of Santander Spain’s Global Risk Department: Credit Risk
In matters regarding Credit Risk, Santander Spain’s Global Risk Department has the following role:
| · | All credit risks greater than U.S.$40 million (U.S.$60 million for financial institutions), after being approved locally, are reviewed by Santander Spain. This additional review ensures that no global exposure limit is being breached. |
| · | In standardized risks, the consumer and mortgage scoring models are developed locally but are reviewed and approved by Santander Spain’s Global Risk Department. |
| · | For each scoring model, a monthly Risk Report is prepared, which is reviewed locally and is also sent to Santander Spain’s Global Risk Department. This report includes the evolution of basic credit risk parameters such as: loan amounts, non-performance, charge offs and provisions. |
| · | Monthly, the Controller of the Risk Department sends a report to Santander Spain’s Global Risk Department covering all the main indicators regarding credit risk and the evolution of credit risk as compared to the budgeted levels. |
Credit Approval
The following diagram lists our committees from which credit approval is required depending on total risk exposure for loans evaluated on an individual basis:
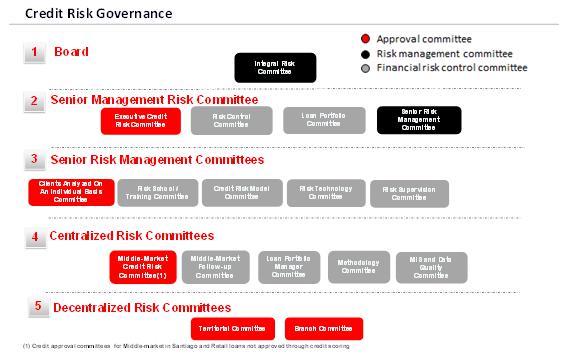
We also have a department designated to monitor the quality of the loan portfolio on a continuous basis. The purpose of this special supervision is to maintain constant scrutiny over the portions of the portfolio that represent the greatest risk and to anticipate any deterioration. Based on this ongoing review of the loan portfolio, we believe that we are able to detect potentially problematic loans and make a decision on a client’s status. This includes measures such as reducing or extinguishing a loan, or requiring better collateral from the client. The control systems require that these loans be reviewed at least three times per year for those clients in the lowest category of credit watch.
Credit Approval: Loans approved on an individual basis
In preparing a credit proposal for a corporate client whose loans are approved on an individual basis, Santander-Chile’s personnel verifies such parameters as debt servicing capacity (typically including projected cash flows), the company’s financial history and projections for the economic sector in which it operates. The Risk Division is closely involved in this process, and prepares the credit application for the client. All proposals contain an analysis of the client’s strengths and weaknesses, a rating and a recommendation. Credit limits are determined not on the basis of outstanding balances of individual clients, but on the direct and indirect credit risk of entire financial groups. For example, a corporation will be evaluated together with its subsidiaries and affiliates.
Credit Approval: Loans approved on a group basis
The majority of loans to individuals and small and mid-sized companies are approved by the Standardized Risk Area through an automated credit scoring system. This system is decentralized, automated and based on multiple parameters, including demographic and information regarding credit behavior from external sources and the SBIF.
Classification of Loan Portfolio
Loans are divided into: (i) consumer loans (including loans granted to individuals for the purpose of financing the acquisition of consumer goods or payment of services); (ii) residential mortgage loans (including loans granted to individuals for the acquisition, construction or repair of residential real estate, in which the value of the property covers at least 100% of the amount of the loan); and (iii) commercial loans (including all loans other than consumer loans and residential mortgage loans). The models and methods used to classify our loan portfolio and establish credit loss allowances must follow the following guiding principles, which have been approved by our Board of Directors.
114
Loans analyzed on an individual basis
For loans that are greater than Ch$150 million (US$286,000), the Bank uses internal models to assign a risk category level to each borrower and its respective loans. We consider the following risk factors: industry or sector of the borrower, the borrower’s competitive position in its markets, owners or managers of the borrower, the borrower’s financial situation, the borrower’s payment capacity and the borrower’s payment behavior to calculate the estimated incurred loan loss. Through these categories, we differentiate the normal loan portfolio from the impaired one.
These are our categories:
1. Debtors may be classified in risk categories A1, A2, A3 or B (if they are current on their payment obligations and show no sign of deterioration in their credit quality). B is different from the A categories by a certain history of late payments. The A categories are distinguished by different PNPs (as defined below).
| 1. | Debtors may be classified in risk categories A1, A2, A3 or B (if they are current on their payment obligations and show no sign of deterioration in their credit quality). B is different from the A categories by a certain history of late payments. The A categories are distinguished by different PNPs (as defined below). |
2. Debtors classified as C1, C2, C3, C4, D1 or D2 include debtors whose loans with us have been charged off or administered by our Recovery Unit, or classified as Precontenciosos (PRECO or deteriorated).
| 2. | Debtors classified as C1, C2, C3, C4, D1 or D2 include debtors whose loans with us have been charged off or administered by our Recovery Unit, or classified asPrecontenciosos (PRECO or deteriorated). |
For loans classified as A1, A2, A3 and B, we assign a specific provision level on an individual basis to each borrower and, therefore, the amount of loan loss allowance is determined on a case by case basis.
Estimated Incurred Loan Loss = Loan Loss Allowance
The estimated incurred loss is obtained by multiplying all risk factors defined in the following equation:
EIL= EXP x PNP x SEV
| · | EIL = Estimated Incurred Loan Loss. The estimated incurred loan loss is how much could be lost in the event a debtor does not perform the obligations under the loan. |
| · | EXP = Exposure. This corresponds to the value of commercial loans. |
| · | PNP = Probability of Non-Performance. This variable, expressed as a percentage, indicates the probability that a debtor will |
| · | SEV = Severity. This is the effective loss rate given default for debtors in the same segment, which is determined statistically based on the historical effective losses for us for each segment. |
PNP and SEV are reviewed and updated every three years. Every year, models together with PNP and SEV assumptions, are tested by the Bank’s Credit Risk Department, to ensure that they are appropriate at each reporting date so as to make sure any difference between the estimated incurred losses and real losses is reduced.
These tests focus on the validation of the sufficiency of the Bank’s allowances, and consist of comparisons between actual write-offs to allowances established by the model, and the coverage of the total allowance to actual write-offs in the most current periods. Individual loan classification and improvements to any customer classification are also presented for approval to our Risk Committee.
Our internal policy requires us to update appraisals of the fair value of collateral every 24 months, which policy does not vary by loan product. The appraisal is required to be performed within a shorter period if market conditions in general or conditions in a specific sector or with respect to certain customers indicate that the fair value of the collateral may have changed and any updated fair value of the collateral is factored into our allowance for loan loss calculations. A change in fair value of the collateral may change the risk category or profile of a customer which could result in lower or higher allowance for loan losses.
In accordance with such policy, every year we update appraisals of fair value of collateral before the end of the 24 month period for certain customers and such updated appraisals are considered in the calculation of the allowance for
115
for loan losses. The number of updated appraisals performed in 2011 was 59 in 2012 was 72, and in 2013 was 113, in 2014 was 98 and in 2015 was 43, and such updated appraisals were performed mainly because of changes in customer conditions (renegotiation deterioration of financial situation increase in credit line).
For loans classified in the C and D categories, loan loss allowances are based mainly on the fair value of the collateral, adjusted for an estimate cost to sell, that each of these loans have. Allowance percentage for each category is then based on the fair value of the collateral, or the expected future cash flow from the loan for each individually evaluated non-performing loans. As of December 31, 2015, loans classified in the C and D risk categories had the following associated loan loss allowance levels:
| Classification | Allowance | |
| C1 | 2% | |
| C2 | 10% | |
| C3 | 25% | |
| C4 | 40% | |
| D1 | 65% | |
| D2 | 90% |
Loans analyzed on a group basis
The Bank uses the concept of estimation ofestimated incurred debtloss to quantify the allowances levels over the group-evaluated portfolios.loan analyzed on a group basis. Incurred debtloss is the expected provision expense that will appear one year away from the balance date of the transaction’s credit risk, considering the counterpart risk and the guaranteescollateral associated withto each transaction.
Following the Bank’s definition, the Bank uses group evaluation to approach transactions that have similar credit risk features, which indicate the debtor’s payment capacity overof the entire debt, principalcapital and interests, pursuant to the contract’s terms. In addition, this allows us to assess a high number of transactions with low individual amounts, whether they belong to individuals or small sized companies. Therefore, debtors and loans with similar features are grouped together and each group has a risk level assigned to it.
These models are meant to be used mainly to analyze loans granted to individuals (including consumer loans, credit lines, mortgage loans and commercial loans) and commercial loans to SMEs.
Allowances are established using these models, taking into account the historical Impairmentimpairment and other known circumstances at the time of evaluation. After this, a historical loss rate is assigned to each portfolio profile constituting each segment.
Allowances for group-evaluated loans are established based on the credit risk of the profile to which the loan belongs, within the established segments for the type of loan. The method for assigning a profile is established based on a statistical building method, establishing a relation through a logistic regression various variables, such as payment behavior in the Bank, payment behavior outside the Bank, various sociodemographicsocio-demographic data, among others, and a response variable that determines a client’s risk level, which in this case is 90 days of non-performance (The chosen features are relevant when calculating future cash flows per group of assets).non-performance. Afterwards, common profiles are established related to a logical order and with differentiateddifferentiate default rates, applying the real historical loss the Bank has had with that portfolio.
The different risk categories are constructed and updated periodically based on the payment behavior of the client’s profile to which they belong, as well as his or her sociodemographic characteristics. Therefore, when a customer has past due balance or has missed some payments, the outcome is that the customer will move to a different segment with a higher loss rate, therefore capturing current trends for each risk profile.
Allowance quantification, once the customers have been classified, is the product of three factors: exposure (EXP), Probability of Non-Performance (PNP) and Severity (SEV). The same equation used for individual assessment mentioned above.
The estimated incurred loss rates for group-evaluated loans correspond to charge-offs net of recoveries. The methodology establishes the period in which the estimated incurred loss for each risk profile emerges. Once the loss has been considered to have been incurred, the estimated incurred loss rates are applied to the corresponding risk profile to obtain the net charge-off level associated with this period. The loss rates applied to each risk profile are based only on the historical net charge-off data for that specific profile within one of the four groups of loans. No other statistical or other information other than net charge-offs is used to determine the loss rates.
To determine the estimated incurred loss for commercial and mortgage loans collectively evaluated for impairment, we mainly analyze the payment behavior of clients, particularly the payment behavior of clients with payments that are more than 90 days overdue, clients with other weaknesses, such as early non-performance (i.e., payments that are past-due, though by less than 90 days), clients with modified loans and clients with renegotiated loans, as well as success in recovery against these clients. We also take into account whether the loan is supported by collateral.
In connection with mortgage loans, historical net charge-offs are considered in the model to calculate loss rates for loans collectively evaluated for impairment. The risk categories are such that when a customer has a past-due balance or has missed some payments, the outcome is that the customer will move to a different risk category with a higher loss rate, therefore capturing current trends of the customer and, when aggregate, current trends in the market.
Our models for loans analyzed on a group basis (consumer loans, residential mortgage loans and small-and-mid- sizedsmall-and-mid-sized commercial loans) are monitored on a monthly basis with respect to predictability and stability, using indicatorsindices that seek to capture the underlying need to update the models for current loss trends. Therefore, the periods of historical net charge-offs used in the allowance model may be more than a year old as we only update the historical net charge-offs only when our assessment of predictability and stability indicators determine it is necessary.
The different risk categories are constructed and updated periodically based on the payment behavior of the client’s profile to which they belong, as well as his or her socio-demographic characteristics. Therefore, when a customer has past due balance or has missed some payments, the outcome is that the customer will move to a different segment with a higher loss rate, therefore capturing current trends for each risk profile.
116
Once the customers have been classified, the loan loss allowance is the product of three factors: Exposure (EXP), Probability of Non-Performance (PNP) and Severity (SEV).
EXP = Exposure. This corresponds to the value of commercial loans.
PNP = Probability of Non-Performing. This variable, expressed as a percentage, indicates the probability that a debtor will default. This percentage is associated with the internal score that we give to each debtor, which is determined by analyzing such parameters as debt servicing capacity (including, usually, projected cash flows), the company’s financial history, the solvency and capacity of shareholders and management, and projections for the economic sector in which it operates. The internal rating can be different from ratings obtained from external third parties.
SEV = Severity. This is the effective loss rate given default for debtors in the same segment, which is determined statistically based on the historical effective losses for us for each segment.
PNP and SEV are reviewed and updated every three years. Every year, models together with PNP and SEV assumptions, are tested by the Bank’s Credit Risk Department, to ensure that they are appropriate at each reporting date so as to make sure any difference between the estimated incurred losses and real losses is reduced.
Allowances for consumer loans
The estimated incurred loss rates for consumer loans correspond to charge-offs net of recoveries. The methodology establishes the period in which the estimated incurred loss for each risk profile emerges. Once the loss has been considered to have been incurred, the estimated incurred loss rates are applied to the corresponding risk profile to obtain the net charge-off level associated with this period. The loss rates applied to each risk profile are based only on the historical net charge-off data for that specific profile within one of the four groups of consumer loans. No other statistical or other information other than net charge-offs is used to determine the loss rates.
The following table sets forth the allowances required by our models for consumer loans from September 30, 2010 until June 2012:2012 to December 2014:
Bank:
Allowance Level(1) | Allowance Level(1) (Loss rate) | ||||||
Not renegotiated | Not renegotiated | ||||||
Loan type | Risk Profile | New Clients* | Existing Clients | Renegotiated | Risk Profile | New Clients | Existing Clients |
| Consumer | Profile 1 | 33.78% | 10.39% | 41.95% | |||
| Performing Consumer | Profile 1 | 24.5% | 20.9% | ||||
| Profile 2 | 10.82% | 2.01% | 26.29% | Profile 2 | 14.0% | 10.1% | |
| Profile 3 | 6.05% | 0.82% | 15.63% | Profile 3 | 7.3% | 5.0% | |
| Profile 4 | 5.70% | 0.38% | 7.01% | Profile 4 | 3.4% | 2.1% | |
| Profile 5 | 4.12% | 0.22% | 3.00% | Profile 5 | 2.1% | 1.4% | |
| Profile 6 | 2.51% | – | 1.25% | Profile 6 | 1.3% | 0.9% | |
| Profile 7 | 1.40% | – | 0.50% | Profile 7 | 0.8% | 0.5% | |
| Profile 8 | 0.4% | 0.3% | |||||
Allowance Level | ||||
Not renegotiated | ||||
Loan type | Days Past Due | New Clients* | Existing Clients | Renegotiated |
| Consumer | 90-120 | 44.58% | 56.39% | 52.82% |
| 120-150 | 44.58% | 67.33% | 62.96% | |
| 150-180 | 44.58% | 75.49% | 70.08% | |
Allowance Level(1) (Loss rate) | ||
Loan type | Risk Profile | Renegotiated |
| Renegotiated Consumer which were less than 90 days past due at the time of renegotiation | Profile 1 | 29.7% |
| Profile 2 | 21.5% | |
| Profile 3 | 10.7% | |
| Profile 4 | 6.5% | |
| Profile 5 | 4.2% | |
| Profile 6 | 3.2% |
117
Allowance Level(1) (Loss rate) | ||
Loan type | Risk Profile | Renegotiated |
| Renegotiated Consumer which were more than 90 days past due at the time of renegotiation (2) | Profile 1 | 100.0% |
| Profile 2 | 56.0% | |
| Profile 3 | 47.0% | |
| Profile 4 | 38.5% |
Allowance Level(1) (Loss rate) | ||||
Not renegotiated | ||||
Loan type | Days Past Due | New Clients | Existing Clients | Renegotiated |
| Non-performing Consumer | 90-120 | 38.5% | 38.5% | 41.6% |
| 120-150 | 47.0% | 47.0% | 48.8% | |
| 150-180 | 55.0% | 55.0% | 55.9% | |
| >180 | Charged-off | |||
Santander Banefe:
Allowance Level(1) | Allowance Level(1) (Loss rate) | ||||||
Not renegotiated | Not renegotiated | ||||||
Loan type | Risk Profile | New Clients* | Existing Clients | Renegotiated | Risk Profile | New Clients | Existing Clients |
| Consumer | Profile 1 | 57.60% | 33.24% | 51.13% | |||
| Performing Consumer | Profile 1 | 26.7% | 22.3% | ||||
| Profile 2 | 22.97% | 14.23% | 32.79% | Profile 2 | 14.2% | 12.3% | |
| Profile 3 | 19.40% | 7.16% | 28.85% | Profile 3 | 9.0% | 4.4% | |
| Profile 4 | 14.62% | 4.10% | 19.23% | Profile 4 | 5.8% | 2.2% | |
| Profile 5 | 10.77% | 2.52% | 13.31% | Profile 5 | 3.1% | 0.7% | |
| Profile 6 | 5.88% | 1.34% | 8.57% | Profile 6 | 1.3% | 0.2% | |
| Profile 7 | 3.09% | 0.94% | 4.37% | Profile 7 | – | 0.1% | |
| Profile 8 | – | 2.69% | |||||
Allowance Level | ||||
Not renegotiated | ||||
Loan type | Days Past Due | New Clients* | Existing Clients | Renegotiated |
| Consumer | 90-120 | 82.95% | 56.36% | 53.55% |
| 120-150 | 82.95% | 68.00% | 64.05% | |
| 150-180 | 82.95% | 78.54% | 74.72% | |
Allowance Level(1) (Loss rate) | ||
Loan type | Risk Profile | Renegotiated |
| Renegotiated Consumer which were less than 90 days past due at the time of renegotiation | Profile 1 | 36.6% |
| Profile 2 | 29.6% | |
| Profile 3 | 21.0% | |
| Profile 4 | 12.2% | |
| Profile 5 | 7.1% | |
| Profile 6 | 5.2% |
Allowance Level(1) (Loss rate) | ||
Loan type | Risk Profile | Renegotiated |
| Renegotiated Consumer which were more than 90 days past due at the time of renegotiation(2) | Profile 1 | 100.0% |
| Profile 2 | 64.7% | |
| Profile 3 | 48.9% | |
| Profile 4 | 32.1% |
118
Allowance Level(1) | ||||
Not renegotiated | ||||
Loan type | Past-due Days | New Clients | Existing Clients | Renegotiated (2) |
| Non-performing Consumer | 90-120 | 32.1% | 32.1% | 48.9% |
| 120-150 | 37.4% | 37.4% | 55.8% | |
| 150-180 | 42.7% | 42.7% | 64.7% | |
| >180 | Charged-off | |||
| Percentage of |
In 2012, we continuedDuring the second half of 2014, and as a response to the ongoing improvement of the allowances models for loans, the Bank updated its allowances model for consumer loans. The model was calibrated with the aim of improving the prediction of client behavior and maintaining statistical and management standards. Part of these improvements consisted of implementing more robust techniques of statistical processes and more historical information, resulting in stronger parameters for the Probability of Non-Performance (PNP) and the Severity (SEV) involved in the provision calculation. These changes resulted in the release of consumer provisions of Ch$26,563 million in 2014. As this is a change in estimation, the impact of this improvement was recognized under the "Provisions for loan losses" in the Consolidated Statement of Income for the year in accordance with IAS 8. The most important improvement was the development of a separate model for our policySantander Select customers, which are higher income clients. This is in line with the Bank’s strategy of upgradingreducing exposure to the low-end of the consumer market and growing in less risky segments. The following table sets forth the allowances required by our models to determine allowances for consumer loans especially regarding consumer loans with some type of renegotiation. since December 2014:
Bank:
Allowance Level(1) (Loss rate) | ||||
Not renegotiated | ||||
Loan type | Risk Profile | New Clients | Existing Clients | Santander Select* |
| Performing Consumer | Profile 1 | 19.03% | 20.81% | 10.70% |
| Profile 2 | 7.53% | 6.53% | 2.35% | |
| Profile 3 | 4.52% | 3.06% | 1.02% | |
| Profile 4 | 2.99% | 1.67% | 0.47% | |
| Profile 5 | 1.91% | 0.93% | 0.23% | |
| Profile 6 | 1.38% | 0.43% | 0.14% | |
| Profile 7 | 0.77% | 0.20% | 0.08% | |
| Profile 8 | 0.30% | 0.08% | 0.04% | |
| * | Santander Select includes those clients attended to within the Santander Select distribution network, which is part of the Retail Banking segment. |
Allowance Level(1) (Loss rate) | ||
Loan type | Risk Profile | Renegotiated |
| Renegotiated Consumer which were less than 90 days past due at the time of renegotiation (2) | Profile 1 | 29.14% |
| Profile 2 | 25.78% | |
| Profile 3 | 21.57% | |
| Profile 4 | 17.58% | |
| Profile 5 | 13.47% | |
| Profile 6 | 10.84% | |
| Profile 7 | 8.12% | |
| Profile 8 | 5.37% |
119
Allowance Level(1) (Loss rate) | ||
Loan type | Risk Profile | Renegotiated |
| Renegotiated Consumer which were more than 90 days past due at the time of renegotiation (2) | Profile 1 | 100.0% |
| Profile 2 | 52.92% | |
| Profile 3 | 44.99% | |
| Profile 4 | 37.17% |
Allowance Level(1) (Loss rate) | |||||
Not renegotiated | |||||
Loan type | Days Past Due | New Clients | Existing Clients | Select | Renegotiated |
| Non-performing Consumer | 90-120 | 37.17% | 37.17% | 37.17% | 41.72% |
| 120-150 | 44.99% | 44.99% | 44.99% | 47.68% | |
| 150-180 | 52.92% | 52.92% | 52.92% | 54.14% | |
| >180 | Charged-off | ||||
Santander Banefe:
Allowance Level(1) (Loss rate) | |||
Not renegotiated | |||
Loan type | Risk Profile | New Clients | Existing Clients |
| Performing Consumer | Profile 1 | 24.45% | 18.95% |
| Profile 2 | 13.53% | 7.14% | |
| Profile 3 | 9.12% | 3.27% | |
| Profile 4 | 7.39% | 1.90% | |
| Profile 5 | 6.47% | 0.94% | |
| Profile 6 | 4.74% | 0.60% | |
| Profile 7 | 3.68% | 0.28% | |
| Profile 8 | 1.35% | 0.17% | |
Allowance Level(1) (Loss rate) | ||
Loan type | Risk Profile | Renegotiated |
| Renegotiated Consumer which were less than 90 days past due at the time of renegotiation | Profile 1 | 32.09% |
| Profile 2 | 29.67% | |
| Profile 3 | 27.96% | |
| Profile 4 | 24.17% | |
| Profile 5 | 18.67% | |
| Profile 6 | 14.79% | |
| Profile 7 | 11.22% | |
| Profile 8 | 8.78% | |
Allowance Level(1) (Loss rate) | ||
Loan type | Risk Profile | Renegotiated |
| Renegotiated Consumer which were more than 90 days past due at the time of renegotiation(2) | Profile 1 | 100.0% |
| Profile 2 | 42.04% | |
| Profile 3 | 35.97% | |
| Profile 4 | 31.48% |
120
Allowance Level(1) | ||||
Not renegotiated | ||||
Loan type | Past-due Days | New Clients | Existing Clients | Renegotiated (2) |
| Non-performing Consumer | 90-120 | 31.48% | 31.48% | 44.50% |
| 120-150 | 35.97% | 35.97% | 50.06% | |
| 150-180 | 42.04% | 42.04% | 58.56% | |
| >180 | Charged-off | |||
| 1. | Percentage of loans outstanding |
| 2. | This category relates only to loans which were renegotiated and were less than 90 days past due at the time of renegotiation, migrating from such category as they reached 90 days past due since renegotiation. |
There are now threetwo renegotiated categories in our consumer loan portfolio:
| 1. | Renegotiated |
| 2. | Renegotiated Consumer |
Profile 1: 180 or more days past due
Profile 2: between 150 and 180 days past due
Profile 3: between 120 and 150 days past due
Profile 4: between 90 and 120 days past due
After the customer has made three consecutive monthly payments, he/she will be reassigned to one of the seven risk profiles for “Renegotiated Consumer” (number 1 above). If the customer is not able to make the required monthly payment under the renegotiated terms and days past due increase, the customer will move to a more risky profile within the same group “Renegotiated Consumer with three months of non-payment”. For example, a customer in Profile 1 (180 or more days past due) that increases days past due will remain in the same category and profile and, therefore, will continue to have a 100% loss rate. A customer in Profile 4 (between 90 and 120 days past due) who reaches more than 120 days past due will move to Profile 3, increasing their loss rate from 38.5% to 47.0%.
The following table sets forth the allowances required by our models for consumer loans since June 2012:
Bank:
Allowance Level(1) (Loss rate) | |||
Not renegotiated | |||
Loan type | Risk Profile | New Clients | Existing Clients |
| Performing Consumer | Profile 1 | 24.5% | 20.9% |
| Profile 2 | 14.0% | 10.1% | |
| Profile 3 | 7.3% | 5.0% | |
| Profile 4 | 3.4% | 2.1% | |
| Profile 5 | 2.1% | 1.4% | |
| Profile 6 | 1.3% | 0.9% | |
| Profile 7 | 0.8% | 0.5% | |
| Profile 8 | 0.4% | 0.3% | |
| ||
|
|
|
| ||
|
|
|
Allowance Level(1) (Loss rate) | ||||
Not renegotiated | ||||
Loan type | Days Past Due | New Clients | Existing Clients | Renegotiated |
| Non-performing Consumer | 90-120 | 38.5% | 38.5% | 41.6% |
| 120-150 | 47.0% | 47.0% | 48.8% | |
| 150-180 | 55.0% | 55.0% | 55.9% | |
| >180 | Charged-off | |||
Santander Banefe:
Allowance Level(1) (Loss rate) | |||
Not renegotiated | |||
Loan type | Risk Profile | New Clients | Existing Clients |
| Performing Consumer | Profile 1 | 26.7% | 22.3% |
| Profile 2 | 14.2% | 12.3% | |
| Profile 3 | 9.0% | 4.4% | |
| Profile 4 | 5.8% | 2.2% | |
| Profile 5 | 3.1% | 0.7% | |
| Profile 6 | 1.3% | 0.2% | |
| Profile 7 | – | 0.1% | |
| ||
|
|
|
| ||
|
|
|
Allowance Level(1) | ||||
Not renegotiated | ||||
Loan type | Past-due Days | New Clients | Existing Clients | Renegotiated (2) |
| Non-performing Consumer | 90-120 | 32.1% | 32.1% | 48.9% |
| 120-150 | 37.4% | 37.4% | 55.8% | |
| 150-180 | 42.7% | 42.7% | 64.7% | |
| >180 | Charged-off | |||
Allowances for residential mortgage loans
Prior to June 2011, residential mortgage loans were assigned an allowance level based on credit risk profiles which were determined utilizing a statistical model that considered a borrower’s credit history, including any defaults on obligations to other creditors, as well as the past-due periods on the loans borrowed from us. Once the rating of the client was determined, the allowance for a mortgage loan was calculated using a risk category, which was directly related to days past-due. The following table sets forth the ratios of the required allowance amount to the aggregate amount of the principal and accrued but unpaid interest on the loan used under the Bank’s prior model.
Previous model | Past-due days | |||||||
1-30 | 31-60 | 61-120 | 121-180 | 181-360 | 361- 720 | >720 | ||
| Mortgage | Profile 1 | 0.3% | 0.5% | 1.2% | 2.4% | 6.8% | 14.1% | 28.3% |
| Profile 2 | 1.5% | 1.6% | 2.5% | 4.4% | 6.8% | 14.1% | 28.3% | |
As of June 2011, the newour provision methodology for residential mortgage loans takes into consideration different factors in order to group customers with less the 90 days past due into seven different risk profiles. Factors considered, in the first place, are whether the customer is a new customer or with prior history with the Bank or if it is a Banefe customer. For each of these three main categories additional factors are considered in order to develop risk profiles within each risk category, including payment behavior, non-performance less than 90 days, collateral levels, renegotiation history with the Bank, and historical amounts of net charge-offs, among others. The explanation for the initial segregation into three categories, existing, new or Banefe customer, is as follows: Banefe customers have a different risk profile as they relate to low income individuals; an existing customer (Banefe or Bank) is a customer for which there is a broader level of information and history of payment behavior with the Bank, while for a new customer the Bank has no history of payment behavior and only information from the banking system and credit bureaus is available. The risk categories are such that when a customer’s payment behavior deteriorates, the outcome is that the customer will move to a different risk category with a higher loss rate, therefore capturing the current status of the customer.
Mortgage loans with more than 90 days past due balances are assigned a loss rate of 11.01%. When the customer becomes current in its payments, such customer will migrate to one of the profiles in the table above. We determined that 90 days is the appropriate, loss emergence period for these loans based onsince our historical analysis of customer’s behavior which has shown that after a customer has reached the 90-day threshold he/she will90 days, customers are likely to default on his/her obligation,their obligations, and that, over succeeding periods, the loss incurred does not increase given the high fair value of collateral percentage to loan amount required under our credit policies for this type of loan. Also, we note that the Chilean economy´seconomy’s stability over the last few years has not resulted in other than insignificant fluctuations in collateral fair values on residential mortgage loan properties. When the customer becomes current in its payments, such customer will migrate to one of the profiles in the table above.
The following table sets forth the required loan loss allowance for residential mortgage loans since June 2011 and in 2012.2013:
Allowance Level(1) (Loss rate) | Allowance Level(1) (Loss rate) | |||||||
Loan type | Risk Profile | New client* | Old | Banefe | Risk Profile | New client | Old | Banefe |
| Residential mortgage | Profile 1 | 5.47% | 4.72% | 5.68% | Profile 1 | 5.96% | 5.14% | 6.19% |
| Profile 2 | 1.66% | 1.41% | 2.51% | Profile 2 | 1.81% | 1.54% | 2.74% | |
| Profile 3 | 0.45% | 0.59% | 0.71% | Profile 3 | 0.49% | 0.64% | 0.77% | |
| Profile 4 | 0.15% | 0.26% | 0.24% | Profile 4 | 0.17% | 0.28% | 0.26% | |
| Profile5 | 0.10% | 0.12% | 0.08% | Profile 5 | 0.11% | 0.13% | 0.08% | |
| Profile6 | 0.03% | 0.06% | Profile 6 | 0.03% | 0.07% | |||
| Profile7 | 0.02% | Profile 7 | 0.02% | |||||
121
In 2013, the model for the renegotiated mortgage loan portfolio was updated. This was driven by the fact that after the 2010 earthquake the Bank offered temporary relief to some mortgage clients. A portion of this portfolio continued to perform out of range with our model. For this reason, the Risk Committee decided that the model needed to be updated in order to capture this event. The following table sets forth the required loan loss allowance for residential mortgage loans in 2013.
Allowance Level(1) (Loss rate) | ||||
Loan type | Risk Profile | New client* | Old | Banefe |
| Residential mortgage | Profile 1 | 5.96% | 5.14% | 6.19% |
| Profile 2 | 1.81% | 1.54% | 2.74% | |
| Profile 3 | 0.49% | 0.64% | 0.77% | |
| Profile 4 | 0.17% | 0.28% | 0.26% | |
| Profile5 | 0.11% | 0.13% | 0.08% | |
| Profile6 | 0.03% | 0.03% | 0.07% | |
| Profile7 | 0.02% | |||
Small- and mid-sized commercial loans
To determine the estimated incurred loss for individuals (natural persons), small- and mid-sized commercial loans collectively evaluated for impairment, we mainly analyze the payment behavior of clients, particularly the payment behavior of clients with payments that are 90 days or more past-due, clients with other weaknesses, such as early non-performance (i.e.(i.e., payments that are past-due, though by less than 90 days), clients with modified loans and clients with renegotiated loans, as well as success in recovery against these clients. We also take into accountconsider whether the loans are supported byloan has underlying mortgage collateral.
The risk categories are such that when a customer has a past-due balance or has missed some payments, the outcome is that the customer will move to a different risk category with a higher loss rate, therefore capturing current trends of the customer and, in the aggregate, current trends in the market.
In order to calculate the estimated incurred loan loss for all commercial loans collectively evaluated for impairment, the Bank sub-divided the portfolio in the following way:
Allowance Level Small- and mid-sized commercial loans collectively evaluated for impairment Loan type | |||||
Non-renegotiated, w/o mortgage | Non-renegotiated, w/o mortgage | Non-renegotiated, with mortgage | |||
| Profile 1 | 37.20% | Profile 1 | 37.20% | Profile 1 | 10.60% |
| Profile 2 | 31.93% | Profile 2 | 18.11% | Profile 2 | 4.42% |
| Profile 3 | 13.25% | Profile 3 | 4.45% | Profile 3 | 0.68% |
| Profile 4 | 5.09% | Profile 4 | 2.06% | Profile 4 | 0.17% |
| Profile 5 | 1.50% | Profile 5 | 0.52% | Profile 5 | 0.11% |
| Profile 6 | 0.55% | Profile 6 | 0.02% | ||
| Profile 7 | 0.05% | ||||
Renegotiated, % | |||||
| Profile 1 | 29.20% | ||||
| Profile 2 | 19.42% | ||||
| Profile 3 | 10.28% | ||||
| Profile 4 | 3.75% | ||||
| Profile 5 | 1.13% | ||||
| Profile 6 | 0.13% | ||||
During the second half of 2014, and as a response to the ongoing improvement of the allowances models for loans, the Bank updated its allowances model for commercial loans. The model was calibrated with the aim of improving the prediction of client behavior and maintaining statistical and management standards. Part of these improvements consisted of implementing more robust statistical processes and more historical information, resulting in stronger parameters for the Probability of Non-Performance (PNP) and the Severity (SEV) involved in the provision calculation. These changes resulted in an increase in commercial provisions of Ch$45,141 million in 2014. Considering this impact and the reversal of Ch$26,563 million in the consumer loan provisioning model, the net increase of these improvements (Ch$18,578 million) was recognized under the “Provisions for loan losses” in the Consolidated Statement of Income for the year in accordance with IAS 8.
The following table sets forth the allowances required by our models for commercial loans assessed on a group basis since December 2014:
122
Allowance Level(1) (Loss rate) | |||||
Non-renegotiated client | |||||
Loan type | Risk Profile | Commercial loan to individuals w/o mortgage collateral | Commercial loan to individuals with mortgage collateral | Small Enterprise | Mid-sized Enterprise |
| Performing commercial loan | Profile 1 | 30.60% | 6.66% | 13.24% | 11.31% |
| Profile 2 | 26.81% | 2.73% | 5.34% | 6.24% | |
| Profile 3 | 20.37% | 0.95% | 2.87% | 3.23% | |
| Profile 4 | 10.80% | 0.45% | 1.67% | 2.43% | |
| Profile 5 | 5.69% | 0.23% | 0.90% | 1.28% | |
| Profile 6 | 4.48% | 0.11% | 0.44% | 0.66% | |
| Profile 7 | 1.96% | 0.03% | 0.19% | 0.32% | |
| Profile 8 | 1.15% | 6.66% | 0.11% | ||
Allowance Level(1) (Loss rate) | ||
Loan type | Risk Profile | Renegotiated client |
| Renegotiated client that was less than 90 days past due at the time of renegotiation | Profile 1 | 20.77% |
| Profile 2 | 17.99% | |
| Profile 3 | 14.51% | |
| Profile 4 | 11.30% | |
| Profile 5 | 7.95% | |
| Profile 6 | 6.40% | |
| Profile 7 | 4.66% |
Allowance level (loss rate) (1) | |||||
Loan type | Risk Profile | Commercial loan to individuals w/o mortgage collateral | Commercial loan to individuals with mortgage collateral | Small Enterprise | Mid-sized Enterprise |
| Renegotiated commercial loans which were more than 90 days past due at the time of renegotiation (2) | Profile 1 (90-179 days) | 52.61% | 15.58% | 27.89% | 21.90% |
| Profile 2 (180-359 days) | 52.61% | 23.46% | 42.33% | 37.15% | |
| Profile 3 (360-719 days) | 58.85% | 33.13% | 51.59% | 48.68% | |
| Profile 4 (>720 days) | 60.92% | 41.30% | 54.77% | 49.20% | |
Allowance level (loss rate) (1) | ||||||
Loan type | Days past-due | Commercial loan to individuals w/o mortgage collateral | Commercial loan to individuals with mortgage collateral | Small Enterprise | Mid-sized Enterprise | Renegotiated |
| Non-performing commercial loan | 90-179 | 52.61% | 15.58% | 27.89% | 21.90% | 24.92% |
| 180-359 | 52.61% | 23.46% | 42.33% | 37.15% | 40.47% | |
| 360-719 | 58.85% | 33.13% | 51.59% | 48.68% | 51.52% | |
| >720 | 60.92% | 41.30% | 54.77% | 49.20% | 57.18% | |
| (1) | Percentage of |
| (2) | This category relates only to loans which were renegotiated and were less than 90 days past due at the time of renegotiation, migrating from such category as they reached 90 days past due since renegotiation. |
123
Analysis of Santander-Chile’s Loan Classification
The following tables provide statistical data regarding the classification of our loans analyzed on an individual basis as of December 31, 2013, 20122015, 2014 and 2011.2013.
As of December 31, | ||||||||||||||||||||||||
| As of December 31, | 2015 | 2014 | 2013 | |||||||||||||||||||||
| Category | 2013 | 2012 | 2011 | Individual | Percentage | Allowance | Percentage | Individual | Percentage | Allowance | Percentage | Individual | Percentage | Allowance | Percentage | |||||||||
| Individualized business | Individual | Percentage | Allowance | Percentage | Individual | Percentage | Allowance | Percentage | Individual | Percentage | Allowance | Percentage | ||||||||||||
| Ch$mn | % | Ch$mn | % | Ch$mn | % | Ch$mn | % | Ch$mn | % | Ch$mn | % | |||||||||||||
| Ch$mn | % | Ch$mn | % | Ch$mn | % | Ch$mn | % | Ch$mn | % | Ch$mn | % | |||||||||||||
| Individu-alized business | ||||||||||||||||||||||||
| A1 | 2,395,371 | 11.4 | 1,589 | 0.3 | 2,114,853 | 11.2 | 1,306 | 0.2 | 1,510,801 | 8.7 | 397 | 0.1 | 2,073,792 | 8.20 | 1,210 | 0.17 | 1,911,035 | 8.35 | 998 | 0.15 | 2,395,371 | 11.4 | 1,589 | 0.3 |
| A2 | 4,846,240 | 23.0 | 20,416 | 3.3 | 4,119,414 | 21.7 | 14,853 | 2.7 | 3,927,846 | 22.5 | 6,113 | 1.3 | 5,898,065 | 23.32 | 17,353 | 2.28 | 5,564,372 | 24.30 | 16,334 | 2.39 | 4,846,240 | 23.0 | 20,416 | 3.3 |
| A3 | 1,281,756 | 6.1 | 27,982 | 4.6 | 1,037,593 | 5.5 | 26,279 | 4.8 | 818,039 | 4.7 | 6,763 | 1.4 | 1,599,234 | 6.32 | 25,145 | 3.30 | 1,334,042 | 5.83 | 19,630 | 2.87 | 1,281,756 | 6.1 | 27,982 | 4.6 |
| B | 374,051 | 1.8 | 30,536 | 5.0 | 287,897 | 1.5 | 23,095 | 4.2 | 269,260 | 1.5 | 8,146 | 1.7 | 504,937 | 1.99 | 37,157 | 4.87 | 398,611 | 1.74 | 29,189 | 4.27 | 374,051 | 1.8 | 30,536 | 5.0 |
| C1 | 56,040 | 0.3 | 1,121 | 0.2 | 45,104 | 0.2 | 902 | 0.2 | 28,888 | 0.2 | 578 | 0.1 | 81,767 | 0.32 | 1,635 | 0.21 | 79,148 | 0.35 | 1,583 | 0.23 | 56,040 | 0.3 | 1,121 | 0.2 |
| C2 | 46,996 | 0.2 | 4,700 | 0.8 | 30,796 | 0.2 | 3,080 | 0.6 | 26,896 | 0.2 | 2,690 | 0.6 | 48,569 | 0.19 | 4,857 | 0.64 | 66,267 | 0.29 | 6,627 | 0.97 | 46,996 | 0.2 | 4,700 | 0.8 |
| C3 | 20,780 | 0.1 | 5,195 | 0.8 | 34,685 | 0.2 | 8,672 | 1.6 | 47,494 | 0.3 | 11,873 | 2.4 | 37,663 | 0.15 | 9,416 | 1.24 | 16,742 | 0.07 | 4,185 | 0.61 | 20,780 | 0.1 | 5,195 | 0.8 |
| C4 | 43,109 | 0.2 | 17,243 | 2.8 | 28,246 | 0.1 | 11,298 | 2.1 | 40,879 | 0.2 | 16,352 | 3.3 | 69,952 | 0.28 | 27,981 | 3.67 | 33,074 | 0.14 | 13,229 | 1.93 | 43,109 | 0.2 | 17,243 | 2.8 |
| D1 | 61,246 | 0.3 | 39,811 | 6.5 | 36,545 | 0.2 | 23,754 | 4.3 | 36,163 | 0.2 | 23,506 | 4.8 | 76,157 | 0.30 | 49,503 | 6.49 | 59,585 | 0.26 | 38,730 | 5.66 | 61,246 | 0.3 | 39,811 | 6.5 |
| D2 | 64,755 | 0.3 | 58,279 | 9.5 | 46,246 | 0.2 | 41,622 | 7.6 | 40,600 | 0.2 | 36,280 | 7.4 | 92,682 | 0.36 | 83,414 | 10.94 | 94,832 | 0.41 | 85,348 | 12.47 | 64,755 | 0.3 | 58,279 | 9.5 |
| Total | 9,190,344 | 43.7 | 206,872 | 33.8 | 7,781,379 | 41.0 | 154,861 | 28.3 | 6,746,866 | 38.7 | 112,698 | 23.1 | 10,482,818 | 41.43 | 257,671 | 33.81 | 9,557,708 | 41.74 | 215,853 | 31.55 | 9,190,344 | 43.7 | 206,872 | 33.8 |
Classification of Loan Portfolio Based on the Borrower’s Payment Performance
Non-performing loans include the aggregate principal and accrued but unpaid interest of any loan with one installment that is at least 90 days overdue, and also loans that may not be overdue 90 days but future expected cash flows are not expected to be received,past-due, and do not accrue interest. Please see Note 10g of our Audited Consolidated Financial Statements.
Impaired loans as of December 31, 2009 and 2010 include: (A)(a) for loans whose allowance is determined on an individual basis,individually evaluated for impairment: (i) the carrying amount of all loans to a debtorclients that are rated C1 through C4, D1 and D2 and (ii) totalthe carrying amount of all loans to single debtorsan individual client with aat least one non-performing loan that(which is non-performing; and (B) for loans whose loan loss allowance is determined on a group basis, (i) total loans to a debtor, when a loan to that debtor is non-performing or has been renegotiated, excluding performing residential mortgage loans and (ii) if the loan that is non-performing or renegotiated isnot a residential mortgage loan past due less than 90 days), regardless of category; and (b) for loans collectively evaluated for impairment, the carrying amount of all loans to that debtor. As of December 31, 2011, 2012 and 2013, impaired loans include: (A) for loans whose allowance is determined on an individual basis, (i) all deteriorated debtors and (ii) total loans to single debtors with a loan that is non-performing; and (B) for loans whose loan loss allowance is determined on a group basis, (i) total loans to a debtor,client, when aat least one loan to that debtorclient is non-performingnot performing or has been renegotiated, excluding performing residential mortgage loans, and (ii) if the loan that is non-performing or renegotiated is a residential mortgage loan all loans to that debtor.renegotiated. See “Note 10—9—Loans and Accounts Receivables from Customers” of the Audited Consolidated Financial Statements. Renegotiated loans, on which payments are not past-due, are not ordinarily classified as non-performing loans, but do not accrue interest.
Charge-offs
As a general rule, charge-offs should be done when all collection efforts have been exhausted. These charge-offs consist of derecognition from the Consolidated Statements of Financial Position of the corresponding loans operations in its entirety, and, therefore, include portions not past-due of a loan in the case of installments loans or leasing operations (no partial charge-offs exists).
Subsequent payments obtained from charged-off loans will be recognized in the Consolidated Statement of Income as a recovery of loans previously charged-off.
Loan and accounts receivable charge-offs are recorded for overdue, past due, and current installments based on the time periods expired since reaching overdue status, as described below:
Type of | Term | |
| Consumer loans with or without collateral | 6 months | |
| Other transactions without collateral | 24 months | |
| Commercial loans with collateral | 36 months | |
| Mortgage loans | 48 months | |
| Consumer leasing | 6 months | |
| Other non-mortgage leasing transactions | 12 months | |
| Mortgage leasing (household and business) | 36 months |
Any payment agreement of an already charged-off loan will not give rise to income—asincome-as long as the operation is still in an impaired status—andstatus-and the effective payments received are accounted for as a recovery from loans previously charged-off.
In general, legal collection proceedings are commenced with respect to consumer loans once they are past-due for at least 90 days and, with respect to mortgage loans, once they are past-due for at least 120 days. Legal collection proceedings are always commenced within one year of such loans becoming past-due, unless we determine that the size of the past-due amount does not warrant such proceedings. In addition, the majority of our
124
commercial loans are short–term,short-term, with single payments at maturity. Past-due loans are required to be covered by individual loan loss reserves equivalent to 100.0% of any unsecured portion thereof.
The following table sets forth all of our past-due loans, non-performing loans and impaired loans as of December 31, 2015, 2014, 2013, 2012 2011, 2010 and 2009.2011.
2013 | 2012 | 2011 | 2010 | 2009 | |
| (in millions of Ch$, except percentages) | |||||
| Non-performing loans (1) | 613,301 | 597,767 | 511,357 | 416,739 | 409,067 |
| Impaired loans (2) | 1,477,701 | 1,338,137 | 1,323,355 | 1,480,476 | 1,485,737 |
| Allowance for loan losses (3) | 614,933 | 550,048 | 488,468 | 425,447 | 349,527 |
| Total loans (4) | 21,060,761 | 18,966,652 | 17,434,782 | 15,727,282 | 13,751,276 |
| Allowance for loan losses / loans | 2.92% | 2.90% | 2.80% | 2.71% | 2.54% |
| Non-performing loans as a percentage of total loans | 2.91% | 3.15% | 2.93% | 2.65% | 2.97% |
| Loan loss allowance as a percentage of non-performing loans | 100.27% | 92.02% | 95.52% | 102.09% | 85.44% |
| 2015 | 2014 | 2013 | 2012 | 2011 | ||||||||||||||||
| (in millions of Ch$, except percentages) | ||||||||||||||||||||
| Non-performing loans (1) | 643,468 | 644,327 | 613,301 | 597,767 | 511,357 | |||||||||||||||
| Impaired loans (2) | 1,669,340 | 1,617,251 | 1,477,701 | 1,338,137 | 1,323,355 | |||||||||||||||
| Allowance for loan losses (3) | 762,301 | 684,317 | 614,933 | 550,048 | 488,468 | |||||||||||||||
| Total loans (4) | 25,300,757 | 22,892,649 | 21,060,761 | 18,966,652 | 17,434,782 | |||||||||||||||
| Allowance for loan losses / loans | 3.01 | % | 2.99 | % | 2.92 | % | 2.90 | % | 2.80 | % | ||||||||||
| Non-performing loans as a percentage of total loans | 2.54 | % | 2.81 | % | 2.91 | % | 3.15 | % | 2.93 | % | ||||||||||
| Loan loss allowance as a percentage of non-performing loans | 118.00 | % | 106.21 | % | 100.27 | % | 92.02 | % | 95.52 | % | ||||||||||
| (1) | Non-performing loans include the aggregate principal and accrued but unpaid interest of any loan with one installment that is at least 90 days past-due, and do not accrue interest. |
| (2) | Impaired loans |
| (3) | Includes allowance for interbank loans. |
| (4) | Includes interbank loans. |
We suspend the accrual of interest and readjustments on all past-due loans. Interest revenue and expense are recorded on an accrual basis using the effective interest method. However, when a loan is past-due by 90 days or more, when an obligation originated from a refinancing or renegotiation or when the Bank believes that the debtor poses a high risk of default, the interest pertaining to these is not recorded directly in the Consolidated Statement of Income unless it has been actually received. See “Note 1—Summary of Significant Accounting Policies—Principles—(h) Valuation of financial assets and liabilities and recognition of fair value changes” and “Note 26—25—Interest Income and Expense”Income” of the Audited Consolidated Financial Statements. These interest and adjustments balances are generally referred to as “suspended” and are recorded in suspense accounts which are not part of the Consolidated Statements of Financial Position. Instead, they are reported as part of the complementary information thereto. See “Note 26—25—Interest Income and Expense”Income” of the Audited Consolidated Financial Statements. This interest is recognized as income, when collected, and as a reversal of the related impairment losses.
The Bank ceases accruing interest on the basis of contractual terms on the principal amount of any asset that is classified as an impaired asset. Thereafter, the Bank recognizes as interest income the accretion of the net present value of the written down amount of the loan due to the passage of time based on the original effective interest rate of the loan. On the other hand, any collected interest for any assets classified as impaired are accounted for on a cash basis.
At the period end, the detail of income from suspended interest is as follows:
Year ended December 31, | Year ended December 31, | ||||||||||||||||||||||||
2013 | 2012 | 2011 | 2010 | 2009 | 2015 | 2014 | 2013 | 2012 | 2011 | ||||||||||||||||
Suspended interest | Ch$ million | Ch$ million | |||||||||||||||||||||||
| Commercial loans | 21,645 | 20,595 | 17,554 | 26,020 | 25,157 | 23,310 | 24,753 | 21,645 | 20,595 | 17,554 | |||||||||||||||
| Mortgage loans | 8,484 | 8,844 | 9,343 | 7,457 | 8,296 | 13,268 | 12,454 | 8,484 | 8,844 | 9,343 | |||||||||||||||
| Consumer loans | 6,753 | 8,742 | 9,246 | 16,780 | 32,117 | 6,224 | 6,336 | 6,753 | 8,742 | 9,246 | |||||||||||||||
| Totals | 36,882 | 38,181 | 36,143 | 50,257 | 65,570 | 42,802 | 43,543 | 36,882 | 38,181 | 36,143 | |||||||||||||||
125
Analysis of Impaired and Non-Performing Loans
The following table analyzes our impaired loans. Impaired loans include: (i) all loans to a single client that are evaluated on a group basis, including performing loans, that have a loan classified as non-performing, (ii) all renegotiated consumer loans and (iii) all commercial loans at risk of default. See “Note 10—9—Loans and Accounts Receivables from Customers—(a) Loans and accounts receivable from customers” in the Audited Consolidated Financial Statements.
2013 | 2012 | 2011 | 2010 | 2009 | |
| (Ch$ million) | |||||
| Total loans | 21,060,761 | 18,966,652 | 17,434,782 | 15,727,282 | 13,751,276 |
| Allowance for loan losses | 614,933 | 550,048 | 488,468 | 425,447 | 349,527 |
| Impaired loans(1) | 1,477,701 | 1,338,137 | 1,323,355 | 1,480,476 | 1,485,737 |
| Impaired loans as a percentage of total loans | 7.02% | 7.06% | 7.59% | 9.41% | 10.80% |
| Amounts non-performing | 613,301 | 597,767 | 511,357 | 416,739 | 409,067 |
| To the extent secured(2) | 295,503 | 306,782 | 264,355 | 214,786 | 206,271 |
| To the extent unsecured | 317,798 | 290,985 | 247,002 | 201,953 | 202,796 |
| Amounts non-performing as a percentage of total loans | 2.91% | 3.15% | 2.93% | 2.65% | 2.97% |
| To the extent secured(2) | 1.40% | 1.62% | 1.52% | 1.37% | 1.50% |
| To the extent unsecured | 1.51% | 1.53% | 1.42% | 1.28% | 1.47% |
| Loans loss allowances as a percentage of: | |||||
| Total loans | 2.92% | 2.90% | 2.80% | 2.71% | 2.54% |
| Total amounts non-performing | 100.27% | 92.02% | 95.52% | 102.09% | 85.44% |
| Total amounts non-performing-unsecured | 193.50% | 189.03% | 197.76% | 210.67% | 172.35% |
| 2015 | 2014 | 2013 | 2012 | 2011 | ||||||||||||||||
| (Ch$ million) | ||||||||||||||||||||
| Total loans | 25,300,757 | 22,892,649 | 21,060,761 | 18,966,652 | 17,434,782 | |||||||||||||||
| Allowance for loan losses | 762,301 | 684,317 | 614,933 | 550,048 | 488,468 | |||||||||||||||
| Impaired loans(1) | 1,669,340 | 1,617,251 | 1,477,701 | 1,338,137 | 1,323,355 | |||||||||||||||
| Impaired loans as a percentage of total loans | 6.60 | % | 7.06 | % | 7.02 | % | 7.06 | % | 7.59 | % | ||||||||||
| Amounts non-performing | 643,468 | 644,327 | 613,301 | 597,767 | 511,357 | |||||||||||||||
| To the extent secured(2) | 283,731 | 296,899 | 295,503 | 306,782 | 264,355 | |||||||||||||||
| To the extent unsecured | 359,737 | 347,428 | 317,798 | 290,985 | 247,002 | |||||||||||||||
| Amounts non-performing as a percentage of total loans | 2.54 | % | 2.81 | % | 2.91 | % | 3.15 | % | 2.93 | % | ||||||||||
| To the extent secured(2) | 1.12 | % | 1.30 | % | 1.40 | % | 1.62 | % | 1.52 | % | ||||||||||
| To the extent unsecured | 1.42 | % | 1.52 | % | 1.51 | % | 1.53 | % | 1.42 | % | ||||||||||
| Loans loss allowances as a percentage of: | ||||||||||||||||||||
| Total loans | 3.01 | % | 2.99 | % | 2.92 | % | 2.90 | % | 2.80 | % | ||||||||||
| Total amounts non-performing | 118.5 | % | 106.21 | % | 100.27 | % | 92.02 | % | 95.52 | % | ||||||||||
| Total amounts non-performing-unsecured | 211.9 | % | 196.97 | % | 193.50 | % | 189.03 | % | 197.76 | % | ||||||||||
| (1) | Impaired loans |
| (2) | Security generally consists of mortgages on real estate, pledges of marketable securities, letters of credit or cash. |
A break-down of the loans included in the previous table which have been classified as impaired, including renegotiated loans, is as follows:
| As of December 31, 2015 | As of December 31, 2015 | |||||||||||||||||||
| Impaired loans | Commercial | Residential mortgage (in millions of Ch$) | Consumer | Total | Commercial | Residential mortgage | Consumer | Total | ||||||||||||
| As of December 31, 2013 | ||||||||||||||||||||
| (in millions of Ch$) | ||||||||||||||||||||
| Non-performing loans | 364,890 | 155,688 | 92,723 | 613,301 | 346,868 | 183,133 | 113,467 | 643,468 | ||||||||||||
| Commercial loans at risk of default (1) | 317,534 | - | 317,534 | 486,685 | - | - | 486,685 | |||||||||||||
| Other impaired loans consisting mainly of renegotiated loans (2) | 122,464 | 167,713 | 256,689 | 546,866 | 108,330 | 213,014 | 217,843 | 539,187 | ||||||||||||
| Total | 804,888 | 323,401 | 349,412 | 1,477,701 | 941,883 | 396,147 | 331,310 | 1,669,340 | ||||||||||||
| Impaired loans | Commercial | Residential mortgage | Consumer | Total | ||||||||||||||||
| As of December 31, 2012 | ||||||||||||||||||||
| Non-performing loans | 320,461 | 159,802 | 117,504 | 597,767 | ||||||||||||||||
| Commercial loans at risk of default (1) | 298,868 | – | 298,868 | |||||||||||||||||
| Other impaired loans consisting mainly of renegotiated loans (2) | 96,793 | 69,228 | 275,481 | 441,502 | ||||||||||||||||
| Total | 716,122 | 229,030 | 392,985 | 1,338,137 | ||||||||||||||||
| Impaired loans | Commercial | Residential mortgage | Consumer | Total | ||||||||||||||||
| As of December 31, 2011 | ||||||||||||||||||||
| Non-performing loans | 251,881 | 152,911 | 106,565 | 511,357 | ||||||||||||||||
| Commercial loans at risk of default (1) | 285,930 | – | 285,930 | |||||||||||||||||
| Other impaired loans consisting mainly of renegotiated loans (2) | 164,158 | 46,785 | 315,125 | 526,068 | ||||||||||||||||
| Total | 701,969 | 199,696 | 421,690 | 1,323,355 | ||||||||||||||||
| Impaired loans | Commercial | Residential mortgage | Consumer | Total | ||||||||||||||||
| As of December 31, 2010 | ||||||||||||||||||||
| Non-performing loans | 213,872 | 121,911 | 80,956 | 416,739 | ||||||||||||||||
| Commercial loans at risk of default (1) | 444,129 | – | 444,129 | |||||||||||||||||
| Other impaired loans consisting mainly of renegotiated loans (2) | 230,810 | 20,735 | 368,063 | 618,608 | ||||||||||||||||
| Total | 888,811 | 142,646 | 449,019 | 1,480,476 | ||||||||||||||||
| As of December 31, 2014 | ||||||||||||||||
| Impaired loans | Commercial | Residential mortgage | Consumer | Total | ||||||||||||
| (in millions of Ch$) | ||||||||||||||||
| Non-performing loans | 367,791 | 179,417 | 97,119 | 644,327 | ||||||||||||
| Commercial loans at risk of default (1) | 420,038 | – | – | 420,038 | ||||||||||||
| Other impaired loans consisting mainly of renegotiated loans (2) | 95,335 | 191,186 | 266,365 | 552,886 | ||||||||||||
| Total | 883,164 | 370,603 | 363,484 | 1,617,251 | ||||||||||||
126
| Impaired loans | Commercial | Residential mortgage | Consumer | Total |
| As of December 31, 2009 | ||||
| Non-performing loans | 195,163 | 130,119 | 83,785 | 409,067 |
| Commercial loans at risk of default (1) | 405,513 | – | – | 405,513 |
| Other impaired loans consisting mainly of renegotiated loans (2) | 273,662 | 2,029 | 395,466 | 671,157 |
| Total | 874,338 | 132,148 | 479,251 | 1,485,737 |
| As of December 31, 2013 | ||||||||||||||||
| Impaired loans | Commercial | Residential mortgage | Consumer | Total | ||||||||||||
| (in millions of Ch$) | ||||||||||||||||
| Non-performing loans | 364,890 | 155,688 | 92,723 | 613,301 | ||||||||||||
| Commercial loans at risk of default (1) | 317,534 | – | – | 317,534 | ||||||||||||
| Other impaired loans consisting mainly of renegotiated loans (2) | 122,464 | 167,713 | 256,689 | 546,866 | ||||||||||||
| Total | 804,888 | 323,401 | 349,412 | 1,477,701 | ||||||||||||
| As of December 31, 2012 | ||||||||||||||||
| Impaired loans | Commercial | Residential mortgage | Consumer | Total | ||||||||||||
| (in millions of Ch$) | ||||||||||||||||
| Non-performing loans | 320,461 | 159,802 | 117,504 | 597,767 | ||||||||||||
| Commercial loans at risk of default (1) | 298,868 | – | – | 298,868 | ||||||||||||
| Other impaired loans consisting mainly of renegotiated loans (2) | 96,793 | 69,228 | 275,481 | 441,502 | ||||||||||||
| Total | 716,122 | 229,030 | 392,985 | 1,338,137 | ||||||||||||
| As of December 31, 2011 | ||||||||||||||||
| Impaired loans | Commercial | Residential mortgage | Consumer | Total | ||||||||||||
| (in millions of Ch$) | ||||||||||||||||
| Non-performing loans | 251,881 | 152,911 | 106,565 | 511,357 | ||||||||||||
| Commercial loans at risk of default (1) | 285,930 | – | – | 285,930 | ||||||||||||
| Other impaired loans consisting mainly of renegotiated loans (2) | 164,158 | 46,785 | 315,125 | 526,068 | ||||||||||||
| Total | 701,969 | 199,696 | 421,690 | 1,323,355 | ||||||||||||
| (1) | Total loans to a debtor, whose allowance level is determined on an individual basis with a risk of defaulting. |
| (2) | Renegotiated loans for loans whose loan loss allowance is analyzed on a group basis. |
Renegotiated Loans
In certain instances, we renegotiate loans that have one or more principal or interest payments past-due. The type of concession we most often afford when renegotiating a loan is a reduction in interest payment or, on rare occasions, forgiveness of principal. We estimate that less than 0.5% of renegotiated loans relate to the forgiveness of principal, and the remaining 99.5% relates to reduction of interest payments. Any amount of principal forgiven is charged off directly to income as of the date the loan is renegotiated, if not already covered by an allowance for loan loss. Renegotiated loans, on which payments are not past-due, are not ordinarily classified as non-performing, but do not accrue interest, and they are considered to be impaired for the life of the loan, both for disclosure purposes and in our determination of our allowances for loan losses, and never moved out of renegotiated status. The effects of the amount of interest to be accrued were not material to “Loans and receivables from customers, net” on our Consolidated Statement of Financial Position.
127
The following table shows the success rate, for the periods indicated, for renegotiated consumer and residential mortgage loans. The success rate for consumer loans is defined for each reported period as: (i) the total amount of loans renegotiated in that period minus the amount of such renegotiated loans that are classified as non-performing loans as of December 31, 20122014 or 2013,2015, as applicable, minus the amount of such renegotiated loans that have been charged off as of December 31, 20122014 or 2013,2015, as applicable, divided by (ii) the total amount of such renegotiated loans. The success rate for residential mortgage loans is defined for each reported period as: (i) the total amount of loans renegotiated in that period minus the amount of such renegotiated loans that are classified as non-performing loans as of December 31, 20122014 or 2013,2015, as applicable, divided by (ii) the total amount of such renegotiated loans. A charge-off of a residential mortgage loan is not generally included in measuring the success rate of mortgage renegotiations since the period to charge-off a mortgage loan is 48 months after an installment is past-due.
Period of renegotiation | Success rate | Success rate |
| 1Q 2012 | 42.6% | 88.6% |
| 2Q 2012 | 48.4% | 87.7% |
| 3Q 2012 | 45.7% | 92.1% |
| 4Q 2012 | 54.7% | 91.5% |
| 1Q 2013 | 65.3% | 94.3% |
| 2Q 2013 | 81.5% | 94.8% |
| 3Q 2013 | 98.6% | 98.4% |
| 4Q 2013 | 100.0% | 100.0% |
Period of renegotiation | Success rate | Success rate |
| 1Q 2014 | 62.2% | 81.2% |
| 2Q 2014 | 63.9% | 84.5% |
| 3Q 2014 | 66.2% | 88.9% |
| 4Q 2014 | 70.7% | 87.0% |
| 1Q 2015 | 71.2% | 84.2% |
| 2Q 2015 | 77.0% | 86.9% |
| 3Q 2015 | 79.8% | 94.6% |
| 4Q 2015 | 96.3% | 93.9% |
From time to time, we modify loans that are not classified as non-performing if a client is confronting a financial difficulty, such as unemployment or another temporary situation. These loans are not classified as renegotiated for disclosure purposes, but are considered as renegotiated for our provisioning models. The following table provides information regarding loans collectively evaluated for impairment that are classified as “modified:”
Modified loans(1) (Ch$mn) | 2013 | 2012 | 2011 |
| Commercial loans collectively evaluated for impairment | 169,285 | 114,949 | 81,810 |
| Residential mortgage loans | 287,730 | 263,454 | 257,854 |
| Consumer loans | 251,795 | 324,666 | 380,036 |
| Total modified loans | 708,810 | 703,069 | 719,700 |
| Modified loans(1) (Ch$mn) | 2015 | 2014 | 2013 | |||||||||
| Commercial loans collectively evaluated for impairment | 156,055 | 169,725 | 169,285 | |||||||||
| Residential mortgage loans | 223,645 | 228,856 | 287,730 | |||||||||
| Consumer loans | 178,244 | 243,441 | 251,795 | |||||||||
| Total modified loans | 557,944 | 642,022 | 708,810 | |||||||||
| (1) | Modified loans include loans collectively evaluated for impairment that were not classified as non-performing in which certain concessions were made to the client. The main type of concession given by the Bank is a reduction of interest, with forgiveness of principal occurring on rare occasions. |
The modified loans included in the table above represent the full balance of all modified loans regardless of the date of modification. When a loan is marked as modified, we do not remove it from this status until paid in full. Our provisioning models currently consider a modified loan to be renegotiated for the life of the loan.
Modified loans are included in the same pool of loans together with renegotiated loans for the life of the loans.
Analysis of Loan Loss Allowances
The following table provides the details of the roll-forwards in 2015, 2014, 2013, 2012 2011, 2010 and 20092011 of our allowance for loan losses, including removaldecrease of allowances due to charge-offs, allowances established, allowances released, gross provision expense and opening and closing balance:
| Activity during 2013 | Commercial | Mortgage | Consumer | Interbank | Total | |
| loans | loans | loans | loan | |||
| Individual | Group | Group | Group | |||
| (in millions of Ch$) | ||||||
| Balance as of December 31, 2012 | 154,702 | 95,938 | 35,990 | 263,259 | 159 | 550,048 |
| Allowances established (1) | 92,008 | 36,724 | 21,314 | 155,921 | 455 | 306,422 |
| Allowances released (2) | (22,014) | (11,151) | (9,216) | (35,482) | (119) | (77,982) |
| Released allowances by charge-off (3) | (18,319) | (21,341) | (4,782) | (119,113) | - | (163,555) |
| Balances as of December 31, 2013 | 206,377 | 100,170 | 43,306 | 264,585 | 495 | 614,933 |
| Activity during 2012 | Commercial | Mortgage | Consumer | Interbank | Total | |
| loans | loans | loans | loan | |||
| Individual | Group | Group | Group | |||
| MCh$ | MCh$ | MCh$ | MCh$ | MCh$ | ||
| Balances as of December 31, 2011 | 112,687 | 97,115 | 35,633 | 243,022 | 11 | 488,468 |
| Allowances established (1) | 83,742 | 31,772 | 10,741 | 239,607 | 548 | 366,410 |
| Allowances released (2) | (20,716) | (16,624) | (7,449) | (38,471) | (400) | (83,660) |
| Charge-off released allowances (3) | (21,011) | (16,325) | (2,935) | (180,899) | - | (221,170) |
| Balances as of December 31, 2012 | 154,702 | 95,938 | 35,990 | 263,259 | 159 | 550,048 |
| Activity during 2011 | Commercial | Mortgage | Consumer | Interbank | Total | |
| loans | loans | loans | loan | |||
| Individual | Group | Group | Group | |||
| MCh$ | MCh$ | MCh$ | MCh$ | MCh$ | ||
| Balances as of December 31, 2010 | 96,560 | 85,942 | 17,332 | 225,559 | 54 | 425,447 |
| Allowances established (1) | 72,927 | 72,601 | 27,406 | 184,488 | 464 | 357,886 |
| Allowances released (2) | (41,741) | (26,582) | (7,645) | (25,185) | (507) | (101,660) |
| Charge-off released allowances (3) | (15,059) | (34,846) | (1,460) | (141,840) | - | (193,205) |
| Balances as of December 31, 2011 | 112,687 | 97,115 | 35,633 | 243,022 | 11 | 488,468 |
| Activity during 2010 | Commercial | Mortgage | Consumer | Interbank | Total | |
| loans | loans | loans | loan | |||
| Individual | Group | Group | Group | |||
| MCh$ | MCh$ | MCh$ | MCh$ | MCh$ | ||
| Balances as of December 31, 2009 | 78,297 | 88,142 | 16,534 | 166,512 | 42 | 349,527 |
| Allowances established (1) | 37,561 | 44,627 | 7,305 | 131,973 | 131 | 221,597 |
| Allowances released (2) | (10,828) | (8,683) | (952) | (7,135) | (119) | (27,717) |
| Charge-off released allowances (3) | (8,470) | (38,144) | (5,555) | (65,791) | - | (117,960) |
| Balances as of December 31, 2010 | 96,560 | 85,942 | 17,332 | 225,559 | 54 | 425,447 |
| Commercial loans | Mortgage loans | Consumer loans | Interbank loan | |||||||||||||||||||||
| Activity during 2015 | Individual MCh$ | Group MCh$ | Group MCh$ | Group MCh$ | Total | |||||||||||||||||||
| Balances as of December 31, 2014 | 215,852 | 165,697 | 48,744 | 254,023 | 1 | 684,317 | ||||||||||||||||||
| Allowances established (1) | 124,968 | 77,723 | 23,416 | 145,382 | 1,357 | 372,846 | ||||||||||||||||||
| Allowances released (2) | (46,614 | ) | (17,885 | ) | (7,205 | ) | (18,126 | ) | (192 | ) | (90,022 | ) | ||||||||||||
| Released allowances by charge-off (3) | (37,701 | ) | (50,839 | ) | (2,528 | ) | (113,772 | ) | - | (204,840 | ) | |||||||||||||
| Balances as of December 31, 2015 | 256,505 | 174,696 | 62,427 | 267,507 | 1,166 | 762,301 | ||||||||||||||||||
| Commercial loans | Mortgage loans | Consumer loans | Interbank loan | |||||||||||||||||||||
| Activity during 2014 | Individual | Group | Group | Group | Total | |||||||||||||||||||
| (in millions of Ch$) | ||||||||||||||||||||||||
| Balance as of December 31, 2013 | 206,377 | 100,170 | 43,306 | 264,585 | 495 | 614,933 | ||||||||||||||||||
| Allowances established (1) | 52,240 | 99,648 | 14,959 | 129,410 | 60 | 296,317 | ||||||||||||||||||
| Allowances released (2) | (15,903 | ) | (7,127 | ) | (6,561 | ) | (38,275 | ) | (554 | ) | (68,420 | ) | ||||||||||||
| Released allowances by charge-off (3) | (26,862 | ) | (26,994 | ) | (2,960 | ) | (101,697 | ) | — | (158,513 | ) | |||||||||||||
| Balances as of December 31, 2014 | 215,852 | 165,697 | 48,744 | 254,023 | 1 | 684,317 | ||||||||||||||||||
| Commercial loans | Mortgage loans | Consumer loans | Interbank loan | |||||||||||||||||||||
| Activity during 2013 | Individual | Group | Group | Group | Total | |||||||||||||||||||
| (in millions of Ch$) | ||||||||||||||||||||||||
| Balance as of December 31, 2012 | 154,702 | 95,938 | 35,990 | 263,259 | 159 | 550,048 | ||||||||||||||||||
| Allowances established (1) | 92,008 | 36,724 | 21,314 | 155,921 | 455 | 306,422 | ||||||||||||||||||
| Allowances released (2) | (22,014 | ) | (11,151 | ) | (9,216 | ) | (35,482 | ) | (119 | ) | (77,982 | ) | ||||||||||||
| Released allowances by charge-off (3) | (18,319 | ) | (21,341 | ) | (4,782 | ) | (119,113 | ) | — | (163,555 | ) | |||||||||||||
| Balances as of December 31, 2013 | 206,377 | 100,170 | 43,306 | 264,585 | 495 | 614,933 | ||||||||||||||||||
| Commercial loans | Mortgage loans | Consumer loans | Interbank loan | |||||||||||||||||||||
| Activity during 2012 | Individual MCh$ | Group MCh$ | Group MCh$ | Group MCh$ | Total | |||||||||||||||||||
| Balances as of December 31, 2011 | 112,687 | 97,115 | 35,633 | 243,022 | 11 | 488,468 | ||||||||||||||||||
| Allowances established (1) | 83,742 | 31,772 | 10,741 | 239,607 | 548 | 366,410 | ||||||||||||||||||
| Allowances released (2) | (20,716 | ) | (16,624 | ) | (7,449 | ) | (38,471 | ) | (400 | ) | (83,660 | ) | ||||||||||||
| Charge-off released allowances (3) | (21,011 | ) | (16,325 | ) | (2,935 | ) | (180,899 | ) | — | (221,170 | ) | |||||||||||||
| Balances as of December 31, 2012 | 154,702 | 95,938 | 35,990 | 263,259 | 159 | 550,048 | ||||||||||||||||||
| Commercial loans | Mortgage loans | Consumer loans | Interbank loan | |||||||||||||||||||||
| Activity during 2011 | Individual MCh$ | Group MCh$ | Group MCh$ | Group MCh$ | Total | |||||||||||||||||||
| Balances as of December 31, 2010 | 96,560 | 85,942 | 17,332 | 225,559 | 54 | 425,447 | ||||||||||||||||||
| Allowances established (1) | 72,927 | 72,601 | 27,406 | 184,488 | 464 | 357,886 | ||||||||||||||||||
| Allowances released (2) | (41,741 | ) | (26,582 | ) | (7,645 | ) | (25,185 | ) | (507 | ) | (101,660 | ) | ||||||||||||
| Charge-off released allowances (3) | (15,059 | ) | (34,846 | ) | (1,460 | ) | (141,840 | ) | — | (193,205 | ) | |||||||||||||
| Balances as of December 31, 2011 | 112,687 | 97,115 | 35,633 | 243,022 | 11 | 488,468 | ||||||||||||||||||
| (1) | Represents gross |
| (2) | Represents the gross amount of loan loss allowances released during the year as a consequence of reduction in the level of risk existing in the loan portfolio, including as a result of improvement in the credit risk classification of borrowers and loans paid. |
| (3) | Represents the gross amount of loan loss allowances removed due to charge-off. |
129
The following table shows recoveries by type of loan:
Recovery of loans previously charged-off | Year ended December 31, | ||||
2013 | 2012 | 2011 | 2010 | 2009 | |
| (in millions of Ch$) | |||||
| Consumer loans | 36,004 | 22,015 | 12,474 | 22,096 | 28,268 |
| Residential mortgage loans | 4,735 | 2,305 | 16,135 | 1,389 | 2,560 |
| Commercial loans | 14,545 | 8,695 | 7,216 | 6,994 | 8,446 |
| Total recoveries | 55,284 | 33,015 | 35,825 | 30,479 | 39,274 |
| Year ended December 31, | ||||||||||||||||||||
| 2015 | 2014 | 2013 | 2012 | 2011 | ||||||||||||||||
| (in millions of Ch$) | ||||||||||||||||||||
| Recovery of loans previously charged-off | ||||||||||||||||||||
| Consumer loans | 35,565 | 36,908 | 36,004 | 22,015 | 12,474 | |||||||||||||||
| Residential mortgage loans | 6,543 | 5,122 | 4,735 | 2,305 | 16,135 | |||||||||||||||
| Commercial loans | 26,032 | 16,947 | 14,545 | 8,695 | 7,216 | |||||||||||||||
| Total recoveries | 68,140 | 58,977 | 55,284 | 33,015 | 35,825 | |||||||||||||||
Allocation of the Loan Loss Allowances
The following tables set forth, as of December 31 of each of the five years listed below, the proportions of our required minimum loan loss allowances that were attributable to our commercial, consumer and residential mortgage loans at each such date.
130
As of December 31, 2015 | As of December 31, 2014 | As of December 31, 2013 | ||||||||||
Total Allowance | Allowance amount as a percentage of loans in category | Allowance amount as a percentage of total loans | Allowance amount as a percentage of total allocated allowances | Total Allowance | Allowance amount as a percentage of loans in category | Allowance amount as a percentage of total loans | Allowance amount as a percentage of total allocated allowances | Total Allowance | Allowance amount as a percentage of loans in category | Allowance amount as a percentage of total loans | Allowance amount as a percentage of total allocated allowances | |
| Ch$ million | Ch$ million | Ch$ million | ||||||||||
| Commercial loans | ||||||||||||
| Commercial loans | 305,465 | 3.4% | 1.2% | 40.1% | 269,185 | 3.2% | 1.2% | 39.3% | 208,619 | 2.7% | 1.0% | 33.9% |
| Foreign trade loans | 67,104 | 3.1% | 0.3% | 8.8% | 56,800 | 3.2% | 0.2% | 8.3% | 53,005 | 2.9% | 0.3% | 8.6% |
| Checking accounts debtors | 9,869 | 4.2% | – | 1.3% | 10,009 | 3.8% | – | 1.4% | 8,376 | 3.0% | – | 1.3% |
| Factoring transactions | 5,955 | 2.2% | – | 0.8% | 4,868 | 1.5% | – | 0.7% | 5,054 | 1.6% | – | 0.8% |
| Leasing transactions | 25,437 | 1.7% | 0.1% | 3.3% | 23,734 | 1.6% | 0.1% | 3.5% | 19,177 | 1.4% | 0.1% | 3.1% |
| Other loans and accounts receivable | 17,371 | 12.1% | 0.1% | 2.3% | 16,953 | 12.5% | 0.1% | 2.5% | 12,316 | 10.4% | 0.1% | 2.0% |
| Subtotals | 431,201 | 3.2% | 1.7% | 56.6% | 381,549 | 3.1% | 1.6% | 55.7% | 306,547 | 2.6% | 1.5% | 49.7% |
| Residential mortgage loans | ||||||||||||
| Loans with mortgage finance bonds | 336 | 0.8% | – | – | 353 | 0.6% | – | 0.1% | 470 | 0.7% | – | 0.1% |
| Mortgage mutual loans | 848 | 0.6% | – | 0.1% | 552 | 0.5% | – | 0.1% | 380 | 0.5% | – | 0.1% |
| Other mortgage mutual loans | 61,243 | 0.8% | 0.2% | 8.0% | 47,839 | 0.7% | 0.2% | 7.0% | 42,456 | 0.8% | 0.2% | 6.9% |
| Subtotals | 62,427 | 0.8% | 0.2% | 8.1% | 48,744 | 0.7% | 0.2% | 7.2% | 43,306 | 0.8% | 0.2% | 7.1% |
| Consumer loans | ||||||||||||
| Installment consumer loans | 215,914 | 8.7% | 0.9% | 28.3% | 201,931 | 8.7% | 0.9% | 29.5% | 221,723 | 10.2% | 1.1% | 36.1% |
| Credit card balances | 43,159 | 3.0% | 0.2% | 5.7% | 44,050 | 3.2% | 0.2% | 6.4% | 37,300 | 3.0% | 0.2% | 6.1% |
| Consumer leasing contracts | 79 | 1.4% | – | – | 80 | 1.5% | – | – | 68 | 2.0% | – | – |
| Other consumer loans | 8,355 | 3.5% | – | 1.1% | 7,962 | 3.5% | – | 1.2% | 5,494 | 2.7% | – | 0.9% |
| Subtotals | 267,507 | 6.4% | 1.1% | 35.1% | 254,023 | 6.5% | 1.1% | 37.1% | 264,585 | 7.3% | 1.3% | 43.1% |
| Totals loans to clients | 761,135 | 3.0% | 3.0% | 99.8% | 648,316 | 3.11% | 2.9% | 100.0% | 614,438 | 2.9% | 3.0% | 99.9% |
| Interbank loans | 1,166 | 10.7% | – | 0.2% | 1 | – | – | – | 495 | 0.4% | – | 0.1% |
| Totals | 762,301 | 3.0% | 3.0% | 100.0% | 648,317 | 3.0% | 2.9% | 100.0% | 614,933 | 2.9% | 3.0% | 100.0% |
131
| As of December 31, 2013 | As of December 31, 2012 | As of December 31, 2011 | ||||||||||
| Total Allowance | Allowance amount as a percentage of loans in category | Allowance amount as a percentage of total loans | Allowance amount as a percentage of total allocated allowances | Total Allowance | Allowance amount as a percentage of loans in category | Allowance amount as a percentage of total loans | Allowance amount as a percentage of total allocated allowances | Total Allowance | Allowance amount as a percentage of loans in category | Allowance amount as a percentage of total loans | Allowance amount as a percentage of total allocated allowances | |
| Ch$ million | Ch$ million | Ch$ million | ||||||||||
| Commercial loans | ||||||||||||
| Commercial loans | 208,619 | 2.7% | 1.0% | 33.9% | 199,841 | 2.7% | 1.1% | 36.3% | 161,289 | 2.4% | 0.9% | 33.0% |
| Foreign trade loans | 53,005 | 2.9% | 0.3% | 8.6% | 18,535 | 1.5% | 0.1% | 3.4% | 19,764 | 1.9% | 0.1% | 4.1% |
| Checking accounts debtors | 8,376 | 3.0% | 0.0% | 1.3% | 3,033 | 1.5% | 0.0% | 0.6% | 3,384 | 2.6% | 0.0% | 0.7% |
| Factoring transactions | 5,054 | 1.6% | 0.0% | 0.8% | 3,683 | 1.1% | 0.0% | 0.7% | 1,861 | 1.0% | 0.0% | 0.4% |
| Leasing transactions | 19,177 | 1.4% | 0.1% | 3.1% | 23,426 | 1.8% | 0.1% | 4.3% | 19,266 | 1.6% | 0.1% | 3.9% |
| Other loans and accounts receivable | 12,316 | 10.4% | 0.1% | 2.0% | 2,122 | 2.2% | 0.0% | 0.4% | 4,238 | 5.0% | 0.0% | 0.9% |
| Subtotals | 306,547 | 2.6% | 1.5% | 49.7% | 250,640 | 2.4% | 1.3% | 45.7% | 209,802 | 2.3% | 1.2% | 4.3% |
| Residential mortgage loans | ||||||||||||
| Loans with mortgage finance bonds | 470 | 0.7% | 0.0% | 0.1% | 493 | 0.5% | 0.0% | 0.1% | 707 | 0.6% | 0.0% | 0.1% |
| Mortgage mutual loans | 380 | 0.5% | 0.0% | 0.1% | 936 | 2.0% | 0.0% | 0.2% | 1,241 | 1.7% | 0.0% | 0.2% |
| Other mortgage mutual loans | 42,456 | 0.8% | 0.2% | 6.9% | 34,561 | 0.7% | 0.2% | 6.3% | 33,685 | 0.7% | 0.2% | 6.9% |
| Subtotals | 43,306 | 0.8% | 0.2% | 7.1% | 35,990 | 0.7% | 0.2% | 6.6% | 35,633 | 0.7% | 0.2% | 7.2% |
| Consumer loans | ||||||||||||
| Installment consumer loans | 221,723 | 10.2% | 1.1% | 36.1% | 218,474 | 11.8% | 1.2% | 39.7% | 193,874 | 10.7% | 1.1% | 39.7% |
| Credit card balances | 37,300 | 3.0% | 0.2% | 6.1% | 38,719 | 3.7% | 0.2% | 7.0% | 43,922 | 4.8% | 0.3% | 9.0% |
| Consumer leasing contracts | 68 | 2.0% | 0.0% | 0.0% | 160 | 4.3% | 0.0% | 0.0% | 109 | 2.9% | 0.0% | 0.0% |
| Other consumer loans | 5,494 | 2.7% | 0.0% | 0.9% | 5,906 | 3.0% | 0.0% | 1.0% | 5,117 | 2.4% | 0.0% | 1.1% |
| Subtotals | 264,585 | 7.3% | 1.3% | 43.1% | 263,259 | 8.5% | 1.4% | 47.7% | 243,022 | 8.3% | 1.4% | 49.8% |
| Totals loans to clients | 614,438 | 2.9% | 3.0% | 99.9% | 549,889 | 2.9% | 2.9% | 100.0% | 488,457 | 2.8% | 2.8% | 100.0% |
| Interbank loans | 495 | 0.4% | 0.0% | 0.1% | 159 | 0.2% | 0.0% | 0.0% | 11 | 0.0% | 0.0% | 0.0% |
| Totals | 614,933 | 2.9% | 3.0% | 100.0% | 550,048 | 2.9% | 2.9% | 100.0% | 488,468 | 2.8% | 2.8% | 100.0% |
| As of December 31, 2010 | As of December 31, 2009 | As of December 31, 2012
| As of December 31, 2011
| |||||||||||||||||||||||||||||||||||||
| Total Allowance | Allowance amount as a percentage of loans in category | Allowance amount as a percentage of total loans | Allowance amount as a percentage of total allocated allowances | Total Allowance | Allowance amount as a percentage of loans in category | Allowance amount as a percentage of total loans | Allowance amount as a percentage of total allocated allowances | Total | Allowance amount | Allowance amount | Allowance amount | Total | Allowance amount | Allowance amount | Allowance amount | |||||||||||||||||||||||||
| Ch$ million | Ch$ million | Ch$ million | ||||||||||||||||||||||||||||||||||||||
| Commercial loans | ||||||||||||||||||||||||||||||||||||||||
| Commercial loans | 132,775 | 2.2% | 0.8% | 31.2% | 124,275 | 2.3% | 0.9% | 35.6% | 199,841 | 2.7 | % | 1.1 | % | 36.3 | % | 161,289 | 2.4 | % | 0.9 | % | 33.0 | % | ||||||||||||||||||
| Foreign trade loans | 18,888 | 2.4% | 0.1% | 4.4% | 23,027 | 3.6% | 0.2% | 6.6% | 18,535 | 1.5 | % | 0.1 | % | 3.4 | % | 19,764 | 1.9 | % | 0.1 | % | 4.1 | % | ||||||||||||||||||
| Draft loans | 4,350 | 6.4% | 0.0% | 1.0% | 3,570 | 3.8% | 0.0% | 1.0% | 3,033 | 1.5 | % | – | 0.6 | % | 3,384 | 2.6 | % | 0.0 | % | 0.7 | % | |||||||||||||||||||
| Factoring transactions | 2,083 | 1.0% | 0.0% | 0.5% | 2,386 | 1.8% | 0.0% | 0.7% | 3,683 | 1.1 | % | – | 0.7 | % | 1,861 | 1.0 | % | 0.0 | % | 0.4 | % | |||||||||||||||||||
| Leasing transactions | 14,742 | 1.3% | 0.1% | 3.5% | 7,839 | 0.8% | 0.1% | 2.2% | 23,426 | 1.8 | % | 0.1 | % | 4.3 | % | 19,266 | 1.6 | % | 0.1 | % | 3.9 | % | ||||||||||||||||||
| Other loans and accounts receivable | 9,664 | 53.8% | 0.1% | 2.3% | 5,342 | 48.7% | 0.0% | 1.5% | 2,122 | 2.2 | % | – | 0.4 | % | 4,238 | 5.0 | % | 0.0 | % | 0.9 | % | |||||||||||||||||||
| Subtotals | 182,502 | 2.2% | 1.2% | 42.9% | 166,439 | 2.3% | 1.2% | 47.6% | 250,640 | 2.4 | % | 1.3 | % | 45.7 | % | 209,802 | 2.3 | % | 1.2 | % | 4.3 | % | ||||||||||||||||||
| Residential mortgage loans | ||||||||||||||||||||||||||||||||||||||||
| Loans with letters of credit | 446 | 0.3% | 0.0% | 0.1% | 576 | 0.3% | 0.0% | 0.2% | 493 | 0.5 | % | – | 0.1 | % | 707 | 0.6 | % | – | 0.1 | % | ||||||||||||||||||||
| Mortgage mutual loans | 11,319 | 6.1% | 0.1% | 2.7% | 9,040 | 4.5% | 0.1% | 2.6% | 936 | 2.0 | % | – | 0.2 | % | 1,241 | 1.7 | % | – | 0.2 | % | ||||||||||||||||||||
| Other mortgage mutual loans | 5,567 | 0.1% | 0.0% | 1.3% | 6,918 | 0.2% | 0.1% | 2.0% | 34,561 | 0.7 | % | 0.2 | % | 6.3 | % | 33,685 | 0.7 | % | 0.2 | % | 6.9 | % | ||||||||||||||||||
| Subtotals | 17,332 | 0.4% | 0.1% | 4.1% | 16,534 | 0.4% | 0.1% | 4.8% | 35,990 | 0.7 | % | 0.2 | % | 6.6 | % | 35,633 | 0.7 | % | 0.2 | % | 7.2 | % | ||||||||||||||||||
| Consumer loans | ||||||||||||||||||||||||||||||||||||||||
| Installment consumer loans | 176,219 | 11.0% | 1.1% | 41.4% | 130,532 | 9.5% | 0.9% | 37.3% | 218,474 | 11.8 | % | 1.2 | % | 39.7 | % | 193,874 | 10.7 | % | 1.1 | % | 39.7 | % | ||||||||||||||||||
| Credit card balances | 36,156 | 4.6% | 0.2% | 8.5% | 24,433 | 4.2% | 0.2% | 7.0% | 38,719 | 3.7 | % | 0.2 | % | 7.0 | % | 43,922 | 4.8 | % | 0.3 | % | 9.0 | % | ||||||||||||||||||
| Consumer leasing contracts | 121 | 3.2% | 0.0% | 0.0% | 9 | 0.2% | 0.0% | 0.0% | 160 | 4.3 | % | – | – | 109 | 2.9 | % | – | – | ||||||||||||||||||||||
| Other consumer loans | 13,063 | 4.4% | 0.1% | 3.1% | 11,538 | 4.2% | 0.1% | 3.3% | 5,906 | 3.0 | % | – | 1.0 | % | 5,117 | 2.4 | % | – | 1.1 | % | ||||||||||||||||||||
| Subtotals | 225,559 | 8.4% | 1.4% | 53.0% | 166,512 | 7.4% | 1.2% | 47.6% | 263,259 | 8.5 | % | 1.4 | % | 47.7 | % | 243,022 | 8.3 | % | 1.4 | % | 49.8 | % | ||||||||||||||||||
| Totals loans to clients | 425,393 | 2.7% | 100.0% | 349,485 | 2.5% | 100.0% | 549,889 | 2.9 | % | 2.9 | % | 100.0 | % | 488,457 | 2.8 | % | 2.8 | % | 100.0 | % | ||||||||||||||||||||
| Interbank | 54 | 0.1% | 0.0% | 0.0% | 42 | 0.2% | 0.0% | 0.0% | 159 | 0.2 | % | – | – | 11 | – | – | – | |||||||||||||||||||||||
| Totals | 425,447 | 2.7% | 100.0% | 349,527 | 2.5% | 100.0% | 550,048 | 2.9 | % | 2.9 | % | 100.0 | % | 488,468 | 2.8 | % | 2.8 | % | 100.0 | % | ||||||||||||||||||||
Based on information available regarding our borrowers, we believe that our loan loss allowances are sufficient to cover known potential losses and losses inherent in a loan portfolio of the size and nature of our loan portfolio.
132
ITEM 6. DIRECTORS, SENIOR MANAGEMENT AND EMPLOYEES
A. Directors and Senior Management
| A. | Directors and Senior Management |
Directors
We are managed by our Board of Directors, which, in accordance with our by-laws, consists of 11 directors and two alternates who are elected at our ordinary shareholders’ meetings. Except as noted below, the current members of the Board of Directors were elected by the shareholders in the ordinary shareholders’ meeting held on April 22, 2014.26, 2016. Members of the Board of Directors are elected for three-year terms. Except as noted below, the term of each of the current board members expires in April of 2017. Cumulative voting is permitted for the election of directors. The Board of Directors may appoint replacements to fill any vacancies that occur during periods between elections. If any member of the Board of Directors resigns before his or her term has ended, and no other alternate director is available to take the position at the next annual ordinary shareholders’ meeting a new replacing member will be elected. Our executive officers are appointed by the Board of Directors and hold office at its discretion. Scheduled meetings of the Board of Directors are held monthly. Extraordinary meetings can be held when called in one of three ways: by the Chairman of the Board of Directors, by three directors with the consent of the Chairman of the Board of Directors or by the majority of directors. None of the members of our Board of Directors has a service contract which entitles any Director to any benefits upon termination of employment with Santander-Chile.
Our current directors are as follows:
| Directors | Position | Committees | Term Expires |
| Vittorio Corbo Lioi | Chairman and Director | Asset and Liability Committee
| April 2017 |
| Human Resources Committee | |||
| Market Committee | |||
| Strategy Committee | |||
| Oscar von Chrismar Carvajal | Asset and Liability Committee
| April 2017 | |
| Human Resources Committee | |||
| Market Committee
| |||
| Risk Committee | |||
| Strategy Committee | |||
| Roberto Méndez Torres |
Risk Committee
| April 2017 | |
| Strategy Committee | |||
| Juan Pedro Santa | Director | Analysis and Resolution Committee
| April 2017 |
| Marco Colodro Hadjes | Director | Asset and Liability Committee
| April 2017 |
| Mauricio Larraín Garcés | Director | Asset and Liability
| |
| April 2017 | |||
| |||
| |||
| Roberto Zahler Mayanz | Director | Asset and Liability Committee Risk Committee Market Committee | April 2017 |
| Lucía Santa Cruz Sutil | Director | Strategy Committee | April 2017 |
| Orlando Poblete Iturrate | Director | Audit Committee | April 2017 |
| Andreu Plaza | Director | — | April 2017 |
| Ana Dorrego | Director | — | April 2017 |
| Blanca Bustamante Bravo | Alternate Director | Human Resources Committee | April 2017 |
| Raimundo Monge Zegers | Alternate Director | Asset and Liability Committee
| April 2017 |
133
Vittorio Corbo Lioi ishas been our Chairman as of the Board since April 2014. He is one of Chile’sChile's leading economists. InFrom 2003 to 2007, Mr. Corbo was namedthe President of Chile’sChile's Central Bank. FollowingSince the end of his tenure there, Mr. Corbo has been named to various boards and is currently a Senior InvestigatorResearch Associate at the Centro de EstudioEstudios Públicos (CEP), a local think tank. Mr. Corbo is a Directoralso member of Santander Spain andthe boards of Banco Santander Mexico.Mexico, CCU Chile and SURA-Chile Insurance Company, and an economic consultant to several large corporations in Chile and abroad. He served in senior managerial positions at the World Bank in Washington, DC (1984-1991) and has been a professor of economics in Canada, the USA and Chile. Between 1991 and 1995, Mr. Corbo was an economic advisor to the Bank, and a member of theits Board of Santander-ChileDirectors between 1995 and 2003. Between 2011 and 2014, he was a board member of Banco Santander SA in Spain. Mr. Corbo is a memberthe President of the Asset and Liability Committee, the Market Committee, the Strategy Committee and the RiskHuman Resource Committee. Mr. Corbo hasholds a Business Administration Degreecommercial engineering degree (with highest distinction) from the Universidad de Chile and a Ph.D. in Economicseconomics from MIT.
Oscar von Chrismar Carvajal became Executive Vice-Chairman of the Board on January 1, 2010 after having served as the chief executive officer of Santander-Chile since August 2003. Mr. Von Chrismar is a member of the Asset and Liability Committee, Clients and Service Qualitythe Risk Committee, Executive Credit Committee,the Human Resources Committee, the Market Committee Marketing Committee, Risk Committee, and the Strategy Committee. Prior to assuming the chief executive officer post, he was the Manager of Global Banking. Prior to the merger, he was the former chief executive officer of Old Santander-Chile since September 1997, after being General Manager of Banco Santander-Peru since September 1995. Mr. von Chrismar is also a board member of Banco Santander Argentina and Banco Santander Peru. He is also the Alternate Director of Universia Chile S.A. Prior to that, Mr. von Chrismar was the manager of the Finance Division of Santander-Chile, a position that he had held since joining Santander-Chile in 1990. Mr. von Chrismar holds an Engineering degree from the Universidad de Santiago de Chile.
Roberto Méndez Torres is our Second Vice Chairman.Co-Vice Chairman of the Board. He is a former member of the Board of Old Santander-Chile, to which he was appointed in 1996. He is a member of the Clients and Service Quality Committee, the Executive Credit Committee, the Marketing Committee, the Risk Committee, the Strategyrisk Committee and the UniversityStrategy Committee. He is a professor of Economics at Universidad Católica de Chile. He has been Advisor to Grupo Santander-Chile since 1989. Mr. Méndez is President and Director of Adimark Chile Gfk and on the Board of the Chilean and German Chamber of Commerce. He is also a Director of Enex S.A. and Vice-Chairman of Universia S.A. Mr. Méndez is also a member of the Council of Paz Ciudadana and was a former President of ICARE. He graduated with a degree in Business Administration from Universidad Católica de Chile, and holds an MBA and a Ph.D. from the Graduate School of Business at Stanford University.
Juan Pedro Santa María Pérezbecame a Director on July 24, 2012 after having served as Corporate Legal Director for Grupo Santander Chile and Legal Counsel for Santander-Chile. Mr. Santa María is on the Analysis and Resolution Committee and the Risk Committee. He is also a Director at Santander Asset Management S.A. Mr. Santa María joined Santander-Chile in 2002, after the merger with Banco Santiago. Previous to that he was Legal Counsel for Banco Santiago and Banco O’Higgins. He has also been President of the Legal
Committee of the Asociación de Bancos e Instituciones Financieras de Chile for over 20 years and President Pro-Tempore of the Financial Law Committee of the Federación LationamericanaLatinoamericana de Bancos (FELABAN). Mr. Santa María holds a degree in Law from the Pontificia Universidad Católica de Chile.
Víctor Arbulú Crousillatbecame a Director on May 6, 1999. He is a member of the Audit Committee and has been designated as a Financial Expert. He was a Managing Director of JPMorgan, member of its European management committee and Chief Executive Officer for Spain and Portugal from 1988 until 1998. He has worked for JPMorgan for over 25 years in various positions in Europe, North America and Latin America. Mr. Arbulú also worked for the Inter-American Development Bank. Mr. Arbulú holds a degree in Engineering and a Masters in Business Administration.
Marco Colodro Hadjes became a Director on April 19, 2005. Mr. Colodro is a member of the Asset and Liability Committee, Executive Credit Committee, Marketthe Audit Committee and the RiskMarket Committee. Mr. Colodro was PresidentHe is a director of the Board of Telefónica Chile and a Directorformer director of Codelco. He is athe former chairman of TVN (national television network)(National Television Network) and the former vice chairman of Banco del Estado (state bank). He was also ownerde Chile (State Bank of Agencia de Valores Alfa S.A.Chile). Prior to that, he was Foreign Trade Director at the Central Bank of Chile. Mr. Colodro holds a degree in Economics from the Universidad de Chile, and has done post-graduate studies at the École Pratique des Hautes Etudes of the University of Paris.
Mauricio Larraín Garcésbecame a Board memberDirector in April 2014. Previously, he was our Chairman. He is a member of the Asset and Liability Committee, the Executive Credit Committee, the Human Resources Committee, the Marketing Committee, the Strategy Committee, and the University Committee. He is also President of Santander Chile Holding S.A. and Universia Chile S.A. He is also a Director of the Asociación de Bancos e Instituciones Financieras de Chile and Inversiones Volcán Choshuenco S.A. He is also a member of the Council of Paz Ciudadana and was a former President of ICARE. He is General Director of ESE Business School from Universidad de Los Andes. Mr. Larraín began working at Santander-Chile in 1989. Previously, he was Intendente (Director) of the SBIF, Manager of External Debt at Banco Central de Chile and a Senior Finance Specialist at the World Bank in Washington. He holds degrees in Law from Universidad Católica de Chile and from Harvard University.
Carlos Olivos Marchant is Director since 2007 and has been a Board member since the merger with Banco Santiago was consummated in 2002. He is Chairman of the Audit Committee. He was a member of the Board of Banco Santiago since 1987 until the date of the merger, and was Chairman of that board between May 1999 until the merger. He is a partner in the law firm Guerrero, Olivos, Novoa y Errazuriz. Mr. Olivos holds a law degree from the Universidad de Chile and a Masters of Jurisprudence from New York University School of Law.
Lucía Santa Cruz Sutil became a Director on August 19, 2003. Ms. Santa Cruz was a member of our Audit Committee until May 2010. She is a member of the Marketing Committee and the University Committee. Ms. Santa Cruz holds a degree in History and a Masters Degree in Philosophy from Oxford University. She is the Dean of the College of Liberal Arts of the Universidad Adolfo Ibañez. Ms. Santa Cruz is also a Director of Universia Chile S.A. She is also on the Board of Compañía de Seguros Generales y de Vida La Chilena Consolidada, on the Advisory Board of Nestle Chile and the Fundación Educacional Santa Teresa de Avila. She is also a member of the Self-Regulation Committee for Insurance Companies in Chile.
Lisandro Serrano Spoerer was elected to the Board in January 2011. He is a member of the Analysis and Resolution Committee and the Audit Committee. He is currently Dean of the Universidad Gabriel Mistral and Professor of Law and Tax at the Law School. He is also a member of the Regulation Committee of the Santiago Stock Exchange and the Self-Regulation Committee of the Chilean Electronic Stock Exchange. Previously, he worked at PricewaterhouseCoopers from 1977 to 2003 where he was a partner in the tax division and later a Principal partner. He was also member of the board of the Hong Kong & Shanghai Bank branch in Chile. Mr. Serrano holds a degree in law and an MBA from the Ponitificia Universidad Católica de Chile.
Roberto Zahler Mayanz became a Director on August 31, 1999.several years. He is a member of the Asset and Liability Committee and the Human Resources Committee and he is the financial expert of the Audit Committee. He is also the dean of the ESE Business School of the Los Andes University and a member of the board of the Institute for Religious Works (IOR) in the Vatican City State. Mr. Larraín began working at Santander-Chile in 1989. Previously, he was Deputy Superintendent of Banks, Manager of
134
External Debt at the Central Bank of Chile, and Senior Finance Specialist at the World Bank, in Washington D.C. He holds law degrees from the Pontifical Catholic University of Chile and from Harvard University.
Roberto Zahler Mayanzbecame a Director in 2002. He is a member of the Asset and Liability Committee, the Market Committee and the Risk Committee. Currently, he is President of the consultancy firm Zahler & Co and serves as a consulting firm.consultant for the World Bank, IADB, IMF and BIS. He is alsohas been a member of the CLAAF orHigh Level Consulting Group to the Latin American Committee forIADB President, of LASFRC (Latin-American Shadow Financial Affairs.Regulatory Committee) and of the Emerging Market Economies Eminent Persons Group (EMEEPG). He was formerly President of the Board of Siemens ChileSiemens-Chile and Director of Air Liquide-Chile.Liquide-Chile and of Banco Santiago. He was also a visiting professor at the IMF’s Research Department. Between 1991 and 1996, he was President of the Central Bank of Chile and Vice-President from 1989 to 1991. He also servesPrior to that he served as a consultantChief Regional Adviser in Monetary and Financial Policy of the UN Economic Commission for the World Bank, the IDB, the IMFLatin America and the International BankCaribbean and was Lecturer and Researcher at the University of Settlements.Chile’s School of Economics.. Mr. Zahler has also provided technical assistance to various Central Banksthe central banks and Finance Ministries in
finance ministries of Indonesia, Kosovo and most countries ofin Latin America, Indonesia and Kosovo.America. Mr. Zahler holds a degree in Business AdministrationEconomics from the Universidad de Chile and a Masters in Economics from the University of Chicago.
Raimundo Monge ZegersLucía Santa Cruz Sutil became an Alternatea Director on April 29,August 19, 2003. HeMs. Santa Cruz is currently a member of the AssetStrategy Committee. Ms. Santa Cruz holds a degree in History from King’s College, London University and Liability Committee,an M.Phil. in History from Oxford University and holds a Doctor Honoris Causa degree from King’s College. She is a Member of the Risk Committee,Board of the Strategy Committee and the Transparency Committee. HeUniversidad Adolfo Ibañez. Ms. Santa Cruz is Corporate Director of Strategic and Financial Planning for Grupo Santander-Chile and is CEO of Santander-Chile Holding S.A. He is also President of Santander S.A. Sociedad Securitizadora and Santander Factoring S.A. He is a Director of AurumUniversia Chile S.A. She is Vice President of the Board of Compañía de Seguros Generales y de Vida La Chilena Consolidada,(Zurich) and Bansa Santander S.A. Mr. Monge hasmember of the Advisory Board of Nestle Chile She sits on the board of non-profit cultural organizations and is also a degreemember of the Self-Regulation Committee for Insurance Companies in business fromChile. She is a Member of the Universidad Católica de ChileAcademy of Social, Political and an MBA fromMoral Sciences of the UniversityInstitute of California, Los Angeles.Chile.
Orlando Poblete Iturrate became a Director on April 25, 2015. He is a member of the Audit Committee. He previously became an Alternate Director on April 22, 2014. Since 1991 Mr. Poblete has been a professor at the Universidad Los Andes. Between 1997 and 2004, he was Dean of the Law School and since 2014 he has been Chancellor of the university. He is also a partner at the law firm Orlando Poblete & Company. He is an arbitrator of the Centro de Arbitraje y Mediación de la Cámara de Comercio de Santiago. Between 2012 and 2014, he was Chairman of Clínica Universidad de los Andes and is currently Member of the Board of the University of the Andes, Chairman of Transa Securitisadora S.A. and Director of Servihabit S.A. He has also been a Professor of Law at the University of Chile. Mr. Poblete is a lawyer from the University of Chile and has masters from the same university.
Andreu Plazabecame a Director in March 2016. Mr. Plaza was appointed as senior executive vice-president of T&O Division in Santander Group on January 2015. He is Santander’s Chief Technology Officer and a member of the management committee. Mr. Plaza joined the Group in 2012 as the technology and operations director for the retail and business banking segments in Santander UK. He has been a senior executive vice-president and member of the Management Committee of Caixa Catalunya since 1998 and is a member of the boards of Servired and Aula Escola Europea. He has a graduate in Mathematics from the Universitat Autónoma de Barcelona. He also has various Master’s degrees in Finance and Banking from Stanford University, Insead, The Wharton School and ESAD.
Ana Dorrego became a Director in March 2016. She has been working at the Santander Group in the Financial Planning and Corporate Development department for the last 11 years, coordinating the Group planning processes. In this role, she has also been involved in following up on the different Santander Group units and projects. She is a board member of Santander Securities Services, S.A. She has also participated in acquisition, sales and integration projects during her time with the Group (ABN, SEB, US, Banesto, Spanish Cajas and Banif Portugal among others) and spent two years as e-business development director for the Santander Group. Prior to joining the Santander Group, she was a corporate clients relationship manager and commercial director of transactional banking at Bankinter. Ms. Dorrego holds a degree in Business Administration from the University Pontificia de Comillas ICAI-ICADE, a degree in General Management from IESE and Master’s degrees in Business Administration from Deusto University – Bilbao, Spain, and Adolfo Ibañez, Miami/Chile.
Blanca Bustamante Bravo became an Alternate Director on April 28, 2015. In 1998, she joined Viña Concha y Toro as Head of Investor Relations with the responsibility to present business strategy and achievements of the company to the financial community, a position held until 2010. In parallel, in May 2001, she became Assistant Manager of Corporate Communications. In 2011, she became responsible for relations with the community in order
135
to focus the efforts of the company in projects that create value for the community and the environment in which it operates. Since 2013, she is a director in the Center for Research & Innovation for Concha y Toro which focus is to develop technology and knowledge transfer to the industry. She holds a degree in business from Universidad Católica de Chile.
Raimundo Monge Zegers became an Alternate Director on April 29, 2003. He is currently a member of the Asset and Liability Committee, the Risk Committee and the Strategy Committee. He is Corporate Director of Strategic and Financial Planning for Grupo Santander-Chile and is CEO of Santander-Chile Holding S.A. He is also President of Santander S.A. Sociedad Securitizadora and Santander Factoring S.A. He is a Director of Aurum S.A. and Bansa Santander S.A. Mr. Monge has a degree in business from the Universidad Católica de Chile and an MBA from the University of California, Los Angeles.
Senior Management
Our senior managers are as follows:
Senior Manager | Position | Date Appointed |
| Claudio Melandri | Chief Executive Officer | |
| Miguel Mata | ||
| Jose Manuel Manzano | Apr-16 | |
| Fred Meller | Director of Global Corporate Banking | Jan-11 |
| Emiliano Muratore | Chief Financial Officer | Apr-16 |
| Guillermo Sabater | Financial Controller | Nov-15 |
| Franco Rizza | Director of Risk | Feb-14 |
| María Eugenia de la Fuente | Director of Human Resources | Jun-15 |
| Sergio Avila | Director of Administration and Costs | |
| Felipe Contreras | Chief Accounting Officer | |
| Carlos Volante | Manager Clients and Service Quality | |
| Cristian Florence | General Counsel | |
| Ricardo Martinez | Director of Internal Audit | Sep-13 |
Claudio Melandri became the Chief Executive Officer of Santander-Chile in January 2010 after being our Retail Banking Manager since February 21, 2008. He started his career at Santander-Chile in 1990 becoming a regional branch manager and manager of Santander-Chile’s branch network. He was also a Vice-President at Banco Santander Venezuela from 2005 to 2007. In 2007, he was appointed Corporate Director of Human Resources of Banco Santander-Chile. He is also a Director of Santander Chile Holding S.A. and Universia Chile S.A..S.A. Mr. Melandri has a Business Degree from the Universidad Tecnológica Metropolitana in Chile.Chile and holds a Master’s degree in Business Administration from the Universidad Adolfo Ibañez.
Miguel Mata became the Deputy General Manager for Santander-Chile on April 2016. Previously, between 2011 and 2016, he was the Chief Financial Officer for Santander-Chile on November 2011.Santander-Chile. Prior to that, he served in several staff positions related to Business Strategy.business strategy. Mr. Mata joined Santander-Chile in 2002 when Santander-Chile merged with Banco Santiago. Previously he was the Financial Controller forof Banco Santiago. He has been working in the banking industry since 1990, when he joined Banco O’Higgins, one of the predecessors ofto Banco Santiago. He is also a Director of Santander S.A. Corredores de Bolsa. Mr. Mata holds a degree in Engineering from Universidad Católica de Chile.
Gabriel MontoyaMatias Sanchez was appointed Financial Controller of Santander-Chile in April 2009 and has been working for Santander Spain and its affiliates since 1997. Between 2005 and 2009, Mr. Montoya wasbecame Director of Retail Banking in March 2016. He previously was the MIS America Projectmanager of Corporations and was responsible for implementing management information systemsInstitutions between 2013 and 2016. He joined Banco Santander in Chile, Mexico, Puerto Rico, Argentina1997 and Brazil. Previous to thathad different roles there, including agent, Regional Manager, Deputy General Manager in Retail and General Manager in Retail Banking. Mr. Montoya was Financial Controller of Santander Puerto Rico, Head of Financial Control forSanchez holds a Master’s degree in Business Administration from the Americas Division of SantanderInstituto de Empresa in Spain and various other management positions inpost graduate degrees.
José Manuel Manzano became Director of our Middle-market banking on April 1, 2016. Prior to that he was Manager of Personnel, Organization and Cost of Banco Santander Colombia. Mr. Montoya has a Business Administration Degree from Universidad del Rosario and an Executive Administration Diploma from the Universidad de los Andes, both in Colombia.
Ricardo Martinez is theChile since September 2013. Prior to that he was Corporate Director of Internal Auditing, a position he has heldRisk since September 1, 2013. He has worked for Grupo Santander since 1998 in different position in Internal Auditing, including the InternalJuly 2007, and Corporate Director of Accounting, AuditHuman Resources for Santander-Chile since October 31, 2002. Previously, he served as Manager of InsuranceHuman Resources for Old Santander-Chile since 1999. He was also General Manager of Santander Fund Management and Managing Director of Bancassurance. He is also a
136
Director of Santander Chile Holding S.A., Santander Asset Management S.A. and head auditor of Financial Risks.Santander S.A. Sociedad Securitizadora. Mr. Martinez hasManzano holds an MBA and a degree in Economic Sciences and Business from the Universidad Complutense of Madrid and a Masters in Business from the CIFF of the UniversidadCatólica de Alcalá de Henares.Chile.
Fred Meller became Manager of Global Banking & Market in January 2011. Prior to that he was Manager of Market Making for Europe and UK for Santander Spain. Previously, he served as Treasurer for Santander-Chile since 2008. He was also General Manager of Santander Agente de Valores and Director of Deposito Central de Valores Chile. Mr. Meller is also President of Santander S.A. Corredores de Bolsa. Mr. Meller holds a degree in Business Administration from Universidad Central de Chile.
Julian Acuña MorenoEmiliano Muratorebecame Managerthe Chief Financial Officer for Santander-Chile in April 2016. Before becoming Chief Financial Officer, he spent eight years as the head of the CommercialALM division. Prior to joining Santander Chile in 2006, Mr. Muratore worked at Santander’s headquarters in Madrid for 4 years and, before that, at Santander’s unit in Argentina for 4 years. Mr. Muratore has a degree in business from Universidad Católica Argentina in Buenos Aires and a postgraduate degree in finance from Universidad de San Andrés in Buenos Aires. Currently, he is chairman of the Finance Committee at Chile’s Banking Association.
Guillermo Sabaterwas appointed Financial Controller of Santander-Chile in November 2015 and has been working for Santander Spain and its affiliates for 23 years. Between 2009 and 2015, he was Executive Vice President of Santander in the US and CFO and Controller of Sovereign Bank and Santander Holdings USA. Before that, he was the financial controller of Banco Santander Chile, between 2006 and 2009. He also served for three years between 2003-2006 as controller of the Consumer Finance Division in July 2013.Madrid, Spain. Mr. Sabater also served as an internal auditor during his first ten years at the company, He has a degree in Economics and Business Administration from the University College of Financial Studies at the University Complutense de Madrid and a completed the Program in Executive Development at the Institute of Business and various courses and participation in institutions such as Babson College and Boston University.
Franco Rizzabecame Director of Risk in February 2014. Previously, he was director of Global Collections & Recoveries in the Madrid headquarters, covering all countries where the Group has commercial banking activities outside Spain. Between 2010 and 2013 he was the Chief Risk Officer of Banco Santander Risk in Uruguay. He joined Banco Santanderthe Group in 1986, playing1989 in Argentina, where he held various roles of responsibility,positions, including agent, Regional Manager, Product Manager and Retail Manager Corporate & Institutional Banking.Credit Risk Manager. He also held the position of vice president of Banco Santander’s businesshas completed studies in Colombia. He is also a director of Santander AssetBusiness and Risk Management Santander Consumer. Mr. Julian Acuña is an accountant auditor from the Universidad Diego Portales.in Argentina and Spain
María Eugenia de la Fuente
José Manuel Manzanobecame Manager of Personnel, Organization and Cost of Banco Santander Chile Division in September 2013. Prior to that he was Corporate Director of Risk since July 2007, and Corporate Director of Human Resources in June 2015. Prior to working for Santander-Chile since October 31, 2002. Previously, he served as Managerthe Bank, Ms. de la Fuente held different posts in strategic planning and human resources. From 2010 to 2013, she was Undersecretary to the Chief of Human Resources for Old Santander-Chile since 1999. HeStaff of President Piñera. From 2013 to 2015, she was also General Manager of Santander Fund Management and Managing Director of Bancassurance. He is also a DirectorTransparency and Client Services for Corpbanca and Chief Executive Officer of Santander Chile Holding S.A., Santander Asset Management S.A. and Santander S.A. Sociedad Securitizadora. Mr. Manzano holds an MBA andBZD Consultores. Ms. de la Fuente has a degree in Businessbusiness from the Universidad de Chile and a Master’s degree in tax planning from the Universidad Adolfo Ibañez.
Sergio Avilais Director of Administration and Costs. He has worked at Banco Santander Chile for 19 years in Asset Management, Corporate Finance, Retail banking, Middle-market and Risks. Mr. Avila has a BS and MS in Civil Engineering Degree from the Universidad Católica de Chile.lica.
Felipe Contreraswas named Chief Accounting Officer of Santander-Chile in October 2008. He has worked for 14 years in our Accounting Department, most recently as Manager of the Consolidation and Reporting Departments, overseeing our Chilean, U.S. and Spanish GAAP reporting requirements. He was in charge of our recent transition to International Financial Reporting Standards. Mr. Contreras is a Public Accountant from the University of Santiago and is currently a candidate to a Masters in Advanced Finance from the Universidad Adolfo Ibáñez.
Pablo Correa became Manager of Corporate Communications and Public Policy in March 2012. Prior to that he was Capital Markets Coordinator in the Ministry of Finance. Prior to that he was Chief Economist of Santander-Chile from 2006 until 2010 and an advisor to the Minister of Finance and the IBD from 2005 to 2006. Mr. Correa has an economics Degree from Universidad Católica de Chile and a Masters degree from the Harvard Kennedy School of Government.
Carlos Volante became manager Customers and Quality of Banco Santander in January 2014. Joined the Santander Group in 1990, holding various responsibilities within the organization, including manager of the Branch Network, general manager of the Administrator of Mutual Funds , Mortgage manager, Product Manager and Monitoring Commercial Banking. He was also Executive Vice President of Commercial Banking at Banco de Venezuela Grupo Santander. Between 2012 and 2013 he was general manager of the Company Corona Commercial Credit Group. Carlos Volante is an accountant auditor from the University of Talca and attended the DPA and an MBA from the Universidad Adolfo Ibáñez and participates in the PADE program at the Universidad de los Andes.
Franco Rizza Is the Risk Division Manager since February 2014. Previously, he was director of the Department of Santander Global Recoveries, with scope for all countries where the Group has commercial banking activities outside Spain. Between 2010 and 2013 he was in charge of the operation of Banco Santander Risk in Uruguay. He joined the Group in 1989 in Argentina, where he held various positions of responsibility, including: Territorial Manager, Product Manager and Director of Standardized Risk. He has degrees in Business and Risk Management in Argentina and Spain.137
Cristian Florenceis our General Counsel, a position he has held since September 2012. Prior to that he served as Chief Lawyer at Santander-Chile. Mr. Florence joined Santander-Chile in 2002 when Santander-Chile merged with Banco Santiago. He started working in the banking industry in 1991, when he joined Centrobanco, a predecessor of Banco O’Higgins and Banco Santiago serving at several positions in the law departments. Mr.
Florence is also a Director of Administrador Financiero de Transantiago S.A..S.A. and Santander Asset Management S.A. Administradora General de Fondos. He has a degree in Law from the Universidad Gabriela Mistral and a Master of Laws (LLM) from the same university.
Ricardo Martinezis the Corporate Director of Internal Auditing, a position he has held since September 1, 2013. He has worked for Grupo Santander since 1998 in different position in Internal Audit Division, including the Internal Director of Accounting, Audit Manager of Insurance and Asset Management and head auditor of Financial Risks. Mr. Martinez has a degree in Economic Sciences and Business from the Universidad Complutense of Madrid and a Master’s in Business from the CIFF of the Universidad de Alcalá de Henares.
B. Compensation
For the year ended December 31, 2013,2015, the aggregate amount of compensation paid by us to all of our directors was Ch$1,0831,374 million, in monthly stipends. For the year ended December 31, 2013,2015, the aggregate amount of compensation paid by us to all of our executive officers and our management members was Ch$30,56937,949 million (U.S.$58.353.6 million). At our annual shareholder meeting to be held on April 22, 2014,26, 2016, shareholders will bewere asked to approve a monthly stipend per director of UF 230 (U.S.$10,227)8,328), UF 460 (U.S.$20,454)16,656) for the Chairman of the Board and UF 345 (U.S.$15,341)12,492) for the Vice-Chairman of the Board. This amount will be increased by UF 30 per month (U.S.$1,334)1,086) if a Board member is named to one or more committees of the Board. The additional amount will be UF 60 (U.S.$2,668)2,172) for the President of a committee and UF 45 (U.S.$2,001)1,629) for the Vice-President of a committee. Shareholders willwere also be asked to approve the Audit Committee 20132015 remuneration for its members. The remuneration is a 33% additional compensation over the monthly stipend received by a regular board member, or UF 77 (U.S.$3,423)2,788), totaling a monthly stipend of UF 307 (U.S.$13,651)11,116). This remuneration is in line with the new Chilean corporate governance law. In addition, we pay certain directors professional service fees for the consulting services that they render to us in their fields of expertise. For the year ended December 31, 2013,2015, payments to our directors for consulting fees totaled Ch$6221,218 million (U.S.$1.21.7 million).
Santander-Chile and its affiliates have designed variable-compensation plans for their employees, based on performance targets and objectives, the achievement of which are evaluated and paid on a quarterly and/or annual basis. There are also multi-year variable-compensation plans designed to retain and motivate executives, whose compensation depends on the achievement of overall group-wide and individual targets over the course of a time period exceeding one year.
Share-based compensation (settled in cash)
Long-term incentive policy
The Board of DirectorsIn accordance with IFRS 2, equity instruments settled in cash are allocated to executives of the equity holdersBank and its Subsidiaries as a form of Banco Santander S.A. (with its Central Office located in Spain, hereinaftercompensation for their services. The Bank measures the “Parent Company”), approved a long-term incentive plan which was ratified locally. This plan focuses onservices received and the Santander Group’s executive directors and certain executive employees in Spain and other Santander Group companies.
Stock performance plan
The plan includes a multi-year incentive plan compensated in shares by the Parent Company. The beneficiaries are Executive Directors, other Senior management members and other employees determined by the Directors Committee from the Parent Company or its deputy, the Executive Committee. These shares will be distributed if the following criteria are met:
This plan involves the implementation of successive cycles of shares delivered to the beneficiaries. Each cycle lasts three years so, each year a new cycle will begin and, since 2009 onwards, another cycle will end. The aim is to establish a proper sequence between the end of each reporting period and on the incentive program linked to the previous plan (I06) and the following cycles of this plan. Therefore, the first two cycles startedsettlement date, recognizing any change in July, 2007. The first one lasted two years (PI09) and the second one adhered to the three year standard duration (PI10)
The commencement of the third-cycle (PI11) and fourth-cycle (PI12) incentive plans were approved by the Parent Company in June 2008 and 2010, respectively. These new plans consist of three-year cycles and are linked to the fulfillment of the predetermined objectives. In June, 2010, the fifth cycle (PI13) was approved. In June, 2011 the sixth and last plan of shares linked to the fulfillment of objectives (PI14) was approved.The first cycle (PI09) was cancelled on July 31, 2009, the second one (PI10) was cancelled on July 31, 2010, the third one (PI11) was cancelled on July 31, 2011, and the forth one (P12) was cancelled on July 31, 2012.
For each cycle, the maximum number of shares that may correspond to each beneficiary is established based on who had been activefair value in the Group overincome statement for the period covered byperiod. For the plan. The objective -which fulfillment will determine the number of shares to be delivered- is defined by comparing the evolution of the Group with a group of financial entities of reference. It will be linked solely to the Total Shareholder Return (TSR). Regarding the plans approved prior to June 2008, the objectives that had determined the number of shares to deliver were defined by comparing the evolution of the Group with a group of financial entities of reference, linked to two parameters: the Total Shareholder Return (TSR) and the Growth of Earnings per Share (EPS).
The final number of shares to be granted in each cycle is determined by the degree of fulfillment of the objectives on the third anniversary of each cycle (with the exception of the first cycle, for which the second anniversary is used), and the shares are delivered within seven months from the date the cycle ends.
Regarding PI13, by the completion of the relevant cycle, the TSR was calculated relative to Santander and every entity of the reference group. The list of reference entities was ordered from largest to smallest, thus determining the percentage of shares to be delivered, on the basis of the following scale and according to the relative position of Santander within the group of financial entities for reference:
As for PI14, the application of a certain criterion related to TSR will determine the percentage of shares to be delivered, on the basis of the following scale and according to the relative position of Banco Santander S.A. (Spain) within the group of financial entities of reference:
|
|
If any of the entities of the reference group was to be acquired by a different company, it would be eliminated from the reference group. In such case, the percentage will be determined based on Santander`s placement in relation to the remaining entities, based on quartiles. If Santander falls within the first quartile (including the top 25th percentile) of the reference group, Santander will earn the highest share percentage, as noted above. No share will be earned if Santander falls below the average (50th percentile) of the reference group. If Santander equals the median (50th percentile), it will earn 30% of the maximum amount. Lastly, for positions in-between the average (50th percentile exclusive) and the first quartile (25thpercentile exclusive), it will be calculated be means of linear interpolation.
As ofyears ended December 31, 2015, 2014 and 2013, the objectives were not met, so Plan I13 was terminated, however as of December 31, 2012, the objectives were met completely for Plan I12. Plan I14 is still active, so the Bank has recorded an amount ofshare-based compensation amounted to Ch$66 million, Ch$310 million and Ch$684 million (Ch$1,747 million as of December 31, 2012), which is included within the income of the specific period on which beneficiaries provided their services to Banco Santander Chile. This program had no effects on non-controlling interest. The fair value was calculated as described:million.
The fair value of each of those plans conceived by the Group is calculated on the grant date. Volatility is measured using an implied volatility model.
The calculation of the fair value of the stock plan linked to objectives is as follows:
| PI12 | PI13 | PI14 | ||
| Expected volatility (*) | 42.36% | 49.65% | 51.35% | |
| Historical annual dividend return | 4.88% | 6.34% | 6.06% | |
| Risk-free interest rate | 2.04% | 3.33% | 4.07% |
(*) Determined based on the historical volatility of the corresponding period (three years).
The application of the simulations under the Monte Carlo model results in a percentage value representing the probability of vesting of 55.42% for the I12 plan, 62.62% for the I13 plan and 55.39% for the I14 plan. Fair value measurement takes into account market conditions (TSR and EPS) and we recognize compensation expense for employees who satisfy vesting conditions (such as service conditions).
This appraisal as the price per share (determined as an average of the 15 working days after April 1st of the year when each plan was implemented) determines the cost per share this benefit shall have for Chile.
Below is a table which provides a detail of the foregoing:
| Number of shares | Exercise price | Group of employees | Number of individuals | Maturity commencement of the exercise period | Date of termination of exercise period | |
| € | ||||||
| Options granted (Plan I12) | 327,882 | - | Manager | 157 | 07-01-2009 | 06-30-2012 |
| Options granted (Plan I12) | 36,848 | - | Other non-managerial positions | 76 | 07-01-2009 | 06-30-2012 |
| Plans in force on December 31, 2009 | 364,730 | |||||
| 2010 Flow | ||||||
| Options granted (Plan I12) | 564,339 | - | Manager | 170 | 07-01-2009 | 06-30-2012 |
| Options granted (Plan I12) | 43,787 | - | Other non-managerial positions | 63 | 07-01-2009 | 06-30-2012 |
| Options granted (Plan I13) | 310,902 | - | Manager | 166 | 07-01-2010 | 06-30-2013 |
| Options granted (Plan I13) | 65,148 | - | Other non-managerial positions | 68 | 07-01-2010 | 06-30-2013 |
| Plans in force on December 31, 2010 | 1,348,906 | |||||
| 2011 Flow | ||||||
| Options granted (Plan I12) | 591,686 | - | Manager | 157 | 07-01-2009 | 06-30-2012 |
| Options granted (Plan I12) | 79,631 | - | Other non-managerial positions | 77 | 07-01-2009 | 06-30-2012 |
| Options granted (Plan I13) | 650,474 | - | Manager | 166 | 07-01-2011 | 06-30-2013 |
| Options granted (Plan I13) | 136,303 | - | Other non-managerial positions | 68 | 07-01-2011 | 06-30-2013 |
| Options granted (Plan I14) | 268,318 | - | Manager | 147 | 07-01-2012 | 06-30-2014 |
| Options granted (Plan I14) | 27,185 | - | Other non-managerial positions | 82 | 07-01-2012 | 06-30-2014 |
| Plans in force on December 31, 2011 | 3,102,503 | |||||
| 2012 Flow | ||||||
| Options granted Plan I12 | 601,101 | - | Manager | 157 | 07-01-2009 | 06-30-2012 |
| Options granted Plan I12 | 63,254 | - | Other non-managerial positions | 77 | 07-01-2009 | 06-30-2012 |
| Options granted Plan I13 | 501,456 | - | Manager | 166 | 07-01-2010 | 06-30-2013 |
| Options granted Plan I13 | 129,076 | - | Other non-managerial positions | 114 | 07-01-2010 | 06-30-2013 |
| Options granted Plan I14 | 508,144 | - | Manager | 147 | 07-01-2011 | 06-30-2014 |
| Options granted Plan I14 | 46,810 | - | Other non-managerial positions | 82 | 07-01-2011 | 06-30-2014 |
| Options exercised Plan I12 | (2,085,008) | - | Manager | 157 | 07-01-2009 | 06-30-2012 |
| Options exercised Plan I12 | (223,520) | - | Other non-managerial positions | 77 | 07-01-2009 | 06-30-2012 |
| Plans in force on December 31, 2012 | 2,643,816 | |||||
| 2013 Flow | ||||||
| Plan I13 terminated (*) | (1,462,832) | - | Manager | 166 | - | - |
| Plan I13 terminated (*) | (330,527) | - | Other non-managerial positions | 114 | - | - |
| Plans in force on December 31, 2013 | 850,457 | |||||
| Plan I14 | 850,457 |
(*) Plan I13 does not comply with the assignation requirements
Pension Plans:
The Bank has an additional benefit available to its principal executives, consisting of a pension plan. The purpose of the pension plan is to endow the executives with funds for a better supplementary pension upon their retirement.
For this purpose, the Bank will match the voluntary contributions made by the beneficiaries for their future pensions with an equivalent contribution. The executives will be entitled to receive this benefit only when they fulfill the following conditions:
| a. |
| b. | The general |
| c. | The |
| d. | The |
138
If the working relationship between the manager and the respective company ends, before s/he fulfills the abovementioned requirements, s/he will have no rights under this benefit plan. In the event of the executive’s death or total or partial disability, s/he will be entitled to receive this benefit.
The Bank will make contributions to this benefit plan on the basis of mixed collective insurance policies whose beneficiary is the Bank. The life insurance company with whom such policies are executed is not an entity linked or related to the Bank or any other Santander Group company.
Rights Plan Assets owned by the Bank due to the plan at the end of 20132015 totaled Ch$ 5,1716,945 million (Ch$ 5,5846,495 million in 2012). The2014).The amount of the defined benefit plans has been quantified by the Bank, based on the following criteria:
Calculation method:
Use of the creditprojected unit projectedcredit method which considers each working year as generating an additional amount of rights over benefits and values each unit separately. It is calculated based primarily on fund contributions, as well as other factors such as the legal annual pension limit, seniority, age and yearly income for each unit valued individually.
Actuarial hypothesis assumptions:
Actuarial assumptions with respect to demographic and financial variables are non-biased and mutually compatible with each other. The most significant actuarial hypotheses considered in the calculations were:
Plans post-employment | Plans post-employment | Plans post-employment | Plans post-employment | ||||||||
| 2013 | 2012 | 2015 | 2014 | ||||||||
| Mortality chart | RV-2009 | RV-2009 | RV-2009 | RV-2009 | |||||||
| Termination of contract rates | 5.0% | 5.0% | 5.0 | % | 5.0 | % | |||||
| Impairment chart | PDT 1985 | PDT 1985 | PDT 1985 | PDT 1985 | |||||||
Assets related to the pension fund contributed by the Bank into the Seguros Euroamérica insurance company with respect to defined benefit plans are presented as net of associated commitments.
Activity for post-employment benefits is as follows:
| As of December 31, | As of December 31, | ||||||||||
| 2013 | 2012 | 2015 | 2014 | ||||||||
| MCh$ | MCh$ | Ch$mn | |||||||||
| Plan assets | 5,171 | 5,584 | 6,945 | 6,495 | |||||||
| Commitments for defined-benefit plans | |||||||||||
| For active personnel | (3,888) | (3,595) | (5,070 | ) | (4,639 | ) | |||||
| Incurred by inactive personnel | - | - | — | — | |||||||
| Minus: | — | ||||||||||
| Unrealized actuarial (gain) losses | - | - | — | — | |||||||
| Balances at year end | 1,283 | 1,989 | 1,875 | 1,856 | |||||||
139
Year’s cash flow for post-employment benefits is as follows:
| For the years ended December 31, | |||||
| 2013 | 2012 | 2011 | |||
| MCh$ | MCh$ | MCh$ | |||
| a) Fair value of plan assets | |||||
| Opening balance | 5,584 | 5,508 | 5,170 | ||
| Expected yield of insurance contracts | 247 | 326 | 403 | ||
| Employer contributions | (660) | (250) | (65) | ||
| Actuarial (gain) losses (*) | - | - | - | ||
| Premiums paid | - | - | - | ||
| Benefits paid | - | - | - | ||
| Fair value of plan assets at year end | 5,171 | 5,584 | 5,508 | ||
| b) Present value of obligations | |||||
| Present value of obligations opening balance | (3,594) | (3,143) | (953) | ||
| Net incorporation of Group companies | - | - | - | ||
| Service cost | (311) | (452) | (1.207) | ||
| Interest cost | - | - | - | ||
| Curtailment/settlement effect | - | - | - | ||
| For the years ended December 31, | |||||||||||||||||
| 2015 | 2014 | 2013 | |||||||||||||||
| Ch$mn | |||||||||||||||||
| a) Fair value of plan assets | |||||||||||||||||
| Opening balance | 6,495 | 5,171 | 5,584 | ||||||||||||||
| Expected yield of insurance contracts | 432 | 446 | 247 | ||||||||||||||
| Employer contributions | 18 | 878 | (660 | ) | |||||||||||||
| Actuarial (gain) losses | — | — | — | ||||||||||||||
| Premiums paid | — | — | — | ||||||||||||||
| Benefits paid | — | — | — | ||||||||||||||
| Fair value of plan assets at year end | 6,945 | 6,495 | 5,171 | ||||||||||||||
| b) Present value of obligations | |||||||||||||||||
| Present value of obligations opening balance | (4,639 | ) | (3,244 | ) | (3,594 | ) | |||||||||||
| Net incorporation of Group companies | — | — | — | ||||||||||||||
| Service cost | (431 | ) | (1,395 | ) | (311 | ) | |||||||||||
| Interest cost | — | — | — | ||||||||||||||
| Curtailment/settlement effect | — | — | — | ||||||||||||||
| Benefits paid | - | - | - | — | — | — | |||||||||||
| Past service cost | - | - | - | — | — | — | |||||||||||
| Actuarial (gain) losses | 17 | - | - | — | — | 17 | |||||||||||
| Other | - | - | - | — | — | — | |||||||||||
| Present value of obligations at year end | (3,888) | (3,595) | (2,160) | (5,070 | ) | (4,639 | ) | (3,888 | ) | ||||||||
| Net balance at year end | 1,283 | 1,989 | 3,348 | 1,875 | 1,856 | 1,283 | |||||||||||
Plan expected profit:
| As of December 31, | ||||||||
| 2013 | 2012 | 2011 | As of December 31, | |||||
2015 | 2014 | 2013 | ||||||
| Type of expected yield from the plan’s assets | UF + 2.50% annual | UF + 2.50% annual | UF + 2.50% annual | UF + 2.50% annual | ||||
| Type of yield expected from the reimbursement rights | UF + 2.50% annual | UF + 2.50% annual | UF + 2.50% annual | UF + 2.50% annual | ||||
Plan associated expenses:
| For the years ended December 31, | For the years ended December 31, | ||||||||||||||||
| 2013 | 2012 | 2011 | 2015 | 2014 | 2013 | ||||||||||||
| MCh$ | MCh$ | MCh$ | MCh$ | MCh$ | MCh$ | ||||||||||||
| Current period service expenses | 311 | 452 | 1,207 | 431 | 1,395 | 311 | |||||||||||
| Interest cost | - | - | - | - | — | — | |||||||||||
| Expected yield from plan’s assets | (247) | (326) | (403) | (432 | ) | (446 | ) | (247 | ) | ||||||||
| Expected yield of insurance contracts linked to the Plan: | — | ||||||||||||||||
| Extraordinary allocations | - | - | - | — | — | — | |||||||||||
| Actuarial (gain)/ losses recorded in the period included in other comprehensive income | (17) | - | - | ||||||||||||||
| Actuarial (gain)/ losses recorded in the period | — | — | (17 | ) | |||||||||||||
| Past service cost | - | - | - | — | — | — | |||||||||||
| Other | - | - | - | — | — | — | |||||||||||
| Total | 47 | 126 | 804 | (1 | ) | 949 | 47 | ||||||||||
C. Board Practices140
The Bank is in the process of changing the members of the Committees based on the results of the recent Board election, but as of April 30, 2014 these Committees remained unchanged.
| C. | Board Practices |
Audit Committee
Board member | Position in Committee |
| Chairman | |
| First Vice Chairman and Financial Expert | |
| Second Vice Chairman |
The Audit Committee (Comité de Directores y Auditoría) is comprised of three members of the Board of Directors. The Committee Secretary is the alternate director Juan Pedro Santa María. The General Counsel is the Committee Secretary. The Chief Executive Officer, General Auditor and other persons from the Bank can be invited to the meetings if necessary and are present on specific matters. This Committee’s primary responsibility is to support the Board of Directors in the continuous improvement of our system of internal controls, which includes reviewing the work of both the external auditors and the Internal Audit Department. The committee is also responsible for analyzing observations made by regulatory entities of the Chilean financial system about us and for recommending measures to be taken by our management in response. This committee also performs functions of a remuneration committee as established in Chilean Law, and reviews annually the salary and bonus programs for the
executive officers of the Bank. The external auditors are recommended by this committee to our Board of Directors and appointed by our shareholders at the annual shareholders’ meeting.
This committee is also responsible for:
| · | Presenting to the Board of Directors a list of candidates for the selection of an external auditor. |
| · | Presenting to the Board of Directors a list of candidates for the selection of rating agencies. |
| · | Overseeing and analyzing the results of the external audit and the internal reviews. |
| · | Coordinating the activities of internal auditing with the external auditors’ review. |
| · | Overseeing and coordinating the Bank’s operational risk |
| · | Analyzing the interim and year-end financial statements and reporting the results to the Board of Directors. |
| · | Analyzing the external auditors’ reports and their content, procedures and scope. |
| · | Analyzing the rating agencies’ reports and their content, procedures and scope. |
| · | Obtaining information regarding the effectiveness and reliability of the internal control systems and procedures. |
| · | Analyzing the information systems performance, and its sufficiency, reliability and use in connection with decision-making processes. |
| · | Obtaining information regarding compliance with the company’s policies regarding the due observance of laws, regulations and internal rules to which the company is subject. |
| · | Investigating suspicious and fraudulent activities (including conflicts). |
| · | Analyzing the reports of the inspection visits, instructions and presentations of the SBIF. |
| · | Obtaining information, analyzing and verifying the company’s compliance with the annual audit program prepared by the internal audit department. |
| · | Informing the Board of Directors of accounting changes and their effects. |
| · | Examining on an annual basis the compensation plans of high level executives and managers. |
141
Asset and Liability Committee (ALCO)
The ALCO includes the Chairman of the Board and five additional members of the Board, the Chief Executive Officer, the Corporate Financial Controller, the Manager of the Financial Management Division, the Manager of Market Risk, the Manager of the Treasury Division, and other senior members of management. The ALCO meets monthly. All limits reviewed by the ALCO are measured and prepared by the Market Risk Department. The non-Board members of the ALCO meet weekly to review liquidity, funding, capital and market risk related matters.
Board member | Position in Committee |
| Vittorio Corbo | Chairman |
| Mauricio Larraín | |
| Oscar von Chrismar | |
| Second Vice-Chairman | |
| Marco Colodro | Member |
| Roberto Zahler | Member |
| Raimundo Monge | Member |
The main functions of the ALCO are:
| · | Making the most important decisions regarding interest rate risk, funding, capital and liquidity levels. |
| · | Review of the Bank’s main gaps (foreign currency and inflation gap). |
| · | Review of the evolution of the most relevant local and international markets and monetary policies. |
Market Committee
The Market Committee includes the Vice-Chairman of the Board, three additional members of the Board, the Chief Executive Officer, the Manager of Global Banking and Markets, the Manager of the Treasury Division, the Manager of the Financial Management Division, the Manager of Market Risk, the Financial Controller and other senior members of management.
Board member | Position in Committee |
| Vittorio Corbo | Chairman |
| Oscar von Chrismar | |
| Roberto Zahler | |
| Second Vice-Chairman | |
| Marco Colodro | Member |
The Market Committee is responsible for:
| · | Establishing a strategy for the Bank’s trading portfolio. |
| · | Establishing the Bank’s policies, procedures and limits with respect to its trading portfolio. The Bank’s Market Risk Department measures all risks and limits and reports these to the Market Committee. |
| · | Reviewing the evolution of the most relevant local and international markets and monetary policies. |
Executive Credit Committee
The Executive Credit Committee is comprised of the following Board members:
|
|
In addition, this committee also includes: the Corporate Director of Risk, the CEO, the Corporate Legal Counsel, the Manager of Global Banking, the Corporate Director of Human Resources and Administration (this is a newly-created position) and two senior members of the Credit Risk department, who present the loans being reviewed. The Executive Credit Committee meets weekly and performs the following main functions:
The Credit Risk Department must present to the Board on a monthly basis. In this presentation all loans above U.S.$5 million that were granted in the previous month must be reviewed. In addition, any other theme or subject of importance regarding credit risk is also presented (for example a proposal to change a provisioning model must be
presented and approved by the Board). Finally, at least once a year, the Credit Risk Department presents a report to assure the Board that our loan loss allowances are adequate for all known and estimated incurred losses.
Integral Risk Committee
Board member | Position in Committee |
| Oscar von Chrismar | Chairman |
| Member | |
| Roberto Méndez | Member |
| Member |
TheIntegral Risk Committee is responsible for revising and following all risks that may affect us, including reputational risk, allowing for an integral risk management. This committee serves as the governing body through which the Board supervises the CRO.all risk functions. It also evaluates the reasonability of the systems for measurement and control of risks. This Committee includes the Vice Chairman of the Board and five Board members. Furthermore, the Board Risk Committee was created, and is comprised of the Vice-Chairman of the Bank and four independent board members.
Marketing, Communications and Institutional Image Committee
|
|
The Marketing, Communications and Institutional Image Committee is comprised of the Chairman of the Board and three additional Board members, the CEO, the Manager of Retail Banking, the Manager of Human Resources, the Manager of Corporate Communications, the Manager of Marketing and other senior managers. This committee reviews and confirms all matters related to products, corporate image and communications.
University Committee
|
|
The University Committee is comprised of the Chairman of the Board and two additional Board members. The committee reviews our support for higher education and integrates this with the growth of the Institutional business segment and retail banking for college graduates.
Strategy Committee
Board member | Position in Committee |
| Chairman | |
| Roberto Méndez | Vice-Chairman |
| Oscar von Chrismar | |
| Member | |
| Raimundo Monge | Member |
The Strategy Committee is in charge of our strategic planning process and follow-up, as well as the identification of broad business opportunities and threats. The Strategy Committee is comprised of the Chairman of the Board and four additional Board members.
ClientsAnalysis and Service QualityPrevention of Money Laundering Committee
Board member | Position in Committee |
The Clients and Service Quality Committee is in charge of overseeing all major issues related to quality and client service.
Transparency Committee
|
|
| Juan Pedro Santa María | Chairman |
The TransparencyThis Committee is compriseddefines and controls the policies regarding anti-money laundering and financing of two Board members. The Transparency Committee dictates guidelines on communicationsterrorism in line with Chilean law and available informationGrupo Santander’s governance. In addition to clients on relation to newMr. Santa María, members of senior management from the legal, risk and existing products and offers, in order to comply with internal and regulatory standards relative to information transparency to clients.compliance departments, among others, are also a part of this committee.
Human Resources Committee
Board member | Position in Committee |
| Vittorio Corbo | Chairman |
| Mauricio Larraín | |
| Oscar Von-Chrismar | Member |
| Blanca Bustamante | Member |
The Human Resources Committee is comprised of twofour Board members, the CEO, the Manager of Human Resources and Administration, the Manager of Human Resources and other senior managers. The Human Resources Committee dictates guidelines on management and general human resources policies, including incentive, selection, promotion and training policies.
D. Employees
| D. | Employees |
As of December 31, 2013,2015, on a consolidated basis, we had 11,51611,723 employees, 8,84510,947 of whom were bank employees, 29898 of whom were employees of our subsidiaries and 2,373678 were employees of entities controlled by the Bank through other considerations. We have traditionally enjoyed good relations with our employees and their unions. Of the total headcount of us and our subsidiaries, 8,7468,363 or 75.9%71.3% were unionized. In May 2014, a new collective bargaining agreement was signed, which went into effect on January 1, 2014 and which expires on December 31, 2018, though it may be renegotiated ahead of schedule with the consent of management and the union. We generally apply the terms of our collective bargaining agreement to unionized and non-unionized employees. The following chart summarizes the number of employees employed by the bank.
Employees | As of |
| Executives | |
| Professionals | |
| Administrative | |
| Total |
E. Share Ownership
| E. | Share Ownership |
No director or executive officer owns more than 1% of the shares of Santander-Chile. As of December 31, 2013,2015, the following directors and executives held shares in Santander-Chile:
Directors | Shares |
| Mauricio Larraín Garcés | 568 |
Santander-Chile currently does not have any arrangements for involving employees in its capital and there is no systematic arrangement for grant of options or shares or securities of Santander-Chile to them.
ITEM 7. MAJOR SHAREHOLDERS AND RELATED PARTY TRANSACTIONS
| A. | Major Shareholders |
Santander Spain controls Santander-Chile through its holdings in Teatinos Siglo XXI Inversiones S.A. and Santander Chile Holding S.A., which are controlled subsidiaries. Santander Spain has control over 67.18% of our shares and actual participation, excluding non-controlling shareholders that participate in Santander Chile Holding, S.A. of 67.01%67.12%.
Shareholder | Number of Shares | Percentage | Number of Shares | Percentage |
| Santander Chile Holding S.A. | 66,822,519,695 | 35.46% | 66,822,519,695 | 35.46% |
| Teatinos Siglo XXI Inversiones S.A.. | 59,770,481,573 | 31.72% | ||
| Teatinos Siglo XXI Inversiones S.A. | 59,770,481,573 | 31.72% | ||
Santander Spain is in a position to cause the election of a majority of the members of Santander-Chile’s Board of Directors, to determine its dividend and other policies and to determine substantially all matters to be decided by a vote of shareholders. Santander Spain holds ordinary shares to which no special voting rights are attached. Each share represents one vote and there are no shareholders with different voting rights.
The number of outstanding shares of Santander-Chile (of which there is only one class, being ordinary shares) at December 31, 2013,2015, was 188,446,126,794 shares, without par value. Santander-Chile’s shares are listed for trading on the Chilean Stock Exchanges and on the NYSE in connection with the registration of ADRs. The market capitalization of Santander-Chile at December 31, 20132015 on the Chilean stock exchange was Ch$ 5,740,0695,990,069 million and U.S.$ 11,1048,463 million on the NYSE. At December 31, 2013,2015, Santander-Chile had 12,17611,881 holders of its ordinary shares registered in Chile, including JP MorganThe Bank of New York Mellon as Depositary (the “Depositary”) of Santander-Chile’s ADS Program. Other than the information disclosed in this section, there are no arrangements to the knowledge of Santander-Chile that can result in a change of control of Santander-Chile. As of December 31, 2013,2015, there were a total of 2526 ADR holders on record. Since some of these ADRs are held by nominees, the number of record holders may not be representative of the number of beneficial holdersholders.
| B. | Related Party Transactions |
The Chilean Companies Law requires that our transactions with related parties be on a market basis, that is, on similar terms to those customarily prevailing in the market. We are required to compare the terms of any such transaction to those prevailing in the market at the date the transaction is to be entered into. Directors of companies that violate this provision are liable for losses resulting from such violations.
In addition, under the Chilean Companies Law, a company may not enter into a transaction with related parties unless (i) such transaction has received the prior approval of the company’s Board of Directors and (ii) the terms of such transaction are consistent with the terms of transactions of a similar type prevailing in the market. If it is not possible to make this determination, the board may appoint two independent evaluators. The evaluators’ final conclusions must be made available to shareholders and directors for a period of 20 business days, during which shareholders representing 5% or more of the issued voting shares may request the board to call a shareholders’ meeting to resolve the matter, with the agreement of two thirds of the issued voting shares required for approval. For purposes of this regulation, the law considers the amount of a proposed transaction to be material if (1) it exceeds 1% of the company’s net worth (provided that it also exceeds 20,000UF) or (2) it exceeds 20,000 UF.
All resolutions approving such transactions must be reported to the company’s shareholders at the next annual shareholders’ meeting. Violations of this provision may result in administrative or civil liability to the corporation, the shareholders and/or third parties who suffer losses as a result of such violation.
Loans granted to related parties
In addition to subsidiaries and associated entities, the Bank’s “related parties” include the “key personnel” of the Bank’s executive staff (members of the Bank’s Board of Directors and the Senior Managers of Santander-Chile and its subsidiaries, together with their close relatives), as well as the entities over which the key personnel could exert significant influence or control.
145
The Bank also considers the companies that are part of the Santander Group worldwide as related parties, given that all of them have a common parent,i.e., Santander Spain.
The table below shows loans and accounts receivable and contingent loans with related parties. For more information, see “Note 37—34—Transactions with Related Parties” in our Audited Consolidated Financial Statements appearing elsewhere in this Annual Report:
As of December 31, | As of December 31, | |||||||||||||||||||||||
2013 | 2012 | 2011 | 2015 | 2014 | 2013 | |||||||||||||||||||
| Companies of the Group | Associated companies | Key personnel | Other | Companies of the Group | Associated companies | Key personnel | Other | Companies of the Group | Associated companies | Key personnel | Other | Companies of the Group | Associated companies | Key personnel | Other | Companies of the Group | Associated companies | Key personnel | Other | Companies of the Group | Associated companies | Key personnel | Other | |
| Ch$mn | Ch$mn | |||||||||||||||||||||||
| Loans and accounts receivables | ||||||||||||||||||||||||
| Commercial loans | 47,305 | 618 | 4,022 | 51,141 | 46,790 | 668 | 2,910 | 57,723 | 39,708 | 663 | 2,234 | 65,512 | 77,388 | 565 | 5,841 | 1,963 | 51,647 | 9,614 | 4,348 | 8,743 | 47,305 | 618 | 4,022 | 51,141 |
| Mortgage loans | - | 15561 | - | 15089 | - | 15657 | - | - | 20,559 | - | 19,941 | - | 15,561 | - | ||||||||||
| Consumer loans | - | 2061 | - | 1513 | - | 1808 | - | - | 2,274 | - | 2,798 | - | 2,061 | - | ||||||||||
| Loans and accounts receivables | 47,305 | 618 | 21,644 | 51,141 | 46,790 | 668 | 19,512 | 57,723 | 39,708 | 663 | 19,699 | 65,512 | 77,388 | 565 | 28,674 | 1,963 | 51,647 | 9,614 | 27,087 | 8,743 | 47,305 | 618 | 21,644 | 51,141 |
| Provision for loan losses | (238) | (3) | (44) | (6) | (329) | (3) | (39) | (9) | (54) | (1) | (39) | (23) | ||||||||||||
| Allowance for loan losses | (213) | (190) | (62) | (20) | (139) | (10) | (46) | (18) | (238) | (3) | (44) | (6) | ||||||||||||
| Net loans | 47,067 | 615 | 21,600 | 51,135 | 46,461 | 665 | 19,473 | 57,714 | 39,654 | 662 | 19,660 | 62,489 | 77,175 | 375 | 28,612 | 1,943 | 51,508 | 9,604 | 27,041 | 8,725 | 47,067 | 615 | 21,600 | 51,135 |
| Guarantees | 124,420 | - | 19,237 | 2,326 | 9 | - | 17,909 | 1,349 | 25,311 | - | 18,244 | 1,241 | 499,803 | - | 25,493 | 1,632 | 409,339 | - | 23,896 | 1,289 | 124,420 | - | 19,237 | 2,326 |
| Contingent loans | ||||||||||||||||||||||||
| Personal guarantees | - | - | ||||||||||||||||||||||
| Letters of credit | 30,714 | - | 25,697 | - | 187 | - | 29,275 | - | 16,000 | - | 11 | 30,714 | - | |||||||||||
| Guarantees | 172,274 | - | 9,989 | 34,897 | - | 1,443 | 12,778 | - | 569 | 510,309 | - | 2 | 432,802 | - | 762 | 172,274 | - | 9,989 | ||||||
| Contingent loans | 202,988 | - | 9,989 | 60,594 | - | 1,443 | 12,965 | - | 569 | 539,584 | - | 2 | 448,802 | - | 773 | 202,988 | - | 9,989 | ||||||
| Provisions for contingent loans | (22) | - | (4) | (15) | - | (2) | (63) | - | (1) | |||||||||||||||
| Allowance for contingent loans | (11) | - | (12) | - | (22) | - | (4) | |||||||||||||||||
| Net contingent loans | 202,966 | - | 9,985 | 60,579 | - | 1,441 | 12,902 | - | 568 | 539,573 | - | 2 | 448,790 | - | 773 | 202,966 | - | 9,985 | ||||||
Loans (a) were made in the ordinary course of business, (b) were made on substantially the same terms, including interest rates and collateral, as those prevailing at the time for comparable transactions with unrelated persons, and (c) did not involve more than the normal collection risk.
146
Under the Chilean General Banking Law, Chilean banks are subject to certain lending limits, including the following:
| · | a bank may not extend to any person or legal entity (or group of related entities), directly or indirectly, unsecured loans in an amount that exceeds 5.0% of the bank’s regulatory capital, or secured loans in an amount that exceeds 25.0% of its regulatory capital. In the case of foreign export trade finance, this 5.0% ceiling is raised to: 10.0% for unsecured financing, 30.0% for secured financing. This ceiling is raised to 15.0% for loans granted to finance public works under the concessions system contemplated in the Decree with Force of Law 164 of 1991, of the Ministry of Public Works, provided that either the loan is secured on the concession, or the loan is granted as part of a loan syndication; |
| · | a bank may not grant loans bearing more favorable terms than those generally offered by banks in the same community to any entity (or group of related entities) that is directly or indirectly related to its owners or management; |
| · | a bank may not extend loans to another bank in an aggregate amount exceeding 30.0% of its regulatory capital; |
| · | a bank may not directly or indirectly grant a loan, the purpose of which is to allow the borrower to acquire shares in the lending bank; |
| · | a bank may not lend, directly or indirectly, to a Director or any other person who has the power to act on behalf of the bank, or to certain related parties; and |
| · | a bank may not grant loans to individuals or legal entities involved in the ownership or management of the bank, whether directly or indirectly (including holders of 1.0% or more of its shares), on more favorable terms than those generally offered to non-related parties. Loans may not be extended to senior executives and to companies in which such individuals have a participation of 5.0% or more of the equity or net earnings in such companies. The aggregate amount of loans to related parties may not exceed a bank’s regulatory capital. |
We are not aware of any loans to any related parties exceeding the above lending limits.
The largest related party loan, which matures on March 23, 2015June 29, 2016 and has an annual rate of U.S.$ + 1.24%0.0%, by the Bank is to Telefónica ChileBanco Santander Spain S.A., corresponds to a performance bond (boleta de garantía) and had an amount outstanding of Ch$30,624U.S.$ 114 million, (U.S.$58 million).which was guaranteeing a corporate foreign trade loan. As this operation is a contingent loan, the Bank charges a fee which was 0.60% per annum.
147
The table below shows assets and liabilities with related parties:
As of December 31, | ||||||||||||||||||||||||
As of December 31, | 2015 | 2014 | 2013 | |||||||||||||||||||||
2013 | 2012 | 2011 | Companies of the Group | Associated companies | Key personnel | Other | Companies of the Group | Associated companies | Key personnel | Other | Companies of the Group | Associated companies | Key personnel | Other | ||||||||||
| Companies of the Group | Associated companies | Key personnel | Other | Companies of the Group | Associated companies | Key personnel | Other | Companies of the Group | Associated companies | Key personnel | Other | MCh$ | ||||||||||||
| Ch$mn | ||||||||||||||||||||||||
| Assets | ||||||||||||||||||||||||
| Cash and deposits in banks | 5,306 | - | 5,357 | - | 178,567 | - | 23,578 | - | 193,377 | — | 5,306 | — | ||||||||||||
| Trading investments | - | - | - | — | ||||||||||||||||||||
| Investments under resale agreements | - | |||||||||||||||||||||||
| Obligations under repurchase agreements | - | - | — | |||||||||||||||||||||
| Loans | - | - | ||||||||||||||||||||||
| Financial derivative contracts | 557,026 | - | 526,734 | - | 506,880 | - | 771,774 | - | 995,468 | — | 557,026 | — | ||||||||||||
| Available for sale investments | - | - | - | — | ||||||||||||||||||||
| Other assets | 2,460 | - | 4,339 | - | 4,617 | - | 3,218 | - | 2,776 | — | 2,460 | — | ||||||||||||
| Liabilities | ||||||||||||||||||||||||
| Deposits and other demand liabilities | 58,030 | 10,406 | 2,783 | 23,300 | 65,386 | 2,563 | 2,286 | 17,211 | 5,057 | 4,009 | 1,425 | 16,782 | 9,987 | 8,535 | 2,454 | 1,373 | 5,061 | 1,168 | 2,403 | 4,602 | 58,030 | 10,406 | 2,783 | 23,300 |
| Investments under repurchase agreements | 59,703 | - | 92,862 | - | 137,191 | - | ||||||||||||||||||
| Obligations under repurchase agreements | 12,006 | - | 47,010 | — | 59,703 | — | ||||||||||||||||||
| Loans | - | - | ||||||||||||||||||||||
| Time deposits and other time liabilities | 54,212 | 299 | 3,774 | 156,977 | 97,449 | 373 | 2,842 | 39,193 | 248,206 | 368 | 3,627 | 41,732 | 1,360,572 | 234 | 2,728 | 898 | 269,381 | 2,320 | 81,079 | 54,212 | 299 | 3,774 | 156,977 | |
| Financial derivative contracts | 537,162 | - | 387,903 | - | 396,538 | - | 1,323,996 | - | 1,395,507 | — | 537,162 | — | ||||||||||||
| Issued debt instruments | 96,872 | - | 67,368 | - | 1,683 | - | 398,565 | - | 336,323 | — | 96,872 | — | ||||||||||||
| Other financial liabilities | 3,912 | - | 103,207 | - | 58,848 | - | 2,409 | - | 846 | — | 3,912 | — | ||||||||||||
| Other liabilities | 462 | - | 1,241 | - | 1,339 | - | 376 | - | 771 | — | 462 | — | ||||||||||||
148
Other transactions with related parties
During the years ended December 31, 2013, 20122015, 2014 and 2011,2013, the Bank had the following significant income (expenses) from services provided to (by) related parties:
2013 | 2012 | 2011 | ||||||||||
| Companies of the Group | Associated companies | Key personnel | Other | Companies of the Group | Associated companies | Key personnel | Other | Companies of the Group | Associated companies | Key personnel | Other | |
| MCh$ | MCh$ | MCh$ | MCh$ | MCh$ | MCh$ | MCh$ | MCh$ | MCh$ | MCh$ | MCh$ | MCh$ | |
| Income (expense) recorded | ||||||||||||
| Income and expenses from interests and readjustments | (8,812) | 50 | 1,065 | (1,082) | (11,660) | 54 | 948 | (2,819) | (17,892) | 54 | 1,289 | (3,683) |
| Income and expenses from fees and services | - | 75 | 120 | 3,615 | (1,191) | 59 | 114 | 214 | 387 | 38 | 110 | 196 |
| Net income from financial and foreign exchange operations(*) | (8,690) | - | (4) | (1,534) | 241,424 | - | (1) | 107 | 38,744 | - | 5 | 392 |
| Other operating revenues and expenses | 955 | - | - | - | 643 | - | - | - | 519 | - | - | - |
| Income for Investments in other companies (**) | 78,122 | - | - | - | - | - | - | - | - | - | - | - |
| Key personnel compensation and expenses | - | - | (31,652) | - | - | - | (30,999) | - | - | - | (32,773) | - |
| Administrative and other expenses | (28,371) | (30,758) | - | - | (23,121) | (20,461) | - | - | (13,303) | (25,509) | - | - |
| Totals | 33,204 | (30,633) | (30,471) | 999 | 206,095 | (20,348) | (29,938) | (2,498) | 8,455 | (25,417) | (31,369) | (3,095) |
For the years ended December 31, | ||||||||||||
2015 | 2014 | 2013 | ||||||||||
Companies of the Group | Associated Companies | Key personnel | Other | Companies of the Group | Associated companies | Key personnel | Other | Companies of the Group | Associated Companies | Key personnel | Other | |
| MCh$ | MCh$ | MCh$ | MCh$ | MCh$ | MCh$ | MCh$ | MCh$ | MCh$ | MCh$ | MCh$ | MCh$ | |
| Income (expense) recorded | — | 1,664 | 116 | |||||||||
| Interest income and inflation—indexation adjustments | (10,986) | 77 | 208 | 39 | (11,130) | 25 | 1,963 | (2,509) | (8,812) | 50 | 1,065 | (1,082) |
| Fee and commission income and expenses | 35,955 | — | 15 | 6 | 30,591 | 84 | 230 | 167 | — | 75 | 120 | 3,615 |
| Net profit (loss) from financial operations and net foreign exchange gain (loss) (*) | (321,985) | — | — | — | (315,918) | — | 20 | (10,051) | (8,690) | — | (4) | (1,534) |
| Other operating income and expenses | 955 | — | — | — | 1,158 | — | — | — | 955 | — | — | — |
| Income from sale of investments in other companies (**) | — | — | — | — | — | — | — | — | 78,122 | — | — | — |
| Key personnel compensation and expenses | — | — | (39,323) | — | — | — | (31,361) | — | — | — | (31,652) | — |
| Administrative and other expenses | (30,591) | (41,691) | — | — | (30,342) | (33,961) | — | — | (28,371) | (30,758) | — | — |
| Total | (326,652) | (41,614) | (37,436) | 161 | (325,641) | (33,852) | (29,148) | (12,393) | 33,204 | (30,633) | (30,471) | 999 |
| (*) | Primarily relates to derivative contracts used to financially cover exchange risk of assets and liabilities that cover positions of the Bank and its subsidiaries. |
(*) Primarily relates to derivative contracts used to financially cover exchange risk of assets and liabilities that cover positions of the Bank and its subsidiaries.
(**) Corresponds to the profit from the sale of the Santander Asset Management S.A. Administradora General de Fondos subsidiary.
| (**) | Corresponds to the profit from the sale of the subsidiary Santander Asset Management S.A. Administradora General de Fondos. |
Only transactions with related parties equal to or greater than UF 5,000 (MCh$128.2 million) are included individually in the table above. Transactions with related parties between UF 1,000 and up to UF 5,000 are included in other transactions with related parties. All transactions were conducted at arm’s length.
149
| C. | Interests of Experts and Counsel |
Not applicable.
| A. | Consolidated Statements and Other Financial Information |
Financial Information
See “Item 18. Financial Statements.”
Legal Proceedings
We are subject to certain claims and are party to certain legal and arbitration proceedings in the normal course of our business, including claims for alleged operational errors. We do not believe that the liabilities related to such claims and proceedings are likely to have, in the aggregate, a material adverse effect on our consolidated financial condition or results of operations. For the yearsyear ended December 31, 2013,2015, the Disclosure Committee of Santander-Chile has defined a significant legal proceeding as that implying an estimated incurred loss greater than an established cut-off amount. This cut-off amount is calculated as 16%0.18% of the following amount: 5%average of averagepre-tax net income forin the past two years, reduced by 30% for prudence.last three years. As of December 31, 2013,2015, this cut-off totaled Ch$2,7251,001 million (U.S.$5.21.4 million). As of December 31, 2013,2014, there were no legal proceedings exceeding that amount. There are no material proceedings in which any of our directors, any members of our senior management, or any of our affiliates is either a party adverse to us or our subsidiaries or has a material interest adverse to us or our subsidiaries.
Upon the recommendation of our legal advisors, we estimate that our aggregate liability if all legal proceedings were determined adversely to us could result in significant losses not estimated by us. As of December 31, 2013,2015, we have set aside Ch$4281,803 million (U.S.$0.82.6 million) as provisions for these legal actions. These provisions are presented in “Contingency Provisions” in the Consolidated Statements of Financial Position. In addition, there are other lawsuits in our subsidiaries for UF26,512 (Ch$618118 million or US$1.20.2 million), which primarily relate to the litigation between Santander Corredores de Seguros Limitada and its clients for leasing assets.
Dividends and dividend policy
See “Item 3. Key Information—A. Selected Financial Data—Dividends.”
| B. | Significant Changes |
None.
| A. | Historical Trading Information |
The table below shows, for the periods indicated, the annual, quarterly and monthly high and low closing prices (in nominal Chilean pesos) of the shares of our common stock on the Santiago Stock Exchange and the annual, quarterly and monthly high and low closing prices (in U.S. dollars) as reported by the NYSE.
Santiago Stock | NYSE | |||
Common Stock | ADS(2) | |||
High | Low | High | Low | |
(Ch$ per share(1)) | (U.S.$ per ADS) | |||
| Annual Price History | ||||
| 2009 | 31.00 | 18.23 | 54.60 | 28.16 |
| 2010 | 47.37 | 30.74 | 64.78 | 31.22 |
| 2011 | 43.65 | 31.94 | 99.44 | 59.40 |
| 2012 | 41.01 | 31.40 | 33.96 | 26.10 |
| 2013 | 36.23 | 27.62 | 30.59 | 21.38 |
Santiago Stock | NYSE | |||
Common Stock | ADS(2) | |||
High | Low | High | Low | |
(Ch$ per share(1)) | (U.S.$ per ADS) | |||
| Quarterly Price History | ||||
| 2011 | ||||
| 1st Quarter | 43.65 | 35.63 | 70.63 | 60.59 |
| 2nd Quarter | 42.23 | 39.80 | 71.88 | 59.40 |
| 3rd Quarter | 42.93 | 34.53 | 99.44 | 66.73 |
| 4th Quarter | 38.80 | 31.94 | 97.02 | 91.28 |
| 2012 | ||||
| 1st Quarter | 41.00 | 31.40 | 33.96 | 26.10 |
| 2nd Quarter | 40.73 | 34.74 | 33.75 | 27.60 |
| 3rd Quarter | 37.97 | 32.47 | 30.83 | 27.23 |
| 4th Quarter | 34.86 | 31.40 | 29.44 | 26.10 |
| 2013 | ||||
| 1st Quarter | 36.23 | 33.41 | 30.59 | 28.34 |
| 2nd Quarter | 33.49 | 28.20 | 28.31 | 21.93 |
| 3rd Quarter | 33.49 | 27.62 | 26.79 | 21.56 |
| 4th Quarter | 33.15 | 28.21 | 26.20 | 21.38 |
| Monthly Price History | ||||
| Oct-13 | 33.15 | 30.84 | 26.20 | 24.45 |
| Nov-13 | 31.16 | 28.86 | 24.37 | 22.24 |
| Dec-13 | 30.46 | 28.21 | 23.57 | 21.38 |
| Jan-14 | 30.66 | 26.81 | 23.13 | 19.35 |
| Feb-14 | 30.49 | 27.19 | 22.26 | 19.34 |
| Mar-14 | 32.10 | 29.96 | 23.44 | 20.93 |
| Apr-14 (through April 29, 2014) | 34.17 | 31.59 | 24.52 | 23.02 |
| Santiago Stock Exchange | NYSE | |||||||||||||||||
| Common Stock | ADS(2) | |||||||||||||||||
| High | Low | High | Low | |||||||||||||||
| (Ch$ per share(1)) | (U.S.$ per ADS) | |||||||||||||||||
| Annual Price History | ||||||||||||||||||
| 2011 | 43.65 | 31.94 | 99.44 | 59.40 | ||||||||||||||
| 2012 | 41.01 | 31.40 | 33.96 | 26.10 | ||||||||||||||
| 2013 | 36.23 | 27.62 | 30.59 | 21.38 | ||||||||||||||
| 2014 | 37.32 | 26.81 | 26.91 | 19.19 | ||||||||||||||
| 2015 | 34.77 | 29.52 | 22.61 | 17.38 | ||||||||||||||
| Quarterly Price History | ||||||||||||||||||
| 2014 | ||||||||||||||||||
| 1st Quarter | 32.10 | 26.81 | 23.57 | 19.34 | ||||||||||||||
| 2nd Quarter | 37.21 | 31.98 | 26.85 | 23.02 | ||||||||||||||
| 3rd Quarter | 37.32 | 33.05 | 26.91 | 21.85 | ||||||||||||||
| 4th Quarter | 34.08 | 29.74 | 22.91 | 21.19 | ||||||||||||||
| 2015 | ||||||||||||||||||
| 1st Quarter | 33.98 | 29.52 | 21.71 | 19.02 | ||||||||||||||
| 2nd Quarter | 34.77 | 31.71 | 22.61 | 20.02 | ||||||||||||||
| 3rd Quarter | 34.51 | 31.44 | 21.04 | 17.88 | ||||||||||||||
| 4th Quarter | 33.96 | 30.33 | 20.23 | 17.38 | ||||||||||||||
| Monthly Price History | ||||||||||||||||||
| Oct-15 | 33.96 | 31.46 | 20.23 | 18.11 | ||||||||||||||
| Nov-15 | 33.25 | 31.70 | 19.27 | 17.89 | ||||||||||||||
| Dec-15 | 32.46 | 30.33 | 18.59 | 17.38 | ||||||||||||||
| Jan-16 | 31.17 | 29.10 | 17.62 | 15.98 | ||||||||||||||
| Feb-16 | 31.25 | 29.43 | 17.78 | 16.47 | ||||||||||||||
| Mar-16 | 33.47 | 30.79 | 19.74 | 17.78 | ||||||||||||||
| Apr-16 (until April 28, 2016) | 33.89 | 31.93 | 20.24 | 19.11 | ||||||||||||||
| B. | Plan of Distribution |
Not applicable
| C. | Nature of Trading Market |
Nature of Trading Market
Shares of our common stock are traded on the Chilean Stock Exchanges. Each ADS represents 400 shares of common stock. ADRs have been issued pursuant to the Deposit Agreement, dated as of August 4, 2008, among Santander-Chile, the Depositary and all holders from time to time of ADRs. On October 22, 2012, this agreement was amended and the number of shares per ADS was changed from 1,039 to 400 shares. As of December 31, 2013, 75,218,321 ADSs2015, 78,425,011ADSs were outstanding (equivalent to 30,087,328,47131,370,004,471 shares of common stock or 15.97%16.66% of the total number of issued shares of common stock).
| D. | Selling Shareholders |
Not applicable.
| E. | Dilution |
Not applicable.
| F. | Expenses of the Issue |
Not applicable.
151
ITEM 10. ADDITIONAL INFORMATION
| A. | Share Capital |
Not applicable.
| B. | Memorandum and Articles of Association |
The legal predecessor of Santander-Chile was Banco Santiago (Santiago). Santiago was incorporated by public deed dated September 7, 1977 granted at the Notary Office of Alfredo Astaburuaga Gálvez. Santiago received its permission to incorporate and function as a bank by Resolution No. 118 of the SBIF on October 27, 1977. The Bank’s by-laws were approved by Resolution No. 103 of the SBIF on September 22, 1977. In January 1997, Santiago merged with Banco O’Higgins’ with Santiago as the surviving entity. In 1999, Santiago became a controlled subsidiary of Santander Spain.
On May 24, 2007, we changed our by-laws as our official name to Banco Santander-Chile (formerly: Banco Santander Chile) and that the Bank may also use the following names: Banco Santander Santiago, Santander Santiago, Banco Santander, or Santander (formerly only: Banco Santander Santiago and Santander Santiago).
Shareholder rights in a Chilean bank that is also an open stock (public) corporation are governed by (1) the corporation’sestatutos, which effectively serve the purpose of both the articles or certificate of incorporation and the by-laws of a company incorporated in the United States, (2) the General Banking Law and (3) to the extent not inconsistent with the General Banking Law, by the provisions of Chilean Companies Law applicable to open stock corporations, except for certain provisions that are expressly excluded. Article 137 of the Chilean Companies Law provides that all provisions of the Chilean Companies Law take precedence over any contrary provision in a corporation’sestatutos. Both the Chilean Companies Law and ourestatutos provide that legal actions by shareholders against us (or our officers or directors) to enforce their rights as shareholders or by one shareholder against another in their capacity as such are to be brought in Chile in arbitration proceedings, notwithstanding the plaintiff’s right to submit the action to the ordinary courts of Chile.
The Chilean securities markets are principally regulated by the Superintendency of Securities and Insurance under the Chilean Securities Market Law and the Chilean Companies Law. In the case of banks, compliance with these laws is supervised by the SBIF. These two laws provide for disclosure requirements, restrictions on insider trading and price manipulation and protection of non-controlling investors. The Chilean Securities Market Law sets forth requirements relating to public offerings, stock exchanges and brokers, and outlines disclosure requirements for companies that issue publicly offered securities. The Chilean Companies Law sets forth the rules and requirements for establishing open stock corporations while eliminating government supervision of closed (closely-held) corporations. Open stock (public) corporations are those with 500 or more shareholders, or companies in which 100 or more shareholders own at least 10.0% of the subscribed capital (excluding those whose individual holdings exceed 10.0%), and all other companies that are registered in the Securities Registry of the Superintendency of Securities and Insurance.
Santander-Chile is a bank providing a broad range of commercial and retail banking services, as well as a variety of financial services. Our objects and purposes can be found in Article 4 of our estatutos.
Board of Directors
The Board of Directors has 11 regular members and 2 alternate members, elected by shareholder vote at General Shareholders’ Meetings. The directors may be either shareholders or non-shareholders of the Company. There is no age limit for directors.
A director remains in office for three years and may be reelected indefinitely. If for any reason, the General Shareholders’ Meeting where the newly appointments of directors are to be made is not held, the duties of those serving as such shall be extended until their replacements are designated, in which case, the Board of Director shall convene a Meeting at the earliest possible time in order to effect the appointments.
The directors are entitled to compensation for the performance of their duties. The amount of their compensation is determined annually by the General Shareholders’ Meeting. In addition, payments in the form of wages, fees, travel accounts, expense accounts, dues as representatives of the Board of Directors and other cash
payments, payments in kind or royalties of any sort whatsoever, may be paid to certain directors for the performance of specific duties or tasks in addition to their functions as directors imposed upon them specifically by the General Shareholders’ Meeting. Any special compensation is authorized or approved at the General Shareholders’ Meeting, and for that purpose, a detailed and separate entry shall be made in the Annual Report, which shall expressly indicate the complete name of each of the directors receiving special compensation.
Without prejudice to any other incapacity or incompatibility established by law, the following may not be directors: (a) those persons who have been sentenced or are being tried, either as principals or accessories, for crimes punishable with a penalty of temporary or permanent suspension from or incapacity to hold public office; (b) those persons who have been declared bankrupt and have not been rehabilitated; (c) members of the House of Representatives and the Senate; (d) directors or employees of any other financial institution; employees appointed by the President of the Republic and employees or officers of (i) the State, (ii) any public service, public institution, semi-public institution, autonomous entity or state-controlled company (any such entity a “Public Entity”) or (iii) any enterprise, corporation or public or private entity in which the State or a Public Entity has a majority interest, has made capital contributions, or is represented or participating, provided that persons holding positions in teaching activities in any of the above entities may be directors; and (f) the Bank’s employees, which shall not prevent a director from holding on a temporary basis and for a term not to exceed ninety days the position of General Manager. Chief Executive Officers may not be elected as directors.
For purposes of the appointment of directors, each shareholder shall have the right to one vote per share for purposes of appointing a single person, or to distribute his votes in between candidates as he may deem convenient, and the persons obtaining the largest number of votes in the same and single process shall be awarded positions, until all positions have been filled. The election of the regular and alternate board members shall be carried out separately. For purposes of the casting of the vote, the Chairman and the Secretary, together with any other persons that may have been previously designated by the Meeting to sign the minutes thereof, shall issue a certificate giving evidence of the oral votes of shareholders attending, following the order of the list of attendance being taken.
Each shareholder shall be entitled, however, to cast his vote by means of a ballot signed by him, stating whether he signs for his own account or as a representative. This entitlement notwithstanding, in order to expedite the voting process, the Chairman of the Bank or the Superintendency, as the case may be, is entitled to order that the vote be taken alternatively or by oral vote or by means of ballots. At the time of polling, the Chairman may instruct that the votes be read aloud, in order for those in attendance to count for themselves the number of votes issued and verify the outcome of the voting process.
The Secretary tabulates the votes and the Chairman announces those who have obtained the largest majorities until all the director positions have been filled. The Secretary places the documents evidencing the outcome of the count, duly signed by the persons charged with the duty of verifying the number of votes issued, together with the ballots delivered by the shareholders who did not vote orally, in an envelope which shall be closed and sealed with the corporate seal and shall remain deposited with the Bank for a least two years.
Every appointment of directors, or any changes in the appointment of directors, shall be transcribed into a public deed before a notary public, published in a newspaper of Santiago and notified to the SBIF and Financial Institutions, by means of the filing of a copy of the respective public deed. Likewise, the appointments of General Manager, Manager and Deputy Managers shall be communicated and transcribed into a public deed.
If a director ceases to be able to perform his or her duties, whether by reason of conflict of interest, limitation, legal incapacity or bankruptcy, impossibility, resignation or any other legal cause, the vacancy shall be filled as follows: (a) the positions of regular directors shall be filled by an alternate director; and (b) the positions of alternate directors vacated upon the application of (a) above, and the positions of regular directors if a regular director’s position cannot be filled pursuant to clause (a) because both alternate members have already become regular members, shall be filled by the Board of Directors on its first meeting after the vacancy occurs. Board members appointed pursuant to clause (b) will remain in the position until the next General Shareholders’ Meeting, where the appointment may be ratified, in which case, the replacement director will remain in his or her position until the expiration of the term of the director he or she replaced.
The alternate directors may temporarily replace regular directors in case of their absence or temporary inability to attend a board meeting, or in a definitive manner in case of vacancy. The alternate board members are always
entitled to attend and speak at board meetings. They will be entitled to vote at such meetings only when a regular member is absent and such alternate member acts as the absent member’s replacement.
During the first meeting following the General Shareholders’ Meeting, the Board of Directors shall elect in separate votes from among its members, a Chairman, a First Vice Chairman and a Second Vice Chairman. In the event of a tie, the appointment shall be decided by lottery.
The Board of Directors meet, in ordinary sessions at least once a month, held on pre-set dates and times determined by the Board. Extraordinary meetings are held whenever called by the Chairman, whether at his own will or upon the request of three or more directors, so long as the Chairman determines in advance that the meeting is justified, except if the request is made by the absolute majority of the directors in office, in which case the meeting shall be held without such prior determination. The extraordinary meetings may only address those matters specifically included in the agenda for the extraordinary meeting, except that, if the meeting is attended by all the directors in office, they may agree otherwise by a unanimous vote. Extraordinary meetings shall be called by means of a written instrument signed by the Chairman or the Secretary or his alternate and delivered to each of the directors at least three days prior to the date set for the meeting.
The quorum for the Board of Directors’ Meeting is six of its members. Resolutions shall be adopted by the affirmative vote of the absolute majority of the attending directors. In the event of a tie, the person acting as the Chairman of the meeting shall cast a deciding vote.
Directors having a vested interest in a negotiation, act, contract or transaction that is not related to the bank business, either as principal or as representative of another person, shall communicate such fact to the other directors. If the respective resolutions are approved by the Board, it shall be in accordance to the prevailing fair market conditions and director’s interest must be disclosed at the next General Shareholders’ Meeting.
The discussions and resolutions of the Board of Directors shall be recorded in a special book of minutes maintained by the Secretary. The relevant minutes shall be signed by the directors attending the meeting and by the Secretary, or his alternate. If a director determines that the minutes for a meeting are inaccurate or incomplete, he is entitled to record an objection before actually signing the minutes. The resolutions adopted may be carried out prior to the approval of the minutes at a subsequent meeting. In the event of death, refusal or incapacity for any reason of any of the directors attending to sign the minutes, such circumstance shall be recorded at the end of the minutes stating the reason for the impediment.
The directors are personally liable for all of the acts they effect in the performance of their duties. Any director who wishes to disclaim responsibility for any act or resolution of the Board of Directors must to record his opposition in the minutes, and the Chairman must report the opposition at the following General Shareholders’ Meeting.
The Board of Directors will represent the Bank in and out of court and, for the performance of the Bank’s business, a circumstance that will not be necessary to prove before third parties, it will be empowered with all the authorities and powers of administration that the law or the by-laws do not set as exclusive to the General Shareholders’ Meeting, without being necessary to grant any special power of attorney, even for those acts that the law requires to do so. This provision is notwithstanding the judicial representation of the Bank that is part of the General Manager’s authorities. The Board of Directors may delegate part of its authority to the General Manager, to the Managers, Deputy Managers or Attorneys of the Bank, a Director, a Commission of Directors, and for specifically determined purposes, in other persons.
Meetings and Voting Rights
An ordinary annual meeting of shareholders is held within the first four months of each year. The ordinary annual meeting of shareholders is the corporate body that approves the annual financial statements, approves all dividends in accordance with the dividend policy determined by our Board of Directors, elects the Board of Directors and approves any other matter that does not require an extraordinary shareholders’ meeting. The last ordinary annual meeting of our shareholders was held on April 22, 2014.26, 2016. Extraordinary meetings may be called by our Board of Directors when deemed appropriate, and ordinary or extraordinary meetings must be called by our Board of Directors when requested by shareholders representing at least 10.0% of the issued voting shares or by the SBIF. Notice to convene the ordinary annual meeting or an extraordinary meeting is given by means of three notices which must be published in a newspaper of our corporate domicile (currently Santiago) or in the Official Gazette in
a prescribed manner, and the first notice must be published not less than 15 days nor more than 20 days in advance of the scheduled meeting. Notice must also be mailed 15 days in advance to each shareholder and given to the SBIF and the Chilean Stock Exchanges. Currently, we publish our official notices in the El Mercurio newspaper of Santiago.
The quorum for a shareholders’ meeting is established by the presence, in person or by proxy, of shareholders representing at least an absolute majority of the issued shares. If a quorum is not present at the first meeting, the meeting can be reconvened (in accordance with the procedures described in the previous paragraph) and, upon the meeting being reconvened, shareholders present at the reconvened meeting are deemed to constitute a quorum regardless of the percentage of the shares represented. The shareholders’ meetings pass resolutions by the affirmative vote of an absolute majority of those voting shares present or represented at the meeting. The vote required at any shareholders’ meeting to approve any of the following actions, however, is a two-thirds majority of the issued shares:
| · | a change in corporate form, spin-off or merger; |
| · | an amendment of the term of existence, if any, and the early dissolution of the bank; |
| · | a change in corporate domicile; |
| · | a decrease of corporate capital previously approved by the SBIF, provided it is not reduced below the legal minimum capital; |
| · | a decrease in the number of directors previously approved by the SBIF; |
| · | the approval of contributions and appraisal of properties other than cash, in those cases where it is permitted by the General Banking Act; |
| · | the amendment of authority of the general shareholders’ meeting or the restriction of the authority of the Board of Directors; |
| · | the transfer of 50.0% or more of the corporate assets, regardless of whether it includes liabilities, or the implementation or amendment of any business plan that contemplates the transfer of 50.0% or more of the corporate assets; |
| · | a change in the manner of distribution of profits established in the by-laws; |
| · | any non-cash distribution in respect of the shares; |
| · | the repurchase of shares of stock in the Bank; or |
| · | the approval of material related-party transactions when requested by shareholders representing at least 5.0% of the issued and outstanding shares with right to vote if they determine that the terms and conditions of those transactions are not favorable to the interests of the bank or if two independent assessments of those transactions requested by the Board materially differ from each other. |
Shareholders may accumulate their votes for the election of directors and cast all of their votes in favor of one person.
In general, Chilean law does not require a Chilean open stock corporation to provide the level and type of information that U.S. securities laws require a reporting company to provide to its shareholders in connection with a solicitation of proxies. However, shareholders are entitled to examine the books of the bank within the 15-day period before the ordinary annual meeting. Under Chilean law, a notice of a shareholders’ meeting listing matters to be addressed at the meeting must be mailed not fewer than 15 days prior to the date of such meeting, and, in cases of an ordinary annual meeting, shareholders holding a prescribed minimum investment must be sent an Annual Report of the bank’s activities which includes audited financial statements. Shareholders who do not fall into this category but who request it must also be sent a copy of the bank’s Annual Report. In addition to these requirements, we regularly provide, and management currently intends to continue to provide, together with the notice of shareholders’ meeting, a proposal for the final annual dividend.
The Chilean Corporations Law provides that whenever shareholders representing 10.0% or more of the issued voting shares so request, a Chilean company’s Annual Report must include, in addition to the materials provided by the Board of Directors to shareholders, such shareholders’ comments and proposals in relation to the company’s affairs. Similarly, the Chilean Corporations Law provides that whenever the Board of Directors of an open stock corporation convenes an ordinary shareholders’ meeting and solicits proxies for that meeting, or distributes information supporting its decisions, or other similar material, it is obligated to include as an annex to its Annual Report any pertinent comments and proposals that may have been made by shareholders owning 10.0% or more of the company’s voting shares who have requested that such comments and proposals be so included.
Only shareholders registered as such with us on the fifth business day prior to the date of a meeting are entitled to attend and vote their shares. A shareholder may appoint another individual (who need not be a shareholder) as his proxy to attend and vote on his behalf. Every shareholder entitled to attend and vote at a shareholders’ meeting has one vote for every share subscribed. Each share represents one vote and there are no special classes of shares with different rights. Our by-laws do not include any condition that is more significant than required by law to change the right of shareholders.
Capitalization
Under Chilean law, the shareholders of a company, acting at an extraordinary shareholders’ meeting, have the power to authorize an increase in such company’s capital. When an investor subscribes for issued shares, the shares are registered in such investor’s name, even if not paid for, and the investor is treated as a shareholder for all purposes except with regard to receipt of dividends and the return of capital, provided that the shareholders may, by amending the by-laws, also grant the right to receive dividends or distributions of capital. The investor becomes eligible to receive dividends and returns of capital once it has paid for the shares (if it has paid for only a portion of such shares, it is entitled to reserve a corresponding pro-rata portion of the dividends declared and/or returns of capital with respect to such shares unless the company’s by-laws provide otherwise). If an investor does not pay for shares for which it has subscribed on or prior to the date agreed upon for payment, the company is entitled under Chilean law to auction the shares on the stock exchange and collect the difference, if any, between the subscription price and the auction proceeds. However, until such shares are sold at auction, the subscriber continues to exercise all the rights of a shareholder (except the right to receive dividends and return of capital).
Article 22 of the Chilean Corporations Law states that the purchaser of shares of a company implicitly accepts its by-laws and any agreements adopted at shareholders’ meetings.
Approval of Financial Statements
Our Board of Directors is required to submit our audited financial statements to the shareholders annually for their approval. The approval or rejection of such financial statements is entirely within our shareholders’ discretion. If our shareholders reject our financial statements, our Board of Directors must submit new financial statements not later than 60 days from the date of such rejection. If our shareholders reject our new financial statements, our entire Board of Directors is deemed removed from office and a new Board of Directors is elected at the same meeting. Directors who individually approved such rejected financial statements are disqualified for re-election for the ensuing period.
Registrations and Transfers
We act as our own registrar and transfer agent, as is customary among Chilean companies. In the case of jointly owned shares, an attorney-in-fact must be appointed to represent the joint owners in dealings with us.
Dividend, Liquidation and Appraisal Rights
Under the Chilean Corporations Law, Chilean companies are generally required to distribute at least 30.0% of their earnings as dividends.
In the event of any loss of capital, no dividends can be distributed so long as such loss is not recovered. Also, no dividends of a bank above the legal minimum can be distributed if doing so would result in the bank exceeding its ratio of risk-weighted assets to regulatory capital or total assets.
Dividends that are declared but not paid by the date set for payment at the time of declaration are adjusted from the date set for payment to the date such dividends are actually paid, and they accrue interest.
We may declare a dividend in cash or in shares. When a share dividend is declared above the legal minimum (which minimum must be paid in cash), our shareholders must be given the option to elect to receive cash. Our ADS holders may, in the absence of an effective registration statement under the Securities Act or an available exemption from the registration requirement thereunder, effectively be required to receive a dividend in cash. See “Item 10. B.—Memorandum and Articles of Association—Preemptive Rights and Increases of Share Capital.” A dividend entitlement lapses after 5 years and the funds go to the Chilean Treasury.
In the event of our liquidation, the holders of fully paid shares would participate equally and pro rata, in proportion to the number of paid-in shares held by them, in the assets available after payment of all creditors. The holders of fully paid shares would not be required to contribute additional capital to the Bank in the event of our liquidation.
In accordance with the General Banking Law, our shareholders do not have appraisal rights.
Ownership Restrictions
Under Article 12 of the Chilean Securities Market Law and the regulations of the SBIF, shareholders of open stock corporations are required to report the following to the Superintendency of Securities and Insurance and the Chilean Stock Exchanges:
| · | any direct or indirect acquisition or sale of shares that results in the holder’s acquiring or disposing, directly or indirectly, 10.0% or more of an open stock corporation’s share capital; and |
| · | any direct or indirect acquisition or sale of shares or options to buy or sell shares, in any amount, if made by a holder of 10.0% or more of an open stock corporation’s capital or if made by a director, liquidator, main officer, general manager or manager of such corporation. |
In addition, majority shareholders must include in their report whether their purpose is to acquire control of the company or if they are making a financial investment. A beneficial owner of ADSs representing 10.0% or more of our share capital will be subject to these reporting requirements under Chilean law.
Under Article 54 of the Chilean Securities Market Law and the regulations of the Superintendency of Securities and Insurance, persons or entities intending to acquire control, directly or indirectly, of an open stock corporation, regardless of the acquisition vehicle or procedure, and including acquisitions made through direct subscriptions or private transactions, are also required to inform the public of such acquisition at least 10 business days before the date on which the transaction is to be completed, but in any case, as soon as negotiations regarding the change of control begin (i.e., when information and documents concerning the target are delivered to the potential acquiror)acquirer) through a filing with the Superintendency of Securities and Insurance, the stock exchanges and the companies controlled by and that control the target and through a notice published in two Chilean newspapers, which notice must disclose, among other information, the person or entity purchasing or selling and the price and conditions of any negotiations.
Prior to such publication, a written communication to such effect must be sent to the target corporation, to the controlling corporation, to the corporations controlled by the target corporation, to the Superintendency of Securities and Insurance, and to the Chilean stock exchanges on which the securities are listed.
In addition to the foregoing, Article 54A of the Chilean Securities Market Law requires that within two business days of the completion of the transactions pursuant to which a person has acquired control of a publicly traded company, a notice shall be published in the same newspapers in which the notice referred to above was published and notices shall be sent to the same persons mentioned in the preceding paragraphs.
The provisions of the aforementioned articles do not apply whenever the acquisition is being made through a tender or exchange offer.
Title XXV of the Chilean Securities Market Law on tender offers and the regulations of the Superintendency of Securities and Insurance provide that the following transactions must be carried out through a tender offer:
| · | an offer which allows a person to take control of a publicly traded company, unless (i) the shares are being sold by a controlling shareholder of such company at a price in cash which is not substantially higher than the market price and the shares of such company are actively traded on a stock exchange and (ii) those shares are acquired (a) through a capital increase, (b) as a consequence of a merger, (c) by inheritance or (d) through a forced sale; and |
| · | an offer for a controlling percentage of the shares of a listed company if such person intends to take control of the parent company (whether listed or not) of such listed company, to the extent that the listed company represents 75.0% or more of the consolidated net worth of the parent company. |
In addition, Article 69bis of the Companies Law requires that whenever a controlling shareholder acquires two thirds of the voting shares of a listed company, such controlling shareholder must offer to purchase the remaining shares from the non-controlling shareholders in a tender offer.
Article 200 of the Chilean Securities Market Law prohibits any shareholder that has taken control of a publicly traded company to acquire, for a period of 12 months from the date of the transaction in which it gained control of the publicly traded company, a number of shares equal to or greater than 3.0% of the outstanding issued shares of the target without making a tender offer at a price per share not lower than the price paid at the time of taking control. Should the acquisition from the other shareholders of the company be made on a stock exchange and on a pro rata basis, the controlling shareholder may purchase a higher percentage of shares, if so permitted by the regulations of the stock exchange.
Title XV of the Chilean Securities Market Law sets forth the basis to determine what constitutes a controlling power, a direct holding and a related party. The Chilean Securities Market Law defines control as the power of a person or group of persons acting (either directly or through other entities or persons) pursuant to a joint action agreement, to direct the majority of the votes at the shareholders’ meetings of the corporation, to elect the majority of members of its Board of Directors, or to influence the management of the corporation significantly. Significant influence is deemed to exist in respect of the person or group of persons with an agreement to act jointly that holds, directly or indirectly, at least 25.0% of the voting share capital, unless:
| · | another person or group of persons acting pursuant to joint action agreement, directly or indirectly, controls a stake equal to or greater than the percentage controlled by such person or group of persons; |
| · | the person or group does not control, directly or indirectly, more than 40.0% of the voting share capital and the percentage controlled is lower than the sum of the shares held by other shareholders holding more than 5.0% of the share capital (either directly or pursuant to a joint action agreement); or |
| · | in cases where the Superintendency of Securities and Insurance has ruled otherwise, based on the distribution or atomization of the overall shareholding. |
According to the Chilean Securities Market Law, a joint action agreement is an agreement among two or more parties which, directly or indirectly, own shares in a corporation at the same time and whereby they agree to participate with the same interest in the management of the corporation or in taking control of the same. The law presumes that such an agreement exists between:
| · | a principal and its agents; |
| · | spouses and relatives within certain degrees of kinship; |
| · | entities within the same business group; and |
| · | an entity and its controller or any of the members of the controller. |
Likewise, the Superintendency of Securities and Insurance may determine that a joint action agreement exists between two or more entities considering, among other things, the number of companies in which they participate
and the frequency with which they vote identically in the election of directors, appointment of managers and other resolutions passed at extraordinary shareholders’ meetings.
According to Article 96 of the Chilean Securities Market Law, a business group is a group of entities with such ties in their ownership, management or credit liabilities that it may be assumed that the economic and financial action of such members is directed by, or subordinated to, the joint interests of the group, or that there are common credit risks in the credits granted to, or in the acquisition of securities issued by, them. According to the Chilean Securities Market Law, the following entities are part of the same business group:
| · | a company and its controller; |
| · | all the companies with a common controller together with that controller; |
| · | all the entities that the Superintendency of Securities and Insurance declares to be part of the business group due to one or more of the following reasons: |
| · | a substantial part of the assets of the company is involved in the business group, whether as investments in securities, equity rights, loans or guaranties; |
| · | the company has a significant level of indebtedness and the business group has a material participation as a lender or guarantor; |
| · | any member of a group of controlling entities of a company mentioned in the first two bullets above and there are grounds to include it in the business group; or |
| · | the company is controlled by a member of a group of controlling entities and there are grounds to include it in the business group. |
Article 36 of the General Banking Law states that as a matter of public policy, no person or company may acquire, directly or indirectly, more than 10.0% of the shares of a bank without the prior authorization of the SBIF, which may not be unreasonably withheld. The prohibition would also apply to beneficial owners of ADSs. In the absence of such authorization, any person or group of persons acting in concert would not be permitted to exercise voting rights with respect to the shares or ADSs acquired. In determining whether or not to issue such an authorization, the SBIF considers a number of factors enumerated in the General Banking Law, including the financial stability of the purchasing party.
According to Article 35bis of the General Banking Law, the prior authorization of the SBIF is required for:
| · | the merger of two or more banks; |
| · | the acquisition of all or a substantial portion of a banks’ assets and liabilities by another bank; |
| · | the control by the same person, or controlling group, of two or more banks; or |
| · | a substantial increase in the existing control of a bank by a controlling shareholder of that bank. |
This prior authorization is only required when the acquiring bank or the resulting group of banks would own a significant market share in loans, defined by the SBIF to be more than 15.0% of all loans in the Chilean banking system. The intended purchase, merger or expansion may be denied by the SBIF; or, if the acquiring bank or resulting group would own a market share in loans determined to be more than 20.0% of all loans in the Chilean banking system, the purchase, merger, or expansion may be conditioned on one or more of the following:
| · | the bank or banks maintaining regulatory capital higher than 8.0% and up to 14.0% of risk-weighted assets; |
| · | the technical reserve established in Article 65 of the General Banking Law being applicable when deposits exceed one and a half times the resulting bank’s paid-in capital and reserves; or |
| · | the margin for interbank loans be reduced to 20.0% of the resulting bank’s regulatory capital. |
If the acquiring bank or resulting group would own a market share in loans determined by the SBIF to be more than 15% but less than 20%, the authorization will be conditioned on the bank or banks maintaining a regulatory capital not lower than 10% of their risks weighted assets for the period specified by the SBIF, which may not be less
than one year. The calculation of the risk weighted assets is based on a five category risk classification system applied to a bank’s assets that is based on the Basel Committee recommendations.
According to the General Banking Law, a bank may not grant loans to related parties on terms more favorable than those generally offered to non-related parties. Article 84 No. 2 of the General Banking Law and the regulations issued by the SBIF creates the presumption that natural persons who are holders of shares and who beneficially own more than 1.0% of the shares are related to the bank and imposes certain restrictions on the amounts and terms of loans made by banks to related parties. This presumption would also apply to beneficial owners of ADSs representing more than 1.0% of the shares. Finally, according to the regulations of the SBIF, Chilean banks that issue ADSs are required to inform the SBIF if any person, directly or indirectly, acquires ADSs representing 5.0% or more of the total amount of shares of capital stock issued by such bank.
Article 16bis of the General Banking Law provides that the individuals or legal entities that, individually or with other people, directly control a bank and who individually own more than 10.0% of its shares must send to the SBIF reliable information on their financial situation in the form and in the opportunity set forth in Resolution No. 3,156 of the SBIF.
There are no limitations for non-resident or foreign shareholders to hold or exercise voting rights on the securities.
Preemptive Rights and Increases of Share Capital
The Chilean Corporations Law provides that whenever a Chilean company issues new shares for cash, it must offer its existing shareholders the right to purchase a number of shares sufficient to maintain their existing ownership percentages in the company. Pursuant to this requirement, preemptive rights in connection with any future issue of shares will be offered by us to the Depositary as the registered owner of the shares underlying the ADRs. However, the Depositary will not be able to make such preemptive rights available to holders of ADSs unless a registration statement under the Securities Act is effective with respect to the underlying shares or an exemption from the registration requirements thereunder is available.
We intend to evaluate, at the time of any preemptive rights offering, the practicality under Chilean law and Central Bank regulations in effect at the time of making such rights available to our ADS holders, as well as the costs and potential liabilities associated with registration of such rights and the related shares of common stock under the Securities Act, and the indirect benefits to us of thereby enabling the exercise by all or certain holders of ADSs of their preemptive rights and any other factors we consider appropriate at the time, and then to make a decision as to whether to file such registration statement. We cannot assure you that any registration statement would be filed. If we do not file a registration statement and no exemption from the registration requirements under the Securities Act is available, the Depositary will sell such holders’ preemptive rights and distribute the proceeds thereof if a premium can be recognized over the cost of such sale. In the event that the Depositary is not able, or determines that it is not feasible, to sell such rights at a premium over the cost of any such sale, all or certain holders of ADSs may receive no value for such rights. Non-U.S. holders of ADSs may be able to exercise their preemptive rights regardless of whether a registration statement is filed. The inability of all or certain holders of ADSs to exercise preemptive rights in respect of shares of common stock underlying such ADSs could result in such holders not maintaining their percentage ownership of the common stock following such preemptive rights offering unless such holder made additional market purchases of ADSs or shares of common stock.
Under Chilean law, preemptive rights are exercisable or freely transferable by shareholders during a period that cannot be less than 30 days following the grant of such rights. During such period, and for an additional 30-day period thereafter, a Chilean corporation is not permitted to offer any unsubscribed shares for sale to third parties on terms which are more favorable than those offered to its shareholders. At the end of such additional 30-day period, a Chilean open stock corporation is authorized to sell unsubscribed shares to third parties on any terms, provided they are sold on a Chilean stock exchange. Unsubscribed shares that are not sold on a Chilean stock exchange can be sold to third parties only on terms no more favorable for the purchaser than those offered to shareholders.
| C. | Material Contracts |
During the past two years, Santander-Chile waswe were not a party to any material contract outside itsthe ordinary course of business that was material to the Santander Group as a whole.business.
| D. | Exchange Controls |
The Central Bank is responsible for, among other things, monetary policies and exchange controls in Chile. Appropriate registration of a foreign investment in Chile grants the investor access to the Formal Exchange Market. See “Item 3. Key Information—A. Selected Financial Data—Exchange Rates.” Foreign investments can be registered with the Foreign Investment Committee under Decree Law No. 600 or can be registered with the Central Bank under the Central Bank Act. The Central Bank Act is an organic constitutional law requiring a “special majority” vote of the Chilean Congress to be amended. Since April 18, 2001, all exchange controls in Chile have been eliminated.
Previously, Chilean law mandated that holders of shares of Chilean companies that were not residents of Chile register as foreign investors under one of the foreign investment regimes contemplated by Chilean law in order to receive dividends, sale proceeds or other amounts with respect to their shares remitted outside Chile through the Formal Exchange Market. Under the Foreign Investment Contract (as defined herein), the Depositary, on behalf of ADS holders, is granted access to the Formal Exchange Market to convert cash dividends from Chilean pesos to U.S. dollars and to pay such U.S. dollars to ADS holders outside Chile, net of taxes, and no separate registration by ADR holders is required. As of April 19, 2001, the Central Bank deregulated the Exchange Market, eliminating the need to obtain approval from the Central Bank in order to remit dividends, but at the same time eliminating the possibility of guaranteeing access to the Formal Exchange Market. However, this did not affect the current Foreign Investment Contract, which was signed prior to April 19, 2001, and which still permits access to the Formal Exchange Market based on the prior approval of the Central Bank. Therefore the holders of ADRs of Santander-Chile are still subject to the Foreign Investment Contract, including its clauses referring to the prior exchange rules including the now extinct Chapter XXVI of the Compendium.
| E. | Taxation |
The following discussion summarizes certain Chilean tax and United States federal income tax consequences to beneficial owners arising from the ownership and disposition of our common stock or ADSs. The summary does not purport to be a comprehensive description of all potential Chilean and United States federal income tax considerations that may be relevant to a decision to own or dispose of our common stock or ADSs and is not intended as tax advice to any particular investor. This summary does not describe any tax consequences arising under the laws of any state, locality or other taxing jurisdiction other than Chile and the United States. There is currently no income tax treaty between the United States and Chile. However, the U.S. government and the government of Chile signed on February 4, 2010 the Proposed Income Tax Treaty between the United States of America and the Republic of Chile (the “Proposed U.S.-Chile Treaty”), which is now subject to ratification by the U.S. Senate and Chilean CongressCongress. If the Proposed U.S.-Chile Treaty becomes effective, U.S. investors should consult their tax advisers as to the applicability of the treaty in their particular circumstances.
Material Tax Consequences of Owning Shares of Our Common Stock or ADSs
Chilean Taxation
The following is a summary of certain Chilean tax consequences of the ownership and disposition of shares of our common stock or of ADSs evidenced by ADRs by Foreign Holders (as defined herein). The summary does not purport to be a comprehensive description of all of the tax considerations that may be relevant to a decision to own or dispose shares of our common stock or ADSs and does not purport to address the tax consequences applicable to all categories of investors, some of whom may be subject to special rules. Holders of shares of our common stock or ADSs are advised to consult their tax advisers concerning the Chilean and other tax consequences of the ownership and disposition of shares of our common stock or of ADSs evidenced by ADRs.
The description of Chilean tax laws set forth below is based on Chilean laws in force as of the date of this Annual Report and is subject to any changes in such laws occurring after the date of this Annual Report. These changes can be made on a retroactive basis, but may not be used retroactively against taxpayers who acted in good faith relying on regulations or interpretations that were in force at that moment.
For purposes of this summary, the term “Foreign Holder” means either (1) in the case of an individual, a person who is not resident or domiciled in Chile; or (2) in the case of a legal entity, a legal entity that is not organized under the laws of Chile, unless the shares of our common stock or ADSs are assigned to a branch or a permanent establishment of such entity in Chile. For purposes of Chilean taxation, (a) an individual holder is resident in Chile
if he or she has remained in Chile for more than six months in one calendar year, or a total of more than six months in two consecutive fiscal years, and (b) an individual is domiciled in Chile if he or she resides in Chile with the actual or presumptive intent of staying in Chile.(intentionChile (intention that can be evidenced by circumstances such as the acceptance of an employment in Chile or the relocation of one´sone’s family to Chile).
The Income Tax Law provides that a Foreign Holder is subject to income taxes on his/her incomes of Chilean sources. For thisthese purposes, Chilean source income means earnings from activities performed within Chilean territory or from sale, disposition or other transactions in connection with assets or goods located in Chile. Indirect sale regulations may also attribute sourced Chilean income.
Taxation of Dividends
Cash dividends paid by us with respect to shares of our common stock held by a Foreign Holder, including shares represented by ADSs, will be subject to a 35% Chilean Withholding Tax, which is withheld and paid over by us (the “Withholding Tax”). If we have paid Corporate Income Tax (the “First Category Tax”) on the income from which the dividend is paid, a credit for the First Category Tax effectively reduces the rate of Withholding Tax. When a credit is available, the Withholding Tax is computed by applying the 35% rate to the pre-tax amount needed to fund the dividend and then subtracting from the tentative withholding tax so determined the amount of First Category Tax actually paid on the pre-tax income. For purposes of determining the rate at which First Category Tax was paid, dividends are treated as paid from our oldest retained earnings.
The effective rate of Withholding Tax to be imposed on dividends paid by us will vary depending upon the amount of First Category Tax paid by us on the earnings underlying the dividends. The statutory rate for the First Category Tax attributed to earnings generated during the fiscal yearyears 2008, 2009 and 2010 was 17.0%. And for fiscalFor years 2011, 2012 and 2013, it was 20%, for 2014 it was 21% and for 2015 it was 22.5%. The example below illustrates the effective Chilean Withholding Tax burden on a cash dividend received by a Foreign Holder, assuming a Withholding Tax rate of 35%, a statutory First Category Tax rate of 20%22.5% and a distribution of all of the net proceeds available after payment of the First Category Tax.
Taxable income | U.S.$ 100 |
| First Category Tax |
|
| Net proceeds available | |
| Dividend payment | |
| Withholding Tax (35% of the sum of the dividend (U.S.$ | |
| First Category Tax credit | |
| Payable Withholding Tax | |
| Net dividend received | 65 |
| |
| Effective dividend withholding tax rate |
|
Dividend distributions made in kind would be subject to the same Chilean tax rules as cash dividends. Stock dividends received by the Foreign Holder are not subject to Chilean taxation. The distributions of preemptive rights relating to shares of common stock will not be subject to Chilean taxation.
If the Proposed U.S.-Chile Treaty becomes effective, U.S. investors should consult their tax advisers as to the applicability of the treaty in their particular circumstances.
Taxation of Capital Gains
Gain realized on the sale, exchange or other disposition by a Foreign Holder of ADSs will not be subject to Chilean taxation, provided that such sale or disposition occurs outside Chile or that it is performed under the rules of Title XXIV of the Chilean Securities Market Law, as amended by Law No. 19,601, dated January 18, 1999. The deposit and withdrawal of shares of common stock in exchange for ADSs will not be subject to any Chilean taxes.
Gain recognized on a sale or exchange of shares of common stock (as distinguished from sales or exchanges of ADSs representing such shares of common stock) by a Foreign Holder will be subject both to First Category Tax (currently imposed at a rate of 20%22.5%) and Withholding Tax (the first can be used as credit against the second) if (1) the Foreign Holder has held such shares of common stock for less than one year since exchanging ADSs for the shares of common stock, (2) the Foreign Holder acquired and disposed of the shares of common stock in the ordinary course of its business or as a regular trader of stock or (3) the sale is made to a company in which the Foreign Holder holds an interest. In certain other cases where the Foreign Holder of shares of common stock has some connection with Chile, gain on the disposition of shares of common stock will be subject only to First Category Tax as a single tax (currently imposed at a rate of 20%)22.5 %).
The sale of shares of common stock by a Foreign Holder to an individual or entity non-resident or domiciled in Chile is subject to a provisional withholding. Such a provisional withholding will be equal to (i) 5% of the total amount to remit, without any deduction, paid to, credited to or putted at the disposal of the Foreign Holder if the transaction is subject to the First Category Tax as a single tax, unless the gain subject to taxation can be determined, in which case the withholding will be equal to the rate of First Category Tax (currently 20%22.5%) on the gain, or (ii) the difference between Withholding Tax (35%) and First Category Tax (20%(22.5%) rates, which currently would be 15%12.5%, of the total amount to remit, without any deduction, paid to, credited to or putted at the disposal of the Foreign Holder, if the transaction is subject to both First Category and Withholding Tax, unless the gain subject to taxation can be determined, in which case the withholding will be equal to a 35% on the gain. . For income tax purposes, the capital gain shall be the difference between the sales price and the acquisition cost of the stock. The tax basis of shares of common stock received in exchange for ADSs will be the acquisition value of such shares. The valuation procedure set forth in the deposit agreement, which values shares of common stock that are being exchanged at the highest price at which they trade on the Santiago Stock Exchange on the date of the exchange, generally will determine the acquisition value for this purpose. Consequently, the conversion of ADSs into shares of common stock and sale of such shares of common stock for the value established under the deposit agreement will not generate a capital gain subject to taxation in Chile.
In the case where ADSs were exchanged for shares and the subsequent sale of the shares is made on a day that is different than the date on which the exchange is recorded, capital gains subject to taxation in Chile may be generated. On October 1, 1999, the Chilean Internal Revenue Service issued Ruling No. 3708N°3,708 whereby it allowed Chilean issuers of ADSs to amend the Deposit Agreements in which they are parties in order to include a clause that states that, in the case that the exchanged shares are sold by the ADSs’ holder on a Chilean Stock Exchange, either on the same day on which the exchange is recorded in the shareholders’ registry of the issuer or within the two prior business days to such date, the acquisition price of such exchanged shares shall be the price registered in the invoice issued by the stock broker that participated in the sale transaction. Consequently, as we have included this clause in the form of ADRs attached to the deposit agreement, the capital gain that may be generated if the shares received in exchange for ADSs were sold within two days prior to the date on which the exchange is recorded will not be subject to taxation.
The distribution and exercise of preemptive rights relating to the shares of common stock will not be subject to Chilean taxation. Cash amounts received in exchange for the shares or assignment of preemptive
rights relating to the shares will be subject to both the First Category Tax and the Withholding Tax (the former being creditable against the latter to the extent described above).
In certain cases and provided certain requirements are met, capital gains realized on the sale of actively traded stock of Chilean public companies may be exempt from Chilean income taxes. Our stock is currently considered an actively traded stock in the Santiago Stock Exchange, and Foreign Holders of the stock may qualify for an income tax exemption. Foreign Holders are urged to consult with their own tax advisers to determine whether an exemption applies to them.
If the Proposed U.S.-Chile Treaty becomes effective, it may further restrict the amount of Chilean tax, if any, imposed on gains derived from the sale or exchange of shares of common stock by U.S. residents eligible for the benefits of the treaty. If the Proposed Tax Treaty becomes effective, U.S. investors should consult their tax advisers as to the applicability of the treaty in their particular circumstances.
Other Chilean Taxes
No Chilean inheritance, donation or succession taxes apply to the transfer or disposition of the ADSs by a Foreign Holder, but such taxes generally will apply to the transfer at death or by donation of shares of our common stock by a Foreign Holder. No Chilean stamp, issue, registration or similar taxes or duties apply to Foreign Holders of shares or ADSs.
Withholding Tax Certificates
Upon request, we will provide to Foreign Holders appropriate documentation evidencing the payment of Withholding Taxes. For further information, the investor should contact: Robert Moreno, rmorenoh@santander.cl.
robert.moreno@santander.cl. Dividends payable to holders of ADSs are net of foreign currency conversion expenses of the Depositary and will be subject to the Withholding Tax currently at the rate of 35% (subject to credits in certain cases as described above).
Impact of Chilean Tax Reform Bill
On September 29, 2014, the Law No. 20,780 containing the Tax Reform was published in the Official Gazette. The Tax Reform introduced significant changes to the Chilean National Congress is currently discussing a newtaxation system and strengthened the powers of the Chilean Tax Authority to control and prevent tax reform that,avoidance. The Tax Reform contemplates, among others, will changeother reforms, changes to the Corporate Tax regime to create two different tax regimes: the Attributed Income Regime (Sistema de Renta Atribuida) and the Semi-Integrated Regime (Sistema Parcialmente Integrado).
On February 8, 2016, Law No. 20,899 (Simplified Tax Reform Law) was published, which introduced changes that are intended to simplify certain provisions of the Tax Reform. The amendments applied the Semi-Integrated Regime (Sistema Parcialmente Integrado) to corporations, limited joint-stock companies and any other entity with at least one non-final taxpayer owner. In addition, the amendments limited the Attributed Income Regime (Sistema de Renta Atribuida) to use by individuals, personal holding companies with limited liability, communities, non-residents that have any kind of permanent establishment in Chile and limited liability companies.
Under the Attributed Income Regime, shareholders would be taxed on an accrual basis, with a FCIT rate (First Category rate)of 25% imposed at the level of the operating entity, plus a global complementary tax at progressive rates for resident individuals or an additional withholding income tax (AWIT) of 35% for nonresident shareholders (the FCIT being 100% creditable), resulting in an overall income tax charge of 35% for nonresidents. Under this regime, profits would be required to be attributed to the owners, irrespective of whether a distribution actually is made.
Under the Semi-integrated Regime, shareholders would be taxed on a cash basis (when profits are distributed), but at a FCIT rate of 25.5% for 2017 (and 27% as from 2018). The statutoryFCIT still would be creditable against the 35% AWIT under that regime, but 35% of the credit would have to be paid to the Treasury, so, in practice, only 65% of the FCIT would be creditable. Thus, taxpayers would pay for the ability to defer shareholder taxation until profits actually are distributed with a higher overall income tax rate is expected to increase to 21% in business year 2014, 22.5% in 2015, 24% in 2016 and to 25% from 2017 onwards. The tax reform will also changethan under the way that investments are taxed with personal income taxes, and we assume the same will happen to foreign investors. The Chilean tax system is integrated, which means that the Corporate Tax rate is basically an advance payment of individual taxes. Under the current system only dividends are considered as taxable income, and ifAttributed Income Regime.
However, the Tax Reform Bill is passed, personal/withholding taxable income will include all(as supplemented by the net incomeSimplify Tax Reform Law) considered that investors from countries with which Chile has signed the Double Tax Treaty as of January 1, 2017 would be entitled to use the 100% of the investment, no matterFCIT credit, even if at that time the dividend payout ratio. Therefore, underagreement was not yet in force. Under such circumstances, the full tax reform,credit would be applicable until December 31, 2019 if at that time the effective withholdingrelevant Tax Treaty had not yet entered into force. Thus, investors from such treaty countries would enjoy the advantage of deferring shareholder taxation until profits were distributed, and yet retain the benefit of the overall 35% income tax rate will be dependent oncharge. This could lead to a shift in the dividend payout ratio.jurisdictions commonly used to make investments into Chile.
AsFor banking enterprises, the Bill proposed could be amendment duringdefault regime is the Parliamentary discussion, we recommended Foreign Investor to consult their personal tax advisers in order to verify the applicability ofSemi-integrated Regime. Additionally, the Tax Reform in their particular circumstances.considered an increase gradually of the FCIT rate of 20% up to 25% under the Attributed Income Regime, as described below. In the case of the Semi-Integrated Regime, the rate would increase up to 27%.
Year | Rate |
| 2014 | 21% |
| 2015 | 22.5% |
| 2016 | 24% |
| 2017 | 25% (Attributed Income Regime) / |
| 25.5% (Semi-Integrated Regime) | |
| 2018 | 25% (Attributed Income Regime) / |
| 27% (Semi-Integrated Regime) |
U.S. Federal Income Tax Considerations
The following is a discussion of material U.S. federal income tax consequences of owning and disposing of shares of our common stock or ADSs to U.S. holders described below, but it does not purport to be a comprehensive description of all of the tax considerations that may be relevant to a particular person’s decision to hold such common stock or ADSs. The discussion applies only if you hold shares of our common stock or ADSs as capital assets for U.S. federal income tax purposes. It does not address all aspects of U.S. federal income taxation that may be relevant to you in light of your particular circumstances, including the alternative minimum tax and the Medicare contribution tax, nor does it describe all tax consequences that may be relevant to U.S. holders subject to special rules, such as:
| · | certain financial institutions; |
| · | insurance companies; |
| · | dealers and traders in securities who use a mark-to-market method of tax accounting; |
| · | persons holding shares or ADSs as part of a hedge, “straddle,” conversion transaction, integrated transaction or similar transaction; |
| · | persons whose functional currency for U.S. federal income tax purposes is not the U.S. dollar; |
| · | partnerships or other entities classified as partnerships for U.S. federal income tax purposes; |
| · | tax-exempt entities, including “individual retirement accounts” or “Roth IRAs”; |
| · | persons holding shares of our common stock or ADSs that own or are deemed to own ten percent or more of our voting stock; |
| · | persons who acquired shares of our common stock or ADSs pursuant to the exercise of any employee stock option plan or otherwise as compensation; or |
| · | persons whose shares or ADSs are held in connection with a trade or business conducted outside the United States. |
If an entity that is classified as a partnership for U.S. federal income tax purposes owns shares of our common stock or ADSs, the U.S. federal income tax treatment of a partner will generally depend on the status of the partner and upon the activities of the partnership. Partnerships owning shares of our common stock or ADSs and partners in such partnerships should consult their tax advisers as to the particular U.S. federal income tax consequences of owning and disposing of the shares of our common stock or ADSs.
As used herein, a “U.S. holder” is a person that for U.S. federal income tax purposes is a beneficial owner of shares of our common stock or ADSs and is:
This discussion is based on the Internal Revenue Code of 1986, as amended (the “Code”), administrative pronouncements, judicial decisions and final, temporary and proposed Treasury regulations, all as of the date hereof. These laws are subject to change, possibly on a retroactive basis. It is also based in part on representations by the depositary and assumes that each obligation under the deposit agreement and any related agreement will be performed in accordance with its terms. In addition, this discussion does not address U.S. state, local and non-U.S. tax consequences. Please consult your tax advisers concerning the U.S. federal, state, local and non-U.S. tax consequences of owning and disposing of shares or ADSs in your particular circumstances.
As used herein, a “U.S. holder” is a person that for U.S. federal income tax purposes is a beneficial owner of shares of our common stock or ADSs and is:
| · | a citizen or individual resident of the United States; |
| · | a corporation, or other entity taxable as a corporation, created or organized in or under the laws of the United States, a state thereof or the District of Columbia; or |
| · | an estate or trust the income of which is subject to U.S. federal income taxation regardless of its source. |
In general, if you own ADSs, you will be treated as the owner of the underlying shares represented by those ADSs for U.S. federal income tax purposes. Accordingly, no gain or loss will be recognized if you exchange ADSs for the underlying shares represented by those ADSs.
The U.S. Treasury has expressed concerns that parties to whom American depositary shares are released prior to delivery of shares to the depositary (“pre-release”) or intermediaries in the chain of ownership between U.S. holders of American depositary shares and the issuer of the security underlying the American
depositary shares may be taking actions that are inconsistent with the claiming of foreign tax credits for holders of American depositary shares. These actions would also be inconsistent with the claiming of the favorable tax rates, described below, applicable to dividends received by certain non-corporate holders. Accordingly, the creditability of Chilean taxes and the availability of the favorable tax rates for dividends received by certain non-corporate holders, each described below, could be affected by actions that may be taken by such parties or intermediaries.
This discussion assumes that we are not, and will not become, a passive foreign investment company, as described below.
Taxation of Distributions
Distributions paid on shares of our common stock or ADSs, other than certain pro rata distributions of common shares or rights, will be treated as dividends to the extent paid out of our current or accumulated earnings and profits (as determined under U.S. federal income tax principles). Because we do not maintain calculations of our earnings and profits under U.S. federal income tax principles, it is expected that distributions generally will be reported to U.S. holders as dividends. Subject to applicable limitations and the discussion above regarding concerns expressed by the U.S. Treasury, certain dividends paid by “qualified foreign corporations” to certain non-corporate U.S. holders may be taxable at rates applicable to long-term capital gains. A foreign corporation is treated as a qualified foreign corporation with respect to dividends paid on stock that is readily tradable on a securities market in the United States, such as the NYSE where our ADSs are traded. You should consult your tax advisers to determine whether the favorable rates may apply to dividends you receive and whether you are subject to any special rules that limit your ability to be taxed at the favorable rates. The amount of the dividend will include any amounts withheld by us or our paying agent in respect of Chilean taxes at the effective rate (after credit for First Category Taxes) as described above under “ — Material Tax Consequences of Owning Shares of Our Common Stock or ADSs—Taxation of Dividends” above.Dividends.” You should consult with your tax adviser to determine the amount considered withheld with respect to a distribution if you opt to be subject to the Attributed Income Regime for Chilean tax purposes starting in 2017, as described above under “—Material Tax Consequences of Owning Shares of Our Common Stock or ADSs—Impact of Chilean Tax Reform.” The amount of the dividend will be treated as foreign-source dividend income to you and will not be eligible for the dividends received deduction generally allowed to U.S. corporations under the Code.
Dividends will be included in your income on the date of your (or in the case of ADSs, the depositary’s) receipt of the dividend. The amount of any dividend income paid in Chilean pesos will be the U.S. dollar amount calculated by reference to the exchange rate in effect on the date of receipt regardless of whether the payment is in fact converted into U.S. dollars. If the dividend is converted into U.S. dollars on the date of receipt, you should not be required to recognize foreign currency gain or loss in respect of the dividend income. You may have foreign currency gain or loss if the dividend is converted into U.S. dollars after the date of receipt.
Subject to applicable limitations that may vary depending upon your circumstances and the discussion above regarding concerns expressed by the U.S. Treasury, Chilean taxes withheld from cash dividends on shares of our common stock or ADSs, reduced by the credit for any First Category Tax, as described above under “—Chilean Taxation,” generally will be creditable against your U.S. federal income tax liability. Starting in 2017, if you opt into the Attributed Income Regime, as described above under “—Material Tax Consequences of Owning Shares of Our Common Stock or ADSs—Impact of Chilean Tax Reform,” amounts withheld by us, reduced by the credit for any First Category Tax, may be creditable for U.S. tax purposes. If creditable, it is uncertain whether such tax would be creditable in the year the Chilean tax is imposed, irrespective of whether a distribution is actually made. You should consult your tax adviser concerning the creditability and timing issues pertaining to such tax. If, however, the Proposed U.S.-Chile Treaty becomes effective, any Chilean income taxes withheld from dividends on shares or ADSs in excess of the rate provided by the treaty will not be creditable by a U.S. holder who is eligible for the benefits of the treaty. The rules governing foreign tax credits are complex and you should consult your tax advisers to determine whether you are subject to any special rules that limit your ability to make effective use of foreign tax credits. Instead of claiming a credit, you may, at your election, deduct such Chilean taxes in computing your taxable income, subject to generally applicable limitations under U.S. law. An election to deduct foreign taxes instead of claiming foreign tax credits must apply to all foreign taxes paid or accrued in the taxable year.
Sale or Other Disposition of Shares or ADSs
For U.S. federal income tax purposes, gain or loss you realize on the sale or other disposition of shares of our common stock or ADSs generally will be capital gain or loss, and will be long-term capital gain or loss if you held the shares of our common stock or ADSs for more than one year. The amount of your gain or loss will be equal to the difference between your tax basis in the shares of our common stock or ADSs disposed of and the amount realized on the disposition, in each case as determined in U.S. dollars. If a Chilean tax is
withheld on the sale or disposition of the shares of our common stock or ADSs, your amount realized will include the gross amount of the proceeds of such sale or disposition before deduction of the Chilean tax. See “—Chilean Taxation—Taxation of Capital Gains” for a description of when a disposition may be subject to taxation by Chile. Such gain or loss generally will be U.S.-source gain or loss for foreign tax credit purposes. Consequently, you may not be able to credit any Chilean tax imposed on the disposition of shares of our common stock or ADSs against your taxable income unless you have other foreign-source income in the appropriate foreign tax credit category. If the Proposed U.S.-Chile Treaty becomes effective, however, a U.S. holder who is eligible for the benefits of the treaty and whose gain from the sale of shares is not exempt from Chilean tax under such treaty may elect to treat disposition gain that is subject to Chilean tax as foreign-source gain and claim a credit in respect of the tax. You should consult your tax advisers as to whether the Chilean tax on gains may be creditable against your U.S. federal income tax on foreign-source income from other sources. Alternatively, instead of claiming a credit, you may elect to deduct otherwise creditable taxes in computing your income, subject to generally applicable limitations under U.S. law. An election to deduct foreign taxes instead of claiming foreign tax credits must apply to all foreign taxes paid or accrued in the taxable year.
Passive Foreign Investment Company Rules
Based on proposed Treasury regulations (the “Proposed Regulations”), which are proposed to be effective for taxable years beginning after December 31, 1994, we believe that we were not a “passive foreign investment company” (a “PFIC”) for U.S. federal income tax purposes for the year ended December 31, 2013.2015. However, since the Proposed Regulations may not be finalized in their current form and since PFIC status depends upon the composition of a company’s income and assets and the market value of its assets (including, among others, less than 25 percent owned equity investments) from time to time, there can be no assurance that we will not be a PFIC for any taxable year. If we were a PFIC for any taxable year during which you held an ADS or a share of our common stock, certain adverse tax consequences could apply to you.
If we were a PFIC for any taxable year during which you held shares of our common stock or ADSs, gain recognized by you on a sale or other disposition (including certain pledges) of a share of our common stock or an ADS would generally be allocated ratably over your holding period for the share of our common stock or ADS. The amounts allocated to the taxable year of the sale or other disposition and to any year before we became a PFIC would be taxed as ordinary income. The amount allocated to each other taxable year would be subject to tax at the highest rate in effect for individuals or corporations, as appropriate, for that taxable year, and an interest charge would be imposed on the resulting tax liability for that taxable year. Similar rules would apply to any distribution in respect of shares of our common stock or ADSs that exceeds 125% of the average of the annual distributions on
shares of our common stock or ADSs received by you during the preceding three years or your holding period, whichever is shorter. Certain elections may be available that would result in alternative treatments of the shares of our common stock or ADSs (including, with respect to our ADSs, a mark-to-market election). In addition, if we were a PFIC for a taxable year in which we pay a dividend or the prior taxable year, the favorable rates discussed above with respect to dividends paid to non-corporate holders would not apply.
If we were to be treated as a PFIC in any taxable year, a U.S. holder may be required to file reports with the Internal Revenue Service containing such information as the Treasury Department may require.
Information Reporting and Backup Withholding
Payment of dividends and sales proceeds that are made within the United States or through certain U.S.-related financial intermediaries generally are subject to information reporting and may be subject to backup withholding, unless you are a corporation or other exempt recipient or in the case of backup withholding, you provide a correct taxpayer identification number and certify that you are not subject to backup withholding.
The amount of any backup withholding from a payment to you will be allowed as a credit against your U.S. federal income tax liability and may entitle you to a refund, provided that the required information is timely furnished to the Internal Revenue Service.
Certain U.S. holders may be required to report information relating to stock of a non-U.S. person, subject to certain exceptions (including an exception for stock held in custodial accounts maintained by a U.S. financial institution). You should consult your tax advisers regarding any reporting obligations you may have with respect to shares of our common stock or ADSs.
| F. | Dividends and Paying Agents |
Not applicable.
| G. | Statement by Experts |
Not applicable.
| H. | Documents on Display |
The documents concerning us which are referred to in this Annual Report may be inspected at our offices at Bandera 140, 20th floor, Santiago, Chile. We are subject to the information reporting requirements of the Exchange Act, except that, as a foreign issuer, we are not subject to the proxy rules or the short-swing profit and disclosure rules of the Exchange Act. In accordance with these statutory requirements, we file or furnish reports and other information with the SEC. Reports and other information filed or furnished by us with the SEC may be inspected and copied at the public reference facilities maintained by the SEC at Room 1024, 450 Fifth Street, N.W., Washington, D.C. 20549. Copies of such material may be obtained by mail from the Public Reference Section of the SEC, 450 Fifth Street, N.W., Washington, D.C. 20549, at prescribed rates. You may obtain information on the operation of the Public Reference Section by calling the SEC at 1-800-732-0330. The SEC maintains a website on the Internet at http://www.sec.gov that contains reports and information statements and other information regarding us. The reports and information statements and other information about us can be downloaded from the SEC’s website and can also be inspected and copied at the offices of the NYSE, Inc., 20 Broad Street, New York, New York 10005.
| I. | Subsidiary Information |
Not applicable.
ITEM 11. QUANTITATIVE AND QUALITATIVE DISCLOSURES ABOUT MARKET RISK
Introduction
The principal types of risk inherent in Santander-Chile’s business are market, liquidity, operational and credit risks. The effectiveness with which we are able to manage the balance between risk and reward is a significant factor in our ability to generate long term, stable earnings growth. Toward that end, our Board and senior management places great emphasis on risk management.
| A. | Integral Risk Committee |
The Integral Risk Committee of the Board is responsible for revisingreviewing and followingmonitoring all risks that may affect us, including reputation risk, allowing for an integral risk management. This committee serves as the governing body through which the Board supervises risk in general. It also evaluates the reasonability of the systems for measurement and control of risks.
| · | Credit risk |
| · | Market risk |
| · | Operational risk |
| · | Solvency risk (BIS) |
| · | Legal risks |
| · | Compliance risks |
| · | Reputational risks |
This Committee includes the Vice Chairman of the Board and five Board members. This committee also includes the CEO, the Director of Risk the CRO and other senior level executives from the commercial side of our business: The Board members of this committee are:
Board member | Position in Committee |
| Oscar von Chrismar | Chairman |
| Marco Colodro | Member |
| Vittorio Corbo | Member |
| Roberto Méndez | Member |
| Raimundo Monge | Member |
| Juan Pedro Santa María | Member |
Below is an organizational chart of the Risk Department:
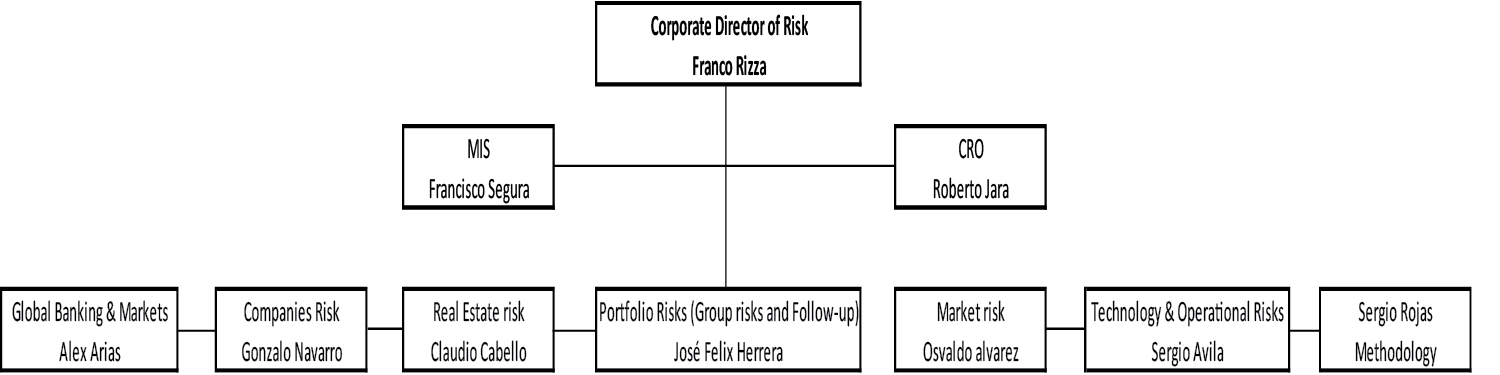
| B. |
Board member | Position in Committee |
| Marco Colodro | Chairman |
| Mauricio Larrain | First Vice Chairman and Financial Expert |
| Orlando Poblete | Second Vice Chairman |
The Audit Committee (Comité de Directores y Auditoría) is comprised of three members of the Board of Directors. The Committee Secretary is the alternate director Juan Pedro Santa María. The General Counsel is the Committee Secretary. The Chief Executive Officer, General Auditor and other persons from the Bank can be invited to the meetings if necessary and are present on specific matters. This Committee’s primary responsibility is to support the Board of Directors in the continuous improvement of our system of internal controls, which includes reviewing the work of both the external auditors and the Internal Audit Department. The committee is also responsible for analyzing observations made by regulatory entities of the Chilean financial system about us and for recommending measures to be taken by our management in response. This committee also performs functions of a remuneration committee as established in Chilean Law, and reviews annually the salary and bonus programs for the executive officers of the Bank. The external auditors are recommended by this committee to our Board of Directors and appointed by our shareholders at the annual shareholders’ meeting.
| C. | Asset and Liability Committee |
The ALCO includes the Chairman of the Board and five additional members of the Board, the Chief Executive Officer, the Corporate Financial Controller, the Manager of the Financial Management Division, the Manager of Market Risk, the Manager of the Treasury Division, and other senior members of management. The ALCO meets monthly. All limits reviewed by the ALCO are measured and prepared by the Market Risk Department. The non-Board members of the ALCO meet weekly to review liquidity, funding, capital and market risk related matters.
Board member | Position in Committee | |||
| Vittorio Corbo | Chairman | |||
| Mauricio Larraín | Vice-Chairman | |||
| Oscar von Chrismar | Second Vice-Chairman | |||
| Marco Colodro | Member | |||
| Roberto Zahler | Member | |||
| Raimundo Monge | Member | |||
The main functions of the ALCO are:
| · | Making the most important decisions regarding interest rate risk, funding, capital and liquidity levels. The main limits set and monitored by the ALCO (and measured by the Market Risk Department) are: |
Risk | Measure |
| Sensitivity Capital | |
| Interest rates | Sensitivity NIM |
| Regulatory market risk limits | |
| Regulatory limit 30 Days | |
| Liquidity | Regulatory limit 90 Days |
| Internal liquidity limit | |
| BIS ratio | |
| Capital | BIS ratio with market risk |
| BIS ratio with market and operational risk | |
| Intergroup exposure: Derivatives, deposits, loans | |
| Foreign exposures | Foreign assets: Derivatives, Deposits, Loans |
| · | Review of the Bank’s main gaps (foreign currency and inflation gap). |
| · | Review of the evolution of the most relevant local and international markets and monetary policies. |
| D. | Market Committee |
The Market Committee includes the Vice-Chairman of the Board, three additional members of the Board, the Chief Executive Officer, the Manager of Global Banking and Markets, the Manager of the Treasury Division, the Manager of the Financial Management Division, the Manager of Market Risk, the Financial Controller and other senior members of management.
Board member | Position in Committee |
| Vittorio Corbo | Chairman |
| Oscar von Chrismar | Vice-Chairman |
| Roberto Zahler | Second Vice-Chairman |
| Marco Colodro | Member |
The Market Committee is responsible for:
| · | Establishing a strategy for the Bank’s trading portfolio. |
| · | Establishing the Bank’s policies, procedures and limits with respect to its trading portfolio. The Bank’s Market Risk Department measures all risks and limits and reports these to the Market Committee. |
| · | Reviewing the evolution of the most relevant local and international markets and monetary policies. |
| E. | Risk Department |
All issues regarding risk in the Bank are the responsibility of the Bank’s Risk Department. The Risk Department reports to the CEO but has full independence, and no risk decisions can be made without its approval. All risks (credit, market and operational) are approved and measured byBelow is an organizational chart of the Risk Department and reported simultaneously to local management and to Santander Spain’s Risk Department, which follows global risk levels. The frequency of reporting depends on the nature of the risk. In general, market risks are measured daily and other risks are reviewed weekly. Within this structure, the Board and senior management interact extensively with the Risk Department.Department:
1. Executive Credit Committee
The Executive Credit Committee is comprised of the following Board members:
|
|
In addition, this committee also includes: the Corporate Director of Risk, the CEO, the Corporate Legal Counsel, the Manager of Global Banking, the Corporate Director of Human Resources and Administration (this is a newly-created position) and two senior members of the Credit Risk Department, who present the loans being reviewed. The Executive Credit Committee meets weekly and performs the following main functions:
The Credit Risk Department must present to the Board onSee Item 5- Selected Statistical Information-Classification of Loan Portfolio for a monthly basis. In this presentation, all loans above U.S.$5 million that were granted in the previous month must be reviewed. In addition, any other topic or subjectcomplete description of importance regarding credit risk is also presented (for example, a proposal to change a provisioning model must be presented and approved by the Board). Finally, at least once a year, the Credit Risk Department presents a report to assure the Board that our loan loss allowances are adequate for all known and estimated incurred losses.
In matters regarding Credit Risk, Santander Spain’s Global Risk Department has the following role:management.
All issues regarding operational risks in the Bank fall under the Non-Financial Risk Department that reports to the Risk Department. Below is an organization chart of this department.
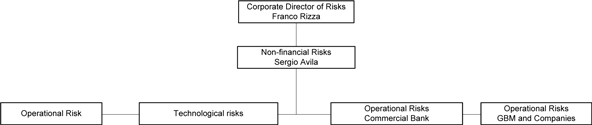

All operational risks are measured in this Department and reported simultaneously to local management and the Board through various channels.
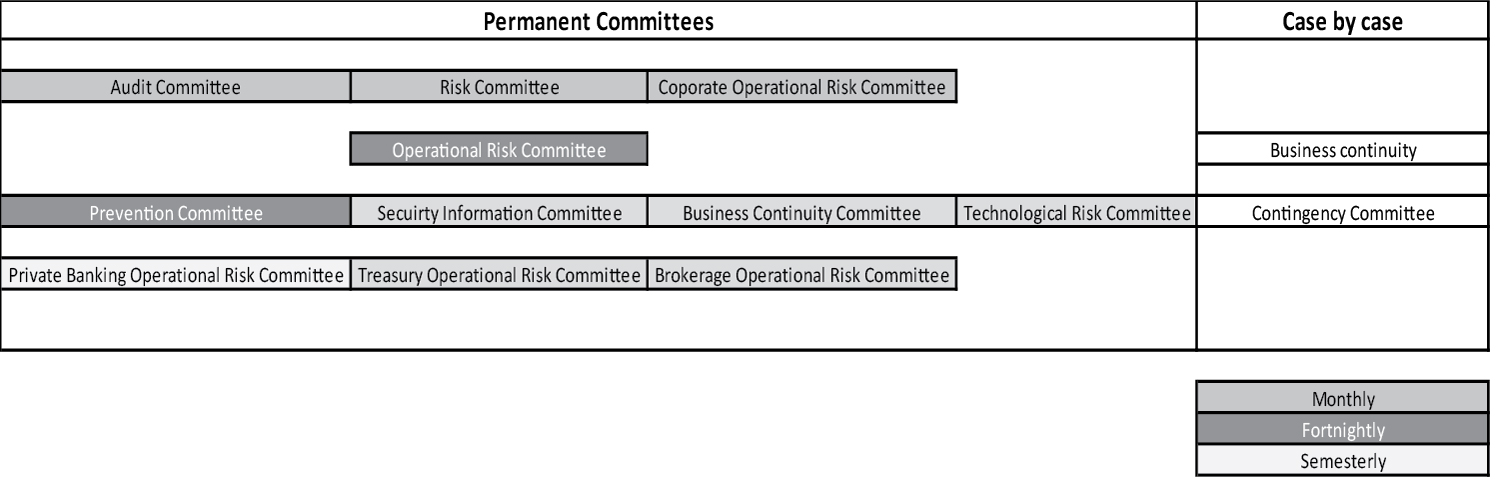
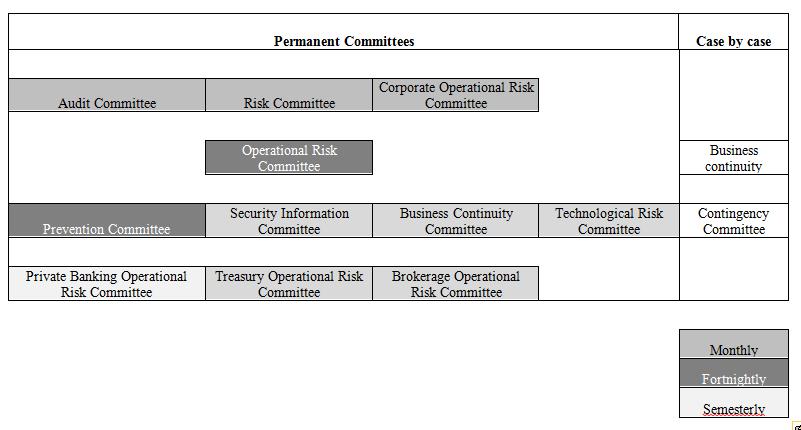
171
On a monthly basis, the DirectorRole of Santander Spain’s Global Risk and the Manager ofDivision: Operational Risk inform the Audit Committee of the most important events regarding operational risks. In addition, the Audit Committee also has the role of establishing the main policies and strategies regarding operational risk. The periodic reviews performed by the different operational risk committees are submitted to the Audit Committee, where senior level executive and the board are informed of these events. The members of the Audit Committee are:
|
|
In matters regarding operational risk, Santander Spain’s Global Risk Department’s role is to define certain global policies, guidelines and procedures regarding operational risk. The Corporate Operational Risk Committee is the main body in which the different units of Santander discuss and review the major operational risk events and policies.
| Market Risks |
This section describes the market risks that we are exposed to, the tools and methodology used to control these risks, the portfolios over which these market risk methods were applied and quantitative disclosure that demonstrate the level of exposure to market risk that we are assuming. This section also discloses the derivative instruments that we use to hedge exposures and offer to our clients.
Market risk is the risk of losses due to unexpected changes in interest rates, foreign exchange rates, inflation rates and other rates or prices. We are exposed to market risk mainly as a result of the following activities:
| · | trading in financial instruments, which exposes us to interest rate and foreign exchange rate risk; |
| · | engaging in banking activities, which subjects us to interest rate risk, since a change in interest rates affected gross interest income, gross interest expense and customer behavior; |
| · | engaging in banking activities, which exposes us to inflation rate risk, since a change in expected inflation affects gross interest income, gross interest expense and customer behavior; |
| · | trading in the local equity market, which subjects us to potential losses caused by fluctuations of the stock market; and |
| · | investing in assets whose returns or accounts are denominated in currencies other than the Chilean peso, which subjects us to foreign exchange risk between the Chilean peso and such other currencies. |
The main decisions that relate to market risk for the Bank and the limits regarding market risk are made in the Asset and Liability Committee and the Market Committee. The measurement and oversight of market risks is performed by the Market Risk Department. Below is a list of the main reports produced by the Market Risk Department and who they are addressed to:
Report | Unit | Objective | Addressed to: | Periodicity |
| Daily Global Report | Market risks | Give a global vision of the market, positions, risks, sensitivity, vision and alerts of the trading and non-trading positions | Market Risk (local and global), Senior Management, Internal Auditors | Daily |
| Stress Test | Market risks | Stress test report over the Bank's trading and ALCO books | Market Risk (local and global), Senior Management, Internal Auditors | Monthly |
| Sensitivity Analysis | Market risks | Sensitivity analysis of the ALCO book | Market Risk (local and global), Senior Management, Internal Auditors | Daily |
| Fixed income positions | Market risks | Fixed income positions and general information | Market Risk (local and global), Senior Management, Internal Auditors | Daily |
| Interest rate gap | Market risks | Interest rate gap sensitivity and limit levels | Market Risk (local and global), Senior Management, Internal Auditors | Monthly |
| Liquidity gap | Market risks | Liquidity levels and limits | Market Risk (local and global), Senior Management, Internal Auditors | Monthly |
| Market report | Market risks | Main market indicators and evolution | Market Risk (local and global), Senior Management, Internal Auditors | Daily |
| VaR | Market risks | VaR position and limits | - Market risk (local and global) and Senior Management | Daily |
| Trading Portfolio Limits | Market risks | Trading book evolution, instruments and limits | Market Risk (local and global), Senior Management, Internal Auditors | Daily |
| Largest depositors | Market risks | Largest 20 and largest 50 depositors | - Market risk (local and global) and Senior Management | Weekly |
| Follow-up report | Market risks | summary of Market risk | Market Risk (local and global), Senior Management (local and global), Internal Auditors | Monthly |
| Liquidity stress-test | Market risks | Liquidity stress test simulation | Market Risk (local and global), Senior Management, Internal Auditors | Quarterly |
| Interest rate risk | Market risks | Interest rate risk report, limits and estimates of results | - Market risk (local and global), | Daily |
| Backtesting | Market risks | Market Risk (local and global), Senior Management, Internal Auditors | Weekly | |
| PNL Treasury | Market risks | Treasury income statement | - Market risk (local and global), | Daily |
Santander-Chile’s governance rules have established the existence of two high-level committees that, among other things, function to monitor and control market risks: the Asset and Liability Committee and the Market Committee.
The Asset and Liability Committee (“ALCO”) includes the ChairmanRole of the Board and five additional members of the Board, the Chief Executive Officer, the Corporate Financial Controller, the Manager of the Financial Management Division, the Manager ofSantander Spain’s Global Risk Division: Market Risk the Manager of the Treasury Division and other senior members of management. The ALCO meets monthly. All limits reviewed by the ALCO are measured and prepared by the Market Risk Department. The non-Board members of the ALCO meet weekly to review liquidity, funding, capital and market risk related matters.
|
|
The main functions of the ALCO are:
2. Market Committee
The Market Committee includes the Vice-Chairman of the Board, three additional members of the Board, the Chief Executive Officer, the Manager of Global Banking and Markets, the Manager of the Treasury Division, the Manager of the Financial Management Division, the Manager of Market Risk, the Financial Controller and other senior members of management.
|
|
The Market Committee is responsible for:
In matters regarding Market Risk, the role of Santander Spain’s Global Risk Department is to define certain global policies, guidelines and procedures regarding market risk. The information produced by our local Market Risk Department is standardized for the whole group in order to facilitate a consolidation of risks being taken on a global basis. They review daily the consumption of limits and provide valuable input on the evolution of markets, especially regarding the Eurozone.
| 4. | Market Risk: Quantitative Disclosure |
3. Market Risk: Quantitative Disclosure
Impact of inflation
Our assets and liabilities are denominated in Chilean pesos, Unidades de Fomento (UF) and foreign currencies. The Bank no longer recognizes inflation accounting and has eliminated price-level restatement in line with IFRS, but inflation impacts our results of operations as some loan and deposit products are contracted in UF. The UF is revalued in monthly cycles. Each day in the period beginning on the tenth day of the current month through the ninth day of the succeeding month, the nominal peso value of the UF is indexed up (or down in the event of deflation) in order to reflect a proportionate amount of the change in the Chilean Consumer Price Index during the prior calendar month. One UF equaled Ch$ 23.309,5625,629.09 at December 31, 2013,2015, Ch$22,840.7524,627.10 at December 31, 2012,2014 and Ch$22,294.0323,309.56 at December 31, 2011.2013. High levels of inflation in Chile could adversely affect the Chilean economy and could have an adverse effect on our business, financial condition and results of operations. Negative inflation rates also negatively impact our results. Inflation measured as the annual variation of the UF was 4.1% in 2015, 5.7% in 2014 and 2.1% in 2013, 2.5% in 2012, and 3.9% in 2011.2013. There can be no assurance that Chilean inflation will not change significantly from the current level. Although we currently benefit from moderate levels of inflation, due to the current structure of our assets and liabilities (i.e., a significant portion of our loans are indexed to the inflation rate, but there are no corresponding features in deposits or other funding sources that would increase the size of our funding base), there can be no assurance that our business, financial condition and result of operations in the future will not be adversely affected by changing levels of inflation. In summary:
| · | UF-denominated assets and liabilities. The effect of any changes in the nominal peso value of our UF-denominated interest earning assets and interest bearing liabilities is reflected in our results of operations as an increase (or decrease, in the event of deflation) in interest income and expense, respectively. Our net interest income will be positively affected by an inflationary environment to the extent that our average UF-denominated interest earning assets exceed our average UF-denominated interest bearing liabilities. Our net interest income will be positively affected by deflation in any period in which our average UF-denominated interest bearing liabilities exceed our average UF-denominated interest earning assets. Our net interest income will be negatively affected in a deflationary environment if our average UF-denominated interest earning assets exceed our average UF-denominated interest bearing liabilities. |
| · | Inflation and interest rate hedge. A key component of our asset and liability policy is the management of interest rate risk. The Bank’s assets generally have a longer maturity than our liabilities. As the Bank’s mortgage portfolio grows, the maturity gap tends to rise as these loans, which are contracted in UF, have a longer maturity than the average maturity of our funding base. As most of our long term financial instruments and mortgage loans are contracted in UF and most of our deposits are in nominal pesos, the rise |
in mortgage lending increases the Bank’s exposure to inflation and to interest rate risk. The size of this gap is limited by internal and regulatory guidelines in order to avoid excessive potential losses due to strong shifts in interest rates. In order to keep this duration gap below regulatory limits, the Bank issues long term bonds denominated in UF or interest rate swaps. The financial cost of the bonds and the efficient part of these hedges is recorded as net interest income. In 2015, the loss from the swaps taken in order to hedge mainly for inflation and interest rate risk and included in net interest income totaled a loss of Ch$107,867 million compared to a loss of Ch$130,254 million in 2014 and a loss of Ch$67,239 million in 2013. The average gap between our interest earnings assets and total liabilities linked to the inflation, including hedging was Ch$3,358,707 million in 2015, Ch$4,168,678 million in 2014 and Ch$3,581,959 million in 2013.
| · | The |
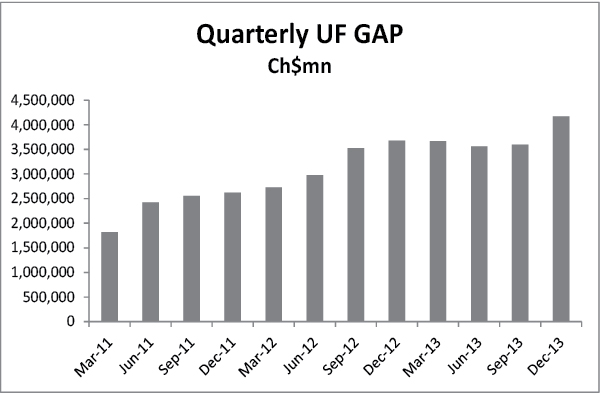
*Includes hedging
As of December 31, | % Change | % Change | |||
Inflation sensitive income | 2013 | 2012 | 2011 | 2013/2012 | 2012/2011 |
| (In millions of Ch$) | |||||
| Interest earned on UF assets(1) | 631,953 | 648,594 | 703,286 | (2.6%) | (7.8%) |
| Interest paid on UF liabilities(1) | (218,304) | (280,695) | (388,349) | (22.2%) | (27.7%) |
| Hedging results | (67,239) | (57,118) | (58,775) | 17.7% | (2.8%) |
| Net gain | 346,410 | 310,781 | 256,162 | 11.5% | 21.3% |
| As of December 31, | % Change | % Change | ||||||||||||||||||
| Impact of inflation on net interest income | 2015 | 2014 | 2013 | 2015/2014 | 2014/2013 | |||||||||||||||
| (In millions of Ch$) | ||||||||||||||||||||
| Results from UF GAP (1) | 130,666 | 229,946 | 71,842 | (43.2 | %) | 220.1 | % | |||||||||||||
| Annual UF inflation | 4.1 | % | 5.7 | % | 2.1 | % | ||||||||||||||
| (1) |
| · | Peso-denominated assets and liabilities. Interest rates prevailing in Chile during any period primarily reflect the inflation rate during the period and the expectations of future inflation. The sensitivity of our peso-denominated interest earning assets and interest bearing liabilities to changes to such prevailing rates varies. See “Item 5. Operating and Financial Review and Prospects— |
Interest rate sensitivity
Interest rates earned and paid on our assets and liabilities reflect, to a certain degree, inflation, expectations regarding inflation, changes in short term interest rates set by the Central Bank and movements in long term real rates. The Central Bank manages short term interest rates based on its objectives of balancing low inflation and economic growth. Because our liabilities are generally re-priced sooner than our assets, changes in the rate of inflation or short term rates in the economy are reflected in the rates of interest paid by us on our liabilities before such changes are reflected in the rates of interest earned by us on our assets. Therefore, when short term interest rates fall, our net interest margin is positively impacted, but when short term rates increase, our interest margin is negatively affected. At the same time, our net interest margin tends to be adversely affected in the short term by a decrease in inflation rates since generally our UF-denominated assets exceed our UF-denominated liabilities. (See “Item 5. Operating and Financial Review and Prospects—C.A. Operating Results—Impact of Inflation—Peso-denominated assets and liabilities”). An increase in long term rates has a positive effect on our net interest margin, because our interest earning assets generally have longer terms than our interest bearing liabilities. In addition, because our peso-denominated liabilities have relatively short re-pricing periods, they are generally more responsive to changes in inflation or short term rates than our UF-denominated liabilities. As a result, during periods when current inflation or expected inflation exceeds the previous period’s inflation, customers often switch funds from
UF-denominated deposits to peso-denominated deposits, which generally bear higher interest rates, thereby adversely affecting our net interest margin.
174
As of December 31, 2013,2015, the breakdown of maturities of assets and liabilities is as follows:
On-Demand | Up to 1 month | Between 1 and | Between 3 and | Between 1 and | More than 5 | Total | ||||||||||
| Interest-earning assets: | ||||||||||||||||
| As of December 31, 2015 | Demand | Up to 1 month | Between 1 and 3 months | Between 3 and 12 months | Subtotal up to 1 year | Between 1 and 5 years | More than 5 years | Subtotal More than 1 year | Total | |||||||
| Assets | ||||||||||||||||
| Cash and deposits in banks | 1,571,810 | - | 1,571,810 | 1,677,076 | 387,730 | - | 2,064,806 | - | 2,064,806 | |||||||
| Cash items in process of collection | 604,077 | - | 604,077 | 724,521 | - | 724,521 | - | 724,521 | ||||||||
| Trading investments | - | 10,018 | 17 | - | 203,608 | 73,924 | 287,567 | - | 126,248 | 21,364 | 264 | 147,876 | 87,735 | 88,660 | 176,395 | 324,271 |
| Investment under resale agreements | - | 17,469 | - | 17,469 | ||||||||||||
| Investments under resale agreements | - | 2,463 | - | 2,463 | - | 2,463 | ||||||||||
| Financial derivative contracts | - | 168,785 | 99,471 | 225,617 | 565,329 | 434,816 | 1,494,018 | - | 158,843 | 213,335 | 407,854 | 780,032 | 1,191,866 | 1,234,028 | 2,425,894 | 3,205,926 |
| Interbank loans | 1,224 | 66,264 | 56,901 | 1,060 | - | 125,449 | ||||||||||
| Loans and accounts receivables from customers | 773,387 | 2,173,231 | 1,776,530 | 3,533,313 | 6,367,870 | 6,310,981 | 20,935,312 | |||||||||
| Interbank loans (*) | 9,371 | - | 1,506 | - | 10,877 | - | 10,877 | |||||||||
| Loans and accounts receivables from customers (**) | 664,164 | 2,401,995 | 2,178,424 | 4,027,990 | 9,272,573 | 7,498,802 | 8,518,505 | 16,017,307 | 25,289,880 | |||||||
| Available for sale investments | - | 228,997 | 240,018 | 627,052 | 275,281 | 329,645 | 1,700,993 | - | 480,801 | 72,217 | 243,241 | 796,259 | 517,655 | 730,497 | 1,248,152 | 2,044,411 |
| Total interest-earning assets | 2,950,498 | 2,647,295 | 2,190,406 | 4,387,042 | 7,412,088 | 7,149,366 | 26,736,695 | |||||||||
| Interest-bearing liabilities: | ||||||||||||||||
| Guarantee deposits (threshold) | 649,325 | - | 649,325 | - | 649,325 | |||||||||||
| Total assets | 3,724,457 | 3,558,080 | 2,486,846 | 4,679,349 | 14,448,732 | 9,296,058 | 10,571,690 | 19,867,748 | 34,316,480 | |||||||
| Liabilities | ||||||||||||||||
| Deposits and other demand liabilities | 5,620,763 | - | 5,620,763 | 7,356,121 | - | 7,356,121 | - | 7,356,121 | ||||||||
| Cash items in process of being cleared | 276,379 | - | 276,379 | 462,157 | - | 462,157 | - | 462,157 | ||||||||
| Obligations under repurchase agreements | - | 185,140 | 18,466 | 5,366 | - | 208,972 | - | 143,689 | - | 143,689 | - | 143,689 | ||||
| Time deposits and other time liabilities | 104,233 | 5,351,489 | 2,333,001 | 1,743,525 | 87,380 | 55,644 | 9,675,272 | 114,341 | 5,707,940 | 3,210,947 | 2,853,761 | 11,886,989 | 238,933 | 56,845 | 295,778 | 12,182,767 |
| Financial derivative contracts | - | 126,238 | 89,018 | 223,031 | 508,206 | 345,292 | 1,291,785 | - | 126,643 | 190,409 | 380,158 | 697,210 | 1,016,731 | 1,148,665 | 2,165,396 | 2,862,606 |
| Interbank borrowings | 8,199 | 104,490 | 216,472 | 1,201,070 | 152,146 | - | 1,682,377 | 27,323 | 7,946 | 148,509 | 684,819 | 868,597 | 438,977 | - | 438,977 | 1,307,574 |
| Issued debt instruments | - | 470,600 | 688,261 | 590,027 | 1,548,733 | 1,901,037 | 5,198,658 | 1,953 | 440,500 | 155,821 | 213,928 | 812,202 | 2,764,082 | 2,380,811 | 5,144,893 | 5,957,095 |
| Other financial liabilities | 97,027 | 568 | 1,111 | 2,992 | 29,685 | 58,398 | 189,781 | 129,358 | 3,142 | 558 | 3,114 | 136,172 | 68,027 | 16,328 | 84,355 | 220,527 |
| Total interest-bearing liabilities | 6,106,601 | 6,238,525 | 3,346,329 | 3,766,011 | 2,326,150 | 2,360,371 | 24,143,987 | |||||||||
| Guarantees received (threshold) | 819,331 | - | 819,331 | - | 819,331 | |||||||||||
| Total liabilities | 8,910,584 | 6,429,860 | 3,706,244 | 4,135,780 | 23,182,468 | 4,526,750 | 3,602,649 | 8,129,399 | 31,311,867 | |||||||
| (*) | Interbank loans are presented on a gross basis. The amount of allowance is Ch$1,166 million. |
| (**) | Loans and accounts receivables from customers are presented on a gross basis. Provisions amounts according to type of loan are detailed as follows: Commercial loans Ch$431,201 million, Mortgage loans Ch$62,427 million, and Consumer loans Ch$267,507 million. |
175
The following table sets forth our average daily balance of liabilities for the years ended December 31, 2013, 20122015, 2014 and 2011,2013, in each case together with the related average nominal interest rates paid thereon.
2013 | 2012 | 2011 | 2015 | 2014 | 2013 | |||||||||||||
Average | % of Total | Average | Average | % of Total | Average | Average | % of Total | Average | Average Balance | % of Total Average Liabilities | Average Nominal Rate | Average Balance | % of Total Average Liabilities | Average Nominal Rate | Average Balance | % of Total Average Liabilities | Average Nominal Rate | |
| (millions of Ch$, except percentages) | (millions of Ch$, except percentages) | |||||||||||||||||
| Interest-bearing liabilities | ||||||||||||||||||
| Savings accounts | 103,760 | 0.4% | 1.9% | 102,420 | 0.4% | 2.5% | 103,085 | 0.4% | 3.6% | 114,330 | 0.3% | 3.4% | 108,185 | 0.3% | 5.0% | 103,760 | 0.4% | 1.9% |
| Time deposits | 9,949,401 | 36.8% | 4.5% | 9,659,815 | 38.5% | 5.2% | 9,107,719 | 37.7% | 4.9% | 12,685,504 | 36.7% | 3.2% | 11,952,994 | 36.6% | 3.4% | 9,949,401 | 36.8% | 4.5% |
| Central Bank borrowings | 221 | 0.0% | 6.3% | 4,469 | 0.0% | 5.2% | 3,097 | 0.0% | 6.0% | 4,891 | -% | 1.0% | 6,906 | 0.0% | 0.2% | 221 | 0.0% | 6.3% |
| Repurchase agreements | 266,883 | 1.0% | 5.6% | 369,338 | 1.5% | 4.2% | 249,174 | 1.0% | 3.5% | 228,050 | 0.7% | 3.1% | 413,263 | 1.3% | 2.0% | 266,883 | 1.0% | 5.6% |
| Mortgage finance bonds | 102,778 | 0.4% | 8.0% | 131,070 | 0.5% | 8.6% | 174,224 | 0.7% | 9.2% | 63,061 | 0.2% | 10.2% | 81,805 | 0.2% | 11.9% | 102,778 | 0.4% | 8.0% |
| Other interest bearing liabilities | 6,850,953 | 25.3% | 4.7% | 5,927,893 | 23.6% | 5.3% | 6,128,052 | 25.4% | 5.2% | 7,500,408 | 21.7% | 5.5% | 6,865,084 | 21.0% | 6.9% | 6,850,953 | 25.3% | 4.7% |
| Subtotal interest bearing liabilities | 17,273,996 | 63.9% | 4.6% | 16,195,005 | 64.5% | 5.3% | 15,765,351 | 65.2% | 5.1% | |||||||||
| Subtotal interest-bearing liabilities | 20,596,244 | 59.6% | 4.0% | 19,428,237 | 59.4% | 4.6% | 17,273,996 | 63.9% | 4.6% | |||||||||
| Non-interest bearing liabilities | ||||||||||||||||||
| Non-interest bearing deposits | 4,620,849 | 17.1% | 4,177,432 | 16.6% | 3,575,544 | 14.8% | 5,719,889 | 16.6% | 5,386,272 | 16.5% | 4,620,849 | 17.1% | ||||||
| Derivatives | 2,958,942 | 8.6% | 2,719,386 | 8.3% | 1,467,723 | 5.4% | ||||||||||||
| Other non-interest bearing liabilities | 2,454,037 | 7.1% | 2,501,651 | 7.6% | 1,325,975 | 4.9% | ||||||||||||
| Shareholders’ equity | 2,816,116 | 8.2% | 2,689,037 | 8.2% | 2,349,448 | 8.7% | ||||||||||||
| Subtotal non-interest bearing liabilities | 13,948,984 | 40.4% | 13,296,346 | 40.6% | 9,763,995 | 36.1% | ||||||||||||
| Total liabilities | 34,545,228 | 100.0% | 32,724,383 | 100.0% | 27,037,991 | 100.0% | ||||||||||||
2013 | 2012 | 2011 | |||||||
Average | % of Total | Average | Average | % of Total | Average | Average | % of Total | Average | |
| (millions of Ch$, except percentages) | |||||||||
| Derivatives | 1,467,723 | 5.4% | 1,141,169 | 4.5% | 1,457,638 | 6.1% | |||
| Other non-interest bearing liabilities | 1,325,975 | 4.9% | 1,395,112 | 5.6% | 1,340,699 | 5.6% | |||
| Shareholders’ equity | 2,349,448 | 8.7% | 2,187,716 | 8.8% | 1,994,487 | 8.3% | |||
| Subtotal non-interest bearing liabilities | 9,763,995 | 36.1% | 8,901,429 | 35.5% | 8,368,368 | 34.8% | |||
| Total liabilities | 27,037,991 | 100.0% | 25,096,434 | 100.0% | 24,133,719 | 100.0% | |||
Foreign exchange fluctuations
The Chilean government’s economic policies and any future changes in the value of the Chilean peso against the U.S. dollar could adversely affect our financial condition and results of operations. The Chilean peso has been subject to significant devaluation in the past and may be subject to significant fluctuations in the future. The Central Bank exchange rate depreciated 9.4%16.5% in 2013, which led to a pickup in CPI inflation in 2013.2015. See “Item 3. Key Information—A. Selected Financial Data—Exchange Rates.”
A significant portion of our assets and liabilities are denominated in foreign currencies, principally the U.S. dollar, and we historically have maintained, and may continue to maintain, material gaps between the balances of such assets and liabilities. Because such assets and liabilities, as well as interest earned or paid on such assets and liabilities, and gains and losses realized upon the sale of such assets, are translated to Chilean pesos in preparing our financial statements, our reported income is affected by changes in the value of the Chilean peso relative to foreign currencies (principally the U.S. dollar).
Our current strategy is not to maintain a significant difference between the balances of our assets and liabilities in foreign currencies. In 2013, 20122015, 2014 and 2011,2013, the Bank’s spot position in foreign currency held more liabilities than assets in foreign currencies, mainly U.S. dollars as a result of an ample supply of U.S.$ deposits from companies that receive export revenues, foreign correspondent bank loans and bonds issued abroad. This difference is usually hedged using forwards and cross-currency swaps. In general, the Bank is not permitted, due to guidelines set by the ALCO, to open a meaningful gap in foreign currency. Therefore, all foreign currency risk is included in the trading portfolio and is measured using VaR. The translation gain or loss over assets and liabilities (excluding derivatives held for trading) is included as foreign exchange transactions in the income statement. The translation and mark-to-market of foreign currency derivatives held for trading is recognized as a gain or loss in the net results from mark-to-market and trading. The composition on our assets and liabilities at December 31, 2013 by foreign currency was as follows:
Non-Trading U.S.$ portfolio (in millions of U.S.$) |
|
|
|
| Assets | Liabilities | ||
| Loans | 4,481 | Client deposits | 2,916 |
| Fixed assets | 367 | Long-term market funding | 6,397 |
| Financial investments | 1,484 | Short-term market funding | 1,758 |
| Derivatives | 4,781 | Other liabilities | 42 |
| Total | 11,113 | Total | 11,113 |
Including the trading portfolio, asAs of December 31, 2013,2015, the net difference between assets and liabilities in foreign currency was a net liabilityasset position of U.S.$2.5 million and the81.4 million. The average difference between assets and liabilitiesgap, be it a net asset or liability position in foreign currency, in 20132015 was a net asset position of U.S.$1.542 million. Both figures include derivatives used to hedge foreign currency risk. Below is a graph that illustrates the net daily foreign currency position in 2013.2015.
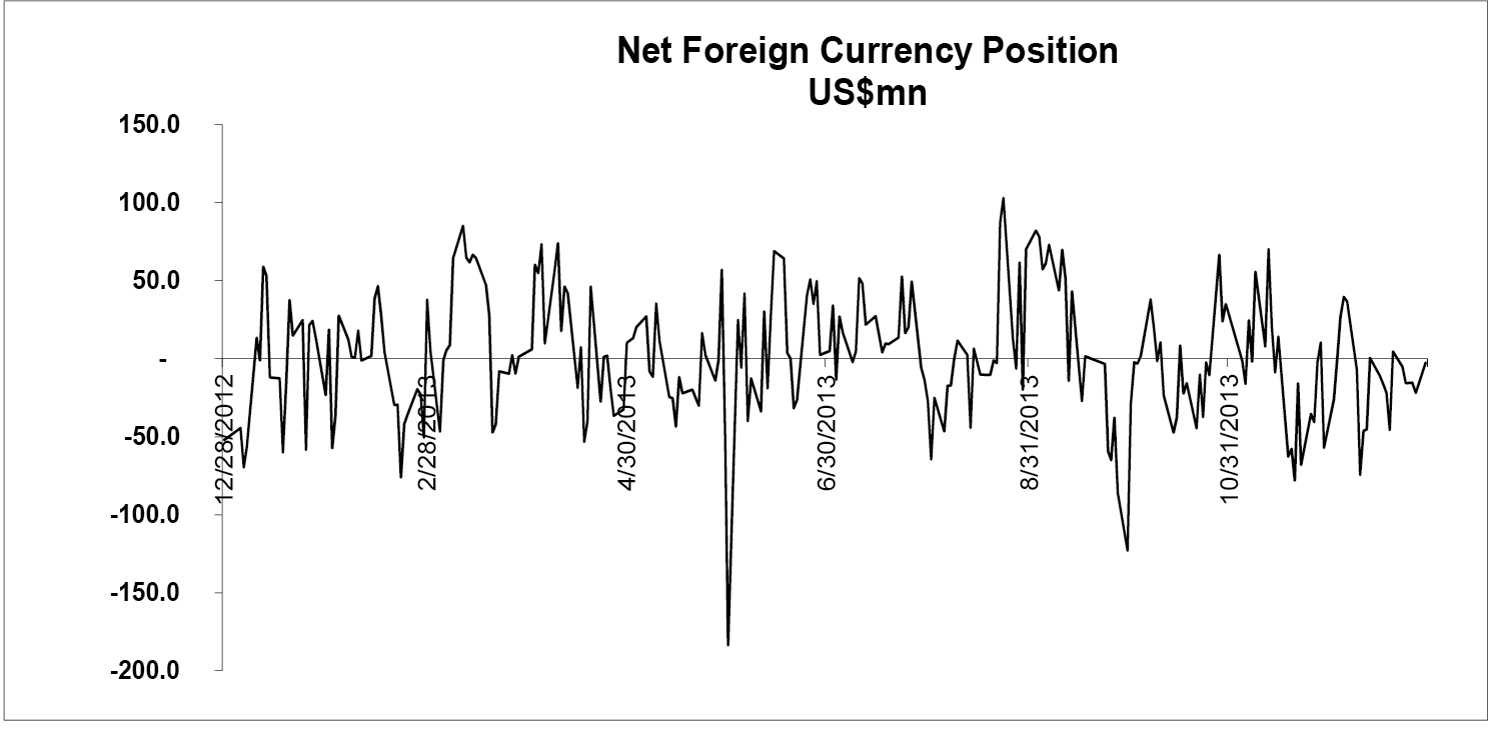
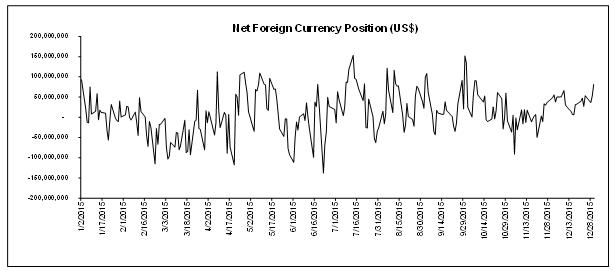
We also set an absolute limit on the size of Santander-Chile’s consolidated net foreign currency trading position, which is equivalent to the maximum differential allowed between assets and liabilities in foreign currencies, including hedging of this gap. The limit on the size of the net foreign currency position is determined by the Market Committee and is calculated and monitored by the Market Risk Department. At December 31, 2013,2015, this was equal to U.S.$200 million. This limit in various other currencies is as follows:
Currency | Limit (in millions of U.S.$) |
| U.S. dollars | 200 |
| Euros | 75 |
| Yen | 22.5 |
| Real | 15 |
| Mexican peso | 15 |
| Colombian peso | 15 |
| Other European currencies | 15 |
| Other Latin American currencies | 7.5 |
| Other currencies | 3.75 |
| Total Limit | 200 |
Liquidity risk management
The Financial Management Division receives information from all the business units on the liquidity profile of their financial assets and liabilities, as well as breakdowns of other projected cash flows stemming from future businesses. On the basis of that information, the Financial Management Division maintains a portfolio of liquid short–term assets, comprised mainly of liquid investments, loans and advances to other banks, to make sure the Bank has sufficient liquidity. The business units’ liquidity needs are met through short–term transfers from the Financial Management Division to cover any short–term fluctuations and long–term financing to address all the structural liquidity requirements.
The Bank monitors its liquidity position every day, determining the future flows of its outlays and revenues. In addition, stress tests are performed at the close of each month, for which a variety of scenarios encompassing both normal market conditions and conditions of market fluctuation are used. The liquidity policy and procedures are subject to review and approval by the Bank’s Board. Periodic reports are generated by the Market Risk Department, providing a breakdown of the liquidity position of the Bank and its subsidiaries, including any exceptions and the corrective measures adopted, which are regularly submitted to the ALCO for review.
The Bank relies on customer (retail)demand deposits from Retail, Middle-Market and institutional deposits,Corporates, obligations to banks, debt instruments, and time deposits as its main sources of funding. Although most obligations to banks, debt instruments and time deposits mature in over a year, customer (retail) and institutional deposits tend to have shorter maturities and a large proportion of them are payable within 90 days. The short–term nature of these deposits increases the
Bank’s liquidity risk, and hence, the Bank actively manages this risk by continual supervision of the market trends and price management.
Liquidity risk management seeks to ensure that, even under adverse conditions, we have access to the funds necessary to cover client needs, maturing liabilities and capital requirements. Liquidity risk arises in the general funding for our financing, trading and investment activities. It includes the risk of unexpected increases in the cost of funding the portfolio of assets at appropriate maturities and rates, the risk of being unable to liquidate a position in a timely manner at a reasonable price and the risk that we will be required to repay liabilities earlier than anticipated. The following table sets forth the balance of our liquidity portfolio managed by our Financial Management Division in the manner in which it is presented to the Asset and Liability Committee (ALCO) and the Board. The ALCO has determined that our liquidity portfolio must be comprised of cash plus assets that can be readily convertible into cash either through the Chilean Central Bank window, overnight deposits or instruments or the local secondary market. The management of the Bank’s liquidity portfolio is performed by the Financial Management Division under rules determined by the ALCO.
December 31, | December 31, | December 31, 2015 | December 31, 2014 | |||||||
| Ch$ million | Ch$ million | |||||||||
| Balance as of (1): | ||||||||||
| Balance as of: | ||||||||||
| Financial investments for trading | 287,567 | 338,287 | 324,271 | 774,815 | ||||||
| Available for sale investments | 1,700,993 | 1,826,158 | 2,044,411 | 1,651,598 | ||||||
| Encumbered assets (net) | (71,896) | (151,620) | (77,647 | ) | (112,015 | ) | ||||
| Net cash | 248,073 | (195) | (315,415 | ) | 14,774 | |||||
| Net interbank deposits | 984,666 | 875,537 | 1,683,208 | 890,274 | ||||||
| Total liquidity portfolio | 3,149,403 | 2,888,167 | 3,658,829 | 3,219,446 | ||||||
December 31, | December 31, | |
| Ch$ million | ||
| Average balance as of: | ||
| Financial investments for trading | 412,012 | 488,367 |
| Available for sale investments | 1,706,631 | 2,008,324 |
| Encumbered assets (net) (2) | (100,021) | (72,399) |
| Net cash (3) | 29,812 | 89,849 |
| Net interbank deposits (4) | 858,699 | 501,561 |
| Total liquidity portfolio | 2,907,134 | 3,015,702 |
| December 31, 2015 | December 31, 2014 | |||||||
| Ch$ million | ||||||||
| Average balance as of: | ||||||||
| Financial investments for trading | 405,352 | 571,479 | ||||||
| Available for sale investments | 1,902,050 | 1,673,423 | ||||||
| Encumbered assets (net) (1) | (74,664 | ) | (97,712 | ) | ||||
| Net cash (2) | (244,186 | ) | (50,554 | ) | ||||
| Net interbank deposits (3) | 1,197,325 | 788,958 | ||||||
| Total liquidity portfolio | 3,185,876 | 2,885,594 | ||||||
| (1) |
| Assets encumbered through repurchase agreements are deducted from the liquidity portfolio |
| Includes overnight deposits in the Central Bank, domestic banks and foreign banks |
The Central Bank must also requires us to comply with regulatory limits imposed by the SBIF and the Central Bank that are the following:following liquidity limits:
| · | The sum of the liabilities with a maturity of less than 30 days may not exceed the sum of the assets with a maturity of less than 30 days by |
| · | The sum of the liabilities in foreign currency with a maturity of less than 30 days may not exceed the sum of the assets in foreign currency with a maturity of less than 30 days by more than an amount greater than our capital. At December 31, |
| · | The sum of the liabilities with a maturity of less than 90 days may not exceed the sum of the assets with a maturity of less than 90 days by more than 2 times our capital. This limit must be calculated in local |
currency and foreign currencies together as one gap. At December 31, 2015 the percentage of (i) our liabilities with a maturity of less than 90 days in excess of our assets with a maturity of less than 90 days to (ii) our capital and reserves was 46%.
New liquidity requirements in line with BIS III
The SBIF and the Chilean Central Bank published new liquidity corporate governance standards and ratios that must be implemented and calculated by all banks. These will eventually replace the current regulatory limits imposed by the SBIF and the Central Bank described above. These new liquidity standards are in line with those established in BIS III. The most important liquidity ratios that will eventually be adopted by Chilean banks are:
| · |
| · | Liquidity coverage ratio (LCR), which measures the percentage of Liquid Assets over Net Cash Outflows. The new guidelines also define Liquid Assets and the formulas for calculating Net Cash Outflows. |
| · | Net Stable Funding Ratio (NSFR) which will measure a bank’s stable funding sources over required stables needs both concepts also defined in the new regulations. |
In the first half of 2016, banks must report these ratios to the Central Bank and the SBIF. The evolution of these indicators will be monitored for a 12 month period and further adjustments could be made. The final limits and results should begin to be published in 2017. The initial limits banks must meet to meet in order to comply with these new ratios have not been published yet. For this reason, and even though the Bank has advanced liquidity management models, we cannot assure that the implementation of these models will not have a material effect on our business.
Market risk management
The Bank’s internal management of market risk is based chiefly on the procedures and standards of Santander Spain, which are in turn based on analysis of management in three principal components:
| · | trading portfolio; |
| · | local financial management portfolio; and |
| · | foreign financial management portfolio. |
The trading portfolio is comprised chiefly of investments valued at fair market value and free of any restriction on their immediate sale, which are often bought and sold by the Bank with the intention of selling them in the short term to benefit from short–term price fluctuations. The trading portfolio also includes the Bank’s exposure to foreign currency. The financial management portfolios include all the financial investments not considered to be part of trading portfolio.
Market risk – management of trading portfolio
The Bank applies VaR methodologies to measure the market risk of its trading portfolio. The Bank has a consolidated commercial position comprised of fixed–income investments and foreign currency trading. This portfolio is comprised mostly of Central Bank of Chile bonds, mortgage bonds, locally issued, low–risk corporate bonds and foreign currencies, mainly USU.S. dollars. At the end of each year, the trading portfolio included no stock portfolio investments.
For the Bank, the VaR estimate is made under the historical simulation methodology, which consists of observing the behavior of the profits and losses that would have occurred in the current portfolio if the market conditions for a given historical period had been in force, in order to infer the maximum loss on the basis of that information, with as given degree of confidence. The methodology has the advantage of precisely reflecting the
historical distribution of the market variables and not requiring any assumptions regarding the distribution of specific probabilities. All the VaR measures are intended to determine the distribution function for a change in the value of a given portfolio, and once that distribution is known, to calculate the percentile related to the necessary degree of confidence, which will be equal to the value at risk by virtue of those parameters. As calculated by the Bank, the VaR is an estimate of the maximum expected loss of market value for a given portfolio over a 1–day horizon, with a 99.00% confidence level. It is the maximum 1–day loss that the Bank could expect to experience in a given portfolio, with a 99.00% confidence level. In other words, it is the loss that the Bank would expect to experience only 1.0% of the time. The VaR provides a single estimate of market risk which is not comparable from one market risk to another. Returns are calculated through the use of a 2–year time window or at least 520 data points obtained since the last reference date for calculation of the VaR going backward in time.
We do not calculate three separate VaRs. We calculate a single VaR for the entire trading portfolio, which in addition is segregated by risk type. The VaR software performs a historical simulation and calculates a Profit and Loss Statement (P&L) for 520 data points (days) for each risk factor (fixed income, foreign currency and variable income.) The P&L of each risk factor is added together and a consolidated VaR is calculated with 520 points or days of data. At the same time a VaR is calculated for each risk factor based on the individual P&L calculated for each individual risk factor . Furthermore, a weighted VaR is calculated in the manner described above, but which gives a greater weighting to the 30 most recent data points. The larger of the two VaRs is the one that is reported. In 2013, 20122015, 2014 and 2011,2013, we used the same VaR model and there has been no change in methodology or assumptions for subsequent periods.
The Bank uses the VaR estimates to provide a warning when the statistically estimated incurred losses in its trading portfolio would exceed prudent levels, and hence, there are certain predetermined limits.
Limitations of the VaR model
When applying a calculation methodology, no assumptions are made regarding the probability distribution of the changes in the risk factors; the historically observed changes are used for the risk factors on which each position in the portfolio will be valued.
It is necessary to define a valuation function fj(xi) for each instrument j, preferably the same one used to calculate the market value and income of the daily position. This valuation function will be applied in each scenario to generate simulated prices for all the instruments in each scenario.
In addition, the VaR methodology is subject to the following limitations:
| · | Changes in market rates and prices may not be independent and identically distributed random variables, and may not have a normal distribution; In particular, the assumption of normal distribution may underestimate the probability of extreme market movements; |
| · | The historical data used by the Bank may not provide the best estimate of the joint distribution of changes in the risk factors in the future, and any modification of the data may be inadequate; In particular, the use of historical data may fail to capture the risk of potential extreme and adverse market fluctuations, regardless of the time period used; |
| · | A 1–day time horizon may not fully capture the market risk positions which cannot be liquidated or covered in a single day; It would not be possible to liquidate or cover all the positions in a single day; |
| · | The VaR is calculated at the close of business, but trading positions may change substantially in the course of the trading day; |
| · | The use of a 99% degree of confidence does not take account of, or make any statement about, the losses that could occur outside of that degree of confidence; and |
| · | A model such as the VaR does not capture all the complex effects of the risk factors over the value of the positions or portfolios, and accordingly, it could underestimate potential losses. |
180
At no time in 2013, 20122015, 2014 and 20112013 did the Bank exceed the VaR limits in respect of the three components which comprise the trading portfolio: fixed–income investments, variable–income investments and foreign currency investments. We perform back-testing daily and generally find that trading losses exceed our VaR estimate approximately one out of every 100 trading days. At the same time, we set a limit to the maximum VaR that we are willing to accept over our trading portfolio. In 2013,2015, the Bank remained within the maximum limit it had set for VaR, including those instances in which the actual VaR exceeded the estimate.
The high, low, and average levels for each component and each year below were as follows:
Consolidated | 2013 | 2012 | 2011 |
| (in millions of U.S.$) | |||
| VaR: | |||
| High | 3.48 | 4.62 | 11.02 |
| Low | 1.06 | 0.96 | 2.39 |
| Average | 1.72 | 2.33 | 6.07 |
| Fixed–income investments: | |||
| High | 2.39 | 4.99 | 11.18 |
| Low | 0.97 | 0.95 | 2.54 |
| Average | 1.57 | 2.24 | 6.09 |
| Variable–income investments: | |||
| High | 0.19 | 0.07 | 0.23 |
| Low | 0.00 | 0.00 | 0.00 |
| Average | 0.00 | 0.00 | 0.07 |
Consolidated | 2013 | 2012 | 2011 | 2015 | 2014 | 2013 | |||||||||
| (in millions of U.S.$) | (in millions of U.S.$) | ||||||||||||||
| VaR: | |||||||||||||||
| High | 3.61 | 3.77 | 3.48 | ||||||||||||
| Low | 0.62 | 1.06 | 1.06 | ||||||||||||
| Average | 1.38 | 1.91 | 1.72 | ||||||||||||
| Fixed–income investments: | |||||||||||||||
| High | 3.13 | 3.99 | 2.39 | ||||||||||||
| Low | 0.61 | 1.06 | 0.97 | ||||||||||||
| Average | 1.23 | 1.78 | 1.57 | ||||||||||||
| Variable–income investments: | |||||||||||||||
| High | 0.19 | 0.15 | 0.19 | ||||||||||||
| Low | 0.00 | 0.00 | 0.00 | ||||||||||||
| Average | 0.00 | 0.00 | 0.00 | ||||||||||||
| Foreign currency investments: | |||||||||||||||
| High | 3.20 | 3.23 | 3.87 | 3.43 | 2.39 | 3.20 | |||||||||
| Low | 0.06 | 0.03 | 0.09 | 0.04 | 0.06 | 0.06 | |||||||||
| Average | 0.69 | 0.66 | 0.9 | 0.64 | 0.58 | 0.69 | |||||||||
Market risk – local and foreign financial management
The Bank’s financial management portfolio includes most of the Bank’s non–trading assets and liabilities, including the credit/loan portfolio. For these portfolios, investment and financing decisions are strongly influenced by the Bank’s commercial strategies.
The Bank uses a sensitivity analysis to measure the market risk of local and foreign currency (not included in the trading portfolio). The Bank performs a simulation of scenarios, which will be calculated as the difference between the present value of the flows in the chosen scenario (a curve with a parallel movement of 100 bp in all its segments) and their value in the base scenario (current market). All the inflation–indexed local currency (UF) positions are adjusted by a sensitivity factor of 0.57, which represents a 57 basis point change in the rate curve for the real rates and a 100 basis point change for the nominal rates. The same scenario is performed for the net foreign currency positions and the interest rates in USU.S. dollars. The Bank has also established limits in regard to the maximum loss which these interest rate movements could impose on the capital and net financial income budgeted for the year.
To determine the consolidated limit, the foreign currency limit is added to the local currency limit for both the net financial income loss limit and the loss limit over capital and reserves using the following formula:
Consolidated limit = Square root of a2 + b2 + 2ab
a: limit in local currency.
b: limit in foreign currency.
Since correlation is assumed to be 0. 2ab = 0.
Limitations of the sensitivity models
The most important assumption is the use of a 100 basis point change in the yield curve (57 basis points for the real rates). The Bank uses a 100 basis point change because sudden changes of that magnitude are considered realistic. The Santander Spain Global Risk Department has established comparable limits by country, to be able to compare, monitor and consolidate the market risk by country in a realistic and orderly way. In addition, the sensitivity simulation methodology should be interpreted with consideration for the following limitations:
| · | The simulation of scenarios assumes that the volumes remain in the Bank’s Consolidated General Balance Sheet and are always renewed at maturity, thereby omitting the fact that certain credit risk and prepayment considerations may affect the maturity of certain positions. |
| · | This model assumes an identical change along the entire length of the yield curve and takes no account of the different movements for different maturities. |
| · | The model takes no account of the sensitivity of volumes which results from interest rate changes. |
| · | The limits to losses of budgeted financial income are calculated on the basis of the financial income foreseen for the year, which may not be actually earned, meaning that the real percentage of financial income at risk may be higher than the expected one. |
Market Risk – Financial management portfolio – December 31, 2013, 20122015, 2014 and 20112013
2013 | 2012 | 2011 | 2015 | 2014 | 2013 | |||||||||||||||||||||||||
Effect on net | Effect on | Effect on net | Effect on | Effect on net | Effect on | Effect on net interest income | Effect on equity | Effect on net interest income | Effect on equity | Effect on net interest income | Effect on equity | |||||||||||||||||||
| Financial management portfolio – local currency (in millions of Ch$) | ||||||||||||||||||||||||||||||
| Loss limit | 35,500 | 167,530 | 37,300 | 167,530 | 22,380 | 167,530 | 32,500 | 150,000 | 38,150 | 192,660 | 35,500 | 167,530 | ||||||||||||||||||
| High | 28,923 | 86,196 | 26,233 | 100,175 | 19,823 | 107,745 | 29,721 | 103,091 | 27,707 | 112,133 | 28,923 | 86,196 | ||||||||||||||||||
| Low | 21,129 | 69,729 | 13,885 | 85,546 | 590 | 71,805 | 13,882 | 72,104 | 16,904 | 77,231 | 21,129 | 69,729 | ||||||||||||||||||
| Average | 25,124 | 77,849 | 20,054 | 92,312 | 9,053 | 93,328 | 22,695 | 88,394 | 21,077 | 92,809 | 25,124 | 77,849 | ||||||||||||||||||
| Financial management portfolio – foreign currency (in millions of U.S.$) | ||||||||||||||||||||||||||||||
| Loss limit | 30.0 | 40.0 | 44.0 | 30.0 | 70.0 | 40.0 | 70.0 | 30.0 | 30.0 | |||||||||||||||||||||
| High | 17.2 | 26.0 | 24.3 | 14.7 | 22.8 | 16.0 | 9.0 | 15.0 | 16.0 | 39.0 | 17.2 | 26.0 | ||||||||||||||||||
| Low | 2.1 | 2.3 | 3.7 | 4.5 | 3.0 | 1.2 | — | 5.0 | — | 10.0 | 2.1 | 2.3 | ||||||||||||||||||
| Average | 10.2 | 18.6 | 12.8 | 11.7 | 14.1 | 7.8 | 2.0 | 12.0 | 10.0 | 28.0 | 10.2 | 18.6 | ||||||||||||||||||
| Financial management portfolio – consolidated (in millions of Ch$) | ||||||||||||||||||||||||||||||
| Loss limit | 35,500 | 167,530 | 39,200 | 167,530 | 37,300 | 167,530 | 34,500 | 150,000 | 40,650 | 172,390 | 35,500 | 167,530 | ||||||||||||||||||
| High | 28,958 | 86,212 | 26,437 | 100,201 | 21,149 | 107,845 | 29,232 | 102,002 | 27,949 | 112,364 | 28,958 | 86,212 | ||||||||||||||||||
| Low | 21,204 | 69,787 | 17,037 | 85,566 | 7,032 | 71,863 | 14,129 | 70,741 | 17,441 | 77,848 | 21,204 | 69,787 | ||||||||||||||||||
| Average | 25,146 | 77,891 | 21,165 | 92,457 | 13,004 | 93,417 | 22,390 | 87,095 | 21,404 | 93,245 | 25,146 | 77,891 | ||||||||||||||||||
Market risk –Regulatory method
The following table illustrates our market risk exposure according to the Chilean regulatory method, as of December 31, 2013.2015. This information is sent to the SBIF on a quarterly basis. Our maximum exposure to long-term interest rate fluctuations is set at 35% of regulatory capital and is approved by the board of directors.
Regulatory Market Risk | As of December 31, |
| (Ch$ million) | |
| Market risk of trading portfolio (EMR) | |
| Interest rate risk of trading portfolio | |
| Foreign currency risk of trading portfolio | |
| Risk from interest rate options | |
| Risk from foreign currency options | |
| Total market risk of trading portfolio | |
| 10% x Risk-weighted assets | |
| Subtotal | |
| Limit = Regulatory Capital | |
| Available margin | |
| Non-trading portfolio market risk | |
| Short-term interest rate risk | |
| Inflation risk | |
| Long-term interest rate risk | |
| Total market risk of non-trading portfolio |
|
|
| Regulatory limit of exposure to short-term interest rate and inflation risk | |
| Short-term exposure to interest rate risk | |
| Exposure to inflation risk | |
| Limit: 20% of (net interest income + net fee income sensitive to interest rates) | |
| Available margin | |
| Regulatory limit of exposure to long-term interest rate risk | |
| Long-term exposure to interest rate risk | |
| 35% of regulatory capital | |
| Available margin |
182
Derivative activities
At December 31, 2013, 20122015, 2014 and 2011,2013, derivatives are valued at market price on the balance sheet and the net unrealized gain (loss) on derivatives is classified as a separate line item on the income statement. Notional amounts are not recorded on the balance sheet. Banks must mark to market derivatives. A derivative financial instrument held for trading purposes must be marked to market and the unrealized gain or loss recognized in the income statement. The SBIF recognizes three kinds of hedge accounting: (i) cash flow hedges, (ii) fair value hedges and (iii) hedging of foreign investments.
| · | When a cash flow hedge exists, the fair value movements on the part of the hedging instrument that is effective are recognized in equity. Any ineffective portion of the fair value movement on the hedging instrument is recognized in the income statement. |
| · | When a fair value hedge exists, the fair value movements on the hedging instrument and the corresponding fair value movements on the hedged item are recognized in the income statement. Hedged items in the balance sheet are presented at their market value. |
| · | When a hedge of foreign investment exposure exists (i.e. investment in a foreign branch), the fair value movements on the part of the hedging instrument that is effective are recognized in equity. Any ineffective portion of the fair value movement on the hedging instrument is recognized in the income statement. |
We classify some of our derivative financial instruments as being held for trading, due to the guidelines from the SBIF. However, substantially all of our derivatives are not actually used for speculative purposes or trading. We use derivatives to hedge our exposure to foreign exchange, interest rate and inflation risks. We had the following derivative financial instruments portfolio as of December 31, 2013, 20122015, 2014 and 2011:2013:
As of December 31, 2013 | As of December 31, 2015 | ||||||||||||||||||||||||
Notional amounts | Fair Value | Notional amounts | Fair Value | ||||||||||||||||||||||
Within 3 | After 3 | After one year | Assets | Liabilities | Up to 3 months | More than 3 months to one year | More than one year | Assets | Liabilities | ||||||||||||||||
| (Ch$ million) | (Ch$ million) | ||||||||||||||||||||||||
| Fair value hedge derivative instruments | |||||||||||||||||||||||||
| Currency forwards | - | - | - | - | - | - | |||||||||||||||||||
| Interest rate swaps | - | 55,000 | 375,599 | 9,951 | 1,009 | 327,955 | 1,184,795 | 630,970 | 5,480 | 6,364 | |||||||||||||||
| Cross currency swaps | - | 233,824 | 899,293 | 63,528 | 1,736 | 9,441 | 30,040 | 1,842,421 | 181,557 | 1,483 | |||||||||||||||
| Call currency options | - | - | - | - | - | - | |||||||||||||||||||
| Call interest rate options | - | - | - | - | - | - | |||||||||||||||||||
| Put currency options | - | - | - | - | - | - | |||||||||||||||||||
| Put interest rate options | - | - | - | - | - | - | |||||||||||||||||||
| Interest rate future | - | - | - | - | - | - | |||||||||||||||||||
| Other Derivatives | - | - | - | - | - | - | |||||||||||||||||||
| Subtotal | - | 288,824 | 1,274,892 | 73,479 | 2,745 | 337,396 | 1,214,835 | 2,473,391 | 187,037 | 7,847 | |||||||||||||||
| Cash Flow hedge derivative instruments | |||||||||||||||||||||||||
| Currency forwards | - | - | - | - | - | ||||||||||||||||||||
| Interest rate swaps | - | - | - | - | - | ||||||||||||||||||||
| Cross currency swaps | 7,281,184 | 4,445,006 | 2,720,520 | 273,291 | 69,716 | ||||||||||||||||||||
| Call currency options | - | - | - | - | - | ||||||||||||||||||||
| Call interest rate options | - | - | - | - | - | ||||||||||||||||||||
| Put currency options | - | - | - | - | - | ||||||||||||||||||||
| Put interest rate options | - | - | - | - | - | ||||||||||||||||||||
| Interest rate future | - | - | - | - | - | ||||||||||||||||||||
| Other Derivatives | - | - | - | - | - | ||||||||||||||||||||
| Subtotal | 7,281,184 | 4,445,006 | 2,720,520 | 273,291 | 69,716 | ||||||||||||||||||||
| Derivative instruments for trading | |||||||||||||||||||||||||
| Currency forwards | 18,731,575 | 13,328,727 | 3,459,386 | 341,236 | 318,416 | ||||||||||||||||||||
| Interest rate swaps | 7,272,523 | 15,677,393 | 56,140,894 | 533,416 | 540,011 | ||||||||||||||||||||
| Cross currency swaps | 5,881,627 | 5,898,094 | 44,921,355 | 1,826,977 | 1,883,185 | ||||||||||||||||||||
| Call currency options | 49,067 | 60,380 | 477,057 | 42,325 | 41,451 | ||||||||||||||||||||
| Call interest rate options | - | - | 264,473 | 1,148 | 1,253 | ||||||||||||||||||||
| Put currency options | 48,958 | 52,682 | - | 422 | 684 | ||||||||||||||||||||
| Put interest rate options | - | - | - | - | - | ||||||||||||||||||||
| Interest rate future | - | - | - | - | - | ||||||||||||||||||||
| Other Derivatives | 125,258 | - | - | 74 | 43 | ||||||||||||||||||||
| Subtotal | 32,109,008 | 35,017,276 | 105,263,165 | 2,745,598 | 2,785,043 | ||||||||||||||||||||
| Total | 39,727,588 | 40,677,117 | 110,457,076 | 3,205,926 | 2,862,606 | ||||||||||||||||||||
| As of December 31, 2014 | ||||||||||||||||||||
| Notional amount | Fair value | |||||||||||||||||||
| Up to 3 months | More than 3 months to 1 year | More than 1 year | Assets | Liabilities | ||||||||||||||||
| Ch$mn | ||||||||||||||||||||
| Fair value hedge derivatives | ||||||||||||||||||||
| Currency forwards | — | — | — | — | — | |||||||||||||||
| Interest rate swaps | 97,812 | 846,168 | 668,166 | 9,821 | 2,540 | |||||||||||||||
| Cross currency swaps | — | 193,704 | 694,852 | 110,448 | 7,997 | |||||||||||||||
| Call currency options | — | — | — | — | — | |||||||||||||||
| Call interest rate options | — | — | — | — | — | |||||||||||||||
| Put currency options | — | — | — | — | — | |||||||||||||||
| Put interest rate options | — | — | — | — | — | |||||||||||||||
| Interest rate futures | — | — | — | — | — | |||||||||||||||
| Other derivatives | — | — | — | — | — | |||||||||||||||
| Subtotal | 97,812 | 1,039,872 | 1,363,018 | 120,269 | 10,537 | |||||||||||||||
| Cash flow hedge derivatives | ||||||||||||||||||||
| Currency forwards | — | — | — | — | — | |||||||||||||||
| Interest rate swaps | — | — | — | — | — | |||||||||||||||
| Cross currency swaps | 11,329 | 850,555 | 1,727,283 | 131,880 | 21,996 | |||||||||||||||
| Call currency options | — | — | — | — | — | |||||||||||||||
| Call interest rate options | — | — | — | — | — | |||||||||||||||
| Put currency options | — | — | — | — | — | |||||||||||||||
| Put interest rate options | — | — | — | — | — | |||||||||||||||
| Interest rate futures | — | — | — | — | — | |||||||||||||||
| Other derivatives | — | — | — | — | — | |||||||||||||||
| Subtotal | 11,329 | 850,555 | 1,727,283 | 131,880 | 21,996 | |||||||||||||||
| Trading derivatives | ||||||||||||||||||||
| Currency forwards | 8,740,802 | 20,156,612 | 2,155,381 | 342,726 | 277,789 | |||||||||||||||
| Interest rate swaps | 1,675,560 | 16,147,587 | 37,838,280 | 518,392 | 485,798 | |||||||||||||||
| Cross currency swaps | 524,274 | 4,395,731 | 19,028,968 | 1,609,197 | 1,761,196 | |||||||||||||||
| Call currency options | 160,560 | 89,701 | — | 1,587 | 2,597 | |||||||||||||||
| Call interest rate options | — | — | 103,474 | 795 | 633 | |||||||||||||||
| Put currency options | 153,999 | 157,757 | 34,491 | 2,575 | 485 | |||||||||||||||
| Put interest rate options | — | — | — | — | — | |||||||||||||||
| Interest rate futures | — | — | — | — | — | |||||||||||||||
| Other derivatives | 258,425 | — | — | 142 | 353 | |||||||||||||||
| Subtotal | 11,513,620 | 40,947,388 | 59,160,594 | 2,475,414 | 2,528,851 | |||||||||||||||
| Total | 11,622,761 | 42,837,815 | 62,250,895 | 2,727,563 | 2,561,384 | |||||||||||||||
As of December 31, 2013 | As of December 31, 2013 | ||||||||||||||||||||||||
Notional amounts | Fair Value | Notional amounts | Fair Value | ||||||||||||||||||||||
Within 3 | After 3 | After one year | Assets | Liabilities | Within 3 months | After 3 months but within one year | After one year | Assets | Liabilities | ||||||||||||||||
| (Ch$ million) | (Ch$ million) | ||||||||||||||||||||||||
| Fair value hedge derivative instruments | |||||||||||||||||||||||||
| Currency forwards | — | — | — | — | — | ||||||||||||||||||||
| Interest rate swaps | — | 55,000 | 375,599 | 9,951 | 1,009 | ||||||||||||||||||||
| Cross currency swaps | — | 233,824 | 899,293 | 63,528 | 1,736 | ||||||||||||||||||||
| Call currency options | — | — | — | — | — | ||||||||||||||||||||
| Call interest rate options | — | — | — | — | — | ||||||||||||||||||||
| Put currency options | — | — | — | — | — | ||||||||||||||||||||
| Put interest rate options | — | — | — | — | — | ||||||||||||||||||||
| Interest rate future | — | — | — | — | — | ||||||||||||||||||||
| Other Derivatives | — | — | — | — | — | ||||||||||||||||||||
| Subtotal | — | 288,824 | 1,274,892 | 73,479 | 2,745 | ||||||||||||||||||||
| Cash Flow hedge derivative instruments | |||||||||||||||||||||||||
| Currency forwards | - | — | — | — | — | — | |||||||||||||||||||
| Interest rate swaps | - | — | — | — | — | — | |||||||||||||||||||
| Cross currency swaps | 522,451 | 937,529 | 661,676 | 60,453 | 13,908 | 522,451 | 937,529 | 661,676 | 60,453 | 13,908 | |||||||||||||||
| Call currency options | - | — | — | — | — | — | |||||||||||||||||||
| Call interest rate options | - | — | — | — | — | — | |||||||||||||||||||
| Put currency options | - | — | — | — | — | — | |||||||||||||||||||
| Put interest rate options | - | — | — | — | — | — | |||||||||||||||||||
| Interest rate future | - | — | — | — | — | — | |||||||||||||||||||
| Other Derivatives | - | — | — | — | — | — | |||||||||||||||||||
| Subtotal | 522,451 | 937,529 | 661,676 | 60,453 | 13,908 | 522,451 | 937,529 | 661,676 | 60,453 | 13,908 | |||||||||||||||
| Derivative instruments for trading | |||||||||||||||||||||||||
| Currency forwards | 14,972,304 | 9,801,554 | 1,749,378 | 198,130 | 188,340 | 14,972,304 | 9,801,554 | 1,749,378 | 198,130 | 188,340 | |||||||||||||||
| Interest rate swaps | 4,526,349 | 11,332,697 | 25,005,852 | 241,528 | 242,563 | 4,526,349 | 11,332,697 | 25,005,852 | 241,528 | 242,563 | |||||||||||||||
| Cross currency swaps | 1,634,855 | 3,927,402 | 14,246,746 | 915,099 | 840,718 | 1,634,855 | 3,927,402 | 14,246,746 | 915,099 | 840,718 | |||||||||||||||
| Call currency options | 443,944 | 42,805 | 5,557 | 1,327 | 2,398 | 443,944 | 42,805 | 5,557 | 1,327 | 2,398 | |||||||||||||||
| Call interest rate options | - | 7,031 | - | — | 7,031 | — | — | — | |||||||||||||||||
| Put currency options | 428,638 | 38,450 | 2,936 | 3,831 | 1,108 | 428,638 | 38,450 | 2,936 | 3,831 | 1,108 | |||||||||||||||
| Put interest rate options | - | — | — | — | — | — | |||||||||||||||||||
| Interest rate future | - | — | — | — | — | — | |||||||||||||||||||
| Other Derivatives | 54,777 | - | 171 | 5 | 54,777 | — | — | 171 | 5 | ||||||||||||||||
| Subtotal | 22,060,867 | 25,149,939 | 41,010,469 | 1,360,086 | 1,275,132 | 22,060,867 | 25,149,939 | 41,010,469 | 1,360,086 | 1,275,132 | |||||||||||||||
| Total | 22,583,318 | 26,376,292 | 42,947,037 | 1,494,018 | 1,291,785 | 22,583,318 | 26,376,292 | 42,947,037 | 1,494,018 | 1,291,785 | |||||||||||||||
185
As of December 31, 2012 | |||||
Notional amounts | Fair Value | ||||
Within 3 | After 3 | After one year | Assets | Liabilities | |
| (Ch$ million) | |||||
| Fair value hedge derivative instruments | |||||
| Currency forwards | – | – | – | – | – |
| Interest rate swaps | 95,200 | 397,092 | 395,471 | 12,647 | 4,054 |
| Cross currency swaps | 25,396 | 14,975 | 671,942 | 12,716 | 4,361 |
| Call currency options | – | – | – | – | – |
| Call interest rate options | – | – | – | – | – |
| Put currency options | – | – | – | – | – |
| Put interest rate options | – | – | – | – | – |
| Interest rate future | – | – | – | – | – |
| Other Derivatives | – | – | – | – | – |
| Subtotal | 120,596 | 412,067 | 1,067,413 | 25,363 | 8,415 |
| Cash Flow hedge derivative instruments | |||||
| Currency forwards | 13,704 | – | – | – | 298 |
| Interest rate swaps | – | – | – | – | – |
| Cross currency swaps | 268,693 | 666,668 | 689,045 | 1,851 | 52,589 |
| Call currency options | – | – | – | – | – |
| Call interest rate options | – | – | – | – | – |
| Put currency options | – | – | – | – | – |
| Put interest rate options | – | – | – | – | – |
| Interest rate future | – | – | – | – | – |
| Other Derivatives | – | – | – | – | – |
| Subtotal | 282,397 | 666,668 | 689,045 | 1,851 | 52,887 |
| Derivative instruments for trading | |||||
| Currency forwards | 17,560,012 | 7,109,216 | 563,301 | 159,624 | 187,304 |
| Interest rate swaps | 4,578,678 | 9,882,478 | 13,752,690 | 204,800 | 230,380 |
| Cross currency swaps | 1,126,961 | 3,215,654 | 11,639,636 | 899,174 | 665,100 |
| Call currency options | 413,452 | 8,032 | – | 567 | 1,485 |
| Call interest rate options | 3,917 | 14,458 | 12,481 | 24 | 20 |
| Put currency options | 402,234 | 1,928 | – | 1,777 | 516 |
| Put interest rate options | – | – | – | – | – |
| Interest rate future | – | – | – | – | – |
| Other Derivatives | 19,415 | – | – | 32 | 54 |
| Subtotal | 24,104,669 | 20,231,766 | 25,968,108 | 1,265,998 | 1,084,859 |
| Total | 24,507,662 | 21,310,501 | 27,724,566 | 1,293,212 | 1,146,161 |
As of December 31, 2011 | |||||
Notional amounts | Fair Value | ||||
Within 3 | After 3 | After one year | Assets | Liabilities | |
| (Ch$ million) | |||||
| Fair value hedge derivative instruments | |||||
| Currency forwards | – | – | – | – | – |
| Interest rate swaps | – | 368,885 | 444,845 | 22,374 | 35 |
| Cross currency swaps | 30,989 | – | 277,469 | 20,498 | 869 |
| Call currency options | – | – | – | – | – |
| Call interest rate options | – | – | – | – | – |
| Put currency options | – | – | – | – | – |
| Put interest rate options | – | – | – | – | – |
| Interest rate future | – | – | – | – | – |
| Other Derivatives | – | – | – | – | – |
| Subtotal | 30,989 | 368,885 | 722,314 | 42,872 | 904 |
| Cash Flow hedge derivative instruments | |||||
| Currency forwards | – | – | – | – | – |
| Interest rate swaps | – | – | – | – | – |
| Cross currency swaps | 284,875 | 1,234,882 | 394,050 | 94,544 | 713 |
| Call currency options | – | – | – | – | – |
| Call interest rate options | – | – | – | – | – |
| Put currency options | – | – | – | – | – |
| Put interest rate options | – | – | – | – | – |
| Interest rate future | – | – | – | – | – |
| Other Derivatives | – | – | – | – | – |
| Subtotal | 284,875 | 1,234,882 | 394,050 | 94,544 | 713 |
| Derivative instruments for trading | |||||
| Currency forwards | 14,305,612 | 8,473,390 | 604,935 | 264,574 | 217,022 |
| Interest rate swaps | 5,527,118 | 11,459,132 | 13,716,043 | 265,084 | 302,327 |
| Cross currency swaps | 1,405,419 | 2,511,430 | 10,688,479 | 934,045 | 769,203 |
| Call currency options | 36,180 | 23,502 | – | 740 | 560 |
| Call interest rate options | 5,855 | 18,773 | 29,672 | 68 | 256 |
| Put currency options | 14,416 | 17,503 | – | 750 | 1,017 |
| Put interest rate options | – | – | – | – | – |
| Interest rate future | – | – | – | – | – |
| Other Derivatives | 102,084 | 1,694 | – | 219 | 400 |
| Subtotal | 21,396,684 | 22,505,424 | 25,039,129 | 1,464,480 | 1,290,785 |
| Total | 21,712,548 | 24,109,191 | 26,155,493 | 1,601,896 | 1,292,402 |
Other subsidiaries
For VaR measurements and scenario simulations, our consolidated trading and consolidated non-trading portfolios do not consolidate the asset liability structure of the following subsidiaries:
| · | Santander S.A. Corredores de Bolsa |
| · | Santander S.A. Sociedad Securitizadora |
| · | Santander Corredores de Seguros Ltda. |
The balance sheets of these subsidiaries are mainly comprised of non-sensitive assets and liabilities, fixed assets and capital and in total only represent 0.7%0.4% of our total consolidated assets.
ITEM 12. DESCRIPTION OF SECURITIES OTHER THAN EQUITY SECURITIES
| A. | Debt Securities |
Not applicable.
| B. | Warrants and Right |
Not applicable.
| C. | Other Securities |
Not applicable.
| D. | American Depositary Shares |
Our Depositary is JPMorgan ChaseThe Bank N.A.,of New York Mellon, with its principal executive office located at 270 Park Avenue,One Wall Street, New York, NY 10017-2070.N.Y. 10286.
Each ADS represents the right to receive 400 shares of Common Stock without par value.
Cancellation of ADSs for the
| |||
| $ | Any cash distribution to ADS holders | ||
| Distribution of | |||
| Depositary services | |||
| Registration and transfer fees | Transfer and registration of shares on our share register to or | ||
| ||
| Taxes and other governmental charges
| As necessary
| |
| Any other charges incurred by the Depositary |
1The Depositary may sell (by publiccollect any of its fees by deducting those fees from any cash distributions payable to owners, or private sale) sufficient securitiesby selling a portion of distributable property to pay the fees. The Depositary may also collect its annual fee for Depositary services and property receivedits fees for any other charges incurred by deducting those fees from any cash distributions or by directly billing ADS holders.
The Depositary may convert currency itself or through any of its affiliates and, in respectthose cases, acts as principal for its own account and not as agent, advisor, broker or fiduciary on behalf of suchany other person and earns revenue, including, without limitation, transaction spreads, that it will retain for its own account. The revenue is based on, among other things, the difference between the exchange rate assigned to the currency conversion made under the Deposit Agreement and the rate that the Depositary or its affiliate receives when buying or selling foreign currency for its own account. The Depositary makes no representation that the exchange rate used or obtained in any currency conversion under the Deposit Agreement will be the most favorable rate that could be obtained at the time or that the method by which that rate will be determined will be the most favorable to ADS holders, subject to the Depositary’s obligations under the Deposit Agreement. The methodology used to determine exchange rates used in currency conversions is available upon request.
In performing its duties under the Deposit Agreement, the Depositary may use brokers, dealers, foreign currency dealers or other service providers that are owned by or affiliated with the Depositary and that may earn or share distributions, rights and other distributions prior to such deposit to cover such charge.fees, spreads or commissions.
Direct and Indirect Payments
The Depositary has agreed to make payments to us to reimburse certainus for costs and expenses generally arising out of our reasonableestablishment and maintenance of the ADS program, waive fees and expenses relatedfor services provided to our ADR program and incurredus by us in connection with the program.Depositary or share revenue from the fees collected from ADS holders from time to time. Under certain circumstances, including termination of the program, we are required to repay to the Depositary amounts reimbursed in prior periods.
The reimbursements include direct payments (legal and accounting fees incurred in connection with preparation of Form 20-F and ongoing SEC compliance and listing requirements, listing fees, investor relations expenses, advertising and public relations expenses and fees payable to service providers for the distribution of hard copy materials to beneficial ADR holders in the Depositary Trust Company, such as information related to shareholders’ meetings and related voting instruction cards); and indirect payments (third-party expenses paid directly and fees waived).
In 2013,2015, the Depositary made direct payments and reimbursements to us in the gross amount of U.S.$821,921 $896,604 for expenses related to investor relations of which 30% was withheld for tax purposes in the U.S. Of this total, US$836,604 was paid by JPMorgan Chase Bank, N.A., which was the Depositary until August 3, 2015, and US$60,000 was paid by The Bank of New York Mellon, which has been the Depositary since August 4, 2015.
PART II
ITEM 13. DEFAULTS, DIVIDEND ARREARAGES AND DELINQUENCIES
Not applicable.
ITEM 14. MATERIAL MODIFICATIONS TO THE RIGHTS OF SECURITY HOLDERS AND USE OF PROCEEDS
Not applicable.
ITEM 15. CONTROLS AND PROCEDURES
Conclusion Regarding the Effectiveness of Disclosure Controls and Procedures
As of December 31, 2013,2015, the Bank, under the supervision and with the participation of the Bank’s management, including its Disclosure Committee, the Chief Executive Officer, the Chief Financial Officer and the Financial Controller, performed an evaluation of the effectiveness of the design and operation of our disclosure controls and procedures (as defined in Rule 13a-15(e) under the Exchange Act). There are, as described below, inherent limitations to the effectiveness of any control system, including disclosure controls and procedures. Accordingly, even effective disclosure controls and procedures can provide only reasonable assurance of achieving their control objectives.
Based on such evaluation, the Bank’s Disclosure Committee, the Chief Executive Officer, the Chief Financial Officer and the Financial Controller concluded that the Bank’s disclosure controls and procedures were effective in ensuring that information relating to the Bank, including its consolidated subsidiaries, required to be disclosed in the reports it files under the Exchange Act is (1) recorded, processed, summarized and reported within the time periods specified in the SEC’s rules and forms, and (2) accumulated and communicated to the Bank’s management, including its Disclosure Committee and principal financial officers as appropriate to allow timely decisions regarding required disclosure.
Management’s Report on Internal Control Over Financial Reporting
The Bank’s management is responsible for establishing and maintaining adequate internal control over financial reporting as defined in Rule 13a-15(f) under the Exchange Act. The Bank’s internal control over financial reporting is a process designed by, or under the supervision of, the Bank’s principal executive and principal financial officers and effected by the Bank’s board of directors, management and other personnel, to provide reasonable assurance regarding the reliability of financial reporting and the preparation of financial statements for external purposes in accordance with IFRS-IASB and includes those policies and procedures that:
| · |
| · |
| · |
Because of its inherent limitations, internal control over financial reporting, no matter how well designed may not prevent or detect misstatements, due to the possibility that a control can be circumvented or overridden or that misstatements due to error or fraud may occur that are not detected. Also, projections of any evaluation of effectiveness to future periods are subject to the risk that controls may become inadequate because of changes in conditions, or that the degree of compliance with the policies or procedures may deteriorate.
We have adapted our internal control over financial reporting to the most rigorous international standards and comply with the guidelines set by the Committee of Sponsoring Organizations of the Treadway Commission in itsInternal Control―Integrated Framework (2013). The general framework assigns to management specific responsibilities regarding the structure and effectiveness of the processes related directly and indirectly with the production of consolidated financial statements, as well as the controls needed to mitigate the risks inherent in these processes.
Under the supervision and with the participation of the Bank’s management, including the Disclosure Committee, the Chief Executive Officer, the Chief Financial Officer and the Financial Controller, we conducted an evaluation of the effectiveness of our internal control over financial reporting based on the criteria established inInternal Control—Integrated Framework (1992)(2013) issued by the Committee of Sponsoring Organizations of the Treadway Commission (“COSO”).
Based on this assessment, our management concluded that, as of December 31, 2013,2015, our internal control over financial reporting was effective based on those criteria.
Our internal control over financial reporting as of December 31, 2013 has been audited by an independent registered public accounting firm, as stated in its report, which follows below.
Changes in Internal Control Over Financial Reporting
There has been no change in the Bank’s internal control over financial reporting (as defined in Rule 13a-15(f) under the Exchange Act) that occurred during the period covered by this Annual Report that has materially affected, or is reasonably likely to materially affect, internal control over financial reporting.
Our internal control over financial reporting as of December 31, 2015 has been audited by an independent registered public accounting firm, as stated in its report, which follows below.
189
Report of Independent Registered Public Accounting Firm
 | Deloitte Auditores y Consultores Limitada Rosario Norte 407 Las Condes, Santiago Chile Fono: (56) 227 297 000 Fax: (56) 223 749 177 deloittechile@deloitte.com www.deloitte.cl |
REPORT OF INDEPENDENT REGISTERED PUBLIC ACCOUNTING FIRM
To the Board of Directors and Shareholders of
Banco Santander Chile
We have audited the internal control over financial reporting of Banco Santander Chile and subsidiaries (the “Bank”) as of December 31, 2013,2015, based on criteria established inInternal Control-Integrated Framework (1992) (2013) issued by the Committee of Sponsoring Organizations of the Treadway Commission. The Bank’s management is responsible for maintaining effective internal control over financial reporting and for its assessment of the effectiveness of internal control over financial reporting, included in the accompanyingManagement’s Report on Internal Control Over Financial Reporting. Our responsibility is to express an opinion on the Bank’s internal control over financial reporting based on our audit.
We conducted our audit in accordance with the standards of the Public Company Accounting Oversight Board (United States of America). Those standards require that we plan and perform the audit to obtain reasonable assurance about whether effective internal control over financial reporting was maintained in all material respects. Our audit included obtaining an understanding of internal control over financial reporting, assessing the risk that a material weakness exists, testing and evaluating the design and operating effectiveness of internal control based on the assessed risk, and performing such other procedures as we considered necessary in the circumstances. We believe that our audit provides a reasonable basis for our opinion.
A company’s internal control over financial reporting is a process designed by, or under the supervision of, the company’s principal executive and principal financial officers, or persons performing similar functions, and effected by the company’s board of directors, management, and other personnel to provide reasonable assurance regarding the reliability of financial reporting and the preparation of financial statements for external purposes in accordance with generally accepted accounting principles. A company’s internal control over financial reporting includes those policies and procedures that (1) pertain to the maintenance of records that, in reasonable detail, accurately and fairly reflect the transactions and dispositions of the assets of the company; (2) provide reasonable assurance that transactions are recorded as necessary to permit preparation of financial statements in accordance with generally accepted accounting principles, and that receipts and expenditures of the company are being made only in accordance with authorizations of management and directors of the company; and (3) provide reasonable assurance regarding prevention or timely detection of unauthorized acquisition, use, or disposition of the company’s assets that could have a material effect on the financial statements.
Because of the inherent limitations of internal control over financial reporting, including the possibility of collusion or improper management override of controls, material misstatements due to error or fraud may not be prevented or detected on a timely basis. Also, projections of any evaluation of the effectiveness of the internal control over financial reporting to future periods are subject to the risk that the controls may become inadequate because of changes in conditions, or that the degree of compliance with the policies or procedures may deteriorate.
In our opinion, the Bank maintained, in all material respects, effective internal control over financial reporting as of December 31, 2013,2015, based on the criteria established inInternal Control-Integrated Framework (1992) (2013) issued by the Committee of Sponsoring Organizations of the Treadway Commission.
We have also audited, in accordance with the standards of the Public Company Accounting Oversight Board (United States of America), the consolidated financial statements as of and for the year ended December 31, 20132015 of the Bank and our report dated April 30, 2014May 1, 2016 expressed an unqualified opinion on those financial statements and included an explanatory paragraph regardingparagraphs regarding: 1) the translation of Chilean peso amounts into U.S. dollar amounts in conformity with the basis stated in Note 1e.1e) and that such U.S. dollar amounts are presented solely for the convenience of readers outside Chile; and 2) the 2014 and 2013 consolidated financial statements have been adjusted by the Bank to give retrospective affect to certain changes in the United States of America.its reporting segments.
/s/ Deloitte Auditores y Consultores Limitada
April 30, 2014
Santiago, Chile
May 1, 2016
Deloitte® se refiere a Deloitte Touche Tohmatsu Limited una compañía privada limitada por garantía, de Reino Unido, y a su red de firmas miembro, cada una de las cuales es una entidad legal separada e independiente. Por favor, vea en www.deloitte.cl/ acercade la descripción detallada de la estructura legal de Deloitte Touche Tohmatsu Limited y sus firmas miembro. Deloitte Touche Tohmatsu Limited es una compañía privada limitada por garantía constituida en Inglaterra & Gales bajo el número 07271800, y su domicilio registrado: Hill House, 1 Little New Street, London, EC4A 3TR, Reino Unido. |
191
ITEM 16A. AUDIT COMMITTEE FINANCIAL EXPERT
Our Board of Directors has determined that one of the members of our Audit Committee, Víctor Arbulú Crousillat,Mauricio Larraín, meets the requirements of an “audit committee financial expert” in accordance with SEC rules and regulations, in that he has an understanding of IFRS-IASB and financial statements, the ability to assess the general application of IFRS-IASB in connection with the accounting for estimates, accruals and reserves, experience analyzing and evaluating financial statements that present a breadth and level of complexity of accounting issues that are generally comparable to the breadth and complexity of issues that can reasonably be expected to be raised by our consolidated financial statements, an understanding of internal controls over financial reporting, and an understanding of audit committee functions. All four members of our Audit Committee have experience overseeing and assessing the performance of Santander-Chile and its consolidated subsidiaries and our external auditors with respect to the preparation, auditing and evaluation of our consolidated financial statements.
All four members of our Audit Committee are considered to be independent according to applicable NYSE criteria. Víctor Arbulú CrousillatMauricio Larraín is relying on the exemption provided by Rule 10A-3(b)(1)(iv)(B), which allows an otherwise independent director to serve on both the audit committee of the issuer and the Board of Directors of an affiliate.
The Bank has adopted a code of ethics that is applicable to all of the Bank’s employees and a copy is included as an exhibit hereto. We will provide to any person without charge, upon request, a copy of our code of ethics. Please email rmorenoh@santander.clrobert.moreno@santander.cl to request a copy. Our code of ethics is available on our website, which does not form part of this Annual Report on Form 20-F, at www.santander.cl under the heading “Información Corporativa”.
ITEM 16C. PRINCIPAL ACCOUNTANT FEES AND SERVICES
Amounts paid to the auditors for statutory audit and other services were as follows:
2013 | 2012 | 2015 | 2014 | |||||||
| (in millions of Ch$) | (in millions of Ch$) | |||||||||
| Audit Fees | ||||||||||
| - Statutory audit | 478 | 494 | 509 | 427 | ||||||
| - Audit-related regulatory reporting | 256 | 255 | 245 | 373 | ||||||
| - Other audit-related fees | 63 | 320 | ||||||||
| Tax Fees | ||||||||||
| - Compliance | – | - | – | |||||||
| - Advisory Services | 34 | 67 | 264 | 53 | ||||||
| All Other Fees | 657 | 219 | ||||||||
| Total | 1,425 | 1,035 | 1,081 | 1,173 | ||||||
Statutory audit: Consists of fees billed for professional services rendered in connection with the audit of our consolidated financial statements that are provided by Deloitte Auditores y Consultores Limitada in connection with statutory and regulatory filings or engagements, and attest services.
Audit-related regulatory reporting: Consists of fees billed for assurance and related services that were specifically related to the performance of the audit and review of our filings under the Securities Act.
Tax fees: Consist of fees billed for related services that were specifically related to tax related matters such as assuring the Bank was in compliance with tax laws and other tax advisory services.
Other fees: ConsistThe audit committee is required to pre-approve the audit and non-audit services performed by the Bank auditors in order to assure that the provision of feessuch services do not impair the audit firm’s independence.
In the first months of each year the audit committee proposes to the board the appointment of the independent auditor. As a matter of policy, at that time, the audit committee pre-approves the audit and audit related services that the appointed auditors will be required to preparing various forms and prospectuses.carry out during the year to comply with the applicable regulation. These services will be included in the corresponding audit contracts of the Bank with its principal auditing firm.
AuditorsIn addition, under such policy, non-recurring audit or audit-related services and all non-audit services provided by the Bank principal auditing firm or other auditing firms are pre-approvedsubject to case-by-case approval by the audit committee.
The Chief Accounting Officer is in charge of managing the process and must report monthly to the audit committee detailing all services to be provided by auditors, and others requiring individual approval.
All services provided by the Bank principal auditing firm in 2015 detailed in the table above were approved by the Audit Committee. The selection of external auditors is subject to approval by shareholders at the Annual Shareholders’ Meeting. All proposed payments have been presented to our Audit Committee, which has determined that they are reasonable and consistent with internal policies.Compliance Committee.
ITEM 16D. EXEMPTIONS FROM THE LISTING STANDARDS FOR AUDIT COMMITTEES
Not applicable.
ITEM 16E. PURCHASES OF EQUITY SECURITIES BY THE ISSUER AND AFFILIATED PURCHASERS
In 2013,2015, neither Santander-Chile nor any of its affiliates purchased any of Santander-Chile’s equity securities.
ITEM 16F. CHANGE IN REGISTRANT’S CERTIFYING ACCOUNTANT
Not applicable.On April 26, 2016, we announced that the board of directors selected PricewaterhouseCoopers Consultores, Auditores y Compañía Limitada to be our independent registered public accounting firm for the 2016 fiscal year. Such selection was adopted at the proposal of the audit committee in accordance with the corporate governance guidelines recommending periodic rotation of the independent registered public accounting firm, following a transparent selection process.This selection was approved by the shareholders at the annual shareholders’ meeting held on April 26, 2016. Accordingly, on April 26, 2016, Deloitte Auditores y Consultores Limitada was dismissed and was not re-elected for another term as our independent registered public accounting firm.
The report of Deloitte Auditores y Consultores Limitada on our financial statements for financial years ended December 31, 2015, 2014 and 2013 did not contain any adverse opinion or disclaimer of opinion and was not qualified or modified as to uncertainty, audit scope or accounting principles. There was no disagreement whatsoever relating to the years ended December 31, 2015, 2014, and 2013 and the period from January 1, 2016 through April 26, 2016 with Deloitte Auditores y Consultores Limitada on any matter of accounting principles or practices, financial statement disclosure, or auditing scope or procedure, which disagreement, if not resolved to the satisfaction of the former auditor, would have caused them to make reference to the subject matter of the disagreement in connection with their report, or any “reportable event” as described in Item 16F(a)(1)(v) of Form 20-F.
Further in the two years prior to December 31, 2015, we have not consulted with PricewaterhouseCoopers Consultores, Auditores y Compañía Limitada regarding either (i) the application of accounting principles to a specified transaction, either completed or proposed, or the type of audit opinion that might be rendered with respect to our consolidated financial statements, and neither a report was provided to us or oral advice was provided that PricewaterhouseCoopers Consultores, Auditores y Compañía Limitada concluded was an important factor considered by us in reaching a decision as to the accounting, auditing or financial reporting issue; or (ii) any matter that was either the subject of a disagreement as that term is used in Item 16F(a)(1)(iv) of Form 20-F or a “reportable event” as described in Item 16F(a)(1)(v) of Form 20-F.
We have provided a copy of the above statements to Deloitte Auditores y Consultores Limitada and requested that Deloitte Auditores y Consultores Limitada furnish us with a letter addressed to the SEC stating whether or not they agree with the above disclosure. A copy of that letter, dated May 2, 2016, is filed as an exhibit to this Annual Report.
ITEM 16G. CORPORATE GOVERNANCE
Summary Comparison of Corporate Governance Standards and NYSE Listed Company Standards
Our corporate governance standards, dictated by Chilean corporate law, differ from the standards followed by U.S. companies under the New York Stock Exchange (NYSE) listing standards in a number of ways. Consequently, you will not have the same protections afforded to shareholders of companies that are subject to all NYSE corporate governance requirements. The following is a non-exhaustive summary of a few key differences:
| · | Whether a company’s executive officers may serve as its directors – the NYSE standards do not prohibit a U.S. company’s executive officer from also serving as a director, whereas our corporate governance standards prohibits this. |
| · | Whether the shareholders must be given an opportunity to vote on equity-compensation plans – the NYSE standards require that shareholders be allowed to vote on all equity compensation plans of a U.S. company, |
| whereas our corporate governance standards only require that shareholders be allowed to vote on director compensation. |
| · | The adoption and disclosure of corporate governance guidelines – the NYSE standards require all U.S. companies listed on the NYSE to adopt the NYSE corporate governance guidelines, whereas we follow the corporate governance guidelines established under Chilean law. |
As more than 50% of our voting power is held by another company, Santander Spain, we would be permitted to elect for certain exemptions under NYSE corporate governance standards if we were a U.S. company. Specifically, as a U.S. company, we could elect to be exempted from the requirements (i) that we have a majority of independent directors (as defined by the NYSE), (ii) that we have a nominating/corporate governance committee meeting certain conditions, and (iii) that we have a compensation committee meeting certain requirements. Because we would not be required to follow these standards if we were a U.S. company, we have not summarized the differences, if any, between these provisions and our own corporate governance procedures.
REPORT OF INDEPENDENT REGISTERED PUBLIC ACCOUNTING FIRM
To the Board of Directors and Shareholders of
Banco Santander Chile
We have audited the internal control over financial reporting of Banco Santander Chile and subsidiaries (the “Bank”) as of December 31, 2015, based on criteria established inInternal Control-Integrated Framework (2013) issued by the Committee of Sponsoring Organizations of the Treadway Commission. The Bank’s management is responsible for maintaining effective internal control over financial reporting and for its assessment of the effectiveness of internal control over financial reporting, included in the accompanyingManagement’s Report on Internal Control Over Financial Reporting. Our responsibility is to express an opinion on the Bank’s internal control over financial reporting based on our audit.
We conducted our audit in accordance with the standards of the Public Company Accounting Oversight Board (United States of America). Those standards require that we plan and perform the audit to obtain reasonable assurance about whether effective internal control over financial reporting was maintained in all material respects. Our audit included obtaining an understanding of internal control over financial reporting, assessing the risk that a material weakness exists, testing and evaluating the design and operating effectiveness of internal control based on the assessed risk, and performing such other procedures as we considered necessary in the circumstances. We believe that our audit provides a reasonable basis for our opinion.
A company’s internal control over financial reporting is a process designed by, or under the supervision of, the company’s principal executive and principal financial officers, or persons performing similar functions, and effected by the company’s board of directors, management, and other personnel to provide reasonable assurance regarding the reliability of financial reporting and the preparation of financial statements for external purposes in accordance with generally accepted accounting principles. A company’s internal control over financial reporting includes those policies and procedures that (1) pertain to the maintenance of records that, in reasonable detail, accurately and fairly reflect the transactions and dispositions of the assets of the company; (2) provide reasonable assurance that transactions are recorded as necessary to permit preparation of financial statements in accordance with generally accepted accounting principles, and that receipts and expenditures of the company are being made only in accordance with authorizations of management and directors of the company; and (3) provide reasonable assurance regarding prevention or timely detection of unauthorized acquisition, use, or disposition of the company’s assets that could have a material effect on the financial statements.
Because of the inherent limitations of internal control over financial reporting, including the possibility of collusion or improper management override of controls, material misstatements due to error or fraud may not be prevented or detected on a timely basis. Also, projections of any evaluation of the effectiveness of the internal control over financial reporting to future periods are subject to the risk that the controls may become inadequate because of changes in conditions, or that the degree of compliance with the policies or procedures may deteriorate.
In our opinion, the Bank maintained, in all material respects, effective internal control over financial reporting as of December 31, 2015, based on the criteria established inInternal Control-Integrated Framework (2013) issued by the Committee of Sponsoring Organizations of the Treadway Commission.
We have also audited, in accordance with the standards of the Public Company Accounting Oversight Board (United States of America), the consolidated financial statements as of and for the year ended December 31, 2015 of the Bank and our report dated May 1, 2016 expressed an unqualified opinion on those financial statements and included explanatory paragraphs regarding: 1) the translation of Chilean peso amounts into U.S. dollar amounts in conformity with the basis stated in Note 1e) and that such U.S. dollar amounts are presented solely for the convenience of readers outside Chile; and 2) the 2014 and 2013 consolidated financial statements have been adjusted by the Bank to give retrospective affect to certain changes in its reporting segments.
/s/ Deloitte Auditores y Consultores Limitada
Santiago, Chile
May 1, 2016
Deloitte® se refiere a Deloitte Touche Tohmatsu Limited una compañía privada limitada por garantía, de Reino Unido, y a su red de firmas miembro, cada una de las cuales es una entidad legal separada e independiente. Por favor, vea en www.deloitte.cl/ acercade la descripción detallada de la estructura legal de Deloitte Touche Tohmatsu Limited y sus firmas miembro. Deloitte Touche Tohmatsu Limited es una compañía privada limitada por garantía constituida en Inglaterra & Gales bajo el número 07271800, y su domicilio registrado: Hill House, 1 Little New Street, London, EC4A 3TR, Reino Unido. |
191
ITEM 16. [RESERVED]
ITEM 16A. AUDIT COMMITTEE FINANCIAL EXPERT
Our Board of Directors has determined that one of the members of our Audit Committee, Mauricio Larraín, meets the requirements of an “audit committee financial expert” in accordance with SEC rules and regulations, in that he has an understanding of IFRS-IASB and financial statements, the ability to assess the general application of IFRS-IASB in connection with the accounting for estimates, accruals and reserves, experience analyzing and evaluating financial statements that present a breadth and level of complexity of accounting issues that are generally comparable to the breadth and complexity of issues that can reasonably be expected to be raised by our consolidated financial statements, an understanding of internal controls over financial reporting, and an understanding of audit committee functions. All four members of our Audit Committee have experience overseeing and assessing the performance of Santander-Chile and its consolidated subsidiaries and our external auditors with respect to the preparation, auditing and evaluation of our consolidated financial statements.
All four members of our Audit Committee are considered to be independent according to applicable NYSE criteria. Mauricio Larraín is relying on the exemption provided by Rule 10A-3(b)(1)(iv)(B), which allows an otherwise independent director to serve on both the audit committee of the issuer and the Board of Directors of an affiliate.
ITEM 16B. CODE OF ETHICS
The Bank has adopted a code of ethics that is applicable to all of the Bank’s employees and a copy is included as an exhibit hereto. We will provide to any person without charge, upon request, a copy of our code of ethics. Please email robert.moreno@santander.cl to request a copy. Our code of ethics is available on our website, which does not form part of this Annual Report on Form 20-F, at www.santander.cl under the heading “Información Corporativa”.
ITEM 16C. PRINCIPAL ACCOUNTANT FEES AND SERVICES
Amounts paid to the auditors for statutory audit and other services were as follows:
| 2015 | 2014 | |||||||
| (in millions of Ch$) | ||||||||
| Audit Fees | ||||||||
| - Statutory audit | 509 | 427 | ||||||
| - Audit-related regulatory reporting | 245 | 373 | ||||||
| - Other audit-related fees | 63 | 320 | ||||||
| Tax Fees | ||||||||
| - Compliance | - | – | ||||||
| - Advisory Services | 264 | 53 | ||||||
| Total | 1,081 | 1,173 | ||||||
Statutory audit: Consists of fees billed for professional services rendered in connection with the audit of our consolidated financial statements that are provided by Deloitte Auditores y Consultores Limitada in connection with statutory and regulatory filings or engagements, and attest services.
Audit-related regulatory reporting: Consists of fees billed for assurance and related services that were specifically related to the performance of the audit and review of our filings under the Securities Act.
Tax fees: Consist of fees billed for related services that were specifically related to tax related matters such as assuring the Bank was in compliance with tax laws and other tax advisory services.
The audit committee is required to pre-approve the audit and non-audit services performed by the Bank auditors in order to assure that the provision of such services do not impair the audit firm’s independence.
In the first months of each year the audit committee proposes to the board the appointment of the independent auditor. As a matter of policy, at that time, the audit committee pre-approves the audit and audit related services that the appointed auditors will be required to carry out during the year to comply with the applicable regulation. These services will be included in the corresponding audit contracts of the Bank with its principal auditing firm.
In addition, under such policy, non-recurring audit or audit-related services and all non-audit services provided by the Bank principal auditing firm or other auditing firms are subject to case-by-case approval by the audit committee.
The Chief Accounting Officer is in charge of managing the process and must report monthly to the audit committee detailing all services to be provided by auditors, and others requiring individual approval.
All services provided by the Bank principal auditing firm in 2015 detailed in the table above were approved by the Audit and Compliance Committee.
ITEM 16D. EXEMPTIONS FROM THE LISTING STANDARDS FOR AUDIT COMMITTEES
Not applicable.
ITEM 16E. PURCHASES OF EQUITY SECURITIES BY THE ISSUER AND AFFILIATED PURCHASERS
In 2015, neither Santander-Chile nor any of its affiliates purchased any of Santander-Chile’s equity securities.
ITEM 16F. CHANGE IN REGISTRANT’S CERTIFYING ACCOUNTANT
On April 26, 2016, we announced that the board of directors selected PricewaterhouseCoopers Consultores, Auditores y Compañía Limitada to be our independent registered public accounting firm for the 2016 fiscal year. Such selection was adopted at the proposal of the audit committee in accordance with the corporate governance guidelines recommending periodic rotation of the independent registered public accounting firm, following a transparent selection process.This selection was approved by the shareholders at the annual shareholders’ meeting held on April 26, 2016. Accordingly, on April 26, 2016, Deloitte Auditores y Consultores Limitada was dismissed and was not re-elected for another term as our independent registered public accounting firm.
The report of Deloitte Auditores y Consultores Limitada on our financial statements for financial years ended December 31, 2015, 2014 and 2013 did not contain any adverse opinion or disclaimer of opinion and was not qualified or modified as to uncertainty, audit scope or accounting principles. There was no disagreement whatsoever relating to the years ended December 31, 2015, 2014, and 2013 and the period from January 1, 2016 through April 26, 2016 with Deloitte Auditores y Consultores Limitada on any matter of accounting principles or practices, financial statement disclosure, or auditing scope or procedure, which disagreement, if not resolved to the satisfaction of the former auditor, would have caused them to make reference to the subject matter of the disagreement in connection with their report, or any “reportable event” as described in Item 16F(a)(1)(v) of Form 20-F.
Further in the two years prior to December 31, 2015, we have not consulted with PricewaterhouseCoopers Consultores, Auditores y Compañía Limitada regarding either (i) the application of accounting principles to a specified transaction, either completed or proposed, or the type of audit opinion that might be rendered with respect to our consolidated financial statements, and neither a report was provided to us or oral advice was provided that PricewaterhouseCoopers Consultores, Auditores y Compañía Limitada concluded was an important factor considered by us in reaching a decision as to the accounting, auditing or financial reporting issue; or (ii) any matter that was either the subject of a disagreement as that term is used in Item 16F(a)(1)(iv) of Form 20-F or a “reportable event” as described in Item 16F(a)(1)(v) of Form 20-F.
We have provided a copy of the above statements to Deloitte Auditores y Consultores Limitada and requested that Deloitte Auditores y Consultores Limitada furnish us with a letter addressed to the SEC stating whether or not they agree with the above disclosure. A copy of that letter, dated May 2, 2016, is filed as an exhibit to this Annual Report.
ITEM 16G. CORPORATE GOVERNANCE
Summary Comparison of Corporate Governance Standards and NYSE Listed Company Standards
Santander-Chile has adopted diverse measuresOur corporate governance standards, dictated by Chilean corporate law, differ from the standards followed by U.S. companies under the New York Stock Exchange (NYSE) listing standards in a number of ways. Consequently, you will not have the same protections afforded to promote goodshareholders of companies that are subject to all NYSE corporate governance. Among the measures adopted are:governance requirements. The following is a non-exhaustive summary of a few key differences:
| · |
| · |
| · | The |
Santander-Chile has a commitment to transparency. This includes:
In addition, our corporate governance practices reflect the Santander Spain corporate governance framework described below.
In December 2012, primarily in response to the requirements of the European Banking Authority, our controlling shareholder, Santander Spain, adopted a corporate governance framework (Marco de Gobierno Interno del Grupo Santander). The purpose of the framework is to organize and standardize the corporate governance
practices of Santander Spain and its most significant subsidiaries, including us, in order to enhance the ability of Santander Spain to manage the risks arising from its operations around the world.
The three pillars of the framework are (i) an organizational model based on functions subject to internal governance, (ii) terms of reference according to which Santander Spain exercises control and oversight over its subsidiaries and participates in specific decisions at the subsidiary level and (iii) corporate models establishing common guidelines for the management and control of Santander Spain’s subsidiaries, subject to local autonomy considerations. In general, the framework purports to implement organizational and procedural changes rather than mandating particular substantive outcomes. However, in some cases, and subject to the limitations set forth in the framework, the framework states that Santander Spain may require that its subsidiaries make substantive changes or take specific actions. The framework enables Santander Spain to participate in the decision-making processes of its subsidiaries by requiring its approval of certain decisions that may have a significant impact on the Santander Group as a whole due to their significance or potential risk, such as decisions relating to mergers and acquisitions, capital structure, dividends and risk appetite, among other things. The framework also requires that a single person at each subsidiary be in charge of each function subject to internal governance and gives Santander Spain the authority to participate in the appointment, evaluation and compensation of each such person.
By its own terms, the framework as a whole is premised on the legal and financial autonomy of the subsidiaries and does not empower Santander Spain to supplant its subsidiaries’ decision-making processes. Moreover, each of the three pillars of the framework is explicitly made subject to local legal requirements. Our Board of Directors approved the adoption of this corporate governance framework in April 2013, subject to certain overarching principles:
As a resultmore than 50% of the precedence givenour voting power is held by another company, Santander Spain, we would be permitted to local legal requirements in the framework itself and in our Board of Directors’ adopting resolutions, we do not expect that the adoption of theelect for certain exemptions under NYSE corporate governance framework will affect our abilitystandards if we were a U.S. company. Specifically, as a U.S. company, we could elect to comply with applicable be exempted from the requirements (i) that we have a majority of independent directors (as defined by the NYSE), (ii) that we have a nominating/corporate governance regulations, including SECcommittee meeting certain conditions, and NYSE rules applicable to foreign private issuers. For example, although one provision of the framework states(iii) that we must obtain Santander Spain’s approval for our audit plan and that Santander Spain may request additional audits at its discretion,have a compensation committee meeting certain requirements. Because we would not be required to follow these standards if we were a U.S. company, we have not summarized the extent that this provision of the framework would prevent our audit committee from fulfillingdifferences, if any, of the requirements of applicable SEC or NYSE rules (including, for example, the audit committee’s obligation to be directly responsible for the appointment, compensation, retention and oversight of the work of any registered public accounting firm engaged for the purpose of preparing an audit report), we understand that this provision would be limited so as not to conflict with such requirements due to the precedence given to local legal requirements in the frameworkbetween these provisions and our adopting resolutions. Similarly, we understand that the authorities given to Santander Spain under the framework to approve certain decisions by us and to approve the compensation of certain persons in charge of functions subject to internalown corporate governance are limited by the framework and the adopting resolutions so as not to limit the ability of members of our audit committee to make independent decisions or take independent actions as required by the audit committee independence requirements of applicable SEC and NYSE rules.procedures.
ITEM 16H. MINE SAFETY DISCLOSURE
Not applicable.
We have responded to Item 18 in lieu of this Item.
Reference is made to Item 19 for a list of all financial statements filed as part of this Annual Report.
a) Index to Financial Statements
b) Index to Exhibits
| |
We will furnish to the Securities and Exchange Commission, upon request, copies of any unfiled instruments that define the rights of holders of long-term debt of Banco Santander-Chile.
SIGNATURES
The registrant hereby certifies that it meets all of the requirements for filing on Form 20-F and that it has duly caused and authorized the undersigned to sign this Annual Report on its behalf.
Date: April 30, 2014

Deloitte
Auditores y Consultores Limitada
RUT: 80.276.200-3
Rosario Norte 407
Las Condes, Santiago
Chile
Fono: (56-2) 2729 7000
Fax: (56-2) 2374 9177
e-mail: deloittechile@deloitte.com
www.deloitte.cl
REPORT OF INDEPENDENT REGISTERED PUBLIC ACCOUNTING FIRM
To the Board of Directors and Shareholders of
Banco Santander Chile
We have audited the internal control over financial reporting of Banco Santander Chile and subsidiaries (the “Bank”) as of December 31, 2015, based on criteria established inInternal Control-Integrated Framework (2013) issued by the Committee of Sponsoring Organizations of the Treadway Commission. The Bank’s management is responsible for maintaining effective internal control over financial reporting and for its assessment of the effectiveness of internal control over financial reporting, included in the accompanyingManagement’s Report on Internal Control Over Financial Reporting. Our responsibility is to express an opinion on the Bank’s internal control over financial reporting based on our audit.
We conducted our audit in accordance with the standards of the Public Company Accounting Oversight Board (United States of America). Those standards require that we plan and perform the audit to obtain reasonable assurance about whether effective internal control over financial reporting was maintained in all material respects. Our audit included obtaining an understanding of internal control over financial reporting, assessing the risk that a material weakness exists, testing and evaluating the design and operating effectiveness of internal control based on the assessed risk, and performing such other procedures as we considered necessary in the circumstances. We believe that our audit provides a reasonable basis for our opinion.
A company’s internal control over financial reporting is a process designed by, or under the supervision of, the company’s principal executive and principal financial officers, or persons performing similar functions, and effected by the company’s board of directors, management, and other personnel to provide reasonable assurance regarding the reliability of financial reporting and the preparation of financial statements for external purposes in accordance with generally accepted accounting principles. A company’s internal control over financial reporting includes those policies and procedures that (1) pertain to the maintenance of records that, in reasonable detail, accurately and fairly reflect the transactions and dispositions of the assets of the company; (2) provide reasonable assurance that transactions are recorded as necessary to permit preparation of financial statements in accordance with generally accepted accounting principles, and that receipts and expenditures of the company are being made only in accordance with authorizations of management and directors of the company; and (3) provide reasonable assurance regarding prevention or timely detection of unauthorized acquisition, use, or disposition of the company’s assets that could have a material effect on the financial statements.
Because of the inherent limitations of internal control over financial reporting, including the possibility of collusion or improper management override of controls, material misstatements due to error or fraud may not be prevented or detected on a timely basis. Also, projections of any evaluation of the effectiveness of the internal control over financial reporting to future periods are subject to the risk that the controls may become inadequate because of changes in conditions, or that the degree of compliance with the policies or procedures may deteriorate.
In our opinion, the Bank maintained, in all material respects, effective internal control over financial reporting as of December 31, 2015, based on the criteria established inInternal Control-Integrated Framework (2013) issued by the Committee of Sponsoring Organizations of the Treadway Commission.
We have also audited, in accordance with the standards of the Public Company Accounting Oversight Board (United States of America), the consolidated financial statements as of and for the year ended December 31, 2015 of the Bank and our report dated May 1, 2016 expressed an unqualified opinion on those financial statements and included explanatory paragraphs regarding: 1) the translation of Chilean peso amounts into U.S. dollar amounts in conformity with the basis stated in Note 1e) and that such U.S. dollar amounts are presented solely for the convenience of readers outside Chile; and 2) the 2014 and 2013 consolidated financial statements have been adjusted by the Bank to give retrospective affect to certain changes in its reporting segments.
/s/ Deloitte Auditores y Consultores Limitada
Santiago, Chile
May 1, 2016
Deloitte® se refiere a Deloitte Touche Tohmatsu Limited una compañía privada limitada por garantía, de Reino Unido, y a su red de firmas miembro, cada una de las cuales es una entidad legal separada e independiente. Por favor, vea en www.deloitte.cl/ acercade la descripción detallada de la estructura legal de Deloitte Touche Tohmatsu Limited y sus firmas miembro. Deloitte Touche Tohmatsu Limited es una compañía privada limitada por garantía constituida en Inglaterra & Gales bajo el número 07271800, y su domicilio registrado: Hill House, 1 Little New Street, London, EC4A 3TR, Reino Unido. |
191
ITEM 16. [RESERVED]
ITEM 16A. AUDIT COMMITTEE FINANCIAL EXPERT
Our Board of Directors has determined that one of the members of our Audit Committee, Mauricio Larraín, meets the requirements of an “audit committee financial expert” in accordance with SEC rules and regulations, in that he has an understanding of IFRS-IASB and financial statements, the ability to assess the general application of IFRS-IASB in connection with the accounting for estimates, accruals and reserves, experience analyzing and evaluating financial statements that present a breadth and level of complexity of accounting issues that are generally comparable to the breadth and complexity of issues that can reasonably be expected to be raised by our consolidated financial statements, an understanding of internal controls over financial reporting, and an understanding of audit committee functions. All four members of our Audit Committee have experience overseeing and assessing the performance of Santander-Chile and its consolidated subsidiaries and our external auditors with respect to the preparation, auditing and evaluation of our consolidated financial statements.
All four members of our Audit Committee are considered to be independent according to applicable NYSE criteria. Mauricio Larraín is relying on the exemption provided by Rule 10A-3(b)(1)(iv)(B), which allows an otherwise independent director to serve on both the audit committee of the issuer and the Board of Directors of an affiliate.
ITEM 16B. CODE OF ETHICS
The Bank has adopted a code of ethics that is applicable to all of the Bank’s employees and a copy is included as an exhibit hereto. We will provide to any person without charge, upon request, a copy of our code of ethics. Please email robert.moreno@santander.cl to request a copy. Our code of ethics is available on our website, which does not form part of this Annual Report on Form 20-F, at www.santander.cl under the heading “Información Corporativa”.
ITEM 16C. PRINCIPAL ACCOUNTANT FEES AND SERVICES
Amounts paid to the auditors for statutory audit and other services were as follows:
| 2015 | 2014 | |||||||
| (in millions of Ch$) | ||||||||
| Audit Fees | ||||||||
| - Statutory audit | 509 | 427 | ||||||
| - Audit-related regulatory reporting | 245 | 373 | ||||||
| - Other audit-related fees | 63 | 320 | ||||||
| Tax Fees | ||||||||
| - Compliance | - | – | ||||||
| - Advisory Services | 264 | 53 | ||||||
| Total | 1,081 | 1,173 | ||||||
Statutory audit: Consists of fees billed for professional services rendered in connection with the audit of our consolidated financial statements that are provided by Deloitte Auditores y Consultores Limitada in connection with statutory and regulatory filings or engagements, and attest services.
Audit-related regulatory reporting: Consists of fees billed for assurance and related services that were specifically related to the performance of the audit and review of our filings under the Securities Act.
Tax fees: Consist of fees billed for related services that were specifically related to tax related matters such as assuring the Bank was in compliance with tax laws and other tax advisory services.
The audit committee is required to pre-approve the audit and non-audit services performed by the Bank auditors in order to assure that the provision of such services do not impair the audit firm’s independence.
In the first months of each year the audit committee proposes to the board the appointment of the independent auditor. As a matter of policy, at that time, the audit committee pre-approves the audit and audit related services that the appointed auditors will be required to carry out during the year to comply with the applicable regulation. These services will be included in the corresponding audit contracts of the Bank with its principal auditing firm.
In addition, under such policy, non-recurring audit or audit-related services and all non-audit services provided by the Bank principal auditing firm or other auditing firms are subject to case-by-case approval by the audit committee.
The Chief Accounting Officer is in charge of managing the process and must report monthly to the audit committee detailing all services to be provided by auditors, and others requiring individual approval.
All services provided by the Bank principal auditing firm in 2015 detailed in the table above were approved by the Audit and Compliance Committee.
ITEM 16D. EXEMPTIONS FROM THE LISTING STANDARDS FOR AUDIT COMMITTEES
Not applicable.
ITEM 16E. PURCHASES OF EQUITY SECURITIES BY THE ISSUER AND AFFILIATED PURCHASERS
In 2015, neither Santander-Chile nor any of its affiliates purchased any of Santander-Chile’s equity securities.
ITEM 16F. CHANGE IN REGISTRANT’S CERTIFYING ACCOUNTANT
On April 26, 2016, we announced that the board of directors selected PricewaterhouseCoopers Consultores, Auditores y Compañía Limitada to be our independent registered public accounting firm for the 2016 fiscal year. Such selection was adopted at the proposal of the audit committee in accordance with the corporate governance guidelines recommending periodic rotation of the independent registered public accounting firm, following a transparent selection process.This selection was approved by the shareholders at the annual shareholders’ meeting held on April 26, 2016. Accordingly, on April 26, 2016, Deloitte Auditores y Consultores Limitada was dismissed and was not re-elected for another term as our independent registered public accounting firm.
The report of Deloitte Auditores y Consultores Limitada on our financial statements for financial years ended December 31, 2015, 2014 and 2013 did not contain any adverse opinion or disclaimer of opinion and was not qualified or modified as to uncertainty, audit scope or accounting principles. There was no disagreement whatsoever relating to the years ended December 31, 2015, 2014, and 2013 and the period from January 1, 2016 through April 26, 2016 with Deloitte Auditores y Consultores Limitada on any matter of accounting principles or practices, financial statement disclosure, or auditing scope or procedure, which disagreement, if not resolved to the satisfaction of the former auditor, would have caused them to make reference to the subject matter of the disagreement in connection with their report, or any “reportable event” as described in Item 16F(a)(1)(v) of Form 20-F.
Further in the two years prior to December 31, 2015, we have not consulted with PricewaterhouseCoopers Consultores, Auditores y Compañía Limitada regarding either (i) the application of accounting principles to a specified transaction, either completed or proposed, or the type of audit opinion that might be rendered with respect to our consolidated financial statements, and neither a report was provided to us or oral advice was provided that PricewaterhouseCoopers Consultores, Auditores y Compañía Limitada concluded was an important factor considered by us in reaching a decision as to the accounting, auditing or financial reporting issue; or (ii) any matter that was either the subject of a disagreement as that term is used in Item 16F(a)(1)(iv) of Form 20-F or a “reportable event” as described in Item 16F(a)(1)(v) of Form 20-F.
We have provided a copy of the above statements to Deloitte Auditores y Consultores Limitada and requested that Deloitte Auditores y Consultores Limitada furnish us with a letter addressed to the SEC stating whether or not they agree with the above disclosure. A copy of that letter, dated May 2, 2016, is filed as an exhibit to this Annual Report.
ITEM 16G. CORPORATE GOVERNANCE
Summary Comparison of Corporate Governance Standards and NYSE Listed Company Standards
Our corporate governance standards, dictated by Chilean corporate law, differ from the standards followed by U.S. companies under the New York Stock Exchange (NYSE) listing standards in a number of ways. Consequently, you will not have the same protections afforded to shareholders of companies that are subject to all NYSE corporate governance requirements. The following is a non-exhaustive summary of a few key differences:
| · | Whether a company’s executive officers may serve as its directors – the NYSE standards do not prohibit a U.S. company’s executive officer from also serving as a director, whereas our corporate governance standards prohibits this. |
| · | Whether the shareholders must be given an opportunity to vote on equity-compensation plans – the NYSE standards require that shareholders be allowed to vote on all equity compensation plans of a U.S. company, whereas our corporate governance standards only require that shareholders be allowed to vote on director compensation. |
| · | The adoption and disclosure of corporate governance guidelines – the NYSE standards require all U.S. companies listed on the NYSE to adopt the NYSE corporate governance guidelines, whereas we follow the corporate governance guidelines established under Chilean law. |
As more than 50% of our voting power is held by another company, Santander Spain, we would be permitted to elect for certain exemptions under NYSE corporate governance standards if we were a U.S. company. Specifically, as a U.S. company, we could elect to be exempted from the requirements (i) that we have a majority of independent directors (as defined by the NYSE), (ii) that we have a nominating/corporate governance committee meeting certain conditions, and (iii) that we have a compensation committee meeting certain requirements. Because we would not be required to follow these standards if we were a U.S. company, we have not summarized the differences, if any, between these provisions and our own corporate governance procedures.
Summary of Corporate Governance Standards
Santander-Chile has adopted diverse measures to promote good corporate governance. Among the measures adopted are:
| · | Board of Directors mainly composed of professionals not related to Santander Spain, our parent company. |
| · | Active participation of Directors in main committees of the Bank. |
| · | All personnel must subscribe to a code of ethics and good conduct. Those who interact directly with the capital markets must also subscribe to an additional code of conduct. |
| · | Segregation of functions in order to assure adequate management of risks. Commercial areas separated from back office areas. Risk management independent of commercial areas. Main credit decisions taken in committees. |
| · | Internal Auditing Area clearly independent from the Administration. |
| · | The Bank also has an Internal Compliance Division that oversees the fulfillment of the Bank’s codes of conduct. |
Santander-Chile has a commitment to transparency. This includes:
| · | Equal treatment for all shareholders: one share equals to one vote. |
| · | Monthly publication of the Bank’s results by the SBIF. |
| · | Quarterly report of a detailed analysis of Bank results published by us at least 30 days after the close of each interim quarter and 40 days after close of the full year. |
| · | Quarterly conference call open to the public. |
| · | All information relevant to the public available immediately on the web page www.santander.cl. |
| · | Ample and periodic coverage of the Bank by international and local stock analysts. |
| · | The Bank has five credit risk ratings by five independent rating agencies, domestic and international. |
In addition, our corporate governance practices reflect the Santander Spain corporate governance framework described below.
In December 2012, primarily in response to the requirements of the European Banking Authority, our controlling shareholder, Santander Spain, adopted a corporate governance framework (Marco de Gobierno Interno del Grupo Santander). The purpose of the framework is to organize and standardize the corporate governance practices of Santander Spain and its most significant subsidiaries, including us, in order to enhance the ability of Santander Spain to manage the risks arising from its operations around the world.
The three pillars of the framework are (i) an organizational model based on functions subject to internal governance, (ii) terms of reference according to which Santander Spain exercises control and oversight over its subsidiaries and participates in specific decisions at the subsidiary level and (iii) corporate models establishing common guidelines for the management and control of Santander Spain’s subsidiaries, subject to local autonomy considerations. In general, the framework purports to implement organizational and procedural changes rather than mandating particular substantive outcomes. However, in some cases, and subject to the limitations set forth in the framework, the framework states that Santander Spain may require that its subsidiaries make substantive changes or take specific actions. The framework enables Santander Spain to participate in the decision-making processes of its subsidiaries by requiring its approval of certain decisions that may have a significant impact on the Santander Group as a whole due to their significance or potential risk, such as decisions relating to mergers and acquisitions, capital structure, dividends and risk appetite, among other things. The framework also requires that a single person at each subsidiary be in charge of each function subject to internal governance and gives Santander Spain the authority to participate in the appointment, evaluation and compensation of each such person.
By its own terms, the framework as a whole is premised on the legal and financial autonomy of the subsidiaries and does not empower Santander Spain to supplant its subsidiaries’ decision-making processes. Moreover, each of the three pillars of the framework is explicitly made subject to local legal requirements. Our Board of Directors approved the adoption of this corporate governance framework in April 2013, subject to certain overarching principles:
| · | the precedence of applicable laws and regulations and orders of competent authorities over the framework to the extent they are in conflict; and |
| · | the disclosure of the adoption of the corporate governance framework to the public and to our employees and subsidiaries. |
As a result of the precedence given to local legal requirements in the framework itself and in our Board of Directors’ adopting resolutions, we do not expect that the adoption of the corporate governance framework will affect our ability to comply with applicable corporate governance regulations, including SEC and NYSE rules applicable to foreign private issuers. For example, although one provision of the framework states that we must obtain Santander Spain’s approval for our audit plan and that Santander Spain may request additional audits at its discretion, to the extent that this provision of the framework would prevent our audit committee from fulfilling any of the requirements of applicable SEC or NYSE rules (including, for example, the audit committee’s obligation to be directly responsible for the appointment, compensation, retention and oversight of the work of any registered public accounting firm engaged for the purpose of preparing an audit report), we understand that this provision would be limited so as not to conflict with such requirements due to the precedence given to local legal requirements in the framework and our adopting resolutions. Similarly, we understand that the authorities given to Santander Spain under the framework to approve certain decisions by us and to approve the compensation of certain persons in charge of functions subject to internal governance are limited by the framework and the adopting resolutions so as not to limit the ability of members of our audit committee to make independent decisions or take independent actions as required by the audit committee independence requirements of applicable SEC and NYSE rules.
ITEM 16H. MINE SAFETY DISCLOSURE
Not applicable.
195
PART III
ITEM 17. FINANCIAL STATEMENTS
We have responded to Item 18 in lieu of this Item.
ITEM 18. FINANCIAL STATEMENTS
Reference is made to Item 19 for a list of all financial statements filed as part of this Annual Report.
ITEM 19. EXHIBITS
a) Index to Financial Statements
| Report of independent registered public accounting firm | F-2 |
| Audited Consolidated Financial Statements | |
| Consolidated Statements of Financial Position as of December 31, 2015 and 2014 | F-3 |
| Consolidated Statements of Income for each of the three years in the period ended December 31, 2015, 2014 and 2013 | F-4 |
| Consolidated Statements of Other Comprehensive Income for each of the three years in the period ended December 31, 2015, 2014 and 2013 | F-5 |
| Consolidated Statements of Changes in Equity for each of the three years in the period ended December 31, 2015, 2014 and 2013 | F-6 |
| Consolidated Statements of Cash Flows for each of the three years in the period ended December 31, 2015, 2014 and 2013 | F-8 |
| Notes to consolidated financial statements | F-10 |
b) Index to Exhibits
| Exhibit Number | Description |
| 1A.1 | Restated Articles of Incorporation of Santander-Chile (Spanish Version) (incorporated by reference to our Registration Statement on Form F-4 (Registration No. 333-100975) filed with the Commission on December 12, 2002). |
| 1A.2 | Restated Articles of Incorporation of Santander-Chile (English Version) (incorporated by reference to our Registration Statement on Form F-4 (Registration No. 333-100975) filed with the Commission on December 12, 2002). |
| 1B.1 | Amended and Restated By-Laws (estatutos) of Santander-Chile (Spanish Version) (incorporated by reference to our Annual Report on Form 20-F for the fiscal year ended December 31, 2013 (File No. 1-4554) filed with the Commission on April 30, 2014). |
| 1B.2 | Amended and Restated By-Laws (estatutos) of Santander-Chile (English Version) (incorporated by reference to our Annual Report on Form 20-F for the fiscal year ended December 31, 2013 (File No. 1-4554) filed with the Commission on April 30, 2014). |
| 2A.1 | Form of Amended and Restated Deposit Agreement among Banco Santander-Chile, The Bank of New York Mellon (as depositary) and Owners and Holders of American Depositary Shares (incorporated by reference to our Registration Statement on Form F-6 (Registration No. 333-205890) filed with the Commission on July 27, 2015). |
| Exhibit Number | Description |
| 2A.2 | English translation of the Foreign Investment Contract among Banco Santander Chile, JPMorgan Chase Bank, N.A. and the Central Bank of Chile relating to the foreign exchange treatment of an investment in ADSs. |
| 2A.3 | English translation of the Assignment of Rights under the Foreign Investment Contract from JPMorgan Chase Bank, N.A. to The Bank of New York Mellon. |
| 2A.4 | Copy of the Central Bank Chapter XXVI Regulations Related to the Acquisition of Shares in Chilean Corporations and the Issuance of Instrument on Foreign Stock Exchanges or under Other Terms and Conditions of Issue (accompanied by an English translation) (incorporated by reference to Old Santander-Chile’s Annual Report for the fiscal year ended December 31, 1996 (File No. 1-13448) filed with the Commission on June 30, 1997). |
| 2B.1 | Agreement for the Issuance of Bonds dated November 26, 1996 between Old Santander-Chile and Banco Security (accompanied by an English translation) (incorporated by reference to Old Santander-Chile’s Annual Report for the fiscal year ended December 31, 1996 (File No. 1-13448) filed with the Commission on June 30, 1997). |
| 2B.2 | Indenture dated December 9, 2004 between Santander-Chile and Deutsche Bank Trust Company Americas, as trustee, providing for issuance of securities in series (incorporated by reference to Banco Santiago’s Annual Report on Form 20-F for the fiscal year ended December 31, 2005 (File No. 1-4554) filed with the Commission on April 12, 2006). |
| 2B.3 | Indenture dated March 16, 2001, as amended on May 30, 2003, October 22, 2004, May 3, 2005, and September 20, 2005 between Santander-Chile and Banco de Chile, as trustee, relating to issuance of UF14 million senior notes (copy to be furnished upon request). |
| 8.1 | List of Subsidiaries. |
| 12.1 | Section 302 Certification by the Chief Executive Officer. |
| 12.2 | Section 302 Certification by the Chief Financial Officer. |
| 12.3 | Section 302 Certification by the Financial Controller. |
| 13.1 | Section 906 Certification. |
| 15.1 | Letter of Deloitte Auditores y Consultores Limitada dated May 2, 2016, regarding change in our independent registered public accounting firm. |
We will furnish to the Securities and Exchange Commission, upon request, copies of any unfiled instruments that define the rights of holders of long-term debt of Banco Santander-Chile.
197
SIGNATURES
The registrant hereby certifies that it meets all of the requirements for filing on Form 20-F and that it has duly caused and authorized the undersigned to sign this Annual Report on its behalf.
| BANCO SANTANDER-CHILE | ||
| /s/ Cristian Florence | ||
| Name: | Cristian Florence | |
| Title: | General Counsel | |
Date: May 1, 2016
CONSOLIDATED FINANCIAL STATEMENTS 2015 | Banco Santander Chile |
 | |
CONTENT
Consolidated Financial Statements
| CONSOLIDATED STATEMENTS OF FINANCIAL POSITION | F-3 |
| CONSOLIDATED STATEMENTS OF INCOME | F-4 |
| CONSOLIDATED STATEMENTS OF COMPREHENSIVE INCOME | F-5 |
| CONSOLIDATED STATEMENTS OF CHANGES IN EQUITY | F-6 |
| CONSOLIDATED STATEMENTS OF CASH FLOW | F-8 |
| Notes to the Consolidated Financial Statements | |
| NOTE 01 SUMMARY OF SIGNIFICANT ACCOUNTING POLICIES | F-10 |
| NOTE 02 SIGNIFICANT EVENTS | F-38 |
| NOTE 03 REPORTING SEGMENTS | F-40 |
| NOTE 04 CASH AND CASH EQUIVALENTS | F-44 |
| NOTE 05 TRADING INVESTMENTS | F-45 |
| NOTE 06 INVESTMENTS UNDER RESALE AGREEMENTS AND OBLIGATIONS UNDER REPURCHASE AGREEMENTS | F-46 |
| NOTE 07 DERIVATIVE FINANCIAL INSTRUMENTS AND HEDGE ACCOUNTING | F-49 |
| NOTE 08 INTERBANK LOANS | F-57 |
| NOTE 09 LOANS AND ACCOUNTS RECEIVABLE FROM CUSTOMERS | F-58 |
| NOTE 10 AVAILABLE FOR SALE INVESTMENTS | F-67 |
| NOTE 11 INVESTMENTS IN ASSOCIATES AND OTHER COMPANIES | F-71 |
| NOTE 12 INTANGIBLE ASSETS | F-73 |
| NOTE 13 PROPERTY, PLANT, AND EQUIPMENT | F-75 |
| NOTE 14 CURRENT AND DEFERRED TAXES | F-78 |
| NOTE 15 OTHER ASSETS | F-81 |
| NOTE 16 TIME DEPOSITS AND OTHER TIME LIABILITIES | F-82 |
| NOTE 17 INTERBANK BORROWINGS | F-83 |
| NOTE 18 ISSUED DEBT INSTRUMENTS AND OTHER FINANCIAL LIABILITIES | F-85 |
| NOTE 19 MATURITY OF ASSETS AND LIABILITIES | F-92 |
| NOTE 20 PROVISIONS | F-94 |
| NOTE 21 OTHER LIABILITIES | F-95 |
| NOTE 22 CONTINGENCIES AND COMMITMENTS | F-95 |
| NOTE 23 EQUITY | F-97 |
| NOTE 24 NON-CONTROLLING INTEREST | F-101 |
| NOTE 25 INTEREST INCOME | F-105 |
| NOTE 26 FEES AND COMMISSIONS | F-107 |
| NOTE 27 NET INCOME (EXPENSE) FROM FINANCIAL OPERATIONS | F-108 |
| NOTE 28 NET FOREIGN EXCHANGE GAIN (LOSS) | F-108 |
| NOTE 29 PROVISION FOR LOAN LOSSES | F-109 |
| NOTE 30 PERSONNEL SALARIES AND EXPENSES | F-110 |
| NOTE 31 ADMINISTRATIVE EXPENSES | F-111 |
| NOTE 32 DEPRECIATION, AMORTIZATION, AND IMPAIRMENT | F-112 |
| NOTE 33 OTHER OPERATING INCOME AND EXPENSES | F-112 |
| NOTE 34 TRANSACTIONS WITH RELATED PARTIES | F-114 |
| NOTE 35 PENSION PLANS | F-120 |
| NOTE 36 FAIR VALUE OF FINANCIAL ASSETS AND LIABILITIES | F-123 |
| NOTE 37 RISK MANAGEMENT | F-129 |
| NOTE 38 SUBSEQUENT EVENTS | F-142 |
 |  |
REPORT OF INDEPENDENT REGISTERED PUBLIC ACCOUNTING FIRM
To the Board of Directors and Shareholders of
Banco Santander Chile
We have audited the accompanying consolidated statements of financial position of Banco Santander Chile and subsidiaries (the “Bank”) as of December 31, 2013,2015, and 2012,2014, and the correspondingrelated consolidated statements of income, comprehensive income, changes in equity, and cash flows for each of the three years in the period ended December 31, 2013.2015. These financial statements are the responsibility of the Bank´s management. Our responsibility is to express an opinion on these consolidated financial statements based on our audits.
We conducted our audits in accordance with the standards of the Public Company Accounting Oversight Board (United States of America). Those standards require that we plan and perform the audit to obtain reasonable assurance about whether the financial statements are free of material misstatement. An audit includes examining, on a test basis, evidence supporting the amounts and disclosures in the financial statements. An audit also includes assessing the accounting principles used and significant estimates made by management, as well as evaluating the overall financial statement presentation. We believe that our audits provide a reasonable basis for our opinion.
In our opinion, such consolidated financial statements present fairly, in all material respects, the financial position of Banco Santander Chile and subsidiaries as of December 31, 20132015 and 2012,2014, and the results of their operations and their cash flows for each of the three years in the period ended December 31, 2013,2015, in conformity with International Financial Reporting Standards as issued by the International Accounting Standards Board (“IFRS-IASB”).
Our audits also comprehended the translation of Chilean peso amounts into U.S. dollar amounts;amounts and, in our opinion, such translation has been made in conformity with the basis stated in Note 1e. The translation into1e) to the consolidated financial statements. Such U.S. dollars has been madedollar amounts are presented solely for the convenience of readers in the United States of America.outside Chile.
As discussed in Note 1d) and 3 to the consolidated financial statements, the accompanying 2014 and 2013 consolidated financial statements have been adjusted by the Bank to give retrospective effect to certain changes in its reporting segments.
We have also audited, in accordance with the standards of the Public Company Accounting Oversight Board (United States of America), the Bank's internal control over financial reporting as of December 31, 2013,2015, based on the criteria established inInternal Control—IntegratedControl-Integrated Framework (1992)(2013)issued by the Committee of Sponsoring Organizations of the Treadway Commission and our report dated April 30, 2014May 1, 2016 expressed an unqualified opinion on the Bank’s internal control over financial reporting.
/s/Deloitte Auditores y Consultores Limitada
Santiago, Chile
April 30, 2014
Santiago, ChileMay 1, 2016
Deloitte®se refiere a Deloitte Touche Tohmatsu Limited una compañía privada limitada por garantía, de Reino Unido, y a su red de firmas miembro, cada una de las cuales es una entidad legal separada e independiente. Por favor, vea enwww.deloitte.cl/acerca de la descripción detallada de la estructura legal de Deloitte Touche Tohmatsu Limited y sus firmas miembro. Deloitte Touche Tohmatsu Limited es una compañía privada limitada por garantía constituida en Inglaterra & Gales bajo el número 07271800, y su domicilio registrado: Hill House, 1 Little New Street, London, EC4A 3TR, Reino Unido. F-2
|
|
![]()
|
| As of December 31, | |||||||
| 2013 | 2013 | 2012 | |||||
| NOTE | ThUS$ | MCh$ | MCh$ | ||||
| ASSETS | |||||||
| Cash and deposits in banks | 5 | 2,998,493 | 1,571,810 | 1,250,414 | |||
| Cash items in process of collection | 5 | 1,152,379 | 604,077 | 520,267 | |||
| Trading investments | 6 | 548,583 | 287,567 | 338,287 | |||
| Investments under resale agreements | 7 | 33,325 | 17,469 | 6,993 | |||
| Financial derivative contracts | 8 | 2,850,092 | 1,494,018 | 1,293,212 | |||
| Interbank loans, net | 9 | 238,371 | 124,954 | 90,414 | |||
| Loans and accounts receivable from customers, net | 10 | 38,765,498 | 20,320,874 | 18,326,190 | |||
| Available for sale investments | 11 | 3,244,931 | 1,700,993 | 1,826,158 | |||
| Held to maturity investments | - | - | - | ||||
| Investments in associates and other companies | 12 | 18,468 | 9,681 | 7,614 | |||
| Intangible assets | 13 | 127,247 | 66,703 | 87,347 | |||
| Property, plant, and equipment | 14 | 343,791 | 180,215 | 162,214 | |||
| Current taxes | 15 | 3,134 | 1,643 | 10,227 | |||
| Deferred taxes | 15 | 433,585 | 227,285 | 181,875 | |||
| Other assets | 16 | 982,330 | 514,938 | 657,890 | |||
| TOTAL ASSETS | 51,740,227 | 27,122,227 | 24,759,102 | ||||
| LIABILITIES | |||||||
| Deposits and other demand liabilities | 17 | 10,722,554 | 5,620,763 | 4,970,019 | |||
| Cash items in process of being cleared | 5 | 527,240 | 276,379 | 284,953 | |||
| Obligations under repurchase agreements | 7 | 398,649 | 208,972 | 304,117 | |||
| Time deposits and other time liabilities | 17 | 18,457,215 | 9,675,272 | 9,112,213 | |||
| Financial derivative contracts | 8 | 2,464,297 | 1,291,785 | 1,146,161 | |||
| Interbank borrowings | 18 | 3,209,418 | 1,682,377 | 1,438,003 | |||
| Issued debt instruments | 19 | 9,917,318 | 5,198,658 | 4,571,289 | |||
| Other financial liabilities | 19 | 362,039 | 189,781 | 192,611 | |||
| Current taxes | 15 | 95,845 | 50,242 | 525 | |||
| Deferred taxes | 15 | 51,037 | 26,753 | 9,544 | |||
| Provisions | 21 | 414,556 | 217,310 | 191,892 | |||
| Other liabilities | 22 | 594,199 | 311,479 | 341,274 | |||
| TOTAL LIABILITIES | 47,214,367 | 24,749,771 | 22,562,601 | ||||
| EQUITY | |||||||
| Attributable to the Bank's shareholders: | 4,471,484 | 2,343,952 | 2,162,236 | ||||
| Capital | 24 | 1,700,311 | 891,303 | 891,303 | |||
| Reserves | 24 | 2,157,556 | 1,130,991 | 975,460 | |||
| Valuation adjustments | 24 | (11,377) | (5,964) | (3,781) | |||
| Retained earnings | 624,994 | 327,622 | 299,254 | ||||
| Retained earnings from prior years | 34,369 | 18,016 | 49,490 | ||||
| Income for the year | 843,750 | 442,294 | 356,808 | ||||
| Minus: Provision for mandatory dividends | 24 | (253,125) | (132,688) | (107,044) | |||
| Non-controlling interest | 25 | 54,376 | 28,504 | 34,265 | |||
| TOTAL EQUITY | 4,525,860 | 2,372,456 | 2,196,501 | ||||
| TOTAL LIABILITIES AND EQUITY | 51,740,227 | 27,122,227 | 24,759,102 | ||||
|
![]()
Banco Santander Chile and Subsidiaries
CONSOLIDATED STATEMENTS OF FINANCIAL POSITION
| As of December 31, | |||||||||
| 2015 | 2015 | 2014 | |||||||
| NOTE | ThUS$ | MCh$ | MCh$ | ||||||
| ASSETS | |||||||||
| Cash and deposits in banks | 4 | 2,917,217 | 2,064,806 | 1,608,888 | |||||
| Cash items in process of collection | 4 | 1,023,624 | 724,521 | 531,373 | |||||
| Trading investments | 5 | 458,139 | 324,271 | 774,815 | |||||
| Investments under resale agreements | 6 | 3,480 | 2,463 | - | |||||
| Financial derivative contracts | 7 | 4,529,424 | 3,205,926 | 2,727,563 | |||||
| Interbank loans, net | 8 | 13,720 | 9,711 | 11,942 | |||||
| Loans and accounts receivable from customers, net | 9 | 34,654,910 | 24,528,745 | 22,196,390 | |||||
| Available for sale investments | 10 | 2,888,402 | 2,044,411 | 1,651,598 | |||||
| Investments in associates and other companies | 11 | 28,693 | 20,309 | 17,914 | |||||
| Intangible assets | 12 | 72,248 | 51,137 | 40,983 | |||||
| Property, plant, and equipment | 13 | 340,010 | 240,659 | 211,561 | |||||
| Current taxes | 14 | - | - | 2,241 | |||||
| Deferred taxes | 14 | 452,850 | 320,527 | 272,118 | |||||
| Other assets | 15 | 1,554,357 | 1,100,174 | 927,961 | |||||
| TOTAL ASSETS | 48,937,074 | 34,637,660 | 30,975,347 | ||||||
| LIABILITIES | |||||||||
| Deposits and other demand liabilities | 16 | 10,392,937 | 7,356,121 | 6,480,497 | |||||
| Cash items in process of being cleared | 4 | 652,949 | 462,157 | 281,259 | |||||
| Obligations under repurchase agreements | 6 | 203,008 | 143,689 | 392,126 | |||||
| Time deposits and other time liabilities | 16 | 17,212,160 | 12,182,767 | 10,413,940 | |||||
| Financial derivative contracts | 7 | 4,044,371 | 2,862,606 | 2,561,384 | |||||
| Interbank borrowings | 17 | 1,847,378 | 1,307,574 | 1,231,601 | |||||
| Issued debt instruments | 18 | 8,416,353 | 5,957,095 | 5,785,112 | |||||
| Other financial liabilities | 18 | 311,567 | 220,527 | 205,125 | |||||
| Current taxes | 14 | 25,143 | 17,796 | 1,077 | |||||
| Deferred taxes | 14 | 5,519 | 3,906 | 7,631 | |||||
| Provisions | 20 | 388,525 | 274,998 | 285,970 | |||||
| Other liabilities | 21 | 1,477,634 | 1,045,869 | 654,557 | |||||
| TOTAL LIABILITIES | 44,977,544 | 31,835,105 | 28,300,279 | ||||||
| EQUITY | |||||||||
| Attributable to the equity holders of the Bank: | 3,916,889 | 2,772,374 | 2,641,985 | ||||||
| Capital | 23 | 1,259,258 | 891,303 | 891,303 | |||||
| Reserves | 23 | 2,158,651 | 1,527,893 | 1,307,761 | |||||
| Valuation adjustments | 23 | 1,820 | 1,288 | 25,600 | |||||
| Retained earnings | 497,160 | 351,890 | 417,321 | ||||||
| Retained earnings from prior years | 53,635 | 37,963 | 18,384 | ||||||
| Income for the year | 633,606 | 448,466 | 569,910 | ||||||
| Minus: Provision for mandatory dividends | 23 | (190,081) | (134,539) | (170,973) | |||||
| Non-controlling interest | 24 | 42,641 | 30,181 | 33,083 | |||||
| TOTAL EQUITY | 3,959,530 | 2,802,555 | 2,675,068 | ||||||
| TOTAL LIABILITIES AND EQUITY | 48,937,074 | 34,637,660 | 30,975,347 | ||||||

Banco Santander Chile and Subsidiaries
CONSOLIDATED STATEMENTS OF INCOME
For the years ended
| December 31, | December 31, | ||||||||||||||||||||
| 2013 | 2013 | 2012 | 2011 | 2015 | 2015 | 2014 | 2013 | ||||||||||||||
| NOTE | ThUS$ | MCh$ | MCh$ | MCh$ | NOTE | ThUS$ | MCh$ | MCh$ | MCh$ | ||||||||||||
| OPERATING INCOME | OPERATING INCOME | OPERATING INCOME | |||||||||||||||||||
| Interest income | Interest income | 26 | 3,569,638 | 1,871,204 | 1,890,953 | 1,768,735 | Interest income | 25 | 2,947,143 | 2,085,988 | 2,227,018 | 1,871,204 | |||||||||
| Interest expense | Interest expense | 26 | (1,515,532) | (794,442) | (848,219) | (796,435) | Interest expense | 25 | (1,173,752) | (830,782) | (909,914) | (794,442) | |||||||||
| Net interest income | Net interest income | 2,054,106 | 1,076,762 | 1,042,734 | 972,300 | Net interest income | 1,773,391 | 1,255,206 | 1,317,104 | 1,076,762 | |||||||||||
| Fee and commission income | Fee and commission income | 27 | 660,282 | 346,120 | 360,427 | 363,041 | Fee and commission income | 26 | 569,229 | 402,900 | 366,729 | 346,120 | |||||||||
| Fee and commission expense | Fee and commission expense | 27 | (221,831) | (116,284) | (89,855) | (85,205) | Fee and commission expense | 26 | (233,502) | (165,273) | (139,446) | (116,284) | |||||||||
| Net fee and commission income | Net fee and commission income | 438,451 | 229,836 | 270,572 | 277,836 | Net fee and commission income | 335,727 | 237,627 | 227,283 | 229,836 | |||||||||||
| Net profit (loss) from financial operations (net trading profit loss) | 28 | (38,705) | (20,289) | (64,079) | 170,857 | ||||||||||||||||
| Net income (expense) from financial operations | Net income (expense) from financial operations | 27 | (646,930) | (457,897) | (159,647) | (20,289) | |||||||||||||||
| Net foreign exchange gain (loss) | Net foreign exchange gain (loss) | 29 | 276,089 | 144,726 | 146,378 | (76,660) | Net foreign exchange gain (loss) | 28 | 852,495 | 603,396 | 272,212 | 144,726 | |||||||||
| Other operating income | Other operating income | 34 | 168,170 | 88,155 | 13,105 | 18,749 | Other operating income | 33 | 9,097 | 6,439 | 6,545 | 88,155 | |||||||||
| Net operating profit before provision for loan losses | Net operating profit before provision for loan losses | 2,898,111 | 1,519,190 | 1,408,710 | 1,363,082 | Net operating profit before provision for loan losses | 2,323,780 | 1,644,771 | 1,663,497 | 1,519,190 | |||||||||||
| Provision for loan losses | Provision for loan losses | 30 | (708,626) | (371,462) | (403,692) | (316,137) | Provision for loan losses | 29 | (564,110) | (399,277) | (354,903) | (371,462) | |||||||||
| NET OPERATING PROFIT | NET OPERATING PROFIT | 2,189,485 | 1,147,728 | 1,005,018 | 1,046,945 | NET OPERATING PROFIT | 1,759,670 | 1,245,494 | 1,308,594 | 1,147,728 | |||||||||||
| Personnel salaries and expenses | Personnel salaries and expenses | 29 | (588,218) | (308,344) | (299,904) | (280,040) | Personnel salaries and expenses | 30 | (546,854) | (387,063) | (338,888) | (308,344) | |||||||||
| Administrative expenses | Administrative expenses | 32 | (359,007) | (188,191) | (183,379) | (166,825) | Administrative expenses | 31 | (311,572) | (220,531) | (205,149) | (188,191) | |||||||||
| Depreciation and amortization | Depreciation and amortization | 33 | (116,509) | (61,074) | (56,369) | (53,466) | Depreciation and amortization | 32 | (75,747) | (53,614) | (44,172) | (61,074) | |||||||||
| Impairment of property, plant, and equipment | Impairment of property, plant, and equipment | 33 | (465) | (244) | (90) | (116) | Impairment of property, plant, and equipment | 32 | (30) | (21) | (36,664) | (244) | |||||||||
| Other operating expenses | Other operating expenses | 34 | (99,844) | (52,338) | (59,637) | (64,208) | Other operating expenses | 33 | (82,974) | (58,729) | (58,946) | (52,338) | |||||||||
| Total operating expenses | Total operating expenses | (1,164,043) | (610,191) | (599,379) | (564,655) | Total operating expenses | (1,017,177) | (719,958) | (683,819) | (610,191) | |||||||||||
| OPERATING INCOME | OPERATING INCOME | 1,025,442 | 537,537 | 405,639 | 482,290 | OPERATING INCOME | 742,493 | 525,536 | 624,775 | 537,537 | |||||||||||
| Income from investments in associates and other companies | Income from investments in associates and other companies | 12 | 2,713 | 1,422 | 267 | 2,140 | Income from investments in associates and other companies | 11 | 3,656 | 2,588 | 2,165 | 1,422 | |||||||||
| Income before tax | Income before tax | 1,028,155 | 538,959 | 405,906 | 484,430 | Income before tax | 746,149 | 528,124 | 626,940 | 538,959 | |||||||||||
| Income tax expense | Income tax expense | 15 | (180,332) | (94,530) | (44,473) | (77,308) | Income tax expense | 14 | (107,933) | (76,395) | (51,050) | (94,530) | |||||||||
| NET INCOME FOR THE YEAR | NET INCOME FOR THE YEAR | 847,823 | 444,429 | 361,433 | 407,122 | NET INCOME FOR THE YEAR | 638,216 | 451,729 | 575,890 | 444,429 | |||||||||||
| Attributable to: | Attributable to: | Attributable to: | |||||||||||||||||||
| Equity holders of the Bank | Equity holders of the Bank | 843,750 | 442,294 | 356,808 | 402,191 | Equity holders of the Bank | 633,606 | 448,466 | 569,910 | 442,294 | |||||||||||
| Non-controlling interest | Non-controlling interest | 25 | 4,073 | 2,135 | 4,625 | 4,931 | Non-controlling interest | 24 | 4,610 | 3,263 | 5,980 | 2,135 | |||||||||
Earnings per share attributable to | |||||||||||||||||||||
| (expressed in Chilean pesos) | |||||||||||||||||||||
Earnings per share attributable to Equity holders of the Bank: | Earnings per share attributable to Equity holders of the Bank: | ||||||||||||||||||||
| Basic earnings | Basic earnings | 23 | 4.477 | 2.347 | 1.893 | 2.134 | Basic earnings | 23 | 3.363 | 2.380 | 3.024 | 2.347 | |||||||||
| Diluted earnings | Diluted earnings | 23 | 4.477 | 2.347 | 1.893 | 2.134 | Diluted earnings | 23 | 3.363 | 2.380 | 3.024 | 2.347 | |||||||||
F-4
|
![]()
Banco Santander Chile and Subsidiaries
CONSOLIDATED STATEMENTS OF OTHER COMPREHENSIVE INCOME
For the years ended
| December 31, | December 31, | ||||||||||||||||||
| 2013 | 2013 | 2012 | 2011 | 2015 | 2015 | 2014 | 2013 | ||||||||||||
| NOTE | ThUS$ | MCh$ | MCh$ | MCh$ | NOTE | ThUS$ | MCh$ | MCh$ | MCh$ | ||||||||||
| NET INCOME FOR THE YEAR | 847,823 | 444,429 | 361,433 | 407,122 | 638,216 | 451,729 | 575,890 | 444,429 | |||||||||||
OTHER COMPREHENSIVE INCOME - ITEMS WHICH MAY BE RECLASSIFIED SUBSEQUENTLY TO PROFIT OR LOSS | |||||||||||||||||||
OTHER COMPREHENSIVE INCOME ITEMS WHICH MAY BE RECLASSIFIED SUBSEQUENTLY TO PROFIT OR LOSS | OTHER COMPREHENSIVE INCOME ITEMS WHICH MAY BE RECLASSIFIED SUBSEQUENTLY TO PROFIT OR LOSS | ||||||||||||||||||
| Available for sale investments | 11 | 20,712 | 10,857 | (13,060) | 21,639 | 10 | (40,657) | (28,777) | 20,844 | 10,857 | |||||||||
| Cash flow hedge | 23 | (25,891) | (13,572) | 4,921 | (11,564) | 23 | (2,966) | (2,099) | 18,982 | (13,572) | |||||||||
Other comprehensive income which may be reclassified subsequently to profit or loss, before tax | (5,179) | (2,715) | (8,139) | (10,075) | |||||||||||||||
Other comprehensive income items which may be reclassified subsequently to profit or loss, before tax | (43,623) | (30,876) | 39,826 | (2,715) | |||||||||||||||
| Income tax related to items which may be reclassified subsequently to profit or loss | 15 | 1,036 | 543 | 1,572 | (1,880) | 14 | 9,130 | 6,462 | (8,289) | 543 | |||||||||
| Other comprehensive income for the year which may be reclassified subsequently to profit or loss, net of tax | (4,143) | (2,172) | (6,567) | 8,195 | |||||||||||||||
| Other comprehensive income items which may be reclassified subsequently to profit or loss, net of tax | (34,493) | (24,414) | 31,537 | (2,172) | |||||||||||||||
| OTHER COMPREHENSIVE INCOME THAT WILL NOT BE RECLASSIFIED SUBSEQUENTLY TO PROFIT OR LOSS | - | - | - | - | - | - | - | - | |||||||||||
| TOTAL COMPREHENSIVE INCOME FOR THE YEAR | 843,680 | 442,257 | 354,866 | 415,317 | 603,723 | 427,315 | 607,427 | 442,257 | |||||||||||
| Attributable to: | |||||||||||||||||||
| Equity holders of the Bank | 839,586 | 440,111 | 350,195 | 410,203 | 599,257 | 424,154 | 601,474 | 440,111 | |||||||||||
| Non-controlling interests | 25 | 4,094 | 2,146 | 4,671 | 5,114 | 24 | 4,466 | 3,161 | 5,953 | 2,146 | |||||||||
F-5
|
![]()
Banco Santander Chile and Subsidiaries
CONSOLIDATED STATEMENTS OF CHANGES IN EQUITY
For the years ended December 31, 20132015, 2014 and 20122013
| RESERVES | VALUATION ADJUSTMENTS | RETAINED EARNINGS | |||||||||||||||||||||
| Capital MCh$ | Reserves and other retained earnings MCh$ | Effects of merger of companies under common control MCh$ | Available for sale investments MCh$ | Cash flow hedge MCh$ | Income tax effects MCh$ | Retained earnings of prior years MCh$ | Income for the year MCh$ | Provision for mandatory dividends MCh$ | Total attributable to shareholders MCh$ | Non-controlling interest MCh$ | Total Equity MCh$ | ||||||||||||
| Equity as of December 31, 2010 | 891,303 | 613,891 | (2,224) | (18,341) | 11,958 | 1,203 | 54,603 | 505,393 | (151,618) | 1,906,168 | 31,809 | 1,937,977 | |||||||||||
| Adjustment for accounting changes (IAS 19) (*) | (1,101) | - | - | - | - | (458) | - | - | (1,559) | - | (1,559) | ||||||||||||
| Distribution of income from previous period | - | - | - | - | - | - | 505,393 | (505,393) | - | - | - | - | |||||||||||
| Equity as of January 1, 2011 | 891,303 | 612,790 | (2,224) | (18,341) | 11,958 | 1,203 | 559,538 | - | (151,618) | 1,904,609 | 31,809 | 1,936,418 | |||||||||||
| Dividends distributions/ withdrawals made | - | - | - | - | - | - | (286,294) | - | 151,618 | (134,676) | (3,122) | (137,798) | |||||||||||
| Transfer of retained earnings to reserves | - | 190,861 | - | - | - | - | (190,861) | - | - | - | - | - | |||||||||||
| Provision for mandatory dividends | - | - | - | - | - | - | - | - | (120,657) | (120,657) | - | (120,657) | |||||||||||
| Subtotals | - | 190,861 | - | - | - | - | (477,155) | - | 30,961 | (255,333) | (3,122) | (258,455) | |||||||||||
| Other comprehensive income | - | - | - | 21,418 | (11,564) | (1,842) | - | - | - | 8,012 | 183 | 8,195 | |||||||||||
| Income for the year | - | - | - | - | - | - | - | 402,191 | - | 402,191 | 4,931 | 407,122 | |||||||||||
| Subtotals | - | - | - | 21,418 | (11,564) | (1,842) | - | 402,191 | - | 410,203 | 5,114 | 415,317 | |||||||||||
| Equity as of December 31, 2011 | 891,303 | 803,651 | (2,224) | 3,077 | 394 | (639) | 82,383 | 402,191 | (120,657) | 2,059,479 | 33,801 | 2,093,280 | |||||||||||
| Distribution of income from previous period | - | - | - | - | - | - | 402,191 | (402,191) | - | - | - | - | |||||||||||
| Equity as of January 1, 2012 | 891,303 | 803,651 | (2,224) | 3,077 | 394 | (639) | 484,574 | - | (120,657) | 2,059,479 | 33,801 | 2,093,280 | |||||||||||
| Dividends distributions/ withdrawals made | - | - | - | - | - | - | (261,051) | - | 120,657 | (140,394) | (4,207) | (144,601) | |||||||||||
| Transfer of retained earnings to reserves | - | 174,033 | - | - | - | - | (174,033) | - | - | - | - | - | |||||||||||
| Provision for mandatory dividends | - | - | - | - | - | - | - | - | (107,044) | (107,044) | - | (107,044) | |||||||||||
| Subtotals | - | 174,033 | - | - | - | - | (435,084) | - | 13,613 | (247,438) | (4,207) | (251,645) | |||||||||||
| Other comprehensive income | - | - | - | (13,118) | 4,921 | 1,584 | - | - | - | (6,613) | 46 | (6,567) | |||||||||||
| Income for the year | - | - | - | - | - | - | - | 356,808 | - | 356,808 | 4,625 | 361,433 | |||||||||||
| Subtotals | - | - | - | (13,118) | 4,921 | 1,584 | - | 356,808 | - | 350,195 | 4,671 | 354,866 | |||||||||||
| Equity as of December 31, 2012 | 891,303 | 977,684 | (2,224) | (10,041) | 5,315 | 945 | 49,490 | 356,808 | (107,044) | 2,162,236 | 34,265 | 2,196,501 | |||||||||||
| Distribution of income from previous period | - | - | - | - | - | - | 356,808 | (356,808) | - | - | - | - | |||||||||||
| Equity as of January 1, 2013 | 977,684 | (2,224) | (10,041) | 5,315 | 945 | 406,298 | - | (107,044) | 2,162,236 | 34,265 | 2,196,501 | ||||||||||||
| Own shares transactions (1) | - | 29 | - | - | - | - | - | - | - | 29 | - | 29 | |||||||||||
| Dividends distributions/ withdrawals made | - | - | - | - | - | - | (232,780) | - | 107,044 | (125,736) | (7,907) | (133,643) | |||||||||||
| Transfer of retained earnings to reserves (*) | - | 155,502 | - | - | - | - | (155,502) | - | - | - | - | - | |||||||||||
| Provision for mandatory dividends | - | - | - | - | - | - | - | - | (132,688) | (132,688) | - | (132,688) | |||||||||||
| Subtotals | - | 155,531 | - | - | - | - | (388,282) | - | (25,644) | (258,395) | (7,907) | (266,302) | |||||||||||
| Other comprehensive income | - | - | - | 10,843 | (13,572) | 546 | - | - | - | (2,183) | 11 | (2,172) | |||||||||||
| Income for the year | - | - | - | - | - | - | - | 442,294 | - | 442,294 | 2,135 | 444,429 | |||||||||||
| Subtotals | - | - | - | 10,843 | (13,572) | 546 | - | 442,294 | - | 440,111 | 2,146 | 442,257 | |||||||||||
| Equity as of December 31, 2013 | 891,303 | 1,133,215 | (2,224) | 802 | (8,257) | 1,491 | 18,016 | 442,294 | (132,688) | 2,343,952 | 28,504 | 2,372,456 | |||||||||||
| RESERVES | VALUATION ADJUSTMENTS | RETAINED EARNINGS | ||||||||||
| Capital | Reserves and other retained earnings | Effects of merger of companies under common control | Available for sale investments | Cash flow hedge | Income tax effects | Retained earnings of prior years | Income for the year | Provision for mandatory dividends | Total attributable to equity holders of the Bank | Non-controlling interest | Total Equity | |
| MCh$ | MCh$ | MCh$ | MCh$ | MCh$ | MCh$ | MCh$ | MCh$ | MCh$ | MCh$ | MCh$ | MCh$ | |
| Equity as of December 31, 2012 | 891,303 | 977,684 | (2,224) | (10,041) | 5,315 | 945 | 49,490 | 356,808 | (107,044) | 2,162,236 | 34,265 | 2,196,501 |
| Distribution of income from previous period | - | - | - | - | - | - | 356,808 | (356,808) | - | - | - | - |
| Equity as of January 1, 2013 | 891,303 | 977,684 | (2,224) | (10,041) | 5,315 | 945 | 406,298 | - | (107,044) | 2,162,236 | 34,265 | 2,196,501 |
| Own shares transactions (1) | - | 29 | - | - | - | - | - | - | - | 29 | - | 29 |
| Dividends distributions/ withdrawals made | - | - | - | - | - | - | (232,780) | - | 107,044 | (125,736) | (7,907) | (133,643) |
| Transfer of retained earnings to reserves | - | 155,502 | - | - | - | - | (155,502) | - | - | - | - | - |
| Provision for mandatory dividends | - | - | - | - | - | - | - | - | (132,688) | (132,688) | - | (132,688) |
| Subtotal | - | 155,531 | - | - | - | - | (388,282) | - | (25,644) | (258,395) | (7,907) | (266,302) |
| Other comprehensive income | - | - | - | 10,843 | (13,572) | 546 | - | - | - | (2,183) | 11 | (2,172) |
| Income for the year | - | - | - | - | - | - | - | 442,294 | - | 442,294 | 2,135 | 444,429 |
| Subtotal | - | - | - | 10,843 | (13,572) | 546 | - | 442,294 | - | 440,111 | 2,146 | 442,257 |
| Equity as of December 31, 2013 | 891,303 | 1,133,215 | (2,224) | 802 | (8,257) | 1,491 | 18,016 | 442,294 | (132,688) | 2,343,952 | 28,504 | 2,372,456 |
| Distribution of income from previous period | - | - | - | - | - | - | 442,294 | (442,294) | - | - | - | - |
| Equity as of January 1, 2014 | 891,303 | 1,133,215 | (2,224) | 802 | (8,257) | 1,491 | 460,310 | - | (132,688) | 2,343,952 | 28,504 | 2,372,456 |
| Increase or decrease of capital and reserves | - | - | - | - | - | - | - | - | - | - | (1,374) | (1,374) |
| Own shares transactions | - | - | - | - | - | - | - | - | - | - | - | - |
| Dividends distributions/ withdrawals made | - | - | - | - | - | - | (265,156) | - | 132,688 | (132,468) | - | (132,468) |
| Transfer of retained earnings to reserves | - | 176,770 | - | - | - | - | (176,770) | - | - | - | - | - |
| Provision for mandatory dividends | - | - | - | - | - | - | - | - | (170,973) | (170,973) | - | (170,973) |
| Subtotal | - | 176,770 | - | - | - | - | (441,926) | - | (38,285) | (303,441) | (1,374) | (304,815) |
| Other comprehensive income | - | - | - | 20,878 | 18,982 | (8,296) | - | - | - | 31,564 | (27) | 31,537 |
| Income for the year | - | - | - | - | - | - | - | 569,910 | - | 569,910 | 5,980 | 575,890 |
| Subtotal | - | - | - | 20,878 | 18,982 | (8,296) | - | 569,910 | - | 601,474 | 5,953 | 607,427 |
| Equity as of December 31, 2014 | 891,303 | 1,309,985 | (2,224) | 21,680 | 10,725 | (6,805) | 18,384 | 569,910 | (170,973) | 2,641,985 | 33,083 | 2.675,068 |
| Distribution of income from previous period | - | - | - | - | - | - | 569,910 | (569,910) | - | - | - | - |
| Equity as of January 1, 2015 | 891,303 | 1,309,985 | (2,224) | 21,680 | 10,725 | (6,805) | 588,294 | - | (170,973) | 2,641,985 | 33,083 | 2.675,068 |
| Increase or decrease of capital and reserves | - | - | - | - | - | - | - | - | - | - | - | - |
| Own shares transactions | - | - | - | - | - | - | - | - | - | - | - | - |
| Dividends distributions/ withdrawals made | - | - | - | - | - | - | (330,199) | - | 170,973 | (159,226) | - | (159,226) |
| Transfer of retained earnings to reserves | - | 220,132 | - | - | - | - | (220,132) | - | - | - | (6,063) | (6,063) |
| Provision for mandatory dividends | - | - | - | - | - | - | - | - | (134,539) | (134,539) | - | (134,539) |
| Subtotal | - | 220,132 | - | - | - | - | (550,331) | - | 36,434 | (293,765) | (6,063) | (299,828) |
| Other comprehensive income | - | - | - | (28,645) | (2,099) | 6,432 | - | - | - | (24,312) | (102) | (24,414) |
| Income for the year | - | - | - | - | - | - | - | 448,466 | - | 448,466 | 3,263 | 451,729 |
| Subtotal | - | - | - | (28,645) | (2,099) | 6,432 | - | 448,466 | - | 424,154 | 3,161 | 427,315 |
| Equity as of December 31, 2015 | 891,303 | 1,530,117 | (2,224) | (6,965) | 8,626 | (373) | 37,963 | 448,466 | (134,539) | 2,772,374 | 30,181 | 2,802,555 |
| (1) | Corresponds to the profit on sale of own shares received in lieu of payment, see Note |
| Period | Total attributable to Bank shareholders | Allocated to reserves | Allocated to dividends | Percentage distributed | Number of shares | Dividend per share (in pesos) | |||||
| MCh$ | MCh$ | MCh$ | % | ||||||||
| Year 2012 (Shareholders Meeting April 2013) (*) | 387,967 | 155,187 | 232,780 | 60 | 188,446,126,794 | 1.235 | |||||
| Year 2011 (Shareholders Meeting April 2012) | 435,084 | 174,033 | 261,051 | 60 | 188,446,126,794 | 1.385 |
(*) For presentation purposes, these amounts have been adjusted to reflect the requirements established by IAS 19 - Revised 'Employee Benefits'. The amount of dividends distributed in 2012, are shown as that amount approved at that time by the Shareholders in their meeting. See Note 02 - Accounting changes.
|
![]()
Banco Santander Chile and Subsidiaries
CONSOLIDATED STATEMENTS OF CHANGES IN EQUITY
For the years ended December 31, 2015, 2014 and 2013
| Period | Total attributable to equity holders of the Bank | Allocated to reserves | Allocated to dividends | Percentage distributed | Number of shares | Dividend per share (in pesos) | |||||
| MCh$ | MCh$ | MCh$ | % | ||||||||
| Year 2014 (Shareholders Meeting April 2015) | 550,331 | 220,132 | 330,199 | 60 | 188,446,126,794 | 1.752 | |||||
| Year 2013 (Shareholders Meeting April 2014) | 441,926 | 176,770 | 265,156 | 60 | 188,446,126,794 | 1.407 |
Banco Santander Chile and Subsidiaries
CONSOLIDATED STATEMENTS OF CASH FLOWS
For the years ended
| December 31, | ||||||||||||
| 2013 | 2013 | 2012 | 2011 | |||||||||
| NOTE | ThUS$ | MCh$ | MCh$ | MCh$ | ||||||||
| A - CASH FLOWS FROM OPERATING ACTIVITIES | ||||||||||||
| CONSOLIDATED INCOME BEFORE TAX | 1,028,155 | 538,959 | 405,906 | 484,430 | ||||||||
| Debits (credits) to income that do not represent cash flows | ||||||||||||
| Depreciation and amortization | 33 | 116,509 | 61,074 | 56,369 | 53,466 | |||||||
| Impairment of property, plant, and equipment | 14 | 465 | 244 | 90 | 116 | |||||||
| Provision for loan losses | 30 | 814,090 | 426,746 | 436,707 | 351,962 | |||||||
| Mark to market of trading investments | (26,156) | (13,711) | (9,978) | (5,331) | ||||||||
| Income from investments in associates and other companies | 12 | (2,713) | (1,422) | (267) | (2,140) | |||||||
| Net gain on sale of assets received in lieu of payment | 34 | (12,535) | (6,571) | (2,654) | (5,629) | |||||||
| Provision on assets received in lieu of payment | 34 | 4,508 | 2,363 | 7,546 | 10,050 | |||||||
| Net gain on sale of investments in associates and other companies | 34 | (149,031) | (78,122) | (599) | - | |||||||
| Net gain on sale of property, plant and equipment | 34 | (336) | (176) | (9,194) | (11,863) | |||||||
| Net interest income | 26 | (2,054,106) | (1,076,762) | (1,042,734) | (972,300 ) | |||||||
| Net fee and commission income | 27 | (438,451) | (229,836) | (270,572) | (277,836) | |||||||
| Debits (credits) to income that do not represent cash flows | 73,598 | 38,580 | 18,324 | 24,181 | ||||||||
| Changes in deferred taxes | 15 | (52,762) | (27,658) | (39,354) | (38,057) | |||||||
| Increase/decrease in operating assets and liabilities | ||||||||||||
| Decrease (increase) of loans and accounts receivables from customers, net | (3,774,500) | (1,978,593) | (1,240,427) | (1,498,982) | ||||||||
| Decrease (increase) of financial investments | 335,532 | 175,886 | (93,372) | (217,424) | ||||||||
| Decrease (increase) due to resale agreements (assets) | (19,985) | (10,476) | 5,935 | 158,057 | ||||||||
| Decrease (increase) of interbank loans | (66,516) | (34,868) | (2,985) | (17,869) | ||||||||
| Decrease (increase) of assets received or awarded in lieu of payment | 8,613 | 4,515 | 46,463 | 51,061 | ||||||||
| Increase of debits in customers checking accounts | 758,075 | 397,383 | 462,367 | 213,424 | ||||||||
| Increase (decrease) of time deposits and other time liabilities | 1,074,130 | 563,059 | 195,535 | 1,652,579 | ||||||||
| Increase (decrease) of obligations with domestic banks | 954 | 500 | - | - | ||||||||
| Increase (decrease) of other demand liabilities or time obligations | 483,329 | 253,361 | 93,838 | (36,043) | ||||||||
| Increase (decrease) of obligations with foreign banks | 465,568 | 244,051 | (481,677) | 336,614 | ||||||||
| Increase (decrease) of obligations with Central Bank of Chile | (338) | (177) | (412) | (497) | ||||||||
| Increase (decrease) obligations under repurchase agreements | (181,505) | (95,145) | (240,264) | 249,656 | ||||||||
| Increase (decrease) in other financial liabilities | (5,398) | (2,830) | 16,012 | 10,310 | ||||||||
| Net increase of other assets and liabilities | (821,125) | (430,434) | (665,506) | (426,883) | ||||||||
| Redemption of letters of credit | (76,747) | (40,231) | (45,830) | (86,747) | ||||||||
| Mortgage bond issuance | 134,184 | 70,339 | - | - | ||||||||
| Senior bond issuances | 1,267,497 | 664,422 | 623,457 | 590,250 | ||||||||
| Redemption of senior bonds and payments of interest | (363,829) | (190,719) | (507,369) | (283,570) | ||||||||
| Issuance of subordinated bonds | 269,063 | 141,043 | - | 111,458 | ||||||||
| Redemption of subordinated bonds and payments of interest | (59,708) | (31,299) | (135,881) | (34,879) | ||||||||
| Interest received | 3,635,124 | 1,905,532 | 1,910,729 | 1,787,128 | ||||||||
| Interest paid | (1,392,488) | (729,942) | (871,130) | (813,125) | ||||||||
| Dividends received from investments in other companies | 12 | 1,479 | 775 | 896 | 795 | |||||||
| Fees and commissions received | 27 | 660,282 | 346,120 | 360,427 | 363,041 | |||||||
| Fees and commissions paid | 27 | (221,831) | (116,284) | (89,855) | (85,205) | |||||||
| Income tax | 15 | (180,332) | (94,530) | (44,473) | (77,308) | |||||||
| Total cash flow provided by (used in) operating activities | 1,230,763 | 645,166 | (1,153,932) | 1,556,890 | ||||||||
|
![]()
| December 31, | |||||||||
| 2015 | 2015 | 2014 | 2013 | ||||||
| NOTE | ThUS$ | MCh$ | MCh$ | MCh$ | |||||
| A - CASH FLOWS FROM OPERATING ACTIVITIES | |||||||||
| CONSOLIDATED INCOME BEFORE TAX | 746,149 | 528,124 | 626,940 | 538,959 | |||||
| Debits (credits) to income that do not represent cash flows | (1,310,527) | (927,591) | (1,022,091) | (905,251) | |||||
| Depreciation and amortization | 32 | 75,747 | 53,614 | 44,127 | 61,074 | ||||
| Impairment of property, plant, and equipment | 32 | 30 | 21 | 36,664 | 244 | ||||
| Provision for loan losses | 29 | 660,380 | 467,417 | 413,880 | 426,746 | ||||
| Mark to market of trading investments | (4,240) | (3,001) | (11,285) | (13,711) | |||||
| Income from investments in associates and other companies | 11 | (3,656) | (2,588) | (2,165) | (1,422) | ||||
| Net gain on sale of assets received in lieu of payment | 33 | (3,468) | (2,455) | (2,811) | (6,571) | ||||
| Provision on assets received in lieu of payment | 33 | 11,024 | 7,803 | 1,577 | 2,363 | ||||
| Net gain on sale of investments in associates and other companies | 33 | - | - | - | (78,122) | ||||
| Net gain on sale of property, plant and equipment | 33 | (538) | (381) | (687) | (176) | ||||
| Net interest income | 25 | (1,773,391) | (1,255,206) | (1,317,104) | (1,076,762) | ||||
| Net fee and commission income | 26 | (335,726) | (237,627) | (227,283) | (229,836) | ||||
| Debits (credits) to income that do not represent cash flows | 127,838 | 90,484 | 115,240 | 38,580 | |||||
| Changes in deferred taxes | 14 | (65,527) | (45,672) | (72,244) | (27,658) | ||||
| Increase/decrease in operating assets and liabilities | 1,536,117 | 1,087,263 | 677,574 | 1,011,458 | |||||
| (Increase) of loans and accounts receivables from customers, net | (2,944,128) | (2,083,854) | (1,674,156) | (1,978,593) | |||||
| (Increase) decrease of financial investments | (81,564) | (57,731) | (437,853) | 175,886 | |||||
| Decrease (increase) due to resale agreements (assets) | 3,480 | 2,463 | 17,469 | (10,476) | |||||
| Decrease (increase) of interbank loans | (1,493) | (1,057) | 113,477 | (34,868) | |||||
| Decrease of assets received or awarded in lieu of payment | 5,873 | 4,157 | 4,431 | 4,515 | |||||
| Increase of debits in customers checking accounts | 1,052,364 | 744,863 | 727,604 | 397,383 | |||||
| Increase of time deposits and other time liabilities | 2,499,049 | 1,768,827 | 738,668 | 563,059 | |||||
| Increase (decrease) of obligations with domestic banks | (93,255) | (66,006) | 65,506 | 500 | |||||
| Increase of other demand liabilities or time obligations | 184,746 | 130,763 | 132,130 | 253,361 | |||||
| Increase (decrease) of obligations with foreign banks | 200,719 | 142,069 | (516,156) | 244,051 | |||||
| (Decrease) of obligations with Central Bank of Chile | (127) | (90) | (126) | (177) | |||||
| (Decrease) increase of obligations under repurchase agreements | (350,999) | (248,437) | 183,154 | (95,145) | |||||
| Increase (decrease) in other financial liabilities | 21,760 | 15,402 | 15,344 | (2,830) | |||||
| Net increase of other assets and liabilities | (1,816,978) | (1,286,057) | (805,865) | (430,434) | |||||
| Redemption of letters of credit | (37,751) | (26,720) | (29,668) | (40,231) | |||||
| Mortgage bond issuance | - | - | 36,941 | 70,339 | |||||
| Senior bond issuances | 1,241,013 | 878,389 | 1,196,273 | 664,422 | |||||
| Redemption of mortgage bonds and payments of interest | (7,549) | (5,343) | (4,195) | - | |||||
| Redemption of senior bonds and payments of interest | (327,737) | (231,972) | (574,507) | (190,719) | |||||
| Issuance of subordinated bonds | - | - | - | 141,043 | |||||
| Redemption of subordinated bonds and payments of interest | (14,689) | (10,397) | (8,886) | (31,299) | |||||
| Interest received | 2,957,089 | 2,093,028 | 2,235,437 | 1,905,532 | |||||
| Interest paid | (1,181,893) | (836,544) | (913,800) | (729,942) | |||||
| Dividends received from investments in other companies | 11 | 393 | 278 | 119 | 775 | ||||
| Fees and commissions received | 26 | 569,229 | 402,900 | 366,729 | 346,120 | ||||
| Fees and commissions paid | 26 | (233,502) | (165,273) | (139,446) | (116,284) | ||||
| Income tax | 14 | (107,933) | (76,395) | (51,050) | (94,530) | ||||
| Total cash flow provided by (used in) operating activities | 971,739 | 687,796 | 282,423 | 645,166 | |||||
Banco Santander Chile and Subsidiaries
CONSOLIDATED STATEMENTS OF CASH FLOWS
For the years ended
| December 31, | December 31, | |||||||||||||||||
| 2013 | 2013 | 2012 | 2011 | 2015 | 2015 | 2014 | 2013 | |||||||||||
| NOTE | ThUS$ | MCh$ | MCh$ | MCh$ | NOTE | ThUS$ | MCh$ | MCh$ | MCh$ | |||||||||
| B - CASH FLOWS FROM INVESTMENT ACTIVITIES: | ||||||||||||||||||
| Purchases of property, plant, and equipment | 14 | (77,812) | (40,789) | (36,738) | (26,689) | 13 | (91,991) | (65,111) | (59,088) | (40,789) | ||||||||
| Sales of property, plant, and equipment | 14 | 664 | 348 | 6,573 | 8,645 | 13 | 171 | 121 | 172 | 348 | ||||||||
| Purchases of investments in associates and other companies | 12 | (2,747) | (1,440) | (61) | - | 11 | (427) | (302) | (6,313) | (1,440) | ||||||||
| Sales of investments in associates and other companies | 12 | 172,226 | 90,281 | 401 | - | 11 | - | - | - | 90,281 | ||||||||
| Purchases of intangible assets | 13 | (35,101) | (18,400) | (42,262) | (34,051) | 12 | (38,956) | (27,573) | (27,437) | (18,400) | ||||||||
| Total cash flow provided by (used in) investment activities | 57,230 | 30,000 | (72,087) | (52,095) | ||||||||||||||
| Total cash flow (used in) provided by investment activities | (131,203) | (92,865) | (92,666) | 30,000 | ||||||||||||||
| C - CASH FLOW FROM FINANCING ACTIVITIES: | ||||||||||||||||||
| From shareholders’ financing activities | (444,067) | (232,780) | (261,051) | (286,294) | (466,515) | (330,199) | (265,156) | (232,780) | ||||||||||
| Dividends paid | (444,067) | (232,780) | (261,051) | (286,294) | (466,515) | (330,199) | (265,156) | (232,780) | ||||||||||
| From non-controlling interest financing activities | (15,084) | (7,907) | (4,207) | (3,122) | - | - | - | (7,907) | ||||||||||
| Dividends and/or withdrawals paid | 15,084 | (7,907) | (4,207) | (3,122) | - | - | - | (7,907) | ||||||||||
| Total cash flow used in financing activities | (459,151) | (240,687) | (265,258) | (289,416) | (466,515) | (330,199) | (265,156) | (240,687) | ||||||||||
| D – NET INCREASE (DECREASE) IN CASH AND CASH EQUIVALENTS DURING THE YEAR | 828,842 | 434,479 | (1,491,277) | 1,215,379 | 374,021 | 264,732 | (75,399) | 434,479 | ||||||||||
| E – EFFECTS OF FOREIGN EXCHANGE RATE FLUCTUATIONS | (39,487) | (20,699) | (3,664) | (71,151) | 287,420 | 203,436 | 34,893 | (20,699) | ||||||||||
| F - INITIAL BALANCE OF CASH AND CASH EQUIVALENTS | 2,834,277 | 1,485,728 | 2,980,669 | 1,836,441 | 2,626,451 | 1,859,002 | 1,899,508 | 1,485,728 | ||||||||||
| FINAL BALANCE OF CASH AND CASH EQUIVALENTS | 5 | 3,623,632 | 1,899,508 | 1,485,728 | 2,980,669 | 4 | 3,287,892 | 2,327,170 | 1,859,002 | 1,899,508 | ||||||||
| December 31, | ||||||||||||||||||
| Reconciliation of provisions for the Consolidated Statement of Cash Flow for the year ended | 2013 | 2013 | 2012 | 2011 | ||||||||||||||
| ThUS$ | MCh$ | MCh$ | MCh$ | |||||||||||||||
| Provision for loan losses for cash flow purposes | 30 | 814,090 | 426,746 | 436,707 | 351,962 | |||||||||||||
| Recovery of loans previously charged off | 30 | (105,464) | (55,284) | (33,015) | (35,825) | |||||||||||||
| Provision for loan losses - net | 708,626 | 371,462 | 403,692 | 316,137 | ||||||||||||||
| December 31, | |||||||||
| Reconciliation of provisions for the Consolidated Statement of Cash Flow for the year ended | 2015 | 2015 | 2014 | 2013 | |||||
| ThUS$ | MCh$ | MCh$ | MCh$ | ||||||
| Provision for loan losses for cash flow purposes | 29 | 660,380 | 467,417 | 413,880 | 426,746 | ||||
| Recovery of loans previously charged off | 29 | (96,270) | (68,140) | (58,977) | (55,284) | ||||
| Provision for loan losses – net | 564,110 | 399,277 | 354,903 | 371,462 | |||||
|
| Banco Santander Chile and Subsidiaries |
Notes to the Consolidated Financial Statements |
AS OF DECEMBER 31, 2015 AND 2014 AND FOR THE YEARS ENDED DECEMBER 31, |
SUMMARY OF SIGNIFICANT ACCOUNTING POLICIES
Notes to the Consolidated Financial Statements
As of and for the years ended December 31, 2013, 2012 and 2011
CORPORATE INFORMATION
Banco Santander Chile (formerly Banco Santiago) is a banking corporation (limited company bank) organizedcompany) operating under the laws of the Republic of Chile, headquartered at Bandera #140, Santiago, whichN°140, Santiago. The corporation provides a broad range of general banking services to its customers, ranging from individuals to major corporations. Banco Santander Chile and its subsidiaries (collectively referred to herein as the “Bank” or “Banco Santander Chile”) offers commercial and consumer banking services, as well as other services, including (but not limited to) factoring, collection, leasing, securities and insurance brokerage,brokering, mutual and investment fund management, and investment banking.
Banco Santander Spain controls Banco Santander-Chile through its holdings in Teatinos Siglo XXI Inversiones Ltda. and Santander-Chile Holding S.A., which are controlled subsidiaries of Banco Santander Spain. As of December 31, 20132015 Banco Santander Spain owns or controls directly and indirectly 99.5% of Santander-Chile Holding S.A. and 100% of Teatinos Siglo XXI Inversiones Ltda. This gives Banco Santander Spain control over 67.18% of the Bank’s shares.
| a) | Basis of preparation |
These Consolidated Financial Statements have been prepared in accordance with International Financial Reporting Standards (IFRS) as issued by the International Accounting Standards Board (IASB) (hereinafter referred to as IFRS).
For purposes of these financial statements we use certain terms and conventions. References to “US$”, “U.S. dollars” and “dollars” are to United States dollars, references to “EUR” are to European Economic Community Euro, references to “CNY” are to Chinese Yuan, references to “CHF” are to Swiss franc, references to “Chilean pesos,”pesos”, “pesos” or “Ch$” are to Chilean pesos, and references to “UF” are to Unidades de Fomento. The UF is an inflation-indexed Chilean monetary unit with a value in Chilean pesos that changes daily to reflect changes in the official Consumer Price Index (“CPI”) of the Instituto Nacional de Estadísticas (the Chilean National Institute of Statistics) for the previous month.
The UF is revalued in monthly cycles. Each day in the period beginning on the tenth day of the current month through the ninth day of the succeeding month, the nominal peso value of the UF is indexed up (or down in the event of deflation) in order to reflect a proportionate amount of the change in the Chilean Consumer Price Index during the prior calendar month. One UF is equaled Ch$22,840.7524,627.10 as of December 31, 20122014 and Ch$23,309.5625,629.09 as of December 31, 2013.2015. In 2013,2015, UF inflation was 2.1%4.4% compared to 2.5%4.6% in 2012.2014. The effect of any changes in the nominal peso value of our UF-denominated interest earning assets and interest bearing liabilities is reflected in our results of operations as an increase (or decrease, in the event of deflation) in interest income and expense, respectively.respectively.
The Notes to the Consolidated Financial Statements contain additional information to support the figures submitted in the Consolidated Statement of Financial Position, Consolidated Statement of Income, Consolidated Statement of Comprehensive Income, Consolidated Statement of Changes in Equity and Consolidated Statement of Cash Flows for the period.
| b) | Basis of preparation for the Consolidated Financial Statements |
The Consolidated Financial Statements as of December 31, 2015, 2014 and 2013, and 2012 consolidateincorporate the financial statements of the Bank entities over which the bankBank has control (including structured entities); and includes the adjustments, reclassifications and eliminations needed to comply with the accounting and valuation criteria established by IFRS issued by IASB.IFRS. Control is achieved when the Bank:
| I. | has power over the investee; |
| II. | is exposed, or has rights, to variable returns from its involvement with the investee; and |
| III. | has the ability to use its power to affect its returns. |
The Bank reassesses whether or not it controls an investee if facts and circumstances indicate that there are changes to one or more of the three elements of control listed above.
Banco Santander Chile and Subsidiaries Notes to the Consolidated Financial Statements AS OF DECEMBER 31, 2015 AND 2014 AND FOR THE YEARS ENDED DECEMBER 31, 2015, 2014 AND 2013 |
NOTE 01
SUMMARY OF SIGNIFICANT ACCOUNTING POLICIES, continued
When the Bank has less than a majority of the voting rights of an investee, it has power over the investee when the voting rights are sufficient to give it the practical ability to direct the relevant activities over the investee unilaterally. The Bank considers all relevant facts and circumstances in assessing whether or not the Bank’s voting rights in an investee are sufficient to give it power, including:
|
NOTE 01
SUMMARY OF SIGNIFICANT ACCOUNTING POLICIES, continued
| · | the size of the Bank’s holding of voting rights relative to the size and dispersion of holdings of the other vote holders; |
| · | potential voting rights held by the Bank, other vote holders or other parties; |
| · | rights arising from other agreements; and |
| · | any additional facts and circumstances that indicate that the Bank has, or does not have, the current ability to direct the relevant activities at the time that decisions need to be made, including voting patterns at previous |
Consolidation of a subsidiary begins when the Bank obtains control over the subsidiary and ceases when the Bank loses control over the subsidiary. Specifically, income and expenses of a subsidiary acquired or disposed of during the year are included in the Consolidated Statement of Income and in the Consolidated Statement of Other Comprehensive Income from the date the Bank gains control until the date when the Bank ceases to control the subsidiary.
Profit or loss and each component of other comprehensive income are attributed to the owners of the Bank and to the non-controlling interests. Total comprehensive income of subsidiaries is attributed to the owners of the Bank and to the non-controlling interests even if this results in the non-controlling interests having a deficit balance.in certain circumstances.
When necessary, adjustments are made to the financial statements of the subsidiaries to bringensure their accounting policies into lineare consistent with the BankBank’s accounting policies.
All intragroup assets, and liabilities, equity, income, expenses and cash flows relating to transactions between consolidated entities are eliminated in full on consolidation.
Changes in the consolidated entities ownership interests in subsidiaries that do not result in losinga loss of control over the subsidiaries are accounted for as equity transactions. The carrying amountsvalues of the Group’s interestBank’s equity and the non-controlling interestsinterests’ equity are adjusted to reflect the changes into their relative interests in the subsidiaries. Any difference between the amount by which the non-controlling interests are adjusted and the fair value of the consideration paid or received is recognized directly in equity and attributed to owners of the Bank.
In addition, third parties’ shares in the Consolidated Bank’s consolidated equity are presented as “Non-controlling interests” in the Consolidated Statement of Changes in Equity. Their share in the income for the year is presented as “Attributable to non-controlling interests”interest” in the Consolidated Statement of IncomeIncome.
The following companies are considered entities controlled by the Bank and are therefore within the scope of consolidation:
| i. | Entities controlled by the Bank through participation in equity |
| Percent ownership share | ||||||||||||||
| As of December 31, | ||||||||||||||
| Place of | 2013 | 2012 | 2011 | |||||||||||
| Incorporation and | Direct | Indirect | Total | Direct | Indirect | Total | Direct | Indirect | Total | |||||
| Name of the Subsidiary | Main activity | operation | % | % | % | % | % | % | % | % | % | |||
| Santander Corredora de Seguros Limitada | Insurance brokerage | Santiago, Chile | 99.75 | 0.01 | 99.76 | 99.75 | 0.01 | 99.76 | 99.75 | 0.01 | 99.76 | |||
| Santander S.A. Corredores de Bolsa | Financial instruments brokerage | Santiago, Chile | 50.59 | 0.41 | 51.00 | 50.59 | 0.41 | 51.00 | 50.59 | 0.41 | 51.00 | |||
| Santander Asset Management S.A. Administradora General de Fondos (*) | Third-party funds administration | Santiago, Chile | - | - | - | 99.96 | 0.02 | 99.98 | 99.96 | 0.02 | 99.98 | |||
| Santander Agente de Valores Limitada | Securities brokerage | Santiago, Chile | 99.03 | - | 99.03 | 99.03 | - | 99.03 | 99.03 | - | 99.03 | |||
| Santander S.A. Sociedad Securitizadora | Purchase of credits and issuance of debt instruments | Santiago, Chile | 99.64 | - | 99.64 | 99.64 | - | 99.64 | 99.64 | - | 99.64 | |||
| Santander Servicios de Recaudación y Pagos Limitada | Support society, making and receiving payments | Santiago, Chile | 99.90 | 0.10 | 100.00 | 99.90 | 0.10 | 100.00 | 99.90 | 0.10 | 100.00 | |||
(*)Santander Asset Management S.A. Administradora General de Fondos was sold in December 2013, see Note 03 - Significant events.
| Name of the Subsidiary | Place of Incorporation and | Percent ownership share | |||||||||||
| As of December 31, | |||||||||||||
| 2015 | 2014 | 2013 | |||||||||||
| Direct | Indirect | Total | Direct | Indirect | Total | Direct | Indirect | Total | |||||
| Main Activity | % | % | % | % | % | % | % | % | % | ||||
| Santander Corredora de Seguros Limitada | Insurance brokerage | Santiago, Chile | 99.75 | 0.01 | 99.76 | 99.75 | 0.01 | 99.76 | 99.75 | 0.01 | 99.76 | ||
| Santander Corredores de Bolsa Limitada(*) | Financial instruments brokerage | Santiago, Chile | 50.59 | 0.41 | 51.00 | 50.59 | 0.41 | 51.00 | 50.59 | 0.41 | 51.00 | ||
| Santander Agente de Valores Limitada | Securities brokerage | Santiago, Chile | 99.03 | - | 99.03 | 99.03 | - | 99.03 | 99.03 | - | 99.03 | ||
| Santander S.A. Sociedad Securitizadora | Purchase of credits and issuance of debt instruments | Santiago, Chile | 99.64 | - | 99.64 | 99.64 | - | 99.64 | 99.64 | - | 99.64 | ||
| Santander Servicios de Recaudación y Pagos Limitada (**) | Support society, making and receiving payment | Santiago, Chile | - | - | - | - | - | - | 99.90 | 0.1 | 100.00 | ||
The
(*) On June 19, 2015, Santander Corredores de Bolsa Limitada, our stock broker company has changed its corporate structure to limited liability company. This situation was informed to SVS through an “essential fact” in accordance with the Law 18.045 articles 9° and 10°, and General Regulation (NCG) N°16 and N°30.
(**) From May 1, 2014, this entity was absorbed by the Bank, only holds complete controlling participation in Santander Servicios de Recaudación y Pagos Limitada. previous authorization obtained from the SBIF on March 26, 2014.
The detail of non-controlling participation on all the remaining subsidiaries can be seen in Note 25 –24– Non-controlling interest.
|
Banco Santander Chile and Subsidiaries |
Notes to the Consolidated Financial Statements |
AS OF DECEMBER 31, 2015 AND 2014 AND FOR THE YEARS ENDED DECEMBER 31, |
NOTE 01
SUMMARY OF SIGNIFICANT ACCOUNTING POLICIES, continued
| ii. | Entities controlled by the Bank through other considerations |
The following companies have been consolidated based on the determination that the Bank has control as previously defined above and in accordance with IFRS 10,Consolidated Financial Statements:
| - | Santander Gestión de Recaudación y Cobranza Limitada (collection services) |
| - | Bansa Santander S.A. (management of repossessed assets and leasing of properties) |
iii. AssociatesDuring 2015 Multinegocios S.A. (management of sales force), Servicios Administrativos y Financieros Limitada (management of sales force) and Multiservicios de Negocios Limitada (call center) have ceased rendering sales services to the Bank and the Bank no longer controls their relevant activities. Therefore as of June 30, 2015 these entities have been excluded from the consolidation perimeter.
As of August 1, 2014, Servicios de Cobranza Fiscalex Limitada was absorbed by Santander Gestión de Recaudación y Cobranza Limitada.
| iii. | Associates |
An associate is an entity over which the Bank has significant influence. Significant influence, in this case, is defined as the power to participate in the financial and operating policy decisions of the investee but is not control or joint control over those policies. An investment in an associate is accounted for using the equity method from the date on which the investee becomes an associate.
The following companies are considered “Associates” in which the Bank accounts for its participation using the equity method:
| Percentage of ownership share | |||||||
| Place of | As of December 31, | ||||||
| incorporation and | 2013 | 2012 | 2011 | ||||
| Subsidiaries | Main activity | operation | % | % | % | ||
| Redbanc S.A. | ATM services | Santiago, Chile | 33.43 | 33.43 | 33.43 | ||
| Transbank S.A. | Debit and credit card services | Santiago, Chile | 25.00 | 25.00 | 32.71 | ||
| Centro de Compensación Automatizado | Electronic fund transfer and compensation services | Santiago, Chile | 33.33 | 33.33 | 33.33 | ||
| Sociedad Interbancaria de Depósito de Valores S.A. | Delivery of securities on public offer | Santiago, Chile | 29.28 | 29.28 | 29.28 | ||
| Cámara de Compensación de Alto Valor S.A. | Payments clearing | Santiago, Chile | 14.14 | 14.14 | 12.65 | ||
| Administrador Financiero del Transantiago S.A. | Administration of boarding passes to public transportation | Santiago, Chile | 20.00 | 20.00 | 20.00 | ||
| Sociedad Nexus S.A. | Credit card processor | Santiago, Chile | 12.90 | 12.90 | 12.90 | ||
| Servicios de Infraestructura de Mercado OTC S.A. | Administration of the infrastructure for the financial market of derivative instruments | Santiago, Chile | 11.11 | - | - | ||
Place of Incorporation and operation | Percentage of ownership share | ||||||
| As of December 31, | |||||||
| 2015 | 2014 | 2013 | |||||
| Associates | Main activity | % | % | % | |||
| Redbanc S.A. | ATM services | Santiago, Chile | 33.43 | 33.43 | 33.43 | ||
| Transbank S.A. | Debit and credit card services | Santiago, Chile | 25.00 | 25.00 | 25.00 | ||
| Centro de Compensación Automatizado | Electronic fund transfer and compensation services | Santiago, Chile | 33.33 | 33.33 | 33.33 | ||
| Sociedad Interbancaria de Depósito de Valores S.A. | Delivery of securities on public offer | Santiago, Chile | 29.29 | 29.29 | 29.28 | ||
| Cámara Compensación de Alto Valor S.A. | Payments clearing | Santiago, Chile | 14.23 | 14.14 | 14.14 | ||
| Administrador Financiero del Transantiago S.A. | Administration of boarding passes to public transportation | Santiago, Chile | 20.00 | 20.00 | 20.00 | ||
| Sociedad Nexus S.A. | Credit card processor | Santiago, Chile | 12.90 | 12.90 | 12.90 | ||
| Servicios de Infraestructura de Mercado OTC S.A. | Administration of the infrastructure for the financial market of derivative instruments | Santiago, Chile | 11.11 | 11.11 | 11.11 | ||
In the case of Sociedad Nexus S.A. and Cámara Compensación de Pagos Alto Valor S.A., Banco Santander Chile has a representative on the Board of Directors. According to this fact and definitions previously mentioned,As per the definition of associates, the Bank has concluded that it exerts significant influence over those entities.
In July, 2013 national banks jointly created the company Servicios de Infraestructura de Mercado OTC S.A., and its objective is to offer certain services to the financial market, granting services of registration, confirmation, storage, consolidation and reconciliation of operations with derivative financial instruments. Banco Santander possesses 11.11% equity participation (see Note 12 - Investments in associates and other companies). This investee is considered an associate since, through its executives;due to the Bank has beenBank’s executives being actively involved in managingthe management of the company, inincluding the process of organization and in the implementation of the functional structurestructuring of this company resulting infrom the point of incorporation, therefore exercising significant influence over this company. This influence is in addition to an 11.11% holding in this associate.
iv. Share or rightsIn the Extraordinary Shareholder meeting held in other companiesApril 2015, Transbank agreed to increase its capital. Banco Santander Chile signed the contract maintaining its ownership.
In October 2015, HSBC Bank Chile sold its ownership share in Camara de Compensación de Pagos de Alto Valor S.A. to Banco Santander Chile, increasing our participation to 14.23%.
Banco Santander Chile and Subsidiaries Notes to the Consolidated Financial Statements AS OF DECEMBER 31, 2015 AND 2014 AND FOR THE YEARS ENDED DECEMBER 31, 2015, 2014 AND 2013 |
NOTE 01
SUMMARY OF SIGNIFICANT ACCOUNTING POLICIES, continued
| iv. | Share or rights in other companies |
Such entities represent those over which the Bank has no control or significant influences and are presented in this category. These holdings are shown at purchase value.
|
NOTE 01
SUMMARY OF SIGNIFICANT ACCOUNTING POLICIES, continuedacquisition value less impairment, if any.
| c) | Non-controlling interest |
Non-controlling interest represents the portion of net income and net assets which the Bank does not own, either directly or indirectly. It is presented as “Attributable to non-controlling interest” separately in the Consolidated Statement of Income, and separately from shareholders’ equity in the Consolidated Statement of Financial Position.
In the case of entities controlled by the Bank through other considerations, income and equity are presented in full as non-controlling interest, since the Bank controls them, but does not have any ownership expressed as a percentage.
| d) |
The Bank discloses separate information for each operating segment that
Operating segments with similar economic characteristics often have aexhibit similar long-term financial performance. Two or more segments can be combined only if aggregation is consistent with International Financial Reporting Standard 8 “Operating Segments” (IFRS 8) and the segments have similar economic characteristics and are similar in each of the following respects:
| i. | the nature of the products and services; |
| ii. | the nature of the production processes; |
| iii. | the type or class of customers that use their products and services; |
| iv. | the methods used to distribute their products or services; and |
| v. | if applicable, the nature of the regulatory environment, for example, banking, insurance, or public utilities. |
The Bank reports separately on each operating segment that exceeds any of the following quantitative thresholds:
| i. |
| ii. |
| iii. |
Operating segments that do not meet any of the quantitative thresholdsthreshold may be treated as segments to be reported, in which case the information must be disclosed separately if management believes it could be useful for the users of the Consolidated Financial Statements.
Information about other business activities of the operating segments not separately reported is combined and disclosed in the “Other segments” category.
According to the information presented, the Bank’s segments were determined under the following definitions: An operating segment is a component of an entity:
| i. | that engages in business activities from which it may earn revenues and incur expenses (including revenues and expenses from transactions with other components of the same entity); |
| ii. | whose operating results are regularly reviewed by the entity’s chief executive officer, who makes decisions about resources allocated to the segment and assess its performance; and |
| iii. | for which discrete financial information is available. |
As of December 31, 2015, the Bank has recast Note 3 Reporting Segments for the two years ended December 31, 2014 and changed the related disclosures. The change in the reporting segments results from the application of new criteria starting with the financial information for 2015 that aim to reflect the Bank’s current reporting structure. The main changes to the reported segments are described in Note 3.
|
Banco Santander Chile and Subsidiaries |
Notes to the Consolidated Financial Statements |
AS OF DECEMBER 31, 2015 AND 2014 AND FOR THE YEARS ENDED DECEMBER 31, |
NOTE 01
SUMMARY OF SIGNIFICANT ACCOUNTING POLICIES, continued
| e) | Functional and presentation currency |
According to International Accounting Standard No.21IAS 21 “The Effects of Changes in Foreign Exchange Rates” (IAS 21), the Chilean peso, which is the currency of the primary economic environment in which the Bank operates and the currency which influences its costs and revenuesrevenue structure, has been defined as the Bank’s functional and presentation currency.
Accordingly, all balances and transactions denominated in currencies other than the Chilean Peso are treated as “foreign currency.”currency”.
The Bank maintains its accounting records and prepares its financial statements in Chilean pesos. The US dollar amounts disclosed in the accompanying financial statements are presented solely for the convenience of the reader as of December 31, 20132015 using the observed exchange rate of Ch$524.20707.80 per US$1.00. This translation is just a reference and in no case should be construed as accurately representing the actual amounts.
| f) | Foreign currency transactions |
The Bank grants loans and accepts depositsmakes transactions in amounts denominated in foreign currencies, mainly the U.S. dollar. Assets and liabilities denominated in foreign currencies, held by the Bank are translated to Chilean pesos based on the market rate published by Reuters at 1:30 p.m. onrepresentative of the last business day of every month;month end reported; the rate used was Ch$524.20707.80 per US$1 as of December, 31, 20132015 (Ch$478.75608.33 per US$1 as of December, 31, 2012)2014).
The amounts of net foreign exchange gains and losses includes recognition of the effects that exchange rate variations have on assets and liabilities denominated in foreign currencies and the profits and losses on foreign exchange spot and forward transactions undertaken by the Bank.
| g) | Definitions and classification of financial instruments |
| i. | Definitions |
A “financial instrument” is any contract that gives rise to a financial asset of one entity, and a financial liability or equity instrument of another entity.
An “equity instrument” is a legal transaction that evidences a residual interest in the assets of an entity deducting all of its liabilities.
A “Financial“financial derivative” is a financial instrument whose value changes in response to the changes in an observable market variable (such as an interest rate, a foreign exchange rate, a financial instrument’s price, or a market index, including credit ratings), whose initial investment is very small compared with other financial instruments having a similar response to changes in market factors, and which is generally settled at a future date.
“Hybrid financial instruments” are contracts that simultaneously include a non-derivative host contract together with a financial derivative, known as an embedded derivative, which is not separately transferable and has the effect that some of the cash flows of the hybrid contract vary in a way similar to a stand-alone derivative.
| ii. | Classification of financial assets for measurement purposes |
Financial assets are classified into the following specified categories: financial assets trading investments “atat fair value through profit or loss'loss (FVTPL), ‘held to maturity' investments,maturity investments’, ‘available for sale investments'investments (AFS)’ financial assets and ‘loans and accounts receivable from customers'. The classification depends on the nature and purpose of the financial assets and is determined at the time of initial recognition. All regular way purchases or sales of financial assetsasset are recognisedrecognized and derecognisedderecognized on a trade date basis. Regular way purchases or sales are purchases or sales of financial assets that require delivery of assetsthe asset within the time frame established by regulation or convention in the marketplace.
Financial assets are initially recognized at fair value plus, in the case of a financial assets not at fair value through profit or loss, transaction costs that are directly attributable to the acquisition or issue.
Banco Santander Chile and Subsidiaries Notes to the Consolidated Financial Statements AS OF DECEMBER 31, 2015 AND 2014 AND FOR THE YEARS ENDED DECEMBER 31, 2015, 2014 AND 2013 |
NOTE 01
SUMMARY OF SIGNIFICANT ACCOUNTING POLICIES, continued
Effective interest method
The effective interest method is a method of calculating the amortised cost of a debt instrument and of allocating interest income over the relevant period. The effective interest rate is the rate that exactly discounts estimated future cash receipts (including all fees and points paid or received that form an integral part of the effective interest rate, transaction costs and other premiums or discounts) through the expected life of the debt instrument, or, where appropriate, a shorter period, to the net carrying amount on initial recognition.
|
NOTE 01
SUMMARY OF SIGNIFICANT ACCOUNTING POLICIES, continued
Income is recognised on an effective interest basis for loans and accounts receivables other than those financial assets classified as at fair value through profit or loss.
Financial assets at FVTPL - Trading investments
Financial assets are classified as at FVTPL when the financial asset is either held for trading or it is designated as at fair value through profit or loss.
A financial asset is classified as held for trading if:
| · | it has been acquired principally for the purpose of selling it in the near term; or |
| · | on initial recognition it is part of a portfolio of identified financial instruments that the Bank manages together and has a recent actual pattern of short-term profit-taking; or |
| · | it is a derivative that is not designated and effective as a hedging instrument. |
A financial asset other than a financial asset held for trading may be designated as at FVTPL upon initial recognition if:
| · | such designation eliminates or significantly reduces a measurement or recognition inconsistency that would otherwise arise; or |
| · | the financial asset forms part of a group of financial assets or financial liabilities or both, which is managed and its performance is evaluated on a fair value basis, in accordance with the Bank's documented risk management or investment strategy, and information about the grouping is provided internally on that basis; or |
| · | it forms part of a contract containing one or more embedded derivatives, and IAS 39 permits the entire combined contract to be designated as |
Financial assets at FVTPL are stated at fair value, with any gains or losses arising on remeasurement recognised in profit or loss. The net gain or loss recognised in profit or loss incorporates any dividend or interest earned on the financial asset and is included in the ‘net profit (loss)income (expense) from financial operations' line item.
Held to maturity investments
Held-to-maturity investments are non-derivative financial assets with fixed or determinable payments and fixed maturity dates that the Bank has the positive intent and ability to hold to maturity. Subsequent to initial recognition, held-to-maturity investments are measured at amortised cost using the effective interest method less any impairment.
Available for sale investments (AFS investments)
AFS investments are non-derivatives that are either designated as AFS or are not classified as (a) loans and accounts receivable from customers, (b) held-to-maturity investments or (c) financial assets at fair value through profit or loss (trading investments).
Financial instruments held by the Bank that are traded in an active market are classified as AFS and are stated at fair value at the end of each reporting period. The Bank also has investments in financial instruments that are not traded in an active market but that are also classified as AFS investments and stated at fair value at the end of each reporting period (because the directors consider that fair value can be reliably measured). Changes in the carrying amount of AFS monetary financial assets relating to changes in foreign currency rates, interest income calculated using the effective interest method and dividends on AFS equity investments are recognised in profit or loss. Other changes in the carrying amount of available for sale investments are recognised in other comprehensive income and accumulated under the heading of “Valuation Adjustment”. When the investment is disposed of or is determined to be impaired, the cumulative gain or loss previously accumulated in the investments revaluation reserve is reclassified to profit or loss.
Dividends on AFS equity instruments are recognised in profit or loss when the Bank's right to receive the dividends is established.
Banco Santander Chile and Subsidiaries Notes to the Consolidated Financial Statements AS OF DECEMBER 31, 2015 AND 2014 AND FOR THE YEARS ENDED DECEMBER 31, 2015, 2014 AND 2013 |
NOTE 01
SUMMARY OF SIGNIFICANT ACCOUNTING POLICIES, continued
The fair value of AFS monetary financial assets denominated in a foreign currency is determined in that foreign currency and translated as the described in f) above. The foreign exchange gains and losses that are recognised in profit or loss are determined based on the amortised cost of the monetary asset.
|
NOTE 01
SUMMARY OF SIGNIFICANT ACCOUNTING POLICIES, continued
AFS equity investments that do not have a quoted market price in an active market and whose fair value cannot be reliably measured and derivatives that are linked to and must be settled by delivery of such unquoted equity investments are measured at cost less any identified impairment losses at the end of each reporting period.
Loans and accounts receivable from customers
Loans and accounts receivable from customers are non-derivative financial assets with fixed or determinable payments that are not quoted in an active market. Loans and accounts receivables from customers (including loans and accounts receivable from customers and interbank loans) are measured at amortised cost using the effective interest method, less any impairment.
Interest income is recognised by applying the effective interest rate, except for short-term receivables when the effect of discounting is immaterial.
| iii. | Classification of financial assets for presentation purposes |
For presentation purposes, the financial assets are classified by their nature into the following line items in the consolidated financial statements:Consolidated Financial Statements:
| - | Cash and deposits in banks: |
| - | Cash items in process of collection: |
| - | Trading investments: |
| - | Investments under resale agreements: |
| - | Financial derivative contracts: |
| · | Trading derivatives: |
| · | Hedging derivatives: |
| - | Interbank loans: |
| - | Loans and accounts receivables from customers: |
| - | Investment instruments: |
|
Banco Santander Chile and Subsidiaries |
Notes to the Consolidated Financial Statements |
AS OF DECEMBER 31, 2015 AND 2014 AND FOR THE YEARS ENDED DECEMBER 31, |
NOTE 01
SUMMARY OF SIGNIFICANT ACCOUNTING POLICIES, continued:continued
| iv. | Classification of financial liabilities for measurement purposes |
Financial liabilities are classified as either financial liabilities ‘at FVTPL'FVTPL or ‘otherother financial liabilities'.liabilities.
Financial liabilities at FVTPL
Financial liabilities are classified as at FVTPL when the financial liability is either held for trading or it is designated as at FVTPL.
A financial liability is classified as held for trading if:
| · | it has been incurred principally for the purpose of repurchasing it in the near term; or |
| · | on initial recognition it is part of a portfolio of identified financial instruments that the Bank manages together and has a recent actual pattern of short-term profit-taking; or |
| · | it is a derivative that is not designated and effective as a hedging instrument. |
A financial liability other than a financial liability held for trading may be designated as at FVTPL upon initial recognition if:
| · | such designation eliminates or significantly reduces a measurement or recognition inconsistency that would otherwise arise; or |
| · | the financial liability forms part of a group of financial assets or financial liabilities or both, which is managed and its performance is evaluated on a fair value basis, in accordance with the Bank's documented risk management or investment strategy, and information about the grouping is provided internally on that basis; or |
| · | it forms part of a contract containing one or more embedded derivatives, and IAS 39 permits the entire combined contract to be designated as |
Financial liabilities at FVTPL are stated at fair value, with any gains or losses arising on remeasurement recognised in profit or loss. The net gain or loss recognised in profit or loss incorporates any interest paid on the financial liability and is included in the ‘net profit (loss)income (expense) from financial operations' line item.
Other financial liabilities
Other financial liabilities (including borrowings and trade and other payables) are subsequently measured at amortised cost using the effective interest method.
The effective interest method is a method of calculating the amortised cost of a financial liability and of allocating interest expense over the relevant period. The effective interest rate is the rate that exactly discounts estimated future cash payments (including all fees and points paid or received that form an integral part of the effective interest rate, transaction costs and other premiums or discounts) through the expected life of the financial liability, or (where appropriate) a shorter period, to the net carrying amount on initial recognition.
| v. | Classification of financial liabilities for presentation purposes |
The financial liabilities are classified by their nature into the following line items in the consolidated statements of financial position:
| - | Deposits and other on- demand liabilities: |
| - | Cash items in process of being cleared: |
| - | Obligations under repurchase agreements: |
|
NOTE 01
SUMMARY OF SIGNIFICANT ACCOUNTING POLICIES, continued
| - | Time deposits and other time liabilities: |
Banco Santander Chile and Subsidiaries Notes to the Consolidated Financial Statements AS OF DECEMBER 31, 2015 AND 2014 AND FOR THE YEARS ENDED DECEMBER 31, 2015, 2014 AND 2013 |
NOTE 01
SUMMARY OF SIGNIFICANT ACCOUNTING POLICIES, continued
| - | Financial derivative contracts: |
| · | Trading derivatives: |
| · | Hedging derivatives: |
| - | Interbank borrowings: |
| - | Issued debt instruments: |
| - | Other financial liabilities: |
| h) | Valuation of financial instruments and recognition of fair value changes |
In general, financial assets and liabilities are initially recordedrecognized at fair value which, in the absence of evidence to the contrary, is deemed to be the transaction price. Financialprice.Financial instruments, notother than those measured at fair value through profit or loss, includesare initially recognized at fair value plus transaction costs. Subsequently, and at the end of each reporting period, theyfinancial instruments are measured pursuant to the following criteria:
| i. | Valuation of financial instruments |
Financial assets are measured according to their fair value, gross of any transaction costs that may be incurred for theirin the course of a sale, except for loanscredit investments and accounts receivable.held to maturity investments.
According to IFRS 13Fair ValueMeasurement(effective (effective date from January 1, 2013), “fair value” is defined as the price that would be received to sell an asset or paid to transfer a liability in an orderly transaction in the principal (or most advantageous) market at the measurement date under current market conditions (i.e. an exit price) regardless of whether that price is directly observable or estimated using another valuation technique. A fair value measurement is for a particular asset or liability. Therefore, whenWhen measuring fair value an entity shall take into account the characteristics of the asset or liability if market participants would take those characteristics into account when pricing the asset or liability at the measurement date.
The fair value measurement assumes that the transaction to sell the asset or transfer the liability takes place:place either: (a) in the principal market for the asset or liability, or (b) in the absence of a principal market, the most advantageous market for the asset or liability. WhenEven when there is no observable market to provide pricing information in connection with the sale of an asset or the transfer of a liability at the measurement date, the fair value measurement shall be assumed in aassume that the transaction that date,takes place, considered from the perspective of a potential market participant who intends to maximize value associated with the asset or liability.
For financial reporting purposes,When using valuation techniques, the Bank shall maximize the use of relevant observable inputs and minimize the use of unobservable inputs as available. If an asset or a liability measured at fair value measurements are categorised intohas a bid price and an ask price, the price within the bid-ask spread that is most representative of fair value in the circumstances shall be used to measure fair value regardless of where the input is categorized within the fair value hierarchy (i.e. Level 1, 2 or 3 based on the degree to which3). IFRS 13 establishes a fair value hierarchy that categorizes into three levels the inputs to thevaluation techniques used to measure fair value. The fair value measurements are observablehierarchy gives the highest priority to quoted prices (unadjusted) in active markets for identical assets or liabilities (Level 1 inputs) and the significance of thelowest priority to unobservable inputs to the fair value measurement in its entirety, which are described as follows:
|
NOTE 01
SUMMARY OF SIGNIFICANT ACCOUNTING POLICIES, continued(Level 3 inputs).
All derivatives are recorded in the Consolidated Statements of Financial Position at the fair value from theirpreviously described. This value is compared to the valuation as at the trade date. If theirthe fair value is subsequently measured positive, they arethis is recorded as an asset, and if theirasset. If the fair value is subsequently measured negative, they arethis is recorded as a liability. The fair value on the trade date is deemed, in the absence of evidence to the contrary, to be the transaction price. The changes in the fair value of derivatives from the trade date are recorded in “Net profit (loss)income (expense) from financial operations” in the Consolidated Statement of Income.
Banco Santander Chile and Subsidiaries Notes to the Consolidated Financial Statements AS OF DECEMBER 31, 2015 AND 2014 AND FOR THE YEARS ENDED DECEMBER 31, 2015, 2014 AND 2013 |
NOTE 01
SUMMARY OF SIGNIFICANT ACCOUNTING POLICIES, continued
Specifically, the fair value of financial derivatives included in the portfolios of financial assets or liabilities held for trading is deemed to be their daily quoted price. If, for exceptional reasons, the quoted price cannot be determined on a given date, the fair value is determined using similar methods to those used to measure over the counter (OTC) derivatives. The fair value of OTC derivatives is the sum of the future cash flows resulting from the instrument, discounted to present value at the date of valuation (“present value” or “theoretical close”) using valuation techniques commonly used by the financial markets: “net present value” (NPV) and option pricing models, among other methods. Also, within the fair value of derivatives are included Credit Valuation Adjustment (CVA) and Debit Valuation Adjustment (DVA), all with the objective that the fair value of each instrument includes the credit risk of its counterparty and Bank´s own risk.
“Loans and accounts receivable from customers” and Held-to-maturity instrument portfolio are measured at amortized cost using the effective interest method. Amortized cost is the acquisition cost of a financial asset or liability, plus or minus, as appropriate, prepayments of principal and the cumulative amortization (recorded in the consolidated income statement) of the difference between the initial cost and the maturity amount as calculated under the effective interest method. For financial assets, amortized cost also includes any reductions for impairment or uncollectibility. For loans and accounts receivable designated as hedged items in fair value hedges, the changes in their fair value related to the risk or risks being hedged are recorded in “Net income (expense) from financial operations”.
The “effective interest rate” is the discount rate that exactly matches the initial amount of a financial instrument to all its estimated cash flows over its remaining life. For fixed-rate financial instruments, the effective interest rate incorporates the contractual interest rate established on the acquisition date. Where applicable, the fees and transaction costs that are a part of the financial return are included. For floating-rate financial instruments, the effective interest rate matches the current rate of return until the date of the next review of interest rates.
Equity instruments whose fair value cannot be determined in a sufficiently objective manner and financial derivatives, whose underlying is an equity instrument that are settled by delivery of those instruments, are measured at acquisition cost adjusted for any related impairment loss.
The amounts at which the financial assets are recorded represent the Bank’s maximum exposure to credit risk as at the reporting date. The Bank has also received collateral and other credit enhancements to mitigate its exposure to credit risk, which consist mainly of mortgage guarantees, equity instruments and personal securities, assets under leasing agreements, assets acquired under repurchase agreements, securities loans and derivatives.
| ii. | Valuation techniques |
Financial instruments at fair value, determined on the basis of price quotations in active markets, include government debt securities, private sector debt securities, equity shares, short positions, and fixed-income securities issued.
In cases where price quotations cannot be observed in available markets, the Bank’s management determines a best estimate of the price that the market would set using its own internal models. In most cases, these models use data based on observable market parameters as significant inputs however for some valuations of financial instruments, significant inputs are unobservable in the market. To determine a value for those instruments, various techniques are employed to make these estimates, including the extrapolation of observable market data.
The most reliable evidence of the fair value of a financial instrument on initial recognition usually is the transaction price, however due to lack of availability of market information, the value of the instrument may be derived from other market transactions performed with the same or similar instruments or may be measured by using a valuation technique in which the variables used include only observable market data, mainly interest rates.
The main techniques used as of December 31, 20132015 and 20122014 by the Bank’s internal models to determine the fair valuesvalue of the financial instruments are as follows:
| i. | In the valuation of financial instruments permitting static hedging (mainly |
| ii. | In the valuation of financial instruments requiring dynamic hedging (mainly structured options and other structured instruments), the Black-Scholes model is normally used. Where appropriate, observable market inputs are used to obtain factors such as the bid-offer spread, exchange rates, volatility, correlation indexes and market liquidity. |
Banco Santander Chile and Subsidiaries Notes to the Consolidated Financial Statements AS OF DECEMBER 31, 2015 AND 2014 AND FOR THE YEARS ENDED DECEMBER 31, 2015, 2014 AND 2013 |
NOTE 01
SUMMARY OF SIGNIFICANT ACCOUNTING POLICIES, continued
| iii. | In the valuation of certain financial instruments exposed to interest rate risk, such as interest rate futures, caps and floors, the present value method (futures) and the Black-Scholes model (plain vanilla options) are used. The main inputs used in these models are observable market data, including the related interest rate curves, volatilities, correlations and exchange rates. |
The fair value of the financial instruments arising fromcalculated by the abovementionedaforementioned internal models considers contractual terms and observable market data, which include interest rates, credit risk, exchange rates, the quoted market price of shares, volatility and prepayments, among other things. Theseothers. The Bank’s management considers that its valuation models are not significantly subjective, since these methodologies can be adjusted and evaluated, as appropriate, through the internal calculation of fair value and the subsequent comparison with the related actively traded price.
“Loans and accounts receivable from customers” and “Held-to-maturity instrument portfolio” are measured at amortized cost using the “effective interest method.” “Amortized cost” is the acquisition cost of a financial asset or liability, plus or minus, as appropriate, prepayments of principal and the cumulative amortization (recorded in the consolidated income statement) of the difference between the initial cost and the maturity amount as calculated under the effective interest rate method. For financial assets, amortized cost also includes any reductions for impairment or uncollectibility. For loans and accounts receivable designated as hedged items in fair value hedges, the changes in their fair value related to the risk or risks being hedged are recorded in “Net profit (loss) from financial operations”.
The “effective interest method” is a method of calculating the amortized cost of a debt instrument and of allocating interest income over the relevant period. The effective interest rate is the rate that exactly discounts estimated future cash receipts (including all fees and points paid or received that form an integral part of the effective interest rate, transaction costs and other premiums or discounts) through the expected life of the debt instrument, or, where appropriate, a shorter period, to the net carrying amount on initial recognition.
For fixed-rate financial instruments, the effective interest rate coincides with the contractual interest rate established on the acquisition date plus, where applicable, the fees and transaction costs that, because of their nature, are a part of the financial return. For floating-rate financial instruments, the effective interest rate coincides with the rate of return prevailing until the next benchmark interest reset date.
The amounts at which the financial assets are recorded represent, in all material respects, the Bank’s maximum exposure to credit risk at each reporting date. The Bank has also received collateral and other credit enhancements to mitigate its exposure to credit risk, which consist mainly of mortgage guarantees, equity instruments and personal securities, assets leased out under leasing and rental agreements, assets acquired under repurchase agreements, securities loans and derivatives.
|
NOTE 01
SUMMARY OF SIGNIFICANT ACCOUNTING POLICIES, continued
Income is recognized on an effective interest basis for loans and receivables other than those financial assets classified as trading investments.
| Hedging transactions |
The Bank uses financial derivatives for the following purposes:
| i. | to sell to customers who request these instruments in the management of their market and credit |
| ii. | to use these derivatives in the management of the risks of the Bank entities’ own positions and assets and liabilities (“hedging derivatives”), and |
| iii. | to obtain profits from changes in the price of these derivatives |
All financial derivatives that doare not qualifyheld for hedging purposes are accounted for as trading derivatives.
A derivative qualifies for hedge accounting if all the following conditions are met:
| 1. | The derivative hedges one of the following three types of exposure: |
| a. | Changes in the value of assets and liabilities due to fluctuations, among others, in the interest rate and/or exchange rate to which the position or balance to be hedged is subject (“fair value hedge”); |
| b. | Changes in the estimated cash flows arising from financial assets and liabilities, and highly probable forecasted transactions (“cash flow hedge”); |
| c. | The net investment in a foreign operation (“hedge of a net investment in a foreign operation”). |
| 2. | It is effective in offsetting exposure inherent in the hedged item or position throughout the expected term of the hedge, which means that: |
| a. | At the date of arrangement the hedge is expected, under normal conditions, to be highly effective (“prospective effectiveness”). |
| b. | There is sufficient evidence that the hedge was actually effective during the life of the hedged item or position (“retrospective effectiveness”). |
| 3. | There must be adequate documentation evidencing the specific designation of the financial derivative to hedge certain balances or transactions and how this effective hedge was expected to be achieved and measured, provided that this is consistent with the Bank’s management of own risks. |
The changes in the value of financial instruments qualifying for hedge accounting are accounted forrecorded as “trading derivatives.”follows:
| a. | For fair value hedges, the gains or losses arising on both hedging instruments and the hedged items (attributable to the type of risk being hedged) are included as “Net income (expense) from financial operations” in the Consolidated Statement of Income. |
The Bank designates certain
| b. | For fair value hedges of interest rate risk on a portfolio of financial instruments, gains or losses that arise in measuring hedging instruments and other gains or losses due to changes in fair value of the underlying hedged item (attributable to the hedged risk) are recorded in the Consolidated Statement of Income under “Net income (expense ) from financial operations”. |
Banco Santander Chile and Subsidiaries Notes to the Consolidated Financial Statements AS OF DECEMBER 31, 2015 AND 2014 AND FOR THE YEARS ENDED DECEMBER 31, 2015, 2014 AND 2013 |
NOTE 01
SUMMARY OF SIGNIFICANT ACCOUNTING POLICIES, continued
| c. | For cash flow hedges, the change in fair value of the hedging instrument is included as “Cash flow hedge” in “Other comprehensive income”, until the hedged transaction occurs, thereafter being reclassified to the Consolidated Statement of Income, unless the hedged transaction results in the recognition of non–financial assets or liabilities, in which case it is included in the cost of the non-financial asset or liability. |
| d. | The differences in valuation of the hedging instrument corresponding to the ineffective portion of the cash flow hedging transactions are recorded directly in the Consolidated Statement of Income under “Net income (expense) from financial operations”. |
If a derivative designated as a hedging instruments, which include derivatives, embedded derivatives and non-derivatives in respect of foreign currency risk, as eitherinstrument no longer meets the requirements described above due to expiration, ineffectiveness or for any other reason, hedge accounting treatment is discontinued. When “fair value hedging” is discontinued, the fair value hedges or cash flow hedges. Hedges of foreign exchange risk on firm commitments are accounted for as cash flow hedges.
Atadjustments to the inception of the hedge relationship, the Bank documents the relationship between the hedging instrument and the hedged item, along with its risk management objectives and its strategy for undertaking various hedge transactions. Furthermore, at the inception of the hedge and on an ongoing basis, the Bank documents whether the hedging instrument is highly effective in offsetting changes in fair values or cash flowscarrying amount of the hedged item attributable toarising from the hedged risk.risk are amortized to gain or loss from that date, where applicable.
Fair value hedges
Changes in the fair value of derivatives that are designated and qualify as fair valueWhen cash flow hedges are recognised in profitdiscontinued, any cumulative gain or loss immediately, together with any changes in the fair value of the hedged asset or liability that are attributable to the hedged risk. The change in the fair value of the hedging instrument andrecognized under “Other comprehensive income” (from the changeperiod when the hedge was effective) remains recorded in equity until the hedged transaction occurs, at which time it is recorded in the hedged item attributable toConsolidated Statement of Income, unless the hedged risk are recognised in profit or loss in the line item relating to the hedged item.
Cash flow hedges
The effective portion of changes in the fair value of derivatives that are designated and qualify as cash flow hedges is recognised in other comprehensive income and accumulated under the heading of cash flow hedging reserve. The gain or loss relating to the ineffective portion is recognised immediately in profit or loss, and is included in the ‘net foreign exchange gain (loss) line item.
Amounts previously recognised in other comprehensive income and accumulated in equity are reclassified to profit or loss in the periods when the hedged item affects profit or loss, in the same line as the recognised hedged item. However, when the hedged forecast transaction results in the recognition of a non-financial asset or a non-financial liability, the gains and losses previously recognised in other comprehensive income and accumulated in equity are transferred from equity and included in the initial measurement of the cost of the non-financial asset or non-financial liability.
Hedge accounting is discontinued when the Bank revokes the hedging relationship, when the hedging instrument expires or is sold, terminated, or exercised, or when it no longer qualifies for hedge accounting. Any gain or loss recognised in other comprehensive income and accumulated in equity at that time remains in equity and is recognised when any forecast transaction is ultimately recognised in profit or loss. When a forecast transaction is no longer expected to occur, thein which case any cumulative gain or loss accumulated in equity is recognisedrecorded immediately in profit or loss.the Consolidated Statement of Income.
| Derivatives embedded in hybrid financial instruments |
Derivatives embedded in non-derivativeother financial instruments or in other hybrid contracts are accounted for separately as derivatives if 1) their risks and characteristics are not closely related to the host contracts, are treated2) a separate instrument with the same terms as separate derivatives when theythe embedded derivative would meet the definition of a derivative, their risks and characteristics are not clearly and closely related to those of3) provided that the host contracts and thehybrid contracts are not measuredclassified as “Trading investments” or as other financial assets (liabilities) at fair value tothrough profit andor loss.
|
NOTE 01
SUMMARY OF SIGNIFICANT ACCOUNTING POLICIES, continued
| Offsetting of financial instruments |
Financial asset and liability balances are offset, i.e., reported in the Consolidated Statements of Financial Position at their net amount, only if there is a legally enforceable right to offset the recorded amounts and an intentthe Bank intends either to settle them on a net basis or to realize the asset and settle the liability simultaneously.
| Derecognition of financial assets and liabilities |
The accounting treatment of transfers of financial assets depends onis determined by the extent and the manner in which the risks and rewards associated with the transferred assets are transferred to third parties:
| i. | If the Bank transfers substantially all the risks and rewards of ownership to third parties, as in the case of unconditional sales of financial assets, sales under repurchase agreements at fair value at the date of repurchase, sales of financial assets with a purchased call option or written put option deeply out of the money, utilization of assets in which the transferor does not retain subordinated debt nor grants any credit enhancement to the new holders, and other similar cases, the transferred financial asset is |
| ii. | If the Bank retains substantially all the risks and rewards of ownership associated with the transferred financial asset, as in the case of sales of financial assets under repurchase agreements at a fixed price or at the sale price plus interest, securities lending agreements under which the borrower undertakes to return the same or similar assets, and other similar cases, the transferred financial asset is not |
| - | An associated financial liability for an amount equal to the consideration received; this liability is subsequently measured at amortized cost. |
| - |
If the Bank neither transfers nor substantially retains all the risks and rewards of ownership associated with the transferred financial asset—as in the case of sales of financial assets with a purchased call option or written put option that is not deeply in or out of the money, securitization of assets in which the transferor retains a subordinated debt or other type of credit enhancement for a portion of the transferred asset, and other similar cases—the following distinction is made:
Banco Santander Chile and Subsidiaries Notes to the AS OF DECEMBER 31, 2015 AND 2014 AND FOR THE YEARS ENDED DECEMBER 31, 2015, 2014 AND 2013 |
NOTE 01
SUMMARY OF SIGNIFICANT ACCOUNTING POLICIES, continued
| a. | If the transferor does not retain control |
| b. | If the transferor retains control |
Accordingly, financial assets are only removedderecognized from the Consolidated StatementsStatement of Financial Position when the rights over the cash flows they generate have terminated or when all the inherent risks and rewards of ownership have been substantially transferred to third parties. Similarly, financial liabilities are only derecognized from the Consolidated StatementsStatement of Financial Position when the obligations specified in the contract are discharged or cancelled or the contract has matured.
| i) | Recognizing income and expenses |
The most significant criteria used by the Bank to recognize its revenues and expenses are summarized as follows:
| i. | Interest revenue, interest expense, and similar items |
Interest revenue and expense are recorded on an accrual basis using the effective interest method.
However, when the Bank believes that the debtor poses a high risk of default, the interest and inflation adjustments pertaining to these transactions are not recorded directly in the Consolidated Statement of Income unless they have been actually received.
This interest and inflation adjustments are generally referred to as “suspended” and are recorded in memo accounts which are not part of the Consolidated Statements of Financial Position. Instead, they are reported as part of the complementary information thereto and as memo accounts.memorandum accounts (Note 25). This interest is recognized as income, when collected.
The resumption of interest income recognition of previously impaired loans only occurs when such loans becamebecome current (i.e. payments were received such that the loans are contractually past-due for less than 90 days) or they are no longer classified under the C3, C4, D1 or D2 risk categories (for loans individually evaluated for impairment).
|
NOTE 01
SUMMARY OF SIGNIFICANT ACCOUNTING POLICIES, continued
Dividends received from companies classified as “Investments in other companies” are recorded as income when the right to receive them arises.
| ii. | Commissions, fees, and similar items |
Fee and commission income and expenses are recognized in the Consolidated Statement of Income using criteria that vary according to their nature. The main criteria are:
| - | Fee and commission income and expenses |
| - | Those arising from transactions or services that are performed over a period of time are recognized over the life of these transactions or services. |
| - | Those relating to services provided in a single |
iv. Loan arrangement fees
| iii. | Loan arrangement fees |
Fees that arise as a result of the origination of a loan, mainly application and analysis-related fees, are deferred and recognized incharged to the Consolidated Statement of Income over the term of the loan.
| j) | Impairment |
| i. | Financial assets: |
A financial asset, other than that at fair value through profit and loss, is evaluated on each financial statement filing date to determine whether objective evidence of impairment exists.
Banco Santander Chile and Subsidiaries Notes to the Consolidated Financial Statements AS OF DECEMBER 31, 2015 AND 2014 AND FOR THE YEARS ENDED DECEMBER 31, 2015, 2014 AND 2013 |
NOTE 01
SUMMARY OF SIGNIFICANT ACCOUNTING POLICIES, continued
A financial asset or group of financial assets will be impaired if, and only if, objective evidence of impairment exists as a result of one or more events that occurred after initial recognition of the asset (“event causing the loss”), and this event or events causing the loss have an impact on the estimated future cash flows of a financial asset or group of financial assets.
An impairment loss relating to financial assets recorded at amortized cost is calculated as the difference between the recorded amount of the asset and the present value of estimated future cash flows, discounted at the financial asset’s original effective interest rate.
An impairment loss relating to a financial asset available for sale is calculated based on a significant or prolonged decline in its fair value.
Individually significant financial assets are individually tested to determine their impairment. The remaining financial assets are evaluated collectively in groups that share similar credit risk characteristics.
All impairment losses are recorded in income. Any impairment loss relating to a financial asset available for sale previously recorded in equity is transferred to profit or loss.
The reversal of an impairment loss occurs only if it can be objectively related to an event occurring after the initial impairment loss was recorded. The reversal of an impairment loss shall not exceed the carrying amount that would have been determined if no impairment loss has been recognized for the asset in prior years. The reversal is recorded in income with the exception of available for sale equity financial assets; any reversalassets, in which case it is recorded in other comprehensive income.
| ii. | Non-financial assets: |
The Bank’s non-financial assets, excluding investment properties, are reviewed at eachthe reporting date to determine whether there is any indication that those assets have suffered anthey show signs of impairment loss (i.e. its carrying amount exceeds its recoverable amount). If any such indicationevidence exists, the recoverable amount of the asset is estimated, in order to determine the extent of the impairment loss.
|
NOTE 01
SUMMARY OF SIGNIFICANT ACCOUNTING POLICIES, continued
Recoverable amount is the higher of fair value less costs to sell and value in use. In assessing value in use, the estimated future cash flows are discounted to their present value using a pre-tax discount rate that reflects current market assessments of the time value of money and the risks specific to the asset for which the estimates of future cash flows have not been adjusted.
If the recoverable amount of an asset is estimated to be less than its carrying amount, the carrying amount of the asset is reduced to its recoverable amount. An impairment loss is recognized immediately in profit or loss.
In connection towith other assets, impairment losses recorded in prior periods are assessed at each reporting date in search of any indication thatto determine whether the loss has decreased or disappeared and should be reversed. AnThe increased carrying amount of an asset other than goodwill attributable to a reversal of an impairment loss shall be reversed only if it does not exceed the carrying amount that would have been determined (net of amortization or depreciation) had no impairment loss for impairmentbeen recognized for the asset in prior years. Goodwill impairment is not reversed.
| k) | Property, plant, and equipment |
This category includes the amount of buildings, land, furniture, vehicles, computer hardware and other fixtures owned by the consolidated entities or acquired under finance leases. Assets are classified according to their use as follows:
| i. | Property, plant and equipment for own use |
Property, plant and equipment for own use (including, among other things,includes but is not limited to tangible assets received by the consolidated entities in full or partial satisfaction of financial assets representing accounts receivable from third parties which are intended to be held for continuing own use and tangible assets acquired under finance leases)leases. These assets are presented at acquisition cost less the related accumulated depreciation and, if applicable, any impairment losses (when net carrying amount was higher than recoverable amount).
Depreciation is calculated using the straight line method over the acquisition cost of assets less their residual value, assuming that the land on which buildings and other structures stand has an indefinite life and, therefore, is not subject to depreciation.
Banco Santander Chile and Subsidiaries Notes to the Consolidated Financial Statements AS OF DECEMBER 31, 2015 AND 2014 AND FOR THE YEARS ENDED DECEMBER 31, 2015, 2014 AND 2013 |
NOTE 01
SUMMARY OF SIGNIFICANT ACCOUNTING POLICIES, continued
The Bank must applyapplies the following useful lives for the tangible assets that comprise its assets:
| ITEM | Useful (Months) | |
| Land | - | |
| Paintings and works of art | ||
| - | ||
| Carpets and curtains | 36 | |
| Computers and hardware | 36 | |
| Vehicles | 36 | |
| 36 | ||
| 60 | ||
| 60 | ||
| Office furniture | 60 | |
| Telephone and communication systems | 60 | |
| Security systems | 60 | |
| Rights over telephone lines | 60 | |
| Air conditioning systems | 84 | |
| 120 | ||
| Buildings | 1,200 | |
The consolidated entities assess at each reporting date whether there is any indication that the carrying amount of any of their tangible assets’asset exceeds its recoverable amount. If this is the case, the carrying amount of the asset is reduced to its recoverable amount and future depreciation charges are adjusted in proportion toaccordance with the revised carrying amount and to the new remaining useful life, if the useful life needs to be revised.
|
NOTE 01
SUMMARY OF SIGNIFICANT ACCOUNTING POLICIES, continued
Similarly, if there is an indication of a recovery in the value of a tangible asset, the consolidated entities record the reversal of the impairment loss recorded in prior periods and adjust the future depreciation charges accordingly. In no circumstance may the reversal of an impairment loss on an asset increase its carrying value above the one it would have had if no impairment losses had been recorded in prior years.
The estimated useful lives of the items of property, plant and equipment held for own use are reviewed at least at the end of each reporting period to detect significant changes therein.changes. If changes are detected, the useful lives of the assets are adjusted by correcting the depreciation charge to be recorded in the Consolidated Statement of Income in future years on the basis of the new useful lives.
Maintenance expenses relating to tangible assets (property, plant and equipment) held for own use are recorded as an expense in the period in which they are incurred.
| ii. | Assets leased out under operating leases |
The criteria used to record the acquisition cost of assets leased out under operating leases, to calculate their depreciation and their respective estimated useful lives, and to record the impairment losses thereof, are consistent with those described in relation to property, plant and equipment held for own use.
| l) | Leasing |
| i. | Finance leases |
Finance leases are leases that substantially transfer all the risks and rewards incidental to ownership of the leased asset to the lessee.
When the consolidated entities act as the lessor of an asset, the sum of the present value of the lease payments receivable from the lessee, including the exercise price of the lessee’s purchase option at the end of the lease term, which is equivalent to one additional lease payment and so is reasonably certain to be exercised, is recognized as lending to third parties and is therefore included under “Loans and accounts receivablesreceivable from customers” in the Consolidated StatementsStatement of Financial Position.
When the consolidated entities act as lessees, they show the cost of the leased assets in the Consolidated StatementsStatement of Financial Position based on the nature of the leased asset, and simultaneously record a liability for the same amount (which is the lower of the fair value of the leased asset and the sum of the present value of the lease payments payable to the lessor plus, if appropriate, the exercise of the purchase option). The depreciation policy for these assets is consistent with that for property, plant and equipment for own use.
Banco Santander Chile and Subsidiaries Notes to the Consolidated Financial Statements AS OF DECEMBER 31, 2015 AND 2014 AND FOR THE YEARS ENDED DECEMBER 31, 2015, 2014 AND 2013 |
NOTE 01
SUMMARY OF SIGNIFICANT ACCOUNTING POLICIES, continued
In both cases, the finance income and finance expenses arising from these contracts are credited and debited, respectively, to “Interest income” and “Interest expense” in the Consolidated Statement of Income so as to achieve a constant rate of return over the lease term.
| ii. | Operating leases |
In operating leases, ownership of the leased asset and substantially all the risks and rewards incidental thereto remain with the lessor.
When the consolidated entities act as the lessor, they present the acquisition cost of the leased assets under "Property, plant and equipment”. The depreciation policy for these assets is consistent with that for similar items of property, plant and equipment held for own use and revenues from operating leases is recorded on a straight line basis under “Other operating income” in the Consolidated Statement of Income.
When the consolidated entities act as the lessees, the lease expenses, including any incentives granted by the lessor, are charged on a straight line basis to “Administrative and other expenses” in the Consolidated Statement of Income.
|
NOTE 01
SUMMARY OF SIGNIFICANT ACCOUNTING POLICIES, continued
| iii. | Sale and leaseback transactions |
For sale at fair value and operating leasebacks, the profit or loss generated is recorded at the time of sale except in the case of excess of proceeds over fair value, which difference is amortized over the period of use of the asset. In the case of finance leasebacks, the profit or loss generated is amortized over the lease term.
| m) | Intangible assets |
Intangible assets are identified as non-monetary assets (separately identifiable from other assets) without physical substance which arise as a result of a legal transaction (contractual terms) or are developed internally bycontractual rights or it is separable. The Bank recognizes an intangible asset, whether purchased or self-created (at cost), when the consolidated entities. They are assets whose cost of the asset can be estimatedmeasured reliably and over which the consolidated entities have control and consider it is probable that the future economic benefits that are attributable to the asset will be generated.flow to the Bank.
Intangible assets are recorded initially at acquisition or production cost and are subsequently measured at cost less any accumulated amortization and any accumulated impairment losses.
Internally developed computer software
Internally developed computer software is recorded as an intangible asset if, among other requirements (basically the Bank’s ability to use or sell it), it can be identified and its ability to generate future economic benefits can be demonstrated. The estimated useful life for software is 3 years.36 months.
Intangible assets are amortized on a straight-line basis over their estimated useful life; which has been defined as 36 months.
Expenditure on research activities is recorded as an expense in the year in which it is incurred and cannot be subsequently capitalized.
| n) | Cash and cash equivalents |
For the preparation of the cash flow statement, the indirect method was used, beginningstarting with the Bank’s consolidated pre-tax income and incorporating non-cash transactions, as well as income and expenses associated with cash flows, which are classified as operating, investment or financing activities.
For the preparation of the cash flow statement, the following items are considered:
| i. | Cash flows: Inflows and outflows of cash and cash equivalents, such as deposits with the Central Bank of Chile, deposits in domestic banks, and deposits in foreign banks. |
| ii. | Operating activities: Principal revenue-producing activities performed by banks and other activities that cannot be classified as investing or financing activities. |
Banco Santander Chile and Subsidiaries Notes to the Consolidated Financial Statements AS OF DECEMBER 31, 2015 AND 2014 AND FOR THE YEARS ENDED DECEMBER 31, 2015, 2014 AND 2013 |
NOTE 01
SUMMARY OF SIGNIFICANT ACCOUNTING POLICIES, continued
| iii. | Investing activities: The acquisition and disposal of long-term assets and other investments not included in cash and cash equivalents. |
| iv. | Financing Activities: Activities that result in changes in the size and composition of the equity and liabilities that are not operating activities. |
| o) | Allowances for loan losses |
The Bank has established allowances to cover incurred losses on loans and account receivables from customers in accordance with its internal models and risk assessment as approved by the Board of Directors.
The Bank models determine allowances and provisions for loan losses according to the type of portfolio or operations. Loans and accounts receivables from customers are divided into three categories:
The Bank performs an assessment of the risk associated with loans and accounts receivable from customers to determine their allowance for loan losses as described below:
| - | Individual assessment |
| - | Group assessment |
The Bank models determine allowances and provisions for loan losses according to the type of portfolio or operations. Loans and accounts receivables from customers are divided into three categories:
| i. | Commercial loans, |
| ii. | Mortgage loans, and |
| iii. | Consumer loans. |
The models used to determine credit risk allowances are described as follows:
|
NOTE 01
SUMMARY OF SIGNIFICANT ACCOUNTING POLICIES, continued
| I. | Allowances for individual assessment |
An individual assessment of commercial debtors is necessary in the case of companies which, due to their size, complexity or level of exposure regarding the entity, must be known and analyzed in detail.
For the purposes of establishing its provisions, the Bank assigns a risk category to each debtor, for boththeir loans and contingent loans, aloans. The risk category, after assigning him/her to one of the portfolio categories. Risk factors used on the assignmentconsidered are: industry or economic sector of the borrower, owners or managers of the borrower, their financial positionsituation and payment ability,capacity, and payment behavior.
The Bank’s risk categories are as follows:
1. Debtors may be classified in risk categories A1, A2, A3 or B (if they are current on their payment obligations and show no sign of deterioration in their credit quality). B is different from the A categories by a certain history of late payments. The A and B categories are distinguished by different PNPs (as defined below).
2. Debtors classified as C1, C2, C3, C4, D1 or D2 include debtors whose loans with us have been charged off or administered by our Recovery Unit, or classified as Precontenciosos (PRECO or deteriorated).
For loans classified as A1, A2, A3 and B, we assign a specific provision level on an individual basis to each borrower and, therefore, the amount of loan loss allowance is determined on a case by case basis.
Banco Santander Chile and Subsidiaries Notes to the Consolidated Financial Statements AS OF DECEMBER 31, 2015 AND 2014 AND FOR THE YEARS ENDED DECEMBER 31, 2015, 2014 AND 2013 |
NOTE 01
SUMMARY OF SIGNIFICANT ACCOUNTING POLICIES, continued
Estimated Incurred Loan Loss = Loan Loss AllowanceAllowance.
The estimated incurred loss is obtained by multiplying all risk factors defined in the following equation:
EIL= EXP x PNP x SEV
EIL = Estimated Incurred Loan Loss. The estimated incurred loan loss is how much could be lost in the event a debtor does not perform the obligations under the loan.
EXP = Exposure. This corresponds to the value of commercial loans.
PNP = Probability of Non-Performance. This variable, expressed as a percentage, indicates the probability that a debtor will default in a period of 12 months.default. This percentage is associated with the internal rating that we give to each debtor, which is determined by analyzing such parameters as debt servicing capacity (including, usually, projected cash flows), the company’s financial history, the solvency and capacity of shareholders and management, and projections for the economic sector in which it operates.
SEV = Severity. This is the effective loss rate given default for debtors in the same segment, which is determined statistically based on the historical effective losses for us for each segment.
PNP and SEV are reviewed and updated every 3 years. Every year, models together with PNP and SEV assumptions, are tested by the Bank’s Credit Risk Department, to ensure that they are appropriate at each reporting date so as to make sure any difference between the estimated incurred losses and actual losses is reduced.
These tests focus on the validation of the sufficiency of the Bank’s allowances, and consist of comparisons between actual write-offs to allowances established by the model, and the coverage of the total allowance to actual write-offs in the most current periods. Individual loan classification and improvements to any customer classification are also presented for approval to our Risk Committee.
For loans classified in the C and D categories, loan loss allowances are based mainly on the fair value of the collateral, adjusted for an estimated cost to sell, that each of these loans have. Allowance percentage for each category is then based on the fair value of the collateral, or the expected future cash flow from the loan for each individually evaluated non-performing loans.
|
NOTE 01
SUMMARY OF SIGNIFICANT ACCOUNTING POLICIES, continued
| II. | Allowances for group |
The Bank uses the concept of estimation of incurred debtloss to quantify the allowances levels over the group-evaluated portfolios. Incurred debt is the expected provision expense that will appear one year away from the balance date of the transaction’s credit risk,portfolios, considering the counterpart risk and the guarantees associated with each transaction.
Following the Bank’s definition, the Bank uses group evaluation to approach transactions that have similar credit risk features, which indicate the debtor’s payment capacity over the entire debt, principal and interests, pursuant to the contract’s terms. In addition, this allows us to assess a high number of transactions with low individual amounts, whether they belong to individuals or smallSMEs (small and medium sized companies.companies). Therefore, debtors and loans with similar features are grouped together and each group has a risk level assigned to it.
These models are meant to be used mainly to analyze loans granted to individuals (including consumer loans, credit lines, mortgage loans and commercial loans) and commercial loans to SMEs.small to middle-sized entities (SMEs).
Allowances are established using these models, taking into account the historical Impairment and other known circumstances at the time of evaluation. After this, a historical loss rate is assigned to each portfolio profile constituting each segment.evaluated group.
Allowances for group-evaluated loans are established based on the credit risk of the profile to which the loan belongs, within the established segments for the type of loan.belongs. The method for assigning a profile is established based on a statistical building method, establishing a relation through logistic regression of various variables, such as payment behavior in the Bank, payment behavior outside the Bank, various sociodemographic data, among others, and a response variable that determines a client’s risk level, which in this case is 90 days of non-performance (The(the chosen features are relevant when calculating future cash flows per group of assets). Afterwards, common profiles are established and with differentiated default rates, applying the real historical loss the Bank has had with that portfolio.
Banco Santander Chile and Subsidiaries Notes to the Consolidated Financial Statements AS OF DECEMBER 31, 2015 AND 2014 AND FOR THE YEARS ENDED DECEMBER 31, 2015, 2014 AND 2013 |
NOTE 01
SUMMARY OF SIGNIFICANT ACCOUNTING POLICIES, continued
The different risk categories are constructed and updated periodically based on the payment behavior of the client’s profile to which they belong, as well as his or her sociodemographic characteristics. Therefore, when a customer has past due balance or has missed some payments, the outcome is that the customer will move to a different segment with a higher loss rate, therefore capturing current trends for each risk profile.
Allowance quantification, once the customers have been classified, is the product of three factors: exposure (EXP), Probability of Non-Performance (PNP) and Severity (SEV). The, the same equation used for individual assessment mentioned above.
The estimated incurred loss rates for group-evaluated loans correspond to charge-offs net of recoveries. The methodology establishes the period in which the estimated incurred loss for each risk profile emerges. Once the loss has been considered to have been incurred, the estimated incurred loss rates are applied to the corresponding risk profile to obtain the net charge-off level associated with this period. The loss rates applied to each risk profile are based only on the historical net charge-off data for that specific profile within one of the four groups of loans.loans (consumer loans, credit lines, mortgage loans and commercial loans). No other statistical or other information other than net charge-offs is used to determine the loss rates.
To determine the estimated incurred loss for commercial and mortgage loans collectively evaluated for impairment, we mainly analyze the payment behavior of clients, particularly the payment behavior of clients with payments that are more than 90 days overdue, clients with other weaknesses, such as early non-performancenon performance (i.e., payments that are past-due, though by less than 90 days), clients with modified loans and clients with renegotiated loans, as well as success in recovery against these clients. We also take into account whether the loan is supported by collateral.
In connection with mortgage loans, historical net charge-offs are considered in the model to calculate loss rates for loans collectively evaluated for impairment. The risk categories are such that when a customer has a past-due balance or has missed some payments, the outcome is that the customer will move to a different risk category with a higher loss rate, therefore capturing current trends of the customer and, when aggregate, current trends in the market.
Our models for loans analyzed on a group basis (consumer loans, residential mortgage loans and small-and-mid- sized commercial loans) are monitored on a monthly basis with respect to predictability and stability, using indicators that seek to capture the underlying need to update the models for current loss trends. Therefore, the periods of historical net charge-offs used in the allowance model may be more than a year old as we only update the historical net charge-offs only when our assessment of predictability and stability indicators determine it is necessary.
During the second semester of 2014, and as a response to the ongoing improvement of the allowances models for loans, the Bank recalibrated its allowances model for consumer loans and commercial loans. The models were recalibrated with the aim of improving the prediction of client behavior and maintaining statistical and management standards. Part of these improvements consisted of the advancement of the models’ governance allowing technical and defined approvals at different points of the approval process, better statistical techniques and the use of the entire extent of historical information, allowing more clarified definition of the Probability of Non-Performance (PNP) and the Severity (SEV) involved in the provision calculation. |
NOTE 01
SUMMARY OF SIGNIFICANT ACCOUNTING POLICIES, continuedThis involved the release of consumer provisions of Ch$26,563 million and an increase in commercial provisions of Ch$45,141 million. As this is a change in estimation, the net increase of these improvements (Ch$18,578 million) was recognized under the "Provisions for loan losses" in the Consolidated Statement of Income for the year in accordance with IAS 8 Accounting policies, changes in Accounting Estimates and Errors.
| III. | Charge-offs |
As a general rule, charge-offs should be done when all collection efforts have been exhausted. These charge-offs consist of derecognition from the Consolidated StatementsStatement of Financial Position of the corresponding loans operations in its entirety, and, therefore, include portions not past-due of a loan in the case of installments loans or leasing operations (no partial charge-offs exists)exist).
Subsequent payments obtained from charged-off loans will be recognized in the Consolidated Statement of Income as a recovery of loans previously charged-off.
Banco Santander Chile and Subsidiaries Notes to the Consolidated Financial Statements AS OF DECEMBER 31, 2015 AND 2014 AND FOR THE YEARS ENDED DECEMBER 31, 2015, 2014 AND 2013 |
NOTE 01
SUMMARY OF SIGNIFICANT ACCOUNTING POLICIES, continued
Loan and accounts receivable charge-offs are recorded for overdue past due, and current installments based on the time periods expired since reaching overdue status, as described below:
| Type of loan | Term | |
| Consumer loans with or without collateral | 6 months | |
| Other transactions without collateral | 24 months | |
| Commercial loans with collateral | 36 months | |
| Mortgage loans | 48 months | |
| Consumer leasing | 6 months | |
| Other non-mortgage leasing transactions | 12 months | |
| Mortgage leasing (household and business) | 36 months |
| IV. | Recovery of loans previously charged off and accounts receivable from customers |
Any payment agreement of an already charged-off loan will not give rise to income—as long as the operation is still in an impaired status—and the effective payments received are accounted for as a recovery from loans previously charged-off.
Recovery of previously charged-off loans and accounts receivable from customers, are recorded in the Consolidated Statement of Income as a deduction from provisions for loan losses.
In accordance with our charge-off policy described in iii) above, we may subsequently recover a portion of the amount charged-off (at 100%). The allowance for loan losses on our collectively evaluated loans incorporates an expected recovery rate based on historical information. At the time we charge-off the carrying amount of any loans which have been collectively evaluated for impairment, the allowance for loan losses on collectively evaluated loans is replenished to reflect incurred losses based on statistical models developed in compliance with IAS 39 on the remaining pool of loans. The amounts required for replenishment are recorded in the financial statements as “Provision established”. When a charged-off line item within the financial statements also includes charge-offs on collectively impaired loans, the line item is titled “Charged-offs of individually significant loans and/or collectively evaluated loans”.
Changes in accounting estimates
In 2012, and as a response to the ongoing improvement and monitoring process of the allowance models, the Bank updated its allowance model for consumer loans. Until June 2012, estimated loss rates in said model were established by the historical behavior of net charge-offs of recoveries for each risk profile. It is important to mention that this method only considered historical debt data for each specific profile and did not include the use of any other statistical information. Since June 2012, loss rate has been estimated with the product of the Probability of Default (PD) and Loss Given Default (LGD); established according to the historical behavior of the different profiles and based on a duly based historical analysis. These changes generated an effect on income of Ch$24,753 million. The effect of these improvements was considered as a change of estimate, following International Accounting Standards No. 8 “Accounting Policies, Changes in Accounting Estimates and Errors”; therefore, the effect was reported on the Consolidated Statement of Income.
|
NOTE 01
SUMMARY OF SIGNIFICANT ACCOUNTING POLICIES, continuedprovision established.
| p) | Provisions, contingent assets, and contingent liabilities |
Provisions are liabilities of uncertain timing or amount. These provisionsProvisions are recognized in the Consolidated Statements of Financial Position when the Bank:
| i. | has a present obligation (legal or constructive) as a result of past events, and |
| ii. |
Contingent assets or contingent liabilities are any potential rights or obligations arising from past events whose existence will be confirmed only by the occurrence or non-occurrence if one or more uncertain future events that are not wholly underwithin control of the Bank.
The Consolidated Statement of Financial Position and annual accounts reflect all significant provisions for which it is estimated that it is probable an outflow of resources will be required to meet the obligation where the probability of having to meet the obligation is more likely than not.
Provisions are quantified using the best available information on the consequences of the event giving rise to them and are reviewed and adjusted at the end of each year and are used to addressyear. Provisions must specify the specific liabilities for which they were originally recognized. Partial or total reversals are recordedrecognized when such liabilities cease to exist or decrease.are reduced.
Provisions are classified according to the obligation covered as follows:
| - | Provision for employee salaries and expenses |
| - | Provision for mandatory dividends |
| - |
| - | Provisions for contingencies |
Banco Santander Chile and Subsidiaries Notes to the Consolidated Financial Statements AS OF DECEMBER 31, 2015 AND 2014 AND FOR THE YEARS ENDED DECEMBER 31, 2015, 2014 AND 2013 |
NOTE 01
SUMMARY OF SIGNIFICANT ACCOUNTING POLICIES, continued
| q) | Deferred income taxes and other deferred taxes |
The Bank records, when appropriate, deferred tax assets and liabilities for the estimated future tax effects attributable to differences between the carrying amount of assets and liabilities and their tax bases. The measurement of deferred tax assets and liabilities is based on the tax rate, according toin accordance with the applicable tax laws, using the tax rate that applies to the period when the deferred asset and liability will be settled..settled. The future effects of changes in tax legislation or tax rates are recorded in deferred taxes beginning on the date on which the law approving such changes is published.enacted or substantially enacted.
| r) | Use of estimates |
The preparation of the financial statements requires Managementthe Bank’s management to make estimates and assumptions that affect the application of the accounting policies and the reported amountsbalances of assets, liabilities, revenues and expenses. Actual results may differ from these estimates.
In certain cases, International Financial Reporting Standards (IFRS) require that assets or liabilities be recorded or disclosed at their fair values. FairThe fair value is the price that would be received to sell an asset or paid to transfer a liability in an orderly transaction between market participants at the measurement date. When available, quoted market prices in active markets have been used as the basis for measurement. WhereWhen quoted market prices in active markets are not available, the Bank has estimated such values based on the best information available, including the use of internal valuation modelsmodeling and other valuation techniques.
The Bank has established allowances to cover incurred losses to estimate allowances. These allowances the Bank must be regularly re-evaluatereviewed taking into consideration factors such as changes in the nature and volume of the loan portfolio, trends in forecasted portfolio quality, credit quality and economic conditions that may adversely affect the borrowers’ ability to pay. Increases in the allowances for loan losses are reflected as “Provision for loan losses” in the Consolidated Statement of Income. Loans are charged-off when Managementthe Bank’s management determines that a loan or a portion thereof is impaired. Charge-offs are recorded as a reduction of the allowance for loan losses.
The relevant estimates and assumptions made to calculate provisions are regularly reviewed by the Bank’s Management to quantify certain assets, liabilities, revenues, expenses, and commitments. Revised accounting estimates are recorded in the period in which the estimate is revised.
|
NOTE 01
SUMMARY OF SIGNIFICANT ACCOUNTING POLICIES, continued
These estimates, made on the basis of the best available information, mainly refer to:
| - | Allowances for loan losses (Notes 8, 9 and 29) |
| - | Impairment losses of certain assets (Notes 7, 8, 9, 10, and |
| - | The useful lives of tangible and intangible assets (Notes 12, 13 |
| - | The fair value of assets and liabilities (Notes 5, 6, 7, |
| - | Commitments and contingencies (Note |
| - | Current and deferred taxes (Note |
| s) | Non-current assets held for sale |
Non-current assets (or a group holding assets and liabilities for disposal) expected to be recovered mainly through the sale of these items rather than through the continued use, are classified as held for sale. Immediately prior to this classification, assets (or elements of a disposable group) are re-measured in accordance with the Bank’s policies. The assets (or disposal group) are measured at the lower of carrying amount and fair value less cost to sell.
As of December 31, 2015 and 2014 the Bank has not classified any non-current assets as held for sale.
| t) | Assets received or awarded in lieu of payment |
Assets received or awarded in lieu of payment of loans and accounts receivable from clients are recognized at their fair value (as determined by an independent appraisal). A price is agreed upon by the parties through negotiation or, when the parties do not reach an agreement, at the amount at which the Bank is awarded those assets at a judicial auction. In the both cases, an independent appraisal is performed. The excess of the outstanding loan balance over the fair value is charged to net income for the period, under “Provision for loan losses”. Any excess of the fair value over the outstanding loan balance, less costs to sell of the collateral, is returned to the client. These assets are subsequently adjusted to their net realizable value less cost to sale (assuming a forced sale). The difference between the carrying value of the asset and the estimated fair value less costs to sell is charged to net income for the period, under “Other operating expenses”. The result obtained in the sale of the asset is subsequently recorded under “Other operating income”.
Banco Santander Chile and Subsidiaries Notes to the Consolidated Financial Statements AS OF DECEMBER 31, 2015 AND 2014 AND FOR THE YEARS ENDED DECEMBER 31, 2015, 2014 AND 2013 |
NOTE 01
SUMMARY OF SIGNIFICANT ACCOUNTING POLICIES, continued
Independent appraisals are obtained at least every 18 months and fair values are adjusted accordingly. No adjustments have been made between appraisals with respect to the period covered by these financial statements considering the stability of the real estate market in Chile during past years and expected stability of the real estate market in the coming years.
At least once a year, the Bank performs the necessary analysis to update these assets’ costsupdated the “cost to sell.sale” of assets received or awarded in lieu of payments. According to the Bank’s survey, as of December 31, 20132015 the average cost to sellsale was estimated at 5.7%5.0% of the appraisedappraisal value (4.5%(4.8% as of December 31, 2012)2014).
| Earnings per share |
Basic earnings per share are determined by dividing the net income attributable to the equity holders of the Bank shareholders for the reported period by the weighted average number of shares outstanding during the reported period.
Diluted earnings per share are determined in the same way as basic earnings, but the weighted average number of outstanding shares is adjusted to take into consideration the potential diluting effect of stock options, warrants, and convertible debt.
As of December 31, 20132015 and 20122014 the Bank did not have any instruments that generated diluting effects over equity.dilution.
| Temporary acquisition (assignment) of assets and liabilities |
Purchases (sales)or sales of financial assets under non-optional resale (repurchase)repurchase agreements at a fixed price (“repos”) are recorded in the Consolidated Statements of Financial Position based on the nature of the debtor (creditor) under “Deposits in the Central Bank of Chile,” “Deposits in financial institutions” or “Loans and accounts receivable from customers” (“Central Bank of Chile deposits,” “Deposits from financial institutions” or “Customer deposits”)., in Note 6.
Differences between the purchase and sale prices are recorded as financial interest over the term of the contract.
| Provision for mandatory dividends |
As of December 31, 20132015 and 20122014 the Bank recorded a provision for mandatory dividends. This provision is made pursuant to Article 79 of the Corporations Act, which is in accordance with the Bank’s internal policy, pursuant to which at least 30% of net income for the period is distributed, except in the case of a contrary resolution adopted at the respective shareholders’ meeting by unanimous vote of the outstanding shares. This provision is recorded, as a deducting item, under the “Retained earnings – provisionsprovision for mandatory dividends” line of the Consolidated Statement of Changes in Equity with offset to Provisions.
|
NOTE 01
SUMMARY OF SIGNIFICANT ACCOUNTING POLICIES, continued
| Employee benefits |
| i. | Post-employment benefits – Defined Benefit Plan: |
According to current collective labor agreements and other agreements, the Bank has an additional benefit available to its principal executives, consisting of a pension plan whose purpose is to endow them with funds for a better supplementary pension upon their retirement.
Features of the Plan:
The main features of the Post-Employment Benefits Plan promoted by the Banco Santander Chile are:
| a. | Aimed at the |
| b. | The general |
| c. | The |
| d. | The |
Banco Santander Chile and Subsidiaries Notes to the Consolidated Financial Statements AS OF DECEMBER 31, 2015 AND 2014 AND FOR THE YEARS ENDED DECEMBER 31, 2015, 2014 AND 2013 |
NOTE 01
SUMMARY OF SIGNIFICANT ACCOUNTING POLICIES, continued
To determine the present value of the defined benefit obligation and the current service cost, the method of projected unit credit is used.
Components of defined benefit cost include:
| - | current service cost and any past service cost, which are recognized in profit or loss for the period; |
| - | net interest on the liability (asset) for net defined benefit, which is recognized in profit or loss for the period; |
| - | new liability (asset) remeasurements for net defined benefit include: |
| (a) | actuarial gains and losses; |
(b) changes in the performance of the plan assets and; (c) changes in the effect of the asset ceiling, which are recognized in other comprehensive income.
| (b) | the difference between the actual return on plan assets and the interest on plan assets included in the net interest component and; |
| (c) | changes in the effect of the asset ceiling. |
The liability (asset) for net defined benefit is the deficit or surplus, determined as the difference between the present value of the defined benefit obligation minusless the fair value of plan assets.
Plan assets comprise the insurance policiespension fund taken out by the BankGroup with a third party that is not a related party. These assets are held by an entity legally separated from the Bank and exist solely to pay benefits to employees.
The Bank presentsrecognizes the present service cost and the net interest of the Personnel wagessalaries and expenses on the Consolidated Statement of Income.
The liability for post-employment benefits liability, recognized in the Consolidated Statement of Financial Position represents the deficit or surplus in the defined benefit plans of the Bank. Any surplus resulting from the calculation is limited to the present value of any economic benefits available in the form of refunds from the plan or reductions in future contributions.
When employees leave the plan before meeting the requirements to be eligible for the benefit, contributions made by the Bank are reduced.
| ii. | Cash-settled share based compensation |
The allocation of equity instrumentsBank allocates cash-settled share based compensation to executives of the Bank and its Subsidiaries as a form of compensation for their services, when those instruments are provided at the end of a specific period of employment, is recorded as an expense in the Consolidated Statement of Income under the “Personnel expenses” item, as the relevant executives provide their services over the course of the period. The Bank pays the parent for the equity instruments granted to its employees. The cash obligation is determined at the grant date in an amount equal to the fair value of the liability with employees at that date. The Bank receives invoices from the parent on a bi-annual basis. Therefore, at the end of each six-month period, the liability recorded is reversed by the payment to the parent.
|
NOTE 01
SUMMARY OF SIGNIFICANT ACCOUNTING POLICIES, continued
Our stock performance plan corresponds to cash-settled share-based payment in accordance with IFRS 2 “Share based payments”.2. The Bank measures the services received and the obligation incurred at fair value at grant datevalue. Until the obligation is determined using a Monte Carlo model which representssettled, the basis of the payment amount, and is recorded on a straight-line basis over the life of the plan. IFRS 2 requires thatBank determines the fair value of the liability be remeasured at the end of each reporting period, and thatas well as at the date of settlement, recognizing any change in fair value changes attributable to rendered services to date be reflected in the income statement of income. Given the immateriality of any changes to the fair value of the liability over the 3-year life of the plan, the fair value remeasurement was not recorded. As a cash-settled share-based payment award, the offset of the journal entry to record the compensation expense is a liability for share-based payment awards.period.
| Application of new and revised International Financial Reporting Standards |
| i. | New and revised |
The following accounting pronouncementsnew and revised IFRS have been issued by the IASB, which have been fully incorporated by the Bank and are detailed as follows:adopted in these financial statements:
Amendment to IFRS 1, First Time Adoption of international financial reporting standards IFRSIAS 19 (2011), Employee Benefits –On December 20, 2010November 21, 2013, the IASB published certain modifications amended IAS 19 (2011)Employee Benefitsto IFRS 1, specifically:clarify the requirements that relate to how contributions from employees or third parties that are linked to service should be attributed to periods of service. The amendments permit contributions that are independent of the number of years of service to be recognized as a reduction in the service cost in the period in which the service is rendered, instead of allocating the contributions to periods of service. Other contributions by employees or third parties are required to be attributed to periods of service either using the plan’s contribution formula or on a straight-line basis.
(i) Elimination of Set DatesThe amendments are effective for First Time Adopters - These modifications help first time adopters of IFRS by replacing the back application date of the un-record of financial assets and liabilities of ‘January 1, 2004’ with the ‘transition date to IFRS’. In this way, first time IFRS adopters do not have to apply the un-record requirements of IAS 39 retrospectively to a previous date and free adopters to recalculate profit and losses of ‘day 1’ over transactions that took place before the transition date to IFRS.
(ii) Severe hyperinflation – These modifications provide guidelines for entities coming from a sever hyperinflation, allowing them at the date of transaction of entities, to measure all assets and liabilities held before the normalization of functional currency date to fair value on the transition to IFRS date and use that fair value as the attributed cost for those assets and liabilities in the statements of opening financial position under IFRS. Entities using this exemption will have to describe the circumstances of how and why their functional currency was subjected to sever hyperinflation and the circumstances that led to end those conditions.
These modifications will be mandatorily applied for yearly periods beginning on or after July 1, 2012. Early implementation is2014, with earlier application permitted.The implementation of this amendment did not have anmaterial impact on the Bank’s Consolidated Financial Statements since we are already preparing our Statements according to IFRS.
IFRS 10, Consolidated Financial Statements - IFRS 10 replaces the parts of IAS 27 Consolidated and Separate Financial Statements that deal with consolidated financial statements and SIC-12Consolidation – Special Purpose Entities. IFRS 10 changes the definition of control such that an investor has control over an investee when a) it has power over the investee, b) it is exposed, or has rights, to variable returns from its involvement with the investee and c) has the ability to use its power to affect its returns. All three of these criteria must be met for an investor to have control over an investee. Previously, control was defined as the power to govern the financial and operating policies of an entity so as to obtain benefits from its activities. Additional guidance has been included in IFRS 10 to explain when an investor has control over an investee. Some guidance included in IFRS 10 that deals with whether or not an investor that owns less than 50% of the voting rights in an investee has control over the investee is relevant to the Bank.The implementation of this standard did not have a significant impact on our consolidated financial statements.
IFRS 11, Joint Arrangements —IFRS 11 replaces IAS 31Interests in Joint Ventures, and the guidance contained in a related interpretation, SIC-13 Jointly Controlled Entities – Non-Monetary Contributions by Venturers, has been incorporated in IAS 28 (as revised in 2011). IFRS 11 deals with how a joint arrangement of which two or more parties have joint control should be classified and accounted for. Under IFRS 11, there are only two types of joint arrangements – joint operations and joint ventures. The classification of joint arrangements under IFRS 11 is determined based on the rights and obligations of parties to the joint arrangements by considering the structure, the legal form of the arrangements, the contractual terms agreed by the parties to the arrangement, and, when relevant, other facts and circumstances. A joint operation is a joint arrangement whereby the parties that have joint control of the arrangement (i.e. joint operators) have rights to the assets, and obligations for the liabilities, relating to the arrangement. A joint venture is a joint arrangement whereby the parties that have joint control of the arrangement (i.e. joint venturers) have rights to the net assets of the arrangement. Previously, IAS 31 contemplated three types of joint arrangements – jointly controlled entities, jointly controlled operations and jointly controlled assets. The classification of joint arrangements under IAS 31 was primarily determined based on the legal form of the arrangement (e.g. a joint arrangement that was established through a separate entity was accounted for as a jointly controlled entity).
|
| Banco Santander Chile and Subsidiaries |
Notes to the Consolidated Financial Statements |
AS OF DECEMBER 31, 2015 AND 2014 AND FOR THE YEARS ENDED DECEMBER 31, |
NOTE 01
SUMMARY OF SIGNIFICANT ACCOUNTING POLICIES, continued
The initial and subsequent accounting of joint ventures and joint operations is different. Investments in joint ventures are accounted for using the equity method (proportionate consolidation is no longer allowed). Investments in joint operations are accounted for such that each joint operator recognizes its assets (including its share of any assets jointly held), its liabilities (including its share of any liabilities incurred jointly), its revenue (including its share of revenue from the sale of the output by the joint operation) and its expenses (including its share of any expenses incurred jointly). Each joint operator accounts for the assets and liabilities, as well as revenues and expenses, relating to its interest in the joint operation in accordance with the applicable Standards.The implementation of this standard did not have a significant impact on our consolidated financial statements.Annual Improvements 2010 – 2012 Cycle
IFRS 12, Disclosure2 Share based payments, Definition of Interestsvesting condition - Appendix A ‘Defined terms’ to IFRS 2 was amended to (i) change the definitions of ‘vesting condition’ and ‘market condition’, and (ii) add definitions for ‘performance condition’ and ‘service condition’ which were previously included within the definition of ‘vesting condition’. The amendments clarify that: (a) a performance target can be based on the operations of the entity or another entity in Other Entitiesthe same group (i.e. a non-market condition) or on the market price of the equity instruments of the entity or another entity in the same group (i.e. a market condition); (b) a performance target can relate either to the performance of the entity as a whole or to some part of it (e.g. a division or an individual employee); (c) a share market index target is a non-vesting condition because it not only reflects the performance of the entity, but also of other entities outside the group; (d) the period for achieving a performance condition must not extend beyond the end of the related service period; (e) a condition need to have an explicit or implicit service requirement in order to constitute a performance condition (rather than being a non-vesting condition); (f) a market condition is a type of performance condition, rather than a non-vesting condition; and (g) if the counterparty ceases to provide services during the vesting period, this means it has failed to satisfy the service condition, regardless of the reason for ceasing to provide services. The amendments apply prospectively to share-based payment transactions with a grant date on or after July 1, 2014, with earlier application permitted.
IFRS 3 Business Combinations, Accounting for contingent consideration in a business combination - On May 12, 2011, The amendments clarify that a contingent consideration that is classified as an asset or a liability should be measured at fair value at each reporting date, irrespective of whether the IASB issuedcontingent consideration is a financial instrument within the scope of IFRS 12 Disclosure9 or IAS 39 or a non-financial asset or liability. Changes in fair value (other than measurement period adjustments) should be recognized in profit or loss. Consequential amendments were also made to IFRS 9, IAS 39 and IAS 37. The amendments apply prospectively to business combination for which the acquisition date is on or after July 1, 2014. Earlier application is permitted.
IFRS 8 Operating Segments, Aggregation of Interests in Other Entities, which requires further disclosures related to interests in subsidiaries, joint agreements, associates and/or unconsolidated structured entities. IFRS 12 establishes disclosure objectives and specifies minimum disclosures thatOperating Segments –The amendments require an entity should provide to fulfill those objectives. An entity should disclose information that allows usersthe judgments made by management in applying the aggregation criteria to operating segments, including a description of its financial statements evaluate the nature and risks associated with interests in other entitiesoperating segments aggregated and the effectseconomic indicators assessed in determining whether the operating segments have ‘similar economic characteristics’. It clarifies that a reconciliation of those intereststhe total of the reportable segments’ assets to the entity’s assets should only be provided if the segment assets are regularly provided to the chief operating decision-maker. The amendments apply for annual periods beginning on its financial statements. The disclosure requirements are extensive and represent and effort that could require gathering the necessary information.The implementation of this standard did not have a significant impact on our consolidated financial statements.or after July 1, 2014, with earlier application permitted.
IFRS 13 Fair Value Measurement, -IFRS 13 establishes a single source of guidanceShort-term receivables and payables –The Basis for fair value measurements and disclosures about fair value measurements. The scopeConclusions was amended to clarify that the issuance of IFRS 13 and consequential amendments to IAS 39 and IFRS 9 did not remove the ability to measure short-term receivables and payables with no stated interest rate at their invoice amounts without discounting, if the effect of not discounting is broad;immaterial.
IAS 16 Property, Plant and Equipment and IAS 38 Intangible Assets, Revaluation method: proportionate restatement of accumulated depreciation/amortization –The amended requirements clarify that the fair value measurement requirementsgross carrying amount is adjusted in a manner consistent with the revaluation of IFRS 13the carrying amount of the asset and that accumulated depreciation/amortization is the difference between the gross carrying amount and the carrying amount after taking into account accumulated impairment losses. The amendments apply for annual periods beginning on or after July 1, 2014, with earlier application permitted. An entity is required to apply to both financial instrument itemsamendments to all revaluations recognized in the annual period in which the amendments are first applied and non-financial instrument items for which other IFRSs require or permit fair value measurements and disclosures about fair value measurements, except for share-based payment transactions that are withinin the scope of IFRS 2Share-based Payment, leasing transactions that are within the scope of IAS 17 Leases, and measurements that have some similaritiesimmediately preceding annual period. An entity is permitted, but not required, to fair value but are not fair value (e.g. net realisable value for the purposes of measuring inventories or value in use for impairment assessment purposes).restate any earlier periods presented.
IFRS 13 defines fair value asIAS 24 Related Party Disclosures, Key management personnel –The amendments clarify that a management entity providing key management personnel services to a reporting entity is a related party of the price that would be received to sell an assetreporting entity. The amendments apply for annual periods beginning on or paid to transfer a liability in an orderly transaction in the principal (or most advantageous) market at the measurement date under current market conditions. Fair value under IFRS 13 is an exit price regardless of whether that price is directly observable or estimated using another valuation technique. Also, IFRS 13 includes extensive disclosure requirements.after July 1, 2014, with earlier application permitted.
IFRS 13 requires prospective application from 1 January 2013. In addition, specific transitional provisions were given to entities such that they need not apply the disclosure requirements set out in the Standard in comparative information provided for periods before the initial application of the Standard.The implementation of this standard generated anthose modifications did not have material impact amounted Ch$18,324 million on ourthe consolidated financial statements of the Bank..
Annual Improvements 2011 – 2013 Cycle
Amendment to IAS 1 - Presentation of Items of Other Comprehensive IncomeIFRS 3 Business Combinations, Scope exception for joint ventures - The amendments introduce new terminology, whose use isscope section was amended to clarify that IFRS 3 does not mandatory,apply to the accounting for the statementformation of comprehensive income and income statement. Underall types of joint arrangement in the amendments to IAS 1,financial statements of the ‘statement of comprehensive income’ is renamed as the ‘statement of profit or loss and other comprehensive income’ [and the ‘income statement’ is renamed as the ‘statement of profit or loss’].joint arrangement itself. The amendments to IASapply for annual periods beginning on or after July 1, retain the option to present profit or loss and other comprehensive income in either a single statement or in two separate but consecutive statements. However, the amendments to IAS 1 require items of other comprehensive income to be grouped into two categories in the other comprehensive income section: (a) items that will not be reclassified subsequently to profit or loss and (b) items that may be reclassified subsequently to profit or loss when specific conditions are met. Income tax on items of other comprehensive income is required to be allocated on the same basis – the amendments do not change the option to present items of other comprehensive income either before tax or net of tax. The amendments have been applied retrospectively, and hence the presentation of items of other comprehensive income has been modified to reflect the changes. Other than the above mentioned presentation changes, the2014, with earlier application of the amendments to IAS 1 does not result in any impact on profit or loss, other comprehensive income and total comprehensive income.permitted.
|
| Banco Santander Chile and Subsidiaries |
Notes to the Consolidated Financial Statements |
AS OF DECEMBER 31, 2015 AND 2014 AND FOR THE YEARS ENDED DECEMBER 31, |
NOTE 01
SUMMARY OF SIGNIFICANT ACCOUNTING POLICIES, continued
Amendment to IAS 19IFRS 13 Fair Value Measurement, Scope of portfolio exception (paragraph 52) - Employee Benefits -IAS 19 (as revised in 2011) changesThe scope of the accountingportfolio exception for defined benefit plans and termination benefits. The most significant change relates to the accounting for changes in defined benefit obligations and plan assets. The amendments require the recognition of changes in defined benefit obligations and inmeasuring the fair value of plan assets when they occur, and hence eliminate the ‘corridor approach’ permitted under the previous version of IAS 19 and accelerate the recognition of past service costs. All actuarial gains and losses are recognized immediately through other comprehensive income in order for the net pension asset or liability recognised in the consolidated statementa group of financial positionassets and financial liabilities on a net basis was amended to reflectclarify that it includes all contracts that are within the full valuescope of, the plan deficit or surplus. Furthermore, the interest cost and expected return on plan assets used in the previous version of IAS 19 are replaced with a ‘net interest’ amount under IAS 19 (as revised in 2011), which is calculated by applying the discount rate to the net defined benefit liability or asset. These changes have had an impact on the amounts recognized in profit or loss and other comprehensive income in prior years (see Note 2 – Accounting changes). In addition, IAS 19 (as revised in 2011) introduces certain changes in the presentation of the defined benefit cost including more extensive disclosures.
Specific transitional provisions are applicable to first-time application of IAS 19 (as revised in 2011).The Bank applied this amendment,accounted for in accordance with, IAS 8 - Accounting Policies Changes.39 or IFRS 9, even if those contracts do not meet the definitions of financial assets or financial liabilities within IAS 32. Consistent with the prospective initial application of IFRS 13, the amendment must be applied prospectively from the beginning of the annual period in which IFRS was initially applied. The effect of thisamendments apply for annual periods beginning on or after July 1, 2014, with earlier application is shown in detail on Note 02 - Accounting changes, on these Consolidated Financial Statements.permitted.
Annual ImprovementsIAS 40 Investment Property, Interrelationship between IFRS 3 and International StandardsIAS 40 -IAS 40 was amended to Financial Information – On May 17, 2012clarify that this standard and IFRS 3Business Combinationsare not mutually exclusive and application of both standards may be required. Consequently, an entity acquiring investment property must determine whether (a) the IASB issued “Annual Improvementsproperty meets the definition of investment property in IAS 40, and (b) the transaction meets the definition of a business combination under IFRS 3. The amendment applies prospectively for acquisitions of investment property in periods commencing on or after July 1, 2014. An entity is only permitted to IFRS: 2009-2011 Cycle”, incorporatingadopt the amendments early and/or restate prior periods if the information to five standards.do so is available. The amendments apply for annual periods beginning on or after July 1, 2014, with earlier application permitted.
The implementation of those modifications did not have material impact on the consolidated financial statements of the Bank.
| New and revised IFRS |
IFRS 9 Financial Instruments (2014) (IFRS 9) - IFRS 9 (2014)contains accounting requirements for financial instruments, replacing IAS 39 Financial Instruments: Recognition and Measurement. The amendmentsstandard contains requirements in the following areas:
Classification and measurement. Financial assets are classified by reference to the business model within which they are held and their contractual cash flow characteristics. The 2014 version of IFRS cycle 2009-2011,9 introduces a 'fair value through other comprehensive income' category for certain debt instruments. Financial liabilities are classified in a similar manner to under IAS 39, however there are differences in the requirements applying to the measurement of an entity's own credit risk.
Impairment. The 2014 version of IFRS 9 introduces an 'expected credit loss' model for the measurement of the impairment of financial assets, so it is no longer necessary for a credit event to have occurred before a credit loss is recognized.
Hedge accounting. Introduces a new hedge accounting model that is designed to be more closely aligned with how entities undertake risk management activities when hedging financial and non-financial risk exposures.
Derecognition. The requirements for the derecognition of financial assets and liabilities are carried forward from IAS 39.
IFRS 9 is effective for annual periods beginning on or after 1 January 1, 2013, although early application is permitted.These amendments did not have a material impact on our consolidated financial statements.
IAS 27 (2011), Separated Financial Statements- IAS 27 Consolidated and Separated Financial Statements was modified by IFRS 10 but keeps the current guidelines for separated financial statements.These amendments did not have a material impact on our consolidated financial statements.
IAS 28 (2011) - Investments in Associates and Joint Ventures -IAS 28 Investments in Associates was modified to conform the changes related to the issuing of IFRS 10 and IFRS 11.These amendments did not have a material impact on our consolidated financial statements.
Amendment to IFRS 10 - Consolidated Financial Statements, IFRS 11 - Joint Agreements and IFRS 12 - Disclosure of Interests in Other Entities - Transition Guidance -On June 28, 2012, the IASB published Consolidated Financial Statements, Joint Agreements and Disclosure of interests in Other Entities (amendments to IFRS 10, IFRS 11 and IFRS 12). Amendments are meant to lighten up the transition from IFRS 10, IFRS 11 and IFRS 12 by "limiting the requirement to provide comparative information adjusted only for the immediately preceding year comparative." Also, the amendments to IFRS 11 and IFRS 12 eliminate the requirement of providing comparative information for the periods prior to the immediately following year. The effective date of these amendments is for annual periods beginning on or after January 1, 2013, in line with the effective dates of IFRS 10, IFRS 11 and IFRS 12.These amendments did not have a material impact on our consolidated financial statements.
Amendment to IFRS 7 Disclosures - Offsetting Financial Assets and Financial Liabilities -The Bank has applied the amendments to IFRS 7Disclosures – Offsetting Financial Assets and Financial Liabilities for the first time in the current year. The amendments to IFRS 7 require entities to disclose information about rights of offset and related arrangements (such as collateral posting requirements) for financial instruments under an enforceable master netting agreement or similar arrangement.
The application of the amendments has had no material impact on the disclosures or on the amounts recognised in the consolidated financial statements, as the Bank has not enforceable master netting agreements in place.
|
NOTE 01
SUMMARY OF SIGNIFICANT ACCOUNTING POLICIES, continued
IFRS 9, Financial Instruments –On November 12, 2009 the IASB issued IFRS 9, Financial Instruments. This regulation incorporates new requirements for the classification and measurement of financial assets and it is effective for yearly periods beginning on or after January 1, 2013. Early application is permitted. IFRS 9 specifies how an entity should classify and measure its financial assets. It requires that all financial assets be classified in their entirely on the basis of the entity’s business model for the management of financial assets and the features of the financial assets agreement cash flows.
Financial assets are measured whether by amortized cost or fair value. Only financial assets classified as measured to amortize cost will be tested for Impairment. On October 28, 2010, the IFRS issued a revised version of IFRS 9, Financial Instruments. The revised Standard keeps the requirements for classification and measurement of financial assets published on November 2009 but it adds guidelines on classification and measurement of financial liabilities. As part of the restructuring of IFRS 9, the IASB has also reproduced the guidelines on un-record of financial instruments and related implementation guidelines from IAS 39 to IFRS 9. These new guidelines constitute the first stage of the IASB project to replace IAS 39. The other stages, impairment and hedge accounting, have not been finished yet.
The guidelines included in IFRS 9 about the classification and measurements of financial assets have not changed from those established in IAS 39. In other words, financial liabilities will continue to be measured whether by amortized cost or fair value with change in income. The concept of bifurcation of embedded derivatives in a contract by financial asset has not change either. Financial liabilities held for trade will continue to be measured at fair value with changes in profit and loss, and all other financial assets will be measured at amortized cost unless the fair value option is applied using currently existing criteria in IAS 39.
Notwithstanding the latter, there are two differences with regards to IAS 39:
On December 16, 2012 the IASB issued Mandatory Implementation Date of IFRS 9 and Transition Disclosures, deferring the effective date versions of both 2009 and 2010 for annual periods beginning on or after 01 January 2015. Prior to the amendments, the application of IFRS 9 was mandatory for annual periods beginning on or after 2013. Modifications change the requirements for the transition from IAS 39 Financial Instruments: Recognition and Measurement to IFRS 9. In addition, the amendments also modify IFRS 7 Financial Instruments: Disclosures, to add certain requirements in the reporting period including the enforcement date of IFRS 9.
Amendments are effective for yearly periods beginning on or after January 1, 2018; early application is permitted.2018.The Bank’s management is assessing the potential impact of the adoption of these modifications.
Amendments to IFRS 10, IFRS 12 and IAS 27 Investment Entities -The amendments to IFRS 10 define an investment entity and require a reporting entity that meets the definition of an investment entity not to consolidate its subsidiaries but instead to measure its subsidiaries at fair value through profit or loss in its consolidated and separate financial statements.
To qualify as an investment entity, a reporting entity is required to:
Consequential amendments have been made to IFRS 12 and IAS 27 to introduce new disclosure requirements for investment entities. Management believes that this amendment will be adopted in the consolidated financial statements of the Bank for the period beginning on January 1, 2014.Bank.
|
NOTE 01
SUMMARY OF SIGNIFICANT ACCOUNTING POLICIES, continued
Investment entities – Amendments to IFRS 10 – Consolidated Financial Statements; IFRS 12 – Disclosures of Interests in Other Entities and IAS 27 – Separated Financial Statements15, Revenue from Contracts with Customers -On October 31, 2012,issued on May 28, 2014, the IASB issued “Investment entities (amendmentshas published its new standard, IFRS 15 Revenue from contracts with customers. At the same time, the Financial Accounting Standards Board (FASB) has published its equivalent revenue standard, ASU 2014-09.The new standard provides a single, principles based five-step model to IFRS 10, IFRS 12 and IAS 27)”, providing an exceptionbe applied to all contracts with customers, i) identify the contract with the customer, ii) identify the performance obligations in the contract, iii) determine the transaction price, iv) allocate the transaction price to the consolidation of subsidiaries under IFRS 10 Consolidated Financial Statements for entities that followperformance obligations in the definition of “investment entity”, as well as some investment funds. Instead, said entities will measure their investments in subsidiaries at fair value through profit and loss, pursuant to IFRS 9 Financial Instruments or IAS 39 Financial Instruments: Recognition and Measurement.contracts, v) recognize revenue when (or as) the entity satisfies a performance obligation.
Amendments also require additional disclosure about whether the entity is consideredIFRS 15 must be applied in an investment entity, details of non-consolidated subsidiaries, the nature of the relationship and certain transactions between the investment entity and its subsidiaries. On the other hand, amendments force an investment entity to account for its investment in a subsidiary in the same way in the consolidatedentity’s first annual IFRS financial statements as well as in its individual financial statements (or just provide individual financial statements if all subsidiaries are not consolidated). These modifications will be effective for yearly periods beginning on or after 1 January 2018. Application of the Standard is mandatory and early adoption is permitted. An entity that chooses to apply IFRS 15 earlier than 1 2014. In-advance enforcement is allowed. Early application permitted. Management believesJanuary 2018 must disclose this new regulation will be adopted in the Bank’s Consolidated Financial Statements for the period beginning on January 1, 2014. Management is currently evaluating the possible impact this might have.fact.The Bank’s management is assessing the potential impact of the adoption of these modifications.this standard on the consolidated financial statements of the Bank.
AmendmentsAccounting for Acquisitions of interests in Joint Operations (Amendments to IAS 32Offsetting Financial Assets and Financial LiabilitiesIFRS 11) -
The amendmentsissued on May 6, 2014 the IASB has issued “Accounting for Acquisitions of Interests in Joint Operations (amendments to IAS 32 clarify the requirements relating to the offset of financial assets and financial liabilities. Specifically,IFRS 11)”, the amendments clarify the meaningaccounting for acquisitions of ‘currently hasan interest in a legally enforceable right of set-off’ and ‘simultaneous realisation and settlement.The Bank’s management is assessingjoint operation when the potential impact of the adoption of these modifications.operation constitutes a business.
Banco Santander Chile and Subsidiaries Notes to the Consolidated Financial Statements AS OF DECEMBER 31, 2015 AND 2014 AND FOR THE YEARS ENDED DECEMBER 31, 2015, 2014 AND 2013 |
NOTE 01
SUMMARY OF SIGNIFICANT ACCOUNTING POLICIES, continued
IFRIC 21 - Levies – On May 20, 2013Amends IFRS 11 Joint Arrangements to require an acquirer of an interest in a joint operation in which the IASB issued this interpretation addressing the accounting foractivity constitutes a liability to pay a levy if such liability is within the IAS 37. It also addresses the accounting for a liability to pay a levy which amount and maturity is true. For the purposes of this Interpretation, a levy is an outflow of resources embodying economic benefits imposed by governments to entities according to legislation (laws and regulations). This is different from the outflow of resources within the reach of IAS 12 Income Tax, and fines or other penalties imposed for breaches of the legislation. An entity shall apply these modifications retrospectivelybusiness (as defined in IFRS 3 Business Combinations) to:
| · | apply all of the business combinations accounting principles in IFRS 3 and other IFRSs, except for those principles that conflict with the guidance in IFRS 11; |
| · | disclose the information required by IFRS 3 and other IFRSs for business combinations. |
The amendments are effective for annual periods beginning on or after 1 January 1, 2014.2016. Earlier application permitted. If an entity applies this Interpretation for prior periods shall disclose this fact. Changes in accounting policies resulting from the application of this Interpretation shall be accounted for retrospectively in accordance with IAS 8 - Accounting policies, changes in accounting estimates and errors.is permitted but corresponding disclosures are required. The amendments apply prospectively.The Bank’s management is assessinghas considered that these amendments will not have material impact on the potential impactconsolidated financial statements of the adoption of these modifications.Bank.
AmendmentClarification of Acceptable Methods of Depreciation and Amortization (Amendments to IAS 36, Impairment of the Assets16 and IAS 38) -– Onissued on May 29, 201312, 2014 the IASB issued Recoverable Amount Disclosures for Non-Financial Assets. The objectivehas published “Clarification of this amendment isAcceptable Methods of depreciation and amortization (amendments to harmonizeIAS 16 and IAS 38)”.The amendments provide additional guidance on how the disclosure requirements about fair value without the disposal costsdepreciation or amortization of property, plant and value in use, when present value techniquesequipment and intangible assets should be calculated. They are used to measure the recoverable amount of assets that are considered value impaired, requiring an entity to disclose the discount rates that have been used to determine the recoverable amount of assets that are considered value impaired. An entity shall apply these modifications retrospectivelyeffective for annual periods beginning on or after 1 January 2016, with earlier application being permitted. The Bank’s management has considered that amendment will not impact the consolidated financial statements.
Equity Method in Separate Financial Statements (Amendments to IAS 27) -issued on August 12, 2014, the IASB has published “Equity Method in Separate Financial Statements (Amendments to IAS 27)”. The amendments reinstate the equity method as an accounting option for investments in subsidiaries, joint ventures and associates in an entity's separate financial statements. The amendments allow an entity to account for investments in subsidiaries, joint ventures and associates in its separate financial statements:
| · | at cost, |
| · | in accordance with IFRS 9 Financial Instruments (or IAS 39 Financial Instruments: Recognition and Measurement for entities that have not yet adopted IFRS 9), or |
| · | using the equity method as described in IAS 28 Investments in Associates and Joint Ventures. |
The accounting option must be applied by category of investments. In addition to the amendments to IAS 27, there are consequential amendments to IAS 28 to avoid a potential conflict with IFRS 10 Consolidated Financial Statements and to IFRS 1 First-time Adoption of International Financial Reporting Standards. The accounting option must be applied by category of investments. In addition to the amendments to IAS 27, there are consequential amendments to IAS 28 to avoid a potential conflict with IFRS 10 Consolidated Financial Statements and to IFRS 1 First-time Adoption of International Financial Reporting Standards. The amendments are effective for annual periods beginning on or after 1 January 2016. Earlier application is permitted.
The amendments are to be applied retrospectively in accordance with IAS 8 Accounting Policies, Changes in Accounting Estimates and Errors. The Bank’s management has considered that these amendments will not have material impact on the consolidated financial statements of the Bank.
Sale or Contributions of Assets between an Investor and its Associate or Joint Venture (Amendments to IFRS 10 and IAS 28) -Issued on September 11, 2014, the IASB has published 'Sale or Contribution of Assets between an Investor and its Associate or Joint Venture (Amendments to IFRS 10 and IAS 28)'. The amendments address a conflict between the requirements of IAS 28
'Investments in Associates and Joint Ventures' and IFRS 10 'Consolidated Financial Statements' and clarify the treatment of the sale or contribution of assets from an investor to its associate or joint venture, as follows:
| · | require full recognition in the investor's financial statements of gains and losses arising on the sale or contribution of assets that constitute a business (as defined in IFRS 3 Business Combinations); |
| · | require the partial recognition of gains and losses where the assets do not constitute a business, i.e. a gain or loss is recognized only to the extent of the unrelated investors’ interests in that associate or joint venture. |
Banco Santander Chile and Subsidiaries Notes to the Consolidated Financial Statements AS OF DECEMBER 31, 2015 AND 2014 AND FOR THE YEARS ENDED DECEMBER 31, 2015, 2014 AND 2013 |
NOTE 01
SUMMARY OF SIGNIFICANT ACCOUNTING POLICIES, continued
On December 17, 2015 the IASB has published final amendments to “Sale or Contribution of Assets between an Investor and its Associate or Joint Venture”. The amendments defer the effective date of the September 2014 amendments to these standards indefinitely until the research project on the equity method has been concluded.The Bank’s management has considered that these amendments will not have material impact on the consolidated financial statements of the Bank.
Disclosure initiative (Amendments to IAS 1) -issued on December 18, 2014 the IASB added an initiative on disclosure to its work program in 2013 to complement the work being done in the Conceptual Framework project. The initiative is made up of a number of smaller projects that aim at exploring opportunities to see how presentation and disclosure principles and requirements in existing Standards can be improved. They are effective for annual periods beginning on or after 1 January 2016, with earlier application being permitted. The Bank’s management has considered that these amendments will not have material impact on the consolidated financial statements of the Bank.
Investment Entities: Applying the Consolidation Exception (Amendments to IFRS 10, IFRS 12 and IAS 28) -issued on December 18, 2014 the IASB has published 'Investment Entities: Applying the Consolidation Exception, Amendments to IFRS 10 Consolidated Financial Statements, IFRS 12 Disclosure of Interests in Other Entities and IAS 28 Investments in Associates and Joint Ventures (2011) to address issues that have arisen in the context of applying the consolidation exception for investment entities. They are effective for annual periods beginning on or after 1 January 2016, with earlier application being permitted. The Bank’s management has considered that these amendments will not have material impact on the consolidated financial statements of the Bank.
Annual Improvements 2012-2014 Cycle
IFRS 5 Non-current Assets Held for Sale and Discontinued Operations, Changes in methods of disposal -Adds specific guidance in IFRS 5 for cases in which an entity reclassify an asset from held for sale to held for distribution or vice versa and cases in which held-for-distribution accounting is discontinued.
IFRS 7 Financial Instruments: Disclosures (with consequential amendments to IFRS 1), Servicing contracts -Adds additional guidance to clarify whether a servicing contract is continuing involvement in a transferred asset for the purpose of determining the disclosures required.
IAS 19 Employee Benefits, Discount rate –Clarifies that the high quality corporate bonds used in estimating the discount rate for post-employment benefits should be denominated in the same currency as the benefits to be paid (thus, the depth of the market for high quality corporate bonds should be assessed at currency level).
IAS 34 Interim Financial Reporting, Disclosure of information “elsewhere in the interim financial report” -Clarifies the meaning of 'elsewhere in the interim report' and requires a cross-reference
The improvements are effective for annual periods beginning on or after 1 July 2016, with earlier application being permitted.
The Bank’s management has considered that these improvements will not have material impact on the consolidated financial statements of the Bank.
IFRS 16 Leases – issued on January 13, 2016, the IASB has published its new standard for leases, which replaces IAS 17 Leases, IFRIC 4 Determining whether an arrangement contains a lease, SIC15 Operating leases and SIC27 Evaluating the substance of transactions involving the legal form of a lease. IFRS 16 introduces a single lessee accounting model and requires a lessee to recognise assets and liabilities for all leases with a term of more than 12 months, unless the underlying asset is of low value. A lessee is required to recognise a right-of-use asset representing its right to use the underlying leased asset and a lease liability representing its obligation to make lease payment. Lessor accounting however remains largely unchanged and the distinction between operating and finance leases is retained.
IFRS 16 is effective for periods beginning on or after January 1, 2014. In-advance enforcement is allowed. An entity shall not apply these modifications to periods (including comparative periods) in which2019, with earlier adoption permitted if IFRS 13 is not15 “Revenue from Contracts with Customer” has also been applied.The Bank’s management is assessing the potential impact of the adoption of these modifications.this standard on the consolidated financial statements of the Bank.
Amendment IAS 39, Financial instruments: recognition and measurement – On June, 27, 2013 the IASB issued the amendment Novation of Derivatives and Continuation of Hedge Accounting, establishing that a derived contract novation with a central counterparty (clearing house) would generate a hedged interruption, derecognition of the original derivative and the recognition of the new derivative contract novated. While product novation laws or regulations do not qualify for derecognition and therefore hedge accounting will not be interrupted (if requirements are met). The effective date of application for annual periods beginning on January 1, 2014, may be applied in advance. An entity shall apply the amendment retrospectively in accordance with IAS 8 - Accounting policies, changes in accounting estimates and errors.The Bank’s management is assessing the potential impact of the adoption of these modifications.
IFRS 9 - Financial Instruments – Coverage and Amendments accounting for IFRS 9, IFRS 7 and IAS 39 – On November 19, 2013 the IASB issued this amendment which includes a new coverage accounting general model. It is more closely aligned with risk management, providing more useful information to users of financial statements. Moreover, the requirements relating to the fair value option for financial liabilities were changed to address own credit risk. This improvement requires that the effects of changes in credit risk of liability should not affect the income of the period unless the liabilities are hold for trading. Early adoption of this amendment is allowed without the application of the other requirements of IFRS 9. Additionally, it conditions the effective date of entry into force to the end of the draft IFRS 9, allowing equally to be adopted. The Bank’s management is assessing the potential impact of the adoption of these modifications regarding IFRS 7 and IAS 39.
|
| Banco Santander Chile and Subsidiaries |
Notes to the Consolidated Financial Statements |
AS OF DECEMBER 31, 2015 AND 2014 AND FOR THE YEARS ENDED DECEMBER 31, |
NOTE 01
SUMMARY OF SIGNIFICANT ACCOUNTING POLICIES, continued
AmendmentRecognition of Deferred Tax Assets for Unrealized Losses (Amendments to IAS 12)-On January 19, – Defined benefit plans: employee contributions –On November 21, 20132016, the IASB issued these modifications establishingpublished final amendments to IAS 12 “Income Taxes”. The amendments clarify the treatment for employee or third party contributions when accounting for the defined benefit plans. Therefore, if the amount of the contributions is independent of the number of years of service, it allows an entity to recognize these contributions as a reduction in service costs in the period in which the related service is rendered, instead of attributing contributions to periods of service, and if the amount of the contribution depends on the number of years of service, an entity to attribute these contributions to periods of service is required, using the same method of allocation required by paragraph 70 of the IAS 19, for gross proceeds (that is, using the contribution plan formula or a linear basis). These modifications apply for annual periods starting as of July 1, 2014 retroactively, as stated byIAS 8 - Accounting policies changes in accounting estimates and errors. Earlier application permitted.The Bank’s management is assessing the potential impact of the adoption of these modifications.
Annual modifications, cycle 2010-2012 –On December 12, 2013 this document covering seven standards was issued:following aspects:
| · | An entity |
IFRS annual modifications, 2010-2012 cycle, must be implemented for annual periods starting on or after July 1, 2014. Early application permitted.The Bank’s management is assessing the potential impact of the adoption of these modifications.
Annual modifications, cycle 2011-2013 –On December 12, 2013 this document covering four standards was issued:
IFRS annual modifications, 2011-2013 cycle, must be implemented for annual periods beginning on or after JulyJanuary 1, 2014.2017. Earlier application is permitted.The Bank’s management is assessinghas considered that these amendments will not have material impact on the potential impactconsolidated financial statements of the adoptionBank.
Disclosure Initiative (Amendments to IAS 7)-The amendments are part of the IASB’s Disclosure initiative project and introduce additional disclosure requirements intended to address investors’ concerns that financial statements do not currently enable them to understand the entity’s cash flows; particularly in respect of the management of financing activities. The amendments require disclosure of information enabling users of financial statements to evaluate changes in liabilities arising from financial activities. Although there is no specific format required to comply with the new requirements, the amendments include illustrative examples to show how an entity can meet the objective of these modifications.amendments.
The amendments are effective for annual periods beginning on or after January 1, 2017. Earlier application is permitted.The Bank’s management has considered that these amendments will not have material impact on the consolidated financial statements of the Bank.
|
| Banco Santander Chile and Subsidiaries |
Notes to the Consolidated Financial Statements |
AS OF DECEMBER 31, 2015 AND 2014 AND FOR THE YEARS ENDED DECEMBER 31, |
2013
ACCOUNTING CHANGES
IAS 19 – “Employee Benefits Revised” was implemented as of January 1, 2013. Regarding the Pension Plan (Defined benefits), the main change of the new version of the IAS 19 is the inability to defer the costs of 'past services' of the defined benefit plans, they have to be recognized within income at the moment of formalizing the plan and when it is modified. The amendments require an accounting change that must be applied retroactively following IAS 8 “Accounting Policies, Changes in Accounting Estimates and Errors”. Management of the Bank has determined that the effect of such retrospective application is not material as of December 31, 2013 and 2012 and for the years ended December 31, 2013, 2012 and 2011.
The required adjustments to comply with the IAS 19 - Employee Benefits amendments within the Consolidated Financial Statements as of December 31, 2012 are as follows:
| Closing balance as of December 31, | Adjusted balance as of December 31, | |||||
| Consolidated Statement of Financial Position | 2012 | Adjustments | 2012 | |||
| MCh$ | MCh$ | MCh$ | ||||
| Assets | ||||||
| Deferred taxes | 181,678 | 197 | 181,875 | |||
| Other assets | 658,873 | (983) | (*) | 657,890 | ||
| Total Assets | 840,551 | (786) | 839,765 | |||
| Liabilities | ||||||
| Provisions | 191,796 | 96 | 191,892 | |||
| Total Liabilities | 191,796 | 96 | 191,892 | |||
| Equity | ||||||
| Reserves | 976,561 | (1,101) | (**) | 975,460 | ||
| Income for the year | 356,493 | 315 | (***) | 356,808 | ||
| Minus: Provision for mandatory dividends | (106,948) | (96) | (107,044) | |||
| Total Equity | 1,226,106 | (882) | 1,225,224 |
(*) Corresponds to decrease in deferred past service costs
(**) Corresponds to the effect, net of taxes, on pension plans that was deferred as of December 31, 2011
(***) Corresponds to an effect on income for the period
The adjustments required by the IAS 19 modifications as of January 1, 2012 are as follows:
| Opening balance as of January 1, | Adjusted balance as of January 1, | |||||
| Consolidated Statement of Financial Position | 2012 | Adjustments | 2012 | |||
| MCh$ | MCh$ | MCh$ | ||||
| Assets | ||||||
| Deferred taxes | 136,521 | 276 | 136,797 | |||
| Other assets | 550,326 | (1,377) | (*) | 548,949 | ||
| Total Assets | 686,847 | (1,101) | 685,746 | |||
| Equity | ||||||
| Reserves | 802,528 | (1,101) | (**) | 801,427 | ||
| Total Equity | 802,528 | (1,101) | 801,427 |
(*) Corresponds to decrease in pension plan for deferred pension plan
(**) Corresponds to pension plans amount pending of deferral as of December 31, 2011 (net of income tax)
|
NOTE 02
ACCOUNTING CHANGES, continued
The adjusted Consolidated Statements with modifications required by IAS 19 - Employee Benefits are as follows:
| Closing balance as of December 31, | IAS 19 adjustments | Adjusted balance as of December 31, | |||
| 2012 | 2012 | ||||
| MCh$ | MCh$ | MCh$ | |||
| ASSETS | |||||
| Cash and deposits in banks | 1,250,414 | - | 1,250,414 | ||
| Cash items in process of collection | 520,267 | - | 520,267 | ||
| Trading investments | 338,287 | - | 338,287 | ||
| Investments under resale agreements | 6,993 | - | 6,993 | ||
| Financial derivative contracts | 1,293,212 | - | 1,293,212 | ||
| Interbank loans, net | 90,414 | - | 90,414 | ||
| Loans and accounts receivable from customers, net | 18,326,190 | - | 18,326,190 | ||
| Available for sale investments | 1,826,158 | - | 1,826,158 | ||
| Held to maturity investments | - | - | - | ||
| Investments in associates and other companies | 7,614 | - | 7,614 | ||
| Intangible assets | 87,347 | - | 87,347 | ||
| Property, plant, and equipment | 162,214 | - | 162,214 | ||
| Current taxes | 10,227 | - | 10,227 | ||
| Deferred taxes | 181,678 | 197 | 181,875 | ||
| Other assets | 658,873 | (983) | 657,890 | ||
| TOTAL ASSETS | 24,759,888 | (786) | 24,759,102 | ||
| LIABILITIES | |||||
| Deposits and other demand liabilities | 4,970,019 | - | 4,970,019 | ||
| Cash items in process of being cleared | 284,953 | - | 284,953 | ||
| Obligations under repurchase agreements | 304,117 | - | 304,117 | ||
| Time deposits and other time liabilities | 9,112,213 | - | 9,112,213 | ||
| Financial derivative contracts | 1,146,161 | - | 1,146,161 | ||
| Interbank borrowings | 1,438,003 | - | 1,438,003 | ||
| Issued debt instruments | 4,571,289 | - | 4,571,289 | ||
| Other financial liabilities | 192,611 | - | 192,611 | ||
| Current taxes | 525 | - | 525 | ||
| Deferred taxes | 9,544 | - | 9,544 | ||
| Provisions | 191,796 | 96 | 191,892 | ||
| Other liabilities | 341,274 | - | 341,274 | ||
| TOTAL LIABILITIES | 22,562,505 | 96 | 22,562,601 | ||
| EQUITY | |||||
| Attributable to the Bank's shareholders: | 2,163,118 | (882) | 2,162,236 | ||
| Capital | 891,303 | - | 891,303 | ||
| Reserves | 976,561 | (1,101) | 975,460 | ||
| Valuation adjustments | (3,781) | - | (3,781) | ||
| Retained earnings | 299,035 | 219 | 299,254 | ||
| Retained earnings of prior years | 49,490 | - | 49,490 | ||
| Income for the period | 356,493 | 315 | 356,808 | ||
| Minus: Provision for mandatory dividends | (106,948) | (96) | (107,044) | ||
| Non-controlling interest | 34,265 | - | 34,265 | ||
| TOTAL EQUITY | 2,197,383 | (882) | 2,196,501 | ||
| TOTAL LIABILITIES AND EQUITY | 24,759,888 | (786) | 24,759,102 |
|
NOTE 02
ACCOUNTING CHANGES, continued
The adjustments required by IAS 19 as of December 31, 2012 are detailed below:
| Closing balance as of December 31, 2012 | IAS 19 adjustments | Adjusted balance as of December 31, 2012 | |
| MCh$ | MCh$ | MCh$ | |
| OPERATING INCOME | |||
| Interest income | 1,890,953 | - | 1,890,953 |
| Interest expense | (848,219) | - | (848,219) |
| Net interest income | 1,042,734 | - | 1,042,734 |
| Fee and commission income | 360,427 | - | 360,427 |
| Fees and commissions expense | (89,855) | - | (89,855) |
| Net fee and commission income | 270,572 | - | 270,572 |
| Net income from financial operations | (64,079) | - | (64,079) |
| Foreign exchange profit (loss), net | 146,378 | - | 146,378 |
| Other operating income | 13,105 | - | 13,105 |
| Net operating profit before provision for loan losses | 1,408,710 | - | 1,408,710 |
| Provisions for loan losses | (403,692) | - | (403,692) |
| NET OPERATING PROFIT | 1,005,018 | - | 1,005,018 |
| Personnel salaries and expenses | (300,298) | 394 | (299,904) |
| Administrative expenses | (183,379) | - | (183,379) |
| Depreciation and amortization | (56,369) | - | (56,369) |
| Impairment | (90) | - | (90) |
| Other operational expenses | (59,637) | - | (59,637) |
| TOTAL OPERATIONAL EXPENSES | (599,773) | 394 | (599,379) |
| OPERATING INCOME | 405,245 | 394 | 405,639 |
| Income from investments in associates and other companies | 267 | - | 267 |
| Income before tax | 405,512 | 394 | 405,906 |
| Income tax expense | (44,394) | (79) | (44,473) |
| NET INCOME FOR THE PERIOD | 361,118 | 315 | 361,433 |
| Attributable to: | |||
| Bank shareholders | 356,493 | 315 | 356,808 |
| Non-controlling interest | 4,625 | - | 4,625 |
Earnings per share attributable to Bank shareholders: (expressed in Chilean pesos) | |||
| Basic earnings | 1.892 | 0.001 | 1.893 |
| Diluted earnings | 1.892 | 0.001 | 1.893 |
|
NOTE 02
ACCOUNTING CHANGES, continued
The adjustments required by IAS 19 as of December 31, 2011 are detailed below:
| Closing balance as of December 31, 2011 | IAS 19 adjustments | Adjusted balance as of December 31, 2011 | |
| MCh$ | MCh$ | MCh$ | |
| OPERATING INCOME | |||
| Interest income | 1,768,735 | - | 1,768,735 |
| Interest expense | (796,435) | - | (796,435) |
| Net interest income | 972,300 | - | 972,300 |
| Fee and commission income | 363,041 | - | 363,041 |
| Fees and commissions expense | (85,205) | - | (85,205) |
| Net fee and commission income | 277,836 | - | 277,836 |
| Net income from financial operations | 170,857 | - | 170,857 |
| Foreign exchange profit (loss), net | (76,660) | - | (76,660) |
| Other operating income | 18,749 | - | 18,749 |
| Net operating profit before provision for loan losses | 1,363,082 | - | 1,363,082 |
| Provisions for loan losses | (316,137) | - | (316,137) |
| NET OPERATING PROFIT | 1,046,945 | - | 1,046,945 |
| Personnel salaries and expenses | (280,613) | 573 | (280,040) |
| Administrative expenses | (166,825) | - | (166,825) |
| Depreciation and amortization | (53,466) | - | (53,466) |
| Impairment | (116) | - | (116) |
| Other operational expenses | (64,208) | - | (64,208) |
| TOTAL OPERATIONAL EXPENSES | (565,228) | 573 | (564,655) |
| OPERATING INCOME | 481,717 | - | 482,290 |
| Income from investments in associates and other companies | 2,140 | - | 2,140 |
| Income before tax | 483,857 | 573 | 484,430 |
| Income tax expense | (77,193) | (115) | (77,308) |
| NET INCOME FOR THE PERIOD | 406,664 | 458 | 407,122 |
| Attributable to: | |||
| Bank shareholders | 401,733 | 458 | 402,191 |
| Non-controlling interest | 4,931 | - | 4,931 |
Earnings per share attributable to Bank shareholders: (expressed in Chilean pesos) | |||
| Basic earnings | 2.132 | 0.002 | 2.134 |
| Diluted earnings | 2.132 | 0.002 | 2.134 |
|
SIGNIFICANT EVENTS
As of December 31, 2013,2015, the following significant events have occurred and had an impact onaffected the Bank’sBank`s operations on theand Consolidated Financial Statements.
a) The Board
| a) | The Board |
AtIn the Ordinary Board Meeting No. 446of Banco Santander Chile held on August 20, 2013, Mr. Jesús MaríApril 28, 2015, Orlando Poblete Iturrate was confirmed as a Zabalza Lotina presented his resignationDirector, having been previously appointed Alternate Director in the Ordinary Board Meeting on April 22, 2014 and replacing Carlos Olivos Marchant as First Vice-president. During this session,Director since September 23, 2014. Also, Blanca Bustamante Bravo was appointed as Alternate Director.
In the Ordinary Board Meeting dated November 17, 2015 the Board appointed the director Orlando Poblete Iturrate as a member of the Audit Committee of Directors, replacing Lisandro Serrano Spoerer who had resigned in the Ordinary Board Meeting held on October 20, 2015.
| b) | Use of Profits and Distribution of Dividends |
The Shareholders’ Meeting of Banco Santander Chile held on April 28, 2015, was chaired by Mr. Oscar von Chrismar Carvajal as Vice-presidentVittorio Corbo Lioi (Chairman), and Mr.attended by Roberto Méndez Torres (Second Vice President), the Directors: Marco Colodro Hadjes, Lucía Santa Cruz Sutil, Juan Pedro Santa María Pérez, as Regular Director of the Bank.
Use of profit and distribution of dividends
The Ordinary Shareholders’ Meeting of Banco Santander Chile was held on April 29, 2013, chaired by Mr. Mauricio Larraín Garcés (Chairman), and attended by Jesús María Zabalza Lotina (First Vice President), Oscar von Chrismar Carvajal (Second Vice President), Víctor Arbulú Crousillat, Lisandro Serrano Spoerer, Marco Colodro Hadjes, Vittorio Corbo Lioi, Carlos Olivos Marchant, Roberto Méndez Torres, Lucía Santa Cruz Sutil, Roberto Zahler Mayanz Juan Pedro Santa María Pérez, and Raimundo Monge Zegers (Alternate Director).Orlando Poblete Iturrate. Also, the CEO Claudio Melandri Hinojosa and CAO Felipe Contreras Fajardo attended the meeting.
According to the information presented during saidin aforementioned meeting, the2014 net profit of the 2012 period (named as Profit attributable to Bank shareholdersincome (designated in the financial statements) wasstatements as “Income attributable to equity holders of the Bank”) amounted to Ch$387,967 million. 550,331 million, according to local regulations. The Board approved the distribution of 60% of such profit was approved. Such percentage divided by the number of shares issued is equivalent tonet income, yielding a Ch$1.752 dividend of Ch$1,235 pesos per share, payable asstarting on April 29, 2015. Also, it was approved that the remaining 40% of April 30, 2013.the profits will be retained in the Bank’s reserves.
b) Selling of the subsidiary Santander Asset Management S.A. Administradora General de Fondos
| c) | Issuance of bonds - at December 31, 2015 |
In the year ended December 2013, our subsidiary Santander Asset Management S.A. Administradora General de Fondos was sold through a formal offer31, 2015 the Bank has issued senior bonds in the amount of purchase receivedCLP 500,000,000,000, UF 14,000,000 CHF 150,000,000, and JPY 1,200,000,000. Debt issuance information is included in May 2013. The sale price was Ch$90,281 million for 100% of the shares. 99.99% were acquired by SAM Investment Holdings Limited and the remaining 0.01% by Santander Asset Management UK Holdings Limited. This operation generated Ch$78,122 million profit recorded within other operating income. Additionally, the entities entered into a management service agreement for a 10-year period.Note 18.
This transaction was reviewed by independent external evaluators who were of the opinion that the price for the offer was reasonable in consideration of their fair value appraisals. The Audit Committee and the Board of Directors ratified the appraiser’s opinion. On December 5, 2013 an Extraordinary Shareholders’ meeting was held. The offer was accepted and thus, on December 6, 2013 the SBIF was informed of this transaction.
c) Merger by absorption of Santander Servicios de Recaudación y Pagos Limitada
On December 17, 2013, at an Extraordinary Board of Directors meeting, a proposal for consultation was made to merge the subsidiary Santander Servicios de Recaudación y Pagos Ltda. during 2014. The Board approved the merger and commissioned the CEO to present the merger to the SBIF for authorization and for legal procedures to formalize properly.
.
| c.1) | Senior bonds |
| Series | Currency | Amount | Term | Issuance rate | Issuance date | Maturity date |
| P1 | CLP | 50,000,000,000 | 10 years | 5.80% per annum simple | 01-01-2015 | 01-01-2025 |
| P2 | CLP | 100,000,000,000 | 5 years | 5.20% per annum simple | 01-01-2015 | 01-01-2020 |
| P3 | CLP | 50,000,000,000 | 7 years | 5.50% per annum simple | 01-01-2015 | 01-01-2022 |
| P4 | CLP | 150,000,000,000 | 5 years | 4.80% per annum simple | 03-01-2015 | 03-01-2020 |
| P5 | CLP | 150,000,000,000 | 6 years | 5.30% per annum simple | 03-01-2015 | 03-01-2022 |
| Total | CLP | 500,000,000,000 | ||||
| P6 | UF | 3,000,000 | 5 years | 2.25% per annum simple | 03-01-2015 | 03-01-2020 |
| P7 | UF | 3,000,000 | 7.5 years | 2.40% per annum simple | 03-01-2015 | 09-01-2022 |
| P8 | UF | 3,000,000 | 5.5 years | 2.25% per annum simple | 03-01-2015 | 09-01-2020 |
| P9 | UF | 5,000,000 | 10.5 years | 2.60% per annum simple | 03-01-2015 | 09-01-2025 |
| Total | UF | 14,000,000 | ||||
| CHF fixed bond | CHF | 150,000,000 | 7 years | 0.38% quarterly | 04-19-2015 | 10-19-2022 |
| Total | CHF | 150,000,000 | ||||
| JPY current bond | JPY | 1,200,000,000 | 5 years | 0.42% biannually | 12-17-2015 | 12-17-2020 |
| Total | JPY | 1,200,000,000 |
| c.2) | Subordinated bonds |
As at December 31, 2015 the Bank had not issued subordinated bonds in this financial year.
Banco Santander Chile and Subsidiaries |
Notes to the Consolidated Financial Statements |
AS OF DECEMBER 31, 2015 AND 2014 AND FOR THE YEARS ENDED DECEMBER 31, |
OPERATING
SIGNIFICANT EVENTS, continued
| c.3) | Repurchase of bonds |
The Bank has conducted the following repurchase of bonds as of December 31, 2015:
| Date | Series | Amount | |
| 12-01-2015 | Senior bond | USD 19,000,000 |
| c.4) | Mortgage bonds at December 31, 2015 |
As of December 31, 2015 the Bank has issued the following bonds:
| Series | Currency | Amount | Term | Issuance rate | Issuance date | Maturity date |
| AC | CLP | 100,000,000,000 | 10 years | 5,50% per annum simple | 01-01-2015 | 01-01-2025 |
| Total | CLP | 100,000,000,000 |
Banco Santander Chile and Subsidiaries Notes to the Consolidated Financial Statements AS OF DECEMBER 31, 2015 AND 2014 AND FOR THE YEARS ENDED DECEMBER 31, 2015, 2014 AND 2013 |
NOTE 03
REPORTING SEGMENTS
The Bank manages and measures the performance of its operations by operating segment which function under three divisions.business segments. The information disclosed in this note is not necessarily comparable to that of other financial institutions, since it is based on management’s internal information system by segment.
Inter-segment transactions are conducted under normal arm’s length commercial terms and conditions. Each segment’s assets, liabilities, and income include items directly attributable to the segment to which they can be allocated on a reasonable basis.
To achieve the strategic objectives adopted by managementDue to changes aimed at allocating customers to those segments best capable of servicing them, and adapt to changing market conditions,streamlining processes, the Bank makes changeshas modified its internal structure during 2015. This change in its organization fromcomposition of the segments resulted in the following:
| - | Commissions paid in “Net fee and commission income “were reassigned among segments to more appropriately reflect the distributions in accordance with the management of each segment; |
| - | The effects of changes in foreign exchange rates of provisions were reallocated to the line item “Other”, to more appropriately reflect the effects directly attributable to the respective segments; |
| - | The improvement of the allocation of interest costs at time of placement of the loan. |
Under IFRS 8, the Bank has aggregated operating segments with similar economic characteristics according to time, whichthe aggregation criteria specified in turn have a greater or lesserthe standard. A reporting segment consists of clients that are offered differentiated but, considering how their performance is measured, are homogenous services based on IFRS 8 aggregation criteria, thus they form part of the same reporting segment. Overall, this aggregation has no significant impact on how it is managed or administered. Hence, this disclosure furnishes information on how the Bank is managed asunderstanding of December 31, 2013.the nature and effects of the Bank’s business activities and the economic environment.
During the second half ofThe information relating to 2014 and 2013 the Institutional segment was moved from the Individuals and SME Division to the Companies and Institutional Division. All prior years’ segment information has been prepared using the above- mentioned current criteria so that the figures presented under the revised Division definitions.are comparable.
The Bank has the following operating segment falling under each Division headerreportable segments noted below:
Individuals and SMEsRetail Banking
Consists of individuals |
b.Commercial banking
c.Small and mid-sized companiessmall to middle-sized entities (SMEs) with annual income less than Ch$2,000 million. This segment gives customers a variety of services, including consumer loans, credit cards, auto loans, commercial loans, foreign exchange, mortgage loans, debit cards, checking accounts, savings products, mutual funds, stockbrokerage, and insurance brokerage. Additionally the SME clients are offered government-guaranteed loans, leasing and factoring.
Companies and institutionalMiddle-market
ConsidersThis segment is made up of companies and large corporations with annual sales overexceeding Ch$1,2002,000 million. It serves institutions such as universities, government entities, local and regional governments and companies engaged in the real estate industry who carry out projects to sell properties to third parties and annual sales exceeding Ch$800 million upwith no upper limit. The companies within this segment have access to Ch$10,000 million. This segment provides a wide variety ofmany products including commercial loans, leasing, factoring, foreign trade, credit cards, mortgage loans, checking accounts, transactional services, treasury services, financial consulting, savings products, mutual funds, and insurance brokerage. Also companies in the real estate industry are offered specialized services to finance projects, chiefly residential, with the aim of expanding sales of mortgage loans.
Global Corporate Banking
This segment consists of foreign and domestic multinational companies with sales over Ch$10,000 million. The companies within this segment have access to many products including commercial loans, leasing, factoring, foreign trade, credit cards, mortgage loans, checking accounts, transactional services, treasury services, financial consulting, investments, savings products, mutual funds and insurance brokerage.
This segment also consists of a Treasury Division which provides sophisticated financial products, mainly to companies in the Middle-market and Global Corporate Banking segments. These include products such as short-term financing and fund raising, brokerage services, derivatives, securitization, and other tailor-made products. The Treasury area may act as brokers to transactions and also manages the Bank’s investment portfolio.
|
| Banco Santander Chile and Subsidiaries |
Notes to the Consolidated Financial Statements |
AS OF DECEMBER 31, 2015 AND 2014 AND FOR THE YEARS ENDED DECEMBER 31, |
NOTE 0403
OPERATING
REPORTING SEGMENTS, continued
Global Banking and Markets
Corporate Activities (“Other”)
This segment mainly includes the results of our Financial Management Division, which develops global management functions, involving the parent company’s structuralincluding managing inflation rate risk, foreign currency gaps, interest rate risk and liquidity risk. Liquidity risk is managed mainly through wholesale deposits, debt issuances.issuances and the Bank’s available for sale portfolio. This segment also manages the Bank’s personal funds, capital allocation by unit, and the financing of investments made. The foregoingunit. These activities usually resultsresult in a negative contribution to income.
In addition, this segment encompasses all the intra-segment income and all the activities not assigned to a given segment or product with customers.
The segments’ accounting policies are the same as those described in the summary of accounting policies. The Bank earns most of its income in the form of interest income, fee and commission income and income from financial operations. To evaluate a segment’s financial performance and make decisions regarding the resources to be assigned to segments, the Chief Operating Decision Maker (CODM) bases his assessment on the segment's interest income, fee and commission income, and expenses.
|
NOTE 04
OPERATING SEGMENTS, continued
Below are the tables showing the Bank’s results by operatingreporting segment for the years ended December 31, 20132015, 2014 and 20122013 in addition to the corresponding balances of loans and accounts receivable from customers:
| As of December 31, 2013 | |||||||||
| Loans and accounts receivable from customers (1) | Net interest income | Net fee and commission income | Financial transactions, net (2) | Provision for loan losses | Support expenses (3) | Segment’s net contribution | |||
| MCh$ | MCh$ | MCh$ | MCh$ | MCh$ | MCh$ | MCh$ | |||
| Segments | |||||||||
| Individuals+ SMEs | |||||||||
| Santander Banefe | 727,452 | 99,182 | 25,648 | 1,614 | (56,309) | (52,370) | 17,765 | ||
| Commercial Banking | 9,710,249 | 506,192 | 123,496 | 7,118 | (157,697) | (298,173) | 180,936 | ||
| Small and mid-sized companies (SMEs) | 3,223,215 | 260,856 | 37,641 | 4,798 | (101,611) | (79,633) | 122,051 | ||
| Subtotal | 13,660,916 | 866,230 | 186,785 | 13,530 | (315,617) | (430,176) | 320,752 | ||
| Companies and institutional | |||||||||
| Companies | 1,757,586 | 73,906 | 14,020 | 7,457 | (21,364) | (27,947) | 46,072 | ||
| Large Corporations | 1,923,810 | 62,953 | 9,026 | 5,930 | (15,296) | (19,937) | 42,676 | ||
| Real estate | 996,847 | 26,607 | 3,588 | 287 | (5,098) | (6,055) | 19,329 | ||
| Institutional | 353,509 | 30,283 | 2,615 | 562 | 261 | (15,889) | 17,832 | ||
| Subtotal | 5,031,752 | 193,749 | 29,249 | 14,236 | (41,497) | (69,828) | 125,909 | ||
| Subtotal Commercial Banking | 18,692,668 | 1,059,979 | 216,034 | 27,766 | (357,114) | (500,004) | 446,661 | ||
| Global Banking and Markets | |||||||||
| Corporate | 2,219,045 | 63,036 | 16,295 | 9,011 | (14,739) | (19,802) | 53,801 | ||
| Treasury | - | 9,896 | 1,727 | 41,706 | - | (17,926) | 35,403 | ||
| Subtotal | 2,219,045 | 72,932 | 18,022 | 50,717 | (14,739) | (37,728) | 89,204 | ||
| Other | 149,048 | (56,149) | (4,220) | 45,954 | 391 | (20,121) | (34,145) | ||
| Total | 21,060,761 | 1,076,762 | 229,836 | 124,437 | (371,462) | (557,853) | 501,720 | ||
| Other operating income | 88,155 | ||||||||
| Other operating expenses | (52,338) | ||||||||
| Income from investments in associates and other companies | 1,422 | ||||||||
| Income tax expense | (94,530) | ||||||||
| Net income for the year | 444,429 | ||||||||
| As of December 31, 2015 | |||||||
Loans and receivable from customers (1) | Netinterest income
| Net fee and commission income | Financial transactions,net (2) | Provision for loan losses | Support expenses (3) | Segment`s net contribution
| |
| MCh$ | MCh$ | MCh$ | MCh$ | MCh$ | MCh$ | MCh$ | |
| Retail Banking | 17,034,707 | 873,026 | 190,380 | 16,245 | (332,657) | (533,086) | 213,908 |
| Middle-market | 6,006,282 | 229,812 | 28,537 | 17,897 | (26,147) | (77,261) | 172,838 |
| Commercial Banking | 23,040,989 | 1,102,838 | 218,917 | 34,142 | (358,804) | (610,347) | 386,746 |
| Global Corporate Banking | 2,178,643 | 85,553 | 15,231 | 50,327 | (28,426) | (49,533) | 73,152 |
| Other | 81,125 | 66,815 | 3,479 | 61,030 | (12,047) | (1,328) | 117,949 |
| Total | 25,300,757 | 1,255,206 | 237,627 | 145,499 | (399,277) | (661,208) | 577,847 |
| Other operating income | 6,439 | ||||||
| Other operating expenses and impairment | (58,750) | ||||||
| Income from investments in associates and other companies | 2,588 | ||||||
| Income tax expense | (76,395) | ||||||
| Net income for the year | 451,729 | ||||||
| (1) | Corresponds to loans and accounts receivable from customers, without deducting their allowances for loan losses. |
| (2) | Corresponds to the sum of the net income from financial operations and the foreign exchange profit or loss. |
| (3) | Corresponds to the sum of personnel salaries and expenses, administrative expenses, depreciation and amortization. |
(1) Corresponds to loans and accounts receivable from customers, net, without deducting their allowances for loan losses.
(2) Corresponds to the sum of the net income from financial operations and the foreign exchange profit.
(3) Corresponds to the sum of personnel salaries and expenses, administrative expenses, depreciation, amortization, and impairment.
|
| Banco Santander Chile and Subsidiaries |
Notes to the Consolidated Financial Statements |
AS OF DECEMBER 31, 2015 AND 2014 AND FOR THE YEARS ENDED DECEMBER 31, |
NOTE 0403
OPERATING
REPORTING SEGMENTS, continued
Operating segments according to the new segmentation criteria are as follows:
| As of December 31, 2014 | |||||||
Loans and accounts receivable from customers (1) | Net interest income
| Net fee and commission income
| Financial transactions, net (2) | Provision for loan losses
| Support expenses (3) | Segment`s net contribution
| |
| MCh$ | MCh$ | MCh$ | MCh$ | MCh$ | MCh$ | MCh$ | |
| Retail Banking | 15,191,808 | 833,139 | 175,007 | 18,458 | (325,621) | (479,954) | 221,029 |
| Middle-market | 5,443,983 | 200,675 | 27,055 | 16,342 | (22,034) | (66,321) | 155,717 |
| Commercial Banking | 20,635,791 | 1,033,814 | 202,062 | 34,800 | (347,655) | (546,275) | 376,746 |
| Global Corporate Banking | 2,201,913 | 71,992 | 22,338 | 42,186 | 1,924 | (44,195) | 94,245 |
| Other | 54,945 | 211,298 | 2,883 | 35,579 | (9,172) | 2,261 | 242,849 |
| Total | 22,892,649 | 1,317,104 | 227,283 | 112,565 | (354,903) | (588,209) | 713,840 |
| Other operating income | 6,545 | ||||||
| Other operating expenses and impairment | (95,610) | ||||||
| Income from investments in associates and other companies | 2,165 | ||||||
| Income tax expense | (51,050) | ||||||
| Net income for the year | 575,890 | ||||||
| As of December 31, 2012 (*) | |||||||||
| Loans and accounts receivable from customers (1) | Net interest income | Net fee and commission income | Financial transactions, net (2) | Provision for loan losses | Support expenses (3) | Segment’s net contribution | |||
| MCh$ | MCh$ | MCh$ | MCh$ | MCh$ | MCh$ | MCh$ | |||
| Segments | |||||||||
| Individuals +SMEs | |||||||||
| Santander Banefe | 730,362 | 123,043 | 33,853 | 1,288 | (73,882) | (51,797) | 32,505 | ||
| Commercial Banking | 8,941,860 | 499,422 | 141,946 | 8,613 | (229,958) | (291,562) | 128,461 | ||
| Small and mid-sized companies (SMEs) | 2,890,251 | 233,622 | 38,115 | 5,009 | (80,144) | (76,560) | 120,042 | ||
| Subtotal | 12,562,473 | 856,087 | 213,914 | 14,910 | (383,984) | (419,919) | 281,008 | ||
| Companies and institutional | |||||||||
| Companies | 1,626,606 | 70,747 | 13,885 | 5,118 | (21,531) | (26,672) | 41,547 | ||
| Large Corporations | 1,661,837 | 56,086 | 8,722 | 5,623 | (3,361) | (17,958) | 49,112 | ||
| Real estate | 770,250 | 21,344 | 3,296 | 321 | 706 | (5,745) | 19,922 | ||
| Institutional | 355,518 | 28,472 | 2,470 | 615 | (346) | (15,297) | 15,914 | ||
| Subtotal | 4,414,211 | 176,649 | 28,373 | 11,677 | (24,532) | (65,672) | 126,495 | ||
| Subtotal Commercial Banking | 16,976,684 | 1,032,736 | 242,287 | 26,587 | (408,516) | (485,591) | 407,503 | ||
| Global Banking and Markets | |||||||||
| Corporate | 1,863,595 | 57,822 | 16,832 | 763 | 5,546 | (17,564) | 63,399 | ||
| Treasury | - | (7,345) | 2,327 | 51,514 | - | (17,912) | 28,584 | ||
| Subtotal | 1,863,595 | 50,477 | 19,159 | 52,277 | 5,546 | (35,476) | 91,983 | ||
| Other | 126,373 | (40,479) | 9,126 | 3,435 | (722) | (18,675) | (47,315) | ||
| Total | 18,966,652 | 1,042,734 | 270,572 | 82,299 | (403,692) | (539,742) | 452,171 | ||
| Other operating income | 13,105 | ||||||||
| Other operating expenses | (59,637) | ||||||||
| Income from investments in associates and other companies | 267 | ||||||||
| Income tax expense | (44,473) | ||||||||
| Net income for the year | 361,433 | ||||||||
| (1) | Corresponds to loans and accounts receivable from customers, without deducting their allowances for loan losses. |
| (2) | Corresponds to the sum of the net income from financial operations and the foreign exchange profit or loss. |
| (3) | Corresponds to the sum of personnel salaries and expenses, administrative expenses, depreciation and amortization. |
(1) Corresponds to loans and accounts receivable from customers, net without deducting their allowances for loan losses.
(2) Corresponds to the sum of the net income from financial operations and the foreign exchange profit.
(3) Corresponds to the sum of personnel salaries and expenses, administrative expenses, depreciation, amortization, and impairment.
(*) Adjusted for comparative purposes, as previously described in Note 02.
|
| Banco Santander Chile and Subsidiaries |
Notes to the Consolidated Financial Statements |
AS OF DECEMBER 31, 2015 AND 2014 AND FOR THE YEARS ENDED DECEMBER 31, |
NOTE 0403
OPERATING
REPORTING SEGMENTS, continued
Operating segments according to the new segmentation criteria are as follows:
| As of December 31, 2013 | |||||||
Loans and accounts receivable from customers (1) | Net interest income
| Net fee and commission income
| Financial transactions, net (2) | Provision for loan losses
| Support expenses (3) | Segment`s
| |
| MCh$ | MCh$ | MCh$ | MCh$ | MCh$ | MCh$ | MCh$ | |
| Retail Banking | 13,703,528 | 865,220 | 184,766 | 13,529 | (315,982) | (435,837) | 311,696 |
| Middle-market | 5,035,780 | 193,454 | 29,199 | 14,236 | (41,064) | (62,817) | 133,008 |
| Commercial Banking | 18,739,308 | 1,058,674 | 213,965 | 27,765 | (357,046) | (498,654) | 444,704 |
| Global Corporate Banking | 2,268,440 | 72,659 | 17,432 | 50,717 | (14,697) | (38,270) | 87,841 |
| Other | 53,013 | (54,571) | (1,561) | 45,955 | 281 | (20,685) | (30,581) |
| Total | 21,060,761 | 1,076,762 | 229,836 | 124,437 | (371,462) | (557,609) | 501,964 |
| Other operating income | 88,155 | ||||||
| Other operating expenses and impairment | (52,582) | ||||||
| Income from investments in associates and other companies | 1,422 | ||||||
| Income tax expense | (94,530) | ||||||
| Net income for the year | 444,429 | ||||||
| (1) | Corresponds to loans and accounts receivable from customers, without deducting their allowances for loan losses. |
| (2) | Corresponds to the sum of the net income from financial operations and the foreign exchange profit or loss. |
| (3) | Corresponds to the sum of personnel salaries and expenses, administrative expenses, depreciation and amortization. |
| As of December 31, 2011 (*) | ||||||||
| Loans and accounts receivable from customers (1) | Net interest income | Net fee and commission income | Financial transactions, net (2) | Provision for loan losses | Support expenses (3) | Segment’s net contribution | ||
| MCh$ | MCh$ | MCh$ | MCh$ | MCh$ | MCh$ | MCh$ | ||
| Segments | ||||||||
| Individuals + SMEs | ||||||||
| Santander Banefe | 804,852 | 117,154 | 37,206 | 275 | (62,252) | (70,719) | 21,664 | |
| Commercial Banking | 8,484,493 | 453,139 | 149,970 | 8,820 | (185,885) | (251,554) | 174,490 | |
| Small and mid-sized companies (SMEs) | 2,560,736 | 207,008 | 38,274 | 9,577 | (65,028) | (74,962) | 114,869 | |
| Subtotal | 11,850,081 | 777,301 | 225,450 | 18,672 | (313,165) | 397,235 | 311,023 | |
| Companies and institutional | ||||||||
| Companies | 1,583,895 | 65,499 | 12,785 | 7,134 | (10,080) | (22,698) | 52,640 | |
| Large Corporations | 1,470,447 | 56,467 | 8,594 | 5,669 | (1,212) | (13,496) | 56,022 | |
| Real estate | 596,367 | 18,852 | 2,931 | 624 | (300) | (4,486) | 17,621 | |
| Institutional | 355,199 | 26,856 | 1,831 | 859 | 503 | (11,329) | 18,720 | |
| Subtotal | 4,005,908 | 167,674 | 26,141 | 14,286 | (11,089) | (52,009) | 145,003 | |
| Subtotal Commercial Banking | 15,855,989 | 944,975 | 251,591 | 32,958 | (324,254) | (449,244) | 456,026 | |
| Global Banking and Markets | ||||||||
| Corporate | 1,479,838 | 64,845 | 30,745 | 1,368 | 7,614 | (13,790) | 90,782 | |
| Treasury | 14,914 | (15,903) | 1,163 | 67,162 | - | (21,512) | 30,910 | |
| Subtotal | 1,494,752 | 48,942 | 31,908 | 68,530 | 7,614 | (35,302) | 121,692 | |
| Other | 84,041 | (21,617) | (5,663) | (7,291) | 503 | (15,901) | (49,969) | |
| Total | 17,434,782 | 972,300 | 277,836 | 94,197 | (316,137) | (500,447) | 527,749 | |
| Other operating income | 18,749 | |||||||
| Other operating expenses | (64,208) | |||||||
| Income from investments in associates and other companies | 2,140 | |||||||
| Income tax expense | (77,308) | |||||||
| Net income for the year | 407,122 | |||||||
CASH AND CASH EQUIVALENTS
The
Cash items in process of collection and in process of being cleared represent domestic transactions
TRADING INVESTMENTS
The detail of instruments deemed as financial trading investments is as follows:
As of December 31,
INVESTMENTS UNDER RESALE AGREEMENTS AND OBLIGATIONS UNDER REPURCHASE AGREEMENTS
The Bank purchases financial instruments agreeing to resell them at a future date. As of December 31,
NOTE INVESTMENTS UNDER RESALE AGREEMENTS AND OBLIGATIONS UNDER REPURCHASE AGREEMENTS, continued
The Bank raises funds by selling financial instruments and committing itself to buy them back at future dates, plus interest at a predetermined rate. As of December 31,
NOTE INVESTMENTS UNDER RESALE AGREEMENTS AND OBLIGATIONS UNDER REPURCHASE AGREEMENTS, continued
DERIVATIVE FINANCIAL INSTRUMENTS AND HEDGE ACCOUNTING
NOTE DERIVATIVE FINANCIAL INSTRUMENTS AND HEDGE ACCOUNTING, continued
NOTE DERIVATIVE FINANCIAL INSTRUMENTS AND HEDGE ACCOUNTING, continued
Fair value hedge:
The Bank uses cross-currency swaps and interest rate
Below is a detail of the hedged elements and hedge instruments under fair value hedges as of December 31,
NOTE DERIVATIVE FINANCIAL INSTRUMENTS AND HEDGE ACCOUNTING, continued
Cash flow hedges
The Bank uses cross currency swaps to hedge the risk from variability of cash flows attributable to changes in the interest rates of bonds and interbank loans at a variable rate. To cover the inflation risk in some items, both forwards as well as currency swaps are used.
Below is the notional amount of the hedged items as of December 31,
NOTE DERIVATIVE FINANCIAL INSTRUMENTS AND HEDGE ACCOUNTING, continued
Below is an estimate of the periods in which flows are expected to be produced:
(*)Only includes cash flow forecast portion of the hedge instruments used to cover interest rate risk.
(*)Only includes cash flow forecast portion of the hedge instruments used to cover interest rate risk.
NOTE DERIVATIVE FINANCIAL INSTRUMENTS AND HEDGE ACCOUNTING, continued
NOTE 07 DERIVATIVE FINANCIAL INSTRUMENTS AND HEDGE ACCOUNTING, continued
Since the inflows and outflows for both the hedged element and the hedging instrument mirror each other, the hedges are nearly 100% effective, which means that the fluctuations of fair value attributable to risk components are almost completely offset.
During the year, the Bank did not have any cash flow hedges of forecast transactions.
NOTE 07 DERIVATIVE FINANCIAL INSTRUMENTS AND HEDGE ACCOUNTING, continued
See Note 23 - Equity, letter e)
As of December 31,
INTERBANK LOANS
LOANS AND ACCOUNTS RECEIVABLE FROM CUSTOMERS
As of December 31,
NOTE LOANS AND ACCOUNTS
NOTE LOANS AND ACCOUNTS
As of December 31,
NOTE LOANS AND ACCOUNTS
NOTE LOANS AND ACCOUNTS
The changes in allowance balances during
NOTE LOANS AND ACCOUNTS
Recoveries of loans previously charged off are recognized as income in the line item “Provision for loans losses”. We only recognize as a recovery interest and/or principal paid in cash in connection with a loan that has already been charged-off in its entirety. Such recoveries do not have an impact on our allowance for loan losses as these recoveries are for loans that have been already charged-off and recognized as a loss in our income statement and are no longer on-balance sheet.
The following chart shows the balance of allowances established, associated with credits granted to customers and banks:
NOTE LOANS AND ACCOUNTS
NOTE 09 LOANS AND ACCOUNTS RECEIVABLE FROM CUSTOMERS, continued
NOTE 09 LOANS AND ACCOUNTS RECEIVABLE FROM CUSTOMERS, continued
Reconciliation of overdue loans with non-performing loans
NOTE 10
AVAILABLE FOR SALE INVESTMENTS
As of December 31,
As of December 31,
As of December 31,
As of December 31, As of December 31, 2014 available for sale investments included a cumulative net unrealized profit of Ch$
NOTE 10
AVAILABLE FOR SALE INVESTMENTS, continued
Gross profits and losses realized on the sale of available for sale
The Bank evaluated those instruments with unrealized losses as of December 31,
NOTE AVAILABLE FOR SALE INVESTMENTS, continued
The following charts show the available for sale investments cumulative unrealized profit and loss, as of December 31,
As of December 31,
NOTE AVAILABLE FOR SALE INVESTMENTS, continued
As of December 31,
INVESTMENTS IN ASSOCIATES AND OTHER COMPANIES
NOTE INVESTMENTS IN ASSOCIATES AND OTHER COMPANIES, continued
There are no significant restrictions regarding the capacity of associates to transfer funds, whether in cash dividends, refund of loans, or advance payments to the Bank.
INTANGIBLE ASSETS
NOTE INTANGIBLE ASSETS, continued
PROPERTY, PLANT, AND EQUIPMENT
NOTE PROPERTY, PLANT, AND EQUIPMENT, continued
NOTE PROPERTY, PLANT, AND EQUIPMENT, continued
As of December 31,
Certain Bank’s premises and equipment are leased under various operating leases. Future minimum rental payments under non-cancellable leases are as follows:
CURRENT AND DEFERRED TAXES
As of December 31,
(*)The tax rate is 22.5% for 2015 and 21% for 2014.
The effect of tax expense on income for the years ended December 31,
NOTE CURRENT AND DEFERRED TAXES,
The reconciliation between the income tax rate and the effective rate applied in determining tax expenses as of December 31,
Below is a summary of the separate effect of deferred tax on
F-79
NOTE CURRENT AND DEFERRED TAXES, continued
As of
Below are the effects of deferred taxes on assets, liabilities and
Below is a summary of the deferred taxes impact on equity and income.
OTHER ASSETS
Other assets item includes the following:
TIME DEPOSITS AND OTHER TIME LIABILITIES
As of December 31,
INTERBANK BORROWINGS
As of December 31,
NOTE INTERBANK BORROWINGS, continued
NOTE 17 INTERBANK BORROWINGS, continued
Debts to the Central Bank of Chile include credit lines for renegotiation of loans and other borrowings. These credit lines were provided by the Central Bank of Chile for renegotiation of loans due to the need to refinance debt as a result of the economic recession and crisis of the banking system in the early 1980s.
The outstanding amounts owed to the Central Bank of Chile under these credit lines are as follows:
These obligations’ maturities are as follows:
ISSUED DEBT INSTRUMENTS AND OTHER FINANCIAL LIABILITIES
As of December 31,
Debts classified as current are either demand obligations or will mature in one year or less. All other debts are classified as non-current. The Bank’s debts, both current and non-current, are summarized below:
NOTE ISSUED DEBT INSTRUMENTS AND OTHER FINANCIAL LIABILITIES, continued
These bonds are used to finance mortgage loans. Their principal amounts are amortized on a quarterly basis. The range of maturities of these bonds is between five and twenty years. Loans are indexed to UF and create a yearly interest
The following table shows senior bonds by currency:
NOTE ISSUED DEBT INSTRUMENTS AND OTHER FINANCIAL LIABILITIES, continued
In
During
NOTE ISSUED DEBT INSTRUMENTS AND OTHER FINANCIAL LIABILITIES, continued
In
During
As of December 31,
NOTE ISSUED DEBT INSTRUMENTS AND OTHER FINANCIAL LIABILITIES, continued
Detail of mortgage bonds per currency is as follows:
During 2015, the Bank has not placed any mortgage bonds.
The maturities of
Detail of the subordinated bonds per currency is as follows:
NOTE ISSUED DEBT INSTRUMENTS AND OTHER FINANCIAL LIABILITIES, continued
| |||||||||||||||||||||||||||||||||||||||||||||||||||||||||||||||||||||||||||||||||||||||||||||||||||||||||||||||||||||||||||||||||||||||||||||||||||||||||||||||||||||||||||||||||||||||||||||||||||||||||||||||||||||||||||||||||||||||||||||||||||||||||||||||||||||||||||||||||||||||||||||||||||||||||||||||||||||||||||||||||||||||||||||||||||||||||||||||||||||||||||||||||||||||||||||||||||||||||||||||||||||||||||||||||||||||||||||||||||||||||||||||||||||||||||||||||||||||||||||||||||||||||||||||||||||||||||||||||||||||||||||||||||||||||||||||||||||||||||||||||||||||||||||||||||||||||||||||||||||||||||||||||||||||||||||||||||||||||||||||||||||||||||||||||||||||||||||||||||||||||||||||||||||||||||||||||||||||||||||||||||||||||||||||||||||||||||||||||||||||||||||||||||||||||||||||||||||||||||||||||||||||||||||||||||||||||||||||||||||||||||||||||||||||||||||||||||||||||||||||||||||||||||||||||||||||||||||||||||||||||||||||||||||||||||||||||||||||||||||||||||||||||||||||||||||||||||||||||||||||