0001604481false2020FYP1Y33.3333.3333.3333.3333.3333.3333.3333.3333.33P6M.0333.333.333.3333.3333.3323433.3333.3333.3323433.3333.3333.332342525258.338.338.33P1Y
UNITED STATES
SECURITIES AND EXCHANGE COMMISSION
Washington, D.C. 20549
FORM 20-F
(Mark One)
|
| | | | |
| [ ] | REGISTRATION STATEMENT PURSUANT TO SECTION 12(b) OR (g) OF THE SECURITIES EXCHANGE ACT OF 1934 |
OR
|
| | | | |
| [X] | ANNUAL REPORT PURSUANT TO SECTION 13 OR 15(d) OF THE SECURITIES EXCHANGE ACT OF 1934 |
| |
| For the fiscal year ended December 31, 2017 2020 |
OR
|
| | | | |
| [ ] | TRANSITION REPORT PURSUANT TO SECTION 13 OR 15(d) OF THE SECURITIES EXCHANGE ACT OF 1934 |
| |
| For the transition period from _________________ to _________________ |
OR
|
| | | | |
| [ ] | SHELL COMPANY REPORT PURSUANT TO SECTION 13 OR 15(d) OF THE SECURITIES EXCHANGE ACT OF 1934 |
| |
| Date of event requiring this shell company report _________________ |
Commission file number 001-36810
|
| |
| EURONAV NV |
| (Exact name of Registrant as specified in its charter) |
|
| |
| (Translation of Registrant's name into English) |
|
| |
| Belgium |
| (Jurisdiction of incorporation or organization) |
|
| |
| De Gerlachekaai 20, 2000 Antwerpen, Belgium |
| (Address of principal executive offices) |
|
| |
Hugo De Stoop, Tel: +32-3-247-4411, management@euronav.com, De Gerlachekaai 20, 2000 Antwerpen, Belgium |
| (Name, Telephone, E-mail and/or Facsimile, and address of Company Contact Person) |
Securities registered or to be registered pursuant to section 12(b) of the Act.
|
| | | | | | | |
| Title of each class | Trading symbol(s) | Name of each exchange on which registered |
Ordinary Shares, no par value CUSIP B38564108
| EURN | New York Stock Exchange |
Securities registered or to be registered pursuant to section 12(g) of the Act.
* Not for trading, but only in connection with the registration of American Depositary Shares, pursuant to the requirements of the Securities and Exchange Commission.
Securities for which there is a reporting obligation pursuant to Section 15(d) of the Act.
Indicate the number of outstanding shares of each of the issuer's classes of capital or common stock as of the close of the period covered by the annual report.
As of December 31, 2017, the issuer had 159,208,949220,024,713 ordinary shares, no par value outstanding.
Indicate by check mark if the registrant is a well-known seasoned issuer, as defined in Rule 405 of the Securities Act.
If this report is an annual or transition report, indicate by check mark if the registrant is not required to file reports pursuant to Section 13 or 15(d) of the Securities Exchange Act of 1934.
Note – Checking the box above will not relieve any registrant required to file reports pursuant to Section 13 or 15(d) of the Securities Exchange Act of 1934 from their obligations under those Sections.
Indicate by check mark whether the registrant (1) has filed all reports required to be filed by Section 13 or 15(d) of the Securities Exchange Act of 1934 during the preceding 12 months (or for such shorter period that the registrant was required to file such reports), and (2) has been subject to such filing requirements for the past 90 days.
Indicate by check mark whether the registrant has submitted electronically and posted on its corporate Web site, if any, every Interactive Data File required to be submitted and posted pursuant to Rule 405 of Regulation S-T (§232.405 of this chapter) during the preceding 12 months (or for such shorter period that the registrant was required to submit and post such files).
Indicate by check mark whether the registrant is a large accelerated filer, an accelerated filer or, a non-accelerated filer.filer or an emerging growth company.. See the definitions of "large accelerated filer","accelerated filer", and "accelerated filer""emerging growth company" in Rule 12b-2 of the Exchange Act. (Check one):
|
| | | | | | | | | | | | | | | | | | | | | | |
| Large accelerated filer x | | Accelerated filer ☐ | | Non-accelerated filer ☐ | | Emerging growth company ☐ |
If an emerging growth company that prepares its financial statements in accordance with U.S. GAAP, indicate by check mark if the registrant has elected not to use the extended transition period for complying with any new or revised financial accounting standards† provided pursuant to Section 13(a) of the Exchange Act. ☐
† The term “new or revised financial accounting standard” refers to any update issued by the Financial Accounting Standards Board to its Accounting Standards Codification after April 5, 2012.
Indicate by check mark whether the registrant has filed a report on and attestation to its management’s assessment of the effectiveness of its internal control over financial reporting under Section 404(b) of the Sarbanes-Oxley Act (15 U.S.C. 7262(b)) by the registered public accounting firm that prepared or issued its audit report: x
Indicate by check mark which basis of accounting the registrant has used to prepare the financial statements included in this filing:
|
| | | | | | | |
| X | | International Financial Reporting Standards as issued by the internationalInternational Accounting Standards Board |
If "Other" has been checked in response to the previous question, indicate by check mark which financial statement item the registrant has elected to follow:
If this is an annual report, indicate by check mark whether the registrant is a shell company (as defined in Rule 12b-2 of the Exchange Act).
CAUTIONARY STATEMENT REGARDING FORWARD-LOOKING STATEMENTS
Matters discussed in this report may constitute forward-looking statements. The Private Securities Litigation Reform Act of 1995 provides safe harbor protections for forward-looking statements in order to encourage companies to provide prospective information about their business. Forward-looking statements include statements concerning plans, objectives, goals, strategies, future events or performance, and underlying assumptions and other statements, which are other than statements of historical facts.
We desire to take advantage of the safe harbor provisions of the Private Securities Litigation Reform Act of 1995 and are including this cautionary statement in connection therewith. This report and any other written or oral statements made by us or on our behalf may include forward-looking statements, which reflect our current views with respect to future events and financial performance, and are not intended to give any assurance as to future results. When used in this document, the words "believe," "expect," "anticipate," "estimate," "intend," "plan," "target," "project," "likely," "may," "will," "would," "could"“believe,” “expect,” “anticipate,” “estimate,” “intend,” “seek”, “plan,” “target,” “project,” “potential”, “continue”, “contemplate”, “possible”, “likely,” “may,” “might”, “will,” “would,” “could” and similar expressions, terms, or phrases may identify forward-looking statements.
These forward-looking statements are not historical facts, but rather are based on current expectations, estimates, assumptions and projections about the business and our future financial results and readers should not place undue reliance on them. The forward-looking statements in this report are based upon various assumptions, many of which are based, in turn, upon further assumptions, including without limitation, management'smanagement’s examination of historical operating trends, data contained in our records and other data available from third parties. Although we believe that these assumptions were reasonable when made, because these assumptions are inherently subject to significant uncertainties and contingencies which are difficult or impossible to predict and are beyond our control, we cannot assure you that we will achieve or accomplish these expectations, beliefs or projections.
In addition to important factors and matters discussed elsewhere in this report, and in the documents incorporated by reference herein, important factors that, in our view, could cause our actual results and developments to differ materially from those discussed in the forward-looking statements include:
•the strength of world economies and currencies;
•fluctuations in interest rates and foreign exchange rates;
•general market conditions, including the market for crude oil and for our vessels, fluctuations in charter rates and vessel values;
•availability of financing and refinancing;refinancing, as well as the Company’s ability to obtain such financing or refinancing in the future;
•our business strategy and other plans and objectives for growth and future operations;
•our ability to successfully employ our existing and newbuilding vessels;
•planned capital expenditures and availability of capital resources to fund capital expenditures;
•planned, pending or recent acquisitions, business strategy and expected capital spending or operating expenses, including drydocking, surveys, upgrades and insurance costs;
•our ability to realize the expected benefits from acquisitions;
•potential liability from pending or future litigation;litigations;
•general domestic and international political conditions;conditions, including trade wars and disagreements between oil producing countries;
•potential disruption of shipping routes due to accidents or political events;
•the length and severity of the ongoing coronavirus (“COVID-19”) outbreak and governmental response thereto, including its impacts across our business on demand for our vessels, our global operations, counterparty risk as well as its disruption to the global economy;
•vessel breakdowns and instances of off-hire;
•competition within our industry;
•the supply of and demand for vessels comparable to ours;
•corruption, piracy, militant activities, political instability, terrorism and ethnic unrest in locations where we may operate;
•delays and cost overruns in construction projects;
•our level of indebtedness;
•the impact of the discontinuance of the London Interbank Offered Rate, or LIBOR, after 2021 on interest rates of our debt that reference LIBOR;
•our ability to obtain financing and comply with the restrictive and other covenants in our financing arrangements;
•our need forability to generate cash to meet our debt service obligations;
•our levels of operating and maintenance costs, including bunker prices, drydocking and insurance costs;
the possibility that the Merger (as defined herein) does not close when expected or at all because required shareholder approval is not received or other conditions to the closing are not satisfied on a timely basis or at all;
that we and Gener8 (as defined herein) may be required to modify the terms and conditions of the Merger Agreement to achieve Gener8 shareholder approval, which is required prior to the Closing of the Merger;
following the successful closing of the Merger, the anticipated benefits of the Merger are not realized within the expected timeframe or at all, including as a result of, among other things, the weakness of the economy and competitive factors in the seaborne transportation in which we and Gener8 do business;
the ability to successfully integrate Euronav and Gener8;
•reputational risks;
•availability of skilled workers and the related labor costs;
•compliance with governmental, tax, environmental and safety regulationregulations and related costs;
•Environmental, Social and Governance (ESG) expectations of investors, banks and other stakeholders and related costs related to compliance with ESG measures;
•any non-compliance with the amendments by the International Maritime Organization, the United Nations agency for maritime safety and the prevention of pollution by vessels, or IMO, (the amendments hereinafter referred to as IMO 2020), to Annex VI to the International Convention for the Prevention of Pollution from Ships, 1973, as modified by the Protocol of 1978 relating thereto, collectively referred to as MARPOL 73/78 and herein as MARPOL, which will reduce the maximum amount of sulfur that vessels may emit into the air and applies to us as of January 1, 2020;
•any non-compliance with the International Convention for the Control and Management of Ships' Ballast Water and Sediments or BWM which applies to us as of September 2019;
•any non-compliance with the European Ship Recycling regulation for large commercial seagoing vessels flying the flag of an European Union or EU, Member State which forces shipowners to recycle their vessels only in safe and sound vessel recycling facilities included in the European List of ship recycling facilities which is applicable as of January 1, 2019;
•any non-compliance with the U.S. Foreign Corrupt Practices Act of 1977 (FCPA)or FCPA, or other applicable regulations relating to bribery;
•our incorporation under the laws of Belgium and the different rights to relief that may be available compared to other counties, including the United States;
•treatment of the Company as a “passive foreign investment company” by U.S. tax authorities;
•being required to pay taxes on U.S. source income;
•general economic conditions and conditions in the oil and natural gas industry;
•effects of new products and new technology in our industry;
•the failure to protect our information systems against security breaches, or the failure or unavailability of these systems for a significant period of time;
•the failure of counterparties to fully perform their contracts with us;
•our dependence on key personnel;
•adequacy of insurance coverage;
•our ability to obtain indemnities from customers;
•changes in laws, treaties or regulations; and
•the volatility of the price of our ordinary shares; and
•other factors that may affect future results of Euronav or Gener8.Euronav.
These factors and the other risk factors described in this annual report and other reports that we furnish or file with the U.S. Securities and Exchange Commission (the “SEC”)or the SEC, are not necessarily all of the important factors that could cause actual results or developments to differ materially from those expressed in any of our forward-looking statements. Other unknown or unpredictable factors also could harm our results. Consequently, there can be no assurance that actual results or developments anticipated by us will be realized or, even if substantially realized, that they will have the expected consequences to, or effects on, us. These forward looking statements are made only as of the date of this annual report. These forward looking statements are not guarantees of our future performance, and actual results and developments may vary materially from those projected in the forward looking statements. Given these uncertainties, prospective investors are cautioned not to place undue reliance on such forward-looking statements. We undertake no obligation, and specifically decline any obligation, except as required by law, to publicly update or revise any forward-looking statements, whether as a result of new information, future events or otherwise.
PART I
ITEM 1. IDENTITY OF DIRECTORS, SENIOR MANAGEMENT AND ADVISERS
Not applicable.
ITEM 2. OFFER STATISTICS AND EXPECTED TIMETABLE
Not applicable.
ITEM 3. KEY INFORMATION
Throughout this report, all references to "Euronav,""Euronav", the "Company," "we," "our,""Company", "we", "our", and "us" refer to Euronav NV and its subsidiaries and all references to “Euronav NV” refer to Euronav NV and not to its subsidiaries. Unless otherwise indicated, all references to "U.S. dollars," "USD," "dollars,"dollars", "USD", "dollars", "US$" and "$" in this annual report are to the lawful currency of the United States of America and references to "Euro," "EUR,""Euro", "EUR", and "€" are to the lawful currency of Belgium.
We refer to our "U.S. Shares" as those shares of Euronav with no par value that are reflected in the U.S. component of our share register, or the U.S. Register, that is maintained by Computershare Trust Company N.A, or Computershare, our U.S. transfer agent and registrar, and are formatted for trading on the New York Stock Exchange, or the NYSE. The U.S. Shares are identified by CUSIP B38564 108. We refer to our "Belgian Shares" as those shares of Euronav with no par value that are reflected in the Belgian component of our share register, or the Belgian Register, that is maintained by De Interprofessionele Effectendeposito- en Girokas (CIK) NV (acting under the commercial name Euroclear Belgium), or Euroclear Belgium, our agent, and are formatted for trading on Euronext Brussels. The Belgian Shares are identified by ISIN BE0003816338. Our U.S. Shares and our Belgian Shares taken together are collectively referred to as our "ordinary shares." For further discussion of the maintenance of our share register, please see "Item 10. Additional Information —B. Memorandum and Coordinated Articles of Association—Share Register."
A.Selected Financial Data
The following tables set forth, in each case for the periods and as of the dates indicated, our selected consolidated financial data and other operating data as of and for the years ended December 31, 2020, 2019, 2018, 2017 2016 2015, 2014 and 2013.2016. The selected data is derived from our audited consolidated financial statements, except where noted, which have been prepared in accordance with International Financial Reporting Standards, or IFRS, as issued by the International Accounting Standards Board, or IASB. The selected historical financial information presented in the tables below should be read in conjunction with and is qualified in its entirety by reference to our audited consolidated financial statements and the accompanying notes. The audited consolidated financial statements and the accompanying notes as of December 31, 20172020 and December 31, 20162019 and for the years ended December 31, 2017, 20162020, 2019 and 20152018 are included in this annual report.
| | | | | | | | | | | | | | | | | | | | | | | | | | | | | | | | |
| | Year Ended December 31, |
| Consolidated Statement of Profit or Loss Data | | 2020 | | 2019 | | 2018* | | 2017* | | 2016* |
| (USD in thousands, except per share data) | |
| Revenue | | 1,230,750 | | | 932,377 | | | 600,024 | | | 513,368 | | | 684,265 | |
| Gains on disposal of vessels/other tangible assets | | 22,728 | | | 14,879 | | | 19,138 | | | 36,538 | | | 50,397 | |
| Other operating income | | 10,112 | | | 10,094 | | | 4,775 | | | 4,902 | | | 6,996 | |
| Voyage expenses and commissions | | (125,430) | | | (144,681) | | | (141,416) | | | (62,035) | | | (59,560) | |
| Vessel operating expenses | | (210,634) | | | (211,795) | | | (185,792) | | | (150,427) | | | (160,199) | |
| Charter hire expenses | | (7,954) | | | (604) | | | (31,114) | | | (31,173) | | | (17,713) | |
| Losses on disposal of vessels | | (1) | | | (75) | | | (273) | | | (21,027) | | | (2) | |
| Impairment on non-current assets held for sale | | — | | | — | | | (2,995) | | | — | | | — | |
| Loss on disposal of investments in equity accounted investees | | — | | | — | | | — | | | — | | | (24,150) | |
| Depreciation tangible assets | | (319,652) | | | (337,646) | | | (270,582) | | | (229,777) | | | (227,664) | |
| Depreciation intangible assets | | (99) | | | (56) | | | (111) | | | (95) | | | (99) | |
| General and administrative expenses | | (65,498) | | | (66,890) | | | (66,232) | | | (46,868) | | | (44,051) | |
| Result from operating activities | | 534,322 | | | 195,603 | | | (74,578) | | | 13,406 | | | 208,220 | |
| Finance income | | 21,496 | | | 20,572 | | | 15,023 | | | 7,266 | | | 6,855 | |
| Finance expenses | | (91,553) | | | (119,803) | | | (89,412) | | | (50,729) | | | (51,695) | |
| Net finance expense | | (70,057) | | | (99,231) | | | (74,389) | | | (43,463) | | | (44,840) | |
| Gain on bargain purchase | | — | | | — | | | 23,059 | | | — | | | — | |
| Share of profit (loss) of equity accounted investees (net of income tax) | | 10,917 | | | 16,460 | | | 16,076 | | | 30,082 | | | 40,495 | |
| Profit (loss) before income tax | | 475,182 | | | 112,832 | | | (109,832) | | | 25 | | | 203,875 | |
| Income tax benefit/(expense) | | (1,944) | | | (602) | | | (238) | | | 1,358 | | | 174 | |
| Profit (loss) for the period | | 473,238 | | | 112,230 | | | (110,070) | | | 1,383 | | | 204,049 | |
| Attributable to: | | | | | | | | | | |
| Owners of the Company | | 473,238 | | | 112,230 | | | (110,070) | | | 1,383 | | | 204,049 | |
| Basic earnings per share | | 2.25 | | | 0.52 | | | (0.57) | | | 0.01 | | | 1.29 | |
| Diluted earnings per share | | 2.25 | | | 0.52 | | | 0.01 | | | 0.01 | | | 1.29 | |
| Dividends per share declared | | 1.40 | | | 0.35 | | | 0.12 | | | 0.12 | | | 0.77 | |
* We have initially applied IFRS 16 at January 1, 2019, using the modified retrospective approach. Under this approach, comparative information is not restated. We initially applied IFRS 15 and IFRS 9 at January 1, 2018. Under the transition methods chosen, comparative information is not restated.
|
| | | | | | | | | | | | | | | |
| | | Year Ended December 31, |
| Consolidated Statement of Profit or Loss Data | | 2017 | | 2016 | | 2015 | | 2014 | | 2013 |
| (US$ in thousands, except per share data) | |
| Revenue | | 513,368 |
| | 684,265 |
| | 846,507 |
| | 473,985 |
| | 304,622 |
|
| Gains on disposal of vessels/other tangible assets | | 36,538 |
| | 50,397 |
| | 13,302 |
| | 13,122 |
| | 8 |
|
| Other operating income | | 4,902 |
| | 6,996 |
| | 7,426 |
| | 11,411 |
| | 11,520 |
|
| Voyage expenses and commissions | | (62,035 | ) | | (59,560 | ) | | (71,237 | ) | | (118,303 | ) | | (79,584 | ) |
| Vessel operating expenses | | (150,427 | ) | | (160,199 | ) | | (153,718 | ) | | (124,089 | ) | | (105,911 | ) |
| Charter hire expenses | | (31,173 | ) | | (17,713 | ) | | (25,849 | ) | | (35,664 | ) | | (21,031 | ) |
| Losses on disposal of vessels | | (21,027 | ) | | (2 | ) | | (8,002 | ) | | — |
| | (215 | ) |
| Impairment on non-current assets held for sale | | — |
| | — |
| | — |
| | (7,416 | ) | | — |
|
| Loss on disposal of investments in equity accounted investees | | — |
| | (24,150 | ) | | — |
| | — |
| | — |
|
| Depreciation tangible assets | | (229,777 | ) | | (227,664 | ) | | (210,156 | ) | | (160,934 | ) | | (136,882 | ) |
| Depreciation intangible assets | | (95 | ) | | (99 | ) | | (50 | ) | | (20 | ) | | (76 | ) |
| General and administrative expenses | | (46,868 | ) | | (44,051 | ) | | (46,251 | ) | | (40,565 | ) | | (27,165 | ) |
| Result from operating activities | | 13,406 |
| | 208,220 |
| | 351,972 |
| | 11,527 |
| | (54,714 | ) |
| Finance income | | 7,266 |
| | 6,855 |
| | 3,312 |
| | 2,617 |
| | 1,993 |
|
| Finance expenses | | (50,729 | ) | | (51,695 | ) | | (50,942 | ) | | (95,970 | ) | | (54,637 | ) |
| Net finance expense | | (43,463 | ) | | (44,840 | ) | | (47,630 | ) | | (93,353 | ) | | (52,644 | ) |
| Share of profit (loss) of equity accounted investees (net of income tax) | | 30,082 |
| | 40,495 |
| | 51,592 |
| | 30,286 |
| | 17,853 |
|
| Profit (loss) before income tax | | 25 |
| | 203,875 |
| | 355,934 |
| | (51,540 | ) | | (89,505 | ) |
| Income tax benefit/(expense) | | 1,358 |
| | 174 |
| | (5,633 | ) | | 5,743 |
| | (178 | ) |
| Profit (loss) for the period | | 1,383 |
| | 204,049 |
| | 350,301 |
| | (45,797 | ) | | (89,683 | ) |
| Attributable to: | |
|
| |
|
| |
|
| |
|
| |
|
|
| Owners of the Company | | 1,383 |
| | 204,049 |
| | 350,301 |
| | (45,797 | ) | | (89,683 | ) |
| Basic earnings per share | | 0.01 |
| | 1.29 |
| | 2.25 |
| | (0.39 | ) | | (1.79 | ) |
| Diluted earnings per share | | 0.01 |
| | 1.29 |
| | 2.22 |
| | (0.39 | ) | | (1.79 | ) |
| Dividends per share declared | | 0.12 |
| | 0.77 |
| | 1.69 |
| | — |
| | — |
|
| | | | | | | | | | | | | | | | | | | | | | | | | | | | | | | | |
| Consolidated Statement of Financial Position Data (at Period End) | | Year Ended December 31, |
| (USD in thousands, except for per share and fleet data) | | 2020 | | 2019 | | 2018 * | | 2017 * | | 2016 * |
| Cash and cash equivalents | | 161,478 | | | 296,954 | | | 173,133 | | | 143,648 | | | 206,689 | |
| Vessels | | 2,865,308 | | | 3,177,262 | | | 3,520,067 | | | 2,271,500 | | | 2,383,163 | |
| Vessels under construction | | 207,069 | | | — | | | — | | | 63,668 | | | 86,136 | |
| Total assets | | 3,687,239 | | | 4,164,843 | | | 4,127,351 | | | 2,810,973 | | | 3,046,911 | |
| Current and non-current bank loans | | 856,860 | | | 1,223,451 | | | 1,560,002 | | | 701,091 | | | 1,085,562 | |
| Share capital | | 239,148 | | | 239,148 | | | 239,148 | | | 173,046 | | | 173,046 | |
| Equity attributable to Owners of the Company | | 2,311,786 | | | 2,311,855 | | | 2,260,523 | | | 1,846,361 | | | 1,887,956 | |
| Cash flow data | | | | | | | | | | |
| Net cash inflow/(outflow) | | | | | | | | | | |
| Operating activities | | 969,782 | | | 271,993 | | | 841 | | | 211,298 | | | 438,202 | |
| Investing activities | | (117,106) | | | 43,750 | | | 190,042 | | | (40,243) | | | (100,615) | |
| Financing activities | | (999,701) | | | (191,187) | | | (160,165) | | | (234,976) | | | (261,160) | |
| Fleet Data (Unaudited) | | | | | | | | | | |
| VLCCs | | | | | | | | | | |
| Average number of vessels(1) | | 43 | | | 44 | | | 38 | | | 31 | | | 30 | |
| Calendar days(2) | | 15,856 | | | 16,206 | | | 13,802 | | | 11,330 | | | 10,770 | |
| Vessel operating days(3) | | 15,201 | | | 15,575 | | | 13,175 | | | 10,859 | | | 10,553 | |
| Available days(4) | | 15,736 | | | 16,206 | | | 13,722 | | | 11,130 | | | 10,691 | |
| Fleet utilization(5) | | 96.6 | % | | 96.1 | % | | 96.0 | % | | 97.6 | % | | 98.7 | % |
| Daily TCE charter rates(6) | | $ | 52,549 | | | $ | 35,678 | | | $ | 24,073 | | | $ | 29,827 | | | $ | 42,243 | |
| Suezmaxes | | | | | | | | | | |
| Average number of vessels(1) | | 24 | | | 25 | | | 23 | | | 19 | | | 19 | |
| Calendar days(2) | | 8,671 | | | 9,125 | | | 8,232 | | | 6,868 | | | 7,002 | |
| Vessel operating days(3) | | 8,468 | | | 8,983 | | | 8,108 | | | 6,820 | | | 6,751 | |
| Available days(4) | | 8,611 | | | 9,060 | | | 8,173 | | | 6,826 | | | 6,882 | |
| Fleet utilization(5) | | 98.3 | % | | 99.2 | % | | 99.2 | % | | 99.9 | % | | 98.1 | % |
| Daily TCE charter rates(6) | | $ | 37,025 | | | $ | 26,542 | | | $ | 17,557 | | | $ | 19,144 | | | $ | 27,114 | |
| LR1 | | | | | | | | | | |
| Average number of vessels(1) | | — | | | — | | | 1 | | | — | | | — | |
| Calendar days(2) | | — | | | 124 | | | 361 | | | — | | | — | |
| Vessel operating days(3) | | — | | | 124 | | | 360 | | | — | | | — | |
| Available days(4) | | — | | | 124 | | | 361 | | | — | | | — | |
| Fleet utilization(5) | | — | % | | 100.0 | % | | 99.9 | % | | — | % | | — | % |
| Daily TCE charter rates(6) | | $ | — | | | $ | 12,471 | | | $ | 6,403 | | | $ | — | | | $ | — | |
| Other data | | | | | | | | | | |
| EBITDA (unaudited)(7) | | $ | 852,892 | | | $ | 540,668 | | | $ | 231,513 | | | $ | 273,452 | | | $ | 475,005 | |
| Adjusted EBITDA (unaudited)(8) | | $ | 888,238 | | | $ | 565,298 | | | $ | 254,816 | | | $ | 294,467 | | | $ | 503,453 | |
| Time charter equivalents revenues (unaudited) | | $ | 1,112,323 | | | $ | 795,656 | | | $ | 459,516 | | | $ | 454,455 | | | $ | 628,842 | |
| Basic weighted average shares outstanding | | 210,193,707 | | | 216,029,171 | | | 191,994,398 | | | 158,166,534 | | | 158,262,268 | |
| Diluted weighted average shares outstanding | | 210,206,403 | | | 216,029,171 | | | 191,994,398 | | | 158,297,057 | | | 158,429,057 | |
* We have initially applied IFRS 16 at January 1, 2019, using the modified retrospective approach. Under this approach, comparative information is not restated.
|
| | | | | | | | | | | | | | | | | | | | | | | |
| Consolidated Statement of Financial Position Data (at Period End) | | Year Ended December 31, |
| (US$ in thousands, except for per share and fleet data) | | 2017 | | 2016 | | 2015 | | 2014 | | 2013 |
| Cash and cash equivalents | | 143,648 |
| | 206,689 |
| — |
| 131,663 |
| — |
| 254,086 |
| — |
| 74,309 |
|
| Vessels | | 2,271,500 |
| | 2,383,163 |
| — |
| 2,288,036 |
| — |
| 2,258,334 |
| — |
| 1,434,800 |
|
| Vessels under construction | | 63,668 |
| | 86,136 |
| — |
| 93,890 |
| — |
| — |
| — |
| — |
|
| Total assets | | 2,810,973 |
| | 3,046,911 |
| | 3,040,746 |
| | 3,096,360 |
| | 1,920,761 |
|
| Current and non-current bank loans | | 701,091 |
| | 1,085,562 |
| — |
| 1,052,448 |
| — |
| 1,234,329 |
| — |
| 847,763 |
|
| Share capital | | 173,046 |
| | 173,046 |
| | 173,046 |
| | 142,441 |
| | 58,937 |
|
| Equity attributable to Owners of the Company | | 1,846,361 |
| | 1,887,956 |
| — |
| 1,905,749 |
| — |
| 1,472,708 |
| — |
| 800,990 |
|
| Cash flow data | | | | | | | | | | |
| Net cash inflow/(outflow) | | | | | | | | | | |
| Operating activities | | 211,298 |
| | 438,202 |
| — |
| 450,532 |
| — |
| 14,782 |
| — |
| (8,917 | ) |
| Investing activities | | (40,243 | ) | | (100,615 | ) | — |
| (205,873 | ) | — |
| (1,023,007 | ) | — |
| 28,114 |
|
| Financing activities | | (234,976 | ) | | (261,160 | ) | — |
| (365,315 | ) | — |
| 1,189,021 |
| — |
| (57,384 | ) |
| Fleet Data (Unaudited) | |
|
| |
|
| |
|
| |
|
| |
|
|
| VLCCs | |
|
| |
|
| |
|
| |
|
| |
|
|
| Average number of vessels(1) | | 31 |
| | 30 |
| | 27 |
| | 20 |
| | 11 |
|
| Calendar days(2) | | 11,330 |
| | 10,770 |
| | 9,860 |
| | 7,450 |
| | 4,085 |
|
| Vessel operating days(3) | | 10,859 |
| | 10,553 |
| | 9,645 |
| | 7,294 |
| | 4,036 |
|
| Available days(4) | | 11,130 |
| | 10,691 |
| | 9,780 |
| | 7,391 |
| | 4,044 |
|
| Fleet utilization(5) | | 97.6 | % | | 98.7 | % | | 98.6 | % | | 98.7 | % | | 99.8 | % |
| Daily TCE charter rates(6) | | $ | 29,827 |
| | $ | 42,243 |
| | $ | 52,802 |
| | $ | 27,189 |
| | $ | 25,785 |
|
| Daily vessel operating expenses(7) | | $ | 8,042 |
| | $ | 9,078 |
| | $ | 9,935 |
| | $ | 8,565 |
| | $ | 8,178 |
|
| Suezmaxes | |
|
| |
|
| |
|
| |
|
| |
|
|
| Average number of vessels(1) | | 19 |
| | 19 |
| | 19 |
| | 19 |
| | 19 |
|
| Calendar days(2) | | 6,868 |
| | 7,002 |
| | 6,885 |
| | 6,937 |
| | 6,848 |
|
| Vessel operating days(3) | | 6,820 |
| | 6,751 |
| | 6,780 |
| | 6,774 |
| | 6,661 |
|
| Available days(4) | | 6,826 |
| | 6,882 |
| | 6,806 |
| | 6,895 |
| | 6,664 |
|
| Fleet utilization(5) | | 99.9 | % | | 98.1 | % | | 99.6 | % | | 98.2 | % | | 100.0 | % |
| Daily TCE charter rates(6) | | $ | 19,144 |
| | $ | 27,114 |
| | $ | 39,689 |
| | $ | 24,490 |
| | $ | 19,284 |
|
| Daily vessel operating expenses(7) | | $ | 7,926 |
| | $ | 8,845 |
| | $ | 8,288 |
| | $ | 8,073 |
| | $ | 7,753 |
|
| Average daily general and administrative expenses per vessel—owned tanker segment only(8) | | $ | 2,577 |
| | $ | 2,489 |
| | $ | 2,790 |
| | $ | 2,820 |
| | $ | 2,485 |
|
| Other data | |
|
| |
|
| |
|
| |
|
| |
|
|
| EBITDA (unaudited)(9) | | $ | 273,360 |
| | $ | 476,478 |
| | $ | 613,770 |
| | $ | 202,767 |
| | $ | 100,096 |
|
| Adjusted EBITDA (unaudited)(10) | | $ | 293,748 |
| | $ | 503,679 |
| | $ | 648,190 |
| | $ | 239,176 |
| | $ | 138,853 |
|
| Time charter equivalents revenues (unaudited) | | $ | 454,455 |
| | $ | 628,842 |
| | $ | 778,368 |
| | $ | 364,211 |
| | $ | 232,519 |
|
| Basic weighted average shares outstanding | | 158,166,534 |
| | 158,262,268 |
| | 155,872,171 |
| | 116,539,017 |
| | 50,230,438 |
|
| Diluted weighted average shares outstanding | | 158,297,057 |
|
| 158,429,057 |
|
|
| 157,529,562 |
|
|
| 116,539,017 |
|
|
| 50,230,438 |
|
| |
(1) | Average number of vessels is the number of vessels that constituted our fleet for the relevant period, as measured by the sum of the number of calendar days each vessel was part of our fleet during the period divided by the number of calendar days in that period.
|
| |
(2) | Calendar days are the total days the vessels were in our possession for the relevant period, including off-hire days (scheduled or unscheduled).
|
| |
(3) | Vessel operating days are the total days our vessels were in our possession for the relevant period net of all off-hire days (scheduled and unscheduled).
|
| |
(4) | Available days are the total days our vessels were in our possession for the relevant period net of scheduled off-hire days associated with major repairs, drydockings or special or intermediate surveys.
|
| |
(5) | Fleet utilization is the percentage of time that our vessels were available for revenue generating voyage days and is determined by dividing Vessel operating days by available days for the relevant period. The shipping industry uses fleet utilization to measure a company's efficiency in finding suitable employment for its vessels and minimizing the number of days that its vessels are off-hire for reasons other than scheduled repairs or repairs under guarantee, vessel upgrades, special surveys or intermediate or vessel positioning.
|
| |
(6) | Time Charter Equivalent, or TCE, (a non-IFRS measure) is a measure of the average daily revenue performance of a vessel on a per voyage basis. Our method of calculating the TCE rate is consistent with industry standards and is determined by dividing total voyage revenues less voyage expenses by vessel operating days for the relevant time period. The period over which voyage revenues are recognized commences at the time the vessel leaves the port at which she discharged her cargo related to her previous voyage (or as the case may be when a vessel is leaving a yard at which she went to drydock or in the case of a newbuilding where she was built or in the case of a newly acquired vessel as from the moment the vessel is available to take a cargo). The period ends at the time that discharge of cargo is completed. Net voyage revenues are voyage revenues minus voyage expenses. Voyage expenses primarily consist of port, canal and fuel costs that are unique to a particular voyage, which would otherwise be paid by the charterer under a time charter contract. We may incur voyage related expenses when positioning or repositioning vessels before or after the period of a time charter, during periods of commercial waiting time or while off-hire during dry-docking or due to other unforeseen circumstances. The TCE rate is not a measure of financial performance under IFRS (non-IFRS measure), and should not be considered as an alternative to voyage revenues, the most directly comparable IFRS measure, or any other measure of financial performance presented in accordance with IFRS. However, TCE rate is standard shipping industry performance measure used primarily to compare period-to-period changes in a company's performance and assists our management in making decisions regarding the deployment and use of our vessels and in evaluating their financial performance. Our calculation of TCE rates may not be comparable to that reported by other companies.
|
| |
(7) | Daily vessel operating expenses, or DVOE, (a non-IFRS measure) is calculated by dividing direct vessel expenses, which includes crew costs, provisions, deck and engine stores, lubricating oil, insurance and maintenance and repairs, by calendar days for the relevant time period.
|
| |
(8) | Average daily general and administrative expenses are calculated by dividing general and administrative expenses by calendar days for our owned tanker segment and relevant time period. Average daily general and administrative expenses are lower when our jointly-owned vessels are included in this calculation.
|
| |
(9) | EBITDA (a non-IFRS measure) represents operating earnings before interest expense, income taxes and depreciation expense attributable to us. EBITDA is presented to provide investors with meaningful additional information that management uses to monitor ongoing operating results and evaluate trends over comparative periods. We believe that EBITDA is useful to investors as the shipping industry is capital intensive which often brings significant cost of financing. EBITDA should not be considered a substitute for profit/(loss) attributable to us or cash flow from operating activities prepared in accordance with IFRS as issued by the IASB or as a measure of profitability or liquidity. The definition of EBITDA used here may not be comparable to that used by other companies. Please see the reconciliation to Profit (loss) for the period, the nearest IFRS measure.
|
| |
(10) | Adjusted EBITDA (a non-IFRS measure) represents operating earnings (including the share of EBITDA of equity accounted investees) before interest expense, income taxes and depreciation expense attributable to us. Adjusted EBITDA provides investors with meaningful additional information that management uses to monitor ongoing operating results and evaluate trends over comparative periods as the shipping industry is a capital intensive industry which often brings significant cost of financing. We also believe that Adjusted EBITDA is useful to investors and equity analysts as a measure of our operating performance that can be readily compared to other companies and we use Adjusted EBITDA in our internal evaluation of operating effectiveness and decisions regarding the allocation of resources. Adjusted EBITDA should not be considered a substitute for profit/(loss) attributable to us or cash flow from operating activities prepared in accordance with IFRS as issued by the IASB or any other measure of operating performance. The definition of Adjusted EBITDA used here may not be comparable to that used by other companies. Please see the reconciliation to Profit (loss) for the period, the nearest IFRS measure.
|
(1)Average number of vessels is the number of vessels that constituted our fleet for the relevant period, as measured by the sum of the number of calendar days each vessel was part of our fleet during the period divided by the number of calendar days in that period.
(2)Calendar days are the total days the vessels were in our possession for the relevant period, including off-hire days (scheduled or unscheduled).
(3)Vessel operating days are the total days our vessels were in our possession for the relevant period net of all off-hire days (scheduled and unscheduled).
(4)Available days are the total days our vessels were in our possession for the relevant period net of scheduled off-hire days associated with major repairs, drydockings or special or intermediate surveys.
(5)Fleet utilization is the percentage of time that our vessels were available for revenue generating voyage days and is determined by dividing Vessel operating days by available days for the relevant period. The shipping industry uses fleet utilization to measure a company's efficiency in finding suitable employment for its vessels and minimizing the number of days that its vessels are off-hire for reasons other than scheduled repairs or repairs under guarantee, vessel upgrades, special surveys or intermediate or vessel positioning.
(6)Time Charter Equivalent, or TCE, (a non-IFRS measure) is a measure of the average daily revenue performance of a vessel on a per voyage basis. Our method of calculating the TCE rate is consistent with industry standards and is determined by dividing total voyage revenues less voyage expenses by vessel operating days for the relevant time period. Voyage expenses primarily consist of port, canal and fuel costs that are unique to a particular voyage, which would otherwise be paid by the charterer under a time charter contract. The TCE rate is not a measure of financial performance under IFRS, and should not be considered as an alternative to voyage revenues, the most directly comparable IFRS measure, or any other measure of financial performance presented in accordance with IFRS. However, TCE rate is standard shipping industry performance measure used primarily to compare period-to-period changes in a company's performance and assists our management in making decisions regarding the deployment and use of our vessels and in evaluating their financial performance. Our calculation of TCE rates may not be comparable to that reported by other companies and going forward, we will closely monitor the relevance of TCE within the industry. The new IMO 2020 legislation, which came into force as of January 1, 2020, allows the use of costly scrubbers to comply with the new legislation, allowing vessels retrofitted with such scrubbers to burn cheaper high-sulfur fuel compared to burning the more expensive low-sulfur fuel. This will reduce bunker cost and increase the net voyage revenues and TCE, but thereby foregoing the additional capital expenditure and depreciation of the new equipment.
(7)EBITDA (a non-IFRS measure) represents operating earnings before interest expense, income taxes and depreciation expense attributable to us. EBITDA is presented to provide investors with meaningful additional information that management uses to monitor ongoing operating results and evaluate trends over comparative periods. We believe that EBITDA is useful to investors as the shipping industry is capital intensive which often brings significant cost of financing. EBITDA should not be considered a substitute for profit/(loss) attributable to us or cash flow from operating activities prepared in accordance with IFRS as issued by the IASB or as a measure of profitability or liquidity. The definition of EBITDA used here may not be comparable to that used by other companies. Please see the reconciliation to Profit (loss) for the period, the nearest IFRS measure.
(8)Adjusted EBITDA (a non-IFRS measure) represents operating earnings including the share of EBITDA of equity accounted investees before interest expense, income taxes and depreciation expense attributable to us. Adjusted EBITDA provides investors with meaningful additional information that management uses to monitor ongoing operating results and evaluate trends over comparative periods as the shipping industry is a capital intensive industry which often brings significant cost of financing. We also believe that Adjusted EBITDA is useful to investors and equity analysts as a measure of our operating performance including our equity accounted investees and we use Adjusted EBITDA in our internal evaluation of operating effectiveness and decisions regarding the allocation of resources. Adjusted EBITDA should not be considered a substitute for profit/(loss) attributable to us or cash flow from operating activities prepared in accordance with IFRS as issued by the IASB or any other measure of operating performance. The definition of Adjusted EBITDA used here may not be comparable to that used by other companies. Please see the reconciliation to Profit (loss) for the period, the nearest IFRS measure.
The following table reflects the calculation of our TCE rates for the years ended December 31,
2020, 2019, 2018, 2017,
2016, 2015, 2014, and
2013:2016: | | | (Unaudited) | | 2017 | | 2016 | | 2015 | | 2014 | | 2013 | (Unaudited) | | 2020 | | 2019 | | 2018 | | 2017 | | 2016 |
| VLCC | |
| |
| |
| |
| |
| VLCC | | | | | | | | | | |
| Net VLCC revenues for all employment types | | $ | 323,892,625 |
| | $ | 445,792,653 |
| | $ | 509,277,925 |
| | $ | 198,316,363 |
| | $ | 104,068,875 |
| Net VLCC revenues for all employment types | | $ | 798,796,226 | | | $ | 555,679,657 | | | $ | 317,168,033 | | | $ | 323,892,625 | | | $ | 445,792,653 | |
| Total VLCC operating days | | 10,859 |
| | 10,553 |
| | 9,645 |
| | 7,294 |
| | 4,036 |
| Total VLCC operating days | | 15,201 | | | 15,575 | | | 13,175 | | | 10,859 | | | 10,553 | |
| Daily VLCC TCE Rate | | $ | 29,827 |
| | $ | 42,243 |
| | $ | 52,802 |
| | $ | 27,189 |
| | $ | 25,785 |
| Daily VLCC TCE Rate | | $ | 52,549 | | | $ | 35,678 | | | $ | 24,073 | | | $ | 29,827 | | | $ | 42,243 | |
| SUEZMAX | |
|
| |
|
| |
|
| |
|
| |
|
| SUEZMAX | |
| Net Suezmax revenues for all employment types | | $ | 130,562,503 |
| | $ | 183,049,801 |
| | $ | 269,090,422 |
| | $ | 165,894,436 |
| | $ | 128,449,941 |
| Net Suezmax revenues for all employment types | | $ | 313,527,066 | | | $ | 238,424,182 | | | $ | 142,348,452 | | | $ | 130,562,503 | | | $ | 183,049,801 | |
| Total Suezmax operating days | | 6,820 |
| | 6,751 |
| | 6,780 |
| | 6,774 |
| | 6,661 |
| Total Suezmax operating days | | 8,468 | | | 8,983 | | | 8,108 | | | 6,820 | | | 6,751 | |
| Daily Suezmax rate | | $ | 19,144 |
| | $ | 27,114 |
| | $ | 39,689 |
| | $ | 24,490 |
| | $ | 19,284 |
| Daily Suezmax rate | | $ | 37,025 | | | $ | 26,542 | | | $ | 17,557 | | | $ | 19,144 | | | $ | 27,114 | |
| LR1 | | LR1 | |
| Net LR1 revenues for all employment types | | Net LR1 revenues for all employment types | | $ | — | | | $ | 1,552,227 | | | $ | 2,307,222 | | | $ | — | | | $ | — | |
| Total LR1 operating days | | Total LR1 operating days | | — | | | 124 | | | 360 | | | — | | | — | |
| Daily LR1 rate | | Daily LR1 rate | | $ | — | | | $ | 12,471 | | | $ | 6,403 | | | $ | — | | | $ | — | |
| Tanker Fleet | |
|
| |
|
| |
|
| |
|
| |
|
| Tanker Fleet | |
| Net Tanker fleet revenues for all employment type | | $ | 454,455,128 |
| | $ | 628,842,454 |
| | $ | 778,368,347 |
| | $ | 364,210,799 |
| | $ | 232,518,816 |
| Net Tanker fleet revenues for all employment type | | $ | 1,112,323,292 | | | $ | 795,656,066 | | | $ | 461,823,707 | | | $ | 454,455,128 | | | $ | 628,842,454 | |
| Total Fleet operating days | | 17,679 |
| | 17,304 |
| | 16,425 |
| | 14,068 |
| | 10,697 |
| Total Fleet operating days | | 23,669 | | | 24,682 | | | 21,643 | | | 17,679 | | | 17,304 | |
| Daily Fleetwide TCE | | $ | 25,706 |
| | $ | 36,341 |
| | $ | 47,389 |
| | $ | 25,889 |
| | $ | 21,737 |
| Daily Fleetwide TCE | | $ | 46,995 | | | $ | 32,236 | | | $ | 21,338 | | | $ | 25,706 | | | $ | 36,341 | |
The following table reflects the calculation of our net revenues for the years ended December 31, 2020, 2019, 2018, 2017, 2016, 2015, 2014, and 2013:2016: | | | | | | | | | | | | | | Year Ended December 31, |
| | | Year Ended December 31, | |
| (US$ in thousands) | | 2017 | | 2016 | | 2015 | | 2014 | | 2013 | |
| (USD in thousands) | | (USD in thousands) | | 2020 | | 2019 | | 2018 | | 2017 | | 2016 |
| Voyage charter revenues | | $ | 394,663 |
| | $ | 544,038 |
| | $ | 720,416 |
| | $ | 341,867 |
| | $ | 171,226 |
| Voyage charter revenues | | $ | 1,116,863 | | | $ | 842,068 | | | $ | 524,786 | | | $ | 394,663 | | | $ | 544,038 | |
| Time charter revenues | | $ | 118,705 |
| | $ | 140,227 |
| | $ | 126,091 |
| | $ | 132,118 |
| | $ | 133,396 |
| Time charter revenues | | $ | 113,887 | | | $ | 90,309 | | | $ | 75,238 | | | $ | 118,705 | | | $ | 140,227 | |
| | | |
| | |
| | |
| | |
| | |
| | | | | | | | | | | |
| Subtotal revenue | | $ | 513,368 |
| | $ | 684,265 |
| | $ | 846,507 |
| | $ | 473,985 |
| | $ | 304,622 |
| Subtotal revenue | | $ | 1,230,750 | | | $ | 932,377 | | | $ | 600,024 | | | $ | 513,368 | | | $ | 684,265 | |
| Other income | | $ | 4,902 |
| | $ | 6,996 |
| | $ | 7,426 |
| | $ | 11,411 |
| | $ | 11,520 |
| Other income | | $ | 10,112 | | | $ | 10,094 | | | $ | 4,775 | | | $ | 4,902 | | | $ | 6,996 | |
| | | |
| | |
| | |
| | |
| | |
| | | | | | | | | | | |
| Total operating revenues | | $ | 518,270 |
| | $ | 691,261 |
| | $ | 853,933 |
| | $ | 485,396 |
| | $ | 316,142 |
| Total operating revenues | | $ | 1,240,862 | | | $ | 942,471 | | | $ | 604,799 | | | $ | 518,270 | | | $ | 691,261 | |
| Less: | |
|
| |
|
| |
|
| |
|
| |
|
| Less: | |
| Other Income* | | $ | (1,780 | ) | | $ | (2,858 | ) | | $ | (4,328 | ) | | $ | (2,882 | ) | | $ | (4,039 | ) | Other Income* | | $ | (3,109) | | | $ | (2,134) | | | $ | (1,559) | | | $ | (1,780) | | | $ | (2,858) | |
| Tanker Fleet | | |
| | |
| | |
| | |
| | |
| Tanker Fleet | | | | | | | | | |
| Net Tanker Fleet Revenues reconciliation | |
|
| |
|
| |
|
| |
|
| |
|
| Net Tanker Fleet Revenues reconciliation | |
| Share of total Revenues attributable to ships owned by Euronav* | | $ | 516,490 |
| | $ | 688,403 |
| | $ | 849,605 |
| | $ | 482,514 |
| | $ | 312,103 |
| Share of total Revenues attributable to ships owned by Euronav* | | $ | 1,237,753 | | | $ | 940,337 | | | $ | 603,240 | | | $ | 516,490 | | | $ | 688,403 | |
| less voyage expenses and commissions | | $ | (62,035 | ) | | $ | (59,560 | ) | | $ | (71,237 | ) | | $ | (118,303 | ) | | $ | (79,584 | ) | less voyage expenses and commissions | | $ | (125,430) | | | $ | (144,681) | | | $ | (141,416) | | | $ | (62,035) | | | $ | (59,560) | |
| | | |
| | |
| |
|
| |
|
| | |
| | | | | | | | | | | |
| Net Total tanker fleet | | $ | 454,455 |
| | $ | 628,843 |
| | $ | 778,368 |
| | $ | 364,211 |
| | $ | 232,519 |
| Net Total tanker fleet | | $ | 1,112,323 | | | $ | 795,656 | | | $ | 461,824 | | | $ | 454,455 | | | $ | 628,843 | |
| of which Net VLCC Revenues for all employment types | | $ | 323,893 |
| | $ | 445,793 |
| | $ | 509,278 |
| | $ | 198,316 |
| | $ | 104,069 |
| of which Net VLCC Revenues for all employment types | | $ | 798,796 | | | $ | 555,680 | | | $ | 317,168 | | | $ | 323,893 | | | $ | 445,793 | |
| of which Net Suezmax Revenues for all employment types | | $ | 130,562 |
| | $ | 183,050 |
| | $ | 269,090 |
| | $ | 165,895 |
| | $ | 128,450 |
| of which Net Suezmax Revenues for all employment types | | $ | 313,527 | | | $ | 238,424 | | | $ | 142,349 | | | $ | 130,562 | | | $ | 183,050 | |
| of which Net LR1 Revenues for all employment types | | of which Net LR1 Revenues for all employment types | | $ | — | | | $ | 1,552 | | | $ | 2,307 | | | $ | — | | | $ | — | |
* Some revenues and costs are excluded because these do not relate directly to vessels, such as rental income and insurance rebates.
rebates
| | | | | Year Ended December 31, | | Year Ended December 31, |
| | | 2017 | | 2016 | | 2015 | | 2014 | | 2013 | | 2020 | | 2019 | | 2018 | | 2017 | | 2016 |
| EBITDA Reconciliation (unaudited) | |
| |
| | | | | | | EBITDA Reconciliation (unaudited) | | | | | | | | | | |
| Profit (loss) for the period | | $ | 1,383 |
| | $ | 204,049 |
| | $ | 350,301 |
| | $ | (45,797 | ) | | $ | (89,683 | ) | Profit (loss) for the period | | $ | 473,238 | | | $ | 112,230 | | | $ | (110,070) | | | $ | 1,383 | | | $ | 204,049 | |
| plus Net finance expenses | | $ | 43,463 |
| | $ | 44,840 |
| | $ | 47,630 |
| | $ | 93,353 |
| | $ | 52,644 |
| |
| plus Net interest expenses | | plus Net interest expenses | | $ | 57,959 | | | $ | 90,134 | | | $ | 70,652 | | | $ | 43,555 | | | $ | 43,367 | |
| plus Depreciation of tangible and intangible assets | | $ | 229,872 |
| | $ | 227,763 |
| | $ | 210,206 |
| | $ | 160,954 |
| | $ | 136,958 |
| plus Depreciation of tangible and intangible assets | | $ | 319,751 | | | $ | 337,702 | | | $ | 270,693 | | | $ | 229,872 | | | $ | 227,763 | |
| plus Income tax expense/(benefit) | | $ | (1,358 | ) | | $ | (174 | ) | | $ | 5,633 |
| | $ | (5,743 | ) | | $ | 178 |
| plus Income tax expense/(benefit) | | $ | 1,944 | | | $ | 602 | | | $ | 238 | | | $ | (1,358) | | | $ | (174) | |
| | | |
| |
|
| |
|
| |
|
| |
|
| | | |
| EBITDA (unaudited) | | $ | 273,360 |
| | $ | 476,478 |
| | $ | 613,770 |
| | $ | 202,767 |
| | $ | 100,097 |
| EBITDA (unaudited) | | $ | 852,892 | | | $ | 540,668 | | | $ | 231,513 | | | $ | 273,452 | | | $ | 475,005 | |
| | | | | | | | | | | | | | | | | | | | | | | | | | | | | | | | |
| | Year Ended December 31, |
| | 2020 | | 2019 | | 2018 | | 2017 | | 2016 |
| Adjusted EBITDA Reconciliation (unaudited) | | | | | | | | | | |
| Profit (loss) for the period | | $ | 473,238 | | | $ | 112,230 | | | $ | (110,070) | | | $ | 1,383 | | | $ | 204,049 | |
| plus Net interest expenses | | $ | 57,959 | | | $ | 90,134 | | | $ | 70,652 | | | $ | 43,555 | | | $ | 43,367 | |
| plus Net interest expenses JV | | $ | 4,806 | | | $ | 4,588 | | | $ | 3,634 | | | $ | 1,456 | | | $ | 4,459 | |
| plus Depreciation of tangible and intangible assets | | $ | 319,751 | | | $ | 337,702 | | | $ | 270,693 | | | $ | 229,872 | | | $ | 227,763 | |
| plus Depreciation of tangible and intangible assets JV | | $ | 20,274 | | | $ | 18,461 | | | $ | 18,070 | | | $ | 18,071 | | | $ | 23,774 | |
| plus Income tax expense/(benefit) | | $ | 1,944 | | | $ | 602 | | | $ | 238 | | | $ | (1,358) | | | $ | (174) | |
| plus Income tax expense/(benefit) JV | | $ | 10,266 | | | $ | 1,581 | | | $ | 1,599 | | | $ | 1,488 | | | 215 | |
| | | | | | | | | | |
| Adjusted EBITDA (unaudited) | | $ | 888,238 | | | $ | 565,298 | | | $ | 254,816 | | | $ | 294,467 | | | $ | 503,453 | |
|
| | | | | | | | | | | | | | | | | | | | |
| | | Year Ended December 31, |
| | | 2017 | | 2016 | | 2015 | | 2014 | | 2013 |
| Adjusted EBITDA Reconciliation (unaudited) | |
| |
| |
| |
| |
|
| Profit (loss) for the period | | $ | 1,383 |
| | $ | 204,049 |
| | $ | 350,301 |
| | $ | (45,797 | ) | | $ | (89,683 | ) |
| plus Net finance expenses | | $ | 43,463 |
| | $ | 44,840 |
| | $ | 47,630 |
| | $ | 93,353 |
| | $ | 52,644 |
|
| plus Net finance expenses JV | | $ | 829 |
| | $ | 3,212 |
| | $ | 5,288 |
| | $ | 7,351 |
| | $ | 8,352 |
|
| plus Depreciation of tangible and intangible assets | | $ | 229,872 |
| | $ | 227,763 |
| | $ | 210,206 |
| | $ | 160,954 |
| | $ | 136,958 |
|
| plus Depreciation of tangible and intangible assets JV | | $ | 18,071 |
| | $ | 23,774 |
| | $ | 29,314 |
| | $ | 29,058 |
| | $ | 30,404 |
|
| plus Income tax expense/(benefit) | | $ | (1,358 | ) | | $ | (174 | ) | | $ | 5,633 |
| | $ | (5,743 | ) | | $ | 178 |
|
| plus Income tax expense/(benefit) JV | | $ | 1,488 |
| | $ | 215 |
| | $ | (182 | ) | | — |
| | — |
|
| | |
|
| |
|
| |
|
| |
|
| |
|
|
| Adjusted EBITDA (unaudited) | | $ | 293,748 |
| | $ | 503,679 |
| | $ | 648,190 |
| | $ | 239,176 |
| | $ | 138,853 |
|
B.Capitalization and Indebtedness
Not applicable.
C.Reasons for the Offer and Use of Proceeds
Not applicable.
D.Risk Factors
The following risks relate principally to us and our business and the industry in which we operate, the securities market and ownership of our securities, including our ordinary shares. The occurrence of any of the risk factors describedsummarized in the Cautionary Statement Regarding Forward Looking Statements and the Summary of Risk Factors below could significantlysummarize the risks that may materially and negatively affect our business, financial condition or operating results, which may reduce our ability to pay dividends, and lower the trading price of our ordinary shares.results.
Risk Factors Relating to Our Industry
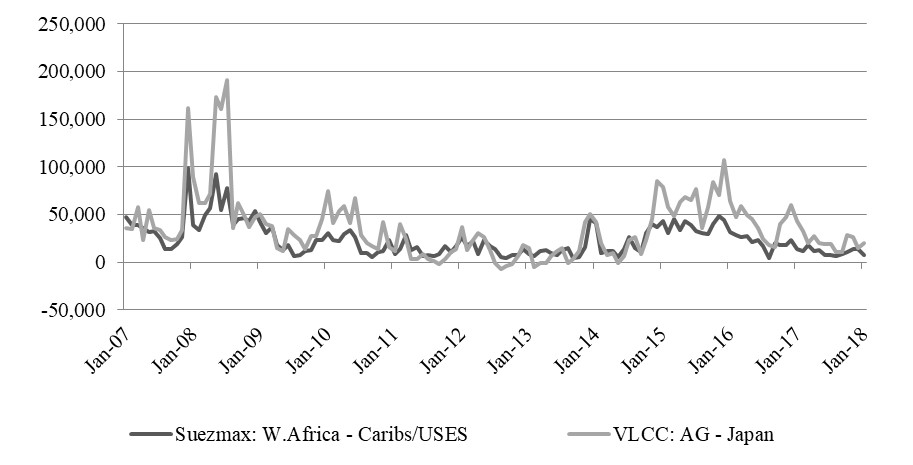
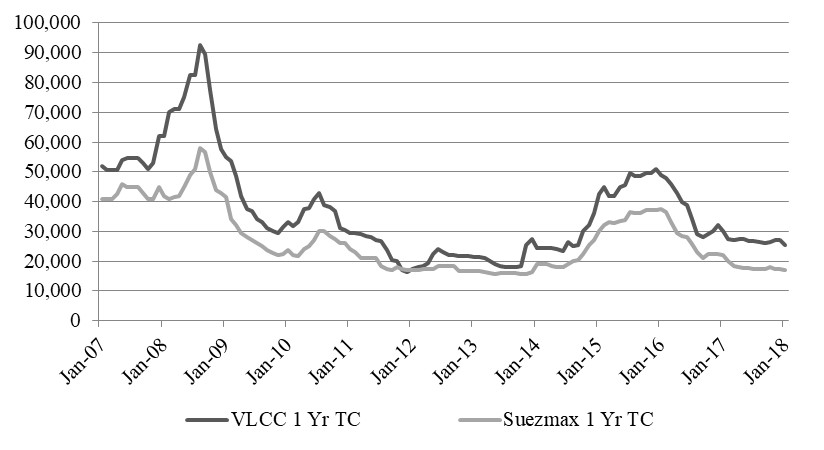
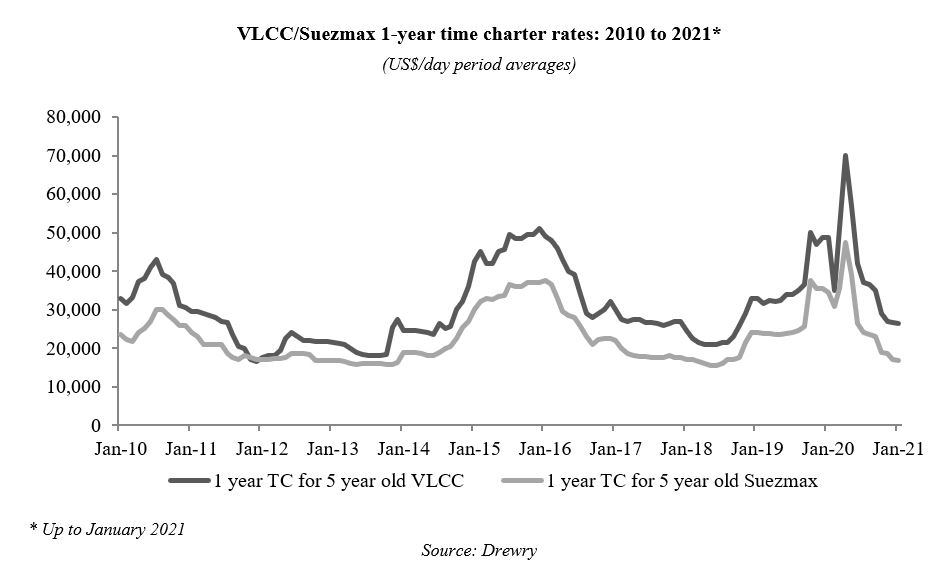
The tanker industry is cyclical and volatile, which may lead to reductions and volatility in the charter rates we are able to obtain, in, vessel values, and in our earnings and available cash flow.
The tanker industry is both cyclical and volatile in terms of charter rates and profitability. For example, during the seven year period from 2010 through 2016, time charter equivalent, or TCE, spotWe expect continued volatility in market rates for our vessels in the foreseeable future with a VLCC trading between the Middle East Gulfconsequent effect on our short- and Japan ranged from rates below operating expenses to a high of $114,148 per day. This volatility continued in 2017, with average daily rates on the same route fluctuating between $7,502 (below operating expenses) to $62,223 per day.medium-term liquidity. A worsening of the current global economic conditions may adversely affect our ability to charter or recharterre-charter our vessels or to sell them on the expiration or termination of their charters, or any renewal or replacement charters that we enter into may not be sufficient to allow us to operate our vessels profitably. Our revenues are affected by our strategy to employ some of our vessels on time charters, which have a fixed income for a pre-set period of time as opposed to trading ships in the spot market where their earnings are heavily impacted by the supply and demand balance. Our ability to renew expiring contracts or obtain new charters will depend on the prevailing market conditions at the time. If we are not able to obtain new contracts in direct continuation with existing charters or for newly acquired vessels, or if new contracts are entered into at charter rates substantially below the existing charter rates or on terms otherwise less favorable compared to existing contracts terms, our revenues and profitability could be adversely affected.
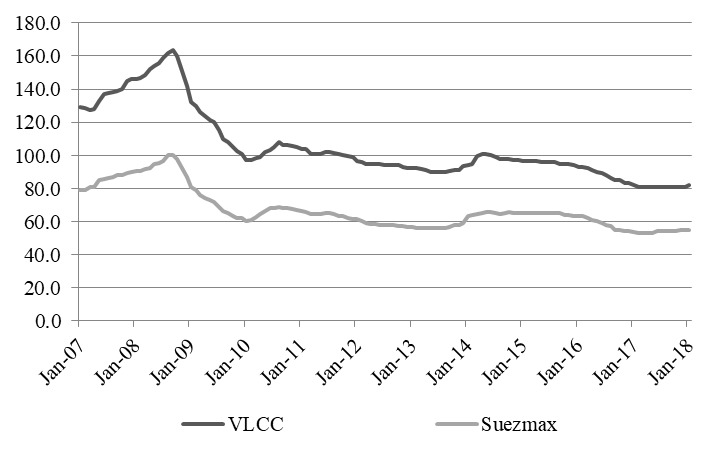
Fluctuations in charter rates and vessel values result from changes in the supply and demand for tanker capacity andcaused by changes in the supply and demand for oil and oil products. The carrying values of our vessels or our floating, storage and offloading (FSO) vessels may not represent their fair market values or the amount that could be obtained by selling the vessels at any point in time since the market prices of second-hand vessels tend to fluctuate with changes in charter rates and the cost of newbuildings.
TheIn general, the factors affecting the supply and demand for tankers are outside of our control, and the nature, timing and degree of changes in industry conditions are unpredictable.
The factors that influence demand for tanker capacity include:
•supply and demand for energy resources and oil and petroleum products;
•competition from, and supply and demand for, alternative sources of energy;
•regional availability of refining capacity and inventories;inventories compared to geographies of oil production regions;
•national policies regarding strategic oil inventories (including if strategic reserves are set at a lower level in the future as oil decreases in the energy mix);
•global and regional economic and political conditions and developments, including armed conflicts, terrorist activities, trade wars, public health threats, tariffs embargoes and strikes;
•currency exchange rates, most importantly versus USD;
•changing trade patterns and the distance over which the oil and the oil products are to be moved by sea;
•changes in seaborne and other transportation patterns, including shifts in transportation demand between crude oil and refined oil products;products and the distance they are transported by sea;
•changes in governmental or maritime self-regulatory organizations’ rules and regulations or actions taken by regulatory authorities;
•environmental and other legal and regulatory developments;
•weather and natural disasters;
•developments in international trade, including those relating to the imposition of tariffs; and
•international sanctions, embargoes, import and export restrictions, nationalizations and wars.
The factors that influence the supply of tanker capacity include:
demand for alternative sources of energy;
•the number of newbuilding orders and deliveries;
•the scrappingavailability of financing for shipping activity;
•the number of vessel casualties;
•the degree of recycling of older vessels, depending, amongst other things, on scrappingrecycling rates and international scrappingrecycling regulations;
conversion•the number of conversions of tankers to other uses;
•the number of vessels that are out of service;service, laid up, dry-docked or used as storage units;
•environmental concerns and regulations; and
•port or canal congestion.
Declines in oil and natural gas prices or decreases in demand for oil and natural gas for an extended period of time, or market expectations of potential decreases in these prices and demand, could negatively affect our future growth in the tanker and offshore sector. Sustained periods of low oil and natural gas prices typically result in reduced exploration and extraction because oil and natural gas companies'companies’ capital expenditure budgets are subject to cash flow from such activities and are therefore sensitive to changes in energy prices. These changes in commodity prices can have a material effect on demand for our services, and periods of low demand can cause excess vessel supply and intensify the competition in the industry, which often results in vessels, particularly older and less technologically-advanced vessels, being idle for long periods of time. We cannot predict the future level of demand for our services or future conditions of the oil and natural gas industry. Any decrease in exploration, development or production expenditures by oil and natural gas companies or decrease in the demand for oil and natural gas could reduce our revenues and materially harm our business, results of operations and cash available for distribution.distribution (see also “Peak oil” below).
A shift in consumer demand from oil towards other energy sources or changes to trade patterns for oil and oil products may have a material adverse effect on our business.
A significant portion of our earnings are related to the oil industry and our lack of diversification will potentially affect the demand for our vessels. We rely almost exclusively on the cash flows generated from charters for our vessels that operate in the tanker sector of the shipping industry. Due to our lack of diversification, adverse developments in the tanker shipping industry have a significantly greater impact on our financial condition and results of operations than if we maintained more diverse assets or lines of business. Adverse developments in the tanker business could therefore reduce our ability to meet our payment obligations and our profitability.
“Peak oil” is the year when the maximum rate of extraction of oil is reached. Recent forecasts of “peak oil” range from 2019 to the 2040s, depending on economics and how governments respond to global warming. Irrespective of “peak oil”, the continuing shift in consumer demand from oil towards other energy resources such as wind energy, solar energy, hydrogen energy or nuclear energy, which shift appears to be accelerating as a result of the COVID situation, as well shift in government commitments and support for energy transition programs, may have a material adverse effect on our future performance, results of operations, cash flows and financial position.
Seaborne trading and distribution patterns are primarily influenced by the relative advantage of the various sources of production, locations of consumption, pricing differentials and seasonality. Changes to the trade patterns of oil and oil products may have a significant negative or positive impact on the ton-mile and therefore the demand for our tankers. This could have a material adverse effect on our future performance, results of operations, cash flows and financial position.
Any decrease in shipments of crude oil may adversely affect our financial performance.
The demand for our vessels and services in transporting oil derives primarily from demand for Arabian Gulf, West African, North Sea, Caribbean Gulf and Gulf of Mexico crude oil, which, in turn, primarily depends on the economies of the world'sworld’s industrial countries and competition from alternative energy sources. A wide range of economic, social and other factors can significantly affect the strength of the world's industrial economies and their demand for crude oil from the mentioned geographical areas. One such factor is the price of worldwide crude oil. The world'sworld’s oil markets have experienced high levels of volatility in the last 25 years. In 2017, crude oil reached a high of $60.46 per barrel (WTI)/$66.80 per barrel (Brent) and a low of $42.53 per barrel (WTI)/$45.31 per barrel (Brent). As of March 1, 2018, crude oil was $60.99 per barrel (WTI)/$54.08 per barrel (Brent).
Any decrease in shipments of crude oil or changes in trade patterns from the above-mentioned geographical areas could have a material adverse effect on our financial performance. Among the factors which could lead to such a decrease are:
•increased crude oil production from other areas, including the exploitation of shale reserves in the United States and the growth in its domestic oil production and exportation;
•increased refining capacity in the Arabian Gulf or West Africa;
•increased use of existing and future crude oil pipelines;
•a decision by Arabian Gulf, orRussia, US, West African or other oil-producing nations to increase their crude oil prices or to further decrease or limit their crude oil production;
•armed conflict in the Arabian Gulf and West Africa and political or other factors;
•trade wars, tariffs, trade embargoes or other economic sanctions by the United States and other countries (including the economic sanctions against Russia as a result of continued political tension due to the situation in Ukraine and the Ukraine)economic sanctions against Iran and Venezuela); and
•the development and the relative costs of nuclear power, natural gas, coal and other alternative sources of energy.
In addition, conditions affecting the world economy generally and the economics of the United States, China and the world economies such as ChinaIndia specifically may result in reduced consumption of oil products and a decreased demand for our vessels and lower charter rates, which could have a material adverse effect on our earnings and our ability to pay dividends.
An over-supply
The outlook for global oil and tanker demand is highly uncertain due to the continuing development of tanker capacitythe COVID-19 outbreak and its impact on the global economy. The extent of the decline is unknown and will depend on how long current restrictions over travel and economic activity in many countries across the globe remain in place. Governments have approved large stimulus packages to mitigate the effects of the sudden decline in economic activity caused by the COVID-19 pandemic; however, we cannot predict the extent to which these measures will restore or sustain the business and financial condition of companies in the shipping industry. The timing of a potential recovery in economic activity, and therefore oil demand, is also uncertain at this time. The large build-up of oil inventories, both onshore and at sea, may lead toresult in period of reduced oil shipments and a reduction indecreased demand for our vessels and lower charter rates, vessel values, and profitability.
The market supply of tankers is affected by a number of factors, such as supply and demand for energy resources, including oil and petroleum products, supply and demand for seaborne transportation of such energy resources, the current and expected purchase orders for newbuildings and the number of vessels being scrapped. If the capacity of new tankers delivered exceeds the capacity of tankers being scrapped or converted to non-trading tankers, tanker capacity will increase. If the supply of tanker capacity increases and if the demand for tanker capacity decreases or does not increase correspondingly, charter rateswhich could materially decline. A reduction in charter rates and the value of our vessels may have a material adverse effect on our business, results of operations, cash flows, financial condition and our ability to make dividend payments to our shareholders.
The instability of the Euro or the inability of countries to refinance their debts could have a material adverse effect on our revenue, profitability and financial position.
As a result of the European credit crisis specifically in Greece, Italy, Ireland, Portugal and Spain, the European Commission created the European Financial Stability Facility, or the EFSF, and the European Financial Stability Mechanism, or the EFSM, to provide funding to Eurozone countries in financial difficulties that seek such support. In March 2011, the European Council agreed that Eurozone countries should establish a permanent stability mechanism, the European Stability Mechanism, or the ESM, which was activated by mutual agreement, to assume the role of the EFSF and the EFSM in providing external financial assistance to Eurozone countries entered into force in May 2013. Despite these measures, and against the background of the COVID-19 outbreak, concerns persist regarding the debt burden of certain Eurozone countries and their ability to meet future financial obligations and the overall stability of the Euro. An extended period of adverse development in the outlook for European countries could still reduce the overall demand for oil and thus for our services. These potential developments, or market perceptions concerning these and related issues, could affect our financial position, results of operations and available cash and our ability to comply with the covenants in our loan agreements.flow.
Our growth in the offshore floating, storage and offloading (FSO) sector depends on the level of activity in the offshore oil and natural gas industry, which is significantly affected by, among other things, volatile oil and natural gas prices, and may be materially and adversely affected by a decline in the offshore oil and natural gas industry.
The offshore production, storage and export industry is cyclical and volatile. Our growth strategy is partially based on expansion in the offshore FSO sector, which depends on the level of activity in oil and natural gas exploration, development and production in offshore areas worldwide. The availability of quality FSO prospects, exploration success, relative production costs, the stage of reservoir development and political and regulatory environments affect customers' FSO programs. Oil and natural gas prices and market expectations of potential changes in these prices also significantly affect this level of activity and demand for offshore units.
Our results of operations are subject to seasonal fluctuations, which may adversely affect our financial condition.
We operate our vessels in markets that have historically exhibited seasonal variations in demand and, as a result, charter rates. Peaks in tanker demand quite often precede seasonal oil consumption peaks, as refiners and suppliers anticipate consumer demand. Seasonal peaks in oil demand can broadly be classified into two main categories: (1) increased demand prior to Northern Hemisphere winters as heating oil consumption increases and (2) increased demand for gasoline prior to the summer driving season in the United States. Unpredictable weather patterns and variations in oil reserves disrupt tanker scheduling. This seasonality may result incause quarter-to-quarter volatility in our operating results, as many of our vessels trade in the spot market. Seasonal variations in tanker demand will affect any spot market related rates that we may receive.
Acts of piracy on ocean-going vessels could adversely affect our business.
Acts of piracy have historically affected ocean-going vessels trading in regions of the world such as the South China Sea, the Indian Ocean, the Gulf of Guinea and in the Gulf of Aden off the coast of Somalia. Over the past few years, the frequency of piracy incidents in the Gulf of AdenSomalia and in the Indian Ocean has decreased significantly and the situation inparticular the Gulf of Guinea has nowregion off Nigeria, which continues to experience increased and more or less stabilized, whereas there has been an increaseviolent incidents of piracy in the South China Sea.2020 and so far into 2021. If these piracy attacks occur in regions in which our vessels are deployed being characterized by insurers as "enhanced risk"“enhanced risk” zones or “war risk” zones or “war and strikes” listed areas by the Joint War Committee, premiums payable for such coverage could increase significantly and such insurance coverage may be more difficult to obtain. In addition, crew and security equipment costs, as well as costs which may be incurred to the extent we employ onboard security armed guards or to the extent we hire in military patrol boats to escort the vessels, could increase in such circumstances. We may not be adequately insured to cover losses from these incidents, which could have a material adverse effect on us. In addition, detention or hijacking as a result of an act of piracy against our vessels, or an increaseincreases in cost associated with seeking to avoid such events (including increased bunker costs resulting from vessels being rerouted or traveling at increased speeds as recommended by BMP5), or unavailability of insurance for our vessels, could have a material adverse impact on our business, results of operations, ability to pay dividends, cash flows and financial condition and may result in loss of revenues, increased costs and decreased cash flows to our customers, which could impair their ability to make payments to us under our charters.
The current state
Political instability, terrorist attacks, international hostilities and global public health threats can affect the seaborne transportation industry, which could adversely affect our business.
We conduct most of our operations outside of the globalUnited States, and our business, results of operations, cash flows, financial banking markets may adversely impact ourcondition and ability to obtain additional financing on acceptable termspay dividends, if any, in the future may be adversely affected by changing economic, political and otherwise negatively impactgovernment conditions in the countries and regions where our business.
Global financial banking markets and economic conditions have been, and continuevessels are employed or registered. Moreover, we operate in a sector of the economy that is likely to be volatile. Although capital markets have improved, they still remain volatile. Since 2008, there has been a general decline inadversely impacted by the willingnesseffects of banks and other financial institutions to extend credit, particularly inpolitical conflicts.
Currently, the shipping industry, due to the historically volatile asset values of vessels. As the shipping industry is highly dependent on the availability of credit to finance and expand operations, it has been negatively affected by this decline.
As a result of concerns about the stability of financial markets generally and the solvency of counterparties specifically, the cost of obtaining money from the credit markets may increase as many lenders have increased interest rates, enacted tighter lending standards, refused to refinance existing debt at all or on terms similar to current debt and reduced, and in some cases ceased, to provide funding to borrowers. Due to these factors, additional financing may not be available if needed and to the extent required, on acceptable terms or at all. If additional financing is not available when needed, or is available only on unfavorable terms, we may be unable to expand or meet our obligations as they come due or we may be unable to enhance our existing business, complete additional vessel acquisitions or otherwise take advantage of business opportunities as they arise.
If economic conditions throughout the world continue to be volatile, it could impede our operations.
The world economy faces a number of challenges, including the effects of volatile oil prices, trade tensions between the United States and China and between the United States and the European Union, continuing turmoil and hostilities in the Middle East, the Korean Peninsula, North Africa, Venezuela, Iran and other geographic areas and countries, continuing economic weakness in the European Union, geopolitical events such as the withdrawal of the U.K. from the European Union ("Brexit"), continuing threat of terrorist attacks around the world, continuing instability and conflicts and other recent occurrences in the Middle East and in other geographic areas and countries continuing economic weaknesssuch as those between the United States and North Korea or Iran, or between the Houthi and Arab counties in the European Union,Yemen, or the E.U.,internally in Libya, and stabilizing growth in China, as well as the public health concerns stemming from the COVID-19 outbreak.
The threat of future terrorist attacks around the world, continues to cause uncertainty in the world's financial markets and international commerce and may affect our business, operating results and financial condition. Continuing conflicts and recent developments in the Middle East, may lead to additional acts of terrorism and armed conflict around the world, which may contribute to further economic instability in the global financial markets and international commerce. Additionally, any escalations between the United States and Iran could result in retaliation from Iran that could potentially affect the shipping industry, through increased attacks on vessels in the Strait of Hormuz (which already experienced an increased number of attacks on and seizures of vessels in 2019 and 2020). These uncertainties could also adversely affect our ability to obtain additional financing or insurance on terms acceptable to us or at all. Any of these occurrences could have a material adverse impact on our operating results, revenues and costs.
Additionally, in Europe, large sovereign debts and fiscal deficits, low growth prospects and high unemployment rates in a number of countries have contributed to the rise of Eurosceptic parties, which advocate for their countries to leave the Euro. Brexit further increases the risk of additional trade protectionism. Brexit, or similar events in other jurisdictions, could impact global markets, including foreign exchange and securities markets; any resulting changes in currency exchange rates, tariffs, treaties and other regulatory matters could in turn adversely impact our business and operations.
In June 2016, a majority of voters in the U.K. elected to withdraw from the EU in a national referendum (informally known as “Brexit”), a process that the government of the U.K. formally initiated in March 2017. Since then, the U.K. and the EU have been negotiating the terms of a withdrawal agreement, which was approved in October 2019 and ratified in January 2020. The U.K. formally exited the EU on January 31, 2020, although a transition period remained in place until December 2020, during which the U.K. was subject to the rules and regulations of the EU. On December 24, 2020, the U.K. and the EU entered into a trade and cooperation agreement (the “Trade and Cooperation Agreement”), which was applied on a provisional basis from January 1, 2021. While the new economic relationship does not match the relationship that existed while the U.K. was a member state of the EU, the Trade and Cooperation Agreement sets out preferential arrangements in certain areas such as trade in goods and in services, digital trade and intellectual property. Negotiations between the U.K. and the EU are expected to continue in relation to other areas which are not covered by the Trade and Cooperation Agreement. The long term effects of Brexit will depend on the effects of the implementation and application of the Trade and Cooperation Agreement and any other relevant agreements between the U.K. and EU.
Brexit has also given rise to calls for the governments of other EU member states to consider withdrawal. These developments and uncertainties, or the perception that any of them may occur, have had and may continue to have a material adverse effect on global economic conditions and the stability of global financial markets, and may significantly reduce global market liquidity and restrict the ability of key market participants to operate in certain financial markets. Any of these factors could depress economic activity and restrict our access to capital, which could have a material adverse effect on our business and on our consolidated financial position, results of operations and our ability to pay distributions. Additionally, Brexit or similar events in other jurisdictions, could impact global markets, including foreign exchange and securities markets; any resulting changes in currency exchange rates, tariffs, treaties and other regulatory matters could in turn adversely impact our business and operations.
Brexit contributes to considerable uncertainty concerning the current and future economic environment. Brexit could adversely affect European or worldwide political, regulatory, economic or market conditions and could contribute to instability in global political institutions, regulatory agencies and financial markets.
Further, governments may turn to trade barriers to protect their domestic industries against foreign imports, thereby depressing shipping demand. In particular, leaders in the United States have indicated that the United States may seek to implement more protective trade measures. The results of the 2020 presidential election in the United States have created significant uncertainty about the future relationship between the United States, China and other exporting countries, including with respect to trade policies, treaties, government regulations and tariffs. For example, in March 2018, former President Trump announced tariffs on imported steel and aluminum into the United States that could have a negative impact on international trade generally and in January 2019, the United States announced sanctions against Venezuela, which may have an effect on its oil output and in turn affect global oil supply. However, it is not yet clear how the United States administration under President Biden may deviate from the former administration’s protectionist foreign trade policies. Protectionist developments, or the perception that they may occur, may have a material adverse effect on global economic conditions, and may significantly reduce global trade. Moreover, increasing trade protectionism may cause an increase in (a) the cost of goods exported from regions globally, (b) the length of time required to transport goods and (c) the risks associated with exporting goods. Such increases may significantly affect the quantity of goods to be shipped, shipping time schedules, voyage costs and other associated costs, which could have an adverse impact on the shipping industry, and therefore, our charterers and their business, operating results and financial condition and could thereby affect their ability to make timely charter hire payments to us and to renew and increase the number of their time charters with us. This could have a material adverse effect on our business, results of operations, financial condition and our ability to pay any cash distributions to our shareholders.
In addition, public health threats such as influenza and other highly communicable diseases or viruses, outbreaks of which have from time to time occurred in various parts of the world in which we operate, including China, Japan and South Korea. Such outbreaks may even develop into pandemics, as the COVID-19 virus has, which could lead to a significant decrease of demand for the transportation of crude oil. Such events may also adversely impact our operations, including timely rotation of our crews, the timing of completion of any outstanding or future newbuilding projects or repair works in drydock as well as the operations of our customers. Delayed rotation of crew may adversely affect the mental and physical health of our crew and the safe operation of our vessels as a consequence.
An economic slowdown or changes in the economic and political environment in the Asia Pacific region could have a material adverse effect on our business, financial condition and results of operations.
We anticipate a significant number of the port calls made by our vessels will continue to involve loading or discharging operations in ports in the Asia Pacific region. As a result, any negative changes in economic conditions in any Asia Pacific country, particularly in China, may have a material adverse effect on our business, financial condition and results of operations, as well as our future prospects. Before the global economic financial crisis that began in 2008, China had one of the world's fastest growing economies in terms of gross domestic product, or GDP, which had a significant impact on shipping demand. The quarterly year-over-year growth rate of China's GDP decreased to 2.3% for the year ended December 31, 2020, as compared to 6.0% for the year ended December 31, 2019, and continues to remain below pre-2008 levels. We can provide no assurances that the Chinese economy will not continue to contract in the future. Furthermore, there is a rising threat of a Chinese financial crisis resulting from massive personal and corporate indebtedness and “trade wars”. Additionally, following the emergence of COVID-19, China experienced reduced industrial activity with temporary closures of factories and other facilities, labor shortages and restrictions on travel. The outbreak of COVID-19 is a very negative development for the global economy and has led to a worldwide economic contraction. We cannot assure you that the global economy will not continue to contract in the future or that global GDP will not be affected beyond the IMF’s initial forecast.
Although state-owned enterprises still account for a substantial portion of the Chinese industrial output, in general, the Chinese government is reducing the level of direct control that it exercises over the economy through state plans and other measures. There is an increasing level of freedom and autonomy in areas such as allocation of resources, production, pricing and management and a gradual shift in emphasis to a "market economy" and enterprise reform. If the Chinese government does not continue to pursue a policy of economic reform, the level of imports to and exports from China could be adversely affected by changes to these economic reforms by the Chinese government, as well as by changes in political, economic and social conditions or other relevant policies of the Chinese government, such as changes in laws, regulations or export and import restrictions.
Notwithstanding economic reform, the Chinese government may adopt policies that favor domestic oil tanker companies and may hinder our ability to compete with them effectively. For example, China imposes a tax for non-resident international transportation enterprises engaged in the provision of services of passengers or cargo, among other items, in and out of China using their own, chartered or leased vessels. The regulation may subject international transportation companies to Chinese enterprise income tax on profits generated from international transportation services passing through Chinese ports. This tax or similar regulations, such as the recently promoted environmental taxes on coal, by China may result in an increase in the cost of raw materials imported to China and the risks associated with importing raw materials to China, as well as a decrease in any raw materials shipped from our charterers to China. This could have an adverse impact on our charterers’ business, operating results and financial condition and could thereby affect their ability to make timely charter hire payments to us and to renew and increase the number of their time charters with us. Moreover, an economic slowdown in the economies of the European Union and other Asian countries may further adversely affect economic growth in China and elsewhere.
In addition, President Xi Jinping committed his country to achieving carbon neutrality by 2060 at the United Nations ("the UN") General Assembly despite carbon emissions currently being a prominent part of China’s economic and industrial structure as it relies heavily on nonrenewable energy sources, generally lacks of energy efficiency, and has a rapidly growing energy demand. Depending on how China attempts to achieve carbon neutrality by 2060, including through the reduction in the use of oil, an overall increase in the use of nonrenewable energy as part of the energy consumption mix and through other means, any reduction in the demand for oil and oil products and our tanker vessels could have a material adverse effect on our business, cash flows and results of operations.
Outbreaks of epidemic and pandemic diseases and governmental responses thereto could adversely affect our business.
The outbreak of COVID-19 has negatively affected economic conditions, the supply chain, the labor market, the demand for shipping regionally as well as globally and may otherwise impact our operations and the operations of our customers and suppliers. In March 2020, the outbreak of COVID-19 was declared a pandemic by the World Health Organization (“WHO”). Governments in affected countries have been and continue to impose travel bans, quarantines and other emergency public health measures. With the second and third wave of COVID-19 in 2020 and beginning of 2021, companies continue to take precautions, such as requiring employees to work remotely, imposing travel restrictions and temporarily closing businesses. These restrictions, and future prevention and mitigation measures, are likely to have an adverse impact on global economic conditions, which could materially and adversely affect our future operations. Continuing uncertainties regarding the economic impact of the COVID-19 outbreak are likely to result in sustained market turmoil, which could also negatively impact our business, financial condition and cash flows. Governments are approving large stimulus packages to mitigate the effects of the sudden decline in economic activity caused by the pandemic; however, we cannot predict the extent to which these measures will be sufficient to restore or sustain the business and financial condition of companies in the shipping industry.
Effects of the current pandemic may include, among others: deterioration of economic conditions and activity and of demand for oil and other petroleum products; operational disruptions to us (such as but not limited to crew rotation and crew fatigue) or our customers due to worker health risks and the effects of new regulations, directives or practices implemented in response to the pandemic (such as travel restrictions for individuals and vessels and quarantining and physical distancing); potential delays in (a) the loading and discharging of cargo on or from our vessels, (b) vessel inspections and related certifications by class societies, customers or government agencies and (c) maintenance (including access to spare parts), modifications or repairs to, or drydocking of, our existing vessels due to worker health or other business disruptions; reduced cash flow and financial condition, including potential liquidity constraints; potential reduced access to capital as a result of any credit tightening generally or due to continued declines in global financial markets; potential reduced ability to opportunistically sell any of our vessels on the second-hand market, either as a result of a lack of buyers or a general decline in the value of second -hand vessels; potential decreases in the market values of our vessels and any related impairment charges or breaches relating to vessel-to-loan financial covenants; potential disruptions, delays or cancellations in the construction of new vessels, which could reduce our future growth opportunities; potential non-performance by counterparties relying on force majeure clauses and potential deterioration in the financial condition and prospects of our customers, joint venture partners or other business partners. Although disruption and effects from the COVID-19 pandemic may be temporary, given the dynamic nature of these circumstances, the duration of business disruption and the related financial impact can still not be reasonably estimated at this time, but could materially affect our business, results of operations and financial condition.
More concretely however in 2020, the biggest operational challenge was conducting crew changes. Apart from serious humanitarian and crew welfare concerns, and issues of regulatory compliance, there is an increasing risk that fatigue will lead to serious maritime accidents. As well as restrictions placed on the movement of seafarers by national and local authorities, there is also the problem of the continued suspension of the majority of flights between major crew change ports and the home country of the Company’s crew. In order to resolve the difficult situation, Euronav’s management decided to accommodate deviations by ships to facilitate crew changes, resulting in an extra cost (USD 1.8 million) and less revenues because of off hire ( USD 4.2 million) .
If economic conditions throughout the world decline, this will impede our results of operations, financial condition and cash flows.
There has historically been a strong link between the development of the world economy and demand for energy, including oil and gas. An extended period of deterioration in the outlook for the world economy could reduce the overall demand for oil and gas and for our services. Such changes could adversely affect our results of operations and cash flows.
Credit markets in the United States and Europe have in the past experienced significant contraction, de-leveraging and reduced liquidity, and there is a risk that the U.S. federal government and state governments and European authorities continue to implement a broad variety of governmental action and/or new regulation of the financial markets. Global financial markets and economic conditions have been, and continue to be, severely disrupted and volatile.
We face risks attendant to changes in economic environments, changes in interest rates, and instability in the banking and securities markets around the world, among other factors. WeMajor market disruptions may adversely affect our business or impair our ability to borrow amounts under our credit facilities or any future financial arrangements. In the absence of available financing, we also may be unable to take advantage of business opportunities or respond to competitive pressures.
As a result of any renewed concerns about the stability of financial markets generally and the solvency of counterparties specifically, the cost of obtaining money from the credit markets may increase as many lenders will increase margins or interest rates, enact tighter lending standards, refuse to refinance existing debt at all or on terms similar to current debt and reduce, and in some cases cease, to provide funding to borrowers. Furthermore, certain banks that have historically been significant lenders to the shipping industry have reduced or ceased lending to the shipping industry. Due to these factors, we cannot predict how longbe certain that additional financing will be available if needed and to the current market conditions will last. However, these recent and developingextent required, on acceptable terms or at all. If additional financing is not available when needed, or is available only on unfavorable terms, we may be unable to meet our obligations as they come due or we may be unable to enhance our existing business or otherwise take advantage of business opportunities as they arise. Relatedly, certain banks have reduced or ceased lending for oil cargoes, which could have an adverse economic and governmental factors, together with the concurrent decline in charter rates and vessel values, may have a material adverse effectimpact on our resultscustomers.
In addition, concerns regarding the possibility of operations andsovereign debt defaults by European Union member countries have in the past disrupted financial conditionmarkets throughout the world, and may causelead to weaker consumer demand in the price of our ordinary shares to decline.
The instabilityEuropean Union, the United States, and other parts of the world. The possibility of sovereign debt defaults by European Union member countries and the possibility of market reforms to float the Chinese renminbi, either of which development could weaken the Euro oragainst the inabilityChinese renminbi, could adversely affect consumer demand in the European Union. Moreover, the revaluation of countries to refinance their debtsthe renminbi may negatively impact the United States' demand for imported goods, many of which are shipped from China. Future weak economic conditions could have a material adverse effect on our revenue, profitability and financial position.
As a result of the credit crisis in Europe, in particular in Greece, Italy, Ireland, Portugal and Spain, the European Commission created the European Financial Stability Facility, or the EFSF, and the European Financial Stability Mechanism, or the EFSM, to provide funding to Eurozone countries in financial difficulties that seek such support. In March 2011, the European Council agreed on the need for Eurozone countries to establish a permanent stability mechanism, the European Stability Mechanism, or the ESM, which was activated by mutual agreement, to assume the role of the EFSF and the EFSM in providing external financial assistance to Eurozone countries entered into force in May 2013. Despite these measures, concerns persist regarding the debt burden of certain Eurozone countries and their ability to meet future financial obligations and the overall stability of the Euro. An extended period of adverse development in the outlook for European countries could still reduce the overall demand for oil and gas and for our services. These potential developments, or market perceptions concerning these and related issues, could affect our financial position,business, results of operations and cash flow.financial condition and our ability to pay dividends to our stockholders.
Consolidation and governmental regulation of suppliers may increase the cost of obtaining supplies or restrict our ability to obtain needed supplies, which may have a material adverse effect on our results of operations and financial condition.
We rely on third-parties to provide supplies and services necessary for our operations, including equipment suppliers, caterers and machinery suppliers. Recent mergers havesuppliers, and are generally dependent on original manufacturers for repair and replacement of equipment. Ongoing consolidation has reduced the number of available suppliers, resulting in fewer alternatives for sourcing key supplies. With respect to certain items, we are generally dependent upon the original equipment manufacturer for repair and replacement of the item or its spare parts. Such consolidation may result in a shortage of supplies and services thereby increasing the cost of supplies and/or potentially inhibiting the ability of suppliers to deliver on time. These cost increases or delays could have a material adverse effect on our results of operations and result in downtime, and delays in the repair and maintenance of our vessels and FSOs. Furthermore, many of our suppliers are U.S. companies or non-U.S. subsidiaries owned or controlled by U.S. companies, which means that in the event a U.S. supplier was debarred or otherwise restricted by the U.S. government from delivering products, our ability to supply and service our operations could be materially impacted. In addition, through regulation and permitting, certain foreign governments effectively restrict the number of suppliers and technicians available to supply and service our operations in those jurisdictions, which could materially impact our operations and financial condition.
Our international operations expose us to additional costs and legal and regulatory risks, which could have a material adverse effect on our business, results of operations and financial conditions
We operate worldwide, where appropriate, through agents or other intermediaries. Compliance with complex local, foreign and U.S. laws and regulations that apply to our international operations increases our cost of doing business. These numerous and sometimes conflicting laws and regulations include, among others, data privacy requirements (in particular the European General Data Protection Regulation, enforceable as from May 25, 2018 and the EU-US Privacy Shield Framework, as adopted by the European Commission on July 12, 2016), labor relations laws, tax laws, anti-competition regulations, import and trade restrictions, export requirements, U.S. laws such as the FCPA and other U.S. federal laws and regulations established by the office of Foreign Asset Control, local laws such as the UK Bribery Act 2010 or other local laws which prohibit corrupt payments to governmental officials or certain payments or remunerations to customers.
Given the high level of complexity of these laws, there is a risk that we, our agent or other intermediaries may inadvertently breach some provisions.certain provisions thereunder. Violations of these laws and regulations could result in fines, criminal sanctions against us, our officers or our employees, requirements to obtain export licenses, cessation of business activities in sanctioned countries, implementation of compliance programs, and prohibitions on the conduct of our business. Violations of laws and regulations also could result in prohibitions on our ability to operate in one or more countries and could materially damage our reputation, our ability to attract and retain employees, or our business, results of operations and financial condition. Furthermore, detecting, investigating and resolving actual or alleged violations is expensive and can consume significant time and attention of our senior management.
We are subject to complex laws and regulations, including environmental laws and regulations that can adversely affect our business, results of operations, cash flows, financial condition, and our available cash.
Our operations are subject to numerous laws and regulations in the form of international conventions and treaties, national, state and local laws and national and international regulations in force in the jurisdictions in which our vessels operate or are registered, which can significantly affect the ownership and operation of our vessels. These requirements include, but are not limited to, the United States ,or U.S., Oil Pollution Act of 1990, or OPA, the U.S. Comprehensive Environmental Response, Compensation and Liability Act of 1980, or CERCLA, the U.S. Clean Air Act, or the CAA, the U.S. Clean Water Act, or the CWA, the U.S. Marine Transportation Security Act of 2002, or the MTSA, European Union or E.U., regulations, regulations of the United Nations International Maritime Organization, or the IMO, including the International Convention for the Prevention of Pollution from Ships of 1973, as from time to time amended and generally referred to as MARPOL, including the designation of Emission Control Areas, or ECAs, thereunder, the International Convention on Load Lines of 1966, and the International Ship and Port Facility Security Code, or the ISPS Code. Compliance with such laws and regulations, where applicable, may require installation of costly equipment or operational changes and may affect the resale value or useful lives of our vessels. We may also incur additional costs in order to comply with other existing and future regulatory obligations, including, but not limited to, costs relating to air emissions including greenhouse gases, the management of ballast waters, maintenance and inspection, development and implementation of emergency Though we have implemented monitoring procedures and insurance coveragerequired policies, guidelines, contractual terms and audits, these measures may not prevent or other financial assurance ofdetect failures by our ability to address pollution incidents. Oil spills that occur from time to time may also result in additional legislativeagents or regulatory initiatives that may affect our operations or require us to incur additional expenses to comply with such new laws or regulations.intermediaries regarding compliance.
These costs could have a material adverse effect on our business, results of operations, cash flows and financial condition and our available cash. A failure to comply with applicable laws and regulations may result in administrative and civil penalties, criminal sanctions or the suspension or termination of our operations. Environmental laws often impose strict liability for remediation of spills and releases of oil and hazardous substances, which could subject us to liability without regard to whether we were negligent or at fault. Under OPA, for example, owners, operators and bareboat charterers are jointly and severally strictly liable for the discharge of oil within the 200-nautical mile exclusive economic zone around the U.S. (unless the spill results solely from the act or omission of a third-party, an act of God or an act of war). An oil spill could result in significant liability, including fines, penalties, criminal liability and remediation costs for natural resource damages under international and U.S. federal, state and local laws, as well as third-party damages, including punitive damages, and could harm our reputation with current or potential charterers of our tankers. We are required to satisfy insurance and financial responsibility requirements for potential oil (including marine fuel) spills and other pollution incidents. Although we have arranged insurance to cover certain environmental risks, there can be no assurance that such insurance will be sufficient to cover all such risks or that any claims will not have a material adverse effect on our business, results of operations, cash flows, financial condition and available cash.
It should be noted that the U.S. is currently experiencing changes in its environmental policy, the results of which have yet to be fully determined. For example, in April 2017, the U.S. President signed an executive order regarding environmental regulations, specifically targeting the U.S. offshore energy strategy, which may affect parts of the maritime industry and our operations. Furthermore, recent action by the IMO’s Maritime Safety Committee and United States agencies indicate that cybersecurity regulations for the maritime industry are likely to be further developed in the near future in an attempt to combat cybersecurity threats. For example, cyber-risk management systems must be incorporated by ship-owners and managers by 2021. This might cause companies to cultivate additional procedures for monitoring cybersecurity, which could require additional expenses and/or capital expenditures. However, the impact of such regulations is hard to predict at this time.
If we fail to comply with international safety regulations, we may be subject to increased liability, which may adversely affect our insurance coverage and may result in a denial of access to, or detention in, certain ports.
The operation of our vessels is affected by the requirements set forth in the IMO's International Management Code for the Safe Operation of Ships and for Pollution Prevention, or the ISM Code, promulgated by the IMO under the International Convention for the Safety of Life at Sea of 1974, or SOLAS.
Non-compliance with the ISM Code and other IMO regulations may subject the shipowner or bareboat charterer to increased liability, may lead to decreases in, or invalidation of, available insurance coverage for affected vessels and may result in the denial of access to, or detention in, some ports. The U.S. Coast Guard ("USCG") and E.U. Authorities enforce compliance with the ISM Code and prohibit non-compliant vessels from trading in U.S. and E.U. ports.
Climate change and greenhouse gas restrictions may adversely impact our operations and markets.
Due to concern over the risk of climate change, a number of countries and the IMO have adopted, or are considering the adoption of, regulatory frameworks to reduce greenhouse gas emissions. These regulatory measures may include, among others, adoption of cap and trade regimes, carbon taxes, increased efficiency standards and incentives or mandates for renewable energy. More specifically, on October 27, 2016, the International Maritime Organization’s Marine Environment Protection Committee announced its decision concerning the implementation of regulations mandating a reduction in sulfur emissions from 3.5% currently to 0.5% as of the beginning of 2020. By 2020 ships will now have to either remove sulfur from emissions or buy fuel with low sulfur content, which may lead to increased costs and supplementary investments for ship owners.
In addition, although the emissions of greenhouse gases from international shipping currently are not subject to the Kyoto Protocol to the United Nations Framework Convention on Climate Change, which required adopting countries to implement national programs to reduce emissions of certain gases, or the Paris Agreement (discussed further below), a new treaty may be adopted in the future that includes restrictions on shipping emissions. Compliance with changes in laws, regulations and obligations relating to climate change could increase our costs related to operating and maintaining our vessels and require us to install new emission controls, acquire allowances or pay taxes related to our greenhouse gas emissions or administer and manage a greenhouse gas emissions program. Revenue generation and strategic growth opportunities may also be adversely affected.
Adverse effects upon the oil and gas industry relating to climate change, including growing public concern about the environmental impact of climate change, may also adversely affect demand for our services. For example, increased regulation of greenhouse gases or other concerns relating to climate change may reduce the demand for oil and gas in the future or create greater incentives for use of alternative energy sources. In addition, the physical effects of climate change, including changes in weather patterns, extreme weather events, rising sea levels, scarcity of water resources, may negatively impact our operations. Any long-term material adverse effect on the oil and gas industry could have a significant financial and operational adverse impact on our business that we cannot predict with certainty at this time.
Declines in charter rates, vessel values and other market deterioration could cause us to incur impairment charges.
We evaluate the carrying amounts of our vessels to determine if events have occurred that would require an impairment of their carrying amounts. The recoverable amount of vessels is reviewed based on events and changes in circumstances that would indicate that the carrying amount of the assets might not be recovered. The review for potential impairment indicators and projection of future cash flows related to the vessels is complex and requires us to make various estimates relating to, among other things, vessel values, future freight rates, earnings from the vessels, discount rates and economic life of vessels. Many of these items have historically experienced volatility.
We evaluate the recoverable amount as the higher of fair value less costs to sell or value in use. If the recoverable amount is less than the carrying amount of the vessel, the vessel is deemed impaired. The carrying values of our vessels may not represent their fair market value at any point in time because the new market prices of secondhand vessels tend to fluctuate with changes in charter rates and the cost of newbuildings. For the years ended December 31, 2017 and 2016, we evaluated the recoverable amount of our vessels and we did not recognize an impairment loss. Factors that we considered in our estimate are described in the Critical Accounting policies. In particular, our estimate for future TCE rates is based on the trailing 10-year historical average spot rates for both VLCC and Suezmax tankers, which we believe is a reasonable basis for this determination. As 2008 was an exceptionally high year in terms of TCE achieved by both the VLCC and Suezmax fleets, the use of a 10-year range that excludes year 2008 may result in a reduction of the value in use used in the determination of the recoverable amount, compared to the 10-year range as of December 31, 2017 which includes 2008. Excluding the year 2008 from our determination of value in use, which would be the case when applying the 10-year range as of December 31, 2018, could result in an impairment loss for the year ending December 31, 2018.
We operate our vessels worldwide and as a result, our vessels are exposed to international risks and inherent operational risks of the tanker industry, which may adversely affect our business and financial condition.
The operation of an ocean-going vessel carries inherent risks.operational risks as well. Our vessels and their cargoes are at risk of being damaged or lost because of events such as marine disasters, bad weather, and acts of God, business interruptions caused by mechanical failures, grounding, fire, explosions and collisions, human error, war, terrorism, piracy, disease, quarantine and other circumstances or events. In addition,
Furthermore, changing economic, regulatory and political conditions in some countries, including political and military conflicts, have from time to time resulted in attacks on vessels, mining of waterways, piracy, terrorism, labor strikes and boycotts. These events may result in death or injury to persons, loss of revenues or property, the payment of ransoms, environmental damage, higher insurance rates, damage to our customer relationships, and market disruptions, delay or rerouting, which may also subject us to litigation. In addition, the operation of tankers has unique operational risks associated with the transportation of oil. An oil spill may cause significant environmental damage and the associated costs could exceed the insurance coverage available to us. Compared to other types of vessels, tankers are exposed to a higher risk of damage and loss by fire, whether ignited by a terrorist attack, collision, or other cause, due to the high flammability and high volume of the oil transported in tankers.
If our vessels suffer damage, they may need to be repaired at a drydocking facility. The costs of drydock repairs and maintenance are unpredictable and may be substantial.substantial, or it may be difficult to find space at a suitable drydocking facility. We may have to pay drydocking costs that our insurance does not cover in full. The loss of revenues while these vessels are being repaired and repositioned, as well as the actual cost of these repairs, may adversely affect our business and financial condition. In addition, space at drydocking facilities is sometimes limited and not all drydocking facilities are conveniently located. We may be unable to find space at a suitable drydocking facility or our vessels may be forced to travel to a drydocking facility that is not conveniently located to our vessels' positions. The loss of earnings while these vessels are forced to wait for space or to travel to more distant drydocking facilities may adversely affect our business and financial condition. Further, the total loss of any of our vessels could harm our reputation as a safe and reliable vessel owner and operator. If we are unable to adequately maintain or safeguard our vessels, we may be unable to prevent any such damage, costs, or loss which could negatively impact our business, financial condition, results of operations and available cash.
In addition, international shipping is subject to various security and customs inspection and related procedures in countries of origin and destination and trans-shipment points. Inspection procedures can result in the seizure of the cargo and/or our vessels, delays in the loading, offloading or delivery and the levying of customs duties, fines or other penalties against us. It is possible that changes to inspection procedures could impose additional financial and legal obligations on us. Furthermore, changes to inspection procedures could also impose additional costs and obligations on our customers and may, in certain cases, render the shipment of certain types of cargo uneconomical or impractical. Any such changes or developments may have a material adverse effect on our business, results of operations, cash flows, financial condition and available cash.
We are subject to complex laws and regulations, including environmental laws and regulations that can adversely affect our business, results of operations, cash flows, financial condition, and our available cash.
Our operations are subject to numerous laws and regulations in the form of international conventions and treaties, national, state and local laws and national and international regulations in force in the jurisdictions in which our vessels operate or are registered, which can significantly affect the ownership and operation of our vessels. Compliance with such laws and regulations, where applicable, may require installation of costly equipment or operational changes and may affect the resale value or useful lives of our vessels. We may also incur additional costs in order to comply with other existing and future regulatory obligations, including, but not limited to, costs relating to air emissions including greenhouse gases, the management of ballast waters, maintenance and inspection, development and implementation of emergency procedures and insurance coverage or other financial assurance of our ability to address pollution incidents. Oil spills that occur from time to time may also result in additional legislative or regulatory initiatives that may affect our operations or require us to incur additional expenses to comply with such new laws or regulations.
These costs could have a material adverse effect on our business, results of operations, cash flows and financial condition and our available cash. A failure to comply with applicable laws and regulations may result in administrative and civil penalties, criminal sanctions or the suspension or termination of our operations.
Environmental requirements can also affect the resale value or useful lives of our vessels, could require a reduction in cargo capacity, ship modifications or operational changes or restrictions, could lead to decreased availability of insurance coverage for environmental matters or could result in the denial of access to certain jurisdictional waters or ports or detention in certain ports. Under local, national and foreign laws, as well as international treaties and conventions, we could incur material liabilities, including clean-up obligations and natural resource damages liability, in the event that there is a release of hazardous materials from our vessels or otherwise in connection with our operations. Environmental laws often impose strict liability for remediation of spills and releases of hazardous substances, which could subject us to liability without regard to whether we were negligent or at fault. We could also become subject to personal injury or property damage claims relating to the release of hazardous substances associated with our existing or historic operations. Violations of, or liabilities under, environmental requirements can result in substantial penalties, fines and other sanctions, including, in certain instances, seizure or detention of our vessels and could harm our reputation with current or potential charterers of our tankers. We are required to satisfy insurance and financial responsibility requirements for potential oil (including marine fuel) spills and other pollution incidents. Although we have arranged insurance to cover certain environmental risks, there can be no assurance that such insurance will be sufficient to cover all such risks or that any claims will not have a material adverse effect on our business, results of operations, cash flows, financial condition and available cash.
In addition, many environmental requirements are designed to reduce the risk of pollution, such as from oil spills, and our compliance with these requirements could be costly. To comply with these and other regulations, including: (i) the sulfur emission requirements of Annex VI of the International Convention for the Prevention of Marine Pollution from Ships, or "MARPOL", which instituted a global 0.5% (lowered from 3.5% as of January 1, 2020) sulfur cap on marine fuel consumed by a vessel, unless the vessel is equipped with a scrubber, and (ii) the International Convention for the Control and Management of Ships' Ballast Water and Sediments of the International Maritime Organization, or "IMO", which requires vessels to install expensive ballast water treatment systems, we may be required to incur additional costs to meet new maintenance and inspection requirements, develop contingency plans for potential spills, and obtain insurance coverage. The increased demand for low sulfur fuels may increase the costs of fuel for our vessels that do not have scrubbers. Additional conventions, laws and regulations may be adopted that could limit our ability to do business or increase the cost of doing business and which may materially and adversely affect our operations.
Please see “Item 4. Information on the Company—B. Business Overview—Environmental and Other Regulations on Tankers and FSO's” for a discussion of the environmental and other regulations applicable to us.
We are subject to international safety regulation and if we fail to comply with international safety regulations, we may be subject to increased liability, which may adversely affect our insurance coverage and may result in a denial of access to, or detention in, certain ports.
The operation of our vessels is affected by government regulations in the form of international conventions, national, state and local laws and regulations in force in the jurisdictions in which the vessels operate, as well as in the country or countries of their registration. As such, we are subject to the requirements set forth in the IMO’s International Safety Management Code for the Safe Operation of Ships and for Pollution Prevention, or the ISM Code, the International Ship & Port Facility Security Code. or ISPS Code, promulgated by the IMO under the International Convention for the Safety of Life at Sea of 1974, or SOLAS, as well as to other conventions, mainly MARPOL, the International Convention on Standards of Training, Certification and Watchkeeping for Seafarers, or STCW, etc. Failure to comply with these requirements may subject us to increased liability, may decrease available insurance coverage for the affected ships, and may result in denial of access to, or detention in, certain ports. The U.S. Coast Guard or USCG and E.U. Authorities enforce compliance with the ISM and ISPS Codes and prohibit non-compliant vessels from trading in U.S. and E.U. ports. This could have a material adverse effect on our future performance, results of operations, cash flows and financial position. The IMO continues to review and introduce new regulations. It is impossible to predict what additional regulations, if any, may be passed by the IMO and what effect, if any, such regulations might have on our operations.
Because such conventions, laws, and regulations are often revised, we cannot predict the ultimate cost of complying with such conventions, laws and regulations or the impact thereof on the resale prices or useful lives of our vessels. Additional conventions, laws and regulations may be adopted which could limit our ability to do business or increase the cost of our doing business and which may materially adversely affect our operations. We are required by various governmental and quasi-governmental agencies to obtain certain permits, licenses, certificates, and financial assurances with respect to our operations.
Recent action by the IMO’s Maritime Safety Committee and United States agencies indicate that cybersecurity regulations for the maritime industry are likely to be further developed in the near future in an attempt to combat cybersecurity threats. For example, cyber-risk management systems must be incorporated by ship-owners and managers by 2021. This might cause companies to cultivate additional procedures for monitoring cybersecurity, which could require additional expenses and/or capital expenditures. However, the impact of such regulations is difficult to predict at this time.
Please see “Item 4. Information on the Company—B. Business Overview—Environmental and Other Regulations on Tankers and FSO's” for a discussion of the environmental and other regulations applicable to us.
Developments in safety and environmental requirements relating to the recycling of vessels may result in escalated and unexpected costs.
The 2009 Hong Kong International Convention for the Safe and Environmentally Sound Recycling of Ships, or the Hong Kong Convention, aims to ensure ships, being recycled once they reach the end of their operational lives, do not pose any unnecessary risks to the environment, human health and safety. The Hong Kong Convention, which would enter into force 24 months after the date on which 15 IMO Member States have ratified or approved, has yet to be ratified by the required number of countries to enter into force. Upon the Hong Kong Convention's entry into force, each ship sent for recycling will have to carry an inventory of its hazardous materials. The hazardous materials, whose use or installation are prohibited in certain circumstances, are listed in an appendix to the Hong Kong Convention. Ships will be required to have surveys to verify their inventory of hazardous materials initially, throughout their lives and prior to the ship being recycled.
On November 20, 2013, the European Parliament and the Council of the EU adopted the Ship Recycling Regulation, which retains the requirements of the Hong Kong Convention and requires that certain commercial seagoing vessels flying the flag of an EU Member State may be recycled only in facilities included on the European list of permitted ship recycling facilities.
These regulatory requirements may lead to cost escalation by shipyards, repair yards and recycling yards. This may then result in a decrease in the residual recycling value of a vessel which could potentially not cover the cost to comply with the latest requirements, which may have an adverse effect on our future performance, results of operations, cash flows and financial position.
Climate change and greenhouse gas restrictions may adversely impact our operations and markets.
Due to concern over the risk of climate change, a number of countries and the IMO have adopted, or are considering the adoption of, regulatory frameworks to reduce greenhouse gas emissions. These regulatory measures may include, among others, adoption of cap and trade regimes, carbon taxes, increased efficiency standards and incentives or mandates for renewable energy. More specifically, on October 27, 2016, IMO's Marine Environment Protection Committee ("MEPC") announced its decision concerning the implementation of regulations mandating a reduction in sulfur emissions from 3.5% currently to 0.5% as of the beginning of January 1, 2020. Additionally, in April 2018, nations at the MEPC 72 adopted an initial strategy to reduce greenhouse gas emissions from ships. The initial strategy identifies levels of ambition to reducing greenhouse gas emissions, including (1) decreasing the carbon intensity from ships through implementation of further phases of the Energy Efficiency Design Index (EEDI) for new ships; (2) reducing carbon dioxide emissions per transport work, as an average across international shipping, by at least 40% by 2030, pursuing efforts towards 70% by 2050, compared to 2008 emission levels; and (3) reducing the total annual greenhouse emissions by at least 50% by 2050 compared to 2008 while pursuing efforts towards phasing them out entirely. The European Union on the other hand has indicated that it intends to accelerate its plans to include shipping into the emissions trading scheme.
Since January 1, 2020, ships must either remove sulfur from emissions or buy fuel with low sulfur content, which may lead to increased costs and supplementary investments for ship owners. The interpretation of "fuel oil used on board" includes use in main engine, auxiliary engines and boilers. Shipowners may comply with this regulation by (i) using 0.5% sulfur fuels on board, which are available around the world but at a higher cost; (ii) installing scrubbers for cleaning of the exhaust gas; or (iii) by retrofitting vessels to be powered by liquefied natural gas or other alternative energy sources, which may not be a viable option due to the lack of supply network and high costs involved in this process. Costs of compliance with these regulatory changes may be significant and may have a material adverse effect on our future performance, results of operations, cash flows and financial position.
In addition, although the emissions of greenhouse gases from international shipping currently are not subject to the Kyoto Protocol to the United Nations Framework Convention on Climate Change, which required adopting countries to implement national programs to reduce emissions of certain gases, or the Paris Agreement (discussed further below), a new treaty may be adopted in the future that includes restrictions on shipping emissions. Compliance with changes in laws, regulations and obligations relating to climate change could increase our costs related to operating and maintaining our vessels and require us to install new emission controls, acquire allowances or pay taxes related to our greenhouse gas emissions or administer and manage a greenhouse gas emissions program. Revenue generation and strategic growth opportunities may also be adversely affected.
Adverse effects upon the oil and gas industry relating to climate change, including growing public concern about the environmental impact of climate change, may also adversely affect demand for our services. For example, increased regulation of greenhouse gases or other concerns relating to climate change may reduce the demand for oil and gas in the future or create greater incentives for use of alternative energy sources. In addition to the peak oil risk from a demand perspective, the physical effects of climate change, including changes in weather patterns, extreme weather events, rising sea levels, scarcity of water resources, may negatively impact our operations. Any long-term material adverse effect on the oil and gas industry could have a significant financial and operational adverse impact on our business that we cannot predict with certainty at this time.
Declines in charter rates, vessel values and other market deterioration could cause us to incur impairment charges.
We evaluate the carrying amounts of our vessels to determine if events have occurred that would require an impairment of their carrying amounts. The recoverable amount of vessels is reviewed based on events and changes in circumstances that would indicate that the carrying amount of the assets might not be recovered. The review for potential impairment indicators and projection of future cash flows related to the vessels is complex and requires us to make various estimates relating to, among other things, vessel values, future freight rates, earnings from the vessels, discount rates, residual values and economic life of vessels. Many of these items have historically experienced volatility and both charter rates and vessel values tend to be cyclical.
We evaluate the recoverable amount as the higher of fair value less costs to sell or value in use. Individual vessels are deemed to constitute a cash generating unit, or a CGU unless they are operated in a net revenue sharing pool. If the recoverable amount is less than the carrying amount of the vessel, the vessel is deemed impaired. The carrying values of our vessels may not represent their fair market value at any point in time because the new market prices of secondhand vessels tend to fluctuate with changes in charter rates and the cost of newbuildings. For the year December 31, 2020, we evaluated the recoverable amount of our vessels and we did not recognize an impairment loss. The carrying value of each of our vessels does not necessarily represent its fair market value or the amount that could be obtained if the vessel were sold. Our estimates of market values for our vessels assume that the vessels are all in good and seaworthy condition without need for repair and, if inspected, would be certified as being in class without notations of any kind. Our estimates are based on the estimated market values for vessels received from independent ship brokers and are inherently uncertain. In addition, because vessel values are highly volatile, these estimates may not be indicative of either the current or future prices that we could achieve if we were to sell any of the vessels. We would not record a loss for any of the vessels for which the fair market value is below its carrying value unless and until we either determine to sell the vessel for a loss or determine that the vessel is impaired, and / or not being part of a pool anymore. Factors that we considered in our estimate are described in the Critical Accounting policies.
In developing estimates of future cash flows, we must make assumptions about future performance, with significant assumptions being related to charter rates, ship operating expenses, utilization, drydocking requirements, residual value and the estimated remaining useful lives of the vessels. These assumptions are based on historical trends and/or on future expectations of expenses and potential investments pursuant to upcoming regulations, which can be difficult to predict. Specifically, in estimating future charter rates or service contract rates, management takes into consideration estimated daily rates for each asset over the estimated remaining lives. Management is continuously assessing the resilience of its projections to the business cycles that can be observed in the tanker market, and it concluded that a business cycle approach provides a good long-term view of the dynamics at play in the industry. By defining a shipping cycle from peak to peak over the last 20 years and including management's expectation of the completion of the current cycle, management is able to capture the full length of a business cycle while also giving more weight to recent and current market experience. The current cycle is forecasted based on management judgment, analyst reports, taking into considerations the length of recovery post Covid - 19 and past experience.
We may be subject to risks inherent in the conversion of vessels into FSOs and the operation of FSO activities.
Our FSO activities are subject to various risks, including delays, cost overruns, unavailability of supplies, employee negligence, defects in machinery, collisions, service damage to vessels, damage or loss to freight, piracy, war, political tensions or strikes. In case of delays in delivering an FSO vessel under service contract to the end-user, contracts can be amended and/or cancelled.canceled. Moreover, the operation of FSO vessels is subject to the inherent possibility of maritime disasters, such as oil spills and other environmental accidents, and to the obligations arising from the ownership and management of vessels in international trade. We have established current insurance against possible accidents and environmental damage and pollution that complies with applicable law and standard practices in the sector. However, there is no guarantee that such insurance will remain available at rates which are regarded as reasonable by us or that such insurance will remain sufficient to cover all losses incurred or the cost of each compensation claim made against us, or that ourus. Our insurance policies willdo not cover the loss of income resulting from a vessel becoming non-operational. Should compensation claims be made against us, our vessels may be impounded or subject to other judicial procedures, which would adversely affect our results of operations and financial condition.
If labor interruptions are not resolved in a timely manner, they could have a material adverse effect on our business, results of operations, cash flows, financial condition and ability to pay dividends.
We employ masters, officers and crews to man our vessels. If not resolved in a timely and cost-effective manner, industrial action or other labor unrest could prevent or hinder our operations from being carried out as we expect and could have a material adverse effect on our business, results of operations, cash flows, financial condition and ability to pay dividends.
Our labor costs and the operating restrictions that apply to us could increase as a result of collective bargaining negotiations and changes in labor laws and regulations, and disputes resulting in work stoppages, strikes, or disruptions could adversely affect our business.
The majority of our employees (land-based and offshore) are represented by collective bargaining agreements in Belgium, Greece, France and the Philippines. For a limited number of vessels, the employment of onboard staff is based on internationally negotiated collective bargaining agreements. In addition, many of these represented individuals are working under agreements that are subject to salary negotiation. These negotiations could result in higher personnel costs, other increased costs or increased operating restrictions that could adversely affect our financial performance. In addition, as part of our legal obligations, we are required to contribute certain amounts to retirement funds and pension plans (with insurance companies or integrated in a national social security scheme) and are bound to legal restrictions in our ability to dismiss employees. Any disagreements concerning ordinary or extraordinary collective bargaining may damage our reputation and the relationship with our employees and lead to labor disputes, including work stoppages, strikes and/or work disruptions, which could hinder our operations from being carried out normally, and if not resolved in a timely cost-effective manner, could have a material effect on our business.
World events could affect our results of operations and financial condition.
We conduct most of our operations outside of the U.S. and Belgium. Our business, results of operations, cash flows, financial condition and available cash may be adversely affected by the effects of political instability, terrorist or other attacks, war or international hostilities. Continuing conflicts and recent developments in the Middle East, the Korean Peninsula, North Africa, and other geographic regions and countries and the presence of the United States and other armed forces in certain of these regions may lead to additional acts of terrorism and armed conflict around the world, which may contribute to further world economic instability and uncertainty in global financial markets. As a result of the above, insurers have increased premiums and reduced or restricted coverage for losses caused by terrorist acts generally. Future terrorist attacks could result in increased volatility of the financial markets and negatively impact the U.S. and global economy. These uncertainties could also adversely affect our ability to obtain additional financing on terms acceptable to us or at all.
In the past, political instability has also resulted in attacks on vessels, mining of waterways and other efforts to disrupt international shipping, particularly in the Arabian Gulf region. Acts of terrorism and piracy have also affected vessels trading in regions such as the South China Sea and the Gulf of Aden off the coast of Somalia. Any of these occurrences could have a material adverse impact on our business, financial condition, results of operations and available cash.
In June 2016, a majority of voters in the United Kingdom elected to withdraw from the European Union in a national referendum (informally known as Brexit). The referendum was advisory, and the terms of any withdrawal are subject to a negotiation period that could last two years after the government of the United Kingdom formally initiated the withdrawal process by invoking Article 50 of the Treaty on European Union on March 29, 2017. It is not clear what impact this will have on the conduct of cross-border business, and this uncertain outcome could increase volatility in the markets and could increase our regulatory compliance costs. These developments have had and may continue to have a material adverse effect on global economic conditions. The withdrawal of the United Kingdom from the EU may lead to a downturn across the European economies, and there is a risk that other countries in the European Union will look to hold referendums on whether to stay in or leave the EU. The potential effects of Brexit could have unpredictable consequences for financial and shipping markets and may adversely affect our future performance, results of operations, cash flows and financial position.
If our vessels call on ports located in countries or territories that are the subject toof sanctions and embargosor embargoes imposed by the U.S. government, the European Union, the United Nations, or other governments, thatapplicable governmental authorities, it could lead to monetary fines or penalties and adversely affect our reputation and the market for our ordinary shares.
The U.S. government and other authorities have made certain countries subject to sanctions and embargoesAlthough no vessels owned or operated by us carry cargo from or have identified countries or other authorities as state sponsors of terrorism, such as Iran, Sudan, Syria and North-Korea. From time to time on charterers' instructions, our vessels may, always to the extent permitted under such sanctions and embargoes, callcalled on ports located in countries or territories that are the subject of country-wide or territory-wide comprehensive sanctions and/or embargoes imposed by the U.S. government or other applicable governmental authorities (“Sanctioned Jurisdictions”) in violation of sanctions or embargo laws during 2020, and we endeavor to take precautions reasonably designed to mitigate such countries. Sanctionsrisks, it is possible that, in the future, our vessels may carry cargo from or call on ports in Sanctioned Jurisdictions on charterers’ instructions and/or without our consent. If such activities result in violation of applicable sanctions or embargo laws, we could be subject to monetary fines, penalties, or other sanctions, and our reputation and the market for our ordinary shares could adversely affected.
The sanctions and embargo laws and regulations vary in their application, as they do not all apply to the same covered persons or proscribe the same activities, and such sanctions and embargo laws and regulations may be amended or strengthenedexpanded over time. In 2010, the U.S. enacted the Comprehensive Iran Sanctions Accountability and Divestment Act,Current or "CISADA," which expanded the scopefuture counterparties of the Iran Sanctions Act. Among other things, CISADA expands the application of the prohibitions on companies such as ours and introduces limits on the ability of companies and persons to do business or trade with Iran when such activities relate to the investment, supply or export of refined petroleum or petroleum products.
In 2012, President Obama signed Executive Order 13608 which prohibits foreign persons from violating or attempting to violate, or causing a violation of any sanctions in effect against Iran or facilitating any deceptive transactions for or on behalf of any person subject to U.S. sanctions. Any persons found to be in violation of Executive Order 13608 will be deemed a foreign sanctions evader and will be banned from all contacts with the U.S., including conducting business in US dollars. Also in 2012, President Obama signed into law the Iran Threat Reduction and Syria Human Rights Act of 2012, or the Iran Threat Reduction Act, which created new sanctions and strengthened existing sanctions. Among other things, the Iran Threat Reduction Act intensifies existing sanctions regarding the provision of goods, services, infrastructure or technology to Iran's petroleum or petrochemical sector. The Iran Threat Reduction Act also includes a provision requiring the President of the U.S. to impose five or more sanctions from Section 6(a) of the Iran Sanctions Act, as amended, on a person the President determines is a controlling beneficial owner of, or otherwise owns, operates, or controls or insures a vessel that was used to transport crude oil from Iran to another country and (1) if the person is a controlling beneficial owner of the vessel, the person had actual knowledge the vessel was so used or (2) if the person otherwise owns, operates, or controls, or insures the vessel, the person knew or should have known the vessel was so used. Such a person could be subject to a variety of sanctions, including exclusion from U.S. capital markets, exclusion from financial transactions subject to U.S. jurisdiction, and exclusion of that person's vessels from U.S. ports for up to two years.
On November 24, 2013, the P5+1 (the U.S., United Kingdom, Germany, France, Russia and China) entered into an interim agreement with Iran entitled the "Joint Plan of Action," or JPOA. Under the JPOA it was agreed that, in exchange for Iran taking certain voluntary measures to ensure that its nuclear program is used only for peaceful purposes, the U.S. and E.U. would voluntarily suspend certain sanctions for a period of six months. On January 20, 2014, the U.S. and the E.U. indicated that they would begin implementing the temporary relief measures provided for under the JPOA. These measures include, among other things, the suspension of certain sanctions on the Iranian petrochemicals, precious metals and automotive industries from January 20, 2014 until July 20, 2014. The JPOA was subsequently extended twice.
On July 14, 2015, the P5+1 and the E.U. announced that they reached a landmark agreement with Iran titled the Joint Comprehensive Plan of Action Regarding the Islamic Republic of Iran's Nuclear Program, or the JCPOA, which is intended to significantly restrict Iran's ability to develop and produce nuclear weapons for 10 years while simultaneously easing sanctions directed toward non-U.S. persons for conduct involving Iran, but taking place outside of U.S. jurisdiction and does not involve U.S. persons. On January 16, 2016, or the Implementation Day, the U.S. joined the E.U. and the United Nations in lifting a significant number of their nuclear-related sanctions on Iran following an announcement by the International Atomic Energy Agency, or IAEA, that Iran had satisfied its respective obligations under the JCPOA.
U.S. sanctions prohibiting certain conduct that is now permitted under the JCPOA have not actually been repealed or permanently terminated at this time. Rather, the U.S. government has implemented changes to the sanctions regime by: (1) issuing waivers of certain statutory sanctions provisions; (2) committing to refrain from exercising certain discretionary sanctions authorities; (3) removing certain individuals and entities from OFAC's sanctions lists; and (4) revoking certain Executive Orders and specified sections of Executive Orders. These sanctions will not be permanently "lifted" until the earlier of "Transition Day," set to occur on October 20, 2023, or upon a report from the IAEA stating that all nuclear material in Iran is being used for peaceful activities.
In addition, charterers and other parties that we have previously entered into contracts with regarding our vessels may be or become affiliated with persons or entities that are now or may soonin the future be the subject of sanctions imposed by the U.S. Government, and/or the E.U. European Union, and/or other international bodies. If we determine that such sanctions or embargoes require us to terminate existing or future contracts to which we, or our subsidiaries are a party or if we are found to be in violation of such applicable sanctions or embargoes, we could face monetary fines, we may suffer reputational harm and our results of operations may be adversely affected.
Although we believe that we have been in compliance with all applicable sanctions and embargo laws and regulations, and intend to maintain such compliance, there can be no assurance that we will be in compliance in the future, particularly as the scope of certain laws may be unclear and may be subject to changing interpretations, and with respect to the JCPOA, the U.S. retains the authority to revoke the aforementioned relief if Iran fails to meet its commitments under the JCPOA.interpretations. Any such violation could result in fines, penalties or other sanctions that could severely impact our ability to access U.S. capital markets and conduct our business and could result in some investors deciding, or being required, to divest their interest, or not to invest, in us. In addition, certain institutional investors may have investment policies or restrictions that prevent them from holding securities of companies that have contracts with countries identified by the U.S. government as state sponsors of terrorism. The determination by these investors not to invest in, or to divest from, our ordinary shares may adversely affect the price at which our ordinary shares trade. Additionally, some investors may decide to divest their interest, or not to invest, in our company simply because we do business with companies that do business in sanctioned countries.countries or territories. Moreover, our charterers may violate applicable sanctions and embargo laws and regulations as a result of actions that do not involve us or our vessels, and those violations could in turn negatively affect our reputation. In addition, our reputation and the market for our securities may be adversely affected if we engage in certain other activities, such as entering into charters with individuals or entities in countries subject to U.S. sanctions and embargo laws that are not controlled by the governments of those countries or territories that are the subject of certain U.S. sanctions or embargo laws, or engaging in operations associated with those countries or territories pursuant to contracts with third-parties that are unrelated to those countries or territories or entities controlled by their governments.government. Investor perception of the value of our ordinary shares may also be adversely affected by the consequences of war, trade war, the effects of terrorism, civil unrest and governmental actions in thesethe countries or territories that we operate in.
Lack of technological innovation to meet quality and surrounding countries.
The smuggling of drugs or other contraband onto our vessels may lead to governmental claims against us.
We expect that our vessels will call in ports where smugglers attempt to hide drugs and other contraband on vessels, with or without the knowledge of crew members. To the extent our vessels are found with contraband, whether inside or attached to the hull of our vessel and whether with or without the knowledge of any of our crew, we may face governmental or other regulatory claims which could have an adverse effect on our business, results of operations, cash flows and financial condition.
Maritime claimants could arrest our vessels, which would have a negative effect on our cash flows.
Crew members, suppliers of goods and services to a vessel, shippers of cargo, secured lenders, and other parties may be entitled to a maritime lien against the relevant vessel for unsatisfied debts, claims or damages. In many jurisdictions, a maritime lien holder may enforce its lien by arresting or attaching a vessel through foreclosure proceedings. The arrest or attachment of one or more of our vessels could interrupt our business or require us to pay large sums of money to have the arrest lifted, which would have a negative effect on our cash flows.
In addition, in some jurisdictions, such as South Africa, under the "sister ship" theory of liability, a claimant may arrest both the vessel which is subject to the claimant's maritime lien and any "associated" vessel, which is any vessel owned or controlled by the same owner. Claimants could try to assert "sister ship" liability against one vessel in our fleet for claims relating to another of our ships.
Governments could requisition our vessels during a period of war or emergency, which may negatively impact our business, financial condition, results of operations and available cash.
A government could requisition one or more of our vessels for title or hire. Requisition for title occurs when a government takes control of a vessel and becomes the owner. Also, a government could requisition our vessels for hire. Requisition for hire occurs when a government takes control of a vessel and effectively becomes the charterer at dictated charter rates. Generally, requisitions occur during a period of war or emergency. Government requisition of one or more of our vessels may negatively impact our business, financial condition, results of operations and available cash.
Technological innovationefficiency requirements could reduce our charterhirecharter hire income and the value of our vessels.
Our customers, in particular those in the oil industry, have a high and increasing focus on quality and compliance standards with their suppliers across the entire supply chain, including the shipping and transportation segment. Our continued compliance with these standards and quality requirements is vital for our operations. The charterhirecharter hire rates and the value and operational life of a vessel are determined by a number of factors including the vessel'svessel’s efficiency, operational flexibility and physical life. Efficiency includes speed, fuel economy and the ability to load and discharge cargo quickly. Flexibility includes the ability to enter harbors, use different means of propulsion and fuels, utilize related docking facilities and pass through canals and straits. The length of a vessel'svessel’s physical life is related to its original design and construction, its maintenance and the impact of the stress of operations. If new tankers are built that are more efficient or more flexible or have longer physical lives than our vessels, competition from these more technologically advanced vessels could adversely affect the amount of charterhirecharter hire payments we receive for our vessels and the resale value of our vessels could significantly decrease. As a result,This could have an adverse effect on our results of operations, andcash flows, financial condition could be adversely affected.and ability to pay dividends.
Risk Factors Relating to Our Company
We are dependentDependency on spot charters and any decrease in spot charter rates in the future may adversely affect our earnings.
As of March 19, 2018,April 1, 2021 we employed 3963 of our vessels in either the spot market or in a spot market-oriented tanker pool, including 2441 vessels in the Tankers International Pool, or the TI Pool, a spot market-oriented pool in which we were a founding member in 2000, exposing us to fluctuations in spot market charter rates. We will also enter into spot charters in the future. Further, it is our intention to employ as soon as commercially practicable all of the vessels that we will acquire from Gener8 Maritime, Inc. in the proposed Merger (as defined herein) on the spot markets, including within the TI Pool. The spot charter market may fluctuate significantly based upon tanker and oil supply and demand. For example, over the past seven years, VLCC spot market rates on the route from Arabian Gulf to Japan expressed as a time charter equivalent have ranged from negative values to a high of $114,148 per day, and in March 2018 are so far averaging $7,728 per day on the new benchmark route between the Middle East Gulf and China. The VLCC benchmark route from the AG to the Far East was changed by the Baltic in 2018 from discharging in Japan to discharging in China, to better reflect current trading patterns in the VLCC market.The successful operation of our vessels in the competitive spot charter market depends on, among other things, obtaining profitable spot charters and minimizing, to the extent possible, time spent waiting for charters and time spent traveling unladenin ballast to pick up cargo. The spot market is very volatile and in the past, there have been and will be periods when spot charter rates have declineddecline below the operating cost of vessels. If future spot charter rates decline, then we may be unable to operate our vessels trading in the spot market profitably, meet our obligations, including payments on indebtedness, or pay dividends in the future. Furthermore, as charter rates for spot charters are fixed for a single voyage which may last up to several weeks, during periods in which spot charter rates are rising, we will generally experience delays in realizing the benefits from such increases.
We may not be able to renew or obtain new and favorable charters for our vessels whose charters are expiring or are terminated, which could adversely affect our revenues and profitability.
Our ability to renew expiring contracts or obtain new charters will depend on the prevailing market conditions at the time. If we are not able to obtain new contracts in direct continuation with existing charters or for newly acquired vessels, or if new contracts are entered into at charter rates substantially below the existing charter rates or on terms otherwise less favorable compared to existing contracts terms, our revenues and profitability could be adversely affected. As of March 19, 2018, we employed 8 vessels on time charters, all of which expire in 2018.
The markets in which we compete experience fluctuations in the demand. Upon the expiration or termination of their current charters, we may not be able to obtain charters for our vessels currently employed and there may be a gap in employment of the vessels between current charters and subsequent charters. In particular, if oil and natural gas prices are low, or if it is expected that such prices will decrease in the future, at a time when we are seeking to arrange charters for our vessels, we may not be able to obtain charters at attractive rates or at all.
If the charters which we receive for the reemployment of our current vessels are less favorable, we will recognize less revenue from their operations. Our ability to meet our cash flow obligations will depend on our ability to consistently secure charters for our vessels at sufficiently high charter rates. We cannot predict the future level of demand for our services or future conditions in the oil and gas industry. If oil and gas companies do not continue to increase exploration, development and production expenditures, we may have difficulty securing charters or we may be forced to enter into charters at unattractive rates, which would adversely affect our results of operations and financial condition.
We are subject to certain risks with respect to our counterparties on contracts, and failure of suchour counterparties to meet their obligations could cause us to suffer losses or negatively impact our results of operations and cash flows.flows
We have entered into, and may enter in the future, various contracts, including shipbuilding contracts or long term contracts such as the FSO vessels operating offshore Qatar, credit facilities, insurance agreements, voyage and time charter agreements and other agreements associated with the operation of our vessels. Such agreements subject us to counterparty risks. The ability of each of our counterparties to perform its payment and other obligations under a contract with us will depend on a number of factors that are beyond our control and may include, among other things, general economic conditions, the condition of the maritime and offshore industries, the overall financial condition of the counterparty, charter rates received for specific types of vessels, work stoppages or other labor disturbances, including as a result of the outbreak of COVID-19 and various expenses. For example, the combination of a reduction of cash flow resulting from declines in world trade, a reduction in borrowing bases under reserve-based credit facilities and the lack of availability of debt or equity financing may result in a significant reduction in the ability of our charterers to make charter payments to us. In addition, in depressed market conditions, our charterers and customers may no longer need a vessel that is currently under charter or contract or may be able to obtain a comparable vessel at lower rates. As a result, charterers and customers may seek to renegotiate the terms of their existing charter agreements or avoid their obligations under those contracts. Should a counterparty fail to honor its obligations under agreements with us, we could sustain significant losses which could have a material adverse effect on our business, financial condition, results of operations and cash flows.
The failure of our charterers to meet their obligations under our charter agreements, on which we depend for our revenues, could cause us to suffer losses or otherwise adversely affect our business.
The ability and willingness of each of our counterparties to perform their obligations under a time charter, spot voyage or other agreement with us will depend on a number of factors that are beyond our control and may include, among other things, general economic conditions, the condition of the tanker shipping industry and the overall financial condition of the counterparties. Charterers are sensitive to the commodity markets and may be impacted by market forces affecting commodities such as oil. In addition, in depressed market
The current state of the global financial markets and current economic conditions theremay adversely impact our results of operation, financial condition, cash flows, ability to obtain financing or refinance our existing and future credit facilities on acceptable terms, which may negatively impact our business.
Global financial markets and economic conditions have been, reportsand continue to be, volatile. Beginning in February 2020, due mainly to the COVID-19 outbreak, global financial markets, including in the U.S., experienced volatility and a steep and abrupt downturn. The ultimate impact on the global financial markets and the disruption to the global economy are dependent on, among other things, the length and severity of charterers renegotiating their charters or defaulting on their obligations under charters. Our customersthe COVID-19 outbreak. COVID-19 also accelerated the attention given by the financial sector globally to ESG matters which may failreduce the availability of financing at acceptable terms and may lead to pay charterhire or attemptdivestment in fossil fuel related activities such as ours. Credit markets and the debt and equity capital markets have been distressed and the uncertainty surrounding the future of the global credit markets has resulted in reduced access to renegotiate charter rates. Should a counterparty failcredit worldwide, particularly for the shipping industry. These issues, along with significant write-offs in the financial services sector, the re-pricing of credit risk and the current weak economic conditions, have made, and will likely continue to honor its obligations under agreements with us,make, it may be difficult to secure substitute employment for such vessel,obtain additional financing. The current state of global financial markets and any new charter arrangements we secure in the spot market or on time charters may be at lower rates given currently decreased tanker charter rate levels. If our charterers fail to meet their obligations to us or attempt to renegotiate our charter agreements, we could sustain significant losses which could have a material adverse effect on our business, financial condition, results of operations and cash flows, as well ascurrent economic conditions might adversely impact our ability to issue additional equity at prices that will not be dilutive to our existing shareholders or preclude us from issuing equity at all. Economic conditions and the economic slow-down resulting from COVID-19 and the international governmental responses to the virus may also adversely affect the market price of our ordinary shares.
Concerns about the stability of financial markets generally and the solvency of counterparties specifically may increase the cost of obtaining money from the credit markets and lenders may increase interest rates, enact tighter lending standards, refuse to refinance existing debt at all or on terms similar to current debt and reduce, and in some cases cease, to provide funding to borrowers. Due to these factors, we cannot be certain that financing will be available to the extent required, or that we will be able to refinance our existing and future credit facilities, on acceptable terms or at all. If financing or refinancing is not available when needed, or is available only on unfavorable terms, we may be unable to meet our obligations as they come due or we may be unable to enhance our existing business, pay dividends, if any,complete the acquisition of our newbuildings and additional vessel acquisitions or otherwise take advantage of business opportunities as they arise. The COVID-19 outbreak has negatively impacted, and may continue to negatively impact, global economic activity, demand for energy, and funds flows and sentiment in the future,global financial markets. Continued economic disruption caused by the continued failure to control the spread of the virus could significantly impact our ability to obtain additional debt (and equity) financing until COVID-19 is resolved and compliance with covenants in our credit facilities.the markets normalize.
Newbuilding projects are subject to risks that could cause delays, cost overruns or cancellation of our newbuilding contracts.
We are currently party to shipbuilding contracts with Hyundai Heavy Industries Co. Ltd. in South Korea, or Hyundai, for the construction of four newbuildinghave two Suezmax vessels for an aggregate purchase price of $247.9 million, ofunder construction which we have already made installment payments to Hyundai of $62.0 million as of March 19, 2018. These vessels are expected to be delivered to uswere acquired under a resale agreement in the coursefirst quarter of 2018. We may, in the future, enter into additional construction contracts or purchase vessels that are under construction.2021. These construction projects are subject to risks of delay or cost overruns inherent in any large construction project from numerous factors, including shortages of equipment, materials or skilled labor, unscheduled delays in the delivery of ordered materials and equipment or shipyard construction, failure of equipment to meet quality and/or performance standards, financial or operating difficulties experienced by equipment vendors or the shipyard, unanticipated actual or purported change orders, inability to obtain required permits or approvals, unanticipated cost increases between order and delivery, design or engineering changes and work stoppages and other labor disputes, public health threats, adverse weather conditions or any other potential events of force majeure. Significant cost overruns or delays could adversely affect our financial position, results of operations and cash flows. Additionally, failure to complete a project on time may result in the delay of revenue from that vessel.
If for any reason we default under any of our newbuilding contracts, or otherwise fail to take delivery of our newbuilding vessels, we would be prevented from realizing potential revenues from thesesuch vessels, we could also lose all or a portion of our investment, including theany installment payments made, to Hyundai, and we could be liable for penalties and damages under such contracts. as well as suffer reputational damage.
In addition, in the event a shipyard does not perform under its contract, we may lose all or part of our investment, which would have a material adverse effect on our results of operations, financial condition and cash flows.
In addition, we will incur significant maintenance costs as a newbuilding vessel must be drydocked within five years of its delivery from a shipyard, with survey cycles of no more than 60 months for the first three surveys, and 30 months thereafter, not including any unexpected repairs. In 2020,the Hakata, Hakone, Filikon, Sofia, Statia and Dia have been dry-docked and a portion of the cost of planned repairs and maintenance was capitalized. The estimated total cost to drydock a vessel are between $1 million and $2.5 million, depending on the size, age and condition of the vessel and the location of drydocking and the special surveys to be performed.
Inherent risks to acquisition of secondhand vessels
Our current business strategy includes additional growth through the acquisition of new and secondhand vessels. While we try to inspect secondhand vessels prior to purchase, such inspection does not provide us with the same knowledge about their condition that we would have had if these vessels had been built for and operated exclusively by us. Generally, as is customary in the shipping sector, we do not receive the benefit of warranties from the builders for the secondhand vessels that we acquire. Additionally, there may be increased costs associated with these vessels to maintain them in good operating order and they are generally less fuel efficient, which makes them less desirable for charterers.
Governmental regulations, safety or other equipment standards related to the age of vessels may require expenditures for alterations or the addition of new equipment to our vessels and may restrict the type of activities in which the vessels may engage. Those expenditures or restrictions might cause us to operate our vessels below profitability during the remainder of their useful lives.
If we do not identify suitable tankers for acquisition or successfully integrate any acquired tankers, we may not be able to grow or to effectively manage our growth.
OneOur current business strategy includes additional growth through the acquisition of our strategies is to continue to grow by expanding our operationsnew and adding to our fleetsecondhand vessels at attractive points in the cycle, including through mergers, (such as our proposed Merger with Gener8) strategic alliances or joint ventures. Our future growth will depend upon a number of factors, some of which may not be within our control. These factors include our ability to:
identify suitable tankers and/or shipping companies for acquisitions at attractive prices, which may not be possible if asset prices rise too quickly;
obtain financing;
manageGrowing any business by acquisition presents numerous risks, such as managing relationships with customers and suppliers;integrating newly acquired assets into existing infrastructure. We cannot give any assurance that we will be successful in executing any growth plans or that we will not incur significant expenses and losses in connection with any future growth efforts.
identify businesses engaged in managing, operating or owning tankers for acquisitions or joint ventures;
integrate any acquired tankers or businesses successfully with our then-existing operations;
attract, hire, train, integrate and retain qualified, highly trained personnel and crew to manage and operate our growing business and fleet;
identify additional new markets;
enhance our customer base;
improve our operating, financial and accounting systems and controls; and
obtain required financing for our existing and new operations.
Our failure to effectively identify, purchase, develop and integrate any tankers or businesses could adversely affect our business, financial condition and results of operations. We may incur unanticipated expenses as an operating company. Our
The number and competencies of employees that perform services for us and our current operating and financial systems may not be adequate as we implement our plan to expand the size of our fleet. Finally, additional acquisitionsfleet, and we may require additional equity issuancesnot be able to effectively hire more employees or debt issuances, bothadequately improve those systems. We may incur unanticipated expenses as an operating company.
Our growth strategy is partially based as well on expansion in the offshore FSO sector, which highly depends on the level of activity in oil and natural gas exploration, development and production in offshore areas worldwide. The availability of quality FSO prospects, exploration success, relative production costs, the stage of reservoir development (such as in Qatar where we operate, which could reduce our cash flow. has fields whose production lives deplete over time, and as a result, the overall activity in such fields may decline faster than anticipated) and political and regulatory environments affect customers’ FSO programs. Oil and natural gas prices and market expectations of potential changes in these prices or decreases in the demand for oil and gas also significantly affect this level of activity and demand for offshore units as does the difference in cost between a floating vessel compared to a fixed installation connected through pipelines.
If we are unable to execute the points noted above, our financial condition may be adversely affected.
Growing any business by acquisition presents numerous risks such as undisclosed liabilities and obligations, difficulty in obtaining additional qualified personnel and managing relationships with customers and suppliers and integrating newly acquired operations into existing infrastructures. The expansion of our fleet may impose significant additional responsibilities on our management and staff, and the management and staff of our commercial and technical managers, and may necessitate that we, and they, increase the number of personnel. We cannot give any assurance that we will be successful in executing our growth plans or that we will not incur significant expenses and losses in connection with our future growth.
An increase in operating costs would decrease earnings and available cash.
Under time charters the charterer is responsible for voyage expenses and the owner is responsible for the vessel operating costs. Under our spot charters,If we are responsibleunable to fulfill our obligations under any memorandum of agreement or newbuilding construction contract for vessel operating expenses. When our owned vessels are operated infuture vessel/FSO acquisitions, the spot market,sellers of such vessels/FSO may be permitted to terminate such contracts and we are also responsiblemay forfeit all or a portion of the down payments we already made under such contracts and we may be sued for voyage expenses and vessel costs. Our vessel operating expenses include the costs of crew, provisions, deck and engine stores, insurance and maintenance and repairs, which expenses depend on a variety of factors, many of which are beyond our control. Voyage expenses include bunkers (fuel), port and canal charges. If our vessels suffer damage, they may need to be repaired at a drydocking facility. The costs of drydock repairs are unpredictable and can be substantial. Increases in any of these expenses would decrease earnings and dividends per share.outstanding balance.
Changes in
Rising fuel or bunkers, prices may adversely affect our profits.profits
While we do not directly bear the cost of fuel or bunkers under our time charters, fuel is a significant factor in negotiating charter rates. The price and supply of fuel is unpredictable due to events outside of our control.
Fuel or bunkers, is typicallyalso a significant, if not the largest, expense in our shipping operations for ourwhen vessels which operateare operated on the spot market under voyage charter and changescharter. As a result, an increase in the price of fuel beyond our expectations may therefore adversely affect our profitability. The price and supplyprofitability at the time of fuel are unpredictable and fluctuate based on events outside our control, including geopolitical developments, supply and demand for oil and gas, actions by the Organization of the Petroleum Exporting Countries and other oil and gas producers, war and unrest in oil producing countries and regions, regional production patterns and environmental concerns.charter negotiation. Further, fuel and in particular fuel that is reducing sulfur emission mayhas become much more expensive as a result of regulations mandating a reduction in the future,sulfur emissions to 0.5% as of January 2020, which may reduce the profitability and competitiveness of our profitability.business versus other forms of transportation, such as truck or rail. Other future regulations may have a similar impact.
The IMO 2020 regulations cause us to incur substantial costs and procure low-sulfur fuel oil directly on the wholesale market and our strategy to procure such low-sulfur fuel oil directly on the wholesale market for storage at sea and onward consumption on our vessels exposes us to additional risks, and may fail.
Effective January 1, 2020, the IMO implemented a new regulation for a 0.50% global sulfur cap on emissions from vessels. Under this new global cap, vessels must use marine fuels with a sulfur content of no more than 0.50% against the former regulations specifying a maximum of 3.50% sulfur in an effort to reduce the emission of sulfur oxide into the atmosphere or use exhaust gas cleaning systems or 'scrubbers'.
We will incur costs to comply with these revised standards. Additional or new conventions, laws and regulations may be adopted that could require, among others, the installation of expensive emission control systems and could adversely affect our business, results of operations, cash flows and financial condition.
With the exception of the four VLCC vessels delivered to us from the Daewoo Shipbuilding & Marine Engineering Co., Ltd., or DSME shipyard in 2021, two Suezmax vessels on time charter in and the two newbuilding Suezmax vessels under construction at Daehan Shipbuilding Co Ltd shipyard in South Korea, none of our vessels are equipped with scrubbers and as of January 1, 2020 we have transitioned to burning IMO compliant fuels. We continue to evaluate different options in complying with IMO and other rules and regulations and continue to work closely with suppliers and producers of both scrubbers and alternative mechanisms. We currently do not hedgeprocure physical low sulfur fuel oil directly on the wholesale market with a view to secure availability of qualitative compliant fuel and to capture volatility in prices between high sulfur and low sulfur fuel oil. The procurement of large quantities of low sulfur fuel oil implies a commodity price risk because of fluctuations in price between the time of purchase and consumption. Whilst we may implement financial strategies with a view to limiting this risk, we cannot give assurance that such strategies will be successful in which case we could sustain significant losses which could have a material impact on our exposurebusiness, financial condition, results of operation and cash flow. The storage of and onward consumption on our vessels of the procured commodity may require us to blend, co-mingle or otherwise combine, handle or manipulate such commodities which implies certain operational risks that may result in loss of or damage to the fluctuating priceprocured commodities or the vessels and their machinery.
Low sulfur fuel is more expensive than standard marine fuel containing 3.5% sulfur content and may become more expensive or difficult to obtain as a result of bunkers.increased demand. If the cost differential between low sulfur fuel and high sulfur fuel is significantly higher than anticipated, or if low sulfur fuel is not available at ports on certain trading routes, it may not be feasible or competitive to operate our vessels on certain trading routes without installing scrubbers or without incurring deviation time to obtain compliant fuel. Scrubbers may not be available to be installed on such vessels at a favorable cost or at all if we seek them at a later date.
While we carry cargo insurance to protect us against certain risks of loss of or damage to the procured commodities, we may not be adequately insured to cover any losses from such operational risks, which could have a material adverse effect on us. Any significant uninsured or under-insured loss or liability could have a material adverse effect on our business, results of operations, cash flows and financial condition and our available cash.
If we are unable to operate our vessels profitably, we may be unsuccessful in competing in the highly competitive international tanker market, which would negatively affect our financial condition and our ability to expand our business.
The operation of tanker vessels and transportation of crude and petroleum products is extremely competitive and reduced demand for transportation of oil and oil products could lead to increased competition. Competition arises primarily from other tanker owners, including major oil companies and national oil companies or companies linked to authorities of oil producing or importing countries, as well as independent tanker companies, some of whom have substantially greater resources than we do. CompetitionOur ability to operate our vessels profitably depends on a variety of factors, including, but not limited to the (i) loss or reduction in business from significant customers, (ii) loss in the credit quality of our customers (iii) unanticipated changes in demand for the transportation of crude oil and petroleum products, (iv) changes in production of or demand for oil and petroleum products, can be intensegenerally or in particular regions, (v) greater than anticipated levels of tanker newbuilding orders or lower than anticipated levels of tanker recyclings, and depends on price, location, size, age, condition(vi) changes in rules and regulations applicable to the tanker industry, including legislation adopted by international organizations such as IMO and the acceptability of the tanker and its operators to the charterers. We will have to compete with other tanker owners, including major oil companies as well as independent tanker companies.EU or by individual countries.
Our market share may decrease in the future. If we expand our business or provide new services in new geographic regions, we may not be able to compete profitably. New markets may require different skills, knowledge or strategies than we use in our current markets, and the competitors in those new markets may have greater financial strength and capital resources than we do.
A substantial portion of our revenue is derived from a limited number of customers and the loss of any of these customers could result in a significant loss of revenues and cash flow.
We currently derive a substantial portion of our revenue from a limited number of customers. For the year ended December 31, 2017,2020, Valero Energy Corporation, or Valero, accounted for 10%, Total S.A., or Total, accounted for 6% and Petroleo Brasileiro S.A. accounted for 6%6 % of our total revenues in our tankers segment. In addition, our only FSO customer as of December 31, 20172020 was North Oil Company. All of our charter agreements have fixed terms, but may be terminated early due to certain events, such as a charterer'scharterer’s failure to make charter payments to us because of financial inability, disagreements with us or otherwise. The ability of each of our counterparties to perform its obligations under a charter with us will depend on a number of factors that are beyond our control and may include, among other things, general economic conditions, the condition of the tanker industry and the overall financial condition of the counterparty. Should a counterparty fail to honor its obligations under an agreement with us, we may be unable to realize revenue under that charter and could sustain losses, which could have a material adverse effect on our business, financial condition, results of operations and ability to pay dividends, if any.
In addition, a charterer may exercise its right to terminate the charter if, among other things:
•the vessel suffers a total loss or is damaged beyond repair;
•we default on our obligations under the charter, including prolonged periods of vessel off-hire;
•war, sanctions, or hostilities significantly disrupt the free trade of the vessel;
•the vessel is requisitioned by any governmental authority; or
•a prolonged force majeure event occurs, such as war, piracy, terrorism, global pandemic or political unrest, which prevents the chartering of the vessel.vessel, in each case in accordance with the terms and conditions of the respective charter.
In addition, the charter payments we receive may be reduced if the vessel does not perform according to certain contractual specifications. For example, charterhire may be reducedsuch as if the average vessel speed falls below the speed we have guaranteed or if the amount of fuel consumed to power the vessel exceeds the guaranteed amount. Additionally, compensation under our FSO service contracts is based on daily performance and/or availability of each FSO in accordance with the requirements specified in the applicable FSO service contracts. The charter payments we receive under our FSO service contracts may be reduced or suspended (as applicable) if the vessel is idle, but available for operation, or if a force majeure event occurs, or we may not be entitled to receive charter payments if the FSO is taken out of service for maintenance for an extended period, or the charter may be terminated if these events continue for an extended period. In addition, our FSO service contracts have day rates that are fixed over the contract term. In order to mitigate the effects of inflation on revenues from these term contracts, our FSO service contracts include yearly escalation provisions. These provisions are designed to recompense us for certain cost increases, including wages, insurance and maintenance costs. However, actual cost increases may result from events or conditions that do not cause correlative changes to the applicable escalation provisions.
If any of our charters are terminated, we may be unable to re-deploy the related vessel on terms as favorable to us as our current charters, or at all. We are exposed to changes in the spot market rates associated with the deployment of our vessels. If we are unable to re-deploy a vessel for which the charter has been terminated, we will not receive any revenues from that vessel and we may be required to pay ongoing expenses necessary to maintain the vessel in proper operating condition. Any of these factors may decrease our revenue and cash flows. Further, the loss of any of our charterers, charters or vessels, or a decline in charterhirecharter hire under any of our charters, could have a material adverse effect on our business, results of operations, financial condition and ability to pay dividends, if any, to our shareholders.
Our FSO service contracts
Regulations relating to ballast water discharge came into effect during September 2019 and may not permit usadversely affect our revenues and profitability.
The IMO has imposed updated guidelines for ballast water management systems specifying the maximum amount of viable organisms allowed to fully recoup our cost increases inbe discharged from a vessel’s ballast water. Depending on the eventdate of a rise in expenses.
Our FSO service contractsthe International Oil Pollution Prevention or IOPP renewal survey, existing vessels constructed before September 8, 2017 are required to comply with the updated D-2 standard on or after September 8, 2019. For most vessels, compliance with the D-2 standard will involve installing on-board systems to treat ballast water and eliminate unwanted organisms. Vessels constructed (keel-laid) on or after September 8, 2017 are required to comply with the D-2 standards on or after September 8, 2017. We currently have dayrates that are fixed over the contract term. In order to mitigate the effects of inflation on revenues from these term contracts, our FSO service contracts include yearly escalation provisions. These provisions are designed to recompense us for certain cost increases, including wages, insurance and maintenance costs. However, actual cost increases may result from events or conditions23 vessels that do not cause correlative changes tocomply with the applicable escalation provisions. In addition, the adjustments are normally performed on an annual basis. For these reasons, the timingupdated guideline and amount received as a resultcosts of the adjustmentscompliance may differ from the timingbe substantial and amount of expenditures associated with actual cost increases, which could adversely affect our resultsrevenues and profitability.
Furthermore, United States regulations are currently changing. Although the 2013 Vessel General Permit (VGP) program and U.S. National Invasive Species Act (NISA) are currently in effect to regulate ballast discharge, exchange and installation, the Vessel Incidental Discharge Act or VIDA, which was signed into law on December 4, 2018, requires that the EPA develop national standards of operationsperformance for approximately 30 discharges, similar to those found in the VGP within two years.On October 26, 2020, the EPA published a Notice of Proposed Rulemaking for Vessel Incident Discharge National Standards of Performance under VIDA. By approximately 2022, the U.S. Coast Guard must develop corresponding implementation, compliance, and financial condition and ability to pay dividends, if any, to our shareholders.
Currently, we operate our FSOs offshore Qatar, which has fields whose production lives deplete over time and as a result, overall activity may decline faster than anticipated.
We currently operate our FSOs offshore Qatar, which has fields whose production lives deplete over time, and as a result,enforcement regulations regarding ballast water. The new regulations could require the overall activity in such fields may decline faster than anticipated. There are increased costs associated with retiring old oil and gas installations,installation of new equipment, which may threaten to slow the development of the region's remaining resources.
The purchase and operation of secondhand vessels exposecause us to increased operatingincur substantial additional costs which couldmay adversely affect our earnings and, as our fleet ages, the risks associated with older vessels could adversely affect our ability to obtain profitable charters.profitability.
Our current business strategy includes additional growth through the acquisition of new and secondhand vessels. While we try to inspect secondhand vessels prior to purchase, this does not provide us with the same knowledge about their condition that we would have had if these vessels had been built for and operated exclusively by us. Generally, as is customary in the shipping sector, we do not receive the benefit of warranties from the builders for the secondhand vessels that we acquire.
In general, the costs to maintain a vessel in good operating condition increase with the age of the vessel. Older vessels are typically less fuel-efficient than more recently constructed vessels due to improvements in engine technology. Cargo insurance rates increase with the age of a vessel, which could lead to older vessels being less desirable for charterers.
Governmental regulations, safety or other equipment standards related to the age of vessels may require expenditures for alterations or the addition of new equipment to our vessels and may restrict the type of activities in which the vessels may engage. As our vessels age, market conditions may not justify those expenditures or enable us to operate our vessels profitably during the remainder of their useful lives.
We will be required to make additional capital expenditures to expand the number of vessels in our fleet and to maintain all our vessels, which will be dependent on additional financing.
Our business strategy is based in part upon the expansion of our fleet through the purchase of additional vessels at attractive points in the cycle. If we are unable to fulfill our obligations under any memorandum of agreement or newbuilding construction contract for future vessel acquisitions, the sellers of such vessels may be permitted to terminate such contracts and we may forfeit all or a portion of the down payments we already made under such contracts and we may be sued for any outstanding balance.
In addition, we will incur significant maintenance costs for our existing and any newly-acquired vessels. A newbuilding vessel must be drydocked within five years of its delivery from a shipyard, with survey cycles of no more than 60 months for the first three surveys, and 30 months thereafter, not including any unexpected repairs. We estimate the cost to drydock a vessel to be between $0.75 and $2.5 million, depending on the size and condition of the vessel and the location of drydocking and the special surveys to be performed.
We may be required to make significant investments in ballast water management which may have a material adverse effect on our future performance, results of operations, and financial position.
The IMO adopted an International Convention for the Control and Management of Ships' Ballast Water and Sediments, or the BWM Convention, which aims to prevent the spread of harmful aquatic organisms from one region to another, by establishing standards and procedures for the management and control of ships' ballast water and sediments. The BWM Convention calls for a phased introduction of mandatory ballast water exchange requirements to be replaced in time with mandatory concentration limits. In order to comply with IMO and U.S. ballast water regulations, we are required to install ballast water treatment plants on all vessels from March 2020 to June 2024. The cost of compliance per vessel for us is estimated to be between $1.6 and $2.0 million, depending on size of the vessel. Significant investments in ballast water treatment may have a material adverse effect on our future performance, results of operations, cash flows and financial position.
If we do not set aside funds and are unable to borrow or raise funds for vessel replacement, at the end of a vessel's useful life our revenue will decline, which would adversely affect our business, results of operations, financial condition, and available cash.
If we do not set aside funds and are unable to borrow or raise funds for vessel replacement, we will be unable to replace the vessels in our fleet upon the expiration of their remaining useful lives. Our cash flows and income are dependent on the revenues earned by the chartering of our vessels. If we are unable to replace the vessels in our fleet upon the expiration of their useful lives, our business, results of operations, financial condition and available cash would be adversely affected. Any funds set aside for vessel replacement will reduce available cash.
Our ability to obtain additional financing may be dependent on the performance and creditworthiness of our then existing charters.
The actual or perceived credit quality of our charterers and any defaults by them, may materially affect our ability to obtain the additional capital resources that we will require to purchase additional vessels or may significantly increase our costs of obtaining such capital. Our inability to obtain additional financing at all or at a higher than anticipated cost may materially affect our results of operation and our ability to implement our business strategy.
We depend on our executive officers and other key employees, and the loss of their services could, in the short term, have a material adverse effect on our business, results and financial condition.
We depend on the efforts, knowledge, skill, reputations and business contacts of our executive officers and other key employees. Accordingly, our success will depend on the continued service of these individuals. We may experience departures of senior executive officers and other key employees, and we cannot predict the impact that any of their departures would have on our ability to achieve our financial objectives. The loss of the services of any of them could, in the short term, have a material adverse effect on our business, results of operations and financial condition.
Failure to obtain or retain highly skilled personnel could adversely affect our operations.
We require highly skilled personnel to operate our business, and will be required to hire additional highly trained personnel in connection with the operation of newly acquired vessels. Competition for skilled and other labor required for our operations has increased in recent years as the number of ocean-going vessels in the worldwide fleet has increased. If this expansion continues and is coupled with improved demand for seaborne shipping services in general, shortages of qualified personnel could further create and intensify upward pressure on wages and make it more difficult for us to staff and service vessels. Such developments could adversely affect our financial results and cash flow. Furthermore, as a result of any increased competition for people and risk for higher turnover, we may experience a reduction in the experience level of our personnel, which could lead to higher downtime and more operating incidents.
United States tax authorities could treat us as a "passive“passive foreign investment company,"” which could have adverse United States federal income tax consequences to United States shareholders.
A foreign corporation will be treated as a "passive“passive foreign investment company,"” or PFIC, for United States federal income tax purposes if either (1) at least 75% of its gross income for any taxable year consists of certain types of "passive income"“passive income” or (2) at least 50% of the average value of the corporation'scorporation’s assets produce or are held for the production of those types of "passive“passive income."” For purposes of these tests, "passive income"“passive income” includes dividends, interest, and gains from the sale or exchange of investment property and rents and royalties other than rents and royalties which are received from unrelated parties in connection with the active conduct of a trade or business. For purposes of these tests, income derived from the performance of services does not constitute "passive“passive income."” United States shareholders of a PFIC are subject to a disadvantageous United States federal income tax regime with respect to the income derived by the PFIC, the distributions they receive from the PFIC and the gain, if any, they derive from the sale or other disposition of their shares in the PFIC.
Based on our current and proposed method of operation, we do not believe that we will be a PFIC with respect to any taxable year. In this regard, we intend to treat the gross income we derive or are deemed to derive from our time chartering activities as services income, rather than rental income. Accordingly, our income from our time and voyage chartering activities should not constitute "passive“passive income,"” and the assets that we own and operate in connection with the production of that income should not constitute assets that produce or are held for the production of "passive“passive income."”
There is substantial legal authority supporting this position, consisting of case law and United States Internal Revenue Service, or IRS, pronouncements concerning the characterization of income derived from time charters and voyage charters as services income for other tax purposes. However, it should be noted that there is also authority that characterizes time charter income as rental income rather than services income for other tax purposes. Accordingly, no assurance can be given that the IRS or a court of law will accept this position, and there is a risk that the IRS or a court of law could determine that we are a PFIC. Moreover, no assurance can be given that we would not constitute a PFIC for any future taxable year if the nature and extent of our operations change.
If the IRS were to find that we are or have been a PFIC for any taxable year, our United States shareholders would face adverse United States federal income tax consequences and incur certain information reporting obligations. Under the PFIC rules, unless those shareholders make an election available under the United States Internal Revenue Code of 1986, as amended, or the Code (which election could itself have adverse consequences for such shareholders), such shareholders would be subject to United States federal income tax at the then prevailing rates on ordinary income plus interest, in respect of excess distributions and upon any gain from the disposition of their ordinary shares, as if the excess distribution or gain had been recognized ratably over the shareholder'sshareholder’s holding period of the ordinary shares. See "Item“Item 10. Additional Information—Information E. Taxation—PassiveTaxation-Passive Foreign Investment Company Status and Significant Tax Consequences"Consequences” for a more comprehensive discussion of the United States federal income tax consequences to United States shareholders if we are treated as a PFIC.
We may have to pay tax on United States source shipping income, or taxes in other jurisdictions, which would reduce our net earnings.
Under the Code, 50% of the gross shipping income of a corporation that owns or charters vessels, as we and our subsidiaries do, that is attributable to transportation that begins or ends, but that does not both begin and end, in the United States may be subject to a 4% United States federal income tax without allowance for deductions, unless that corporation qualifies for exemption from tax under Section 883 of the Code and the regulations promulgated thereunder by the United States Department of the Treasury or an applicable U.S. income tax treaty.
We and our subsidiaries continue to take the position that we qualify for either this statutory tax exemption or exemption under an income tax treaty for United States federal income tax return reporting purposes. However, there are factual circumstances beyond our control that could cause us to lose the benefit of this tax exemption and thereby become subject to United States federal income tax on our United States source shipping income. For example, we may no longer qualify for exemption under Section 883 of the Code for a particular taxable year if shareholders with a five percent or greater interest in our ordinary shares, or "5%“5% Shareholders,"” owned, in the aggregate, 50% or more of our outstanding ordinary shares for more than half the days during the taxable year, and there does not exist sufficient 5% Shareholders that are qualified shareholders for purposes of Section 883 of the Code to preclude non-qualified 5% Shareholders from owning 50% or more of our ordinary shares for more than half the number of days during such taxable year or we are unable to satisfy certain substantiation requirements with regard to our 5% Shareholders. Due to the factual nature of the issues involved, there can be no assurances on the tax-exempt status of us or any of our subsidiaries.
If we or our subsidiaries were not entitled to exemption under Section 883 of the Code for any taxable year, we or our subsidiaries could be subject for such year to an effective 2% United States federal income tax on the shipping income we or they derive during such year which is attributable to the transport of cargoes to or from the United States. The imposition of this taxation would have a negative effect on our business and would decrease our earnings available for distribution to our shareholders.
We may also be subject to tax in other jurisdictions, which could reduce our earnings.
Our shareholders residing in countries other than Belgium may be subject to double withholding taxation with respect to dividends or other distributions made by us.
Any dividends or other distributions we make to shareholders will, in principle, be subject to withholding tax in Belgium at a rate of 30%, except for shareholders which qualify for an exemption of withholding tax such as, amongst others, qualifying pension funds or a company qualifying as a parent company in the sense of the Council Directive (90/435/EEC) of July 23, 1990, or the Parent-Subsidiary Directive or that qualify for a lower withholding tax rate or an exemption by virtue of a tax treaty. Various conditions may apply and shareholders residing in countries other than Belgium are advised to consult their advisers regarding the tax consequences of dividends or other distributions made by us. Our shareholders residing in countries other than Belgium may not be able to credit the amount of such withholding tax to any tax due on such dividends or other distributions in any other country than Belgium. As a result, such shareholders may be subject to double taxation in respect of such dividends or other distributions.
Belgium and the United States have concluded a double tax treaty concerning the avoidance of double taxation, or the U.S.—BelgiumU.S.-Belgium Treaty. The U.S.—BelgiumU.S.-Belgium Treaty reduces the applicability of Belgian withholding tax to 15%, 5% or 0% for U.S. taxpayers, provided that the U.S. taxpayer meets the limitation of benefits conditions imposed by the U.S.—BelgiumU.S.-Belgium Treaty. The Belgian withholding tax is generally reduced to 15% under the U.S.—BelgiumU.S.-Belgium Treaty. The 5% withholding tax applies in cases where the U.S. shareholder is a company which holds at least 10% of the shares in the Company. A 0% Belgian withholding tax applies when the shareholder is a company which has held at least 10% of the shares in the Company for at least 12 months, or is, subject to certain conditions, a U.S. pension fund. The U.S. shareholders are encouraged to consult their own tax advisers to determine whether they can invoke the benefits and meet the limitation of benefits conditions as imposed by the U.S.—BelgiumU.S.-Belgium Treaty.
Changes to the tonnage tax or the corporate tax regimes applicable to us, or to the interpretation thereof, may impact our future operating results.
TheShortly after its incorporation in 2003, Euronav applied for treatment under the Belgian Ministrytonnage tax regime. It was declared eligible for this regime by the Federal Finance Department on 23 October 2003 for a ten-year period. In line with the tonnage tax regulations, which are part of Finance approved our application on October 23, 2013 for beneficial tax treatment of certain of our vessel operations income. Under this Belgianthe normal corporate tax regime our taxable basis isin Belgium, profits from the operation of seagoing vessels are determined on a lump-sumlump sum basis (which is,based on the basis of thenet registered tonnage of the vessels it operates), rather than onparticular vessels. After this first ten-year period had elapsed, the basis of our accounting results, as adjusted,tonnage tax regime has been automatically renewed for Belgian corporate income tax purposes.another ten-year period. This tonnage tax regime was initially granted for 10 years,replaces all factors that are normally taken into account in traditional tax calculations, such as profit or loss, operating costs, depreciation, gains and was renewed for an additional 10-year periodthe offsetting of past losses of the revenues taxable in 2013. In addition, with respect to certainBelgium. Two of our vessels operating under the Greek flag, we benefit from a similar tonnage tax regime in Greece. Our twoEuronav’s subsidiaries that were formed in connection with our vessel acquisitions in 2014, Euronav(Euronav Shipping NV and Euronav Tankers NV areNV) also applied for the Belgian tonnage tax regime as from January 1, 2016 also subject towhich application has been successfully obtained. In 2019 Euronav Shipping NV left the Belgian Tonnage Tax regime. We cannot assure youtonnage tax regime on a voluntary basis because no vessels were operated by that we will be able to take advantage of past tax benefits built up in those companies, which can only be claimed upon an eventual return tosubsidiary for the Belgian corporate income tax regime.period 2020 and 2019.
Changes to the tax regimes applicable to us, or the interpretation thereof, may impact our future operating results. In 2017 and early 2018 the Company took note of the correspondence between the Belgian authorities and the European Commission within the framework of request for extension of the state aid to the maritime industry by Belgium. Belgium extended the State of Belgium. Based onstate aid to the actual draftmaritime industry up to, and including, December 31, 2022. Belgium decided to adjust the tonnage tax law which includesentered into force retroactively as from January 1, 2018 to comply with the legislativerecommendations from the European Commission. The changes as requested byto the Commission, has beentonnage tax regulations were reviewed by the Company, webut did or do not expecthave any adverse effect of these changes to our existing tonnage tax regime.regime or on the operations of the Company.
Euronav is also operating vessels under Greek, Marshall Island and Liberian Flag for which the Company is paying the required tonnage tax in these particular jurisdictions.
There is, however, no guarantee that the tonnage tax regime will not be reversed or that other forms of taxation will not be imposed such as, but not limited to, a carbon tax or emissions trading system in the context of the discouragement of the use of fossil fuels. To the extent such changes would be implemented on the EU level only, the global level playing field may be distorted and put the company in a weaker competitive position compared to its non-EU peer companies.
Insurance may be difficult to obtain, or if obtained, may not be adequate to cover our losses that may result from our operations due to the inherent operational risks of the tanker industry.
We carrytake out insurance to protect us against most of the accident-related risks involved in the conduct of our business, including marine hull and machinery insurance, protection and indemnity insurance, which include pollution risks, crew insurance and war risk insurance. However, we may not be adequately insured to cover losses from our operational risks, which could have a material adverse effect on us. Additionally, our insurers may refuse to pay particular claims and our insurance may be voidable by the insurers if we take, or fail to take, certain action, such as failing to maintain certification of our vessels with applicable maritime regulatory organizations. Any significant uninsured or under-insured loss or liability could have a material adverse effect on our business, results of operations, cash flows and financial condition and our available cash. In addition, we may not be able to obtain adequate insurance coverage at reasonable rates in the future during adverse insurance market conditions.
In addition, changes in the insurance markets attributable to terrorist attacks may also make certain types of insurance more difficult for us to obtain due to increased premiums or reduced or restricted coverage for losses caused by terrorist acts generally.
Because we obtain some of our insurance through protection and indemnity associations, which result in significant expenses to us, we may be required to make additional premium payments.
We may be subject to increased premium payments, or calls, in amounts based on our claim records, the claim records of our managers, as well as the claim records of other members of the protection and indemnity associations through which we receive insurance coverage for tort liability, including pollution-related liability. In addition, our protection and indemnity associations may not have enough resources to cover claims made against them. Our payment of these calls could result in significant expense to us, which could have a material adverse effect on our business, results of operations, cash flows, financial condition and available cash.
Servicing our current or future indebtedness limits funds available for other purposes and if we cannot service our debt, we may lose our vessels.
We had $964.6$1,375.5 million and $1,159.0$1,853.0 million of indebtedness as of December 31, 20172020 and December 31, 2016,2019, respectively, and expect to incur additional indebtedness as we take delivery of the two vessels that are currently under construction and further expand our fleet. Borrowing under our credit facilities are secured by our vessels and certain of our vessel owning subsidiaries’ bank accounts and if we cannot service our debt, we may lose our vessels or certain of our pledged accounts. Borrowings under our credit facilities and other debt agreements requires us to dedicate a part of our cash flow from operations to paying interest and principal on our indebtedness. These payments limit funds available for working capital, capital expenditures and other purposes, including further equity or debt financing in the future. Amounts borrowed under our credit facilities bear interest at variable rates. Increases in prevailing rates could increase the amounts that we would have to pay to our lenders, even though the outstanding principal amount remains the same and our net income and cash flows would decrease. We expect our earnings and cash flow to vary from year to year due to the cyclical nature of the tanker industry. If we do not generate or reserve enough cash flow from operations to enable us to satisfy our short-term or medium- to long-term liquidity requirements or to otherwise satisfy our debt obligations, we may have to undertake alternative financing plans, which could dilute shareholders or negatively impact our financial results, depending on market conditions at the time, such as:
•seeking to raise additional capital;capital or equity;
•refinancing or restructuring our debt;
•establish new loans;
•selling tankers;tankers or assets (including investments); or
•reducing or delaying capital investments.
However, these alternative financing plans, if necessary, may not be sufficient to allow us to meet our debt obligations. If we are unable to meet our debt obligations or if some other default occurs under our credit facilities, our lenders could elect to declare that our debt, totally or partially, together with accrued interest and fees, to be immediately due and payable and proceed against the collateral vessels securing that debt even though the majority of the proceeds used to purchase the collateral vessels did not come from our credit facilities.
Adverse market conditions could cause us to breach covenants in our credit facilities and adversely affect our operating results.
The market values of tankers have generally been depressed. The market prices for tankers declined significantly from historically high levels reached in early 2008 and remain at relatively low levels. You should expect the market value of our vessels to fluctuate depending on general economic and market conditions affecting the shipping industry and prevailing charterhire rates, competition from other tanker companies and other modes of transportation, types, sizes and ages of vessels, applicable governmental regulations and the cost of newbuildings. We believe that the current aggregate market value of our vessels will be in excess of loan to value amounts required under our credit facilities. Our credit facilities generally require that the fair market value of the vessels pledged as collateral never be less than between 100% and 125%, depending on the applicable credit facility, of the aggregate principal amount outstanding under the loan. We were in compliance with these requirements as of December 31, 2017 and as of the date of this annual report.
A decrease in vessel values or a failure to meet this ratio could cause us to breach certain covenants in our existing credit facilities and future financing agreements that we may enter into from time to time. If we breach such covenants and are unable to remedy the relevant breach or obtain a waiver, our lenders could accelerate our debt and foreclose on our owned vessels. Additionally, if we sell one or more of our vessels at a time when vessel prices have fallen, the sale price may be less than the vessel's carrying value on our consolidated financial statements, resulting in a loss on sale or an impairment loss being recognized, ultimately leading to a reduction in earnings.
We may be unable to comply with the restrictions and financial covenants in the agreements governing our indebtedness or any future financial obligations, including the loan agreements that our 50%-owned joint ventures have entered or may enter into, that impose operating and financial restrictions on us.
Our agreements governing our indebtedness, including the loan agreements that our 50%-owned joint ventures have entered into,also impose certain operating and financial restrictions on us, mainly to ensure that the market value of the mortgaged vessel under the applicable credit facility does not fall below a certain percentage of the outstanding amount of the loan, which we refer to as the asset coverage ratio.ratio which means that the facility size of the vessel loans can be reduced if the value of the collateralized vessels falls under a certain percentage of the outstanding amount under that loan as a result of which a repayment in the same amount may be required. In addition, certain of our credit facilities will require us to satisfy certain other financial covenants, which require us to, among other things, maintain:
•an amount of current assets, which may include undrawn amount of any committed revolving credit facilities and credit lines having a maturity of more than one year, that, on a consolidated basis, exceeds our current liabilities;
•an aggregate amount of cash, cash equivalents and available aggregate undrawn amounts of any committed loan of at least $50.0 million or 5% of our total indebtedness (excluding guarantees), depending on the applicable loan facility, whichever is greater;
•an aggregate cash balance of at least $30.0 million; and
•a ratio of stockholders'stockholders’ equity to total assets of at least 30%.
In general, the operating restrictions that are contained in our credit facilities may prohibit or otherwise limit our ability to, among other things:
•effect changes in management of our vessels;
•transfer or sell or otherwise dispose of all or a substantial portion of our assets;
•declare and pay dividends if there is or will be, as a result of the dividend, an event of default or breach of a loan covenant; and
•incur additional indebtedness.
A violation of any of our financial covenants or operating restrictions contained in our credit facilities may constitute an event of default under our credit facilities, which, unless cured within the grace period set forth under the applicable credit facility, if applicable, or waived or modified by our lenders, provides our lenders with the right to, among other things, require us to post additional collateral, enhance our equity and liquidity, increase our interest payments, pay down our indebtedness to a level where we are in compliance with our loan covenants, sell vessels in our fleet, reclassify our indebtedness as current liabilities and accelerate our indebtedness and foreclose their liens on our vessels and the other assets securing the credit facilities, which would impair our ability to continue to conduct our business.
Furthermore, certain of our credit facilities contain a cross-default provision that may be triggered by a default under one of our other credit facilities, or those of our 50%-owned joint ventures. A cross-default provision means that a default on one loan would result in a default on certain other loans. Because of the presence of cross-default provisions in certain of our credit facilities, the refusal of any one lender under our credit facilities to grant or extend a waiver could result in certain of our indebtedness being accelerated, even if our other lenders under our credit facilities have waived covenant defaults under the respective credit facilities. If our secured indebtedness is accelerated in full or in part, it would be very difficult in the current financing environment for us to refinance our debt or obtain additional financing and we could lose our vessels and other assets securing our credit facilities if our lenders foreclose their liens, which would adversely affect our ability to conduct our business.
Moreover, in connection with any waivers of or amendments to our credit facilities that we may obtain, our lenders may impose additional operating and financial restrictions on us or modify the terms of our existing credit facilities. These restrictions may further restrict our ability to, among other things, pay dividends, make capital expenditures or incur additional indebtedness, including through the issuance of guarantees. In addition, our lenders may require the payment of additional fees, require prepayment of a portion of our indebtedness to them, accelerate the amortization schedule for our indebtedness and increase the interest rates they charge us on our outstanding indebtedness. Our credit facilities contain provisions that entitle the lenders to require us to prepay to the lenders their respective portion of any advances granted to us under the facility, which could negatively impact our financial results.
As of December 31, 20172020 and as of the date of this annual report, we were in compliance with the financial covenants contained and other restrictions in our debt agreements.
For more information, please read "Item 5. Operating and Financial Review and Prospects."
Adverse market conditions could cause us to breach covenants in our credit facilities and adversely affect our operating results.
Notwithstanding a degree of volatility in vessel values, the market values of tankers have generally been depressed. The market prices for tankers declined significantly from historically high levels reached in early 2008, and remain at relatively low levels. You should expect the market value of our vessels to fluctuate depending on general economic and market conditions affecting the shipping industry and prevailing charter hire rates, competition from other tanker companies and other modes of transportation, types, sizes, propulsion mode, fuel consumption and ages of vessels, applicable governmental regulations and the cost of newbuildings. Our credit facilities generally require that the fair market value of the vessels pledged as collateral never be less than 125% of the aggregate principal amount outstanding under the loan. We were in compliance with these requirements as of December 31, 2020 and as of the date of this annual report.
A decrease in vessel values or a failure to meet this ratio could cause us to breach certain covenants in our existing credit facilities and future financing agreements that we may enter into from time to time. If we breach such covenants and are unable to remedy the relevant breach or obtain a waiver, our lenders could accelerate our debt and foreclose on our owned vessels. Additionally, if we sell one or more of our vessels at a time when vessel prices have fallen, the sale price may be less than the vessel’s carrying value on our consolidated financial statements, resulting in a loss on sale or an impairment loss being recognized, ultimately leading to a reduction in earnings. In addition, because FSO vessels are often purposely built for specific circumstances, and due to the absence of an efficient market for transactions of FSO vessels, the carrying values of our FSO’s may not represent their fair values at any point in time. Additionally, events beyond our control, including changes in the economic and business conditions in the shipping markets in which we operate, interest rate developments, changes in the funding costs of our banks and changes in vessel earnings and asset valuations and outbreaks of epidemic and pandemic of diseases, such as the COVID-19 pandemic, may affect our ability to comply with these covenants.
The contribution of our joint ventures to our profits and losses may fluctuate, which could have a material adverse effect on our business, financial condition, results of operation and cash flows.
We currently own an interest in twothree of our vessels, Bari, FSO Asia and FSO Africa, through 50%-owned joint ventures, together with other third-party vessel owners and operators in our industry. Our ownership in these joint ventures is accounted for using the equity method, which means that our allocation of profits and losses of the applicable joint venture is included in our consolidated financial statements. The joint ventures for FSO Asia and FSO Africa have entered into certain credit facilities, for which we have provided a guarantee for the revolving credit facility tranche and are secured by the FSO vessels. A violation of any of our financial covenants or operating restrictions contained in the credit facilities for the FSO Africa and the FSO Asia may constitute an event of default thereunder, which may provide our lenders with the right to, among other things, require us to post additional collateral, enhance our equity and liquidity, increase our interest payments, pay down our indebtedness to a level where we are in compliance with our loan covenants, sell vessels in our fleet, reclassify our indebtedness as current liabilities and accelerate our indebtedness and foreclose their liens on our vessels and the other assets securing the credit facilities, which would impair our ability to continue to conduct our business. The joint venture for Bari has entered into various agreements including a term loan with Euronav Hong Kong as lender, secured by the vessel. A violation of any of the financial covenants or operations restrictions contained in the term loan for Bari may constitute an event of default thereunder, which may provide us with the right to, among other things, call all the issued shares in the joint venture. The contribution of our joint ventures to our profits and losses may fluctuate, including the dividends that we may receive from such entities, which could have a material adverse effect on our business, financial condition, results of operations and cash flows.
In addition, we have provided, and may continue to provide in the future, unsecured loans to our joint ventures which we treat as additional investments in the joint ventures. Accordingly, in the event our joint ventures do not repay these loans as they become due and payable, the value of our investment in such entities may decline. Furthermore, we have provided, and may continue to provide in the future, guarantees to certain banks with respect to commercial bank indebtedness of our joint ventures. Failure on behalf of any of our joint ventures to service its debt requirements and comply with any provisions contained in its commercial loan agreements, including paying scheduled installments and complying with certain covenants, may lead to an event of default under its loan agreement. As a result, if our joint ventures are unable to obtain a waiver or do not have enough cash on hand to repay the outstanding borrowings, their lenders may foreclose their liens on the vessels securing the loans or seek repayment of the loan from us, or both, which would have a material adverse effect on our financial condition, results of operations, and cash flows. As of December 31, 2017, the joint venture loan agreement has been repaid in full.
We are exposed to volatility in the London Interbank Offered Rate ("LIBOR"),LIBOR, and we have and we intend to selectively enter into derivative contracts, which can result in higher than market interest rates and charges against our income. If volatility in LIBOR occurs, it could affect our profitability, earnings and cash flow.
LIBOR is the subject of recent national, international and other regulatory guidance and proposals for reform. These reforms and other pressures may cause LIBOR to be eliminated or to perform differently than in the past. The consequences of these developments cannot be entirely predicted, but could include an increase in the cost of our variable rate indebtedness and obligations. The amounts outstanding under our senior secured credit facilities have been, and amounts under additional credit facilities that we may enter in the future will generally be, advanced at a floating rate based on LIBOR, which has been volatile in prior years, which can affect the amount of interest payable on our debt, and which, in turn, could have an adverse effect on our earnings and cash flow. In addition, in recent years, LIBOR has been at relatively low levels, and may rise in the future as the current low interest rate environment comes to an end. Our financial condition could be materially adversely affected at any time that we have not entered into interest rate hedging arrangements to hedge our exposure to the interest rates applicable to our credit facilities and any other financing arrangements we may enter into in the future. Moreover, even if we have entered into interest rate swaps or other derivative instruments for purposes of managing our interest rate exposure, our hedging strategies may not be effective and we may incur substantial losses.
LIBOR has historically been volatile, with the spread between LIBOR and the prime lending rate widening significantly at times. These conditions are the result of the disruptions in the international credit markets. Because the interest rates borne by our outstanding indebtedness fluctuate with changes in LIBOR, if this volatility were to occur, it would affect the amount of interest payable on our debt, which in turn, could have an adverse effect on our profitability, earnings and cash flow.
Furthermore, the calculation of interest in most financing agreements in our industry has been based on published LIBOR rates. Due in part to uncertainty relating to the LIBOR calculation process in recent years, it is likely that LIBOR will be phased out in the future. As a result, lenders have insisted on provisions that entitle the lenders, in their discretion, to replace published LIBOR as the base for the interest calculation with their cost-of-funds rate. If we are required to agree to such a provision in future financing agreements, our borrowing costs could increase significantly, which would have an adverse effect on our profitability, earnings and cash flow.
In addition, on November 30, 2020, ICE Benchmark Administration, the administrator of LIBOR, with the support of the United States Federal Reserve and the United Kingdom’s Financial Conduct Authority, announced plans to consult on ceasing publication of U.S. Dollar LIBOR on December 31, 2021 for only the one-week and two-month U.S. Dollar LIBOR tenors, and on June 30, 2023 for all other U.S. Dollar LIBOR tenors. The United States Federal Reserve concurrently issued a statement advising banks to stop new U.S. Dollar LIBOR issuances by the end of 2021. Such announcements indicate that the continuation of LIBOR on the current basis will not be guaranteed after 2021. The Alternative Reference Rate Committee, a committee convened by the Federal Reserve that includes major market participants, has proposed an alternative rate to replace U.S. Dollar LIBOR with: the Secured Overnight Financing Rate, or “SOFR.” The impact of such a transition from LIBOR to SOFR or another alternative rate could be significant for us.
In order to manage our exposure to interest rate fluctuations, we may from time to time use interest rate derivatives to effectively fix some of our floating rate debt obligations. No assurance can however be given that the use of these derivative instruments, if any, may effectively protect us from adverse interest rate movements. The use of interest rate derivatives may affect our results through mark to market valuation of these derivatives. Also, adverse movements in interest rate derivatives may require us to post cash as collateral, which may impact our free cash position. Interest rate derivatives may also be impacted by the transition from LIBOR to SOFR or other alternative rates.
We have previously entered into and may selectively in the future enter into additional derivative contracts to hedge our overall exposure to interest rate risk exposure. Entering into swaps and derivatives transactions is inherently risky and presents various possibilities for incurring significant expenses. The derivatives strategies that we employ currently or in the future may not be successful or effective, and we could, as a result, incur substantial additional interest costs and recognize losses on such arrangements in our financial statements. Such risk may have an adverse effect on our financial condition and results of operations. See "Item“Item 5. Operating and Financial Review and Prospects"Prospects” for a description of our interest rate swap arrangements.
Fluctuations in exchange rates and non-convertibility of currencies could result in losses to us.
As a result of our international operations, we are exposed to fluctuations in foreign exchange rates due to parts of our operating costs being expressed in currencies other than U.S. dollars, primarily in Euro. As a result, there is transactional risk to us that currency fluctuations will have a negative effect on the value of our cash flows and our financial condition. Accordingly, we may experience currency exchange losses if we have not fully hedged our exposure to a foreign currency, which could lead to fluctuations in our results of operations.
Our costs of operating as a public company are significant, and our management is required to devote substantial time to complying with public company regulations. If we fail to maintain an effective system of internal control over financial reporting, we may not be able to accurately report our financial results or prevent fraud. As a result, shareholders could lose confidence in our financial and other public reporting, which would harm our business and the trading price of our common stock.
In January 2015, we became subject to the reporting requirements of the Securities Exchange Act of 1934, as amended, or the Exchange Act, and the other rules and regulations of the SEC, including the Sarbanes-Oxley Act of 2002, or the Sarbanes-Oxley Act, and as such, we have significant legal, accounting and other expenses that we did not incur previously. In 2016, we became subject to the requirements as directed by Section 404(b) of the Sarbanes-Oxley Act of 2002, requiring an auditor attestation with respect to our internal control over financial reporting (ICOFR).or ICOFR. These reporting obligations impose various requirements on US registered public companies, including changes in corporate governance practices, and these requirements may continue to evolve. We, and our management personnel, and other personnel if any, devote a substantial amount of time to comply with these requirements. Moreover, these rules and regulations increase our legal and financial compliance costs and make some activities more time-consuming and costly.
Sarbanes-Oxley requires, among other things, that we maintain and periodically evaluate our internal control over financial reporting and disclosure controls and procedures. In particular, we need to perform system and process evaluation and testing of our internal control over financial reporting to allow management and our independent registered public accounting firm to report on the effectiveness of our internal control over financial reporting, as required by Section 404 of Sarbanes-Oxley. Effective internal controls over financial reporting, together with adequate disclosure controls and procedures, are necessary for us to provide reliable financial reports and are designed to prevent fraud. Any failure to implement required new or improved controls, or difficulties encountered in their implementation, could cause us to fail to meet our reporting obligations. In addition, any testing we conduct in connection with Section 404 of the Sarbanes-Oxley Act of 2002, or any testing conducted by our independent registered public accounting firm, may reveal deficiencies in our internal controls over financial reporting that are deemed to be material weaknesses or that may require prospective or retroactive changes to our financial statements or identify other areas for further attention or improvement. Inferior internal controls could also cause investors to lose confidence in our reported financial information, which could have a negative effect on the trading price of our securities. Our compliance with Section 404 has and may continue to require us to incur substantial expenses and significant management efforts.
Increasing scrutiny and changing expectations from investors, lenders and other market participants with respect to our Environmental, Social and Governance (“ESG”) policies may impose additional costs on us or expose us to additional risks.
Companies across all industries are facing increasing scrutiny relating to their ESG policies. Investor advocacy groups, certain institutional investors, investment funds, lenders and other market participants are increasingly focused on ESG practices and in recent years have placed increasing importance on the implications and social cost of their investments. The increased focus and activism related to ESG and similar matters may hinder access to capital, as investors and lenders may decide to reallocate capital or to not commit capital as a result of their assessment of a company’s ESG practices. Companies which do not adapt to or comply with investor, lender or other industry shareholder expectations and standards, which are evolving, or which are perceived to have not responded appropriately to the growing concern for ESG issues, regardless of whether there is a legal requirement to do so, may suffer from reputational damage and the business, financial condition, and/or stock price of such a company could be materially and adversely affected.
We depend on directorsmay face increasing pressures from investors, lenders and other market participants, who are associated with affiliated companies, whichincreasingly focused on climate change, to prioritize sustainable energy practices, reduce our carbon footprint and promote sustainability. As a result, we may create conflicts of interest.
Certain ofbe required to implement more stringent ESG procedures or standards so that our directors are associated with affiliated companies, which may create conflicts of interest. Because these directors owe fiduciary duties to bothexisting and future investors and lenders remain invested in us and other related parties, conflictsmake further investments in us, especially given the highly focused and specific trade of interestcrude oil transportation in which we are engaged. If we do not meet these standards, our business and/or our ability to access capital could be harmed.
Additionally, certain investors and lenders may resultexclude oil transport companies, such as us, from their investing portfolios altogether due to environmental, social and governance factors. These limitations in matters involving or affecting usboth the debt and our customers. In addition, theyequity capital markets may have conflicts of interest when faced with decisions that could have different implications for other related parties than they do for us. Any such conflicts of interest could adversely affect our ability to grow as our plans for growth may include accessing the equity and debt capital markets. If those markets are unavailable, or if we are unable to access alternative means of financing on acceptable terms, or at all, we may be unable to implement our business strategy, which would have a material adverse effect on our financial condition and results of operations and impair our ability to service our indebtedness. Further, it is likely that we will incur additional costs and require additional resources to monitor, report and comply with wide ranging ESG requirements. The occurrence of any of the trading price of our ordinary shares. For further discussion of transactions with, or involving, our directors that may give rise to potential conflicts of interest, please see "Item 7. Major Shareholders and Related Party Transactions—B. Related Party Transactions."
A shift in consumer demand from oil towards other energy sources or changes to trade patterns for oil and oil products may have a material adverse effect on our business.
A significant portion of our earnings are related to the oil industry. A shift in the consumer demand from oil towards other energy resources such as wind energy, solar energy, water energy or nuclear energy will potentially affect the demand for our vessels. Thisforegoing could have a material adverse effect on our future performance, results of operations, cash flows and financial position.
Seaborne trading and distribution patterns are primarily influenced by the relative advantage of the various sources of production, locations of consumption, pricing differentials and seasonality. Changes to the trade patterns of oil and oil products may have a significant negative or positive impact on the ton-mile and therefore the demand for our tankers. This could have a material adverse effect on our future performance, results of operations, cash flows and financial position.
An inability to effectively time investments in and divestments of vessels could prevent the implementation of our business strategy and negatively impact our results of operations and financial condition.
Our strategy is to own and operate a fleet large enough to provide global coverage, but no larger than what the demand for our services can support over a longer period by both contracting newbuildings and through acquisitions and disposals in the secondhand market. Our business is greatly influenced by the timing of investments and/or divestments and contracting of newbuildings. If we are unable to identify the optimal timing of such investments, divestments or contracting of newbuildings in relation to the shipping value cycle due to capital restraints, this could have a material adverse effect on our competitive position, future performance, results of operations, cash flows and financial position.
We rely on our information systems to conduct our business, and failure to protect these systems against security breaches could adversely affect our business and results of operations. Additionally, if these systems fail or become unavailable for any significant period of time, our business could be harmed.
The efficient operation of our business is dependent on computer hardware and software systems. Information systems are vulnerable to security breaches by computer hackers and cyber-terrorists. Like other global companies, we have, from time to time, experienced threats to our data and systems, including malware and computer virus attacks, internet network scans, systems failures and disruptions. A cyberattack that bypasses our IT security systems, causing an IT security breach, could lead to a material disruption of our IT systems and adversely impact our daily operations and cause the loss of sensitive information, including our own proprietary information and that of our customers, suppliers and employees. Such losses could harm our reputation and result in competitive disadvantages, litigation, regulatory enforcement actions, lost revenues, additional costs and liability. While we devote substantial resources to maintaining adequate levels of cybersecurity, our resources and technical sophistication may not be adequate to prevent all types of cyberattacks.
We rely on industry accepted security & control frameworks and technology to securely maintain confidential and proprietary information and personal data maintained on our information systems. However, these measures and technology may not adequately prevent security breaches. In addition, the unavailability of the information systems or the failure of these systems to perform as anticipated for any reason could disrupt our business and could result in decreased performance and increased operating costs, causing our business and results of operations to suffer. Any significant interruption or failure of our information systems or any significant breach of security could adversely affect our business, results of operations and financial condition, as well as our cash flows. Furthermore, as from May 25, 2018, data breaches on personal data as defined in the General Data Protection Regulation 2016/679 (EU), could lead to administrative fines up to €20 million or up to 4% of the total worldwide annual turnover of the company, whichever is higher.
We depend on directors who are associated with major shareholders, which may create conflicts of interest.
Certain of our directors are associated with major shareholders, which may create conflicts of interest. Because these directors owe fiduciary duties to both us and those shareholders, conflicts of interest may result in matters involving or affecting us and our customers. In addition, they may have conflicts of interest when faced with decisions that could have different implications for those shareholders than they do for us. Any such conflicts of interest could adversely affect our business, financial condition and results of operations and the trading price of our ordinary shares. For further discussion of transactions with, or involving, our directors that may give rise to potential conflicts of interest, please see "Item 6.A and F/S note 22 “Related Parties”: Relationship with CMB - Properties - Registration Rights”.
An inability to effectively time investments in and divestments of vessels could prevent the implementation of our business strategy and negatively impact our results of operations and financial condition.
Our Proposed Mergerstrategy is to own and operate a fleet large enough to provide global coverage, but no larger than what the demand for our services can support over a longer period by both contracting newbuildings and through acquisitions and disposals in the secondhand market. Our business is greatly influenced by the timing of investments and/or divestments and contracting of newbuildings. In general, the cost of maintaining a vessel in good operating condition increases with Gener8
Completionthe age of the Merger is subjectvessel. As our fleet ages, we may incur increased costs. Older vessels are typically less fuel efficient and more costly to maintain than more recently constructed vessels due to improvements in engine technology. Cargo insurance rates also increase with the age of a vessel, making older vessels less desirable to charterers. Governmental regulations and safety or other equipment standards related to the age of a vessel may also require expenditures for alterations or the addition of new equipment to our vessels, and may restrict the type of activities in which our vessels may engage. Although our current fleet of 75 vessels has an average age of approximately 9.35 years as of April 1, 2021, we cannot assure you that, as our vessels age, market conditions will justify such expenditures or will enable us to profitably operate our vessels during the remainder of their expected useful lives. The increased operating costs in the future could adversely affect our earnings.
If we are unable to identify the optimal timing of such investments, divestments or contracting of newbuildings in relation to the shipping value cycle due to capital restraints, this could have a material adverse effect on our competitive position, future performance, results of operations, cash flows and financial position.
Dependence on third party service providers
The Company currently outsources to third party service providers, certain management services of its fleet, including certain aspects of technical, commercial and crew management. In particular, the Company has entered into ship management agreements that assign technical and crew management responsibilities to a numberthird party technical manager for 20% of other conditions,the Company’s fleet (collectively, the “Ship Management Agreements”) and if these conditions are not satisfied or waived, the Merger will not be completed.
On December 20, 2017, the Company Gener8 Maritime. Inc., a corporation organized underhas transferred commercial management of part of its fleet to TI Pool.
In such outsourcing arrangements, the lawsCompany has transferred direct control over technical, crew and commercial management of the Republicrelevant vessels, while maintaining significant oversight and audit rights, and must rely on third party service providers to, among other things:
•comply with contractual commitments to the Company, including with respect to safety, security, quality, proper crew management and environmental compliance of the Marshall Islands ("Gener8") and Euronav MI Inc., a corporation organized under the lawsoperations of the Republic ofCompany’s vessels;
•comply with requirements imposed by the Marshall Islands and a wholly-owned subsidiary ofU.S. government, the Company (the “Merger Sub”) entered into an agreement and plan of merger (the "Merger Agreement") to govern a stock-for-stock merger (the "Merger") for the entire issued and outstanding share capital of Gener8.
Our obligationsUN and the obligations of Gener8 to complete the mergerEU (i) restricting certain transaction that may be and calls on ports located in countries that are, subject to satisfaction or waiver of a number of conditions including, amongsanctions and embargoes and (ii) prohibiting bribery and other conditions: (i) approvalcorrupt practices;
•respond to changes in customer demands for the Company’s vessels;
•obtain supplies and materials necessary for the operation and maintenance of the Merger AgreementCompany’s vessels; and
•mitigate the related transactions, including the appointmentimpact of an exchange agentlabor shortages and/or disruptions relating to among other things, act as agent for the Merger, by holders of a majority of the outstanding Gener8 common shares at a special meeting, (ii) Gener8 obtaining certain consents and waivers under its applicable credit agreements and related transaction documents to allow the Merger to be properly entered into without causing a breach of any of the terms of such agreements, (iii) approval for the listingcrews on the New York Stock ExchangeCompany’s vessels.
The failure of our ordinary sharesthird-party service providers to be issuedmeet such commitments could lead to legal liability or other damages to the Company. The third-party service providers the Company has selected may not provide a standard of service comparable to that which the Company would provide for such vessels if the Company directly provided such service. The Company relies on its third-party service providers to comply with applicable law, and a failure by such providers to comply with such laws may subject the Company to liability or damage its reputation even if the Company did not engage in the Merger, (iv) our registration statementconduct itself. Furthermore, damage to any such third party’s reputation, relationships or business may reflect on Form F-4 being declared effective under the Securities Act by the SEC; (v) absence of any applicable lawCompany directly or order that prohibits completion of the transaction, (vi) accuracy of the representationsindirectly, and warranties made in the Merger Agreement by the other party, subject to certain materiality qualifications, (vii) performance in all material respects by the other party of the material obligations required to be performed by it at or prior to completion of the transaction, and (viii) the absence ofcould have a material adverse effect on the other party.Company’s reputation and business.
There can be no assurance
The third-party managers have the right to terminate their agreements. If the third-party manager exercises that right, the conditions to completion of the MergerCompany will be satisfiedrequired either to enter into substitute agreements with other third parties or waived or thatto assume those management duties. The Company may not succeed in negotiating and entering into such agreements with other events will not intervene to delay or result inthird parties and, even if it does so, the failure to complete the Merger.
Weterms and conditions of such agreements may fail to realize the anticipated benefits of the Merger.
We believe that the Merger will provide benefitsbe less favorable to the combined company resulting fromCompany. Furthermore, if the Merger. However, thereCompany is a risk that some or all of the expected benefits of the Merger may failrequired to materialize, or may not occur within the time periods anticipated. The realization of such benefits may be affected by a number of factors, many of which are beyond our control, includingdedicate internal resources to managing its fleet (including, but not limited to, the strengthhiring additional qualified personnel or weakness of the economy and competitive factors in the areas where we and Gener8 do business, the effects of competition in the markets in which Euronav or Gener8 operate, and the impact of changes in the laws and regulations regulating the seaborne transportation or refined petroleum products industries or affecting domestic or foreign operations. The challenge of coordinating previously separate businesses makes evaluating the business and future financial prospects of the combined company following the Merger difficult. We and Gener8 have operated and, until completion of the Merger, will continue to operate, independently. The success of the Merger, including anticipated benefits and cost savings, will depend, in part, on the ability to successfully integrate the operations of both companies in a mannerdiverting existing resources), that results in various benefits, including, among other things, an expanded market reach and operating efficiencies, and that does not materially disrupt existing relationships norcould result in decreased revenues or dividends. The past financial performance of each of us and Gener8 may not be indicative of their future financial performance. Realization of the anticipated benefits in the Merger will depend, in part, on the combined company’s ability to successfully integrate the two businesses. The combined company will be required to devote significant management attention and resources to integrating its business practices and support functions. The diversion of management’s attention and any delays or difficulties encountered in connection with the Merger and the coordination of the two companies’ operations could have an adverse effect on the business, financial results, financial condition or the share price of the combined company following the Merger. The coordination process may also result in additional and unforeseen expenses.
Failure to realize all of the anticipated benefits of the Merger may impact the financial performance of the combined company, the price of our ordinary shares and our ability to pay dividends, which will be at the discretion of its board of directors in accordance with Euronav’s dividend policy. In addition, even if we do not realize the anticipated benefits of the merger, we would remain liable for significant transaction costs, including legal, accounting and financial advisory fees. Any delay in completing the Merger may significantly reduce the benefits that we expect to achieve if they successfully complete the Merger within the expected timeframe and integrate their respective businesses.
The announcement and pendency of the Merger could adversely affect our businesses, results of operations and financial condition.
The announcement and pendency of the Merger could cause disruptions in and create uncertainty surrounding our businesses, including affecting our relationships with our existing and future customers, suppliers and employees, which could have an adverse effect on our business, results of operations and financial condition, regardless of whether the Merger is completed. In particular, we could potentially lose customers or suppliers, and new customer or supplier contracts could be delayed or decreased. These uncertainties may impair our ability to attract, retain and motivate key personnel until the Merger is consummated and for a period of time thereafter. In addition, we have expended, and continue to expend, significant management resources, in an effort to complete the Merger, which are being diverted from our day-to-day operations.
If the Merger is not completed, the price of our ordinary shares may fall to the extent that the current price of their shares reflects a market assumption that the Merger will be completed. In addition, the failure to complete the Merger may result in negative publicity or a negative impression of us in the investment community and may affect our relationships with employees, customers, suppliers, lenders and other partners in the business community.
We will incur significant transaction and integration-related costs in connection with the merger.
We expect to incur a number of non-recurring costs associated with the merger and combining Gener8’s operations into our operations. We will incur significant transactionincreased costs and integration-related feesreduced efficiency and costs related to formulating and implementing integration plans, including systems consolidation costs and employment-related costs. We continue to assess the amount of these costs, and additional unanticipated costs may be incurred in the Merger. Although we expect to realize other efficiencies related to the integration of us with Gener8 which may allow us to offset integration-related costs over time, this net benefit may not be achieved in the near term, or at all.
The termination of the Merger Agreement could negatively impact us.
If the Merger is not completed for any reason, including as a result of Gener8’s shareholders failing to approve the Merger Agreement, our ongoing business may be adversely affected and, without realizing any of the anticipated benefits of having completed the Merger, we may be subject to a number of risks, including the following:
we may experience negative reactions from the financial markets, including a decline of our share price (which may reflect a market assumption that the Merger will be completed);
we may experience negative reactions from the investment community, its respective customers and employees and other partners in the business community;
we may be required to pay certain costs relating to the Merger, whether or not the Merger is completed; and
matters relating to the Merger will have required substantial commitments of time and resources by our management, which would otherwise have been devoted to our day-to-day operations and other opportunities that may have been beneficial had the Merger not been contemplated.
The Merger Agreement could lead to financing restrictions andprofitability. Any such changes in covenants.
We will assume or repay a substantial part of the existing indebtedness of Gener8 if the Merger is completed, which may impose additional operating and financial restrictions on us (beyond those that currently exist) which, together with the resulting debt services obligations, could significantly limit the combined company’s ability to execute its business strategy, and increase the risk of default under its debt obligations after the Merger is completed.
As of December 31, 2017, we intend to assume $1,358.0 million of the existing indebtedness of Gener8 in connection with the completion of the Merger. Gener8’s current secured credit facilities require it to maintain specified financial ratios and satisfy financial covenants, including ratios and covenants based on the market value of the vessels in Gener8’s fleet in relation to the indebtedness outstanding. Gener8 is reasonably likely, absent waivers or amendments from its senior secured lenders, to be in breach of certain financial covenants in its senior secured credit facilities as early as the end of the first quarter of 2018, subject to the completion of covenant testing. Although Gener8 has requested a waiver from its lenders for the potential breach, such waiver might not obtained before the Merger is consummated.
Because some of the ratios and covenants set minimum values for the vessels in respect of the indebtedness outstanding, should vessel values decline in the future for any reason whatsoever, including due to declines in charter rates, the combined company may be required to take action to reduce its debt or to act in a manner contrary to its business objectives to meet any such financial ratios and satisfy any such financial covenants. Additionally, some of the ratios and covenants require the combined company to (i) maintain minimum levels of liquidity and interest expense coverage and (ii) not exceed the maximum level of leverage specified therein. Events beyond the combined company’s control, including changes in the economic and business conditions in the shipping markets in which the combined company will operate, may affect its ability to comply with these covenants. No assurance can be provided that the combined company will meet its financial or other covenants or that its lenders will waive any failure to do so.
Additionally, the terms of Gener8’s existing indebtedness place certain restrictions on the operations of the obligors thereunder, including restrictions on incurring additional indebtedness and liens, disposal of assets and chartering arrangements. These covenants, along with the financial covenants discussed above, may adversely affect the combined company’s ability to finance future operations or limit its ability to pursue certain business opportunities or take certain corporate actions. The covenants may also restrict the combined company’s flexibility in planning for, or reacting to, changes in its business and the industry and make it more vulnerable to economic downturns and adverse developments. A breach of any of the covenants in, or the combined company’s inability to maintain the required financial ratios under, its credit facilities would prevent it from borrowing additional money under its credit facilities and could result in a default under its credit facilities. If a default occurs undertemporary loss of customer approvals, could disrupt the combined company’s credit facilities, the lenders could elect to declare the issuedCompany’s business and outstanding debt, together with accrued interest and other fees, to be immediately due and payable and foreclose on the collateral securing that debt, which could constitute all or substantially all of the combined company’s assets. Furthermore, the combined company’s debt agreements contain cross-default provisions, whereby a default by the combined company under one of its debt agreements would automatically be an event of default under other debt agreements. Such cross defaults could result in the acceleration of the maturity of the debt under these agreements and the lenders thereunder may foreclose upon any collateral securing that debt, including the combined company’s vessels. In the event of such acceleration or foreclosure, the combined company might not have sufficient funds or other assets to satisfy all of its obligations, which would have a material adverse effect on itsthe Company’s business, results of operations and financial condition.
Following the completion of the Merger, the combined company’s ability to meet its cash requirements, including the combined company’s debt service obligations, will be dependent upon its operating performance, which will be subject to general economic and competitive conditions and to financial, business and other factors affecting its operations, many of which are or may be beyond the combined company’s control. The combined company cannot provide assurance that its business operations will generate sufficient cash flows from operations to fund these cash requirements and debt service obligations. If the combined company’s operating results, cash flow or capital resources prove inadequate, it could face substantial liquidity problems and might be required to dispose of material assets or operations to meet its debt and other obligations. If the combined company is unable to service its debt, it could be forced to reduce or delay planned expansions and capital expenditures, sell assets, restructure or refinance its debt or seek additional equity capital. The combined company may be unable to take any of these actions on satisfactory terms or in a timely manner which could result in the combined company entering bankruptcy proceedings. Further, any of these actions may not be sufficient to allow the combined company to service its debt obligations or may have an adverse impact on its business. The combined company’s debt agreements may limit its ability to take certain of these actions. The combined company’s failure to generate sufficient operating cash flow to pay its debts or to successfully undertake any of these actions could have a material adverse effect on the combined company. These risks may be increased as a result of the increased amount of indebtedness of the combined company following the completion of the Merger.
In addition, the degree to which the combined company may be leveraged as a result of the indebtedness assumed in connection with the Merger or otherwise could materially and adversely affect its ability to obtain additional financing for working capital, capital expenditures, acquisitions, debt service requirements or other purposes, could make the combined company more vulnerable to general adverse economic, regulatory and industry conditions, and could limit its flexibility in planning for, or reacting to, changes and opportunities in the markets in which it competes.
Additional information concerning the risks, uncertainties and assumptions associated with the Merger can be found in the section entitled “Risk Factors” contained in our preliminary joint proxy statement/prospectus on Form F-4 (Registration No. 333-223039), as amended and supplemented, that was initially filed with the SEC on February 14, 2018, and as may be subsequently amended.
Risk Factors Relating to an Investment in Our Ordinary Shares
Our share price may be highly volatile and future sales of our ordinary shares could cause the market price of our ordinary shares to decline.
The market price of our ordinary shares has historically fluctuated over a wide range and may continue to fluctuate significantly in response to many factors, such as actual or anticipated fluctuations in our operating results, changes in financial estimates by securities analysts, economic, regulatory and regulatoryESG trends, general market conditions, rumors, fabricated news, business interruptions caused by the outbreak of COVID-19 and other factors, many of which are beyond our control. Since 2008, the stock market has experienced extreme price and volume fluctuations. If the volatility in the market continues or worsens, it could have an adverse effect on the market price of our ordinary shares and impact a potential sale price if holders of our ordinary shares decide to sell their shares.
The price of our common shares has fluctuated in the past, has recently been volatile and may be volatile in the future, and as a result, investors in our common shares could incur substantial losses.
Our stock price has fluctuated in the past, has recently been volatile and may be volatile in the future. The price of our common shares has ranged from a price of between $13.09 and $7.36 between 1 January 2020 and 31 December 2020 without any discernable announcements or developments by the company or third parties to substantiate the movement of our stock price. Out stock prices may experience rapid and substantial decreases or increases in the foreseeable future that are unrelated to our operating performance or prospects. In addition, the ongoing outbreak of the novel COVID-19 virus has caused broad stock market and industry fluctuations. The stock market in general and the market for shipping companies in particular have experienced extreme volatility that has often been unrelated to the operating performance of particular companies. As a result of this volatility, investors may experience substantial losses on their investment in our common shares. The market price for our common shares may be influenced by many factors, including the following:
•investor reaction to our business strategy;
•our continued compliance with the listing standards of NYSE and/or Euronext;
•regulatory or legal developments in the United States and other countries, especially changes in laws or regulations applicable to our industry;
•variations in our financial results or those of companies that are perceived to be similar to us;
•our ability or inability to raise additional capital and the terms on which we raise it;
•declines in the market prices of stocks generally;
•trading volume of our common shares;
•sales of our common shares by us or our stockholders;
•general economic, industry and market conditions; and
•other events or factors, including those resulting from such events, or the prospect of such events, including war, terrorism and other international conflicts, public health issues including health epidemics or pandemics, such as the ongoing COVID-19 pandemic, adverse weather and climate conditions could disrupt our operations or result in political or economic instability.
These broad market and industry factors may seriously harm the market price of our common shares, regardless of our operating performance, and may be inconsistent with any improvements in actual or expected operating performance, financial condition or other indicators of value. Since the stock price of our common shares has fluctuated in the past, has been recently volatile and may be volatile in the future, investors in our common shares could incur substantial losses. In the past, following periods of volatility in the market, securities class-action litigation has often been instituted against companies. Such litigation, if instituted against us, could result in substantial costs and diversion of management’s attention and resources, which could materially and adversely affect our business, financial condition, results of operations and growth prospects. There can be no guarantee that our stock price will remain at current prices.
Additionally, recently, securities of certain companies have experienced significant and extreme volatility in stock price due short sellers of shares of common shares, known as a “short squeeze”. These short squeezes have caused extreme volatility in those companies and in the market and have led to the price per share of those companies to trade at a significantly inflated rate that is disconnected from the underlying value of the company. Many investors who have purchased shares in those companies at an inflated rate face the risk of losing a significant portion of their original investment as the price per share has declined steadily as interest in those stocks have abated. While we have no reason to believe our shares would be the target of a short squeeze, there can be no assurance that we will not be in the future, and you may lose a significant portion or all of your investment if you purchase our shares at a rate that is significantly disconnected from our underlying value.
From time to time our Supervisory Board may authorize a share buyback within the Belgian legal framework. There is no guarantee that we will repurchase shares at a level anticipated by stockholders or at all, which could reduce returns to our stockholders. Once authorized, decisions to repurchase our common stock will be at the discretion of our Management Board, based upon a review of relevant considerations.
In accordance with the authorization granted by a general meeting of shareholders held on 20 May 2020, we have the option but not the obligation until June 2025 of buying our own shares back should we believe there is a substantial value disconnect between the share price and the real value of the Company. During 2020 we bought back shares from June 2020 until December 2020. During 2021 as of the date of this annual report, we did not buy back shares.
Following these transactions, as of April 1, 2021 we owned 18,346,732 of our own shares (8,43% of the total outstanding shares). We may continue to buy back our shares opportunistically under the conditions laid down by law and subject to a valid authorization. The extent to which we do so and the timing of these purchases, will depend upon a variety of factors, including market conditions, regulatory requirements and other corporate considerations.
The Supervisory Board’s determination to repurchase shares of our common stock will depend upon our profitability and financial condition, contractual restrictions, restrictions imposed by applicable law and other factors that the Supervisory Board deems relevant. Based on an evaluation of these factors, the Supervisory Board may determine not to repurchase shares or to repurchase shares at reduced levels compared to historical levels, any or all of which could reduce returns to our stockholders.
Although we have a dividend policy that includes a fixed component, we cannot assure you that we will declare or pay any dividends. The tanker industry is volatile and we cannot predict with certainty the amount of cash, if any, that will be available for distribution as dividends in any period.
Our Supervisory Board of Directors may from time to time, declare and pay cash dividends in accordance with our Coordinated Articles of Association and applicable Belgian law. The declaration and payment of dividends, if any, will always be subject to the approval of either our Supervisory Board of Directors (in the case of "interim dividends"“interim dividends”) or of the shareholders (in the case of "regular“regular dividends” or "intermediary dividends").
Dividends,
Our current dividend policy is the following: we intend to pay a minimum fixed dividend of at least $0.12 in total per share per year provided (a) the Company has in the view of the Supervisory Board, sufficient balance sheet strength and liquidity combined (b) with sufficient earnings visibility from fixed income contracts. In addition, if any,the results per share are positive and exceed the amount of the fixed dividend, that excess income will be paidallocated to either: additional cash dividends, share buy-back, accelerated amortization of debt or the acquisition of vessels which the Supervisory Board considers at that time to be accretive to shareholders’ value.
Additional guidance to the above stated policy as applied to our final results for the year ended on December 31, 2019 and to our quarterly results as from 2020 onwards, was provided by our Supervisory Board by way of a press release dated January 9, 2020, as follows:
•Each quarter the Company will target to return 80% of net income (including the fixed element of $0.03 per quarter) to shareholders.
•This return to shareholders will primarily be in two installments: firstthe form of a cash dividend and the Company will always look at stock repurchase as an interimalternative if it believes more value can be created for shareholders.
•The Company retains the right to return more than 80% should the circumstances allow it.
As part of its distribution policy the Company will continue to include exceptional capital losses when assessing additional dividends but also continue to exclude exceptional capital gains when assessing additional dividend based onpayments. As part of its distribution policy the Company will not include non-cash items affecting the results of the first 6 months of our fiscal year, thensuch as a balance payment corresponding to the final dividend once the full year results have been audited and presented to our shareholders for approval. The interim dividend payout ratio may typically be more conservative than the yearly payout and will take into account any other form of return of capital done over the same period.deferred tax assets or deferred tax liabilities.
Pursuant to the dividend policy set out above, our
Our Supervisory Board of Directors will continue to assess the declaration and payment of dividends upon consideration of our financial results and earnings, restrictions in our debt agreements, market prospects, current capital expenditures, commitments, investment opportunities, and the provisions of Belgian law affecting the payment of dividends to shareholders and other factors. We may stop paying dividends at any time and cannot assure you that we will pay any dividends in the future or of the amount of such dividends. For instance, we did not declare or pay any dividends from 2010 until 2014.
In general, under the terms of our debt agreements, we are not permitted to pay dividends if there is or will be as a result of the dividend a default or a breach of a loan covenant.covenant as a result of the dividend. Our credit facilities also contain restrictions and undertakings which may limit our and our subsidiaries' ability to declare and pay dividends (for instance, with respect to each of our joint ventures, no dividend may be distributed before its loan agreement, as applicable, is repaid in full). Please see "Item“Item 5. Operating and Financial Review and Prospects"Prospects” for more information relating to restrictions on our ability to pay dividends under the terms of the agreements governing our indebtedness. Belgian law generally prohibits the payment of dividends unless net assets on the closing date of the last financial year do not fall beneath the amount of the registered capital and, before the dividend is paid out, 5% of the net profit is allocated to the legal reserve until this legal reserve amounts to 10% of the share capital. No distributions may occur if, as a result of such distribution, our net assets would fall below the sum of (i) the amount of our registered capital, (ii) the amount of such aforementioned legal reserves, and (iii) other reserves which may be required by our Coordinated Articles of Association or by law, such as the reserves not available for distribution in the event we hold treasury shares. We may not have sufficient surplus in the future to pay dividends and our subsidiaries may not have sufficient funds or surplus to make distributions to us. We can give no assurance that dividends will be paid at a level anticipated by stockholders or at all. In addition, the corporate law of jurisdictions in which our subsidiaries are organized may impose restrictions on the payment or source of dividends under certain circumstances.
Future issuances and sales of our ordinary shares could cause the market price of our ordinary shares to decline.
As of December 31, 2017,2020, our issued (and fully paid up) share capital was $173,046,122.14$239,147,506.82 which was represented by 159,208,949 ordinary shares, and220,024,713 shares. By decision at our Shareholders’ Special Meeting held on May 20, 2020, our Supervisory Board of Directors ishas been authorized to acquire a maximum of 10% of the existing shares or profit shares during a period of five years, at a price per share not exceeding the maximum price allowed under applicable law and not to be less than EUR 0.01. Shares bought back by must not be cancelled and can be held as treasury shares. Under Belgian corporate laws, the voting rights related to treasury shares are suspended and treasury shares give no entitlement to dividend. We may at any time transfer all or part of our treasury shares to a third party, at which time the corresponding voting rights will cease to be suspended and the shares will again give their holder entitlement to dividend. Our shareholders may incur dilution from any such future transfer. Additionally, by decision of our shareholders’ meeting held on February 20, 2020, our Supervisory Board has been authorized to increase our share capital in one or several times by a total maximum amount of $150,000,000$25,000,000 (with possibility for our Supervisory Board to restrict or suspend the preferential subscription rights of our existing shareholders) or $120,000,000 (without the possibility for our Supervisory Board to restrict or suspend the preferential subscription rights of our existing shareholders) during a period of five years as from June 19, 2015.the date of publication of the decision, subject to the terms and conditions to be determined by our Supervisory Board. Issuances and sales of a substantial number of ordinary shares in the public market, or the perception that these issuances or sales could occur, may depress the market price for our ordinary shares. These sales could also impair our ability to raise additional capital through the sale of our equity securities in the future. We intend to issue additional ordinary shares in the future. Our shareholders may incur dilution from any future equity offering.
We are incorporated in Belgium, which provides for different and in some cases more limited shareholder rights than the laws of jurisdictions in the United States.
We are a Belgian company and our corporate affairs are governed by Belgian corporate law. Principles of law relating to such matters as the validity of corporate procedures, the fiduciary duties of management, the dividend payment dates and the rights of shareholders may differ from those that would apply if we were incorporated in a jurisdiction within the United States.
For example, there are no statutory dissenters'dissenters’ rights under Belgian law with respect to share exchanges, mergers and other similar transactions, and the rights of shareholders of a Belgian company to sue derivatively, on the company'scompany’s behalf, are more limited than in the United States.
Civil liabilities based upon the securities and other laws of the United States may not be enforceable in original actions instituted in Belgium or in actions instituted in Belgium to enforce judgments of U.S. courts.
Civil liabilities based upon the securities and other laws of the United States may not be enforceable in original actions instituted in Belgium or in actions instituted in Belgium to enforce judgments of U.S. courts. Actions for the enforcement of judgments of U.S. courts might be successful only if the Belgian court confirms the substantive correctness of the judgment of the U.S. court and is satisfied that:
•the effect of the enforcement judgment is not manifestly incompatible with Belgian public policy;
•the judgment did not violate the rights of the defendant;
•the judgment was not rendered in a matter where the parties transferred rights subject to transfer restrictions with the sole purpose of avoiding the application of the law applicable according to Belgian international private law;
•the judgment is not subject to further recourse under U.S. law;
•the judgment is not incompatible with a judgment rendered in Belgium or with a subsequent judgment rendered abroad that might be enforced in Belgium;
•a claim was not filed outside Belgium after the same claim was filed in Belgium, while the claim filed in Belgium is still pending;
•the Belgian courts did not have exclusive jurisdiction to rule on the matter;
•the U.S. court did not accept its jurisdiction solely on the basis of either the nationality of the plaintiff or the location of the disputed goods; and
•the judgment submitted to the Belgian court is authentic.
ITEM 4. INFORMATION ON THE COMPANY
A.History and Development of the Company
Euronav NV was incorporated under the laws of Belgium on June 26, 2003 for an indefinite term, and grew out of the combination of certain tanker businesses carried out by three companies that had a strong presence in the shipping industry: Compagnie Maritime Belge NV, or CMB, formed in 1895, Compagnie Nationale de Navigation SA, or CNN, formed in 1938, and Ceres Hellenic Shipping Enterprises Ltd., or Ceres Hellenic, formed in 1950. Our predecessor started doing business under the name "Euronav" in 1989.term. Our Company has the legal form of a public limited liability company (naamloze vennootschap/ société anonyme).
Our principal shareholderregistered office is Marc Saverys, individually or through Saverco NV, or Saverco, an entity controlled by him. The Saverys family has had a continuous presence in the shipping industry since the early nineteenth century. The Saverys family owned a shipyard which was founded in 1829, ownedlocated at De Gerlachekaai 20, 2000 Antwerpen, Belgium and operated various shipowning companies since the 1960s, and acquired CMB in 1991.our telephone number is +32 3 247 44 11.
Our ordinary shares have traded on Euronext Brussels since December 2004. In January 2015, we completed our underwritten initial public offering in the United States of 18,699,000 ordinary shares at $12.25 per share, and our ordinary shares commenced trading on the New York Stock Exchange, or NYSE. In March 2015, we completed our offer to exchange unregistered ordinary shares that were previously issued in Belgium (other than ordinary shares owned by our affiliates) for ordinary shares that were registered under the Securities Act of 1933, as amended, or the U.S. Exchange Offer, in which an aggregate of 42,919,647 ordinary shares were validly tendered and exchanged. Our ordinary shares currently trade on the NYSE and Euronext Brussels under the symbol "EURN."
On June 12, 2018 we completed the merger with Gener8 Maritime Inc., a corporation organized under the laws of the Republic of the Marshall Islands ("Gener8") whereby Gener8 became our wholly-owned subsidiary. Prior to the merger, Gener8 was a leading U.S.-based provider of international seaborne crude oil transportation services that resulted from a merger between General Maritime Corporation, a well-known tanker owner, and Navig8 Crude Tankers Inc., a company sponsored by the Navig8 Group, an independent vessel pool manager. At the date of the merger with Gener8, Gener8 owned a fleet of 29 tankers on the water, consisting of 21 VLCC vessels, six Suezmax vessels, and two LR1 vessels, with an aggregate carrying capacity of approximately 7.4 million deadweight tons or DWT, which included 19 “eco” VLCC newbuildings delivered from 2015 through 2017 equipped with advanced, fuel-saving technology, that were constructed at reputable shipyards.
The merger with Gener8 created a world leading independent crude tanker operator with 74 large crude tankers focused predominately on the VLCC and Suezmax asset classes and two FSO vessels in joint venture and provides tangible economies of scale via pooling arrangements, procurement opportunities, reduced overhead and enhanced access to capital. Furthermore the combined company offers investors a well-capitalized and more liquid company in the tanker market.
The SEC maintains an Internet site that contains reports, proxy and information statements, and other information regarding issuers that file electronically with the SEC, which can be accessed at http://www.sec.gov. Our website address is https://www.euronav.com/en/. The information contained on these websites do not form a part of this annual report.
For information about the development of our fleet, please see Item 5. Operating and Financial Review and Prospects—Fleet Development."
B.Business Overview
We are a fully-integrated provider of international maritime shipping and offshore services engaged primarily in the transportation and storage of crude oil. As of March 19, 2018,April 1, 2021, we owned or operated a modern fleet of 5377 vessels (including four10 chartered-in vessels, four to be delivered in 2018)vessels) with an aggregate carrying capacity of approximately 13.419.5 million deadweight tons, or dwt, consisting of 2845 very large crude carriers, or VLCCs, onetwo V-plus, 2228 Suezmax vessels (including fourtwo under construction as of March 19, 2018)April 1, 2021), and two floating, storage and offloading vessels, or FSOs (both owned through 50/50 joint ventures). The average age of our fleet as of March 19, 2018April 1, 2021 was approximately 9.07.97 years for our VLCC fleet and 11.09 years for our Suezmax fleet, as compared to an industry average age as of March 19, 2018April 1, 2020 of approximately 9.410.1 years for the VLCC fleet and 9.510.6 years for the Suezmax fleet.
We currently charter our vessels, non-exclusively, to leading international energy companies, such as North Oil Company, or NOC, (whose shareholders are Qatar Petroleum Oil & Gas Limited and Total E&P Golfe Limited), Total and Valero or their respective subsidiaries, although there is no guarantee that these companies will continue their relationships with us. We pursue a chartering strategy that seeks an optimal mix of employment of our vessels depending on the fluctuations of freight rates in the market and our own judgment as to the direction of those rates in the future. Our vessels are therefore routinely employed on a combination of spot market voyages, fixed-rate contracts and long-term time charters, which typically include a profit sharing component. We principally employ our VLCCs through the TI Pool, a spot market-oriented pool in which we were a founding member in 2000. As of March 19, 2018, 15April 1, 2021, 22 of our vessels were employed directly in the spot market, 2441 of our vessels were employed in the TI Pool, 812 of our vessels were employed on long-term charters, of which the average remaining duration is 4 months,2 years, including fivefour with profit sharing components, and our two FSOs owned in joint venture were employed on long-term service contracts. While we believe that our chartering strategy allows us to capitalize on opportunities in an environment of increasing rates by maximizing our exposure to the spot market, our vessels operating in the spot market may be subject to market downturns to the extent spot market rates or need for spot voyages decline. At times when the freight market may become more challenging, we will try to timely shift our exposure to more time charter contracts and potentially dispose of some of our assets which should provide us with incremental stable cash flows and stronger utilization rates supporting our business during periods of market weakness. We believe that our chartering strategy and our fleet size management, combined with the leadership of our experienced management team should enable us to capture value during cyclical upswings and to withstand the challenging operating environment such as the one seen in the years from 2010 to 2013 or/and seen since the last quarter of 2017.in 2018.
Developments in 20172020
On April 20, 2017 we signed two long-term time charter contracts, each with a term of seven years with Valero Energy Inc. for the employment of two Suezmax vessels with specialized Ice Class 1C capability. The charters are expected to commence in late 2018. In connection with entry charter contracts, on April 27, 2017 we entered into newbuilding contracts for the construction of two high specification Ice Class Suezmax vessels from Hyundai shipyard in South Korea. These vessels have a substantially increased steel structure that enables a ship to navigate through sea ice and are equipped with specific emissions controls and other bespoke operational capabilities. Delivery of these vessels is expected in the second half of 2018 when each of the time charter contracts will begin.
On May 11, 2017, our General Meeting of Shareholders approved the annual accounts for the year ended December 31, 2016, and a dividend of $0.22 per ordinary share. Taken into account the gross dividend of USD 0.55 per share paid on September 30, 2016 as interim dividend, this brings the total gross dividend paid in relation to 2016 to USD 0.77 per share.
On May 14, 2017, our joint ventures with International Seaways, Inc. signed a five year contract for the FSO Africa and FSO Asia in direct continuation of the previous contractual service with Maersk Oil Qatar, which expired on September 21, 2017 and July 21, 2017, respectively. The contracts were signed with North Oil Company, the new operator of the Al-Shaheen oil field, whose shareholders are Qatar Petroleum Oil & Gas Limited and Total E&P Golfe Limited. The new contracts for these custom-made three million barrels capacity units which have been significantly converted and that have been serving the Al-Shaheen field without interruption since 2010, have a duration of five years.
On May 31, 2017, Euronav Luxembourg SA, one of our wholly owned subsidiaries, completed a new senior unsecured bond issue of $150 million with a coupon of 7.50% and maturity in May 2022. The net proceeds from the bond issue will be used for general corporate purposes. We serve as guarantor of the bonds. On October 23, 2017, the bonds were listed on the Oslo Stock Exchange.
On June 6, 2017, we entered into an agreement, or the Dealer Agreement,with BNP Paribas Fortis SA/NV to act as arranger and dealer for a Belgian Multi-currency Short- Notes Program with a maximum outstanding amount of €50million. Pursuant to the terms of the Dealer Agreement, we may issue the treasury notes to the dealer from time to time upon such terms and such prices as we and the dealer agree. As of December 31, 2017 the outstanding balance under this program was €41.7 million or $50.0 million.
For information about acquisitions and dispositions of our vessels during 2017,2020, please see Item. 5. Operating and Financial Review and Prospects-Fleet Development.
Proposed Merger with Gener8 Maritime, Inc.
On December 20, 2017, the Company, Gener8 Maritime, Inc., which we refer to as Gener8, and Euronav MI Inc., which we refer to as Merger Sub, entered into the Merger Agreement to govern the Merger. Pursuant to the Merger Agreement, subject to the satisfaction or waiver of certain conditions, the Merger Sub will merge with and into Gener8 and Gener8 will continue its corporate existence as a wholly-owned subsidiary of the Company. At the effective time of the Merger (the "Effective Time"), each issued and outstanding Gener8 common share will be canceled and automatically converted into the right to receive 0.7272 of an ordinary share of the Company (the "Exchange Ratio"). The Gener8 common shares will be contributed to the Company pursuant to applicable provisions of the Belgian Companies Code in a capital increase procedure referred to as a Contribution in Kind. Immediately following the Effective Time, the Company expects to issue approximately 60.9 million new ordinary shares to Gener8 shareholders, based on the Exchange Ratio, which are estimated to represent approximately 28% of the outstanding Euronav ordinary shares (based on the fully diluted share capital of Euronav and the fully diluted share capital of Gener8). The Exchange Ratio implies a premium of 35% paid on Gener8 shares based on the closing share prices on December 20, 2017.
The completion of the Merger is subject to the satisfaction of certain closing conditions, many of which are substantive and which have not been met as of the date of this annual report. The Merger is currently projected to close in the second quarter of 2018; however, there is no assurance that the Merger will be completed. The Merger is subject to, among other important conditions, (i) the approval of the Merger Agreement by Gener8 shareholders representing at least a majority of the issued and outstanding common shares of Gener8 at a special meeting, (ii) the consent of certain of Gener8’s lenders to assign certain debt facilities to the combined entity following the Merger, (iii) the effectiveness of a registration statement filed by the Company with the SEC to register our ordinary shares to be issued in the Merger and (iv) the approval for the listing of such shares on the NYSE.
If the Merger is completed, we will assume approximately $1,358.0 million of Gener8’s existing indebtedness (which was the amount outstanding as of December 31, 2017) in connection with the completion of the Merger. Gener8’s current secured credit facilities require it to maintain specified financial ratios and satisfy financial covenants, including ratios and covenants based on the market value of the vessels in Gener8’s fleet in relation to the indebtedness outstanding, which vary from the covenants and restrictions contained in our existing debt agreements and with which the combined company will be required to comply.
After the Merger, members of our Board of Directors and executive management will continue to serve in such positions of the combined company. In addition, pursuant to the Merger Agreement, we have agreed to take all actions necessary so that Mr. Steven Smith (a current director of Gener8) (or if Mr. Smith is unavailable, then such other person designated by a committee of Gener8’s disinterested directors who is reasonably satisfactory to Euronav, which acceptance shall not be unreasonably withheld) will, upon recommendation of our corporate governance and nomination committee, be proposed for election to serve on our Board of Directors at our next regularly scheduled annual general meeting. In connection with the proposed Merger, certain shareholders of Gener8, representing approximately 48% of the issued and outstanding share of Gener8 as of the date of this annual report, have entered into certain voting agreements pursuant to which these shareholders, subject to the terms and conditions of such voting agreements, to appear (in person or by proxy) at any meeting of the shareholders convened for the purpose of approving the Merger Agreement and to vote their Gener8 common shares in favor of the Merger Agreement and the related transactions.
Concurrently with the execution of the Merger Agreement, the Company and Gener8 executed and delivered three memoranda of agreement which contemplate the purchase by us of three vessels from Gener8 at a total purchase price of $220.9 million if the Merger is not consummated, other than as a result of a breach of the Merger Agreement by us. A portion of the purchase price of each of the three vessels can be offset by up to one-third of the $39 million termination fee contemplated by the Merger Agreement payable by Gener8 in the case of a termination of the Merger Agreement in circumstances that trigger the termination fee.
We expect to enter into an agreement with International Seaways, Inc., or International Seaways, an unaffiliated third-party, pursuant to which International Seaways would, subject to the consummation of the Merger, among other conditions, purchase from us up to six VLCC vessels (the “Gener8 VLCC Vessels”) and their respective special purpose vehicles for an aggregate purchase price of up to $434 million part of which is expected to be by assuming the outstanding debt related to those vessels. The purchase by International Seaways of the Gener8 VLCC Vessels is subject to the consent of International Seaways’ existing lenders. If such lenders do not consent to International Seaways’ purchase of the Gener8 VLCC Vessels, Seaways will nevertheless buy the Gener8 VLCC Vessels and their respective special purpose vehicles for the same aggregate purchase price and may or may not assume the debt related to those vessels and we expect to repurchase two of the Gener8 VLCC Vessels from International Seaways for cash consideration of $143 million and we may also prepay all or part of the outstanding debt obligations associated with those VLCCs and subject to certain other conditions. The Gener8 VLCC Vessels, which have an average age of 1.7 years as of the date the Merger Agreement, are expected to be delivered to the buyer during the second fiscal quarter of 2018. The sale of the Gener8 VLCC Vessels is subject to definitive documentation.
Following the completion of the proposed Merger with Gener8 and assuming the proposed sale of six VLCCs to International Seaways, it is expected that the combined company resulting from the Merger will own and operate a combined fleet, or the Combined Fleet, with an average age of approximately 7.71 years (estimated as of March 19, 2018), an aggregate carrying capacity of approximately 19.1 million deadweight tons, or dwt and consisting of one V-Plus crude carrier, 43 very large crude carriers, or VLCCs (including four vessels that we charter-in), 28 Suezmax vessels (which include the newbuilding delivered to us on March 26, 2018 and the remaining three newbuildings expected to be delivered in 2018), two Panamax vessels, one Aframax vessel, and two floating, storage and offloading vessels, or FSOs (in which we hold a 50% ownership interest).
It is our intention to employ as soon as commercially practicable all of the Gener8 vessels either in commercial pools, on time charters or in the spot market, consistent with the strategy currently employed by us, as described below under the heading "Employment of Our Fleet." Generally, the Combined Fleet will be technically and commercially managed as described below under the heading “Technical and Commercial Management of Our Vessels." As a result of the Merger, a larger proportion of the vessels in the Combined Fleet may be managed by third-party managers than the proportion of vessels in our fleet that were managed by third-party managers prior to the Merger.
For additional information on the Proposed Merger with Gener8, including the risks associated with the Merger, please see our preliminary joint proxy statement/prospectus on Form F-4 (Registration No. 333-223039), as amended and supplemented, that was initially filed with the SEC on February 14, 2018, and as may be subsequently amended. Please also refer to Item 3. Key Information-D. Risk Factors".
Our Fleet
Set forth below is certain information regarding our fleet as of March 19, 2018.April 1, 2021.
| | | | | | | | | | | | | | | | | | | | | | | | | | | | | | | | | | | | | | | | | | | | |
| Vessel Name | | Type | | Deadweight Tons (dwt) | | Year Built | | Shipyard (1) | | Charterer | | Employment | | Charter Expiry Date (2) |
| Owned Vessels | | | | | | | | | | | | | | |
| Europe | | V-Plus | | 441,561 | | 2002 | | | Daewoo | | ST Shipping | | Time Charter | | May-21 |
| Oceania | | V-Plus | | 441,561 | | 2003 | | | Daewoo | | | | Spot | | N/A |
| Aegean | | VLCC | | 299,999 | | 2016 | | | Hyundai | | | | TI Pool | | N/A |
| Alboran | | VLCC | | 298,991 | | 2016 | | | Hyundai | | | | TI Pool | | N/A |
| Alex | | VLCC | | 299,445 | | 2016 | | | Hyundai | | | | TI Pool | | N/A |
| Alice | | VLCC | | 299,320 | | 2016 | | | Hyundai | | | | TI Pool | | N/A |
| Alsace | | VLCC | | 320,350 | | 2012 | | | Samsung | | | | TI Pool | | N/A |
| Amundsen | | VLCC | | 298,991 | | 2017 | | | Hyundai | | | | TI Pool | | N/A |
| Andaman | | VLCC | | 299,392 | | 2016 | | | Hyundai | | | | TI Pool | | N/A |
| Anne | | VLCC | | 299,533 | | 2016 | | | Hyundai | | | | TI Pool | | N/A |
| Antigone | | VLCC | | 299,421 | | 2015 | | | Hyundai | | | | TI Pool | | N/A |
| Aquitaine | | VLCC | | 298,767 | | 2017 | | | Hyundai | | | | TI Pool | | N/A |
| Arafura | | VLCC | | 298,991 | | 2016 | | | Hyundai | | | | TI Pool | | N/A |
| Aral | | VLCC | | 299,999 | | 2016 | | | Hyundai | | | | TI Pool | | N/A |
| Ardeche | | VLCC | | 298,642 | | 2017 | | | Hyundai | | | | TI Pool | | N/A |
| Daishan | | VLCC | | 306,005 | | 2007 | | | Daewoo | | | | TI Pool | | N/A |
| Dalma | | VLCC | | 306,543 | | 2007 | | | Daewoo | | | | TI Pool | | N/A |
| Delos | | VLCC | | 300,200 | | 2021 | | | Daewoo | | | | TI Pool | | N/A |
| Desirade | | VLCC | | 299,999 | | 2016 | | | Daewoo | | | | TI Pool | | N/A |
| Dia | | VLCC | | 299,999 | | 2015 | | | Daewoo | | | | TI Pool | | N/A |
| Dickens | | VLCC | | 300,200 | | 2021 | | | Daewoo | | Trafigura | | Time Charter | | Jun-21 |
| Diodorus | | VLCC | | 300,200 | | 2021 | | | Daewoo | | ST Shipping | | Time Charter | | April-21 |
| Dominica | | VLCC | | 299,999 | | 2015 | | | Daewoo | | | | TI Pool | | N/A |
| Donoussa | | VLCC | | 299,999 | | 2016 | | | Daewoo | | | | TI Pool | | N/A |
| Doris | | VLCC | | 300,200 | | 2021 | | | Daewoo | | Trafigura | | Time Charter | | May-21 |
| Drenec | | VLCC | | 299,999 | | 2016 | | | Daewoo | | | | TI Pool | | N/A |
| Hakata | | VLCC | | 302,550 | | 2010 | | | Universal | | | | TI Pool | | N/A |
| Hakone | | VLCC | | 302,624 | | 2010 | | | Universal | | | | TI Pool | | N/A |
| Hatteras | | VLCC | | 297,363 | | 2017 | | | Hanjin Subic | | | | TI Pool | | N/A |
| Heron | | VLCC | | 297,363 | | 2017 | | | Hanjin Subic | | | | TI Pool | | N/A |
| Hirado | | VLCC | | 302,550 | | 2011 | | | Universal | | | | TI Pool | | N/A |
| Hojo | | VLCC | | 302,965 | | 2013 | | | JMU | | | | TI Pool | | N/A |
| Ilma | | VLCC | | 314,000 | | 2012 | | | Hyundai | | | | TI Pool | | N/A |
| Ingrid | | VLCC | | 314,000 | | 2012 | | | Hyundai | | | | TI Pool | | N/A |
| Iris | | VLCC | | 314,000 | | 2012 | | | Hyundai | | | | TI Pool | | N/A |
| Sandra | | VLCC | | 323,527 | | 2011 | | | STX | | | | TI Pool | | N/A |
| Sara | | VLCC | | 323,183 | | 2011 | | | STX | | | | TI Pool | | N/A |
| Simone | | VLCC | | 313,988 | | 2012 | | | STX | | Petrobras | | Time Charter | | June-22 |
| Sonia | | VLCC | | 314,000 | | 2012 | | | STX | | | | TI Pool | | N/A |
| Bari | | Suezmax | | 159,186 | | 2005 | | | Hyundai | | | | Spot | | N/A |
| Cap Charles | | Suezmax | | 158,881 | | 2006 | | | Samsung | | | | Spot | | N/A |
| Cap Corpus Christi | | Suezmax | | 156,600 | | 2018 | | | Hyundai | | Valero | | Time Charter (3) | | Oct-25 |
| Cap Felix | | Suezmax | | 158,765 | | 2008 | | | Samsung | | | | Spot | | N/A |
|
| | | | | | | | | | | | | | | |
| Vessel Name | | Type | | Deadweight Tons (dwt) | | Year Built | | Shipyard (1) | | Charterer | | Employment | | Charter Expiry Date (2) |
| Owned Vessels | |
| |
| |
| |
| |
| |
| |
|
| TI Europe | | V-Plus | | 441,561 | | 2002 |
| | Daewoo | | Statoil | | Time Charter | | Mar-18 |
| Sandra | | VLCC | | 323,527 | | 2011 |
| | STX | |
| | TI Pool | | N/A |
| Sara | | VLCC | | 323,183 | | 2011 |
| | STX | | Total | | Time Charter (3) | | Nov-18 |
| Alsace | | VLCC | | 320,350 | | 2012 |
| | Samsung | |
| | TI Pool | | N/A |
| TI Hellas | | VLCC | | 319,254 | | 2005 |
| | Hyundai | | Petrobras | | Time Charter | | Nov-18 |
| Ilma | | VLCC | | 314,000 | | 2012 |
| | Hyundai | |
| | TI Pool | | N/A |
| Simone | | VLCC | | 313,988 | | 2012 |
| | STX | |
| | TI Pool | | N/A |
| Sonia | | VLCC | | 314,000 | | 2012 |
| | STX | |
| | TI Pool | | N/A |
| Ingrid | | VLCC | | 314,000 | | 2012 |
| | Hyundai | |
| | TI Pool | | N/A |
| Iris | | VLCC | | 314,000 | | 2012 |
| | Hyundai | |
| | TI Pool | | N/A |
| Nautic | | VLCC | | 307,284 | | 2008 |
| | Dalian | |
| | TI Pool | | N/A |
| Newton | | VLCC | | 307,284 | | 2009 |
| | Dalian | |
| | TI Pool | | N/A |
| Nectar | | VLCC | | 307,284 | | 2008 |
| | Dalian | |
| | TI Pool | | N/A |
| Noble | | VLCC | | 307,284 | | 2008 |
| | Dalian | |
| | TI Pool | | N/A |
| V.K. Eddie | | VLCC | | 305,261 | | 2005 |
| | Daewoo | | Petrobras | | Time Charter | | Aug-18 |
| Hojo | | VLCC | | 302,965 | | 2013 |
| | JMU | |
| | TI Pool | | N/A |
| Hakone | | VLCC | | 302,624 | | 2010 |
| | Universal | |
| | TI Pool | | N/A |
| Hirado | | VLCC | | 302,550 | | 2011 |
| | Universal | |
| | TI Pool | | N/A |
| Hakata | | VLCC | | 302,550 | | 2010 |
| | Universal | | Total | | Time Charter (3) | | Sep-18 |
| Antigone | | VLCC | | 299,421 | | 2015 |
| | Hyundai | |
| | TI Pool | | N/A |
| Anne | | VLCC | | 299,533 | | 2016 |
| | Hyundai | |
| | TI Pool | | N/A |
| Alex | | VLCC | | 299,445 | | 2016 |
| | Hyundai | |
| | TI Pool | | N/A |
| Alice | | VLCC | | 299,320 | | 2016 |
| | Hyundai | |
| | TI Pool | | N/A |
| Aquitaine | | VLCC | | 298,767 | | 2017 |
| | Hyundai | |
| | TI Pool | | N/A |
| Ardeche | | VLCC | | 298,642 | | 2017 |
| | Hyundai | |
| | TI Pool | | N/A |
| Cap Diamant | | Suezmax | | 160,044 | | 2001 |
| | Hyundai | |
| | Spot | | N/A |
| Cap Pierre | | Suezmax | | 159,083 | | 2004 |
| | Samsung | |
| | Spot | | N/A |
| Cap Leon | | Suezmax | | 159,049 | | 2003 |
| | Samsung | | Valero | | Time Charter (3) | | Jul-18 |
| Cap Philippe | | Suezmax | | 158,920 | | 2006 |
| | Samsung | |
| | Spot | | N/A |
| Cap Guillaume | | Suezmax | | 158,889 | | 2006 |
| | Samsung | |
| | Spot | | N/A |
| Cap Charles | | Suezmax | | 158,881 | | 2006 |
| | Samsung | |
| | Spot | | N/A |
| Cap Victor | | Suezmax | | 158,853 | | 2007 |
| | Samsung | |
| | Spot | | N/A |
| Cap Lara | | Suezmax | | 158,826 | | 2007 |
| | Samsung | |
| | Spot | | N/A |
| Cap Theodora | | Suezmax | | 158,819 | | 2008 |
| | Samsung | |
| | Spot | | N/A |
| Cap Felix | | Suezmax | | 158,765 | | 2008 |
| | Samsung | |
| | Spot | | N/A |
| Fraternity | | Suezmax | | 157,714 | | 2009 |
| | Samsung | |
| | Spot | | N/A |
| Felicity | | Suezmax | | 157,667 | | 2009 |
| | Samsung | |
| | Spot | | N/A |
| Capt. Michael | | Suezmax | | 157,648 | | 2012 |
| | Samsung | |
| | Spot | | N/A |
| Maria | | Suezmax | | 157,523 | | 2012 |
| | Samsung | |
| | Spot | | N/A |
| Cap Quebec (7) | | Suezmax | | 156,600 | | 2018 |
| | Hyundai | | Valero | | Time Charter (3) (6) | | May-25 |
| Hull S910 (4) | | Suezmax | | 156,600 | | 2018 |
| | Hyundai | | Valero | | Time Charter (3) (6) | | N/A |
| Hull S911 (4) | | Suezmax | | 156,600 | | 2018 |
| | Hyundai | | Valero | | Time Charter (3) (6) | | N/A |
| Hull S912 (4) | | Suezmax | | 156,600 | | 2018 |
| | Hyundai | | Valero | | Time Charter (3) (6) | | N/A |
| Finesse | | Suezmax | | 149,994 | | 2003 |
| | Universal | |
| | Spot | | N/A |
| Filikon | | Suezmax | | 149,989 | | 2002 |
| | Universal | |
| | Spot | | N/A |
| Cap Romuald | | Suezmax | | 146,640 | | 1998 | | Samsung | | Valero | | Time Charter (3) | | May-18 |
| Cap Jean | | Suezmax | | 146,643 | | 1998 |
| | Samsung | | Valero | | Time Charter (3) | | Mar-18 |
| Total DWT—Owned Vessels | |
| | 11,278,424 | |
| |
| |
| |
| |
|
| | | | | | | | | | | | | | | | | | | | | | | | | | | | | | | | | | | | | | | | | | | | |
| Cap Guillaume | | Suezmax | | 158,889 | | 2006 | | Samsung | | Oceanic Marine | | Time Charter | | Sep-21 |
| Cap Lara | | Suezmax | | 158,826 | | 2007 | | | Samsung | | | | Spot | | N/A |
| Cap Leon | | Suezmax | | 159,049 | | 2003 | | | Samsung | | | | Spot | | N/A |
| Cap Pembroke | | Suezmax | | 156,600 | | 2018 | | | Hyundai | | Valero | | Time Charter (3) | | Jun-25 |
| Cap Philippe | | Suezmax | | 158,920 | | 2006 | | | Samsung | | | | Spot | | N/A |
| Cap Pierre | | Suezmax | | 159,083 | | 2004 | | | Samsung | | | | Spot | | N/A |
| Cap Port Arthur | | Suezmax | | 156,600 | | 2018 | | | Hyundai | | Valero | | Time Charter (3) | | Oct-25 |
| Cap Quebec | | Suezmax | | 156,600 | | 2018 | | | Hyundai | | Valero | | Time Charter (3) | | Jun-25 |
| Cap Theodora | | Suezmax | | 158,819 | | 2008 | | | Samsung | | | | Spot | | N/A |
| Cap Victor | | Suezmax | | 158,853 | | 2007 | | | Samsung | | | | Spot | | N/A |
| Captain Michael | | Suezmax | | 157,648 | | 2012 | | | Samsung | | | | Spot | | N/A |
| Filikon | | Suezmax | | 149,989 | | 2002 | | | Universal | | | | Spot | | N/A |
| Fraternity | | Suezmax | | 157,714 | | 2009 | | | Samsung | | | | Spot | | N/A |
| Maria | | Suezmax | | 157,523 | | 2012 | | | Samsung | | | | Spot | | N/A |
| Sapphira | | Suezmax | | 150,205 | | 2008 | | | Universal | | | | Spot | | N/A |
| Selena | | Suezmax | | 150,205 | | 2007 | | | Universal | | | | Spot | | N/A |
| Sienna | | Suezmax | | 150,205 | | 2007 | | | Universal | | | | Spot | | N/A |
| Statia | | Suezmax | | 150,205 | | 2006 | | | Universal | | | | Spot | | N/A |
| Stella | | Suezmax | | 165,000 | | 2011 | | | Hyundai | | | | Spot | | N/A |
| Sofia | | Suezmax | | 165,000 | | 2010 | | | Hyundai | | | | Spot | | N/A |
| Total DWT—Owned Vessels | | | | 15,899,784 | | | | | | | | | | |
|
| | | | | | | | | | | | | | | |
| Vessel Name | | Type | | Deadweight Tons (dwt) | | Year Built |
| | Shipyard (1) | | Charterer | | Employment | | Chartered-In Expiry Date |
| Chartered-In Vessels | | | | | | | | | | | | | | |
| Nucleus | | VLCC | | 307,284 | | 2007 |
| | Dalian | | | | TI Pool | | Dec-21 |
| Nautilus | | VLCC | | 307,284 | | 2006 |
| | Dalian | | | | TI Pool | | Dec-21 |
| Navarin | | VLCC | | 307,284 | | 2007 |
| | Dalian | | | | TI Pool | | Dec-21 |
| Neptun | | VLCC | | 307,284 | | 2007 |
| | Dalian | | | | TI Pool | | Dec-21 |
| Total DWT Chartered-In Vessels | | 1,229,136 | |
| |
| | | |
| |
|
| | | | | | | | | | | | | | | Service Contract Expiry Date |
| FSO Vessels | | | | | | | | | | | | | | |
| FSO Africa (5) | | FSO | | 442,000 | | 2002 |
| | Daewoo | | NOC | | Service Contract | | Sep-22 |
| FSO Asia (5) | | FSO | | 442,000 | | 2002 |
| | Daewoo | | NOC | | Service Contract | | Jul-22 |
| Total DWT FSO Vessels(6) | | 442,000 | |
| |
| | | |
| |
|
| | | | | | | | | | | | | | | | | | | | | | | | | | | | | | | | | | | | | | | | | | | | |
| Vessel Name | | Type | | Deadweight
Tons (dwt) | | Year
Built | | Shipyard (1) | | Charterer | | Employment | | Chartered-In Expiry Date |
| Chartered-In Vessels | | | | | | | | | | | | | | |
| Chartered-In Vessels | | | | | | | | | | | | | | |
| Nucleus | | VLCC | | 307,284 | | 2007 | | | Dalian | | | | TI Pool | | Dec-21 |
| Nautilus | | VLCC | | 307,284 | | 2006 | | | Dalian | | | | TI Pool | | Dec-21 |
| Navarin | | VLCC | | 307,284 | | 2007 | | | Dalian | | | | TI Pool | | Dec-21 |
| Neptun | | VLCC | | 307,284 | | 2007 | | | Dalian | | | | TI Pool | | Dec-21 |
| Nautica | | VLCC | | 307,284 | | 2008 | | | Dalian | | | | TI Pool | | Jun-24 |
| Nectar | | VLCC | | 307,284 | | 2008 | | | Dalian | | | | TI Pool | | Jun-24 |
| Noble | | VLCC | | 307,284 | | 2008 | | | Dalian | | | | TI Pool | | Jun-24 |
| Newton | | VLCC | | 307,284 | | 2009 | | | Dalian | | | | TI Pool | | Feb-24 |
| Marlin Sardinia | | Suezmax | | 156,607 | | 2019 | | | New Times Shipbuilding | | | | Spot | | Oct-22 |
| Marlin Somerset | | Suezmax | | 156,620 | | 2019 | | | New Times Shipbuilding | | | | Spot | | Nov-22 |
| Total DWT Chartered-In Vessels | | | | 2,771,499 | | | | | | | | | | |
| FSO Vessels | | | | | | | | | | | | | | |
| FSO Africa (4) | | FSO | | 442,000 | | 2002 | | | Daewoo | | NOC | | Service Contract | | Sep-32 |
| FSO Asia (4) | | FSO | | 442,000 | | 2002 | | | Daewoo | | NOC | | Service Contract | | Jul-32 |
| Total DWT FSO Vessels | | 442,000 | | | | | | | | | | |
| |
(1) | As used in this report, "Samsung" refers to Samsung Heavy Industries Co., Ltd, "Hyundai" refers to Hyundai Heavy Industries Co., Ltd., "Universal" refers to Universal Shipbuilding Corporation, "Hitachi refers to Hitachi Zosen Corporation, "Daewoo" refers to Daewoo Shipbuilding and Marine Engineering S.A., "JMU" refers to Japan Marine United Corp., Ariake Shipyard, Japan, "Dalian" refers to Dalian Shipbuilding Industry Co. Ltd., and "STX" refers to STX Offshore and Shipbuilding Co. Ltd. |
| |
(2) | Assumes no exercise by the charterer of any option to extend (if applicable). |
| |
(3) | Profit sharing component under time charter contracts. |
| |
(4) | Vessels expected to be delivered to us in the course of 2018. |
| |
(5) | Vessels in which we hold a 50% ownership interest. |
| |
(6) | Vessels in which we hold a 50% ownership interest are only accounted for the share of DWT corresponding to our ownership interest. |
| |
(7) | Vessel was delivered to the Company on March 26, 2018 |
(1)As used in this report, "Samsung" refers to Samsung Heavy Industries Co., Ltd, "Hyundai" refers to Hyundai Heavy Industries Co., Ltd., "Universal" refers to Universal Shipbuilding Corporation, "Hitachi refers to Hitachi Zosen Corporation, "Daewoo" refers to Daewoo Shipbuilding and Marine Engineering S.A., "JMU" refers to Japan Marine United Corp., Ariake Shipyard, Japan, "Dalian" refers to Dalian Shipbuilding Industry Co. Ltd., "STX" refers to STX Offshore and Shipbuilding Co. Ltd., and "Hanjin" refers to Hanjin Heavy Industry Co. Ltd.
(2)Assumes no exercise by the charterer of any option to extend (if applicable).
(3)Profit sharing component under time charter contracts.
(4)Vessels in which we hold a 50% ownership interest and are only accounted for the share of DWT corresponding to such ownership interest.
Employment of Our Fleet
Our tanker fleet is employed worldwide through a combination of primarily spot market voyage fixtures, including through the TI Pool, fixed-rate contracts and time charters. We deploy our two FSOs as floating storage units under fixed-rate service contracts in the offshore services sector. For the year 2018,2021, our fleet is currently expected to have approximately 17,48425,668 available days for hire, of which, as of March 19, 2018, 85.99%April 1, 2021, 90.18% are expected to be available to be employed on the spot market, either directly or through the TI Pool, 10.32%5.7% are expected to be available to be employed on fixed time charters with a profit sharing element and 3.69%2.7% are expected to be available to be employed on fixed time charters without a profit sharing element.
Spot Market
A spot market voyage charter is a contract to carry a specific cargo from a load port to a discharge port for an agreed freight per ton of cargo or a specified total amount. Under spot market voyage charters, we pay voyage expenses such as port, canal and bunker costs. Spot charter rates have historically been volatile and fluctuate due to seasonal changes, as well as general supply and demand dynamics in the crude oil marine transportation sector. Although the revenue we generate in the spot market is less predictable, we believe our exposure to this market provides us with the opportunity to capture better profit margins during periods when vessel demand exceeds supply leading to improvements in tanker charter rates. As of March 19, 2018,April 1, 2021, we employed 1522 of our vessels directly in the spot market.
Suezmax Chartering
In June 2016, Euronav, together with Diamond S. Management LLC and Frontline Ltd., companies not affiliated with Euronav, formed Suezmax Chartering, a chartering joint venture that creates a single point of contact for cargo owners to access a large fleet of 46 modern Suezmax vessels, including newbuildings, operated on the spot market.
Tankers International Pool
Euronav principally employs and commercially manages its VLCCs through the Tankers International Pool, or the TI Pool, a leading spot market-oriented VLCC pool in which other shipowners with vessels of similar size and quality participate along with us. We participated in the formation of the TI Pool in 2000 to allow it and other TI Pool participants, consisting of unaffiliated third-party owners and operators of similarly sized vessels, or Pool Participants, to gain economies of scale, obtain increased cargo, flow of information, logistical efficiency and greater vessel utilization. As of March 19, 2018,April 1, 2021, the TI Pool was comprised of 3757 vessels, including 2441 of Euronav’s VLCCs.
By pooling its VLCCs with those of other shipowners, Euronav is able to derive synergies, including (i) the potential for increased vessel utilization by securing backhaul voyages for its vessels, and (ii) the performance of the Contracts of Affreightment, or COAs. Backhaul voyages involve the transportation of cargo on part of the return leg of a voyage. COAs, which can involve backhauls, may generate higher effective time charter equivalent, or TCE, revenues than otherwise might be obtainable directly in the spot market. Additionally, by operating a large number of vessels as an integrated transportation system, the TI Pool offers customers greater flexibility and an additional level of service while achieving scheduling efficiencies. The TI Pool is an owner-focused pool that does not charge commissions to its members, a practice that differs from that of other commercial pools; rather, the TI Pool aggregates gross charter revenues it receives and deducts voyage expenses and administrative costs before distributing net revenues to the pool members in accordance with their allocated pool points, which are based on each vessel's speed, fuel consumption and cargo-carrying capacity. We believe this results in lower TI Pool membership costs, compared to other similarly sized pools. In 2017,2020, TI Pool membership costs were approximately $750$742.4 per vessel per day (with each vessel receiving its proportional share of pool membership expenses, excluding pool credit line costs).
In 2017, the corporate structure of the TI Pool was rationalized. This new structure allowed the TI Pool to arrange for a credit line financing. This credit line is used to fund the working capital in the ordinary course of TI Pool's business of operating a pool of tankers vessels, including but not limited to the purchase of bunker fuel, the payment of expenses relating to specific voyages and supplies of pool vessels, commissions payable on fixtures, port costs, expenses for hull and propeller cleaning, canal costs, insurance costs for the account of the pool, and insurance and fees payable for towage of vessels.
Tankers (UK) Agencies Ltd.Limited., of which Euronav owns 50% of the outstanding voting shares, is the manager of the pool and is also responsible for the commercial management of the pool participants,Pool Participants, including negotiating and entering into vessel employment agreements on behalf of the pool participants.Pool Participants. Technical management of the pooled vessels is performed by each shipowner, who bears the operating costs for its vessels.
Tankers International and Frontline Management (Bermuda) Ltd., or Frontline, a company not affiliated with Euronav, together formed VLCC Chartering Ltd., a chartering joint venture that has access to the combined fleets of Frontline and the TI Pool, including Euronav’s vessels that are operating in the TI Pool. VLCC Chartering Ltd. commenced operations on October 6, 2014. Tankers International and Frontline each own 50% of VLCC Chartering Ltd. Euronav believes that VLCC Chartering Ltd. increases its fleet earnings potential while creating greater options for cargo end-users.
Time Charters
Time charters provide us with a fixed and stable cash flow for a known period of time. Time charters may help Euronav mitigate, in part, its exposure to the spot market, which tends to be volatile in nature, being seasonal and generally weaker in the second and third quarters of the year due to refinery shutdowns and related maintenance during the warmer summer months. In the future, Euronav may when the cycle matures or otherwise opportunistically employ more of its vessels under time charter contracts as the available rates for time charters improve. Euronav may also enter into time-charter contracts with profit-sharing arrangements, which it believes will enable Euronav to benefit if the spot market increases above a base charter rate as calculated either by sharing sub charter profits of the charterer or by reference to a market index and in accordance with a formula provided in the applicable charter contract. As of March 19, 2018,April 1, 2021, Euronav employed eight12 of its vessels on fixed-rate time charters with an average remaining duration of four months,2 years, including fivefour with profit-sharing components based on a percentage of the excess between the prevailing applicable market rate and the base charter rate.
FSOs and Offshore Service Contracts
We currently deploy our two FSOs as floating storage units under service contracts with North Oil Company, in the offshore services sector. As our tanker vessels age, we may seek to extend their useful lives by employing such vessels on long-term offshore projects at rates higher than may otherwise be achieved in the time charter market, or sell such vessels to third-party owners in the offshore conversion market at a premium.
Technical and Commercial Management of our Vessels
MostA majority of Euronav’s vessels are technically managed in-house through our wholly-owned subsidiaries, Euronav Ship Management SAS, Euronav SAS and Euronav Ship Management (Hellas) Ltd. Its in-house technical management services include providing technical expertise necessary for all vessel operations, supervising the maintenance, upkeep and general efficiency of vessels, arranging and supervising newbuilding construction, drydocking, repairs and alterations, and developing, implementing, certifying and maintaining a safety management system.
In addition to Euronav’s in-house fully integrated technical management, Euronav utilizes from time to time the services of experienced third party managers. The independent technical managers typically have specific teams dedicated to Euronav’s vessels and are supervised by our in housean experienced in-house oversight team. Euronav currently contract Wallem Shipmanagementcontracts Northern Marine Management Limited for one(part of Euronav’s owned VLCCsNorthern Marine Group) and Anglo Eastern group of companies (through the fellow subsidiaries, Anglo-Eastern (Antwerp) NV, Anglo-Eastern Tanker Management (Hong Kong) Limited and Anglo-Eastern (Labuan) Limited for twosome of Euronav’s owned VLCCs and two VLCCs that we have on bareboat charter.their wholly-owned subsidiaries) The services provided by Euronav’s third party technical management are very similar to Euronav’s own technical management and involves part or all of the day-to-day management of vessels.
Euronav’s VLCCs are commercially managed by Tankers International while operating in the TI Pool. All of the participants in the TI Pool collectively pay a pool management fee equivalent to the costs of running the pool business, excluding voyage expenses, interest adjustments and administration costs, including legal, banking and other professional fees. The net charge is the pool administration cost, which is apportioned to each vessel by calendar days. During the year ended December 31, 2017,2020, Euronav paid an aggregate of $7.4$10.1 million for the commercial management of Euronav’s vessels operating in the TI Pool.
Euronav’s Suezmax vessels trading in the spot market are commercially managed by Euronav (UK) Agencies Ltd., our London commercial department. Commercial management services include securing employment for Euronav’s vessels.
Euronav’s time chartered vessels if any, are managed by Euronav’s operations department based in Antwerp.
Principal Executive Offices
Our principal executive headquarters are located at De Gerlachekaai 20, 2000 Antwerpen, Belgium. Our telephone number at that address is 011-32-3-247-4411. We also have offices located in the United Kingdom, France, Greece, Hong Kong, Switzerland (canton Geneva) and Singapore. Our website is www.euronav.com. The information contained on our website does not form a part of this annual report.
Competition
The operation of tanker vessels and transportation of crude and petroleum products is extremely competitive. We compete with other tanker owners, including major oil companies as well as independent tanker companies. Competition arises primarily from other tanker owners, including major oil companies as well as independent tanker companies, some of whom have substantially greater resources than we do. We compete for charters on the basis of price, vessel location, size, age and condition of the vessel, as well as on our reputation as an operator. Competition is also affected by the availability of other size vessels to compete in the trades in which we engage. We currently operate all of our vessels in the spot market, either directly or through the TI Pool, or on time charter. For our vessels that operate in the TI Pool, Tankers UK Agencies Ltd. (TUKA), the pool manager, is responsible for their commercial management, including marketing, chartering, operating and purchasing bunker (fuel oil) for the vessels. From time to time, we may also arrange our time charters and voyage charters in the spot market through the use of brokers, who negotiate the terms of the charters based on market conditions.
Seasonality
We operate our vessels in markets that have historically exhibited seasonal variations in demand and, as a result, charter rates. Peaks in tanker demand quite often precede seasonal oil consumption peaks, as refiners and suppliers anticipate consumer demand. Seasonal peaks in oil demand can broadly be classified into two main categories: (1) increased demand prior to Northern Hemisphere winters as heating oil consumption increases and (2) increased demand for gasoline prior to the summer driving season in the United States. Unpredictable weather patterns and variations in oil reserves disrupt tanker scheduling. This seasonality may result in quarter-to-quarter volatility in our operating results, as many of our vessels trade in the spot market. Seasonal variations in tanker demand will affect any spot market related rates that we may receive.
Industry and Market Conditions
THE INTERNATIONAL OIL TANKER SHIPPING INDUSTRY
All the information and data presented in this section, including the analysis of the international oil tanker shipping industry has been provided by Drewry. Drewry has advised us that the statistical and graphical information contained herein is drawn from its database and other sources. In connection therewith, Drewry has advised that: (i) certain information in Drewry’s database is derived from estimates or subjective judgments; (ii) the information in the databases of other maritime data collection agencies may differ from the information in Drewry’s database; (iii) while Drewry has taken reasonable care in the compilation of the statistical and graphical information and believes it to be accurate and correct, data compilation is subject to limited audit and validation procedures. The Companycompany believes and acts as though the industry and market data presented in this section is reliable.
Overview
The maritime shippingtransport industry is fundamental to international trade as it is the only practicable and economic way of transporting large volumes of many essential commodities and finished goods around the world. In turn, the oil tanker shipping industry represents a vital link in the global energy supply chain, in which larger vessels, such as VLCCsVLCC, Suezmax and SuezmaxAframax tankers, play an important role, given their capability to carry large quantities of crude oil.
The oil tanker shipping industry is divided between crude tankers that carry either crude oil or residual fuel oil and product tankers that carry refined petroleum products. The following review specifically focuses on the crude sector. Revenue for an oil tanker shipping company is primarily driven by freight rates paid for transportation capacity. Freight is paid for the movement of cargo between a load port and a discharge port. The cost of moving the ship from a discharge port to the next load port is not directly compensated by the charterers in the freight payment but is an expense of the owners if not on time charter.
The tanker freight market remained buoyant throughout 2015 and first half of 2016 on account of favorable supply/demand dynamics. However, in the second half of 2016 rising newbuilding deliveries outpaced the growth in tanker demand and hence there was downward pressure on freight rates. A deluge of newbuilding deliveries in 2017 aggravated the situation further and rates fell. For example, the average VLCC spot rate on Arabian Gulf (AG)-Japan route was US$ 22,617 per day in 2017 compared with US$ 42,183 per day in 2016. Oil tanker freight rates declined in the second half of 2016 and 2017 due to a number of factors, including:
(i) A surge in newbuilding deliveries that outpaced the growth in tanker demand in 2016 as well as 2017,
(ii) Oil production cuts announced by OPEC and higher compliance by the member countries,
(iii) Reduced stockpiling activities by major Asian economies.
Tanker freight rates remained under pressure throughout 2017, and in January 2018 VLCCs and Suezmaxes were reported fixed at US$ 20,600 per day on Arabian Gulf (AG)-Japan routes and US$ 7,700 per day on West Africa-United States routes respectively. However, asset prices have stabilized and in January 2018, five-year-old VLCC and Suezmax tankers were valued at US$ 62 and US$ 40 million respectively. Nevertheless, it is worth noting that five year old VLCC and Suezmax tankers were changing hands at prices nearly 30% below their long-term average over the course of 2017.
In broad terms, the volume of seaborne oil trade which is seaborne is primarily dependent on global and regional economic growth, and to a lesser extent other factors such as changes in regional oil prices. Overall, there is a close relationship between changes in the level of economic activity and changes in the volume of oil moved by sea (see the chart below).sea. With continued strong GDP growth in Asia, seaborne oil trade to emerging Asian markets has been growing significantly. Chinese oil consumption grew at a compound average growth rate (CAGR) of 5.1%4.5% from 20078.9 mbpd in 2010 to 2017, rising from 7.6 to 12.4 million barrels per day (mbpd). Oil demand13.8 mbpd in OECD Europe and North America has also risen in2020. Asian (excluding China) oil consumption increased at a CAGR of 1.7% during the last three years primarily due to lower oil prices and improving general economic conditions.same period. In 2017,2020, the total seaborne trade in crude oil was equivalent to 2.11.9 billion tons.tons as per provisional estimates.
World GDPThe outbreak of COVID-19 severely affected demand of crude oil and Crude Oilrefined petroleum products as several major economies enforced lockdowns to contain the spread of the virus and mitigate the damage caused by the pandemic. Accordingly, the world seaborne tanker trade, including crude oil and refined products fell 8.9% to 2,820 million tons. Seaborne Trade 2002 to 2017
(Percent changecrude oil trade fell 6.6% year on year)year to 93.9 mbpd in 2020 primarily due to demand destruction in 2020 because of mobility restrictions enforced by state authorities in several major economies and can be seen as an outlier. Oil demand and trade started a gradual recovery in 2H20 on the back of easing of lockdown restriction in major parts of the world. Moreover, several countries have authorised emergency use of various COVID-19 vaccines and a widespread availability of these vaccines would play a key role in containing the pandemic, which will support the seaborne trade and tanker demand.
* Provisional estimates for GDP/Trade
Changes in regional oil consumption, as well as a shift in global refinery capacity from the developed to the developing world, is also translating into growing seaborne oil trade distances. For example, a VLCC’s voyage from West Africa to the US Gulf takes 3540 days, but a trip from West Africa to China (a trade which is expanding) takes 6065 days, and a trip from the US Gulf to Far East (a key trade route with growing US crude exports) takes nearly 100 days. The increase in oil trade distances, coupled with increases in world oil demand, has had a positive impact on tanker demand in ton miles (crude and products), which has increased from 10.711.4 to 13.1 billion12.0 trillion ton miles in the period 20072010 to 2017.2020. In 2020, ton miles demand declined 8.6% year on year due to sharp slump in demand due to COVID-19.
Supply in the tanker sector, as measured by its deadweight (dwt) cargo carrying capacity, is primarily influenced by the rate of deliveries of newbuilds from the shipyards in line with their orderbook, as well as the rate of removals from the fleet via vessel scrapping or conversion. After a period of rapid expansion, supply growth in the tanker sector moderated in 2013-14 and the overall tanker fleet grew byexpanded just 0.6% in 2014, and a relatively modest 2.7% in 2015. However, in 2016, the crude oil tanker fleet expanded by 5.8% due to a high level of newbuilding deliveries during the year and lower levels of scrapping. A further round of newbuilding deliveries took place in 2017 and the world tanker fleet grew byincreased another 4.8% despite an increasea rise in scrapping in the second half of the year. Record high demolitions kept a check on fleet growth, and global crude tanker fleet expanded by a marginal 0.3% in 2018 despite the delivery of 101 newbuilds with aggregate capacity of 20.3 mdwt. Global world tanker fleet rose 7.1% year on year to 412.3 mdwt in 2019 primarily due to 39.1% year on year increase in deliveries to 28.3 mdwt. Demolitions declined sharply to 2 mdwt in 2019 compared with 17.4 mdwt in 2018.Global tanker fleet increased 1.3% to 417.6 mdwt in 2020.
In terms of ordering activity, new tanker orders in the periodfrom 2010 to 2014 were limited due to the lack of available bank financing and a challenged rate environment, which contributed to the total crude tanker orderbook declining to 13.9% of the existing global tanker fleet capacity as of December 2014, compared with nearly 50% of the existing fleet at its recent peak in 2008. However, new ordering picked up in the VLCC and Suezmax sectors in late 2014 and 2015 because of the continued strength in the tanker freight market and the exemption from compliance to tierTier III NOx emission norms for vessels ordered before 1 January 1, 2016. Ordering activity fell substantially in 2016 and only 39 crude tankers were ordered, compared with 244 in 2015. However, ordering activity picked up again in 2017 with 93 new contracts placed for crude tankers during the year. Weak newbuilding prices were one of the main factors stimulating new ordering. In January 2018, theOrdering activity took a backseat in a depressed tanker market, and a total of 73 crude tankers were ordered in 2018. The crude tanker orderbook was equivalent to 12.2%thinned down significantly in 2019 and 2020 as deliveries outpaced new ordering. The orderbook as a percentage of the existing fleet.fleet also slipped from 12.3% at the start of 2019 to 7.9% at the end of 2020.
The tanker freight market remained buoyant throughout 2015 and 1H16 on the back of favourable supply/demand dynamics. However, in 2H16, rising newbuilding deliveries outpaced the growth in tanker demand, and hence, there was downward pressure on freight rates. A deluge of newbuilding in 2017 aggravated the situation further and rates fell. For example, the average VLCC spot rate on the Arabian Gulf (AG)-Japan route was US$ 22,617pd in 2017 compared with US$ 42,183pd in 2016. Oil tanker freight rates declined in 2H16 and 2017 due to a number of factors, including:
i.A surge in newbuilding deliveries that outpaced the growth in tanker demand in 2016 as well as 2017,
ii.Oil production cuts announced by OPEC and higher compliance by the member countries, and
iii.Reduced stockpiling activity by major Asian economies.
Freight rates across vessel class averaged well below breakeven rates for the first nine months of 2018. Suppressed vessel earnings prompted demolitions and 103 crude tankers with aggregate capacity of 17.4 mdwt were sold to scrapyards in 2018. Sluggish fleet growth—because of record high demolitions and steady increase in the demand for tankers—improved supply-demand dynamics in the last quarter of 2018 to an extent. Vessel earnings surged substantially in the last four months of 2018. Second-hand asset prices moved up in 4Q18, as a result of higher charter rates.
In 2019, crude tanker freight rates benefited from the US sanctions on Cosco Shipping Tanker (Dalian) Co., geopolitical tensions and tight supply. In addition, crude tanker vessel supply was reduced by 1.2% as vessels moved out of trade to fit scrubbers. New orders were constrained as shipowners wanted more clarity to emerge on the availability of HSFO for scrubber-fitted vessels and LSFO prices. Scrapping came down sharply as owners wanted to benefit from higher freight rates in 2H19. Second-hand asset prices reacted positively to buoyant charter rates.
Crude tanker freight rates saw a sudden spike in 1H20 due to a surge in demand of VLCCs for floating storage. The global oil demand plunged substantially due to lockdown measure adopted by several major economies. However, the rates have normalized since then as OPEC+ and several other key producers curtailed their production to rebalance the oil market. As of January 2021, one-year time charter rate for a five-year-old VLCC was US$ 26,500pd.Second-hand prices of VLCC increased in March and April 2020 with a surge in earnings. However, second-hand asset prices have declined in the last few months as freight rates have weakened.
World Oil Demand and Production
In 2017,2019, oil accounted for approximately one thirdaround one-third of global energy consumption. With the exception of 2008, 2009 and 2009,2020, world oil consumption has increased steadily over the past two decades, as a result of increasing global economic activity and industrial production. In recent years, the growth in oil demand has been largely driven by developing countries in Asia and growing Chinese consumption, but in 2015-17 some developed economies also witnessedrecorded increases in demand.demand between 2014 and 2018. In 2017,2019, world oil demand increased to 97.8 million barrels per day,100.3 mbpd, which represents a 1.6%1.0% increase from 20162018 and 14.4%17.3% higher than the recent low recorded in 2009 following the global financial crisis of 2008-09.
World Oil Consumption: 2007 Global oil demand has been hampered in 2020 due to 2017
(Million Barrels Per Day)COVID-19 but is expected to bounce back strongly in 2021 as the global economy revives. According to the IMF, global economy is projected to grow at 5.5% in 2021 after shrinking by 4.4% in 2020. On the other hand, China, the key growth driver of tankers, is expected to grow by 8.1% in 2021 after growing at 2.3% in 2020. respectively.
|
| | | | | | | | | | | | | | | | | | | | | | | | |
| | 2007 |
| 2008 |
| 2009 |
| 2010 |
| 2011 |
| 2012 |
| 2013 |
| 2014 |
| 2015 |
| 2016 |
| 2017 |
| CAGR 07-17 |
| North America | 25.5 |
| 24.2 |
| 23.7 |
| 24.1 |
| 24.0 |
| 23.6 |
| 24.0 |
| 24.1 |
| 24.6 |
| 24.7 |
| 24.9 |
| -0.2 | % |
| Europe - OECD | 15.3 |
| 15.4 |
| 14.7 |
| 14.7 |
| 14.3 |
| 13.8 |
| 13.6 |
| 13.5 |
| 13.7 |
| 14.0 |
| 14.3 |
| -0.7 | % |
| Pacific | 8.4 |
| 8.0 |
| 8.0 |
| 8.1 |
| 8.1 |
| 8.6 |
| 8.4 |
| 8.1 |
| 8.0 |
| 8.1 |
| 8.1 |
| -0.3 | % |
| Total OECD | 49.2 |
| 47.6 |
| 46.4 |
| 46.9 |
| 46.4 |
| 46.0 |
| 46.0 |
| 45.7 |
| 46.4 |
| 46.9 |
| 47.3 |
| -0.4 | % |
| Former Soviet Union | 4.2 |
| 4.2 |
| 4.0 |
| 4.2 |
| 4.4 |
| 4.5 |
| 4.6 |
| 4.9 |
| 4.6 |
| 4.8 |
| 4.8 |
| 1.4 | % |
| Europe - Non OECD | 0.8 |
| 0.7 |
| 0.7 |
| 0.7 |
| 0.7 |
| 0.7 |
| 0.7 |
| 0.7 |
| 0.7 |
| 0.7 |
| 0.7 |
| -0.8 | % |
| China | 7.6 |
| 7.9 |
| 7.9 |
| 8.9 |
| 9.2 |
| 9.8 |
| 10.1 |
| 10.6 |
| 11.5 |
| 11.9 |
| 12.4 |
| 5.1 | % |
| Asia (exc China) | 9.5 |
| 9.7 |
| 10.3 |
| 10.9 |
| 11.1 |
| 11.4 |
| 11.7 |
| 12.0 |
| 12.5 |
| 12.9 |
| 13.4 |
| 3.5 | % |
| Latin America | 5.7 |
| 5.9 |
| 5.7 |
| 6.0 |
| 6.3 |
| 6.4 |
| 6.6 |
| 6.8 |
| 6.8 |
| 6.6 |
| 6.6 |
| 1.4 | % |
| Middle East | 6.5 |
| 7.1 |
| 7.1 |
| 7.3 |
| 7.4 |
| 7.7 |
| 8.0 |
| 8.0 |
| 8.4 |
| 8.3 |
| 8.3 |
| 2.4 | % |
| Africa | 3.1 |
| 3.2 |
| 3.4 |
| 3.5 |
| 3.4 |
| 3.7 |
| 3.7 |
| 4.0 |
| 4.1 |
| 4.3 |
| 4.4 |
| 3.5 | % |
| Total Non-OECD | 37.4 |
| 38.7 |
| 39.1 |
| 41.5 |
| 42.5 |
| 44.2 |
| 45.4 |
| 47.1 |
| 48.5 |
| 49.4 |
| 50.6 |
| 3.1 | % |
| | | | | | | | | | | | | |
| World Total | 86.6 |
| 86.3 |
| 85.5 |
| 88.4 |
| 88.9 |
| 90.2 |
| 91.4 |
| 92.8 |
| 94.9 |
| 96.3 |
| 97.8 |
| 1.2 | % |
Source: Drewry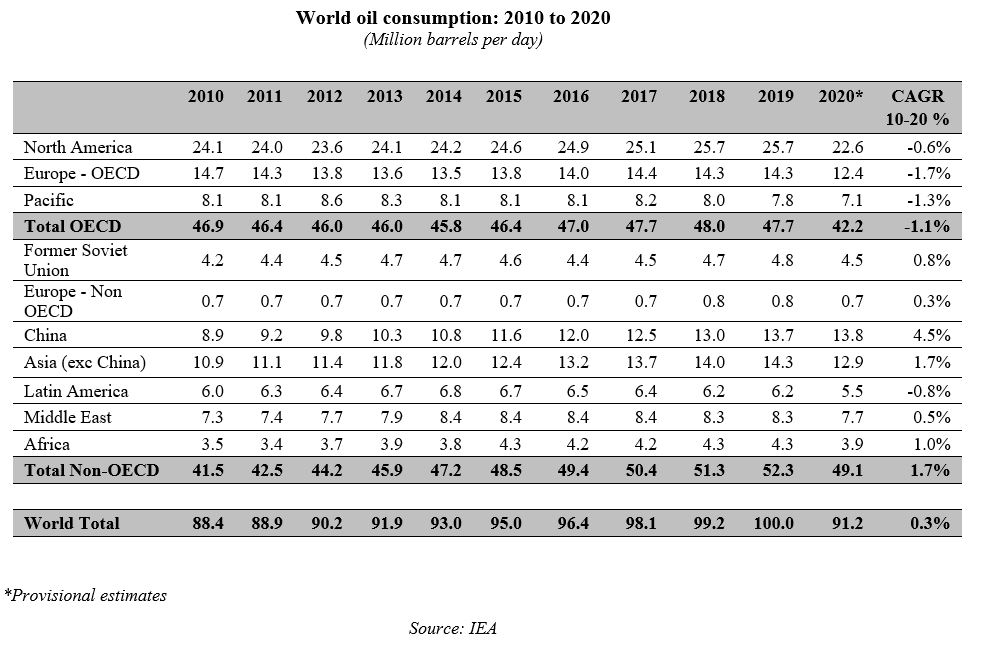
Seasonal trends also affect world oil consumption, and consequently, oil tanker demand. While trends in consumption vary with the specific season each year, peaks in tanker demand often precede seasonal consumption peaks as refiners and suppliers anticipate consumer demand. Seasonal peaks in oil demand can be classified broadly into two main categories: increased demand prior tobefore the Northern Hemisphere winters as heating oil consumption increases and increased demand for gasoline prior tobefore the summer driving season in the United States (U.S.).US.
Global trends in oil production have naturally followed the growth in oil consumption, allowing for the fact that changes in the level of oil inventories also play an integral role in determining production levels and tie in with the seasonal peaks in demand. Changes in world crude oil production by region in the period 2007from 2010 to 20172020 are shown in the table below.
World Oil Production: 2007 to 2017
(Million Barrels Per Day)
|
| | | | | | | | | | | | | | | | | | | | | | | | |
| | 2007 |
| 2008 |
| 2009 |
| 2010 |
| 2011 |
| 2012 |
| 2013 |
| 2014 |
| 2015 |
| 2016 |
| 2017 |
| CAGR 07-17 |
| | | | | | | | | | | | | |
| North America | 14.3 |
| 13.9 |
| 13.6 |
| 14.1 |
| 14.6 |
| 15.8 |
| 17.1 |
| 19.1 |
| 20.0 |
| 19.5 |
| 20.1 |
| 3.45 | % |
| FSU* | 12.8 |
| 12.8 |
| 13.3 |
| 13.5 |
| 13.6 |
| 13.7 |
| 13.9 |
| 13.9 |
| 14.0 |
| 14.2 |
| 14.4 |
| 1.17 | % |
| OPE | 35.5 |
| 37.0 |
| 34.0 |
| 34.6 |
| 35.6 |
| 37.6 |
| 36.7 |
| 37.5 |
| 38.2 |
| 39.6 |
| 39.4 |
| 1.03 | % |
| Asia | 6.4 |
| 6.4 |
| 7.5 |
| 7.8 |
| 7.8 |
| 7.8 |
| 7.7 |
| 7.6 |
| 7.9 |
| 7.6 |
| 7.3 |
| 1.34 | % |
| Other | 16.6 |
| 16.4 |
| 17.0 |
| 17.3 |
| 16.8 |
| 16.0 |
| 16.0 |
| 15.8 |
| 16.5 |
| 16.1 |
| 16.3 |
| -0.20 | % |
| | | | | | | | | | | | | |
| Total | 85.6 |
| 86.5 |
| 85.4 |
| 87.3 |
| 88.4 |
| 90.9 |
| 91.4 |
| 93.8 |
| 96.6 |
| 97.1 |
| 97.4 |
| 1.3 | % |
* Former Soviet Union
Source: Drewry
At the beginning of 2017,2020, proven global oil reserves totaled 1,6101,733 billion barrels approximately 45– about 47 times the current rates of production.annual production (based on 2019 crude production). These reserves tend to be located in regions far from the major consuming countries separated by large expanses of water, and this geographical barrier creates the demand for crude tanker shipping. However, the development of light tight oil (LTO) or shale oil reserves in the U.S.US had a negative impact on the volume of U.S.US crude oil imports as well as the demand for crude tankers from 2004 to 2014. However, rising U.S.US crude exportexports on long-haul routes to China and India is good newsa positive development for ship owners,shipowners as every additional barrel exported from the country will open avenues for equal imports as U.S.the US is a net importer of the crude oil.
New technologies, such as horizontal drilling and hydraulic fracturing, have triggered a shale oil revolution in the U.S.,US, and in 2013, for the first time in the previous two decades, the U.S.US produced more oil than it imported. In view of the rising surplus in oil production, in 2015 the U.S.US Congress lifted a 40 year-old ban on crude oil exports in 2015 that was put in place after the Arab oil embargo in 1973. Thereby, allowing U.S.this allowed US oil producers access to international markets.
The first shipments of the U.S.US crude were sent to Europe immediately after the lifting of the ban, and since then, other destinations have followed. The U.S.US exported 0.5 mbpd of crude oil in 2015 and 2016. However, 2017 marked a very important development for the U.S.US crude producers as the country exported crude to every major importer, including China, India, South Korea and several European countries. In October 2017, U.S.US crude exportexports surpassed 2 mbpd, and on average, the country’s crude exports more than doubled in 2017 to 1.11.2 mbpd. The US crude exports jumped further to 2.1 mbpd in 2018 and 3.0 mbpd in 2019 on the back of rising domestic crude oil production and nearly flat domestic demand. US crude oil exports increased slightly to 3.2 mbpd in 2020 as the outbreak of COVID-19 and steep decline in crude oil prices in 2020 adversely affected oil production, thereby reducing exports momentum. However, this is still well below the exports of major exporters such as Saudi Arabia, Russia and other Middle Eastern exporters. Nevertheless, the US Gulf to Asia could be a key trading route for VLCC with growing US exports.
In the meantime, much of the oil from West Africa and the Caribbean, thatwhich was historically imported by the U.S.US, is now shipped in VLCC to China and other Asian economies, which has a positive impact on tanker demand due to increased ton miles, given the longer distances the oil needs to travel. Production and exports from the Middle East (largely from OPEC suppliers) and West Africa have historically had a significant impact on the demand for tanker capacity, and consequently, on tanker charter hire rates due to the long distances between these supply sources and demand centers. Oil exports from short-haul regions, such as the North Sea, are significantly closer to ports used by the primary consumers of such exports, which results in shorter average voyages.
Overall, the volume of crude oil moved by sea each year reflects the underlying changes in world oil consumption and production. Driven by increased world oil demand and production, especially in developing countries, seaborne trade in crude oil in 20172020 is provisionally estimated at 2.11.9 billion tons or 67.3%66.9% of all seaborne oil trade (crude oil and refined petroleum products). The chart below illustrates changes in global seaborne movements of crude oil between 19821983 and 2017.2020.
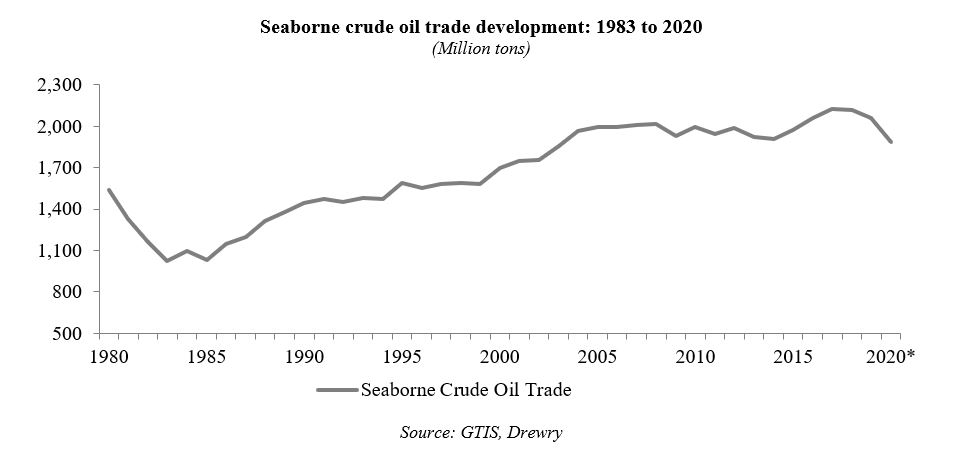
Seaborne Crude Oil Trade Development: 1982 to 2017
(Million Tons)
Source: Drewry
World seaborne oil trade is the result of geographical imbalances between areas of oil consumption and production. Historically, certain developed economies have acted as the primary drivers of these seaborne oil trade patterns. The regional growth rates in oil consumption shown in the chart below indicate that the developing world is driving recent trends in oil demand and trade. In Asia, the Middle East Africa and Latin America,Africa, oil consumption during the period from 20072010 to 20172020 grew at annual rates in excess of 2%1.1%, and at an annual growth rate of 5.1%4.5% in the case of China. Strong demand for oil in these regions is driving both increased volume of seaborne oil trades and increased voyage distances as more oil is being transported on long-haul routes. Excluding 2020 when COVID-19 severely affected crude oil demand, crude oil consumption during 2010 to 2019 increased at a CAGR of 2.3% in Asia, the Middle East and Africa. Chinese crude oil consumption increased at a CAGR of 4.9% during the same period.
Regional Oil Consumption Growth Rates: 2007 to 2017
(CAGR – Percent)
Source: Drewry
Furthermore, consumption on a per capita basis remains low in many parts of the developing world, and as many of these regions have insufficient domestic supplies, the rising demand for oil will have to be satisfied by increased imports.
Oil Consumption Per Capita: 2017
Source: Drewry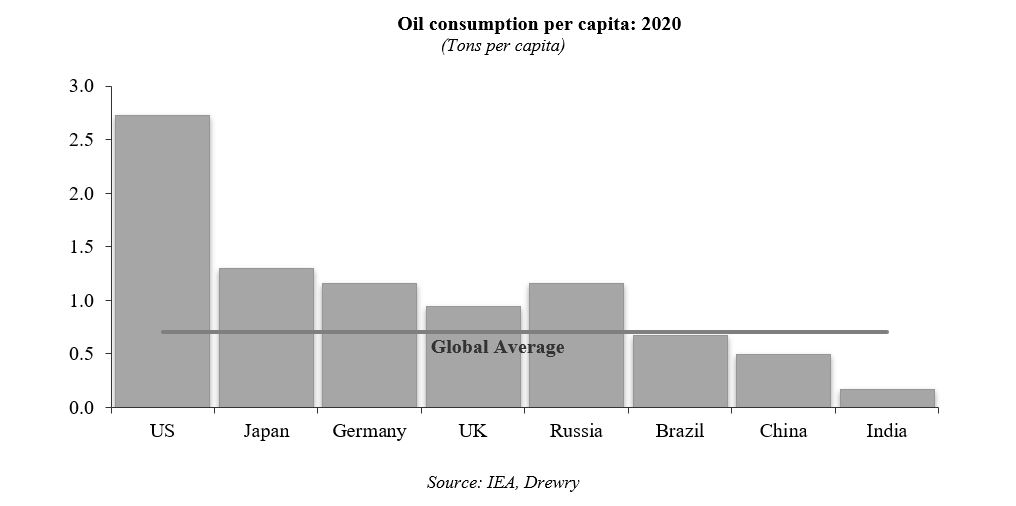
In the case of China and India, seaborne crude oil imports have risen significantly in the last decade in order to meet an increasing demand for energy (see chart below).energy. During the period from 20072010 to 2017,2020, Chinese crude oil imports increased from 163.2239.3 to 386.2542.4 million tons and Indian imports increased from 110.7155.6 to 214.5181 million tons. Conversely, Japanese imports declined from 201.7178.7 to 143.6119.9 million tons over the same period. In the U.S.US, crude oil imports declined between 2007 and 2015, but in 2016, the trend was reversed and average U.S.US crude imports increased by 0.5 mbpd because ofdue to declining shale output. In 2017, U.S.US imports inched up by another 0.9%0.4% to reach 7.9 mbpd on accountthe back of rising crude oil consumption. In 2018, the US crude oil imports declined 2.5% year on year to 7.8 mbpd, whereas the country’s crude oil imports declined 12.6% year on year to 6.8 mbpd in 2019. US crude oil imports declined 13.6% year on year to 5.9 mbpd in 2020. US crude oil imports have declined in the last three years because of the country’s rising crude oil production. In 2020, crude oil imports for almost all countries have been adversely impacted by the pandemic.
Asian Countries – Crude Oil Imports: 2007 to 2017
(Million Tons)
* Provisional estimates for 2017
Source: Drewry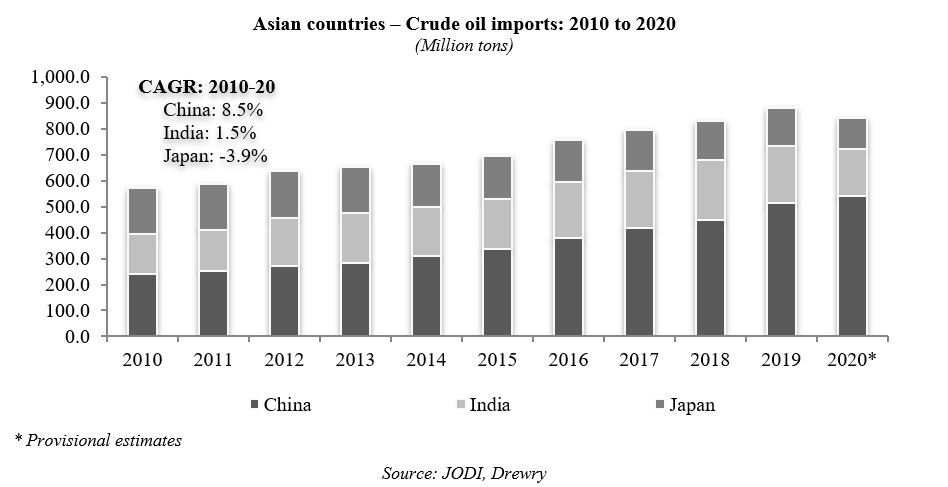
A vital factor, which is affecting both the volume and pattern of world oil trades, is the shift in global refinery capacity from the developed to the developing world, which is increasing the distances from oil production sources to refineries. The distribution of refinery throughput by region in the period 2007from 2010 to 20172020 is shown in the following table.
Oil Refinery Throughput by Region: 2007 to 2017
('000 Barrels Per Day)
|
| | | | | | | | | | | | | | | | | | | | | | | | |
| | 2007 |
| 2008 |
| 2009 |
| 2010 |
| 2011 |
| 2012 |
| 2013 |
| 2014 |
| 2015 |
| 2016 |
| 2017* |
| CAGR % 07 -17 |
| North America | 18,460 |
| 17,879 |
| 17,502 |
| 17,740 |
| 17,707 |
| 17,993 |
| 18,299 |
| 18,734 |
| 19,390 |
| 18,960 |
| 19,290 |
| 0.4 | % |
| S. & Cent. America | 5,456 |
| 5,363 |
| 4,889 |
| 4,834 |
| 5,053 |
| 4,657 |
| 4,773 |
| 4,721 |
| 4,760 |
| 4,200 |
| 3,850 |
| -3.4 | % |
| Europe & Eurasia | 20,716 |
| 20,635 |
| 19,509 |
| 19,595 |
| 19,491 |
| 19,538 |
| 18,693 |
| 18,858 |
| 19,250 |
| 19,300 |
| 19,510 |
| -0.6 | % |
| Middle East | 6,397 |
| 6,396 |
| 6,297 |
| 6,396 |
| 6,517 |
| 6,388 |
| 6,363 |
| 6,656 |
| 6,450 |
| 6,810 |
| 7,160 |
| 1.1 | % |
| Africa | 2,372 |
| 2,456 |
| 2,293 |
| 2,449 |
| 2,169 |
| 2,206 |
| 2,182 |
| 2,255 |
| 2,250 |
| 2,090 |
| 2,050 |
| -1.4 | % |
| Australasia | 767 |
| 756 |
| 762 |
| 756 |
| 789 |
| 779 |
| 657 |
| 607 |
| 536 |
| 541 |
| 550 |
| -3.3 | % |
| China | 6,563 |
| 6,953 |
| 7,488 |
| 8,571 |
| 9,059 |
| 9,199 |
| 9,648 |
| 9,986 |
| 10,400 |
| 11,023 |
| 11,200 |
| 5.5 | % |
| India | 3,107 |
| 3,213 |
| 3,641 |
| 3,899 |
| 4,085 |
| 4,302 |
| 4,462 |
| 4,473 |
| 4,660 |
| 4,931 |
| 5,003 |
| 4.9 | % |
| Japan | 3,995 |
| 3,946 |
| 3,627 |
| 3,619 |
| 3,410 |
| 3,400 |
| 3,453 |
| 3,289 |
| 3,310 |
| 3,280 |
| 3,165 |
| -2.3 | % |
| Other Asia Pacific | 7,493 |
| 7,351 |
| 7,229 |
| 7,434 |
| 7,390 |
| 7,436 |
| 7,252 |
| 7,253 |
| 7,260 |
| 8,535 |
| 8,582 |
| 1.4 | % |
| Total World | 75,325 |
| 74,949 |
| 73,234 |
| 75,293 |
| 75,668 |
| 75,899 |
| 75,782 |
| 76,832 |
| 78,266 |
| 79,670 |
| 80,360 |
| 0.6 | % |
* Provisional estimates for 2017
Source: Drewry
Changes in refinery throughput are largely driven by changes in the location of capacity. Capacity increases are taking place mostly in the developing world, especially in Asia. In response to growing domestic demand, coupled with export ambitions, Chinese refinery throughput has grown at a faster rate than that of any other global region in the last decade, with refinery throughput in India, the Middle East and other emerging economies following a similar pattern. The shift in refinery capacity is likely to continue as refinery development plans are heavily focused on areas such as Asia and the Middle East and few new refineries are planned for North America and Europe.
Oil Refinery Throughput by Region: Growth Rates 2007 to 2017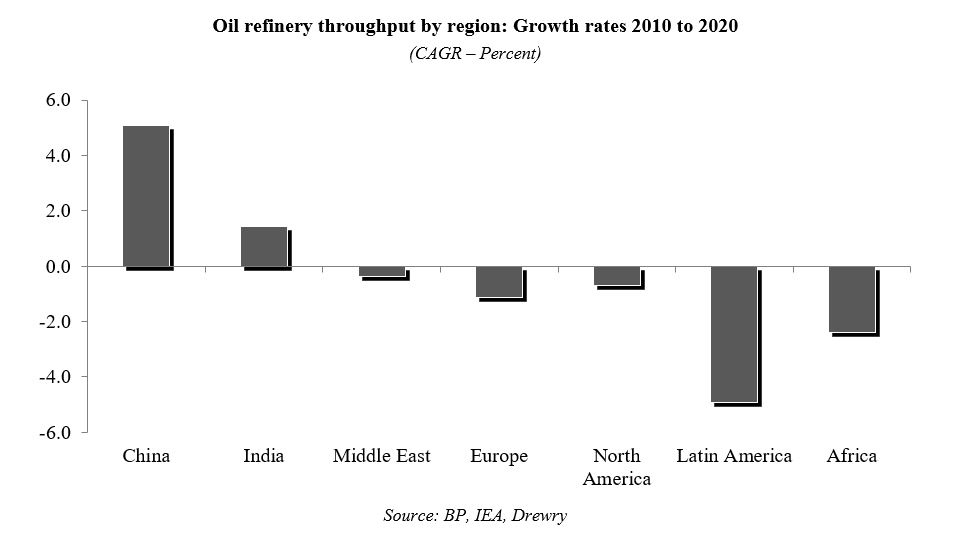
(CAGR – Percent)
Source: Drewry
As a result of changes in trade patterns, as well as shifts in refinery locations, average voyage distances in the crude sector have increased. In the period from 2007From 2010 to 2017 ton mile2020, ton-mile demand in the crude tanker sector grew from 8.68.8 to 9.9 billion9.1 trillion ton miles. The table below shows changes in tanker demand expressed in ton miles, which is measured as the product of the volume of oil carried (measured in metric tons) multiplied by the distance over which it is carried (measured in miles).
Crude Oil Tanker Demand: 2007 to 2017
|
| | | | | | | | | | | | | | | | | | | | | | | | |
| | 2007 |
| 2008 |
| 2009 |
| 2010 |
| 2011 |
| 2012 |
| 2013 |
| 2014 |
| 2015 |
| 2016 |
| 2017 |
| CAGR % 07 -17 |
| | | | | | | | | | | | | |
| Seaborne Crude Trade - Mill Tons | 2,008 |
| 2,014 |
| 1,928 |
| 1,997 |
| 1,941 |
| 1,988 |
| 1,918 |
| 1,895 |
| 1,957 |
| 2,042 |
| 2,125 |
| 0.57 | % |
| Ton Mile Demand - Bill T M | 8,640 |
| 8,783 |
| 8,442 |
| 8,849 |
| 8,723 |
| 9,130 |
| 8,809 |
| 8,784 |
| 8,983 |
| 9,554 |
| 9,966 |
| 1.44 | % |
| Average Voyage Length - Miles | 4,302 |
| 4,362 |
| 4,379 |
| 4,431 |
| 4,494 |
| 4,592 |
| 4,592 |
| 4,636 |
| 4,589 |
| 4,678 |
| 4,690 |
| 0.87 | % |
Source: Drewry
Another aspect which has impacted on crude tanker demand in recent years has been the use of tankers for floating storage. In the closing weeks of 2014 and the opening weeks of 2015, commodity traders hired VLCCs in the expectation that profits could be made by storing oil at sea to create a contango, that is, where the current or spot price for the oil was below the price of oil for delivery in the futures market. As a result, several fixtures for long termlong-term storage were reported by oil majors and commodity traders for periods up to 12 months in late 2014 and first half of 2015.1H15. Floating crude oil storage reached a high of 197 million barrels in May 2015, and thereafter, it declined because of a narrowing of the contango and shrinking arbitrage in crude oil futures.
The use of large tankers for offshore storage rebounded somewhat in 2016 on accountbecause of logistical considerations, marketing issues and inventory drawdown. Similar patterns were seen when floating storage peaked in June 2017, when more than 200 million barrels were reported to be stored in crude tankers. Floating storage declined gradually in second half2H17. Production cuts pursued by OPEC, Russia and its allies encouraged inventory drawdown and floating storage dropped further in 2018. In 2019, demand for floating storage increased as owners stored LSFO and HSFO to avoid uncertainty of 2017availability of these fuels and hedge them from price increase. Demand for VLCC for oil storage increased as well with 28 VLCCs being used in the Middle East Gulf to store oil.
In early 2020, the oil supply shock as a result of the price war between Russia and Saudi Arabia coupled with demand destruction due to the outbreak of COVID-19 led to a sharp decline in crude oil prices and a contango in oil futures. The demand for VLCCs for floating storage surged with arbitrage opportunities in the oil market and operational limitations of several oil producers. As of January 31, 2018, approximately 133 million barrels2021, nearly 63 VLCCs were employed in floating storage, which account for ~7.6% of the fleet. This figure was lower than the 105 VLCCs deployed for floating storage at the peak of the contango opportunities in oil were reported stored onmarket in April 2020, indicating a declining trend in on-the-water storage of crude oil tankers at seaoil.
Floating Storage of Crude Oil
(Million Barrels)
Source: Drewry
Crude Tanker Fleet Overview
The world crude tanker fleet is generally classified into three major types of vessel categories, based on carrying capacity. The main crude tanker vessel types are:
•VLCCs, with an oil cargo carrying capacity in excess of 200,000 dwt (typically 300,000 to 320,000 dwt or approximatelyaround two million barrels). VLCCs generally trade on long-haul routes from the Middle East and West Africa to Asia, Europe and the U.S.US Gulf or the Caribbean. Tankers in excess of 320,000 dwt are known as Ultra Large Crude Carriers (ULCCs), although for the purposes of this report, they are included within the VLCC category.
•Suezmax tankers, with an oil cargo carrying capacity of approximatelyabout 120,000 to 200,000 dwt (typically 150,000 to 160,000 dwt or approximatelyaround one million barrels). Suezmax tankers are engaged in a range of crude oil trades across a number of major loading zones. Within the Suezmax sector, there are a number of product and shuttle tankers (shuttle tankers are specialized ships built to transport crude oil and condensates from offshore oil field installations to onshore terminals and refineries and are often referred to as “floating pipelines”‘floating pipelines’), which do not participate in the crude oil trades.
•Aframax tankers, with an oil cargo carrying capacity of approximatelyaround 80,000 to 120,000 dwt (or approximatelyabout 500,000 barrels). Aframax tankers are employed in shorter regional trades, mainly in North WestNorthwest Europe, the Caribbean, the Mediterranean and Asia.
There are also a relatively small number of ships below 80,000 dwt which operate in crude oil trades, buttrades. However, many such ships operate in cabotage type trades, and therefore, do not form part of the open market. For this reason, the following analysis of supply concentrates on the VLCC, Suezmax and Aframax tonnage.vessels. As of January 31, 2018,2021, the crude tanker fleet consisted of 1,8622,082 vessels with a combined capacity of 372.5 million dwt.
Crude Oil Tanker Fleet – January 31, 2018420.1 mdwt.
|
| | | | | |
| Vessel Type | Deadweight Tons (Dwt) | Number of Vessels | % of Fleet | Capacity (Million Dwt) | % of Fleet |
| VLCC | 200,000 + | 735 | 39.5 | 225.8 | 60.6 |
| Suezmax | 120-199,999 | 505 | 27.1 | 79.1 | 21.2 |
| Aframax | 80-119,999 | 622 | 33.4 | 67.6 | 18.1 |
| Total | | 1,862 | 100.0 | 372.5 | 100.0 |
Source: Drewry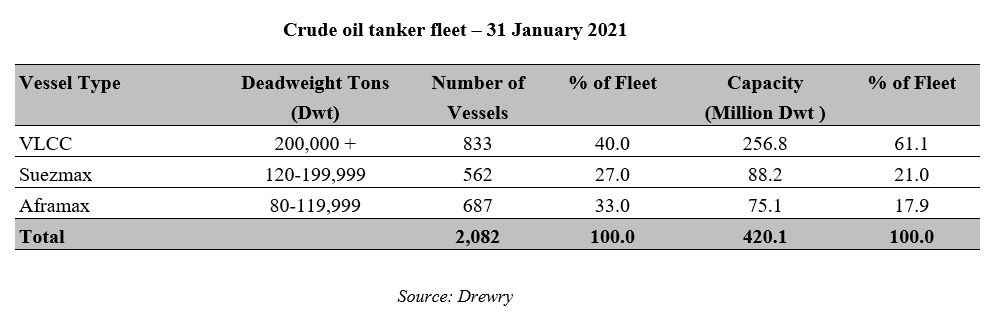
The table below shows principal routes for crude oil tankers and where these vessels are deployed.
Crude Oil Tankers – Typical Deployment by Size Category
|
| | | | | | |
Area | | Trade Route | Haul | Vessel Type | | |
| | | | VLCC | Suezmax | Aframax |
| | | | | | |
Inter-Regional | | MEG(1) - Asia | X | X | X |
| | MEG - N. America | X | | |
| | MEG - Europe - Suez(2) | | X | |
| | W.Africa(3) - N. America | X | X | X |
| | W. Africa - Asia | X | X | |
| | US Gulf - Asia | X | X | |
| | MEG - Europe - Cape (4) | X | | |
| | W. Africa - Europe | | X | X |
| | NS(5) - N. America | | | X |
| | MEG - Pacific Rim | | X | X | |
| | | | | | |
Intra-Regional | | North Sea | | X | X |
| | Caribbean | | X | X |
| | Mediterranean | | X | X |
| | Asia - Pacific | | | X | X |
| | | | | | |
| | | | |
(1) Middle East Gulf | | | | |
(2) Suezmax via Suez Canal fully laden | | | | |
(3) West Africa | | | | |
(4) VLCC transit via Cape of Good Hope | | | | |
(5) North Sea | | | | |
Source: Drewry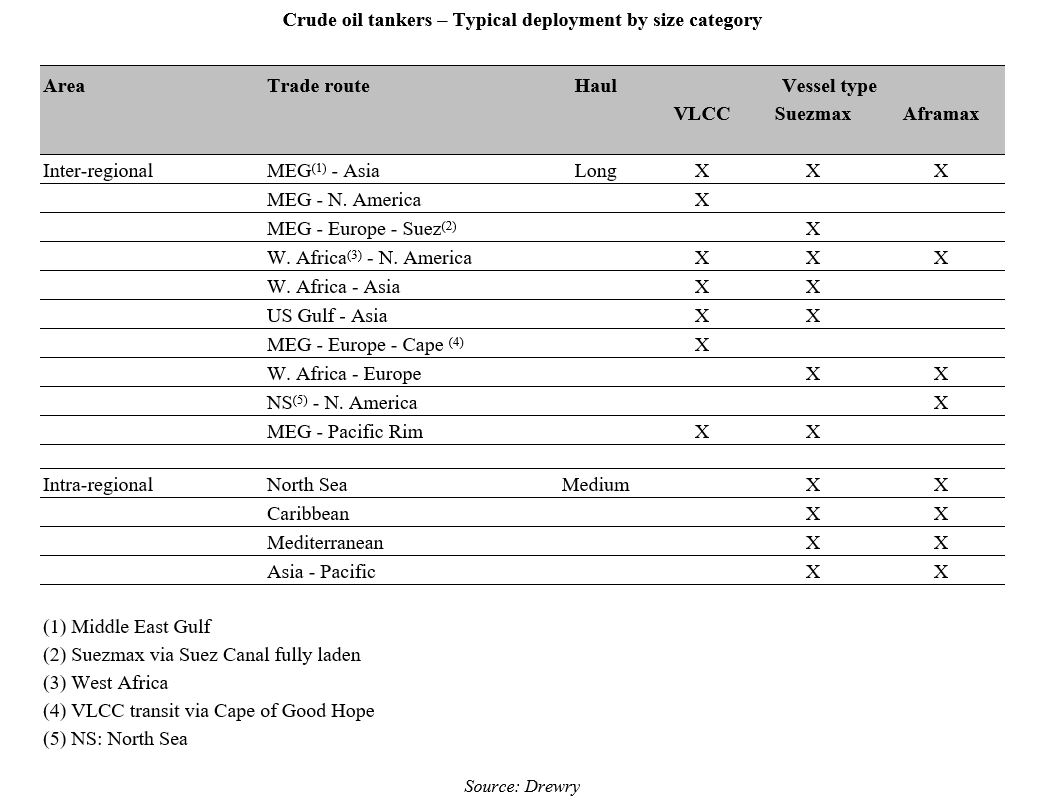
VLCCs are built to carry cargo parcels of two million barrels, and Suezmax tankers are built to carry cargo parcels of one million barrels, which are the most commonly traded parcel sizes in the crude oil trading markets. Their carrying capacities make VLCCs and Suezmax tankers the most appropriate asset class globally for long and medium haul trades. While traditional VLCC and Suezmax trading routes have typically originated in the Middle East and the Atlantic Basin, increased Asian demand for crude oil has opened up new trading routes for both classes of vessel.vessels. The map below shows the main VLCC and Suezmax tanker seaborne trade routes.
Principal VLCC and Suezmax Seaborne Crude Oil Trades
Source: Drewry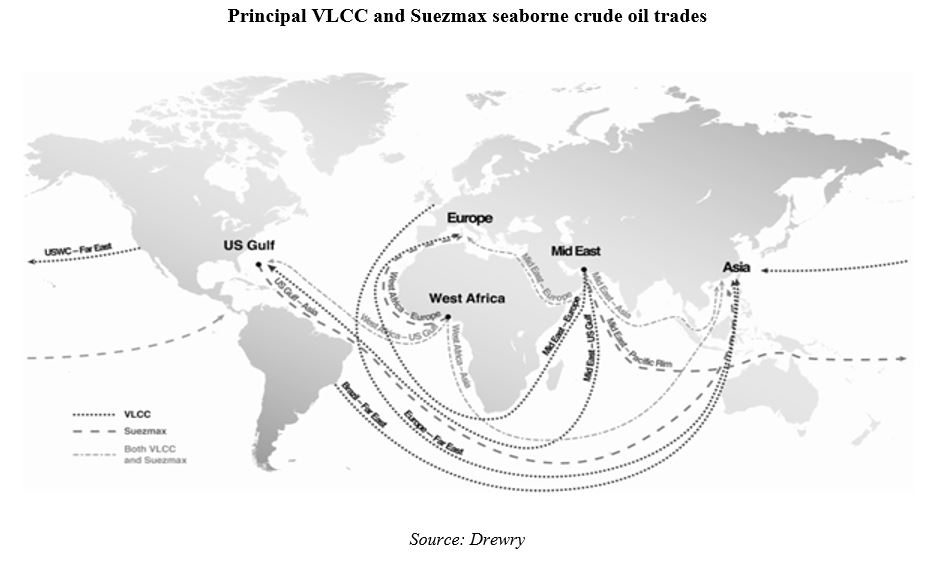
VLCC/Suezmax Fleet Development
In 2017, the worldAfter growing at a record 6.5% year on year in 2019, crude tanker fleet grewgrowth moderated to 3.1% year on year in 2020 to 417.6 mdwt. Deliveries declined by 4.8% compared to 5.8%46.1% year on year as orderbook was small. Demolition also declined 18.8% year on year in 2016. A total of 26.3 million dwt (5.3 million dwt greater than 2016) of newbuild deliveries were added to the crude fleet2020 as sharp decline in 2017, whilebunker prices made life easy for old vessels. An unprecedented surge in freight rates in 1H20 also kept scrapping activity muted.Moreover, activity in ship-breaking yards in Southeast Asia was also picked uphampered by the lockdowns and corresponding volatility in second half of the year. A total of 8.9 million dwt was sent for demolition in 2017 compared with 1.6 million dwt in 2016.steel prices.
VLCC & Suezmax Fleet Development: 2005 to 2017
(Year on Year percentage Growth: Million Dwt)
The chart below indicates the volume of new orders placed in the VLCC and Suezmax sectors in the period from 20072010 to 2017. Very few new vessel orders were placed in both sectors during 2011, 2012 and 2013, although the pace of new ordering in the VLCC sector increased in the closing months of 2013 and newbuild orders for VLCCs as well as Suezmax tankers were considerably higher in 2014 and 2015.January 2021. Tight supply-demand dynamics in the tanker market, firm freight rates and exemption from compliance to tierTier III NOx emission norms for vessels ordered before 1 January 1, 2016, were the reasons for high new ordering activity in 2015, and a total of 62 VLCCs and 51 Suezmaxes contracts were placed during the year. New ordering activity then declined in 2016, whenwith only 14 VLCCs were ordered during the year compared with 62 during 2015. Ordering activity picked up again in 2017 as ship-ownersshipowners took advantage of low newbuild prices to embark on fleet renewal. However, newbuilding activity took a back seat in the depressed freight market, and 39 VLCCs and 12 Suezmaxes were ordered in 2018 compared with 48 VLCCs and 19 Suezmaxes in 2017. Uncertainty over the price and availability of new bunker fuel resulted in lower orders in 2019. New orders remained subdued in 2020. Apart from the weak market outlook, the upcoming IMO regulations on decarbonisation are holding back newbuilding activity as the new regulations will affect the choice of propulsion systems and fuels in the future.
VLCC/Suezmax New Orders 2007 to 2017
('000 Dwt)
Source: Drewry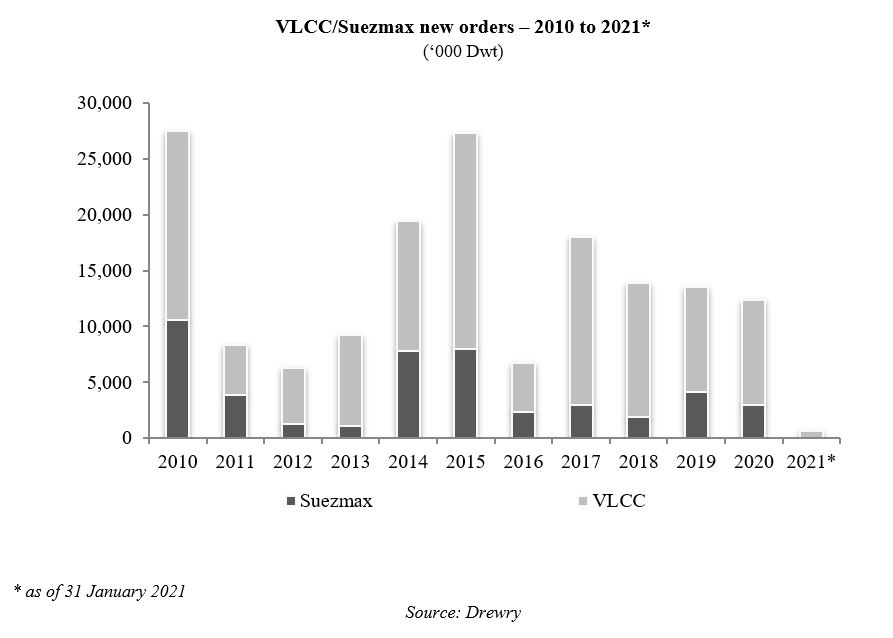
In the last few years, delays in new vessel deliveries, often referred to as “slippage,”‘slippage’, have become a regular feature of the market. Slippage is the result of a combination of several factors, including cancellations of orders, problemsissues in obtaining vessel financing, owners seeking to defer delivery during weak markets, shipyards quoting over-optimistic delivery times, and in some cases, shipyards experiencing financial difficulty. A number of Chinese yards, including yards at which crude tankers are currently on order, are experiencing financial problems which have led to both cancellations and delays in deliveries. New order cancellations have been a feature of most shipping markets during the market downturn. For obvious reasons, shipyards are reluctant to openly report such events, making the tracking of the true size of the orderbook at any given point in time difficult. The difference between actual and scheduled deliveries reflects the fact that order booksorderbooks are often overstated. Slippage has affected both the VLCC and Suezmax sectors. The table below indicates the relationship between scheduled and actual deliveries for both asset classes in the periodfrom 2011 to 2017.2020. Since slippage has occurred in recent years, it is not unreasonable to expect that some of the VLCC and Suezmax tankers currently on order will not be delivered on time.
VLCC/Suezmax Tankers: Scheduled versus Actual Deliveries
(Million Dwt)
|
| | | | | | | |
| | 2011 | 2012 | 2013 | 2014 | 2015 | 2016 | 2017 |
| VLCC | | | | | | | |
| Scheduled Deliveries | 26.4 | 22.4 | 17.8 | 9.9 | 8.7 | 20.5 | 16.5 |
| Actual Deliveries | 19.1 | 15.4 | 9.5 | 7.6 | 5.7 | 14.3 | 15.2 |
| Slippage Rate (%) | 27.6 | 31.4 | 46.5 | 22.7 | 35.1 | 29.9 | 7.8 |
| | | | | | | | |
| | | | | | | | |
| Suezmax | 2011 | 2012 | 2013 | 2014 | 2015 | 2016 | 2017 |
| Scheduled Deliveries | 10.9 | 11.2 | 10.4 | 4.7 | 2.6 | 6.5 | 10.2 |
| Actual Deliveries | 6.6 | 7.4 | 4.6 | 1.3 | 1.7 | 4.1 | 7.8 |
| Slippage Rate (%) | 39.1 | 34.1 | 56.1 | 73.2 | 35.5 | 36.7 | 23.4 |
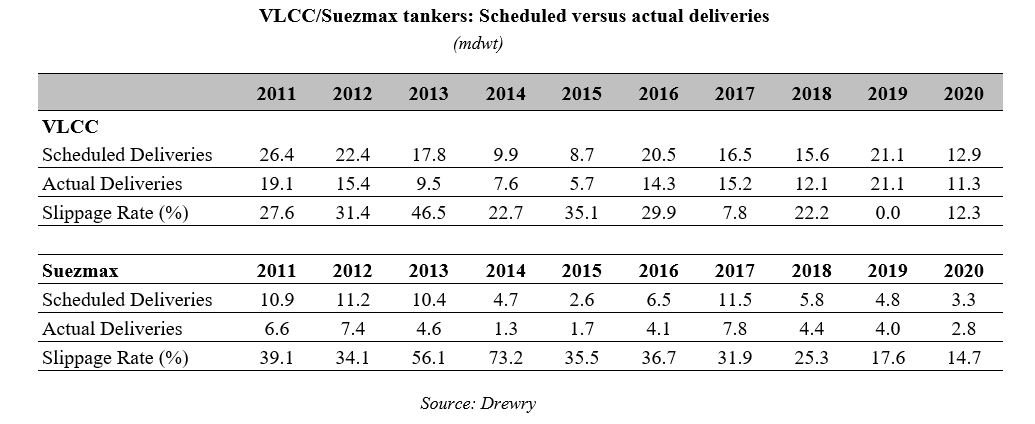
Source: Drewry
In 2017,2020, VLCC and Suezmax deliveries amounted to 15.211.3 and 7.8 million dwt,2.8 mdwt respectively, compared with 14.321.1 and 4.1 million dwt,3.9 mdwt respectively in 2016.2019. As a result of these changes,deliveries, the VLCC and Suezmax fleets grew by 5.6%expanded 3.6% and 8.5%3.3% year on year respectively in 2017.2020.
VLCC/Suezmax Tanker Deliveries: 2007 to 2017
('000 Dwt)
Source: Drewry
At its peak in 2008, the VLCC and Suezmax tanker order booksorderbooks were each equivalent to 50% of the existing fleets, which led to high levels of new deliveries in both sectors between 2009 and 2012. The orderbook as a percentage of the existing fleet declined in the period 2010-13 due to low levels of new ordering. However, with the upturn in new ordering activity in 2014 and 2015, the VLCC and Suezmax orderbook to fleet ratios rose to 19.4% and 24.7% respectively in December 2015. As a result of lower levels of new ordering and elevated deliveries fromduring 2016-19, the orderbook, the orderbookorderbooks for VLCC and Suezmax vessels as of 31 January 31, 20182021 were equivalent to 12.7%7.0% and 10.2%8.1% of the existing fleets, respectively. The VLCC and Suezmax orderbook to fleet ratio are at their lowest level since 2008.
VLCC & Suezmax Orderbook:
(Percent Existing Fleet)
* As on January 2018
Source: Drewry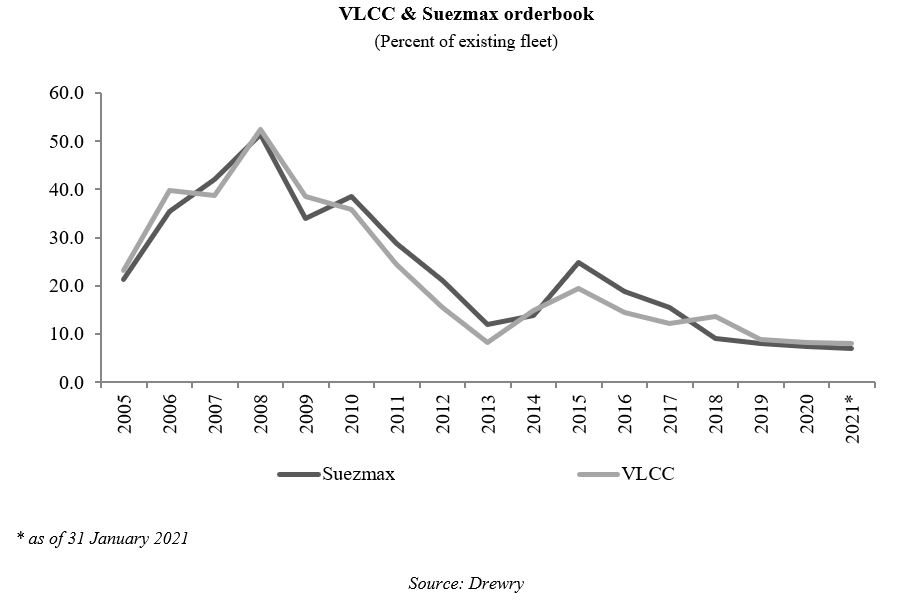
As of 31 January 31, 2018,2021, the total crude tanker orderbook comprised 237consisted of 164 vessels with aggregate capacity of 47.1 million dwt.35.2 mdwt. The orderbook for Suezmax tankers was 5139 vessels representing 8.1 million dwt6.1 mdwt (excluding shuttle tankers), and for VLCCs, the orderbook was 9278 vessels representing 28.7 million dwt.23.7 mdwt.
Crude Oil Tanker (1) Orderbook January 31, 2018
|
| | | | | | | | | | | | | | | |
| Size Dwt | | Existing Fleet | Scheduled Deliveries | Total Orderbook | % Existing Fleet |
| | | | | 2018 | 2019 | 2020 | 2021 | | | | |
| | | No. | m dwt | No. | m dwt | No. | m dwt | No. | m dwt | No. | m dwt | No. | m dwt | No | Dwt |
| | | | | | | | | | | | | | | | |
| VLCC | 200,000 + | 735 | 225.8 | 46 | 14.4 | 36 | 11.2 | 8 | 2.5 | 2 | 0.6 | 92 | 28.7 | 12.5% | 12.7% |
| Suezmax | 120-199,999 | 505 | 79.1 | 34 | 5.4 | 14 | 2.2 | 2 | 0 | 1 | 0.2 | 51 | 8.1 | 10.1% | 10.2% |
| Aframax | 80-119,999 | 622 | 67.6 | 53 | 6.0 | 20 | 2.3 | 8 | 0.9 | 5 | 0.6 | 86 | 9.7 | 13.8% | 14.4% |
| | | | | | | | | | | | | | | | |
| Total | | 1,862 | 372.5 | 133 | 25.7 | 70 | 15.7 | 18 | 3.7 | 8 | 1.4 | 229 | 46.5 | 12.3% | 12.5% |
(1) Excludes product tankers and in the case of Suezmax shuttle tankers
Source: Drewry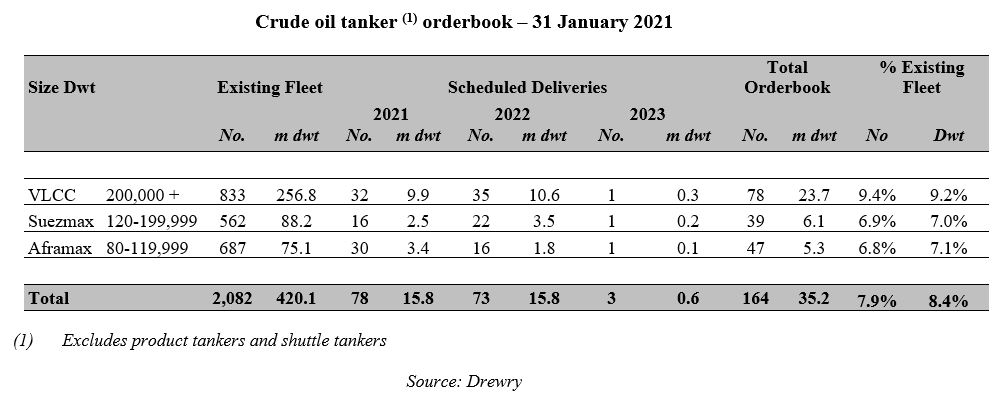
Tanker supply is also affected by vessel scrapping or demolition.scrapping. As an oil tanker ages, vessel owners often conclude that it is more economical to scrap a vessel that has exhausted its useful life than to upgrade the vesselit to maintain its “in-class”’in-class’ status. Often, particularly when tankers reach approximatelyabout 25 years of age, the costs of conducting the class survey and performing required repairs become economically inefficient. In recent years, most oil tankers that have been scrappeddemolished were between 1825 and 2330 years of age. The average demolition age of VLCC has been around 21 years.
In addition to vessel age, scrapping activity is influenced by freight markets as well as steel prices. Duringmarkets. Demolitions tend to decrease during periods of high freight rates scrapping activity will decline and the opposite will occurincrease when freight rates are low. The chart below indicates that vessel scrapping was muchsignificantly higher from 2010 to 2014 than in the preceding five years. Firm freight rates in 2015 and 2016 also encouraged the ship-ownersshipowners to defer the scrapping of older tonnagevessels, and demolitions in these two years were substantially lower compared to that ofwith those during 2010-14. However, weak freight rates in third quarter of 20173Q17 accelerated demolitiondemolitions and a total of 58 crude tankers totaling 8.9 million dwt8.5 mdwt were sold to scrapyards in 2017. Scrapping activity reached a record high as a weak freight market forced shipowners to phase out vessels below 20 years of age. Consequently, 108 crude carriers aggregating 18.6 mdwt were demolished in 2018. In 2019, demolitions remained muted as shipowners preferred holding on their old vessels due to higher freight rates in 2H19. Scrapping in 2020 continued to be muted due to a sharp decline in bunker prices and surge freight rates in 1H20. Moreover, activity in ship-breaking yards in Southeast Asia was also hampered by the lockdowns and corresponding volatility in steel prices. Lower freight rates in 2H20 failed to underpin scrapping activity as many old vessels were employed in oil storage.
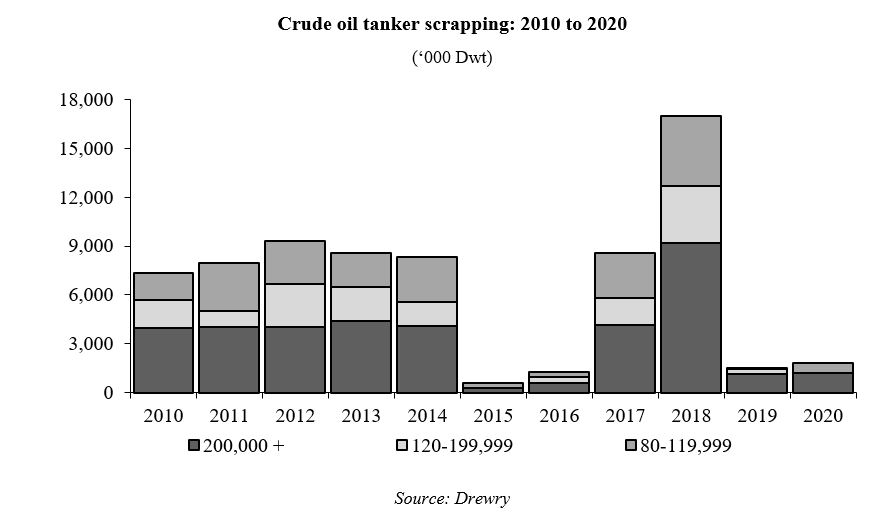
Crude Oil Tanker Scrapping: 2007 to 2017
('000 Dwt)
Source: Drewry
Two other important factors are likely to affect crude tanker supply in the future. The first is the requirement to retrofit ballast water management systems (“BWMS”)(BWMS) to existing vessels. In February 2004, the IMO adopted the International Convention for the Control and Management of Ships'Ships’ Ballast Water and Sediments. The IMO ballast water management (“BWM”)Ballast Water Management (BWM) Convention contains an environmentally protective numeric standard for the treatment of ship'sa ship’s ballast water before it is discharged. This standard, detailed in Regulation "D-2"‘D-2’ of the BWMInternational Convention for the Control and Management of Ships' Ballast Water and Sediments (the "BWM Convention"), sets out the numbers of organisms allowed in specific volumes of treated discharge water. The IMO "D-2"‘D-2’ standard is also the standard that has been adopted by the U.S.US Coast Guard'sGuard’s ballast water regulations and the U.S. EPA'sUS EPA’s Vessel General Permit. The BWM Convention also contains an implementation schedule for the installation of IMO member state type approved treatment systems in existing ships and in new vessels, requirements for the development of vessel ballast water management plans, requirements for the safe removal of sediments from ballast tanks, and guidelines for the testing and type approval of ballast water treatment technologies. In July 2017, the IMO extended the regulatory requirement of compliance to BWM Convention from 8 September 8, 2017 to 8 September 8, 2019. Vessels trading internationally will have to comply with the BWM Convention upon their next special survey after that date. For a VLCC tanker, the retrofit cost could be as much as $3.0US$2.0 million per vessel, including labor. Expenditure of this kind will behas become another factor impacting on the decision to scrap older vessels onceafter the BWM convention comesConvention came into force in September 2019.
The second factor that is likely to impact on future vessel supply is the drive to introduce low sulfur fuels.lower emission from ships. For many years, heavy fuelheavy-fuel oil (“HFO”)(HFO) has been the main fuel of the shipping industry. It is relatively inexpensive and widely available, but it is “dirty”‘dirty’ from an environmental point of view.
The sulfursulphur content of HFO is extremely high and it is the reason that maritime shipping accounts for 8% of global emissions of sulfur dioxide (“SO2”), an important source for acid rain as well as respiratory diseases.about 3.5%. In some port cities, such as Hong Kong, shipping is the largest single source of SO2 emissions, as well as emissions of particulate matter (“PM”)(PM), which are directly tied to the sulfursulphur content of the fuel.
The IMO, the governing body of international shipping, has made a concerted effort to diversify the industry away from HFO into cleaner fuels with less harmful effects on the environment and human health. Effective in 2015, ships operating within the Emission Control Areas (“ECAs”)(ECAs) covering the Economic Exclusive Zone of North America, the Baltic Sea, the North Sea, and the English Channel are required to use marine gas oil with allowable sulfursulphur content up to 1,000 parts per million (“ppm”)0.1%. From 2020,The IMO implemented emission control regulation globally with effect from 1 January, 2020. It stipulates that ships sailing outside ECAs will switch to marine gas oilan alternate fuel with permitted sulfursulphur content up to 5,000 ppm.0.5% or will retrofit scrubber in order to reduce emission. This will create openingshas created demand for a varietyVery Low Sulphur Fuel Oil (VLSFO) with 0.5% Sulphur content. Some of new fuels, or major capital expenditurethe owners of large vessels have also opted for costly “scrubbers” to be retrofittedscrubbers retrofitting on existing ships and, asships. As such itthe emission regulation will be another factor hastening the demiseeventual demolition of older ships whose propulsion systems are based on the use of HFO.
ships. Within the context of the wider market, increased vessel scrapping is a positive development as it helps to counterbalance new ship deliveries and moderates the fleet growth.
Starting 2020, high and low sulfur fuel demand (originating from the shipping industry) reported significant variation. The fuel price spread largely oscillated between $300 and $350 per metric ton during the initial days and hovered around $190-200 per tonne in February 2020. Despite the initial speculation, the shipping industry did not see any systemic shortage of the new low sulfur fuel, which came out as a relief. The premium commanded by low sulphur fuel reduced to around $90 per ton by January 2021 as the availability of compliant fuel is not an issue due to reduced demand and increased supply across major bunkering ports. The narrowing premium diluted shipowners’ incentive to invest in scrubbers and prolonged the period for the return on investment for those who had already invested in scrubbers. Overall, installation of scrubbers and new fuel regulations turned out to be a non-event in the backdrop of COVID-19 and low fuel prices.
As of January 31, 2021, owners have opted to fit scrubbers in about 140.2 mdwt of crude tonnage (includes UL/ VLCC, Suezmax and Aframax), which constitutes about 33.4% of the existing fleet (based on capacity in dwt). As per our estimate, 337 UL/ VLCCs are currently fitted with scrubbers, including 99 UL/ VLCC delivered as newbuilds. In addition, 32 UL/ VLCCs are pending retrofitting. Altogether, about 40.6s% of UL/ VLCC fleet is fitted with scrubbers (based on dwt capacity and includes pending retrofits). In the existing fleet, 159 Suezmax are fitted with scrubbers (96 retrofitted, 39 fitted at newbuilding and 24 retrofit pending). In total, 28.3% of the total Suezmax fleet is fitted with scrubbers (based on dwt capacity and includes pending retrofit). Vessels moving out of trade to retrofit scrubbers impede supply growth and support freight rates.
IMO 2030, IMO 2050 and Sea Cargo Charter
In addition to recently implemented emission control regulations, IMO has been devising strategies to reduce greenhouse gases (“GHG”) and carbon emissions from ships. According to the latest announcement, IMO plans to initiate measures to reduce CO2 emissions by at least 40% by 2030 and 70% by 2050 from the levels in 2008. It also plans to introduce measures to reduce GHG emissions by 50% by 2050 from the 2008 levels. These are likely to be achieved by setting energy efficiency requirements and encouraging ship owners to use alternative fuels such as biofuels, and electro-/synthetic fuels such as hydrogen or ammonia. It may include limiting the speed of the ships. Currently, there is uncertainty regarding the exact measures that the IMO will undertake to achieve these targets. Although the current macroeconomic environment constitutes the main deterrent, IMO-related uncertainty is also one of the factors deterring ship owners from ordering newbuild vessels, as these vessels may have a high environmental compliance cost in the future. As mentioned above, some shipowners are ahead of the curve by having ordered LNG-fueled ships in order to comply with stricter regulations that may be announced in future.
In November 2020, MEPC approved a draft for the new mandatory regulations to cut the carbon intensity of existing ships. Formal adoption of the proposal for GHG and CO2 emissions reduction action plan is expected in June 2021. It will be a combination of technical and operational measures. These will be monitored by the flag administration and corrective actions will be required in the event of constant non-compliance. The draft amendments would require the IMO to review the effectiveness of the implementation of the Carbon Intensity Indicator (“CII”) and Energy Efficiency Existing Ship Index (“EEXI”) requirements, by January 1, 2026 at the latest. EEXI is a technical measure and would apply to ships above 400 gross tonnage. It indicates the energy efficiency of the ship compared to a baseline and is based on a required reduction factor (expressed as a percentage relative to the Energy Efficiency Design Index baseline). On the other hand, CII is an operational measure which specifies carbon intensity reduction requirements for vessels with 5,000 gross tonnage and above. The CII determines the annual reduction factor needed to ensure continuous improvement of the ship’s operational carbon intensity within a specific rating level. The operational carbon intensity rating would be given on a scale of A, B, C, D or E indicating a major superior, minor superior, moderate, minor inferior, or inferior performance level, respectively. The performance level would be recorded in the ship’s Ship Energy Efficiency Management Plan (SEEMP). A ship rated D for three consecutive years, or E, would have to submit a corrective action plan, to show how the required index (C or above) would be achieved. Further, the European Union has endorsed a binding target of at least 55% domestic reduction in economy-wide GHG reduction by 2030 compared to 1990. EU shipowners are required to comply with this regulation.
The Sea Cargo Charter, applicable to bulk ship charterers, is a global framework that allows for the integration of climate considerations into chartering decisions to favor climate-aligned maritime transport. At present, 18 charterers are signatories to the sea cargo charter. These charterers have vowed to make the details of their shipping carbon footprint public.
We expect these regulations to affect old tonnage more, which would need to slow steam or carry out energy efficiency improvements to remain viable. They are likely to make the very old tonnage uneconomical.
The Crude Oil Tanker Freight Market
Types of Charter
Oil tankers are employed in the market through a number of different chartering options, described below.
•A bareboat charter involves the use of a vessel usually over longer periods of up to several years. All voyage related costs, including vessel fuel, or bunkers, and port dues as well as all vessel operating expenses, such as day-to-day operations, maintenance, crewing and insurance, transfer to the charterer’s account. The owner of the vessel receives monthly charter hire payments on a per day basis and is responsible only for the payment of capital costs related to the vessel.
•A time charter involves the use of the vessel, either for a number of months or years or for a trip between specific delivery and redelivery positions, known as a trip charter. The charterer pays all voyage related costs. The owner of the vessel receives monthly charter hire payments on a per day basis and is responsible for the payment of all vessel operating expenses and capital costs of the vessel.
•A single or spot voyage charter involves the carriage of a specific amount and type of cargo on a load port to discharge port basis, subject to various cargo handlingcargo-handling terms. Most of these charters are of a single or spot voyage nature. The cost of repositioning the ship to load the next cargo falls outside the charter and is at the cost and discretion of the owner. The owner of the vessel receives one payment derived by multiplying the tons of cargo loaded on board by the agreed upon freight rate expressed on a per cargo ton basis. The owner is responsible for the payment of all expenses, including voyage, operating and capital costs of the vessel.
•A contract of affreightment, or COA, relates to the carriage of multiple cargoes over the same route and enables the COA holder to nominate different ships to perform individual voyages. This arrangement constitutes a number of voyage charters to carry a specified amount of cargo during the term of the COA, which usually spans a number of years. All of the ship’s operating, voyage and capital costs are borne by the shipowner. The freight rate is normally agreed on a per cargo ton basis.
Tanker Freight Rates
Worldscale is the tanker industry’s standard reference for calculating freight rates. Worldscale is used because it provides the flexibility required for the oil trade. Oil is a fairly homogenous commodity as it does not vary significantly in quality and it is relatively easy to transport by a variety of methods. These attributes, combined with the volatility of the world oil markets, means that an oil cargo may be bought and sold many times while at sea, and therefore, the cargo owner requires great flexibility in its choice of discharge options. If tanker fixtures were priced in the same way as dry cargo fixtures, this would involve the shipowner calculating separate individual freights for a wide variety of discharge points. Worldscale provides a set of nominal rates designed to provide roughly the same daily income irrespective of discharge point.
Time charter equivalent (TCE) is the measurement that describes the earnings potential of any spot market voyage based on the quoted Worldscale rate. As described above, the Worldscale rate is set and can then be converted into dollars per cargo ton. A voyage calculation is then performed, which removes all expenses (port costs, bunkers and commission) from the gross revenue, resulting in a net revenue whichthat is then divided by the total voyage days, which includesincluding the days from discharge of the prior cargo until discharge of the cargo for which the freight is paid (at sea andand/or in port), to give a daily TCE rate.
The supply and demand for tanker capacity influences tanker charter hire rates and vessel values. In general, time charter rates are less volatile than spot rates as they reflect the fact that the vessel is fixed for a longer period of time. In the spot market, rates will reflect the immediate underlying conditions in vessel supply and demand, and are thus more prone to volatility. Small changes in tanker utilization have historically led to relatively large fluctuations in tanker charter rates for VLCCs, with more moderate price volatility in the Suezmax, Aframax and Panamax markets and less volatility in the HandyHandysize market, as compared towith the tanker market as a whole. The chart below illustrates monthly changes in TCE rates for VLCC and Suezmax tankers during the period from January 20072010 to January 2018.2021.
VLCC TCE saw a spike during 1H20 due to a surge in demand for VLCCs for floating storage when the global oil demand plunged substantially as a result of the lockdown measures adopted by several major economies to curb the spread of COVID-19. This led to unprecedented oversupply of crude oil. As a result, the average VLCC TCE rate spiked to about US$ 200,000pd in April 2020. However, the production cut by OPEC+ and other major companies has facilitated the gradual clearing of supply glut and TCE rates came down to US$ 15,800pd in December. High inventories of crude and refined products, as well as the second wave of COVID-19, has dented the crude oil trade and tonnage demand. Meanwhile, the return of vessels from floating storage has inflated vessel supply.
VLCC/Suezmax Tanker Time Charter Equivalent (TCE) Rates: 2007 to 2018*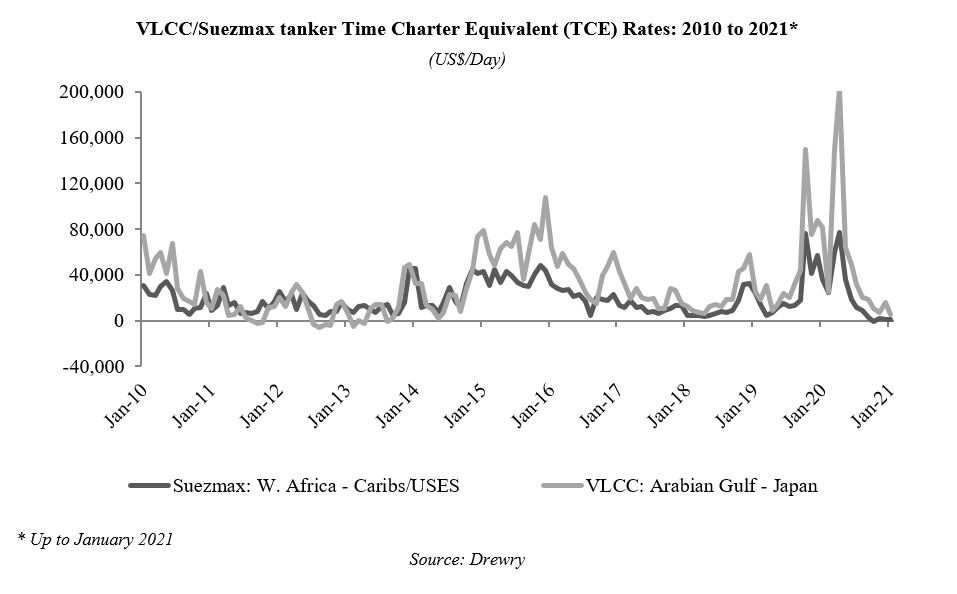
(US$/Day)
* Through to January 2018
After a weak phase between 2009 and the first half of 2014,1H14, tanker freight rates started rising in the second half of 2014,2H14, the main stimulus being the fall in oil prices and rising oil consumption. In addition, key oil-importing countries, such as India and China, started building Strategic Petroleum Reserves (SPRs).
In the last quarter of 2015,4Q15, VLCC spot rates surged, benefiting from seasonal demand and low growth in fleet supply.the global crude tanker fleet. However, a wave of newbuilding deliveries in 2016 outpaced demand, and average TCE rates in 2016 were approximatelyaround 40% lower than in 2015. A spate of newbuilding deliveries in 2017 aggravated the situation further and the average TCE rates dropped by a further 45% in 2017. The situation worsened further and TCE rates were below breakeven rates for the first nine months of 2018. However, vessel earnings improved in the later months of the year and TCE rates for VLCCs on Arabian Gulf–Japan averaged at about US$ 21,500pd in 2018, which is nearly 5% lower than the rates realized in 2017.
VLCC TCE rates rose 2.1x in 2019, compared with 2018, on the back of the US sanctions on Cosco Shipping Tanker (Dalian) Co, geopolitical tensions and tight supply. VLCC rates surged to record high levels in October 2019 due to tight supply as US sanctions on Cosco subsidiaries in late September 2019 made a substantial number of Cosco’s 43 VLCCs difficult to trade. The US sanctions on Iran and the corresponding decline in Iran’s crude exports have also trimmed the availability of National Iranian Tanker Company (NITC) vessels for international trade. Effective vessel supply was also squeezed, with vessels moving out of trade to retrofit scrubbers.
VLCC/Suezmax 1 Year Time Charter Rates: 2007 to 2018*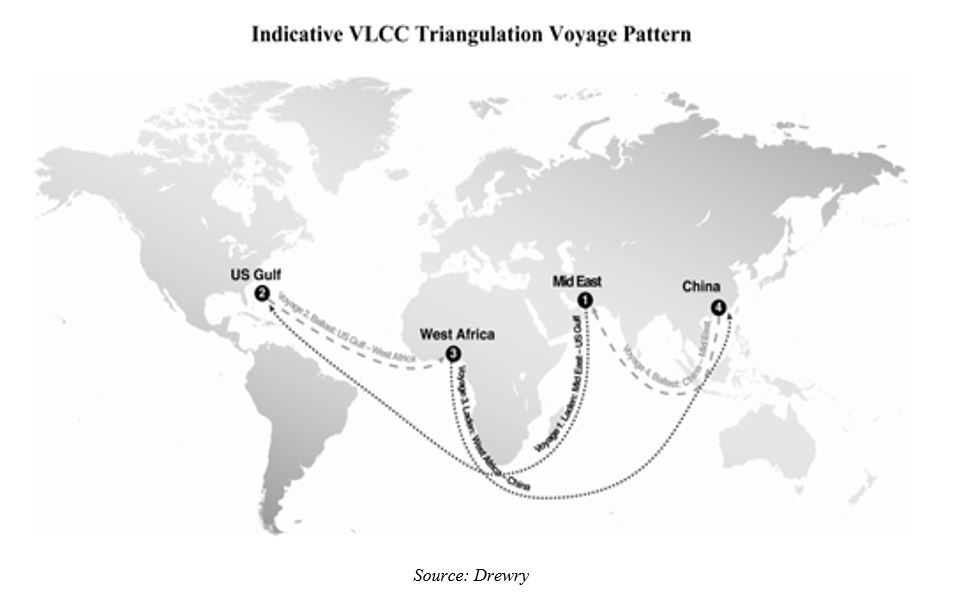
(US$/Day Period Averages)
* Through to January 2018
Source: Drewry
In the tanker market, independent ship ownersshipowners have two principal employment options -– either the spot or time charter markets or a combination of both. How tankers are deployed varies from operator to operator, and are also influenced by the market conditions. In a buoyant market, the companies that prefer to deploy vessels on the spot market will gain more as they will benefit from the rise in freight rates. Broadly speaking, a ship ownershipowner with an operating strategy, which is focused on the time charter market, will experience a more stable income stream and they will be relatively insulated against the volatility in spot rates.
Newbuilding Prices
Global shipbuilding is concentrated in South Korea, China and Japan. This concentration is the result of economies of scale, construction techniques and the prohibitive costs of building ships in other parts of the world. Collectively, these three countries account for approximatelyabout 90% of the global shipbuilding output.market.
Vessels constructed at shipyards are of varying size and technical sophistication. DrybulkDry bulk carriers generally require less technical know-how to construct, while oil tankers, container vessels and LNG carriers require technically advanced manufacturing processes.
The actual construction of a vessel can take place in 9 to 12 months and can be partitioned into five stages: contract signing, steel cutting, keel laying, launching and delivery. The amount of time between signing a newbuilding contract and the date of delivery is usually at least 16-20 months, but in times of high shipbuilding demand, it can extend up to two2 to three3 years.
Newbuilding prices for tankers of all sizes rose steadily between 2004 and mid-2008. This was due to a number of factors, including high levels of new ordering, a shortage in newbuilding capacity during a period of high charter rates, and increased shipbuilders’ costs as a result of strengthening steel prices and the weakening U.S.US dollar. Prices weakened in 2009 as a result offollowing a downturn in new ordering and remained weak until the second half of 2013,2H13, when they slowly started to rise.
Newbuild prices increased by an average of 10% across vessel classclasses in 2014, but they declined marginally in 2015 because ofdue to weaker steel prices and spare capacity at shipyards on accountbecause of negligible activity in other sectors of the maritime industry. Average new buildingThe average newbuilding prices for VLCCs in 2015 dropped by 2.4% year on year, while prices were flat for Suezmax tankers prices were flat between 2014 and 2015. Spare capacity at shipyards, coupled with low ordering in 2016, led to a further decline of 10% to 12% in newbuilding prices of crude tankers. Newbuild prices remained stable throughout 2017. However, newbuild price data for last twelve months suggest that prices have stabilized; asincreased steadily in 2018 primarily on the back of January 2018, indicativeoptimism about a recovery in the tanker market. VLCC and Suezmax newbuild prices were estimated at US$ 82mincreased in 2019 with an increase in charter rates. In 2020 newbuilding prices for VLCC and US$ 55m respectively.Suezmax declined 7.4% on average because of lower new orders and weak freight market in 2H20.
VLCC/Suezmax Tanker Newbuilding Prices: 2007 to 2018*
* Through to January 2018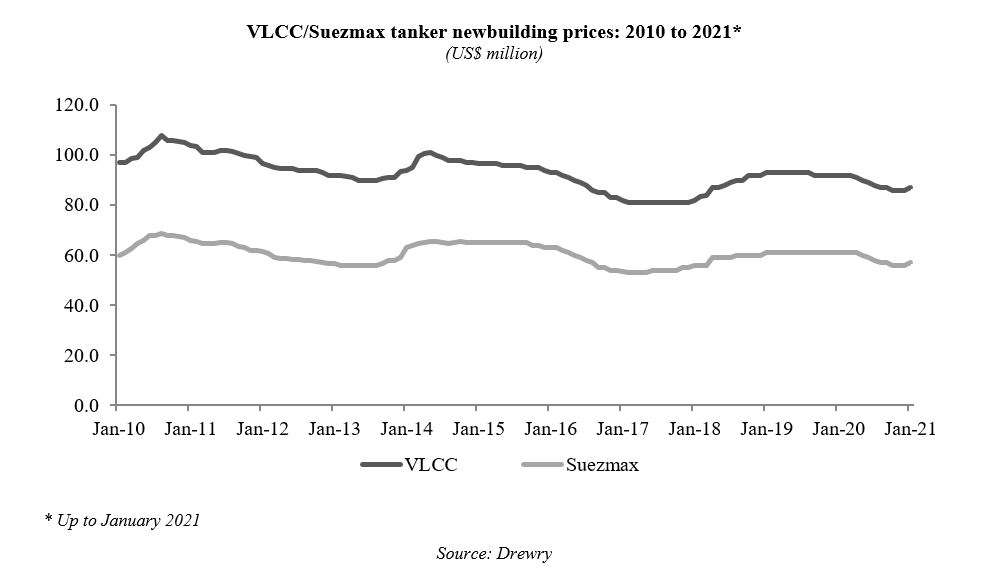
Source: Drewry
SecondhandSecond-hand Prices
SecondhandSecond-hand prices are generally influenced by potential vessel earnings, which in turn are influenced by trends in the supply of and demand for shipping capacity. The secondhandsecond-hand vessel prices follow the prevailing freight rates and they provide a better assessment of the existing supply and demand situationsupply-demand dynamics in the market. Vessel values are also dependent on other factors, including the age of the vessel.vessel, shipyard etc. Prices for young vessels, those approximately five yearsaround five-years old or under are also influenced by newbuilding prices. Prices for old vessels, those that are in excess of 2520 years oldof age and near the end of their useful economic lives, are swayed by the value of scrap steel. In addition, the values for younger vessels tend to fluctuate less on a percentage basis than the values for older vessels. This is attributed to the finite useful economic life of older vessels that makes the price of younger vessels less sensitive to freight rates in the short term.
Vessel values are determined on a daily basis in the sale and purchase (S&P) market, where vessels are sold and bought through specialized sale and purchase brokers who regularly report these transactions to participants in the seaborne transportation industry. The S&P market for oil tankers is transparent and quite liquid, with a large number of vessels changing hands on a regular basis.
The chart below illustrates the movements of prices for secondhand (5 yearsecond-hand (5-year old) oil tankers between 20072010 and 2018.January 2021. After remaining range boundrange-bound between 2010 and 2013, secondhandsecond-hand vessel prices started recovering in 2014-15, but a sharp decline in the earning capabilities of vessels in 2016 reversed the trend, and secondhandsecond-hand prices plunged by 25-30% during the year. However, it is evident from the data available that second handsecond-hand prices wereremained stable for much of 2017. That said, second hand2017 and started to move up slowly from the beginning of 2018 due to increased demand for modern fuel-efficient vessels in the S&P market. Nevertheless, the second-hand prices of crude tankers are well below the last peak witnessedrecorded in 2008. AsIn 2019, the second-hand prices of January 2018, five year old VLCC and Suezmax vessels were changing hands atincreased in tandem with a surge in charter rates. The average second-hand prices of VLCCs increased 10.1% year on year to US$ 62m70.8 million, while the average Suezmax second-hand prices increased 14.1% year on year to US$ 49.7 million. Second-hand prices of VLCC and US$ 40m respectively.Suezmax declined 15.8% on an average as freight rates plunged in 2H20.
VLCC/Suezmax Tanker Secondhand Prices – 5 Year Old Vessels: 2007 to 2018*
* Through January 2018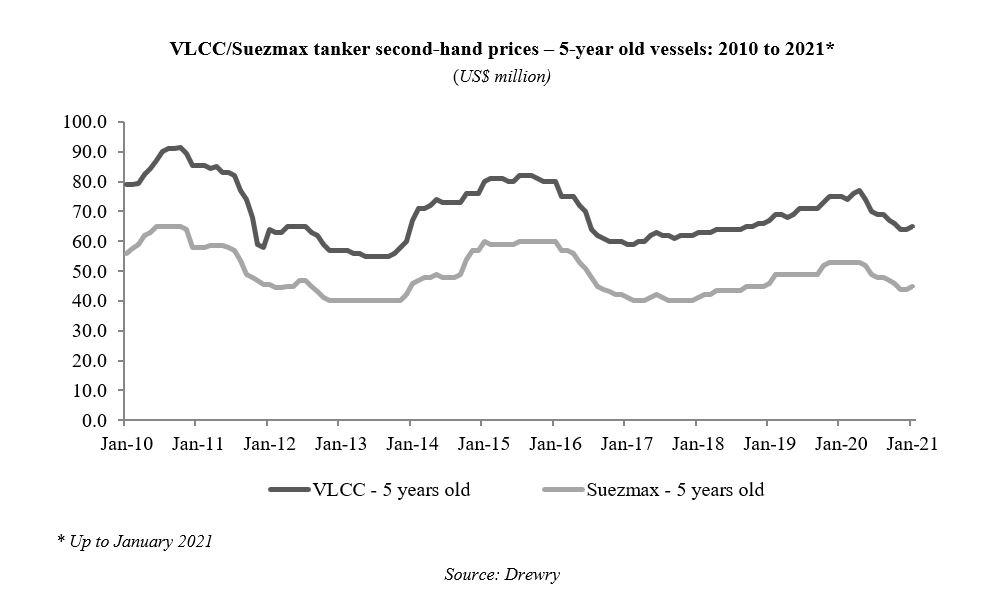
OVERVIEW OF THE OFFSHORE OIL AND GAS INDUSTRY
All the information and data in this annual report about the offshore oil industry has been provided by Energy Maritime Associates (EMA), an independent strategic planning and consulting firm focused on the marine and offshore sectors. EMA has advised that the statistical and graphical information contained herein is drawn from its database and other sources. In connection therewith, EMA has advised that: (a) certain information in EMA’s database is derived from estimates or subjective judgments; (b) the information in the databases of other maritime data collection agencies may differ from the information in EMA’s database; (c) while EMA has taken reasonable care in the compilation of the statistical and graphical information and believes it to be accurate and correct, data compilation is subject to limited audit and validation procedures.
Brief History of the Offshore Industry
Over the past 20 years global oil demand has grown at an average annual rate of 1.2%. With the exception of two years during the global financial crisis in 2008 and 2009, oil demand has increased year after year during this period. The Energy Information Administration (EIA) forecasts world oil production will grow to 113 million barrels per day (b/d) by 2040.
The offshore oil and gas industry can generally be defined as the extraction and production of oil and gas offshore. From a more nuanced perspective, it is a highly technical industry with significant risks, but whose rewards are high. Unlike on-shore developments, where drilling and processing equipment be constructed onsite, often with access to existing infrastructure, offshore developments have additional engineering and logistical requirements in designing, transporting, installing and operating facilities in remote offshore environments. Because of this, each production unit is unique and designed for the specific field’s geological and environmental characteristics including hydrocarbon specifications, reservoir requirements (water/gas/chemical injection), well/subsea configuration, water depth, and weather conditions (above and below the water).
The water depth of offshore developments has increased dramatically since its start from piers extended from shore in just a few meters of water. In 1947, Kerr-McGee drilled the first well beyond the sight of land. This well was in only 5.5 meters of water, but was 17 kilometers off the Louisiana coast. Offshore developments have continued to move further from land and into increasingly deeper waters using fixed platforms that extended from the seabed to the surface.
Floating Production and Storage (or FPS) and Floating, Production, Storage and Offloading unit (or FPSO) units emerged in the 1970s. Since that time, FPS units have been installed in increasing water depths, with the deepest unit now operating in 2,900 meters of water. Water depths are currently defined as shallow (less than 1,000 meters), deepwater (between 1,000 meters and 1,500 meters), and ultra-deepwater (greater than 1,500 meters). Units installed before 2000 were almost all shallow water. Since 2000, 35%45% of units have been installed in deepwater including 15%20% in ultra-deepwater. For units currently on order, 56%over half are in deepwater, including 50%40% in ultra-deepwater. Other types of FPS units include Spar, Tension-Leg Platform (TLP), and Semi-submersible (Semi), which are well suited to deepwater. For liquefying gas and then converting it back to gas, Floating Liquefied Natural Gas (FLNG) and Floating Storage Regas Unit (FSRU) can be used. Mobile Offshore Production Units (MOPU), and Floating Storage Offloading Units (FSO) are popular for shallow water developments.
The geographical range of the FPS industry has also changed over the years. For the first few decades of industry activity, projects were concentrated in the Gulf of Mexico and the North Sea. However, with discoveries of new hydrocarbon basins, the location of offshore developments expanded to include most parts of the world, with Brazil, West Africa, and Southeast Asia now leading the way.
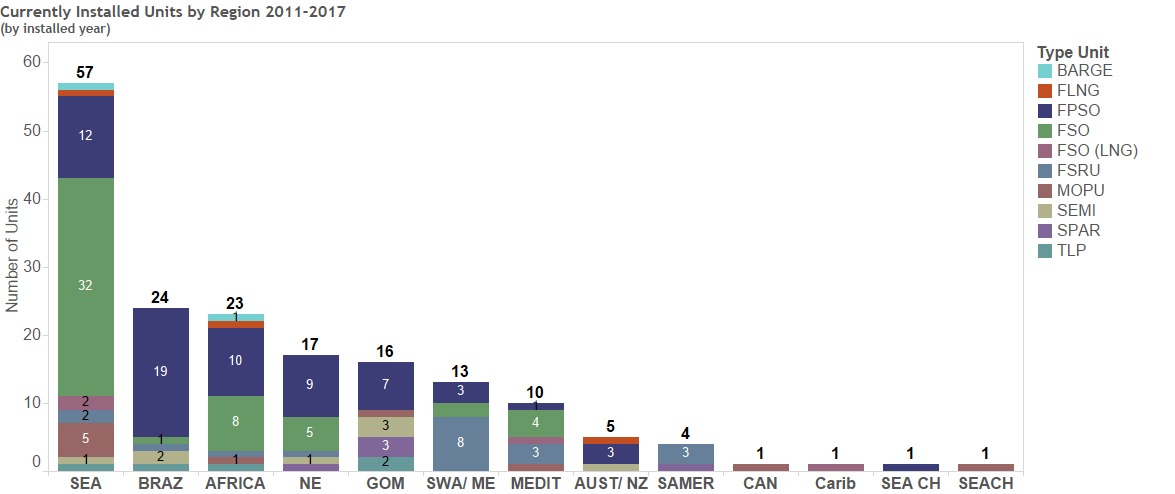
Source: Energy Maritime Associates, December 2017
Along with increasing water depth, the size and complexity of these offshore developments has also grown, which in turn has increased the size and complexity of the FPS units. Project development cycles have increased in time, complexity, and cost. In particular, the time between initial discovery and starting production is now five to ten years. However, over the past few years there has been a concerted effort to reduce field development costs by reducing the number of interfaces and re-using standardized designs as much as possible. It remains to be seen how sustainable and lasting these changes will be.
Contract Awards and Orderbook
Production from floating production systems has been increasing over the past 20 years, but not in a consistent manner.
Approval of these projects depends largely on the oil price expectation at the time and the related production potential associated with the specific project. As a result, the orders for FPS units generally follow the price of oil. However, oil price is not the only factor. Development costs also play a major role in determining the economic viability of a project. After the price of Brent crude dropped to $34 per barrel in 2008, only 10 FPS units were awarded in 2009. As the price of Brent crude recovered to over $100 per barrel, 25-33 FPS units were awarded each year from 2010-2014. Following the sharp decline in oil prices, FPS orders dropped to 15 units in 2015 and 17 in 2016. WithAs oil prices recovered from 2017-2019, so did orders, particularly for FPSOs, which rose from 6 in 2017 to 13, a level not seen since 2013. However, with the global outbreak of COVID-19 and decline in oil price recovery,demand and prices, orders came to a halt in Q2 2020 as companies cut Capex and deferred investment decisions into 2021. One FPSO order was placed by 2017 there were 27 awards, ten more than the previous year and back to the level before the oil price crash.Petrobras in August 2020.
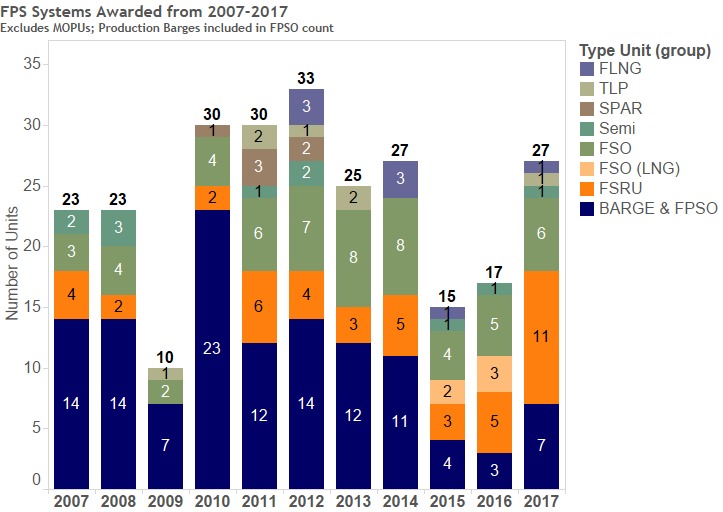
Source: Energy Maritime Associates, December 2017
Currently Installed Units
As of December 2017,January 2021, there are 289296 FPS systems in service worldwide comprised of FPSOs (60%(56%) of the current total, Production Semis (12%(13%), FSRUs (10%), TLPs (9%), Production Spars (7%), FSRUs (7%), Production Barges (3%), and FLNGs (1%). This does not include 3540 production units and sixtwo floating storage/offloading units that are available for re-use. Another 104107 floating storage/offloading units (without production capability) are in service.
Source: Energy Maritime Associates, December 2017
Global Distribution of Installed Units by Type:
Source: Energy Maritime Associates, December 2017
Source: Energy Maritime Associates, December 2017
Markets
The top five regions for floating production systems are Southeast Asia (23%), Africa (18%), Brazil (16%(17%), Gulf of Mexico (“GOM”) (13%), and Northern Europe (“NE”) (12%). The type of systems varies widely from region to region -– FSOs are the dominant type in Southeast Asia (“SEA”) due to the relatively shallow water depths and lack of infrastructure. In this type of environments, a fixed production platform and FSO is often the most economic development option.
The current order backlog consists of 4942 production floaters, seven8 FSOs (four(2 Oil and three6 LNG) and four3 Mobile Offshore Production Units, or MOPUs. Within the backlog, 2927 units are utilizing purpose-built hulls, and 20 units are based on converted hulls.hulls, 4 redeployments and 2 major upgrades. Of the production floaters being built, 2426 are owned by field operators, 2527 by leasing contractors.contractors, including two FPSOs which may be leased or owned (SBM’s Fast4Ward Hull #4 &5).
Since 1997, the production floater order backlog has ranged from a low of 17 units in 1999 to a peak of 70 units in the first half of 2013. Within this period, there have been multiple cycles: a downturn in 1998 and 1999 followed by an upturn from 2000 to 2002 of 17 to 39 units, relative stability in 2003 and 2004, an upturn from 2005 to 2007 from 35 to 67 units followed by a downturn from 2008 to 2009 down to 32 units, an upturn between 2010 and 2013 to 70 units, and a gradual decline to neararound 50 units bywhere it has remained since 2017. In Q1 2021 the endorderbook dropped to 42 and may mark the beginning of 2016.a period where deliveries outpace orders.
The leading destinations for the oil FSOs currently on order are Northern Europe and Southeast Asia.Southwest Asia/Middle East.
Source: Energy Maritime Associates, December 2017
Most Attractive Growth Regions
Between 20232025 and 2028,2030, Brazil and West Africa areis expected to continue to beremain the most attractive areasarea for offshore projects and presentpresents ample investment opportunities according to respondents of EMA’s 20182021 industry sentiment survey. As of December 2017, these two regions accountJanuary 2021, Brazil accounts for 33% (8015% (30 out of 241)202) potential floating production projects in the planning process. Other industry participants believe that Southeast AsiaSouth America (excluding Brazil) and GOM-MexicoWest Africa present the next largest growth opportunities globally. NewGuyana is rapidly becoming a prime destination, with up to 10 FPSOs planned by ExxonMobil and other exploration activity underway in Suriname.
Other industry participants remain optimistic about the Mexican and US sides of the GOM, buoyed by greenfield and brownfield deepwater developments. Foreign companies in Mexico have begun developing new shallow and deep waterdeepwater projects requiring FPSOs and FSOs are expected to increase dramatically following reforms in Mexico to allow foreign investment. East Africa is also expected to see new floating production units, following large gas discoveries in Mozambique and Tanzania.FSOs.
Source: Energy Maritime Associates, December 2017
The FSO Market
FSOs provide field storage and offloading in a variety of situations. FSOs are primarily used in conjunction with fixed platforms, MOPUs and production floaters (Semis, TLPs, Spars) to provide offshore field storage of oil and condensate. They are also used as offshore storage/export facilities for onshore production fields and as storage/blending/transshipment terminals for crude oil or refined products. Most FSOs store oil, although there are a few FSOs that store liquefied natural gas (LNG) or liquefied petroleum gas (LPG).
FSOs range from simple tankers with few modifications to purpose built and extensively modified tankers with significant additional equipment at a total cost ranging between $250 and $300 million. Oil storage capacity on FSOs varies from 60,000 barrels to 3 million barrels. FSO Asia and the FSO Africa, which are co-owned by Euronav, are among the largest and most complex FSOs in operation. Water depth ranges from 15 meters to 380 meters with the exception of except for an FSO located in Brazil’s Marlim Sul field (1,180 meters). There is no inherent limitation on water depth for FSOs.
Most FSOs currently in operation are older single-hull tankers modified for storage/offloading use. ApproximatelyOver 60% of the FSOs now operating are at least 20 years old, with almost 30% over 30 years old. Production continues on many of these fields, therefore requiring life extension or replacement of these older hulls. Around 40% of the FSOs in service are Aframax or Suezmax-size (600,000 to 1 million barrels). VLCC or ULCC size units (up to 3 million barrels) account for another 40%. The remaining 20% of FSOs is comprised of smaller units.
Approximately 50% of FSOs in service are positioned in Southeast Asia. Around another 15% are in West Africa. The others are spread over the Middle East, India, Northern Europe, Mediterranean, Brazil, and elsewhere.
Large storage capacity and ability to be moored in almost any water depth makes FSOs ideal for areas without pipeline infrastructure and where the production platform has no storage capabilities (fixed platforms, MOPU, Spar, TLP, Semi-submersible platform). FSOs have no or limited process topsides, which make them relatively simple to convert from old tankers, as compared to an FPSO. FSOs can be relocated to other fields and some have also later been converted to FPSOs.
The Key Components of an FSO
Unlike other FPS systems, the hull is the primary component of an FSO. Topsides are normally simple and feature primarily accommodation, helicopter landing facilities, crude metering equipment, and sometimes power generation. However some FSOs, including the FSO Asia and the FSO Africa, which are co-owned by Euronav, have more sophisticated topsides (which are described below).Mooring systems are the same as for an FPSO: spread-mooring or turret-moored (internal and external). In addition, some simple storage units are moored by their own anchor or alongside a jetty. In benign environments, an FSO can be moored to a Catenary Anchor Leg Mooring buoy (soft mooring), where the buoy is fixed to the seabed and attached to the FSO by mooring ropes.
Some FSOs, such as FSO Asia and FSO Africa, include a small part of the production process, particularly water separation/treatment and chemical injection. For example, after initial processing on the platform, the FSO Asia and FSO Africa may provide additional processing of the platform fluids and separate the water from the crude oil. The oil and water are usually heated, accelerating the separation of the two organic compounds. Once separated, oil is transferred to separate storage cargo tanks and then offloaded to export vessels. Water is treated, purified and returned to the underwater source reservoir or directly to the sea.
Trends in FSO orders
30
54 orders for FSOs have been placed over the past fiveten years, an average of 6.05.4 annually. While the majority of FSOs were converted from oil tankers, approximately 25% of these units were purpose-built as FSOs. This is in line with the currently installed fleet profile.
Forecast Summary
EMA is tracking 2531 potential projects in the planning stage that may require an FSO. The number of FSO projects in the planning pipeline is down slightly from last year. In 2013 there were 29 FSO projects visible.relatively steady. FSO projects can typically be developed more quickly than other FPS developments and therefore there are a number of projects to be awarded in the next five years that are not yet visible.
The prospects for the FSO sector remain good,promising, supported by the risingnumber of visible projects in the planning stage, low development costs for offshore fields, and prospects for higher oil price environment and drilling activity.prices. Utilization of jack-up drilling rigs increased dramatically from 40% in the beginning of 2017has begun to over 70% by mid-year, althoughincrease, but rates have remained extremelyare expected to remain low for some time due to competition. In Southeast Asia, the most popular development option is an FSO, in conjunction with a fixed platform or MOPU.
The vast majority of FSO orders will continue to go to Southeast Asian countries including Thailand, Vietnam, Indonesia, and Malaysia, but there has been increased activity in the North SeaAfrica and MediterraneanMexico as well. Two large projects in Mexico, is also a large potential market for FSO solutions, which would be ideal for many shallow water developments.BHP’s Trion and Talos’s Zama, are currently progressing with developments that require FSOs.
From 2018-2022,2021-2025, converted oil tankers will remain the dominant choice for FSOs. Newbuilt units will be used for some projects in the North Seawith high specifications as well as for condensate FSOs on gas fields. We expect between 14-2010-25 conversion and 3-71-4 newbuilding orders over the next five years. In addition, we expect 3-84-6 FSO orders to be filled by redeployed units. Currently there are 2131 idle FPSOs and 64 idle FSOs, withFSOs. More than 20 more potential units coming off contractthat could potentially be redeployed may come available over the next five years.
Between $2.1$1.4 and $4.1$3.5 billion is expected to be spent on FSO orders over the next five years, with the mid-case being $3.1$2.5 billion. Around 60%71% will be spent on conversions, 25%14% on newbuildings, and 15% on redeployments. The purpose-built units will cost in the range of $125$150 to $200$600 million. Converted units will cost an average of around $100 million. Capital cost for redeployed units would depend on the value assigned to the existing asset but should be lowerslightly less than a converted unit. Where the capex falls in this range depends on the hull size, design life and mooring/ offloading system needed.
In the past, the majority of vessels chosen for conversion were between 20 and 25 years old. However, this trend is changing as companies increasingly scrutinize the quality and hull fatigue of the units earmarked as conversion candidates. Some recent FPSO conversion projects have selected newbuilt intercepts or units as young as 5 years old.
FSO conversion work is being carried out mainly in Chinese yards, but some of the more complex FSO projects will be continue tomay be performed in Singapore and Malaysia. Most newbuilt units have been constructed by the Chinese and Korean yards. However, Sembcorp shipyard in Singapore was awarded a contract in 2015 forcompleted a high spec unit destined for the UK’s Culzean field.field in 2018.
Competition
Competition in the FSO market includes tanker owners, specialized FSO/FPSO contractors, and engineering/construction companies in the floating production sector. Tanker owners tend to compete for projects which require less modification and investment. Companies such as Altera Infrastructure (formerly Teekay Offshore Partners L.P.), Knutsen NYK Offshore Tankers AS, Malaysia International Shipping Corporation Berhad, and Omni Offshore Terminals PtePte. Ltd target more complex FSO projects with higher specifications and client requirements. FPSO contractors such as MODEC Inc, SBM Offshore N.V., and BW Offshore Limited had competed in the FSO market in the past, but are now primarily focused on large FPSO projects.
Most clients conduct a detailed pre-qualification screening before accepting proposals. Pre-qualification requirements include: FSO conversion and operation experience, health, safety, environment systems and procedures, access to tanker for conversion, and financial resources.
Contract Structure
As part of the overall offshore field development, most FSOs are leased on long-term (5 to 15 years), fixed rate service contracts (normally structured as either a time charter or a bareboat contract). The FSO is essential to the field production as oil is exported via the FSO.Typically, the FSO contract has a fixed period as well as additional extension periods (at the charterer’s option) depending on the projected life of the development project. The FSO is designed to remain offshore for the duration of the contact, as opposed to conventional tankers, which have scheduled drydocking repairs every 2 to 3 years. Depending on tax treatment and local regulations, some oil companies elect to purchase the FSO rather than lease it, particularly when the unit is expected to remain on site for over 20 years. However, there have been FSO lease contracts for 20 or even 25 years.
Environmental and Other Regulations on Tankers and FSO's
Government lawsregulation and regulationslaws significantly affect the ownership and operation of our vessels.fleet. We are subject to various international conventions and treaties, national, state and local laws and regulations in force in the countries in which our vessels may operate or are registered.registered relating to safety and health and environmental protection including the storage, handling, emission, transportation and discharge of hazardous and non-hazardous materials, and the remediation of contamination and liability for damage to natural resources. Compliance with such laws, regulations and other requirements may entailentails significant expense, including vessel modificationmodifications (where applicable) and implementation costs.of certain operating procedures.
A variety of governmental, quasi-governmentalgovernment and private organizationsentities subject our vessels to both scheduled and unscheduled inspections. These organizationsentities include the local port authorities (applicable national authorities harbor masterssuch as the United States Coast Guard or equivalent entities,USCG, Captain of the Port or equivalent), classification societies, relevant flag state (countryadministrations (countries of registry) and charterers, particularly terminal operators and oil companies. Someoperators. Certain of these entities require us to obtain permits, licenses, certificates and approvalsother authorizations for the operation of our vessels. Our failureFailure to maintain necessary permits licenses, certificates or approvals could require us to incur substantial costs or temporarily suspendresult in the temporary suspension of the operation of one or more of the vessels in our fleet, or lead to the invalidation or reduction of our insurance coverage.vessels.
We believe that the heightened levels of environmental and quality concerns among insurance underwriters, regulators and charterers have led to greater inspection and environmental safety requirements on all vessels and may accelerate the scrapping of older vessels throughout the industry. Increasing environmental concerns have created a demand for tankersvessels that conform to stricter environmental standards. We are required to maintain operating standards for all of our vessels that emphasize operational safety, quality maintenance, continuous training of our officers and crews and compliance with applicable local, nationalUnited States and international environmental laws and regulations. We are confidentbelieve that the operation of our vessels is in full compliance with applicable environmental laws and regulations and that our vessels have all material permits, licenses, certificates or other authorizations necessary for the conduct of our operations; however,operations. However, because such laws and regulations are frequently changedchange and may impose increasingly strictstricter requirements, we cannot predict the ultimate cost of complying with these requirements, or the impact of these requirements on the resale value or useful lives of our vessels. In addition, a future serious marine incident that results in significant oil pollution or otherwise causes significant adverse environmental impact such as the 2010 Deepwater Horizon oil spill in the Gulf of Mexico, could result in additional legislation or regulation that could negatively affect our profitability.
International Maritime Organization
The IMO had adopted the International Maritime Organization, or the IMO, is a specialized agency of the United Nations responsible for setting global standardsConvention for the safety, security and environmental performancePrevention of vessels engaged in international shipping. The IMO primary objective is to create a regulatory frameworkPollution from Ships or “MARPOL”, the International Convention for the shipping industry that is fairSafety of Life at Sea of 1974 or “SOLAS Convention”, and effective, and universally adopted and implemented. The IMO has adopted several international conventions that regulate the international shipping industry, including but not limited to the International Convention on Civil Liability for Oil Pollution DamageLoad Lines of 1969, as amended by different Protocols in 1976, 1984 and 1992, and amended in 2000,1966 or the CLC,“LL Convention”. MARPOL establishes structural and operational environmental standards relating to oil leakage or spilling, garbage management, sewage, air emissions, handling and disposal of noxious liquids and the International Convention on Civil Liability for Bunker Oil Pollution Damagehandling of 2001, or the Bunker Conventionharmful substances in packaged forms. MARPOL is applicable to all tankers, among other vessels, and MARPOL. MARPOL is broken into six Annexes, each of which establishes environmental standards relating toregulates a different sourcessource of pollution:pollution. Annex I relates to the prevention of pollution by oil; Annexes II and III relate to the prevention of pollution by noxious liquidharmful substances carried in bulk and harmful substances carried by seain liquid or in packaged form, respectively; Annexes IV and V relate to sewage and garbage management, respectively; and Annex VI, lastly, relates to prevention of air pollution from ships. Annex VI was separately adopted by the IMO in September of 1997, relates to air pollution by ship1997; new emissions including greenhouse gases.standards, titled IMO-2020, took effect on January 1, 2020.
In 2013, the IMO’s Marine Environmental Protection Committee, or the “MEPC,” adopted a resolution amending MARPOL Annex I Condition Assessment Scheme, or “CAS.”“CAS”. These amendments became effective on October 1, 2014, and require compliance with the 2011 International Code on the Enhanced Programme of Inspections or "2011 ESP Code" during Surveys of Bulk Carriers and Oil Tankers, or “ESP Code”, which provides for enhanced inspection programs. We may need to make certain financial expenditures to comply with these amendments.
Air Emissions
In September of 1997, the IMO adopted Annex VI to MARPOL to address air pollution.pollution from vessels. Effective May 2005, Annex VI sets limits on sulfur oxide and nitrogen oxide emissions from ships whose diesel engines were constructed (or underwent major conversions) on or after January 1, 2000. It alsoall commercial vessel exhausts and prohibits "deliberate emissions"“deliberate emissions” of "ozoneozone depleting substances" defined to include certain (such as halons and chlorofluorocarbons. "Deliberate emissions" are not limitedchlorofluorocarbons), emissions of volatile compounds from cargo tanks, and the shipboard incineration of specific substances. Annex VI also includes a global cap on the sulfur content of fuel oil and allows for special areas to times when the ship is at sea; they can for example include discharges occurring in the course of the ship's repair and maintenance.be established with more stringent controls on sulfur emissions, as explained below. Emissions of "volatile“volatile organic compounds"compounds” from certain tankersvessels, and the shipboard incineration (from incinerators installed after January 1, 2000) of certain substances (such as polychlorinated biphenyls)biphenyls, or PCBs) are also prohibited and the emission of Volatile Organic Compounds is controlled.prohibited. We believe that all our vessels are currently compliant in all material respects with these regulations.
The MEPC adopted amendments to Annex VI also includes a global capregarding emissions of sulfur oxide, nitrogen oxide, particulate matter and ozone depleting substances, which entered into force on the sulfur content of fuel oil (see below).
July 1, 2010. The amended Annex VI willseeks to further reduce air pollution from vessels by, among other things, (i) implementing a progressive reduction of the amount of sulfur contained in any fuel oil used onboard vessels. On October 27, 2016, the MEPC agreed to implement a global 0.5% m/m sulfur oxide emissions limit (reduced from ships. At MEPC 70, it was agreed3.50%) starting from January 1, 2020. This limitation can be met by using low-sulfur compliant fuel oil, alternative fuels, or certain exhaust gas cleaning systems. Vessels are now required to implement the global 0.5% sulphur limit from 1 January 2020. At MEPC 71, to implement the global 0.5% sulphur limit, additional measures to promote an appropriate implementation of the global limit were considered. It was agreed that the consideration on this matter will be made at Sub-Committee onobtain bunker delivery notes and International Air Pollution Prevention and Response (PPR), and the completion of this work item should be in 2019. By 2020 ships will now have to either remove sulfuror “IAPP” Certificates from emissions through the use of emission scrubbers or buy fuel with lowtheir flag states that specify sulfur content. AmendedAdditionally, at MEPC 73, amendments to Annex VI also establishes new tiersto prohibit the carriage of bunkers above 0.5% sulfur on vessels were adopted and took effect March 1, 2020. These regulations subject ocean-going vessels to stringent nitrogen oxide emissions standards for new marine engines, depending on their date of installation. At MEPC 70 & 71, MEPC approved the North Seacontrols, and Baltic Sea as ECAs for nitrogen oxides, effective January 1, 2021. It is expected that these areas will be formally designated after draft amendments are presented at MEPC's next session. The U.S. ratified the Annex VI amendments in October 2008, and the U.S. Environmental Protection Agency, or EPA, promulgated equivalent emissions standards in late 2009.may cause us to incur substantial costs.
Sulfur content standards are even stricter within certain “Emission Control Areas,” or ECAs. As of January 1, 2015, shipsvessels operating within an ECA were not permitted to use fuel with sulfur content in excess of 0.10%.0.1% m/m. Amended Annex VI establishes procedures for designating new ECAs. Currently, the IMO has designated four ECAs, andincluding specified portions of the Baltic Sea thearea, North Sea certain coastal areas ofarea, North America,American area and the U.S.United States Caribbean Sea are all within designated ECAs where the 0.10% fuel sulfur content applies.area. In addition, several Chinese ports have established a similar system. Ocean-going vessels in these areas will be subject to stringent emissionsemission controls and may cause us to incur additional losses. Amendmentscosts. Other areas in China are subject to Annex VI imposedlocal regulations that impose stricter nitrogen oxide standards on marine diesel engines installed on ships built on or after January 1, 2016 which operate in North American and U.S. Caribbean ECAs. The EPA promulgated equivalent (and in some senses stricter) emissions standards in late 2009. As a result of these designations or similar future designations, we may be required to incur additional operating or other costs.
As determined at the MEPC 70 as well as MEPC71, the new Regulation 22A of MARPOL Annex VI is effective as of March 1, 2018 and requires ships above 5,000 gross tonnage to collect and report annual data on fuel oil consumption to an IMO database, with the first year of data collection commencing on January 1, 2019.
As of January 1, 2013, MARPOL made mandatory certain measures relating to energy efficiency for ships. All ships are now required to develop and implement Ship Energy Efficiency Management Plans (“SEEMP”), and new ships must be designed in compliance with minimum energy efficiency levels per capacity mile as defined by the Energy Efficiency Design Index. Under these measures, by 2025, all new ships built will be 30% more energy efficient than those built in 2014.
emission controls. If other ECAs are approved by the IMO, or other new or more stringent requirements relating to emissions from marine diesel engines or port operations by vessels are adopted by the EPAU.S. Environmental Protection Agency “EPA”, or the states where we operate, compliance with these regulations could entail significant capital expenditures or otherwise increase the costs of our operations.
Amended Annex VI also establishes new tiers of stringent nitrogen oxide emissions standards for marine diesel engines, depending on their date of installation. At the MEPC meeting held from March to April 2014, amendments to Annex VI were adopted which address the date on which Tier III Nitrogen Oxide (NOx) standards in ECAs will go into effect. Under the amendments, Tier III NOx standards apply to vessels that operate in the North American and U.S. Caribbean Sea ECAs designed for the control of NOx produced by vessels with a marine diesel engine installed and constructed on or after January 1, 2016. Tier III requirements could apply to areas that will be designated for Tier III NOx in the future. At MEPC 70 and MEPC 71, the MEPC approved the North Sea and Baltic Sea as ECAs for nitrogen oxide for vessels built on or after January 1, 2021. The EPA promulgated equivalent (and in some senses stricter) emissions standards in 2010. As a result of these designations or similar future designations, we may be required to incur additional operating or other costs.
As determined at the MEPC 70, the new Regulation 22A of MARPOL Annex VI became effective as of March 1, 2018 and requires vessels above 5,000 gross tonnage to collect and report annual data on fuel oil consumption to an IMO database, with the first year of data collection commencing on January 1, 2019. The IMO intends to use such data as the first step in its roadmap (through 2023) for developing its strategy to reduce greenhouse gas emissions from vessels, as discussed further below.
As of the date of this annual report, weJanuary 1, 2013, MARPOL made mandatory certain measures relating to energy efficiency for vessels. All vessels are now required to develop and implement Ship Energy Efficiency Management Plans (“SEEMP”), and new vessels must be designed in compliance with applicable requirements underminimum energy efficiency levels per capacity mile as defined by the Energy Efficiency Design Index or “EEDI”. Under these measures, by 2025, all new vessels built will be 30% more energy efficient than those built in 2014. Additionally, MEPC 75 adopted amendments to MARPOL Annex VI which brings forward the effective date of the EEDI’s “phase 3” requirements from January 1, 2025 to April 1, 2022 for several ship types, including gas carriers, general cargo ships, and LNG carriers.
Additionally, MEPC 75 introduced draft amendments to Annex VI which impose new regulations to reduce greenhouse gas emissions from ships. These amendments introduce requirements to assess and measure the energy efficiency of all ships and set the required attainment values, with the goal of reducing the carbon intensity of international shipping. The requirements include (1) a technical requirement to reduce carbon intensity based on a new Energy Efficiency Existing Ship Index (“EEXI”), and (2) operational carbon intensity reduction requirements, based on a new operational carbon intensity indicator (“CII”). The attained EEXI is required to be calculated for ships of 400 gross tonnage and above, in accordance with different values set for ship types and categories. With respect to the CII, the draft amendments would require ships of 5,000 gross tonnage to document and verify their actual annual operational CII achieved against a determined required annual operational CII. Additionally, MEPC 75 proposed draft amendments requiring that, on or before January 1, 2023, all ships above 400 gross tonnage must have an approved SEEMP on board. For ships above 5,000 gross tonnage, the SEEMP would need to include certain mandatory content. MEPC 75 also approved draft amendments to MARPOL Annex I to prohibit the use and carriage for use as amended.fuel of heavy fuel oil (“HFO”) by ships in Arctic waters on and after July 1, 2024. The draft amendments introduced at MEPC 75 may be adopted at the MEPC 76 session, to be held during 2021.
We may incur costs to comply with these revised standards. Additional or new conventions, laws and regulations may be adopted that could require the installation of expensive emission control systems and could adversely affect our business, results of operations, cash flows and financial condition.
Safety Management System Requirements
The SOLAS Convention amongst others addressaddresses issues related to the safe manning of vessels and emergency preparedness, training and drills. The Convention of Limitation of Liability for Maritime Claims (theor the “LLMC”) sets limitations of liability for a loss of life or personal injury claim or a property claim against shipvessel owners. We are confidentbelieve that all of our vessels are in full compliance with SOLAS and LL ConventionLLMC standards.
Under Chapter IX of the SOLAS Convention, introducesor the International Safety Management Code for the Safe Operation of Ships and for Pollution Prevention (theor the “ISM Code”). Our, our operations are also subject to environmental standards and requirements (i.e. ISO 14001, EPA, OPA 90, EU Directives).requirements. The ISM Code requires the party with operational control of a vessel to develop an extensive safety management system that includes, among other things, the adoption of a safety and environmental protection policy setting forth instructions and procedures for operating its vessels safely and describing procedures for responding to emergencies. We rely upon the safety management system that we and our technical management team have developed for compliance with the ISM Code.
The failure of a vessel owner or bareboat charterer to comply with the ISM Code may subject such party to increased liability, may decrease available insurance coverage for the affected vessels and may result in a denial of access to, or detention in, certain ports.
The ISM Code requires that vessel operators obtain a safety management certificate or "SMC:" for each vessel they operate. This certificate evidences compliance by a vessel’s management with the ISM Code requirements for a safety management system. No vessel can obtain a safety management certificate unless its manager has been awarded a document of compliance or "DOC", issued by, or on behalf of, each flag state, under the ISM Code. We have obtained applicable documents of compliance for our ship management offices and safety management certificates for all of our vessels for which the certificates are required by the IMO. The document of compliance and safety management certificate are renewed as required.
Chapter II-1Regulation II-1/3-10 of the SOLAS Convention governs shipvessel construction and stipulates that shipsvessels over 150 meters in length must have adequate strength, integrity and stability to minimize risk of loss or pollution. Goal-based standards amendments in SOLAS regulation II-1/3-10 Goal-based ship construction standards as amended,entered into force in 2012, with July 1, 2016 set for application to new oil tankers, among other vessels. The SOLAS Convention regulation II-1/3-10 on goal-based vessel construction standards for oil tankers, among other vessels, which entered into force on January 1, 2012, requires that all oil tankers, among other vessels, of 150 meters in length and bulk carriers., in order toabove, for which the building contract is placed on or after July 1, 2016, satisfy applicable structural requirements.requirements conforming to the functional requirements of the International Goal-based Ship Construction Standards for Bulk Carriers and Oil Tankers (GBS Standards).
Amendments to the SOLAS Convention Chapter VII apply to vessels transporting dangerous goods and require those vessels be in compliance with the International Maritime Dangerous Goods Code (“IMDGor “IMDG Code”). LatestEffective January 1, 2018, the IMDG Code includes (1) updates to the provisions for radioactive material, reflecting the latest provisions from the International Atomic Energy Agency, (2) new marking, packing and classification requirements for dangerous goods, and (3) new mandatory training requirements. Amendments which took effect on January 1, 2020 also reflect the latest material from the UN Recommendations on the Transport of Dangerous Goods, including (1) new provisions regarding IMO type 9 tank, (2) new abbreviations for segregation groups, and (3) special provisions for carriage of lithium batteries and of vehicles powered by flammable liquid or gas.
The IMO has also adopted the International Convention on Standards of Training, Certification and Watchkeeping for Seafarers (“STCW”)or “STCW”. AllAs of February 2017, all seafarers are required to meet the STCW standards and be in possession of a valid STCW certificate. Flag states that have ratified SOLAS and STCW generally employ the classification societies, which have incorporated SOLAS and STCW requirements into their class rules, to undertake surveys to confirm compliance.
The IMO's Maritime Labour Convention, 2006 (MLC, 2006),Safety Committee and MEPC, respectively, each adopted relevant parts of the International Code for Ships Operating in Polar Water (the “Polar Code”). The Polar Code, which entered into force on January 1, 2017, covers design, construction, equipment, operational, training, search and rescue as well as environmental protection matters relevant to ships operating in the waters surrounding the two poles. It also includes mandatory measures regarding safety and pollution prevention as well as recommendatory provisions. The Polar Code applies to new ships constructed after January 1, 2017, and after January 1, 2018, ships constructed before January 1, 2017 are required to meet the relevant requirements by the International Labour Organization, isearlier of their first intermediate or renewal survey.
Furthermore, recent action by the fourth pillar ofIMO’s Maritime Safety Committee and United States agencies indicates that cybersecurity regulations for the international maritime regulatory regime. It both fills a gapindustry are likely to be further developed in the 1982 United Nations Convention on the Lawnear future in an attempt to combat cybersecurity threats. For example, cyber-risk management systems are required to be incorporated by vessel-owners and managers by 2021. This may cause companies to create additional procedures for monitoring cybersecurity, which could require additional expenses and/or capital expenditures. The impact of the Sea and complements the International Maritime Organization’s core conventions. The MLC has two pripary purposes: (1)such regulations is hard to bring the system of protection contained in existing labour standards closer to the workers concerned, in a form consistent with the rapidly developing, globalized sector (ensuring “decent work), and (2) to improve the applicability of the system so that shipowners and governments interested in providing decent conditions of work do not have to bear an unequal burden in ensuring protection (“level-plying field” - fair competition).
MLC often called the “fourth pillar” of International maritime regulatory regime, because it stands besides the key IMO Conventions (SOLAS, MARPOL & STCW) that support quality shipping and held to eliminate substandard shipping. The MLC requires that vessel operators obtain an MLC Compliance certificate for each vessel they operate. We are confident that all of our vessels are in full compliance with MLC Convention.
predict at this time.
Pollution Control and Liability Requirements
The IMO has negotiated international conventions that impose liability for pollution in international waters and the territorial waters of the signatories to such conventions. For example, the IMO adopted an International Convention for the Control and Management of Ships’ Ballast Water and Sediments (theor the “BWM Convention”) in 2004. The BWM Convention entered into force on September 9,8, 2017. The BWM Convention requires shipsvessels to manage their ballast water to remove, render harmless, or avoid the uptake or discharge of new or invasive aquatic organisms and pathogens within ballast water and sediments. The BWM Convention’s implementing regulations call for a phased introduction of mandatory ballast water exchange requirements, to be replaced in time with mandatory concentration limits, and require all shipsvessels to carry a ballast water record book and an international ballast Waterwater management certificate.
On December 4, 2013, the IMO Assembly passed a resolution revising the application dates of BWM Convention so that the dates are triggered by the entry into force date and not the dates originally in the BWM Convention. This, in effect, makes all vessels delivered before the entry into force date “existing vessels” and allows for the installation of ballast water management systems on such vessels at the first International Oil Pollution Prevention (IOPP)(or “IOPP”) renewal survey following entry into force of the convention. The MEPC adopted updated guidelines for approval of ballast water management systems (G8) at MEPC 70. At MEPC 71, the schedule regarding the BWM Convention’s implementation dates was also discussed and amendments were introduced to extend the date existing vessels are subject to certain ballast water standards. ShipsThose changes were adopted at MEPC 72. Vessels over 400 gross tons generally must comply with a “D-1 standard,” requiring the exchange of ballast water only in open seas and away from coastal waters. The “D-2 standard” specifies the maximum amount of viable organisms allowed to be discharged, and compliance dates vary depending on the IOPP renewal dates. Depending on the date of the IOPP renewal survey, existing vesselsships constructed before September 8, 2017 must comply with the D2D-2 standard on or after September 8, 2019. Ships constructed on or after September 8, 2017 are to comply with the D-2 standards on or after September 8, 2017. For most ships,vessels, compliance with the D2D-2 standard will involve installing on-board systems to treat ballast water and eliminate unwanted organisms. CostsWe currently have 38 vessels that do not comply with the updated guideline and costs of compliance may be substantial and adversely affect our revenues and profitability.
Ballast water management systems, which include systems that make use of chemical, biocides, organisms or biological mechanisms, or which alter the chemical or physical characteristics of the ballast water, must be approved in accordance with IMO Guidelines (Regulation D-3). As of October 13, 2019, MEPC 72’s amendments to the BWM Convention took effect, making the Code for Approval of Ballast Water Management Systems, which governs assessment of ballast water management systems, mandatory rather than permissive, and formalized an implementation schedule for the D-2 standard. Under these amendments, all ships must meet the D-2 standard by September 8, 2024. Costs of compliance with these regulations may be substantial. Additionally, in November 2020, MEPC 75 adopted amendments to the BWM Convention which would require a commissioning test of the ballast water management system for the initial survey or when performing an additional survey for retrofits. This analysis will not apply to ships that already have an installed BWM system certified under the BWM Convention. These amendments are expected to enter into force on June 1, 2022
Once mid-ocean ballast exchange ballast water treatment requirements become mandatory under the BWM Convention, the cost of compliance could increase for ocean carriers and may be material.have a material effect on our operations. However, many countries already regulate the discharge of ballast water carried by vessels from country to country to prevent the introduction of invasive and harmful species via such discharges. The U.S., for example, requires vessels entering its waters from another country to conduct mid-ocean ballast exchange, or undertake some alternate measure, and to comply with certain reporting requirements. The costs of compliance with a mandatory mid-ocean ballast exchange could be material, and it is difficult to predict the overall impact of such a requirement on our operations.
The IMO adopted the International Convention on Civil Liability for Oil Pollution Damage of 1969, as amended by different Protocols in 1976, 1984, and 1992, and amended in 2000 (“theor “the CLC”). Under the CLC and depending on whether the country in which the damage results is a party to the 1992 Protocol to the CLC, a vessel’s registered owner may be strictly liable for pollution damage caused in the territorial waters of a contracting state by discharge of persistent oil, subject to certain exceptions. The 1992 Protocol changed certain limits on liability expressed using the International Monetary Fund currency unit, the Special Drawing Rights. The limits on liability have since been amended so that the compensation limits on liability were raised. The right to limit liability is forfeited under the CLC where the spill is caused by the shipowner’svessel owner’s actual fault and under the 1992 Protocol where the spill is caused by the shipowner’svessel owner’s intentional or reckless act or omission where the shipownervessel owner knew pollution damage would probably result. The CLC requires shipsvessels over 2,000 tons covered by it to maintain insurance covering the liability of the owner in a sum equivalent to an owner’s liability for a single incident. We have protection and indemnity insurance for environmental incidents. P&I Clubs in the International Group issue the required Bunkers Convention “Blue Cards” to enable signatory states to issue certificates. All of our vessels are in possession of a CLC State issued certificate attesting that the required insurance coverage is in force.
The IMO also adopted the International Convention on Civil Liability for Bunker Oil Pollution Damage or the “Bunker Convention” to impose strict liability on vessel owners (including the registered owner, bareboat charterer, manager or operator) for pollution damage in jurisdictional waters of ratifying states caused by discharges of bunker fuel. The Bunker Convention requires registered owners of vessels over 1,000 gross tons to maintain insurance for pollution damage in an amount equal to the limits of liability under the applicable national or international limitation regime (but not exceeding the amount calculated in accordance with the LLMC). With respect to non-ratifying states, liability for spills or releases of oil carried as fuel in vessel’s bunkers typically is determined by the national or other domestic laws in the jurisdiction where the events or damages occur.
Vessels are required to maintain a certificate attesting that they maintain adequate insurance to cover an incident. In jurisdictions, such as the United States where the CLC or the Bunker Convention has not been adopted, various legislative schemes or common law govern, and liability is imposed either on the basis of fault or on a strict-liability basis.
Anti‑Fouling Requirements
In 2001, the IMO adopted the International Convention on the Control of Harmful Anti‑fouling Systems on Ships, or the “Anti‑fouling Convention.” The Anti‑fouling Convention, which entered into force on September 17, 2008, prohibits the use of organotin compound coatings to prevent the attachment of mollusks and other sea life to the hulls of vessels. Vessels of over 400 gross tons engaged in international voyages are required to undergo an initial survey before the vessel is put into service or before an International Anti‑fouling System Certificate is issued for the first time; and subsequent surveys when the anti‑fouling systems are altered or replaced. We have obtained Antifouling System Certificates for all of our vessels that are subject to the Antifouling Convention.
In November 2020, MEPC 75 approved draft amendments to the Anti-fouling Convention to prohibit antifouling systems containing cybutryne, which would apply to ships from January 1, 2023, or, for ships already bearing such an anti-fouling system, at the next scheduled renewal of the system after that date, but no later than 60 months following the last application to the ship of such a system. These amendments may be formally adopted at MEPC 76 in 2021.
We have obtained Anti-fouling System Certificates for all of our vessels that are subject to the Anti-fouling Convention.
Compliance Enforcement
Noncompliance with the ISM Code or other IMO regulations may subject the vessel owner or bareboat charterer to increased liability, may lead to decreases in available insurance coverage for affected vessels and may result in the denial of access to, or detention in, some ports. The USCG and European Union authorities have indicated that vessels not in compliance with the ISM Code by applicable deadlines will be prohibited from trading in U.S. and European Union ports, respectively. As of the date of this report, each of our vessels is ISM Code certified. However, there can be no assurance that such certificates will be maintained in the future. The IMO continues to review and introduce new regulations. It is impossible to predict what additional regulations, if any, may be passed by the IMO and what effect, if any, such regulations mightmay have on our operations.
United States Regulations
The U.S. Oil Pollution Act of 1990 and the Comprehensive Environmental Response, Compensation and Liability Act
The U.S. Oil Pollution Act of 1990 or OPA, establishes“OPA” established an extensive regulatory and liability regime for the protection and cleanup of the environment from oil spills. OPA affects all "owners“owners and operators"operators” whose vessels trade inor operate within the U.S., its territories and possessions or whose vessels operate in U.S. waters, which includes the U.S.’s territorial sea and its 200 nautical mile exclusive economic zone.zone around the U.S. The U.S. has also enacted CERCLA,the Comprehensive Environmental Response, Compensation and Liability Act or “CERCLA”, which applies to the discharge of hazardous substances (including certain forms of oil)other than oil, except in limited circumstances, whether on land or at sea. OPA and CERCLA both define "owner“owner and operator"operator” in the case of a vessel as any person owning, operating or chartering by demise, the vessel. Accordingly, bothBoth OPA and CERCLA impact our operations.
Under OPA, vessel owners and operators are "responsible parties"“responsible parties” and are jointly, severally and strictly liable (unless the spill results solely from the act or omission of a third-party,third party, an act of God or an act of war) for all containment and clean-up costs and other damages arising from discharges or threatened discharges of oil from their vessels.vessels, including bunkers (fuel). OPA defines these other damages broadly to include:
(i) injury to, destruction or loss of, or loss of use of, natural resources and related assessment costs;
(ii) injury to, or economic losses resulting from, the destruction of real and personal property;
(iii) loss of subsistence use of natural resources that are injured, destroyed or lost;
(iv) net loss of taxes, royalties, rents, fees or net profit revenues resulting from injury, destruction or loss of real or personal property, or natural resources;
loss of subsistence use of natural resources that are injured, destroyed or lost;
(v) lost profits or impairment of earning capacity due to injury, destruction or loss of real or personal property or natural resources; and
(vi) net cost of increased or additional public services necessitated by removal activities following a discharge of oil, such as protection from fire, safety or health hazards, and loss of subsistence use of natural resources.
OPA contains statutory caps on liability and damages; such caps do not apply to direct cleanup costs. Effective December 21, 2015,November 12, 2019, the USCG adjusted the limits of OPA liability for tankers, other than a single-hull tanker, over 3,000 gross tons liability to the greater of $2,200$2,300 per gross ton or $18,796,800$19,943,400 (subject to periodic adjustment for inflation), for tank vessels greater than 3,000 gross tons other than a single hull tank vessel, such as double hull tankers and our fleet is entirely composed of vessels of this size class.. These limits of liability do not apply if an incident was proximately caused by the violation of an applicable U.S. federal safety, construction or operating regulation by a responsible party (or its agent, employee or a person acting pursuant to a contractual relationship), or a responsible party's gross negligence or willful misconduct. The limitation on liability similarly does not apply if the responsible party fails or refuses to (i) report the incident as required by law where the responsibilityresponsible party knows or has reason to know of the incident; (ii) reasonably cooperate and assist as requested in connection with oil removal activities; or (iii) without sufficient cause, comply with an order issued under the Federal Water Pollution Act (Section 311 (c), (e)) or the Intervention on the High Seas Act.
OPA permits individual states to impose their own liability regimes with regard to oil pollution incidents occurring within their boundaries, provided they accept, at a minimum, the levels of liability established under OPA. Some states have enacted legislation providing for unlimited liability for discharge of pollutants within their waters, however, in some cases, states which have enacted this type of legislation have not yet issued implementing regulations defining tanker owners' responsibilities under these laws.
The 2010 Deepwater Horizon oil spill in the Gulf of Mexico may also result in additional regulatory initiatives or statutes, including the raising of liability caps under OPA. For example, effective October 22, 2012, the U.S. Bureau of Safety and Environment Enforcement, or the BSEE, implemented a final drilling safety rule for offshore oil and gas operations that strengthens the requirements for safety equipment, well control systems, and blowout prevention practices. In December 2015, the BSEE announced a new pilot inspection program for offshore facilities. On February 24, 2014, the U.S. Bureau of Ocean Energy Management, or the BOEM, proposed a rule increasing the limits of liability of damages for offshore facilities under the OPA based on inflation. Furthermore, in April 2015, it was announced that new regulations are expected to be imposed in the U.S. regarding offshore oil and gas drilling and the BSEE announced a new Well Control Rule in April 2016. Compliance with any new requirements of OPA may substantially impact our cost of operations or require us to incur additional expenses to comply with any new regulatory initiatives or statutes.
CERCLA which applies to owners and operators of vessels, contains a similar liability regime whereby owners and operators of vessels are liable for cleanup, removal and remedial costs, as well as damagedamages for injury to, or destruction or loss of, natural resources, including the reasonable costs associated with assessing the same, and health assessments or health effects studies. There is no liability if the discharge of a hazardous substance results solely from the act or omission of a third-party,third party, an act of God or an act of war. Liability under CERCLA is limited to the greater of $300 per gross ton or $5$5.0 million for vessels carrying a hazardous substance as cargo and the greater of $300 per gross ton or $500,000 for any other vessel. These limits do not apply (rendering the responsible person liable for the total cost of response and damages) if the release or threat of release of a hazardous substance resulted from willful misconduct or negligence, or the primary cause of the release was a violation of applicable safety, construction or operating standards or regulations. The limitation on liability also does not apply if the responsible person fails or refusesrefused to provide all reasonable cooperation and assistance as requested in connection with response activities where the vessel is subject to OPA.
OPA and CERCLA each preserve the right to recover damages under existing law, including maritime tort law.
OPA and CERCLA both require owners and operators of vessels to establish and maintain with the USCG evidence of financial responsibility sufficient to meet the maximum amount of liability to which the particular responsible person may be subject. Vessel owners and operators may satisfy their financial responsibility obligations by providing a proof of insurance, a surety bond, qualification as a self-insurer or a guarantee. We have provided such evidencecomply and receivedplan to comply going forward with the USCG’s financial responsibility regulations by providing applicable certificates of financial responsibility fromresponsibility.
The 2010 Deepwater Horizon oil spill in the USCG'sGulf of Mexico resulted in additional regulatory initiatives or statutes, including higher liability caps under OPA, new regulations regarding offshore oil and gas drilling and a pilot inspection program for eachoffshore facilities. However, several of these initiatives and regulations have been or may be revised. For example, the U.S. Bureau of Safety and Environmental Enforcement’s (“BSEE”) revised Production Safety Systems Rule (“PSSR”), effective December 27, 2018, modified and relaxed certain environmental and safety protections under the 2016 PSSR. Additionally, the BSEE amended the Well Control Rule, effective July 15, 2019, which rolled back certain reforms regarding the safety of drilling operations, and the former U.S. President Trump had proposed leasing new sections of U.S. waters to oil and gas companies for offshore drilling. The effects of these proposals and changes are currently unknown, and recently, current U.S. President Biden signed an executive order temporarily blocking new leases for oil and gas drilling in federal waters. Compliance with any new requirements of OPA and future legislation or regulations applicable to the operation of our vessels as requiredcould impact the cost of our operations and adversely affect our business.
OPA specifically permits individual states to impose their own liability regimes with regard to oil pollution incidents occurring within their boundaries, provided they accept, at a minimum, the levels of liability established under OPA and some states have one.enacted legislation providing for unlimited liability for oil spills. Many U.S. states that border a navigable waterway have enacted environmental pollution laws that impose strict liability on a person for removal costs and damages resulting from a discharge of oil or a release of a hazardous substance. These laws may be more stringent than U.S. federal law. Moreover, some states have enacted legislation providing for unlimited liability for discharge of pollutants within their waters, although in some cases, states which have enacted this type of legislation have not yet issued implementing regulations defining vessel owners’ responsibilities under these laws. The Company intends to comply with all applicable state regulations in the ports where the Company’s vessels call.
Through our P&I Club membership with Gard, West of England and Brittania, weWe currently maintain pollution liability coverage insurance in the amount of $1 billion per incident for each of our vessels. If the damages from a catastrophic spill were to exceed our insurance coverage, it could have a materialan adverse effect on our business financial condition,and results of operation.
Other United States Environmental Initiatives
The U.S. Clean Air Act of 1970 (including its amendments of 1977 and 1990) or “CAA” requires the EPA to promulgate standards applicable to emissions of volatile organic compounds and other air contaminants. Our vessels are subject to vapor control and recovery requirements for certain cargoes when loading, unloading, ballasting, cleaning and conducting other operations in regulated port areas. The CAA also requires states to draft State Implementation Plans, or SIPs, designed to attain national health-based air quality standards in each state. Although state-specific, SIPs may include regulations concerning emissions resulting from vessel loading and cash flows.unloading operations by requiring the installation of vapor control equipment. Our vessels operating in such regulated port areas with restricted cargoes are equipped with vapor recovery systems that satisfy these existing requirements.
The U.S. Clean Water Act or the CWA,“CWA” prohibits the discharge of oil, hazardous substances and ballast water in U.S. navigable waters unless authorized by a duly-issued permit or exemption, and imposes strict liability in the form of penalties for any unauthorized discharges. The CWA also imposes substantial liability for the costs of removal, remediation and damages and complements the remedies available under OPA and CERCLA. Furthermore, manyIn 2015, the EPA expanded the definition of “waters of the United States” or “WOTUS”, thereby expanding federal authority under the CWA. Following litigation on the revised WOTUS rule, in December 2018, the EPA and Department of the Army proposed a revised, limited definition of “waters of the United States.” The proposed rule was published in the Federal Register on February 14, 2019 and was subject to public comment. On October 22, 2019, the agencies published a final rule repealing the 2015 Rule defining “waters of the United States” and recodified the regulatory text that existed prior to the 2015 Rule. The final rule became effective on December 23, 2019. On January 23, 2020, the EPA published the “Navigable Waters Protection Rule,” which replaces the rule published on October 22, 2019, and redefines “waters of the United States.” This rule became effective on June 22, 2020, although the effective date has been stayed in at least one U.S. states that border a navigable waterway have enacted environmental pollution laws that impose strict liability on a person for removal costs and damages resulting from a dischargestate pursuant to court order.The effect of oil or a release of a hazardous substance. These laws may be more stringent than U.S. federal law.this rule is currently unknown.
The EPA and the USCG have also enacted rules relating to ballast water discharge, compliance with which requires the installation of equipment on our vessels to treat ballast water before it is discharged or the implementation of other port facility disposal arrangements or procedures at potentially substantial costs, and/or otherwise restrict our vessels from entering U.S. Waters. The EPA requires a permit regulatingwill regulate these ballast water discharges and other discharges incidental to the normal operation of certain vessels within United States waters under the Vessel General Permit for Discharges Incidentalpursuant to the Normal Operation of Vessels (the “VGP”). On March 28, 2013, the EPA re-issuedVIDA, which was signed into law on December 4, 2018 and replaces the VGP for another five years from the effective date of December 19, 2013. The 2013 VGP focuses on authorizingprogram (which authorizes discharges incidental to operations of commercial vessels and contains numeric ballast water discharge limits for most vessels to reduce the risk of invasive species in U.S. waters, stringent requirements for exhaust gas scrubbers, and requirements for the use of environmentally acceptable lubricants. For a new vessel delivered to an owner or operator after December 19, 2013 to be covered by the VGP, the owner must submit a Notice of Intent (“NOI”) at least 30 days (or 7 days for eNOIs) before the vessel operates in United States waters. We have submitted NOIs for our vessels where required.
The USCGlubricants) and current Coast Guard ballast water management regulations adopted under the U.S. National Invasive Species Act (“NISA”) impose mandatory, such as mid-ocean ballast water management practicesexchange programs and installation of approved USCG technology for all vessels equipped with ballast water tanks bound for U.S. ports or entering U.S. waters. VIDA establishes a new framework for the regulation of vessel incidental discharges under Clean Water Act (CWA), requires the EPA to develop performance standards for those discharges within two years of enactment, and requires the U.S. Coast Guard to develop implementation, compliance and enforcement regulations within two years of EPA’s promulgation of standards. Under VIDA, all provisions of the 2013 VGP and USCG regulations regarding ballast water treatment remain in force and effect until the EPA and U.S. Coast Guard regulations are finalized. Non-military, non-recreational vessels greater than 79 feet in length must continue to comply with the requirements of the VGP, including submission of a Notice of Intent (“NOI”) or operating inretention of a PARI form and submission of annual reports. We have submitted NOIs for our vessels where required. Compliance with the EPA, U.S. waters, whichCoast Guard and state regulations could require the installation of certain engineering equipment andballast water treatment systems to treat ballast water before it is dischargedequipment on our vessels or the implementation of other port facility disposal arrangements or procedures, and/or may otherwise restrict our vessels from entering U.S. waters. The USCG has implemented revised regulations on ballast water management by establishing standards on the allowable concentration of living organisms in ballast water discharged from ships in U.S. waters. As of January 1, 2014, vessels were technically subject to the phasing-in of these standards, and the USCG must approve any technology before it is placed on a vessel. The USCG first approved said technology in December 2016, and continues to review ballast water management systems. The USCG may also provide waivers to vessels that demonstrate why they cannot install the new technology. The USCG has set up requirements for ships constructed before December 1, 2013 with ballast tanks trading with exclusive economic zones of the U.S. to install water ballast treatment systems as follows: (1) ballast capacity 1,500-5,000m3-first scheduled drydock after January 1, 2014; and (2) ballast capacity above 5,000m3-first scheduled drydock after January 1, 2016. All of our vessels have ballast capacities over 5,000m3, and those of our vessels trading in the U.S. will have to install water ballast treatment plants at their first drydock after January 1, 2016, unless an extension is granted by the USCG.
The EPA, on the other hand, has taken a different approach to enforcing ballast discharge standards under the VGP. On December 27, 2013, the EPA issued an enforcement response policy in connection with the new VGP in which the EPA indicated that it would take into account the reasons why vessels do not have the requisite technology installed, but will not grant any waivers. In addition, through the CWA certification provisions that allow U.S. states to place additional conditions on the use of the VGP within state waters, a number of states have proposed or implemented a variety of stricter ballast requirements including, in some states, specific treatment standards. Compliance with the EPA, USCG and state regulations could require the installation of equipment on our vessels to treat ballast water before it is discharged or the implementation of other port facility disposal arrangements or procedures at potentially substantial cost, or may otherwise restrict our vessels from entering U.S. waters.
Two recent United States court decisions should be noted. First, in October 2015, the Second Circuit Court of Appeals issued a ruling that directed the EPA to redraft the sections of the 2013 VGP that address ballast water. However, the Second Circuit stated that 2013 VGP will remains in effect until the EPA issues a new VGP. The effect of such redrafting remains unknown. Second, on October 9, 2015, the Sixth Circuit Court of Appeals stayed the Waters of the United States rule (WOTUS), which aimed to expand the regulatory definition of “waters of the United States,” pending further action of the court. In response, regulations have continued to be implemented as they were prior to the stay on a case-by-case basis. In February 2017, the U.S. President issued an executive order directing the EPA and U.S. Army Corps of Engineers to publish a proposed rule rescinding or revising the WOTUS rule. In January 2018, the EPA and Army Corps of Engineers issued a final rule pursuant to the President’s order, under which the Agencies will interpret the term “waters of the United States” to mean waters covered by the regulations, as they are currently being implemented, within the context of the Supreme Court decisions and agency guidance documents, until February 6, 2020. Litigation regarding the status of the WOTUS rule is currently underway, and the effect of future actions in these cases upon our operations is unknown.
The U.S. Clean Air Act, or the CAA, requires the EPA to promulgate standards applicable to emissions of volatile organic compounds and other air contaminants. Vessels are subject to vapor control and recovery requirements for certain cargoes when loading, unloading, ballasting, cleaning and conducting other operations in regulated port areas. The CAA also requires states to draft State Implementation Plans, or SIPs, designed to attain national health-based air quality standards in each state. SIPs may include regulations concerning emissions resulting from vessel loading and unloading operations by requiring the installation of vapor control equipment.
European Union Regulations
In October 2009, the E.U.European Union amended a directive to impose criminal sanctions for illicit ship-sourcevessel-source discharges of polluting substances, including minor discharges, if committed with intent, recklessly or with serious negligence and the discharges individually or in the aggregate result in deterioration of the quality of water. Aiding and abetting the discharge of a polluting substance may also lead to criminal penalties. Member States were requiredThe directive applies to enact lawsall types of vessels, irrespective of their flag, but certain exceptions apply to warships or regulations to comply withwhere human safety or that of the directive by the end of 2010.vessel is in danger. Criminal liability for pollution may result in substantial penalties or fines and increased civil liability claims. Regulation (EU) 2015/757 of the European Parliament and of the Council of 29 April 2015 (amending EU Directive 2009/16/EC) governs the monitoring, reporting and verification of carbon dioxide emissions from maritime transport, and, subject to some exclusions, requires companies with vessels over 5,000 gross tonnage to monitor and report carbon dioxide emissions annually, which may cause us to incur additional expenses.
The E.U.European Union has adopted several regulations and directives requiring, among other things, more frequent inspections of high-risk ships,vessels, as determined by type, age, and flag as well as the number of times the shipvessel has been detained. The E.U.European Union also adopted and then extended a ban on substandard shipsvessels and enacted a minimum ban period and a definitive ban for repeated offenses. The regulation also provided the E.U.European Union with greater authority and control over classification societies, by imposing more requirements on classification societies and providing for fines or penalty payments for organizations that failed to comply. Furthermore, the EU has implemented regulations requiring vessels to use reduced sulfur content fuel for their main and auxiliary engines. The EU Directive 2005/33/EC (amending Directive 1999/32/EC) introduced requirements parallel to those in MARPOL Annex VI relating to the sulfur content of marine fuels. In addition, the EU imposed a 0.1% maximum sulfur requirement for fuel used by shipsvessels at berth in the Baltic, the North Sea and the English Channel (the so called “SOx-Emission Control Area”). As of January 2020, EU ports.member states must also ensure that ships in all EU waters, except the SOx-Emission Control Area, use fuels with a 0.5% maximum sulfur content.
The Ship Recycling Regulation adopted in 2013 by the European Parliament and the Council of the European Union aims to reduce the negative impacts linked to the recycling of ships flying the flag of Member States of the Union. The Regulation lays down requirements that ships and recycling facilities have to fulfill in order to make sure that ship recycling takes place in an environmental sound and safe manner.
The Regulation first prohibits or restricts the installation and use of hazardous materials (like asbestos or ozone-depleting substances) on board ships.
The EU Ship Recycling Regulation (EUSRR), adopted in 2013, contains requirements for EU-flagged ships, of 500 gross tonnage and above, to carry an inventory of hazardous materials (IHM). In addition, ships calling at EU ports from non-EU countries will also be required to carry an IHM identifying all the hazardous materials on board. EU-flagged ships must also be scrapped in an EU approved ship recycling facility.
On September 15, 2020, the European Parliament voted to include greenhouse gas emissions from the maritime sector in the European Union’s carbon market from 2022. This will require shipowners to buy permits to cover these emissions. Contingent on another formal approval vote, specific regulations are forthcoming and are expected to be proposed by 2021.
Greenhouse Gas Regulation
Currently, the emissions of greenhouse gases from international shipping are not subject to the Kyoto Protocol ofto the United Nations Framework Convention on Climate Change, which entered into force in 2005 and pursuant to which adopting countries have been required to implement national programs to reduce greenhouse gas emissions with targets extended through 2020. International negotiations are continuing with respect to a successor to the Kyoto Protocol, and restrictions on shipping emissions may be included in any new treaty. In December 2009, more than 27 nations, including the U.S. and China, signed the Copenhagen Accord, which includes a non-binding commitment to reduce greenhouse gas emissions. The 2015 United Nations Climate Change Conference in Paris resulted in the Paris Agreement, which entered into force on November 4, 2016 and does not directly limit greenhouse gas emissions from ships. Onvessels. The U.S. initially entered into the agreement, but on June 1, 2017, the former U.S. presidentPresident Trump announced that the U.S. is withdrawingUnited States intends to withdraw from the Paris Agreement. The timingAgreement, and effect of such action has yetthe withdrawal became effective November 4, 2020. On January 20, 2021, U.S. President Biden signed an executive order to be determined.rejoin the Paris Agreement, which the U.S. officially rejoined on February 19, 2021.
At MEPC 70 and MEPC 71, a draft outline of the structure of the initial strategy for developing a comprehensive IMO strategy on reduction of greenhouse gas emissions from shipsvessels was approved. In accordance with this roadmap, in April 2018, nations at the MEPC 72 adopted an initial IMO strategy for reduction of greenhouse gas emissions is expected to be adopted at MEPC 72 in the second quarter of 2018. The IMO may implement market-based mechanisms to reduce greenhouse gas emissions from shipsvessels. The initial strategy identifies “levels of ambition” to reducing greenhouse gas emissions, including (1) decreasing the carbon intensity from vessels through implementation of further phases of the EEDI for new vessels; (2) reducing carbon dioxide emissions per transport work, as an average across international shipping, by at least 40% by 2030, pursuing efforts towards 70% by 2050, compared to 2008 emission levels; and (3) reducing the upcoming MEPC session.total annual greenhouse emissions by at least 50% by 2050 compared to 2008 while pursuing efforts towards phasing them out entirely. The initial strategy notes that technological innovation, alternative fuels and/or energy sources for international shipping will be integral to achieve the overall ambition. These regulations could cause us to incur additional substantial expenses.
The EU made a unilateral commitment to reduce overall greenhouse gas emissions from its member states from 20% of 1990 levels by 2020. The EU also committed to reduce its emissions by 20% under the Kyoto Protocol’s second period from 2013 to 2020. Starting in January 2018, large shipsvessels over 5,000 gross tonnage calling at EU ports are required to collect and publish data on carbon dioxide emissions and other information. As previously discussed, regulations relating to the inclusion of greenhouse gas emissions from the maritime sector in the European Union’s carbon market are also forthcoming.
In the United States, the EPA issued a finding that greenhouse gases endanger the public health and safety, adopted regulations to limit greenhouse gas emissions from certain mobile sources, and proposed regulations to limit greenhouse gas emissions from large stationary sources. However, in March 2017, the former U.S. President Trump signed an executive order to review and possibly eliminate the EPA’s plan to cut greenhouse gas emissions, and in August 2019, the Administration announced plans to weaken regulations for methane emissions. The outcome of this order is not yet known. AlthoughOn August 13, 2020, the mobile source emissions regulations do not applyEPA released rules rolling back standards to greenhouse gascontrol methane and volatile organic compound emissions from vessels,new oil and gas facilities. However, U.S. President Biden recently directed the EPA to publish a proposed rule suspending, revising, or rescinding certain of these rules. The EPA or individual U.S. states could enact environmental regulations that would affect our operations. For example, California has introduced a cap-and-trade program for greenhouse gas emissions, aiming to reduce emissions 40% by 2030.
Any passage of climate control legislation or other regulatory initiatives by the IMO, the EU, the U.S. or other countries where we operate, or any treaty adopted at the international level to succeed the Kyoto Protocol or Paris Agreement, that restricts emissions of greenhouse gases could require us to make significant financial expenditures which we cannot predict with certainty at this time. Even in the absence of climate control legislation, our business may be indirectly affected to the extent that climate change may result in sea level changes or more intensecertain weather events (see risk factor on climate change).events.
International Labour Organization
The International LaborLabour Organization (theor the “ILO”) is a specialized agency of the UN that has adopted the Maritime LaborLabour Convention 2006 (“MLCor “MLC 2006”)., which has been amended in 2018 A Maritime LaborLabour Certificate and a Declaration of Maritime LaborLabour Compliance is required to ensure compliance with the MLC 2006 for all shipsvessels above 500 gross tons in international trade. We believeMLC is often called the “fourth pillar” of International maritime regulatory regime, because it stands beside the key IMO Conventions (SOLAS, MARPOL & STCW) that allsupport quality shipping and held to eliminate substandard shipping. The MLC requires that vessel operators obtain an MLC Compliance certificate for each vessel they operate. All our vessels are in substantialfull compliance with and are certified to meet MLC 2006.
Vessel Security Regulations
Since the terrorist attacks of September 11, 2001 in the United States, there have been a variety of initiatives intended to enhance vessel security. On November 25,security such as the U.S. Maritime Transportation Security Act of 2002 the MTSA, came into effect.or “MTSA”. To implement certain portions of the MTSA, in July 2003, the USCG issued regulations requiring the implementation of certain security requirements aboard vessels operating in waters subject to the jurisdiction of the U.S. The regulations also impose requirements onUnited States and at certain ports and facilities, some of which are regulated by the EPA.
Similarly, in December 2002, amendments to SOLAS created a new chapterChapter XI-2 of the convention dealing specifically with maritime security. The new Chapter XI-2 became effective in July 2004 andSOLAS Convention imposes various detailed security obligations on vessels and port authorities and mandates compliance with the International Ship and Port Facility Security Code or “the ISPS Code.Code”. The ISPS Code is designed to enhance the security of ports and shipsvessels against terrorism. Amendments to SOLAS Chapter VII, made mandatory in 2004, apply to vessels transporting dangerous goods and require those vessels be in compliance with the International Maritime Dangerous Goods Code, or the IMDG Code.
To trade internationally, a vessel must attain an International Ship Security Certificate or ISSC,“ISSC” from a recognized security organization approved by the vessel'svessel’s flag state.
The following are among the various requirements, some of which are found in SOLAS:
•onboard installation of automatic identification systems to provide a means for the automatic transmission of safety-related information from among similarly equipped ships and shore stations, including information on a ship'sship’s identity, position, course, speed and navigational status;
•onboard installation of ship security alert systems, which do not sound on the vessel but only alert the authorities on shore;
•the development of vessel security plans;
•ship identification number to be permanently marked on a vessel'svessel’s hull;
•a continuous synopsis record kept onboard showing a vessel'svessel’s history, including the name of the ship, the state whose flag the ship is entitled to fly, the date on which the ship was registered with that state, the ship'sship’s identification number, the port at which the ship is registered and the name of the registered owner(s) and their registered address; and
•compliance with flag state security certification requirements.
ShipsVessels operating without a valid certificate may be detained, at port until it obtains an ISSC, or it may be expelled from, port, or refused entry at port.port until they obtain an ISSC.
The USCG regulations, intended to align with international maritime security standards, exempt non-U.S. vessels from MTSA vessel security measures, non-U.S. vessels provided that such vessels have on board a valid ISSC that attests to the vessel'svessel’s compliance with the SOLAS Convention security requirements and the ISPS Code. Future security measures could have a significant financial impact on us. We have implementedintend to comply with the various security measures addressed by MTSA, the SOLAS Convention and the ISPS Code,Code.
The cost of vessel security measures has also been affected by the escalation in the frequency of acts of piracy against ships, notably off the Gulf of Guinea, off the coast of Somalia, including the Gulf of Aden and Arabian Sea area. Substantial loss of revenue and other costs may be incurred as a result of detention of a vessel or additional security measures, and the risk of uninsured losses could significantly affect our fleet isbusiness. Costs are incurred in compliancetaking additional security measures in accordance with applicable security requirements.Best Management Practices to Deter Piracy, notably those contained in the BMP5 industry standard.
Inspection by Classification Societies
The hull and machinery of every commercial vessel must be classed by a classification society authorized by its country of registry. The classification society certifies that a vessel is safe and seaworthy in accordance with the applicable rules and regulations of the country of registry of the vessel and SOLAS. The IACS has adopted harmonized Common Structural Rules, or the Rules, which apply to oil tankers, among other vessels, constructed on or after July 1, 2015. The Rules attempt to create a level of consistency between IACS Societies. In complying with current and future environmental requirements, vessel-owners and operators may also incur significant additional costs in meeting new maintenance and inspection requirements, in developing contingency arrangements for potential spills and in obtaining insurance coverage. Government regulation of vessels, particularly in the areas of safety and environmental requirements, can be expected to become stricter in the future and require us to incur significant capital expenditures on our vessels to keep them in compliance.
A vessel must undergo annual surveys, intermediate surveys, drydockings and special surveys. In lieu of a special survey, a vessel’s machinery may be on a continuous survey cycle, under which the machinery would be surveyed periodically over a five-year period. Every vessel is also required to be drydocked every 30 to 36 months for inspection of the underwater parts of the vessel. If any vessel does not maintain its class and/or fails any annual survey, intermediate survey, drydocking or special survey, the vessel will be unable to carry cargo between ports and will be unemployable and uninsurable which could cause us to be in violation of certain covenants in our loan agreements. Any such inability to carry cargo or be employed, or any such violation of covenants, could have a material adverse impact on our financial condition and results of operations.
The operation of our vessels is affected by the requirements set forth in the IMO's International Management Code for the Safe Operation of Ships and Pollution Prevention, or the ISM Code. The ISM Code requires ship owners, ship managers and bareboat charterers to develop and maintain an extensive "Safety Management System" that includes the adoption of a safety and environmental protection policy setting forth instructions and procedures for safe operation and describing procedures for dealing with emergencies. Currently, all of our vessels are ISM Code-certified. and we expect that any vessels that we acquire in the future will be ISM Code-certified when delivered to us. The failure of a shipowner or bareboat charterer to comply with the ISM Code may subject it to increased liability, may invalidate existing insurance or decrease available insurance coverage for the affected vessels and may result in a denial of access to, or detention in, certain ports. If we are subject to increased liability for non-compliance or if our insurance coverage is adversely impacted as a result of non-compliance, it may negatively affect our ability to pay dividends, if any, in the future. If any of our vessels are denied access to, or are detained in, certain ports, this may decrease our revenues.
Every seagoing vessel must be "classed"“classed” by a classification society. The classification society certifies that the vessel is "in“in class,''’’ signifying that the vessel has been built and maintained in accordance with the rules of the classification society. In addition, where surveys are required by international conventions and corresponding laws and ordinances of a flag state, the classification society will undertake them on application or by official order, acting on behalf of the authorities concerned and will certify that such vessel complies with applicable rules and regulations of the vessel'svessel’s country of registry and the international conventions of which that country is a member.
The classification society also undertakes on request other surveys and checks that are required by regulations and requirements of the flag state. These surveys are subject to agreements made in each individual case and/or to the regulations of the country concerned.
For maintenance of the class, regular and extraordinary surveys of hull, machinery, including the electrical plant, and any special equipment classed are required to be performed as follows:
•Annual Surveys. For seagoing ships, annual surveys are conducted for the hull and the machinery, including the electrical plant, and where applicable for special equipment classed, within three months before or after each anniversary date of the date of commencement of the class period indicated in the certificate.
•Intermediate Surveys. Extended annual surveys are referred to as intermediate surveys and are to be carried out either at or between the second and third Annual Surveys after Special Periodical Survey No. 1 and subsequent Special Periodical Surveys. Those items which are additional to the requirements of the Annual Surveys may be surveyed either at or between the second and third Annual Surveys. After the completion of the No.3 Special Periodical Survey the following Intermediate Surveys are of the same scope as the previous Special Periodical Survey.
•Special Periodical Surveys (or Class Renewal Surveys). Class renewal surveys, also known as Special Periodical Surveys, are carried out for the ship'sship’s hull, machinery, including the electrical plant, and for any special equipment classed, and should be completed within five years after the date of build or after the crediting date of the previous Special Periodical Survey. At the special survey, the vessel is thoroughly examined, including ultrasonic-gauging to determine the thickness of the steel structures. Should the thickness be found to be less than the minimum class requirements, the classification society would prescribe steel renewals. A Special Periodical Survey may be commenced at the fourth Annual Survey and be continued with completion by the fifth anniversary date. Substantial amounts of money may have to be spent for steel renewals to pass a special survey if the vessel experiences excessive wear and tear.
As mentioned above for vessels that are more than 15 years old, the Intermediate Survey may also have a considerable financial impact.
At an owner'sowner’s application, the surveys required for class renewal (for tankers only the ones in relation to machinery and automation) may be split according to an agreed schedule to extend over the entire five yearfive-year period. This process is referred to as continuous survey system. All areas subject to survey as defined by the classification society are required to be surveyed at least once per class period, unless shorter intervals between surveys are prescribed elsewhere. The period between two subsequent surveys of each area must not exceed five years.
Most vessels are subject also to a minimum of two examinations of the outside of a vessel'svessel’s bottom and related items during each five-year special survey period. Examinations of the outside of a vessel'svessel’s bottom and related items is normally to be carried out with the vessel in drydock but an alternative examination while the vessel is afloat by an approved underwater inspection may be considered. One such examination is to be carried out in conjunction with the Special Periodical Survey and in this case the vessel must be in drydock. For vessels older than 15 years (after the third Special Periodical Survey) the bottom survey must always be in the drydock. In all cases, the interval between any two such examinations is not to exceed 36 months.
In general, during the above surveys if any defects are found, the classification surveyor will require immediate repairs or issue a ''recommendation''‘‘recommendation’’ which must be rectified by the shipowner within prescribed time limits.
Most insurance underwriters make it a condition for insurance coverage that a vessel be certified as "in-class"“in-class” by a classification society which is a member of the International Association of Classification Societies, or the IACS. All our vessels are certified as being "in-class"“in-class” by American Bureau of Shipping, Lloyds Register or Bureau Veritas who are all members of IACS. All new and secondhand vessels that we purchase must be certified prior to their delivery under our standard purchase contracts and memoranda of agreement. If the vessel is not certified on the scheduled date of closing, we have no obligation to take delivery of the vessel.
In addition to the classification inspections, many of our customers regularly inspect our vessels as a precondition to chartering them for voyages. We believe that our well-maintained, high-quality vessels provide us with a competitive advantage in the current environment of increasing regulation and customer emphasis on quality.
Risk of Loss and Liability Insurance
General
The operation of any cargo vessel includes risks such as mechanical failure, physical damage, collision, property loss, cargo loss or damage and business interruption due to political circumstances in foreign countries, piracy incidents, hostilities and labor strikes. In addition, there is always an inherent possibility of marine disaster, including oil spills and other environmental mishaps, and the liabilities arising from owning and operating vessels in international trade. OPA, which in certain circumstances imposes virtually unlimited liability upon vessel owners, operators and demisebareboat charterers of any vessel trading in the United States exclusive economic zone of the United States for certain oil pollution accidents in the United States, has made liability insurance more expensive for shipownersvessel owners and operators trading in the United States market. While we believe that our presentWe carry insurance coverage is adequate,as customary in the shipping industry. However, not all risks can be insured, against,specific claims may be rejected, and there canwe might not be no guarantee that any specific claim will be paid, or that we will always be able to obtain adequate insurance coverage at reasonable rates.
Hull and Machinery Insurance
We procure hull and machinery insurance, protection and indemnity insurance, which includes environmental damage and pollution insurance and war risk insurance and freight, demurrage and defense insurance for our fleet. We generally do not maintain insurance against loss of hire which covers business interruptions that result in the loss of use of a vessel.
Marine and War Risks Insurance
We have in force marine and war risks insurance for all of our vessels. Our marine hull and machinery insurance covers risks of particular and general average and actual or constructive total loss from collision, fire, grounding, engine breakdown and other insured named perils up to an agreed amount per vessel. Our war risks insurance covers the risks of particular and general average and actual or constructive total loss from acts of war and civil war, terrorism, piracy, confiscation, seizure, capture, vandalism, sabotage, and other war-related named perils. We have also arranged coverage for increased value for each vessel. Under this increased value coverage, in the event of total loss of a vessel, we will be able to recover amounts in excess of those recoverable under the hull and machinery policy in order to compensate for additional costs associated with replacement of the loss of the vessel. Each vessel is covered up to at least its fair market value at the time of the insurance attachment and subject to a fixed deductible per each single accident or occurrence, but excluding actual or constructive total loss. As of the date of this annual report, nil deductible applies under the war risks insurance.
Protection and Indemnity Insurance
Protection and indemnity insurance is provided by mutual protection and indemnity associations, or P&I Associations, and covers our contractual and third-party liabilities in connection with our shipping activities in accordance with the Rules of the P&I Association.activities. This coversincludes third-party liability and other related expenses including but not limited to those resulting fromof injury or death of crew, passengers and other third-parties,third parties, loss of or damage to cargo, claims arising from collisions with other vessels, damage to other third-party property, pollution arising from oil or other substances, and mandatorysalvage, towing and other related costs, including wreck removal (not including towage costs, which is covered by marine or war risk insurance).removal. Protection and indemnity insurance is a form of mutual indemnity insurance, extended by mutual protection and indemnity mutual associations, or "clubs."“clubs.”
As a member of a P&I Club that is a member of the International Group of P&I Clubs, or the International Group, we carryOur current protection and indemnity insurance coverage capped atfor pollution is $1 billion for oil pollution claims and at $3.0 billion for other claims per vessel per incident. The 13 P&I ClubsAssociations that comprise the International Group insure approximately 90% of the world'sworld’s commercial tonnage and have entered into a pooling agreement to reinsure each association's liabilitiesassociation’s liabilities. The International Group’s website states that the Pool provides a mechanism for sharing all claims in excess of their own retention (presently $9.0 million). Although theUS $10 million up to, currently, approximately US $8.2 billion. As a member of a P&I Clubs compete with each other for business, they have found it beneficial to pool their larger risks under the auspicesAssociation, which is a member of the International Group. This pooling is regulated by a contractual agreement which defines the risks that are to be pooled and exactly how these risks are to be shared by the participating P&I Clubs. WeGroup, we are subject to calls payable to the associations based on our claim records as well as the claim records of all other members of the individual associations and members of the shipping pool of P&I ClubsAssociations comprising the International Group.
Permits and Authorizations
We are required by various governmental and quasi-governmental agencies to obtain certain permits, licenses and certificates with respect to our vessels. The kinds of permits, licenses and certificates required depend upon several factors, including the commodity transported, the waters in which the vessel operates, the nationality of the vessel'svessel’s crew and the age of the vessel. We have been able to obtain all permits, licenses and certificates currently required to permit our vessels to operate. Additional laws and regulations, environmental or otherwise, may be adopted which could limit our ability to do business or increase the cost of us doing business.
C.Organizational Structure
We were incorporated under the laws of Belgium on June 26, 2003. We own our vessels either directly at the parent level, indirectly through our wholly-owned vessel owning subsidiaries, or jointly through our 50%-owned subsidiaries. We conduct our vessel operations through our wholly-owned subsidiaries Euronav Ship Management SAS, Euronav SAS, Euronav Singapore Pte. Ltd. and Euronav Ship Management (Hellas) Ltd., and also through the TI Pool. Our subsidiaries are incorporated under the laws of Belgium, France, United Kingdom, Liberia, Luxembourg, Cyprus, Hong Kong, Singapore and the Marshall Islands. Our vessels are flagged in Belgium, the Marshall Islands, France, PanamaLiberia and Greece.
Please see Exhibit 8.1 to this annual report for a list of our subsidiaries.
D.Property, Plants and Equipment
For a description of our fleet, please see "Item 4. Information on the Company—B. Business Overview—Our Fleet."
We own no properties other than our vessels. We lease office space in various jurisdictions, and have the following material leases in place for such use as of January 1, 2018:December 31, 2020:
•Belgium, located at Belgica Building, De Gerlachekaai 20, Antwerp, Belgium, for a yearly rent of $197,303.$334,072.
•Greece, located at 31-33 Athinon Avenue, Athens, Greece 10447, for a yearly rent of $358,704.$384,268.
•France, located at Quai Ernest Renaud 15, CS20421, 44104 Nantes Cedex 1, France, for a total yearly rent of $32,733.$32,866.
United Kingdom, London, located at Moreau House, 3rd Floor, 116 Brompton Road, London SW3 1JJ for a yearly rent of $10,524 (our former London office) through January 2018.
•United Kingdom, London, located at 81-99 Kings Road, Chelsea, London SW3 4PA, 1-3 floor, for a yearly rent of $1,010,366.$930,280. We sublease part of this office space to third parties and received a total yearly rent of $749,871 (our new London office).$848,468.
•Singapore, located at 10 Hoe Chiang79 Anson Road, # 10-04, Keppel Tower,#23-06 Singapore 089315,(079906), for a yearly rent through June 2018 of $28,424.$119,364.
•Hong Kong, located at Room 2503-05 25th Floor Harcourt House 39 Gloucester Road Wanchai Hong Kong, for a yearly rent of $14,046.$80,112.
Please see "Item 7. Major Shareholders•United States of America, located at 299 Park Avenue, New York, for a yearly rent of $2,013,887. We sublease this office space to third parties and Related Party Transactions—B. Related Party Transactions"received a total yearly rent of $1,484,114. This lease expires in September 2025
•Switzerland, located at Place Bourg de Four #4, Geneva 1204 for further information on leases we have entered into with related parties.a yearly rent of $31,580.
ITEM 4A. UNRESOLVED STAFF COMMENTS
None.
ITEM 5. OPERATING AND FINANCIAL REVIEW AND PROSPECTS
The following management's discussion and analysis of the results of our operations and financial condition should be read in conjunction with the financial statements and the notes to those statements included elsewhere in this annual report. This discussion includes forward-looking statements that involve risks and uncertainties. Our actual results may differ materially from those anticipated in these forward-looking statements as a result of many factors, such as those set forth in "Item 3. Key Information—D. Risk Factors" and elsewhere in this report.
For a discussion of our results for the year ended December 31, 2019 compared to the year ended December 31, 2018, please see “Item 5. Operating and Financial Review and Prospects – A. Operating Results – Year ended December 31, 2019, compared to the year ended December 31, 2018” contained in our annual report on Form 20-F for the year ended December 31, 2019, filed with the SEC on April 29, 2020 and is incorporated by reference herein. .
Factors affecting our results of operations
The principal factors which have affected our results of operations and are expected to affect our future results of operations and financial position include:
•The spot rate and time charter market for VLCC and Suezmax tankers;
•The number of vessels in our fleet;
•Utilization rates on our vessels, including actual revenue days versus non-revenue ballast and off-hire days;
•Our ability to maintain and grow our customer relationships;
•Economic, financial, regulatory, political and government conditions that affect the supply and demand of crude oil and the tanker shipping industry;
•The earnings on our vessels;
•Gains and losses from the sale of assets and amortization of deferred gains;
•Vessel operating expenses, including in some cases, the fluctuating price of fuel expenses when our vessels operate in the spot or voyage market;
•Impairment losses on vessels;vessels or our fuel inventory on board of the Oceania;
•Administrative expenses;
•Potential liabilities arising from pending or future claims;
•Acts of piracy or terrorism;
•Depreciation;
•Drydocking and special survey days, both expected and unexpected;
•Our overall debt level and the interest expense and principal amortization; and
•Equity gains (losses) of unconsolidated subsidiaries and associated companies.companies;
Lack•The European Ship Recycling regulation which is applicable as of Historical Operating DataJanuary 1, 2019;
•IMO 2020: The MarPol convention, Annex VI Prevention of Air Pollution from Ships which reduces the maximum amount of Sulfur that ships can emit into the air and is applicable since January 1, 2020;
•The International Convention for Vessels Before Their Acquisitionthe Control and Management of Ships' Ballast Water and Sediments (BWM) which will be applicable imminently; and
•Impact related to COVID-19 pandemic on oil demand and our operations.
COVID-19
The COVID-19 outbreak has impacted many countries around the world, and disrupted the lives of many millions of people. The Company takes the risks associated with shipping industry practice, other than inspectionthe outbreak extremely seriously, and the safety and wellbeing of its employees is of paramount importance.
In that respect, the largest operational challenge was conducting crew changes. Apart from serious humanitarian and crew welfare concerns, there is an increasing risk that fatigue will lead to serious maritime accidents. In addition to restrictions placed on the movement of seafarers by national and local authorities, there is also the problem of the physical conditioncontinued suspension of the majority of flights between major crew change ports and the home country of the Company’s crew. In order to resolve the difficult situation, the Company decided to accommodate deviations by ships to facilitate crew changes, resulting in an increased costs cost (USD 1.8 million ) and decreased revenues because of off hire (USD 4.2 million).
Going forward, it remains difficult to estimate the future impact of the pandemic on the economies where we are active, and hence the impact these factors might have on the financial results.
In general terms, the market will become more challenging as demand for crude oil is negatively impacted by the COVID-19 pandemic. This decrease in demand combined with the gradual release of vessels that were used as storage has disrupted the supply-demand balance and thus the freight market. However, these negative consequences could very well be offset by continuing logistical delays of ships in ports, increased level of recycling, reduced ordering of newbuild vessels and increased crude oil production, partially neutralizing the COVID-19 impact to a certain extent. In view of these different dynamics which the company does not control, the longer term global macro-economic impact on the Company’s results related to the COVID-19 outbreak remains difficult to accurately quantify. Any forward-looking statements should be regarded with caution because of the inherent uncertainties in economic trends and business risks related to the current COVID-19 outbreak.
The significant assumptions and accounting estimates, to support the reported amounts of assets and liabilities, income and expenses, were regularly reviewed, and if needed updated, during 2020. The main judgements, estimates and assumptions, which might be impacted by COVID-19, are:
•Impairments: The carrying amount of the vessels is reviewed to determine whether an indication of impairment exists. No impairment is required as the recoverable amount of each CGU continues to be in excess of the carrying amounts.
•Bunkers on the Oceania and examinationsthe vessels are valued at lower of classification society records, there is no historical financial and/or operational due diligence process when we acquire vessels. Accordingly, we do not obtaincost of net realizable value adjustments. Weighted average of the historical operating datafuel stock on board of the Oceania and the vessels was lower than the market price at year-end.
•Allowance for expected credit losses: In accordance with IFRS 9, the group recognizes expected credit losses on trade receivables following the simplified approach. Lifetime expected losses are recognized for the vessels fromtrade receivables, excluding recoverable VAT amounts. However, based on customer’s payment behaviour, no significant additional allowances for expected credit losses were to be recognized as per December 31, 2020.
As the sellers because that information is not material to our decision to make acquisitions, nor do we believe it would be helpful toCOVID-19 pandemic further evolves, potential investorschanges in assessing our business or profitability. Most vessels are sold under a standardized agreement, which, among other things, provides the buyer with the right to inspect the vessel and the vessel's classification society records. The standard agreement does not give the buyer the right to inspect, or receive copiesthese views might occur in 2021. Please see "Item 3 - Risk Factors" for more details about potential effects of the historical operating data of the vessel. Prior to the delivery of a purchased vessel, the seller typically removes from the vessel all records, including past financial records and accounts related to the vessel. In addition, the technical management agreement between the seller's technical manager and the seller is automatically terminated and the vessel's trading certificates are revoked by its flag state following a change in ownership.coronavirus on our business.
Consistent with shipping industry practice, we treat the acquisition of a vessel (whether acquired with or without charter) as the acquisition of an asset rather than a business. Although the vessels we acquire generally do not have a charter attached, we have agreed to acquire (and may in the future acquire) some vessels with time charters attached. Where a vessel has been under a voyage charter, the vessel is delivered to the buyer free of charter. It is rare in the shipping industry for the last charterer of the vessel in the hands of the seller to continue as the first charterer of the vessel in the hands of the buyer. In most cases, when a vessel is under time charter and the buyer wishes to assume that charter, the vessel cannot be acquired without the charterer's consent and the buyer's entering into a separate direct agreement with the charterer to assume the charter. The purchase of a vessel itself does not transfer the charter, because it is a separate service agreement between the vessel owner and the charterer. When we acquire a vessel and assume a related time charter, we take the following steps before the vessel will be ready to commence operations:
obtain the charterer's consent to us as the new owner;
obtain the charterer's consent to a new technical manager;
in some cases, obtain the charterer's consent to a new flag for the vessel;
arrange for a new crew for the vessel;
replace most if not all hired equipment on board, such as computers and communication equipment;
negotiate and enter into new insurance contracts for the vessel through our own insurance brokers;
register the vessel under a flag state and perform the related inspections in order to obtain new trading certificates from the flag state;
implement a new planned maintenance program for the vessel; and
ensure that the new technical manager obtains new certificates for compliance with the safety and vessel security regulations of the flag state.
Critical Accounting Policies
Our consolidated financial statements are prepared in accordance with IFRS, which requires us to make estimates in the application of accounting policies based on the best assumptions, judgments and opinions of management.
The following is a discussion of our accounting policies that involve a higher degree of judgment and the methods of their application. For a description of all of our material accounting policies, please see Note 1—Summary of Significant Accounting Policies to our consolidated financial statements included herein.
Revenue Recognition
We generate a large part of our revenue from voyage charters, including vessels in pools that predominantly perform voyage charters. Within the shipping industry, there are two methods used to account forUnder IFRS 15, revenue from contracts with customers, voyage charter revenue: (1)revenue is recognized ratably over the estimated length of each voyage, and (2) completed voyage. The recognition of voyage revenues ratably over the estimated length of each voyage is the most prevalent method of accounting for voyage revenues in the shipping industry and the method we use. Under each method, voyages may be calculated on either a load-to-loadload-to-discharge basis. Voyage expenses are capitalized between the previous discharge port, or discharge-to-discharge basis. In applying its revenue recognition method, management believes that the discharge-to-discharge basis of calculating voyages more accurately estimates voyage results than the load-to-load basis. Since, at the time of discharge, management generally knowscontract date if later, and the next load port and expected discharge port,if they qualify as fulfillment costs under IFRS 15. To recognize costs incurred to fulfill a contract as an asset, the discharge-to-discharge calculation of voyage revenues canfollowing criteria shall be estimated with a greater degree of accuracy. We do not begin recognizing voyage revenue until a charter has been agreed to by both us andmet: (i) the customer, even if the vessel has discharged its cargo and is sailingcosts relate directly to the anticipatedcontract, (ii) the costs generate or enhance resources of the entity that will be used in satisfying performance obligations in the future and (iii) the costs are expected to be recovered. Capitalized voyage expenses are amortized ratably between load port on its next voyage, because it is only at this time the charter rate is determinable for the specified load and discharge ports and collectability is reasonably assured.port.
Revenues from time charters are accounted for as operating leases and are thus recognized ratably over the rental periods of such charters, as service is performed. The board will, however, analyze each contract before deciding on its accounting treatment between operating lease and finance lease. We do not recognize time charter revenues during periods that vessels are off-hire.
For our vessels operating in the TI Pool, revenues and voyage expenses are pooled and allocated to the pool's participants on a TCE basis in accordance with an agreed-upon formula. The formulas in the pool agreements for allocating gross shipping revenues net of voyage expenses are based on points allocated to participants' vessels based on cargo carrying capacity and other technical characteristics, such as speed and fuel consumption. The selection of charterers, negotiation of rates and collection of related receivables and the payment of voyage expenses are the responsibility of the pool. The pool may enter into contracts that earn either voyage charter revenue or time charter revenue. The pool follows the same revenue recognition principles, as applied by us, in determining shipping revenues and voyage expenses, including recognizing revenue only after a charter has been agreed to by both the pool and the customer, even if the vessel has discharged its cargo and is sailing to the anticipated load port on its next voyage.
The following table presents our average TCE rates (in U.S. dollars) and vessel operating days, which are the total days the vessels were in our possession for the relevant period, net of scheduled off-hire days associated with major repairs, drydockings or special or intermediate surveys for the periods indicated:
|
| | | | | | | | | | | | | | | | | | | | | | | | | | | | | | | | | | | | |
| | | Year ended December 31, 2017 | | Year ended December 31, 2016 | | Year ended December 31, 2015 |
| | | REVENUE | | REVENUE | | REVENUE |
| | | Fixed |
| | Spot |
| | Pool |
| | Fixed |
| | Spot |
| | Pool |
| | Fixed |
| | Spot |
| | Pool |
|
| TANKER SEGMENT* | | | | | | | | | | | | | | | | | | |
| VLCC | | | | | | | | | | | | | | | | | | |
| Average rate | | $ | 39,629 |
|
| $ | — |
|
| $ | 27,773 |
|
| $ | 42,618 |
|
| $ | 47,384 |
|
| $ | 41,863 |
|
| $ | 41,981 |
|
| $ | 30,734 |
|
| $ | 55,055 |
|
| Vessel Operating days | | 1,882 |
|
| — |
|
| 8,977 |
|
| 1,918 |
|
| 468 |
|
| 8,167 |
|
| 954 |
|
| 380 |
|
| 8,311 |
|
| SUEZMAX | | | | | | | | | | | | | | | | | | |
| Average rate | | $ | 22,131 |
|
| $ | 18,002 |
|
| — |
|
| $ | 26,269 |
|
| $ | 27,498 |
|
| — |
|
| $ | 35,790 |
|
| $ | 41,686 |
|
| — |
|
| Vessel Operating days | | 1,886 |
|
| 4,934 |
|
| — |
|
| 2,105 |
|
| 4,646 |
|
| — |
|
| 2,297 |
|
| 4,483 |
|
| — |
|
| FSO SEGMENT** | | | | | | | | | | | | | | | | | | |
| FSO | | | | | | | | | | | | | | | | | | |
| Average rate | | $ | 163,975 |
|
| — |
|
| — |
|
| $ | 178,650 |
|
| — |
|
| — |
|
| $ | 178,778 |
|
| — |
|
| — |
|
| FSO Operating days | | 365 |
|
| — |
|
| — |
|
| 366 |
|
| — |
|
| — |
|
| 365 |
|
| — |
|
| — |
|
* The figures for the tanker segment do not include our economic interest in joint ventures.
**The figures for the FSO segment are included and presented at our economic interest, 50%.
Through pooling mechanisms, we receive a weighted, average allocation, based on the total spot results earned by the total of pooled vessels, (reflected under "Pool" in the table above), whereas results from direct spot employment are earned and allocated on a one-on-one basis to the individual vessel and thus owner of the according vessel (reflected under "Spot" in the table above).vessel.
Vessel Useful Lives and Residual Values
The useful economic life of a vessel is variable. Elements considered in the determination of the useful lives of the assets are the uncertainty over the future market and future technological changes. The carrying value of each of our vessels represents its initial cost at the time it was delivered or purchased plus any additional capital expenditures less depreciation calculated using an estimated useful life of 20 years, except for FSO service vessels for which estimated useful lives of 25 years arewas used. Following the signing of an extension of the contract with North Oil Company until 2032, the end of the useful economic life was set equal to the contract end date or approximately 30 years since build date. Newbuildings are depreciated from delivery from the construction yard. Purchased vessels and FSOs converted later into an FSO and FSOs are depreciated over their respective remaining useful lives as from the delivery of the construction yard to its first owner.
On December 31, 2017, all of our owned vessels were of double hull construction. If the estimated economic lives assigned to our vessels prove to be too long because of new regulations, the continuation of weak markets, the broad imposition of age restrictions by our customers or other future events, this could result in higher depreciation expenses and impairment losses in future periods related to a reduction in the useful lives of any affected vessels.
We estimate that our vessels will not have any residual value at the end of their useful lives. Even though the scrap value of a vessel could be worth something, it is difficult to estimate taking into consideration the cyclicality of the nature of future demand for scrap steel and is likely to remain volatile and unpredictable. The costs of scrapping and disposing ofrecycling a vessel with due respect for the environment and the safety of the workers in such specialized yards is equally challenging to forecast as regulations and good industry practice leading to self-regulation can dramatically change over time. For example, certain organizations have suggested that the industry adopt The Hong Kong International Convention for the Safe and Environmentally Sound Recycling of Ships, or the Convention. While this Convention has not been accepted yet by all the flag states of the flags we use, we believe that this Convention or a similar convention may be adopted in the future. In the event that more stringent requirements are imposed upon tanker owners, including those seeking to sell their vessels to a party that intends to recycle the vessels after they have been purchased, or a Recycling Purchaser, such requirements could negatively impact the sales prices obtainable from the Recycling Purchasers or require companies, including us, to incur additional costs in order to sell their vessels to recycling purchasersRecycling Purchasers or to other foreign buyers intending to use such vessels for further trading. Reference is made to the risk factor section for additional information on certain regulations impacting recycling including the risk factor entitled “Developments in safety and environmental requirements relating to the recycling of vessels may result in escalated and unexpected costs”. Therefore, we take the view that by the time our assets reach the end of their useful lives, their scrapresidual values are likely to be the same as their disposal costs.
Vessel Impairment
The carrying values of our vessels may not represent their fair market values at any point in time since the market prices of second-hand vessels tend to fluctuate with changes in charter rates and the cost of constructing new vessels. The carrying amounts of our vessels are reviewed at each reporting date to determine whether there is any indication of impairment. If any such indication exists, the recoverable amount is estimated. We define our cash generating unit (or CGU) as a single vessel, unless such vessel is operated in a pool, in which case such vessel, together with the other vessels in the pool, are collectively treated as a cash generating unit.CGU. The carrying amounts of our CGUs are reviewed at each reporting date to determine whether there is any indication of impairment. If any such indication exists, the recoverable amount is estimated. An impairment loss is recognized whenever the carrying amount of an asset or cash generating unit exceeds its recoverable amount. Impairment losses are recognized in the income statement.
FSO ImpairmentTankers
DueThe following internal and external indicators are reviewed to assess whether tankers might be impaired:
•The obsolescence or physical damage of an asset;
•Significant changes in the extent or manner in which an asset is (or is expected to be) used that have (or will have) an adverse effect on the entity;
•A plan to dispose of an asset before the previously expected date of disposal;
•Indications that the performance of an asset is, or will be, worse than expected;
•Cash flows for acquiring the asset, operating or maintaining it that are significantly higher than originally budgeted;
•Net cash flows or operating profits that are lower than originally budgeted;
•Net cash outflows or operating losses;
•Market capitalization below net asset value;
•A significant and unexpected decline in market value;
•Significant adverse effects in the technological, market, economic or legal environment including, but not limited to, vessel and crude oil supply and demand trends; and
•Increases in market interest rates.
When events and changes in circumstances indicate that the carrying amount of the asset or CGU might not be recovered, the Group performs an impairment test whereby the carrying amount of the asset or CGU is compared to its recoverable amount, which is the greater of its value in use and its fair value less cost of disposal. For assessing value in use and the assumptions used we refer to the factnext paragraph - Calculation of recoverable amount.
Although management believes that its process to determine the assumptions used to evaluate the carrying amount of the assets, when required, are reasonable and appropriate, such assumptions are subject to judgment. Management is assessing continuously the resilience of its projections to the business cycles that can be observed in the tankers market, and concluded that a business cycle approach provides a better long-term view of the dynamics at play in the industry. By defining a shipping cycle from peak to peak over the last 20 years and including management's expectation of the completion of the current cycle, management is better able to capture the full length of a business cycle while also giving more weight to recent and current market experience. The current cycle is forecasted based on management judgment, analyst reports and past experience. Long term charter rates are used in the calculation in case available.
The Group performed a review of the internal as well as external indicators of impairment to consider whether further testing was necessary, and determined that there are indicators that vessels might be impaired as of December 31, 2020 and accordingly a determination of the fair value less cost to dispose or value in use computation was performed. The implemented computation showed that no impairment of CGU was required.
FSOs
In the context of the valuation of the Group's investments in the respective joint ventures, the Group also reviews internal and external indicators, similar to the ones used for tankers, to assess whether the FSOs might be impaired. When events and changes in circumstances indicate that the carrying amount of the assets might not be recovered, the Group performs an impairment test on the FSO vessels are often purposely built for specific circumstances,owned by TI Asia Ltd and dueTI Africa Ltd, based on a value in use calculation to estimate the absence of anrecoverable amount from the vessel. This method is chosen as there is no efficient market for transactions of FSO vessels as each vessel is often purposely built for specific circumstances. In assessing value in use, assumptions are made regarding the carryinguse of FSO, forecast charter rates, Weighted Average Cost of Capital ('WACC'), the useful life of the FSOs (30 years) and a residual value. After careful consideration of the trends in the shipping industry, the Group elected to retain residual values for its vessels equal to zero.
The value in use calculation for FSOs, when required, is based on the remaining useful life of our FSOs may not represent their fair values at any point in time. The carrying amountsthe vessels as of our FSOs are reviewed at eachthe reporting date, and the charter rates are determined using the fixed daily rates as negotiated in the extension of the contract. The FSO Asia and the FSO Africa are on timecharter contract to determineNorth Oil Company, the operator of the Al-Shaheen oil field, whose shareholders are Qatar Petroleum Oil & Gas Limited and Total E&P Golfe Limited until 2032.
In the context of the valuation of the Group's investments in the respective joint ventures, the Group also performed a review of the internal as well as external indicators of impairment to consider whether there is any indicationfurther testing was necessary, and determined that no value in use computation was necessary as of impairment. If any such indication exists, the recoverable amount is estimated. We define our cash generating unit as a single FSO. AnDecember 31, 2020. Such computation will be implemented in future periods when events and changes in circumstances indicate that an impairment loss is recognized whenevermight exist and the carrying amount of an asset or cash generating unit exceeds its recoverable amount. Impairment losses are recognized in the income statement.assets might not be recovered.
Calculation of recoverable amount
The recoverable amount of an asset or cash generating unit is the greater of its fair value less its cost to sellof disposal and value in use. In assessing value in use, the estimated future cash flows, which are based on current market conditions, historical trends as well as future expectations, are discounted to their present value using a pre-tax discount rate that reflects the time value of money and the risks specific to the asset or cash generating unit.
The carrying values of our vessels or our FSOs may not represent their fair market values or the amount that could be obtained by selling the vessels at any point in time since the market prices of second-hand vessels tend to fluctuate with changes in charter rates and the cost of newbuildings. Historically, both charter rates and vessel values tend to be cyclical. The value of a FSO is highly dependent on the value of the service contract under which the unit is employed.
In developing estimates of future cash flows, we must make assumptions about future performance, with significant assumptions being related to charter rates, ship operating expenses, utilization, drydocking requirements, residual value and the estimated remaining useful lives of the vessels. These assumptions are based on historical trends and/or on future expectations. Specifically, in estimating future charter rates or service contract rates, management takes into consideration estimated daily rates for each assetThe Group uses a business cycle approach to forecast expected TCE rates. By defining a shipping cycle from peak to peak over the estimated remaining lives.last 20 years and including management's expectation of the completion of the current cycle, management is better able to capture the full length of a business cycle while also giving more weight to recent and current market experience. The estimated daily TCE rates arecurrent cycle is forecasted based on the trailing 10-year historical average rates, based on quarterly average rates published by an independent third-party maritime research service. Recognizing that the transportation of crude oilmanagement judgment, analyst reports and petroleum products is cyclical and subject to significant volatility based on factors beyond our control, management believes the use of estimates based on the 10-year historical average rates calculated as of the reporting date to be reasonable, even though the standard deviation of the 10-year average has increased in 2017 compared to 2016 for the tanker segment, on both VLCC and Suezmax. Also, the 10-year average used in the computation of value in use (for both VLCC and Suezmax) as of December 31, 2017 includes the year 2008, which was an exceptional high year in terms of TCE achieved by both the VLCC and Suezmax fleets. When using 5-year historical charter rates in this impairment analysis, the impairment analysis as at December 31, 2017 indicates a total impairment amount of $5.7 million for the tanker fleet, and when using 1-year historical charter rates in this impairment analysis, the impairment analysis as at December 31, 2017 indicates a total impairment amount of $427.3million for the tanker fleet. The value in use calculation for FSOs is based on the remaining useful life of the vessels as of the reporting date, and is based on fixed daily rates for the remaining period of the charter as well as management's best estimate of daily rates for future periods. past experience.
The WACC used to calculate the value in use of our assets is derived from our actual cost of debt and the cost of equity is calculated by using the beta as reported on Bloombergcalculated by an external party with the country premium and without adjustment,market risk of our direct competitors, which we believe reflects the appropriate cost of equity. However given the significant increase of the WACC in 2017 when compared to 2016, we will continue monitoring it to see if it necessitates any adjustment to reflect more accurately our cost of equity.
Estimated outflows for operating expenses and drydocking requirements are based on historical and budgeted costs and are adjusted for assumed inflation. Finally, utilization is based on historical levels achieved over the last 5 years, vessels useful lives and estimates of residual values consistent with our depreciation policy.
The more significant factors that could impact management's assumptions regarding time charter equivalent rates include (i) loss or reduction in business from significant customers, (ii) unanticipated changes in demand for transportation of crude oil and petroleum products, (iii) changes in production of or demand for oil and petroleum products, generally or in particular regions, (iv) greater than anticipated levels of tanker newbuilding orders or lower than anticipated levels of tanker scrappings,recyclings, and (v) changes in rules and regulations applicable to the tanker industry, including legislation adopted by international organizations such as IMO and the EU or by individual countries. Although management believes that the assumptions used to evaluate potential impairment are reasonable and appropriate at the time they were made, such assumptions are highly subjective and likely to change, possibly materially, in the future. There can be no assurance as to how long charter rates and vessel values will remain at their current levels.
Our Fleet—Vessel Carrying Values
During the past few years, the market values of vessels have experienced particular volatility, with substantial declines prior to 2018 in many vessel classes.classes and a recovery in 2018 and 2019. As a result, the charter-free market value, or basic market value, of certain of our vessels may have declined below the carrying amounts of those vessels. After undergoing the impairment indicator analysis and, if applicable, the impairment analysis discussed above, we have concluded that for the years ended December 31, 20172020 and 2016,2019, no impairment was required.
The following table presents information with respect to the carrying amount of our vessels by type and indicates whether their estimated market values are below their carrying values as of December 31, 20172020 and December 31, 2016.2019. The carrying value of each of our vessels does not necessarily represent its fair market value or the amount that could be obtained if the vessel were sold. Our estimates of market values for our vessels assume that the vessels are all in good and seaworthy condition without need for repair and, if inspected, would be certified as being in class without notations of any kind. Our estimates are based on the estimated market values for vessels received from independent ship brokers and are inherently uncertain. In addition, because vessel values are highly volatile, these estimates may not be indicative of either the current or future prices that we could achieve if we were to sell any of the vessels. We would not record a loss for any of the vessels for which the fair market value is below its carrying value unless and until we either determine to sell the vessel for a loss or determine that the vessel is impaired as discussed above in "Critical Accounting Policies—Vessel Impairment". We believe that the future discounted cash flows expected to be earned over the estimated remaining useful lives for those vessels that have experienced declines in market values below their carrying values would exceed such vessels' carrying values (For Vessels or for the CGU as appropriate and defined in the Critical Accounting Policies - Vessel Impairment). For vessels that are designated as held for sale at the balance sheet date, we either use the agreed upon selling price of each vessel if an agreement has been reached for such sale or an estimate of basic market value if an agreement for sale has not been reached as of the date of this annual report.
| | | | | | | | | | | | | | | | | | | | | | | | | | |
| | | | | | (In thousands of USD) |
| Vessel Type | | Numbers of Vessels at December 31, 2020 | | Numbers of Vessels at December 31, 2019 | | Carrying Value at December 31, 2020 | | Carrying Value at December 31, 2019 |
VLCC (includes V PLUS (1) | | 39 | | | 40 | | | 2,164,591 | | | 2,383,249 | |
Suezmax (2) | | 23 | | | 24 | | | 700,717 | | | 794,013 | |
| Vessels held for sale | | — | | | 1 | | | — | | | 12,705 | |
| Total | | 62 | | | 65 | | | 2,865,308 | | | 3,189,967 | |
|
| | | | | | | | | | | | |
| | | | | | | (In thousands of USD) |
| Vessel Type | | Numbers of Vessels at December 31, 2017 | | Numbers of Vessels at December 31, 2016 | | Carrying Value at December 31, 2017 | | Carrying Value at December 31, 2016 |
VLCC (includes ULCC) (1) | | 25 |
|
| 26 |
|
| 1,667,308 |
|
| 1,694,506 |
|
Suezmax (2) | | 18 |
|
| 19 |
|
| 604,192 |
|
| 688,657 |
|
| Vessels held for sale | | — |
|
| — |
|
| — |
|
| — |
|
| Total | | 43 |
|
| 45 |
|
| 2,271,500 |
|
| 2,383,163 |
|
| |
(1) | As of December 31, 2017, 20 of our VLCC owned vessels (December 31, 2016: 19) had carrying values which exceeded their market values. These vessels had an aggregate carrying value of $1,462.5 million (December 31, 2016: $1,432.2 million), which exceeded their aggregate market value by approximately $244.2 million (December 31, 2016: $298.0 million). |
| |
(2) | As of December 31, 2017, 16 of our Suezmax owned vessels (December 31, 2016: 17) had carrying values which exceeded their market values. These vessels had an aggregate carrying value of $598.2 million (December 31, 2016: $664.8 million), which exceeded their aggregate market value by approximately $191.6 million (December 31, 2016: $204.7 million). |
(2)As of December 31, 2020, 15 of our Suezmax owned vessels (December 31, 2019: 5) had carrying values which exceeded their individual market values. These vessels had an aggregate carrying value of $560.0 million (December 31, 2019: $211.9 million), which exceeded their aggregate market value by approximately $69.3 million (December 31, 2019: $18.9 million).
The table above only takes into account the fleet that is 100% owned by us and therefore does not take into account the FSOs and the Suezmax owned by Bari Shipholding Ltd as they are accounted for using the equity method.
Furthermore, the table does also not take into account the right-of-use assets and vessels under construction.
Vessels held for sale
Vessels whose carrying values are expected to be recovered primarily through sale rather than through continuing use are classified as held for sale. This is the case when the asset is available for immediate sale in its present condition subject only to terms that are usual and customary for sales of such vessels and its sale is highly probable (when it is significantly more likely than merely probable).
Immediately before classification as held for sale, the vessels are remeasured in accordance with our accounting policies. Thereafter the vessels are measured at the lower of their carrying amount and fair value less cost to sell.of disposal.
Impairment losses on initial classification as held for sale and subsequent gains and losses on remeasurement are recognized in profit or loss. Gains are not recognized in excess of any cumulative impairment loss.
Vessels classified as held for sale are no longer depreciated.
As of December 31, 2017 and December 31, 20162020, we had no vessels as a non-current asset held for sale. As of December 31, 2019, we had one Suezmax (Finesse) as a non-current asset held for sale.
Drydocking-Component approach
Where an item of property, plant and equipment comprises major components having different useful lives, they are accounted for as separate items of property, plant and equipment. Costs associated with routine repairs and maintenance are expensed as incurred including routine maintenance performed whilst the vessel is in drydock. Components installed during dry-dock with a useful life of more than 1 year, are depreciated over their estimated useful life (2.5-5 years).
Fleet Development
The following table summarizes the development of our fleet as of the dates presented below*:
| | | | | Year ended December 31, 2017 | | Year ended December 31, 2016 | | Year ended December 31, 2015 | | | Year ended
December 31, 2020 | | Year ended
December 31, 2019 | | Year ended
December 31, 2018 |
| VLCCs | | | | | | | VLCCs | | | | | | |
| At start of period | | 30.0 |
|
| 28.5 |
|
| 27.5 |
| At start of period | | 44.0 | | | 45.0 | | | 29.0 | |
| Acquisitions | | 2.0 |
|
| 3.5 |
|
| 3.0 |
| Acquisitions | | — | | | — | | | 22.0 | |
| Dispositions | | (3.0 | ) |
| (5.0 | ) |
| (1.0 | ) | |
| Disposals | | Disposals | | (1.0) | | | (1.0) | | | (6.0) | |
| Chartered-in | | — |
|
| 3.0 |
|
| (1.0 | ) | Chartered-in | | — | | | — | | | — | |
| At end of period | | 29.0 |
|
| 30.0 |
|
| 28.5 |
| At end of period | | 43.0 | | | 44.0 | | | 45.0 | |
| Newbuildings on order | | — |
|
| 2.0 |
|
| 3.0 |
| Newbuildings on order | | 4.0 | | | — | | | — | |
| Suezmax | |
|
|
|
|
|
|
|
| Suezmax | |
| At start of period | | 19.0 |
|
| 20.0 |
|
| 21.0 |
| At start of period | | 26.0 | | | 26.0 | | | 18.0 | |
| Acquisitions | | — |
|
| 1.0 |
|
| — |
| Acquisitions | | — | | | 1.0 | | | 10.0 | |
| Dispositions | | (1.0 | ) |
| (1.0 | ) |
| (1.0 | ) | |
| Disposals | | Disposals | | (2.5) | | | (1.0) | | | (2.0) | |
| Chartered in | | Chartered in | | 2.0 | | | — | | | — | |
| At end of period | | At end of period | | 25.5 | | | 26.0 | | | 26.0 | |
| Newbuildings on order | | Newbuildings on order | | — | | | — | | | — | |
| LR1 | | LR1 | |
| At start of period | | At start of period | | — | | | 1.0 | | | — | |
| Acquisitions | | Acquisitions | | — | | | — | | | 2.0 | |
| Disposals | | Disposals | | — | | | (1.0) | | | (1.0) | |
| Chartered in | | — |
|
| (1.0 | ) |
| — |
| Chartered in | | — | | | — | | | — | |
| At end of period | | 18.0 |
|
| 19.0 |
|
| 20.0 |
| At end of period | | — | | | — | | | 1.0 | |
| Newbuildings on order | | 4.0 |
|
| 2.0 |
|
| — |
| Newbuildings on order | | — | | | — | | | — | |
| FSO | |
|
|
|
|
|
|
|
| FSO | |
| At start of period | | 1.0 |
|
| 1.0 |
|
| 1.0 |
| At start of period | | 1.0 | | | 1.0 | | | 1.0 | |
| Acquisitions | | — |
|
| — |
|
| — |
| Acquisitions | | — | | | — | | | — | |
| Dispositions | | — |
|
| — |
|
| — |
| |
| Disposals | | Disposals | | — | | | — | | | — | |
| Chartered in | | — |
|
| — |
|
| — |
| Chartered in | | — | | | — | | | — | |
| At end of period | | 1.0 |
|
| 1.0 |
|
| 1.0 |
| At end of period | | 1.0 | | | 1.0 | | | 1.0 | |
| Newbuildings on order | | — |
|
| — |
|
| — |
| Newbuildings on order | | — | | | — | | | — | |
| Total fleet | |
|
|
|
|
|
|
|
| Total fleet | |
| At start of period | | 50.0 |
|
| 49.5 |
|
| 49.5 |
| At start of period | | 71.0 | | | 73.0 | | | 48.0 | |
| Acquisitions | | 2.0 |
|
| 4.5 |
|
| 3.0 |
| Acquisitions | | — | | | 1.0 | | | 34.0 | |
| Dispositions | | (4.0 | ) |
| (6.0 | ) |
| (2.0 | ) | |
| Disposals | | Disposals | | (3.5) | | | (3.0) | | | (9.0) | |
| Chartered in | | — |
|
| 2.0 |
|
| (1.0 | ) | Chartered in | | 2.0 | | | — | | | — | |
| At end of period | | 48.0 |
|
| 50.0 |
|
| 49.5 |
| At end of period | | 69.5 | | | 71.0 | | | 73.0 | |
| Newbuildings on order | | 4.0 |
|
| 4.0 |
|
| 3.0 |
| Newbuildings on order | | 4.0 | | | — | | | — | |
* This table includes the two vesselsvessel and the FSOs that we own through joint venture entities, which we recognize in our income statement using the equity method, at our respective share of economic interest. This table does not include vessels acquired, but not yet delivered.
Vessel Acquisitions and Charter-in Agreements
On June 15, 2015,March 26, 2018, we entered into an agreement with an unrelated third-party to acquire contracts for the constructiontook delivery of the Metrostar Acquisition Vessels, which atnewbuilding Suezmax Cap Quebec (2018-156,600 dwt) against payment of the timeremaining installments of our purchase$44.1 million in aggregate. This vessel was the first of four newbuilding Ice Class Suezmax vessels that were under construction at Hyundai, for an aggregate purchase pricecontracted to commence seven-year employment contracts with a leading global refinery player upon delivery from the yard during 2018.
On April 25, 2018, we took delivery of $384.0the Cap Pembroke (2018-156,600 dwt) against the payment of the remaining installments of $43.5 million or $96.0 million per vessel. The firstin aggregate. This vessel was the Antigone, was deliveredsecond of the four newbuilding Ice Class Suezmax vessels that were contracted to us on September 25, 2015. The second vessel, the Alice, was delivered to us on January 26, 2016. The third vessel, the Alex, was delivered to us on March 24, 2016. The fourth vessel, the Anne, was delivered to us on May 13, 2016.
commence seven-year employment contracts with a leading global refinery player upon delivery during 2018.
On June 2, 2016,12, 2018, we entered into a Share Swap and Claims Transfer Agreement whereby (i) we transferred our 50% equity interest in Moneghetti Shipholding Ltd., or Moneghetti, and Fontvieille Shipholding Ltd., or Fontvieille, and, as consideration therefor, acquired from Bretta its 50% ownership interest in Fiorano Shipholding Ltd., or Fiorano, and Larvotto Shipholding Ltd., or Larvotto; and (ii) we transferred our claims arising fromclosed the shareholder loans to Moneghetti and Fontvieille and acquired Bretta’s claims arising fromMerger with Gener8 which owned at the shareholder loans to Fiorano and Larvotto. In addition, we paid $15.1 million to Bretta as compensation for the difference in valuedate of the vessels. AsMerger, a resultfleet of this transaction, our equity interest29 tankers on the water, consisting of 21 VLCC vessels, six Suezmax vessels, and two Panamax vessels, with an aggregate carrying capacity of approximately 7.4 million dwt. These vessels included 19 “eco” VLCC newbuildings delivered from 2015 through 2017 equipped with advanced, fuel-saving technology, and were constructed at highly reputable shipyards.
On June 27, 2018, we acquired the ULCC Seaways Laura Lynn (2003 - 441,561 dwt) from Oceania Tanker Corporation, a subsidiary of International Seaways Inc. (NYSE:INSW) for $32.5 million. We renamed the ULCC as Oceania and registered it under the Belgian flag. The Oceania is one of two V-plus vessels in both Fiorano and Larvotto increased from 50% to 100% and we are now the sole owner of the Suezmaxes Captain Michael and the Maria, respectively.global tanker fleet. We no longer have an equity interest in Moneghetti or Fontvieille, which now fullyalso own the Suezmaxes Devon andTI Europe (2002-442,470 dwt) which together with the Eugenie, respectively. Effective as ofOceania are the same date, Fiorano and Larvotto are fully consolidated within our consolidated group of companies. We refer to these transactions collectively asonly two V-plus vessels in the Share Swap and Claims Transfer Agreement. global tanker fleet, providing us with significant strategic opportunities in this sector.
On August 16, 2016,8, 2018, we took delivery of the newbuilding Cap Port Arthur (2018-156,600 dwt) against payment of the remaining installments of $43.6 million. This vessel was the third of the four newbuilding Ice Class Suezmax vessels that were contracted to commence seven-year employment contracts with a leading global refinery player upon delivery during 2018.
On August 29, 2018, we took delivery of the newbuilding Cap Corpus Christi (2018-156,600 dwt) against payment of the remaining installments of $43.6 million. This vessel was the fourth of the four newbuilding Ice Class Suezmax vessels that were contracted to commence seven-year employment contracts with a leading global refinery player upon delivery during 2018.
In November 2019 two joint venture agreements were signed with Ridgetuf LLC resulting in the incorporation of two 50 per cent joint venture companies Bari Shipholding Limited and Bastia Shipholding Limited. Bari Shipholding Limited and Bastia Shipholding Limited are the owners of, respectively, the Suezmax vessels Bari and Bastia.
On February 12, 2020 and March 6, 2020, we announced we entered into an agreement for the acquisition through resale of two VLCCs which are under construction at Hyundai for an aggregated purchase price of $169 million or $84.5 million per vessel. The two VLCCS, Ardechethree and Aquitaine, were delivered to us on January 12, 2017 and January 20, 2017 respectively.
On October 3, 2016, we entered into constructionone VLCC newbuilding contracts, respectively, with Hyundai for two high specification Ice-Class Suezmax vessels from Hyundai, which we expect will be delivered to usdelivery dates in the first halfquarter of 2018.2021.
On November 1, 2016, we entered into an agreement to purchase the VLCC V.K. Eddie from our 50% joint venture Seven Seas Shipping Ltd., or Seven Seas, at a price of $39.0 million.
On April 27, 2017, we entered into newbuilding contracts for the construction of two additional high specification Ice Class Suezmax vessels from Hyundai shipyard in South Korea. We expect that these vessels will be delivered to us during the second half of 2018.
Vessel Sales and Redeliveries
In April 2014,On June 8, 2018, we sold the Suezmax Cap Jean (1998 – 146,643 dwt) for $10.6 million. As a result of the sale, we recorded a capital gain of approximately $10.6 million. The sale of the Cap Jean was part of our counterparty exercisedfleet rejuvenation program.
On June 15, 2018, we sold 6 VLCCS, Gener8 Miltiades (2016 - 301,038 dwt), Gener8 Chiotis (2016 - 300,973 dwt), Gener8 Success (2016 - 300,932 dwt), Gener8 Andriotis (2016 - 301,014 dwt), Gener8 Strength (2015 - 300,960 dwt) and Gener8 Supreme (2016 - 300,933 dwt), to INSW for a purchase optiontotal consideration of $434.0 million relating to buy the Olympivessels which included $ 123.0 million in cash consideration and $311.0 million in the form of assumption of the outstanding debt related to the vessels.
On June 25, 2018, we sold the Suezmax Cap Romuald (1998 - 146,643 dwt) for a and the Antarctica from us for an aggregate purchasenet sale price of $178.0$10.3 million. The Company recorded a gain of $9.0 million of which $20.0 million had been received in January 2011 as an option fee deductible fromon the purchase price. The sale resulted in a combined loss of $7.4 million which was recorded in the second quarter of 2014. The Olympia was deliveredupon delivery to its new owner on September 8, 2014 and the Antarctica was delivered to its new owner on January 15, 2015, earlier than expected, resulting in an increased sale price and a corresponding gain on disposal of assets of $2.2 million, which was recorded in the first quarter of 2015.August 22, 2018.
On November 11, 2015, we sold the Suezmax Cap Laurent for a net price of $22.3 million to an unrelated third-party, resulting in a capital gain of $11.1 million in the fourth quarter of 2015. We delivered the vessel to its new owner on November 26, 2015.
On January 15, 2016, we sold the VLCC Famenne, for a net price of $38.0 million to an unrelated third-party, resulting in a capital gain of $13.8 million, which was recorded in the first quarter of 2016. We delivered the vessel to its new owner on March 9, 2016.
On October 27, 2016 and November 27, 2016, we redelivered the VLCC KHK Vision and the Suezmax Suez Hans, respectively, to their owners upon the conclusion of their respective time charter-in periods .
On December 16, 2016,31, 2018 we entered into a five-year sale and leaseback agreement with an unrelated third-party for four VLCCs. The four VLCCs areregarding the Nautilus, the Navarin, the Neptun, and the Nucleus. The transaction assumed a net en-bloc sale price of $185 million and produced a gain of $41.5 million which was recorded in the fourth quarter of 2016. However, because there was a total difference of $5.0 million between the observable fair value of the assets ($181 million) and the sale price ($186 million), this excess has been deferred and is being amortized over the period for which the asset is expected to be used (in this case, the duration of the lease, which is 5 years.).
On May 23, 2017, the Company sold the VLCC TI Topaz (2002 – 319,430Suezmax vessel Felicity (2009-157,667 dwt), one of its two oldest VLCC vessels, for $21.0 million. The loss on that sale of $21.0 million, was recorded in the second quarter.
On November 10, 2017, the Company sold the VLCC Flandre (2004 - 305,688 dwt) for $45.0 million to with a global supplier and operator of offshore floating platforms. A capital loss on the sale of approximately $3.0 million was recorded in Q4 2018. The Companycash generated on this transaction after repayment of debt was $34.7 million. The vessel was delivered to her new owners in January 2019 and is expected to be converted into an FPSO.
On November 29, 2018, we sold the LR1 Companion (2004 - 72,749 dwt) for $6.3 million, which was acquired in the merger with Gener8 and was a non-core asset. We recorded a gainloss of $20.3$0.2 million on the sale which wasupon delivery to its new owner on November 29, 2018.
On February 20, 2019, we sold the LR1 Genmar Compatriot (2004 – 72,768 dwt) for a net sale price of $6.6 million.We recorded a capital gain of $0.4 million in the fourthsecond quarter of 2017.2019 upon delivery to its new owner on May 21, 2019.
On July 12, 2019, we sold the VLCC V.K. Eddie (2005 - 305,261 dwt), for $38.0 million. This vessel was accounted for as a non-current asset held for sale as at June 30, 2019, and had a carrying value of $ 23.2 million at that time. The vessel was delivered to its new owner on December 20, 2017 and will be convertedAugust 5, 2019. Taking into an FSPO by her new owner and will therefore leaveaccount $0.4 million of costs to sell (sales commissions), the worldwide VLCC trading fleet.
gain on the sale of this vessel was $14.4 million. This gain was recorded upon delivery of the vessel in the third quarter of 2019.
On November 16, 2017,January 23, 2020 the Company sold the Suezmax Cap Georges (1998Finesse (2003 - 146,652149,994 dwt), for $9.3$21.0 million. The Company recordedThis vessel was accounted for as a gainnon-current asset held for sale as at December 31, 2019 and had a carrying value of $8.5 million on the sale which was recorded in the fourth quarter of 2017.$12.7 million. The vessel was delivered to its new owner on November 29, 2017.February 21, 2020 and the capital gain of $8.3 million was recorded in the first quarter of 2020.
On November 17, 2017, the CompanyMarch 20, 2020, Euronav sold the VLCC ArtoisSuezmax Cap Diamant (2001 - 298,330160,044 dwt) for $21.8a net sale price of $20.1 million. The Artois was the oldest vessel in the Company’s VLCC fleet. The Company recorded a capital gain of $7.7$12.8 million on the sale which was recorded in the fourthsecond quarter of 2017. The vessel was delivered2020 upon delivery to its new owner on December 4, 2017.April 9, 2020.
On April 22, 2020, Euronav sold the VLCC TI Hellas (2005 - 319,254 dwt) for a net sale price of $37.0 million. A capital gain of $1.6 million was recorded in the second quarter of 2020 upon delivery to its new owner on June 5, 2020.
On September 15, 2020, the Suezmax Bastia was sold for USD 20.5 million. A capital gain on the sale of USD 0.7 million (Euronav's share) was recorded in the joint venture company upon delivery to her new owners in Q3.
A. Operating Results
Year ended December 31, 2017,2020, compared to the year ended December 31, 20162019
Total shipping revenues and voyage expenses and commissions.
The following table sets forth our total shipping revenues and voyage expenses and commissions for the years ended December 31, 20172020 and 2016:2019:
| | | | | | | | | | | | | | | | | | | | | | | | | | |
| (USD in thousands) | | 2020 | | 2019 | | $ Change | | % Change |
| Voyage charter and pool revenues | | 1,116,863 | | | 842,068 | | | 274,795 | | | 33 | % |
| Time charter revenues | | 113,887 | | | 90,309 | | | 23,578 | | | 26 | % |
| Other income | | 10,112 | | | 10,094 | | | 18 | | | — | % |
| Total shipping revenues | | 1,240,862 | | | 942,471 | | | 298,391 | | | 32 | % |
| Voyage expenses and commissions | | (125,430) | | | (144,681) | | | 19,251 | | | (13) | % |
|
| | | | | | | | | | | | |
| (US$ in thousands) | | 2017 |
| 2016 |
| $ Change |
| % Change |
| Voyage charter and pool revenues | | 394,663 |
|
| 544,038 |
|
| (149,375 | ) |
| (27 | )% |
| Time charter revenues | | 118,705 |
|
| 140,227 |
|
| (21,522 | ) |
| (15 | )% |
| Other income | | 4,902 |
|
| 6,996 |
|
| (2,094 | ) |
| (30 | )% |
| Total shipping revenues | | 518,270 |
|
| 691,261 |
|
| (172,991 | ) |
| (25 | )% |
| Voyage expenses and commissions | | (62,035 | ) |
| (59,560 | ) |
| (2,475 | ) |
| 4 | % |
Voyage Charter and Pool Revenues. Voyage charter and pool revenues decreasedincreased by 27%33%, or $149.4$274.8 million, to $394.7$1,116.9 million for the year ended December 31, 2017,2020, compared to $544.0$842.1 million for 2016.2019. This decreaseincrease was mainly due to a decreasean increase in the average achieved TCE rates for VLCCs and Suezmax tankers from $42,243$35,678 per day and $27,114$26,542 per day, respectively in 20162019 to $29,827$52,549 and $19,144,$37,025, respectively in 2017.2020. This decreaseincrease in achieved TCE rates was offset with a lower number of onhire days in 2020 compared to 2019 mainly due to (i) the sale of the VLCCs VK Eddie and TI Hellas and the Suezmaxes Cap Diamant, Cap Guillaume and Finesse and (ii) more vessels that operated under a Time Charter in 2020.
The increase in freight rates compared to 2019 is related to the fact that as from the end of the first quarter of 2020, the tanker market benefited from the development of three key factors. Firstly, unilateral actions were taken by Saudi Arabia in simultaneously cutting their oil prices but also raising their crude oil exports. This prompted a large short-term increase in demand for tanker tonnage, primarily in the average TCEVLCC sector. Secondly, the restrictions taken by governments to curtail the COVID-19 virus globally curbed economic activity and consequently crude oil consumption. This led to a steep and rapid disconnect between crude oil demand and supply alongside a wide contango. Thirdly, this pricing structure itself further incentivized the storage of crude oil for financial gain during April/May 2020, thus increasing short-term the demand for tonnage to store this excess oil. The second half of 2020 was partially offsetnegatively impacted by an increase of the total number of vessel operating days.tankers returning from such storage activity, increasing the supply side while the demand for transportation was rather flat.
Time Charter Revenues. Time charter revenues decreasedincreased by 15%26%, or $21.5$23.6 million, to $118.7$113.9 million for the year ended December 31, 2017,2020, compared to $140.2$90.3 million for 2016.2019. This decreaseincrease was primarily due to severalnew time charters at improved rates signed in the course 2019 and 2020 and profit splits received on certain time charter contracts that ended without being renewed during the course of 2017 combined with deteriorating spot market conditions that resulted in lower profit splits existing on some of those contracts.
Other Income. Other income decreased by 30%,remained on the same level or $2.1 million, to $4.9$10.1 million for the year ended December 31, 2017,2020, compared to $7$10.1 million for 2016.2019. Other income includes revenues related to the standard business operation of the fleet and that are not directly attributable to an individual voyage, such as insurance rebates received based on changes in our vessels' trading patterns.voyage.
Voyage Expenses and Commissions. Voyage expenses and commissions increaseddecreased by 4%13% or $2.5$19.3 million, to $(62.0)$(125.4) million for the year ended December 31, 2017,2020, compared to $(59.6)$(144.7) million for 2016.2019. This increasedecrease was primarily due to increaseda lower number of vessels performing spot voyages in 2020 due to an increase of time charters and a significant drop in oil prices which increased bunker expenses, the largest component of voyage expenses and fewer vessels operating under a long term time charter.corresponding price for fuel.
Net gain (loss) on lease terminations and net gain (loss) on the sale of assets.
The following table sets forth our gain (loss) on lease terminations and gain (loss) on the sale of assets for the years ended December 31, 20172020 and 2016:2019:
| | | | | | | | | | | | | | | | | | | | | | | | | | |
| (USD in thousands) | | 2020 | | 2019 | | $ Change | | % Change |
| Net gain (loss) on sale of assets (including impairment on non-current assets held for sale) | | 22,727 | | | 14,804 | | | 7,923 | | | 54 | % |
|
| | | | | | | | | | | | |
| (US$ in thousands) | | 2017 |
| 2016 |
| $ Change |
| % Change |
| Net gain (loss) on lease terminations | | — |
|
| — |
|
| — |
|
| 0 | % |
| Net gain (loss) on sale of assets (including impairment on non-current assets held for sale and loss on disposal of investments in equity-accounted investees) | | 15,511 |
|
| 26,245 |
|
| (10,734 | ) |
| (41 | )% |
Net gain (loss) on lease terminations. We did not terminate any leases during the years ended December 31, 2017 and 2016.
Net gain (loss) on sale of assets (including impairment on non-current assets held for sale, and loss on disposal of investments in equity-accounted investees)sale). Net gain (loss) decreasedincreased by 41%54%, or $10.7$7.9 million, to a net gain of $15.5$22.7 million for the year ended December 31, 2017,2020, compared to a net gain of $26.2$14.8 million for 2016.2019.
The net gain on sale of assets of $15.5$22.7 million in 2017 ,2020, represents the difference betweenaggregate of a gain of $8.5$12.8 million recorded on the sale of the Suezmax Cap GeorgesDiamant, a gain of $7.7$8.3 million recorded on the sale of the Suezmax Finesse, anda gain of $1.6 million on the sale of the VLCC Artois, TI Hellas.
The net gain on sale of assets of $14.8 million in 2019 represents the aggregate of a gain of $20.3$14.4 million recorded on the sale of the VLCC FlandreVK Eddie anda lossgain of 21.0$0.4 million on the sale of the VLCC TI Topaz.
The net gain on sale of assets of $26.2 million in 2016 represents the difference between a gain of $13.8 million recorded on the sale of the VLCC Famenne, a gain of $36.5 million recorded on the sale and lease back transaction of the VLCC Nautilus, Navarin, Neptun and Nucleus, and a loss of $24.1 million on the disposal of the joint ventures with Bretta, where we assumed full ownership of the two youngest vessels, the Suezmax Captain Michael and the Suezmax MariaLR1 Gener8 compatriot.
Vessel Operating Expenses.
The following table sets forth our vessel operating expenses for the years ended December 31, 20172020 and 2016:2019:
| | | (US$ in thousands) | | 2017 |
| 2016 |
| $ Change |
| % Change | |
| (USD in thousands) | | (USD in thousands) | | 2020 | | 2019 | | $ Change | | % Change |
| Total VLCC operating expenses | | 95,987 |
|
| 100,848 |
|
| (4,861 | ) |
| (5 | )% | Total VLCC operating expenses | | 141,755 | | | 138,512 | | | 3,243 | | | 2 | % |
| Total Suezmax operating expenses | | 54,440 |
|
| 59,351 |
|
| (4,911 | ) |
| (8 | )% | Total Suezmax operating expenses | | 68,839 | | | 72,415 | | | (3,576) | | | (5) | % |
| Total LR1 operating expenses | | Total LR1 operating expenses | | 40 | | | 868 | | | (828) | | | (95) | % |
| Total vessel operating expenses | | 150,427 |
|
| 160,199 |
|
| (9,772 | ) |
| (6 | )% | Total vessel operating expenses | | 210,634 | | | 211,795 | | | (1,161) | | | (1) | % |
Total vessel operating expenses decreased by 6%1%, or $9.8$1.2 million, to $150.4$210.6 million during the year ended December 31, 2017,2020, compared to $160.2$211.8 million for 2016.2019.
VLCC operating expenses decreasedincreased by 5%2%, or $4.9$3.2 million, during the year ended December 31, 2017,2020, compared to 2016. The decrease2019. This increase was primarily attributabledue to various cost savings and positive rate of exchange impact, partlya general increase in technical maintenance costs partially offset by the deliveryimpact of the sale of the VLCC ArdecheVK Eddie and VLCC Aquitaine in January 2017 and purchase of the VLCC V.K. Eddie in November 2016.TI Hellas.
Suezmax operating expenses decreaseddecrease by 8%5%, or $4.9$3.6 million, during the year ended December 31, 2017,2020, compared to 2016. The2019. This decrease was mainlyprimarily due to lower technical costs in general, partly offset by the acquisitionsale of the Suezmaxes MariaCap Diamant and Captain Michael followingFinesse.
LR1 operating expenses decreased by $(0.8) million, during the Share Swap and Claims Transfer Agreement. See Item 5. Operating and Financial Review and Prospects-Fleet Development.year ended December 31, 2020, compared to 2019. This decrease was due to the sale in the beginning of 2019 of the last remaining LR1 vessel, originally acquired in the merger with Gener8.
Time charter-in expenses and bareboat charter-hire expenses.
The following table sets forth our chartered-in vessel expenses and bareboat charter-hire expenses for the years ended December 31, 20172020 and 2016:2019:
| | | | | | | | | | | | | | | | | | | | | | | | | | |
| (USD in thousands) | | 2020 | | 2019 | | $ Change | | % Change |
| Time charter-in expenses | | 7,954 | | | 604 | | | 7,350 | | | 1,217 | % |
| Total charter hire expense | | 7,954 | | | 604 | | | 7,350 | | | 1,217 | % |
|
| | | | | | | | | | | | |
| (US$ in thousands) | | 2017 |
| 2016 |
| $ Change |
| % Change |
| Time charter-in expenses | | 62 |
|
| 16,921 |
|
| (16,859 | ) |
| (100 | )% |
| Bareboat charter-hire expenses | | 31,111 |
|
| 792 |
|
| 30,319 |
|
| 3,828 | % |
| Total charter hire expense | | 31,173 |
|
| 17,713 |
|
| 13,460 |
|
| 76 | % |
Time charter-in expenses. Time charter-in expenses decreasedincreased by 100%1,217%, or $16.9$7.4 million, to $0.1$8.0 million during the year ended December 31, 2017,2020, compared to $16.9$0.6 million for 2016.2019. The decreaseincrease was attributable to the expiration of twonew time charter partiescontract signed in 2016.
Bareboat charter-hire expenses. Bareboat charter-hire expenses increased by $30.3 million, to $31.1 millionthe course of 2019 for the year ended December 31, 2017, compared to $0.8 million for 2016. The increase was entirely attributable toDragon Satu used in the salebunker fuel project and leaseback transaction of the VLCCs Nautilus, Navarin, Nucleus and Neptun entered into on December 16, 2016.an internal time charter with Bari Shipholding Ltd, a joint venture.
General and administrative expenses.
The following table sets forth our general and administrative expenses for the years ended December 31, 20172020 and 2016:2019:
| | | | | | | | | | | | | | | | | | | | | | | | | | |
| (USD in thousands) | | 2020 | | 2019 | | $ Change | | % Change |
| General and administrative expenses | | 65,498 | | | 66,890 | | | (1,392) | | | (2) | % |
|
| | | | | | | | | | | | |
| (US$ in thousands) | | 2017 |
| 2016 |
| $ Change |
| % Change |
| General and administrative expenses | | 46,868 |
|
| 44,051 |
|
| 2,817 |
|
| 6 | % |
General and administrative expenses which include, also, amongamongst others, shore staff wages, directors' fees, office rental, consulting fees, audit fees and tonnage tax, increaseddecreased by 6%2%, or $2.8$1.4 million, to $46.9$65.5 million for the year ended December 31, 2017,2020, compared to $44.1$66.9 million for 2016.2019.
This increasedecrease was due to among other factors, an increase(i) a decrease of $0.5 million relating to tonnage tax due to a higher number of VLCCs in the fleet, and an increase of $1.7$3.9 million in administrative expenses related to the TI Pool,staff costs mainly due to the signing and usagesettlement following resignation of Mr. Paddy Rodgers our former CEO, during the first half of 2019, (ii) a senior secured linedecrease of credit to fund the working capital$3.1 million in the ordinary course of TI Pool's business of operating a pool of tankers vessels, including but not limited to the purchase of bunker fuel, the payment of expenses relating to specific voyages and supplies of pool vessels, commissions payable on fixtures, port costs, expenses for hull and propeller cleaning, canal costs, insurance costs for the account of the pool, and insurance and fees payable for towage of vessels. The TI Pool's financing expenses are part of the Pool administrative expenses which are borne by the Pool Participants, including Euronav. Furthermore, the auditlegal and other fees, increased by $0.6(iii) a decrease of 1.2 million for the year ended December 31, 2017, compared to 2016,in travel cost and restaurant costs due to the enhanced effort on internal processes excellence in 2017. Staff costs increased with $0.6 million due to an increased head count.COVID-19 restrictions.
This increasedecrease was offset partially by a decrease(i) increase of $0.7$2.5 million in directors’the Pool administrative fees due to a favorable ratebetter freight market, (ii) an increase of exchange1.2 million in IT expenses, (iii) an increase of $2.1 million in Tonnage tax due to the reversal of the voluntary tonnage tax provision in 2019 which was waived as a result of a change in the tonnage tax regime in 2019 and (iv) an increase in provision due to the resignationwrite off of onethe outstanding receivable of our directors. a chartering customer who is currently in restructuring.
Depreciation and amortization expenses.
The following table sets forth our depreciation and amortization expenses for the years ended December 31, 20172020 and 2016:2019:
| | | (US$ in thousands) | | 2017 |
| 2016 |
| $ Change |
| % Change | |
| (USD in thousands) | | (USD in thousands) | | 2020 | | 2019 | | $ Change | | % Change |
| Depreciation and amortization expenses | | 229,872 |
|
| 227,763 |
|
| 2,109 |
|
| 1 | % | Depreciation and amortization expenses | | 319,750 | | | 337,702 | | | (17,952) | | | (5) | % |
Depreciation and amortization expenses increaseddecreased by 1%5%, or $2.1$18.0 million, to $229.9$319.8 million for the year ended December 31, 2017,2020, compared to $227.8$337.7 million for 2016.2019.
Depreciation increaseddecreased primarily due to (i) the acquisition and delivery of the VLCCs Ardeche, Aquitaine, Alex, Anne and V.K. Eddie, resulting in an aggregate increase of $15.7 million, (ii) an increase in depreciation of drydock of $3.6 million and (iii) an increase of $3.6 million due to the acquisition of full ownershipsale of the Suezmaxes MariaCap Diamant and Captain Michael followingFinesse in 2020resulting in a decrease of $8.4 million, (ii) the Share Swapsale of the VLCC TI Hellas in 2020 resulting in a decrease of $5.2 million, (iii) the sale of the VLCC VK Eddie in 2019 resulting in a decrease of 2.1 million, and Claims Transfer Agreement (see Fleet Development). (iv) a change in the depreciation schedule for the 3 VLCCs Nectar, Nautica and Noble, who were sold under a sale and lease back end of 2019 and as the transaction was not considered a sale under IFRS 15 will remain on the balance sheet of the Group till the end of the contract.
This increasedecrease was partially offset by a decrease in depreciations due to (i) the sale and leaseback transactiontime charter-in of the VLCCs Nautilus, Navarin, Nucleustwo Suezmaxes Marlin Somerset and Neptun entered into on DecemberMarlin Sardinia, which is categorized as a lease under IFRS 16, 2016, resulting in an aggregate decrease of $13.3 million (ii) the sale and delivery of the VLCC TI Topaz to its new owner on June 9, 2017, (iii) the sale and delivery of the Suezmax Cap Georges to its new owner on November 29, 2017, (iv) the sale and delivery of the VLCC Flandre to its new owner on December 20, 2017 and (iv) the sale and delivery of the VLCC Artois to its new owner on December 4, 2017 resulting in a combined decreaseright of $6.2use asset and corresponding recognized depreciations amounting to an aggregate of $2.1 million.
Finance Expenses.
The following table sets forth our finance expenses for the years ended December 31, 20172020 and 2016:2019:
| | | (US$ in thousands) | | 2017 |
| 2016 |
| $ Change |
| % Change | |
| (USD in thousands) | | (USD in thousands) | | 2020 | | 2019 | | $ Change | | % Change |
| Interest expense on financial liabilities measured at amortized cost | | 38,391 |
|
| 39,007 |
|
| (616 | ) |
| (2 | )% | Interest expense on financial liabilities measured at amortized cost | | 62,350 | | | 84,378 | | | (22,028) | | | (26) | % |
| Interest Leasing | | Interest Leasing | | 3,287 | | | 4,811 | | | (1,524) | | | (32) | % |
| Fair value adjustment on interest rate swaps | | Fair value adjustment on interest rate swaps | | 108 | | | 8,533 | | | (8,425) | | | (99) | % |
| Other financial charges | | 5,819 |
|
| 4,577 |
|
| 1,242 |
|
| 27 | % | Other financial charges | | 9,936 | | | 7,474 | | | 2,462 | | | 33 | % |
| Foreign exchange losses | | 6,521 |
|
| 8,111 |
|
| (1,590 | ) |
| (20 | )% | Foreign exchange losses | | 15,872 | | | 14,607 | | | 1,265 | | | 9 | % |
| Finance expenses | | 50,731 |
|
| 51,695 |
|
| (964 | ) |
| (2 | )% | Finance expenses | | 91,553 | | | 119,803 | | | (28,250) | | | (24) | % |
Finance expenses decreased by 2%24%, or $1.0$28.3 million, to $50.7$91.6 million for the year ended December 31, 2017,2020, compared to $51.7$119.8 million for 2016.2019.
Interest expense on financial liabilities measured at amortized cost decreased by 2%26%, or $0.6$22.0 million, during the year ended December 31, 2017,2020, compared to 2016.2019. This decrease was primarily attributable to the decrease in average outstanding debt during the year ended December 31, 2017,2020, compared to the same period in 2016, partially offset by an increase2019, and a decrease of floating interest rates in 2017. 2020 compared to 2019. This decrease was partially offset by the recognition of $11.1 million in interest expenses due to the sale and leaseback agreement for three VLCCs entered into December 30, 2019.
Interest leasing is the interest on lease liabilities which were recognized due to the adoption of IFRS 16 on January 1, 2019. The decrease in interest leasing is due to decreasing interest expenses over the duration of the existing leasing contracts
Fair value adjustment on interest rate swaps relate primarily to interest rate swaps which were acquired in the merger with Gener8 and of which the fair value at acquisition is amortized over the remaining duration of the swap via the fair value adjustment of interest rate swaps. Most of the swaps were unwound in 2019 and the last two interest rate swaps matured in September 2020.
Other financial charges increased by 27%33%, or $1.2$2.5 million, to $5.8$9.9 million for the year ended December 31, 2017,2020, compared to $4.6$7.5 million for 2016.2019. This increase was primarily attributable to commitment fees paid for available credit lines, offor which the total availability increased in 2017.2020.
Foreign exchange losses decreasedincreased by 20%9%, or $1.6$1.3 million, primarily due to change in exchange rates between the EUR and the USD.
Share of results of equity accounted investees, net of income tax.
The following table sets forth our share of results of equity accounted investees (net of income tax) for the years ended December 31, 20172020 and 2016:2019:
| | | | | | | | | | | | | | | | | | | | | | | | | | |
| (USD in thousands) | | 2020 | | 2019 | | $ Change | | % Change |
| Share of results of equity accounted investees | | 10,917 | | | 16,460 | | | (5,543) | | | (34) | % |
|
| | | | | | | | | | | | |
| (US$ in thousands) | | 2017 |
| 2016 |
| $ Change |
| % Change |
| Share of results of equity accounted investees | | 30,082 |
|
| 40,495 |
|
| (10,413 | ) |
| (26 | )% |
As at December 31, 2017,2020, our equity accounted investees included two joint ventures which owned one FSO each.each one joint venture which owned a Suezmax and one joint venture who previously owned the Suezmax Bastia, which was sold in September 2020.
On June 2, 2016, we entered into a Share Swap and Claims Transfer Agreement whereby (i) we transferred our 50% equity interest in Moneghetti and Fontvieille, and, as consideration therefor, acquired from Bretta its 50% ownership interest in Fiorano and Larvotto; and (ii) we transferred our claims arising from the shareholder loans to Moneghetti and Fontvieille and acquired Bretta’s claims arising from the shareholder loans to Fiorano and Larvotto. As a result, our equity interest in both Fiorano and Larvotto increased from 50% to 100% giving us control of both companies. We no longer have an equity interest in Moneghetti and Fontvieille. Before the swap agreement, we accounted for the four entities using the equity method. Following the acquisition, Fiorano and Larvotto are fully consolidated as of June 2, 2016. These transactions led to aThe decrease in the share of resultsresult of equity accounted investees for the year ended December 31, 2017, by $2.0 million compared to 2016.
On November 23, 2016, we took delivery of the VLCC V.K. Eddie that we purchased from our 50% joint venture Seven Seas. As a result, our share of the profit of this joint venture for the year ended December 31, 2017, was $3.7 million lower compared to 2016.
The result of our participations in the 50%-owned joint ventures, TI Asia Ltd. and TI Africa Ltd., the owners of FSO Asia and FSO Africa, respectively, have decreased by an aggregate of $4.6 million, mostlyis mainly due to thea recognition of a deferred tax liability and lower revenue underfollowing the new FSO contracts which started in July and September 2017signing of an extension for the FSO Asia and FSO Africa, respectively. This was partly offset by lower interest expense after the repaymenttwo FSOs, until 2032, which caused an increase of the remaining bank debt in July 2017.taxable difference between the current carrying amount at the end of the contracts for both FSOs.
Income tax benefit/(expense).
The following table sets forth our income tax benefit/(expense) for the years ended December 31, 20172020 and 2016:2019:
| | | (US$ in thousands) | | 2017 |
| 2016 |
| $ Change |
| % Change | |
| (USD in thousands) | | (USD in thousands) | | 2020 | | 2019 | | $ Change | | % Change |
| Income tax benefit (expense) | | 1,358 |
|
| 174 |
|
| 1,184 |
|
| 680 | % | Income tax benefit (expense) | | (1,944) | | | (602) | | | (1,342) | | | 223 | % |
Income tax benefit/(expense) increased by 680%223%, or $1.2$1.3 million, to a benefitan expense of $1.4$1.9 million for the year ended December 31, 2017,2020, compared to a benefitan expense of $0.2$0.6 million for 2016,2019, which was mainly attributable to the recognitionreversal of a deferred tax asset related to our fully owned subsidiary Euronav Luxembourg.Luxembourg in 2020.
Year ended December 31, 2016, compared to the year ended December 31, 2015
Total shipping revenues and voyage expenses and commissions.
The following table sets forth our total shipping revenues and voyage expenses and commissions for the years ended December 31, 2016 and 2015:
|
| | | | | | | | | | | | |
| (US$ in thousands) | | 2016 |
| 2015 |
| $ Change |
| % Change |
| Voyage charter and pool revenues | | 544,038 |
|
| 720,416 |
|
| (176,378 | ) |
| (24 | )% |
| Time charter revenues | | 140,227 |
|
| 126,091 |
|
| 14,136 |
|
| 11 | % |
| Other income | | 6,996 |
|
| 7,426 |
|
| (430 | ) |
| (6 | )% |
| Total shipping revenues | | 691,261 |
|
| 853,933 |
|
| (162,672 | ) |
| (19 | )% |
| Voyage expenses and commissions | | (59,560 | ) |
| (71,237 | ) |
| 11,677 |
|
| (16 | )% |
Voyage Charter and Pool Revenues. Voyage charter and pool revenues decreased by 24%, or $176.4 million, to $544.0 million for the year ended December 31, 2016, compared to $720.4 million for the same period in 2015. This decrease was due to a decrease in the average TCE rates for VLCCs and Suezmax tankers from $52,802 and $39,689, respectively in 2015 to $42,243 and $27,114, respectively in 2016. This decrease in the average TCE was partially offset by an increase of the total number of vessel operating days.
Time Charter Revenues. Time charter revenues increased by 11%, or $14.1 million, to $140.2 million for the year ended December 31, 2016, compared to $126.1 million for the same period in 2015. This increase was partly due to several new time charter contracts at the end of 2015 and in 2016 resulting in an increase in fixed operating days. The increase in fixed operating days was partially offset by a lower rate received during 2016 due to renewal of charters and by the market-related profit share earned on certain of our time charter-out vessels due to less favorable market conditions.
Other Income. Other income decreased by 6%, or $0.4 million, to $7.0 million for the year ended December 31, 2016, compared to $7.4 million for the same period in 2015. Other income includes revenues related to the daily standard business operation of the fleet that are not directly attributable to an individual voyage, such as insurance rebates received based on changes in our vessels' trading patterns.
Voyage Expenses and Commissions. Voyage expenses and commissions decreased by 16% or $11.7 million, to $(59.6) million for the year ended December 31, 2016, compared to $(71.2) million for the same period in 2015. This decrease was primarily due to a decrease of oil prices which reduced bunker expenses, the largest component of voyage expenses and more vessels operating under a long term time charter.
Net gain (loss) on lease terminations and net gain (loss) on the sale of assets.
The following table sets forth our gain (loss) on lease terminations and gain (loss) on the sale of assets for the years ended December 31, 2016 and 2015:
|
| | | | | | | | | | | | |
| (US$ in thousands) | | 2016 |
| 2015 |
| $ Change |
| % Change |
| Net gain (loss) on lease terminations | | — |
|
| — |
|
| — |
|
| 0 | % |
| Net gain (loss) on sale of assets (including impairment on non-current assets held for sale and loss on disposal of investments in equity-accounted investees) | | 26,247 |
|
| 5,300 |
|
| 20,947 |
|
| 395 | % |
Net gain (loss) on lease terminations. We did not terminate any leases during the years ended December 31, 2016 and 2015.
Net gain (loss) on sale of assets (including impairment on non-current assets held for sale, and loss on disposal of investments in equity-accounted investees). Net gain (loss) increased by 395%, or $20.9 million, to a gain of $26.2 million for the year ended December 31, 2016, compared to a gain of $5.3 million for the same period in 2015. The net gain on sale of assets of $26.2 million in 2016 represents the difference between a capital gain of $13.8 million recorded on the sale of the VLCC Famenne, a capital gain of $36.5 million recorded on the sale and lease back transaction of the VLCC Nautilus, Navarin, Neptun and Nucleus, and a loss of $24.1 million on the disposal of the joint ventures with Bretta, where we assumed full ownership of the two youngest vessels, the Suezmax Captain Michael and the Suezmax Maria. The net gain on sale of assets of $5.3 million in 2015 represents the difference between a capital gain of $11.1 million on the sale of the Suezmax Cap Laurent, an additional capital gain of $2.2 million on the sale of the VLCC Antarctica, and a write-off of the $8.0 million option fee related to the option to purchase four VLCCs from the seller of the Metrostar Acquisition Vessels, which our Board of Directors decided not to exercise in the third quarter of 2015.
Vessel Operating Expenses.
The following table sets forth our vessel operating expenses for the years ended December 31, 2016 and 2015:
|
| | | | | | | | | | | | |
| (US$ in thousands) | | 2016 |
| 2015 |
| $ Change |
| % Change |
| Total VLCC operating expenses | | 100,848 |
|
| 99,682 |
|
| 1,166 |
|
| 1 | % |
| Total Suezmax operating expenses | | 59,351 |
|
| 54,036 |
|
| 5,315 |
|
| 10 | % |
| Total vessel operating expenses | | 160,199 |
|
| 153,718 |
|
| 6,481 |
|
| 4 | % |
Total vessel operating expenses increased by 4%, or $6.5 million, to $160.2 million during the year ended December 31, 2016, compared to $153.7 million for the same period in 2015. This increase was primarily due to an increase in the number of vessels operated by us (i) following the delivery of newbuildings the VLCCs Alice, Alex, and Anne , (ii) the acquisition of the joint venture stake we did not own in the Suezmaxes Captain Michael, Maria and VLCC V.K. Eddie (see Fleet Development). The increase was partly offset by the sale of the VLCC Famenne and Suezmax Cap Laurent.
VLCC operating expenses increased by 1%, or $1.2 million, during the year ended December 31, 2016, compared to the same period 2015. The increase was primarily attributable to additional vessels acquired and delivered in 2016 and in the course of 2015, offset by the sale of the Famenne and lower technical expenses in general.
Suezmax operating expenses increased by 10%, or $5.3 million, during the year ended December 31, 2016, compared to the same period 2015. The increase was mainly due to the Suezmaxes Maria and Captain Michael following the Share Swap and Claims Transfer Agreement (see Fleet Development), partially offset by the sale of the Cap Laurent at the end of 2015.
Time charter-in expenses and bareboat charter-hire expenses.
The following table sets forth our chartered-in vessel expenses and bareboat charter-hire expenses for the years ended December 31, 2016 and 2015:
|
| | | | | | | | | | | | |
| (US$ in thousands) | | 2016 |
| 2015 |
| $ Change |
| % Change |
| Time charter-in expenses | | 16,921 |
|
| 25,849 |
|
| (8,928 | ) |
| (35 | )% |
| Bareboat charter-hire expenses | | 792 |
|
| — |
|
| 792 |
|
| — |
|
| Total charter hire expense | | 17,713 |
|
| 25,849 |
|
| (8,136 | ) |
| (31 | )% |
Time charter-in expenses. Time charter-in expenses decreased by 35%, or $8.9 million, to $16.9 million during the year ended December 31, 2016, compared to $25.8 million for the same period in 2015. The decrease was attributable primarily to the expiration of two time charter parties in 2016.
Bareboat charter-hire expenses. Bareboat charter-hire expenses increased by $0.8 million, to $0.8 million for the year ended December 31, 2016, compared to $0.0 million for the same period in 2015. The increase was entirely attributable to the sale and leaseback transaction of the VLCCs Nautilus, Navarin, Nucleus and Neptun on December 22, 2016.
General and administrative expenses.
The following table sets forth our general and administrative expenses for the years ended December 31, 2016 and 2015:
|
| | | | | | | | | | | | |
| (US$ in thousands) | | 2016 |
| 2015 |
| $ Change |
| % Change |
| General and administrative expenses | | 44,051 |
|
| 46,251 |
|
| (2,200 | ) |
| (5 | )% |
General and administrative expenses which include also, among others, directors' fees, office rental, consulting fees, audit fees and tonnage tax, decreased by 5%, or $2.2 million, to $44.1 million for the year ended December 31, 2016, compared to $46.3 million for the same period in 2015.
This decrease was due to, among other factors, a decrease of $1.2 million relating to equity-settled share based payments, a decrease of $0.4 million in rental expenses, a decrease of $0.4 million in directors' fees, a decrease of $0.3 million in travel expenses, and a $0.7 million reversal of provisions for onerous contracts.
Furthermore, the administrative expenses related to the TI Pool decreased by $0.9 million during the year ended December 31, 2016, compared to the same period in 2015, mainly due to the lower freight market.
The audit and other fees increased by $0.9 million during the year ended December 31, 2016, compared to the same period in 2015, due to the implementation and audit of an enhanced framework of internal controls.
The mortgages and registration fees increased by $0.9 million during the year ended December 31, 2016 compared to the same period in 2015, due to the sale of certain vessels between consolidated companies in the course of 2016.
Depreciation and amortization expenses.
The following table sets forth our depreciation and amortization expenses for the years ended December 31, 2016 and 2015:
|
| | | | | | | | | | | | |
| (US$ in thousands) | | 2016 |
| 2015 |
| $ Change |
| % Change |
| Depreciation and amortization expenses | | 227,763 |
|
| 210,206 |
|
| 17,557 |
|
| 8 | % |
Depreciation and amortization expenses increased by 8%, or $17.6 million, to $227.8 million for the year ended December 31, 2016, compared to $210.2 million for the same period in 2015.
Depreciations increased primarily due to (i) the acquisition and delivery of the VLCCs Antigone, Alice, Alex and Anne, resulting in an aggregate increase of $16.0 million, (ii) an increase in depreciation of drydock of $3.3 million and (iii) the acquisition of full ownership of the Suezmaxes Maria and Captain Michael following the Share Swap and Claims Transfer Agreement (see Fleet Development). This increase was partially offset by a decrease in depreciations due to (i) the sale and delivery of the VLCC Famenne and Suezmax Cap Laurent to their respective new owners on March 9, 2016 and November 26, 2015, respectively, resulting in a combined decrease of $7.9 million.
Finance Expenses.
The following table sets forth our finance expenses for the years ended December 31, 2016 and 2015:
|
| | | | | | | | | | | | |
| (US$ in thousands) | | 2016 |
| 2015 |
| $ Change |
| % Change |
| Interest expense on financial liabilities measured at amortized cost | | 39,007 |
|
| 38,246 |
|
| 761 |
|
| 2 | % |
| Other financial charges | | 4,577 |
|
| 8,482 |
|
| (3,905 | ) |
| (46 | )% |
| Foreign exchange losses | | 8,111 |
|
| 4,214 |
|
| 3,897 |
|
| 92 | % |
| Finance expenses | | 51,695 |
|
| 50,942 |
|
| 753 |
|
| 1 | % |
Finance expenses increased by 1%, or $0.8 million, to $51.7 million for the year ended December 31, 2016, compared to $50.9 million for the same period in 2015.
Interest expense on financial liabilities measured at amortized cost increased by 2%, or $0.8 million, during the year ended December 31, 2016, compared to the same period in 2015. This increase was primarily attributable to the increase of floating interest rates in 2016, offset by a decrease in average outstanding debt during the year ended December 31, 2016, compared to the same period in 2015. Other financial charges decreased by (46)%, or $ (3.9) million, to $4.6 million for the year ended December 31, 2016, compared to $8.5 million for the same period in 2015. This decrease was primarily attributable to the repayment of the $235.5 million bond, issued to partly finance the acquisition of the Maersk Acquisition Vessels, in the first quarter of 2015. As the bond was issued below par and in accordance with IFRS, we amortized $4.1 million in the first quarter of 2015.
Foreign exchange losses increased by 92%, or $3.9 million, due to change in exchange rates between the EUR and the USD.
Share of results of equity accounted investees, net of income tax.
The following table sets forth our share of results of equity accounted investees (net of income tax) for the years ended December 31, 2016 and 2015:
|
| | | | | | | | | | | | |
| (US$ in thousands) | | 2016 |
| 2015 |
| $ Change |
| % Change |
| Share of results of equity accounted investees | | 40,495 |
|
| 51,592 |
|
| (11,097 | ) |
| (22 | )% |
As at December 31, 2015, our equity accounted investees included one joint venture which owned one VLCC, four joint ventures which owned one Suezmax each, and two joint ventures which owned one FSO each.
On June 2, 2016, we entered into a Share Swap and Claims Transfer Agreement whereby (i) we transferred our 50% equity interest in Moneghetti and Fontvieille, and, as consideration therefor, acquired from Bretta its 50% ownership interest in Fiorano and Larvotto; and (ii) we transferred our claims arising from the shareholder loans to Moneghetti and Fontvieille and acquired Bretta's claims arising from the shareholder loans to Fiorano and Larvotto. As a result, our equity interest in both Fiorano and Larvotto increased from 50% to 100% giving us control of both companies. We no longer have an equity interest in Moneghetti and Fontvieille. Before the swap agreement, we accounted for the four entities using the equity method. Following the acquisition, Fiorano and Larvotto are fully consolidated as of June 2, 2016. These transactions led to a decrease in the share of results of equity accounted investees by $10.6 million compared to 2015.
On November 23, 2016, we took delivery of the VLCC V.K. Eddie that we purchased from our 50% joint venture Seven Seas. Our share of the profit of this joint venture for the year ended December 31, 2016 was $2.2 million lower than in the year ended December 31, 2015.
The result of our participations in the 50%-owned joint ventures, TI Asia Ltd. and TI Africa Ltd., the owners of FSO Asia and FSO Africa, respectively, have increased by an aggregate of $1.4 million, mostly due to lower daily operating expenses.
Income tax benefit/(expense).
The following table sets forth our income tax benefit/(expense) for the years ended December 31, 2016 and 2015:
|
| | | | | | | | | | | | |
| (US$ in thousands) | | 2016 |
| 2015 |
| $ Change |
| % Change |
| Income tax benefit (expense) | | 174 |
|
| (5,633 | ) |
| 5,807 |
|
| (103 | )% |
Income tax benefit/(expense) decreased by 103%, or $5.8 million, to a benefit of $0.2 million for the year ended December 31, 2016, compared to an expense of $5.6 million for the same period in 2015, which was mainly attributable to the fact that two Belgian subsidiaries applied the tonnage tax regime as from January 1, 2016.
B. Liquidity and capital resourcesCapital Resources
We operate in a capital intensive industry and have historically financed our purchase of tankers and other capital expenditures through a combination of cash generated from operations, equity capital, borrowings from commercial banks and the occasional issuance of convertible or other unsecured notes. Our ability to generate adequate cash flows on a short- and medium-term basis depends substantially on the trading performance of our vessels. Historically, market rates for charters of our vessels have been volatile. Periodic adjustments to the supply of and demand for oil tankers cause the industry to be cyclical in nature. We expect continued volatility in market rates for our vessels in the foreseeable future with a consequent effect on our short- and medium-term liquidity.
Our funding and treasury activities are conducted within corporate policies to maximize investment returns while maintaining appropriate liquidity for our requirements. Cash and cash equivalents are held primarily in U.S. dollars with some balances held in British Pounds, Euros, and other currencies we may hold for limited amounts.
As of December 31, 20172020 and December 31, 2016,2019, we had $143.6$161.5 million and $206.7$297.0 million in cash and cash equivalents, respectively.
Our short-term liquidity requirements relate to payment of operating costs (including certain repairs performed in drydock)drydock and the installation of on-board systems to treat ballast water), lease payments for our chartered-in fleet, funding working capital requirements, maintaining cash reserves against fluctuations in operating cash flows as well as maintaining some cash balances on accounts pledged under borrowings from commercial banks.
Sources of short-term liquidity include cash balances, restricted cash balances, syndicated credit lines, short-term investments and receipts from our customers. Revenues from time charters and bareboat charters are generally received monthly in advance. Revenues from FSO service contracts are received monthly in arrears while revenues from voyage charters are received upon completion of the voyage. As of December 31, 20172020 and December 31, 2016,2019, we had $ 60.0$0.0 million and $ 60.0$60.0 million in available syndicated credit lines, respectively.
Our medium- and long-term liquidity requirements include funding the equity portion of investments in new or replacement vessels and funding all the payments we are required to make under our loan agreements with commercial banks. Sources of funding for our medium- and long-term liquidity requirements include new loans, refinancing of existing arrangements, drawdown under committed secured revolving credit facilities, issuance of new notes or refinancing of existing ones via public and private debt offerings, equity issues, vessel sales and sale and leaseback arrangements. As of December 31, 20172020 and December 31, 2016,2019, we had $ 547.4$940.4 million and $ 295.8$693.1 million in available committed secured revolving credit facilities, respectively.
Net cash from (used in) operating activities during the year ended December 31, 20172020 was $211.3$969.8 million, compared to $438.2$272.0 million during the year ended December 31, 2016.2019. Our partial reliance on the spot market contributes to fluctuations in cash flows from operating activities as a result of its exposure to highly cyclical tanker rates. Any increase or decrease in the average TCE rates earned by our vessels in periods subsequent to December 31, 20172020 will have a positive or negative comparative impact, respectively, on the amount of cash provided by operating activities.
We believe that our working capital resources are sufficient to meet our requirements for the next 12 months from the date of this annual report.
As of December 31, 20172020 and December 31, 2016,2019, our total indebtedness was $964.6$1,375.5 million and $1,159.0$1,853.0 million respectively.
We expect to finance our funding requirements with cash on hand, operating cash flow and bank debt or other types of debt financing. In the event that our cash flow from operations does not enable us to satisfy our short-term or medium- to long-term liquidity requirements, we will also have to consider alternatives, such as raising equity, or new convertible notes, which could dilute shareholders, or selling assets (including investments), which could negatively impact our financial results, depending on market conditions at the time, establish new loans or refinancing of existing arrangements.
Our Borrowing Activities
| | | | | Amounts Outstanding as of | | | Amounts Outstanding as of |
| (US$ in thousands) | | December 31, 2017 | | December 31, 2016 | (US$ in thousands) | | December 31,
2020 | | December 31,
2019 |
| Euronav NV Credit Facilities | | | | | Euronav NV Credit Facilities | | | | |
| $500.0 Million Senior Secured Credit Facility |
| — |
|
| — |
| |
| $340.0 Million Senior Secured Credit Facility |
| 111,666 |
|
| 207,271 |
| $340.0 Million Senior Secured Credit Facility | | — | | | 43,447 | |
| $750.0 Million Senior Secured Credit Facility |
| 330,000 |
|
| 612,050 |
| $750.0 Million Senior Secured Credit Facility | | — | | | 130,000 | |
| $409.5 Million Senior Secured Credit Facility |
| 118,000 |
|
| 222,036 |
| $409.5 Million Senior Secured Credit Facility | | 65,000 | | | 90,000 | |
| $67.5 Million Secured Loan Facility (Larvotto) |
| 25,173 |
|
| 29,143 |
| |
| $76.0 Million Secured Loan Facility (Fiorano) |
| 23,563 |
|
| 27,813 |
| |
| $108.5 Million Secured Loan Facility | | 104,932 |
| | — |
| |
| $108.5 Million Senior Secured Credit Facility | | $108.5 Million Senior Secured Credit Facility | | 83,221 | | | 90,458 | |
| $173.5 Million Senior Secured Credit Facility | | $173.5 Million Senior Secured Credit Facility | | 143,613 | | | 156,918 | |
| $200.0 Million Senior Secured Credit Facility | | $200.0 Million Senior Secured Credit Facility | | 55,000 | | | 100,000 | |
| $100.0 Million Senior Secured Credit Facility | | $100.0 Million Senior Secured Credit Facility | | — | | | 70,000 | |
| $700.0 Million Senior Secured Credit Facility | | $700.0 Million Senior Secured Credit Facility | | 345,000 | | | 560,000 | |
| $713.0 Million Sustainability Linked Senior Secured Credit Facility | | $713.0 Million Sustainability Linked Senior Secured Credit Facility | | 185,000 | | | — | |
| | | | | | |
| Credit Line Facilities | | | | | Credit Line Facilities | |
| Credit lines |
| — |
|
| — |
| |
| Credit Lines | | Credit Lines | | — | | | — | |
| | | | | | |
| Senior unsecured bond | | | | | Senior unsecured bond | |
| Senior unsecured bond | | 150,000 |
| | — |
| |
| Senior Unsecured Bond | | Senior Unsecured Bond | | 199,000 | | | 200,000 | |
| | | | | | |
| Treasury notes program | | | | | Treasury notes program | |
| Treasury notes program | | 50,010 |
| | — |
| |
| Treasury Notes Program | | Treasury Notes Program | | 38,654 | | | 122,788 | |
| | Other borrowings | | Other borrowings | |
| Other borrowings | | Other borrowings | | 112,699 | | | 124,425 | |
| | | | | | |
| Total interest bearing debt | | 913,344 |
| | 1,098,313 |
| Total interest bearing debt | | 1,227,187 | | | 1,688,036 | |
| | | | | | |
| Joint Venture Credit Facilities (at 50% economic interest) | | |
| | |
| Joint Venture Credit Facilities (at 50% economic interest) | | | | |
| $500.0 Million Secured Loan Facility (TI Asia and TI Africa) |
| — |
|
| 37,671 |
| |
| $220.0 Million Senior Secured Facility (TI Asia and TI Africa) | | $220.0 Million Senior Secured Facility (TI Asia and TI Africa) | | 45,180 | | | 69,592 | |
| | | | | | | | | |
| Total interest bearing debt - joint ventures | | — |
| | 37,671 |
| Total interest bearing debt - joint ventures | | 45,180 | | | 69,592 | |
Euronav NV Credit Facilities
$500.0 Million Senior Secured Credit Facility
On March 25, 2014, we entered into a $500.0 million senior secured credit facility with DNB Bank ASA, Nordea Bank Norge ASA, and Skandinaviska Enskilda Banken AB (publ). The proceeds of the facility were drawn and used to partially finance the purchase price of the 15 VLCCs which we acquired from Maersk Tankers in 2014. On December 21, 2016, we repaid this facility in full using a portion of the borrowings under our new $409.5 million Senior Secured Credit Facility.
$340.0 Million Senior Secured Credit Facility
On October 13, 2014, we entered into a $340.0 million senior secured credit facility with a syndicate of banks and ING Bank N.V., as Agent and Security Trustee. Borrowings under this facility have been used to partially finance our acquisition of the VLCC Maersk Acquisition Vessels and to repay $153.1 million of outstanding debt and retire our $300.0 million Secured Loan Facility dated April 3, 2009. This facility is comprised of (i) a $148.0 million non-amortizing revolving credit facility and (ii) a $192.0 million term loan facility. This facility has a term of 7 years and bears interest at LIBOR plus a margin of 2.25% per annum. This credit facility is secured by eight of our wholly-owned vessels,vessels. Following the Fraternity, Felicity, Cap Felix, Cap Theodora andsale of the VLCC Acquisition Vessels. As of December 31, 2017 and December 31, 2016Suezmax Felicity in January 2019, the outstanding balance ontotal revolving credit facility was reduced by $13.6 million. On September 29, 2020, we repaid this facility was $111.7in full using a portion of the borrowings under our new $713.0 million and $207.3 million, respectively.Sustainability linked Senior Secured Credit Facility
$750.0 Million Senior Secured Credit Facility
On August 19, 2015, we entered into a $750.0 million secured loan facility with a syndicate of banks and Nordea Bank Norge SA, as Agent and Security Agent. This facility is comprised of a $500.0 million revolving credit facility, a $250.0 million revolving acquisition facility, and an uncommitted $250.0 million upsize facility. We used the proceeds of this facility to refinance all remaining indebtedness under our $750.0 million senior secured credit facility (2011) and our $65.0 million secured credit facility and for the acquisition of the Metrostar Acquisition Vessels in June 2015. This facility is secured by 24 of our wholly-owned vessels. The revolving credit facility is reduced in 13 installments of consecutive six-month interval. The revolving acquisition facility is reduced in 13 installments of consecutive six-month interval and a final $154.0 million repayment is due at maturity in 2022. This facility bears interest at LIBOR plus a margin of 1.95% per annum plus applicable mandatory costs. Following the sale of the Cap Laurent in November 2015, the total revolving credit facility was reduced by $11.5 million. Following the sale of the Famenne in January 2016, the total revolving credit facility was reduced by $21.3 million. Following the sale of the VLCC TI Topaz in June 2017, the total revolving credit facility was reduced by $19.5 million. Following the sale of the Suezmax Cap Georges in November 2017, the total revolving credit facility was reduced by $7.5 million. Following the sale of the VLCC Artois and Flandre in December 2017, the total revolving credit facility was reduced by $35.5 million. Following the sale of the Suezmax Cap Jean in May 2018, the total revolving credit facility was reduced by $7.4 million. Following the sale of the Suezmax Cap Romuald in August 2018, the total revolving credit facility was reduced by $7.4 million. Following the sale of the Suezmax Finesse in February 2020, the total revolving credit facility was reduced by $6.3 million. Following the sale of the Suezmax Cap Diamant in April 2020, the total revolving credit facility was reduced by $4.0 million. Following the sale of the VLCC TI Hellas in May 2020, the total revolving credit facility was reduced by $9.2 million. In September 2020, five vessels under this facility were refinanced under the new $713.0 Sustainability linked Senior Secured Credit Facility and the total commitment was therefore reduced by $190.5 million. As of December 31, 20172020 and December 31, 20162019 the outstanding balance on this facility was $330.0$0.0 million and $612.1$130.0 million, respectively.
$409.5 Million Senior Secured Credit Facility
On December 16, 2016, we entered into a $409.5 million senior secured amortizing revolving credit facility with a syndicate of banks and Nordea Bank Norge SA, as Agent and Security Agent. We used the proceeds of this facility to refinance all remaining indebtedness under our $500.0 Million Senior Secured Credit Facility. This facility is secured by 11 of our wholly-owned vessels. The revolving credit facility is reduced in 12 installments of consecutive six-month interval and a final $129.2 million repayment is due at maturity in 2023. This facility bears interest at LIBOR plus a margin of 2.25% per annum plus applicable mandatory costs. Following the sale and lease back of the VLCC Nautica, Nectar and Noble in December 2019, this facility was reduced by $56.9 million. As of December 31, 20172020 and December 31, 2016,2019, the outstanding balance on this facility was $118.0$65.0 million and $222.0$90.0 million, respectively.
$67.5 Million Secured Loan Facility (Larvotto)
On August 29, 2008, one of our previously 50%-owned joint ventures, Larvotto Shipholding Limited, entered into a $67.5 million loan facility, as supplemented by a supplemental letter dated November 28, 2011, with Fortis Bank S.A./N.V. to partially finance the acquisition of the Maria. This loan has a term of eight years starting after the delivery of the vessel (January 2012) with a balloon payment of $16.2 million due at maturity. This loan bears interest at LIBOR plus a margin of 1.5% per annum. As of December 31, 2015, the outstanding balance on this facility was $33.1 million of which we had a 50% economic interest of $16.5 million. After the Share Swap and Claims Transfer Agreement (see Fleet Development), we acquired the full economic interest in this loan facility, and as of December 31, 2017 and December 31, 2016, the outstanding balance on this facility was $25.2 million and $29.1 million, respectively.
$76.0 Million Secured Loan Facility (Fiorano)
On October 23, 2008, one of our previously 50%-owned joint ventures, Fiorano Shipholding Limited, entered into a $76.0 million loan facility with Scotiabank Ireland Ltd. to partially finance the acquisition of the Capt. Michael. This loan had an original term of eight years and was extended in January 2017 bringing the final maturity date to January 31, 2020, with a final balloon payment of $14.0 million. This loan bears interest at LIBOR plus a margin of 1.95% per annum. As of December 31, 2015 the outstanding balance on this facility was $32.0 million, of which we had a 50% economic interest of $16.0 million. After the Share Swap and Claims Transfer Agreement (see Fleet Development), we acquired the full economic interest in this loan facility, and as of December 31, 2017 and December 31, 2016 the outstanding balance on this facility was $23.6 million and $27.8 million, respectively.
$108.5 Million Senior Secured Credit Facility
On April 25, 2017, we entered into a $108.5 million revolving credit facility with DNB Bank ASA, as Agent and Security Trustee. This facility is comprised of (i) a term loan of $27.1 million from a syndicate of commercial lenders which we refer to as the “commercial tranche” and (ii) a term loan of $81.4 million insured by the Korea Trade Insurance Corporation, which we refer to as “K-sure tranche”. We used the proceeds of this facility to finance our acquisition of the VLCC newbuildings Ardeche and Aquitaine, which were delivered to us on January 12, 2017 and January 20, 2017, respectively, and which serve as security under this facility. The commercial tranche bears interest at LIBOR plus a margin of 1.95% per annum plus applicable mandatory costs and is reduced in 24 installments of consecutive six-month interval and a final $21.7 million repayment is due at maturity in 2029. The K-sure tranche bears interest at LIBOR plus a margin of 1.50% per annum plus applicable mandatory costs and is reduced in 24 installments of consecutive six-month interval until maturity in 2029. As of December 31, 2017,2020 and December 31, 2019, the outstanding balance on this facility was $104.9$83.2 million in aggregate.
and $90.5 million, respectively.
The facility agreement contains a provision that entitles the lenders to require us to prepay to the lenders, on January 12, 2024, with 180 days’ notice, their respective portion of any advances granted to us under the facility. The facility agreement also contains provisions that allow the remaining lenders to assume an outgoing lender’s respective portion(s) of the advances made to us or to allow us to suggest a replacement lender to assume the respective portion of such advances.
$150.0173.5 Million Senior Secured Credit Facility
On March 22, 2018, we entered into a $173.5 million revolving credit facility with Crédit Agricole Corporate and Investment Bank, as Agent and Security Trustee. This facility is comprised of (i) a term loan of $69.4 million from a syndicate of commercial lenders which we refer to as the “commercial tranche” and (ii) a term loan of $104.1 million provided by the Export-Import Bank of Korea, which we refer to as “Kexim tranche”. We used the proceeds of this facility to finance our acquisition of the Suezmax newbuildings Cap Quebec, Cap Pembroke, Cap Port Arthur, and Cap Corpus Christi, which were delivered to us on March 26, 2018, April 25, 2018, August 8, 2018 and August 29, 2018, respectively, and which serve as security under this facility. The commercial tranche bears interest at LIBOR plus a margin of 2.00% per annum plus applicable mandatory costs and is reduced in 24 installments of consecutive six-month interval and a final $13.9 million repayment is due at maturity in 2030.The Kexim tranche bears interest at LIBOR plus a margin of 2.00% per annum plus applicable mandatory costs and is reduced in 24 installments of consecutive six-month interval till maturity in 2030. The facility agreement contains a provision that entitles the lenders to require us to prepay to the lenders, on March 28, 2025, with 13 months' notice, their respective portion of any advances granted to us under the facility. The facility agreement also contains provisions that allow the remaining lenders to assume an outgoing lender’s respective portion(s) of the advances made to us or to allow us to suggest a replacement lender to assume the respective portion of such advances. As of December 31, 2020 and December 31, 2019, the outstanding balance on this facility was $143.6 million and $156.9 million, respectively.
$200.0 Million Senior Secured Credit Facility
On September 7, 2018, we entered into a $200.0 million secured revolving credit facility with a syndicate of banks and Nordea Bank Norge SA, as Agent and Security Agent. We used the proceeds of this facility to refinance all remaining indebtedness under our $581.0 Senior Secured Loan facility, our $67.5 Million Secured Loan Facility (Larvotto), and our $76.0 Million Secured Loan Facility (Fiorano). This facility is secured by nine of our wholly-owned vessels. This revolving credit facility is reduced in 12 installments of consecutive six-month interval and a final $55.0 repayment is due at maturity in 2025. This facility bears interest at LIBOR plus a margin of 2.00% per annum plus applicable mandatory costs. As of December 31, 2020 and December 31, 2019, the outstanding balance on this facility was $55.0 million and $100.0 million, respectively.
$100.0 Million Senior Secured Credit Facility
On June 27, 2019,we entered into a $100.0 million senior secured amortizing revolving credit facility with a syndicate of banks in which ABN Amro Bank acts as Coordinator, Agent and Security Trustee. The purpose of the credit facility is to finance the purchase inventory of low sulfur fuel oil. As of December 31, 2020 and December 31, 2019 the outstanding balance on this facility was $0 million and $70.0 million, respectively.
$700.0 Million Senior Secured Credit Facility
On August 28, 2019, we entered into a $700.0 million secured revolving credit facility with a syndicate of banks and Nordea Bank Norge SA, as Agent and Security Agent. We used the proceeds of this facility to refinance all remaining indebtedness under our $633.5 Senior Secured Loan facility. This facility is secured by 13 of our wholly-owned vessels. This revolving credit facility is reduced in 12 installments of consecutive six-month interval and a final $407.0 repayment is due at maturity in 2026. This facility bears interest at LIBOR plus a margin of 1.95% per annum plus applicable mandatory costs. As of December 31, 2020 and December 31, 2019 , the outstanding balance on this facility was $345.0 million and $560.0 million, respectively.
$713.0 Million Sustainability Linked Senior Secured Credit Facility
On September 11, 2020, the Group entered into a $713.0 million sustainability linked loan with specific targets to emission reduction, or the $713.0 Million Sustainability Linked Senior Secured Credit Facility. This facility is secured by 16 of our wholly-owned vessels, 9 VLCCs, 3 Suezmaxes and the 4 new VLCCs under construction at DSME. The credit facility will mature on March 31, 2026 and carries a rate of LIBOR plus a margin of 2.35%. The facility consists of (i) a revolver of 469.0 million to refinance the $340.0 million senior secured credit facility and part of the $750.0 million senior secured credit facility and (ii) a term loan of 244.0 million to finance the acquisition of four newbuilding VLCCs with delivery in the first quarter of 2021. The facility includes terms with clear targets to reduce our GHG emissions with compliance being rewarded with a reduced interest coupon of five basis points. As of December 31, 2020, the outstanding balance under this facility was $185.0 million.
$200.0 Million Senior Unsecured Note
On May 31, 2017, we completed an issuance of $150.0 million of senior unsecured bonds with a fixed coupon of 7.50% and maturity in May 2022. Euronav NV serves as guarantor of the bonds. The net proceeds from the bond issuance are being used for general corporate purposes. DNB Markets, Nordea and Arctic Securities AS acted as joint lead managers in connection with the placement of the bonds. The related transaction costs for a total of $2.7 million are amortized over the lifetime of the bonds using the effective interest rate method. The bonds were listed on the Oslo Stock Exchange on October 23, 2017.
On June 14, 2019, we successfully completed a tap issue of $50 million under the existing senior unsecured bonds. The bonds are guaranteed by Euronav NV, mature in May 2022 and carry a coupon of 7.50% The tap issue was priced at 101% of par value.
In the course of the first quarter of 2020, the company bought back $1.0 million face value of its $200.0 Million Senior Unsecured Notes at an average price of 15% below face value.
As of December 31, 2020, and December 31, 2019 the outstanding balance under this Unsecured Note was $199.0 and $200.0, respectively.
€50.0150.0 Million Treasury Notes Program
On June 6, 2017, we entered into an agreement, or the Dealer Agreement, with BNP Paribas Fortis SA/NV to act as arranger and dealer for a Belgian Multi-currencyMulti-Currency Short-Term Treasury Notes Program with a maximum outstanding amount of €50.0 million. On October 1, 2018, we amended the agreement to increase the maximum outstanding amount to €150.0 million, while appointing KBC Bank NV as additional dealer for the program. Pursuant to the terms of the Dealer Agreement, we may issue the treasury notes to the dealer from time to time upon such terms and such prices as we and the dealer agree. As of December 31, 20172020 and December 31, 2019, the outstanding balancebalances under this program was €41.7$38.7 million or $50.0(€31.5 million) and $122.8 million (€109.3 million), respectively
Other borrowings
On December 30, 2019, the Company entered into a sale and leaseback agreement for three VLCCs. The three VLCCs are the Nautica (2008 – 307,284), Nectar (2008 – 307,284) and Noble (2008 – 307,284). The vessels were sold and were leased back under a 54-months bareboat contract at an average rate of $20,681 per day per vessel. In accordance with IFRS, this transaction was not accounted for as a sale but Euronav as seller-lessee will continue to recognize the transferred assets, and recognized a financial liability equal to the net transfer proceeds of $124.4 million. At the end of the bareboat contract, the vessels will be redelivered to their new owners. Euronav may, at any time on and after the 1st anniversary, notify the owners by serving an irrevocable written notice at least three months prior to the proposed purchase option date of the charterers' intention to terminate this charter on the purchase option date and purchase the vessel from the owners for the applicable purchase option price.
Joint Venture Credit Facilities (at 50% economic interest)
$500.0220.0 Million Secured Loan Facility (TI Asia and TI Africa)
On October 3, 2008,March 29, 2018, two of our 50%-owned joint ventures, TI Asia Ltd. and TI Africa Ltd., entered into a $500.0$220.0 million senior secured credit facility. The facility withconsists of a groupterm loan $110.0 million and a revolving loan of commercial lenders with ING Bank N.V.$110.0 million for the purpose of refinancing the two FSOs as Agent and Security Trustee.well as for general corporate purposes. The joint ventures used the proceeds of this facility to finance the acquisitionterm loan consists of two ULCC vessels, TItranches; the FSO Asia Term loan of $54.0 million, maturing on June 21, 2022 and TIthe FSO Africa, Term loan of $56.0 million, maturing on September 22, 2022. The revolving credit facility consists of two tranches; the FSO Asia revolving loan of $54.0 million, maturing on June 21, 2022 and to convert these vessels to FSOs, which serve as collateral under this facility. the FSO Africa revolving loan of $56.0 million, maturing on September 22, 2022.
As of December 31, 2016,2020 and December 31 2019, the outstanding balance onunder this program was $90.4 and $139.2 million in aggregate.
The joint venture term loans described above were secured by a mortgage of the specific vessel and we provided a guarantee for the revolving credit facility tranche. As of December 31, 2020 and December 31, 2019, the outstanding balance under the revolving credit facility tranche was $75.4$45.2 million of which we had a 50% economic interest of $37.7and $69.6 million. The facility was repaid in full on July 13, 2017.
Security
Our secured indebtedness is generally secured by:
•a first priority mortgage in all collateral vessels;
•a general pledge of earnings generated by the vessels under mortgage for the specific facility; and
•a parent guarantee when the indebtedness is not taken at the level of the parent.
Loan Covenants
Our debt agreements discussed above generally contain financial covenants, which require us to maintain, among other things:
•an amount of current assets that, on a consolidated basis, exceeds our current liabilities. Current assets may include undrawn amount of any committed revolving credit facilities and credit lines having a maturity of more than one year;
•an aggregate amount of cash, cash equivalents and available aggregate undrawn amounts of any committed loan of at least $50.0 million or 5% of our total indebtedness (excluding guarantees), depending on the applicable loan facility, whichever is greater;
•an aggregate cash balance of at least $30.0 million; and
•a ratio of stockholders' equity to total assets of at least 30%.; and
•and a minimum asset coverage ratio.
Our credit facilities discussed above also contain restrictions and undertakings which may limit our and our subsidiaries' ability to, among other things:
•effect changes in management of our vessels;
•transfer or sell or otherwise dispose of all or a substantial portion of our assets;
•declare and pay dividends, (with respect to each of our joint ventures, other than Seven Seas Shipping Limited, no dividend may be distributed before its loan agreement, as applicable, is repaid in full); and
•incur additional indebtedness.
A violation of any of our financial covenants or operating restrictions contained in our credit facilities may constitute an event of default under our credit facilities, which, unless cured within the grace period set forth under the applicable credit facility, if applicable, or waived or modified by our lenders, provides our lenders with the right to, among other things, require us to post additional collateral, enhance our equity and liquidity, increase our interest payments, pay down our indebtedness to a level where we are in compliance with our loan covenants, sell vessels in our fleet, reclassify our indebtedness as current liabilities and accelerate our indebtedness and foreclose their liens on our vessels and the other assets securing the credit facilities, which would impair our ability to continue to conduct our business.
Furthermore, certain of our credit facilities contain a cross-default provision that may be triggered by a default under one of our other credit facilities. A cross-default provision means that a default on one loan would result in a default on certain other loans. Because of the presence of cross-default provisions in certain of our credit facilities, the refusal of any one lender under our credit facilities to grant or extend a waiver could result in certain of our indebtedness being accelerated, even if our other lenders under our credit facilities have waived covenant defaults under the respective credit facilities. If our secured indebtedness is accelerated in full or in part, it would be very difficult in the current financing environment for us to refinance our debt or obtain additional financing and we could lose our vessels and other assets securing our credit facilities if our lenders foreclose their liens, which would adversely affect our ability to conduct our business.
Moreover, in connection with any waivers of or amendments to our credit facilities that we may obtain, our lenders may impose additional operating and financial restrictions on us or modify the terms of our existing credit facilities. These restrictions may further restrict our ability to, among other things, pay dividends, make capital expenditures or incur additional indebtedness, including through the issuance of guarantees. In addition, our lenders may require the payment of additional fees, require prepayment of a portion of our indebtedness to them, accelerate the amortization schedule for our indebtedness and increase the interest rates they charge us on our outstanding indebtedness.
In addition, we have provided, and may continue to provide in the future, unsecured loans to our joint ventures which we consider economically as equivalent to investments in the joint ventures. Accordingly, in the event our joint ventures do not repay these loans as they become due and payable, the value of our investment in such entities may decline. Furthermore, we have provided, and may continue to provide in the future, guarantees to certain banks with respect to commercial bank indebtedness of our joint ventures. Failure on behalf of any of our joint ventures to service its debt requirements and comply with any provisions contained in its commercial loan agreements, including paying scheduled installments and complying with certain covenants, may lead to an event of default under its loan agreement. As a result, if our joint ventures are unable to obtain a waiver or do not have enough cash on hand to repay the outstanding borrowings, their lenders may foreclose their liens on the vessels securing the loans or seek repayment of the loan from us, or both, which would have a material adverse effect on our financial condition, results of operations, and cash flows. As of December 31, 2016, $75.42020 and December 31, 2019, $90.4 million and $139.2 million was outstanding respectively under these joint venture loan agreements, of which we guaranteed $37.7$45.2 million and $69.6 million. In 2017, these joint venture loans matured.
As of December 31, 20172020 and December 31, 2016,2019, we were in compliance with all of the covenants contained in our debt agreements, and our joint ventures were in compliance with all of the covenants contained in their respective debt agreements.
Guarantees
We have provided guarantees to financial institutions that have provided credit facilities in 20162019 to two of our joint ventures, in the aggregate amount of $37.7$45.2 million. The related outstanding bank loans were repaid on July 13, 2017.
In addition, on July 14, 2017 and September 22, 2017, TI Asia Ltd. and TI Africa Ltd., two 50%-owned joint ventures, which own the FSO Asia and FSO Africa, two FSO vessels, respectively, entered into two guarantees of up to $5.0 million each with ING Bank, in favor of North Oil Company in connection with its use of the FSO Asia and FSO Africa. These guarantees terminate on October 21, 2022 with respect tofor the FSO Asia and December 21, 2022 with respect tofor the FSO Africa. As of December 31, 2017,2020, these guarantees have not been called upon.
Recent Developments
In January 2021, we took delivery of the first two of four newbuildings, Delos (2021 – 300,200 dwt) and Diodorus (2021 – 300,200 dwt), which were purchased in February 2020. In February 2021, we took delivery of the third newbuilding, Doris (2021 – 300,200 dwt) and in March 2021, we took delivery of the fourth newbuilding, Dickens (2021 – 300,200 dwt).
During its meeting of February 2, 2021, our Supervisory Board approved an interim dividend for the fourth quarter of 2020 of $0.03 per share. The interim dividend of $0.03 per share was payable as from March 5, 2021. The interim dividend to holders of Euronext shares was paid in EUR at the USD/EUR exchange rate of the record date.
On February 10, 2021, we entered into an agreement for the acquisition through resale of two eco-Suezmax newbuilding contracts. Currently completing construction at the Daehan Shipyard in South Korea, these modern vessels are being acquired for an en-bloc price of $113.0 million. Both vessels are due for delivery in January 2022. The vessels are the latest generation of Suezmax Eco-type tankers. They will be fitted with Exhaust Gas Scrubber technology and Ballast Water Treatment systems. The vessels have the structural notation to be LNG Ready. Euronav is working closely with the shipyard to also have the structural notation to be Ammonia Ready. This provides the option to switch to other fuels at a later stage.
On February 22, 2021, we entered into a sale and leaseback agreement for the VLCC Newton (2009 – 307,284) with Taiping & Sinopec Financial Leasing Ltd Co. The vessel was sold for $36.0 million. The vessel was delivered to its new owner on February 22, 2021. We have leased back the vessel under a 36-months bareboat contract at an average rate of $22,500 per day. At the end of the bareboat contract, the vessel will be redelivered to its owners.
On March 26, 2021, the Supervisory Board proposed the Annual Shareholders' meeting be held on May 20, 2021, to approve a full year dividend for 2020 of USD 1.40 per share. Taking into account the interim dividends paid based on the Group’s policy to return 80% of the net income to shareholders , no closing dividend will be paid.
C. Research and development, patents and licenses
Not applicable.
D. Trend information
The supply and demand patterns for ships continue to behave the biggest impact on revenues. Generally, the global demand for oil transportation on ships is affected by the global demand for crude oil, which in turn is highly dependent on the state of the global economy. Most economiesEconomies across the world are experiencing healthycurrently impacted by a reduction in demand caused by the outbreak of COVID-19, which brought about restrictions on economic growthactivity, which in turn heavily affected global oil demand. The tanker market therefore continues to experience pressure from temporarily reduced demand and oil supply cuts from production cuts made by the Organization of the Petroleum Exporting Countries, or OPEC. However, rebalancing is underway, with the expectation of economic recovery at the moment and thisheels of COVID-19 vaccine availability. Platts currently estimates that demand for oil in 2021 is reflected in strong oil demand growth. In its latest published report the International Energy Agency (IEA) are forecasting 2018 oil demand growth of 1.29expected to increase by 5.9 million barrels per day compared to average growth levels2020, despite a weaker than expected first quarter, with the expectation of a strong recovery later in the last 10 years of 1.15 million barrels. The market has recently seen the price of oil increase, which could have a dampening effect on oil demand going forward.year.
The rate at which a change in oil demand impacts the demand for oil tankers depends not only on the nominal change in oil demand but also how this oil is traded. Looking at crude oil,traded, for example, the market has recently seencontinued to see a significant uptick in exports emanating from the US Gulf and other Atlantic based producers, most of which have been destined for China, India, and other Far Eastern customers. This oil travels a substantially longer distance than crude oil originating from the Arabian Gulf headed fortraveling to the same destination, and hence employs the crude tankers for a longer period of time. The current trend is a rise in crude exports from the Atlantic basin combined with demand growth centered in the Far East providing longer employment times for crude tankers for the incremental barrel produced. Whilst it is anticipated to see continued negative pressure on TCE within 2021, it is broadly expected to improve during the second part of the year. The trend for financing of shipping companies is likely to remain challenging with sustainability features and targets becoming more standard in all finance facilities.
The supply of tankers is influenced by the number of vessels delivered to the fleet, the number of vessels removed from the fleet (through scrappingrecycling or conversion) and the number of vessels tied up in alternative employment such as storage. 20172020 saw a significantapproximately half of the number of new ships joinjoining the fleet compared to the year before across all the crude tanker segments,VLCC and this trend is set to continue in 2018.Suezmax segments. The tanker orderbook as a whole however remains measured, with both the VLCC orderbook equal to 7.0% of the fleet and Suezmax orderbooksorderbook equal to 14%8.1% of the current fleet. VesselThere have been only a few vessel exits from the trading fleet have startedin 2020 with just four VLCCs and no Suezmaxes tankers removed and one VLCC converted. Going forward we expect regulatory requirements to gain momentum towards the end of 2017. We expect this trend to continue in 2018 aspush a number of factors support increased scrapping levels. These includeships out of the freight environment being attrading fleet as owners are faced with the lowest levels seen for many years, scrap prices increasing and regulatory pressure on ship owners to make decisions on whether to continue tradingalternative of putting their older tonnage or put themvessels through costly upgrades to comply with new directives, such as the Ballast Water Management convention. The requirement for vessels to now burn low sulfur fuel is another factor that may cause ship owners to re-evaluate the longevity of some of their older tonnage.
Our revenues are also affected by our strategy to employ some of our vessels on time charters, which have a fixed income for a pre-set period of time as opposed to trading ships in the spot market where their earnings are heavily impacted by the supply and demand balance. The ManagementOur management team continuously evaluates the value of both strategies and makes informed decisions on the chartering mix based on anticipated earnings, and through this process we aim to always maximize each vessel’s return.return
We have no additionalThe company’s strong funding requirements going forward all things being equal (4 Suezmaxes newbuilding to be delivered over the course of 2018 and a pending merger) and areliquidity structure in place, supported by a proven management team, strict capital discipline and an established dividend distribution policy.policy should also weather the volatility of the sector.
Please see alsoFactors affecting our results of operations—COVID-19” and "Item 4. Information on the Company—B. Business Overview—Industry and Market Conditions."
E. Off-balance sheet arrangements
We are committed to make rental payments under operating leases for vessels and for office premises. The future minimum rental payments under our non-cancellable operating leases are disclosed below under "Contractual Obligations."
F. Tabular disclosure of contractual obligations
Contractual Obligations
As of December 31, 2017,2020, we had the following contractual obligations and commitments which are based on contractual payment dates:
| | | (US$ in thousands) | | Total |
| | 2018 |
| | 2019 |
| | 2020 |
| | 2021 |
| | 2022 |
| | Thereafter |
| |
| (USD in thousands) | | (USD in thousands) | | Total | | 2021 | | 2022 | | 2023 | | 2024 | | 2025 | | Thereafter |
| Long-term bank loan facilities (1) | | 713,334 |
| | 47,361 |
| | 47,361 |
| | 147,111 |
| | 106,567 |
| | 197,020 |
| | 167,914 |
| Long-term bank loan facilities (1) | | 876,834 | | | 20,542 | | | 20,542 | | | 98,822 | | | 46,198 | | | 36,606 | | | 654,123 | |
| Long-term debt obligations | | 150,000 |
| | — |
| | — |
| | — |
| | — |
| | 150,000 |
| | — |
| Long-term debt obligations | | 199,000 | | | — | | | 199,000 | | | — | | | — | |
| Treasury Note Program | | 50,010 |
| | 50,010 |
| | | | | | | | | | | Treasury Note Program | | 38,654 | | | 38,654 | | | — | | | — | | | — | | | — | | | — | |
| Bank credit line facilities | | — |
| | — |
| | — |
| | — |
| | — |
| | — |
| | — |
| Bank credit line facilities | | — | | | — | | | — | | | — | | | — | | | — | | | — | |
| Operating leases (vessels) | | 127,644 |
| | 32,120 |
| | 32,120 |
| | 32,208 |
| | 31,196 |
| | — |
| | — |
| |
| Operating leases (non-vessel) | | 10,738 |
| | 2,287 |
| | 2,015 |
| | 1,898 |
| | 1,744 |
| | 1,567 |
| | 1,227 |
| |
| Leases (vessels) | | Leases (vessels) | | 54,528 | | | 43,706 | | | 10,822 | | | — | | | — | | |
| Leases (non-vessel) | | Leases (non-vessel) | | 15,727 | | | 4,273 | | | 3,963 | | | 3,153 | | | 2,501 | | | 1,718 | | | 119 | |
| Other borrowings | | Other borrowings | | 79,211 | | | 22,667 | | | 22,667 | | | 22,667 | | | 11,212 | | |
| Capital Expenditure commitments (2) | | 185,922 |
| | 185,922 |
| | — |
| | — |
| | — |
| | — |
| | — |
| Capital Expenditure commitments (2) | | 172,100 | | | 172,100 | | | — | | | — | | | — | | | — | | | — | |
| Total contractual obligations due by period | | 1,237,648 |
| | 317,700 |
| | 81,496 |
| | 181,217 |
| | 139,507 |
| | 348,587 |
| | 169,141 |
| Total contractual obligations due by period | | 1,436,054 | | | 301,942 | | | 256,994 | | | 124,642 | | | 59,911 | | | 38,324 | | | 654,242 | |
(1) Excludes interest payments.
(2) Includes obligations only under our newbuilding program.
Not included in the table above are options that have been granted to us but not yet exercised under our time charter-in agreements to extend their respective durations.
G. Safe harbor
Forward-looking information discussed in this Item 5 includes assumptions, expectations, projections, intentions and beliefs about future events. These statements are intended as "forward-looking statements." We caution that assumptions, expectations, projections, intentions and beliefs about future events may and often do vary from actual results and the differences can be material. Please see the section entitled "Cautionary Statement Regarding Forward-Looking Statements" in this annual report.
ITEM 6. DIRECTORS, SENIOR MANAGEMENTANDMANAGEMENT AND EMPLOYEES
A.Directors and Senior managementManagement
Set forth below are the names, ages and positions of the members of our DirectorsSupervisory Board or the Supervisory Board Members, and Executive Officersof our Management Board, or the Management Board Members as of the date of this annual report. Our Supervisory Board of Directors is elected annually on a staggered basis, and each directormember holds office for a term of maximum four years, until his or her term expires or until his or her death, resignation, removal or the earlier termination of his or her term of office. All Directorsmembers of the Supervisory Board whose term expires are eligible for re-election. Officers are appointed from time to time by our Supervisory Board of Directors and hold office until a successor is appointed or their employmentengagement is terminated. The business address of each of our DirectorsSupervisory Board Members and Executive OfficersManagement Board Members listed below is Euronav NV, Belgica House, De Gerlachekaai 20, 2000 Antwerp, Belgium.
|
| | | | | | | | | | | | | | | | | | | |
| Name | | Age | | Position | | Date of Expiry of Current Term
(for Directors)
Supervisory Board) |
| Carl E. Steen | | 6770 | | Chairman of the Supervisory Board of Directors | | Annual General Meeting 20182022 |
Daniel R. Bradshaw Anne-Hélène Monsellato | | 7153 | | DirectorSupervisory Board Member | | Annual General Meeting 20192022 |
William Thomson Ludovic Saverys | | 7037 | | DirectorSupervisory Board Member | | Annual General Meeting 20182021 |
Anne-Hélène Monsellato Grace Reksten Skaugen | | 5067 | | DirectorSupervisory Board Member | | Annual General Meeting 20182022 |
Ludovic Saverys Anita Odedra | | 3450 | | DirectorSupervisory Board Member | | Annual General Meeting 20182021 |
Grace Reksten SkaugenCarl Trowell | | 6452 | | DirectorSupervisory Board Member | | Annual General Meeting 20202021 |
Patrick Rodgers Hugo De Stoop1 | | 5848 | | Chief Executive Officer and Director | | Annual General Meeting 2020 |
Hugo De Stoop Lieve Logghe2 | | 4552 | | Chief Financial Officer | | |
Alex Staring3 | | 5255 | | Chief Operating Officer | | |
Egied Verbeeck4 | | 4346 | | General Counsel | | |
An Goris | | 40 | | Secretary General | | |
| Brian Gallagher | | 4750 | | Head of Investor Relations | | |
| Stamatis Bourboulis | | 63 | | General Manager, Euronav Ship Management (Hellas) Ltd. | | |
1 Mr. Hugo De Stoop is acting as permanent representative of Hecho BV;
2 Ms. Lieve Logghe is acting as permanent representative of Tincc BV;
3 Mr.Alex Staring is acting as permanent representative of AST projects BV;
4 Mr. Egied Verbeeck is acting as permanent representative of Echinus BV;
Biographical information concerning the DirectorsMembers of the Supervisory Board and Executive OfficersManagement Board listed above is set forth below.below:
Carl E. Steen, our Chairman,Chair, was co-opted as director and appointed Chairman of our Supervisory Board of Directors with effect immediately after the meeting of our Supervisory Board of Directors on December 3, 2015. Mr. Steen is also a member of our Audit and Risk Committee and our Corporate Governance and Nomination Committee. He graduated from the Eidgenössische Technische Hochschule in Zurich, Switzerland in 1975 with a M.Sc. in Industrial and Management Engineering. After working as a consultant in a logistical research and consultancy company, he joined a Norwegian shipping company in 1978 with primary focus on business development. Five years later, in 1983, he joined Christiania Bank and moved to Luxembourg, where he was responsible for Germany and later the Corporate division. In 1987, Mr. Steen became Senior Vice president within the Shipping Division in Oslo and in 1992 he took charge of the Shipping/Offshore and Transport Division. When Christiania Bank merged with Nordea in 2001, he was made Executive Vice President within the newly formed organization while adding the International Division to his responsibilities. Mr. Steen remained Head of Shipping, Offshore and Oil services and the International Division until 2011. Since leaving Nordea, Mr. Steen has become a non-executive director for the following listed companies in the finance, shipping and logistics sectors: Golar LNG Limited (NASDAQ: GLNG) and Golar LNG Partners LP (NASDAQ: GMLP), both part of the same group and where he also sits on the audit committee, Wilh Wilhelmsen Holding ASA and Belships ASA. Mr. Steen is also member of the Board of Directors of CMB NV, a company controlled by Fam. Marc Saverys, our former director and the father of Ludovic Saverys, a member of our Supervisory Board. The Company’s Supervisory Board has determined that Mr. Steen is considered “independent” under Rule 10A-3 promulgated under the Exchange Act and under the rules of the NYSE.
Anne-Hélène Monsellato, one of our directors, Supervisory Board Members, serves and has served on our Supervisory Board of Directors since 2004, and is a member of our Audit and Risk Committee and the chairman of our Corporate Governance and Nomination Committee. Since 2014 Mr. Bradshaw also serves as Independent Director of GasLog Partners LP (NYSE: GLOP), a Marshall Islands limited partnership. Since 2010 he serves as an Independent non-executive Director of IRC Limited, a company listed in Hong Kong, which operates iron mines in far eastern Russia, and which is an affiliate of Petropavlovsk PLC, a London-listed mining and exploration company. Since 2006 Mr. Bradshaw is an Independent non-executive Director of Pacific Basin Shipping Company Limited, a company listed in Hong Kong and operating in the Handysize bulk carrier sector. Since 1978 Mr. Bradshaw has worked at Johnson Stokes & Master, now Mayer Brown JSM, in Hong Kong, from 1983 to 2003 as a Partner and since 2003 as a Senior Consultant. From 2003 until 2008 Mr. Bradshaw was a member of the Hong Kong Maritime Industry Council. From 1993 to 2001 he served as Vice-Chairman of the Hong Kong Shipowners' Association and was a member of the Hong Kong Port and Maritime Board until 2003. Mr. Bradshaw began his career with the New Zealand law firm Bell Gully and in 1974, joined the international law firm Sinclair Roche & Temperley in London. Mr. Bradshaw obtained a Bachelor of Laws and a Master of Laws degree at the Victoria University of Wellington (New Zealand).
William Thomson, one of our directors, serves and has served on our Board of Directors since 2011 and is a member of our Remuneration Committee and our Audit and Risk Committee. Currently and since 2005 Mr. Thomson holds a Directors' mandate in Latsco, established to operate under the British Tonnage Tax Regime Very Large Gas Carriers (VLGC), long-range and medium-range vessels. From 1980 to 2008 Mr. Thomson has been Chairman in several maritime and other companies including Forth Ports Plc, British Ports Federation and Relayfast, and the North of England P&I club. Mr. Thomson previously served as a Director of Trinity Lighthouse Service, Tibbett and Britten and Caledonian McBrayne. From 1970 to 1986 he was a Director with Ben Line, for which he worked in, amongst others, Japan, Indonesia, Taiwan and Edinburgh. In 1985, he established Edinburgh Tankers and five years later, Forth and Celtic Tankers. After serving with the army for three years, Mr. Thomson began his professional career with Killick Martin Shipbrokers in London.
Anne-Hélène Monsellato, one of our directors, serves and has served on our Board of Directors since her appointment at the AGM ofin May 2015, and is the ChairmanChair of our Audit and Risk Committee and a member of our Corporate Governance and Nomination Committee. She can be considered as the Audit and Risk Committee financial expert for purposes applicable for corporate governance regulations and Article 963:6 paragraph 1, 9° of the Belgian Company Code.Code of Companies and Associations. Since June 2017, Mrs. Monsellato serves on the Board of Directors of Genfit, a biopharmaceutical company listed inon Euronext Paris and on NASDAQ (NASDAQ: GNFT), and is the chairman of the Audit Committee. Mrs. Monsellato is an active member of theIFA (the French National Association of Directors since 2013.Directors) as part of the Audit Chair Group and of the ESG reporting Taskforce, of ECODA, the European confederation of directors' associations, and participates in the consultative working group of ESMA Corporate Reporting Standing Committee. In addition, she is servingserves as the Vice President and Treasurer of the Mona Bismarck American Center for Art and Culture, a U.S. publicprivate foundation based in New York. From 2005 tilluntil 2013, Mrs. Monsellato served as a Partner with Ernst & Young (now EY), Paris, after having served as Auditor/Senior, Manager and Senior Manager for the firm starting in 1990. During her time at EY, she gained extensive experience in cross border listing transactions, in particular with the U.S. She is a Certified Public Accountant in France since 2008 and graduated from EM Lyon in 1990 with a degree in Business Management. The Company’s Supervisory Board has determined that Ms. Monsellato is considered “independent” under Rule 10A-3 promulgated under the Exchange Act and under the rules of the NYSE.
Ludovic Saverys, one of our directors, serves andSupervisory Board Members, has served on ourthe Board of Directors since 2015 and is a member of our Remuneration Committee and our Corporate Governance and Nomination Committee.since December 2019 also a member of the Sustainability Committee . Mr. Saverys currently serves as Chief Financial Officer of CMB NV and as General Manager of Saverco NV. HeUntil the end of March 2019, he also servesserved as Chief Financial Officer and Director of Hunter Maritime Acquisition Corp. (NASDAQ: HUNT), a blank check company listed on NASDAQ. During the time he lived in New York, Mr. Saverys served as Chief Financial Officer of MiNeeds Inc. from 2011 until 2013 and as Chief Executive Officer of SURFACExchange LLC from 2009 until 2013. He started his career as Managing Director of European Petroleum Exchange (EPX) in 2008. From 2001 until 2007 he followed several educational programs at universities in Leuven, Barcelona and London from which he graduated with M. Sc. degrees in International Business and Finance.
Grace Reksten Skaugen, one of our directors,Supervisory Board Members, serves and has served on the Supervisory Board of Directors since the AGM ofon May 12, May 2016 and is ChairmanChair of the Remuneration Committee and a member of the Corporate Governance and Nomination Committee. GraceSince December 2019 Ms. Skaugen is also a member of the Sustainability Committee. Ms. Reksten Skaugen is a Trustee /advisory council member of the HSBC European Senior Advisory Council (ESAC).The International Institute of Strategic Studies in London. In 2009 she founded Infovidi Board Services Ltd, an independent consulting company. From 2002 untilto 2015, she was a member of the Board of Directors of Statoil ASA. She is presently Deputy Chairman of Orkla ASA, a Board member of Investor AB, and Lundin Petroleum AB, and Chairman of NAXS Noric Access Buyout A/S.PJT Partners, a US boutique investment bank. In 20062009 she aswas one of the founders of the Norwegian Institute of Directors, of which she continues to be a member of the Board. From 1994 untilto 2002 she was a Director in Corporate Finance in SEB Enskilda Securities in Oslo. She has previously worked in the fields of venture capital and shipping in Oslo and London and carried out research in microelectronics at Columbia University in New York. She has a doctorate in Laser Physics from Imperial College of Science and Technology, University of London. In 1993 she obtained an MBA from the BI Norwegian School of Management. The Company’s Supervisory Board has determined that Ms. Skaugen is considered “independent” under Rule 10A-3 promulgated under the Exchange Act and under the rules of the NYSE.
Patrick Rodgers becameAnita Odedra has served on the Supervisory Board since her appointment at the AGM of May 2019, and is member of the Audit and Risk Committee and of the Sustainability Committee. Ms. Odedra brings 25 years’ experience in the energy industry, and is currently Chief Commercial Officer at Tellurian Inc. Prior roles include Executive Vice President at the Angelicoussis Shipping Group Ltd (ASGL), where she led the LNG and oil freight trading businesses and Vice President, Shipping & Commercial Operations for Cheniere. Ms. Odedra spent 19 years at BG Group, where she worked across all aspects of BG’s business including exploration, production, trading, marketing, business development, commercial operations and shipping; latterly holding the position of VP, Global Shipping. She began her career with ExxonMobil in 1993 as a Geoscience analyst. Ms. Odedra was on the Board for the Society of International Gas Tanker and Terminal Operators (SIGGTO) from 2013 to 2016 and was Chair of GIIGNL’s Commercial Study Group from 2010 to 2015. She completed her PhD in Rock Physics from University College London & University of Tokyo and has a BSc in Geology from Imperial College, University of London. The Company’s Supervisory Board has determined that Ms. Odedra is considered “independent” under Rule 10A-3 promulgated under the Exchange Act and under the rules of the NYSE.
Carl Trowell serves on the Supervisory Board since his appointment at the AGM of May 2019, and is a member of the Remuneration Committee and Chair of the Corporate Governance and Nomination Committee. Since June 2020, Carl Trowell is the Chief Executive Officer of Euronav in 2000Acteon Group Ltd., a marine energy and hasinfrastructure services company serving the renewables, near-shore construction and oil and gas sectors. Prior to join Acteon, Carl served on Euronav’s Boardas Chief Executive Officer of DirectorsEnsco PLC, a NYSE listed London-based offshore drilling company, since June 2003. He joined Euronav as2014, where he was also a member of the Board of Directors and took up the position of Executive CommitteeChairman in 1995April 2019 upon closing of the merger with Rowan PLC (subsequently becoming Valaris PLC) until April 2020. Prior to this Carl had an international executive career with Schlumberger Ltd., holding the roles of President of the Integrated Project Management, the Production Management and the WesternGeco Seismic divisions of the company. Prior to these roles, he held a variety of international management positions within Schlumberger including corporate VP for Marketing and Sales and Managing Director North-Sea/Europe region. Mr Trowell began his career as a petroleum engineer with Royal Dutch Shell before joining Schlumberger. Carl has been a member of several energy industry advisory boards, he was appointed Chief Financial Officer in 1998. Since 2011, he hasformally a supervisory board member for EV Private Equity and served as Directora non-executive director on the board of Ophir Energy PLC from 2016 to 2019. Mr Trowell has a PhD in Earth Sciences from the University of Cambridge, a Master of Business Administration form the Open University (UK), and Chairmana Bachelor of Science degree in Geology from Imperial College London.
Hugo De Stoop serves on the Management Board as Chief Executive Officer as of May 2019. During 2020, he took up the role of Chair of the International Tanker Owners Pollution Federation Fund (ITOPF). Paddy was elected to the Executive Committee of Intertanko in May 2017. From 1990 to 1995 Paddy Rodgers worked at CMB Group as in-house Lawyer and subsequently as Shipping Executive moving to Euronav when it became a subsidiary for tanker investments of the CMB Group. He graduated in with an LLB in Law from University College London in 1981 and qualified to practice in 1984 having passed law society entrance exams after studying at the College of Law, Guildford in 1982. In 1984 he joined Bentley, Stokes & Lowless as a solicitor and in 1986 he moved to Johnson, Stokes & Master in Hong Kong where he practiced until 1990
HugoSustainability Committee. Mr. De Stoop serves and has served as our Chief Financial Officer since 2008, after serving as our Deputy Chief Financial Officer and Head of Investor Relations beginning in 2004. Mr. De Stoop has been a member of our Executive CommitteeManagement Board since 2008. In 2000, he joined Davos Financial Corp.,Mr. De Stoop started his career in 1998 with Mustad International Group, an investment manager for UBS, specializingindustrial group with over 30 companies located in Asset Management and Private Equity,five continents where he became an Associateworked as a project manager on various assignments in the United States, Europe and later a Vice PresidentLatin America, in 2001.order to integrate recently acquired subsidiaries. In 1999, Mr. De Stoop founded First Tuesday in America, the world's largest meeting place for high tech entrepreneurs, venture capitalists and companies and helped develop the network in the United States and in Latin America and, in 2001, was appointed member of the Board of Directors of First Tuesday International. Mr. De Stoop started his careerInternational. In 2000, he joined Davos Financial Corp., an investment manager for UBS, specializing in 1998 with Mustad International Group, an industrial group with over 30 companies located in five continentsAsset Management and Private Equity, where he worked asbecame an Associate and later a project manager on various assignmentsVice President in the United States, Europe2001. He conducted several transactions, including private placement in public equities (PIPE) and Latin America,investments in order to integrate recently acquired subsidiaries.real estate. Mr. De Stoop studied in Oxford, Madrid and Brussels and graduated from école polytechnique (ULB) with a Master of Science in engineering. He also holds a MBA from INSEAD.
Lieve Logghe joined Euronav as Chief Financial Officer on 1 January 2020, succeeding Hugo De Stoop who took on the role of CEO. Ms. Logghe is member of the Euronav Management Board. Lieve started her career in international finance with an initial 3-year period as Audit Senior with PriceWaterhouseCoopers in Belgium. In 1995 Ms. Logghe joined Sidmar (currently ArcelorMittal Belgium). She progressively moved through the finance organization in different European geographies after the merger between Arbed, Usinor, Aceralia and Mittal to her position of Vice President CFO for ArcelorMittal Flat Europe in Luxemburg. As from July 2018 she was VP Head of Energy for the ArcelorMittal Europe perimeter. Ms. Logghe graduated from University of Brussels with a Master in Economics, from Vlerick School for Management with a Master in Accounting and from EHSAL Management School with an expertise in Fiscal Sciences. She is a Certified Internal Auditor (IIA) since 1997.
Alex Staring serves and has served as our Chief Operating Officer since 2005. He has also been in charge of our offshore segment since July 2010. Captain Staring serves and has served as a member of our Executive CommitteeManagement Board since 2005. Captain Staring has been a Director of Euronav Hong Kong Ltd. since 2007, a Director of Euronav SAS and Euronav Ship Management since 2002 and a Director of Euronav Luxembourg SA since 2000. In 2000, international shipping companies, AP Moller, Euronav, Frontline, OSG, Osprey Maritime and Reederei'Nord' Klaus E Oldendorff consolidated the commercial management of their VLCCs by operating them in a pool, Tankers International, of which Captain Staring became Director of Operations. In 1988, Captain Staring gained his master's and chief engineer's license and spent the majority of his time at sea
on Shell Tankers and CMB tankers, the last 3 years of which he attained the title of Master. From 1997 to 1998, Captain Staring headed the SGS S.A. training and gas centre. In 1998, Captain Staring rejoined CMB and moved to London to head the operations team at their subsidiary, Euronav UK. Captain Staring graduated with a degree in Maritime Sciences from the Maritime Institute in Flushing, The Netherlands and started his career at sea in 1985.
Egied Verbeeck serves and has served as General Counsel of the Company since 2009 and became a member of the Executive CommitteeManagement Board of the Company in January 2010. Mr. Verbeeck is also a member of the Sustainability Committee. From 2006 until June 2014, Mr. Verbeeck served as Secretary General of the Company. Prior to joining Euronav he was a managing associate at Linklaters De Bandt from 1999-2005. Mr. Verbeeck has been a Director of Euronav Ship Management SAS since 2012, a Director of Euronav Hong Kong Ltd. since 2007 and a Director of Euronav Luxembourg S.A. since 2008. Mr. Verbeeck graduated in law from the Catholic University of Louvain in 1998. He also holds a Master Degree in international business law from Kyushu University (Japan) as well as a postgraduate degree in corporate finance from the Catholic University of Louvain.
An Goris serves and has served as Secretary General of the Company since June 2014, in which capacity, she is responsible for the general corporate affairs of the Company. From 2011 to 2014, Ms. Goris served as legal counsel to the Company. She became a member of the Antwerp Bar when joining Linklaters in 2001 where she gained extensive experience in corporate law, mergers and acquisitions and finance. In 2008 she joined Euroclear as a legal manager where she worked for both the local central securities depository Euroclear Belgium as well as the international central securities depository Euroclear Bank. An Goris graduated in law from the University of Antwerp in 2000. She also holds a Master's Degree in law from Oxford University, International Business Law (Paris, University René Descartes) and in Corporate Law (Catholic Universities of Louvain and Brussels). Ms. Goris is a native Dutch speaker and is also fluent in English and French. She is also a sworn legal translator for English and French into Dutch.
Brian Gallagher serves and has served as Head of Investor Relations of the Company since March 2014.2014 and joined the Euronav Management Board on January 1, 2019. Mr. Gallagher is also a member of the Sustainability Committee. Mr. Gallagher began his fund management career at the British Coal Pension fund unit, CIN Management, before moving to Aberdeen Asset Management in 1996. Managing and marketing a range of UK investment products Mr. Gallagher then progressed to Murray Johnstone in 1999 and then was headhunted by Gartmore Investment Management in 2000 to manage a range of UK equity income products. In 2007 he then set up a retail fund at UBS Global Asset Management before switching into Investor Relations as IR Director at APR Energy in 2011. Mr. Gallagher graduated in Economics from Birmingham University in 1992.
Stamatis Bourboulis joined the Euronav Management Board on January 1, 2019. Mr. Bourboulis has been General Manager of Euronav Ship Management (Hellas) Ltd. since its inception in November 2005. Mr. Bourboulis is also a member of the Sustainability Committee. Following his employment in a chemical factory, ship building and ship repair shipyards in Greece, he joined Ceres Hellenic Shipping Enterprises Ltd in October 1990 as Superintendent Engineer and dealt with various types of vessels. In 1997 Mr. Bourboulis became Ship Manager for the Crude Oil Tankers and OBOs. In 2000 Mr. Bourboulis undertook the position of Technical Manager for the Ceres fleet of Dry Bulk, Crude Oil, Chemical and LNG Carriers. He is a member of Intertanko Safety and Technical Committee (ISTEC), DNVGL and RINA Greek Technical Committee. Mr. Bourboulis graduated from the National Technical University of Athens as a Naval Architect and Marine Engineer in 1981.
B.Compensation
B.1. Compensation of the Supervisory Board Members
The compensation of our Supervisory Board of Directors is determined on the basis of four regular meetings of the full board per year. The actual amount of remuneration is determined by the annual general meeting and is benchmarked periodically with Belgian listed companies and international peer companies. The aggregate annual compensation paid to our executive officers, excluding our Chief Executive Officer,remuneration in 2020 of the members of the Supervisory Board is reflected in the table below:
| | | | | | | | | | | | | | | | | | | | | | | | | | | | | | | | | | | |
| Name | Fixed fee | Attendance fee Board | Audit and Risk committee | Attendance fee Audit and Risk Committee | Remuneration Committee | Attendance fee Remuneration Committee | Corporate Governance and Nomination Committee | Attendance fee Corporate Governance and Nomination Committee | Sustainability committee | Attendance fee Sustainability Committee | Total |
| Carl Steen | €160,000 | €40,000 | €20,000 | €20,000 | €0 | €0 | €5,000 | €20,000 | €0 | €0 | €265,000 |
| Anne-Hélène monsellato | €60,000 | €40,000 | €40,000 | €20,000 | €0 | €0 | €0 | €0 | €0 | €0 | €160,000 |
| Ludovic Saverys | €60,000 | €40,000 | €0 | €0 | €5,000 | €20,000 | €0 | €0 | €5,000 | €20,000 | €150,000 |
| Grace reksten Skaugen | €60,000 | €40,000 | €0 | €0 | €7,500 | €20,000 | €5,000 | €20,000 | €5,000 | €20,000 | €177,500 |
| Anita Odedra | €60,000 | €30,000 | €20,000 | €20,000 | €0 | €0 | €0 | €0 | €2,500 | €10,000 | €142,500 |
| Carl Trowell | €60,000 | €40,000 | €0 | €0 | €5,000 | €20,000 | €7,500 | €20,000 | €0 | €0 | €152,500 |
| Total | €460,000 | €230,000 | €80,000 | €60,000 | €17,500 | €60,000 | €17,500 | €60,000 | €12,500 | €50,000 | €1,047,500 |
B.2. Compensation of the Management Board Members
The fixed and variable remuneration in 2020 of the members of the Management Board is reflected in the table below:
Remuneration of Management Board Members for the previous financial year ended December 31, 2017 was EUR 2,644,951 comprised of EUR 1,083,097 of fixed compensation, EUR1,468,500 of variable compensation (of which EUR 734,250 in cash and EUR 734,250 in share related compensation), pension and benefits valued at EUR35,252 and EUR 58,102 in other compensation. The annual aggregate compensation paid to our Chief Executive Officer was GBP 996,978 comprised of GBP393,728 of fixed compensation, GBP 590,592 of variable compensation (of which GBP 295,296 in cash and GBP 295,296 in share related compensation) and GBP12,658 in other compensation. We also paid an aggregate of EUR580,000 fixed fees (board and committees) to our non-executive directors during
Taking into account the year ended December 31, 2017, with an additional aggregate board and committee meeting attendance fee of EUR435,000. Our Chairmanfact that the Management Board Members below have entered into a consultancy agreement as of the reported financial year, the below remuneration of 2019 has been used to calculate their actual consultancy remuneration.
| | | | | | | | | | | | | | | | | | | | | | | | | | | | | | | | |
| Name | Position | Fixed remuneration | One-year variable remuneration (1) | Extra ordinary items | Pension | Total Remuneration | Proportion of fixed remuneration | Proportion of variable remuneration |
| | Base Salary | Director Fees(2) | Fringe benefits | | | | | | |
| De Stoop Hugo | CEO | € 211,813 | € 292,000 | € 44,437 | € 325,000 | | € 22,374 | € 895,624 | 63,71% | 36,29% |
| Verbeeck Egied | General Counsel | € 146,800 | € 180,000 | € 39,146 | € 188,500 | | € 14,433 | € 568,879 | 66,86% | 33,14% |
| Gallagher Brian | Investor Relations Manager | £190,000 | | | £ 57,238 | | £19,000 | £ 266,238 | 78,50% | 21,50% |
| Alex Staring | COO | € 201,096 | € 295,000 | € 22,131 | € 227,950 | | € 32,507 | € 778,684 | 70,73% | 29,27% |
(1) Only takes into account the remuneration under the STIP, for information in respect of remuneration under the Company’s Long Term Incentive Plans (LTIP's) please refer to table under Item 6. F. Equity Incentive Plan.
(2) Director fees related to wholly owned subsidiaries of Euronav NV
Remuneration of Management Board is entitledMembers for the reported financial year
| | | | | | | | | | | | | | | | | | | | | | | | | | | | | | | | |
| Name | Position | Fixed remuneration | One-year variable remuneration (1) | Extra ordinary items | Pension | Total Remuneration | Proportion of fixed remuneration | Proportion of variable remuneration |
| | Base Remuneration | Director Fees | Fringe benefits | | | | | | |
| Hugo De Stoop, as permanent representative of Hecho BV | CEO | € 314,496 | € 292,000 | € 17,082 | € 370.000 | | | € 993.578
| 62,76% | 37,24% |
| Alex Staring, as permanent representative of AST Projects BV | COO | € 255,732 | € 295,000 | € 0 | € 260.000 | | | € 810.732 | 67,93% | 32,07% |
| Egied Verbeeck, as permanent representative of Echinus BV | General Counsel | € 219,960 | € 180,000 | € 17,082 | € 250.000 | | | € 667.042 | 62,52% | 37,48% |
| Lieve Logghe, as permanent representative of TINCC BV | CFO | € 335,000 | € 90,000 | € 0 | € 280.000 | € 142,800 | | € 847.800 | 50,13% | 49,87% |
| Brian Gallagher, as permanent representative of BG-IR Ltd. | Investor Relations Manager | £ 209,000 | € 0 | € 0 | £ 80.000 | | | £ 289.000 | 72,32% | 27,68% |
| Stamatis Bourboulis | General Manager Hellas | € 365,147 | € 0 | € 9,690 | € 80.000 | | € 18.257 | € 473.094 | 83,09% | 16,91% |
(1) Only takes into account the remuneration under the STIP, for information in respect of renumeration under the Company’s Long Term Incentive Plans (LTIPs) please refer to receivetable under Item 6. F. Equity Incentive Plan.
C.Board Practices
Effective as of February 20, 2020, Euronav's governance structure was revised to adopt a gross fixed amounttwo tier governance model. As of EUR 160,000 per year,February 20, 2020, the body formerly known as the Board of Directors was converted into a Supervisory Board and the former Executive Committee ceased to exist and was replaced by the existing Management Board, in accordance with relevant provisions of the Code of Companies and Associations. For the date of expiration of the current term of office of each member of the board is entitled to receive a gross fixed amount of EUR 60,000 per year, save for Mr. Dan Bradshaw. For Mr. Bradshaw, the gross fixed annual remuneration pursuant to his director's mandate was set at EUR 20,000. In addition, our ChairmanSupervisory Board, please see “Item 6. Directors, Senior Management and each director are entitled to receive an attendance fee of EUR 10,000 per board meeting attended, not to exceed EUR 40,000 per year. The Chairman of our auditEmployees – A. Directors and risk committee is entitled to receive a gross fixed amount of EUR 40,000, and each member of the audit and risk committee is entitled to receive a gross fixed amount of EUR 20,000 per year. In addition, the Chairman of our audit and risk committee and members of the audit and risk committee are entitled to receive an attendance fee of EUR 5,000 per audit and risk committee meeting attended, not to exceed EUR 20,000 per year. Our Chairmen of all of our other committees are entitled to receive a gross fixed amount of EUR 7,500 per year, and the members of all of our other committees are entitled to receive a gross fixed amount of EUR 5,000. In addition, our Chairmen and members of these other committees will also be entitled to receive an attendance fee of EUR 5,000 for each committee meeting attended, with a maximum of EUR 20,000 per year for each committee served.Senior Management.”
Our Chief Executive Officer, who is also a director, has waived his director's fees.
C.Supervisory Board Practices
Our Board of Directors currently consists of sevensix members, five of which are considered "independent" under Rule 10A-3 promulgated under the Exchange Act and under the rules and regulations of the NYSE: Mr. Steen, Mr. Bradshaw, Ms. Monsellato, Ms. Skaugen, Ms. Odedra and Mr. Thomson.
Trowell.
Our Supervisory Board of Directors has established the following committees, and may, in the future, establish such other committees as it determines from time to time:
Audit and Risk Committee
Our Audit and Risk Committee consists of four Directorsthree members (all four Directorsthree members of whom are independent under the Exchange Act and NYSE rules)rules and regulations): Ms. Monsellato, as Chairman, Mr. Thomson, Mr. BradshawChair, Ms. Odedra and Mr. Steen. Our Audit and Risk Committee is responsible for ensuring that we have an independent and effective internal and external audit system. Additionally, the Audit and Risk Committee advises the Supervisory Board of Directors in order to achieve its supervisory oversight and monitoring responsibilities with respect to financial reporting, internal controls and risk management. Our Supervisory Board of Directors has determined that Ms. Monsellato qualifies as an "audit committee financial expert" for purposes of SEC rules and regulations.
Corporate Governance and Nomination Committee
Our Corporate Governance and Nomination Committee consists of three members: Mr. Bradshaw,Trowell, as Chairman, Ms. MonsellatoChair, Mr. Steen and Ms. Skaugen. Our Corporate Governance and Nomination Committee is responsible for evaluating and making recommendations regarding the size, composition and independence of the Supervisory Board of Directors and the Executive Committee,Management Board, including the recommendation of new Director-nominees.Supervisory Board members and the appointment of new Management Board members.
Remuneration Committee
Our Remuneration Committee consists of three members: Mr. Thomson,Ms. Skaugen, as Chairman, Ms. SkaugenMr. Steen and Mr. Saverys. Our remuneration committee is responsible for assisting and advising the Supervisory Board of Directors on determining compensation for our directors, executive officersof its members, members of the Management Board and other employees and administering our compensation programs.
Sustainability Committee
Our Sustainability Committee (formerly known as ESG & Climate Committee) consists of seven members: Mr. De Stoop, as Chair, Ms. Skaugen, Mr. Saverys, Ms Odedra, Mr. Verbeeck, Mr Bourboulis and Mr. Gallagher. The Sustainability Committee is an advisory body to the Supervisory Board. The main role of the Sustainability Committee is to assist and advise the Supervisory Board in monitoring the performance as well as key risks and opportunities that the Company faces in relation to environmental, social and climate matters. In this respect the Sustainability Committee will oversee the Company’s conduct and performance on ESG matters as well as its reporting thereon, in order to inform the Supervisory Board and make recommendations it deems appropriate on any area within its remit where action or improvement is needed.
ESG Information
APPLICATION OF GLOBAL ENVIRONMENTAL AND OTHER REGULATIONS
Increasing environmental concerns have created a demand for vessels that conform to stricter environmental standards. We are required to maintain operating standards for all of our vessels that emphasize operational safety, quality maintenance, continuous training of our officers and crews and compliance with international regulations. We believe that the operation of our vessels is in substantial compliance with applicable environmental laws and regulations and that our vessels have all material permits, licenses, certificates or other authorizations necessary for the conduct of our operations. However, because such laws and regulations frequently change and may impose increasingly stricter requirements, we cannot predict our ability to comply and the ultimate cost of complying with these requirements, or the impact of these requirements on the resale value or useful lives of our vessels. In addition, a future serious marine incident that causes significant adverse environmental impact could result in additional legislation or regulation that could negatively affect our profitability.
As one of the biggest large crude tanker shipping companies in the world, we recognize the need to operate a safe, responsible and sustainable business built for the long term. We are committed to implementing ESG practices into our operational and strategic decision making within the scope of our vision to be a leader in sustainable crude tanker shipping. As such, we aim to meet and, if possible and appropriate for our business, exceed minimum compliance levels set forth in rules and regulations governing the maritime industry, including certain rules and regulations described below.
In this respect in terms of disclosure we act in accordance with the Marine Transportation framework established by the Sustainability Accounting Standards Board (SASB). The SASB standard allows us to identify, manage and report on material sustainability or ESG topics with industry specific performance metrics, based on SASB’s internationally recognised indicators and related definitions, scope and calculations. Additionally, we have incorporated the principles of the UN Sustainability Development Goals where applicable.
We believe that environmental actions, addressing climate change, and operating our business to the highest safety standards cannot be done without strong governance, which includes high ethical standards and oversight from an independent board and management. Environment and governance cannot do without the input of social or human capital with respect for the individual, gender and other social qualities. Sustainability at Euronav is about much more than emissions, climate change and other environmental challenges. It is also about delivering a supportive environment to our employees, respect, safety at all levels of our business, and ensuring accountability on these objectives.
Our ESG Performance:
Environment
We implement measures designed to ensure compliance with all applicable environmental regulations, reduce our carbon footprint, improve our environmental performance and protect the marine environment.
•We have established a dedicated fuel procurement and management team to ensure compliant VLSFO (Very Low Sulphur Fuel Oil) fuel is managed effectively and complies with new regulations to reduce SOX emissions by 85% from the United Nations agency for maritime safety and the prevention of pollution by vessels (the “IMO”).
•We have an ongoing retrofit program across our entire fleet to comply with the IMO’s Ballast Water Management Convention.
•With our initial submission in 2020, Euronav was awarded a B rating by the Carbon Disclosure Project for our ongoing engagement on climate change.
•We were an original drafting partner and fully participate in the Poseidon Principles, which establish a framework for assessing and disclosing the climate alignment of ship finance portfolios and are consistent with the policies and ambitions of the IMO to reduce shipping's total annual GHG emissions by at least 50% by 2050.
•We have engaged and actively participate in partnerships and alliances that promote sustainability in the maritime sector, including emission control and other environmental initiatives, such as the Global Maritime Forum, the Getting to Zero Coalition, International Tanker Owner Pollution Federation, Sea Cargo Charter, Ocean Cleanup, HELMEPA (Hellenic Marine Environment Protection Association) and Intertanko.
Social
•We are focused οn continuously improving our social impact, including with respect to the health, safety and wellbeing of employees, both on board and ashore, to operational excellence, and to community support.
•The health, safety and well-being of our people at sea and on shore is our top priority, especially during the COVID-19 pandemic. We are a signatory to the Neptune Declaration on Seafarer Wellbeing, which promotes the health and safety of seafarers.
•We are dedicated to providing equal employment opportunities and treating our people fairly without regard to race, color, religious beliefs, age, sex, or any other classification.
•We maintain high retention rates both on board and ashore and work to facilitate the professional development and career advancement of our people.
•Since the inception of the index in 2017 Euronav has been included in the Bloomberg Gender-Equality Index – following a company-wide assessment of gender representation – Euronav is the only shipping company to be included in this independently accredited benchmark.
•Our community investment activities focus on, but are not limited to, supporting vulnerable groups and youth education.
Governance
We endeavor to apply corporate governance best practices, adhere to high ethical principles and ensure the high commercial performance of our fleet.
•The Company is governed by a diverse and experienced, majority independent Supervisory Board.
•We have a transparent Code of Ethics, Anti-Corruption Policy and Whistleblowing Policy in place.
•We began the process of moving our capital funding to a sustainable framework with our September 2020 entrance into the $713.0 Million Sustainability Linked Senior Secured Credit Facility in September of 2020, which facility features sustainability targets, including emissions reduction built into agreement.
•Established in 2019, Euronav is the only crude tanker company to have a dedicated committee comprising Supervisory and Management Board members as part of the Sustainability Committee. The role of this Sustainability Committee is to oversee Euronav’s management of and strategy toward sustainability and climate change.
•50% of our Supervisory Board is female.
•We implement strong internal controls structured to ensure robust risk management.
•We have consistently ranked in top 10 in leading corporate governance surveys of shipping companies organized by Wells Fargo/Webber research since 2016 (https://www.euronav.com/en/sustainability/publications).
Our Decarbonisation Strategy
We aim to lead the crude tanker and the shipping industry’s efforts to reduce greenhouse gas (GHG) emissions and comply with globally set regulations. We intend to lead by example by applying new technologies where possible and forming alliances with participants that aim to decarbonize the industry. We are focused on reducing emissions progressively going forward with yearly milestone targets rather than open ended commitments far into the future.
Key drivers of our decarbonization strategy include:
•Continuing to be leaders in developing transparent reporting on our GHG emissions
•Improving the energy efficiency of our existing fleet.
•Participating in research and development for new technologies and alternative fuels.
•Developing partnerships and participating in environmental alliances; and
•Establishing ambitious but realistic GHG emission targets
We have and will continue to take various steps to reduce our carbon footprint and improve the environment, including through investments made to our fleet. Our carbon footprint for 2020 versus 2019 was reduced by 1%. Specifically, we have:
•Purchased modern, fuel-efficient vessels with lower overall fuel consumption than older vessels in order to reduce our fleet’s greenhouse gas GHG emissions.
•Divested of certain older, less fuel-efficient vessels.
•Established and executed a compliance program regarding IMO 2020 fuel regulations.
•Overseen the installation of ballast water treatment systems are installed on 39 vessels in our current fleet, which represents approximately 53% of our current fleet; and
•Engaged in investments designed to both improve operational performance but also reduce emissions. For instance application on 27 vessels during 2021 dry docking schedule in foul reducing paints is expected to actively reduce our CO2 emissions.
D.Employees
As of December 31, 2017,2020, we employed approximately 2,9523,720 (2019: 2,910 and 2018: 2,900) people, including approximately 152220 (2019: 210 and 2018: 200) onshore employees based in our offices in Greece, Belgium, United Kingdom, France, Switzerland, Hong Kong, Geneva, and Singapore and approximately 2,8003,500 (2019: 2,700 and 2018: 2,700) seagoing officers and crew. Some of our employees are represented by collective bargaining agreements. As part of the legalour obligations in some of these agreements, we are required to contribute certain amounts to retirement funds and pension plans and have restricted ability to dismiss certain employees. In addition, many of these represented individuals are working under agreements that are subject to salary negotiation. These negotiations could result in higher personnel costs, other increased costs or increased operating restrictions that could adversely affect our financial performance. We consider our relationships with the various unions as satisfactory. As of the date of this annual report, there are no ongoing salary negotiations or material outstanding issues.
E. Share ownership
The ordinary shares beneficially owned by our directorsthe members of the Supervisory Board and Management Board and senior managers are disclosed in "Item 7. Major Shareholders and Related Party Transactions—A. Major Shareholders."
F. Equity Incentive Plans
Stock Option Plan
Our Board of Directors has adopted a stock option plan, pursuant to which directors, officers, and certain employees of us and our subsidiaries were eligible to receive options to purchase ordinary shares of us at a predetermined price. On December 16, 2013, we granted options to purchase an aggregate of 1,750,000 ordinary shares to members of our Executive Committee at an exercise price of €5.7705 per share. The following table provides a summary of the number of options that were granted pursuant to this plan, together with the amount of options that have vested and have been exercised as of the date of this annual report. | | | | | | | | | | | | | | | | | | | | | | | | | | | | | | | | | | | | | | |
| Name of Director | Position | The main conditions of share plans | Information regarding the reported financial year |
| Opening balance | During the year | Closing balance |
| Specification of plan | Performance period (1) | Award date | Vesting date | End of retention period | Shares held at the beginning of the year | Shares awarded a) total number granted b) value @ grant date | Shares vested a) total number vested b) value @ vest date | Shares subject to a performance condition | Shares awarded and unvested | Shares subject to a retention period |
| Hugo De Stoop, as permanent representative of Hecho BV | CEO | LTIP 2016 | 02/02/2016- 03/02/2020 | 02/02/2016 | 03/02/2020 | N/A | 6,909 | | a) 6,909 | | 0 | N/A |
| | | | | | | | b) € 80,308 | | | |
| LTIP 2017 | 09/02/2017-10/02/2021 | 09/02/2017 | 10/02/2021 | N/A | 13,486 | | a) 6,743 | | 6,743 | N/A |
| | | | | | | | b) € 69,559 | | | |
| LTIP 2018 | 16/02/2018-17/02/2022 | 16/02/2018 | 17/02/2022 | N/A | 37,620 | | a) 12,540 | | 25,080 | N/A |
| | | | | | | | b) € 129,965 | | | |
| TBIP | 12/01/2019-12/01/2024 | 12/01/2019 | 12/01/2024 | N/A | 300,000 | | a) 36,000 | 264,000 | 264,000 | N/A |
| | | | | | | | b) $ 430,200 | | | |
| LTIP 2019 | 01/04/2019 - 01/04/2022 | 01/04/2019 | 01/04/2022 | N/A | 67,069 | | | 67,069 | 67,069 | N/A |
| | | | | | | | | | | |
| LTIP 2020 | 01/04/2020 - 01/04/2023 | 01/04/2020 | 01/04/2023 | N/A | | a) 48,856 | | 48,856 | 48,856 | N/A |
| | | | | | | b) € 500,000 | | | | |
|
| | | |
| | Options Granted | Options Vested | Options Exercised |
| CEO | 525,000 | 525,000 | 350,000 |
| CFO | 525,000 | 525,000 | 350,000 |
| COO | 350,000 | 350,000 | 350,000 |
| General Counsel | 350,000 | 350,000 | 350,000 |
| | | | | | | | | | | | | | | | | | | | | | | | | | | | | | | | | | | | | | |
| Alex Staring, as permanent representative of AST Projects BV | COO | LTIP 2016 | 02/02/2016- 03/02/2020 | 02/02/2016 | 03/02/2020 | N/A | 2,670 | | a) 2,670 | | 0 | N/A |
| | | | | | | b) € 31,035 | | | |
| LTIP 2017 | 09/02/2017-10/02/2021 | 09/02/2017 | 10/02/2021 | N/A | 8,372 | | a) 4,186 | | 4,186 | N/A |
| | | | | | | b) € 43,181 | | | |
| LTIP 2018 | 16/02/2018-17/02/2022 | 16/02/2018 | 17/02/2022 | N/A | 36,480 | | a) 12,160 | | 24,320 | N/A |
| | | | | | | b) €126,026 | | | |
| TBIP | 12/01/2019-12/01/2024 | 12/01/2019 | 12/01/2024 | N/A | 150,000 | | a) 18,000 | 132,000 | 132,000 | N/A |
| | | | | | | b) $ 215,100 | | | |
| LTIP 2019 | 01/04/2019 - 01/04/2022 | 01/04/2019 | 01/04/2022 | N/A | 39,034 | | | 39,034 | 39,034 | N/A |
| | | | | | | | | | |
| LTIP 2020 | 01/04/2020 - 01/04/2023 | 01/04/2020 | 01/04/2023 | N/A | | a) 28,434 | | 28,434 | 28,434 | N/A |
| | | | | | b) € 291,000 | | | | |
| Egied Verbeeck, as permanent representative of Echinus BV | General Counsel | LTIP 2016 | 02/02/2016- 03/02/2020 | 02/02/2016 | 03/02/2020 | N/A | 2,922 | | a) 2,922 | | 0 | N/A |
| | | | | | | | b) € 33,964 | | | |
| LTIP 2017 | 09/02/2017-10/02/2021 | 09/02/2017 | 10/02/2021 | N/A | 6,538 | | a) 3,269 | | 3,269 | N/A |
| | | | | | | | b) € 33,722 | | | |
| LTIP 2018 | 16/02/2018-17/02/2022 | 16/02/2018 | 17/02/2022 | N/A | 27,360 | | a) 9,120 | | 18,240 | N/A |
| | | | | | | | b) € 94,520 | | | |
| TBIP | 12/01/2019-12/01/2024 | 12/01/2019 | 12/01/2024 | N/A | 170,000 | | a) 20,400 | 149,600 | 149,600 | N/A |
| | | | | | | | b) $ 243,780 | | | |
| LTIP 2019 | 01/04/2019 - 01/04/2022 | 01/04/2019 | 01/04/2022 | N/A | 21,797 | | | 21,797 | 21,797 | N/A |
| | | | | | | | | | | |
| LTIP 2020 | 01/04/2020 - 01/04/2023 | 01/04/2020 | 01/04/2023 | N/A | | a) 15,878 | | 15,878 | 15,878 | N/A |
| | | | | | | b) €162,500 | | | | |
| | | | | | | | | | | | | | | | | | | | | | | | | | | | | | | | | | | | | | |
| Lieve Logghe, as permenant representative of TINCC BV | CFO | LTIP 2020 | 01/04/2020 - 01/04/2023 | 01/04/2020 | 01/04/2023 | N/A | | a) 34,199 | | | | N/A |
| | | | | | | b) € 350,000 | | | | |
| Brian Gallagher, as permanent representative of BG-IR Ltd. | Investor Relations Manager | LTIP 2017 | 09/02/2017-10/02/2021 | 09/02/2017 | 10/02/2021 | N/A | 4,024 | | a) 2,012 | | 2,012 | N/A |
| | | | | | | b) € 20,755 | | | |
| LTIP 2018 | 16/02/2018-17/02/2022 | 16/02/2018 | 17/02/2022 | N/A | 6,319 | | a) 2,106 | | 4,213 | N/A |
| | | | | | | b) € 21,826 | | | |
| TBIP | 12/01/2019-12/01/2024 | 12/01/2019 | 12/01/2024 | N/A | 80,000 | | a) 9,600 | 70,400 | 70,400 | N/A |
| | | | | | | b) $ 114,720 | | | |
| LTIP 2019 | 01/04/2019 - 01/04/2022 | 01/04/2019 | 01/04/2022 | N/A | 9,677 | | | 9,677 | 9,677 | N/A |
| | | | | | | | | | |
| LTIP 2020 | 01/04/2020 - 01/04/2023 | 01/04/2020 | 01/04/2023 | N/A | | a) 6,267 | | 6,267 | 6,267 | N/A |
| | | | | | b) £ 57,000 | | | | |
| Bourboulis Stamatis | General Manager Hellas | TBIP | 12/01/2019-12/01/2024 | 12/01/2019 | 12/01/2024 | N/A | 50,000 | | a) 6,000 | 44,000 | 44,000 | N/A |
| | | | | | | b) $ 71,700 | | | |
| LTIP 2019 | 01/04/2019 - 01/04/2022 | 01/04/2019 | 01/04/2022 | N/A | 14,769 | | | 14,769 | 14,769 | N/A |
| LTIP 2020 | 01/04/2020 - 01/04/2023 | 01/04/2020 | 01/04/2023 | N/A | | a) 10,758 | | 10,758 | 10,758 | N/A |
| | | | | | b) € 110,100 | | | | |
2015 Long-TermLong Term Incentive Plan
In 2015, our Board of Directors adopted a long-term incentive plan, pursuant to which key management personnel are eligible to receive options to purchase ordinary shares at a predetermined price and restricted stock units (RSUs) that represent the right to receive ordinary shares or payment of cash in lieu thereof, in accordance with the terms of the plan. On February 12, 2015, we granted options to purchase an aggregate of 236,590 ordinary shares at €10.0475 per share, subject to customary vesting provisions, and 65,433 RSUs which vested automatically on the third anniversary of the grant. The following tables providetable provides a summary of the number of options and RSUs that werehave been granted pursuant to this plan, together with the amount of options that have vested and that have been exercised as of the date of this annual report..report:
| | | | | | | | | | | |
| | Options Granted | Options Vested | Options Exercised |
| Former CEO | 80,518 | 80,518 | — |
| Former CFO | 58,716 | 58,716 | — |
| COO | 54,614 | 54,614 | — |
| General Counsel | 42,742 | 42,742 | — |
|
| | | |
| | Options Granted | Options Vested | Options Exercised |
| CEO | 80,518 | 80,518 | — |
| CFO | 58,716 | 58,716 | — |
| COO | 54,614 | 54,614 | — |
| General Counsel | 42,742 | 42,742 | — |
|
| |
| RSUs granted |
CEO | 22,268 |
CFO | 16,239 |
COO | 15,105 |
General Counsel | 11,821 |
2016 Long Term Incentive Plan
In December 2015, our Board of Directors adopted a long termlong-term incentive plan, or the 2016 Long Term Incentive Plan, pursuant to which members of the Executive Committee are eligible to receive phantom stock unit grants. References in the tabular disclosure immediately under the heading “Item 6.F.—Equity Incentive Plans” to “LTIP 2016” are to the 2016 Long Term Incentive Plan. Other senior employees may in the future be invited to participate in this long termlong-term incentive plan by the Supervisory Board of Directors upon recommendation of the Remuneration Committee. Upon the vesting of each phantom stock unit and subject to the terms of the 2016 Long Term Incentive Plan, each phantom stock unit grants the holder a conditional right to receive an amount of cash equal to the fair market value of one share of the Company on the settlement date. On February 2, 2016, we granted 54,616 phantom stock units to certain of our executive officers. The phantom stock units will mature one-third each year on the second, third, fourth anniversary of the award. All of the beneficiaries have accepted the phantom stock units granted to them. The number of phantom stock units granted was calculated on the basis of a share price of €10.6134 which equals the weighted average of the share price of the three days preceding the grant date. The following tables providetable provides a summary of the number of phantom stock units that were granted pursuant to this plan and the amount that has vested as of the date of this annual report.
| | | | | | | | |
| | Phantom Stock Units Granted | Phantom Stock Units Vested |
| Former CEO | 17,116 | N/A * |
| Former CFO | 20,728 | 20,728 |
| COO | 8,009 | 8,009 |
| General Counsel | 8,762 | 8,762 |
|
| | |
| | Phantom Stock Units Granted | Phantom Stock Units Vested |
| CEO | 17,116 | 5,705 |
| CFO | 20,728 | 6,909 |
| COO | 8,009 | 2,669 |
| General Counsel | 8,762 | 2,920 |
2017 Long Term Incentive Plan
In February 2017, our Board of Directors adopted a long term incentive plan or the 2017 Long Term Incentive Plan, pursuant to which members of the Executive Committee as well as the Head of Investor Relations are eligible to receive phantom stock unit grants. References in the tabular disclosure immediately under the heading “Item 6.F.—Equity Incentive Plans” to “LTIP 2017” are to the 2017 Long Term Incentive Plan. Other senior employees may in the future be invited to participate in this long term incentive plan by the Supervisory Board of Directors upon recommendation of the Remuneration Committee. Upon the vesting of each phantom stock unit and subject the terms of the 2017 Long Term Incentive Plan, each phantom stock unit grants the holder a conditional right to receive an amount of cash equal to the fair market value of one share of the Company on the settlement date. On February 9, 2017, we granted 66,44866,449 phantom stock units to certain of our executive officers. The phantom stock units will maturematured one-third each year on the second, third, fourth anniversary of the award. All of the beneficiaries have accepted the phantom stock units granted to them. The number of phantom stock units granted was calculated on the basis of a share price of €7.2677 which equals the weighted average of the share price of the three days preceding the announcement of our preliminary full year results of 2016. The following tables providetable provides a summary of the number of phantom stock units that were granted pursuant to this plan and the amount that has vested as of the date of this annual report.
|
| | |
| Phantom Stock Units Granted | Phantom Stock Units Vested |
CEO | 17,819 | — |
CFO | 20,229 | — |
COO | 12,557 | — |
General Counsel | 9,808 | — |
Head of Investor Relations | 6,036 | — |
| | | | | | | | |
| | Phantom Stock Units Granted | Phantom Stock Units Vested |
| Former CEO | 17,819 | N/A* |
| Former CFO | 20,229 | 20,229 |
| COO | 12,557 | 12,557 |
| General Counsel | 9,808 | 9,808 |
| Head of Investor Relations | 6,036 | 6,036 |
2018 Long Term Incentive Plan
In February 2018, our Board of Directors adopted a long termlong-term incentive plan, or the 2018 Long Term Incentive Plan, pursuant to which members of the Executive CommitteeManagement Board as well as the Head of Investor Relations, Research & Communications are eligible to receive phantom stock unit grants. References in the tabular disclosure immediately under the heading “Item 6.F.—Equity Incentive Plans” to “LTIP 2018” are to the 2018 Long Term Incentive Plan. Other senior employees may in the future be invited to participate in this long termlong-term incentive plan by the Supervisory Board of Directors upon recommendation of the Remuneration Committee. Upon the vesting of each phantom stock unit and subject the terms of the 2018 Long Term Incentive Plan, each phantom stock unit grants the holder a conditional right to receive an amount of cash equal to the fair market value of one share of the Company on the settlement date. On February 16, 2018, we granted 148,113154,432 phantom stock units to certain of our executive officers. The phantom stock units will mature one-third each year on the second, third, fourth anniversary of the award. All of the beneficiaries have accepted the phantom stock units granted to them. The number of phantom stock units granted was calculated on the basis of a share price of €7.2368 which equals the weighted average of the share price of the three days preceding the announcement of our preliminary full year results of 2017. The following tables providetable provides a summary of the number of phantom stock units that were granted pursuant to this plan and the amount that has vested as of the date of this annual report.
| | | | | | | | |
| | Phantom Stock Units Granted | Phantom Stock Units Vested |
| Former CEO | 46,652 | N/A* |
| Former CFO | 37,620 | 25,080 |
| COO | 36,480 | 24,320 |
| General Counsel | 27,360 | 18,240 |
| Head of Investor Relations | 6,319 | 4,213 |
Transaction Based Incentive Plan
On 12 January 2019, the members of the Executive Committee and certain other senior employees were granted a transaction based incentive award in the form of 1,200,000 phantom stock units or the Transaction Based Incentive Plan. References in the tabular disclosure immediately under the heading “Item 6.F.—Equity Incentive Plans” to “TBIP” are to the Transaction Based Incentive Plan. The vesting and settlement of the awards under the Transaction Based Incentive Plan is spread over a timeframe of five years. The phantom stock awarded matures in four tranches as follows:
•the first tranche of 12% vests when the Company's share price reaches $ 12
•the second tranche of 19% vests when the Company's share price reaches $14
•the third tranche of 25% vests when the Company's share price reaches $ 16; and
•the fourth tranche of 44% vests when the Company's share price reaches $18
| | | | | | | | |
| | Phantom Stock Units Granted | Phantom Stock Units Vested |
| Former CEO | 400,000 | N/A* |
| Former CFO | 300,000 | 36,000 |
| COO | 150,000 | 18,000 |
| General Counsel | 170,000 | 20,400 |
| Head of Investor Relations | 80,000 | 9,600 |
| General Manager Hellas | 50,000 | 6,000 |
* The CEO waived further entitlements as a result of termination of his employment, announced by press release on February 4, 2019.
|
| | |
| Phantom Stock Units Granted | Phantom Stock Units Vested |
CEO | 46,652 | — |
CFO | 37,620 | — |
COO | 36,480 | — |
General Counsel | 27,360 | — |
Head of Investor Relations | 6,319 | — |
2019 Long Term Incentive Plan
In December 2019, the Supervisory Board, upon recommendation of the Remuneration Committee, has adopted a variable compensation structured as a long term incentive plan comprised of restricted stock units, or RSU's for certain of our Management Board Members. Each RSU grants the applicable holder of the RSU, or the RSU Holder a conditional right to receive one (1) ordinary share for free upon vesting of the RSU.
The maximum value at grant:
•In the case of the CEO, 100% of absolute base salary for the CEO; and
•In the case of the other Management Board Members, ranges from 30% to 75% of absolute base salary of such Members
The vesting is subject for:
•75% to a relative Total Shareholder Return (TSR) performance measurement compared to a peer group over a three year period. Each yearly measurement to be worth 1/3rd of 75% of the award.
•25% to an absolute TSR of the Company’s Shares measured each year for 1/3rd of 25% of the award
The RSUs held by an RSU Holder may vest in accordance with the principles of the plan during a period of three years and will only be acquired by the RSU holder after 3 years.
2020 Long Term Incentive Plan
On March 24, 2020 the Supervisory Board, upon recommendation of the Remuneration Committee, has adopted a variable compensation structured as a long term incentive plan comprised of RSUs for certain of our Management Board Members. Each RSU grants the RSU Holder a conditional right to receive one (1) ordinary shares for free upon vesting of the RSU.
The maximum value at grant:
•In the case of the CEO and CFO is 100% of absolute base salary; and
•In the case of the other Management Board Members, ranges from 30% to 75% of absolute base salary of such Members
The vesting is subject for:
•75% to a relative Total Shareholder Return (TSR) performance measurement compared to a peer group over a three year period. Each yearly measurement to be worth 1/3rd of 75% of the award.
•25% to an absolute TSR of the Company’s Shares measured each year for 1/3rd of 25% of the award
The RSU held by an RSU Holder may vest in accordance with the plan during a period of 3 years and will only be acquired by the RSU holder after 3 years.
ITEM 7. MAJOR SHAREHOLDERS AND RELATED PARTY TRANSACTIONS.
A.Major shareholders.
The following table sets forth information regarding beneficial ownership of our ordinary shares for (i) owners of more than five percent of our ordinary shares and (ii) our directors and officers as a group, of which we are aware as of March 19, 2018.April 1, 2021.
|
| | | | | | |
| | | Number |
| | Percentage(1) |
|
| Saverco NV (2) | | 16,130,028 |
| | 10.13 | % |
| Châteauban SA (3) | | 15,921,400 |
| | 10.00 | % |
| Victrix NV (4) | | 9,245,393 |
| | 5.81 | % |
| M&G Investment Management Limited (5) | | 8,135,920 |
| | 5.11 | % |
| Directors and Executive Officers as a Group * | | — |
| | — |
|
| | | | | | | | | | | | | | |
| Shareholder | | Number | | Percentage(1) |
| Euronav (treasury shares) | | 18,346,732 | | | 8.34 | % |
| Directors and Executive Officers as a Group * | | — | | — |
*Individually each owning less than 1.0% of our outstanding ordinary shares.
| |
(1) | Calculated based on 159,208,949 ordinary shares outstanding as of March 19, 2018. |
| |
(2) | Including shares held directly or indirectly by or for the benefit of Mr. Marc Saverys. The business address of Mr. Marc Saverys is De Gerlachekaai 20, 2000 Antwerpen, Belgium. The information is derived from Schedule 13G filed with the SEC on February 1, 2018. |
| |
(3) | Based on information contained in the Schedule 13G/A that was filed with the SEC on February 1, 2018 by Châteauban SA. |
| |
(4) | Including shares held directly or indirectly by or for the benefit of Ms. Virginie Saverys, who has voting or dispositive power over the shares held by Victrix NV. The business address of Victrix NV is Le Grellelei 20, 2000 Antwerpen, Belgium. The information is derived from Schedule 13G filed with the SEC on February 11, 2016. |
| |
(5) | Based on information contained in the Schedule 13G that was filed with the SEC on February 14, 2018 by M&G Investment Management Limited. |
(1)Calculated based on 220,024,713 ordinary shares outstanding as of April 1, 2021. The Company holds 18,346,732 ordinary shares in treasury.
As of March 19, 2018,April 1, 2021, our issued share capital amounted to $173,046,122.14$239,147,506.82 divided into 159,208,949220,024,713 ordinary shares with no par value. On the same date, 33,939,91360,594,267 of our shares, our U.S. Shares, representing approximately 21.3%28% of our share capital , were reflected on the U.S. Register, all of which wereand are held in the name of one shareholder, beingby 9 holders including CEDE & CO.,CO, acting as nominee holder for Thethe Depository Trust Company.
In accordance with a May 2, 2007 Belgian law relating to disclosure of major holdings in issuers whose shares are admitted to trading on a regulated market and containing miscellaneous provisions requiring investors in certain publicly-traded corporations whose investments reach certain thresholds to notify thethe Company and the Belgian Financial Services and Markets Authority, or the FSMA, of such change as soon as possible and in any event within four trading days. The minimum disclosure threshold is 5% of the Company's issued voting share capital. Further details in this respect can be found on the website of the FSMA: http:https://www.fsma.be/en/Supervision/fm/gv/ah/wetteksten/wetgeving.aspx.shareholding-structure-0. The information contained on this website does not form a part of this annual report.
To our knowledge, we are neither directly nor indirectly owned nor controlled by any other corporation, by any government or by any other natural or legal person severally or jointly. Pursuant to Belgian law and our organizational documents, to the extent that we may have major shareholders at any time, we may not give them different voting rights from any of our other shareholders.
WeAs of the date of this report, to our knowledge, there are aware of no arrangements which may at a subsequent date result in a change in control of our company.Company.
B.Related party transactions.
Services Agreement with CMB
During the year ended December 31, 2017, we paid CMB a total of $34,928 (2016: $17,731, 2015: $0) for stationery provided by CMB.
Mr. Marc Saverys, the former Vice Chairman of our Board ofSee “Item 6.A Directors, currently controls Saverco, a company that is currently CMB's majority shareholder,Senior Management and may be deemed to beneficially own 10.13% of our outstanding ordinary shares. Mr. Marc Saverys is the father of one of our directors, Mr. Ludovic Saverys.
From time to time, Saverco renders travel services to us on a transactional basis. Saverco did not render any such services to us during the years ended December 31, 2017.
Registration Rights Agreement
On January 28, 2015, we entered into a registration rights agreement with companies affiliated with our former Chairman, Peter Livanos, or the Ceres Shareholders, and companies affiliated with our former Vice Chairman and current major shareholder, Marc Saverys, or the Saverco Shareholders.
The Ceres Shareholders and the Saverco Shareholders may require us to file shelf registration statements permitting sales by them of ordinary shares into the market from time to time over an extended period, subject to certain exceptions. The Ceres Shareholders and the Saverco Shareholders are only treated as having made their request if the registration statement for such shareholder group's shares is declared effective. The Ceres Shareholders and the Saverco Shareholders can also exercise piggyback registration rights to participate in certain registrations of ordinary shares by us, including through on the others' demand registration. All expenses relating to the registrations, including the participation of our executive management team in two marketed roadshows and a reasonable number of marketing calls in connection with one-day or overnight transactions, will be borne by us. The registration rights agreement also contains provisions relating to indemnification and contribution. There are no specified financial remedies for non-compliance with the registration rights agreement.
Chartering with Joint Venture Entities
Bretta Tanker Holdings Inc. Eugenie, Devon, Capt. Michael, Maria
Prior to June 2, 2016, we and Bretta Tanker Holdings Inc., or Bretta, each owned a 50% equity interest in Fiorano, Larvotto, Fontvieille, and Moneghetti, joint ventures which owned the Capt. Michael, Maria, Eugenie and Devon, respectively.
John Michael Radziwill, one of our former directors, serves as an advisor of SCP Clover Maritime, a company that manages assets and investments of Mr. John Radziwill, his father, and specifically for Bretta.
On June 2, 2016, we entered into a share swap and claims transfer agreement whereby (i) we transferred our 50% equity interest in Moneghetti and Fontvieille, and as consideration therefore, acquired from Bretta its 50% ownership interest in Fiorano and Larvotto; and (ii) we transferred our claims arising from the shareholder loans to Moneghetti and Fontvieille and acquired Bretta's claims arising from the shareholder loans to Fiorano and Larvotto. In addition, we paid $15.1 million to Bretta as compensation for the difference in value of the vessels. As a result of this transaction, our equity interest in both Fiorano and Larvotto increased from 50% to 100% and we are now the sole owner of the Suezmaxes Captain Michael and the Maria. We no longer have an equity interest in Moneghetti or Fontvieille, which own the Suezmaxes Devon and the Eugenie, respectively. Effective as of the same date, Fiorano and Larvotto are fully consolidated within our consolidated group of companies.
Up to December 31, 2015, a majority of our Suezmaxes operating in the spot market participated in an internal Revenue Sharing Agreement, or RSA, together with the four Suezmaxes that we previously owned with Bretta, as well as Suezmaxes owned by third-parties. Under the RSA, each vessel owner was responsible for its own costs, including voyage-related expenses, but shared in the net revenues, after the deduction of voyage-related expenses, retroactively on a semi-annual basis. Calculation of allocations and contributions under the RSA were based on a pool points system and were paid after the deduction of the pool fee to us, as pool manager, from the gross pool income. The RSA was terminated during the course of 2016, with effect as of December 31, 2015. If this RSA had not been in place, our profit for the year ended December 31, 2015 would have been reduced by $0.9 million.Employees - E.Share Ownership - Equity Incentive Plans.”
Loan Agreements of Our Joint Ventures
For a description of our Joint Venture Loan Agreements, please see "Item 5. Operating and Financial Review and Prospects—B. Liquidity and Capital Resources—Joint Venture Credit Facilities (at 50% economic interest)".
Guarantees
For a description of our guarantees, please see "Item 5. Operating and Financial Review and Prospects—B. Liquidity and Capital Resources—Guarantees" and our consolidated financial statements included herein.
Properties
We lease office space in Belgium pursuant to a lease agreement with Reslea N.V., an entity jointly controlled by CMB and Exmar N.V. Under this lease, we paid an annual rent of $175,572 for the year ended December 31, 2016 and an annual rent of $179,079 for the year ended December 31, 2017. This lease expires on August 31, 2021.
We leased office space, through our subsidiary Euronav Ship Management Hellas, in Piraeus, Greece, pursuant to a lease agreement with Nea Dimitra Ktimatiki Kai Emporiki S.A., an entity controlled by Ceres Shipping, which we believe was on arms' length terms. Mr. Livanos, the representative of our former corporate directors, TankLog and Ceres Investments
(Cyprus), and the former Chairman of our Board of Directors, is the Chairman and sole shareholder of Ceres Shipping. Under this lease, we paid an annual rent of $199,873 for the year ended December 31, 2016 and an annual rent of $183,766 for the year ended December 31, 2017. This lease expired on December 31, 2017.
We sublease office space in our new London, United Kingdom office, through our subsidiary Euronav (UK) Agencies Limited, pursuant to sublease agreements, dated September 25, 2014, with GasLog Services UK Limited and Unisea Maritime Limited, both parties related to Peter Livanos, the representative of our former corporate directors, TankLog and Ceres Investments (Cyprus), and the former Chairman of our Board of Directors. In 2016 and 2017, under these subleases, we received $443,643 and $416,995, respectively. These subleases expire on April 27, 2023.
We also sublease office space in our new London, United Kingdom office, through our subsidiary Euronav (UK) Agencies Limited, pursuant to a sublease agreement, dated September 25, 2014, with Tankers (UK) Agencies Limited, a joint venture with International Seaways. In 2016 and 2017, under this sublease, we received $232,882 and $218,594, respectively.INSW. This sublease expires on April 27, 2023.
We lease office space in Hong Kong pursuant to a lease agreement, dated January 1 2017, with Bocimar Hong Kong Limited, an entity controlled by CMB N.V. Under this lease, we paid an annual rent of $38,461 for the year ended December 31, 2017. This lease expires on August 31, 2018.
C.Interests of experts and counsel.
Not applicable.
ITEM 8. FINANCIAL INFORMATION
A.Consolidated Statements and Other Financial Information
See "Item 18. Financial Statements."
Legal Proceedings
On March 8, 2018,We are currently involved in a putative class action lawsuit captioned Fragapane v. Gener8 Maritime, Inc. et al., No. 1:18-cv-02097 (S.D.N.Y.),litigation. Provisions related to legal and arbitration proceedings are recorded in accordance with the accounting policy described in note 1.16 of Euronav Consolidated Financial Statements.
The claim has been submitted on 15 January 2021 by Unicredit Bank in London with the High Court of Justice of England and Wales. The claim relates to an alleged misdelivery of 101,809 metric tons of low sulphur fuel oil that was filedtransported by our Suezmax vessel Sienna. The charterer, Gulf Petrochem FZC, a company of GP Global, instructed the vessel to discharge the cargo at Sohar without presentation of the bill of lading but against a letter of indemnification issued by the charterer as is customary practice in the United States District Courtcrude oil shipping industry. Unicredit bank who had financed the cargo for an amount of USD 26,367,200 and had become the Southern District of New York, purportedly on behalfholder of the public stockholdersbill of Gener8, against Gener8, Gener8’s directors, us andlading, was not repaid in accordance with the Merger Sub. On March 14, 2018, another lawsuit, captioned Mohr v. Gener8 Maritime, Inc., et al, No. 1:18-cv-02276 (S.D.N.Y.), was also filed against Gener8 and its directors. The complaints allege that our registration statement on Form F-4 (Registration No. 333-223039) violates Section 14(a)financing arrangements agreed with Gulf Petrochem FZC. As holder of the Securitiesbill of lading, Unicredit Bank is now claiming that amount of USD 26,367,200 together with interest from Euronav NV. The GP Global group is currently under a restructuring plan and Exchange Actany recourse under the letter of 1934 because it omits and/or misrepresents material information concerning, among other things, the (i) sales process leading up to the Merger, (ii) financial projections usedindemnity issued by Gener8’s financial advisor in its financial analyses and (iii) inputs underlying the financial valuation analyses that were used by Gener8’s financial advisor to support its fairness opinion. The complaints also allege that Gener8’s directors are liable under Section 20(a) of the Exchange Act as controlling persons. The Fragapane complaint further alleges that Gener8’s directors breached their fiduciary duties to Gener8’s stockholders by engaging in a flawed sales process, by agreeing to sell Gener8 for inadequate consideration and by agreeing to improper deal protection terms in the Merger Agreement. The complaints seek, among other things, injunctive relief against the proposed transaction with us as well as other equitable relief, damages and attorneys’ fees and costs.Gulf Petrochem FZC is therefore doubtful. We believe that we have followed well established standard working practices. Based on an external legal advice, management believes that it has strong arguments and that the allegations in the complaintsrisk of an outflow is less than probable and therefore no provision is recognized.
We are without merit, and intend to defend them vigorously.
Neither are wenot involved in any other legal proceedings which we believe may have, or have had, a significant effect on our business, financial position and results of operations or liquidity, nor are we aware of any other proceedings that are pending or threatened which may have a significant effect on our business, financial position, results of operations or liquidity. From time to time, we may be subject to other legal proceedings and claims in the ordinary course of business, principally personal injury and property casualty claims. We expect that these claims would be covered by insurance, subject to customary deductibles. Any such claims, even if lacking merit, could result in the expenditure of managerial resources and materially adversely affect our business, financial condition and results of operations.
Capital Allocation Policy & Dividend Policy
Our Supervisory Board of Directors may from time to time, declare and pay cash dividends in accordance with our Coordinated Articles of Association and applicable Belgian law. The declaration and payment of dividends, if any, will always be subject to the approval of either our Supervisory Board of Directors (in the case of "interim dividends"“interim dividends”) or of the shareholders (in the case of "regular“regular dividends” or "intermediary dividends").
Dividends,Our current dividend policy is the following: we intend to pay a minimum fixed dividend of at least $0.12 in total per share per year provided (a) the Company has in the view of the Supervisory Board, sufficient balance sheet strength and liquidity combined (b) with sufficient earnings visibility from fixed income contracts. In addition, if any,the results per share are positive and exceed the amount of the fixed dividend, that additional income will be paidallocated to either: additional cash dividends, share buy-back, accelerated amortization of debt or the acquisition of vessels which the Supervisory Board considers at that time to be accretive to shareholders’ value.
Additional guidance to the above stated policy was applied to our final results for the year ended on December 31, 2019 and to our quarterly results as from 2020 onwards, as provided by our Supervisory Board by way of a press release dated January 9, 2020, as follows: Each quarter the Company will target to return 80% of net income (including the fixed element of $0.03 per quarter) to shareholders.
•This return to shareholders will primarily be in two instalments: firstthe form of a cash dividend and the Company will always look at stock repurchase as an interim dividend based onalternative if it believes more value can be created for shareholders.
•The Company retains the resultsright to return more than 80% should the circumstances allow it.
As part of its distribution policy the first six months of our fiscal year, then as a balance payment corresponding to the final dividend once the full year results have been audited and presented to our shareholders for approval. The interim dividend payout ratio may typically be more conservative than the yearly payout and will take into account any other form of return of capital made over the same period.
Pursuant toCompany, the dividend calculation will not include capital gains ( reserved for fleet renewal) and deferred tax assets or liabilities but will include capital losses while the policy set out above, ourwill at all times be subject to freight market outlook, company balance sheet and cyclicality along with other factors and regulatory requirements. Supervisory Board of Directorsbelieves that this approach has the flexibility to manage the Company through the cycle, retaining sufficient capital for fleet renewal whilst simultaneously rewarding shareholders.
Our Supervisory Board will continue to assess the declaration and payment of dividends upon consideration of our financial results and earnings, restrictions in our loandebt agreements, market prospects, current capital expenditures, commitments, investment opportunities, and the provisions of Belgian law affecting the payment of dividends to shareholders and other factors.
As adopted by our Board of Directors in August 2017, our current dividend policy, as of the date of this annual report, is to pay a minimum fixed dividend of at least $0.12 per share per year provided that, at the sole discretion of our Board of Directors, (i) the Company has sufficient balance sheet strength and liquidity and (ii) sufficient earnings visibility from fixed income contracts. In addition, if our results per share are positive and exceed the amount of the fixed dividend over the same period, the additional income during such period will be allocated to either additional cash dividends, the purchase by us of our own shares, accelerated amortization of debt or the acquisition of vessels which the Board of Directors considers, at that time, to be accretive to shareholders’ value. As part of this distribution policy we will continue to include exceptional capital losses when assessing additional dividends but also continue to exclude exceptional capital gains when assessing additional dividend payments. In addition, as a part of this dividend policy, we will not include non-cash items affecting the results such as deferred tax assets or deferred tax liabilities.
We may stop paying dividends at any time and cannot assure you that we will pay any dividends in the future or of the amount of such dividends. For instance, we did not declare or pay any dividends from 2010 until May 2015. Since May 2015, we have declared and paid six dividends to shareholders in an aggregate amount of $2.52 per share.
The current dividend payment policy as adopted by the Board is the following: the company intends to pay a minimum fixed dividend of at least USD 0.12 in total per share per year provided (a) the company has in the view of the board, sufficient balance sheet strength and liquidity combined (b) with sufficient earnings visibility from fixed income contracts. In addition, if the results per share are positive and exceed the amount of the fixed dividend, that additional income* will be allocated to either: additional cash dividends, share buy-back, accelerated amortization of debt or the acquisition of vessels which the board considers at that time to be accretive to shareholders’ value.
*Treatment of capital losses and capital gains
As part of its distribution policy Euronav will continue to include exceptional capital losses when assessing additional dividends but also continue to exclude exceptional capital gains when assessing additional dividend payments.
*Treatment of Deferred Tax Assets (DTA) and Deferred Tax Liabilities (DTL)
As part of its distribution policy Euronav will not include non-cash items affecting the results such as DTA or DTL.2014.
In general, under the terms of our debt agreements, we are not permitted to pay dividends if there is or will be as a result of the dividend a default or a breach of a loan covenant. Our credit facilities also contain restrictions and undertakings which may limit our and our subsidiaries' ability to declare and pay dividends (for instance, with respect to each of our joint ventures, no dividend may be distributed before its loan agreement, as applicable, is repaid in full). Please see "Item“Item 5. Operating and Financial Review and Prospects"Prospects” for more information relating to restrictions on our ability to pay dividends under the terms of the agreements governing our indebtedness. Belgian law generally prohibits the payment of dividends unless net assets on the closing date of the last financial year do not fall beneath the amount of the registered capital and, before the dividend is paid out, 5% of the net profit is allocated to the legal reserve until this legal reserve amounts to 10% of the share capital. No distributions may occur if, as a result of such distribution, our net assets would fall below the sum of (i) the amount of our registered capital, (ii) the amount of such aforementioned legal reserves, and (iii) other reserves which may be required by our Coordinated Articles of Association or by law, such as the reserves not available for distribution in the event we hold treasury shares. We may not have sufficient surplus in the future to pay dividends and our subsidiaries may not have sufficient funds or surplus to make distributions to us. We can give no assurance that dividends will be paid at a level anticipated by stockholders or at all. In addition, the corporate law of jurisdictions in which our subsidiaries are organized may impose restrictions on the payment or source of dividends under certain circumstances.
For a discussion of the material tax consequences regarding the receipt of dividends we may declare, please see "Item 10. Additional Information—E. Taxation."
B.Significant Changes.
Please see Note 29 - Subsequent Events to our Audited Consolidated Financial Statements included herein.
ITEM 9. OFFER AND THE LISTING
A.Offer and Listing Details.
Our share capital consists of ordinary shares issued without par value. Under Belgian law, shares without par value are deemed to have a "nominal" value equal to the total amount of share capital divided by the number of shares. As of March19, 2018,April 1, 2021, our issued (and fully paid up) share capital was $173,046,122.14,$239,147,506.82 which is represented by 159,208,949220,024,713 ordinary shares with no par value. The fractional value of our ordinary shares is $1.086912 per share.
Our ordinary shares have traded on Euronext Brussels, since December 1, 2004 and on the NYSE since January 23, 2015, under the symbol "EURN." We maintain the Belgian Register and, for the purposes of trading our shares on the NYSE, the U.S. Register.
All shares on Euronext Brussels trade in euros, and all shares on the NYSE trade in U.S. dollars. The following tables set forth the high and low closing prices for our ordinary shares for the periods indicated, as reported by the NYSE and Euronext Brussels, respectively.
|
| | | | | | | | | | | | | | |
| | | NYSE | | | Euronext Brussels |
| | | High
(US$) |
| | | Low
(US$) |
| | | High
(EUR) |
| | Low
(EUR) |
|
| For the Fiscal Year Ended: | | | | | | | | | | |
| December 31, 2013 | | — |
| | | — |
| | | 8 |
| | 3.05 |
|
| December 31, 2014 | | — |
| | | — |
| | | 10.50 |
| | 7.35 |
|
| December 31, 2015 | | 16.32 |
| * | | 10.95 |
| * | | 15.10 |
| | 9.60 |
|
| December 31, 2016 | | 13.44 |
| | | 6.70 |
| | | 12.44 |
| | 6.40 |
|
| December 31, 2017 | | 9.25 |
| | | 6.90 |
| | | 8.01 |
| | 6.05 |
|
|
| | | | | | | | | | | | | | |
| | | NYSE | | | Euronext Brussels |
| | | High (US$) |
| | | Low (US$) |
| | | High (EUR) |
| | Low (EUR) |
|
| For the Quarter Ended: | | | | | | | | | | |
| June 30, 2016 | | 11.37 |
| | | 8.79 |
| | | 10.07 |
| | 7.95 |
|
| September 30, 2016 | | 9.44 |
| | | 7.43 |
| | | 8.46 |
| | 6.81 |
|
| December 31, 2016 | | 8.26 |
| | | 6.70 |
| | | 7.72 |
| | 6.40 |
|
| March 31, 2017 | | 8.55 |
| | | 7.65 |
| | | 8.01 |
| | 7.18 |
|
| June 30, 2017 | | 8.25 |
| | | 7.20 |
| | | 7.65 |
| | 6.49 |
|
| September 30, 2017 | | 8.10 |
| | | 6.90 |
| | | 6.98 |
| | 6.05 |
|
| December 31, 2017 | | 9.25 |
| | | 8.00 |
| | | 7.73 |
| | 6.84 |
|
| March 31, 2018 | | 9.55 |
| | | 7.65 |
| | | 7.96 |
| | 6.33 |
|
|
| | | | | | | | | | | | |
| | | NYSE | | Euronext Brussels |
| | | High (US$) |
| | Low (US$) |
| | High (EUR) |
| | Low (EUR) |
|
| For the Month: | | | | | | | | |
| October 2017 | | 8.60 |
| | 8.00 |
| | 7.29 |
| | 6.84 |
|
| November 2017 | | 8.90 |
| | 8.20 |
| | 7.51 |
| | 7.07 |
|
| December 2017 | | 9.25 |
| | 8.10 |
| | 7.73 |
| | 6.84 |
|
| January 2018 | | 9.55 |
| | 8.80 |
| | 7.96 |
| | 6.98 |
|
| February 2018 | | 8.45 |
| | 7.65 |
| | 6.86 |
| | 6.33 |
|
| March 2018 | | 8.75 |
| | 8.10 |
| | 7.05 |
| | 6.51 |
|
| April 2018 (through and including April 16, 2018) | | 8.80 |
| | 8.05 |
| | 7.06 |
| | 6.67 |
|
* Period for the NYSE begins on January 23, 2015.
B.Plan of Distribution
Not applicable
C.Markets.
Our ordinary shares trade on the NYSE and Euronext Brussels under the symbol "EURN."
For a discussion of our ordinary shares which are listed and eligible for trading on the NYSE and Euronext Brussels, please see "Item 10. Additional Information — B. Memorandum and Coordinated Articles of Association — Share Register."
D.Selling Shareholders
Not applicable.
E.Dilution
Not applicable.
F.Expenses of the Issue
Not applicable.
ITEM 10. ADDITIONAL INFORMATION
A.Share capital.
Not applicable.
B.Memorandum and Coordinated Articles of Association.
We are a public limited liability company incorporated in the form of a naamloze vennootschap / société anonyme under Belgian law (Register of Legal Entities number 0860.402.767 (Antwerpen)).
The following is a description of the material terms of our current Coordinated Articles of Association currently in effect.(amended as of February 20, 2020). Because the following is a summary, it does not contain all information that you may find useful. For more complete information, you should read our Coordinated Articles of Association which have beenare filed as Exhibit 1.1 to ourthis annual report on Form 20-F filed with the SEC on April 5, 2016, which is incorporated by reference herein.report.
Purpose
Our objectives are set forth in Section I, Article 23 of our Coordinated Articles of Association. Our purpose, as stated therein, is to engage in operations related to maritime transport and shipowning, particularly the chartering in and out, the acquisition and sale of ships, and the opening and operation of regular shipping lines, but is not restricted to these activities.
Issued and Authorized Capitalization
As of March 19, 2018, our issued (and fully paid up) share capital was $173,046,122.14 which is represented by 159,208,949 ordinary shares with no par value. The shareholders' meeting of May 13, 2015 has authorized the Board of Directors to increase the share capital one or several times by a total maximum amount of $150,000,000 for a period of five years as of June 19, 2015. Taking into account the fractional value of $1.086912 per share, the authorized capital of $150,000,000 allows the Board to issue additionally up to 138,005,652 ordinary shares without future shareholder approval. As of March 19, 2018 and taking into account that no ordinary shares have been issued since the shareholders' meeting of May 13, 2015, our Board of Directors is authorized to issue up to an additional 138,005,652 ordinary shares without future shareholder approval.
Share History
In January 2015, we completed our underwritten initial public offering in the United States of 18,699,000 ordinary shares at $12.25 per share, for gross proceeds of $229.1 million.
In January 2015, we redeemed the remaining 250 outstanding convertible notes due 2015, with a face value of $100,000, at par. We held 18 of these notes. As a result, no more convertible notes due 2015 are outstanding.
On February 6, 2015, we issued 9,459,283 ordinary shares upon the conversion of the remaining 30 outstanding perpetual convertible preferred equity securities. As a result, no more perpetual convertible preferred equity securities are outstanding.
In March 2015, we completed our offer to exchange unregistered ordinary shares that were previously issued in Belgium (other than ordinary shares owned by our affiliates) for ordinary shares that were registered under the Securities Act of 1933, as amended, or the U.S. Exchange Offer, in which an aggregate of 42,919,647 ordinary shares were validly tendered and exchanged.
In January 2016, we repurchased 500,000 of our ordinary shares at the average price of $10.3705 per share. In June 2016, we repurchased 192,415 of our ordinary shares at the average price of $8.8588.
Ordinary Shares
Each outstanding ordinary share entitles the holder to one vote on all matters submitted to a vote of shareholders. Each share represents an identical fraction of the share capital and is either in registered or dematerialized form.
Share Register
We maintain a share registerOur Belgian Shares are reflected in Belgium, the Belgian Register, that is maintained by Euroclear Belgium, on which ourBelgium. The Belgian Shares have ISIN BE0003816338. Only these shares, which are reflected.reflected in the Belgian Register, may be traded on Euronext Brussels.
Our U.S. Shares are reflected in our U.S. Register that is maintained by Computershare.
The U.S. Shares have CUSIP B38564 108. Only these shares, which are reflected in the U.S. Register, may be traded on the NYSE.
The Belgian Shares have ISIN BE0003816338. Only these shares, which are reflected in the Belgian Register, may be traded on Euronext Brussels.
For Belgian Shares, including shares that were either acquired on Euronext Brussels or prior to our initial public offering, to be traded on the NYSE and for U.S. Shares to be traded on Euronext Brussels, shareholders must reposition their shares to the appropriate component of our share register (the U.S. Register for listing and trading on the NYSE and the Belgian Register for listing and trading on Euronext Belgium). As part of the repositioning procedure, the shares to be repositioned would be debited from the Belgian Register or the U.S. Register, as applicable, and cancelledcanceled from the holder's securities account, and simultaneously credited to the relevant register (the Belgian Register for shares to be eligible for listing and trading on Euronext Brussels and the U.S. Register for shares to be eligible for listing and trading on the NYSE) and deposited in the holder's securities account. The repositioning procedure is normally completed within three trading days, but may take longer and the Company cannot guarantee the timing. The Company may suspend the repositioning of shares for periods of time, which we refer to as "freeze periods" for certain corporate events, including the payment of dividends or shareholder meetings. In such cases, the Company plans to inform its shareholders about such freeze periods on its website.
Please see the Company's website www.euronav.com for instructions on how to reposition your shares to be eligible for trading on either the NYSE or Euronext Brussels. The information contained on our website does not form a part of this annual report.
Dividend Rights
For a summary of our dividend policy and legal basis for dividends under Belgian law, see "Item 8: Financial Information – Dividend Policy.Policy and guidance."
Liquidation Rights
In the event of the dissolution and liquidation of the Company, the assets remaining after payment of all debts, liquidation expenses and taxes shall be distributed to the holders of our ordinary shares, each receiving a sum proportional to the number of our shares held by them, subject to prior liquidation rights of any preferred stock that may be outstanding.
Perpetual Convertible Preferred Equity IssuesDirectors
Prior to February 20, 2020, before implementation of the CCA, the Board of Directors was the ultimate decision-making body of the Company, with the exception of the matters reserved to the Shareholders’ Meeting as provided by law or the Articles of Association.
On January 13, 2014, we issued 60 perpetual convertible preferred equity securities for net proceedsFebruary 20, 2020 the extraordinary shareholders meeting implemented the CCA and adopted new Articles of $150.0 million, which were convertible into ordinary sharesAssociation including a two-tier governance model, comprising a Supervisory Board and a Management Board. The powers of us, at the holders' option. The perpetual convertible preferred equity securities bore interest at 6% , which was payable annuallySupervisory Board are those outlined in arrears in cash or in shares at our option. On February 6, 2014, we issued 9,459,286 ordinary shares uponarticle 7:109 of the conversion of 30 perpetual convertible preferred equity securities, representing a face value of $75.0 million, and on February 6, 2015, we issued 9,459,283 ordinary shares upon our exerciseCCA. A copy of our rightcurrent Coordinated Articles of Association can be consulted at Exhibit 1.1. to forceour annual report on Form 20-F filed with the conversion of the remaining 30 perpetual convertible preferred equity securities, representing a face value of $75.0 million. As a result, no more perpetual convertible preferred equity securities are outstanding.
DirectorsSEC on April 15, 2021.
Our Coordinated Articles of Association provide that our Supervisory Board of Directors shall consist of at least five and maximum ten members. Our Supervisory Board of Directors currently consists of sevensix members. The Coordinated Articles of Association provide that the members of the Supervisory Board of Directors remain in office for a period not exceeding 4 years and are eligible for re-election. The term of a directormember of the Supervisory Board comes to an end immediately after the annual shareholders' meeting of the last year of his term. DirectorsMembers of the Supervisory Board can be dismissed at any time by the vote of a majority of our shareholders. Each year, there may be one or more directors who have reached the end of their current term of office and may be reappointed.
The Board of Directors is our ultimate decision-making body, with the exception of the matters reserved for the general shareholders' meeting as provided by the Belgian Companies Code or by our Articles of Association.
Belgian law does not regulate specifically the ability of directors to borrow money from the Company. Our Corporate Governance Charter provides that as a matter of principle, no loans or advances will be granted to any director (except for routine advances for business-related expenses in accordance with our rules for reimbursement of expense)expenses).
Article 5237:115 of the Belgian Code of Companies and Associations provides that if one of our directorsSupervisory Board members directly or indirectly has a personal financial interest that conflicts with a decision or transaction that falls within the powersauthority of ourthe Supervisory Board, the director concerned mustconflicted member shall inform ourthe other directorsmembers of such conflict before ourthe Supervisory Board makes any decisionhas decided on such transaction.the relevant matter. The statutory auditor must also be notified. The directorconflicted member’s statement and explanation as to the nature of the conflict of interest shall be included in the meeting minutes enacting the decision on the relevant matter and shall be disclosed in accordance with in article 7:115 of the Belgian Code of Companies and Associations. The Supervisory Board shall deliberate and decide on the relevant matter without participation of the conflicted member(s). The Supervisory Board may not participate indelegate this decision. If all members of the deliberation or vote onSupervisory Board have such conflict of interest, the conflictingrelevant matter is referred to by the Supervisory Board to a general meeting of shareholders. If the General Meeting approves the relevant decision or transaction. An excerpt fromtransaction is approved at such general meeting, the minutes of the meeting of ourSupervisory Board that sets forth the financial impact of the matter on us and justifies the decision of our Board must be published in our annual report. The statutory auditor's reportis authorized to the annual accounts must contain a description of the financial impact on us of each of the decisions of our Board where director conflicts arise.execute same.
Shareholder Meetings
The annual general shareholders' meeting is generally held annually on the secondthird Thursday of May at 1110:30 a.m. (Central European Time). If this day is a legal holiday, the meeting is held on the preceding business day.
The Supervisory Board of Directors or the statutory auditor (or, as the case may be, the liquidators) can convene a special or extraordinary general shareholders' meeting at any time if the interests of the Company so require. Such general meetings must also be convened whenever requested by the shareholders who together represent a fifthtenth of our share capital within three weeks of their request, provided that the reason of convening a special or extraordinary general shareholders' meeting is given.
A shareholder only has the right to be admitted to and to vote at the general shareholders' meeting on the basis of the registration of the shares on the fourteenth calendar day at 12 p.m. (Belgian time) preceding the date of the meeting, the day of the meeting not included, (theor such fourteenth calendar day the "Record Date"), either by registration in the Company's register of registered shares, either by their registration in the accounts of an authorized custody account keeper or clearing institution, regardless of the number of shares owned by the shareholder on the day of the general shareholders' meeting.
The shareholder must notify the Company or a designated person of its intention to take part in the general shareholders' meeting at the sixth calendar day preceding the date of the meeting, the day of the meeting not included, in the way mentioned in the convening notice.
The financial intermediary of the authorized custody account keeper or clearing institution delivers a certificate to the shareholders of dematerialized shares which are tradable on Euronext Brussels stating the number of dematerialized shares which are registered in the name of the shareholder on its accounts at the Record Date and with which the shareholder intends to take part in the general shareholders' meeting.
A shareholder of shares which are tradable on the New York Stock Exchange only has the right to be admitted to and vote at thea general meeting of shareholders if such shareholder complies with the conditions and formalities set out in the convening notice, as decided upon by the board of directorsSupervisory Board in compliance with all applicable legal provisions.
The convening notice for each general shareholders' meeting shall be disclosed to our shareholders in compliance with all applicable legal terms and provisions, including on our website www.euronav.com
In general, there is no quorum requirement for the general shareholders' meeting and decisions are taken with a simple majority of the votes, except as provided by law on certain matters.
Preferential Subscription Rights
In the event of a share capital increase for cash by way of the issue of new shares, or in the event of an issue of convertible bonds or warrants, our existing shareholders have a preferential right to subscribe, pro rata, to the new shares, convertible bonds or warrants.
In accordance with the provisions of the Belgian Code of Companies and Associations and our Coordinated Articles of Association, the Company, when issuing shares, has the authority to limit or cancel the preferential subscription right of the shareholders in the interest of the Company in respect of such issuance. This limitation or cancellation can be decided upon in favor of one or more particular persons subscribing to that issuance.
When cancellingcanceling the preferential right of the shareholders, priority may be given to the existing shareholders for the allocation of the newly issued shares.
Disclosure of Major Shareholdings
In accordance with a May 2, 2007 Belgian law relating to disclosure of major holdings in issuers whose shares are admitted to trading on a regulated market and containing miscellaneous provisions requiring investors in certain publicly-traded corporations whose investments reach certain thresholds to notify the Company and the Belgian Financial Services and Markets Authority, or the FSMA, of such change as soon as possible and in any event within four trading days. The minimum disclosure threshold is 5% of the Company's issued voting share capital. Further details in this respect can be found in article 14 of our Articles of Association and on the website of the FSMA: http:https://www.fsma.be/en/Supervision/fm/gv/ah/wetteksten/wetgeving.aspx.shareholding-structure-0. The information contained on this website does not form a part of this annual report.
Purchase and Sales of Our Own Shares
We may only acquire our own ordinary shares pursuant to a decision by our shareholders' meeting taken underArticle 13 of the conditionsArticles of quorum and majority provided for inAssociation contains the Belgian Companies Code.
The extraordinary shareholders' meeting of May 13, 2015 resolved to authorize the Board of Directors ofprinciple that the Company and its direct and indirect subsidiaries may acquire and sell the Company’s own shares under the conditions laid down by law. With respect to the acquisition of the Company’s own shares, a prior resolution of the General Meeting is required to authorize the Company to acquire in accordance with the conditions of the law, with available assets in the sense of article 617 of the Belgian Companies Code,its own shares. Such an authorization was granted by at a special general meeting on May 20, 2020 and remains valid for a period of five years as from May 13, 2015,the publication in the Annexes to the Belgian Official Gazette of the decision taken by such general meeting.
Pursuant to this authorization, the Company may acquire a maximum of twenty per centten percent (10%) of the existing ordinary shares of the Company where all ordinary shares already purchased by the Company and its direct subsidiaries need to be taken into account and at a price per share equalnot exceeding the maximum price allowed under applicable law and not to the average of the last five closing prices of the Company's ordinary shares at Euronext Brussels before the acquisition, increased with a maximum of twenty percent (20%) or decreased with a maximum of twenty percent (20%) of the said average.be less than EUR 0.01.
Anti-Takeover Effect of Certain Provisions of Our Articles of Association
Our Articles of Association contain provisions which may have anti-takeover effects. These provisions are intended to avoid costly takeover battles, lessen our vulnerability to a hostile change of control and enhance the ability of our Supervisory Board of Directors to maximize shareholder value in connection with any unsolicited offer to acquire us. However, these anti-takeover provisions could also discourage, delay or prevent (1) the merger or acquisition of us by means of a tender offer, a proxy contest or otherwise that a shareholder may consider in its best interest and (2) the removal of incumbent officers and directors.
For example, a shareholder's voting rights can be suspended with respect to ordinary shares that give such shareholder the right to voting rights above 5% (or a multiple of 5%) of the total number of voting rights attached to our ordinary shares on the date of the relevant general shareholder's meeting, unless we and the Belgian Financial Services and Markets Authority have been informed at least 20 days prior to the date of the relevant general shareholder's meeting in which the holder wishes to vote. In addition, our Board of Directors is authorized in our Articles of Association to (i) increase the Company's capital within the framework of the authorized capital with a maximum amount of $150,000,000 and (ii) buy back and sell the Company's own shares. These authorizations may be used by the Board of Directors in the event of a hostile takeover bid.
Limitations on the Right to Own Securities
Neither Belgian law nor our articles of association imposes any general limitation on the right of non-residents or foreign persons to hold our ordinary shares or exercise voting rights on our ordinary shares other than those limitations that would generally apply to all shareholders.
Transfer agent
The registrar and transfer agent for our ordinary shares in the United States is Computershare Trust Company N.A. Our Belgian Register is maintained by Euroclear Belgium.
C.Material contracts.
We refer you to "Item 4. Information on the Company—B. Business Overview," "Item 5. Operating and Financial Review and Prospects—B. Liquidity and Capital Resources—Credit Facilities," Item 6. Directors, Senior Management and Employees — E. Share Ownership— Equity Incentive Plan," and "Item 7. Major Shareholders and Related Party Transactions—B. Related Party Transactions" for a discussion of our material agreements that we have not entered into outside the ordinary course of our business during the two-year period immediately preceding the date of this annual report.
Other than as set forth above, there were noany material contracts, other than contracts entered into in the ordinary course of business, to which we were a party during the two year period immediately preceding the date of this annual report.attached as exhibits hereto or otherwise described herein.
D.Exchange controls.
There are no Belgian exchange control regulations that would affect the import or export of capital, including the availability of cash and cash equivalents for use by the company's group or the remittance of dividends, interest or other payments to nonresident holders of the Company's securities.
See "Item 10. Additional information—E. Taxation" for a discussion of the tax treatment of dividends.
E.Taxation.
United States Federal Income Tax Considerations
In the opinion of Seward & Kissel LLP, our United States counsel, the following are the material United States federal income tax consequences to us and our U.S. Holders and Non-U.S. Holders, each as defined below, of our activities and the ownership of our ordinary shares. This discussion does not purport to deal with the tax consequences of owning ordinary shares to all categories of investors, some of which, such as banks, insurance companies, real estate investment trusts, regulated investment companies, grantor trusts, tax-exempt organizations, dealers in securities or currencies, traders in securities that elect the mark-to-market method of accounting for their securities, investors whose functional currency is not the United States dollar, investors that are or own our ordinary shares through partnerships or other pass-through entitles, investors that own, actually or under applicable constructive ownership rules, 10% or more of our ordinary shares, persons that will hold the ordinary shares as part of a hedging transaction, "straddle"“straddle” or "conversion“conversion transaction,"” persons who are deemed to sell the ordinary shares under constructive sale rules, persons required to recognize income for U.S. federal income tax purposes no later than when such income is reported on an “applicable financial statement,” persons subject to the “base erosion and anti-avoidance” tax, and persons who are liable for the alternative minimum tax may be subject to special rules. The following discussion of United States federal income tax matters is based on the United States Internal Revenue Code of 1986, as amended, or the Code, judicial decisions, administrative pronouncements, and existing and proposed regulations issued by the United States Department of the Treasury, or the Treasury Regulations, all of which are subject to change, possibly with retroactive effect. This discussion deals only with holders who purchase ordinary and hold the ordinary shares as a capital asset. The discussion below is based, in part, on the description of our business as described herein and assumes that we conduct our business as described herein. Unless otherwise noted, references in the following discussion to the "Company," "we"“Company,” “we” and "us"“us” are to Euronav NV and its subsidiaries on a consolidated basis.
United States Federal Income Taxation of the Company
Taxation of Operating Income: In General
Unless exempt from U.S. federal income taxation under the rules discussed below, a foreign corporation is subject to U.S. federal income taxation in respect of any income that is derived from the use of vessels, from the hiring or leasing of vessels for use on a time, voyage or bareboat charter basis, from the participation in a pool, partnership, strategic alliance, joint operating agreement, code sharing arrangements or other joint venture it directly or indirectly owns or participates in that generates such income, or from the performance of services directly related to those uses, which we refer to as "shipping“shipping income,"” to the extent that the shipping income is derived from sources within the United States. For these purposes, 50% of shipping income that is attributable to transportation that begins or ends, but that does not both begin and end, in the United States constitutes income from sources within the United States, which we refer to as "U.S.-source“U.S.-source shipping income."”
Shipping income attributable to transportation that both begins and ends in the United States is considered to be 100% from sources within the United States. We are not permitted by law to engage in transportation that produces income which is considered to be 100% from sources within the United States.
Shipping income attributable to transportation exclusively between non-U.S. ports will be considered to be 100% derived from sources outside the United States. Shipping income derived from sources outside the United States will not be subject to any U.S. federal income tax.
In the absence of exemption from tax under Section 883 of the Code or an applicable U.S. income tax treaty, our gross U.S.-source shipping income would be subject to a 4% tax imposed without allowance for deductions as described below.
Exemption of Operating Income from U.S. Federal Income Taxation
Under the U.S.-Belgium income tax treaty, (the "Belgian Treaty"),or the Belgian Treaty, we will be exempt from U.S. federal income tax on our U.S.-source shipping income if (1) we are resident in Belgium for Belgian income tax purposes and (2) we satisfy one of the tests under the Limitation on Benefits Provision of the Belgian Treaty. We believe that we satisfy the requirements for exemption under the Belgian Treaty for our 20172020 and possibly for our future taxable years. Alternatively, we may qualify for exemption under Section 883, as discussed below.
Under Section 883 of the Code and the regulations there under, we will be exempt from U.S. federal income tax on our U.S.-source shipping income if:
(1) we are organized in a foreign country, or our country of organization, that grants an "equivalent exemption"“equivalent exemption” to corporations organized in the United States; and
(2) either
(A) more than 50% of the value of our stock is owned, directly or indirectly, by individuals who are "residents"“residents” of our country of organization or of another foreign country that grants an "equivalent exemption"“equivalent exemption” to corporations organized in the United States, which we refer to as the "50%“50% Ownership Test,"” or
(B) our stock is "primarily“primarily and regularly traded on an established securities market"market” in our country of organization, in another country that grants an "equivalent exemption"“equivalent exemption” to United States corporations, or in the United States, which we refer to as the "Publicly-Traded Test"“Publicly-Traded Test”.
Each of the jurisdictions where our ship-owning subsidiaries are incorporated grant an "equivalent exemption"“equivalent exemption” to U.S. corporations. Therefore, we will be exempt from U.S. federal income tax with respect to our U.S.-source shipping income if either the 50% Ownership Test or the Publicly-Traded Test is met.
We do not currently anticipate circumstances under which we would be able to satisfy the 50% Ownership Test given the widely held nature of our ordinary shares. Our ability to satisfy the Publicly-Traded Test is discussed below.
Treasury Regulations provide, in pertinent part, that stock of a foreign corporation will be considered to be “primarily traded” on an established securities market if the number of shares of each class of stock that are traded during any taxable year on all established securities markets in that country exceeds the number of shares in each such class that are traded during that year on established securities markets in any other single country. Our ordinary shares are “primarily traded” on Euronext for this purpose even though the ordinary shares are also listed and traded on the NYSE.
Under the Treasury Regulations, our ordinary shares will be considered to be "regularly traded"“regularly traded” on an established securities market if one or more classes of our stock representing more than 50% of our outstanding shares, by total combined voting power of all classes of stock entitled to vote and total value, is listed on the market which we refer to as the listing threshold. Our ordinary shares are listed on the NYSE and therefore we satisfy the listing requirement.
It is further required that with respect to each class of stock relied upon to meet the listing threshold, (i) such class of stock be traded on the market, other than in minimal quantities, on at least 60 days during the taxable year or one-sixth of the days in a short taxable year, which we refer to as the "trading“trading frequency test"test”; and (ii) the aggregate number of shares of such class of stock traded on such market is at least 10% of the average number of shares of such class of stock outstanding during such year or as appropriately adjusted in the case of a short taxable year, which we refer to as the "trading“trading volume test"test”. We believe we satisfied the trading frequency and trading volume tests for the 20172020 taxable year. Even if this was not the case, the Treasury Regulations provide that the trading frequency and trading volume tests will be deemed satisfied if, as is the case with our ordinary shares, such class of stock is traded on an established securities market in the United States and such stock is regularly quoted by dealers making a market in such stock.
Notwithstanding the foregoing, the Treasury Regulations provide, in pertinent part, that a class of our stock will not be considered to be "regularly traded"“regularly traded” on an established securities market for any taxable year if 50% or more of the vote and value of the outstanding shares of such class of stock are owned, actually or constructively under specified stock attribution rules, on more than half the days during the taxable year by persons who each own 5% or more of the vote and value of the outstanding shares of such class of stock, which we refer to as the "5“5 Percent Override Rule."”
For purposes of being able to determine the persons who own 5% or more of our stock, or "5%“5% Shareholders,"” the Treasury Regulations permit us to rely on those persons that are identified on Schedule 13G and Schedule 13D filings with the SEC, as having a 5% or more beneficial interest in our ordinary shares. The Treasury Regulations further provide that an investment company identified on a SEC Schedule 13G or Schedule 13D filing which is registered under the Investment Company Act of 1940, as amended, will not be treated as a 5% shareholder for such purposes.
In the event the 5 Percent Override Rule is triggered, the Treasury Regulations provide that the 5 Percent Override Rule will not apply if we can establish that among the closely-held group of 5% Shareholders, there are sufficient 5% Shareholders that are considered to be qualified shareholders for purposes of Section 883 of the Code to preclude non-qualified 5% Shareholders in the closely-held group from owning 50% or more of each class of our stock for more than half the number of days during such year.
We believe that we and each of our subsidiaries qualify for exemption under Section 883 of the Code for our 20172020 taxable year. We also expect that we and each of our subsidiaries will qualify for this exemption for our subsequent taxable years. However, there can be no assurance in this regard. For example, if our 5% Stockholders own 50% or more of our ordinary shares, we would be subject to the 5% Override Rule unless we can establish that among the closely-held group of 5% Stockholders, there are sufficient 5% Stockholders that are qualified stockholders for purposes of Section 883 of the Code to preclude non-qualified 5% Stockholders in the closely-held group from owning 50% or more of our ordinary shares for more than half the number of days during the taxable year. In order to establish this, sufficient 5% Stockholders that are qualified stockholders would have to comply with certain documentation and certification requirements designed to substantiate their identity as qualified stockholders. These requirements are onerous and there is no assurance that we will be able to satisfy them.
Taxation in the Absence of Exemption under Section 883 of the Code
To the extent the benefits of Section 883 of the Code are unavailable, our U.S.-source shipping income, to the extent not considered to be "effectively connected"“effectively connected” with the conduct of a U.S. trade or business, as described below, would be subject to a 4% tax imposed by Section 887 of the Code on a gross basis, without the benefit of deductions, which we refer to as the "4%“4% gross basis tax regime"regime”. Since under the sourcing rules described above, no more than 50% of our shipping income would be treated as being derived from U.S. sources, the maximum effective rate of U.S. federal income tax on our shipping income would never exceed 2% under the 4% gross basis tax regime.
To the extent the benefits of the exemption under Section 883 of the Code are unavailable and our U.S.-source shipping income is considered to be "effectively connected"“effectively connected” with the conduct of a U.S. trade or business, as described below, any such "effectively connected"“effectively connected” U.S.-source shipping income, net of applicable deductions, would be subject to the U.S. federal corporate income tax imposed at ratesa rate of up to 35% with respect to the 2017 taxable year. The U.S. federal corporate income tax rate will be 21% for tax years beginning after December 31, 2017.In. In addition, we may be subject to the 30% "branch profits"“branch profits” tax on earnings effectively connected with the conduct of such U.S. trade or business, as determined after allowance for certain adjustments, and on certain interest paid or deemed paid attributable to the conduct of such U.S. trade or business.
Our U.S.-source shipping income would be considered "effectively connected"“effectively connected” with the conduct of a U.S. trade or business only if:
•we have, or are considered to have, a fixed place of business in the United States involved in the earning of shipping income; and
•substantially all of our U.S.-source shipping income is attributable to regularly scheduled transportation, such as the operation of a vessel that follows a published schedule with repeated sailings at regular intervals between the same points for voyages that begin or end in the United States.
We do not currently have, nor intend to have or permit circumstances that would result in having, any vessel operating to the United States on a regularly scheduled basis. Based on the foregoing and on the expected mode of our shipping operations and other activities, we believe that none of our U.S.-source shipping income will be "effectively connected"“effectively connected” with the conduct of a U.S. trade or business.
U.S. Taxation of Gain on Sale of Vessels
Regardless of whether we qualify for exemption under Section 883 of the Code, we will not be subject to U.S. federal income taxation with respect to gain realized on a sale of a vessel, provided the sale is considered to occur outside of the United States under U.S. federal income tax principles. In general, a sale of a vessel will be considered to occur outside of the United States for this purpose if title to the vessel, and risk of loss with respect to the vessel, pass to the buyer outside of the United States. It is expected that any sale of a vessel by us will be considered to occur outside of the United States.
United States Federal Income Taxation of U.S. Holders
As used herein, the term "U.S. Holder"“U.S. Holder” means a beneficial owner of ordinary shares that is a United States citizen or resident, United States corporation or other United States entity taxable as a corporation, an estate the income of which is subject to United States federal income taxation regardless of its source, or a trust if (i) a court within the United States is able to exercise primary supervision over the administration of the trust and one or more United States persons have the authority to control all substantial decisions of the trust or (ii) the trust has a valid election in effect to be treated as a United States person for United States federal income tax purposes.
If a partnership holds our ordinary shares, the tax treatment of a partner will generally depend upon the status of the partner and upon the activities of the partnership. If you are a partner in a partnership holding our ordinary shares, you are encouraged to consult your tax advisor.
Distributions
Subject to the discussion of passive foreign investment companies below, any distributions made by us with respect to our ordinary shares to a U.S. Holder will generally constitute dividends, which may be taxable as ordinary income or "qualified“qualified dividend income"income” as described in more detail below, to the extent of our current and accumulated earnings and profits, as determined under United States federal income tax principles. Distributions in excess of our earnings and profits will be treated first as a nontaxable return of capital to the extent of the U.S. Holder'sHolder’s tax basis in the holder'sholder’s ordinary shares on a dollar-for-dollar basis and thereafter as capital gain. Because we are not a United States corporation, U.S. Holders that are corporations will generally not be entitled to claim a dividends received deduction with respect to any distributions they receive from us. Dividends paid with respect to our ordinary shares will generally be treated as "passive“passive category income"income” or, in the case of certain types of U.S. Holders, "general“general category income"income” for purposes of computing allowable foreign tax credits for United States foreign tax credit purposes.
Dividends paid on our ordinary shares to a U.S. Holder who is an individual, trust or estate (a "U.S.“U.S. Non-Corporate Holder"Holder”) will generally be treated as "qualified“qualified dividend income"income” that is taxable to such U.S. Non-Corporate Holders at preferential tax rates provided that (1) either we qualify for the benefits of the Belgian Treaty (which we expect to be the case) or the ordinary shares are readily tradable on an established securities market in the United States (such as the NYSE, on which our ordinary shares are listed); (2) we are not a passive foreign investment company for the taxable year during which the dividend is paid or the immediately preceding taxable year (as discussed below); (3) the U.S. Non-Corporate Holder has owned the ordinary shares for more than 60 days in the 121-day period beginning 60 days before the date on which the ordinary shares become ex-dividend (and has not entered into certain risk limiting transactions with respect to such ordinary share); and (4) the U.S. Non-Corporate Holder is not under an obligation (whether pursuant to a short sale or otherwise) to make related payments with respect to positions in substantially similar related property. There is no assurance that any dividends paid on our ordinary shares will be eligible for these preferential tax rates in the hands of a U.S. Non-Corporate Holder.
As discussed below, our dividends may be subject to Belgian withholding taxes. A U.S. Holder may elect to either deduct his share of any foreign taxes paid with respect to our dividends in computing his Federal taxable income or treat such foreign taxes as a credit against U.S. federal income taxes, subject to certain limitations. No deduction for foreign taxes may be claimed by an individual who does not itemize deductions. Dividends paid with respect to our ordinary shares will generally be treated as "passive“passive category income"income” or, in the case of certain types of U.S. Holders, "general“general category income"income” for purposes of computing allowable foreign tax credits for United States foreign tax credit purposes. The rules governing foreign tax credits are complex and U.S. Holders are encouraged to consult their tax advisors regarding the applicability of these rules in a U.S. Holder'sHolder’s specific situation.
Amounts taxable as dividends generally will be treated as passive income from sources outside the U.S. However, if (a) Euronav is 50% or more owned, by vote or value, by U.S. persons and (b) at least 10% of Euronav’s earnings and profits are attributable to sources within the U.S., then for foreign tax credit purposes, a portion of its dividends would be treated as derived from sources within the U.S. With respect to any dividend paid for any taxable year, the U.S. source ratio of our dividends for foreign tax credit purposes would be equal to the portion of Euronav’s earnings and profits from sources within the U.S. for such taxable year divided by the total amount of Euronav’s earnings and profits for such taxable year. The rules related to U.S. foreign tax credits are complex and U.S. holders should consult their tax advisors to determine whether and to what extent a credit would be available.
Special rules may apply to any "extraordinary dividend"“extraordinary dividend” generally, a dividend paid by us in an amount which is equal to or in excess of ten percent of a U.S. Non-Corporate Holder'sHolder’s adjusted tax basis (or fair market value in certain circumstances) or dividends received within a one-year period that, in the aggregate, equal or exceed 20% of a shareholder's adjusted tax basis (or fair market value upon the shareholder's election) in a share of ordinary shares paid by us. If we pay an "extraordinary dividend"“extraordinary dividend” on our ordinary shares that is treated as "qualified“qualified dividend income,"” then any loss derived by a U.S. Non-Corporate Holder from the sale or exchange of such ordinary shares will be treated as long-term capital loss to the extent of such dividend.
Dividends will be generally included in the income of U.S. Holders at the U.S. dollar amount of the dividend (including any non-U.S. taxes withheld therefrom), based upon the exchange rate in effect on the date of the distribution. In the case of foreign currency received as a dividend that is not converted by the recipient into U.S. dollars on the date of receipt, a U.S. Holder will have a tax basis in the foreign currency equal to its U.S. dollar value on the date of receipt. Any gain or loss recognized upon a subsequent sale or other disposition of the foreign currency, including the exchange for U.S. dollars, will be ordinary income or loss. However an individual whose realized foreign exchange gain does not exceed U.S. $200 will not recognize that gain, to the extent that there are not expenses associated with the transaction that meet the requirement for deductibility as a trade or business expense (other than travel expenses in connection with a business trip or as an expense for the production of income).
Sale, Exchange or other Disposition of Ordinary shares
Subject to the discussion of passive foreign investment companies below, a U.S. Holder generally will recognize taxable gain or loss upon a sale, exchange or other disposition of our ordinary shares in an amount equal to the difference between the amount realized by the U.S. Holder from such sale, exchange or other disposition and the U.S. Holder'sHolder’s tax basis in such shares. The U.S. Holder'sHolder’s initial tax basis in its shares generally will be the U.S. Holder'sHolder’s purchase price for the shares and that tax basis will be reduced (but not below zero) by the amount of any distributions on the shares that are treated as non-taxable returns of capital (as discussed above under "—United“-United States Federal Income Taxation of U.S. Holders—Distributions"Holders-Distributions”). Such gain or loss will be treated as long-term capital gain or loss if the U.S. Holder'sHolder’s holding period is greater than one year at the time of the sale, exchange or other disposition. Such capital gain or loss will generally be treated as United States source income or loss, as applicable, for United States foreign tax credit purposes. A U.S. Holder'sHolder’s ability to deduct capital losses is subject to certain limitations.
Passive Foreign Investment Company
Special United States federal income tax rules apply to a U.S. Holder that holds stock in a foreign corporation classified as a passive foreign investment company, or PFIC for United States federal income tax purposes. In general, a foreign corporation will be treated as a PFIC with respect to a United States shareholder in such foreign corporation, if, for any taxable year in which such shareholder holds stock in such foreign corporation, either:
•at least 75 percent of the corporation'scorporation’s gross income for such taxable year consists of passive income (e.g., dividends, interest, capital gains and rents derived other than in the active conduct of a rental business); or
•at least 50 percent of the average value of the assets held by the corporation during such taxable year produce, or are held for the production of, passive income.
For purposes of determining whether a foreign corporation is a PFIC, it will be treated as earning and owning its proportionate share of the income and assets, respectively, of any of its subsidiary corporations in which it owns at least 25 percent of the value of the subsidiary'ssubsidiary’s stock.
Income earned by a foreign corporation in connection with the performance of services would not constitute passive income. By contrast, rental income would generally constitute "passive income"“passive income” unless the foreign corporation is treated under specific rules as deriving its rental income in the active conduct of a trade or business or receiving the rental income from a related party.
Based on our current operations and future projections, we do not believe that we are, nor do we expect to become a PFIC with respect to any taxable year. Although there is no legal authority directly on point, our belief is based principally on the position that, for purposes of determining whether we are a PFIC, the gross income we derive or are deemed to derive from the time chartering and voyage chartering activities of our wholly-owned subsidiaries should constitute services income, rather than rental income. Correspondingly, such income should not constitute passive income, and the assets that we or our wholly-owned subsidiaries own and operate in connection with the production of such income, in particular, the vessels, should not constitute passive assets for purposes of determining whether we are a PFIC. We believe there is substantial legal authority supporting our position consisting of case law and IRS pronouncements concerning the characterization of income derived from time charters and voyage charters as services income for other tax purposes. We have not sought, and we do not expect to seek, a ruling from the Internal Revenue Service, or the IRS, on this matter. As a result, the IRS or a court could disagree with our position. No assurance can be given that this result will not occur. In addition, although we intend to conduct our affairs in a manner to avoid, to the extent possible, being classified as a PFIC with respect to any taxable year, we cannot assure you that the nature of our operations will not change in the future, or that we can avoid PFIC status in the future.
As discussed more fully below, if we were to be treated as a PFIC for any taxable year, a U.S. Holder would be subject to different taxation rules depending on whether the U.S. Holder makes an election to treat us as a "Qualified“Qualified Electing Fund,"” which election we refer to as a "QEF“QEF election."” As an alternative to making a QEF election, a U.S. Holder should be able to make a "mark-to-market"“mark-to-market” election with respect to our ordinary shares, as discussed below.
If we were to be treated as a PFIC for any taxable year, a U.S. Holder would be required to file an annual report with the IRS for that year with respect to such U.S. Holder'sHolder’s ordinary shares.
Taxation of U.S. Holders Making a Timely QEF Election
If a U.S. Holder makes a timely QEF election, which U.S. Holder we refer to as an "Electing“Electing Holder,"” the Electing Holder must report each year for United States federal income tax purposes his pro rata share of our ordinary earnings and our net capital gain, if any, for our taxable year that ends with or within the taxable year of the Electing Holder, regardless of whether or not distributions were received from us by the Electing Holder. The Electing Holder'sHolder’s adjusted tax basis in the ordinary shares will be increased to reflect taxed but undistributed earnings and profits. Distributions of earnings and profits that had been previously taxed will result in a corresponding reduction in the adjusted tax basis in the ordinary shares and will not be taxed again once distributed. An Electing Holder would generally recognize capital gain or loss on the sale, exchange or other disposition of our ordinary shares. A U.S. Holder would make a QEF election with respect to any year that our company is a PFIC by filing IRS Form 8621 with his United States federal income tax return. If we were aware that we or any of our subsidiaries were to be treated as a PFIC for any taxable year, we would, if possible, provide each U.S. Holder with all necessary information in order to make the QEF election described above. If we were to be treated as a PFIC, a U.S. Holder would be treated as owning his proportionate share of stock in each of our subsidiaries which is treated as a PFIC and such U.S. Holder would need to make a separate QEF election for any such subsidiaries. It should be noted that we may not be able to provide such information if we did not become aware of our status as a PFIC in a timely manner.
Taxation of U.S. Holders Making a "Mark-to-Market"“Mark-to-Market” Election
Alternatively, if we were to be treated as a PFIC for any taxable year and, as we anticipate, our shares are treated as "marketable“marketable stock,"” a U.S. Holder would be allowed to make a "mark-to-market"“mark-to-market” election with respect to our ordinary shares, provided the U.S. Holder completes and files IRS Form 8621 in accordance with the relevant instructions and related Treasury Regulations. The "mark-to-market"“mark-to-market” election will not be available for any of our subsidiaries. If that election is made, the U.S. Holder generally would include as ordinary income in each taxable year the excess, if any, of the fair market value of the ordinary shares at the end of the taxable year over such holder'sholder’s adjusted tax basis in the ordinary shares. The U.S. Holder would also be permitted an ordinary loss in respect of the excess, if any, of the U.S. Holder'sHolder’s adjusted tax basis in the ordinary shares over its fair market value at the end of the taxable year, but only to the extent of the net amount previously included in income as a result of the mark-to-market election. A U.S. Holder'sHolder’s tax basis in his ordinary shares would be adjusted to reflect any such income or loss amount. Gain realized on the sale, exchange or other disposition of our ordinary shares would be treated as ordinary income, and any loss realized on the sale, exchange or other disposition of the ordinary shares would be treated as ordinary loss to the extent that such loss does not exceed the net mark-to-market gains previously included in income by the U.S. Holder. It should be noted that the mark-to-market election would likely not be available for any of our subsidiaries which are treated as PFICs.
Taxation of U.S. Holders Not Making a Timely QEF or Mark-to-Market Election
Finally, if we were to be treated as a PFIC for any taxable year, a U.S. Holder who does not make either a QEF election or a "mark-to-market"“mark-to-market” election for that year, whom we refer to as a "Non-Electing“Non-Electing Holder,"” would be subject to special rules with respect to (1) any excess distribution (the portion of any distributions received by the Non-Electing Holder on our ordinary shares in a taxable year in excess of 125 percent of the average annual distributions received by the Non-Electing Holder in the three preceding taxable years, or, if shorter, the Non-Electing Holder'sHolder’s holding period before the taxable year for the ordinary shares), and (2) any gain realized on the sale, exchange or other disposition of our ordinary shares. Under these special rules:
•the excess distribution or gain would be allocated ratably over the Non-Electing Holders'Holders’ aggregate holding period for the ordinary shares;
•the amount allocated to the current taxable year and any taxable year before we became a PFIC would be taxed as ordinary income; and
•the amount allocated to each of the other taxable years would be subject to tax at the highest rate of tax in effect for the applicable class of taxpayer for that year, and an interest charge for the deemed tax deferral benefit would be imposed with respect to the resulting tax attributable to each such other taxable year.
These rules would not apply to a pension or profit sharing trust or other tax-exempt organization that did not borrow funds or otherwise utilize leverage in connection with its acquisition of our ordinary shares. If a Non-Electing Holder who is an individual dies while owning our ordinary shares, such holder'sholder’s successor generally would not receive a step-up in tax basis with respect to such shares.
United States Federal Income Taxation of "Non-U.S. Holders"“Non-U.S. Holders”
A beneficial owner of our ordinary shares that is not a U.S. Holder or an entity treated as a partnership is referred to herein as a "Non-U.S.“Non-U.S. Holder."
”
If a partnership holds our ordinary shares, the tax treatment of a partner will generally depend upon the status of the partner and upon the activities of the partnership. If you are a partner in a partnership holding our ordinary shares, you are encouraged to consult your tax advisor.
Dividends on Ordinary shares
Non-U.S. Holders generally will not be subject to United States federal income tax or withholding tax on dividends received from us with respect to our ordinary shares, unless that income is effectively connected with the Non-U.S. Holder'sHolder’s conduct of a trade or business in the United States. If the Non-U.S. Holder is entitled to the benefits of a United States income tax treaty with respect to those dividends, that income may be taxable only if it is also attributable to a permanent establishment maintained by the Non-U.S. Holder in the United States.
Sale, Exchange or Other Disposition of Ordinary shares
Non-U.S. Holders generally will not be subject to United States federal income tax or withholding tax on any gain realized upon the sale, exchange or other disposition of our ordinary shares, unless:
•the gain is effectively connected with the Non-U.S. Holder'sHolder’s conduct of a trade or business in the United States. If the Non-U.S. Holder is entitled to the benefits of an income tax treaty with respect to that gain, that gain may be taxable only if it is also attributable to a permanent establishment maintained by the Non-U.S. Holder in the United States or
•the Non-U.S. Holder is an individual who is present in the United States for 183 days or more during the taxable year of disposition and other conditions are met.
If the Non-U.S. Holder is engaged in a United States trade or business for United States federal income tax purposes, the income from the ordinary shares, including dividends and the gain from the sale, exchange or other disposition of the ordinary shares that are effectively connected with the conduct of that trade or business will generally be subject to regular United States federal income tax in the same manner as discussed in the previous section relating to the taxation of U.S. Holders. In addition, in the case of a corporate Non-U.S. Holder, its earnings and profits that are attributable to the effectively connected income, subject to certain adjustments, may be subject to an additional branch profits tax at a rate of 30 percent, or at a lower rate as may be specified by an applicable United States income tax treaty.
Backup Withholding and Information Reporting
In general, dividend payments, or other taxable distributions, made within the United States to you will be subject to information reporting requirements. Such payments will also be subject to backup withholding tax if paid to a non-corporate U.S. Holder who:
•fails to provide an accurate taxpayer identification number;
•is notified by the IRS that he has failed to report all interest or dividends required to be shown on his federal income tax returns; or
•in certain circumstances, fails to comply with applicable certification requirements.
Non-U.S. Holders may be required to establish their exemption from information reporting and backup withholding by certifying their status on an appropriate IRS Form W-8.
If a Non-U.S. Holder sells his ordinary shares to or through a United States office of a broker, the payment of the proceeds is subject to both United States backup withholding and information reporting unless the Non-U.S. Holder certifies that he is a non-U.S. person, under penalties of perjury, or otherwise establishes an exemption. If a Non-U.S. Holder sells his ordinary shares through a non-United States office of a non-United States broker and the sales proceeds are paid to the Non-U.S. Holder outside the United States then information reporting and backup withholding generally will not apply to that payment. However, United States information reporting requirements, but not backup withholding, will apply to a payment of sales proceeds, even if that payment is made to a Non-U.S. Holder outside the United States, if the Non-U.S. Holder sells ordinary shares through a non-United States office of a broker that is a United States person or has some other contacts with the United States.
Backup withholding is not an additional tax. Rather, a taxpayer generally may obtain a refund of any amounts withheld under backup withholding rules that exceed the taxpayer'staxpayer’s income tax liability by filing a refund claim with the IRS.
Individuals who are U.S. Holders (and to the extent specified in applicable Treasury Regulations, certain individuals who are Non-U.S. Holders and certain United States entities) who hold "specified“specified foreign financial assets"assets” (as defined in Section 6038D of the Code) are required to file IRS Form 8938 with information relating to the asset for each taxable year in which the aggregate value of all such assets exceeds $75,000 at any time during the taxable year or $50,000 on the last day of the taxable year (or such higher dollar amount as prescribed by applicable Treasury Regulations). Specified foreign financial assets would include, among other assets, our ordinary shares, unless the shares are held through an account maintained with a United States financial institution. Substantial penalties apply to any failure to timely file IRS Form 8938, unless the failure is shown to be due to reasonable cause and not due to willful neglect. Additionally, in the event an individual U.S. Holder (and to the extent specified in applicable Treasury Regulations, an individual Non-U.S. Holder or a United States entity) that is required to file IRS Form 8938 does not file such form, the statute of limitations on the assessment and collection of United States federal income taxes of such holder for the related tax year may not close until three years after the date that the required information is filed. U.S. Holders (including United States entities) and Non-U.S. Holders are encouraged to consult their own tax advisors regarding their reporting obligations under this legislation.
Belgian Tax Considerations
In the opinion of Argo Law, our Belgian counsel, the following are the material Belgian federal income tax consequences of the acquisition, ownership and disposal of ordinary shares by an investor, but this summary does not purport to address all tax consequences of the ownership and disposal of ordinary shares, and does not take into account the specific circumstances of particular investors, some of which may be subject to special rules, or the tax laws of any country other than Belgium. This summary does not describe the tax treatment of investors that are subject to special rules, such as banks, insurance companies, collective investment undertakings, dealers in securities or currencies, persons that hold, or will hold, ordinary shares as a position in a straddle, share-repurchase transaction, conversion transactions, synthetic security or other integrated financial transactions. This summary does not address the tax regime applicable to ordinary shares held by Belgian tax residents through a fixed basis or a permanent establishment situated outside Belgium. This summary does principally not address theany local taxes that may be due in connection with the ownership and disposal of ordinary shares.shares, other than Belgian local surcharges which generally vary from 0% to 9% of the investor's income tax liability.
For purposes of this summary, a Belgian resident is:
•an individual subject to Belgian personal income tax, i.e., an individual who is domiciled in Belgium or has his seat of wealth in Belgium or a person assimilated to a resident for purposes of Belgian tax law;
•a company (as defined by Belgian tax law) subject to Belgian corporate income tax, i.e., a corporate entity that has its statutory seat (unless it can be proved that the tax residence of the company is situated in another State than Belgium), its main establishment, its administrative seat or seat of management in Belgium;
•an Organization for Financing Pensions subject to Belgian corporate income tax, i.e., a Belgian pension fund incorporated under the form of an Organization for Financing Pensions; or
•a legal entity subject to Belgian income tax on legal entities, i.e., a legal entity other than a company subject to Belgian corporate income tax, that has its statutory seat, its main establishment, its administrative seat or seat of management in Belgium.
A non-resident is any person that is not a Belgian resident.
This summary is based on laws, treaties and regulatory interpretations in effect in Belgium on the date of this Form 20-F, all of which are subject to change, including changes that could have retroactive effect. Investors should appreciate that, as a result of evolutions in law or practice, the eventual tax consequences may be different from what is stated below.
Investors should consult their own advisers regarding the tax consequences of the acquisition, ownership and disposal of the ordinary shares in the light of their particular circumstances, including the effect of any state, local or other national laws.
Belgian taxation of dividends onordinary shares
For Belgian income tax purposes, the gross amount of all benefits paid on or attributed to the ordinary shares is generally treated as a dividend distribution. By way of exception, the repayment of capital carried out in accordance with the Belgian CompaniesCompanies’ and Associations’ Code is not treated as a dividend distribution to the extent that such repayment is imputed to the fiscal capital. This fiscal capital includes, in principle, the actual paid-up statutory share capital and, subject to certain conditions, the paid-up issuance premiums and the cash amounts subscribed to atcontributions done in exchange for the time of the issueissuance of profit sharing certificates. However, as of 1 January 2018, a repayment of capital decided upon by the shareholder’s meeting as of January 1, 2018 and which is carried out in accordance with the Belgian Companies’ and Associations’ Code is partly considered to be a dividend distribution, more specifically with respect to the portion that is deemed to be the distribution of the existing taxed reserves (irrespective of whether they are incorporated into the capital) and/or of the tax-free reserves incorporated into the capital whereby suchcapital. Such portion is determined on the basis of the ratio of the taxed reserves (except for the legal reserve up to the legal minimum and certain unavailable reserves) and the tax-free reserves incorporated into the capital versus(with a few exceptions) over the aggregate of such reserves and the fiscal capital.
Belgian withholding tax of 30% is normally levied on dividends, subject to such relief as may be available under applicable domestic or tax treaty provisions.
If the Company redeems its own ordinary shares, the redemption distribution (aftergain (i.e. the redemption proceeds after deduction of the portion of fiscal capital represented by the redeemed ordinary shares) will, in principle, be treated as a dividend subject to a Belgian withholding tax of 30%, subject to such relief as may be available under applicable domestic or tax treaty provisions. No Belgian withholding tax will be triggered if such redemption is carried out on a stock exchange and meets certain conditions.
In case of liquidation of the Company, any amountsthe liquidation gain (i.e. the amount distributed in excess of the fiscal capitalcapital) will in principle be subject to Belgian withholding tax at a rate of 30%, subject to such relief as may be available under applicable domestic or tax treaty provisions.
As mentioned above any dividends or other distributions made by the Company to shareholders owning its ordinary shares will, in principle, be subject to withholding tax in Belgium at a rate of 30%, except for shareholders which qualify for an exemption of withholding tax such as, among others, qualifying pension funds or a company qualifying as a parent company in the sense of the Council Directive (90/435/EEC) of July 23, 1990, or the Parent-Subsidiary Directive, or that qualify for a lower withholding tax rate or an exemption by virtue of a tax treaty. Various conditions may apply and shareholders residing in countries other than Belgium are advised to consult their advisers regarding the tax consequences of dividends or other distributions made by the Company. Shareholders of the Company residing in countries other than Belgium may not be able to credit the amount of such withholding tax to any tax due on such dividends or other distributions in any other country than Belgium. As a result, such shareholders may be subject to double taxation in respect of such dividends or other distributions.
Belgium and the United States have concluded a double tax treaty concerning the avoidance of double taxation, or the U.S.-Belgium Tax Treaty. The U.S.-Belgium Tax Treaty reduces the applicability of Belgian withholding tax to 15%, 5% or 0% for U.S. taxpayers, provided that the U.S. taxpayer meets the limitation of benefits conditions imposed by the U.S.-Belgium Tax Treaty. The Belgian withholding tax is generally reduced to 15% under the U.S.-Belgium Tax Treaty. The 5% withholding tax applies in case where the U.S. shareholder is a company which holds at least 10% of the ordinary shares in the Company. A 0% Belgian withholding tax applies when the shareholder is a U.S. company which has held at least 10% of the ordinary shares in the Company for a period of at least 12 months ending on the date the dividend is declared, or is, subject to certain conditions, a U.S. pension fund. The U.S. shareholders are encouraged to consult their own tax advisers to determine whether they can invoke the benefits and meet the limitation of benefits conditions as imposed by the U.S.-Belgium Tax Treaty.
Belgian resident individuals
For Belgian resident individuals who acquire and hold the ordinary shares as a private investment, the Belgian dividend withholding tax fully discharges their personal income tax liability. They may nevertheless elect to report (the gross amount of) the dividends in their personal income tax return. Where such individual opts to report them, dividends will normally be taxable at the lower of the generally applicable 30% withholding tax rate on dividends or at the progressive personal income tax rates applicable to the taxpayer'staxpayer’s overall declared income.income (local surcharges will not apply). The first EUR 812 (amount applicable for income year 2020; the amount applicable for income year 2021 is EUR 800) of reported ordinary dividend income will be exempt from Belgian tax. This exemption of Belgian tax has to be claimed by each tax payer via their tax declaration. For the avoidance of doubt, all reported dividends are taken into account to assess whether said maximum amount is reached. In addition, if the dividends are reported, the Belgian dividend withholding tax withheldlevied at source may be credited against the personal income tax due and is reimbursable to the extent that it exceeds the final personal income tax liability with at least EUR 2.50, provided that the dividend distribution does not result in a reduction in value of or a capital loss on the ordinary shares. This condition is not applicable if the individual can demonstrate that he has held the ordinary shares in full legal ownership for an uninterrupted period of twelve months prior to the attribution of the dividends.
For Belgian resident individuals who acquire and hold the ordinary shares for professional purposes, the Belgian withholding tax does not fully discharge their income tax liability. Dividends received must be reported by the investor and will, in such case, be taxable at the investor’s personal income tax rate increased with local surcharges. WithholdingThe Belgian dividend withholding tax withheldlevied at source may be credited against the personal income tax due and is reimbursable to the extent that it exceeds the final personal income tax dueliability with at least EUR 2.50, subject to two conditions: (1) the taxpayer must own the ordinary shares in full legal ownership aton the timedate on which the dividends are paid or attributedbeneficiary of the dividend is identified and (2) the dividend distribution may not result in a reduction in value of or a capital loss on the ordinary shares. The latter condition is not applicable if the investor can demonstrate that he has held the full legal ownership of the ordinary shares for an uninterrupted period of twelve months prior to the attribution of the dividends.
Belgian resident companies
Corporate income tax
For Belgian resident companies, the dividend withholding tax does not fully discharge the corporate income tax liability. For such companies, the gross dividend income (including the Belgian withholding tax) must be declared in the standard corporate income tax return and will be subject to a corporate income tax rate of currently 29.58% for assessment year 20192021 in relation to financial years starting as ofon or after 1 January 2018,2020, unless the reduced corporate income tax rates apply. The corporate income tax rate will beSubject to certain conditions, a reduced to 25% as of assessment year 2021 for financial years starting as of 1 January 2020. The dividends received during a financial year starting before 1 January 2018 or ending before 31 December 2018 will be subject to the standard corporate income tax rate of 33.99%, unless20% as of year 2021 (i.e. for financial years starting on or after 1 January 2020) applies for Small and Medium Sized Enterprises (as defined by Article 1:24, §1 to §6 of the reduced corporate income tax rates apply.
Belgian Companies’ and Associations’ Code) on the first EUR 100,000 of taxable profits.
Any Belgian dividend withholding tax levied at source may be credited against the corporate income tax due and is reimbursable to the extent that it exceeds the corporate income tax due, subject to two conditions: (1) the taxpayer must own the ordinary shares in full legal ownership aton the timedate on which the dividends are paid or attributed;beneficiary of the dividend is identified; and (2) the dividend distribution may not result in a reduction in value of or a capital loss on the ordinary shares. The latter condition is not applicable (a) if the taxpayer can demonstrate that it has held the ordinary shares in full legal ownership for an uninterrupted period of twelve months prior to the attribution of the dividends; or (b) if, during said period, the ordinary shares never belonged to a taxpayer other than a resident company or a non-resident company which has, in an uninterrupted manner, invested the ordinary shares in a permanent establishment (“PE”)or “PE” in Belgium.
If the corporate purpose of the beneficiary solely or mainly consists in managing and investing funds collected in order to pay legal or complementary pensions, the Belgian dividend withholding tax levied at source may be credited against the corporate income tax due and is reimbursable to the extent that it exceeds the corporate income tax due, provided that the taxpayer has held the ordinary shares in full legal ownership for an uninterrupted period of sixty days. This condition is not applicable if the taxpayer can demonstrate that the dividends are not connected to an arrangement or a series of arrangements (rechtshandeling of geheel van rechtshandelingen/acte juridique ou un ensemble d’actes juridiques) which is not genuine (kunstmatig/non authentique) and has been put in place for the main purpose or one of the main purposes of obtaining a tax credit of the Belgian dividend withholding tax.
As a general rule, Belgian resident companies can (as of assessment year 2019 and subject(subject to certain limitations) deduct 100% of gross dividends received from their taxable income (“dividend received deduction”)or the "Dividend Received Deduction Regime", provided that at the time of a dividend payment or attribution: (1) the Belgian resident company holds the ordinary shares representing at least 10% of the share capital of the Company or a participation in the Company with an acquisition value of at least EUR 2,500,000; (2) the ordinary shares have been held or will be held in full ownership for an uninterrupted period of at least one year; and (3) the conditions relating to the taxation of the underlying distributed income, as described in Article 203 of the Belgian Income Tax Code (the “Articleor the "Article 203 ITC Taxation Condition”)Condition" are met; and (4) the anti-abuse provision contained in Article 203, §1, 7° of the Belgian Income Tax Code is not applicable (together, the “Conditions for the application of the dividend received deduction regime”Dividend Received Deduction Regime”). Under certain circumstances the conditions referred to under (1) and (2) do not need to be fulfilled in order for the dividend received deductionDividend Received Deduction Regime to apply. Dividends received during a financial year starting before 1 January 2018 or ending before 31 December 2018 are only be deductible up to 95%.
The Conditions for the application of the dividend received deduction regimeDividend Received Deduction Regime depend on a factual analysis, upon each dividend distribution, and for this reason the availability of this regime should be verified upon each dividend distribution.
Belgian withholding tax
Dividends distributed to a Belgian resident company will be exempt from Belgian withholding tax provided that the Belgian resident company holds, upon payment or attribution of the dividends, at least 10% of the share capital of the Company and such minimum participation is held or will be held during an uninterrupted period of at least one year.
In order to benefit from this exemption, the Belgian resident company must provide the Company or its paying agent at the latest upon the attribution or the payment of the dividend with a certificate confirming its qualifying status and the fact that it meets the required conditions. If the Belgian resident company holds the required minimum participation for less than one year, at the time the dividends are paid on or attributed to the ordinary shares, the Company will levy the Belgian withholding tax but will not transfer it to the Belgian Treasury provided that the Belgian resident company certifies its qualifying status, the date from which it has held such minimum participation, and its commitment to hold the minimum participation for an uninterrupted period of at least one year.
The Belgian resident company must also inform the Company or its paying agent if the one-year period has expired or if its shareholding will drop below 10% of the share capital of the Company before the end of the one-year holding period. Upon satisfying the one-year shareholding requirement, the dividend withholding tax which was temporarily withheld, will be refunded to the Belgian resident company.
Please note that the above described dividend received deduction regimeDividend Received Deduction Regime and the withholding tax exemption will not be applicable to dividends which are connected to an arrangement or a series of arrangements (““rechtshandeling of geheel van rechtshandelingen”rechtshandelingen”/”acte juridique ou un ensemble d’actes juridiques”)juridiques” for which the Belgian tax administration, taking into account all relevant facts and circumstances, has proven, unless evidence to the contrary, that this arrangement or this series of arrangements is not genuine (“kunstmatig”“kunstmatig”/”non authentique”)authentique” and has been put in place for the main purpose or one of the main purposes of obtaining the dividend received deduction, the above dividend withholding tax exemption or one of the advantages of the EU Parent-Subsidiary Directive of November 30, 2011 (2011/96/EU) (“Parent-Subsidiary Directive”) in another EU Member State. An arrangement or a series of arrangements is regarded as not genuine to the extent that they are not put into place for valid commercial reasons which reflect economic reality.
Belgian resident organizations for financing pensions
For organizations for financing pensions (“OFPs”),or OFPs, i.e., Belgian pension funds incorporated under the form of an OFP ("(“organismen voor de financiering van pensioenen"pensioenen”/"”organismes de financement de pensions"pensions”) within the meaning of Article 8 of the Belgian Act of 27 October 27, 2006, the dividend income is generally tax exempt.
Subject to certain limitations, any Belgian dividend withholding tax levied at source may be credited against the corporate income tax due and is reimbursable to the extent that it exceeds the corporate income tax due.
If the corporate purpose of the beneficiary solely or mainly consists in managing and investing funds collected in order to pay legal or complementary pensions, the Belgian dividend withholding tax levied at source may be credited against the corporate income tax due and is reimbursable to the extent that it exceeds the corporate income tax due, provided that the taxpayer has held the ordinary shares in full legal ownership for an uninterrupted period of sixty days. This condition is not applicable if the taxpayer can demonstrate that the dividends are not connected to an arrangement or a series of arrangements ("rechtshandeling of geheel van rechtshandelingen/acte juridique ou un ensemble d’actes juridiques") which is not genuine ("kunstmatig/non authentique") and has been put in place for the main purpose or one of the main purposes of obtaining a tax credit of the Belgian dividend withholding tax.
Other Belgian resident legal entities subject to Belgian legal entities tax
For taxpayers subject to the Belgian income tax on legal entities, the Belgian dividend withholding tax in principle fully discharges their income tax liability.
Non-resident individuals or non-resident companies
Non-resident income tax
For non-resident individuals and companies, the Belgian dividend withholding tax will be the only tax on dividends in Belgium, unless the non-resident holds the ordinary shares in connection with a business conducted in Belgium through a fixed base in Belgium or a Belgian PE.
If the ordinary shares are acquired by a non-resident in connection with a businessfixed base or a PE in Belgium, the investor must report any dividends received, which will be taxable at the applicable non-resident personal or corporate income tax rate, as appropriate. Belgian dividend withholding tax levied at source may be credited against non-resident personal or corporate income tax and is reimbursable to the extent that it exceeds the income tax due with at least EUR 2.50 and, subject to two conditions: (1) the taxpayer must own the ordinary shares in full legal ownership aton the timedate on which the dividends are paid or attributedbeneficiary of the dividend is identified and (2) the dividend distribution may not result in a reduction in value of or a capital loss on the ordinary shares. The latter condition is not applicable if (a) the non-resident individual or the non-resident company can demonstrate that the ordinary shares were held in full legal ownership for an uninterrupted period of twelve months prior to the payment or attribution of the dividends or (b) with regard to non-resident companies only, if, during said period, the ordinary shares have not belonged to a taxpayer other than a Belgian resident company or a non-resident company which has, in an uninterrupted manner, invested the ordinary shares in a Belgian PE.
Non-resident companies whose ordinary shares are invested in a Belgian PE may as of assessment year 2019, deduct 100% of the gross dividends received from their taxable income if, at the date the dividends are paid or attributed, the Conditions for the application of the dividend received deduction regimeDividend Received Deduction Regime are met. ApplicationThe application of the dividend received deduction regimeDividend Received Deduction Regime depends, however, on a factual analysis to be made upon each distribution and its availability should be verified upon each dividend distribution.
Dividends distributed to non-resident individuals who do not use the ordinary shares in the exercise of a professional activity, may be eligible for the tax exemption with respect to ordinary dividends in an amount of up to EUR 812 (amount applicable for income year 2020; the amount applicable for income year 2021 is EUR 800) per year. For the avoidance of doubt, all dividends paid or attributed to such non-resident individual (and hence not only dividends paid or attributed on the ordinary shares) are taken into account to assess whether said maximum amount is reached. Consequently, if Belgian withholding tax has been levied on dividends paid or attributed to the ordinary shares, such non-resident individual may request in its Belgian non-resident income tax return that any Belgian withholding tax levied is credited and, as the case may be, reimbursed. However, if no Belgian non-resident income tax return must be filed by the non-resident individual, any Belgian withholding tax levied could in principle be reclaimed by filing a certified, dated and signed written request thereto addressed to the tax official of the Centre Abroad (Centrum Buitenland/Centre Etrangers). Such a request must be filed no later than on December 31st of the calendar year following the calendar year in which the relevant dividend(s) have been received, together with an affidavit confirming the non-resident individual status and certain supporting documents.
Belgian dividend withholding tax relief for non-residents
Under Belgian tax law, withholding tax is not due on dividends paid to a foreign pension fund which satisfies the following conditions: (i) it is a non-resident saver in the meaning of Article 227, 3° of the Belgian ITC which implies that it has separate legal personality and fiscal residence outside of Belgium; (ii) whose corporate purpose consists solely in managing and investing funds collected in order to pay legal or complementary pensions; (iii) whose activity is limited to the investment of funds collected in the exercise of its statutory mission, without any profit making aim; (iv) which is exempt from income tax in its country of residence; and (v) except in specific circumstances, provided that it is not contractually obligated to redistribute the dividends to any ultimate beneficiary of such dividends for whom it would manage the ordinary shares, nor obligated to pay a manufactured dividend with respect to the ordinary shares under a securities borrowing transaction. The exemption will only apply if the foreign pension fund provides a certificate confirming that it is the full legal owner or usufruct holder of the ordinary shares and that the above conditions are satisfied. The organizationforeign pension fund must then forward that certificate to the Company or its paying agent.
As mentioned above, if the corporate purpose of the beneficiary solely or mainly consists in managing and investing funds collected in order to pay legal or complementary pensions, the Belgian dividend withholding tax levied at source may be credited against the corporate income tax due and is reimbursable to the extent that it exceeds the corporate income tax due, provided that the taxpayer has held the ordinary shares in full legal ownership for an uninterrupted period of sixty days. This condition is not applicable if the taxpayer can demonstrate that the dividends are not connected to an arrangement or a series of arrangements ("rechtshandeling of geheel van rechtshandelingen/acte juridique ou un ensemble d’actes juridiques") which is not genuine ("kunstmatig/non authentique") and has been put in place for the main purpose or one of the main purposes of obtaining a tax credit of the Belgian dividend withholding tax.
Dividends distributed to non-resident qualifying parent companies established in a Member State of the EU or in a country with which Belgium has concluded a double tax treaty that includes a qualifying exchange of information clause, will, under certain conditions, be exempt from Belgian withholding tax provided that the ordinary shares held by the non-resident company, upon payment or attribution of the dividends, amount to at least 10% of the share capital of the Company and such minimum participation is held or will be held during an uninterrupted period of at least one year. A non-resident company qualifies as a parent company provided that (i) for companies established in a Member State of the EU, it has a legal form as listed in the annex to the EU Parent-Subsidiary Directive of July 23, 1990 (90/435/EC)Directive), as amended by Directive 2003/123/EC of 22 December 22, 2003, or, for companies established in a country with which Belgium has concluded a qualifying double tax treaty, it has a legal form similar to the ones listed in such annex;annex (provided that, as regards the companies governed by Belgian law, the reference to "besloten vennootschap met beperkte aansprakelijkheid/société privée à responsabilité limitée", to "coperatieve vennootschap met onbeperkte aansprakelijkheid/”/”société cooperative à responsabilité illimitée", and to "gewone commanditaire vennootschap/société en commandite simple", should also be understood as a reference to respectively the "beslotenvennootschap, the coperatieve vennootschap/société à responsabilité limitée”, and the "commanditaire vennootschap/société en commandite"; (ii) it is considered to be a tax resident according to the tax laws of the country where it is established and the double tax treaties concluded between such country and third countries; and (iii) it is subject to corporate income tax or a similar tax without benefiting from a tax regime that derogates from the ordinary tax regime.
In order toTo benefit from this exemption, the non-resident company must provide the Company or its paying agent at the latest upon the attribution of the dividends with a certificate confirming its qualifying status and the fact that it meets the three abovementionedaforementioned conditions.
If the non-resident company holds a minimum participation for less than one year at the time the dividends are paid on or attributed to the ordinary shares, the Company must deduct the withholding tax but does not need to transfer it to the Belgian Treasury provided that the non-resident company provides the Company or its paying agent with a certificate confirming, in addition to its qualifying status, the date as of which it has held the ordinary shares, and its commitment to hold the ordinary shares for an uninterrupted period of at least one year. The non-resident company must also inform the Company or its paying agent when the one-year period has expired or if its shareholding drops below 10% of the Company’s share capital before the end of the one-year holding period. Upon satisfying the one-year shareholding requirement, the deducted dividend withholding tax which was temporarily withheld, will be refunded to the non-resident company.
Please note that the above withholding tax exemption will not be applicable to dividends which are connected to an arrangement or a series of arrangements (‘‘rechtshandeling of geheel van rechtshandelingen’’/’’acte juridique ou un ensemble d’actes juridiques’’) for which the Belgian tax administration, taking into account all relevant facts and circumstances, has proven, unless evidence to the contrary, that this arrangement or this series of arrangements is not genuine (‘‘kunstmatig’’/’’non authentique’’) and has been put in place for the main purpose or one of the main purposes of obtaining the dividend received deduction, the above dividend withholding tax exemption or one of the advantages of the Parent-Subsidiary Directive in another EU Member State. An arrangement or a series of arrangements is regarded as not genuine to the extent that they are not put into place for valid commercial reasons which reflect economic reality. Pursuant to recent jurisprudence of the European Court of Justice, the withholding tax exemption may even be refused if the receiving Parent Company cannot be considered as the beneficial owner of the dividends.
Dividends paid or attributeddistributed by a Belgian company to a non-resident company will be exempt from withholding tax, provided that (i) the non-resident company is established in the European Economic Area or in a country with whom Belgium has concluded a tax treaty that includes a qualifying exchange of information clause, (ii) the non-resident company is subject to corporate income tax or a similar tax without benefiting from a tax regime that derogates from the ordinary tax regime, (iii) the non-resident company does not satisfy the 10%-participation threshold but has a participation in the Belgian company with an acquisition value of at least EUR 2,500,000 upon the date of payment or attribution of the dividend, (iv) the dividends relate to ordinary shares which are or will be held in full ownership for at least one year without interruption; and (v) the non-resident company has a legal form as listed in the annex to the Parent-Subsidiary Directive, as amended from time to time, or, has a legal form similar to the ones listed in such annex (provided that, as regards the companies governed by Belgian law, the reference to “besloten vennootschap met beperkte aansprakelijkheid”/”société privée à responsabilité limitée”, to “coöperatieve vennootschap met onbeperkte aansprakelijkheid”/”société cooperative à responsabilité illimitée”, and to “gewone commanditaire vennootschap”/”société en commandite simple”, should also be understood as a reference to respectively the “besloten vennootschap”/”société à responsabilité limitée”, the “coöperatieve vennootschap”/”société cooperative”, and the “commanditaire vennootschap”/”société en commandite”) and that is governed by the laws of another Member State of the EEA, or, by the law of a country with whom Belgium has concluded a qualifying double tax treaty, (vi)treaty. This exemption applies to the ordinary Belgianextent that the withholding tax is,which would have been due in principle, neithercase this exemption would not exit, would not be creditable nor reimbursable in the hands of the non-resident company.
In order to benefit from the exemption of withholding tax, the non-resident company must provide the Company or its paying agent with a certificate confirming (i) it has the above described legal form, (ii) it is subject to corporate income tax or a similar tax without benefiting from a tax regime that deviates from the ordinary domestic tax regime, (iii) it holds a participation of less than 10% in the capital of the Company but with an acquisition value of at least EUR 2,500,000 upon the date of payment or attribution of the dividend, (iv) the dividends relate to ordinary shares in the Company which it has held or will hold in full legal ownership for an uninterrupted period of at least one year, (v) to which extent it could in principle, would this exemption not exist, credit the levied Belgian withholding tax or obtain a reimbursement according to the legal provisions applicable upon 31 December of the year preceding the year of the payment or attribution of the dividends, and (vi) its full name, legal form, address and fiscal identification number, if applicable.
Belgian dividend withholding tax is subject to such relief as may be available under applicable double tax treaty provisions. Belgium has concluded double tax treaties with more than 95 countries, reducing the dividend withholding tax rate to 20%, 15%, 10%, 5% or 0% for residents of those countries, depending on conditions, among others, related to the size of the shareholding and certain identification formalities. Such reduction may be obtained either directly at source or through a refund of taxes withheld in excess of the applicable tax treaty rate.
Prospective holders should consult their own tax advisors to determine whether they qualify for a reduction in withholding tax upon payment or attribution of dividends, and, if so, to understand the procedural requirements for obtaining a reduced withholding tax upon the payment of dividends or for making claims for reimbursement.
CapitalBelgian taxation of capital gains and losses on ordinary shares
Belgian resident individuals
In principle, Belgian resident individuals acquiring the ordinary shares as a private investment should not be subject to Belgian capital gains tax on a later disposal of the ordinary shares and capital losses will not be tax deductible.
Capital gains realisedrealized by a Belgian resident individual are however taxable at 33% (plus local surcharges) if the capital gain on the ordinary shares is deemed to be realisedrealized outside the scope of the normal management of its private estate. Capital losses are, however, not tax deductible. Moreover, capital gains realisedrealized by Belgian resident individuals on the disposal of the ordinary shares to a non-resident company (or body constituted in a similar legal form), to a foreign State (or one of its political subdivisions or local authorities) or to a non-resident legal entity, each time established outside the European Economic Area, are in principle taxable at a rate of 16.5% (plus local surcharges) if, at any time during the five years preceding the sale, the Belgian resident individual has owned, directly or indirectly, alone or with his/her spouse or with certain relatives, a substantial shareholding in the Company (i.e., a shareholding of more than 25% in the Company). Capital losses arising from such transactions are, however, not tax deductible.
Capital gains realisedrealized by Belgian resident individuals in case of redemption of the ordinary shares or in case of liquidation of the Company will generally be taxable as a dividend.
Belgian resident individuals who hold the ordinary shares for professional purposes are taxable at the ordinary progressive personal income tax rates (plus local surcharges) on any capital gains realisedrealized upon the disposal of the ordinary shares, except for the ordinary shares held for more than five years, which are taxable at a separate rate of, in principle, 10% (capital gains realisedrealized in the framework of the cessation of activities inunder certain circumstances) or 16.5% (other
occasions), both plus local surcharges. Capital losses on the ordinary shares incurred by Belgian resident individuals who hold the ordinary shares for professional purposes are in principle tax deductible.
Belgian resident companies
Belgian resident companies are normally not subject to Belgian capital gains taxation on gains realisedrealized upon the disposal of the ordinary shares provided that the Conditions for the application of the dividend received deduction regimeDividend Received Deduction Regime are met. Such capital gains realized by non-small and medium-sized companies in a financial year starting before 1 January 2018 or ending before 31 December 2018 will still be subject to a corporate income tax of 0.412%.
If the one-year minimum holding period condition is not met (but the other Conditions for the applicationone or more of the dividend received deduction regime are met), the capital gains realised upon the disposal of the ordinary shares by Belgian resident companies are taxable at a separate corporate income tax rate of 25.50%. Such capital gains realized in a financial year starting before 1 January 2018 or ending before 31 December 2018 will still be subject to a separate corporate income tax rate of 25.75%. From assessment year 2019 (financial years from 1 January 2018) this separate rate for the non-fulfillment of the one-year detention condition does not apply to SMEs, insofar as the capital gain qualifies for the reduced rate of 20.40% (this is, with a taxable basis up to 100,000 EUR). This separate rate will be fully abolished as of the assessment year 2021 (financial years from 1 January 2020), since at that time the standard corporate tax rate will be reduced to 25% (or 20% for qualifying SMEs).
If the Conditions for the application of the dividend received deduction regimeDividend Received Deduction Regime would not be met, any capital gain realisedrealized would be taxable at the standard corporate income tax rate of 29.58%25%, unless the reduced corporate income tax rates apply. Such capital gain realized in a financial year starting before 1 January 2018 or ending before 31 December 2018 will still be subject to the standard corporate income tax rate of 33.99%, unless the reduced corporate income tax rates apply. The corporate income tax rate will be reduced to 25% as of assessment year 2021 for financial years starting on or after 1 January 2020.20% applies.
Capital losses on the ordinary shares incurred by Belgian resident companies are as a general rule not tax deductible.
Ordinary shares held in the trading portfolios of Belgian qualifying credit institutions, investment enterprises and management companies of collective investment undertakings are subject to a different regime. The capital gains on such ordinary shares are taxable at the ordinarystandard corporate income tax rate of 29.58%25% unless the reduced corporate income tax rate of 20% applies and the capital losses on such ordinary shares are tax deductible. Internal transfers to and from the trading portfolio are assimilated to a realization. Such capital gain realized in a financial year starting before 1 January 2018 or ending before 31 December 2018 will still be subject to the standard corporate income tax rate of 33.99%, unless the reduced corporate income tax rates apply. The corporate income tax rate will be reduced to 25% as of assessment year 2021 for financial years starting as of 1 January 2020.
Capital gains realisedrealized by Belgian resident companies in case of redemption of the ordinary shares or in case of liquidation of the Company will, in principle, be subject to the same taxation regime as dividends.
Belgian resident organizations for financing pensions
Capital gains on the ordinary shares realisedand capital losses realized by OFPs within the meaning of Article 8 of the Belgian Act of 27 October 27, 2006, are exempt from corporate income tax and capital lossesupon the disposal of the ordinary shares are not to be taken into account for the determination of the taxable result of the OFPs.
Other Belgian resident legal entities subject to Belgian legal entities tax deductible.
Capital gains realisedrealized upon disposal of the ordinary shares by Belgian resident legal entities are in principle not subject to Belgian income tax and capital losses are not tax deductible.
Capital gains realisedrealized upon disposal of (part of) a substantial participation in a Belgian company (i.e., a participation representing more than 25% of the share capital of the Company at any time during the last five years prior to the disposal) may, however, under certain circumstances be subject to income tax in Belgium at a rate of 16.5% (plus crisis surcharge of 2%; such surcharge will however be abolished as of 1 January 2020).
Capital gains realisedrealized by Belgian resident legal entities in case of redemption of the ordinary shares or in case of liquidation of the Company will, in principle, be subject to the same taxation regime as dividends.
Non-resident individuals or non-resident companies
Non-resident individuals or companies are, in principle, not subject to Belgian income tax on capital gains realisedrealized upon disposal of the ordinary shares, unless the ordinary shares are held as part of a business conducted in Belgium through a fixed base in Belgium or a Belgian PE. In such a case, the same principles apply as described with regard to Belgian individuals (holding the ordinary shares for professional purposes) or Belgian companies.
Non-resident individuals who do not use the ordinary shares for professional purposes and who have their fiscal residence in a country with which Belgium has not concluded a tax treaty or with which Belgium has concluded a tax treaty that confers the authority to tax capital gains on the ordinary shares to Belgium, might be subject to tax in Belgium if the capital gains arise from transactions which are to be considered speculative or beyond the normal management of one'sone’s private estate or in case of disposal of a substantial participation in a Belgian company as mentioned in the tax treatment of the disposal of the ordinary shares by Belgian individuals. Such non-resident individuals might therefore be obliged to file a tax return and should consult their own tax advisor.
Annual tax on securities accounts
AsThe law of 10 March 2018,17 February 2021 on the introduction of an annual tax on securities accounts (the “Law of 17 February 2021”) has introduced an annual tax on securities accounts into Belgian law effective as from February 26, 2021. Pursuant
to the Law of 17 February 2021, a new0.15% tax is applicable to Belgian residents and non-residents who hold securities accounts with an average value, over a period of twelve consecutive months starting on October 1st and ending on September 30th of the subsequent year, higher than EUR 1,000,000. The ordinary shares are principally qualifying securities for the purposes of this tax.
For the calendar year 2021, the average value of securities accounts will as a general rule be calculated from February 26, 2021 until September 30, 2021.
The tax due is limited to 10% on the difference between the taxable amount and the aforementioned cap of EUR 1,000,000. This cap is assessed per securities account (irrespective whether the account is held in Belgium or abroad) and involves Belgian as well as foreign securities accounts held by Belgian residents. Securities held by non-residents only fall within the scope of the annual tax on securities accounts provided they are held on securities accounts with a financial intermediary established or located in Belgium. Note that pursuant to certain double tax treaties, Belgium has no right to tax capital. Hence, to the extent that the annual tax on securities accounts is viewed as a tax on capital within the meaning of these double tax treaties, treaty override may, subject to certain conditions, be claimed. Belgian establishments from non-residents are however treated as Belgian residents for purposes of the annual tax on securities accounts so that both Belgian and foreign securities accounts fall within the scope of this tax.
The annual tax on securities accounts is in principle due by the financial intermediary established or located in Belgium. Otherwise, the annual tax on securities accounts needs to be declared and is due by the holder of the securities accounts itself, unless the holder provides evidence that the annual tax on securities accounts has already been introduced, whereby both (i) Belgian resident private individuals holding onewithheld, declared and paid by an intermediary which is not established or morelocated in Belgium. In that respect, intermediaries located or established outside of Belgium could appoint an annual tax on securities accounts via a financial intermediary basedrepresentative in Belgium or abroad, and (ii) non-resident private individuals holding one or more securities accounts via a financial intermediary based in Belgium, are subject to tax at a rate of 0.15 % on the total amount of qualifying assets (including listed ordinary shares, bonds, funds) held on these securities accounts if during the preceding reference period of 12 months the combined average value of qualifying assets across all securities accounts exceeded EUR 500,000 per individual account holder (i.e., EUR 1,000,000 for a married couple holding a common securities account). Pension savings accounts and life insurances are excluded. The tax is, in principle, collected by the intermediary financial institution, who also determine the combined average value of the accounts concerned, in case this financial institution is a Belgian financial institution or a foreign financial institution which has appointedBelgium. Such a representative in Belgium to do so. If not,is then liable towards the securities account holder is responsibleBelgian Treasury (“Thesaurie”/”Trésorerie”) for calculating, reporting and paying the annual tax on securities accounts.accounts due and for complying with certain reporting obligations in that respect. If the holder of the securities accounts itself is liable for reporting obligations (e.g. when a Belgian resident holds a securities account abroad with an average value higher than EUR 1,000,000), the deadline for filing the tax return for the annual tax on securities accounts corresponds with the deadline for filing the annual tax return for personal income tax purposes electronically, irrespective whether the Belgian resident is an individual or a legal entity. In the latter case, the annual tax on securities accounts must be paid by the tax payer on 31 August of the year following the year on which the tax was calculated, at the latest.
As a general rule, no annual tax on securities accounts is due provided that the average value of the securities account is less than EUR 1,000,000.
Please note that the annual tax on securities accounts contains several (specific) anti-abuse provisions that intend to remediate tax avoidance (e.g. conversion of qualifying financial instruments to non-qualifying financial instruments (such as nominative shares) or splitting an existing securities account into several securities accounts in order to avoid reaching the cap of EUR 1,000,000 on the relevant securities account).
Investors should consult their own professional advisors in relation to the annual tax on securities accounts.
Belgian tax on stock exchange transactions
The purchase and the sale and any other acquisition or transfer for consideration of existing ordinary shares (secondary market transactions) is subject to the Belgian tax on stock exchange transactions (““taks op de beursverrichtingen”beursverrichtingen” / “taxe“taxe sur les opérations de bourse”)bourse” if (i) it is executed in Belgium through a professional intermediary, or (ii) deemed to be executed in Belgium, which is the case if the order is directly or indirectly made to a professional intermediary established outside of Belgium, either by private individuals with habitual residence in Belgium, or legal entities for the account of their seat or establishment in Belgium (both referred to as a “Belgian Investor”). The tax on stock exchange transactions is not due upon the issuance of new ordinary shares.shares (primary market transactions).
The tax on stock exchange transactions is levied at a rate of 0.35% of the purchase price, capped at EUR 1,600 per transaction and per party.
A separate tax is due by each party to the transaction, and both taxes are collected by the professional intermediary. However, if the intermediary is established outside of Belgium, the tax will in principle be due by the Belgian Investor, unless that Belgian Investor can demonstrate that the tax has already been paid. Professional intermediaries established outside of Belgium can, subject to certain conditions and formalities, appoint a Belgian stock exchange tax representative (“Stock Exchange Tax Representative”), which will be liable for the tax on stock exchange transactions in respect of the transactions executed through the professional intermediary. If such a Stock Exchange Tax Representative would have paid the tax on stock exchange transactions due, the Belgian Investor will, as per the above, no longer be the debtor of the tax on stock exchange transaction.
No tax on stock exchange transactions is due on transactions entered into by the following parties, provided they are acting for their own account: (i) professional intermediaries described in Article 2.9° and 10° of the Belgian Law of 2 August 2, 2002 on the supervision of the financial sector and financial services; (ii) insurance companies defined in Article 5 of the Belgian Law of 13 March 13, 2016 on the status and supervision of insurance companies and reinsurance companies; (iii) pension institutions referred to in Article 2,1° of the Belgian Law of 27 October 27, 2006 concerning the supervision of pension institutions; (iv) undertakings for collective investment; (v) regulated real estate companies; and (vi) Belgian non-residents provided they deliver a certificate to their financial intermediary in Belgium confirming their non-resident status.
Application of the tonnage tax regime to the Company
The Belgian Ministry of Finance approved our application on October 23, 2013 for beneficial tax treatment of certain of our vessel operations income.
Under this Belgian tax regime, our taxable basis is determined on a lump-sum basis (Tonnage Tax Regime - An alternative way of calculating taxable income of operating qualifying ships. Taxable profits are calculated by reference to the net tonnage of the qualifying vessels a company operates, independent of the actual earnings (profit or loss) for Belgian corporate income tax purposes). This tonnage tax regime was initially granted for 10 years and was renewed for an additional 10-year period in 2013.
The subsidiaries Euronav Shipping NV and Euronav Tankers NV that were formed in connection with our acquisition of the 2014 Fleet Acquisition Vessels applied for the Belgian tonnage tax regime and obtained approval effective January 1, 2016.
We cannot assure the Company will be able to continue to take advantage of these tax benefits in the future or that the Belgian Ministry of Finance will approve the Company'sCompany’s future applications. Changes to the tax regimes applicable to the Company, or the interpretation thereof, may impact the future net results of the Company.
Other income tax considerations
In addition to the income tax consequences discussed above, the Company may be subject to tax in one or more other jurisdictions where the Company conducts activities. The amount of any such tax imposed upon our operations may be material.
The proposed Financial Transaction Tax (FTT)
On February 14, 2013 the EU Commission adopted a Draft Directive on a common Financial Transaction Tax (the “FTT”"FTT"). Earlier negotiations for a common transaction tax among all 28 EU Member States had failed. The current negotiations between Austria, Belgium, France, Germany, Greece, Italy, Portugal, Slovakia, Slovenia and Spain (the Participating"Participating Member States)States") are seeking a compromise under “enhanced cooperation” rules, which require consensus from at least nine nations. Earlier Estonia dropped out of the negotiations by declaring it would not introduce the FTT.
The Draft Directive currently stipulates that once the FTT enters into force, the Participating Member States shall not maintain or introduce taxes on financial transactions other than the FTT (or VAT as provided in the Council Directive 2006/112/EC of November 28, 2006 on the common system of value added tax). For Belgium, the tax on stock exchange transactions should thus be abolished once the FTT enters into force.
However, the Draft Directive on the FTT remains subject to negotiations between the Participating Member States. It may therefore be altered prior to any implementation, of which the eventual timing and outcome remains unclear. Additional EU Member States may decide to participate or drop out of the negotiations. If the number of Participating Member States would fall below nine, it would put an end to the project.
In June 2016, the Participating Member States declared that they would continue their efforts in the second half of the year but since then the negotiating parties have not been successful in reaching an agreement. The FTT was at a standstill but yet renewed discussions between the Participating Member States took place in May and June 2019.
The Portuguese Presidency decided to relaunch discussions between the Member States. A key objective of the Portuguese Presidency is to explore ways for a possible consensus on an efficient FTT design model including reassessment of the views of participating and non-participating Member States taking into account the current context. In February 2021, a discussion on the FTT took place in the Working Party on Tax Questions.
Prospective investors should consult their own professional advisors in relation to the FTT.
F.Dividends and paying agents.
Not applicable.
G.Statement by experts.
Not applicable.
H.Documents on display.
We are subject to the informational requirements of the Exchange Act. In accordance with these requirements we file reports and other information with the SEC. These materials, including this annual report and the accompanying exhibits, may be inspected and copied at the public reference facilities maintained by the Commission at 100 F Street, N.E., Washington, D.C. 20549. You may obtain information on the operation of the public reference room by calling 1 (800) SEC-0330, and you may obtain copies at prescribed rates from the Public Reference Section of the Commission at its principal office in Washington, D.C. 20549. The SEC maintains a website (http://www.sec.gov) that contains reports, proxy and information statements and other information that we and other registrants have filed electronically with the SEC. Our filings are also available on our website at www.euronav.com. This web address is provided as an inactive textual reference only. Information contained on our website does not constitute part of this annual report.
Shareholders may also request a copy of our filings at no cost, by writing or telephoning us at the following address:
Euronav NV
De Gerlachekaai 20, 2000 Antwerpen
Belgium
Telephone: 011-32-3-247-4411
I.Subsidiary Information
Not applicable.
ITEM 11. QUANTITATIVE AND QUALITATIVE DISCLOSURES ABOUT MARKET RISK
We are exposed to market risk from changes in interest rates related to the variable rate of the borrowings under our secured and unsecured credit facilities. Amounts borrowed under the credit facilities bear interest at a rate equal to LIBOR plus a margin. Increasing interest rates could affect our future profitability. In certain situations, we may enter into financial instruments to reduce the risk associated with fluctuations in interest rates. A one percentage point increase in LIBOR would have increased our interest expense for the year ended December 31, 20172020 by approximately $9.4$7.6 million ($10.612.4 million in 2016)2019).
We are exposed to currency risk related to our operating expenses and treasury notes expressed in euros. In 2017,2020, about 16.5%14.4% of the total operating expenses were incurred in euros (2016: 17.4%(2019: 12.5%). Revenue and the financial instruments are expressed in U.S. dollars only. A 10 percent strengthening of the Euro against the dollar at December 31, 20172020 would have decreased our profit or loss by $7.1$10.4 million (2016:(2019: $10.0 million). A 10 percent weakening of the euro against the dollar at December 31, 20172020 would have had the equal but opposite effect.
We are exposed to credit risk from our operating activities (primarily for loans and guarantees extended to our joint ventures as part of the investing activities, trade receivables, and available liquidity under our credit revolving facilities) and from our financing activities, including credit risk related to undrawn portions of our facilities and deposits with banks and financial institutions. We seek to diversify the credit risk on our cash deposits by spreading the risk among various financial institutions. The cash and cash equivalents are held with bank and financial institution counterparties, which are rated A- to AA+, based on the rating agency, Standard & Poor's Financial Services LLC.
Historically, the tanker markets have been volatile as a result of the many conditions and factors that can affect the price, supply and demand for tanker capacity. Changes in demand for transportation of oil over longer distances and supply of tankers to carry that oil may materially affect our revenues, profitability and cash flows. A significant partportion of our vessels are currently exposed to the spot market. Every increase (decrease) of $1,000 on a spot tanker freight market (VLCC and Suezmax) per day would have increased (decreased) profit or loss by $13.4$19.6 million in 2017 (2016: $14.12020 (2019: $22.6 million).
For further information, please see Note 1819 to our consolidated financial statements included herein.
ITEM 12. DESCRIPTION OF SECURITIES OTHER THAN EQUITY SECURITIES
Not applicable.
PART II
ITEM 13. DEFAULTS, DIVIDEND ARREARAGES AND DELINQUENCIES
None.
ITEM 14. MATERIAL MODIFICATIONS TO THE RIGHTS OF SECURITY HOLDERS AND USE OF PROCEEDS
None.
ITEM 15. CONTROLS AND PROCEDURES
(a)Disclosure of controls and procedures.
We evaluated the effectiveness of the Company's disclosure controls and procedures (as defined in Rules 13a-15(e) and 15d-15(e) under the Exchange Act) as of December 31, 2017.2020. Based on that evaluation, our Principal Executive Officer and Principal Financial Officer concluded that our disclosure controls and procedures were effective to provide reasonable assurance that the information required to be disclosed by the Company in reports filed under the Exchange Act is recorded, processed, summarized and reported within the time periods specified in the SEC's rules and forms. There are inherent limitations to the effectiveness of any system of disclosure controls and procedures, including the possibility of human error and the circumvention or overriding of the controls and procedures. Accordingly, even effective disclosure controls and procedures can only provide reasonable assurance of achieving their control objectives.
(b)Management's annual report on internal control over financial reporting.
In accordance with Rule 13a-15(f) and Rule 15d-15(f) of the Exchange Act, the management of the Company is responsible for the establishment and maintenance of adequate internal controls over financial reporting for the Company. Internal control over financial reporting is a process designed to provide reasonable assurance regarding the reliability of financial reporting and the preparation of financial statements for external purposes in accordance with generally accepted accounting principles.IFRS as issued by the IASB. The Company's system of internal control over financial reporting includes those policies and procedures that (i) pertain to the maintenance of records that, in reasonable detail, accurately and fairly reflect the transactions and dispositions of the assets of the Company; (ii) provide reasonable assurance that transactions are recorded as necessary to permit preparation of financial statements in accordance with generally accepted accounting principles, and that receipts and expenditures of the Company are being made only in accordance with authorizations of management and directors of the Company; and (iii) provide reasonable assurance regarding prevention or timely detection of unauthorized acquisition, use, or disposition of the Company's assets that could have a material effect on the financial statements. Management has performed an assessment of the effectiveness of the Company's internal controls over financial reporting as of December 31, 20172020 based on the provisions of Internal Control—Integrated Framework issued by the Committee of Sponsoring Organizations of the Treadway Commission, or COSO, in 2013. Based on our assessment, management determined that the Company's internal controls over financial reporting were effective as of December 31, 20172020 based on the criteria in Internal Control—Integrated Framework issued by COSO (2013).
(c)Attestation report of the registered public accounting firm.
The attestation report of the registered public accounting firm is presented on page F-2 of the financial statements as filed as part of this annual report.
(d)Changes in internal control over financial reporting.
There were no changes in our internal controls over financial reporting that occurred during the period covered by this annual report that have materially affected, or are reasonably likely to materially affect, our internal control over financial reporting.
ITEM 16A. AUDIT COMMITTEE FINANCIAL EXPERT
In accordance with the rules of the NYSE, the U.S. exchange on which our ordinary shares are listed, we have appointed an audit committee, referred to as Audit and Risk Committee, whose members as of December 31, 20172020 are Ms. Monsellato, as Chairman, Mr. Steen, Mr. Thomson and Mr. Bradshaw.Ms. Odedra. Our Supervisory Board has determined that Ms. Monsellato has been determined to be ais an audit committee financial expert, by our board of directorsas such term is defined under U.S. securities laws, and independent, as thatsuch term is defined inunder the listing standards ofU.S. securities laws and the NYSE.NYSE rules and regulations.
ITEM 16B. CODE OF ETHICS
We have adopted a code of conduct that applies to our principal executive officer, principal financial officer, principal accounting officerdirectors, officers, employees and certain persons performing similar functions. A copy of our code of conduct has been filed as an exhibit to our annual report on Form 20-F for the fiscal year ended December 31, 2014 and is also available on our website at www.euronav.com. We will also provide a hard copy of our code of conduct free of charge upon written request of a shareholder.
Shareholders may also request a copy of our code of conduct at no cost, by writing or telephoning us at the following address:
Euronav NV
De Gerlachekaai 20, 2000 Antwerpen
Belgium
Telephone: 011-32-3-247-4411
ITEM 16C. PRINCIPAL ACCOUNTING FEES AND SERVICES
Our principal accountants for the years ended December 31, 20172020 and 20162019 were KPMG Bedrijfsrevisoren—Réviseurs d' Entreprises Burg. CVBABV/SRL (KPMG). The following table sets forth the fees related to audit, tax and other services provided by KPMG.
| | | (in U.S. dollars) | | December 31, 2017 | | December 31, 2016 | (in U.S. dollars) | | December 31, 2020 | | December 31, 2019 |
| Audit fees | | 870,324 |
| | 966,733 |
| Audit fees | | 1,004,738 | | | 965,016 | |
| Audit-related fees | | 7,987 |
| | 28,559 |
| Audit-related fees | | 56,839 | | | — | |
| Taxation fees | | 22,104 |
| | 17,642 |
| Taxation fees | | 798 | | | 728 | |
| All other fees | | — |
| | — |
| All other fees | | 19,634 | | | 20,151 | |
| Total | | 900,415 |
| | 1,012,934 |
| Total | | 1,082,009 | | | 985,895 | |
Audit Fees
Audit fees are fees billed for the audit of our annual financial statements or for services that are normally provided by our independent audit firms in connection with our statutory and regulatory filings and engagements (as applicable) services that provide assurance on the fair presentation of financial statements and generally encompass the following specific elements:
•An audit opinion on our consolidated financial statements and our internal controls over financial reporting;statements;
•An audit opinion on the statutory financial statements of individual companies within our consolidated group of companies, where legally required;
•A review opinion on interim financial statements; and
•In general, any opinion assigned to the statutory auditor by local legislation or regulations.
Audit-Related Fees
Audit-related fees are fees not included in Audit Fees for assurance or other related work traditionally provided to us by our independent external audit firms in their role as statutory auditors.auditors and which are reasonably related to the performance of the audit or review of our financial statements. These services generally include, among others, audits of employee benefit plan audits, due diligence related to mergers and acquisitions, accounting consultations and audits in connection with acquisitions, internal control reviews, attest services related to financial reporting that are not required by statute or regulation, work performed in connection with registration statements such as due diligence procedures or issuances of comfort letters and consultation concerning financial accounting and reporting standards. usually result in a certification or specific opinion on an investigation or specific procedures applied, and include opinion/audit reports on information provided by us at the request of a third party (for example, prospectuses, comfort letters). More specifically the audit related services for Euronav are related to issuance of a limited assurance report by the statutory auditor on a statement of assets and liabilities of Euronav NV in the context of the payment of an interim dividend — Pursuant to Article 7:213 of the Belgian Companies and Associations Code( BCAC),and under the conditions set forth in the BCAC.
Tax Fees
Tax fees in 20172020 and 20162019 were related to tax compliance services.
The other fees are related to services in connection with EMIR Agreed upon Procedures support.
ITEM 16D. EXEMPTIONS FROM LISTING STANDARDS FOR AUDIT COMMITTEES
None.
ITEM 16E. PURCHASES OF EQUITY SECURITIES BY THE ISSUER AND AFFILIATED PURCHASES
none | | | | | | | | | | | | | | | | | |
| 2020 | Total number of shares purchased | Average Price Paid per share in € | Total Price Paid in € | Average Price Paid per share in $ | Total Price Paid in $ |
| June 30, 2020 | 300,000 | | 7.1464 | | 2,143,920 | | 7.9582 | | 2,387,469 | |
| June 30, 2020 * | 350,000 | | N/A | N/A | 8.0165 | | 2,805,775 | |
| July 1, 2020 | 350,000 | | 7.2917 | | 2,552,095 | | 8.1652 | | 2,857,836 | |
| July 1, 2020 * | 25,000 | | N/A | N/A | 8.2611 | | 206,528 | |
| July 2, 2020 | 7,500 | | 7.3650 | | 55,238 | | 8.2473 | | 61,855 | |
| July 2, 2020 | 320,000 | | 7.3013 | | 2,336,416 | | 8.1760 | | 2,616,319 | |
| July 2, 2020 * | 196,608 | | N/A | N/A | 8.2005 | | 1,612,284 | |
| July 3, 2020 | 100,000 | | 7.3490 | | 734,900 | | 8.2294 | | 822,941 | |
| July 6, 2020 | 330,000 | | 7.4754 | | 2,466,882 | | 8.3710 | | 2,762,414 | |
| July 6, 2020 * | 125,000 | | N/A | N/A | 8.4432 | | 1,055,400 | |
| July 7, 2020 | 300,000 | | 7.6626 | | 2,298,780 | | 8.5806 | | 2,574,174 | |
| July 7, 2020 * | 175,000 | | N/A | N/A | 8.4995 | | 1,487,413 | |
| July 8, 2020 | 250,000 | | 7.5914 | | 1,897,850 | | 8.5008 | | 2,125,212 | |
| July 8, 2020 * | 300,000 | | N/A | N/A | 8.6671 | | 2,600,130 | |
| July 9, 2020 | 250,000 | | 7.5395 | | 1,884,875 | | 8.4427 | | 2,110,683 | |
| July 9, 2020 * | 300,000 | | N/A | N/A | 8.4427 | | 2,532,810 | |
| July 14, 2020 | 150,000 | | 7.8959 | | 1,184,385 | | 8.8418 | | 1,326,274 | |
| July 14, 2020 * | 150,000 | | N/A | N/A | 9.0647 | | 1,359,705 | |
| July 15, 2020 | 250,000 | | 7.9866 | | 1,996,650 | | 8.9434 | | 2,235,849 | |
| July 15, 2020 * | 128,392 | | N/A | N/A | 9.2662 | | 1,189,706 | |
| July 17, 2020 * | 65,000 | | N/A | N/A | 9.1824 | | 596,856 | |
| July 20, 2020 | 250,000 | | 8.0367 | | 2,009,175 | | 8.9995 | | 2,249,874 | |
| July 20, 2020 * | 200,000 | | N/A | N/A | 9.3322 | | 1,866,440 | |
| July 21, 2020 | 246,937 | | 8.1185 | | 2,004,758 | | 9.0911 | | 2,244,928 | |
| July 21, 2020 * | 200,000 | | N/A | N/A | 9.3353 | | 1,867,060 | |
| July 22, 2020 | 243,063 | | 8.0155 | | 1,948,271 | | 8.9758 | | 2,181,674 | |
| July 22, 2020 * | 125,000 | | N/A | N/A | 9.2948 | | 1,161,850 | |
| July 23, 2020 | 300,000 | | 8.0100 | | 2,403,000 | | 8.9696 | | 2,690,879 | |
| July 23, 2020 * | 200,000 | | N/A | N/A | 9.4022 | | 1,880,440 | |
| July 24, 2020 | 230,000 | | 8.1417 | | 1,872,591 | | 9.1171 | | 2,096,927 | |
| July 24, 2020 * | 225,000 | | N/A | N/A | 9.5000 | | 2,137,500 | |
| July 27, 2020 | 150,000 | | 8.0508 | | 1,207,620 | | 9.0153 | | 1,352,293 | |
| July 27, 2020 * | 100,000 | | N/A | N/A | 9.4940 | | 949,400 | |
| July 28, 2020 | 200,000 | | 8.2130 | | 1,642,600 | | 9.1969 | | 1,839,383 | |
| July 28, 2020 * | 200,000 | | N/A | N/A | 9.6694 | | 1,933,880 | |
| July 29, 2020 | 60,500 | | 8.3891 | | 507,541 | | 9.3941 | | 568,344 | |
| July 29, 2020 | 12,000 | | 8.4750 | | 101,700 | | 9.4903 | | 113,884 | |
| July 29, 2020 * | 135,000 | | N/A | N/A | 9.8714 | | 1,332,639 | |
| July 30, 2020 | 225,000 | | 8.2793 | | 1,862,843 | | 9.2712 | | 2,086,011 | |
| July 30, 2020 * | 175,000 | | N/A | N/A | 9.7243 | | 1,701,753 | |
| July 31, 2020 | 125,000 | | 8.2432 | | 1,030,400 | | 9.2307 | | 1,153,842 | |
| July 31, 2020 * | 125,000 | | N/A | N/A | 9.7227 | | 1,215,338 | |
| August 3, 2020 | 245,675 | | 8.3178 | | 2,043,476 | | 9.8549 | | 2,421,110 | |
| August 3, 2020 * | 66,309 | | N/A | N/A | 9.7081 | | 643,734 | |
| August 18, 2020 * | 200,000 | | N/A | N/A | 9.7939 | | 1,958,780 | |
| | | | | | | | | | | | | | | | | |
| August 19, 2020 | 60,000 | | 8.0702 | | 484,212 | | 9.5616 | | 573,694 | |
| August 19, 2020 * | 40,000 | | N/A | N/A | 9.454 | | 378,160 | |
| August 20, 2020 | 70,000 | | 7.8509 | | 549,563 | | 9.3017 | | 651,122 | |
| August 20, 2020 * | 30,000 | | N/A | N/A | 9.4925 | | 284,775 | |
| August 21, 2020 | 60,000 | | 7.9336 | | 476,016 | | 9.3997 | | 563,984 | |
| August 21, 2020 * | 40,000 | | N/A | N/A | 9.4128 | | 376,512 | |
| August 24, 2020 | 17,173 | | 7.9859 | | 137,142 | | 9.4617 | | 162,486 | |
| August 27, 2020 | 100,000 | | 7.8112 | | 781,120 | | 9.2547 | | 925,471 | |
| August 27, 2020 * | 50,000 | | N/A | N/A | 9.1288 | | 456,440 | |
| August 31, 2020 | 50,000 | | 7.6618 | | 383,090 | | 9.0777 | | 453,885 | |
| September 1, 2020 | 100,000 | | 7.6058 | | 760,580 | | 9.0813 | | 908,133 | |
| September 1, 2020 * | 50,000 | | N/A | N/A | 9.055 | | 452,750 | |
| September 2, 2020 * | 50,000 | | N/A | N/A | 8.7041 | | 435,205 | |
| September 9, 2020 | 50,000 | | 7.7069 | | 385,345 | | 9.202 | | 460,102 | |
| September 9, 2020 * | 30,000 | | N/A | N/A | 9.2015 | | 276,045 | |
| September 10, 2020 | 50,000 | | 7.7461 | | 387,305 | | 9.2488 | | 462,442 | |
| September 10, 2020 * | 30,000 | | N/A | N/A | 9.2480 | | 277,440 | |
| September 11, 2020 | 200,000 | | 8.0692 | | 1,613,840 | | 9.6346 | | 1,926,925 | |
| September 11, 2020 * | 150,000 | | N/A | N/A | 9.6929 | | 1,453,935 | |
| September 14, 2020 | 150,000 | | 8.2193 | | 1,232,895 | | 9.8138 | | 1,472,077 | |
| September 14, 2020 * | 150,000 | | N/A | N/A | 9.7434 | | 1,461,510 | |
| September 15, 2020 | 75,000 | | 8.2434 | | 618,255 | | 9.8426 | | 738,196 | |
| September 15, 2020 * | 75,000 | | N/A | N/A | 9.6172 | | 721,290 | |
| September 16, 2020 | 50,000 | | 8.186 | | 409,300 | | 9.7741 | | 488,704 | |
| September 16, 2020 * | 50,000 | | N/A | N/A | 9.7001 | | 485,005 | |
| September 17, 2020 | 50,000 | | 8.214 | | 410,700 | | 9.8075 | | 490,376 | |
| September 17, 2020 * | 50,000 | | N/A | N/A | 9.6564 | | 482,820 | |
| September 25, 2020 | 50,000 | | 7.6009 | | 380,045 | | 9.0755 | | 453,774 | |
| September 25, 2020 * | 50,000 | | N/A | N/A | 8.8731 | | 443,655 | |
| September 28, 2020 | 50,000 | | 7.5547 | | 377,735 | | 9.0203 | | 451,016 | |
| September 28, 2020 * | 50,000 | | N/A | N/A | 8.7182 | | 435,910 | |
| September 29, 2020 | 100,000 | | 7.4817 | | 748,170 | | 8.9331 | | 893,315 | |
| September 29, 2020 * | 100,000 | | N/A | N/A | 8.7540 | | 875,400 | |
| September 30, 2020 | 100,000 | | 7.5357 | | 753,570 | | 8.9976 | | 899,763 | |
| September 30, 2020 * | 84,500 | | N/A | N/A | 8.8812 | | 750,461 | |
| November 20, 2020 * | 52,207 | | N/A | N/A | 7.9662 | | 415,891 | |
| November 30, 2020 | 75,000 | | 6.6566 | | 499,245 | | 7.7869 | | 584,017 | |
| November 30, 2020 * | 75,000 | | N/A | N/A | 7.9274 | | 594,555 | |
| December 1, 2020 | 75,000 | | 6.6456 | | 498,420 | | 7.9614 | | 597,107 | |
| December 1, 2020 * | 75,000 | | N/A | N/A | 7.8274 | | 587,055 | |
| December 2, 2020 | 58,589 | | 6.4714 | | 379,153 | | 7.7527 | | 454,225 | |
| December 2, 2020 * | 75,000 | | N/A | N/A | 7.8973 | | 592,298 | |
| December 3, 2020 | 75,000 | | 6.4716 | | 485,370 | | 7.7530 | | 581,473 | |
| December 3, 2020 * | 75,000 | | N/A | N/A | 7.9357 | | 595,178 | |
| December 4, 2020 | 59,063 | | 6.6456 | | 392,509 | | 7.9614 | | 470,226 | |
| December 8, 2020 | 100,000 | | 6.7664 | | 676,640 | | 8.1061 | | 810,615 | |
| December 8, 2020 * | 100,000 | | N/A | N/A | 8.1015 | | 810,150 | |
| December 9, 2020 | 100,000 | | 6.8993 | | 689,930 | | 8.2654 | | 826,536 | |
| December 10, 2020 | 100,000 | | 6.9177 | | 691,770 | | 8.2874 | | 828,740 | |
| | | | | | | | | | | | | | | | | |
| December 10, 2020 * | 100,000 | | N/A | N/A | 8.4892 | | 848,920 | |
| December 11, 2020 | 100,000 | | 6.8979 | | 689,790 | | 8.2637 | | 826,368 | |
| December 11, 2020 * | 100,000 | | N/A | N/A | 8.2104 | | 821,040 | |
| December 14, 2020 | 100,000 | | 6.7909 | | 679,090 | | 8.1355 | | 813,550 | |
| December 14, 2020 * | 100,000 | | N/A | N/A | 8.2307 | | 823,070 | |
| December 15, 2020 | 100,000 | | 6.8102 | | 681,020 | | 8.1586 | | 815,862 | |
| December 15, 2020 * | 100,000 | | N/A | N/A | 8.3982 | | 839,820 | |
| December 16, 2020 | 100,000 | | 6.8372 | | 683,720 | | 8.1910 | | 819,097 | |
| December 16, 2020 * | 100,000 | | N/A | N/A | 8.3833 | | 838,330 | |
| December 17, 2020 | 100,000 | | 6.7344 | | 673,440 | | 8.0678 | | 806,781 | |
| December 17, 2020 * | 100,000 | | N/A | N/A | 8.2831 | | 828,310 | |
| December 18, 2020 | 82,000 | | 6.7201 | | 551,048 | | 8.0507 | | 660,156 | |
| Total | 13,400,516 | | | | | 118,487,744 | |
* shares purchased on the NYSE in USD.
ITEM 16F. CHANGE IN REGISTRANT'S CERTIFYING ACCOUNTANT
None.
ITEM 16G. CORPORATE GOVERNANCE
Pursuant to an exception for foreign private issuers, we, as a Belgian company, are not required to comply with the corporate governance practices followed by U.S. companies under the NYSE listing standards.rules and regulations. Set forth below is a list of what we believe to be the significant differences between our corporate governance practices and those differences.applicable to U.S. companies under the NYSE rules and regulations.
Independence of Directors. The NYSE requires that a U.S. listed company maintain a majority of independent directors. Our Supervisory Board of Directors currently consists of seven directors,six members, five of which are considered "independent" according to NYSE's standards for independence. However, as permitted under Belgian law, our Supervisory Board of Directors may in the future not consist of a majority of independent directors. members.
Executive Sessions. The NYSE requires that Supervisory Board Members meet regularly in executive sessions without presence of the Management Board. The NYSE also requires that all independent directors meet in an executive session at least once a year. As permitted under Belgian law, closed sessions of our Supervisory Board may comprise both independent and non-independent Supervisory Board members.
Compensation Committee and Nominating/Corporate Governance Committee. The NYSE requires that a listed U.S. company have a compensation committee and a nominating/corporate governance committee of independent directors. As permitted under Belgian law, our Remuneration Committee, unlike the Company's Corporate Governance and Nomination Committee, does not currently, and may not in the future, consist entirely of independent directors.members. Nevertheless, in accordance with Belgian corporate law our Remuneration Committeeand corporate governance standards, both Committees must at all times maintain a majority of independent directorsmembers (in accordance with Belgian independence standards).
Audit Committee. The NYSE requires, among other things, that a listed U.S. company have an audit committee comprised of a minimum of three entirely independent directors.directors, who are all independent. Under Belgian law, our Audit and Risk Committee need not be comprised of three entirely independent directors,members, but it must at all times havecount among its members at least one independent directormember (in accordance with Belgian independence standards). Although we are not required to do so under the NYSE rules and Rule 10A-3 under the Exchange Act, our Audit and Risk Committee is currently comprised of fourthree independent directorsmembers in accordance with the Exchange Act and NYSE rules three of whom are independentas well as according to Belgian independence standards.
Corporate Governance Guidelines. The NYSE requires U.S. companies to adopt and disclose corporate governance guidelines. The guidelines must address, among other things: director qualification standards, director responsibilities, director access to management and independent advisers, director compensation, director orientation and continuing education, management succession and an annual performance evaluation. We are not required to adopt such guidelines, under Belgian law, but we have adopted a corporate governance charter in compliance with Belgian law requirements.
Shareholder Approval of Securities Issuances. The NYSE requires that a listed U.S. company obtain the approval of its shareholders prior to issuances of securities under certain circumstances. In lieu of this requirement, we have elected to follow applicable practices under the laws of BelgianBelgium for authorizing issuances of securities.
Proxies. As a foreign private issuer, we are not required to solicit proxies or provide proxy statements in connection with meetings of the Company’s shareholders as required by U.S. companies under the NYSE listing rules and regulations. As provided in our Coordinated Articles of Association, the designation of a proxy holder by a shareholder will occur as stated in the convening notice for the respective meeting of shareholders. The Supervisory Board of the Company may decide on the form of the proxies and may stipulate that the same be deposited at the place it indicates, within the period it fixes and that no other forms will be accepted.
Information about our corporate governance practices may also be found on our website, http://www.euronav.com, in the section "Investors" under "Corporate Governance." The information contained on our website does not form a part of this annual report.
ITEM 16H. MINE SAFETY DISCLOSURE
Not applicable.
PART III
ITEM 17. FINANCIAL STATEMENTS
See "Item 18. Financial Statements."
ITEM 18. FINANCIAL STATEMENTS
The financial statements, together with the report of KPMG Bedrijfsrevisoren—Réviseurs d'Entreprises Burg. CVBABV/SRL (KPMG) thereon, are set forth on page F-2 and are filed as a part of this report.
ITEM 19. EXHIBITS
| | | | | | | | |
| Exhibit Number | Description | |
| |
Exhibit Number | Description |
| |
| 1.1 | | |
| | |
| 2.1 | | |
| | |
4.12.2 | | |
| | |
| 4.1 | | |
| | |
| 4.2 | | |
| | |
| 4.3 | | |
| | |
| 4.4 | | |
| | |
| 4.5 | |
|
| |
| |
4.64.7 | |
| |
4.7 | | |
| | |
| 4.8 | | |
| | |
4.104.9 | | |
| | |
| 4.10 | | |
| | |
| 4.11 | | |
| | |
| 4.12 | | |
| | |
| 4.13 | | |
| | |
| 4.14 |
| |
| | |
| 4.15 |
| |
| | |
| 4.16 |
| |
| | |
| 4.17 | | |
| | |
| 4.18 | | |
| | |
| 4.19 | | |
| | |
| 4.20 | | |
| | |
| | | | | | | | |
| 4.21 | | |
| | |
| 4.22 | | |
| | |
| 4.23 | | |
| | |
| 4.24 | | |
| | |
| 4.25 | | |
| | |
| 4.26 | | |
| | |
| 4.27 | |
| |
|
| | |
| 4.28 | | |
| | |
| 4.29 | | |
| | |
| 4.30 | | |
| | |
| 4.31 | | |
| | |
| 4.32 | | |
| | |
8.14.33 | | |
| | |
| 4.34 | | |
| | |
| 4.35 | | |
| | |
| 4.36 | | |
| | |
| 4.37 | | |
| | |
| 4.38 | | |
| | |
| 4.39 | | |
| | |
| 4.40 | | |
| | |
| 4.41 | | |
| | | | | | | | |
| | |
| 4.42 | | |
| | |
| 8.1 | | |
| | |
| 11.1 | | |
| | |
| 12.1 | | |
| | |
| 12.2 | | |
| | |
| 13.1 | | |
| | |
| 13.2 | | |
| | |
| 15.1 | | |
| | |
| 15.2 | | |
| | |
| 15.3 | | |
| | |
| 15.4 | | |
| | |
| 15.5 | | |
| | |
| 101 | The following financial information from the registrant's annual report on Form 20-F for the fiscal year ended December 31, 2017,2019, formatted in Extensible Business Reporting Language (XBRL): | |
| (1) Consolidated Statement of Financial Position as of December 31, 2017, 20162020, 2019 and 20152018 | |
| (2) Consolidated Statement of Profit or Loss for the years ended December 31, 2017, 20162020, 2019 and 20152018 | |
| (3) Consolidated Statement of Comprehensive Income as of December 31, 2017, 20162020, 2019 and 20152018 | |
| (4) Consolidated Statements of Changes in Equity as of December 31, 2017, 20162020, 2019 and 20152018 | |
| (5) Consolidated Statements of Cash Flows for the years ended December 31, 2017, 20162020, 2019 and 20152018 | |
| (6) Notes to the Consolidated Financial Statements. | |
| |
(1) | Filed as an exhibit to the Company's Registration Statement on Form F-1, Registration No. 333-198625 and incorporated by reference herein. |
| |
(2) | Filed as an exhibit to the Company's Annual Report on Form 20-F for the year ended December 31, 2014 and incorporated by reference herein. |
| |
(3) | Filed as an exhibit to the Company's Annual Report on Form 20-F for the year ended December 31, 2015 and incorporated by reference herein. |
(1)Filed as an exhibit to the Company's Registration Statement on Form F-1, Registration No. 333-198625 and incorporated by reference herein.
| |
(4) | Filed as an exhibit to the Company’s Annual Report on Form 20-F for the year ended December 31, 2016 and incorporated by reference herein. |
| |
(5) | Filed as an exhibit to the Company’s Report of Foreign Private Issuer on Form 6-K filed with the SEC on December 22, 2017 and incorporated by reference herein. |
| |
(6) | Filed as an exhibit to the Company's Registration Statement on Form F-4, Registration No. 333-223039 and incorporated by reference herein. |
(2)Filed as an exhibit to the Company's Annual Report on Form 20-F for the year ended December 31, 2014 and incorporated by reference herein.
(3)Filed as an exhibit to the Company's Annual Report on Form 20-F for the year ended December 31, 2015 and incorporated by reference herein.
(4)Filed as an exhibit to the Company’s Annual Report on Form 20-F for the year ended December 31, 2016 and incorporated by reference herein.
(5)Filed as an exhibit to the Company’s Report of Foreign Private Issuer on Form 6-K filed with the SEC on December 22, 2017 and incorporated by reference herein.
(6)Filed as an exhibit to the Company's Registration Statement on Form F-4, Registration No. 333-223039 and incorporated by reference herein.
(7)Filed as an exhibit to the Company’s Annual Report on Form 20-F for the year ended December 31, 2017 and incorporated by reference herein.
(8)Filed as an exhibit to the Company’s Annual Report on Form 20-F for the year ended December 31, 2018 and incorporated by reference herein.
(9)Filed as an exhibit to the Company’s Annual Report on Form 20-F for the year ended December 31, 2019 and incorporated by reference herein.
SIGNATURES
The registrant hereby certifies that it meets all of the requirements for filing on Form 20-F and that it has duly caused and authorized the undersigned to sign this annual report on its behalf.
|
| | | | | | | |
| EURONAV NV |
| | |
| | |
| | |
| By: | /s/ Hugo De StoopLieve Logghe |
| | Name: Hugo De Stoop Lieve Logghe
Title: Chief Financial Officer |
Date: April 17, 201815, 2021 | | |
INDEX TO CONSOLIDATED FINANCIAL STATEMENTS
EURONAV NV
NOTES TO CONSOLIDATED FINANCIAL STATEMENTS 2017
Report of Independent Registered Public Accounting Firm
To the Shareholders and Supervisory Board of Directors
Euronav NV:
Opinions on the Consolidated Financial Statements and Internal Control Over Financial Reporting
We have audited the accompanying consolidated statementsstatement of financial position of Euronav NV and subsidiaries (the Company) as of December 31, 20172020 and 2016,2019, the related consolidated statements of profit or loss, comprehensive income, changes in equity and cash flows for each of the years in the three-year period ended December 31, 2017,2020, and the related notes (collectively, the consolidated financial statements). We also have audited the Company’s internal control over financial reporting as of December 31, 2017,2020, based on criteria established in Internal Control -– Integrated Framework (2013) issued by the Committee of Sponsoring Organizations of the Treadway Commission.
In our opinion, the consolidated financial statements referred to above present fairly, in all material respects, the financial position of the Company as of December 31, 20172020 and 2016,2019, and the results of its operations and its cash flows for each of the years in the three-yearthree year period ended December 31, 2017,2020, in conformity with International Financial Reporting Standards as issued by the International Accounting Standards Board. Also in our opinion, the Company maintained, in all material respects, effective internal control over financial reporting as of December 31, 2017,2020 based on criteria established in Internal Control -– Integrated Framework (2013) issued by the Committee of Sponsoring Organizations of the Treadway Commission.
Changes in Accounting Principle
As discussed in Note 1 to the consolidated financial statements, the Company changed its method of accounting for leases effective January 1, 2019 due to the adoption of International Financial Reporting Standard 16 Leases.
Basis for Opinions
The Company’s management is responsible for these consolidated financial statements, for maintaining effective internal control over financial reporting, and for its assessment of the effectiveness of internal control over financial reporting, included in the accompanying Management’s Annual Reportmanagement’s annual report on Internal Controlinternal control over Financial Reporting.financial reporting. Our responsibility is to express an opinion on the Company’s consolidated financial statements and an opinion on the Company’s internal control over financial reporting based on our audits. We are a public accounting firm registered with the Public Company Accounting Oversight Board (United States) (PCAOB) and are required to be independent with respect to the Company in accordance with the U.S. federal securities laws and the applicable rules and regulations of the Securities and Exchange Commission and the PCAOB.
We conducted our audits in accordance with the standards of the PCAOB. Those standards require that we plan and perform the audits to obtain reasonable assurance about whether the consolidated financial statements are free of material misstatement, whether due to error or fraud, and whether effective internal control over financial reporting was maintained in all material respects.
Our audits of the consolidated financial statements included performing procedures to assess the risks of material misstatement of the consolidated financial statements, whether due to error or fraud, and performing procedures that respond to those risks. Such procedures included examining, on a test basis, evidence regarding the amounts and disclosures in the consolidated financial statements. Our audits also included evaluating the accounting principles used and significant estimates made by management, as well as evaluating the overall presentation of the consolidated financial statements. Our audit of internal control over financial reporting included obtaining an understanding of internal control over financial reporting, assessing the risk that a material weakness exists, and testing and evaluating the design and operating effectiveness of internal control based on the assessed risk. Our audits also included performing such other procedures as we considered necessary in the circumstances. We believe that our audits provide a reasonable basis for our opinions.
Definition and Limitations of Internal Control Over Financial Reporting
A company’s internal control over financial reporting is a process designed to provide reasonable assurance regarding the reliability of financial reporting and the preparation of financial statements for external purposes in accordance with International Financial Reporting Standards as issued by the International Accounting Standards Board.generally accepted accounting principles. A company’s internal control over financial reporting
includes those policies and procedures that (1) pertain to the maintenance of records that, in reasonable detail, accurately and fairly reflect the transactions and dispositions of the assets of the company; (2) provide reasonable assurance that transactions are recorded as necessary to permit preparation of financial statements in accordance with International Financial Reporting Standards as issued by the International Accounting Standards Board,generally accepted accounting principles, and that receipts and expenditures of the company are being made only in accordance with authorizations of management and directors of the company; and (3) provide reasonable assurance regarding prevention or timely detection of unauthorized acquisition, use, or disposition of the company’s assets that could have a material effect on the financial statements.
EURONAV NV
NOTES TO CONSOLIDATED FINANCIAL STATEMENTS 2017
Because of its inherent limitations, internal control over financial reporting may not prevent or detect misstatements. Also, projections of any evaluation of effectiveness to future periods are subject to the risk that controls may become inadequate because of changes in conditions, or that the degree of compliance with the policies or procedures may deteriorate.
Critical Audit Matter
The critical audit matter communicated below is a matter arising from the current period audit of the consolidated financial statements that was communicated or required to be communicated to the audit committee and that: (1) relates to accounts or disclosures that are material to the consolidated financial statements and (2) involved our especially challenging, subjective, or complex judgments. The communication of a critical audit matter does not alter in any way our opinion on the consolidated financial statements, taken as a whole, and we are not, by communicating the critical audit matter below, providing separate opinions on the critical audit matter or on the accounts or disclosures to which it relates.
Assessment of impairment indicators and carrying value for vessels in the Tankers segment
As discussed in Note 2 to the consolidated financial statements, the net carrying value of vessels in the Tankers segment (vessels and vessels in assets under construction and in right of use assets) as of December 31, 2020 was $3.1 billion, representing 85% of the Group’s total assets. As discussed in Note 1 and Note 8, at each reporting date, the Group evaluates the carrying value of vessels for impairment at the level of the cash generating unit (CGU), by identifying events or changes in circumstances that indicate the carrying value of these CGUs may not be recoverable. The Group identified two impairment indicators for its CGU’s included in the Tankers segment: (1) the significant drop in market rates and (2) the very low share price of the Group. The Group subsequently performed its annual impairment tests for each CGU in its Tankers segment, considering management’s estimates and assumptions such as vessel values, expected future charter rates, earnings from the vessels, forecasted vessel operating expenses, weighted average cost of capital (WACC) and economic life of vessels. The Group concluded that the recoverable amount (value in use - VIU) of each defined CGU in its Tankers segment exceeded the CGU’s carrying value as of December 31, 2020 and consequently, that no impairment loss needed to be recorded as of December 31, 2020.
We identified the assessment of impairment indicators and carrying value of vessels included in the Tankers segment as a critical audit matter. The Group's evaluation of the existence of impairment indicators considers both internal and external data, such as vessel and crude oil supply and demand trends, and changes in the extent and manner in which vessels are expected to be used. The assessment of the impact of these indicators on each CGU requires a high degree of auditor judgment. This is due to the existence of unobservable information and the unpredictability of global macroeconomic and geopolitical conditions affecting freight rates over the CGU’s useful life. There is also a high degree of auditor judgment involved in evaluating certain key assumptions such as the WACC, expected future charter rates and forecasted vessel operating expenses applied in determining the VIU of the vessels.
The following are the primary procedures we performed to address this critical audit matter:
•We evaluated the design and tested the operating effectiveness of certain internal controls related to the vessel impairment process. This included controls related to the assessment of the impact of internal and external impairment indicators, such as vessel and crude oil supply and demand trends and changes in the extent and manner in which vessels are expected to be used. This also included controls related to certain key assumptions used by management in determining the VIU of the vessels, such as the WACC, expected future charter rates and forecasted vessel operating expenses;
•We evaluated the information and assumptions used by the Group in its assessment of the existence of impairment indicators by comparing information such as vessel and crude oil supply and demand trends, and changes in the extent and manner in which vessels are expected to be used, to historical information, external third-party information such as brokers’ reports and other industry data as well as to internal data;
•We evaluated the Group’s VIU calculations for each CGU included in the Tankers segment by comparing the assumptions used by the Group with our knowledge of the Group’s business and the industry in which it operates, the Group’s future, current and historical charter rates and vessel operating expenses, third-party industry publications for conventional tankers with similar characteristics and other available observable market information;
•We evaluated the recoverability of the carrying value of each CGU in the Tankers segment by comparing to the average value of two independent broker values;
•We performed a retrospective comparison of historical expected charter rates and vessel operating expenses used in the Group’s VIU calculations to actual charter rates and vessel operating expenses incurred by the Group in prior years;
•We involved valuation professionals with specialized skills and knowledge, who assisted in evaluating the reasonableness of the WACC by developing a range of rates and comparing this to the WACC used by the Group; and
•We performed sensitivity analyses on the WACC and the future charter rates used by the Group to assess the impact of changes to the assumptions, and assess whether there were any indications of management bias in the selection of these assumptions.
/s/ Herwig Carmans
KPMG Bedrijfsrevisoren - BV/Réviseurs d’Entreprises Burg. CVBA
/s/ Götwin Jackers
Bedrijfsrevisor / Réviseur d’Entreprises
SRL
We have served as the Company’s auditor since 2003.
2004.
Zaventem, BELGIUMBelgium
April 17, 201815, 2021
Consolidated Statement of Financial Position
(in thousands of USD)
| | | | | | | | | | | | | | |
| | | December 31, 2020 | | December 31, 2019 |
| ASSETS | | | | |
| Non-current assets | | | | |
| Vessels (Note 8) | | 2,865,308 | | | 3,177,262 | |
| Assets under construction (Note 8) | | 207,069 | | | 0 | |
| Right-of-use assets (Note 8) | | 52,955 | | | 58,908 | |
| Other tangible assets (Note 8) | | 1,759 | | | 2,265 | |
| | | | |
| Intangible assets | | 161 | | | 39 | |
| Receivables (Note 10) | | 55,054 | | | 71,083 | |
| Investments in equity accounted investees (Note 26) | | 51,703 | | | 50,322 | |
| Deferred tax assets (Note 9) | | 1,357 | | | 2,715 | |
| | | | |
| Total non-current assets | | 3,235,366 | | | 3,362,594 | |
| | | | |
| Current assets | | | | |
| Bunker inventory (Note 11) | | 75,780 | | | 183,382 | |
| Non-current assets held for sale (Note 3) | | 0 | | | 12,705 | |
| Trade and other receivables (Note 12) | | 214,479 | | | 308,987 | |
| Current tax assets | | 136 | | | 221 | |
| Cash and cash equivalents (Note 13) | | 161,478 | | | 296,954 | |
| | | | |
| Total current assets | | 451,873 | | | 802,249 | |
| | | | |
| TOTAL ASSETS | | 3,687,239 | | | 4,164,843 | |
| | | | |
| | | | |
| EQUITY and LIABILITIES | | | | |
| | | | |
| Equity | | | | |
| Share capital (Note 14) | | 239,148 | | | 239,148 | |
| Share premium (Note 14) | | 1,702,549 | | | 1,702,549 | |
| Translation reserve | | 935 | | | 299 | |
| Hedging reserve (Note 14) | | (7,456) | | | (4,583) | |
| Treasury shares (Note 14) | | (164,104) | | | (45,616) | |
| Retained earnings | | 540,714 | | | 420,058 | |
| | | | |
| Equity attributable to owners of the Company | | 2,311,786 | | | 2,311,855 | |
| | | | |
| Non-current liabilities | | | | |
| Bank loans (Note 16) | | 836,318 | | | 1,173,944 | |
| Other notes (Note 16) | | 198,279 | | | 198,571 | |
| Other borrowings (Note 16) | | 100,056 | | | 107,978 | |
| Lease liabilities (Note 16) | | 21,172 | | | 43,161 | |
| Other payables (Note 18) | | 6,893 | | | 3,809 | |
| Employee benefits (Note 17) | | 7,987 | | | 8,094 | |
| Provisions (Note 21) | | 1,154 | | | 1,381 | |
| | | | |
| Total non-current liabilities | | 1,171,859 | | | 1,536,938 | |
| | | | |
| Current liabilities | | | | |
| Trade and other payables (Note 18) | | 85,150 | | | 94,408 | |
| Current tax liabilities | | 629 | | | 49 | |
| Bank loans (Note 16) | | 20,542 | | | 49,507 | |
| Other borrowings (Note 16) | | 51,297 | | | 139,235 | |
| Lease liabilities (Note 16) | | 45,749 | | | 32,463 | |
| Provisions (Note 21) | | 227 | | | 388 | |
| | | | |
Consolidated Statement of Financial Position
(in thousands of USD)
|
| | | | | | |
| | | December 31, 2017 | | December 31, 2016 |
| ASSETS | | | | |
| Non-current assets | | | | |
| Vessels (Note 8) | | 2,271,500 |
| | 2,383,163 |
|
| Assets under construction (Note 8) | | 63,668 |
| | 86,136 |
|
| Other tangible assets (Note 8) | | 1,663 |
| | 777 |
|
| Intangible assets | | 72 |
| | 156 |
|
| Receivables (Note 10) | | 160,352 |
| | 183,914 |
|
| Investments in equity accounted investees (Note 25) | | 30,595 |
| | 18,413 |
|
| Deferred tax assets (Note 9) | | 2,487 |
| | 964 |
|
| | | | | |
| Total non-current assets | | 2,530,337 |
| | 2,673,523 |
|
| | | | | |
| Current assets | | |
| | |
|
| Trade and other receivables (Note 11) | | 136,797 |
| | 166,342 |
|
| Current tax assets | | 191 |
| | 357 |
|
| Cash and cash equivalents (Note 12) | | 143,648 |
| | 206,689 |
|
| Non-current assets held for sale (Note 3) | | — |
| | — |
|
| | | | | |
| Total current assets | | 280,636 |
| | 373,388 |
|
| | | | | |
| TOTAL ASSETS | | 2,810,973 |
| | 3,046,911 |
|
| | | | | |
| | | | | |
| EQUITY and LIABILITIES | | | | |
| | | | | |
| Equity | | | | |
| Share capital | | 173,046 |
| | 173,046 |
|
| Share premium | | 1,215,227 |
| | 1,215,227 |
|
| Translation reserve | | 568 |
| | 120 |
|
| Treasury shares (Note 13) | | (16,102 | ) | | (16,102 | ) |
| Retained earnings | | 473,622 |
| | 515,665 |
|
| | | | | |
| Equity attributable to owners of the Company | | 1,846,361 |
| | 1,887,956 |
|
| | | | | |
| Non-current liabilities | | |
| | |
|
| Bank loans (Note 15) | | 653,730 |
| | 966,443 |
|
| Other notes (Note 15) | | 147,619 |
| | — |
|
| Other payables (Note 17) | | 539 |
| | 533 |
|
| Employee benefits (Note 16) | | 3,984 |
| | 2,846 |
|
| Provisions | | — |
| | 38 |
|
| | | | | |
| Total non-current liabilities | | 805,872 |
| | 969,860 |
|
| | | | | |
| Current liabilities | | |
| | |
|
| Trade and other payables (Note 17) | | 61,355 |
| | 69,859 |
|
| Current tax liabilities | | 11 |
| | — |
|
| Bank loans (Note 15) | | 47,361 |
| | 119,119 |
|
| Other borrowings (Note 15) | | 50,010 |
| | — |
|
| Provisions | | 3 |
| | 117 |
|
| | | | | |
| Total current liabilities | | 158,740 |
| | 189,095 |
|
| | | | | |
| TOTAL EQUITY and LIABILITIES | | 2,810,973 |
| | 3,046,911 |
|
| | | | | |
| | | | | | | | | | | | | | |
| Total current liabilities | | 203,594 | | | 316,050 | |
| | | | |
| TOTAL EQUITY and LIABILITIES | | 3,687,239 | | | 4,164,843 | |
| | | | |
The accompanying notes on page F-10F-13 to F-81F-112 are an integral part of these consolidated financial statements.
Consolidated Statement of Profit or Loss
(in thousands of USD except per share amounts)
| | | | | | | | | | | | | | | | | | | | |
| | 2020 | | 2019 | | 2018 * |
| | Jan. 1 - Dec 31, 2020 | | Jan. 1 - Dec 31, 2019 | | Jan. 1 - Dec 31, 2018 |
| Shipping income | | | | | | |
| Revenue (Note 4) | | 1,230,750 | | | 932,377 | | | 600,024 | |
| Gains on disposal of vessels/other tangible assets (Note 8) | | 22,728 | | | 14,879 | | | 19,138 | |
| Other operating income (Note 4) | | 10,112 | | | 10,094 | | | 4,775 | |
| Total shipping income | | 1,263,590 | | | 957,350 | | | 623,937 | |
| | | | | | |
| Operating expenses | | | | | | |
| Voyage expenses and commissions (Note 5) | | (125,430) | | | (144,681) | | | (141,416) | |
| Vessel operating expenses (Note 5) | | (210,634) | | | (211,795) | | | (185,792) | |
| Charter hire expenses (Note 5) | | (7,954) | | | (604) | | | (31,114) | |
| Loss on disposal of vessels/other tangible assets (Note 8) | | (1) | | | (75) | | | (273) | |
| Impairment on non-current assets held for sale (Note 3) | | 0 | | | 0 | | | (2,995) | |
| | | | | | |
| Depreciation tangible assets (Note 8) | | (319,652) | | | (337,646) | | | (270,582) | |
| Depreciation intangible assets | | (99) | | | (56) | | | (111) | |
| General and administrative expenses (Note 5) | | (65,498) | | | (66,890) | | | (66,232) | |
| Total operating expenses | | (729,268) | | | (761,747) | | | (698,515) | |
| | | | | | |
| RESULT FROM OPERATING ACTIVITIES | | 534,322 | | | 195,603 | | | (74,578) | |
| | | | | | |
| Finance income (Note 6) | | 21,496 | | | 20,572 | | | 15,023 | |
| Finance expenses (Note 6) | | (91,553) | | | (119,803) | | | (89,412) | |
| Net finance expenses | | (70,057) | | | (99,231) | | | (74,389) | |
| | | | | | |
| Gain on bargain purchase (Note 25) | | 0 | | | 0 | | | 23,059 | |
| Share of profit (loss) of equity accounted investees (net of income tax) (Note 26) | | 10,917 | | | 16,460 | | | 16,076 | |
| | | | | | |
| PROFIT (LOSS) BEFORE INCOME TAX | | 475,182 | | | 112,832 | | | (109,832) | |
| | | | | | |
| Income tax benefit (expense) (Note 7) | | (1,944) | | | (602) | | | (238) | |
| | | | | | |
| PROFIT (LOSS) FOR THE PERIOD | | 473,238 | | | 112,230 | | | (110,070) | |
| | | | | | |
| Attributable to: | | | | | | |
| Owners of the company | | 473,238 | | | 112,230 | | | (110,070) | |
| | | | | | |
| Basic earnings per share (Note 14) | | 2.25 | | | 0.52 | | | (0.57) | |
| Diluted earnings per share (Note 14) | | 2.25 | | | 0.52 | | | (0.57) | |
| | | | | | |
| Weighted average number of shares (basic) (Note 14) | | 210,193,707 | | | 216,029,171 | | | 191,994,398 | |
| Weighted average number of shares (diluted) (Note 14) | | 210,206,403 | | | 216,029,171 | | | 191,994,398 | |
* The Group initially applied IFRS 16 at January 1, 2019, using the modified retrospective approach. Under this approach, comparative information is not restated. |
| | | | | | | | | |
| | | 2017 | | 2016 | | 2015 |
| | | Jan. 1 - Dec 31, 2017 | | Jan. 1 - Dec 31, 2016 | | Jan. 1 - Dec 31, 2015 |
| Shipping income | | | | | | |
| Revenue (Note 4) | | 513,368 |
| | 684,265 |
| | 846,507 |
|
| Gains on disposal of vessels/other tangible assets (Note 8) | | 36,538 |
| | 50,397 |
| | 13,302 |
|
| Other operating income (Note 4) | | 4,902 |
| | 6,996 |
| | 7,426 |
|
| Total shipping income | | 554,808 |
| | 741,658 |
|
| 867,235 |
|
| | | | | | | |
| Operating expenses | | |
| | |
| | |
|
| Voyage expenses and commissions (Note 5) | | (62,035 | ) | | (59,560 | ) | | (71,237 | ) |
| Vessel operating expenses (Note 5) | | (150,427 | ) | | (160,199 | ) | | (153,718 | ) |
| Charter hire expenses (Note 5) | | (31,173 | ) | | (17,713 | ) | | (25,849 | ) |
| Loss on disposal of vessels/other tangible assets (Note 8) | | (21,027 | ) | | (2 | ) | | (8,002 | ) |
| Impairment on non-current assets held for sale (Note 3) | | — |
| | — |
| | — |
|
| Loss on disposal of investments in equity accounted investees (Note 24) | | — |
| | (24,150 | ) | | — |
|
| Depreciation tangible assets (Note 8) | | (229,777 | ) | | (227,664 | ) | | (210,156 | ) |
| Depreciation intangible assets | | (95 | ) | | (99 | ) | | (50 | ) |
| General and administrative expenses (Note 5) | | (46,868 | ) | | (44,051 | ) | | (46,251 | ) |
| Total operating expenses | | (541,402 | ) | | (533,438 | ) |
| (515,263 | ) |
| | | | | | | |
| RESULT FROM OPERATING ACTIVITIES | | 13,406 |
| | 208,220 |
| | 351,972 |
|
| | | | | | | |
| Finance income (Note 6) | | 7,266 |
| | 6,855 |
| | 3,312 |
|
| Finance expenses (Note 6) | | (50,729 | ) | | (51,695 | ) | | (50,942 | ) |
| Net finance expenses | | (43,463 | ) | | (44,840 | ) |
| (47,630 | ) |
| | | | | | | |
| Share of profit (loss) of equity accounted investees (net of income tax) (Note 25) | | 30,082 |
| | 40,495 |
| | 51,592 |
|
| | | | | | | |
| PROFIT (LOSS) BEFORE INCOME TAX | | 25 |
| | 203,875 |
| | 355,934 |
|
| | | | | | | |
| Income tax benefit (expense) (Note 7) | | 1,358 |
| | 174 |
| | (5,633 | ) |
| | | | | | | |
| PROFIT (LOSS) FOR THE PERIOD | | 1,383 |
| | 204,049 |
| | 350,301 |
|
| | | | | | | |
| Attributable to: | | |
| | |
| | |
|
| Owners of the company | | 1,383 |
| | 204,049 |
| | 350,301 |
|
| | | | | | | |
| Basic earnings per share (Note 14) | | 0.01 |
| | 1.29 |
| | 2.25 |
|
| Diluted earnings per share (Note 14) | | 0.01 |
| | 1.29 |
| | 2.22 |
|
| | | | | | | |
| Weighted average number of shares (basic) (Note 14) | | 158,166,534 |
| | 158,262,268 |
| | 155,872,171 |
|
| Weighted average number of shares (diluted) (Note 14) | | 158,297,057 |
| | 158,429,057 |
| | 157,529,562 |
|
The accompanying notes on page F-10F-13 to F-81F-112 are an integral part of these consolidated financial statements.
Consolidated Statement of Comprehensive Income
(in thousands of USD)
| | | | | | | | | | | | | | | | | | | | |
| | 2020 | | 2019 | | 2018 * |
| | Jan. 1 - Dec 31, 2020 | | Jan. 1 - Dec 31, 2019 | | Jan. 1 - Dec 31, 2018 |
| Profit/(loss) for the period | | 473,238 | | | 112,230 | | | (110,070) | |
| | | | | | |
| Other comprehensive income (expense), net of tax | | | | | | |
| Items that will never be reclassified to profit or loss: | | | | | | |
| Remeasurements of the defined benefit liability (asset) (Note 17) | | (97) | | | (1,223) | | | 120 | |
| | | | | | |
| Items that are or may be reclassified to profit or loss: | | | | | | |
| Foreign currency translation differences (Note 6) | | 636 | | | (112) | | | (157) | |
| Cash flow hedges - effective portion of changes in fair value (Note 14) | | (2,873) | | | (1,885) | | | (2,698) | |
| Equity-accounted investees - share of other comprehensive income (Note 26) | | (2) | | | (720) | | | (459) | |
| | | | | | |
| Other comprehensive income (expense), net of tax | | (2,336) | | | (3,940) | | | (3,194) | |
| | | | | | |
| Total comprehensive income (expense) for the period | | 470,902 | | | 108,290 | | | (113,264) | |
| | | | | | |
| Attributable to: | | | | | | |
| Owners of the company | | 470,902 | | | 108,290 | | | (113,264) | |
|
| | | | | | | | | |
| | | 2017 | | 2016 | | 2015 |
| | | Jan. 1 - Dec 31, 2017 | | Jan. 1 - Dec 31, 2016 | | Jan. 1 - Dec 31, 2015 |
| Profit/(loss) for the period | | 1,383 |
| | 204,049 |
| | 350,301 |
|
| | | | | | | |
| Other comprehensive income, net of tax | | |
| | |
| | |
|
| Items that will never be reclassified to profit or loss: | | |
| | |
| | |
|
| Remeasurements of the defined benefit liability (asset) (Note 16) | | 64 |
| | (646 | ) | | (44 | ) |
| | | | | | | |
| Items that are or may be reclassified to profit or loss: | | |
| | |
| | |
|
| Foreign currency translation differences (Note 6) | | 448 |
| | 170 |
| | (429 | ) |
| Equity-accounted investees - share of other comprehensive income (Note 25) | | 483 |
| | 1,224 |
| | 1,610 |
|
| | | | | | | |
| Other comprehensive income, net of tax | | 995 |
| | 748 |
| | 1,136 |
|
| | | | | | | |
| Total comprehensive income for the period | | 2,378 |
| | 204,797 |
| | 351,437 |
|
| | | | | | | |
| Attributable to: | | |
| | |
| | |
|
| Owners of the company | | 2,378 |
| | 204,797 |
| | 351,437 |
|
The accompanying notes on page F-10F-13 to F-81F-112 are an integral part of these consolidated financial statements.
Consolidated Statement of Changes in Equity
(in thousands of USD)
| | | | | | | | | | | | | | | | | | | | | | | | | | | | | | | | | | | | | | | | | | | | |
| | Share capital | | Share premium | | Translation reserve | | Hedging reserve | | Treasury shares | | Retained earnings | | Total equity |
| | | | | | | | | | | | | | |
| Balance at January 1, 2018 | | 173,046 | | | 1,215,227 | | | 568 | | | 0 | | | (16,102) | | | 473,622 | | | 1,846,361 | |
| | | | | | | | | | | | | | |
| Adjustment on initial application of IFRS 15 (net of tax) | | — | | | — | | | — | | | — | | | — | | | (1,729) | | | (1,729) | |
| Adjustment on initial application of IFRS 9 (net of tax) | | — | | | — | | | — | | | — | | | — | | | (16) | | | (16) | |
| Balance at January 1, 2018 adjusted * | | 173,046 | | | 1,215,227 | | | 568 | | | 0 | | | (16,102) | | | 471,877 | | | 1,844,616 | |
| | | | | | | | | | | | | | |
| Profit (loss) for the period | | — | | | — | | | — | | | — | | | — | | | (110,070) | | | (110,070) | |
| Total other comprehensive income | | — | | | — | | | (157) | | | (2,698) | | | — | | | (339) | | | (3,194) | |
| Total comprehensive income | | — | | | — | | | (157) | | | (2,698) | | | — | | | (110,409) | | | (113,264) | |
| | | | | | | | | | | | | | |
| Transactions with owners of the company | | | | | | | | | | | | | | |
| Issue of ordinary shares related to business combinations (Note 14) | | 66,102 | | | 487,322 | | | — | | | — | | | — | | | — | | | 553,424 | |
| | | | | | | | | | | | | | |
| | | | | | | | | | | | | | |
| | | | | | | | | | | | | | |
| Dividends to equity holders | | — | | | — | | | — | | | — | | | — | | | (22,629) | | | (22,629) | |
| Treasury shares acquired (Note 14) | | — | | | — | | | — | | | — | | | (3,955) | | | — | | | (3,955) | |
| Treasury shares sold (Note 14) | | — | | | — | | | — | | | — | | | 5,406 | | | (3,112) | | | 2,294 | |
| Equity-settled share-based payment (Note 23) | | — | | | — | | | — | | | — | | | — | | | 37 | | | 37 | |
| Total transactions with owners | | 66,102 | | | 487,322 | | | — | | | — | | | 1,451 | | | (25,704) | | | 529,171 | |
| | | | | | | | | | | | | | |
| Balance at December 31, 2018 | | 239,148 | | | 1,702,549 | | | 411 | | | (2,698) | | | (14,651) | | | 335,764 | | | 2,260,523 | |
| | | | | | | | | | | | | | |
| | | | | | | | | | | | | | |
| | | | | | | | | | | | | | |
| Balance at January 1, 2019 ** | | 239,148 | | | 1,702,549 | | | 411 | | | (2,698) | | | (14,651) | | | 335,764 | | | 2,260,523 | |
| | | | | | | | | | | | | | |
| | | | | | | | | | | | | | |
| | | | | | | | | | | | | | |
| | | | | | | | | | | | | | |
| | | | | | | | | | | | | | |
| Profit (loss) for the period | | — | | | — | | | — | | | — | | | — | | | 112,230 | | | 112,230 | |
| Total other comprehensive income | | — | | | — | | | (112) | | | (1,885) | | | — | | | (1,943) | | | (3,940) | |
| Total comprehensive income | | — | | | — | | | (112) | | | (1,885) | | | — | | | 110,287 | | | 108,290 | |
| | | | | | | | | | | | | | |
| Transactions with owners of the company | | | | | | | | | | | | | | |
| | | | | | | | | | | | | | |
| | | | | | | | | | | | | | |
| Dividends to equity holders (Note 14) | | — | | | — | | | — | | | — | | | — | | | (25,993) | | | (25,993) | |
| | | | | | | | | | | | | | |
| Treasury shares acquired (Note 14) | | — | | | — | | | — | | | — | | | (30,965) | | | — | | | (30,965) | |
| | | | | | | | | | | | | | |
| Total transactions with owners | | — | | | — | | | — | | | — | | | (30,965) | | | (25,993) | | | (56,958) | |
| | | | | | | | | | | | | | |
| Balance at December 31, 2019 | | 239,148 | | | 1,702,549 | | | 299 | | | (4,583) | | | (45,616) | | | 420,058 | | | 2,311,855 | |
|
| | | | | | | | | | | | | | | | | | | | | | | | | | | |
| | | Share capital | | Share premium | | Translation reserve | | Hedging reserve | | Treasury shares | | Retained earnings | | Capital and reserves | | Other equity interest | | Total equity |
| | | | | | | | | | | | | | | | | | | |
| Balance at January 1, 2015 | | 142,441 |
| | 941,770 |
| | 379 |
| | — |
| | (46,062 | ) | | 359,180 |
| | 1,397,708 |
| | 75,000 |
| | 1,472,708 |
|
| | | | | | | | | | | | | | | | | | | |
| Profit (loss) for the period | | — |
| | — |
| | — |
| | — |
| | — |
| | 350,301 |
| | 350,301 |
| | — |
| | 350,301 |
|
| Total other comprehensive income | | — |
| | — |
| | (429 | ) | | — |
| | — |
| | 1,565 |
| | 1,136 |
| | — |
| | 1,136 |
|
| Total comprehensive income | | — |
| | — |
| | (429 | ) | | — |
| | — |
| | 351,866 |
| | 351,437 |
| | — |
| | 351,437 |
|
| | | | | | | | | | | | | | | | | | | |
| Transactions with owners of the company | | | | | | | | | | | | | | | | | | |
| Issue of ordinary shares (Note 13) | | 20,324 |
| | 208,738 |
| | — |
| | — |
| | — |
| | (19,357 | ) | | 209,705 |
| | — |
| | 209,705 |
|
| Conversion perpetual convertible preferred equity (Note 13) | | 10,281 |
| | 64,719 |
| | — |
| | — |
| | — |
| | — |
| | 75,000 |
| | (75,000 | ) | | — |
|
| Dividends to equity holders | | — |
| | — |
| | — |
| | — |
| | — |
| | (138,001 | ) | | (138,001 | ) | | — |
| | (138,001 | ) |
| Treasury shares sold (Note 13) | | — |
| | — |
| | — |
| | — |
| | 33,779 |
| | (25,516 | ) | | 8,263 |
| | — |
| | 8,263 |
|
| Equity-settled share-based payment (Note 22) | | — |
| | — |
| | — |
| | — |
| | — |
| | 1,637 |
| | 1,637 |
| | — |
| | 1,637 |
|
| Total transactions with owners | | 30,605 |
| | 273,457 |
| | — |
| | — |
| | 33,779 |
| | (181,237 | ) | | 156,604 |
| | (75,000 | ) | | 81,604 |
|
| | | | | | | | | | | | | | | | | | | |
| Balance at December 31, 2015 | | 173,046 |
| | 1,215,227 |
| | (50 | ) | | — |
| | (12,283 | ) | | 529,809 |
| | 1,905,749 |
| | — |
| | 1,905,749 |
|
| | | | | | | | | | | | | | | | | | | |
| | | | | | | | | | | | | | | | | | | |
| | | | | | | | | | | | | | | | | | | |
| Balance at January 1, 2016 | | 173,046 |
| | 1,215,227 |
| | (50 | ) | | — |
| | (12,283 | ) | | 529,809 |
| | 1,905,749 |
| | — |
| | 1,905,749 |
|
| | | | | | | | | | | | | | | | | | | |
| Profit (loss) for the period | | — |
| | — |
| | — |
| | — |
| | — |
| | 204,049 |
| | 204,049 |
| | — |
| | 204,049 |
|
| Total other comprehensive income | | — |
| | — |
| | 170 |
| | — |
| | — |
| | 578 |
| | 748 |
| | — |
| | 748 |
|
| Total comprehensive income | | — |
| | — |
| | 170 |
| | — |
| | — |
| | 204,627 |
| | 204,797 |
| | — |
| | 204,797 |
|
| | | | | | | | | | | | | | | | | | | |
| Transactions with owners of the company | | | | | | | | | | | | | | | | | | |
| Dividends to equity holders | | — |
| | — |
| | — |
| | — |
| | — |
| | (216,838 | ) | | (216,838 | ) | | — |
| | (216,838 | ) |
| Treasury shares acquired (Note 13) | | — |
| | — |
| | — |
| | — |
| | (6,889 | ) | | — |
| | (6,889 | ) | | — |
| | (6,889 | ) |
| Treasury shares sold (Note 13) | | — |
| | — |
| | — |
| | — |
| | 3,070 |
| | (2,339 | ) | | 731 |
| | — |
| | 731 |
|
| Equity-settled share-based payment (Note 22) | | — |
| | — |
| | — |
| | — |
| | — |
| | 406 |
| | 406 |
| | — |
| | 406 |
|
| Total transactions with owners | | — |
| | — |
| | — |
| | — |
| | (3,819 | ) | | (218,771 | ) | | (222,590 | ) | | — |
| | (222,590 | ) |
| | | | | | | | | | | | | | | | | | | |
| Balance at December 31, 2016 | | 173,046 |
| | 1,215,227 |
| | 120 |
| | — |
| | (16,102 | ) | | 515,665 |
| | 1,887,956 |
| | — |
| | 1,887,956 |
|
Consolidated Statement of Changes in Equity (Continued)
(in thousands of USD)
| | | | | | | | | | | | | | | | | | | | | | | | | | | | | | | | | | | | | | | | | | | | |
| | Share capital | | Share premium | | Translation reserve | | Hedging reserve | | Treasury shares | | Retained earnings | | Total equity |
| Balance at January 1, 2020 | | 239,148 | | | 1,702,549 | | | 299 | | | (4,583) | | | (45,616) | | | 420,058 | | | 2,311,855 | |
| | | | | | | | | | | | | | |
| | | | | | | | | | | | | | |
| | | | | | | | | | | | | | |
| | | | | | | | | | | | | | |
| Profit (loss) for the period | | — | | | — | | | — | | | — | | | — | | | 473,238 | | | 473,238 | |
| Total other comprehensive income / (expense) | | — | | | — | | | 636 | | | (2,873) | | | — | | | (99) | | | (2,336) | |
| Total comprehensive income / (expense) | | — | | | — | | | 636 | | | (2,873) | | | — | | | 473,139 | | | 470,902 | |
| | | | | | | | | | | | | | |
| Transactions with owners of the company | | | | | | | | | | | | | | |
| | | | | | | | | | | | | | |
| Dividends to equity holders (Note 14) | | — | | | — | | | — | | | — | | | — | | | (352,483) | | | (352,483) | |
| Treasury shares acquired (Note 14) | | — | | | — | | | — | | | — | | | (118,488) | | | — | | | (118,488) | |
| | | | | | | | | | | | | | |
| | | | | | | | | | | | | | |
| Total transactions with owners | | — | | | — | | | — | | | — | | | (118,488) | | | (352,483) | | | (470,971) | |
| | | | | | | | | | | | | | |
| Balance at December 31, 2020 | | 239,148 | | | 1,702,549 | | | 935 | | | (7,456) | | | (164,104) | | | 540,714 | | | 2,311,786 | |
* The Group initially applied IFRS 15 and IFRS 9 at January 1, 2018. Under the transition methods chosen, comparative information is not restated but the opening balance of 2018 was adjusted following the application of IFRS 15 on Revenue Recognition and IFRS 9 on Financial Instruments. |
| | | | | | | | | | | | | | | | | | | | | | | | | | | | | | | | | | | |
| | | Share capital | | Share premium | | Translation reserve | | Hedging reserve | | Treasury shares | | Retained earnings | | Capital and reserves | | Other equity interest | | Total equity |
| Balance at January 1, 2017 | | 173,046 |
| | 1,215,227 |
| | 120 |
| | — |
| | (16,102 | ) | | 515,665 |
| | 1,887,956 |
| | — |
| | 1,887,956 |
|
| | | | | | | | | | | | | | | | | | | |
| Profit (loss) for the period | | — |
| | — |
| | — |
| | — |
| | — |
| | 1,383 |
| | 1,383 |
| | — |
| | 1,383 |
|
| Total other comprehensive income | | — |
| | — |
| | 448 |
| | — |
| | — |
| | 547 |
| | 995 |
| | — |
| | 995 |
|
| Total comprehensive income | | — |
| — |
| — |
| — |
| 448 |
| — |
| — |
| — |
| — |
| — |
| 1,930 |
| — |
| 2,378 |
| — |
| — |
| — |
| 2,378 |
|
| | | | | | | | | | | | | | | | | | | |
| Transactions with owners of the company | | | | | | | | | | | | | | | | | | |
| Dividends to equity holders (Note 13) | | — |
| | — |
| | — |
| | — |
| | — |
| | (44,286 | ) | | (44,286 | ) | | — |
| | (44,286 | ) |
| Equity-settled share-based payment (Note 22) | | — |
| | — |
| | — |
| | — |
| | — |
| | 313 |
| | 313 |
| | — |
| | 313 |
|
| Total transactions with owners | | — |
| | — |
| | — |
| | — |
| | — |
| | (43,973 | ) | | (43,973 | ) | | — |
| | (43,973 | ) |
| | | | | | | | | | | | | | | | | | | |
| Balance at December 31, 2017 | | 173,046 |
| | 1,215,227 |
| | 568 |
| | — |
| | (16,102 | ) | | 473,622 |
| | 1,846,361 |
| | — |
| | 1,846,361 |
|
** The Group initially applied IFRS 16 at January 1, 2019, using the modified retrospective approach. Under this approach, comparative information is not restated.
The accompanying notes on page F-10F-13 to F-81F-112 are an integral part of these consolidated financial statements.
Consolidated Statement of Cash Flows
(in thousands of USD)
| | | | | | | | | | | | | | | | | | | | |
| | 2020 | | 2019 | | 2018 * |
| | Jan. 1 - Dec 31, 2020 | | Jan. 1 - Dec 31, 2019 | | Jan. 1 - Dec 31, 2018 |
| Cash flows from operating activities | | | | | | |
| Profit (loss) for the period | | 473,238 | | | 112,230 | | | (110,070) | |
| | | | | | |
| Adjustments for: | | 357,720 | | | 405,823 | | | 289,311 | |
| Depreciation of tangible assets (Note 8) | | 319,652 | | | 337,646 | | | 270,582 | |
| Depreciation of intangible assets | | 99 | | | 56 | | | 111 | |
| Impairment on non-current assets held for sale (Note 3) | | 0 | | | 0 | | | 2,995 | |
| | | | | | |
| Provisions | | (388) | | | (448) | | | (42) | |
| Income tax (benefits)/expenses (Note 7) | | 1,944 | | | 602 | | | 239 | |
| Share of profit of equity-accounted investees, net of tax (Note 26) | | (10,917) | | | (16,460) | | | (16,076) | |
| Net finance expenses (Note 6) | | 70,057 | | | 99,231 | | | 74,389 | |
| (Gain)/loss on disposal of assets (Note 8) | | (22,727) | | | (14,804) | | | (18,865) | |
| Equity-settled share-based payment transactions (Note 5) | | 0 | | | 0 | | | 37 | |
| Amortization of deferred capital gain | | 0 | | | 0 | | | (1,000) | |
| Gain on bargain purchase (Note 25) | | 0 | | | 0 | | | (23,059) | |
| | | | | | |
| Changes in working capital requirements | | 180,576 | | | (165,419) | | | (114,533) | |
| Change in cash guarantees (Note 10) | | (12,339) | | | (34) | | | 33 | |
| Change in inventory (Note 11) | | 107,602 | | | (161,121) | | | (22,261) | |
| Change in receivables from contracts with customers (Note 12) | | 85,830 | | | (41,001) | | | (23,589) | |
| Change in accrued income (Note 12) | | 12,667 | | | (3,051) | | | (6,393) | |
| Change in deferred charges and fulfillment costs (Note 12) | | (263) | | | (2,078) | | | 18,848 | |
| Change in other receivables (Note 10 and 12) | | (3,826) | | | 22,393 | | | (77,876) | |
| Change in trade payables (Note 18) | | 4,490 | | | 6,471 | | | (8,181) | |
| Change in accrued payroll (Note 18) | | 2,536 | | | (2,282) | | | (11,000) | |
| Change in accrued expenses (Note 18) | | (10,675) | | | 3,473 | | | 18,839 | |
| Change in deferred income (Note 18) | | (4,645) | | | 10,028 | | | (2,265) | |
| Change in other payables (Note 18) | | (148) | | | (806) | | | (1,304) | |
| Change in provisions for employee benefits (Note 17) | | (653) | | | 2,589 | | | 616 | |
| | | | | | |
| Income taxes paid during the period | | 78 | | | (993) | | | (67) | |
| Interest paid (Note 6-19) | | (56,084) | | | (98,852) | | | (67,209) | |
| Interest received (Note 6-12) | | 6,723 | | | 6,602 | | | 3,409 | |
| Dividends received from equity-accounted investees (Note 26) | | 7,534 | | | 12,600 | | | 0 | |
| | | | | | |
| Net cash from (used in) operating activities | | 969,785 | | | 271,991 | | | 841 | |
| | | | | | |
| Acquisition of vessels (Note 8) | | (224,904) | | | (7,024) | | | (237,476) | |
| Proceeds from the sale of vessels (Note 8) | | 78,075 | | | 86,235 | | | 26,762 | |
| Acquisition of other tangible assets and prepayments (Note 8) | | (285) | | | (1,015) | | | (588) | |
| Acquisition of intangible assets | | (221) | | | (14) | | | (1) | |
| Proceeds from the sale of other (in)tangible assets (Note 8) | | 0 | | | 30 | | | 0 | |
| Loans from (to) related parties (Note 26) | | 26,443 | | | (31,713) | | | 134,097 | |
| | | | | | |
| Acquisition of subsidiaries or from business combinations, net of cash acquired (Note 25) | | 0 | | | 0 | | | 126,288 | |
| Proceeds from sale (Purchase of) shares in equity-accounted investees (Note 26) | | 2,000 | | | (4,000) | | | 0 | |
| Proceeds from sale of subsidiaries (Note 25) | | 0 | | | 0 | | | 140,960 | |
| Lease payments received from finance leases | | 1,786 | | | 1,251 | | | 0 | |
| | | | | | |
| Net cash from (used in) investing activities | | (117,106) | | | 43,750 | | | 190,042 | |
| | | | | | |
| | | | | | |
| | | | | | |
| | | | | | |
| | | | | | |
| (Purchase of) Proceeds from sale of treasury shares (Note 14) | | (118,488) | | | (30,965) | | | (1,661) | |
| Proceeds from new borrowings (Note 16) | | 893,827 | | | 1,099,701 | | | 983,882 | |
| Repayment of borrowings (Note 16) | | (994,989) | | | (1,318,398) | | | (1,115,894) | |
| Repayment of commercial paper (Note 16) | | (359,295) | | | 0 | | | 0 | |
| (Repayment of) Proceeds from sale and leaseback (Note 16) | | (22,853) | | | 124,425 | | | 0 | |
| Repayment of lease liabilities (Note 16) | | (37,779) | | | (30,214) | | | 0 | |
| Transaction costs related to issue of loans and borrowings (Note 16) | | (8,083) | | | (9,721) | | | (3,849) | |
| Dividends paid (Note 14) | | (352,041) | | | (26,015) | | | (22,643) | |
| | | | | | |
| Net cash from (used in) financing activities | | (999,701) | | | (191,187) | | | (160,165) | |
| | | | | | |
Consolidated Statement of Cash Flows
(in thousands of USD)
|
| | | | | | | | | |
| | | 2017 | | 2016 | | 2015 |
| | | Jan. 1 - Dec 31, 2017 | | Jan. 1 - Dec 31, 2016 | | Jan. 1 - Dec 31, 2015 |
| Cash flows from operating activities | | | | | | |
| Profit (loss) for the period | | 1,383 |
| | 204,049 |
| | 350,301 |
|
| | | | | | | |
| Adjustments for: | | 225,527 |
| | 205,457 |
| | 208,305 |
|
| Depreciation of tangible assets (Note 8) | | 229,777 |
| | 227,664 |
| | 210,156 |
|
| Depreciation of intangible assets | | 95 |
| | 99 |
| | 50 |
|
| Loss (gain) on disposal of investments in equity accounted investees (Note 24) | | — |
| | 24,150 |
| | — |
|
| Provisions | | (160 | ) | | (603 | ) | | 91 |
|
| Tax (benefits)/expenses (Note 7) | | (1,358 | ) | | (174 | ) | | 5,633 |
|
| Share of profit of equity-accounted investees, net of tax (Note 25) | | (30,082 | ) | | (40,495 | ) | | (51,592 | ) |
| Net finance expense (Note 6) | | 43,463 |
| | 44,839 |
| | 47,630 |
|
| (Gain)/loss on disposal of assets (Note 8) | | (15,511 | ) | | (50,395 | ) | | (5,300 | ) |
| Equity-settled share-based payment transactions (Note 5) | | 313 |
| | 406 |
| | 1,637 |
|
| Amortization of deferred capital gain | | (1,010 | ) | | (34 | ) | | — |
|
| | | | | | | |
| Changes in working capital requirements | | 22,083 |
| | 38,487 |
| | (57,692 | ) |
| Change in cash guarantees | | (52 | ) | | 107 |
| | 1 |
|
| Change in trade receivables (Note 11) | | 5,938 |
| | (755 | ) | | 12,330 |
|
| Change in accrued income (Note 11) | | (1,499 | ) | | 21,049 |
| | (13,175 | ) |
| Change in deferred charges (Note 11) | | (3,648 | ) | | 239 |
| | 11,090 |
|
| Change in other receivables (Note 10-11) | | 28,773 |
| | 35,905 |
| | (34,654 | ) |
| Change in trade payables (Note 17) | | 1,165 |
| | (6,817 | ) | | 1,190 |
|
| Change in accrued payroll (Note 17) | | 1,014 |
| | (138 | ) | | 255 |
|
| Change in accrued expenses (Note 17) | | (6,727 | ) | | (7,547 | ) | | (1,649 | ) |
| Change in deferred income (Note 17) | | (3,726 | ) | | (3,591 | ) | | 6,612 |
|
| Change in other payables (Note 17) | | 18 |
| | (226 | ) | | (39,800 | ) |
| Change in provisions for employee benefits (Note 16) | | 827 |
| | 261 |
| | 108 |
|
| | | | | | | |
| Income taxes paid during the period | | 11 |
| | (100 | ) | | (109 | ) |
| Interest paid (Note 6-18) | | (39,595 | ) | | (33,378 | ) | | (50,810 | ) |
| Interest received (Note 6-11) | | 636 |
| | 209 |
| | 262 |
|
| Dividends received from equity-accounted investees (Note 25) | | 1,250 |
| | 23,478 |
| | 275 |
|
| | | | | | | |
| Net cash from (used in) operating activities | | 211,295 |
| | 438,202 |
| | 450,532 |
|
| | | | | | | |
| Acquisition of vessels (Note 8) | | (176,687 | ) | | (342,502 | ) | | (351,596 | ) |
| Proceeds from the sale of vessels (Note 8) | | 96,880 |
| | 223,016 |
| | 112,890 |
|
| Acquisition of other tangible assets and prepayments (Note 8) | | (1,203 | ) | | (178 | ) | | (8,289 | ) |
| Acquisition of intangible assets | | (11 | ) | | (18 | ) | | (258 | ) |
| Proceeds from the sale of other (in)tangible assets | | 29 |
| | 38 |
| | 95 |
|
| Loans from (to) related parties (Note 25) | | 40,750 |
| | 22,047 |
| | 39,785 |
|
| Proceeds from capital decreases in joint ventures (Note 25) | | — |
| | 3,737 |
| | 1,500 |
|
| Acquisition of subsidiaries, net of cash acquired (Note 24) | | — |
| | (6,755 | ) | | — |
|
| | | | | | | |
| Net cash from (used in) investing activities | | (40,242 | ) | | (100,615 | ) | | (205,873 | ) |
| | | | | | | |
| Proceeds from issue of share capital (Note 13) | | — |
| | — |
| | 229,063 |
|
| Transaction costs related to issue of share capital (Note 13) | | — |
| | — |
| | (19,357 | ) |
| (Purchase of) Proceeds from sale of treasury shares (Note 13) | | — |
| | (6,157 | ) | | 8,263 |
|
| Proceeds from new borrowings (Note 15) | | 526,024 |
| | 740,286 |
| | 931,270 |
|
| Repayment of borrowings (Note 15) | | (710,993 | ) | | (774,015 | ) | | (1,367,871 | ) |
| Transaction costs related to issue of loans and borrowings (Note 15) | | (5,874 | ) | | (4,436 | ) | | (8,680 | ) |
| Dividends paid (Note 13) | | (44,133 | ) | | (216,838 | ) | | (138,003 | ) |
| | | | | | | |
| Net cash from (used in) financing activities | | (234,976 | ) | | (261,160 | ) | | (365,315 | ) |
| | | | | | | |
| Net increase (decrease) in cash and cash equivalents | | (63,923 | ) | | 76,427 |
| | (120,656 | ) |
| | | | | | | |
| Net cash and cash equivalents at the beginning of the period (Note 12) | | 206,689 |
| | 131,663 |
| | 254,086 |
|
| Effect of changes in exchange rates | | 882 |
| | (1,401 | ) | | (1,767 | ) |
| | | | | | | |
| Net cash and cash equivalents at the end of the period (Note 12) | | 143,648 |
| | 206,689 |
| | 131,663 |
|
| | | | | | | | | | | | | | | | | | | | |
| Net increase (decrease) in cash and cash equivalents | | (147,022) | | | 124,554 | | | 30,718 | |
| | | | | | |
| Net cash and cash equivalents at the beginning of the period (Note 13) | | 296,954 | | | 173,133 | | | 143,648 | |
| Effect of changes in exchange rates | | 11,546 | | | (733) | | | (1,233) | |
| | | | | | |
| Net cash and cash equivalents at the end of the period (Note 13) | | 161,478 | | | 296,954 | | | 173,133 | |
| | | | | | |
* The Group initially applied IFRS 16 at January 1, 2019, using the modified retrospective approach. Under this approach, comparative information is not restated. Due to the increased significance of inventory (see accounting policies), the Group has re-presented the comparative information related to bunker inventory to align with the current year presentation.
The accompanying notes on page F-10F-13 to F-81F-112 are an integral part of these consolidated financial statements.
NOTES TO CONSOLIDATED FINANCIAL STATEMENTS 20172020
Notes to the consolidated financial statements for the year ended December 31, 2017
NOTES TO CONSOLIDATED FINANCIAL STATEMENTS 20172020
Note 1 - Significant accounting policies
1. Reporting Entity
Euronav NV (the "Company"“Company”) is a company domiciled in Belgium. The address of the Company'sCompany’s registered office is De Gerlachekaai 20, 2000 Antwerpen, Belgium. The consolidated financial statements of the Company comprise the Company and its subsidiaries (together referred to as the "Group"“Group”) and the Group'sGroup’s interests in associates and joint ventures.
Euronav NV is a fully-integrated provider of international maritime shipping and offshore services engaged in the transportation and storage of crude oil. The Company was incorporated under the laws of Belgium on June 26, 2003, and grew out of three companies that had a strong presence in the shipping industry; Compagnie Maritime Belge NV, ("CMB"),or CMB, formed in 1895, Compagnie Nationale de Navigation SA, ("CNN"),or CNN, formed in 1938, and Ceres Hellenic formed in 1950. The Company started doing business under the name "Euronav"“Euronav” in 1989 when it was initially formed as the international tanker subsidiary of CNN. Euronav NV merged in 2018 with Gener8 Maritime, Inc, which became a wholly-owned subsidiary of Euronav NV. Through the merger Euronav NV has an operating fleet of more than 70 tankers and is a leading independent large crude tanker operator.
Euronav NV charters its vessels to leading international energy companies. The Company pursues a chartering strategy of primarily employing its vessels on the spot market, including through the Tankers International (TI) Pool (the "TI Pool") and also under fixed-rate contracts and long-term time charters, which typically include a profit sharing component.
A spot market voyage charter is a contract to carry a specific cargo from a load port to a discharge port for an agreed freight per ton of cargo or a specified total amount. Under spot market voyage charters, the Company pays voyage expenses such as port, canal and bunker costs. Spot charter rates have historically been volatile and fluctuate due to seasonal changes, as well as general supply and demand dynamics in the crude oil marine transportation sector. Although the revenues generated by the Company in the spot market are less predictable, the Company believes their exposure to this market provides them with the opportunity to capture better profit margins during periods when vessel demand exceeds supply leading to improvements in tanker charter rates. The Company principally employs and commercially manages their VLCCs through the TI Pool, a leading spot market-oriented VLCC pool in which other third-party shipowners with vessels of similar size and quality participate along with the Company. The Company participated in the formation of the TI Pool in 2000 to allow themselves and other TI Pool participants consisting of third-party owners and operators of similarly sized vessels, to gain economies of scale, obtain increased cargo flow of information, logistical efficiency and greater vessel utilization.
Time charters provide the CompanyGroup with a fixed and stable cash flow for a known period of time. Time charters may help the CompanyGroup mitigate, in part, theirits exposure to the spot market, which tends to be volatile in nature, being seasonal and generally weaker in the second and third quarters of the year due to refinery shutdowns and related maintenance during the warmer summer months. The Group may when the cycle matures or otherwise opportunistically employ more of theirits vessels under time charter contracts as the available rates for time charters improve. The Group may also enter into time charter contracts with profit sharing arrangements, which the CompanyGroup believes will enable themit to benefit if the spot market increases above a base charter rate as calculated either by sharing sub charter profits of the charterer or by reference to a market index and in accordance with a formula provided in the applicable charter contract.
The Group currently deploys their twoits 2 FSOs as floating storage units under service contracts with North Oil Company, in the offshore services sector.
| |
(a) | Statement of compliance |
2. Basis of accounting
These financial statements have been prepared in accordance with International Financial Reporting Standards (IFRS) issued by the International Accounting Standards Board (IASB). and as adopted by the European Union as of December 31, 2020.
Changes in significant accounting policies are described in policy 6. All accounting policies have been consistently applied for all periods presented in the consolidated financial statements unless disclosed otherwise.
The consolidated financial statements were authorized for issue by the Supervisory Board of Directors on April 17, 2018.
15, 2021.
NOTES TO CONSOLIDATED FINANCIAL STATEMENTS 20172020
Note 1 - Significant accounting policies (Continued)
3. Basis of measurement
The consolidated financial statements have been prepared on the historical cost basis except for the following material items in the statement of financial position:
•Derivative financial instruments are measured at fair value
| |
(c) | Functional and presentation currency |
•Non-current assets held for sale are recognized at fair value less cost of disposal if it is lower than their carrying amount
4.Functional and presentation currency
The consolidated financial statements are presented in USD, which is the Company's functional and presentation currency. All financial information presented in USD has been rounded to the nearest thousand except when otherwise indicated.
| |
(d) | Use of estimates and judgements |
5. Use of estimates and judgments
The preparation of the consolidated financial statements in conformity with IFRS requires management to make judgements,judgments, estimates and assumptions that affect the application of the Group's accounting policies and the reported amounts of assets and liabilities, income and expenses.
The estimates and associated assumptions are based on historical experience and various other factors that are believed to be reasonable under the circumstances, the results of which are the basis of making the judgementsjudgments about carrying values of assets and liabilities that are not readily apparent from other sources. Actual results may differ from these estimates.
The estimates and underlying assumptions are reviewed on an ongoing basis. Revisions to accounting estimates are recognized in the period in which the estimate is revised if the revision affects only that period, or in the period of the revision and future periods if the revision affects both current and future periods.
A. Judgments
Information about critical judgementsjudgments made in applying accounting policies that have the most significant effecteffects on the amounts recognized in the consolidated financial statement is included in the following note:notes:
•Note 8 – ImpairmentImpairment;
•Note 25 - Business Combination and
•Note 20 - Lease term: whether the Group is reasonably certain to exercise renewal, termination, purchase options.
B. Assumptions and estimation uncertainties
Information about assumptions and estimation uncertainties that have a significant risk of resulting in a material adjustment withinto the carrying amounts in the next financial yearyears is included in the following note:notes:
•Note 8 – Impairment test: key assumptions underlying the recoverable amount;
•Note 9 - Measurement of deferred tax assets: availability of future taxable profit against which deductible temporary differences and tax losses carried forward can be utilized and
• Note 20 - Leases: key assumptions underlying the lease liability and right-of-use asset, e.g. lease term, lease payments and estimate on residual value guarantee.
The significant assumptions and accounting estimates, to support the reported amounts of assets and liabilities, income and expenses, were regularly reviewed, and if needed updated, during 2020. The main judgements, estimates and assumptions, which might be impacted by COVID-19, are:
•Note 8 – Impairment test: The carrying amount of the vessels is reviewed to determine whether an indication of impairment exists. No impairment is required as the recoverable amount of each CGU continues to be in excess of the carrying amounts.
NOTES TO CONSOLIDATED FINANCIAL STATEMENTS 2020
Note 1 - Significant accounting policies (Continued)
•Bunkers on the Oceania and the vessels are valued at lower of cost or net realizable value. Weighted average of the fuel stock on board of the Oceania and the vessels was lower than the market price at year-end.
•Allowance for expected credit losses: In accordance with IFRS 9, the group recognizes expected credit losses on trade receivables following the simplified approach. Lifetime expected losses are recognized for the trade receivables, excluding recoverable VAT amounts. However, based on customer’s payment behaviour, no significant additional allowances for expected credit losses were to be recognized as per December 31, 2020.
As the COVID-19 pandemic further evolves, potential changes in these views might occur in 2021.
Measurement of fair values
A number of the Group'sGroup’s accounting policies and disclosures require the measurement of fair values, for both financial and non-financial assets and liabilities.
The Group has an established control framework with respect to the measurement of fair values. This includes a valuation team that has overall responsibility for overseeing all significant fair value measurements, including Level 3 fair values, and reports directly to the CFO.
The valuation team regularly reviews significant unobservable inputs and valuation adjustments. If third party information, such as broker quotes or pricing services, is used to measure fair values, then the valuation team assesses the evidence obtained from the third parties to support the conclusion that such valuations meet the requirements of IFRS, including the level in the fair value hierarchy in which such valuations should be classified. Significant valuation issues are reported to the Group Audit and Risk Committee.Committee.
When measuring the fair value of an asset or a liability, the Group uses market observable data as far as possible. Fair values are categorized into different levels in a fair value hierarchy based on the inputs used in the valuation techniques as follows.
•Level 1: quoted prices (unadjusted) in active markets for identical assets or liabilities.
•Level 2: inputs other than quoted prices included in Level 1 that are observable for the asset or liability, either directly (i.e.as prices) or indirectly (i.e. derived from prices).
•Level 3: inputs for the asset or liability that are not based on observable market data (unobservable inputs).
NOTES TO CONSOLIDATED FINANCIAL STATEMENTS 2017
Note 1 - Significant accounting policies (Continued)
If the inputs used to measure the fair value of an asset or a liability might be categorized in different levels of the fair value hierarchy, then the fair value measurement is categorized in its entirety in the same level of the fair value hierarchy as the lowest level input that is significant to the entire measurement.
The Group recognizes transfers between levels of the fair value hierarchy at the end of the reporting period during which the change has occurred.
| |
(e) | Changes in accounting policies |
Further information about the assumptions made in measuring fair values is included in the following notes:
•Note 3 - Assets and liabilities held for sale and discontinued operations;
•Note 19 - Financial instruments and
•Note 23 - Share-based payment arrangements
6. Changes in accounting policies
Except for the changes below, the accounting policies adopted in the preparation of the consolidated financial statements for the year ended December 31, 20172020 are consistent with those applied in the preparation of the consolidated financial statements for the year ended December 31, 2016. The Group has adopted the following2019. A number of new standards interpretations and amendments to standards, including any consequential amendments to other standards, with a date of initial application ofare effective from January 1, 2017:
Annual Improvements to IFRSs 2014-2016 cycle (amendments to IFRS 12)
Amendments to IAS 7: Disclosure Initiative
Amendments to IFRS 12: Recognition of Deferred Tax Assets for Unrealized Losses
The adoption of these standards, interpretations and amendments to standards did2020 but they do not have a material impacteffect on the Group's consolidated financial statements.
•Definition of a Business (Amendments to IFRS3), see accountancy policy 7.1.
•Interest Rate Benchmark Reform (Amendments to IFRS 9, IAS 39 and IFRS 7). The Group applies hedge accounting to certain Interest rate swaps that are used to hedge the risk related to the fluctuation of the LIBOR (see
| | | | | | | | |
(f) | Basis of Consolidation |
| EURONAV NV | |
(i) | Business Combinations |
NOTES TO CONSOLIDATED FINANCIAL STATEMENTS 2020
Note 1 - Significant accounting policies (Continued)
Note 14). The Group applied the interest rate benchmark reform phase 1 amendments retrospectively to the hedging relationships that existed at 1 January 2020 or were designated thereafter and that are directly affected by interest rate benchmark reform. These amendments also apply to the gain or loss accumulated in the cash flow hedging reserve that existed at 1 January 2020. For the related accounting policy, refer to 9.3.
The Group applied IFRS 16 using the modified retrospective approach, under which the cumulative effect of initial application is recognized in retained earnings at 1 January 2019. Accordingly, the comparative information presented for 2018 is not restated - i.e. it is presented, as previously reported, under IAS 17 and related interpretations. The details of the changes in accounting policies are disclosed below. Additionally, the disclosure requirements in IFRS 16 have not been applied to comparative information. The Group initially applied IFRS 15 and IFRS 9 at January 1, 2018. Under the transition methods chosen, comparative information is not restated but the opening balance of 2018 was adjusted following the application of IFRS 15 on Revenue Recognition and IFRS 9 on Financial Instruments.
7. Basis of Consolidation
7.1. Business Combinations
The Group accounts for business combinations are accounted for using the acquisition method as atwhen the acquisition date, which isacquired set of activities and assets meets the date on whichdefinition of a business and control is transferred to the Group. The Group controls an entity when it is exposed to, or has rights to, variable returns from its involvement with the entity and has the ability to affect those returns through its power over the entity. In determining whether a particular set of activities and assets is a business, the Group assesses whether the set of assets and activities acquired includes, at a minimum, an input and substantive process and whether the acquired set has the ability to produce outputs. The Group has an option to apply a ‘concentration test’ that permits a simplified assessment of whether an acquired set of activities and assets is not a business. The optional concentration test is met if substantially all of the fair value of the gross assets acquired is concentrated in a single identifiable asset or group of similar identifiable assets.
For acquisitions on or after January 1, 2010, the Group measures goodwill at the acquisition date as:
•the fair value of the consideration transferred; plus
•the recognized amount of any non-controlling interests in the acquiree; plus if the business combination is achieved in stages, the fair value of the existing equity interest in the acquiree; less
•the net recognized amount (generally fair value) of the identifiable assets acquired and liabilities assumed.
When the excess is negative, a bargain purchase gain is recognized immediately in profit or loss.
The consideration transferred does not include amounts related to the settlement of pre-existing relationships. Such amounts
generally are recognized in profit or loss.
Transaction costs, other than those associated with the issue of debt or equity securities, that the Group incurs in connection with a business combination are expensed as incurred.
Any contingent consideration payable is measured at fair value at the acquisition date. If the contingent consideration is classified as equity, then it is not remeasured and settlement is accounted for within equity. Otherwise, subsequent changes in the fair value of the contingent consideration are recognized in profit or loss.
| |
(ii) | Non-controlling interests (NCI) |
7.2. Non-controlling interests (NCI)
NCI are measured at their proportionate share of the acquiree's identifiable net assets at the date of acquisition. Changes in the Group's interest in a subsidiary that do not result in a loss of control are accounted for as equity transactions.
7.3. Subsidiaries
NOTES TO CONSOLIDATED FINANCIAL STATEMENTS 2017
Note 1 - Significant accounting policies (Continued)
Subsidiaries are those entities controlled by the Group. The Group controls an entity when it is exposed to, or has rights to, variable returns from its involvement with the entity and has the ability to affect those returns through its power over the entity. The financial statements of subsidiaries are included in the consolidated financial statements from the date on which the control commences until the date on which control ceases.
7.4. Loss of control
| | | | | | | | |
(iv) | Loss of controlEURONAV NV | |
NOTES TO CONSOLIDATED FINANCIAL STATEMENTS 2020
Note 1 - Significant accounting policies (Continued)
On the loss of control, the Group derecognizes the assets and liabilities of the subsidiary, any non-controlling interests and the other components of equity related to the subsidiary. Any surplus or deficit arising on the loss of control is recognized in profit or loss. If the Group retains any interest in the former subsidiary, then such interest is measured at fair value at the date that control is lost. Subsequently it is accounted for as an equity-accounted investee or as an available-for-salea Fair Value through Other Comprehensive Income ("FVOCI") or Fair Value through Profit or Loss ("FVTPL") financial asset depending on the level of influence retained.
| |
(v) | Interests in equity-accounted investees |
7.5. Interests in equity-accounted investees
The Group'sGroup’s interests in equity-accounted investees comprise interest in associates and joint ventures.
Associates are those entities in which the Group has significant influence, but not control or joint control, over the financial and operating policies. A joint venture is an arrangement in which the Group has joint control, whereby the Group has rights to the net assets of the arrangement, rather than rights to its assets and obligations for its liabilities.
Interests in associates and joint ventures are accounted for using the equity method. They are recognized initially at cost, which includes transaction costs. Subsequent to initial recognition, the consolidated financial statements include the Group'sGroup’s share of the profit or loss and other comprehensive income ("OCI"(“OCI”) of equity-accounted investees, until the date on which significant influence or joint control ceases.
Interests in associates and joint ventures include any long-term interests that, in substance, form part of the Group'sGroup’s investment in those associates or joint ventures and include unsecured shareholder loans for which settlement is neither planned nor likely to occur in the foreseeable future, which, therefore, are an extension of the Group'sGroup’s investment in those associates and joint ventures. The Group'sGroup’s share of losses that exceeds its investment is applied to the carrying amount of those loans. After the Group'sGroup’s interest is reduced to zero, a liability is recognized to the extent that the Group has a legal or constructive obligation to fund the associates'associates’ or joint ventures'ventures’ operations or has made payments on their behalf.
| |
(vi) | Transactions eliminated on consolidation |
7.6. Transactions eliminated on consolidation
Intragroup balances and transactions, and any unrealized gains arising from intra-group transactions, are eliminated in preparing the consolidated financial statements. Unrealized gains arising from transactions with equity-accounted investees are eliminated against the underlying asset to the extent of the Group's interest in the investee. Unrealized losses are eliminated in the same way as unrealized gains, but only to the extent that there is no evidence of impairment.
| |
(i) | Foreign currency transactions |
8. Foreign currency
8.1. Foreign currency transactions
Transactions in foreign currencies are translated to USD at the foreign exchange rate applicable at the date of the transaction. Monetary assets and liabilities denominated in foreign currencies at the balance sheet date are translated to USD at the foreign exchange rate applicable at that date. Foreign exchange differences arising on translation are recognized in profit or loss. Non-monetary assets and liabilities that are measured in terms of historical cost in a foreign currency are translated using the exchange rate at the date of the transaction. Foreign exchange differences arising on translation are generally recognized in profit or loss. However, foreign currency differences arising from the translation of the following items are recognized in OCI:
•a financial liability designated as a hedge of the net investment in a foreign operation to the extent that the hedge is effective; and
•qualifying cash flow hedges to the extent that the hedges are effective.
8.2. Foreign operations
The assets and liabilities of foreign operations, including goodwill and fair value adjustments arising on acquisition, are translated to USD at exchange rates at the reporting date. The income and expenses of foreign operations are translated to USD at rates approximating the exchange rates at the dates of the transactions.
Foreign currency differences are recognized directly in equity (Translation reserve). When a foreign operation is disposed of, in part or in full, the relevant amount in the translation reserve is transferred to profit or loss.
9. Financial Instruments
NOTES TO CONSOLIDATED FINANCIAL STATEMENTS 20172020
Note 1 - Significant accounting policies (Continued)
Recognition and initial measurement
| |
(i) | Non-derivative financial assets |
The group
Trade receivables, debt securities issued and subordinated liabilities are initially recognizes loans and receivables on the date thatrecognized when they are originated. All other financial assets and financial liabilities (including assetsliabilities designated as at fair value through profit and loss)FVTPL) are initially recognized initially on the trade date, which is the date that the Group becomes a party to the contractual provisions of the instrument.
A financial asset (unless it is a trade receivable without a significant financing component which is initially measured at the transaction price) is initially measured at fair value plus, for an item not at FVTPL, transaction costs that are directly attributable to its acquisition or issue.
Financial liabilities are recognized initially at fair value less any directly attributable transaction costs.
The fair values of quoted investments are based on current bid prices. If the market for a financial asset is not active (and for unlisted securities), the Group establishes fair value by using valuation techniques. These include the use of recent arm’s length transactions, reference to other instruments that are substantially the same, discounted cash flow analysis, and option pricing models refined to reflect the issuer’s specific circumstances.
Financial assets and liabilities are offset and the net amount is presented in the statement of financial position when, and only when, the Group has a legal right to offset the amounts and intends either to settle on a net basis or to realize the asset and settle the liability simultaneously.
9.1. Financial assets
Classification and subsequent measurement
On initial recognition, a financial asset is classified as measured at: amortized cost; FVOCI - debt investment; FVOCI - equity instrument; or FVTPL. The classification of financial assets under IFRS 9 is generally based on the business model in which a financial asset is managed and its contractual cash flow characteristics.
Financial assets are not reclassified subsequent to their initial recognition unless the Group changes its business model for managing financial assets, in which case all affected financial assets are reclassified on the first day of the first reporting period following the change in the business model.
A financial asset is measured at amortized cost if it meets both of the following conditions and is not designated as at FVTPL:
•it is held within a business model whose objectives is to hold assets to collect contractual cash flows; and
•its contractual terms give rise on specified dates to cash flows that are solely payments of principal and interest on the principal amount outstanding.
A debt investment is measured at FVOCI if it meets both of the following conditions and is not designated as at FVTPL:
•it is held within a business model whose objective is achieved by both collecting contractual cash flows and selling financial assets; and
•its contractual terms give rise on specified dates to cash flows that are solely payments of principal and interest on the principal amount outstanding.
On initial recognition of an equity investment that is not held for trading, the Group may irrevocably elect to present subsequent changes in the investment's fair value in OCI. This election is made on an investment-by-investment basis.
All financial assets not classified as measured at amortized cost or FVOCI as described above are measured at FVTPL. This includes all derivative financial assets. On initial recognition, the Group may irrevocably designate a financial asset that otherwise meets the requirements to be measured at amortized cost or at FVOCI as at FVTPL if doing so eliminates or significantly reduces an accounting mismatch that would otherwise arise.
Assessment whether contractual cash flows are solely payments of principal and interest
For the purposes of this assessment, 'principal' is defined as the fair value of the financial asset on initial recognition. 'Interest' is defined as consideration for the time value of money and for the credit risk associated with the principal amount outstanding during a particular period of time and for other basic lending risks and costs (e.g. liquidity risk and administrative costs), as well as a profit margin.
NOTES TO CONSOLIDATED FINANCIAL STATEMENTS 2020
Note 1 - Significant accounting policies (Continued)
In assessing whether the contractual cash flows are solely payments of principal and interest, the Group considers the contractual terms of the instrument. This includes assessing whether the financial asset contains a contractual term that could change the timing or amount of contractual cash flows such that it would not meet this condition. In making this assessment, the Group considers:
•contingent events that would change the amount or timing of cash flows;
•terms that may adjust the contractual coupon rate, including variable-rate features;
•prepayment and extension features; and
•terms that limit the Group's claim to cash flows from specified assets (e.g. non-resource features).
A prepayment feature is consistent with the solely payments of principal and interest criterion if the prepayment amount substantially represents unpaid amounts of principal and interest on the principal amount outstanding, which may include reasonable additional compensation for early termination of the contract. Additionally, for a financial asset acquired at a discount or premium to its contractual par amount, a feature that permits or requires prepayment at an amount that substantially represents the contractual par amount plus accrued (but unpaid) contractual interest (which may also include reasonable additional compensation for early termination) is treated as consistent with this criterion if the fair value of the prepayment feature is insignificant at initial recognition.
| | | | | |
| |
| Financial assets at FVTPL | These assets are subsequently measured at fair value. Net gains and losses, including any interest or dividend income, are recognized in profit or loss. |
| Financial assets at amortized cost | These assets are subsequently measured at amortized cost using the effective interest method. The amortized cost is reduced by impairment losses (see (ii) below). Interest income, foreign exchange gains and losses and impairment are recognized in profit or loss. Any gain or loss on derecognition is recognized in profit or loss. |
| Debt investments at FVOCI | These assets are subsequently measured at fair value. Interest income calculated using the effective interest method, foreign exchange gains and losses and impairment are recognized in profit or loss. Other net gains and losses are recognized in OCI. On derecognition, gains and losses accumulated in OCI are reclassified to profit or loss. |
| Equity investments at FVOCI | These assets are subsequently measured at fair value. Dividends are recognized as income in profit or loss unless the dividend clearly represents a recovery of part of the cost of the investment. Other net gains and losses are recognized in OCI and are never reclassified to profit or loss. |
| |
Derecognition
The Group derecognizes a financial asset when the contractual rights to the cash flows from the asset expire, or it transfers the rights to receive the contractual cash flows in a transaction in which substantially all the risks and rewards of ownership of the financial asset are transferred.transferred or in which the Group neither transfers nor retains substantially all of the risks and rewards of ownership and it does not retain control of the financial asset.
The Group enters into transactions whereby it transfers assets recognized in its statement of financial position, but retains either all or substantially all of the risks and rewards of the transferred assets. In these cases the transferred assets are not derecognized. Any interest in such transferred financial assets that is created or retained by the Group is recognized as a separate asset or liability.
9.2. Financial assetsliabilities
Classification and subsequent measurement
Financial liabilities are offset and the net amount presented in the statement of financial position when, and only when, the Group has a legal right to offset the amounts and intends either to settle on a net basisclassified as measured at amortized cost or to realize the asset and settle the liability simultaneously.FVTPL.
The fair values of quoted investments are based on current bid prices. If the market for a financial asset is not active (and for unlisted securities), the Group establishes fair value by using valuation techniques. These include the use of recent arm's length transactions, reference to other instruments that are substantially the same, discounted cash flow analysis, and option pricing models refined to reflect the issuer's specific circumstances.
The Group classifies non-derivative financial assets into the following categories: financial assets at fair value through profit or loss, loans and receivables, cash and cash equivalents, held-to-maturity financial assets and available-for-sale financial assets. The Company determines the classification of its investments at initial recognition and re-evaluates this designation at every reporting date.
Financial assets at fair value through profit or loss
A financial assetliability is classified as at fair value through profit or lossFVTPL if it is classified as held for tradingheld-for-trading, it is derivative or it is designated as such on initial recognition. Financial assets are designated asliabilities at fair value through profit or loss if the Group manages such investments and makes purchase and sale decisions based on their fair value in accordance with the Group's treasury policy. Attributable transaction costs are recognized in profit or loss as incurred. Financial assets at fair value through profit or lossFVTPL are measured at fair value and changes therein, which takes into accountnet gains and losses, including any dividend income,interest expense, are recognized in profit or loss.
Assets in this category
Other financial liabilities are classified as current assets if they are expected to be realized within 12 months of the balance sheet date.
Loans and receivables
Loans and receivables are financial assets with fixed or determinable payments that are not quoted in an active market. Such assets are recognized initially at fair value plus any directly attributable transaction costs. Subsequent to initial recognition, loans and receivables aresubsequently measured at amortized cost using the effective interest method, less any impairment losses.
They arise when the Group provides money, goods or services directly to a debtor with no intention of trading the receivable. They are included in current assets, except for maturities greater than 12 months after the balance sheet date. These are classified as non-current assets. Loansmethod. Interest expense and receivables are included in tradeforeign exchange gains and other receivables in the statement of financial position.
Held-to-maturity financial assets
If the Group has the positive intent and ability to hold debt securities to maturity, then such financial assets are classified as held-to-maturity. Held-to-maturity financial assetslosses are recognized initially at fair value plus any directly attributable transaction costs. Subsequentin profit or loss. Any gains or loss on derecognition is also recognized
in profit or loss.
The financial liability related to initial recognition, held-to-maturity financial assets arethe 3 VLCCs under the sale and leaseback agreement entered into on December 30, 2019 (see Note 16) is measured at amortized cost using the effective interest method, less any impairment losses. Held-to-maturity financial assets comprise debentures.
method. It is remeasured when there is a
NOTES TO CONSOLIDATED FINANCIAL STATEMENTS 20172020
Note 1 - Significant accounting policies (Continued)
Available-for-sale financial assets
Available-for-sale financial assets are non-derivatives that are either designatedchange in this categoryfuture lease payments arising from a change in an index or not classifiedrate, if there is a change in anythe Group’s estimate of the other categories. Available-for-sale financial assets are recognized initially at fair value plus any directly attributable transaction costs.
Subsequent to initial recognition, they are measured at fair value and changes therein, other than impairment losses and foreign currency differences on available-for-sale debt instruments, are recognized in OCI and presented in the fair value reserve in equity. When an investment is derecognized, the gain or loss accumulated in equity is reclassified to profit or loss.
Available-for-sale financial assets comprise equity securities and debt securities.
They are included in non-current assets unless the Company intends to dispose of the investment within 12 monthsassets transferred at the end of the balance sheet date.
| |
(ii) | Non-derivative financial liabilities |
The Group initially recognizes debt securities issued and subordinated liabilities on the date that they are originated. All other financial liabilities (including liabilities designated as at fair value through profitlease term or loss) are recognized initially on the trade date, which is the date thatif the Group becomes a party tochanges its assessment of whether it will exercise the contractual provisions of the instrument.purchase option.
Derecognition
The Group derecognizes a financial liability when its contractual obligations are discharged, cancelledcanceled, or expire.
Non-derivativeexpired. The Group also derecognizes a financial liabilitiesliability when its terms are modified and the cash flows of the modified liability are substantially different, in which case a new financial liability based on the modified terms is recognized initially at fair value lessvalue.
On derecognition of a financial liability, the difference between the carrying amount extinguished and the consideration paid
(including any directly attributable transaction costs. Subsequent to initial recognition, these financialnon-cash assets transferred or liabilities are measured at amortized cost using the effective interest method.assumed) is recognized in profit or loss.
Non-derivative financial liabilities comprise loans and borrowings, bank overdrafts, and trade and other payables.
Bank overdrafts that are repayable on demand and form an integral part of the Group'sGroup’s cash management are included as
a component of cash and cash equivalents for the purpose of the statement of cash flows.
9.3. Derivative financial instruments
Derivative financial instruments and hedge accounting
The Group from time to time may enter into derivative financial instruments to hedge its exposure to market fluctuations, foreign exchange and interest rate risks arising from operational, financing and investment activities.
Derivative are initially measured at fair value; attributable transaction costs are expensed as incurred. Subsequent to initial recognition, derivatives are remeasured at fair value, and changes therein are generally recognized in profit or loss.
The group designated certain derivatives as hedging instruments to hedge the variability in cash flows.
The Group ensure that hedge accounting relationships are aligned with its risk management objectives and strategy and apply a more qualitative and forward looking approach in assessing hedge effectiveness. On initial designation of the derivative as hedging instrument, the Group formally documents the economic relationship between the hedging instrument(s) and hedged item(s), including the risk management objective(s) and strategy for undertaking the hedge. The Group also documents the methods that will be used to assess the effectiveness of the hedging relationship and makes an assessment whether the hedging instruments are expected to be “highly effective” in offsetting the changes in the cash flows of the respective hedged items during the period for which the hedge is designated.
On an ongoing basis, the Group assesses whether the hedge relationship continues and is expected to continue to remain highly effective using retrospective and prospective quantitative and qualitative analysis.
Hedges directly affected by interest rate benchmark reform
For the purpose of evaluation whether there is an economic relationship between the hedged item(s) and the hedging instrument(s), the Group assumes that the benchmark interest rate is not altered as a result of interest rate benchmark reform.
For a cash flow hedge of a forecast transaction, the Group assumes that the benchmark interest rate will not be altered as a result of interest rate benchmark reform for the purpose of assessing whether the forecast transaction is highly probable and presents an exposure to variations in cash flows that could ultimately affect profit or loss. In determining whether a previously designated forecast transaction in a discontinued cash flow hedge is still expected to occur, the Group assumes that the interest rate benchmark cash flows designated as a hedge will not be altered as a result of interest rate benchmark reform.
The Group will cease to apply the specific policy for assessing the economic relationship between the hedged item and the hedging instrument (i) to a hedged item or hedging instrument when the uncertainty arising from interest rate benchmark reform is no longer present with respect to the timing and the amount of the interest rate benchmark-based cash flows of the respective item or instrument or (ii) when the hedging relationship is discontinued. For its highly probable assessment of the hedged item, the Group will no longer apply the specific policy when the uncertainty arising from interest rate benchmark reform about the timing and the amount of the interest rate benchmark-based future cash flows of the hedged item is no longer present, or when the hedging relationship is discontinued.
See Note 19 for related disclosures.
| | | | | | | | |
(iii) | Share capitalEURONAV NV | |
NOTES TO CONSOLIDATED FINANCIAL STATEMENTS 2020
Note 1 - Significant accounting policies (Continued)
Cash flow hedges
When a derivative is designated as the hedging instrument in a hedge of the variability in cash flows attributable to a particular risk associated with a recognized asset or liability or a highly probable forecast transaction that could affect profit or loss, the effective portion of changes in the fair value of the derivative is recognized in OCI and presented in the hedging reserve in equity. The amount recognized in OCI is removed and included in profit or loss in the same period as the hedged cash flows affect profit or loss under the same line item in the statement of profit or loss as the hedged item. Any ineffective portion of changes in the fair value of the derivative is recognized immediately in profit or loss.
The Group designates only the change in fair value of the spot element of forward exchange contracts as the hedging instrument in cash flow hedging relationships. The change in fair value of the forward element of forward exchange contracts ('forward points') is separately accounted for as a cost of hedging and recognized in a costs of hedging reserve within equity.
If the hedging instrument no longer meets the criteria for hedge accounting, expires or is sold, terminated, exercised, or the designation is revoked, then hedge accounting is discontinued prospectively. When hedge accounting for cash flow hedges is discontinued, the amount that has been accumulated in the hedging reserve remains in equity until, for a hedge of a transaction resulting in the recognition of a non-financial item, it is included in the non-financial item's cost on its initial recognition or, for other cash flow hedges, it is reclassified to profit or loss in the same period or periods as the hedged expected future cash flows affect profit or loss.
If the hedged future cash flows are no longer expected to occur, then the balance in equity is reclassified to profit or loss.
9.4. Share capital
Ordinary share capital
Ordinary share capital is classified as equity. Incremental costs directly attributable to the issue of ordinary shares are recognized as a deduction from equity, net of any tax effects.
Repurchase of share capital
When share capital recognized as equity is repurchased, the amount of the consideration paid, including directly attributable costs, net of any tax effects, is recognized as a deduction from equity. Repurchased shares are classified as treasury shares and presented in the reserve for own shares. When treasury shares are sold or reissued subsequently, the amount received is recognized as an increase in equity, and the resulting surplus or deficit on the transaction is presented in share premium.retained earnings.
| |
(iv) | Derivative financial instruments |
The Group from time to time may enter into derivative
9.5. Compound financial instruments to hedge its exposure to market fluctuations, foreign exchange and interest rate risks arising from operational, financing and investment activities.
NOTES TO CONSOLIDATED FINANCIAL STATEMENTS 2017
Note 1 - Significant accounting policies (Continued)
On initial designation of the derivative as hedging instrument, the Group formally documents the relationship between the hedging instrument(s) and hedged item(s), including the risk management objectives and strategy in undertaking the hedge transaction, together with the methods that will be used to assess the effectiveness of the hedging relationship. The Group makes an assessment, both at the inception of the hedge relationship as well as on an ongoing basis, whether the hedging instruments are expected to be "highly effective" in offsetting the changes in the fair value or cash flows of the respective hedged items during the period for which the hedge is designated, and whether the actual results of each hedge are within a range of 80-125 percent. For a cash flow hedge of a forecast transaction, the transaction should be highly probable to occur and should present an exposure to variations in cash flows that could ultimately affect reported net income.
Derivative financial instruments are recognized initially at fair value; attributable transaction costs are expensed as incurred. Subsequent to initial recognition, all derivatives are remeasured to fair value, and changes therein are accounted for as follows:
Cash flow hedges
When a derivative is designated as the hedging instrument in a hedge of the variability in cash flows attributable to a particular risk associated with a recognized asset or liability or a highly probable forecast transaction that could affect profit or loss, the effective portion of changes in the fair value of the derivative is recognized in OCI and presented in the hedging reserve in equity.
The amount recognized in OCI is removed and included in profit or loss in the same period as the hedged cash flows affect profit or loss under the same line item in the statement of profit or loss as the hedged item. Any ineffective portion of changes in the fair value of the derivative is recognized immediately in profit or loss.
When the hedged item is a non-financial asset, the amount accumulated in equity is included in the carrying amount of the asset when the asset is recognized. In other cases, the amount accumulated in equity is reclassified to profit or loss in the same period that the hedged item affects profit or loss.
If the hedging instrument no longer meets the criteria for hedge accounting, expires or is sold, terminated, exercised, or the designation is revoked, then hedge accounting is discontinued prospectively. If the forecast transaction is no longer expected to occur, then the balance in equity is reclassified to profit or loss.
Other non-trading derivatives
When a derivative financial instrument is not held for trading, and is not designated in a qualifying hedge relationship, all changes in its fair value are recognized immediately in profit or loss.
| |
(v) | Compound financial instruments |
Compound financial instruments issued by the Group comprise Notes denominated in USD that can be converted to ordinary shares at the option of the holder, when the number of shares is fixed and does not vary with changes in fair value.
The liability component of compound financial instruments is initially recognized at the fair value of a similar liability that does not have an equity conversion option. The equity component is initially recognized at the difference between the fair value of the compound financial instrument as a whole and the fair value of the liability component. Any directly attributable transaction costs are allocated to the liability and equity component in proportion to their initial carrying amounts.
Subsequent to initial recognition, the liability component of a compound financial instrument is measured at amortized cost using the effective interest method. The equity component of a compound financial instrument is not remeasured.
Interest related to the financial liability is recognized in profit and loss. On conversion, the financial liability is reclassified to equity and no gain or loss is recognized.
NOTES TO CONSOLIDATED FINANCIAL STATEMENTS 20172020
Note 1 - Significant accounting policies (Continued)
10. Goodwill and intangible assets
| |
(i) | Goodwill and intangible assets |
10.1. Goodwill
Goodwill that arises on the acquisition of subsidiaries is presented as an intangible asset. For the measurement of goodwill at initial recognition, seerefer to accounting policy (f).7.1.
After initial recognition goodwill is measured at cost less accumulated impairment losses, (referrefer to accounting policy (k)).12. In respect of equity accounted investees, the carrying amount of goodwill is included in the carrying amount of the investment, and any impairment loss is allocated to the carrying amount of the equity accounted investee as a whole.
10.2. Intangible assets
Intangible assets that are acquired by the Group and have finite useful lives are measured at cost less accumulated amortization and impairment losses, (seerefer to accounting policy k).12.
The cost of an intangible asset acquired in a separate acquisition is the cash paid or the fair value of any other consideration given. The cost of an internally generated intangible asset includes the directly attributable expenditure of preparing the asset for its intended use.
| |
(iii) | Subsequent expenditure |
10.3. Subsequent expenditure
Subsequent expenditure on intangible assets is capitalized only when it increases the future economic benefits embodied in the specific asset to which it relates and its cost can be measured reliably. All other expenditure is expensed as incurred.
10.4. Amortization
Amortization is charged to the income statement on a straight-line basis over the estimated useful lives of the intangible assets from the date they are available for use. The estimated useful lives are as follows:
•Software: 3 - 5 years
Amortization methods, useful lives and residual values are reviewed at each reporting date and adjusted if appropriate.
| |
(j) | Vessels, property, plant and equipment |
11. Vessels, property, plant and equipment
11.1. Owned assets
Vessels and items of property, plant and equipment are stated at cost or deemed cost less accumulated depreciation (see below) and impairment losses, (referrefer to accounting policy (k)).12.
Cost includes expenditure that is directly attributable to the acquisition of the asset. The cost of self-constructed assets includes the following:
•The cost of materials and direct labor;
•Any other costs directly attributable to bringing the assets to a working condition for their intended use;
•When the Group has an obligation to remove the asset or restore the site, an estimate of the costs of dismantling and removing the items and restoring the site on which they are located; and
•Capitalized borrowing costs.
Where an item of property, plant and equipment comprises major components having different useful lives, they are accounted for as separate items of property, plant and equipment, (referrefer to accounting policy (j) vii).11.6.
Gains and losses on disposal of a vessel or of another item of property, plant and equipment are determined by comparing the net proceeds from disposal with the carrying amount of the vessel or the item of property, plant and equipment and are recognized in profit or loss.
NOTES TO CONSOLIDATED FINANCIAL STATEMENTS 2017
Note 1 - Significant accounting policies (Continued)
For the sale of vessels, or other items of property, plant and equipment, transfer of risk and rewards usually occurs upon delivery of the vessel to the new owner.
| | | | | | | | |
(ii) | Leased assets EURONAV NV | |
Leases in terms of which the Group assumes substantially all of the risks and rewards of ownership are classified as finance leases. Vessels, property, plant and equipment acquired by way of finance lease is stated at an amount equal to the lower of its fair value and the present value of the minimum lease payments at inception of the lease, less accumulated depreciation (see below) and impairment losses (referNOTES TO CONSOLIDATED FINANCIAL STATEMENTS 2020
Note 1 - Significant accounting policy (k)). Lease payments are accounted for as described in accounting policy (q). Other leases are operating leases and are not recognized in the Group's statement of financial position.policies (Continued)
(iii)11.2. Assets under construction
Assets under construction, especially newbuilding vessels, are accounted for in accordance with the stage of completion of the newbuilding contract. Typical stages of completion are the milestones that are usually part of a newbuilding contract: signing or receipt of refund guarantee, steel cutting, keel laying, launching and delivery. All stages of completion are guaranteed by a refund guarantee provided by the shipyard.
| |
(iv) | Subsequent expenditure |
11.3. Subsequent expenditure
Subsequent expenditure is capitalized only when it increases the future economic benefits embodied in the item of property, plant and equipment and its cost can be measured reliably. The carrying amount of the replaced part is derecognized. All other expenditure is recognized in the consolidated statement of profit or loss as an expense as incurred.
11.4. Borrowing costs
Borrowing costs that are directly attributable to the acquisition, construction or production of a qualifying asset are capitalized as part of the cost of that asset.
11.5. Depreciation
Depreciation is charged to the consolidated statement of profit or loss on a straight-line basis over the estimated useful lives of vessels and items of property, plant and equipment. Leased assets areThe right-of-use asset is depreciated overusing the shorterstraight-line method from the commencement date to the end of the lease term, and their useful lives unless it is reasonably certain thatthe lease transfers ownership of the underlying asset to the Group will obtain ownership by the end of the lease term.term or the cost of the right-of-use asset reflects that the Group will exercise a purchase option. In that case the right-of-use asset will be depreciated over the useful life of the underlying asset, which is determined on the basis of those of property and equipment (refer to accounting policy 18). Land is not depreciated.
Vessels and items of property, plant and equipment are depreciated from the date that they are available for use. Internally constructed assets are depreciated from the date that the assets are completed and ready for use.
The estimated useful lives of significant items of property, plant and equipment are as follows:
|
| | | | | | | |
| tankers | 20 years |
| FSO/FpSO/FPSO | 2530 years |
| plant and equipment | 5 - 20 years |
| fixtures and fittings | 5 - 10 years |
| other tangible assets | 3 - 20 years |
| dry-docking | 2.5 - 5 years |
The useful life of the FSOs have been reassessed from 25 years to 30 years due to the extension for ten years of the timecharter contract in direct continuation of their current contractual service, or until July 21, 2032 and September 21, 2032 respectively. The end of the useful economic life of the FSO vessels was set equal to the contract end date or approximately 30 years since build date. The net book value and depreciations were reassessed and applied prospectively as from the moment the extension was signed. The impact in the consolidated statement of profit or loss statement was immaterial.
Vessels are estimated to have a zero0 residual value.value except for the 3 VLCCs under the sale and leaseback agreement entered into on December 30, 2019 (see Note 16). In accordance with IFRS, this transaction was not accounted for as a sale but Euronav as seller-lessee will continue to recognize the transferred assets. The 3 vessels are subsequently depreciated over their useful lives (i.e. from the commencement date to the end of the lease term) as it is not reasonably certain that the Group will exercise the purchase option. Depreciation is calculated on the net carrying value of the 3 vessels as of December 30, 2019 less their estimate residual values using the straight-line method. The residual value, estimated at USD 21 million, is the amount that the Group could receive from disposal of the vessels at the reporting date if the vessels were already of the age and in the condition that they will be in at the end of the lease term.
Depreciation methods, useful lives at the end of the lease term and residual values are reviewed at each reporting date and adjusted if appropriate.
11.6. Dry-docking – component approach
NOTES TO CONSOLIDATED FINANCIAL STATEMENTS 2017
Note 1 - Significant accounting policies (Continued)
| |
(vii) | Dry-docking – component approach |
Where an item of property, plant and equipment comprises major components having different useful lives, they are accounted for as separate items of property, plant and equipment. Costs associated with routine repairs and maintenance are
NOTES TO CONSOLIDATED FINANCIAL STATEMENTS 2020
Note 1 - Significant accounting policies (Continued)
expensed as incurred including routine maintenance performed whilst the vessel is in dry-dock. Components installed during dry-dock with a useful life of more than 1 year will be amortizedare depreciated over their estimated useful life.useful-life.
| |
(i) | Non-derivative financial assets |
A
12. Impairment
12.1. Non-derivative financial assets
Financial instruments and contract assets
The impairment model applies to financial assets measured at amortized cost, contract assets and debt investments at FVOCI.
The financial assets at amortized cost consist of trade and other receivables, cash and cash equivalents and non-current receivables.
Under IFRS 9, loss allowances are measured on either of the following bases:
•12-month 'expected credit loss' (ECL): these are ECLs that result from possible default events within the 12 months after the reporting date; and
•lifetime ECLs: these are ECLs that result from all possible default events over the expected life of a financial instrument.
The Group measures loss allowances at an amount equal to lifetime ECLs, except for the following, which are measured in accordance with 12-months ECLs model:
•debt securities that are determined to have low credit risk at the reporting date; and
•other debt securities and bank balances for which credit risk (i.e. the risk of default occurring over the expected life of the financial instrument) has not increased significantly since initial recognition.
Loss allowances for trade receivables are measured at an amount equal to lifetime ECLs.
When determining whether the credit risk of a financial asset has increased significantly since initial recognition and when estimating ECLs, the Group considers reasonable and supportable information that is relevant and available without undue cost or effort. This includes both quantitative and qualitative information and analysis, based on the Group's historical experience and informed credit assessment and including forward-looking information.
The Group assumes that the credit risk on a financial asset has increased significantly if it is more than 180 days past due. The financial assets that are more than 180 days past due, which mainly relates to demurrage and TI pool outstandings, are followed up closely and as long as their collection is highly probable, they are not classifiedconsidered in default.
The Group considers a financial asset to be in default when the borrower is unlikely to pay its credit obligations to the Group in full, without recourse by the Group to actions such as realizing security (if any is held).
The cash and cash equivalents are held with bank and financial institution counterparties, which are rated A- to AA+, based on rating agency S&P. Derivatives are entered into with banks and financial institution counterparties, which are rated A to AA+, based on rating agency S&P.
The maximum period considered when estimating ECLs is the maximum contractual period over which the Group is exposed to credit risk.
Measurement of ECLs
ECLs are a probability-weighted estimate of credit losses. Credit losses are measured as the present value of all cash shortfalls (i.e. the difference between cash flows due to the entity in accordance with the contract and cash flows that the Group expects to receive). ECLs are discounted at fair value through profit or loss is assessed atthe effective interest rate of the financial asset.
Credit-impaired financial assets
At each reporting date, to determinethe Group assesses whether there is objective evidence that it is impaired.
financial assets carried at amortized cost and debt securities at FVOCI are credit-impaired. A financial asset is impaired if there is objective evidence of impairment as a result of'credit-impaired' when one or more events that occurred after the initial recognition of the asset, and that loss event(s) had anhave a detrimental impact on the estimated future cash flows of that asset that can be estimated reliably.
Objective evidence that financial assets are impaired includes default or delinquency by a debtor, restructuring of an amount due to the Group on terms that the Group would not consider otherwise, indications that a debtor or issuer will enter bankruptcy, adverse changes in the payment status of borrowers or issuers, economic conditions that correlate with defaults or the disappearance of an active market for a security. In addition, for an investment in an equity security a significant or prolonged decline in the fair value of the security below its cost is objective evidence of impairment.
Financial assets measured at amortized cost
The Group considers evidence of impairment for financial assets measured at amortized cost (loans and receivables and held-to-maturity financial assets) at both a specific asset and collective level. All individually significant assets are assessed for specific impairment. Those found not to be specifically impaired are then collectively assessed for any impairment that has been incurred but not yet identified. Assets that are not individually significant are collectively assessed for impairment by grouping together assets with similar risk characteristics.
In assessing collective impairment, the Group uses historical trends of the probability of default, the timing of recoveries and the amount of loss incurred, adjusted for management's judgement as to whether current economic and credit conditions are such that the actual losses are likely to be greater or less than suggested by historical trends.
An impairment loss in respect of a financial asset measured at amortized cost is calculated as the difference between its carrying amount and the present value of the estimated future cash flows discounted at the asset's original effective interest rate. Losses are recognized in profit or loss and reflected in an allowance account against loans and receivables or held-to maturity financial assets. Interest on the impaired asset continues to be recognized. When an event occurring after the impairment was recognized causes the amount of impairment loss to decrease, the decrease in impairment loss is reversed through profit or loss.
Available-for-sale financial assets
Impairment losses on available-for-sale financial assets are recognized by reclassifying the losses accumulated in the fair value reserve in equity to profit or loss. The cumulative loss that is reclassified from equity to profit or loss is the difference between the acquisition cost, net of any principal repayment and amortization, and the current fair value, less any impairment loss recognized previously in profit or loss. Changes in cumulative impairment losses attributable to the application of the effective interest method are reflected as a component of interest income. If, in a subsequent period, the fair value of an impaired available-for-sale debt security increases and the increase can be related objectively to an event occurring after the impairment loss was recognized, then the impairment loss is reversed, with the amount of the reversal recognized in profit or loss. However, any subsequent recovery in the fair value of an impaired available-for-sale equity security is recognized in OCI.
Equity-accounted investees
An impairment loss in respect of an equity-accounted investee is measured by comparing the recoverable amount of the investment with its carrying amount. An impairment loss is recognized in profit or loss, and is reversed if there has been a favorable change in the estimates used to determine the recoverable amount.
have occurred.
NOTES TO CONSOLIDATED FINANCIAL STATEMENTS 20172020
Note 1 - Significant accounting policies (Continued)
Presentation of allowance for ECL
Loss allowances for financial assets measured at amortized cost are deducted from the gross carrying amount of the assets. The impairment loss on trade receivable has been presented in 'general and administrative expenses'.
For debt securities at FVOCI, the loss allowance is recognized in OCI, instead of being recorded in the statement of profit or loss.
Impairment losses on other financial assets are not presented separately in the statement of profit or loss and OCI, because the amount is not material. It has been presented as part of the line 'finance expenses'.
Write-off
The gross carrying amount of a financial asset is written off when the Group has no reasonable expectations of recovering a financial asset in its entirety or a portion thereof. The Group calculates the ELC on trade and other receivables based on actual credit loss experience over the past 10 years taking into account reasonable and supportable forecast of future economic conditions.
12.2 Non-financial assets
The carrying amounts of the Group'sGroup’s non-financial assets, other than deferred tax assets (refer to accounting policy (s))21), inventory and contract assets, are reviewed at each reporting date to determine whether there is any indication of impairment. If any such indication exists, the asset'sasset’s recoverable amount is estimated.
Goodwill and indefinite-lived intangible assets areis tested annually for impairment. An
For the purpose of impairment losstesting, assets are grouped together into the smallest group of assets that generates cash inflows from continuing use that are largely independent of the cash inflows of other assets or CGU’s. Goodwill acquired in a business combination is recognized wheneverallocated to groups of CGU’s that are expected to benefit from the carrying amountsynergies of an asset or its cash-generating unit (CGU) exceeds its recoverable amount.the combination.
The recoverable amount of an asset or CGU is the greater of its fair value less cost to sell and value in use. In assessing value in use, the estimated future cash flows are discounted to their present value using a pre-tax discount rate that reflects current market assessments of the time value of money and the risks specific to the asset or CGU. Future cash flows are based on current market conditions, historical trends as well as future expectations. For
An impairment loss is recognized if the purposecarrying amount of impairment testing, assets are grouped together into the smallest group of assets that generates cash inflows from continuing use that are largely independent of the cash inflows of other assetsan asset or CGUs. Goodwill acquired in a business combination is allocated to groups of CGUs that are expected to benefit from the synergies of the combination.
CGU exceeds its recoverable amount. Impairment losses are recognized in profit or loss. Impairment losses recognized in respect of CGUs are allocated first to reduce the carrying amount of any goodwill allocated to the CGU (group of CGUs), and then to reduce the carrying amounts of the other assets in the CGU (group of CGUs) on a pro rata basis.
An impairment loss recognized for goodwill shall not be reversed. For other assets, an impairment loss is reversed only to the extent that the asset'sasset’s carrying amount does not exceed the carrying amount that would have been determined, net of depreciation or amortization, if no impairment loss had been recognized.
Tankers
The Group analyzes the following internal and external indicators to assess whether tankers might be impaired:
• the obsolescence or physical damage of an asset;
• significant changes in the extent or manner in which vessels are (or are expected to be) used that have (or will have) an adverse effect on the entity;
• plans to dispose of assets before the previously expected date of disposal;
• indications that the performance of a CGU is, or will be, worse than expected;
• significant increases in cash flows for acquiring, operating or maintaining vessels that are significantly higher than originally budgeted;
• net cash flows or operating profits that are lower than originally budgeted;
• net cash outflows or operating losses;
• market capitalization below net asset value;
• a significant and unexpected decline in market value of vessels;
• significant adverse effects in the technological, market, economic, legal and regulatory environment, including but not limited to, vessel and crude oil supply and demand trends;
• increases in market interest rates.
| | | | | | | | |
(l) | Assets held for saleEURONAV NV | |
NOTES TO CONSOLIDATED FINANCIAL STATEMENTS 2020
Note 1 - Significant accounting policies (Continued)
Euronav defines its cash generating unit as a single vessel, unless such vessel is operated in a profit-sharing pool, in which case such vessel, together with the other vessels in the pool, are collectively treated as a cash generating unit.
When events and changes in circumstances indicate that the carrying amount of the asset or CGU might not be recovered, the Group performs an impairment test whereby the carrying amount of the asset or CGU is compared to its recoverable amount, which is the greater of its value in use and its fair value less cost to sell. For assessing value in use, assumptions are made regarding forecast charter rates, using the weighted average of past and ongoing shipping cycles including management judgment for the ongoing cycle and for the weighting factors applied, the weighted average cost of capital ('WACC'), the useful life of the vessels (20 years for tankers) and a residual value. After careful consideration of the trends in the shipping industry, the Group elected to retain residual values for its vessels equal to 0.
Although management believes that its process to determine the assumptions used to evaluate the carrying amount of the assets, when required, are reasonable and appropriate, such assumptions are subject to judgment. Management is assessing continuously the resilience of its projections to the business cycles that can be observed in the tankers market, and concluded that a business cycle approach provides a better long-term view of the dynamics at play in the industry. By defining a shipping cycle from peak to peak over the last 20 years and including management's expectation of the completion of the current cycle, management is better able to capture the full length of a business cycle while also giving more weight to recent and current market experience. The current cycle is forecasted based on management judgment, analyst reports and past experience. Long term charter rates are used in the calculation in case available.
FSOs
In the context of the valuation of the Group's investments in the respective joint ventures, the Group also reviews internal and external indicators, similar to the ones used for tankers, to assess whether the FSOs might be impaired. When events and changes in circumstances indicate that the carrying amount of the assets might not be recovered, the Group performs an impairment test on the FSO vessels owned by TI Asia Ltd and TI Africa Ltd, based on a value in use calculation to estimate the recoverable amount from the vessel. This method is chosen as there is no efficient market for transactions of FSO vessels as each vessel is often purposely built for specific circumstances. In assessing value in use, assumptions are made regarding forecast charter rates, weighted average cost of capital ('WACC'), the useful life of the FSOs (30 years) and a residual value. After careful consideration of the trends in the shipping industry, the Group elected to retain residual values for its vessels equal to 0.
The value in use calculation for FSOs, when required, is based on the remaining useful life of the vessels as of the reporting date, and forecast charter rates are determined using the fixed daily contract rates. The FSO Asia and the FSO Africa are on a five years timecharter contract to North Oil Company, the operator of the Al-Shaheen oil field, whose shareholders are Qatar Petroleum Oil & gas Limited and Total E&P Golfe Limited, until July 22, 2022 and September 22, 2022, respectively. In November 2020, the two joint ventures (TI Asia Ltd and TI Africa Ltd.) signed an extension for ten years in direct continuation of their current contractual service, or until July 21, 2032 and September 21, 2032 respectively. Following this extension of the contract with North Oil Company until 2032, the end of the useful economic life was set equal to the contract end date or approximately 30 years since build date.
13. Assets held for sale
Non-current assets, or disposal groups comprising assets and liabilities, that are expected to be recovered primarily through sale rather than through continuing use are classified as held for sale. Immediately before classification as held for sale, the assets, or components of a disposal group, are remeasured in accordance with the Group'sGroup’s accounting policies. Thereafter generally the assets or disposal group are measured at the lower of their carrying amount and fair value less cost to sell.of disposal. Any impairment loss on a disposal group is allocated first to goodwill, and then to the remaining assets and liabilities on a pro rata basis, except that no loss is allocated to inventories, financial assets, deferred tax assets, employee benefit assets or investment property, which continue to be measured in accordance with the Group'sGroup’s accounting policies. Impairment losses on initial classification as held for sale and subsequent gains and losses on remeasurement are recognized in profit or loss. Gains are not recognized in excess of any cumulative impairment loss.
Once classified as held for sale, intangible assets and property, plant and equipment are no longer amortized or depreciated,
and any equity-accounted investee is no longer equity accounted.
14. Bunker inventory
| | | | | | | | |
(m) | Employee benefitsEURONAV NV | |
NOTES TO CONSOLIDATED FINANCIAL STATEMENTS 2020
Note 1 - Significant accounting policies (Continued)
The Group has been purchasing compliant bunker fuel for future use by its vessels. Bunkers are presented as inventory and are accounted for on a weighted average basis. The cost of inventories comprises of the purchase price, fuel inspection costs and transport and handling costs. The effective portion of the change in fair value of derivatives designated as cash flow hedges of the underlying price index between the date of purchase and the date of delivery is also recognized as an inventory cost. The ineffective portion of the change in fair value of these derivatives is recognized directly in profit or loss.
The inventory is accounted for at the lower of cost and net realizable value with cost being determined on a weighted average basis. No write down is needed as long as the freight market remains robust offsetting potential higher weighted average consumption costs of the bunker oil consumed from that inventory.
Bunker expenses are recognized in profit or loss upon consumption.
| | | | | | | | |
(i) | Defined contribution plansEURONAV NV | |
NOTES TO CONSOLIDATED FINANCIAL STATEMENTS 2020
Note 1 - Significant accounting policies (Continued)
15. Employee benefits
15.1. Defined contribution plans
A defined contribution plan is a post-employment benefit plan under which an entity pays fixed contributions into a separate entity and has no legal or constructive obligation to pay further amounts. Obligations for contributions to defined contribution plans are recognized as an employee benefit expense in profit or loss in the periods during which related services are rendered by employees. Prepaid contributions are recognized as an asset to the extent that a cash refund or a reduction in future payments is available. Contributions to a defined contribution plan that are due more than 12 months after the end of the period in which the employees render the services are discounted to their present value. The calculation of defined contribution obligations is performed annually by a qualified actuary using the projected unit credit method.
| |
(ii) | Defined benefit plans |
15.2. Defined benefit plans
The Group'sGroup’s net obligation in respect of defined benefit plans is calculated separately for each plan by estimating the amount of future benefit that employees have earned in the current and prior periods, discounting that amount and deducting the fair value of any plan assets.
NOTES TO CONSOLIDATED FINANCIAL STATEMENTS 2017
Note 1 - Significant accounting policies (Continued)
The calculation of defined benefit obligations is performed annually by a qualified actuary using the projected unit credit method. When the calculation results in a potential asset for the Group, the recognized asset is limited to the present value of economic benefits available in the form of any future refunds from the plan or reductions in future contributions to the plan. To calculate the present value of economic benefits, consideration is given to any applicable minimum funding requirements.
Remeasurements of the net defined benefit liability, which comprise actuarial gains and losses, the return of plan assets (excluding interest) and the effect of the asset ceiling (if any, excluding interest), are recognized immediately in OCI. The Group determines the net interest expense (income) on the net defined benefit liability (asset) for the period by applying the discount rate used to measure the defined benefit obligation at the beginning of the annual period to the then-net defined benefit liability (asset), taking into account any changes in the net defined benefit liability (asset) during the period as a result of contributions and benefit payments. Net interest expense and other expenses related to defined benefit plans are recognized in profit and loss.
When the benefits of a plan are changed or when a plan is curtailed, the resulting change in benefit that relates to past service or the gain or loss on curtailment is recognized immediately in profit or loss. The Group recognizes gains and losses on the settlement of a defined plan when the settlement occurs.
| |
(iii) | Other long term employee benefits |
15.3. Other long term employee benefits
The Group'sGroup’s net obligation in respect of long-term employee benefits, other than pension plans, is the amount of future benefit that employees have earned in return for their service in the current and prior periods. The obligation is calculated using the projected unit credit method and is discounted to its present value and the fair value of any related assets is deducted. The discount rate is the yield at the reporting date on AA credit rated bonds that have maturity dates approximating the terms of the Group'sGroup’s obligations and that are denominated in the currency in which the benefits are expected to be paid. Remeasurements are recognized in profit or loss in the period in which they arise.
15.4. Termination benefits
Termination benefits are recognized as an expense when the Group is demonstrably committed, without realistic possibility or withdrawal, to a formal detailed plan to either terminate employment before the normal retirement date, or to provide termination benefits as a result of an offer made to encourage voluntary redundancy. Termination benefits for voluntary redundancies are recognized as an expense if the Group has made an offer of voluntary redundancy, it is probable that the offer will be accepted, and the number of acceptances can be estimated reliably. If benefits are payable more than 12 months after the reporting date, then they are discounted to their present value.
| | | | | | | | |
(v) | Short-term employee benefitEURONAV NV | |
NOTES TO CONSOLIDATED FINANCIAL STATEMENTS 2020
Note 1 - Significant accounting policies (Continued)
15.5. Short-term employee benefit
Short-term employee benefit obligations are measured on an undiscounted basis and are expensed as the related service is provided. A liability is recognized for the amount expected to be paid under short-term cash bonus or profit-sharing plans if the Group has a present legal or constructive obligation to pay this amount as a result of past service provided by the employee, and the obligation can be estimated reliably.
| |
(vi) | Share-based payment transactions |
15.6. Share-based payment transactions
The grant-date fair value of equity-settled share-based payment awards granted to employees is generally recognized as an expense, with a corresponding increase in equity, over the vesting period of the awards. The amount recognized as an expense is adjusted to reflect the number of awards for which the related service and non-market performance conditions are expected to be met, such that the amount ultimately recognized is based on the number of awards that meet the related service and non-market performance conditions at the vesting date.
The fair value of the amount payable to beneficiaries in respect of "phantom“phantom stock unit"unit” grants, which are settled in cash, is recognized as an expense with a corresponding increase in liabilities, over the period during which the beneficiaries become unconditionally entitled to payment. The amountfair value of the Transaction Based Incentive Plan is being determined by using a binomial model with cost being spread of the expected vesting period over the various tranches. The fair value of the Long term incentive plan is remeasured at each reporting date and at settlement based on the fair value of the phantom stock units. Any changes in the liability are recognized in profit or loss.
NOTES TO CONSOLIDATED FINANCIAL STATEMENTS 2017
Note 1 - Significant accounting policies (Continued)
A provision is recognized when the Group has a legal or constructive obligation that can be estimated reliably, as a result of a past event, and it is probable that an outflow of economic benefits will be required to settle the obligation. The provisions are determined by discounting the expected future cash flows at a pre-tax rate that reflects current market assessments of the time value of money and, where appropriate, the risks specific to the liability. The unwinding of the discount is recognized as finance cost.
Restructuring
A provision for restructuring is recognized when the Group has approved a detailed and formal restructuring plan, and the restructuring has either commenced or has been announced publicly. Future operating costs are not provided for.
Onerous contracts
A provision for onerous contracts is recognized when the expected benefits to be derived by the Group from a contract are lower than the unavoidable cost of meeting its obligations under the contract. The provision is measured at the present value of the lower of the expected cost of terminating the contract and the expected net cost of continuing with the contract. Before a provision is established, the Group recognizes any impairment loss on the assets associated with that contract.
17. Revenue
17.1. Pool Revenues
Aggregated revenue recognized on a daily basis from vessels operating on voyage charters in the spot market and on contract of affreightment ("COA"(“COA”) within the pool is converted into an aggregated net revenue amount by subtracting aggregated voyage expenses (such as fuel and port charges) from gross voyage revenue. These aggregated net revenues are combined with aggregated floating time charter revenues to determine aggregated pool Time Charter Equivalent revenue ("TCE"(“TCE”). Aggregated pool TCE revenue is then allocated to pool partners in accordance with the allocated pool points earned for each vessel that recognizes each vessel'svessel’s earnings capacity based on its cargo, capacity, speed and fuel consumption performance and actual on hire days. The TCE revenue earned by our vessels operated in the pools is equal to the pool point rating of the vessels multiplied by time on hire, as reported by the pool manager.
Revenue from the floating time charter agreements under which vessels are employed by the TI Pool is accounted for under IFRS 15 Revenue from Contracts with Customers.
| | | | | | | | |
(ii) | Time - and Bareboat chartersEURONAV NV | |
NOTES TO CONSOLIDATED FINANCIAL STATEMENTS 2020
Note 1 - Significant accounting policies (Continued)
17.2. Time - and Bareboat charters
As a lessor, the Group leases out some of its vessels under time charters and bareboat charters, refer to accounting policy 19. Lessors shall classify each lease as an operating lease or a finance lease. A lease is classified as a finance lease if it transfers substantially all the risks and rewards incidental to ownership of an underlying asset. Otherwise a lease is classified as an operating lease.
Revenues from time charters and bareboat charters are accounted for as operating leases and are recognized on a straight line basis over the periods of such charters, as service is performed (refer to accounting policy 19.A.2). IFRS 16 requires the Group to separate lease and non-lease components, with the lease component qualifying as operating lease under IFRS16 and the service components accounted for under IFRS 15.
The
17.3. Spot voyages
As from 1 January 2018, the Group does not recognizeapplied IFRS 15. Voyage revenue is recognized over time charter revenues during periods that vessels are offhire.
Within the shipping industry, there are two methods used to account for voyage revenues: ratably over the estimated length of each voyage and completed voyage.
The recognition of voyage revenues ratablyspot charters on a daily basis overload-to-discharge basis. Progress is determined based on time elapsed. Voyage expenses are expensed as incurred unless they are incurred between the estimated length of each voyage isdate on which the most prevalent method of accounting for voyage revenuescontract was concluded and the method used by the Group and the pools in which we participate. Under each method, voyages may be calculated on either a load-to-load or discharge-to-discharge basis. In applying its revenue recognition method, management believes that the discharge-to-discharge basis of calculating voyages more accurately estimates voyage results than the load-to-load basis. Since, at the time of discharge, management generally knows the next load port. They are then capitalized if they qualify as fulfillment costs and if they are expected to be recovered.
When our vessels cannot start or continue performing its obligation due to other factors such as port and expecteddelays, a demurrage is paid. The applicable demurrage rate is stipulated in the contract. Demurrage which occurs at the discharge port the discharge-to-discharge calculation of voyage revenues can be estimated withis recognized as incurred. As demurrage is often a greater degree of accuracy.commercial discussion between Euronav does not begin recognizing voyage revenue until a charter has been agreed to by both the Group and the customer, even ifcharterer, the vessel has discharged its cargooutcome and is sailing to the anticipated load port on its next voyage because it is only at this time the charter rate is determinabletotal compensation received for the specified load and discharge ports and collectabilitydelay is reasonably assured.
not always certain. As such, Euronav only recognizes the revenue which is highly probable to be received. No revenue is recognized if there are significant uncertainties regarding recoverythe collection of the consideration dueis not highly probable. The amount of revenue recognized is estimated based on historical data. The Group updates its estimate on an annually basis.
Payment is typically done at the end of the voyage. There is no specific financing component.
18. Gain and associated costs.losses on disposal of vessels
NOTES TO CONSOLIDATED FINANCIAL STATEMENTS 2017
Note 1 - Significant accounting policies (Continued)
| |
(p) | Gain and losses on disposal of vessels |
In view of their importance the Group reports capital gains and losses on the sale of vessels as a separate line item in the consolidated statement of profit or loss. For the sale of vessels, transfer of risks and awardscontrol usually occurs upon delivery of the vessel to the new owner.
19. Leases
The Group has applied IFRS 16 using the modified retrospective approach and therefore the comparative information for 2018 has not been restated and continues to be reported under IAS 17 and IFRIC 4.
At inception of a contract, the Group assesses whether a contract is, or contains, a lease. A contract is, or contains, a lease if the contract conveys the right to control the use of an identified asset for a period of time in exchange for consideration. To assess whether a contract conveys the right to control the use of an identified asset, the Group uses the definition of a lease in IFRS 16.
1. As a lessee
The Group recognizes a right-of-use asset and a lease liability at the lease commencement date. The right-of-use asset is initially measured at the amount equal to the lease liability adjusted by initial direct costs incurred by the lessee. Adjustments may also be required for any payments made at or before the commencement date and an estimate of costs to dismantle and remove the underlying asset or to restore the underlying asset or the site on which it is located, less any lease incentives received.
After lease commencement, the Group measures the right-of-use asset using a cost model, namely at cost less accumulated depreciation and accumulated impairment. The right-of-use asset is subsequently depreciated using the straight-line method, refer to accounting policy 10.5. In addition, the right-of-use asset is periodically reduced by impairment losses, if any, and adjusted for certain remeasurements of the lease liability.
The lease liability is initially measured at the present value of the lease payments that are not paid at the commencement date, discounted using the interest rate implicit in the lease or, if that rate cannot be readily determined, the Group's
NOTES TO CONSOLIDATED FINANCIAL STATEMENTS 2020
Note 1 - Significant accounting policies (Continued)
incremental borrowing rate. Generally, the Group uses its incremental borrowing rate as the discount rate. The lessee's incremental borrowing rate is the rate of interest that a lessee would have to pay to borrow over a similar term, and with a similar security, the funds necessary to obtain an asset of a similar value to the right-of-use asset in a similar economic environment. The Group determines its incremental borrowing rate by obtaining interest rates from various external financing sources (e.g. World office yield rate) and makes certain adjustments to reflect the terms of the lease and type of the asset leased or by calculating the weighted average of the cost of secured debt and unsecured debt.
Lease payments included in the measurement of the lease liability comprise the following:
- fixed payments;
- variable lease payments that depend on an index or a rate;
- amounts expected to be payable under a residual value guarantee and
- the exercise price under a purchase option that the Group is reasonably certain to exercise, lease payments in an optional renewal period if the Group is reasonably certain to exercise an extension option, and penalties for early termination of a lease unless the Group is reasonably certain not to terminate early.
The lease liability is subsequently increased by the interest cost on the lease liability and decreased by lease payments made. It is remeasured when there is a change in future lease payments arising from a change in an index or rate, if there is a change in the Group's estimate of the amount expected to be payable under a residual value guarantee, or if the Group changes its assessment of whether the purchase or extension option is reasonably certain to be exercised or a termination option is reasonably certain not to be exercised.
The Group has applied judgment to determine the lease term for some lease contracts in which it is a lessee that include renewal options. The assessment of whether the Group is reasonably certain to exercise such options impacts the lease term, which significantly affects the amount of lease liabilities and right-of-use assets recognized.
When the lease liability is remeasured in this way, a corresponding adjustment is made to the carrying amount of the right-of-use asset, or is recorded in the profit or loss if the carrying amount of the right-to-use asset has been reduced to zero.
Lease and non-lease components in the contracts are separated.
Short-term leases and leases of low-value assets
The Group has elected not to recognize right-of-use assets and lease liabilities for leases of low-value assets and short-term leases, including IT equipment. The Group recognizes the lease payments associated with these leases as an expense on a straight-line basis over the lease term.
2. As a lessor
When the Group acts as a lessor, it determines at lease inception whether each lease is a finance or operating lease.
To classify each lease, the Group makes an overall assessment of whether the lease transfers substantially all of the risks and rewards incidental to ownership of the underlying asset. If this is the case, then the lease is a finance lease; if not, then it is an operating lease. As part of this assessment, the Group considers certain indicators such as whether the lease is for the major part of the economic life of the asset.
If the lease qualifies as an operating lease, e.g. time charter out, the leased asset remains on the balance sheet of the lessor and continues being depreciated. The adoption of IFRS 16 required the Group to separate the lease and non-lease component in the contract, with the lease component qualified as operating lease and the non-lease component accounted for under IFRS 15. The Group recognizes lease payments received under operating leases as income on a straight-line basis over the lease term as part of 'revenue' (refer to accounting policy 17.2.) Payments related to service component made under operating leases are also recognized in the income statement over the term of the lease.
The Group sub-leases some of its properties. The sub-lease contracts are classified as finance leases under IFRS 16. For these sub-lease, the right-of-use asset related to the head lease was derecognized and a lease receivable, at an amount equal to the net investment, relating to the sublease is recognized. Subsequently the Group recognizes finance income over the lease term of a finance lease, based on a pattern reflecting a constant periodic rate of return on the net investment and if applicable impairment losses on lease receivable.
NOTES TO CONSOLIDATED FINANCIAL STATEMENTS 2020
Note 1 - Significant accounting policies (Continued)
Policy applicable before 1 January 2019
For contracts entered into before 1 January 2019, the Group determined whether the arrangement was or contained a lease.
1. As a lessee
Leases in terms of which the Group assumes substantially all of the risks and rewards of ownership were classified as finance leases. Vessels, property, plant and equipment acquired by way of finance lease was stated at an amount equal to the lower of its fair value and the present value of the minimum lease payments at inception of the lease, less accumulated depreciation (see below) and impairment losses (refer to accounting policy 12). Lease payments were accounted for as described in accounting policy 19.A.1. Other leases are operating leases and were not recognized in the Group’s statement of financial position.
2. As a lessor
Payments received under operating leases were recognized in the income statement on a straight-line basis over the term of the lease. Lease incentives received arewere recognized as an integral part of the total lease expense, over the term of the lease.
Minimum lease payments made under finance leases arewere apportioned between the finance expense and the reduction of the outstanding liability. The finance expense iswere allocated to each period during the lease term so as to produce a constant period rate of interest on the remaining balance of the liability.
| |
(r) | Finance income and finance cost |
20. Finance income and finance cost
Net financing costs comprise interest payable on borrowings calculated using the effective interest rate method, dividends on redeemable preference shares, interest receivable on funds invested, dividend income, foreign exchange gains and losses, and gains and losses on hedging instruments that are recognized in the consolidated statement of profit or loss (refer to accounting policy (h))8).
The 'effective interest rate' is the rate that exactly discounts estimated future cash payments or receipts through the expected life of the financial instrument to:
• the gross carrying amount of the financial asset; or
• the amortized cost of the financial liability.
In calculating interest income and expense, the effective interest rate is applied to the gross carrying amount of the asset (when the asset is not credit-impaired) or to the amortized cost of the liability.
Interest income is recognized in the consolidated statement of profit or loss as it accrues, taking into account the effective yield on the asset. Dividend income is recognized in the consolidated statement of profit or loss on the date that the dividend is declared. Interest income related to finance lease for the subleases is also recognized in the consolidated statement of profit or loss. as a finance income.
The interest expense component of finance lease paymentsliabilities is recognized in the consolidated statement of profit or loss using the effective interest rate method.
21. Income tax
Income tax expense comprises current and deferred tax. Current tax and deferred tax are recognized in profit or loss except to the extent that it relates to a business combination, or items recognized directly in equity or in OCI.
Current tax is the expected tax payable on the taxable income for the year, using tax rates enacted or substantially enacted at the balance sheet date, and any adjustment to tax payable in respect of previous years.
Deferred tax is recognized using the balance sheet method, in respect of temporary differences between the carrying amounts of assets and liabilities for financial reporting purposes and the amounts used for taxation purposes. Deferred tax is not recognized for: the initial recognition of goodwill, the initial recognition of assets or liabilities that affect neither accounting nor taxable profit, and differences relating to investments in subsidiaries to the extent that they will probably not reverse in the foreseeable future. The amount of deferred tax recognized is based on the expected manner of realization or settlement of the carrying amount of assets and liabilities, using tax rates enacted or substantially enacted at the balance sheet date. Deferred tax assets and liabilities are offset if there is a legally enforceable right to offset current tax liabilities and assets, and they relate to income taxes levied by the same tax authority on the same taxable entity.
NOTES TO CONSOLIDATED FINANCIAL STATEMENTS 2020
Note 1 - Significant accounting policies (Continued)
A deferred tax asset is recognized only to the extent that it is probable that future taxable profits will be available against which the asset can be utilized. Deferred tax assets are reviewed at each reporting date and are reduced to the extent that it is no longer probable that the related tax benefit will be realized.
In application of an IFRIC agenda decision on IAS 12 Income taxes, tonnage tax is not accounted for as income taxes in accordance with IAS 12 and is not presented as part of income tax expense in the income statement but is shown as an administrative expense under the heading Other operating expenses. In accordance to IFRIC 23 the Group assesses whether there is any uncertainty over Income Tax Treatments. The amount is the best estimate of the tax amount expected to be paid or received that reflects uncertainty related to income taxes.
F-2422. Segment reporting
NOTES TO CONSOLIDATED FINANCIAL STATEMENTS 2017
Note 1 - Significant accounting policies (Continued)
An operating segment is a component of the Group that engages in business activities from which it may earn revenues and incur expenses, including revenues and expenses that relate to transactions with any of the Group's other components. The Group distinguishes two2 segments: the operation of crude oil tankers in the international markets and the floating storage and offloading operations (FSO/FpSO). The Group's internal organizational and management structure does not distinguish any geographical segments.
| |
(u) | Discontinued operations |
23. Discontinued operations
A discontinued operation is a component of the Group'sGroup’s business that represents a separate major line of business or geographical area of operations that has been disposed of or is held for sale, or is a subsidiary acquired exclusively with a view to resale. Classification as a discontinued operation occurs upon disposal or when the operation meets the criteria to be classified as held for sale, if earlier. When an operation is classified as a discontinued operation, the comparative statement of profit or loss is represented as if the operation had been discontinued from the start of the comparative period.
| |
(v) | New standards and interpretations not yet adopted |
24. New standards and interpretations not yet adopted
A number of new standards, amendments to standards and interpretations are not yet effective for the year ended 31 December, 2017,2020, and have not been applied in preparing these consolidated financial statements:
IFRS 9 Financial instruments, the IASB issued the final version of IFRS 9 Financial Instruments in July 2014. IFRS 9 is effective for annual periods beginning on or after 1 January 2018, with early adoption permitted. The Group will apply IFRS 9 initially on 1 January 2018 and will not restate comparative information for prior periods. The new standard will require the Group to revise its accounting processes and internal controls related to reporting financial instruments. An analysis indicated that the initial adoption of IFRS 9 on January 1, 2018 would result in a provision for doubtful debtors of USD 16k. The adoption of IFRS 9 will not have any other impact on the classification or measurement of financial assets.
IFRS 15 Revenue from Contracts with Customersestablishes a comprehensive framework for determining whether, how much and when revenue is recognized. It replaces existing revenue recognition guidance, including IAS 18 Revenue, IAS 11 Construction Contracts, IFRIC 13 Customer Loyalty Programmes, IFRIC 15 Agreements for the Construction of Real Estate, IFRIC 18 Transfers of Assets from Customers and SIC 31 Barter Transactions Involving Advertising Services. IFRS 15 is effective for the annual periods beginning on or after January 1, 2018, with early adoption permitted. The standard establishes a five-step model that will apply to revenue earned from a contract with a customer. The standard’s requirements will also apply to the sale of some non-financial assets that are not part of the entity’s ordinary activities (e.g., sales of property or plant and equipment). Extensive disclosures will be required, including disaggregation of total revenue, information about performance obligations, changes in contract asset and liability account balances between periods and key judgements and estimates.
The guidance permits two methods of adoption: retrospectively to each prior reporting period presented (full retrospective method), or the cumulative effect of initially applying the guidance recognized at the date of initial application (the cumulative catch-up transition method). The Group will adopt the standard using the cumulative catch-up transition method. The new standard will be effective for us beginning January 1, 2018. The Group has undertaken a comprehensive approach to assess the impact of the guidance on its business by reviewing the current accounting policies and practices to identify any potential differences that may result from applying the new requirements to the consolidated financial statements. Part of the Group’s revenue is generated from time charters, where revenue is recognized on an accrual basis and is recorded over the term of the charter as the service is provided. This new guidance will not have any impact on this aspect of the Group’s revenue. For spot charters, we recognize revenue on a discharge-to-discharge basis in determining the percentage of completion for all voyage charters. After consulting with other shipping companies on business assumptions, processes, systems and controls the Group decided to recognize revenue on a load-to-discharge basis as from January 1, 2018. Under this new standard the Group will also capitalize the voyage expenses incurred between the previous discharge port and the next load port if they qualify as fulfillment costs under IFRS 15 and if they are expected to be recovered. An analysis of spot charter revenue from voyages over year-end indicated that the initial adoption of IFRS 15 on January 1, 2018 will result in a reduction of accrued revenue by USD 4.4 million and the recognition of capitalized fulfillment costs of USD 2.7 million, with a corresponding net reduction of equity. The new standard will also require the Group to revise its accounting processes and internal controls related to reporting spot charter revenue and voyage expenses.
NOTES TO CONSOLIDATED FINANCIAL STATEMENTS 2017
Note 1 - Significant accounting policies (Continued)
IFRS 16 Leases published on January 13, 2016 makes a distinction between a service contract and a lease based on whether the contract conveys the right to control the use of an identified asset and introduces a single, on-balance sheet lease accounting model for lessees. A lessee recognizes a right-of-use asset representing its right to use the underlying asset and a lease liability representing its obligation to make lease payments. There are optional exemptions for short term leases and leases of low value items. Lessor accounting remains similar to the current standard - i.e. lessors continue to classify leases as finance or operating leases. For lessors, there is little change to the existing accounting in IAS 17 Leases. IFRS 16 replaces existing leases guidance including IAS 17 Leases, IFRIC 4 Determining whether an Arrangement contains a Lease, SIC-15 Operating Leases-Incentives and SIC-27 Evaluating the Substance of Transactions Involving the Legal Form of a Lease. The standard is effective for annual periods beginning on or after January 1, 2019. Early adoption is permitted for entities that apply IFRS 15 Revenue from Contracts with Customers at or before the date of initial application of IFRS 16. The Group will adopt IFRS 16 as of January 1, 2019. An assessment of the impact of IFRS 16 has not been finalized to date, but the Group expects that the most significant impact will be that the Group will recognize new assets and liabilities for its operating leases as lessee (for company cars, office rental and bare boat charters). Reference is also made to the disclosure on lease payments in Note 19. In addition, the nature and recognition of expenses related to those leases will change as IFRS 16 replaces the straight-line operating lease expense with a depreciation charge for right-of-use assets and interest expense on lease liabilities. The Group does not expect the adoption of IFRS 16 to impact its ability to comply with the loan covenants described in Note 18.
Classification and Measurement of Share-based Payment Transactions (Amendments to IFRS 2) issued on 20 June 2016 covers three accounting areas: the measurement of cash-settled share-based payments; the classification of share-based payments settled net of tax withholdings; and the accounting for a modification of a share-based payment from cash-settled to equity-settled. The amendments are effective for annual periods commencing on or after 1 January 2018. As a practical simplification, the amendments can be applied prospectively so that prior periods do not have to be restated. Retrospective, or early application is permitted if companies have the required information. The amendments are not expected to have a material impact on the Group’s consolidated financial statements.
Transfers of property assets to/from, investment property (Amendments to IAS 40) issued on 8 December 2016, clarifies that a property asset is transferred to, or from, investment property when and only when there is an actual change in use. A change in management intention alone does not support a transfer. The amendments are effective for annual periods beginning on or after 1 January 2018, with earlier adoption permitted. The amendments are not expected to have a material impact on the Group’s consolidated financial statements.
Long-term Interests in Associates and Joint Ventures (Amendments to IAS 28) issued on 12 October 2017, clarifies how companies should account for long-term interests in an associate or joint venture, to which the equity method is not applied, using IFRS 9. The amendments are effective for annual periods beginning on or after 1 January 2019, with early adoption permitted. The amendments are not expected to have a material impact on the Group’s consolidated financial statements.
IFRIC 22 Foreign currency transactions and Advance consideration issued on 8 December 2016, clarifies the transaction date to be used to determine the exchange rate for translating foreign currency transactions involving an advance payment or receipt. The interpretation is effective for annual periods beginning on or after 1 January 2018, with earlier adoption permitted. The amendments are not expected to have a material impact on the Group’s consolidated financial statements.
IFRIC 23 Uncertainty over Income Tax Treatments issued on 7 June 2017, clarifies how to apply the recognition and measurement requirements in IAS 12 when there is uncertainty over income tax treatments. In such a circumstance, an entity shall recognize and measure its current or deferred tax asset or liability applying the requirements in IAS 12 based on taxable profit (tax loss), tax bases, unused tax losses, unused tax credits and tax rates determined applying this Interpretation. An entity is required to assume that a tax authority with the right to examine and challenge tax treatments will examine those treatments and have full knowledge of all related information. Detection risk is not considered in the recognition and measurement of uncertain tax treatments. The entity should measure the impact of the uncertainty using the method that best predicts the resolution of the uncertainty; either the most likely amount method or the expected value method. The interpretation is effective for annual periods beginning on or after 1 January 2019, with earlier adoption permitted. The amendments are not expected to have a material impact on the Group’s consolidated financial statements.
Annual improvements to IFRSs 2014-2016 Cycle, issued on 8 December 2016, covers the following minor amendments:
- IFRS 1 First-time Adoption of IFRS: removes outdated exemptions for first-time adopters of IFRS (effective for annual periods beginning on or after 1 January 2018);
NOTES TO CONSOLIDATED FINANCIAL STATEMENTS 2017
Note 1 - Significant accounting policies (Continued)
- IFRS 12 Disclosure of Interests in Other Entities: the amendments clarify that the disclosure requirements for interests in other entities also apply to interests that are classified as held for sale or distribution (effective for annual periods beginning on or after 1 January 2017 and adopted by the Group as of 1 January 2017).
- IAS 28 Investments in Associates and Joint Ventures: the amendments clarify that a venture capital organization, or other qualifying entity, may elect to measure its investments in an associate or joint venture at fair value through profit or loss. This election can be made on an investment-by-investment basis. A non-investment entity investor may elect to retain the fair value accounting applied by an investment entity associate or investment entity joint venture to its subsidiaries. This election can be made separately for each investment entity associate or joint venture. These amendments are effective for annual periods beginning on or after 1 January 2018, with earlier adoption permitted. The amendments are not expected to have a material impact on the Group’s consolidated financial statements.
Annual improvementsAmendments to IFRSs 2015-2017 Cycle,IAS 1 Presentation of Financial statements: Classification of Liabilities as Current or Non-current, issued on 23 January 2020, clarify a criterion in IAS 1 for classifying a liability as non-current: the requirement for an entity to have the right to defer settlement of the liability for at least 12 December 2017, coversmonths after the following minorreporting period.
The amendments:
-–specify that an entity’s right to defer settlement must exist at the end of the reporting period;
–clarify that classification is unaffected by management’s intentions or expectations about whether the entity will exercise its right to defer settlement;
–clarify how lending conditions affect classification; and
–clarify requirements for classifying liabilities an entity will or may settle by issuing its own equity instruments.
On July 15, 2020, the IASB issued Classification of Liabilities as Current or Non-current — Deferral of Effective Date (Amendment to IAS 1) deferring the effective date of the January 2020 amendments to IAS 1 by one year to annual reporting periods beginning on or after January 1, 2023. The amendments have not yet been endorsed by the EU.
Amendments to IFRS 3 Business Combinations:Combinations; IAS 16 Property, plant and Equipment; IAS 37 Provisions, Contingent Liabilities and Contingent Assets as well as Annual improvements,issued on 14 May 2020, include several narrow-scope amendments which are changes that clarify the wording or correct minor consequences, oversights or conflicts between requirements in the Standards:
–Amendments to IFRS 3 Business Combinations update a reference in IFRS 3 to the Conceptual Framework for Financial Reporting without changing the accounting requirements for business combinations.
–Amendments to IAS 16 Property, Plant and Equipment prohibit a company from deducting from the cost of property, plant and equipment amounts received from selling items produced while the company is preparing the asset for its intended use. Instead, a company will recognize such sales proceeds and related cost in profit
NOTES TO CONSOLIDATED FINANCIAL STATEMENTS 2020
Note 1 - Significant accounting policies (Continued)
or loss. The amendments also clarify that testing whether an item of PPE is functioning properly means assessing its technical and physical performance rather than assessing its financial performance.
–Amendments to IAS 37 Provisions, Contingent Liabilities and Contingent Assets specify which costs a company includes when assessing whether a contract will be loss-making. The amendments clarify that the ‘costs of fulfilling a company remeasures its previously held interest in a joint operation when it obtains controlcontract’ comprise both: the incremental costs; and an allocation of other direct costs.
–Annual Improvements to IFRS Standards 2018–2020 make minor amendments to IFRS 1 First-time Adoption of International Financial Reporting Standards, IFRS 9 Financial Instruments, IAS 41 Agriculture and the business.Illustrative Examples accompanying IFRS 16 Leases
- IFRS 11 Joint Arrangements: the amendments clarify that a company does not remeasure its previously held interest in a joint operation when it obtains joint control of the business.
- IAS 12 Income Taxes: the amendments clarify that a company accounts for all income tax consequences of dividend payments consistently with the transactions that generated the distributable profits - i.e. in profit or loss, OCI or equity.
- IAS 23 Borrowing Costs: the amendments clarify that a company treats as part of general borrowings any borrowing originally made to develop an asset when the asset is ready for its intended use or sale.
The amendments are effective for annual reporting periods beginning on or after 1 January 20192022. These amendments have not yet been endorsed by the EU.
Amendments to IFRS 9, IAS 39, IFRS 7, IFRS 4 and IFRS 16 Interest Rate Benchmark Reform – Phase 2 (issued on 27 August 2020) address issues that might affect financial reporting during the reform of an interest rate benchmark, including the effects of changes to contractual cash flows or hedging relationships arising from the replacement of an interest rate benchmark with an alternative benchmark rate (replacement issues).
In Phase 2 of its project, the Board amended requirements in IFRS 9 Financial Instruments, IAS 39 Financial Instruments: Recognition and Measurement, IFRS 7 Financial Instruments: Disclosures, IFRS 4 Insurance Contracts and IFRS 16 Leases relating to:
–changes in the basis for determining contractual cash flows of financial assets, financial liabilities and lease liabilities;
–hedge accounting; and
–disclosures.
The Phase 2 amendments apply only to changes required by the interest rate benchmark reform to financial instruments and hedging relationships. The amendments apply retrospectively from 1 January 2021 with earlier application permitted. TheHedging relationships previously discontinued solely because of changes resulting from the reform will be reinstated if certain conditions are met. These amendments arehave not expected to have a material impact onyet been endorsed by the Group’s consolidated financial statements.EU.
NOTES TO CONSOLIDATED FINANCIAL STATEMENTS 20172020
Note 2 - Segment reporting
The Group distinguishes two2 operating segments: the operation of crude oil tankers inon the international markets (the Tankers Segment)(Tankers) and the floating production, storage and offloading operations (the FSO/FpSO Segment)(FSO/FPSO). These two2 divisions operate in completely different markets, where in the latter the assets are tailor made or converted for specific long term projects. The tanker market requires a different marketing strategy as this is considered a very volatile market, contract duration is often less than two years and the assets are to a large extent standardized. The segment profit or loss figures and key assets as set out below are presented to the executive committee on at least a quarterly basis to help the key decision makers in evaluating the respective segments. The Chief Operating Decision Maker (CODM) also receives the information per segment based on proportionate consolidation for the joint ventures and not by applying equity accounting. The reconciliation between the figures of all segments combined on the one hand and with the consolidated statements of financial position and profit or loss on the other hand is presented in a separate column Equity-accounted investees.
The Group has one client in the Tankers segment that represented 10%6% of the Tankers segment total revenue in 2017 (2016: two clients which represented 10% each and in 20152020 (2019: one client which represented 11%7% and in 2018 one client which represented 7%). All the other clients represent less than 10%6% of total revenues of the Tankers segment.
The Group didhas one client in the FSO segment.
The Group's internal organizational and management structure does not identifydistinguish any relevant geographic areas.
geographical segments.
NOTES TO CONSOLIDATED FINANCIAL STATEMENTS 20172020
Note 21 - Segment reportingSignificant accounting policies (Continued)
Consolidated statement of financial position
| | | | | | | | | | | | | | | | | | | | | | | | | | | | | | | | | | | | | | | | | | | | | | | | | | |
| (in thousands of USD) | | December 31, 2020 | | December 31, 2019 |
| ASSETS | | Tankers | | FSO | | Less: Equity-accounted investees | | Total | | Tankers * | | FSO * | | Less: Equity-accounted investees * | | Total |
| Vessels | | 2,875,348 | | | 115,248 | | | (125,288) | | | 2,865,308 | | | 3,198,993 | | | 131,958 | | | (153,689) | | | 3,177,262 | |
| Assets under construction | | 207,069 | | | 0 | | | 0 | | | 207,069 | | | 0 | | | 0 | | | 0 | | | 0 | |
| Right-of-use assets | | 52,955 | | | 0 | | | 0 | | | 52,955 | | | 58,908 | | | 0 | | | 0 | | | 58,908 | |
| Other tangible assets | | 1,759 | | | 0 | | | 0 | | | 1,759 | | | 2,265 | | | 0 | | | 0 | | | 2,265 | |
| | | | | | | | | | | | | | | | |
| Intangible assets | | 161 | | | 0 | | | 0 | | | 161 | | | 39 | | | 0 | | | 0 | | | 39 | |
| Receivables | | 46,419 | | | 0 | | | 8,635 | | | 55,054 | | | 52,502 | | | 0 | | | 18,581 | | | 71,083 | |
| Investments in equity accounted investees | | 2,822 | | | 0 | | | 48,881 | | | 51,703 | | | 2,355 | | | 0 | | | 47,967 | | | 50,322 | |
| Deferred tax assets | | 1,357 | | | 0 | | | 0 | | | 1,357 | | | 2,715 | | | 1,116 | | | (1,116) | | | 2,715 | |
| | | | | | | | | | | | | | | | |
| Total non-current assets | | 3,187,890 | | | 115,248 | | | (67,772) | | | 3,235,366 | | | 3,317,777 | | | 133,074 | | | (88,257) | | | 3,362,594 | |
| | | | | | | | | | | | | | | | |
| Total current assets | | 453,009 | | | 10,182 | | | (11,318) | | | 451,873 | | | 805,613 | | | 10,405 | | | (13,769) | | | 802,249 | |
| | | | | | | | | | | | | | | | |
| TOTAL ASSETS | | 3,640,899 | | | 125,430 | | | (79,090) | | | 3,687,239 | | | 4,123,390 | | | 143,479 | | | (102,026) | | | 4,164,843 | |
| | | | | | | | | | | | | | | | |
| EQUITY and LIABILITIES | | | | | | | | | | | | | | | | |
| | | | | | | | | | | | | | | | |
| Total equity | | 2,264,271 | | | 47,515 | | | 0 | | | 2,311,786 | | | 2,268,490 | | | 43,365 | | | 0 | | | 2,311,855 | |
| | | | | | | | | | | | | | | | |
| Bank and other loans | | 836,318 | | | 36,237 | | | (36,237) | | | 836,318 | | | 1,173,944 | | | 67,962 | | | (67,962) | | | 1,173,944 | |
| Other notes | | 198,279 | | | 0 | | | 0 | | | 198,279 | | | 198,571 | | | 0 | | | 0 | | | 198,571 | |
| Other borrowings | | 100,056 | | | 0 | | | 0 | | | 100,056 | | | 107,978 | | | 0 | | | 0 | | | 107,978 | |
| Lease liabilities | | 21,172 | | | 0 | | | 0 | | | 21,172 | | | 43,161 | | | 0 | | | 0 | | | 43,161 | |
| Other payables | | 6,893 | | | 242 | | | (242) | | | 6,893 | | | 3,809 | | | 539 | | | (539) | | | 3,809 | |
| Deferred tax liabilities | | 0 | | | 11,525 | | | (11,525) | | | 0 | | | 0 | | | 4,769 | | | (4,769) | | | 0 | |
| Employee benefits | | 7,987 | | | 0 | | | 0 | | | 7,987 | | | 8,094 | | | 0 | | | 0 | | | 8,094 | |
| | | | | | | | | | | | | | | | |
| Provisions | | 1,154 | | | 0 | | | 0 | | | 1,154 | | | 1,381 | | | 0 | | | 0 | | | 1,381 | |
| | | | | | | | | | | | | | | | |
| Total non-current liabilities | | 1,171,859 | | | 48,004 | | | (48,004) | | | 1,171,859 | | | 1,536,938 | | | 73,270 | | | (73,270) | | | 1,536,938 | |
| | | | | | | | | | | | | | | | |
| Total current liabilities | | 204,769 | | | 29,911 | | | (31,086) | | | 203,594 | | | 317,962 | | | 26,844 | | | (28,756) | | | 316,050 | |
| | | | | | | | | | | | | | | | |
| TOTAL EQUITY and LIABILITIES | | 3,640,899 | | | 125,430 | | | (79,090) | | | 3,687,239 | | | 4,123,390 | | | 143,479 | | | (102,026) | | | 4,164,843 | |
|
| | | | | | | | | | | | | | | | | | | | | | | | |
| (in thousands of USD) | | December 31, 2017 | | December 31, 2016 |
| ASSETS | | Tankers | | FSO | | Less: Equity-accounted investees | | Total | | Tankers | | FSO | | Less: Equity-accounted investees | | Total |
| Vessels | | 2,271,500 |
| | 168,100 |
| | (168,100 | ) | | 2,271,500 |
| | 2,383,163 |
| | 186,170 |
| | (186,170 | ) | | 2,383,163 |
|
| Assets under construction | | 63,668 |
| | — |
| | — |
| | 63,668 |
| | 86,136 |
| | — |
| | — |
| | 86,136 |
|
| Other tangible assets | | 1,663 |
| | — |
| | — |
| | 1,663 |
| | 777 |
| | — |
| | — |
| | 777 |
|
| Intangible assets | | 72 |
| | — |
| | — |
| | 72 |
| | 156 |
| | — |
| | — |
| | 156 |
|
| Receivables | | 163,382 |
| | 10,739 |
| | (13,769 | ) | | 160,352 |
| | 204,079 |
| | 9,414 |
| | (29,579 | ) | | 183,914 |
|
| Investments in equity accounted investees | | 1,695 |
| | — |
| | 28,900 |
| | 30,595 |
| | 1,546 |
| | — |
| | 16,867 |
| | 18,413 |
|
| Deferred tax assets | | 2,487 |
| | 223 |
| | (223 | ) | | 2,487 |
| | 964 |
| | — |
| | — |
| | 964 |
|
| | | | | | | | | | | | | | | | | |
| Total non-current assets | | 2,504,467 |
| | 179,062 |
| | (153,192 | ) | | 2,530,337 |
| | 2,676,821 |
| | 195,584 |
| | (198,882 | ) | | 2,673,523 |
|
| | | | | | | | | | | | | | | | | |
| Total current assets | | 281,132 |
| | 11,581 |
| | (12,077 | ) | | 280,636 |
| | 375,037 |
| | 43,048 |
| | (44,697 | ) | | 373,388 |
|
| | | | | | | | | | | | | | | | | |
| TOTAL ASSETS | | 2,785,599 |
| | 190,643 |
| | (165,269 | ) | | 2,810,973 |
| | 3,051,858 |
| | 238,632 |
| | (243,579 | ) | | 3,046,911 |
|
| | | | | | | | | | | | | | | | | |
| | | | | | | | | | | | | | | | | |
| EQUITY and LIABILITIES | | | | | | | | | | | | | | | | |
| | | | | | | | | | | | | | | | | |
| Total equity | | 1,820,887 |
| | 25,473 |
| | 1 |
| | 1,846,361 |
| | 1,892,836 |
| | (4,879 | ) | | (1 | ) | | 1,887,956 |
|
| | | | | | | | | | | | | | | | | |
| Bank and other loans | | 653,730 |
| | 162,762 |
| | (162,762 | ) | | 653,730 |
| | 966,443 |
| | 203,512 |
| | (203,512 | ) | | 966,443 |
|
| Convertible and other Notes | | 147,619 |
| | — |
| | — |
| | 147,619 |
| | — |
| | — |
| | — |
| | — |
|
| Other payables | | 539 |
| | — |
| | — |
| | 539 |
| | 533 |
| | 1,118 |
| | (1,118 | ) | | 533 |
|
| Deferred tax liabilities | | — |
| | 1,680 |
| | (1,680 | ) | | — |
| | — |
| | — |
| | — |
| | — |
|
| Employee benefits | | 3,984 |
| | — |
| | — |
| | 3,984 |
| | 2,846 |
| | — |
| | — |
| | 2,846 |
|
| Amounts due to equity-accounted joint ventures | | — |
| | — |
| | — |
| | — |
| | — |
| | — |
| | — |
| | — |
|
| Provisions | | — |
| | — |
| | — |
| | — |
| | 38 |
| | — |
| | — |
| | 38 |
|
| | | | | | | | | | | | | | | | | |
| Total non-current liabilities | | 805,872 |
| | 164,442 |
| | (164,442 | ) | | 805,872 |
| | 969,860 |
| | 204,630 |
| | (204,630 | ) | | 969,860 |
|
| | | | | | | | | | | | | | | | | |
| Total current liabilities | | 158,840 |
| | 728 |
| | (828 | ) | | 158,740 |
| | 189,162 |
| | 38,881 |
| | (38,948 | ) | | 189,095 |
|
| | | | | | | | | | | | | | | | | |
| TOTAL EQUITY and LIABILITIES | | 2,785,599 |
| | 190,643 |
| | (165,269 | ) | | 2,810,973 |
| | 3,051,858 |
| | 238,632 |
| | (243,579 | ) | | 3,046,911 |
|
Consolidated statement of profit or loss
NOTES TO CONSOLIDATED FINANCIAL STATEMENTS 20172020
Note 21 - Segment reportingSignificant accounting policies (Continued)
Consolidated statement of profit or loss | | | (in thousands of USD) | | 2017 | | 2016 | | 2015 | (in thousands of USD) | | 2020 | | 2019 | | 2018 |
| | | Tankers | FSO | Less: Equity-accounted investees | Total | | Tankers | FSO | Less: Equity-accounted investees | Total | | Tankers | FSO | Less: Equity-accounted investees | Total | | | Tankers | FSO | Less: Equity-accounted investees | Total | | Tankers * | FSO * | Less: Equity-accounted investees * | Total | | Tankers | FSO | Less: Equity-accounted investees | Total |
| Shipping income | | | | | | | Shipping income | | | | | | |
| Revenue | | 513,398 |
| 59,513 |
| (59,543 | ) | 513,368 |
| | 704,766 |
| 65,125 |
| (85,626 | ) | 684,265 |
| | 898,495 |
| 64,504 |
| (116,492 | ) | 846,507 |
| Revenue | | 1,241,252 | | 49,949 | | (60,451) | | 1,230,750 | | | 933,823 | | 49,461 | | (50,907) | | 932,377 | | | 600,024 | | 49,155 | | (49,155) | | 600,024 | |
| Gains on disposal of vessels/other tangible assets | | 36,538 |
| — |
| — |
| 36,538 |
| | 50,397 |
| — |
| — |
| 50,397 |
| | 13,302 |
| — |
| — |
| 13,302 |
| Gains on disposal of vessels/other tangible assets | | 23,107 | | 0 | | (379) | | 22,728 | | | 14,879 | | 0 | | 0 | | 14,879 | | | 19,138 | | 0 | | 0 | | 19,138 | |
| Other operating income | | 4,902 |
| 234 |
| (234 | ) | 4,902 |
| | 6,765 |
| 327 |
| (96 | ) | 6,996 |
| | 6,798 |
| 808 |
| (180 | ) | 7,426 |
| Other operating income | | 9,907 | | 2,577 | | (2,372) | | 10,112 | | | 10,075 | | 3,351 | | (3,332) | | 10,094 | | | 4,775 | | 72 | | (72) | | 4,775 | |
| Total shipping income | | 554,838 |
| 59,747 |
| (59,777 | ) | 554,808 |
| | 761,928 |
| 65,452 |
| (85,722 | ) | 741,658 |
| | 918,595 |
| 65,312 |
| (116,672 | ) | 867,235 |
| Total shipping income | | 1,274,266 | | 52,526 | | (63,202) | | 1,263,590 | | | 958,777 | | 52,812 | | (54,239) | | 957,350 | | | 623,937 | | 49,227 | | (49,227) | | 623,937 | |
| | | | | | | | | | | | | | |
| Operating expenses | | | | | | | Operating expenses | |
| Voyage expenses and commissions | | (62,035 | ) | (304 | ) | 304 |
| (62,035 | ) | | (63,305 | ) | (476 | ) | 4,221 |
| (59,560 | ) | | (83,896 | ) | (473 | ) | 13,132 |
| (71,237 | ) | Voyage expenses and commissions | | (129,833) | | 0 | | 4,403 | | (125,430) | | | (145,047) | | 2 | | 364 | | (144,681) | | | (141,416) | | (1) | | 1 | | (141,416) | |
| Vessel operating expenses | | (150,390 | ) | (9,157 | ) | 9,120 |
| (150,427 | ) | | (164,478 | ) | (9,679 | ) | 13,958 |
| (160,199 | ) | | (160,894 | ) | (10,074 | ) | 17,250 |
| (153,718 | ) | Vessel operating expenses | | (213,489) | | (12,014) | | 14,869 | | (210,634) | | | (212,010) | | (12,657) | | 12,872 | | (211,795) | | | (185,792) | | (9,637) | | 9,637 | | (185,792) | |
| Charter hire expenses | | (31,173 | ) | — |
| — |
| (31,173 | ) | | (17,713 | ) | — |
| — |
| (17,713 | ) | | (25,849 | ) | — |
| — |
| (25,849 | ) | Charter hire expenses | | (5,410) | | 0 | | (2,544) | | (7,954) | | | (604) | | 0 | | 0 | | (604) | | | (31,114) | | 0 | | 0 | | (31,114) | |
| Losses on disposal of vessels/other tangible assets | | (21,027 | ) | — |
| — |
| (21,027 | ) | | (1 | ) | — |
| (1 | ) | (2 | ) | | (8,002 | ) | — |
| — |
| (8,002 | ) | Losses on disposal of vessels/other tangible assets | | (1) | | 0 | | 0 | | (1) | | | (75) | | 0 | | 0 | | (75) | | | (273) | | 0 | | 0 | | (273) | |
| Loss on disposal of investments in equity accounted investees | | — |
| — |
| — |
| — |
| | (24,150 | ) | — |
| — |
| (24,150 | ) | | — |
| — |
| — |
| — |
| |
| Impairment on non-current assets held for sale | | Impairment on non-current assets held for sale | | 0 | | 0 | | 0 | | 0 | | | 0 | | 0 | | 0 | | 0 | | | (2,995) | | 0 | | 0 | | (2,995) | |
| | Depreciation tangible assets | | (229,777 | ) | (18,071 | ) | 18,071 |
| (229,777 | ) | | (233,368 | ) | (18,071 | ) | 23,775 |
| (227,664 | ) | | (221,399 | ) | (18,071 | ) | 29,314 |
| (210,156 | ) | Depreciation tangible assets | | (323,216) | | (16,710) | | 20,274 | | (319,652) | | | (338,036) | | (18,071) | | 18,461 | | (337,646) | | | (270,582) | | (18,071) | | 18,071 | | (270,582) | |
| Depreciation intangible assets | | (95 | ) | — |
| — |
| (95 | ) | | (99 | ) | — |
| — |
| (99 | ) | | (50 | ) | — |
| — |
| (50 | ) | Depreciation intangible assets | | (99) | | 0 | | 0 | | (99) | | | (56) | | 0 | | 0 | | (56) | | | (111) | | 0 | | 0 | | (111) | |
| General and administrative expenses | | (46,871 | ) | (30 | ) | 33 |
| (46,868 | ) | | (44,152 | ) | (80 | ) | 181 |
| (44,051 | ) | | (46,433 | ) | (283 | ) | 465 |
| (46,251 | ) | General and administrative expenses | | (65,606) | | (560) | | 668 | | (65,498) | | | (66,958) | | (283) | | 351 | | (66,890) | | | (66,235) | | (425) | | 428 | | (66,232) | |
| Total operating expenses | | (541,368 | ) | (27,562 | ) | 27,528 |
| (541,402 | ) | | (547,266 | ) | (28,306 | ) | 42,134 |
| (533,438 | ) | | (546,523 | ) | (28,901 | ) | 60,161 |
| (515,263 | ) | Total operating expenses | | (737,654) | | (29,284) | | 37,670 | | (729,268) | | | (762,786) | | (31,009) | | 32,048 | | (761,747) | | | (698,518) | | (28,134) | | 28,137 | | (698,515) | |
| | | | | | | | | | | | | | |
| RESULT FROM OPERATING ACTIVITIES | | 13,470 |
| 32,185 |
| (32,249 | ) | 13,406 |
| | 214,662 |
| 37,146 |
| (43,588 | ) | 208,220 |
| | 372,072 |
| 36,411 |
| (56,511 | ) | 351,972 |
| RESULT FROM OPERATING ACTIVITIES | | 536,612 | | 23,242 | | (25,532) | | 534,322 | | | 195,991 | | 21,803 | | (22,191) | | 195,603 | | | (74,581) | | 21,093 | | (21,090) | | (74,578) | |
| | | | | | | | | | | | | | |
| Finance income | | 7,267 |
| 197 |
| (198 | ) | 7,266 |
| | 6,864 |
| 57 |
| (66 | ) | 6,855 |
| | 3,313 |
| 22 |
| (23 | ) | 3,312 |
| Finance income | | 20,045 | | 21 | | 1,430 | | 21,496 | | | 20,399 | | 147 | | 26 | | 20,572 | | | 15,023 | | 160 | | (160) | | 15,023 | |
| Finance expenses | | (50,730 | ) | (1,026 | ) | 1,027 |
| (50,729 | ) | | (52,420 | ) | (2,552 | ) | 3,277 |
| (51,695 | ) | | (52,590 | ) | (3,663 | ) | 5,311 |
| (50,942 | ) | Finance expenses | | (91,645) | | (3,295) | | 3,387 | | (91,553) | | | (119,809) | | (4,558) | | 4,564 | | (119,803) | | | (89,412) | | (3,795) | | 3,795 | | (89,412) | |
| Net finance expenses | | (43,463 | ) | (829 | ) | 829 |
| (43,463 | ) | | (45,556 | ) | (2,495 | ) | 3,211 |
| (44,840 | ) | | (49,277 | ) | (3,641 | ) | 5,288 |
| (47,630 | ) | Net finance expenses | | (71,600) | | (3,274) | | 4,817 | | (70,057) | | | (99,410) | | (4,411) | | 4,590 | | (99,231) | | | (74,389) | | (3,635) | | 3,635 | | (74,389) | |
| | | | | | | | | | | | | | |
| Gain on bargain purchase | | Gain on bargain purchase | | 0 | | 0 | | 0 | | 0 | | | 0 | | 0 | | 0 | | 0 | | | 23,059 | | 0 | | 0 | | 23,059 | |
| Share of profit (loss) of equity accounted investees (net of income tax) | | 150 |
| — |
| 29,932 |
| 30,082 |
| | 334 |
| — |
| 40,161 |
| 40,495 |
| | 185 |
| — |
| 51,407 |
| 51,592 |
| Share of profit (loss) of equity accounted investees (net of income tax) | | 467 | | 0 | | 10,450 | | 10,917 | | | 440 | | 0 | | 16,020 | | 16,460 | | | 220 | | 0 | | 15,856 | | 16,076 | |
| | | | | | | | |
| Profit (loss) before income tax | | (29,843 | ) | 31,356 |
| (1,488 | ) | 25 |
| | 169,440 |
| 34,651 |
| (216 | ) | 203,875 |
| | 322,980 |
| 32,770 |
| 184 |
| 355,934 |
| Profit (loss) before income tax | | 465,479 | | 19,968 | | (10,265) | | 475,182 | | | 97,021 | | 17,392 | | (1,581) | | 112,832 | | | (125,691) | | 17,458 | | (1,599) | | (109,832) | |
| | | | | | | | | | | | | | |
| Income tax expense | | Income tax expense | | (1,944) | | (10,265) | | 10,265 | | (1,944) | | | (602) | | (1,581) | | 1,581 | | (602) | | | (238) | | (1,599) | | 1,599 | | (238) | |
| | Profit (loss) for the period | | Profit (loss) for the period | | 463,535 | | 9,703 | | 0 | | 473,238 | | | 96,419 | | 15,811 | | 0 | | 112,230 | | | (125,929) | | 15,859 | | 0 | | (110,070) | |
NOTES TO CONSOLIDATED FINANCIAL STATEMENTS 20172020
Note 21 - Segment reportingSignificant accounting policies (Continued)
| | | Income tax expense | | 1,358 |
| (1,488 | ) | 1,488 |
| 1,358 |
| | 174 |
| (216 | ) | 216 |
| 174 |
| | (5,633 | ) | 184 |
| (184 | ) | (5,633 | ) | |
| | | | | | | | |
| Profit (loss) for the period | | (28,485 | ) | 29,868 |
| — |
| 1,383 |
| | 169,614 |
| 34,435 |
| — |
| 204,049 |
| | 317,347 |
| 32,954 |
| — |
| 350,301 |
| |
| | | | | | | | | | | | | | |
| Attributable to: | | | | | | | Attributable to: | |
| Owners of the company | | (28,485 | ) | 29,868 |
| — |
| 1,383 |
| | 169,614 |
| 34,435 |
| — |
| 204,049 |
| | 317,347 |
| 32,954 |
| — |
| 350,301 |
| Owners of the company | | 463,535 | | 9,703 | | 0 | | 473,238 | | | 96,419 | | 15,811 | | 0 | | 112,230 | | | (125,929) | | 15,859 | | 0 | | (110,070) | |
Summarized consolidated statement of cash flows
| | | | | | | | | | | | | | | | | | | | | | | | | | | | | | | | | | | | | | | | | | | | | | | | | | | | | | | | | | | | | | | | | | | | | | | | | | |
| (in thousands of USD) | | 2020 | | 2019 | | 2018 |
| | | Tankers | | FSO | | Less: Equity-accounted investees | | Total | | Tankers * | | FSO * | | Less: Equity-accounted investees * | | Total | | Tankers | | FSO | | Less: Equity-accounted investees | | Total |
| Net cash from (used in) operating activities | | 958,798 | | | 36,328 | | | (25,341) | | | 969,785 | | | 259,109 | | | 41,278 | | | (28,396) | | | 271,991 | | | 843 | | | 40,672 | | | (40,674) | | | 841 | |
| Net cash from (used in) investing activities | | (110,314) | | | 0 | | | (6,792) | | | (117,106) | | | 44,211 | | | 0 | | | (461) | | | 43,750 | | | 190,042 | | | 0 | | | 0 | | | 190,042 | |
| Net cash from (used in) financing activities | | (995,151) | | | (36,503) | | | 31,953 | | | (999,701) | | | (178,587) | | | (41,491) | | | 28,891 | | | (191,187) | | | (160,165) | | | (42,164) | | | 42,164 | | | (160,165) | |
| | | | | | | | | | | | | | | | | | | | | | | | | |
| Capital expenditure | | (226,663) | | | 0 | | | 1,252.5 | | | (225,410) | | | (30,173) | | | 0 | | | 22,120 | | | (8,053) | | | (238,065) | | | 0 | | | 0 | | | (238,065) | |
| | | | | | | | | | | | | | | | | | | | | | | | |
| | | | | | | | | | | | | | | | | | | | | | | | |
* The Group initially applied IFRS 16 at 1 January 2019, which requires the recognition of right-of-use assets and lease liabilities for lease contracts that were previously classified as operating leases. As a result, the Group recognized $87.6 million of right-of-use assets and $105.3 million of liabilities from those lease contracts. The assets and liabilities are included in the Tankers and FSO segments as at 31 December 2020 and 31 December 2019. The Group has applied IFRS 16 using the modified retrospective approach, under which comparative information is not restated (see Note 1.19).
|
| | | | | | | | | | | | | | | | | | | | | | | | | | | | | | | | | | | | |
| (in thousands of USD) | | 2017 | | 2016 | | 2015 |
| | | Tankers | | FSO | | Less: Equity-accounted investees | | Total | | Tankers | | FSO | | Less: Equity-accounted investees | | Total | | Tankers | | FSO | | Less: Equity-accounted investees | | Total |
| Net cash from operating activities | | 211,310 |
| | 49,684 |
| | (49,698 | ) | | 211,295 |
| | 427,926 |
| | 49,013 |
| | (38,737 | ) | | 438,202 |
| | 505,821 |
| | 58,747 |
| | (114,036 | ) | | 450,532 |
|
| Net cash from (used in) investing activities | | (40,243 | ) | | — |
| | 1 |
| | (40,242 | ) | | (90,891 | ) | | — |
| | (9,724 | ) | | (100,615 | ) | | (248,770 | ) | | — |
| | 42,897 |
| | (205,873 | ) |
| Net cash from (used in) financing activities | | (234,921 | ) | | (78,421 | ) | | 78,367 |
| | (234,976 | ) | | (264,714 | ) | | (32,929 | ) | | 36,483 |
| | (261,160 | ) | | (350,429 | ) | | (20,557 | ) | | 5,671 |
| | (365,315 | ) |
| | | | | | | | | | | | | | | | | | | | | | | | | |
| Capital expenditure | | (177,901 | ) | | — |
| | — |
| | (177,901 | ) | | (342,698 | ) | | — |
| | — |
| | (342,698 | ) | | (361,754 | ) | | — |
| | 1,611 |
| | (360,143 | ) |
| Impairment losses | | — |
| | — |
| | — |
| | — |
| | — |
| | — |
| | — |
| | — |
| | — |
| | — |
| | — |
| | — |
|
| Impairment losses reversed | | — |
| | — |
| | — |
| | — |
| | — |
| | — |
| | — |
| | — |
| | — |
| | — |
| | — |
| | — |
|
NOTES TO CONSOLIDATED FINANCIAL STATEMENTS 20172020
Note 3 - Assets and liabilities held for sale and discontinued operations
Assets held for sale
The assets held for sale can be detailed as follows:
| | | | | | | | | | | | | | | | | | | | |
| (in thousands of USD) | | December 31, 2020 | | December 31, 2019 | | December 31, 2018 |
| Vessels | | 0 | | | 12,705 | | | 42,000 | |
| Of which in Tankers segment | | 0 | | | 12,705 | | | 42,000 | |
| Of which in FSO segment | | 0 | | | 0 | | | 0 | |
|
| | | | | | | | | |
| (in thousands of USD) | | 2017 | | 2016 | | 2015 |
| Vessels | | — |
| | — |
| | 24,195 |
|
| Of which in Tankers segment | | — |
| | — |
| | 24,195 |
|
| Of which in FSO segment | | — |
| | — |
| | — |
|
| | | | | | | | | | | | | | | | | | | | | | | | | | | | | | | | |
| (in thousands of USD) | | (Estimated) Net sale price | | Book Value | | Asset Held For Sale | | Impairment Loss | | (Expected) Gain |
| At January 1, 2019 | | — | | | — | | | 42,000 | | | — | | | — | |
| | | | | | | | | | |
| Assets transferred to assets held for sale | | | | | | | | | | |
| Finesse | | 21,003 | | | 12,705 | | | 12,705 | | | 0 | | | 8,298 | |
| | | | | | | | | | |
| Assets sold from assets held for sale | | | | | | | | | | |
| Felicity | | 42,000 | | | 42,000 | | | (42,000) | | | 0 | | | 0 | |
| | | | | | | | | | |
| At December 31, 2019 | | 0 | | | 0 | | | 12,705 | | | 0 | | | 8,298 | |
| | | | | | | | | | |
| At January 1, 2020 | | — | | | — | | | 12,705 | | | — | | | — | |
| | | | | | | | | | |
| | | | | | | | | | |
| | | | | | | | | | |
| | | | | | | | | | |
| Assets sold from assets held for sale | | | | | | | | | | |
| Finesse | | 21,003 | | | 12,705 | | | (12,705) | | | 0 | | | 8,298 | |
| | | | | | | | | | |
| | | | | | | | | | |
| At December 31, 2020 | | 0 | | | 0 | | | 0 | | | 0 | | | 8,298 | |
| | | | | | | | | | |
|
| | | | | | | | | | | | | | | |
| (in thousands of USD) | | (Estimated) Sale price | | Book Value | | Asset Held For Sale | | (Expected) Gain | | (Expected) Loss |
| At January 1, 2015 | | — |
| | — |
| | 89,000 |
| | — |
| | — |
|
| | | | | | | | | | | |
| Assets transferred to assets held for sale | | | | | | | | | | |
| Famenne | | 38,016 |
| | 24,195 |
| | 24,195 |
| | 13,821 |
| | — |
|
| | | | | | | | | | | |
| Assets sold from assets held for sale | | | | | | | | | | |
| Antarctica | | 91,065 |
| | 89,000 |
| | (89,000 | ) | | 2,065 |
| | — |
|
| | | | | | | | | | | |
| At December 31, 2015 | | — |
| | — |
| | 24,195 |
| | 15,886 |
| | — |
|
| | | | | | | | | | | |
| At January 1, 2016 | | — |
| | — |
| | 24,195 |
| | — |
| | — |
|
| | | | | | | | | | | |
| Assets sold from assets held for sale | | | | | | | | | | |
| Famenne | | 38,016 |
| | 24,195 |
| | (24,195 | ) | | 13,821 |
| | — |
|
| | | | | | | | | | | |
| At December 31, 2016 | | — |
| | — |
| | — |
| | 13,821 |
| | — |
|
| | | | | | | | | | | |
On January 15, 2016,23, 2020, the Company sold the VLCC Famenne (2001Suezmax Finesse (2003 - 298,412149,994 dwt), for USD 38.4$21.8 million. The fair value less cost of disposal amounted to 21.0 million. This vessel was accounted for as a non-current asset held for sale as at December 31, 2015,2019, and had a carrying value of USD 24.2$12.7 million as of that datedate. The vessel was delivered to its new owner on March 9, 2016.February 21, 2020. Taking into account the sales commissions,commission, the net gain on the sale of this vessel amountedamounts to USD 13.8 million. This gain has been$8.3 million and was recorded upon delivery of the vessel and is therefore reflected in the consolidated statement of profit or loss forin the twelve months endedfirst quarter of 2020 (see Note 8).
As of December 31, 2016.
As per December 31, 2017 and December 31, 2016,2020, the Group had no0 assets held for sale.
Discontinued operations
As perof December 31, 20172020 and December 31, 2016,2019, the Group had no0 operations that meet the criteria of a discontinued operation.
NOTES TO CONSOLIDATED FINANCIAL STATEMENTS 2020
Note 4 – Revenue and other operating income
|
| | | | | | | | | |
| (in thousands of USD) | | 2017 | | 2016 | | 2015 |
| Pool Revenue | | 249,303 |
| | 340,217 |
| | 455,617 |
|
| Spot Voyages | | 145,360 |
| | 203,821 |
| | 264,799 |
|
| Time Charters (Note 19) | | 118,705 |
| | 140,227 |
| | 126,091 |
|
| Total revenue | | 513,368 |
| | 684,265 |
| | 846,507 |
|
| | | (in thousands of USD) | | 2017 | | 2016 | | 2015 | (in thousands of USD) | | 2020 | | 2019 |
| | | Tankers | FSO | Less: Equity-accounted investees | Total | | Tankers | FSO | Less: Equity-accounted investees | Total |
| | Pool Revenue | | Pool Revenue | | 715,812 | | 0 | | 594 | | 716,406 | | | 524,840 | | 0 | | 7 | | 524,847 | |
| Spot Voyages | | Spot Voyages | | 410,256 | | 0 | | (9,799) | | 400,457 | | | 318,674 | | 0 | | (1,453) | | 317,221 | |
| Revenue from contracts with customers | | Revenue from contracts with customers | | 1,126,068 | | 0 | | (9,205) | | 1,116,863 | | | 843,514 | | 0 | | (1,446) | | 842,068 | |
| | Time Charters | | Time Charters | | 115,184 | | 49,949 | | (51,246) | | 113,887 | | | 90,309 | | 49,461 | | (49,461) | | 90,309 | |
| Lease income | | Lease income | | 115,184 | | 49,949 | | (51,246) | | 113,887 | | | 90,309 | | 49,461 | | (49,461) | | 90,309 | |
| | Total revenue | | Total revenue | | 1,241,252 | | 49,949 | | (60,451) | | 1,230,750 | | | 933,823 | | 49,461 | | (50,907) | | 932,377 | |
| | Other operating income | | 4,902 |
| | 6,996 |
| | 7,426 |
| Other operating income | | — | | — | | — | | 10,112 | | | — | | — | | — | | 10,094 | |
|
For the accounting treatment of revenue, we refer to the accounting policies (o)(see Note 1.17) - Revenue.
NOTES TO CONSOLIDATED FINANCIAL STATEMENTS 2017
The decreaseincrease in revenue is mostly related to the decreaseincrease in pool and spot voyage revenue which is due to lowerimproved rates compared to 2019. The increase in revenue from time charters is also due to favorable market conditions and a slightly higher number of vessels on time charter.
The increase in time charter rates compared to 2019 is related to the fact that as from the end of the first quarter of 2020, the tanker market benefited from the development of three key factors. Firstly, unilateral actions were taken by Saudi Arabia in simultaneously cutting their oil prices but also raising their crude oil exports. This prompted a large short-term increase in demand for tanker tonnage, primarily in the VLCC sector. Secondly, the restrictions taken by governments to curtail the COVID-19 virus globally curbed economic activity and consequently crude oil consumption. This led to a steep and rapid disconnect between crude oil demand and supply alongside a wide contango. Thirdly, this pricing structure itself further incentivised the storage of crude oil for financial gain during April/May 2020, thus increasing short-term the demand for tonnage to store this excess oil.
The disruption to tanker markets from these factors combined to take between 7-9% of the global trading fleet for storage purposes (300 million barrels). These features combined to create a highly favourable tanker freight market conditions.from February until August reflected in strong revenues for the Company. The OPEC plus nations agreed to a 9.7M bpd cut to production of global crude (out of 100M bpd daily output) applicable from May 2020. However, the impact of these cuts was not felt in tanker markets until the third quarter 2020 given the positive disruption from storage on fleet supply. The returning vessels from storage from August 2020 onwards combined with fewer available cargoes from the production cuts has led to a challenging freight market from August 2020 onwards.
Other operating income includes revenues related to the daily standard business operation of the fleet and that are not directly attributable to an individual voyage, such as insurance rebates received based on changes in our vessels' trading patterns.voyage.
NOTES TO CONSOLIDATED FINANCIAL STATEMENTS 2020
Note 5 - Expenses for shipping activities and other expenses from operating activities
Voyage expenses and commissions
| | | | | | | | | | | | | | | | | | | | |
| (in thousands of USD) | | 2020 | | 2019 | | 2018 |
| Commissions paid | | (12,748) | | | (10,130) | | | (8,193) | |
| Bunkers | | (98,761) | | | (101,947) | | | (103,920) | |
| Other voyage related expenses | | (13,921) | | | (32,604) | | | (29,303) | |
| Total voyage expenses and commissions | | (125,430) | | | (144,681) | | | (141,416) | |
|
| | | | | | | | | |
| (in thousands of USD) | | 2017 | | 2016 | | 2015 |
| Voyage related expense | | (57,140 | ) | | (52,836 | ) | | (62,787 | ) |
| Commissions paid | | (4,895 | ) | | (6,724 | ) | | (8,450 | ) |
| Total voyage expenses and commissions | | (62,035 | ) | | (59,560 | ) | | (71,237 | ) |
The voyage expenses and commissions decreased in 2020 compared to 2019 mainly due to a decrease in other voyage related expenses. For vessels operated on the spot market, voyage expenses are paid by the shipowner while voyage expenses for vessels under a time charter contract, are paid by the charterer. Voyage expenses for vessels operated in a Pool, are paid by the Pool.
The majority of other voyage expenses are bunkers, port costs, agency fees and agent fees paid to operate the vessels on the spot market. ThesePort costs vary depending on the number of spot voyages performed, number and type of ports. The decrease in other voyage related expenses increased in 20172020 compared to 2016 because2019 is due to changed trading patterns.
Bunker expenses decreased compared to last year due to a lower proportionchange in the composition of vessels were on time charter contract in 2017 and because bunker costs per ton increased. For vessels under a time charter contract, voyage expenses are paid by the charterer andfleet for vessels operated on the spot market, voyage expenses are paid by the ship owner.spot.
Vessel operating expenses
| | | | | | | | | | | | | | | | | | | | |
| (in thousands of USD) | | 2020 | | 2019 | | 2018 |
| Operating expenses | | (196,677) | | | (196,739) | | | (172,589) | |
| Insurance | | (13,957) | | | (15,056) | | | (13,203) | |
| Total vessel operating expenses | | (210,634) | | | (211,795) | | | (185,792) | |
|
| | | | | | | | | |
| (in thousands of USD) | | 2017 | | 2016 | | 2015 |
| Operating expenses | | (139,832 | ) | | (148,554 | ) | | (142,035 | ) |
| Insurance | | (10,595 | ) | | (11,645 | ) | | (11,683 | ) |
| Total vessel operating expenses | | (150,427 | ) | | (160,199 | ) | | (153,718 | ) |
The operating expenses relate mainly to the crewing, technical and other costs to operate tankers. In 20172020 these expenses were lower compared to 2016 because technical operating expenses were lower thanks to cost optimization strategies applied in 2017.line with 2019.
Charter hire expenses
| | | | | | | | | | | | | | | | | | | | |
| (in thousands of USD) | | 2020 | | 2019 | | 2018 |
| Charter hire | | (7,954) | | | (604) | | | 6 | |
| Bare boat hire | | 0 | | | 0 | | | (31,120) | |
| Total charter hire expenses | | (7,954) | | | (604) | | | (31,114) | |
|
| | | | | | | | | |
| (in thousands of USD) | | 2017 | | 2016 | | 2015 |
| Charter hire (Note 19) | | (62 | ) | | (16,921 | ) | | (25,849 | ) |
| Bare boat hire (Note 19) | | (31,111 | ) | | (792 | ) | | — |
|
| Total charter hire expenses | | (31,173 | ) | | (17,713 | ) | | (25,849 | ) |
The decreasecharter-hire expenses in 2020 are entirely attributable to internal short term time charter agreement with our joint venture Bari Shipholding Ltd. and the hire is mainly dueexpenses for the barge (Dragon Satu) in relation to the redeliverybunker fuel strategy. The Group elected to apply the short-term lease exemption and accordingly, the lease payments were recognized as an expense and right-of-use assets and lease liabilities were not recognized.
Due to the adoption of IFRS 16 on January 1, 2019, whereby the costs related to the bareboat agreements are now recognized in depreciation and amortization expenses for the depreciation of the two chartered-in vessels,right-of-use asset over the VLCC KHK Visionremaining lease term and finance expense, the Suezmax Suez Hans, to their owners on October 27, 2016 and November 27, 2016 respectively.
The increase in bareboat charter-hire expenses in 2017 is entirely attributable to the sale and leaseback agreement of four VLCCs ( Nautilus, Navarin, Neptun and Nucleus), under a five year bareboat contract agreed on December 16, 2016.remain zero
General and administrative expenses
|
| | | | | | | | | |
| (in thousands of USD) | | 2017 | | 2016 | | 2015 |
| Wages and salaries | | (12,853 | ) | | (12,754 | ) | | (12,554 | ) |
| Social security costs | | (2,511 | ) | | (2,532 | ) | | (2,379 | ) |
| Provision for employee benefits (Note 16) | | (827 | ) | | (261 | ) | | (108 | ) |
| Equity-settled share-based payments (Note 22) | | (313 | ) | | (406 | ) | | (1,637 | ) |
| Other employee benefits | | (3,148 | ) | | (3,178 | ) | | (3,715 | ) |
| Employee benefits | | (19,652 | ) | | (19,131 | ) | | (20,392 | ) |
| Administrative expenses | | (22,579 | ) | | (21,264 | ) | | (21,389 | ) |
| Tonnage Tax | | (4,772 | ) | | (4,246 | ) | | (4,360 | ) |
| Claims | | (25 | ) | | (13 | ) | | (19 | ) |
| Provisions | | 160 |
| | 603 |
| | (91 | ) |
| Total general and administrative expenses | | (46,868 | ) | | (44,051 | ) | | (46,251 | ) |
| | | | | | | |
| Average number of full time equivalents (shore staff) | | 150.49 |
| | 139.44 |
| | 132.20 |
|
NOTES TO CONSOLIDATED FINANCIAL STATEMENTS 20172020
Note 5 - Expenses for shipping activities and other expenses from operating activities (Continued)
General and administrative expenses
| | | | | | | | | | | | | | | | | | | | |
| (in thousands of USD) | | 2020 | | 2019 | | 2018 |
| Wages and salaries | | (19,806) | | | (25,050) | | | (16,247) | |
| Social security costs | | (3,269) | | | (3,430) | | | (3,746) | |
| Provision for employee benefits (Note 17) | | (545) | | | (134) | | | (111) | |
| Cash-settled share-based payments (Note 23) | | 1,338 | | | (2,455) | | | (505) | |
| Equity-settled share-based payments (Note 23) | | (140) | | | 0 | | | (37) | |
| Other employee benefits | | (4,450) | | | (3,713) | | | (7,607) | |
| Employee benefits | | (26,872) | | | (34,782) | | | (28,253) | |
| Administrative expenses | | (35,565) | | | (31,226) | | | (33,485) | |
| Tonnage Tax | | (3,459) | | | (1,313) | | | (4,436) | |
| Claims | | 10 | | | (17) | | | (100) | |
| Provisions | | 388 | | | 448 | | | 42 | |
| Total general and administrative expenses | | (65,498) | | | (66,890) | | | (66,232) | |
| | | | | | | |
| Average number of full time equivalents (shore staff) | | 185.66 | | | 184.90 | | | 161.77 | |
The general and administrative expenses which include amongst others: shore staff wages, director fees, office rental, consulting and audit fees and Tonnage Tax, increasedtonnage tax, decreased in 20172020 compared to 2016.2019. This increasedecrease was mainly duerelated to the merger with Gener8 Maritime Inc. and the settlement following the stepping down of the CEO Paddy Rodgers, which had an impact on wages and salaries in 2019.
This decrease was offset by an increase in administrative expenses. The increase in administrative expense is mainly related to an increase in provisionsTI admin fees due to a better freight market in 2020 and higher IT expenses.
Furthermore the legal and other fees decreased in 2020, as well as travel and meal expenses due to COVID-19 restrictions.
Tonnage tax increased in 2020 compared to 2019 due to the reversal of the voluntary tonnage tax provision in 2019, which was waived as a result of a change in the tonnage tax regime. The voluntary tonnage tax is no longer applicable to the Group as from 2019.
The provision for employee benefits and to higher administrative expenses.
The administrative expenses increaseddecreased in 20172020 compared to 2016 due to2019. This decrease resulted from the signing and usage by Tankers International Ltd. of a senior secured uncommitted on-demand line of credit to fund the working capital in the ordinary course of TI Pool's business of operating a pool of tankers vessels, including but not limited to the purchase of bunker fuel, the payment of expenses relating to specific voyages and supplies of pool vessels, commissions payable on fixtures, port costs, expenses for hull and propeller cleaning, canal costs, insurance costs for the accountvesting of the pool, and insurance and fees payable for towage of vessels. The TI Pool's financing expenses are partfirst tranche of the Pool administrative expenses which are borne byTBIP 2019 and one-third of the Pool participants, including Euronav.LTIP 2016, LTIP 2017 and LTIP 2018 (see Note 14 and 17).
NOTES TO CONSOLIDATED FINANCIAL STATEMENTS 20172020
Note 6 - Net finance expense
Recognized in profit or loss | | | (in thousands of USD) | | 2017 | | 2016 | | 2015 | (in thousands of USD) | | 2020 | | 2019 | | 2018 |
| Interest income | | 655 |
| | 217 |
| | 208 |
| Interest income | | 6,487 | | | 6,529 | | | 4,106 | |
| Foreign exchange gains | | 6,611 |
| | 6,638 |
| | 3,104 |
| Foreign exchange gains | | 15,009 | | | 14,043 | | | 10,917 | |
| Finance income | | 7,266 |
| | 6,855 |
| | 3,312 |
| Finance income | | 21,496 | | | 20,572 | | | 15,023 | |
| | | | | | | | | | | | | |
| | | | | | | | |
| Interest expense on financial liabilities measured at amortized cost | | (38,391 | ) | | (39,007 | ) | | (38,246 | ) | Interest expense on financial liabilities measured at amortized cost | | (62,350) | | | (84,378) | | | (67,956) | |
| Amortization other Notes | | — |
| | — |
| | (4,127 | ) | |
| Interest leasing | | Interest leasing | | (3,287) | | | (4,811) | | | 0 | |
| Fair value adjustment on interest rate swaps | | Fair value adjustment on interest rate swaps | | (108) | | | (8,533) | | | (2,790) | |
| Other financial charges | | (5,819 | ) | | (4,577 | ) | | (4,355 | ) | Other financial charges | | (9,936) | | | (7,474) | | | (6,802) | |
| Foreign exchange losses | | (6,519 | ) | | (8,111 | ) | | (4,214 | ) | Foreign exchange losses | | (15,872) | | | (14,607) | | | (11,864) | |
| Finance expense | | (50,729 | ) | | (51,695 | ) | | (50,942 | ) | Finance expense | | (91,553) | | | (119,803) | | | (89,412) | |
| | | | | | | | | | | | | |
| Net finance expense recognized in profit or loss | | (43,463 | ) | | (44,840 | ) | | (47,630 | ) | Net finance expense recognized in profit or loss | | (70,057) | | | (99,231) | | | (74,389) | |
Interest expense on financial liabilities measured at amortized cost decreased during the year ended December 31, 2017,2020, compared to 2016.2019. This decrease was primarily attributable to the fact that the increase in floating interest rates in 2017 was more than offset by a decrease in the average outstanding debt duringcombined with decreased interest rates and was partially offset by an increase in the year endedinterest expenses on the sale and leaseback agreement for 3 VLCCs entered into on December 31, 2017, compared30, 2019 (see Note 16).
Interest leasing is the interest on lease liabilities.
Fair value adjustment on interest rate swaps relate primarily to 2016. Other financial charges increasedthe amortization over the remaining duration of the interest rate swaps which were acquired in 2017 comparedthe Gener8 Maritime Inc. merger. NaN IRSs related to 2016, which was primarily attributable to commitment fees paid for available credit lines,the Gener8 Maritime Inc. merger were settled in the third quarter of which2019 and the total availability increased2 remaining had a duration matching the repayment profile of the underlying facility and matured in 2017.September 2020 (see Note 14).
The above finance income and expenses include the following in respect of assets (liabilities) not recognized at fair value through profit or loss:
| | | | | | | | | | | | | | | | | | | | |
| | 2020 | | 2019 | | 2018 |
| Total interest income on financial assets | | 6,487 | | | 6,529 | | | 4,106 | |
| Total interest expense on financial liabilities | | (62,350) | | | (84,378) | | | (67,956) | |
| Total interest leasing | | (3,287) | | | (4,811) | | | 0 | |
| Total other financial charges | | (9,936) | | | (7,474) | | | (6,802) | |
|
| | | | | | | | | |
| | | 2017 | | 2016 | | 2015 |
| Total interest income on financial assets | | 655 |
| | 217 |
| | 208 |
|
| Total interest expense on financial liabilities | | (38,391 | ) | | (39,007 | ) | | (42,373 | ) |
| Total other financial charges | | (5,819 | ) | | (4,577 | ) | | (4,355 | ) |
Recognized directly in equity
| | | | | | | | | | | | | | | | | | | | |
| (in thousands of USD) | | 2020 | | 2019 | | 2018 |
| Foreign currency translation differences for foreign operations | | 636 | | | (112) | | | (157) | |
| Cash flow hedges - effective portion of changes in fair value | | (2,873) | | | (1,885) | | | (2,698) | |
| | | | | | |
| Net finance expense recognized directly in equity | | (2,237) | | | (1,997) | | | (2,855) | |
| Attributable to: | | | | | | |
| Owners of the Company | | (2,237) | | | (1,997) | | | (2,855) | |
| Net finance expense recognized directly in equity | | (2,237) | | | (1,997) | | | (2,855) | |
| Recognized in: | | | | | | |
| Translation reserve | | 636 | | | (112) | | | (157) | |
| Hedging reserve | | (2,873) | | | (1,885) | | | (2,698) | |
|
| | | | | | | | | |
| (in thousands of USD) | | 2017 | | 2016 | | 2015 |
| Foreign currency translation differences for foreign operations | | 448 |
| | 170 |
| | (429 | ) |
| Net finance expense recognized directly in equity | | 448 |
| | 170 |
| | (429 | ) |
| Attributable to: | | | | | | |
| Owners of the Company | | 448 |
| | 170 |
| | (429 | ) |
| Net finance expense recognized directly in equity | | 448 |
| | 170 |
| | (429 | ) |
| Recognized in: | | | | | | |
| Translation reserve | | 448 |
| | 170 |
| | (429 | ) |
NOTES TO CONSOLIDATED FINANCIAL STATEMENTS 20172020
Note 7 - Income tax benefit (expense)
| | | | | | | | | | | | | | | | | | | | |
| (in thousands of USD) | | 2020 | | 2019 | | 2018 |
| Current tax | | | | | | |
| Current period | | (575) | | | (1,066) | | | (37) | |
| Total current tax | | (575) | | | (1,066) | | | (37) | |
| | | | | | |
| Deferred tax | | | | | | |
| Recognition of unused tax losses/(use of tax losses) | | (1,369) | | | 474 | | | (195) | |
| Other | | 0 | | | (10) | | | (6) | |
| Total deferred tax | | (1,369) | | | 464 | | | (201) | |
| | | | | | |
| Total tax benefit/(expense) | | (1,944) | | | (602) | | | (238) | |
|
| | | | | | | | | |
| (in thousands of USD) | | 2017 | | 2016 | | 2015 |
| Current tax | | | | | | |
| Current period | | (85 | ) | | 60 |
| | (98 | ) |
| Total current tax | | (85 | ) | | 60 |
| | (98 | ) |
| | | | | | | |
| Deferred tax | | | | | | |
| Recognition of unused tax losses/(use of tax losses) | | 1,473 |
| | 220 |
| | (5,450 | ) |
| Other | | (30 | ) | | (106 | ) | | (85 | ) |
| Total deferred tax | | 1,443 |
| | 114 |
| | (5,535 | ) |
| | | | | | | |
| Total tax benefit/(expense) | | 1,358 |
| | 174 |
| | (5,633 | ) |
| | | Reconciliation of effective tax | | 2017 | | 2016 | | 2015 | Reconciliation of effective tax | | 2020 | | 2019 | | 2018 |
| Profit (loss) before tax | | | | 25 |
| | | | 203,875 |
| | | | 355,934 |
| Profit (loss) before tax | | 475,182 | | | 112,832 | | | (109,832) | |
| | | | | | | | | | | | | | |
| Tax at domestic rate | | (33.99 | )% | | (8 | ) | | (33.99 | )% | | (69,297 | ) | | (33.99 | )% | | (120,982 | ) | Tax at domestic rate | | (25.00) | % | | (118,796) | | | (29.58) | % | | (33,376) | | | (29.58) | % | | 32,488 | |
| Effects on tax of : | | | | | | | | | | | | | Effects on tax of : | |
| Tax exempt profit / loss | | | | 499 |
| | | | (8,090 | ) | | | | (144 | ) | Tax exempt profit / loss | | 241 | | | 317 | | | (50) | |
| Tax adjustments for previous years | | | | 10 |
| | | | 70 |
| | | | 17 |
| Tax adjustments for previous years | | 0 | | | 34 | | | 9 | |
| Loss for which no DTA (*) has been recognized | | | | — |
| | | | — |
| | | | (4,811 | ) | Loss for which no DTA (*) has been recognized | | (61) | | | (26) | | | (1,037) | |
| Use of previously unrecognized tax losses | | | | 7,146 |
| | | | 1,118 |
| | | | 15,668 |
| |
| | Non-deductible expenses | | | | (710 | ) | | | | (1,718 | ) | | | | (5,225 | ) | Non-deductible expenses | | (482) | | | (538) | | | (962) | |
| Use of previously unrecognized tax losses and tax credits | | Use of previously unrecognized tax losses and tax credits | | 267 | | | 4,066 | | | 0 | |
| Tonnage Tax regime | | | | (13,918 | ) | | | | 64,637 |
| | | | 91,334 |
| Tonnage Tax regime | | 115,174 | | | 24,534 | | | (33,602) | |
| Effect of share of profit of equity-accounted investees | | | | 10,175 |
| | | | 13,761 |
| | | | 17,536 |
| Effect of share of profit of equity-accounted investees | | 2,613 | | | 2,482 | | | 4,690 | |
| Effects of tax regimes in foreign jurisdictions | | | | (1,836 | ) | | | | (307 | ) | | | | 974 |
| Effects of tax regimes in foreign jurisdictions | | (900) | | | 1,905 | | | (1,774) | |
| Total taxes | | 5,430.01 | % | | 1,358 |
| | 0.09 | % | | 174 |
| | (1.58 | )% | | (5,633 | ) | Total taxes | | (0.41) | % | | (1,944) | | | (0.53) | % | | (602) | | | 0.22 | % | | (238) | |
In application of an IFRIC agenda decision on 'IAS‘IAS 12 Income taxes'taxes’, tonnage tax is not accounted for as income taxes in accordance with IAS 12 and is not presented as part of income tax expense in the consolidated statement of profit or loss but
has been shown as an administrative expense under the heading General and administrative expenses. The amount paid for tonnage tax in the year ended December 31, 20172020 was USD 4.8$3.5 million (2019: $1.3 million) (see Note 5).
* Deferred Tax Asset
NOTES TO CONSOLIDATED FINANCIAL STATEMENTS 20172020
Note 8 - Property, plant and equipment
| | | | | | | | | | | | | | | | | | | | | | | | | | | | | | | | | | |
| (in thousands of USD) | | Vessels | | Vessels under construction | | Right-of-use assets | | Other tangible assets | | | | Total PPE |
| At January 1, 2018 | | | | | | | | | | | | |
| Cost | | 3,595,692 | | | 63,668 | | | 0 | | | 3,545 | | | | | 3,662,905 | |
| Depreciation & impairment losses | | (1,324,192) | | | 0 | | | 0 | | | (1,882) | | | | | (1,326,074) | |
| Net carrying amount | | 2,271,500 | | | 63,668 | | | 0 | | | 1,663 | | | | | 2,336,831 | |
| | | | | | | | | | | | |
| Acquisitions | | 45,750 | | | 191,726 | | | 0 | | | 588 | | | | | 238,064 | |
| Acquisitions through business combinations (Note 25) | | 1,704,250 | | | 0 | | | 0 | | 345 | | | | | 1,704,595 | |
| Disposals and cancellations | | (7,814) | | | 0 | | | 0 | | | (75) | | | | | (7,889) | |
| Disposals and cancellations through business combinations (Note 25) | | (434,000) | | | 0 | | | 0 | | | 0 | | | | | (434,000) | |
| Depreciation charges | | (270,018) | | | 0 | | | 0 | | | (564) | | | | | (270,582) | |
| Transfer to assets held for sale (Note 3) | | (44,995) | | | 0 | | | 0 | | 0 | | | | | (44,995) | |
| Transfers | | 255,394 | | | (255,394) | | | 0 | | | 0 | | | | | 0 | |
| Translation differences | | 0 | | | 0 | | | 0 | | | (14) | | | | | (14) | |
| Balance at December 31, 2018 | | 3,520,067 | | | 0 | | | 0 | | | 1,943 | | | | | 3,522,010 | |
| | | | | | | | | | | | |
| At January 1, 2019 | | | | | | | | | | | | |
| Cost | | 4,927,324 | | | 0 | | | 0 | | | 4,274 | | | | | 4,931,598 | |
| Depreciation & impairment losses | | (1,407,257) | | | 0 | | | 0 | | (2,331) | | | | | (1,409,588) | |
| Net carrying amount | | 3,520,067 | | | 0 | | | 0 | | | 1,943 | | | | | 3,522,010 | |
| | | | | | | | | | | | |
| Acquisitions | | 7,024 | | | 0 | | | 549 | | | 1,012 | | | | | 8,585 | |
| Adoption IFRS 16 | | 0 | | | 0 | | | 87,598 | | | 0 | | | | | 87,598 | |
| | | | | | | | | | | | |
| Disposals and cancellations | | (29,386) | | | 0 | | | 0 | | | (52) | | | | | (29,438) | |
| | | | | | | | | | | | |
| Depreciation charges | | (307,738) | | | 0 | | | (29,265) | | | (643) | | | | | (337,646) | |
| Transfer to assets held for sale | | (12,705) | | | 0 | | | 0 | | | 0 | | | | | (12,705) | |
| | | | | | | | | | | | |
| Translation differences | | 0 | | | 0 | | | 26 | | | 5 | | | | | 31 | |
| Balance at December 31, 2019 | | 3,177,262 | | | 0 | | | 58,908 | | | 2,265 | | | | | 3,238,435 | |
| | | | | | | | | | | | |
| At January 1, 2020 | | | | | | | | | | | | |
| Cost | | 4,815,910 | | | 0 | | | 88,182 | | | 5,042 | | | | | 4,909,134 | |
| Depreciation & impairment losses | | (1,638,648) | | | 0 | | | (29,274) | | | (2,777) | | | | | (1,670,699) | |
| Net carrying amount | | 3,177,262 | | | 0 | | | 58,908 | | | 2,265 | | | | | 3,238,435 | |
| | | | | | | | | | | | |
| Acquisitions | | 17,835 | | | 207,069 | | | 25,701 | | | 285 | | | | | 250,890 | |
| | | | | | | | | | | | |
| Disposals and cancellations | | (42,641) | | | 0 | | | 0 | | | (2) | | | | | (42,643) | |
| | | | | | | | | | | | |
| Depreciation charges | | (287,148) | | | 0 | | | (31,702) | | | (802) | | | | | (319,652) | |
| | | | | | | | | | | | |
| | | | | | | | | | | | |
| Translation differences | | 0 | | | 0 | | | 48 | | | 13 | | | | | 61 | |
| Balance at December 31, 2020 | | 2,865,308 | | | 207,069 | | | 52,955 | | | 1,759 | | | | | 3,127,091 | |
| | | | | | | | | | | | |
| At December 31, 2020 | | | | | | | | | | | | |
| Cost | | 4,608,326 | | | 207,069 | | | 113,859 | | | 5,189 | | | | | 4,934,443 | |
| Depreciation & impairment losses | | (1,743,018) | | | 0 | | | (60,904) | | | (3,430) | | | | | (1,807,352) | |
| Net carrying amount | | 2,865,308 | | | 207,069 | | | 52,955 | | | 1,759 | | | | | 3,127,091 | |
|
| | | | | | | | | | | | | | | |
| (in thousands of USD) | | Vessels | | Vessels under construction | | Other tangible assets | | Prepayments | | Total PPE |
| At January 1, 2015 | | | | | | | | | | |
| Cost | | 3,342,607 |
| | — |
| | 2,997 |
| | 16,601 |
| | 3,362,205 |
|
| Depreciation & impairment losses | | (1,084,273 | ) | | — |
| | (1,771 | ) | | — |
| | (1,086,044 | ) |
| Net carrying amount | | 2,258,334 |
| | — |
| | 1,226 |
| | 16,601 |
| | 2,276,161 |
|
| | | | | | | | | | | |
| Acquisitions | | 257,706 |
| | 93,890 |
| | 288 |
| | 8,001 |
| | 359,885 |
|
| Disposals and cancellations | | (10,681 | ) | | — |
| | (3 | ) | | (8,000 | ) | | (18,684 | ) |
| Depreciation charges | | (209,728 | ) | | — |
| | (428 | ) | | — |
| | (210,156 | ) |
| Transfer to assets held for sale | | (24,195 | ) | | — |
| | — |
| | — |
| | (24,195 | ) |
| Transfers | | 16,600 |
| | — |
| | — |
| | (16,600 | ) | | — |
|
| Translation differences | | — |
| | — |
| | (35 | ) | | — |
| | (35 | ) |
| Balance at December 31, 2015 | | 2,288,036 |
| | 93,890 |
| | 1,048 |
| | 2 |
| | 2,382,976 |
|
| | | | | | | | | | | |
| At January 1, 2016 | | |
| | |
| | |
| | |
| | |
|
| Cost | | 3,477,605 |
| | 93,890 |
| | 2,482 |
| | 2 |
| | 3,573,979 |
|
| Depreciation & impairment losses | | (1,189,569 | ) | | — |
| | (1,434 | ) | | — |
| | (1,191,003 | ) |
| Net carrying amount | | 2,288,036 |
| | 93,890 |
| | 1,048 |
| | 2 |
| | 2,382,976 |
|
| | | | | | | | | | | |
| Acquisitions | | 250,912 |
| | 86,944 |
| | 175 |
| | 3 |
| | 338,034 |
|
| Acquisitions through business combinations (Note 24) | | 120,280 |
| | — |
| | — |
| | — |
| | 120,280 |
|
| Disposals and cancellations | | (143,457 | ) | | — |
| | (7 | ) | | — |
| | (143,464 | ) |
| Depreciation charges | | (227,306 | ) | | — |
| | (358 | ) | | — |
| | (227,664 | ) |
| Transfer to assets held for sale | | — |
| | — |
| | — |
| | — |
| | — |
|
| Transfers | | 94,698 |
| | (94,698 | ) | | 5 |
| | (5 | ) | | — |
|
| Translation differences | | — |
| | — |
| | (86 | ) | | — |
| | (86 | ) |
| Balance at December 31, 2016 | | 2,383,163 |
| | 86,136 |
| | 777 |
| | — |
| | 2,470,076 |
|
| | | | | | | | | | | |
| At January 1, 2017 | | | | | | | | | | |
| Cost | | 3,748,135 |
| | 86,136 |
| | 2,373 |
| | — |
| | 3,836,644 |
|
| Depreciation & impairment losses | | (1,364,972 | ) | | — |
| | (1,596 | ) | | — |
| | (1,366,568 | ) |
| Net carrying amount | | 2,383,163 |
| | 86,136 |
| | 777 |
| | — |
| | 2,470,076 |
|
| | | | | | | | | | | |
| Acquisitions | | 125,486 |
| | 51,201 |
| | 1,203 |
| | — |
| | 177,890 |
|
| Acquisitions through business combinations (Note 24) | | — |
| | — |
| | — |
| | — |
| | — |
|
| Disposals and cancellations | | (81,389 | ) | | — |
| | (9 | ) | | — |
| | (81,398 | ) |
| Depreciation charges | | (229,429 | ) | | — |
| | (348 | ) | | — |
| | (229,777 | ) |
| Transfer to assets held for sale | | — |
| | — |
| | — |
| | — |
| | — |
|
| Transfers | | 73,669 |
| | (73,669 | ) | | — |
| | — |
| | — |
|
| Translation differences | | — |
| | — |
| | 40 |
| | — |
| | 40 |
|
| Balance at December 31, 2017 | | 2,271,500 |
| | 63,668 |
| | 1,663 |
| | — |
| | 2,336,831 |
|
| | | | | | | | | | | |
| At December 31, 2017 | | |
| | |
| | |
| | |
| | |
|
| Cost | | 3,595,692 |
| | 63,668 |
| | 3,545 |
| | — |
| | 3,662,905 |
|
| Depreciation & impairment losses | | (1,324,192 | ) | | — |
| | (1,882 | ) | | — |
| | (1,326,074 | ) |
| Net carrying amount | | 2,271,500 |
| | 63,668 |
| | 1,663 |
| | — |
| | 2,336,831 |
|
On January 12In 2020, the Hakata, Hakone, Filikon, Sofia, Statia, Dominica and January 20, 2017, Euronav took delivery of the VLCCs Ardeche (2017 - 298,642dwt) and the VLCC Aquitaine (2017 - 298,767 dwt).
In 2017, the Cap Lara, Captain Michael, Alsace, Iris, Navarin, Simone, Ilma, Nucleus, Neptun, Sonia, Filikon, TI Europe and Nectar Dia have been dry-docked. The cost of planned repairs and maintenance is capitalized and included under the heading acquisitions and is depreciated over their estimated useful life (2.5-5 years).Acquisitions.
The adoption of IFRS 16 as of January 1, 2019 (see Note 1.19), resulted in the recognition of right-of-use assets of $87.6 million on the balance sheet which are included under the heading Adoption IFRS 16.
NOTES TO CONSOLIDATED FINANCIAL STATEMENTS 20172020
Note 8 - Property, plant and equipment (Continued)
On October 27, 2020 and November 6, 2020, the Company entered into a time charter agreement for 2 Suezmaxes, Marlin Sardinia and Marlin Somerset (see Note 20). In accordance with IFRS, the Group recognized a right-of-use asset of $24.9 million.
The group had 4 vessels under construction at December 31, 2020 for an aggregate amount of $207.1 million (2019: 0 vessels under construction). The amounts presented within "vessels under construction" relate to 4 Eco-type VLCCs.
Disposal of assets – Gains/losses
| | | | | | | | | | | | | | | | | | | | | | | | | | |
| (in thousands of USD) | | Sale price | | Book Value | | Gain | | Loss |
Cap Jean - Sale | | 10,175 | | | 0 | | | 10,175 | | | 0 | |
Cap Romuald - Sale | | 10,282 | | | 1,319 | | | 8,963 | | | 0 | |
Gener8 Companion - Sale | | 6,305 | | | 6,495 | | | 0 | | | (190) | |
| Other | | 0 | | | 0 | | | 0 | | | (83) | |
| | | | | | | | |
| At December 31, 2018 | | 26,762 | | | 7,814 | | | 19,138 | | | (273) | |
| | | | | | | | |
| | | Sale price | | Book Value | | Gain | | Loss |
Felicity - Sale | | 42,000 | | | 42,000 | | | 0 | | | 0 | |
Compatriot - Sale | | 6,615 | | | 6,173 | | | 442 | | | 0 | |
VK Eddie - Sale | | 37,620 | | | 23,212 | | | 14,408 | | | 0 | |
| Other | | 29 | | | 0 | | | 29 | | | (75) | |
| At December 31, 2019 | | 86,264 | | | 71,385 | | | 14,879 | | | (75) | |
| | | | | | | | |
| | Sale price | | Book Value | | Gain | | Loss |
Finesse - Sale | | 21,003 | | | 12,705 | | | 8,298 | | | 0 | |
Cap Diamant - Sale | | 20,072 | | | 7,242 | | | 12,830 | | | 0 | |
TI Hellas - Sale | | 37,000 | | | 35,400 | | | 1,600 | | | 0 | |
| | | | | | | | |
| At December 31, 2020 | | 78,075 | | | 55,347 | | | 22,728 | | | 0 | |
|
| | | | | | | | | | | | | | | | | |
| (in thousands of USD) | | Acquisitions | | Sale price | | Book Value | | Gain | | Deferred Gain | Loss |
| Antarctica - Sale (Note 3) | | — |
| | 91,065 |
| | 89,000 |
| | 2,065 |
| | — |
| — |
|
| Cap Laurent - Sale | | — |
| | 21,825 |
| | 10,682 |
| | 11,143 |
| | — |
| — |
|
| Other | | — |
| | — |
| | — |
| | 94 |
| | — |
| (8,002 | ) |
| At December 31, 2015 | | | | | | | | 13,302 |
| | — |
| (8,002 | ) |
| | | | | | | | | | | | |
| | | Acquisitions | | Sale price | | Book Value | | Gain | | Deferred Gain | Loss |
| Famenne - Sale (Note 3) | | — |
| | 38,016 |
| | 24,195 |
| | 13,821 |
| | — |
| — |
|
| Nautilus - Sale | | — |
| | 43,250 |
| | 32,208 |
| | 11,042 |
| | (500 | ) | — |
|
| Navarin - Sale | | — |
| | 47,250 |
| | 36,739 |
| | 10,511 |
| | (1,500 | ) | — |
|
| Neptun - Sale | | — |
| | 47,250 |
| | 37,534 |
| | 9,716 |
| | (1,500 | ) | — |
|
| Nucleus - Sale | | — |
| | 47,250 |
| | 36,974 |
| | 10,276 |
| | (1,500 | ) | — |
|
| Other | | — |
| | — |
| | — |
| | 31 |
| | — |
| (2 | ) |
| At December 31, 2016 | | | | | | | | 55,397 |
| | (5,000 | ) | (2 | ) |
| | | | | | | | | | | | |
| | | Acquisitions | | Sale price | | Book Value | | Gain | | Deferred Gain | Loss |
| TI Topaz - Sale | | — |
| | 20,790 |
| | 41,817 |
| | — |
| | — |
| (21,027 | ) |
| Flandre - Sale | | — |
| | 45,000 |
| | 24,693 |
| | 20,307 |
| | — |
| — |
|
| Cap Georges - Sale | | — |
| | 9,310 |
| | 801 |
| | 8,509 |
| | — |
| — |
|
| Artois - Sale | | — |
| | 21,780 |
| | 14,077 |
| | 7,703 |
| | — |
| — |
|
| Other | | — |
| | 28 |
| | 8 |
| | 20 |
| | — |
| — |
|
| At December 31, 2017 | | | | | | | | 36,538 |
| | — |
| (21,027 | ) |
On MayJanuary 23, 2017,2020 the Company sold the VLCC TI Topaz (2002Suezmax Finesse (2003 - 319,430149,994 dwt), for $21.0 million. This vessel was accounted for as a net sales pricenon-current asset held for sale as at December 31, 2019 and had a carrying value of USD 20.8$12.7 million. The loss on that sale of USD 21.0 millionvessel was recorded upon delivery of the vesseldelivered to its new owner on February 21, 2020 and the capital gain of $8.3 million was recorded in the first quarter of 2020.
On March 20, 2020, Euronav sold the Suezmax Cap Diamant (2001 - 160,044 dwt) for a net sale price of $20.1 million. The Company recorded a capital gain of $12.8 million in the second quarter of 2017.
On November 10, 2017, the Company sold the VLCC Flandre (2004 - 305,688 dwt) for USD 45.0 million to a global supplier and operator of offshore floating platforms. The Company recorded a gain of USD 20.3 million on the sale which was recorded2020 upon delivery to its new owner on December 20, 2017.April 9, 2020.
On November 16, 2017, the CompanyApril 22, 2020, Euronav sold the Suezmax Cap Georges (1998VLCC TI Hellas (2005 - 146,652319,254 dwt) for USD 9.3a net sale price of $37.0 million. The Company recorded aA capital gain of USD 8.5$1.6 million onwas recorded in the salesecond quarter of 2020 upon delivery to its new owner on November 29, 2017.June 5, 2020.
On November 17, 2017, the Company sold the VLCC Artois (2001 - 298,330 dwt) for USD 21.8 million. The Artois was the oldest vessel in the Company’s VLCC fleet. The Company recorded a gain of USD 7.7 million on the sale upon delivery to its new owner on December 4, 2017.
Impairment
TankersIn previous years Euronav carefully assessed through a detailed approach if the carrying amounts of the vessels would require an impairment. No impairment was booked so far. In 2019 the Group did not perform an impairment test because no indicators of impairment were present.
Euronav defines its cash generating unitThis year, and both for the CGUs under the tankers segment and the FSO segment (as defined in Note 2), the Group performed a review of the internal as well as external indicators of impairment to consider whether further testing was necessary. As of December 31, 2020, the significant drop in market rates and the very low share price of the Group were identified as two indicators which triggered the requirement to perform a single vessel, unlessmore in-depth impairment analysis (2019: no such vessel is operated in a pool, in which case such vessel, together with the other vessels in the pool, are collectively treated as a cash generating unit.
indicators were
NOTES TO CONSOLIDATED FINANCIAL STATEMENTS 20172020
Note 8 - Property, plant and equipment (Continued)
present) for CGUs under the tankers segment. For the FSO segment, the Group concluded that the impairment indicator ‘market rates’ was not applicable following the conclusion of the profitable extension agreements until the end of the FSOs’ useful lives. Hence, the annual impairment tests were performed for the defined cash-generating units under the tankers segment. The Group has performed an impairment test for tankers whereby the carryingrecoverable amount of an asset or CGUthose cash-generating units has been determined based on a value-in-use calculation using cash flow projections generated. This exercise is comparedcomplex and requires various estimates to its recoverable amount, which is the greater of its value in use and its fair value less costbe made, relating to, sell. In assessing value in use, the following assumptions were used:
- 10 year historical average spotamong other things, vessel values, future freight rates, are used as forecastearnings from the vessels, discount rates and economic life of vessels. These assumptions, and in particular for estimating future charter rates,
- are based on historical trends and current market conditions, as well as future expectations, the latter integrating the impact of weaker TCE because of COVID-19. The same methodology used in previous years was applied which takes into consideration the volatile character of the tanker business by considering a full shipping cycle defined from peak to the next peak level while applying a weighing to the past cycles. The Weighted Average Cost of Capital ("WACC"('WACC') used to calculate the value in use was 5.45%.
The most significant factors that could impact management’s assumptions regarding future time charter equivalent rates include (i) unanticipated changes in demand for transportation of 9.70% (2016: 6.43%crude oil cargoes, (ii) changes in production or supply of or demand for oil, generally or in specific geographical regions, (iii) the levels of tanker newbuilding orders or the levels of tanker scrappings, (iv) changes in rules and 2015: 6.01%)regulations applicable to the tanker industry, including legislation adopted by international organizations such as the IMO or by individual countries and vessels’ flag states.
- 20 year useful life with residual value equal to zero
Although management believesThe assessment did not indicate that the assumptions used to evaluate potentialcarrying amounts of the cash generating units, including right of use assets, may be higher than its recoverable amount. Whilst no impairment are reasonable and appropriate, such assumptions are subject to judgment. In particular,is required this year, we cannot assure this will be also the years 2008-2017 were retainedcase in the trailing 10-year historical average spot rates onfuture. Any impairment charge incurred could negatively affect our financial condition, operating results, the tanker segmentvalue of our shares and include year 2008, which was an exceptional high year in termsamount of TCE achieved by both the VLCC and Suezmax fleets.The increase in WACC in 2017 compared to 2016 is mainly related to the higher cost of equity due to a higher Beta and higher market risk. The impairment test did not result in a requirement to record an impairment loss in 2017. dividend.
With an increase of the WACC of 300bps200bps to 12.70%7.45%, the analysis would also indicate an impairment loss in 2017 of USD 9.2 million.
Recognizing that the transportationcarrying amount of crude oilthe vessels as of December 31, 2020 is not impaired. This weighting and petroleum productsforecasting on the ongoing cycle is cyclical and subject to significant volatility based on factors beyond Euronav's control, Euronav believesmanagement judgement, but none of the full cycles, with or without management forecasting of the ongoing cycle or the sole use of estimates based on the 10-year historical average rates calculated as of the reporting dateongoing cycle would lead to be reasonable as historically it is an appropriate reflection of a typical shipping cycle despite the fact that the standard deviation of the 10-year average has increased in 2017 compared to 2016. impairment.
When using 5-year historical charter rates in this impairment analysis, the impairment analysis indicates that an impairment of USD 5.7 million is required for the tanker fleet (2016: no impairment and 2015: USD 123.3 million), and when using 1-year10-year historical charter rates in this impairment analysis, the impairment analysis indicates that an impairment is required for the tanker fleet of USD 427.3 million (2016 and 2015: no impairment).
FSO
In0.7 million. When using 5-year historical charter rates in this impairment analysis, the context of the valuation of the Group's investments in the respective joint ventures, the Group also performedimpairment analysis indicates that an impairment test onis required for the FSO vessels owned by TI Asia Ltdtanker fleet of USD 2.4 million and TI Africa Ltd. For FSOswhen using 1-year historical charter rates in this impairment analysis, the impairment assessment has been based on a value in use calculation to estimate the recoverable amount from the vessel. This methodanalysis indicates that 0 impairment is chosen as there is no efficient market for transactions of FSO vessels as each vessel is often purposely built for specific circumstances. In assessing value in use, the following assumptions were used:
- Weighted Average Cost of Capital ('WACC') of 9.70% (2016: 6.43% and 2015: 6.01%)
- 25 year useful life with residual value equal to zero
This assessment did not result in a requirement to record an impairment loss in 2017. Even with an increase of the WACC of 300bps, there was no need to record an impairment loss in 2017. The value in use calculation for FSOs is based on the remaining useful life of the vessels as of the reporting date, and is based on fixed daily rates as well as management's best estimate of daily rates for future unfixed periods. The FSO Asia and the FSO Africa were on a timecharter contract to Maersk Oil Qatar until July 22, 2017 and September 22, 2017, respectively. On May 14, 2017, the joint ventures between the Group and International Seaways, signed a contract for five yearsrequired for the FSO Africatanker fleet.
NOTES TO CONSOLIDATED FINANCIAL STATEMENTS 2020
Note 8 - Property, plant and FSO Asia in direct continuation of the current contractual service. The contract was signed with North Oil Company, the new operator of the Al-Shaheen oil field, whose shareholders are Qatar Petroleum Oil & gas Limited and Total E&P Golfe Limited.equipment (Continued)
Security
All tankers financed are subject to a mortgage to secure bank loans (see Note 15)16).
Vessels on order or under construction
The group had four vessels under construction as at December 31, 2017 for an aggregate amount of USD 63.7 million (2016: USD 86.1 million and 2015: 93.9 million). The amounts presented within "Vessels under construction" relate to four Ice Class Suezmax vessels from Hyundai Heavy Industries of which the first Ice Class Suezmax was delivered on March 26, 2018, the second Ice Class Suezmax will be delivered in the second quarter of 2018 and the other two Ice Class Suezmax in the second half of 2018.
NOTES TO CONSOLIDATED FINANCIAL STATEMENTS 2017
Note 8 - Property, plant and equipment (Continued)
Capital commitment
As at December 31, 20172020 the Group's total capital commitmentcommitments amounts to USD 185.9$172.1 million (2016: USD 208.8 million)(December 31, 2019 0 capital commitments). These capital commitments relate to 3 out of the 4 VLCC newbuilding contracts entered into in 2020. The capital commitments can be detailed as follows:
| | | | | | | | | | | | | | | | | | | | |
| (in thousands of USD) | | Total | | 2021 | | 2022 |
| Commitments in respect of VLCCs | | 172,100 | | | 172,100 | | | 0 | |
| Commitments in respect of Suezmaxes | | 0 | | | 0 | | | 0 | |
| Commitments in respect of FSOs | | 0 | | | 0 | | | 0 | |
| Total | | 172,100 | | | 172,100 | | | 0 | |
| | | | | | |
|
| | | | | | | | | | | | |
| (in thousands of USD) | | As at December 31, 2016 payments scheduled for |
| | | TOTAL | | 2017 | | 2018 | | 2019 |
| Commitments in respect of VLCCs | | 97,035 |
| | 97,035 |
| | — |
| | — |
|
| Commitments in respect of Suezmaxes | | 111,793 |
| | 24,843 |
| | 86,950 |
| | — |
|
| Commitments in respect of FSOs | | — |
| | — |
| | — |
| | — |
|
| Total | | 208,828 |
| | 121,878 |
| | 86,950 |
| | — |
|
| | | | | | | | | |
| | | As at December 31, 2017 payments scheduled for |
| | | TOTAL | | 2018 |
| | 2019 |
| | 2020 |
|
| Commitments in respect of VLCCs | | — |
| | — |
| | — |
| | — |
|
| Commitments in respect of Suezmaxes | | 185,922 |
| | 185,922 |
| | — |
| | — |
|
| Commitments in respect of FSOs | | — |
| | — |
| | — |
| | — |
|
| Total | | 185,922 |
| | 185,922 |
| | — |
| | — |
|
At December 31, 2016, Euronav held the option to purchase an additional two Ice Class Suezmax vessels from Hyundai Heavy Industries. Euronav exercised this option in the second quarter of 2017 which brings the number to four ordered Ice Class Suezmax vessels.
NOTES TO CONSOLIDATED FINANCIAL STATEMENTS 20172020
Note 9 - Deferred tax assets and liabilities
Recognized deferred tax assets and liabilities
Deferred tax assets and liabilities are attributable to the following:
| | (in thousands of USD) | | (in thousands of USD) | | ASSETS | | LIABILITIES | | NET |
| | Employee benefits | | Employee benefits | | 26 | | | 0 | | | 26 | |
| Unused tax losses & tax credits | | Unused tax losses & tax credits | | 29,011 | | | 0 | | | 29,011 | |
| Unremitted earnings | | Unremitted earnings | | 0 | | | (26,322) | | | (26,322) | |
| | | 29,037 | | | (26,322) | | | 2,715 | |
| Offset | | Offset | | (26,322) | | | 26,322 | | | |
| Balance at December 31, 2019 | | Balance at December 31, 2019 | | 2,715 | | | 0 | | | |
| | | (in thousands of USD) | | ASSETS |
| | LIABILITIES |
| | NET |
| |
| Provisions | | 31 |
| | — |
| | 31 |
| |
| Employee benefits | | 37 |
| | — |
| | 37 |
| Employee benefits | | 29 | | | 0 | | | 29 | |
| Unused tax losses & tax credits | | 896 |
| | — |
| | 896 |
| Unused tax losses & tax credits | | 27,650 | | | 0 | | | 27,650 | |
| Unremitted earnings | | Unremitted earnings | | 0 | | | (26,322) | | | (26,322) | |
| | | 964 |
| | — |
| | 964 |
| | | 27,679 | | | (26,322) | | | 1,357 | |
| Offset | | — |
| | — |
| | |
| Offset | | (26,322) | | | 26,322 | | |
| Balance at December 31, 2016 | | 964 |
| | — |
| | |
| |
| | | | | | | | |
| Provisions | | 1 |
| | — |
| | 1 |
| |
| Employee benefits | | 44 |
| | — |
| | 44 |
| |
| Unused tax losses & tax credits | | 2,442 |
| | — |
| | 2,442 |
| |
| | | 2,487 |
| | — |
| | 2,487 |
| |
| Offset | | — |
| | — |
| | | |
| Balance at December 31, 2017 | | 2,487 |
| | — |
| | | |
| Balance at December 31, 2020 | | Balance at December 31, 2020 | | 1,357 | | | 0 | | | |
Unrecognized deferred tax assets and liabilities
Deferred tax assets and liabilities have not been recognized in respect of the following items:
| | | (in thousands of USD) | | December 31, 2017 | | December 31, 2016 | (in thousands of USD) | | December 31, 2020 | | December 31, 2019 |
| | | ASSETS |
| | LIABILITIES |
| | ASSETS |
| | LIABILITIES |
| | ASSETS | | LIABILITIES | | ASSETS | | LIABILITIES |
| Deductible temporary differences | | 357 |
| | — |
| | 280 |
| | — |
| Deductible temporary differences | | 38 | | | 0 | | | 290 | | | 0 | |
| Taxable temporary differences | | 7 |
| | (14,231 | ) | | 7 |
| | (25,213 | ) | Taxable temporary differences | | 0 | | | (12,162) | | | 0 | | | (12,162) | |
| Tax losses & tax credits | | 89,528 |
| | — |
| | 105,731 |
| | — |
| Tax losses & tax credits | | 64,923 | | | 0 | | | 59,772 | | | 0 | |
| | | 89,892 |
| | (14,231 | ) | | 106,018 |
| | (25,213 | ) | | 64,961 | | | (12,162) | | | 60,062 | | | (12,162) | |
| Offset | | (14,231 | ) | | 14,231 |
| | (25,213 | ) | | 25,213 |
| Offset | | (12,162) | | | 12,162 | | | (12,162) | | | 12,162 | |
| Total | | 75,661 |
| | — |
| | 80,805 |
| | — |
| Total | | 52,799 | | | 0 | | | 47,900 | | | 0 | |
The unrecognized deferred tax assets in respect of tax losses and tax credits are relatedrelates to tax losses carried forward, investment deduction allowances and excess dividend received deduction. Tax losses and tax credits have no expiration date.
The increase in unrecognized deferred tax assets is mainly due to currency translations.
A deferred tax asset ('DTA') is recognized for unused tax losses and tax credits carried forward, to the extent that it is probable that future taxable profits will be available. The Group considers future taxable profits as probable when it is more likely than not that taxable profits will be generated in the foreseeable future. When determining whether probable future taxable profits are available the probability threshold is applied to portions of the total amount of unused tax losses or tax credits, rather than the entire amount.
Given the nature of the tonnage tax regime, the Group has a substantial amount of unused tax losses and tax credits for which no future taxable profits are probable and therefore no deferred tax assetDTA has been recognized.
The unrecognized tax liabilities in respect of taxable temporary differences relate primarily to tax liabilities in respect of non distributed reserves of the Group that will be taxed when distributed.
No deferred tax liability has been recognized because the Group controls whether the tax liability will be incurred and management is satisfied that the tax liability will not be incurred in the foreseeable future. In addition, no deferred tax liabilities have been recognized for temporary differences related to vessels for which the Group expects that the reversal of these differences will not have a tax effect.
In December 2017, changes to the Belgian corporate income tax rate were enacted, lowering the rate to 29.58% as from 2018 and to 25% from 2020. These changes have been reflected in the calculation of the amounts of deferred tax assets and liabilities in respect of Belgian Group entities as at December 31, 2017.2020 and December 31, 2019.
NOTES TO CONSOLIDATED FINANCIAL STATEMENTS 20172020
Note 9 - Deferred tax assets and liabilities (Continued)
Movement in deferred tax balances during the year
| | | | | | | | | | | | | | | | | | | | | | | | | | | | | | | | |
| (in thousands of USD) | | Balance at Jan 1, 2018 | | Recognized in income | | Recognized in equity | | Translation differences | | Balance at Dec 31, 2018 |
| Provisions | | 1 | | | (1) | | | 0 | | | 0 | | | 0 | |
| Employee benefits | | 44 | | | (5) | | | 0 | | | (2) | | | 37 | |
| Unused tax losses & tax credits | | 2,442 | | | (195) | | | 0 | | | (29) | | | 2,218 | |
| Total | | 2,487 | | | (201) | | | 0 | | | (31) | | | 2,255 | |
| | | | | | | | | | |
| | Balance at Jan 1, 2019 | | Recognized in income | | Recognized in equity | | Translation differences | | Balance at Dec 31, 2019 |
| | | | | | | | | | |
| Provisions | | 0 | | | 0 | | | 0 | | | 0 | | | 0 | |
| Employee benefits | | 37 | | | (10) | | | 0 | | | (1) | | | 26 | |
| Unused tax losses & tax credits | | 2,218 | | | 474 | | | 0 | | | (3) | | | 2,689 | |
| Total | | 2,255 | | | 464 | | | 0 | | | (4) | | | 2,715 | |
| | | | | | | | | | |
| | Balance at Jan 1, 2020 | | Recognized in income | | Recognized in equity | | Translation differences | | Balance at Dec 31, 2020 |
| | | | | | | | | | |
| Provisions | | 0 | | | 0 | | | 0 | | | 0 | | | 0 | |
| Employee benefits | | 26 | | | 0 | | | 0 | | | 3 | | | 29 | |
| Unused tax losses & tax credits | | 2,689 | | | (1,369) | | | 0 | | | 8 | | | 1,328 | |
| Total | | 2,715 | | | (1,369) | | | 0 | | | 11 | | | 1,357 | |
|
| | | | | | | | | | | | | | | |
| (in thousands of USD) | | Balance at Jan 1, 2015 |
| | Recognized in income |
| | Recognized in equity |
| | Translation differences |
| | Balance at Dec 31, 2015 |
|
| Provisions | | 238 |
| | (61 | ) | | — |
| | (8 | ) | | 169 |
|
| Employee benefits | | 52 |
| | (24 | ) | | — |
| | (5 | ) | | 23 |
|
| Unused tax losses & tax credits | | 6,246 |
| | (5,450 | ) | | — |
| | (53 | ) | | 743 |
|
| Total | | 6,536 |
| | (5,535 | ) | | — |
| | (66 | ) | | 935 |
|
| | | | | | | | | | | |
| | | Balance at Jan 1, 2016 |
| | Recognized in income |
| | Recognized in equity |
| | Translation differences |
| | Balance at Dec 31, 2016 |
|
| Provisions | | 169 |
| | (121 | ) | | — |
| | (17 | ) | | 31 |
|
| Employee benefits | | 23 |
| | 15 |
| | — |
| | (1 | ) | | 37 |
|
| Unused tax losses & tax credits | | 743 |
| | 220 |
| | — |
| | (67 | ) | | 896 |
|
| Total | | 935 |
| | 114 |
| | — |
| | (85 | ) | | 964 |
|
| | | | | | | | | | | |
| | | Balance at Jan 1, 2017 |
| | Recognized in income |
| | Recognized in equity |
| | Translation differences |
| | Balance at Dec 31, 2017 |
|
| Provisions | | 31 |
| | (32 | ) | | — |
| | 2 |
| | 1 |
|
| Employee benefits | | 37 |
| | 2 |
| | — |
| | 5 |
| | 44 |
|
| Unused tax losses & tax credits | | 896 |
| | 1,473 |
| | — |
| | 73 |
| | 2,442 |
|
| Total | | 964 |
| | 1,443 |
| | — |
| | 80 |
| | 2,487 |
|
NOTES TO CONSOLIDATED FINANCIAL STATEMENTS 2020
Note 10 - Non-current receivables
| | | | | | | | | | | | | | |
| (in thousands of USD) | | December 31, 2020 | | December 31, 2019 |
| Shareholders loans to joint ventures | | 33,936 | | | 60,379 | |
| Derivatives | | 2 | | | 0 | |
| Other non-current receivables | | 14,434 | | | 2,094 | |
| Lease receivables | | 6,681 | | | 8,609 | |
| Investment | | 1 | | | 1 | |
| Total non-current receivables | | 55,054 | | | 71,083 | |
|
| | | | | | |
| (in thousands of USD) | | December 31, 2017 | | December 31, 2016 |
| Shareholders loans to joint ventures | | 159,733 |
| | 183,348 |
|
| Other non-current receivables | | 618 |
| | 565 |
|
| Investment | | 1 |
| | 1 |
|
| Total non-current receivables | | 160,352 |
| | 183,914 |
|
TheFollowing the sale of the Suezmax Bastia in September 2020, the shareholders loansloan to joint ventures as of December 31, 2017 and December 31, 2016 did not bear interest.
Bastia Shipholding Ltd. was fully repaid. Please refer to Note 2526 for more information on the shareholders loans to joint ventures.
The increase in other non-current receivables is related to the issuance of a bank guarantee for the amount of $12.3 million through a cash deposit in the context of the enforcement proceedings lodged by Unicredit on January 15, 2021 (see Note 21).
The lease receivables relate to the subleases of office space to third parties regarding the leased offices of Euronav UK and Euronav MI II Inc. (formerly Gener8 Maritime Inc.).
The maturity date of the non-current receivables is as follows:
| | | | | | | | | | | | | | |
| (in thousands of USD) | | December 31, 2020 | | December 31, 2019 |
| Receivable: | | | | |
| Within two years | | 2,100 | | | 1,959 | |
| Between two and three years | | 2,305 | | | 2,076 | |
| Between three and four years | | 18,862 | | | 2,278 | |
| Between four and five years | | 2,764 | | | 38,754 | |
| More than five years | | 29,023 | | | 26,016 | |
| Total non-current receivables | | 55,054 | | | 71,083 | |
Because the shareholders loans are perpetual non-amortizing loans, these non-current receivables are presented as maturing after 5 years with the exception of the shareholders loans to Bari Shipholding Ltd. which will mature in 2024.
|
| | | | | | |
| (in thousands of USD) | | December 31, 2017 | | December 31, 2016 |
| Receivable: | | — |
| | — |
|
| Between one and two years | | — |
| | — |
|
| Between two and three years | | — |
| | — |
|
| Between three and four years | | — |
| | — |
|
| Between four and five years | | — |
| | — |
|
| More than five years | | 160,352 |
| | 183,914 |
|
| Total non-current receivables | | 160,352 |
| | 183,914 |
|
NOTES TO CONSOLIDATED FINANCIAL STATEMENTS 20172020
Note 11 - Bunker inventory
The Group has set up a Bunker Fuel Management Group to manage the fuel oil exposure in the future relating to the IMO 2020 requirements. IMO 2020 requires the vessels to operate with low sulfur fuel (LSFO) which was expected to be higher priced due to anticipated or potential shortage in the production of LSFO in the first months of 2020 compared to demand. The activity involves the purchase and storage of compliant fuel oil inventory on board of a Euronav vessel, the ULCC Oceania, so that there would be a safety inventory available for the use on our own fleet.
The bunker inventory purchased and stored on this Euronav vessel is accounted for at the lower of cost and net realizable value with cost being determined on a weighted average basis. The cost includes: the purchase price, initial fuel inspection costs, the transport and handling costs for loading the bunker on our vessel and the effective portion of the change in fair value of derivatives (see Note 14) designated as cashflow hedge of the underlying index between commitment and pricing.
In the course of 2020, the Company purchased an additional 179,927 metric ton (2019: 420,000 metric ton) of compliant fuel for an amount of $49.7 million (2019: $202.3 million) (all costs included). As of December 31, 2020 the carrying amount of the total bunker inventory amounted to $75.8 million (2019: $183.4 million) of which $57.7 million (2019: $164.0 million) was the carrying amount of the bunker inventory related to the purchase and storage of compliant fuel oil inventory on board of the Oceania.
The compliant fuel has already been partially transferred to our fleet and will continue to be transferred and used in the course of 2021. $22.7 million (2019: $0) has been recognized as bunker expense in the consolidated statement of profit or loss during 2020 which is included under voyage expenses and commissions (as discussed in Note 5). As of December 31, 2020 the carrying amount of the bunker inventory on board of our vessels amounted to $18.1 million (2019: $19.4 million). Bunkers delivered to vessels operating in the TI Pool, are sold to the TI Pool and bunkers on board of these pooled vessels are no longer shown as bunker inventory but as trade and other receivables.
In compliance with the accounting policy no write-down had to be considered at the course of 2020 as the net realizable value remained positive as the bunker fuel is being used in the end product because future TCE was estimated as high enough to recoup higher cost. As of December 31, 2020, the market price of compliant fuel oil exceeded our weighted average cost.
The inventory is pledged as security to the $100 million loan facility.
NOTES TO CONSOLIDATED FINANCIAL STATEMENTS 2020
Note 1112 - Trade and other receivables - current
| | | | | | | | | | | | | | |
| (in thousands of USD) | | December 31, 2020 | | December 31, 2019 |
| Receivable from contracts with customers | | 70,658 | | | 105,925 | |
| Receivable from contracts with customers - TI Pool | | 99,236 | | | 149,800 | |
| Accrued income | | 8,149 | | | 20,815 | |
| Accrued interest | | 441 | | | 678 | |
| Deferred charges | | 21,239 | | | 19,134 | |
| Deferred fulfillment costs | | 714 | | | 2,556 | |
| Other receivables | | 12,046 | | | 8,220 | |
| Lease receivables | | 1,981 | | | 1,802 | |
| Derivatives | | 15 | | | 57 | |
| Total trade and other receivables | | 214,479 | | | 308,987 | |
|
| | | | | | |
| (in thousands of USD) | | December 31, 2017 | | December 31, 2016 |
| Trade receivables | | 32,758 |
| | 38,695 |
|
| Accrued income | | 12,465 |
| | 10,966 |
|
| Accrued interest | | 52 |
| | 33 |
|
| Deferred charges | | 24,797 |
| | 21,149 |
|
| Other receivables | | 66,725 |
| | 95,499 |
|
| Total trade and other receivables | | 136,797 |
| | 166,342 |
|
The decrease in other receivables from contracts with customers mainly relates to a decrease in market freight rates at year-end.
The decrease in receivables from contracts with customers - TI Pool relates to income to be received by the Group from the Tankers International Pool. These amounts decreased in 20172020 mainly due to overall declininglower working capital per vessel in the Pool as a result of Tankers International drawing under their working capital credit lines and the decrease in market freight rates as from August 2020 onwards and for the remainder of 2020.
The decrease in accrued income is mainly related to lower market conditions.freight rates at year-end and the timing of the cut-off in the voyages in progress at year-end.
Fulfillment costs represent primarily bunker costs incurred between the date on which the contract of a spot voyage charter was concluded and the next load port. These expenses are deferred according to IFRS 15 Revenue from Contracts with Customers and are amortized on a systematic basis consistent with the pattern of transfer of service.
The increase in other receivables relate mainly to outstanding receivables of several commodity swaps or futures in connection with the low sulfur fuel oil strategy (see Note 14).
The lease receivables relate to the sublease of office space to third parties regarding the leased offices of Euronav UK and Euronav MI II Inc. (formerly Gener8 Maritime Inc).
For currency and credit risk, we refer to Note 18.19.
Note 1213 - Cash and cash equivalents
| | | | | | | | | | | | | | |
| (in thousands of USD) | | December 31, 2020 | | December 31, 2019 |
| Bank deposits | | 0 | | | 215,000 | |
| Cash at bank and in hand | | 161,478 | | | 81,954 | |
| TOTAL | | 161,478 | | | 296,954 | |
| | | | |
| | | | |
| | | | |
| | | | |
| | | | |
|
| | | | | | |
| (in thousands of USD) | | December 31, 2017 | | December 31, 2016 |
| Bank deposits | | 102,200 |
| | 104,500 |
|
| Cash at bank and in hand | | 41,448 |
| | 102,189 |
|
| TOTAL | | 143,648 |
| | 206,689 |
|
| Of which restricted cash | | 115 |
| | 146 |
|
| | | | | |
| Less: | | | | |
| Bank overdrafts used for cash management purposes | | — |
| | — |
|
| NET CASH AND CASH EQUIVALENTS | | 143,648 |
| | 206,689 |
|
The bank deposits as at December 31, 20172019 had an average maturity of 16 days (2016: 10 days).
8 days.
NOTES TO CONSOLIDATED FINANCIAL STATEMENTS 2017
2020
Note 1314 - Equity
| | | (in shares) | | December 31, 2017 | | December 31, 2016 | | December 31, 2015 | (in shares) | | December 31, 2020 | | December 31, 2019 | | December 31, 2018 |
| On issue at 1 January | | 159,208,949 |
| | 159,208,949 |
| | 131,050,666 |
| On issue at 1 January | | 220,024,713 | | | 220,024,713 | | | 159,208,949 | |
| Conversion perpetual convertible preferred equity | | — |
| | — |
| | 9,459,283 |
| |
| Capital increases | | — |
| | — |
| | 18,699,000 |
| |
| Issued in business combination | | Issued in business combination | | 0 | | | 0 | | | 60,815,764 | |
| | On issue at 31 December - fully paid | | 159,208,949 |
| | 159,208,949 |
| | 159,208,949 |
| On issue at 31 December - fully paid | | 220,024,713 | | | 220,024,713 | | | 220,024,713 | |
On January 20, 2015Upon the Group announcedcompletion of the commencement of its underwritten initial public offering (IPO) in the United States of 13,550,000merger transaction with Gener8 Maritime Inc. on June 12, 2018 60,815,764 new ordinary shares. On January 19, 2015 the closingshares were issued at a stock price of $9.10 each (see Note 25) increasing the Company's ordinarynumber of shares on Euronext Brussels was USD 12.94 perissued to 220,024,713 shares (see Note 15). This resulted in an increase of $66.1 million in share (based upon the Bloomberg Composite Rate of EUR 0.8604 per USD 1.00 in effect on that date). The Company received approval to list its ordinary shares on the New York Stock Exchange (the "NYSE") under the symbol "EURN". On January 28, 2015 the Group announced the closing of its IPO of 18,699,000 common sharescapital and $487.3 million share premium.
As at a public offering price of USD 12.25 per share for gross proceeds of USD 229,062,750. This included the exercise in full by the underwriters of their overallotment option. The transaction costs related to this public offering for a total amount of USD 19.4 million were recognized directly in retained earnings.
At December 31, 2017 and December 31, 20162020, the share capital is represented by 159,208,949220,024,713 shares. The shares have no parnominal value.
AtAs at December 31, 2017,2020, the authorized share capital not issued amounts to USD 150,000,000 (2016$83,898,616 (2019: $83,898,616 and 2015: USD 150,000,000)2018: $83,898,616) or the equivalent of 138,005,65277,189,888 shares (2016(2019: 77,189,888 and 2015: 138,005,6522018: 77,189,888 shares).
The holders of ordinary shares are entitled to receive dividends when declared and are entitled to one1 vote per share at the shareholders' meetings of the Group.
Conversion of perpetual convertible preferred equity
Following its IPO, the Group exercised its right to request the conversion of the remaining 30 outstanding perpetual convertible preferred equity securities ('PCPs') and issued such notice on January 30, 2015. The aggregate principal amount of USD 75,000,000 was converted to Euronav's share capital through a contribution in kind on February 6, 2015 against the issuance of 9,459,283 shares. These shares are listed on both Euronext Brussels and the NYSE.
Translation reserve
The translation reserve comprises all foreign exchange differences arising from the translation of the financial statements of foreign operations.
Hedging reserve
The Group, through two of its JV companies in connection to the $220.0 million facility raised in March 2018 (Note 16), entered on June 29, 2018 in several Interest Rate Swaps (IRSs) for a combined notional value of $208.8 million (Euronav’s share amounts to 50%). These IRSs are used to hedge the risk related to the fluctuation of the Libor rate and qualify as hedging instruments in a cash flow hedge relationship under IFRS 9. These instruments have been measured at their fair value; effective changes in fair value have been recognized in OCI and the ineffective portion has been recognized in profit or loss. These IRSs have a remaining duration between one and two years matching the repayment profile of that facility and mature on July 21, 2022 and September 22, 2022 for FSO Asia and FSO Africa respectively. The notional value of these instruments at December 31, 2020 amounted to $90.4 million. The fair value of these instruments at December 31, 2020 amounted to $(2.4) million (100%), of which $(5) thousand was reflected in OCI at the level of the JV companies in 2020 (Note 26).
The Group, through the acquisition of Gener8 Maritime Inc. on June 12, 2018, acquired several IRSs for a combined notional value of $668.0 million. These IRSs were used to hedge the risk related to the fluctuation of the Libor rate and qualify as hedging instruments in a cash flow hedge relationship under IFRS 9. These instruments have been measured at their fair value; effective changes in fair value have been recognized in OCI and the ineffective portion has been recognized in profit or loss. NaN IRSs have been settled in 2019 (see Note 6) and the 2 matured in September 2020.
The Group, through the long term charter parties with Valero for 2 Suezmaxes (Cap Quebec and Cap Pembroke), entered on March 28, 2018 and April 20, 2018, in 2 IRSs for a combined notional value of $86.8 million. These IRSs are used to hedge the risk related to the fluctuation of the Libor rate and qualify as hedging instruments in a cash flow hedge relationship under IFRS 9. These instruments have been measured at their fair value; effective changes in fair value have been recognized in OCI and the ineffective portion has been recognized in profit or loss. These IRSs have the same duration as the long term charter parties matching the repayment profile of the underlying $173.6 million facility and mature on March 28, 2025. The notional value of these instruments at December 31, 2020 amounted to $70.1 million. The fair value of these instruments at December 31, 2020 amounted to $(6.0) million (see Note 18) and $(2.6) million has been recognized in OCI in 2020.
NOTES TO CONSOLIDATED FINANCIAL STATEMENTS 2020
Note 14 - Equity (Continued)
The Group entered on December 7, 2018 into 2 forward cap contracts (CAPs) with a strike at 3.25% starting on October 1, 2020, to hedge against future increase of interest rates with a notional value of $200.0 million and qualify as hedging instruments in a cash flow hedge relationship under IFRS 9. These instruments have been measured at their fair value; effective changes in fair value have been recognized in OCI and the ineffective portion has been recognized in profit or loss. These CAPs have a maturity date at October 3, 2022. The notional value of these instruments at December 31, 2020 amounted to $200.0 million. The fair value of these instruments at December 31, 2020 amounted to $15 thousand (see Note 12) and $0.1 million has been recognized in OCI in 2020.
During 2019 and the beginning of 2020, the Group entered into several commodity swaps and futures in connection with its low sulfur fuel oil project for a combined notional value of $25.8 million and $133.6 million, respectively. These swaps are used to hedge a potential increase in the index underlying the price of low sulfur fuel between the purchase date and the delivery date of the product, i.e. when title to the low sulfur fuel is actually transferred. These instruments qualified as hedging instruments in a cash flow hedge relationship under IFRS9. These instruments were measured at their fair value; effective changes in fair value were recognized in OCI and the ineffective portion was recognized in profit or loss. All swaps were settled in 2020 upon delivery of the fuel.
The Group, through the long term charter parties with Valero for 2 Suezmaxes (Cap Corpus Christi and Cap Port Arthur), entered on October 26, 2020 in 2 IRSs for a combined notional value of $70.1 million with effective date in 2021. These IRSs are used to hedge the risk related to the fluctuation of the LIBOR rate and qualify as hedging instruments in a cash flow hedge relationship under IFRS 9. These instruments have been measured at their fair value; effective changes in fair value have been recognized in OCI and the ineffective portion has been recognized in profit or loss. These IRSs have the same duration as the long term charter parties matching the repayment profile of the underlying $173.6 million facility and mature on September 28, 2025. The notional value of these instruments at December 31, 2020 amounted to $70.1 million. The fair value of these instruments at December 31, 2020 amounted to $(0.3) million (see Note 18) and $(0.3) million has been recognized in OCI in 2020.
The Group entered in the second half of 2020 in 6 Interest Rate Swaps (IRSs) for a combined notional value of $237.2 million with effective date in 2021. These IRSs are used to hedge the risk related to the fluctuation of the LIBOR rate in connection with the new $713.0 million sustainability linked loan and qualify as hedging instruments in a cash flow hedge relationship under IFRS 9. These instruments have been measured at their fair value; effective changes in fair value have been recognized in OCI and the ineffective portion has been recognized in profit or loss. These IRSs mature on March 11, 2025. The notional value of these instruments at December 31, 2020 amounted to $237.2 million. The fair value of these instruments at December 31, 2020 amounted to $(0.1) million (see Note 18) and $(0.1) million has been recognized in OCI in 2020.
Treasury shares
As of December 31, 20172020 Euronav owned 1,042,41518,346,732 of its own shares, compared to 1,042,4154,946,216 of shares owned on December 31, 2016.2019. In the twelve months period ended December 31, 2017,2020, Euronav did not buybought back or dispose13,400,516 shares at an aggregate cost of any own shares.$118.5 million.
Dividends
During its meeting of May 5, 2020, the Supervisory Board of Euronav approved an interim dividend for the first quarter of 2020 of $0.81 per share. The interim dividend of $0.81 per share was payable as from June 26, 2020. The interim dividend to holders of Euronext shares was paid in EUR at the USD/EUR exchange rate of the record date.
On May 11, 2017,20, 2020, the Annual Shareholders' meeting approved a full year dividend for 2019 of USD 0.77$0.35 per share. Taking into account the interim dividend approved in August 20162019 in the amount of USD 0.55$0.06 per share, the final dividend of 2019, which was paid after the AGM on June 9, 2020 was USD 0.22$0.29 per share. The dividend to holders of Euronav shares trading on Euronext Brussels was paid in EUR at the USD/EUR exchange rate of the record date.
During its meeting of August 9, 2017,4, 2020, the Supervisory Board of Directors of Euronav approved an interim dividend for the first semester 2017second quarter of USD 0.062020 of $0.47 per share. The interim dividend of USD 0.06$0.47 per share was payable as from October 5, 2017.August 28, 2020. The interim dividend to holders of Euronext shares was paid in EUR at the USD/EUR exchange rate of the record date.
During its meeting of November 3, 2020, the Supervisory Board of Euronav approved an interim dividend for the third quarter of 2020 of $0.09 per share. The interim dividend of $0.09 per share was payable as from November 30, 2020. The interim dividend to holders of Euronext shares was paid in EUR at the USD/EUR exchange rate of the record date.
NOTES TO CONSOLIDATED FINANCIAL STATEMENTS 2020
Note 14 - Equity (Continued)
During its meeting of February 2, 2021, the Supervisory Board of Euronav approved an interim dividend for the fourth quarter of 2020 of $0.03 per share. The interim dividend of $0.03 per share was payable as from March 5, 2021. The interim dividend to holders of Euronext shares was paid in EUR at the USD/EUR exchange rate of the record date.
On March 20, 2018,26, 2021, the Supervisory Board of Directors decided to propose toproposed the Annual Shareholders' meeting to be held on May 9, 2018,20, 2021, to approve a full year dividend for 2020 of USD 0.12$1.40 per share. Taking into account the interim dividends paid based on the Group’s policy to return 80% of the net income to shareholders, no closing dividend approved in August in the amount of USD 0.06 per share, the expected dividend payable after the AGM shouldwill be USD 0.06 per share.paid.
The total amount of dividends paid in 20172020 was USD 44.1 million.$352.0 million ($26.0 million in 2019).
NOTES TO CONSOLIDATED FINANCIAL STATEMENTS 2017
Note 13 - Equity (Continued)
Share-based payment arrangements
On December 16, 2013, the Group established a share option program that entitles key management personnel to purchase existing shares in the Company. Under the program, holders of vested options are entitled to purchase shares at the market price of the shares at the grant date. Currently this program is limited to key management personnel. In March 2016, the holders exercised 166,667 options and a corresponding number of treasury shares were sold. The key terms and conditions did not change after December 31, 2013. The compensation expense related to this share option program was recognized in prior periods and therefore, this program did not have any impact on the consolidated statement of profit or loss for 2017.
Long term incentive plan 2015
The Group's Board of Directors (as of February 2020 Supervisory Board) implemented in 2015 a long term incentive plan ('LTIP') for key management personnel. Under the terms of this LTIP, the beneficiaries will obtain 40% of their respective LTIP in the form of Euronav stock options, with vesting over three years and 60% in the form of restricted stock units ('RSU's'), with cliff vesting on the third anniversary. In total 236,590 options and 65,433 RSU's were granted on February 12, 2015. Vested stock options may be exercised until 13 years after the grant date. The stock options have an exercise price of EUR 10.0475 and are equity-settled. All of the stock options and RSUs granted on February 12, 2015 remained outstanding as of December 31, 2017. The fair value of the stock options was measured using the Black Scholes formula. The fair value of the RSUs was measured with reference to the Euronav share price at the grant date. The total employee benefit expense recognized in the consolidated statement of profit or loss during 2017 with respect to the LTIP 2015 was USD 0.3 million.
Long term incentive plan 2016
The Group's Board of Directors (as of February 2020 Supervisory Board) implemented in 2016 an additional long term incentive plan for key management personnel. Under the terms of this LTIP, key management personnel is eligible to receive phantom stock unit grants. Each phantom stock unit grants the holder a conditional right to receive an amount of cash equal to the fair market value of one share of the company on the settlement date. The phantom stock units will mature one-third each year on the second, third and fourth anniversary of the award. In total a number of 54,616 phantom stocks were granted on February 2, 2016 and all remain outstanding as of December 31, 2017. The LTIP 2016 qualifies as a cash-settled share-based payment transaction. The Company recognizes a liability in respect of its obligations under the LTIP 2016, measured based on the Company's share price at the reporting date, and taking into account the extent to which the services have been rendered to date. The compensation expense recognized in the consolidated statement of profit or loss during 2017 was USD 0.4 million.2016.
Long term incentive plan 2017
The Group's Board of Directors (as of February 2020 Supervisory Board) implemented in 2017 an additional long term incentive plan for key management personnel. Under the terms of this LTIP, key management personnel are eligible to receive phantom stock unit grants. Each phantom stock unit grants the holder a conditional right to receive an amount of cash equal to the fair market value of one share of the company on the settlement date. The phantom stock units will mature one-third each year on the second, third and fourth anniversary of the award. In total a number of 66,449 phantom stock units were granted on February 9, 2017 and all remain outstanding as2017.
Long term incentive plan 2018
The Group's Board of December 31, 2017. TheDirectors (as of February 2020 Supervisory Board) implemented in 2018 an additional long term incentive plan for key management personnel. Under the terms of this LTIP, 2017 qualifies askey management personnel are eligible to receive phantom stock unit grants. Each phantom stock unit grants the holder a cash-settled share-based payment transaction. The Company recognizes a liability in respectconditional right to receive an amount of its obligations undercash equal to the LTIP 2017, measured basedfair market value of one share of the company on the Company’ssettlement date. The phantom stock units will mature one-third each year on the second, third and fourth anniversary of the award. In total a number of 154,432 phantom stock units were granted on February 16, 2018.
Transaction Based Incentive Plan 2019
The Group’s Board of Directors (as of February 2020 Supervisory Board) has implemented in 2019 a transaction-based incentive plan for key management personnel.
Under the terms of this TBIP, key management personnel is eligible to receive phantom stock unit grants. Each phantom stock unit grants the holder a conditional right to receive an amount of cash equal to the Fair Market Value ("FMV") of one share of the Company multiplied by the number of phantom stock units that have vested prior to the settlement date. The TBIP defines FMV as the volume weighted average price of the shares on the New York Stock Exchange over the thirty (30) Business Days preceding such date.
Long term incentive plan 2019
The Group’s Supervisory Board (as of February 2020 Supervisory Board) implemented in 2019 an additional long term incentive plan (‘LTIP’) for key management personnel. Under the terms of this LTIP, key management personnel will obtain 100% of their respective LTIP in the form of Euronav restricted stock units (‘RSU’s’). The RSU’s vest over three years in 3 equal annual installments at the reportingthree anniversary dates from the reference date (April 1, 2019) and taking into account the extent to which the services have been rendered to date. The compensation expense recognizedwill be settled in the consolidated statement of profit or loss during 2017 was USD 0.3 million.
shares. In total 152,346 RSU’s were granted on April 1, 2019.
NOTES TO CONSOLIDATED FINANCIAL STATEMENTS 20172020
Note 14 - Equity (Continued)
Long term incentive plan 2020
The Group’s Supervisory Board implemented in 2020 an additional long term incentive plan (‘LTIP’) for key management personnel. Under the terms of this LTIP, key management personnel will obtain 100% of their respective LTIP in the form of Euronav restricted stock units (‘RSU’s’). The RSU’s vest over three years in 3 equal annual installments at the three anniversary dates from the reference date (April 1, 2020) and will be settled in shares. In total 144,392 RSU’s were granted on April 1, 2020. As of December 31, 2020, 0 RSU's were vested. 0 compensation expense was recognized in the Consolidated Statement of Profit or Loss during 2020.
NOTES TO CONSOLIDATED FINANCIAL STATEMENTS 2020
Note 1415 - Earnings per share
Basic earnings per share
The calculation of basic earnings per share at December 31, 2017 was based on a result attributable to ordinary shares of USD 1,382,530 (December 31, 2016: USD 204,049,212 and December 31, 2015: USD 350,300,535) and a weighted average number of ordinary shares outstanding during the period ended December 31 2017 of 158,166,534 (December 31, 2016: 158,262,268 and December 31, 2015:155,872,171),each year, calculated as follows:
Result attributable to ordinary shares
| | | | | | | | | | | | | | | | | | | | |
| | 2020 | | 2019 | | 2018 |
| Result for the period (in USD) | | 473,237,286 | | | 112,230,267 | | | (110,069,928) | |
| Weighted average number of ordinary shares | | 210,193,707 | | | 216,029,171 | | | 191,994,398 | |
| Basic earnings per share (in USD) | | 2.25 | | | 0.52 | | | (0.57) | |
|
| | | | | | | | | |
| (in thousands of USD except share and per share information) | | 2017 | | 2016 | | 2015 |
| Result for the period | | 1,383 |
| | 204,049 |
| | 350,301 |
|
| Weighted average number of ordinary shares | | 158,166,534 |
| | 158,262,268 |
| | 155,872,171 |
|
| Basic earnings per share (in USD) | | 0.01 |
| | 1.29 |
| | 2.25 |
|
Weighted average number of ordinary shares
| | | | | | | | | | | | | | | | | | | | | | | | | | |
| (in shares) | | Shares issued | | Treasury shares | | Shares outstanding | | Weighted number of shares |
| On issue at January 1, 2018 | | 159,208,949 | | | 1,042,415 | | | 158,166,534 | | | 158,166,534 | |
| Issuance of shares | | 60,815,764 | | | 0 | | | 60,815,764 | | | 33,823,562 | |
| Purchases of treasury shares | | 0 | | | 545,486 | | | (545,486) | | | (13,917) | |
| Withdrawal of treasury shares | | 0 | | | 0 | | | 0 | | | 0 | |
| Sales of treasury shares | | 0 | | | (350,000) | | | 350,000 | | | 18,219 | |
| On issue at December 31, 2018 | | 220,024,713 | | | 1,237,901 | | | 218,786,812 | | | 191,994,398 | |
| | | | | | | | |
| On issue at January 1, 2019 | | 220,024,713 | | | 1,237,901 | | | 218,786,812 | | | 218,786,812 | |
| Issuance of shares | | 0 | | | 0 | | | 0 | | | 0 | |
| Purchases of treasury shares | | 0 | | | 3,708,315 | | | (3,708,315) | | | (2,757,641) | |
| Withdrawal of treasury shares | | 0 | | | 0 | | | 0 | | | 0 | |
| Sales of treasury shares | | 0 | | | 0 | | | 0 | | | 0 | |
| On issue at December 31, 2019 | | 220,024,713 | | | 4,946,216 | | | 215,078,497 | | | 216,029,171 | |
| | | | | | | | |
| On issue at January 1, 2020 | | 220,024,713 | | | 4,946,216 | | | 215,078,497 | | | 215,078,497 | |
| Issuance of shares | | 0 | | | 0 | | | 0 | | | 0 | |
| Purchases of treasury shares | | 0 | | | 13,400,516 | | | (13,400,516) | | | (4,884,790) | |
| Withdrawal of treasury shares | | 0 | | | 0 | | | 0 | | | 0 | |
| Sales of treasury shares | | 0 | | | 0 | | | 0 | | | 0 | |
| On issue at December 31, 2020 | | 220,024,713 | | | 18,346,732 | | | 201,677,981 | | | 210,193,707 | |
|
| | | | | | | | | | | | |
| (in shares) | | Shares issued | | Treasury shares | | Shares outstanding | | Weighted number of shares |
| On issue at January 1, 2015 | | 131,050,666 |
| | 1,750,000 |
| | 129,300,666 |
| | 129,300,666 |
|
| Issuance of shares | | 28,158,283 |
| | — |
| | 28,158,283 |
| | 25,842,099 |
|
| Purchases of treasury shares | | — |
| | — |
| | — |
| | — |
|
| Withdrawal of treasury shares | | — |
| | — |
| | — |
| | — |
|
| Sales of treasury shares | | — |
| | (1,283,333 | ) | | 1,283,333 |
| | 729,406 |
|
| On issue at December 31, 2015 | | 159,208,949 |
| | 466,667 |
| | 158,742,282 |
| | 155,872,171 |
|
| | | | | | | | | |
| On issue at January 1, 2016 | | 159,208,949 |
| | 466,667 |
| | 158,742,282 |
| | 158,742,282 |
|
| Issuance of shares | | — |
| | — |
| | — |
| | — |
|
| Purchases of treasury shares | | — |
| | 692,415 |
| | (692,415 | ) | | (575,005 | ) |
| Withdrawal of treasury shares | | — |
| | — |
| | — |
| | — |
|
| Sales of treasury shares | | — |
| | (116,667 | ) | | 116,667 |
| | 94,991 |
|
| On issue at December 31, 2016 | | 159,208,949 |
| | 1,042,415 |
| | 158,166,534 |
| | 158,262,268 |
|
| | | | | | �� | | | |
| On issue at January 1, 2017 | | 159,208,949 |
| | 1,042,415 |
| | 158,166,534 |
| | 158,166,534 |
|
| Issuance of shares | | — |
| | — |
| | — |
| | — |
|
| Purchases of treasury shares | | — |
| | — |
| | — |
| | — |
|
| Withdrawal of treasury shares | | — |
| | — |
| | — |
| | — |
|
| Sales of treasury shares | | — |
| | — |
| | — |
| | — |
|
| On issue at December 31, 2017 | | 159,208,949 |
| | 1,042,415 |
| | 158,166,534 |
| | 158,166,534 |
|
Diluted earnings per share
For the twelve months ended December 31, 2017,2020, the diluted earnings per share (in USD) amount to 0.01 (2016: 1.292.25 (2019: 0.52 and 2015: 2.22)2018: (0.57)). At December 31, 20172020, December 31, 2019 and December 31, 2016,2018, 236,590 options issued under the LTIP 2015 were excluded from the calculation of the diluted weighted average number of shares because their effect wouldthese 236,590 options were out-of-the money and have been considered as anti-dilutive. At December 31, 2020, the 12,696 vested RSU's under the LTIP 2019 have been considered as dilutive, as these are only subject to the passage of time and therefore no longer contingent.
NOTES TO CONSOLIDATED FINANCIAL STATEMENTS 20172020
Note 1415 - Earnings per share (Continued)
Weighted average number of ordinary shares (diluted)
The table below shows the potential weighted number of shares that could be created if all stock options and restricted stock units convertible notes and PCPs were to be converted into ordinary shares.
| | | | | | | | | | | | | | | | | | | | |
| (in shares) | | 2020 | | 2019 | | 2018 |
| Weighted average of ordinary shares outstanding (basic) | | 210,193,707 | | | 216,029,171 | | | 191,994,398 | |
| | | | | | |
| | | | | | |
| | | | | | |
| Effect of Share-based Payment arrangements | | 12,696 | | | 0 | | | 0 | |
| | | | | | |
| Weighted average number of ordinary shares (diluted) | | 210,206,403 | | | 216,029,171 | | | 191,994,398 | |
|
| | | | | | | | | |
| (in shares) | | 2017 | | 2016 | | 2015 |
| Weighted average of ordinary shares outstanding (basic) | | 158,166,534 |
| | 158,262,268 |
| | 155,872,171 |
|
| | | | | | | |
| Effect of potential conversion of convertible Notes | | — |
| | — |
| | 88,689 |
|
| Effect of potential conversion of PCPs | | — |
| | — |
| | 932,971 |
|
| Effect of Share-based Payment arrangements | | 130,523 |
| | 166,789 |
| | 635,731 |
|
| | | | | | | |
| Weighted average number of ordinary shares (diluted) | | 158,297,057 |
| | 158,429,057 |
| | 157,529,562 |
|
After the conversions of the convertible Notes and the PCPs in the course of 2015, thereThere are no more remaining outstanding instruments at December 31, 20172020, December 31, 2019 and December 31, 20162018 which can give rise to dilution, except for the share-based payment arrangements.Euronav stock options of LTIP 2015 and the RSU's of the LTIP 2019.
NOTES TO CONSOLIDATED FINANCIAL STATEMENTS 20172020
Note 1516 - Interest-bearing loans and borrowings
| | | | | | | | | | | | | | | | | | | | | | | | | | | | | | | | |
| (in thousands of USD) | | Bank loans | | Other notes | | Lease liabilities | | Other borrowings | | Total |
| More than 5 years | | 433,662 | | | 0 | | | 0 | | | 0 | | | 433,662 | |
| Between 1 and 5 years | | 987,803 | | | 148,166 | | | 0 | | | 0 | | | 1,135,969 | |
| More than 1 year | | 1,421,465 | | | 148,166 | | | 0 | | | 0 | | | 1,569,631 | |
| Less than 1 year | | 138,537 | | | 0 | | | 0 | | | 60,342 | | | 198,879 | |
| At January 1, 2019 | | 1,560,002 | | | 148,166 | | | 0 | | | 60,342 | | | 1,768,510 | |
| | | | | | | | | | |
| New loans | | 986,755 | | | 50,500 | | | 498 | | | 896,145 | | | 1,933,898 | |
| Adoption IFRS 16 | | 0 | | | 0 | | | 105,238 | | | 0 | | | 105,238 | |
| Scheduled repayments | | (92,651) | | | 0 | | | (30,214) | | | (708,135) | | | (831,000) | |
| Early repayments | | (1,225,747) | | | 0 | | | 0 | | | 0 | | | (1,225,747) | |
| | | | | | | | | | |
| Other changes | | (4,908) | | | (95) | | | 0 | | | 0 | | | (5,003) | |
| Translation differences | | 0 | | | 0 | | | 102 | | | (1,139) | | | (1,037) | |
| Balance at December 31, 2019 | | 1,223,451 | | | 198,571 | | | 75,624 | | | 247,213 | | | 1,744,859 | |
| | | | | | | | | | |
| More than 5 years | | 628,711 | | | 0 | | | 1,652 | | | 0 | | | 630,363 | |
| Between 1 and 5 years | | 545,233 | | | 198,571 | | | 41,509 | | | 107,978 | | | 893,291 | |
| More than 1 year | | 1,173,944 | | | 198,571 | | | 43,161 | | | 107,978 | | | 1,523,654 | |
| Less than 1 year | | 49,507 | | | 0 | | | 32,463 | | | 139,235 | | | 221,205 | |
| Balance at December 31, 2019 | | 1,223,451 | | | 198,571 | | | 75,624 | | | 247,213 | | | 1,744,859 | |
| | | | | | | | | | |
| | | Bank loans | | Other notes | | Lease liabilities | | Other borrowings | | Total |
| More than 5 years | | 628,711 | | | 0 | | | 1,652 | | | 0 | | | 630,363 | |
| Between 1 and 5 years | | 545,233 | | | 198,571 | | | 41,509 | | | 107,978 | | | 893,291 | |
| More than 1 year | | 1,173,944 | | | 198,571 | | | 43,161 | | | 107,978 | | | 1,523,654 | |
| Less than 1 year | | 49,507 | | | 0 | | | 32,463 | | | 139,235 | | | 221,205 | |
| At January 1, 2020 | | 1,223,451 | | | 198,571 | | | 75,624 | | | 247,213 | | | 1,744,859 | |
| | | | | | | | | | |
| New loans | | 630,000 | | | 0 | | | 25,703 | | | 263,827 | | | 919,530 | |
| | | | | | | | | | |
| Scheduled repayments | | (88,989) | | | 0 | | | (34,492) | | | (371,021) | | | (494,502) | |
NOTES TO CONSOLIDATED FINANCIAL STATEMENTS 2020
Note 16 - Interest-bearing loans and borrowings (Continued)
| | Early repayments | | Early repayments | | (905,000) | | | (1,000) | | | 0 | | | 0 | | | (906,000) | |
| | (in thousands of USD) | | Bank loans | | Convertible and other Notes | | Total | |
| More than 5 years | | 147,174 |
| | — |
| | 147,174 |
| |
| Between 1 and 5 years | | 805,252 |
| | — |
| | 805,252 |
| |
| More than 1 year | | 952,426 |
| | — |
| | 952,426 |
| |
| Less than 1 year | | 100,022 |
| | — |
| | 100,022 |
| |
| At January 1, 2016 | | 1,052,448 |
| | — |
| | 1,052,448 |
| |
| | | | | | | | |
| New loans | | 740,286 |
| | — |
| | 740,286 |
| |
| Scheduled repayments | | (60,015 | ) | | — |
| | (60,015 | ) | |
| Early repayments | | (714,000 | ) | | — |
| | (714,000 | ) | |
| Acquisitions through business combinations (Note 24) | | 61,065 |
| | — |
| | 61,065 |
| |
| Other changes | | 5,778 |
| | — |
| | 5,778 |
| Other changes | | (2,602) | | | 708 | | | 0 | | | 0 | | | (1,894) | |
| Balance at December 31, 2016 | | 1,085,562 |
| | — |
| | 1,085,562 |
| |
| Translation differences | | Translation differences | | 0 | | | 0 | | | 86 | | | 11,334 | | | 11,420 | |
| Balance at December 31, 2020 | | Balance at December 31, 2020 | | 856,860 | | | 198,279 | | | 66,921 | | | 151,353 | | | 1,273,413 | |
| | | | | | | | | | | | | |
| More than 5 years | | 330,491 |
| | — |
| | 330,491 |
| More than 5 years | | 631,044 | | | 0 | | | 0 | | | 0 | | | 631,044 | |
| Between 1 and 5 years | | 635,952 |
| | — |
| | 635,952 |
| Between 1 and 5 years | | 205,274 | | | 198,279 | | | 21,172 | | | 100,056 | | | 524,781 | |
| More than 1 year | | 966,443 |
| | — |
| | 966,443 |
| More than 1 year | | 836,318 | | | 198,279 | | | 21,172 | | | 100,056 | | | 1,155,825 | |
| Less than 1 year | | 119,119 |
| | — |
| | 119,119 |
| Less than 1 year | | 20,542 | | | 0 | | | 45,749 | | | 51,297 | | | 117,588 | |
| Balance at December 31, 2016 | | 1,085,562 |
| | — |
| | 1,085,562 |
| |
| | | | | | | | |
| | | Bank loans | | Convertible and other Notes | | Total | |
| More than 5 years | | 330,491 |
| | — |
| | 330,491 |
| |
| Between 1 and 5 years | | 635,952 |
| | — |
| | 635,952 |
| |
| More than 1 year | | 966,443 |
| | — |
| | 966,443 |
| |
| Less than 1 year | | 119,119 |
| | — |
| | 119,119 |
| |
| At January 1, 2017 | | 1,085,562 |
| | — |
| | 1,085,562 |
| |
| | | | | | | | |
| New loans | | 326,014 |
| | 150,000 |
| | 476,014 |
| |
| Scheduled repayments | | (43,743 | ) | | — |
| | (43,743 | ) | |
| Early repayments | | (667,250 | ) | | — |
| | (667,250 | ) | |
| Other changes | | 508 |
| | (2,381 | ) | | (1,873 | ) | |
| Balance at December 31, 2017 | | 701,091 |
| | 147,619 |
| | 848,710 |
| |
| | | | | | | | |
| More than 5 years | | 157,180 |
| | — |
| | 157,180 |
| |
| Between 1 and 5 years | | 496,550 |
| | 147,619 |
| | 644,169 |
| |
| More than 1 year | | 653,730 |
| | 147,619 |
| | 801,349 |
| |
| Less than 1 year | | 47,361 |
| | — |
| | 47,361 |
| |
| Balance at December 31, 2017 | | 701,091 |
| | 147,619 |
| | 848,710 |
| |
| Balance at December 31, 2020 | | Balance at December 31, 2020 | | 856,860 | | | 198,279 | | | 66,921 | | | 151,353 | | | 1,273,413 | |
The amounts shown under "New Loans" and "Early Repayments" include drawdowns and repayments under revolving credit facilities during the year.
NOTES TO CONSOLIDATED FINANCIAL STATEMENTS 2017
Note 15 - Interest-bearing loans and borrowings (Continued)
Bank Loans
On March 25, 2014, the Group entered into a USD 500.0 million senior secured credit facility. This facility bore interest at LIBOR plus a margin of 2.75% per annum and was repayable over a term of six years with maturity in 2020 and was secured by the fifteen (15) Very Large Crude Carriers (VLCC) that the Group purchased from Maersk Tankers Singapore Pte Ltd ('the Maersk Acquisition Vessels'). The proceeds of the facility were drawn and used to partially finance the purchase price of the Maersk Acquisition Vessels. This USD 500.0 million loan facility was repaid in full on December 21, 2016 using a portion of the borrowing under the USD 409.5 million senior secured amortizing revolving credit facility entered into on December 16, 2016.
On October 13, 2014, the Group entered into a USD 340.0$340.0 million senior secured credit facility with a syndicate of banks. Borrowings under this facility have beenwere used to partially finance the acquisition of the four4 (4) modern Japanese built VLCC vessels ('the VLCC Acquisition Vessels') from Maersk Tankers Singapore Pte Ltd and to repay USD 153.1$153.1 million of outstanding debt and retire the Group's USD 300.0$300.0 million Secured Loan Facility dated April 3, 2009. This facility is comprised of (i) a USD 148.0$148.0 million non-amortizing revolving credit facility and (ii) a USD 192.0$192.0 million term loan facility. This facility has a term of 7 years and bears interest at LIBOR plus a margin of 2.25% per annum. This credit facility is secured by eight7 of our wholly-owned vessels, the Fraternity, Felicity, Cap Felix, Cap Theodora and, upon their respective deliveries, the Hojo, Hakone, Hirado and Hakata.vessels. On October 22, 2014 a first drawdown under this facility was made to repay a former USD 300$300 million secured loan facility, followed by additional drawdowns on December 22, 2014 and December 23, 2014 for an amount of 60.3$60.3 million and 50.3$50.3 million following the delivery of the Hojo and Hakone respectively. On March 3, 2015 and April 13, 2015 additional drawdowns of 53.4$53.4 million and 50.4$50.4 million were made following the delivery of the Hirado and Hakata respectively. Following the sale of the Suezmax Felicity in January 2019, the total revolving credit facility was reduced by $13.6 million and an early repayment of $7.3 million. As of December 31, 2017 and December 31, 2016,2019, the outstanding balancesbalance on this facility were USD 111.7was $43.4 million. Following the signing of the new $713.0 million and USD 207.3 million, respectively.sustainability linked senior secured credit facility, the loan facility was repaid in full on September 29, 2020.
On August 19, 2015, the Group entered into a USD 750.0$750.0 million senior secured amortizing revolving credit facility with a syndicate of banks. The facility is available for the purpose of (i) refinancing 21 vessels; (ii) financing four4 newbuilding VLCCs vessels as well as (iii) Euronav's general corporate and working capital purposes. The credit facility will mature on 1 July 2022 and carries a rate of LIBOR plus a margin of 195 bps. As of December 31, 20172020 and December 31, 2016,2019, the outstanding balancesbalance under this facility were USD 330.0was $0.0 million and USD 612.1$130.0, million, respectively. This facility is currently secured by 9 of our wholly-owned vessels.
On November 9, 2015, the Group entered into a USD 60.0$60.0 million unsecured revolving credit facility.facility carrying a rate of LIBOR plus a margin of 2.25%. As of December 31, 20172020 and December 31, 2016,2019, there were nowas 0 outstanding balancesbalance under this facility. The credit facility matured on November 9, 2020.
On June 2, 2016, the Group entered into a share swap and claim transfer agreement (see Note 24) whereby as of that date, Fiorano Shipholding Ltd. and Larvotto Shipholding Ltd. were fully consolidated and all assets acquired and liabilities assumed were recognized. Their respective loans are related to, and are secured by, the vessels owned by Fiorano and Larvotto at the date of the aforementioned transaction. As of December 31, 2017 and December 31, 2016, the outstanding balances on these facilities were USD 48.7 million and 57.0 million, respectively.
On December 16, 2016, the Group entered into a USD 409.5$409.5 million senior secured amortizing revolving credit facility for the purpose of refinancing 11 vessels as well as Euronav's general corporate purposes. The credit facility was used to refinance the USD 500$500 million senior secured credit facility dated March 25, 2014 and will mature on January 31, 2023 carrying a rate of LIBOR plus a margin of 2.25%. Following the sale and lease back of the VLCC Nautica, Nectar and Noble in December 2019, the total revolving credit facility was reduced by $56.9 million. As of December 31, 20172020 and December 31, 2016,2019, the outstanding balancesbalance on this facility were USD 118was $65.0 million and 222.0$90.0 million, respectively. The credit facility is secured by the aforementioned 118 vessels.
NOTES TO CONSOLIDATED FINANCIAL STATEMENTS 2020
Note 16 - Interest-bearing loans and borrowings (Continued)
On January 30, 2017, the Group signed a loan agreement for a nominal amount of USD 110.0$110.0 million with the purpose of financing the Ardeche and the Aquitaine as mentioned in Note 8.. On April 25, 2017, following a successful syndication, the loan was replaced with a new Korean Export Credit facility for a nominal amount of USD 108.5$108.5 million with Korea Trade Insurance Corporation or “K-sure” as insurer. The new facility is comprised of (i) a USD 27.1$27.1 million commercial tranche, which bears interest at LIBOR plus a margin of 1.95% per annum and (ii) a USD 81.4$81.4 million tranche insured by K-sure which bears interest at LIBOR plus a margin of 1.50% per annum. The facility is repayable over a term of 12 years, in 24 installments at successive six month intervals, each in the amount of USD 3.6$3.6 million together with a balloon installment of USD 21.7$21.7 million payable with the 24th installment on January 12, 2029. The K-sure insurance premium and other related transaction costs for a total amount of USD 3.2$3.2 million are amortized over the lifetime of the instrument using the effective interest rate method. As of December 31, 20172020 and December 31, 2019, the outstanding balance on this facility was USD 104.9$83.2 million and $90.5 million, respectively in aggregate. This facility is secured by the VLCCs the Ardeche and the Aquitaine.
Aquitaine. The facility agreement also contains a provision that entitles the lenders to require us to prepay to the lenders, on January 12, 2024, with 180 days’ notice, their respective portion of any advances granted to us under the facility. The facility agreement also contains provisions that allow the remaining lenders to assume an outgoing lender’s respective portion(s) of the advances made to us or to allow us to suggest a replacement lender to assume the respective portion of such advances.
On March 22, 2018, the Group signed a senior secured credit facility for an amount of $173.6 million with Kexim, BNP and Credit Agricole Corporate and Investment bank acting also as Agent and Security Trustee. The purpose of the loan was to finance up to 70 per cent of the aggregate contract price of the 4 Ice Class Suezmax vessels that were delivered over the course of 2018. The new facility was comprised of (i) a $69.4 million commercial tranche, which bears interest at LIBOR plus a margin of 2.0% per annum and (ii) a $104.2 million ECA tranche which bears interest at LIBOR plus a margin of 2.0% per annum. The commercial tranche is repayable by 24 equal consecutive semi-annual installments, each in the amount of $0.6 million per vessel together with a balloon installment of $3.5 million payable with the 24th and last installment on August 24, 2030. The ECA tranche is repayable by 24 consecutive semi-annual installments, each in the amount of $1.1 million per vessel and last installment on August 24, 2030. Transaction costs for a total amount of $1.6 million are amortized over the lifetime of the instrument using the effective interest rate method. As of December 31, 2020 and December 31, 2019, the outstanding balance on this facility was $143.6 million and $156.9 million, respectively. Lenders of the facility have a put option on the 7th anniversary of the facility, for which a notice has to be served 13 months in advance requesting a prepayment of their remaining contribution. After receiving notice, the Group will have to either repay the relevant contribution on the 7th year anniversary or to transfer this contribution to another acceptable lender. The put option can only be exercised if the employment of the vessel at that time is not satisfactory to the lenders.
As a result of the business combination on June 12, 2018, Euronav assumed the $633.5 million senior secured loan facility from Gener8 Maritime Inc. This facility provided for term loans up to the aggregate approximate amount of $963.7 million, which is comprised of a tranche of term loans to be made available by a syndicate of commercial lenders up to the aggregate approximate amount of $282.0 million (the “Commercial Tranche”), a tranche of term loans to be fully guaranteed by the Export-Import Bank of Korea (“KEXIM”) up to the aggregate approximate amount of up to $139.7 million (the “KEXIM Guaranteed Tranche”), a tranche of term loans to be made available by KEXIM up to the aggregate approximate amount of $197.4 million (the “KEXIM Funded Tranche”) and a tranche of term loans insured by Korea Trade Insurance Corporation (“K-Sure”) up to the aggregate approximate amount of $344.6 million (the “K-Sure Tranche”). The Commercial Tranche with a final maturity on September 28, 2022, bears interest at LIBOR plus a margin of 2.75% per annum and is reduced in 10 remaining installments of consecutive three-month interval and a balloon repayment at maturity in 2022. The KEXIM Guaranteed Tranche, with a final maturity on February 28, 2029, bears interest at LIBOR plus a margin of 1.50% per annum and is reduced in 39 remaining installments of consecutive three-month interval. The KEXIM Funded Tranche, with a final maturity on February 28, 2029, bears interest at LIBOR plus a margin of 2.60% per annum and is reduced in 39 remaining installments of consecutive three-month interval. The K-Sure Tranche, with a final maturity on February 28, 2029, bears interest at LIBOR plus a margin of 1.70% per annum and is reduced in 39 remaining installments of consecutive three-month interval. This facility was secured by 13 of our wholly-owned vessels. As of December 31, 2019, the outstanding balance on this facility was $604.8 million in aggregate. On September 26, 2019, the Group repaid this facility in full ($561.6 million) using a portion of the borrowings under our new $700.0 million Senior Secured Credit Facility.
On September 7, 2018, the Group signed a senior secured credit facility for an amount of $200.0 million. The Group used the proceeds of this facility to refinance all remaining indebtedness under the $581.0 million senior secured loan facility, the $67.5 million secured loan facility (Larvotto), and the $76.0 million secured loan facility (Fiorano). This facility is secured by 9 of our wholly-owned vessels. This revolving credit facility is reduced in 12 installments of consecutive six-month interval and a final $55.0 million repayment is due at maturity in 2025. This facility bears interest at LIBOR plus a margin of 2.0% per annum plus applicable mandatory costs. As of December 31, 2020 and December 31, 2019, the outstanding balance on this facility was $55.0 million and $100.0 million, respectively.
NOTES TO CONSOLIDATED FINANCIAL STATEMENTS 20172020
Note 1516 - Interest-bearing loans and borrowings (Continued)
On June 27, 2019, the Group entered into a $100.0 million senior secured amortizing revolving credit facility with a syndicate of banks of which ABN Amro Bank also acting as Coordinator, Agent and Security Trustee. The facility, secured by the Oceania and the bunker inventory bought in anticipation of the new legislation starting in January 1, 2020, will mature on December 31, 2021 and carries a rate of LIBOR plus a margin of 2.10%. As of December 31, 2020 and December 31, 2019, the outstanding balance on this facility was $0.0 million and $70.0 million, respectively.
On August 28, 2019, the Group entered into a $700.0 million senior secured amortizing revolving credit facility with a syndicate of banks and Nordea Bank Norge SA acting as Agent and Security Trustee for the purpose of refinancing all remaining indebtedness under the $633.5 million senior secured loan facility. The credit facility will mature on January 31, 2026 carrying a rate of LIBOR plus margin of 1.95%. The facility is secured by 13 of our wholly-owned vessels. As of December 31, 2020 and December 31, 2019, the outstanding balance on this facility was $345.0 million and $560.0 million, respectively.
On September 11, 2020, the Group entered into a USD 713.0 million sustainability linked loan with specific targets to emission reduction. This facility is secured by 16 of our wholly-owned vessels, 9 VLCCs, 3 Suezmaxes and the 4 new VLCCs under construction at DSME. The credit facility will mature on March 31, 2026 and carries a rate of LIBOR plus a margin of 2.35%. The facility consist of (i) a revolver of 469.0 million to refinance the USD 340.0 million senior secured credit facility and part of the USD 750.0 million senior secured credit facility and (ii) a term loan of 244.0 million to finance the acquisition of 4 newbuilding VLCCs with delivery in Q1 2021. The revolver commitment includes terms with specific targets to reduce our GHG emissions with compliance being rewarded with a reduced interest coupon by 5 basis points. As of December 31, 2020, the outstanding balance on this facility was $185.0 million.
Undrawn borrowing facilities
At December 31, 2017,2020, Euronav and its fully-owned subsidiaries have undrawn credit line facilities amounting to USD 607.4$940.4 million committed for at least one year (2016: USD 355.8(2019: $753.1 million)., of which is $100.0 million will mature within 12 months.
NOTES TO CONSOLIDATED FINANCIAL STATEMENTS 2020
Note 16 - Interest-bearing loans and borrowings (Continued)
Terms and debt repayment schedule
The terms and conditions of outstanding loans were as follows:
| | | (in thousands of USD) | | December 31, 2017 | | December 31, 2016 | (in thousands of USD) | | December 31, 2020 | | December 31, 2019 |
| | | Curr | | Nominal interest rate | | Year of mat. | | Facility size | | Drawn | | Carrying value | | Facility size | | Drawn | | Carrying value | | Curr | | Nominal interest rate | | Year of mat. | | Facility size | | Drawn | | Carrying value | | Facility size | | Drawn | | Carrying value |
| Secured vessels loan 192M | | USD | | libor +2.25% | | 2021 | | 111,666 |
| | 111,666 |
| | 110,156 |
| | 143,571 |
| | 143,571 |
| | 141,501 |
| Secured vessels loan 192M | | USD | | libor + 2.25% | | 2021 | | 0 | | | 0 | | | 0 | | | 43,447 | | | 43,447 | | | 42,859 | |
| Secured vessels Revolving loan 148M* | | USD | | libor +2.25% | | 2021 | | 147,559 |
| | — |
| | — |
| | 147,559 |
| | 63,700 |
| | 63,700 |
| Secured vessels Revolving loan 148M* | | USD | | libor + 2.25% | | 2021 | | 0 | | | 0 | | | 0 | | | 133,962 | | | 0 | | | 0 | |
| Secured vessels Revolving loan 750M* | | USD | | libor +1.95% | | 2022 | | 485,017 |
| | 330,000 |
| | 325,519 |
| | 636,536 |
| | 612,050 |
| | 605,806 |
| Secured vessels Revolving loan 750M* | | USD | | libor + 1.95% | | 2022 | | 45,958 | | | 0 | | | (871) | | | 322,340 | | | 130,000 | | | 128,205 | |
| Secured vessels Revolving loan 409.5M* | | USD | | libor +2.25% | | 2023 | | 362,780 |
| | 118,000 |
| | 114,634 |
| | 409,500 |
| | 222,036 |
| | 217,600 |
| Secured vessels Revolving loan 409.5M* | | USD | | libor + 2.25% | | 2023 | | 175,605 | | | 65,000 | | | 63,997 | | | 212,459 | | | 90,000 | | | 88,328 | |
| Secured vessels loan 76M | | USD | | libor +1.95% | | 2020 | | 23,563 |
| | 23,563 |
| | 23,563 |
| | 27,813 |
| | 27,813 |
| | 27,813 |
| |
| Secured vessels loan 67.5M | | USD | | libor +1.5% | | 2020 | | 25,173 |
| | 25,173 |
| | 25,173 |
| | 29,143 |
| | 29,143 |
| | 29,143 |
| |
| | Secured vessels loan 27.1M | | USD | | libor +1.95% | | 2029 | | 26,911 |
| | 26,911 |
| | 24,876 |
| | — |
| | — |
| | — |
| Secured vessels loan 27.1M | | USD | | libor + 1.95% | | 2029 | | 25,554 | | | 25,554 | | | 25,554 | | | 26,007 | | | 26,007 | | | 25,389 | |
| Secured vessels loan 81.4M | | USD | | libor +1.50% | | 2029 | | 78,020 |
| | 78,020 |
| | 77,171 |
| | — |
| | — |
| | — |
| Secured vessels loan 81.4M | | USD | | libor + 1.50% | | 2029 | | 57,667 | | | 57,667 | | | 55,918 | | | 64,452 | | | 64,452 | | | 62,970 | |
| Secured vessels loan 69.4M | | Secured vessels loan 69.4M | | USD | | libor + 2.0% | | 2030 | | 59,007 | | | 59,007 | | | 59,007 | | | 63,635 | | | 63,635 | | | 63,635 | |
| Secured vessels loan 104.2M | | Secured vessels loan 104.2M | | USD | | libor + 2.0% | | 2030 | | 84,606 | | | 84,606 | | | 83,562 | | | 93,283 | | | 93,283 | | | 92,035 | |
| | Secured vessels Revolving loan 200.0M* | | Secured vessels Revolving loan 200.0M* | | USD | | libor + 2.0% | | 2025 | | 148,688 | | | 55,000 | | | 53,876 | | | 174,344 | | | 100,000 | | | 98,445 | |
| Secured vessels Revolving loan 100.0M* | | Secured vessels Revolving loan 100.0M* | | USD | | libor + 2.10% | | 2021 | | 100,000 | | | 0 | | | (479) | | | 100,000 | | | 70,000 | | | 69,043 | |
| Secured vessels Revolving loan 700.0M* | | Secured vessels Revolving loan 700.0M* | | USD | | libor + 1.95% | | 2026 | | 651,160 | | | 345,000 | | | 338,765 | | | 700,000 | | | 560,000 | | | 552,542 | |
| Secured vessels Revolving loan 713.0M* | | Secured vessels Revolving loan 713.0M* | | USD | | libor + 2.35% | | 2026 | | 469,000 | | | 185,000 | | | 177,529 | | | 0 | | | 0 | | | 0 | |
| Unsecured bank facility 60M | | USD | | libor +2.25% | | 2020 | | 60,000 |
| | — |
| | — |
| | 60,000 |
| | — |
| | — |
| Unsecured bank facility 60M | | USD | | libor + 2.25% | | 2020 | | 0 | | | 0 | | | 0 | | | 60,000 | | | 0 | | | 0 | |
| Total interest-bearing bank loans | Total interest-bearing bank loans | | 1,320,688 |
| | 713,332 |
| | 701,091 |
| | 1,454,121 |
| | 1,098,312 |
| | 1,085,562 |
| Total interest-bearing bank loans | | 1,817,246 | | | 876,834 | | | 856,860 | | | 1,993,928 | | | 1,240,824 | | | 1,223,451 | |
The facility size of the vessel loans can be reduced if the value of the collateralized vessels falls under a certain percentage of the outstanding amount under that loan. For further information, we refer to Note 19.
* The total amount available under the revolving loan Facilities depends on the total value of the fleet of tankers securing the facility.
Other notes
|
| | | | | | | | | | | | | | | | | | | | | | | | |
| | | | | | | | | | | | | | | | | | | |
| (in thousands of USD) | | | |
| |
| | December 31, 2017 | | December 31, 2016 |
| | Curr | | Nominal interest rate | | Year of mat. | | Facility size | | Drawn | | Carrying value | | Facility size | | Drawn | | Carrying value |
| Unsecured notes | | USD | | 7.50% | | 2022 | | 150,000 |
| | 150,000 |
| | 147,619 |
| | — |
| | — |
| | — |
|
| Total other notes | |
| | 150,000 |
| | 150,000 |
| | 147,619 |
| | — |
| | — |
| | — |
|
| | | | | | | | | | | | | | | | | | | |
NOTES TO CONSOLIDATED FINANCIAL STATEMENTS 20172020
Note 1516 - Interest-bearing loans and borrowings (Continued)
Other notes
| | | | | | | | | | | | | | | | | | | | | | | | | | | | | | | | | | | | | | | | | | | | | | | | | | | | | | | | |
| | | | | | | | | | | | | | | | | | |
| (in thousands of USD) | | | | | | | | December 31, 2020 | | December 31, 2019 |
| | Curr | | Nominal interest rate | | Year of mat. | | Facility size | | Drawn | | Carrying value | | Facility size | | Drawn | | Carrying value |
| Unsecured notes | | USD | | 7.50% | | 2022 | | 200,000 | | | 199,000 | | | 198,279 | | | 200,000 | | | 200,000 | | | 198,571 | |
| Total other notes | | | | 200,000 | | | 199,000 | | | 198,279 | | | 200,000 | | | 200,000 | | | 198,571 | |
| | | | | | | | | | | | | | | | | | |
On May 31, 2017,June 14, 2019, the Group successfully completed a newtap issue of $50 million under its existing senior unsecured bond issue of USD 150.0 million with a fixedbonds. The bonds have the same maturity date and carry the same coupon of 7.50%. The tap issue was priced at 101% of par value. Arctic Securities AS, DNB Markets and maturityNordea acted as joint lead managers in May 2022. The net proceeds fromconnection with the bond issue are being used for general corporate purposes.placement of the tap issue. The related transaction costs for a total of USD 2.7 million$675,000 are amortized over the lifetime of the instrument using the effective interest rate method.Since October 23, 2017, thesemethod as well as the above par issuance of $500,000. In the course of the first quarter of 2020, the company bought back 10 notes of its USD 200 million fixed rate senior unsecured bonds are listed onnotes, due 2022. The face value of each cash bond is $100,000 and the Oslo stock exchange.company paid an average of $85,000.
Other borrowings
On June 6, 2017, the Group signed an agreement with BNP to act as dealer for a Treasury Notes Program with a maximum outstanding amount of 50 million Euro. On October 1, 2018, KBC has been appointed as an additional dealer in the agreement and the maximum amount has been increased from 50 million Euro to 150 million Euro. As of December 31, 2020, the outstanding amount was $38.7 million or 31.5 million Euro (December 31, 2019: $ 122.8 million or 109.3 million Euro).The Treasury Notes are issued on an as needed basis with different durations not exceeding 1 year, and initial pricing is set to 60 bps over Euribor. The company enters into FX forward contracts to manage the transactioncurrency risks related to these instruments issued in Euro compared to the USD Group functional currency. The FX contracts have athe same nominal amount and duration as the issued Treasury Notes and they are measured at fair value with changes in fair value recognized in the consolidated statement of profit or loss. On December 31, 2017,2020, the fair value of these forward contracts amounted to USD 0.5$1.2 million (December 31, 2019: $1.3 million).
On December 30, 2019, the Company entered into a sale and leaseback agreement for 3 VLCCs. The 3 VLCCs are the Nautica (2008 – 307,284), Nectar (2008 – 307,284) and Noble (2008 – 307,284). The vessels were sold and were leased back under a 54-months bareboat contract at an average rate of $20,681 per day per vessel. In accordance with IFRS, this transaction was not accounted for as a sale but Euronav as seller-lessee will continue to recognize the transferred assets, and recognized a financial liability equal to the net transfer proceeds of $124.4 million. As of December 31, 2020, the outstanding amount was $112.7 million. At the end of the bareboat contract, the vessels will be redelivered to their new owners. Euronav may, at any time on and after the 1st anniversary, notify the owners by serving an irrevocable written notice at least three months prior to the proposed purchase option date of the charterers' intention to terminate this charter on the purchase option date and purchase the vessel from the owners for the applicable purchase option price.
The future lease payments for these leaseback agreements are as follows:
| | | | | | | | | | | | | | |
| | | | |
| (in thousands of USD) | | December 31, 2020 | | December 31, 2019 |
| | | | |
| Less than one year | | 22,667 | | | 22,853 | |
| Between one and five years | | 56,545 | | | 79,211 | |
| | | | |
| Total future lease payables | | 79,211 | | | 102,064 | |
| | | | |
NOTES TO CONSOLIDATED FINANCIAL STATEMENTS 2020
Note 16 - Interest-bearing loans and borrowings (Continued)
Transaction and other financial costs
The heading 'Other changes' in the first table of this footnote reflects the recognition of directly attributable transaction costs as a deduction from the fair value of the corresponding liability, and the subsequent amortization of such costs. In 2017,2020, the Group recognized USD 4.0$6.2 million of amortization of financing costs. The Group recognized USD 3.2$8.1 million of directly attributable transaction costs as a deduction from the fair value of the USD 110.0$713.0 million senior secured amortizing loan facility concluded on January 30, 2017 and USD 2.7 million of directly attributable transaction costs as a deduction from the fair value of the USD 150.0 million senior unsecured bond concluded on May 31, 2017.entered into September 11, 2020.
Interest expense on financial liabilities measured at amortized cost decreased during the year ended December 31, 2017,2020, compared to 2016 (2017: USD -38.42019 (2020: $(-62.4) million, 2016: USD -39.02019: $(-84.4) million). This decrease was primarily attributable to the fact that the increase in floating interest rates in 2017 was more than offset by a decrease in the average outstanding debt during the year endedand was partially offset by an increase in the interest expenses on the sale and leaseback agreement for three VLCCs entered into December 31, 2017, compared to 2016.30, 2019. Other financial charges increased in 20172020 compared to 2016 (2017: USD -5.82019 (2020: $(-9.9) million, 2016: USD -4.62019: $(-7.5) million) which was primarily attributable to commitment feefees paid for available credit lines,lines.
Interest on lease liabilities (2020: $(-3.3) million, 2019: $ (-4.8) million) were recognized due to the adoption of which the total availability increased in 2017.IFRS 16 on January 1, 2019 (see Note 1.19).
NOTES TO CONSOLIDATED FINANCIAL STATEMENTS 20172020
Note 1516 - Interest-bearing loans and borrowings (Continued)
Reconciliation of movements of liabilities to cash flows arising from financing activities
| | | | | | | | | | | | | | | | | | | | | | | | | | | | | | |
| Liabilities | | | Equity | |
| Loans and borrowings | Other Notes | Other borrowings | | Lease liabilities | Share capital / premium | Reserves | Treasury shares | Retained earnings | Total |
| Restated balance at January 1, 2019 | 1,560,002 | | 148,166 | | 60,342 | | | 105,736 | | 1,941,697 | | (2,287) | | (14,651) | | 335,764 | | 4,134,769 | |
| | | | | | | | | | |
| Changes from financing cash flows | | | | | | | | | | |
| Proceeds from loans and borrowings (Note 16) | 986,755 | | 50,500 | | 0 | | | 0 | | 0 | | 0 | | 0 | | 0 | | 1,037,255 | |
| Proceeds from issue of other borrowings (Note 16) | 0 | | 0 | | 62,446 | | | 0 | | 0 | | 0 | | 0 | | 0 | | 62,446 | |
| Purchase treasury shares (Note 14) | 0 | | 0 | | 0 | | | 0 | | 0 | | 0 | | (30,965) | | 0 | | (30,965) | |
| Proceeds from sale and leaseback agreement (Note 16) | 0 | | 0 | | 124,425 | | | 0 | | 0 | | 0 | | 0 | | 0 | | 124,425 | |
| | | | | | | | | | |
| Transaction costs related to loans and borrowings (Note 16) | (9,046) | | (675) | | 0 | | | 0 | | 0 | | 0 | | 0 | | 0 | | (9,721) | |
| Repayment of borrowings (Note 16) | (1,318,398) | | 0 | | 0 | | | 0 | | 0 | | 0 | | 0 | | 0 | | (1,318,398) | |
| Repayment of lease liabilities (Note 16) | 0 | | 0 | | 0 | | | (30,214) | | 0 | | 0 | | 0 | | 0 | | (30,214) | |
| Dividend paid | 0 | | 0 | | 0 | | | 0 | | 0 | | 0 | | 0 | | (26,015) | | (26,015) | |
| Total changes from financing cash flows | (340,689) | | 49,825 | | 186,871 | | | (30,214) | | 0 | | 0 | | (30,965) | | (26,015) | | (191,187) | |
| | | | | | | | | | |
| Other changes | | | | | | | | | | |
| Liability-related | | | | | | | | | | |
| | | | | | | | | | |
| | | | | | | | | | |
| Amortization of transaction costs (Note 16) | 4,138 | | 674 | | 0 | | | 0 | | — | | — | | — | | — | | 4,812 | |
| Amortization of above par issuance (Note 16) | 0 | | (94) | | 0 | | | 0 | | — | | — | | — | | — | | (94) | |
| Translation differences (Note 16) | 0 | | 0 | | 0 | | | 102 | | — | | — | | — | | — | | 102 | |
| | | | | | | | | | |
| | | | | | | | | | |
| Total liability-related other changes | 4,138 | | 580 | | 0 | | | 102 | | — | | — | | — | | — | | 4,820 | |
| | | | | | | | | | |
| Total equity-related other changes (Note 14) | — | | — | | — | | | — | | 0 | | (1,997) | | 0 | | 110,309 | | 108,312 | |
| | | | | | | | | | |
| Balance at December 31, 2019 | 1,223,451 | | 198,571 | | 247,213 | | | 75,624 | | 1,941,697 | | (4,284) | | (45,616) | | 420,058 | | 4,056,714 | |
NOTES TO CONSOLIDATED FINANCIAL STATEMENTS 2020
Note 16 - Interest-bearing loans and borrowings (Continued)
|
| | | | | | | | | | | | | | | | | |
| | | Liabilities | Equity | |
| | Note | Loans and borrowings |
| Other Notes |
| Other borrowings |
| Share capital / premium |
| Reserves |
| Treasury shares |
| Retained earnings |
| Total |
|
| Balance at January 1, 2017 | | 1,085,562 |
| — |
| — |
| 1,388,273 |
| 120 |
| (16,102 | ) | 515,665 |
| 2,973,518 |
|
| | | | | | | | | | |
| Changes from financing cash flows | | | | | | | | | |
| Proceeds from issue of other notes | 15 | — |
| 150,000 |
| — |
| — |
| — |
| — |
| — |
| 150,000 |
|
| Proceeds from loans and borrowings | 15 | 326,014 |
| — |
| — |
| — |
| — |
| — |
| — |
| 326,014 |
|
| Proceeds from issue of other borrowings | 15 | — |
| — |
| 50,010 |
| — |
| — |
| — |
| — |
| 50,010 |
|
| Proceeds from settlement of derivatives | - | — |
| — |
| — |
| — |
| — |
| — |
| — |
| — |
|
| Transaction costs related to loans and borrowings | 15 | (3,174 | ) | (2,700 | ) | — |
| — |
| — |
| — |
| — |
| (5,874 | ) |
| Repayment of borrowings | 15 | (710,993 | ) | — |
| — |
| — |
| — |
| — |
| — |
| (710,993 | ) |
| Dividend paid | - | — |
| — |
| — |
| — |
| — |
| — |
| (44,133 | ) | (44,133 | ) |
| Total changes from financing cash flows | | (388,153 | ) | 147,300 |
| 50,010 |
| — |
| — |
| — |
| (44,133 | ) | (234,976 | ) |
| | | | | | | | | | |
| Other changes | | | | | | | | | |
| Liability-related | | | | | | | | | |
| Capitalized borrowing costs | 15 | 3,682 |
| 319 |
| — |
| — |
| — |
| — |
| — |
| 4,001 |
|
| Total liability-related other changes | | 3,682 |
| 319 |
| — |
| — |
| — |
| — |
| — |
| 4,001 |
|
| Total equity-related other changes | | — |
| — |
| — |
| — |
| 448 |
| — |
| 2,090 |
| 2,538 |
|
| | | | | | | | | | |
| Balance at December 31, 2017 | | 701,091 |
| 147,619 |
| 50,010 |
| 1,388,273 |
| 568 |
| (16,102 | ) | 473,622 |
| 2,745,081 |
|
| | | | | | | | | | | | | | | | | | | | | | | | | | | | | | |
| Liabilities | | | Equity | |
| Loans and borrowings | Other Notes | Other borrowings | | Lease liabilities | Share capital / premium | Reserves | Treasury shares | Retained earnings | Total |
| Restated balance at January 1, 2019 | 1,223,451 | | 198,571 | | 247,213 | | | 75,624 | | 1,941,697 | | (4,284) | | (45,616) | | 420,058 | | 4,056,714 | |
| | | | | | | | | | |
| Changes from financing cash flows | | | | | | | | | | |
| Proceeds from loans and borrowings (Note 16) | 630,000 | | 0 | | 0 | | | 0 | | 0 | | 0 | | 0 | | 0 | | 630,000 | |
| Proceeds from issue of other borrowings (Note 16) | 0 | | 0 | | 263,827 | | | 0 | | 0 | | 0 | | 0 | | 0 | | 263,827 | |
| Proceeds from sale of treasury shares (Note 14) | 0 | | 0 | | 0 | | | 0 | | 0 | | 0 | | (118,488) | | 0 | | (118,488) | |
| Purchase treasury shares (Note 14) | 0 | | 0 | | 0 | | | 0 | | 0 | | 0 | | 0 | | 0 | | 0 | |
| Repayment of sale and leaseback liability (Note 16) | 0 | | 0 | | (22,853) | | | 0 | | 0 | | 0 | | 0 | | 0 | | (22,853) | |
| Transaction costs related to loans and borrowings (Note 16) | (8,083) | | 0 | | 0 | | | 0 | | 0 | | 0 | | 0 | | 0 | | (8,083) | |
| Repayment of borrowings (Note 16) | (993,989) | | (1,000) | | — | | | 0 | | 0 | | 0 | | 0 | | 0 | | (994,989) | |
| Repayment of commercial paper (Note 16) | 0 | | 0 | | (359,295) | | | 0 | | 0 | | 0 | | 0 | | 0 | | (359,295) | |
| Repayment of lease liabilities (Note 16) | 0 | | 0 | | 0 | | | (37,779) | | 0 | | 0 | | 0 | | 0 | | (37,779) | |
| Dividend paid | 0 | | 0 | | 0 | | | 0 | | 0 | | 0 | | 0 | | (352,041) | | (352,041) | |
| Total changes from financing cash flows | (372,072) | | (1,000) | | (118,321) | | | (37,779) | | 0 | | 0 | | (118,488) | | (352,041) | | (999,701) | |
| | | | | | | | | | |
| Other changes | | | | | | | | | | |
| Liability-related | | | | | | | | | | |
| | | | | | | | | | |
| | | | | | | | | | |
| Amortization of transaction costs (Note 16) | 5,481 | | 787 | | 0 | | | 0 | | — | | — | | — | | — | | 6,268 | |
| Amortization of above par issuance (Note 16) | 0 | | (175) | | 0 | | | 0 | | — | | — | | — | | — | | (175) | |
| Amortization of below par issuance (Note 16) | 0 | | 96 | | 0 | | | 0 | | — | | — | | — | | — | | 96 | |
| New leases (Note 16) | 0 | | 0 | | 0 | | | 25,703 | | — | | — | | — | | — | | 25,703 | |
| Interest expense (Note 6) | 0 | | 0 | | 11,127 | | | 3,287 | | — | | — | | — | | — | | 14,414 | |
| Translation differences (Note 16) | 0 | | 0 | | 11,334 | | | 86 | | — | | — | | — | | — | | 11,420 | |
| Total liability-related other changes | 5,481 | | 708 | | 22,461 | | | 29,076 | | — | | — | | — | | — | | 57,726 | |
| | | | | | | | | | |
| Total equity-related other changes (Note 14) | — | | — | | — | | | — | | 0 | | (2,237) | | 0 | | 472,697 | | 470,460 | |
| | | | | | | | | | |
| Balance at December 31, 2020 | 856,860 | | 198,279 | | 151,352.62 | | | 66,921.07 | | 1,941,697 | | (6,521) | | (164,104) | | 540,714 | | 3,585,199 | |
NOTES TO CONSOLIDATED FINANCIAL STATEMENTS 2020
Note 1617 - Employee benefits
The amounts recognized in the balance sheet are as follows: | | | (in thousands of USD) | | December 31, 2017 | | December 31, 2016 | | December 31, 2015 | (in thousands of USD) | | December 31, 2020 | | December 31, 2019 | | December 31, 2018 |
| NET LIABILITY AT BEGINNING OF PERIOD | | (2,846 | ) | | (2,038 | ) | | (2,108 | ) | NET LIABILITY AT BEGINNING OF PERIOD | | (8,094) | | | (4,336) | | | (3,984) | |
| Recognized in profit or loss | | (827 | ) | | (261 | ) | | (108 | ) | Recognized in profit or loss | | 653 | | | (2,589) | | | (616) | |
| Recognized in other comprehensive income | | 64 |
| | (646 | ) | | (44 | ) | Recognized in other comprehensive income | | (97) | | | (1,223) | | | 120 | |
| Foreign currency translation differences | | (375 | ) | | 99 |
| | 222 |
| Foreign currency translation differences | | (449) | | | 54 | | | 144 | |
| NET LIABILITY AT END OF PERIOD | | (3,984 | ) | | (2,846 | ) | | (2,038 | ) | NET LIABILITY AT END OF PERIOD | | (7,987) | | | (8,094) | | | (4,336) | |
| | | | | | | | | | | | | |
| Present value of funded obligation | | (3,537 | ) | | (2,846 | ) | | (852 | ) | Present value of funded obligation | | (5,074) | | | (4,298) | | | (3,538) | |
| Fair value of plan assets | | 2,760 |
| | 2,117 |
| | 539 |
| Fair value of plan assets | | 3,940 | | | 3,241 | | | 2,970 | |
| | | (777 | ) | | (729 | ) | | (313 | ) | | | (1,134) | | | (1,057) | | | (568) | |
| Present value of unfunded obligations | | (3,207 | ) | | (2,117 | ) | | (1,725 | ) | Present value of unfunded obligations | | (6,853) | | | (7,037) | | | (3,768) | |
| NET LIABILITY | | (3,984 | ) | | (2,846 | ) | | (2,038 | ) | NET LIABILITY | | (7,987) | | | (8,094) | | | (4,336) | |
| | | | | | | | | | | | | |
| Amounts in the balance sheet: | | | | | | | Amounts in the balance sheet: | |
| Liabilities | | (3,984 | ) | | (2,846 | ) | | (2,038 | ) | Liabilities | | (7,987) | | | (8,094) | | | (4,336) | |
| Assets | | — |
| | — |
| | — |
| Assets | | 0 | | | 0 | | | 0 | |
| NET LIABILITY | | (3,984 | ) | | (2,846 | ) | | (2,038 | ) | NET LIABILITY | | (7,987) | | | (8,094) | | | (4,336) | |
Liability for defined benefit obligations
The Group makes contributions to three3 defined benefit plans that provide pension benefits for employees upon retirement.
EURONAV NV
NOTES TO CONSOLIDATED FINANCIAL STATEMENTS 2017
OneNaN plan - the Belgian plan - is fully insured through an insurance company. The second and third - French and Greek plans - are uninsured and unfunded. The unfunded obligations include provisions in respect of LTIP 2016, LTIP 2017, LTIP 2018, TBIP 2019 and LTIP 20172019 (see Note 13)23).
The Group expects to contribute the following amount to its defined benefit pension plans in 2018: USD 255,814.2021: $50,798.
The valuation used for the defined contribution plans is the Projected Unit Credit Cost as prescribed by IAS 19 R.
The Group expects to contribute the following amount to its defined contribution pension plans in 2021: $368,301.
NOTES TO CONSOLIDATED FINANCIAL STATEMENTS 2020
Note 1718 - Trade and other payables
| | | | | | | | | | | | | | |
| (in thousands of USD) | | December 31, 2020 | | December 31, 2019 |
| Advances received on contracts in progress, between 1 and 5 years | | 508 | | | 414 | |
| Derivatives | | 6,385 | | | 3,395 | |
| Total non-current other payables | | 6,893 | | | 3,809 | |
| Trade payables | | 27,226 | | | 22,737 | |
| Accrued expenses | | 35,321 | | | 45,997 | |
| Accrued payroll | | 5,849 | | | 3,313 | |
| Dividends payable | | 565 | | | 123 | |
| Accrued interest | | 2,959 | | | 3,924 | |
| Deferred income | | 13,138 | | | 17,783 | |
| Other payables | | 92 | | | 333 | |
| Derivatives | | 0 | | | 198 | |
| Total current trade and other payables | | 85,150 | | | 94,408 | |
|
| | | | | | |
| (in thousands of USD) | | December 31, 2017 | | December 31, 2016 |
| Advances received on contracts in progress, between 1 and 5 years | | 539 |
| | 533 |
|
| Total non-current other payables | | 539 |
| | 533 |
|
| Trade payables | | 19,274 |
| | 18,107 |
|
| Accrued payroll | | 3,596 |
| | 2,581 |
|
| Dividends payable | | 160 |
| | 7 |
|
| Accrued expenses | | 22,518 |
| | 29,245 |
|
| Accrued interest | | 1,762 |
| | 1,150 |
|
| Deferred income | | 10,020 |
| | 13,746 |
|
| Other payables | | 4,025 |
| | 5,023 |
|
| Total current trade and other payables | | 61,355 |
| | 69,859 |
|
The non-current derivatives relate to the interest rate swap derivatives used to hedge the risk related to the fluctuation of the LIBOR rate (see Note 14). The increase is due to a negative mark-to-market on these IRSs at December 31, 2020.
The increase in trade payables is due to a higher number of outstanding invoices mainly related to two time charter agreements for the vessels Marlin Sardinia and Marlin Somerset which were entered into at the end of 2020 and a higher number of outstanding invoices related to bunkers.
The decrease in accrued expenses is mainly due to receiving more invoices upfront related to vessels operated on the spot market.
The decrease in accrued interest is related to the settlement in 2017payment schedule of the accrued profit split$340 million facility that was repaid in the course of the VLCC KHK Vision and the accrued TC-in cost2020.
The decrease in deferred income is due to a lower number of the Suezmax Suez Hans, lower accrualsvessels on time charter as of spot related voyage expenses and lower bonus accruals.December 31, 2020 compared to December 31, 2019.
Other payables are mainly relatedThe current derivative relate to the deferred gainIRS acquired through the acquisition of USD 5.0 million which was the difference between the fair valueGener8 Maritime Inc. and the sale price of the four VLCCs of the sale and leaseback entered into on December 16, 2016. This excess was deferred and is being amortized over the duration of the lease, i.e. 5 yearsmatured in September 2020 (see Note 19)14).
NOTES TO CONSOLIDATED FINANCIAL STATEMENTS 2020
Note 1819 - Financial instruments - marketFair values and other risksrisk management
Carrying amounts
Accounting classifications and fair values
The following table shows the carrying amounts and fair values of financial assets and financial liabilities, including their levels in the fair value hierarchy. It does not include fair value information for financial assets and financial liabilities not measured at fair value if the carrying amount is a reasonable approximation of fair value, such as trade and other receivables and payables.
NOTES TO CONSOLIDATED FINANCIAL STATEMENTS 20172020
Note 1819 - Financial instruments - marketFair values and other risksrisk management (Continued)
| | | | | | | | | | | | | | | | | | | | | | | | | | | | | | | | | | | | | | | | | | | | | | | | | | |
| | | Carrying amount | | Fair value |
| | | Fair value - Hedging instruments | | Financial assets at amortized cost | | Other financial liabilities | | Total | | Level 1 | | Level 2 | | Level 3 | | Total |
| December 31, 2019 | | | | | | | | | | | | | | | | |
| Financial assets measured at fair value | | | | | | | | | | | | | | | | |
| Forward exchange contracts (Note 16) | | 1,306 | | | — | | | — | | | 1,306 | | | 0 | | | 1,306 | | | 0 | | | 1,306 | |
| Interest rate swaps (Note 12) | | 5 | | | — | | | — | | | 5 | | | 0 | | | 5 | | | 0 | | | 5 | |
| Forward cap contracts (Note 12) | | 52 | | | — | | | — | | | 52 | | | 0 | | | 52 | | | 0 | | | 52 | |
| | 1,363 | | | — | | | — | | | 1,363 | | | | | | | | | |
| | | | | | | | | | | | | | | | |
| Financial assets not measured at fair value | | | | | | | | | | | | | | | | |
| Non-current receivables (Note 10) | | — | | | 62,474 | | | — | | | 62,474 | | | 0 | | | 0 | | | 52,591 | | | 52,591 | |
| Lease receivables (Note 10) | | — | | | 8,609 | | | — | | | 8,609 | | | 0 | | | 9,961 | | | 0 | | | 9,961 | |
| Trade and other receivables * (Note 12) | | — | | | 286,447 | | | — | | | 286,447 | | | 0 | | | 0 | | | 0 | | | 0 | |
| Cash and cash equivalents (Note 13) | | — | | | 296,954 | | | ��� | | | 296,954 | | | 0 | | | 0 | | | 0 | | | 0 | |
| | | — | | | 654,484 | | | — | | | 654,484 | | | | | | | | | |
| | | | | | | | | | | | | | | | |
| Financial liabilities measured at fair value | | | | | | | | | | | | | | | | |
| Interest rate swaps (Note 18) | | 3,593 | | | — | | | — | | | 3,593 | | | 0 | | | 3,593 | | | 0 | | | 3,593 | |
| | 3,593 | | | — | | | — | | | 3,593 | | | | | | | | | |
| | | | | | | | | | | | | | | | |
| Financial liabilities not measured at fair value | | | | | | | | | | | | | | | | |
| Secured bank loans (Note 16) | | — | | | — | | | 1,223,451 | | | 1,223,451 | | | 0 | | | 1,235,770 | | | 0 | | | 1,235,770 | |
| Unsecured bank loans (Note 16) | | — | | | — | | | 198,571 | | | 198,571 | | | 206,700 | | | 0 | | | 0 | | | 206,700 | |
| Other borrowings (Note 16) | | — | | | — | | | 247,213 | | | 247,213 | | | 0 | | | 247,213 | | | 0 | | | 247,213 | |
| Lease liabilities (Note 16) | | — | | | — | | | 75,624 | | | 75,624 | | | 0 | | | 70,074 | | | 0 | | | 70,074 | |
| Trade and other payables * (Note 18) | | — | | | — | | | 76,391 | | | 76,391 | | | 0 | | | 0 | | | 0 | | | 0 | |
| Advances received on contracts (Note 18) | | — | | | — | | | 414 | | | 414 | | | 0 | | | 0 | | | 0 | | | 0 | |
| | | | — | | | 1,821,664 | | | 1,821,664 | | | | | | | | | |
NOTES TO CONSOLIDATED FINANCIAL STATEMENTS 2020
Note 19 - Financial instruments - Fair values and risk management (Continued)
|
| | | | | | | | | | | | | | | | | | | | | | | | |
| | | | | Carrying amount | | Fair value |
| | | Hedging instruments | | Loans and receivables | | Other financial liabilities | | Total | | Level 1 | | Level 2 | | Level 3 | | Total |
| December 31, 2016 | | | | | | | | | | | | | | | | |
| Financial assets not measured at fair value | | | | | | | | | | | | | | | | |
| Non-current receivables (Note 10) | | — |
| | 183,914 |
| | — |
| | 183,914 |
| | — |
| | — |
| | 178,216 |
| | 178,216 |
|
| Trade and other receivables * (Note 11) | | — |
| | 145,193 |
| | — |
| | 145,193 |
| | — |
| | — |
| | — |
| | — |
|
| Cash and cash equivalents (Note 12) | | — |
| | 206,689 |
| | — |
| | 206,689 |
| | — |
| | — |
| | — |
| | — |
|
| | | — |
| | 535,796 |
| | — |
| | 535,796 |
| | | | | | | | |
| | | | | | | | | | | | | | | | | |
| Financial liabilities not measured at fair value | | | | | | | | | | | | | | | | |
| Secured bank loans (Note 15) | | | | — |
| | 1,085,562 |
| | 1,085,562 |
| | — |
| | 1,092,023 |
| | — |
| | 1,092,023 |
|
| Unsecured bank loans (Note 15) | | | | — |
| | — |
| | — |
| | — |
| | — |
| | — |
| | — |
|
| Trade and other payables * (Note 17) | | | | — |
| | 56,113 |
| | 56,113 |
| | — |
| | — |
| | — |
| | — |
|
| Advances received on contracts (Note 17) | | | | — |
| | 533 |
| | 533 |
| | — |
| | — |
| | — |
| | — |
|
| | | | | — |
| | 1,142,208 |
| | 1,142,208 |
| | | | | | | | |
|
| | | | | | | | | | | | | | | | | | | | | | | | |
| | | | | Carrying amount | | Fair value |
| | | Hedging instruments | | Loans and receivables | | Other financial liabilities | | Total | | Level 1 | | Level 2 | | Level 3 | | Total |
| December 31, 2017 | | | | | | | | | | | | | | | | |
| Financial assets measured at fair value | | | | | | | | | | | | | | | | |
| Forward exchange contracts | | 467 |
| | — |
| | — |
| | 467 |
| | — |
| | 467 |
| | — |
| | 467 |
|
| | | 467 |
| | — |
| | — |
| | 467 |
| | | | | | | | |
| Financial assets not measured at fair value | | | | | | | | | | | | | | | | |
| Non-current receivables (Note 10) | | — |
| | 160,352 |
| | — |
| | 160,352 |
| | — |
| | — |
| | 128,427 |
| | 128,427 |
|
| Trade and other receivables * (Note 11) | | — |
| | 112,000 |
| | — |
| | 112,000 |
| | — |
| | — |
| | — |
| | — |
|
| Cash and cash equivalents (Note 12) | | — |
| | 143,648 |
| | — |
| | 143,648 |
| | — |
| | — |
| | — |
| | — |
|
| | | — |
| | 416,000 |
| | — |
| | 416,000 |
| | | | | | | | |
| | | | | | | | | | | | | | | | | |
| Financial liabilities not measured at fair value | | | | | | | | | | | | | | | | |
| Secured bank loans (Note 15) | | — |
| | — |
| | 701,091 |
| | 701,091 |
| | — |
| | 706,056 |
| | — |
| | 706,056 |
|
| Unsecured bank loans (Note 15) | | — |
| | — |
| | — |
| | — |
| | — |
| | — |
| | — |
| | — |
|
| Unsecured notes (Note 15) | | — |
| | — |
| | 147,619 |
| | 147,619 |
| | 149,630 |
| | — |
| | — |
| | 149,630 |
|
| Unsecured other borrowings (Note 15) | | — |
| | — |
| | 50,010 |
| | 50,010 |
| | — |
| | — |
| | — |
| | — |
|
| Trade and other payables * (Note 17) | | — |
| | — |
| | 51,335 |
| | 51,335 |
| | — |
| | — |
| | — |
| | — |
|
| Advances received on contracts (Note 17) | | — |
| | — |
| | 539 |
| | 539 |
| | — |
| | — |
| | — |
| | — |
|
| | | — |
| | — |
| | 950,594 |
| | 950,594 |
| | | | | | | | |
| | | | | | | | | | | | | | | | | |
| | | | | | | | | | | | | | | | | | | | | | | | | | | | | | | | | | | | | | | | | | | | | | | | | | |
| | Carrying amount | | Fair value |
| | Fair value - Hedging instruments | | Financial assets at amortized cost | | Other financial liabilities | | Total | | Level 1 | | Level 2 | | Level 3 | | Total |
| December 31, 2020 | | | | | | | | | | | | | | | | |
| Financial assets measured at fair value | | | | | | | | | | | | | | | | |
| Forward exchange contracts (Note 16) | | 1,246 | | | — | | | — | | | 1,246 | | | 0 | | | 1,246 | | | 0 | | | 1,246 | |
| Interest rate swaps (Note 10) | | 2 | | | — | | | — | | | 2 | | | 0 | | | 2 | | | 0 | | | 2 | |
| Cap contracts (Note 12) | | 15 | | | — | | | — | | | 15 | | | 0 | | | 15 | | | 0 | | | 15 | |
| | | | | | | | | | | | | | | | |
| | 1,262 | | | 0 | | | — | | | 1,262 | | | | | | | | | |
| | | | | | | | | | | | | | | | |
| Financial assets not measured at fair value | | | | | | | | | | | | | | | | |
| Non-current receivables (Note 10) | | — | | | 48,371 | | | — | | | 48,371 | | | 0 | | | 0 | | | 44,512 | | | 44,512 | |
| Lease receivables (Note 10) | | — | | | 6,681 | | | — | | | 6,681 | | | 0 | | | 7,925 | | | 0 | | | 7,925 | |
| Trade and other receivables * (Note 12) | | — | | | 191,633 | | | — | | | 191,633 | | | 0 | | | 0 | | | 0 | | | 0 | |
| Cash and cash equivalents (Note 13) | | — | | | 161,478 | | | — | | | 161,478 | | | 0 | | | 0 | | | 0 | | | 0 | |
| | — | | | 408,163 | | | — | | | 408,163 | | | | | | | | | |
| | | | | | | | | | | | | | | | |
| Financial liabilities measured at fair value | | | | | | | | | | | | | | | | |
| Interest rate swaps (Note 18) | | 6,385 | | | — | | | — | | | 6,385 | | | 0 | | | 6,385 | | | 0 | | | 6,385 | |
| | 6,385 | | | — | | | — | | | 6,385 | | | | | | | | | |
| | | | | | | | | | | | | | | | |
| Financial liabilities not measured at fair value | | | | | | | | | | | | | | | | |
| Secured bank loans (Note 16) | | — | | | — | | | 856,860 | | | 856,860 | | | 0 | | | 864,848 | | | 0 | | | 864,848 | |
| | | | | | | | | | | | | | | | |
| Unsecured other notes (Note 16) | | — | | | — | | | 198,279 | | | 198,279 | | | 207,099 | | | 0 | | | 0 | | | 207,099 | |
| Other borrowings (Note 16) | | — | | | — | | | 151,353 | | | 151,353 | | | 0 | | | 151,353 | | | 0 | | | 151,353 | |
| Lease liabilities (Note 16) | | — | | | — | | | 66,921 | | | 66,921 | | | 0 | | | 62,387 | | | 0 | | | 62,387 | |
| Trade and other payables * (Note 18) | | — | | | — | | | 71,958 | | | 71,958 | | | 0 | | | 0 | | | 0 | | | 0 | |
| Advances received on contracts (Note 18) | | — | | | — | | | 508 | | | 508 | | | 0 | | | 0 | | | 0 | | | 0 | |
| | — | | | — | | | 1,345,879 | | | 1,345,879 | | | | | | | | | |
| | | | | | | | | | | | | | | | |
* Deferred charges, deferred fulfillment costs and VAT receivables (included in other receivables) (see Note 11) and12), deferred income and VAT payables (included in other payables) (see Note 17)18), which are not financial assets (liabilities) are not included.
NOTES TO CONSOLIDATED FINANCIAL STATEMENTS 2020
Note 19 - Financial instruments - Fair values and risk management (Continued)
Measurement of fair values
Valuation techniques and significant unobservable inputs
Level 1 fair value was determined based on the actual trading of the unsecured notes, due in 2022, and the trading price on December 31, 2017.2020. The following tables show the valuation techniques used in measuring Level 1, Level 2 and Level 3 fair values, as well as the significant unobservable inputs used.
|
| | | | | | | | | | | | | | | | | | | | | | |
| Financial instruments measured at fair value | EURONAV NV | |
NOTES TO CONSOLIDATED FINANCIAL STATEMENTS 2017
Note 18 - Financial instruments - market and other risks (Continued)
| | | | |
| | | | | | | |
Financial instruments measured at fair value | | | | | | | |
| | | | | | | |
| Type | | Valuation Techniques | | | Significant unobservable inputs |
| | | | | | | |
| Forward exchange contracts | | Forward pricing: the fair value is determined using quoted forward exchange rates at the reporting date and present value calculations based on high credit quality yield curve in the respective currencies. | | Not applicable |
| | | | | | | |
| Interest rate swaps | | Swap models: the fair value is calculated as the present value of the estimated future cash flows. Estimates of future floating-rate cash flows are based on quoted swap rates, futures prices and interbank borrowing rates. | | Not applicable |
| | | | | | | |
| Forward cap contracts | | Fair values for both the derivative and the hypothetical derivative will be determined based on a software used to calculate the net present value of the expected cash flows using LIBOR rate curves, futures and basis spreads. | | Not applicable |
| | | | | | | |
| | | | |
| | | | | | | |
| | | | | | | | | | | | | | |
| Financial instruments not measured at fair value | | | | |
| | | | |
| Type | | Valuation Techniques | | Significant unobservable inputs |
| Non-current receivables (consisting primarily of shareholders' loans) | | Discounted cash flow | | Discount rate and forecasted cash flows |
| Lease receivables | | Discounted cash flow | | Discount rate |
Other financial liabilities (consisting of secured and unsecured bank loans)loans and lease liabilities) | | Discounted cash flow | | Discount rate |
| Other financial notes (consisting of unsecured notes) | | List price | | Not applicable |
NOTES TO CONSOLIDATED FINANCIAL STATEMENTS 2020
Note 19 - Financial instruments - Fair values and risk management (Continued)
Transfers between Level 1, 2 and 3
There were no transfers between these levels in 20162019 and 2017.2020.
Financial risk management
In the course of its normal business, the Group is exposed to the following risks:
•Credit risk
•Liquidity risk
•Market risk (Tanker market risk, interest rate risk, currency risk and currencycommodity risk)
The Company's Supervisory Board of Directors has overall responsibility for the establishment and oversight of the Group's risk management framework. The Supervisory Board of Directors has established the Audit and Risk Committee, which is responsible for developing and monitoring the Group's risk management policies. The Committee reports regularly to the Supervisory Board of Directors on its activities.
The Group's risk management policies are established to identify and analyze the risks faced by the Group, to set appropriate risk limits and controls and to monitor risks and adherence to limits. Risk management policies and systems are reviewed regularly to reflect changes in market conditions and the Group's activities. The Group, through its training and management standards and procedures, aims to maintain a disciplined and constructive control environment in which all employees understand their roles and obligations.
The Group's Audit and Risk Committee oversees how management monitors compliance with the Group's risk management policies and procedures, and reviews the adequacy of the risk management framework in relation to the risks faced by the Group. The Group's Audit and Risk Committee is assisted in its oversight role by internal audit. Internal audit undertakes both regular and ad hoc reviews of risk management controls and procedures, the results of which are reported to the Audit and Risk Committee.
Credit risk
Trade and other receivables
NOTES TO CONSOLIDATED FINANCIAL STATEMENTS 2017
Note 18 - Financial instruments - market and other risks (Continued)
The Group has a formal credit policy. Credit evaluations - when necessary - are performed on an ongoing basis. At the balance sheet date there were no significant concentrations of credit risk. All trade and other receivables were with oil majors within the same industry but with a geographic spread and a different business focus. Based on past experience, and considering any forward-looking factors, there was only a small impact on doubtful amounts year-end. Based on individual analyses, provisions for doubtful debtors increased compared to 2019. In particular, the one client representing 10% each6% of the Tankers segment's total revenue in 20172020 (see Note 2) only represented 0.03% of the total trade and other receivables at December 31, 2017 (2016: two clients2020 (2019: one client representing 3.4%3.82%). The maximum exposure to credit risk is represented by the carrying amount of each financial asset.
The ageing of current trade and other receivables is as follows:
NOTES TO CONSOLIDATED FINANCIAL STATEMENTS 2020
Note 19 - Financial instruments - Fair values and risk management (Continued)
| | | (in thousands of USD) | | 2017 | | 2016 | (in thousands of USD) | | 2020 | | 2019 |
| Not past due | | 124,243 |
| | 155,950 |
| Not past due | | 183,138 | | | 246,422 | |
| Past due 0-30 days | | 2,071 |
| | 1,261 |
| Past due 0-30 days | | 9,961 | | | 35,036 | |
| Past due 31-365 days | | 9,784 |
| | 7,666 |
| Past due 31-365 days | | 16,253 | | | 21,020 | |
| More than one year | | 699 |
| | 1,465 |
| More than one year | | 5,127 | | | 6,509 | |
| Total trade and other receivables | | 136,797 |
| | 166,342 |
| Total trade and other receivables | | 214,479 | | | 308,987 | |
Past due amounts are not credit impaired as collection is still considered to be likely and management is confident the outstanding amounts can be recovered. As at December 31, 2017 45.37% (2016: 55.72%2020 46.27% (2019: 47.45%) of the total current trade and other receivables relate to TI Pool. TI Pool which areis paid after completion of the voyages but which only deals with oil majors, national oil companies and other actors of the oil industry whose credit worthiness is veryhistorically has been high. Amounts not past due are also with customers with very high credit worthiness and are therefore not credit impaired.
Non-current receivables
Non-current receivables mainly consist of shareholder's loans to joint ventures (see Note 10). As at December 31, 20172020 and December 31, 2016,2019, these receivables had no maturity date, except for the shareholder loans to Bari Shipholding Ltd. which has a maturity date in 2024, and werewas not impaired.credit impaired as there is no credit risk exposure for the Group.
Cash and cash equivalents
The Group held cash and cash equivalents of USD 143.6$161.5 million at December 31, 2017 (2016: USD 206.72020 (2019: $297.0 million). The cash and cash equivalents are held with bank and financial institution counterparties, which are rated A- to AA+, based on rating agency S&P (see Note 12)13).
Derivatives
Derivatives are entered into with banks and financial institution counterparties, which are rated A- to AA+, based on rating agency S&P.
Guarantees
The Group's policy is to provide financial guarantees only for subsidiaries and joint ventures. At December 31, 2017, there were no outstanding guarantees towards joint ventures. The2018, the Group has issued a guarantee to certain banks in respect of the new credit facilities ofentered into 2018 which were granted to 2 joint ventures (see Note 25), in respect of which26). At December 31, 2020, these guarantees towards joint ventures were still outstanding but have not been called upon. At December 30, 2019, the Group had previously issued guarantees, expireda guarantee to the buyer of the 3 VLCCs in 2017.relation to the sale and leaseback transaction (see Note 16) whereby the VLCCs were leased back in a subsidiary under a 54-months bareboat contract.
Liquidity risk
Liquidity risk is the risk that the Group will not be able to meet its financial obligations as they fall due. The Group's approach to managing liquidity is to ensure, as far as possible, that it will always have sufficient liquidity to meet its liabilities when due, under both normal and stressed conditions, without incurring unacceptable losses or risking damage to the Group's reputation. The sources of financing are diversified and the bulk of the loans are irrevocable, long-term and maturities are spread over different years.
NOTES TO CONSOLIDATED FINANCIAL STATEMENTS 20172020
Note 1819 - Financial instruments - marketFair values and other risksrisk management (Continued)
The following are the remaining contractual maturities of financial liabilities:
|
| | | | | | | | | | | | | | | |
| | | Contractual cash flows December 31, 2016 |
| (in thousands of USD) | | Carrying Amount | | Total | | Less than 1 year | | Between 1 and 5 years | | More than 5 years |
| Non derivative financial liabilities | | | | | | | | | | |
| Bank loans (Note 15) | | 1,085,562 |
| | 1,218,702 |
| | 150,630 |
| | 718,950 |
| | 349,122 |
|
| Current trade and other payables * (Note 17) | | 56,113 |
| | 56,113 |
| | 56,113 |
| | — |
| | — |
|
| Non-current other payables (Note 17) | | — |
| | — |
| | — |
| | — |
| | — |
|
| | | 1,141,675 |
| | 1,274,815 |
| | 206,743 |
| | 718,950 |
| | 349,122 |
|
| | | | | | | | | | | |
| Derivative financial liabilities | | | | | | | | | | |
| Interest rate swaps (Note 17) | | — |
| | — |
| | — |
| | — |
| | — |
|
| Forward exchange contracts (Note 17) | | — |
| | — |
| | — |
| | — |
| | — |
|
| | | — |
| | — |
| | — |
| | — |
| | — |
|
| | | | | | | | | | | |
| | | Contractual cash flows December 31, 2017 |
| | | Carrying Amount | | Total | | Less than 1 year | | Between 1 and 5 years | | More than 5 years |
| Non derivative financial liabilities | | |
| | |
| | |
| | |
| | |
|
| Bank loans (Note 15) | | 848,710 |
| | 1,009,508 |
| | 83,039 |
| | 750,722 |
| | 175,747 |
|
| Other borrowings (Note 15) | | 50,010 |
| | 50,010 |
| | 50,010 |
| | — |
| | — |
|
| Current trade and other payables * (Note 17) | | 51,335 |
| | 51,335 |
| | 51,335 |
| | — |
| | — |
|
| Non-current other payables (Note 17) | | — |
| | — |
| | — |
| | — |
| | — |
|
| | | 950,055 |
| | 1,110,853 |
| | 184,384 |
| | 750,722 |
| | 175,747 |
|
| | | | | | | | | | | |
| Derivative financial liabilities | | | | | | | | | | |
| Interest rate swaps (Note 17) | | — |
| | — |
| | — |
| | — |
| | — |
|
| Forward exchange contracts (Note 17) | | — |
| | — |
| | — |
| | — |
| | — |
|
| | | — |
| | — |
| | — |
| | — |
| | — |
|
| | | | | | | | | | | | | | | | | | | | | | | | | | | | | | | | |
| | | Contractual cash flows December 31, 2019 |
| (in thousands of USD) | | Carrying Amount | | Total | | Less than 1 year | | Between 1 and 5 years | | More than 5 years |
| Non derivative financial liabilities | | | | | | | | | | |
| Bank loans and other notes (Note 16) | | 1,422,022 | | | 1,697,327 | | | 110,720 | | | 905,302 | | | 681,305 | |
| Other borrowings (Note 16) | | 247,213 | | | 268,661 | | | 145,640 | | | 123,021 | | | 0 | |
| Lease liabilities (Note 16) | | 75,624 | | | 79,873 | | | 35,525 | | | 42,667 | | | 1,681 | |
| Current trade and other payables * (Note 18) | | 76,589 | | | 76,589 | | | 76,589 | | | 0 | | | 0 | |
| | | | | | | | | | |
| | | 1,821,448 | | | 2,122,450 | | | 368,474 | | | 1,070,990 | | | 682,986 | |
| | | | | | | | | | |
| Derivative financial liabilities | | | | | | | | | | |
| Interest rate swaps (Note 18) | | 3,593 | | | 3,300 | | | 758 | | | 2,432 | | | 110 | |
| Forward exchange contracts (Note 18) | | 0 | | | 0 | | | 0 | | | 0 | | | 0 | |
| | | 3,593 | | | 3,300 | | | 758 | | | 2,432 | | | 110 | |
| | | | | | | | | | |
| | | Contractual cash flows December 31, 2020 |
| | | Carrying Amount | | Total | | Less than 1 year | | Between 1 and 5 years | | More than 5 years |
| Non derivative financial liabilities | | | | | | | | | | |
| Bank loans and other notes (Note 16) | | 1,055,139 | | | 1,191,925 | | | 55,079 | | | 474,687 | | | 662,159 | |
| Other borrowings (Note 16) | | 151,353 | | | 180,865 | | | 61,320 | | | 119,545 | | | 0 | |
| Lease liabilities (Note 16) | | 66,921 | | | 70,245 | | | 47,976 | | | 22,150 | | | 119 | |
| Current trade and other payables * (Note 18) | | 71,958 | | | 71,958 | | | 71,958 | | | 0 | | | 0 | |
| | | | | | | | | | |
| | | 1,345,371 | | | 1,514,993 | | | 236,333 | | | 616,382 | | | 662,278 | |
| | | | | | | | | | |
| Derivative financial liabilities | | | | | | | | | | |
| Interest rate swaps (Note 18) | | 6,385 | | | 8,601 | | | 2,194 | | | 6,406 | | | 0 | |
| Forward exchange contracts (Note 18) | | 0 | | | 0 | | | 0 | | | 0 | | | 0 | |
| | | 6,385 | | | 8,601 | | | 2,194 | | | 6,406 | | | 0 | |
* Deferred income and VAT payables (included in other payables) (see Note 17)18), which are not financial liabilities, are not included.
The Group has secured bank loans that contain loan covenants. A future breach of covenant may require the Group to repay the loan earlier than indicated in the above table. For more details on these covenants, please see "capital management" below.
NOTES TO CONSOLIDATED FINANCIAL STATEMENTS 2020
Note 19 - Financial instruments - Fair values and risk management (Continued)
The interest payments on variable interest rate loans in the table above reflect market forward interest rates at the reporting date and these amounts may change as market interest rates change. It is not expected that the cash flows included in the table above (the maturity analysis) could occur significantly earlier, or at significantly different amounts than stated above.
Market risk
Managing interest rate benchmark reform and associated risks
Overview
A fundamental reform of major interest rate benchmarks is being undertaken globally, including the replacement of some interbank offered rates (IBORs) with alternative nearly risk-free rates (referred to as ‘IBOR reform’). The Group has exposures to IBORs on its financial instruments that will be replaced or reformed as part of these market-wide initiatives. There is uncertainty over the timing and the methods of transition in some jurisdictions that the Group operates in. The Group anticipates that IBOR reform will impact its risk management and hedge accounting. The Audit and Risk Committee monitors the Group’s transition to alternative rates.
Derivatives
The Group holds interest rate swaps for risk management purposes which are designated in cash flow hedging relationships. The interest rate swaps have floating legs that are indexed to USD LIBOR.
Hedge Accounting
The Group has evaluated the extent to which its cash flow hedging relationships are subject to uncertainty driven by IBOR reform as at 31 December 2020. The Group’s hedged items and hedging instruments continue to be indexed to USD LIBOR. These benchmark rates are quoted each day and the IBOR cash flows are exchanged with counterparties as usual.
However, the Group’s USD LIBOR cash flow hedging relationships extend beyond the anticipated cessation date for USD LIBOR. The Group expects that LIBOR will be discontinued after the end of 2021. However, there is uncertainty about when and how replacement may occur with respect to the relevant hedged items and hedging instruments. Such uncertainty may impact the hedging relationship. The Group applies the amendments to IFRS 9 issued in September 2019 to those hedging relationships directly affected by IBOR reform. Hedging relationships impacted by IBOR reform may experience ineffectiveness attributable to market participants’ expectations of when the shift from the existing IBOR benchmark rate to an alternative benchmark interest rate will occur. This transition may occur at different times for the hedged item and hedging instrument, which may lead to hedge ineffectiveness. The Group has measured its hedging instruments indexed to USD LIBOR using available quoted market rates for LIBOR-based instruments of the same tenor and similar maturity and has measured the cumulative change in the present value of hedged cash flows attributable to changes in USD LIBOR on a similar basis.
The Group's exposure to USD LIBOR designated in hedging relationships is $270.1 million nominal amount at 31 December 2020 (see Note 14), representing the nominal amount of the hedging caps and interest rate swaps maturing in 2022 and 2025, respectively.
Tanker market risk
The spot tanker freight market is a highly volatile global market and the Group cannot predictpredicting what the market will be.be, involves significant uncertainty. The Group has a strategy of operating the majority of its fleet on the spot market but tries to keep a certain part of the fleet under fixed time charter contracts. The proportion of vessels operated on the spot will vary according to the many factors affecting both the spot and fixed time charter contract markets.
NOTES TO CONSOLIDATED FINANCIAL STATEMENTS 2020
Note 19 - Financial instruments - Fair values and risk management (Continued)
Every increase (decrease) of 1,000 USD$1,000 on the spot tanker freight market (VLCC and Suezmax) per day would have increased (decreased) profit or loss by the amounts shown below:
NOTES TO CONSOLIDATED FINANCIAL STATEMENTS 2017
Note 18 - Financial instruments - market and other risks (Continued)
|
| | | | | | | | | | | | | | | | | | |
| (effect in thousands of USD) | | 2017 | | 2016 | | 2015 |
| | | Profit or loss | | Profit or loss | | Profit or loss |
| | | 1,000 USD | | 1,000 USD | | 1,000 USD | | 1,000 USD | | 1,000 USD | | 1,000 USD |
| | | Increase | | Decrease | | Increase | | Decrease | | Increase | | Decrease |
| | | 13,420 |
| | (13,420 | ) | | 14,140 |
| | (14,140 | ) | | 12,972 |
| | (12,972 | ) |
| | | | | | | | | | | | | | | | | | | | | | | | | | | | | | | | | | | | | | |
| (effect in thousands of USD) | | 2020 | | 2019 | | 2018 |
| | Profit or loss | | Profit or loss | | Profit or loss |
| | 1,000 USD | | 1,000 USD | | 1,000 USD | | 1,000 USD | | 1,000 USD | | 1,000 USD |
| | Increase | | Decrease | | Increase | | Decrease | | Increase | | Decrease |
| | 19,638 | | | (19,638) | | | 22,601 | | | (22,581) | | | 19,332 | | | (19,323) | |
Interest rate risk
Euronav interest rate management general policy is to borrow at floating interest rates based on LIBOR plus a margin. The Euronav Corporate Treasury Department monitors the Group's interest rate exposure on a regular basis. From time to time and under the responsibility of the Chief Financial Officer, different strategies to reduce the risk associated with fluctuations in interest rates can be proposed to the Board of Directors for their approval. In the past theThe Group hedgedhedges part of its exposure to changes in interest rates on borrowings. All borrowings contracted for the financing of vessels are on the basis of a floating interest rate, increased by a margin. On a regular basis the Group may use various interest rate related derivatives (interest rate swaps, caps and floors) to achieve an appropriate mix of fixed and floating rate exposure as defined by the Group. On December 31, 2017,2020 and December 31, 2019, the Group had no such instruments in place.place and approximately 48% of the floating interest rates have been hedged.
The Group determines the existence of an economic relationship between the hedging instrument and hedged item based on the reference interest rates, tenors, repricing dates and maturities and the notional or par amounts. If a hedging relationship is directly affected by uncertainty arising from IBOR reform, then the Group assumes for this purpose that the benchmark interest rate is not altered as a result of interest rate benchmark reform.
Hedging relationships that are impacted by IBOR reform may experience ineffectiveness because of timing mismatch between the hedged item and the hedging instrument regarding IBOR transition. For further details, see 'Managing interest rate benchmark reform and associated risks' above.
NOTES TO CONSOLIDATED FINANCIAL STATEMENTS 2020
Note 19 - Financial instruments - Fair values and risk management (Continued)
At the reporting date the interest rate profile of the Group's interest-bearing financial instruments was:
| | | (in thousands of USD) | | 2017 | | 2016 | (in thousands of USD) | | 2020 | | 2019 |
| FIXED RATE INSTRUMENTS | | | | | FIXED RATE INSTRUMENTS | | | | |
| Financial assets | | — |
| | — |
| Financial assets | | 17,271 | | | 37,163 | |
| Financial liabilities | | 147,619 |
| | — |
| Financial liabilities | | 377,899 | | | 398,620 | |
| | | 147,619 |
| | — |
| | 395,170 | | | 435,783 | |
| | | | | | | | | |
| VARIABLE RATE INSTRUMENTS | | | | | VARIABLE RATE INSTRUMENTS | |
| Financial liabilities | | 751,101 |
| | 1,085,562 |
| Financial liabilities | | 895,514 | | | 1,346,239 | |
| | | 751,101 |
| | 1,085,562 |
| | | 895,514 | | | 1,346,239 | |
Fair value sensitivity analysis for fixed rate instruments
The Group does not account for any fixed rate financial assets and liabilities at fair value through profit or loss, and the Group does not designate derivatives (interest rate swaps) as hedging instruments under a fair value hedge accounting model. Therefore a change in interest rates at the reporting date would not affect profit or loss nor equity as of that date.
Cash flow sensitivity analysis for variable rate instruments
A change of 50 basis points in interest rates at the reporting date would have increased (decreased) equity and profit or loss by the amounts shown below. This analysis assumes that all other variables, in particular foreign currency rates, remain constant.
NOTES TO CONSOLIDATED FINANCIAL STATEMENTS 20172020
Note 1819 - Financial instruments - marketFair values and other risksrisk management (Continued)
| | | | | Profit or Loss | | Equity | | | Profit or Loss | | Equity |
| | | 50 BP | | 50 BP | | 50 BP | | 50 BP | | | 50 BP | | 50 BP | | 50 BP | | 50 BP |
| (effect in thousands of USD) | | Increase | | Decrease | | Increase | | Decrease | (effect in thousands of USD) | | Increase | | Decrease | | Increase | | Decrease |
| December 31, 2015 | | | | | | | | | |
| December 31, 2018 | | December 31, 2018 | | | | | | | | |
| Variable rate instruments | | (5,670 | ) | | 5,670 |
| | — |
| | — |
| Variable rate instruments | | (4,238) | | | 4,238 | | | 0 | | | 0 | |
| Interest rate swaps | | — |
| | — |
| | — |
| | — |
| Interest rate swaps | | 0 | | | 0 | | | 6,201 | | | (6,116) | |
| Cash Flow Sensitivity (Net) | | (5,670 | ) | | 5,670 |
| | — |
| | — |
| Cash Flow Sensitivity (Net) | | (4,238) | | | 4,238 | | | 6,201 | | | (6,116) | |
| | | | | | | | | | | | | | | | | |
| December 31, 2016 | | |
| | |
| | |
| | |
| |
| December 31, 2019 | | December 31, 2019 | | | | | | | | |
| Variable rate instruments | | (5,315 | ) | | 5,315 |
| | — |
| | — |
| Variable rate instruments | | (6,195) | | | 6,195 | | | 0 | | | 0 | |
| Interest rate swaps | | — |
| | — |
| | — |
| | — |
| Interest rate swaps | | 0 | | | 0 | | | 1,553 | | | (1,433) | |
| Cash Flow Sensitivity (Net) | | (5,315 | ) | | 5,315 |
| | — |
| | — |
| Cash Flow Sensitivity (Net) | | (6,195) | | | 6,195 | | | 1,553.2 | | | (1,433) | |
| | | | | | | | | | | | | | | | | |
| December 31, 2017 | | |
| | |
| | |
| | |
| |
| December 31, 2020 | | December 31, 2020 | | | | | | | | |
| Variable rate instruments | | (4,685 | ) | | 4,685 |
| | — |
| | — |
| Variable rate instruments | | (3,819) | | | 2,484 | | | 0 | | | 0 | |
| Interest rate swaps | | — |
| | — |
| | — |
| | — |
| Interest rate swaps | | 0 | | | 0 | | | 5,542 | | | (5,343) | |
| Cash Flow Sensitivity (Net) | | (4,685 | ) | | 4,685 |
| | — |
| | — |
| Cash Flow Sensitivity (Net) | | (3,819) | | | 2,484 | | | 5,542 | | | (5,343) | |
| | | | | | | | | | | | | | | | | |
Currency risk
The Company’sGroup policy is to monitor its material non-functional currency transaction exposure so as to allow for natural coverage (revenues in the same currency than the expenses) whenever possible. When natural coverage is not deemed reasonably possible (for example for long term commitments), the Company manages its material non-functional currency transaction exposure on a case-by-case basis, either by entering into spot foreign currency transactions, foreign exchange forward, swap or option contracts, or by engaging a third party financial advisor with the purpose of managing the foreign exchange risk for us. contracts.
The Group'sGroup’s exposure to currency risk is related to its operating expenses expressed in Euros and to Treasury Notes denominated in Euros. In 20172020 about 16.5% (2016: 17.4%14.4% (2019: 12.5% and 2015: 17.4%2018: 12.9%) of the Group's total operating expenses were incurred in Euros. Revenue and the financial instrumentsborrowings are expressed in USD only, except for instruments issued under the Treasury Notes Program (Note 15)16).
| | | (in thousands of USD) | | December 31, 2017 | | December 31, 2016 | | December 31, 2015 | (in thousands of USD) | | December 31, 2020 | | December 31, 2019 | | December 31, 2018 |
| | | EUR |
| | USD |
| | EUR |
| | USD |
| | EUR |
| | USD |
| | EUR | | USD | | EUR | | USD | | EUR | | USD |
| Trade payables | | (7,891 | ) | | (11,383 | ) | | (8,725 | ) | | (9,383 | ) | | (9,913 | ) | | (13,121 | ) | Trade payables | | (5,662) | | | (21,564) | | | (4,002) | | | (18,735) | | | (6,311) | | | (9,955) | |
| Operating expenses | | (89,289 | ) | | (452,113 | ) | | (92,608 | ) | | (440,830 | ) | | (89,457 | ) | | (425,806 | ) | Operating expenses | | (105,172) | | | (624,096) | | | (95,278) | | | (666,469) | | | (89,761) | | | (608,754) | |
| Treasury Notes | | (50,010 | ) | | — |
| | — |
| — |
| — |
| | — |
| — |
| — |
| Treasury Notes | | (38,654) | | | 0 | | | (122,788) | | | 0 | | | (60,342) | | | 0 | |
For the average and closing rates applied during the year, we refer to Note 27.
In the past, Euronav had entered into an agreement with a third party financial advisor with the aim to manage the
NOTES TO CONSOLIDATED FINANCIAL STATEMENTS 2020
Note 19 - Financial instruments - Fair values and risk from adverse movements in EUR/USD exchange rates. The program used a financial trading strategy called Currency Overlay Management Strategy which managed the equivalent of EUR 40.0 million exposures on a yearly basis. The currency overlay manager conducted foreign-exchange hedging by selectively placing and removing hedges to achieve the objectives set by us. On July 29, 2016, Euronav terminated this agreement.management (Continued)
As such there is no impact of this program on the Group's consolidated statement of profit or loss for the year ending December 31, 2017 (2016: loss of USD 0.9 million and 2015: loss of USD 1.0 million).
Sensitivity analysis
A 10 percent strengthening of the EUR against the USD at December 31, would have increased (decreased) equity and profit or loss by the amounts shown below. This analysis assumes that all other variables, in particular interest rates, remain constant.
|
| | | | | | | | | |
| (in thousands of USD) | | 2017 | | 2016 | | 2015 |
| Equity | | 211 |
| | 532 |
| | 473 |
|
| Profit or loss | | (7,113 | ) | | (10,025 | ) | | (9,565 | ) |
NOTES TO CONSOLIDATED FINANCIAL STATEMENTS 2017
Note 18 - Financial instruments - market and other risks (Continued)
| | | | | | | | | | | | | | | | | | | | |
| (in thousands of USD) | | 2020 | | 2019 | | 2018 |
| Equity | | 735 | | | 437 | | | 491 | |
| Profit or loss | | (10,412) | | | (9,952) | | | (7,888) | |
A 10 percent weakening of the EUR against the USD at December 31, would have had the equal but opposite effect to the amounts shown above, on the basis that all the other variables remain constant.
Cash flow hedges
At December 31, 2020, the Group held the following instruments to hedge exposures to changes in interest rates.
| | | | | | | | | | | | | | | | | | | | |
| | | | | | |
| | Maturity |
| (in thousands of USD) | | 1-6 months | | 6-12 months | | More than 1 year |
| | | | | | |
| Interest rate risk | | | | | | |
| Interest rate swaps | | | | | | |
| Net exposure | | (10,855) | | | (10,942) | | | (81,803) | |
| Average fixed interest rate | | 2.96 | % | | 2.96 | % | | 2.96 | % |
| | | | | | |
At December 31, 2019, the Group held the following instruments to hedge exposures to changes in interest rates.
| | | | | | | | | | | | | | | | | | | | |
| | | | | | |
| | Maturity |
| (in thousands of USD) | | 1-6 months | | 6-12 months | | More than 1 year |
| | | | | | |
| Interest rate risk | | | | | | |
| Interest rate swaps | | | | | | |
| Net exposure | | (23,469) | | | (23,261) | | | (176,598) | |
| Average fixed interest rate | | 1.99 | % | | 2.00 | % | | 2.96 | % |
| | | | | | |
At December 31, 2020 and December 31, 2019, the Group had 2 interest cap options with a notional amount of $200.0 million starting on October 1, 2020.
The amounts at the reporting date relating to items designated as hedged items were as follows.
NOTES TO CONSOLIDATED FINANCIAL STATEMENTS 2020
Note 19 - Financial instruments - Fair values and risk management (Continued)
| | | | | | | | | | | | | | | | | | | | | | | |
| December 31, 2020 | | December 31, 2019 |
| (in thousands of USD) | Change in value used for calculating hedge ineffectiveness | | Cash flow hedge reserve | | Change in value used for calculating hedge ineffectiveness | | Cash flow hedge reserve |
| | | | | | | |
| Interest rate risk | | | | | | | |
| Variable-rate instruments | 2,989 | | | (6,385) | | | 1,205 | | | (3,396) | |
| Cap option | (116) | | | (1,071) | | | 680 | | | (1,187) | |
| | | | | | | |
The amounts relating to items designated as hedging instruments and hedge ineffectiveness were as follows.
| | | | | | | | | | | | | | | | | | | | | | | | | | | | | | | | | | | | | | | | | | | | |
| | | | | | | | | | | | | | |
| | 2020 | | During the period 2020 |
| (in thousands of USD) | | Nominal amount | | Carrying amount - Assets | | Carrying amount - Liabilities | | Line item in the statement of financial position where the hedging instrument is included | | Changes in the value of the hedging instrument recognized in OCI | | Hedge ineffectiveness recognized in profit or loss | | Line item in profit or loss that includes hedge ineffectiveness |
| | | | | | | | | | | | | | |
| Interest rate risk | | | | | | | | | | | | | | |
| Interest rate swaps | | 70,143 | | | 2 | | | 6,385 | | | Trade and other receivables, non-current and current other payables | | (2,989) | | | (108) | | | Finance expenses |
| Cap options | | 200,000 | | | 15 | | | 0 | | | Trade and other receivables | | 116 | | | 0 | | | Finance expenses |
| | | | | | | | | | | | | | |
| | | | | | | | | | | | | | | | | | | | | | | | | | | | | | | | | | | | | | | | | | | | |
| | | | | | | | | | | | | | |
| | 2019 | | During the period 2019 |
| (in thousands of USD) | | Nominal amount | | Carrying amount - Assets | | Carrying amount - Liabilities | | Line item in the statement of financial position where the hedging instrument is included | | Changes in the value of the hedging instrument recognized in OCI | | Hedge ineffectiveness recognized in profit or loss | | Line item in profit or loss that includes hedge ineffectiveness |
| | | | | | | | | | | | | | |
| Interest rate risk | | | | | | | | | | | | | | |
| Interest rate swaps | | 506,603 | | | 5 | | | 3,593 | | | Trade and other receivables, non-current and current other payables | | (1,205) | | | (4,943) | | | Finance expenses |
| Forward cap options | | 200,000 | | | 52 | | | 0 | | | Trade and other receivables | | (680) | | | 0 | | | Finance expenses |
| | | | | | | | | | | | | | |
During 2020, 0 amounts were reclassified from hedging reserve to profit or loss. During 2019, $4.9 million was reclassified from hedging reserve to profit or loss.
The following table provides a reconciliation by risk category of components of equity and analysis of OCI items, net of tax, resulting from cash flow hedge accounting.
NOTES TO CONSOLIDATED FINANCIAL STATEMENTS 2020
Note 19 - Financial instruments - Fair values and risk management (Continued)
| | | | | | | | | | | |
| | | |
| (in thousands of USD) | | Hedging reserve | |
| | | |
| Balance at January 1, 2020 | | (4,583) | | |
| Cash flow hedges | | | |
| Change in fair value interest rate risk | | (2,873) | | |
| Balance at December 31, 2020 | | (7,456) | | |
| | | |
| Balance at January 1, 2019 | | (2,698) | | |
| Cash flow hedges | | | |
| Change in fair value interest rate risk | | (1,885) | | |
| Balance at December 31, 2019 | | (4,583) | | |
| | | |
Master netting or similar agreements
The Group enters into derivative transactions under International Swaps and Derivatives Association (ISDA) master netting agreements. In general, under such agreements the amounts owned by each counterparty on a single day in respect of all transactions outstanding in the same currency are aggregated into a single net amount that is payable by one party to the other.
Capital management
Euronav is continuously optimizingseeking to optimize its capital structure (mix between debt and equity). The main objective is to maximize shareholder value while keeping the desired financial flexibility to execute the strategic projects. Some of the Group's other key drivers when making capital structure decisions are pay-out restrictions and the maintenance of the strong financial health of the Group. Besides the statutory minimum equity funding requirements that apply to the Group's subsidiaries in the various countries, the Group is also subject to covenants in relation to some of its senior secured credit facilities:
•an amount of current assets that, on a consolidated basis, exceeds current liabilities. Current assets may include undrawn amounts of any committed revolving credit facilities and credit lines having a maturity of more than one year;
•an aggregate amount of cash, cash equivalents and available aggregate undrawn amounts of any committed loan of at least USD 50.0$50.0 million or 5% of the Group's total indebtedness (excluding guarantees), depending on the applicable loan facility, whichever is greater;
•an amount of cash of at least USD 30.0$30.0 million; and
•a ratio of Stockholders' Equity to Total Assets of at least 30%
Further, the Group's loan facilities generally include an asset protection clause whereby the fair market value of collateral vessels should be at least 125% of the aggregate principal amount outstanding under the respective loan.
NOTES TO CONSOLIDATED FINANCIAL STATEMENTS 2020
Note 19 - Financial instruments - Fair values and risk management (Continued)
The credit facilities discussed above also contain restrictions and undertakings which may limit the Group and the Group's subsidiaries' ability to, among other things:
•effect changes in management of the Group's vessels;
•transfer or sell or otherwise dispose of all or a substantial portion of the Group's assets;
•declare and pay dividends (with respect to each of the Group's joint ventures, other than Seven Seas Shipping Limited, no dividend may be distributed before its loan agreement, as applicable, is repaid in full); and
•incur additional indebtedness.
A violation of any of these financial covenants or operating restrictions contained in the credit facilities may constitute an event of default under these credit facilities, which, unless cured within the grace period set forth under the applicable credit facility, if applicable, or waived or modified by the Group's lenders, provides them with the right to, among other things, require the Group to post additional collateral, enhance equity and liquidity, increase interest payments, pay down indebtedness to a level where the Group is in compliance with loan covenants, sell vessels in the fleet, reclassify indebtedness as current liabilities and accelerate indebtedness and foreclose liens on the vessels and the other assets securing the credit facilities, which would impair the Group's ability to continue to conduct business.
Furthermore, certain of our credit facilities contain a cross-default provision that may be triggered by a default under one of our other credit facilities. A cross-default provision means that a default on one loan would result in a default on certain other loans. Because of the presence of cross-default provisions in certain of our credit facilities, the refusal of any one lender under our credit facilities to grant or extend a waiver could result in certain of our indebtedness being accelerated, even if our other lenders under our credit facilities have waived covenant defaults under the respective credit facilities. If our secured indebtedness is accelerated in full or in part, it would be very difficult in the current financing environment for us to refinance our debt or obtain additional financing and we could lose our vessels and other assets securing our credit facilities if our lenders foreclose their liens, which would
adversely affect our ability to conduct our business.
NOTES TO CONSOLIDATED FINANCIAL STATEMENTS 2017
Note 18 - Financial instruments - market and other risks (Continued)
As of December 31, 2017,2020, December 31, 20162019 and December 31, 2015,2018, the Group was in compliance with all of the covenants contained in the debt agreements. With respect to the quantitative covenants as of December 31, 2017,2020, as described above:
| |
1. | current assets on a consolidated basis (including available credit lines of USD 607.4 million) exceeded current liabilities by USD 729.3 million
|
| |
2. | aggregated cash was USD 751.0 million
|
| |
3. | cash was USD 143.6 million
|
| |
4. | ratio of Stockholders' Equity to Total Assets was 65.7%
|
In1.current assets on a consolidated basis (including available credit lines of $840.4 million) exceeded current liabilities by $1,088.7 million
2.aggregated cash was $1,101.9 million
3.cash was $161.5 million
4.ratio of Stockholders' Equity to Total Assets was 62.7%
The Company updated the courseguidance to its dividend policy and will target each quarter, applicable as of 2017,the first quarter 2020, to return 80% of the net income (including the fixed element of $3 cents per quarter) to shareholders. This return to shareholders will primarily be in the form of a cash dividend and the Company updated its dividend policy.will always look at share buyback as an alternative if it believes more value can be created for shareholders.
NOTES TO CONSOLIDATED FINANCIAL STATEMENTS 2020
Note 19 - Financial instruments - Fair values and risk management (Continued)
The Board has adopted the following current dividend payment policy: the Company intends to pay a minimum fixed dividend of at least USD 0.12 in total per share per year provided (a) the Company has in the view of management and the board, sufficient balance sheet strength and liquidity combined (b) with sufficient earnings visibility from fixed income contracts. In addition, if the results per share are positive and exceed the amount of the fixed dividend, that additional income* will be allocated to either: additional cash dividends, share buy-back, accelerated amortization of debt or the acquisition of vessels which we consider at that time to be accretive to shareholders’ value.
*Treatment ofcalculation does not include capital gains (reserved for fleet renewal) but include capital losses and capital gainsthe policy is at all times subject to freight market outlook, company balance sheet and cyclicality along with other factors and regulatory requirements.
As part of its distribution policycapital allocation strategy, Euronav will continuehas the option of buying its own shares back should the Supervisory Board and Management Board believe that there is a substantial value disconnect between the share price and the real value of the Company. This return of capital is in addition to include exceptional capital losses when assessing additional dividends but also continue to exclude exceptional capital gains when assessing additionalthe fixed dividend payments.
*Treatment of Deferred Tax Assets (DTA) and Deferred Tax Liabilities (DTL)
As part$0.12 per share paid each year. On December 31, 2020, the Company had purchased 13,400,516 of its distribution policy Euronavown shares on Euronext Brussels. Following these transactions, the Company owned 18,346,732 own shares (8.34% of the total outstanding shares) at year-end.
Commodity risk
The Group has been purchasing compliant bunker fuel for the future consumption by its vessels. In order to fix the price of the fuel bought the company has used swaps and futures to hedge the risk between decision of buying the fuel and receiving and paying the cargo. These swaps and futures were designated as cash flow hedges of the variability in the price of bunker between the order date and the fixing date. At year-end, all fuel was received. The Group remain exposed to the risk of decrease in bunker fuel on the spot market.
Consequences and impact of the COVID-19 pandemic
The COVID-19 outbreak has impacted many countries around the world, and disrupted the lives of many millions of people. The Company has been taking the risks associated with the outbreak extremely seriously, and the safety and wellbeing of its employees is of paramount importance.
In that respect, the biggest operational challenge was to conduct crew changes. Apart from serious humanitarian and crew welfare concerns, there is an increasing risk that fatigue will lead to serious maritime accidents. As well as restrictions placed on the movement of seafarers by national and local authorities, there is also the problem of the continued suspension of the majority of flights between major crew change ports and the home country of the Company’s crew. In order to resolve the difficult situation, the Company decided to accommodate deviations by ships to facilitate crew changes, resulting in an extra cost ($1.8 million) and less revenues because of off hire ($4.2 million).
Going forward, it remains difficult to estimate the future impact of the pandemic on the economies where we are active, and hence the impact these factors might have on the financial results.
In general terms, the market will become more challenging as demand for crude oil is negatively impacted by the COVID-19 pandemic. This decrease in demand combined with the gradual release of vessels that were used as storage may distort the supply-demand balance and thus the freight market. However, these negative consequences could very well be offset by continuing logistical delays of ships in ports, increased level of recycling, reduced ordering of newbuild vessels and increased crude oil production, partially neutralizing the COVID-19 impact to a certain extent. In view of these different dynamics which the company does not include non-cash items affectingcontrol, the longer term global macro-economic impact on the Company’s results such as DTA or DTL.related to the COVID-19 outbreak remains difficult to accurately quantify. Any forward-looking statements should be regarded with caution because of the inherent uncertainties in economic trends and business risks related to the current COVID-19 outbreak.
NOTES TO CONSOLIDATED FINANCIAL STATEMENTS 2020
Note 1920 - Operating leasesLeases
Leases as lessee
Future minimum lease payments
The Group leases in some of its vessels under time charter andFor the four bare boat agreements (operating leases). The future minimumcharters for the vessels Nautilus, Nucleus, Neptun and Navarin, the Group recognized a right-of-use asset and lease payments with an average durationliability which was the present value at January 1, 2019 of 4 years under non-cancellable leases are as follows:
|
| | | | | | |
| (in thousands of USD) | | December 31, 2017 | | December 31, 2016 |
| Less than 1 year | | (32,120 | ) | | (32,120 | ) |
| Between 1 and 5 years | | (95,524 | ) | | (127,644 | ) |
| More than 5 years | | — |
| | — |
|
| | | | | |
| Total future lease payments | | (127,644 | ) | | (159,764 | ) |
Options to extend the charter period, if any, have not been taken into account when calculating the future minimum lease payments.
In 2016, The right-of-use asset, on January 1, 2019, was measured based on the Group entered into a five year leaseback agreement for 4 VLCCs on December 16, 2016. The saletransition option to align the value of the right of use asset to that of the lease liability. The right-of-use asset was adjusted for the effect of a previously deferred gain on the sale and leaseback of these vessels occurred onand is depreciated over the remaining lease term till December 22, 2016 and the charter period has a duration of 5 years, therefore ending on December 22,15, 2021.
Under these leaseback agreements there is a seller's credit of USD 4.5$4.5 million of the sale price that becomes immediately due and payable by the owners upon sale of the vessel during the charter period and shall be paid out of the sales proceeds. It also becomes due to the extent of 50% of the (positive) difference between the fair market value of the vessels at the end of the leaseback agreements and USD 17.5$17.5 million (for the oldest VLCC) or USD 19.5$19.5 million (for the other vessels). Furthermore, the Group providesprovided a residual guarantee to the owners in the aggregate amount of up to USD 20.0$20.0 million in total at the time of redelivery of the four4 vessels. The parties also agreed a profit split, if the vessel is sold at charter expiry they shall share the net proceeds of the sale, 75% for owners and 25% for charterers, between USD 26.5$26.5 million and USD 32.5$32.5 million (for the oldest VLCC) or between USD 28.5$28.5 million and USD 34.5$34.5 million (for the other vessels).
On October 27, 2020 and November 6, 2020, the Company entered into a time charter agreement for 2 Suezmaxes. The 2 Suezmaxes are the Marlin Sardinia (2019 - 156,607) and the Marlin Somerset (2019 - 156,620). The time charter contracts have a duration of 24-months with an option for an additional 12 months, which should be declared no later than 20 months after delivery, at a rate of $25,000 per day per vessel for the firm 24-months period and $26,500 per day per vessel for the optional 12-months period. Owners have a right to sell the vessel during the firm and optional period of the charter and transfer the remaining charter to the new owners by way of novation agreement. In accordance with IFRS, the Group recognized a right-of-use asset and lease liability. As at December 31, 2020, the Company is not reasonably certain that the optional period will be exercised and has not been taking into account when calculating the future minimum lease payments.
The future lease payments for these leaseback agreements are as follows:
| | | | | | | | | | | | | | |
| (in thousands of USD) | | December 31, 2020 | | December 31, 2019 |
| Less than 1 year | | 49,218 | | | 32,903 | |
| Between 1 and 5 years | | 14,714 | | | 31,870 | |
| | | | |
| Total future lease payments | | 63,932 | | | 64,773 | |
For the office leases in Belgium, France, Greece, Hong Kong, Singapore, UK and US, which have an average lease term till November 2023, the Group recognized a right-of-use asset and lease liability. The right-of-use asset was adjusted by the practical expedient impairment assessment based on the onerous contract analysis option. The right-of-use asset related to office leases was reduced by the lease receivable related to subleases that qualify as finance lease under IFRS 16.
The Group used the short-term lease exemption for all the lease contracts with a remaining lease term of less than one year. Accordingly, those lease payments were recognized as an expense and there was no impact on transition.
Information about leases for which the Group is a lessee is presented below.
Right-of-use assets
| | | | | | | | | | | | | | | | | | | | | | | | | | | | | | | | |
| | | | | | | | | | |
| (in thousands of USD) | | Bare boats | | Time charters | | Office rental | | Company cars | | Total |
| | | | | | | | | | |
| Balance at January 1, 2019 | | 83,698 | | | 0 | | | 3,711 | | | 189 | | | 87,598 | |
| Additions to right-of-use assets | | 0 | | | 0 | | | 0 | | | 653 | | | 653 | |
| Depreciation charge for the year | | (28,287) | | | 0 | | | (900) | | | (78) | | | (29,265) | |
| Derecognition of right-of-use assets | | 0 | | | 0 | | | (78) | | | 0 | | | (78) | |
| | | | | | | | | | |
| Balance at December 31, 2019 | | 55,411 | | | 0 | | | 2,733 | | | 764 | | | 58,908 | |
| | | | | | | | | | |
NOTES TO CONSOLIDATED FINANCIAL STATEMENTS 20172020
Note 1920 - Operating leasesLeases (Continued)
The Group analyzed the classification of the leaseback agreements based on the primary lease classification criteria and the supplemental indicators in IAS 17, and determined that these agreements qualified as operating leases.
Non-cancellable operating lease rentals for office space and company cars with an average duration of 3 years are payable as follows:
|
| | | | | | |
| (in thousands of USD) | | December 31, 2017 | | December 31, 2016 |
| Less than 1 year | | (2,287 | ) | | (2,297 | ) |
| Between 1 and 5 years | | (7,224 | ) | | (5,070 | ) |
| More than 5 years | | (1,227 | ) | | (1,183 | ) |
| | | | | |
| Total non-cancellable operating lease rentals | | (10,738 | ) | | (8,550 | ) |
| | | | | | | | | | | | | | | | | | | | | | | | | | | | | | | | |
| | | | | | | | | | |
| (in thousands of USD) | | Bare boats | | Time charters | | Office rental | | Company cars | | Total |
| | | | | | | | | | |
| Balance at 1 January 2020 | | 55,411 | | | 0 | | | 2,733 | | | 764 | | | 58,908 | |
| Additions to right-of-use assets | | 0 | | | 24,873 | | | 762 | | | 66 | | | 25,701 | |
| Depreciation charge for the year | | (28,364) | | | (2,078) | | | (1,092) | | | (167) | | | (31,702) | |
| Derecognition of right-of-use assets | | 0 | | | 0 | | | 0 | | | 0 | | | 0 | |
| Translation differences | | 0 | | | 0 | | | 36 | | | 12 | | | 48 | |
| | | | | | | | | | |
| Balance at 31 December 2020 | | 27,047 | | | 22,795 | | | 2,438 | | | 675 | | | 52,955 | |
| | | | | | | | | | |
Amounts recognized in profit andor loss
| | | | | | | | | | | |
| | | |
| (in thousands of USD) | | | |
| | | |
| 2020 | | 2019 |
| Interest on lease liabilities | (3,287) | | | (4,811) | |
| Depreciation right-of-use assets | (31,702) | | | (29,265) | |
| | | |
| Expenses relating to short-term leases | 0 | | | (103) | |
| Low-value leases | (228) | | | (851) | |
| | | |
|
| | | | | | | | | |
| (in thousands of USD) | | 2017 | | 2016 | | 2015 |
| Bareboat charter | | (31,111 | ) | | (792 | ) | | — |
|
| Time charter | | (62 | ) | | (16,921 | ) | | (25,849 | ) |
| Office rental | | (2,136 | ) | | (2,219 | ) | | (2,581 | ) |
| | | | | | | |
| Total recognized in profit and loss | | (33,309 | ) | | (19,932 | ) | | (28,430 | ) |
| | | | | | | | | | | |
| | | |
| (in thousands of USD) | 2020 | | 2019 |
| | | |
| Total cash outflow for leases | (37,779) | | | (30,214) | |
| Total cash inflow for leases | 1,786 | | | 1,251 | |
| | | |
Extension options
Some property leases contain extension options exercisable by the Group. The Group assesses at lease commencement date whether it is reasonably certain to exercise the extension options, and reassesses if there is a significant event or significant changes in circumstances within its control.
The Group has estimated that the potential future lease payments, should it exercise the option, would result in an impact of approximately $12.3 million in the lease liabilities.
Leases as lessor
Future minimum lease receivables
TheAs a lessor the Group leases out some of its vessels under long-term time charter agreements. For certain vessels employed under long-term time charter agreements, (operating leases). the adoption of IFRS 16 required the Group to separate the lease and non-lease component in the contract, with the lease component qualified as operating lease and the non-lease component accounted for under IFRS 15. This did not have a material impact for the Group.
The future minimumundiscounted lease receivables with an average duration of 5 months under non-cancellable leasespayments to be received for these lease agreements are as follows:
|
| | | | | | |
| (in thousands of USD) | | December 31, 2017 | | December 31, 2016 |
| Less than 1 year | | 103,007 |
| | 150,450 |
|
| Between 1 and 5 years | | 147,967 |
| | 35,083 |
|
| More than 5 years | | 31,793 |
| | — |
|
| | | | | |
| Total future lease receivables | | 282,767 |
| | 185,533 |
|
| | | | | | | | | | | |
| (in thousands of USD) | December 31, 2020 | | December 31, 2019 |
| Less than one year | 123,319 | | | 143,748 | |
| Between one and five years | 303,561 | | | 263,406 | |
| More than five years | 217,354 | | | 27,362 | |
| Total future lease receivables | 644,234 | | | 434,516 | |
The amounts shown in the table above include the Group's share of operating leases of joint ventures. The increase in lease receivables is due to the extension of the time charter contracts, signed in November 2020, in the two joint ventures (TI Asia Ltd. and TI Africa Ltd.) for ten years in direct continuation of their current contractual service, until July 21, 2032 and September 21, 2032 respectively.
On some of the abovementionedabove mentioned vessels the Group has granted the option to extend the charter period. These option periods have not been taken into account when calculating the future minimum lease receivables.
At December 31, 2017, Euronav and its subsidiaries, without joint ventures, have future minimum lease receivables less than one year of USD 54.4 million (2016: USD 108.5 million) and future minimum lease receivables between 1 and 5 years of USD 0.0 million (2016: USD 35.1 million).
Following the rationalization of the TI Pool structure in 2017 (see Note 23), Tankers International Ltd. ("TIL") became the disponent owner of all of the vessels in the TI Pool as all the vessels are now time chartered with a duration of 1 year to TIL at a floating rate equivalent to the average spot rate achieved by the pool times the pool points assigned to each vessel. At December 31, 2017, 24 of our VLCC vessels were employed in the TI Pool under such floating time charters. Given the variable nature of the time charter rates, there are no minimum lease receivables for these contracts and therefore, these floating time charters are not included in the table above.
NOTES TO CONSOLIDATED FINANCIAL STATEMENTS 20172020
Note 1920 - Operating leasesLeases (Continued)
Vessels employed by the TI Pool do not meet the definition of a lease under IFRS 16 and accordingly are accounted for under IFRS 15 Revenue from Contracts with Customers.
Non-cancellable operating lease rentals for office space with an average duration of 5 years are receivable as follows:
|
| | | | | | |
| (in thousands of USD) | | December 31, 2017 | | December 31, 2016 |
| Less than 1 year | | 726 |
| | 806 |
|
| Between 1 and 5 years | | 2,903 |
| | 2,644 |
|
| More than 5 years | | 233 |
| | 878 |
|
| | | | | |
| Total future lease receivables | | 3,862 |
| | 4,328 |
|
The above operating lease rentals receivable relate entirely toFurther the Group's leased offices for Euronav UK.
Euronav UK has sublet part of theGroup subleases office space to four different subtenants, startingthird parties in 2014.certain leased offices of Euronav UK and Euronav MI II Inc (formerly Gener8 Maritime Inc.). The Group recognized at January 1, 2019 $11.4 million lease receivables related to sublease agreements that qualify as finance lease.
Amounts recognized in profit and loss
The following table sets out a maturity analysis of the lease receivables related to the subleased office space, showing the undiscounted sublease payments to be received after the reporting date.
| | | | | | | | | | | | | | |
| (in thousands of USD) | | December 31, 2020 | | December 31, 2019 |
| Less than 1 year | | 2,328 | | | 2,229 | |
| One to two years | | 2,359 | | | 2,304 | |
| Two to three years | | 1,898 | | | 2,335 | |
| Three to four years | | 1,689 | | | 1,890 | |
| Four to five years | | 1,285 | | | 1,689 | |
| More than 5 years | | 0 | | | 1,285 | |
| Total undiscounted lease receivables | | 9,559 | | | 11,732 | |
|
| | | | | | | | | |
| (in thousands of USD) | | 2017 | | 2016 | | 2015 |
| Bareboat charter | | — |
| | — |
| | — |
|
| Time charter | | 118,705 |
| | 140,227 |
| | 126,091 |
|
| Office rental | | 840 |
| | 878 |
| | 879 |
|
| | | | | | | |
| Total recognized in profit and loss | | 119,545 |
| | 141,105 |
| | 126,970 |
|
NOTES TO CONSOLIDATED FINANCIAL STATEMENTS 2020
Note 2021 - Provisions and contingencies
| | | | | | | | | | | |
| (in thousands of USD) | | Onerous contract | Total |
| | | |
| Balance at January 1, 2019 | | 5,265 | | 5,265 | |
| | | |
| Assumed in a business combination (Note 25) | | (3,049) | | (3,049) | |
| Provisions used during the year | | (447) | | (447) | |
| Balance at December 31, 2019 | | 1,769 | | 1,769 | |
| | | |
| Non-current | | 1,381 | | 1,381 | |
| Current | | 388 | | 388 | |
| Total | | 1,769 | | 1,769 | |
| | | |
| Balance at January 1, 2020 | | 1,769 | | 1,769 | |
| | | |
| Adoption IFRS 16 | | 0 | | 0 | |
| Provisions used during the year | | (388) | | (388) | |
| Balance at December 31, 2020 | | 1,381 | | 1,381 | |
| | | |
| Non-current | | 1,154 | | 1,154 | |
| Current | | 227 | | 227 | |
| Total | | 1,381 | | 1,381 | |
In 2004, Gener8 Maritime Subsidiary II Inc. entered into a non-cancellable lease for office space. This lease started on December 1, 2004 and would have expired on September 30, 2020. On July 14, 2015 this lease was extended for an additional 5 years until September 30, 2025. The facilities have been sub-let starting on December 1, 2018 for the remaining lease term, but changes in market conditions have meant that the rental income is lower than the rental expense. The obligation for the future payments, net of expected rental income, has been provided for. $3.0 million of the provision was reclassified to right-of-use assets as part of the adoption of IFRS 16 on January 1, 2019.
The Group is currently involved in a litigation. Provisions related to legal and arbitration proceedings are recorded in accordance with the accounting policy as described in Note 1.16. The claim has been submitted on January 15, 2021 by Unicredit Bank in London with the High Court of Justice of England and Wales. The claim relates to an alleged misdelivery of 101,809 metric tons of low sulphur fuel oil that was transported by the Suezmax vessel, Sienna. The charterer, Gulf Petrochem FZC, a company of GP Global, instructed the vessel to discharge the cargo at Sohar without presentation of the bill of lading but against a letter of indemnification issued by the charterer as is customary practice in the crude oil shipping industry. Unicredit bank, who had financed the cargo for an amount of USD 26,367,200 and had become the holder of the bill of lading, was not repaid in accordance with the financing arrangements agreed with Gulf Petrochem FZC. As holder of the bill of lading, Unicredit Bank is now claiming that amount of USD 26,367,200 together with interest from Euronav NV. The GP Global group is currently under a restructuring plan and any recourse under the letter of indemnity issued by Gulf Petrochem FZC is therefore doubtful. The Group believes that it has followed well established standard working practices and that it has valid defense arguments. Based on an external legal advice, management believes that it has strong arguments that the risk of an outflow is less than probable and therefore no provision is recognized. The court proceedings are in early stage.
Furthermore, the Group is involved in a number of disputes in connection with its day-to-day activities, both as claimant and defendant. Such disputes and the associated expenses of legal representation are covered by insurance. Moreover, they are not of a magnitude that lies outside the ordinary, and their scope is not of such a nature that they could jeopardize the Group's financial position.
NOTES TO CONSOLIDATED FINANCIAL STATEMENTS 20172020
Note 2122 - Related parties
Identity of related parties
The Group has a related party relationship with its subsidiaries (see Note 23)24) and equity-accounted investees (see Note 25)26) and with its directors and executive officers (see Note 22)23).
Transactions with key management personnel
The total amount of the remuneration paid in local currency to all non-executive directors for their services as members of the board and committees (if applicable) is as follows:
| | | (in thousands of EUR) | | 2017 | | 2016 | | 2015 | (in thousands of EUR) | | 2020 | | 2019 | | 2018 |
| Total remuneration | | 1,015 |
| | 1,145 |
| | 1,591 |
| Total remuneration | | 1,048 | | | 1,101 | | | 1,035 | |
The Nomination and Remuneration Committee annually reviews the remuneration of the members of the Executive Committee.Management Board. The remuneration (excluding the CEO) consists of a fixed and a variable component and can be summarized as follows:
| | | (in thousands of EUR) | | 2017 | | 2016 | | 2015 | (in thousands of EUR) | | 2020 | | 2019 | | 2018 |
| Total fixed remuneration | | 1,176 |
| | 1,175 |
| | 1,176 |
| Total fixed remuneration | | 2,165 | | | 1,579 | | | 1,231 | |
| of which | | | | | | | of which | | | | | | |
| Cost of pension | | 35 |
| | 35 |
| | 35 |
| Cost of pension | | 18 | | | 80 | | | 39 | |
| Other benefits | | 58 |
| | 57 |
| | 57 |
| Other benefits | | 143 | | | 81 | | | 75 | |
| | | | | | | | |
| Total variable remuneration | | 1,331 |
| | 1,042 |
| | 2,392 |
| Total variable remuneration | | 1,029 | | | 2,424 | | | 1,153 | |
| of which | | | | | | | of which | | | | | | |
| Share-based payments | | 597 |
| | 351 |
| | 1,010 |
| Share-based payments | | 69 | | | 1,403 | | | 299 | |
All amounts mentioned refer to the Executive CommitteeManagement Board in its official composition throughout 2017.2020.
The remuneration of the CEO can be summarized as follows:
| | | | | | | | | | | | | | | | | | | | |
| (2020 & 2019 in thousands of EUR, 2018 in thousands of GBP) | | 2020 | | 2019 | | 2018 |
| Total fixed remuneration | | 624 | | | 5,754 | | | 537 | |
| of which | | | | | | |
| Cost of pension | | — | | | 7.4 | | | 0 | |
| Other benefits | | — | | | 26 | | | 40 | |
| | | | | | |
| Total variable remuneration | | 424 | | | 786 | | | 1,866 | |
| of which | | | | | | |
| Share-based payments | | 54 | | | 786 | | | 118 | |
|
| | | | | | | | | |
| (in thousands of GBP) | | 2017 | | 2016 | | 2015 |
| Total fixed remuneration | | 407 |
| | 405 |
| | 405 |
|
| of which | | | | | | |
| Cost of pension | | — |
| | — |
| | — |
|
| Other benefits | | 13 |
| | 11 |
| | 11 |
|
| | | | | | | |
| Total variable remuneration | | 528 |
| | 437 |
| | 863 |
|
| of which | | | | | | |
| Share-based payments | | 233 |
| | 171 |
| | 333 |
|
Within the framework of a stock option plan, the board of directors has granted on December 16, 2013 options on its 1,750,000 treasury shares to the members of the Executive Committee for no consideration but with conditions (see Note 22). 525,000 options were granted to the CEO and 1,225,000 options were granted to the other members of the Executive Committee. The exercise price of the options is EUR 5.7705. All of the beneficiaries have accepted the options granted to them. In 2016 the Company bought back 692,415 shares and delivered 116,667 shares upon the exercise of share options. In 2017 Euronav did not buy back or dispose of any own shares. At the date of this report all of the remaining options are vested. In addition, the board of directors has granted onOn February 12, 2015, the Board of Directors (as of February 2020 Supervisory Board) granted 236,590 options and 65,433 restricted stock units within the framework of a long term incentive plan. Vested stock options may be exercised until 13 years after the grant date. As of December 31, 2020, all the stock options remained outstanding but all RSUs were exercised in 2018 (see Note 14 and 23). On February 2, 2016, the boardBoard of directorsDirectors (as of February 2020 Supervisory Board) granted 54,616 phantom stock units within the framework of an additional long term incentive plan. Each unit gives a conditional right to receive an amount of cash equal to the fair market value of one share of the Company on the settlement date. The phantom stock units will mature one-third each year on the second, third and fourth anniversary of the award. One-third was vested on the second anniversary, one-third was vested on the third anniversary and one-third was vested on the fourth anniversary (see Note 14 and 23). On February 9, 2017, the Board of Directors (as of February 2020 Supervisory Board) granted 66,449 phantom stock units within the framework of an additional long term incentive plan. Each unit gives a conditional right to receive an amount of cash equal to the fair market value of one share of the company on the settlement date. The phantom stock units will mature one-third each year on the second, third and fourth anniversary of the award (seeaward. One-third was vested on the second anniversary and one-third was vested on the third anniversary(see Note 22)14 and 23). On February 9, 201716, 2018, the boardBoard of directorsDirectors (as of February 2020 Supervisory Board) granted 66,449154,432 phantom stock units within the framework of an additional long term incentive plan. Each unit gives a conditional right to receive an amount of cash equal to the fair
NOTES TO CONSOLIDATED FINANCIAL STATEMENTS 2017
Note 21 - Related parties continued
market value of one share of the company on the settlement date. The phantom stock units will mature
NOTES TO CONSOLIDATED FINANCIAL STATEMENTS 2020
Note 22 - Related parties (Continued)
one-third each year on the second, third and fourth anniversary of the awardaward. One-third was vested on the second anniversary (see Note 22)14 and 23). On January 8, 2019, the Board of Directors (as of February 2020 Supervisory Board) granted 1,200,000 phantom stock units within the framework of a transaction based incentive plan ("TBIP"). After the resignation of the former CEO, 400,000 phantom stock units were waived. The first tranche of 12% was vested in the first quarter of 2020. The contractual term of the TBIP offer is 5 years. A first tranche of 12% of the total number of phantom stock units vests on the date on which the Fair Market Value ("FMV") reaches USD 12 (decreased with the amount of dividend paid since grant, if any). A second tranche (16%) vests on the date the FMV reaches USD 14 (decreased with the amount of dividend paid since grant, if any), a third tranche (25%) vests on the date the FMV reaches USD 16 (decreased with the amount of dividend paid since grant, if any) and the final tranche (44%) vests on the date the FMV reaches USD 18 (decreased with the amount of dividend paid since grant, if any) (see Note 14 and 23). The TBIP defines FMV as the volume weighted average price of the shares on the New York Stock Exchange over the thirty (30) Business Days preceding such date. On April 1, 2019, the Board of Directors (as of February 2020 Supervisory Board) granted 152,346 restricted stock units within the framework of a long term incentive plan. The RSU’s vest over three years in 3 equal annual installments at the three anniversary dates from the reference date (April 1, 2019) and will be settled in shares. As of December 31, 2020, 12,696 RSU’s were vested, however vested RSU’s will not be delivered in shares until the first business day after April 1, 2022. On April 1, 2020, the Supervisory Board granted 144,392 restricted stock units within the framework of a long term incentive plan. The RSU’s vest over three years in 3 equal annual installments at the three anniversary dates from the reference date (April 1, 2020) and will be settled in shares. As of December 31, 2020, no RSU’s were vested.
Relationship with CMB
In 2004, Euronav split from Compagnie Maritime Belge (CMB). CMB renders some administrative and general services to Euronav. In 20172020 CMB invoiced a total amount of USD 34,928 (2016: USD 17,731$1,578 (2019: $1,336 and 2015: USD 0)2018: $1,151).
In 2019, Euronav started up a project to develop software with CMB Technology to monitor fuel consumption performance of the Euronav fleet. In 2019, CMB Technology invoiced a total amount of $167 thousand (150 thousand EUR) in relation to the software development project (2020: $0).
The Group purchased IMO 2020 compliant bunker fuel (low sulphur fuel oil) for future use by its vessels (Note 11). A ruling was granted to include this activity under the tonnage tax regime. This ruling also allows the execution of physical swaps. Discussions were started in 2019 to enter into such fuel swaps with the CMB Group. The swap agreement was extended to CMB NV, Bocimar International NV and Bocimar Hong Kong Ltd. In the course of 2020, a total of 51,000 metric tons of compliant bunker fuel oil was swapped between these parties.
Properties
The Group leases office space in Belgium from Reslea N.V., an entity jointly controlled by CMB and Exmar.CMB. Under this lease, the Group paid an annual rent of USD [179,079]$335,033 in 2017 (2016: USD 175,5722020 (2019: $290,858 and 2015: USD 178,104)2018: $185,326). This lease expires on August 31, 2021.
The Group leases office space, through our subsidiary Euronav Ship Management Hellas, in Piraeus, Greece, from Nea Dimitra Ktimatiki Kai Emporik S.A., an entity controlled by Ceres Shipping. Mr. Livanos, a former member of our board acting as permanent representative of TankLog until his resignation on December 3, 2015, is the Chairman and sole shareholder of Ceres Shipping. Under this lease, the Group paid an annual rent of USD 183,766 in 2017 (2016: USD 199,873 and 2015: USD 184,791). This lease expires on December 31, 2017.
The Group subleases office space in its London, United Kingdom office, through its subsidiary Euronav (UK) Agencies Limited, pursuant to sublease agreements, dated September 25, 2014, with GasLog Services UK Limited and Unisea Maritime Limited, both parties related to Peter Livanos. Under these subleases, the Company received in 2017 a rent of USD 416,995 (2016: USD 443,643 and 2015: USD 495,507). This sublease expires on April 27, 2023.
The Company also subleases office space in its London, United Kingdom office, through its subsidiary Euronav (UK) Agencies Limited, pursuant to a sublease agreement, dated 25 September 2014, with Tankers (UK) Agencies Limited, a 50-50 joint venture with International Seaways. Under this sublease, the Company received in 20172020 a rent of USD 218,894 (2016: USD 232,882$218,074 (2019: $216,750 and 2015: USD 260,108)2018: $227,089). This sublease expires on April 27, 2023.
Registration Rights
On January 28, 2015 the Group entered into a registration rights agreement with companies affiliated with our former Chairman, Peter Livanos, or the Ceres Shareholders, and companies affiliated with our former Vice Chairman, Marc Saverys, or the Saverco Shareholders.
Pursuant to the registration rights agreement, each of the Ceres Shareholders as a group and the Saverco Shareholders as a group will be able to piggyback on the others' demand registration. The Ceres Shareholders and the Saverco Shareholders are only treated as having made their request if the registration statement for such shareholder group's shares is declared effective. Once we are eligible to do so, commencing 12 calendar months after the Ordinary Shares have been registered under the Exchange Act, the Ceres Shareholders and the Saverco Shareholders may require us to file shelf registration statements permitting sales by them of ordinary shares into the market from time to time over an extended period. The Ceres Shareholders and the Saverco Shareholders can also exercise piggyback registration rights to participate in certain registrations of ordinary shares by us. All expenses relating to the registrations, including the participation of our executive management team in two marketed roadshows and a reasonable number of marketing calls in connection with one-day or overnight transactions, will be borne by us. The registration rights agreement also contains provisions relating to indemnification and contribution. There are no specified financial remedies for non-compliance with the registration rights agreement. At December 31, 2017, no rights were exercised by any of the parties under the registration rights agreement.
Transactions with subsidiaries and joint ventures
The Group has supplied funds in the form of shareholder's advances to some of its joint ventures at pre-agreed conditions which are always similar for the other party involved in the joint venture in question (see below and Note 25)26).
On 20 May, 2016,November 19, 2019, the Group announced that it had agreed with Bretta Tanker Holdings Inc. ("Bretta") to terminate its Suezmax joint ventures and to enterentered into a share swapjoint venture together with affiliates of Ridgebury Tankers and claims transfer agreement.clients of Tufton Oceanic. Each 50%-50% joint venture acquired one Suezmax vessel. The joint ventures covered four Suezmax vessels: the Captain Michael (2012 - 157,648 dwt), the Maria (2012 - 157,523 dwt), the Eugenie (2010 - 157,672 dwt)JVs, Bari Shipholding Ltd and the Devon (2011 - 157,642 dwt).Bastia Shipholding Ltd, entered into various agreements including a secured term loan for $36.7 million and revolving credit for $3.0 million with Euronav assumed full ownership of the two companies owning the two youngest vessels, the Captain MichaelHong Kong as lender, a commercial management service with Euronav NV and the Maria, and Bretta assumed full ownership of the two companies owning the Eugenie and the Devon (see Note 24).
a technical management service with Ridgebury.
NOTES TO CONSOLIDATED FINANCIAL STATEMENTS 20172020
Note 2122 - Related parties continued(Continued)
On September 15, 2020, the Suezmax Bastia was sold for USD 20.5 million. A capital gain on the sale of USD 0.4 million (Euronav's share) was recorded in the joint venture company. The vessel has been delivered to her new owners. Following this sale, the shareholders loan to Bastia Shipholding Ltd. was fully repaid.
Balances and transactions between the Group and its subsidiaries have been eliminated on consolidation and are not disclosed in this note. Details of outstanding balances and transactions between the Group and its joint ventures are disclosed below:
| | | | | | | | | | | | | | | | | | | | | | | | | | | | | | | | |
| As of end for the year ended December 31, 2019 | | | | | | |
| (in thousands of USD) | | Trade receivables | | Trade payables | | Shareholders Loan | | Turnover | | Dividend Income |
| TI Africa Ltd | | 227 | | | 0 | | | 23,215 | | | 390 | | | 0 | |
| TI Asia Ltd | | 90 | | | 0 | | | 0 | | | 390 | | | 12,600 | |
| | | | | | | | | | |
| | | | | | | | | | |
| | | | | | | | | | |
| | | | | | | | | | |
| | | | | | | | | | |
| | | | | | | | | | |
| Bari Shipholding Ltd | | 265 | | | 211 | | | 18,390 | | | 13 | | | 0 | |
| Bastia Shipholding Ltd | | 301 | | | 96 | | | 18,773 | | | 25 | | | 0 | |
| Tankers Agencies (UK) Ltd | | 0 | | | 132 | | | 0 | | | 0 | | | 0 | |
| | | | | | | | | | |
| Total | | 883 | | | 439 | | | 60,379 | | | 818 | | | 12,600 | |
| | | | | | | | | | |
| As of end for the year ended December 31, 2020 | | | | | | |
| (in thousands of USD) | | Trade receivables | | Trade payables | | Shareholders Loan | | Turnover | | Dividend Income |
| | | | | | | | | | |
| TI Africa Ltd | | 440 | | | 0 | | | 16,665 | | | 398 | | | 0 | |
| TI Asia Ltd | | 472 | | | 0 | | | 0 | | | 398 | | | 5,550 | |
| Bari Shipholding Ltd | | 283 | | | 52 | | | 19,271 | | | 342 | | | 0 | |
| Bastia Shipholding Ltd | | 17 | | | 1 | | | 0 | | | 326 | | | 1,590 | |
| | | | | | | | | | |
| | | | | | | | | | |
| | | | | | | | | | |
| | | | | | | | | | |
| | | | | | | | | | |
| | | | | | | | | | |
| Tankers Agencies (UK) Ltd | | 19 | | | 135 | | | 0 | | | 0 | | | 0 | |
| | | | | | | | | | |
| Total | | 1,231 | | | 188 | | | 35,936 | | | 1,464 | | | 7,534 | |
|
| | | | | | | | | | | | | | | |
| As of end for the year ended December 31, 2016 | | | | | | | | | | |
| (in thousands of USD) | | Trade receivables |
| | Trade payables |
| | Shareholders Loan |
| | Turnover |
| | Dividend Income |
|
| TI Africa Ltd | | 241 |
| | — |
| | 137,615 |
| | 360 |
| | — |
|
| TI Asia Ltd | | 303 |
| | — |
| | 65,897 |
| | 360 |
| | — |
|
| Fiorano Shipholding Ltd | | — |
| | — |
| | — |
| | 265 |
| | — |
|
| Fontvieille Shipholding Ltd | | — |
| | — |
| | — |
| | 249 |
| | — |
|
| Larvotto Shipholding Ltd | | — |
| | — |
| | — |
| | 275 |
| | — |
|
| Moneghetti Shipholding Ltd | | — |
| | — |
| | — |
| | 287 |
| | — |
|
| Great Hope Enterprises Ltd | | — |
| | — |
| | — |
| | | | 28 |
|
| Kingswood Co. Ltd | | — |
| | — |
| | — |
| | | | 23,450 |
|
| Total | | 544 |
| | — |
| | 203,512 |
| | 1,796 |
| | 23,478 |
|
| | | | | | | | | | | |
| As of end for the year ended December 31, 2017 | | | | | | |
| (in thousands of USD) | | Trade receivables |
| | Trade payables |
| | Shareholders Loan |
| | Turnover |
| | Dividend Income |
|
| | | | | | | | | | | |
| TI Africa Ltd | | 30 |
| | 50 |
| | 100,115 |
| | 372 |
| | — |
|
| TI Asia Ltd | | 130 |
| | — |
| | 62,647 |
| | 372 |
| | — |
|
| Kingswood Co. Ltd | | — |
| | — |
| | — |
| | — |
| | 1,250 |
|
| Tankers Agencies (UK) Ltd | | 134 |
| | 137 |
| | — |
| | — |
| | — |
|
| Total | | 294 |
| | 187 |
| | 162,762 |
| | 744 |
| | 1,250 |
|
Guarantees
The Group provided guarantees to financial institutions that provided credit facilities to joint ventures of the Group. As of December 31, 2016,2020, the total amount outstanding under these credit facilities was USD 75.3$90.4 million (2019: $139.2 million), of which the Group guaranteed USD 37.7 million. As of December 31, 2017, these credit facilities and the related guarantees had expired$45.2 million (2019: $69.6 million) (see Note 25)26).
NOTES TO CONSOLIDATED FINANCIAL STATEMENTS 20172020
Note 2223 - Share-based payment arrangements
Description of share-based payment arrangements:
At December 31, 2017,2020, the Group had the following share-based payment arrangements:
Share option programs (Equity-settled)
On December 16, 2013, the Group established a share option program that entitles key management personnel to purchase existing shares in the Company. Under the program, holders of vested options are entitled to purchase shares at the market price of the shares at the grant date. Currently this program is limited to key management personnel.
The Group intends to use its treasury shares to settle its obligations under this program. The key terms and conditions related to the grants under these programs are as follows:
|
| | | | | | |
Grant date/employees entitled | | Number of instruments | | Vesting Conditions | | Contractual life of Options |
Options granted to key management personnel | | | | | | |
December 16, 2013 ("Tranche 1") | | 583,000 | | Share price to be at least EUR 7.5 | | 5 years |
December 16, 2013 ("Tranche 2") | | 583,000 | | Share price to be at least EUR 8.66 | | 5 years |
December 16, 2013 ("Tranche 3") | | 583,000 | | Share price to be at least EUR 11.54 and US listing | | 5 years |
Total Share options | | 1,750,000 | | | | |
In addition, 50% of the options can only be exercised at the earliest if the shares of the Group are admitted for listing in a recognized US listing exchange platform (the "listing event"). The other 50% can only be exercised 1 year after the listing event. If the Group's shares had not been listed on a US listing exchange, then only 2/3 of the shares would be exercisable and would have to meet the first 2 vesting conditions listed above.
Long term incentive plan 2015 (Equity-settled)
The Group's Board of Directors implemented in 2015 a long term incentive plan ('LTIP') for key management personnel. Under the terms of this LTIP, the beneficiaries will obtain 40% of their respective LTIP in the form of Euronav stock options, with vesting over three years at anniversary date and 60% in the form of restricted stock units ('RSU's'), which will be paid out in cash, with cliff vesting on the third anniversary. In total 236,590 options and 65,433 RSU's were granted on February 12, 2015. Vested stock options may be exercised until 13 years after the grant date. The stock options have an exercise price of €10.0475 and are equity-settled. As of December 31, 2020, all the stock options remained outstanding but all RSU's were exercised in 2018. The total employee benefit expense recognized in the consolidated statement of profit or loss during 2020 with respect to the LTIP 2015 was $0 thousand (2019: $0 thousand and 2018: expense of $37 thousand).
Long term incentive plan 2016 (Cash-settled)
The Group's Board of Directors implemented in 2016 an additional long term incentive plan for key management personnel. Under the terms of this LTIP, the beneficiaries will obtain their respective LTIP in cash, based on the volume weighted average price of the shares on Euronext Brussels over the 3 last business days of the relevant vesting period. The phantom stock units will mature one-third each year on the second, third and fourth anniversary of the award. In total a number of 54,616 phantom stocks were granted on February 2, 2016.2016 and one-third was vested on the second anniversary, one-third on the third anniversary and one-third on the fourth anniversary. Following the resignation of our former CEO Paddy Rodgers, his phantom stocks were waived. As of December 31, 2020, 0 phantom stocks were outstanding. The LTIP 2016 qualifies as a cash-settled share-based payment transaction. The Company recognizes a liability in respect of its obligations under the LTIP 2016, measured based on the Company’s share price at the reporting date, and taking into account the extent to which the services have been rendered to date. The compensation income recognized in the consolidated statement of profit or loss during 2020 was $0.3 million (2019: income of $0.1 million and 2018: income of $0.2 million).
Long term incentive plan 2017 (Cash-settled)
The Group's Board of Directors implemented in 2017 an additional long term incentive plan for key management personnel. Under the terms of this LTIP, the beneficiaries will obtain their respective LTIP in cash, based on the volume weighted average price of the shares on Euronext Brussels over the 3 last business days of the relevant vesting period. The phantom stock units will mature one-third each year on the second, third and fourth anniversary of the award. In total a number of 66,449 phantom stock units were granted on February 9, 2017.2017 and one-third was vested on the second anniversary and one-third on the third anniversary. Following the resignation of our former CEO Paddy Rodgers, his phantom stocks were waived. As of December 31, 2020, 16,210 phantom stocks were outstanding. The LTIP 2017 qualifies as a cash-settled share-based payment transaction. The Company recognizes a liability in respect of its obligations under the LTIP 2017, measured based on the Company’s share price at the reporting date, and taking into account the extent to which the services have been rendered to date. The compensation income recognized in the consolidated statement of profit or loss during 2020 was $0.3 million (2019: expense of $22,000 and 2018: expense of $0.2 million).
Long term incentive plan 2018 (Cash-settled)
The Group's Board of Directors implemented in 2018 an additional long term incentive plan for key management personnel. Under the terms of this LTIP, the beneficiaries will obtain their respective LTIP in cash, based on the volume weighted average price of the shares on Euronext Brussels over the 3 last business days of the relevant vesting period. The phantom stock units will mature one-third each year on the second, third and fourth anniversary of the award. In total a number of 154,432 phantom stock units were granted on February 16, 2018 and one-third was vested on the second anniversary. Following the resignation of our former CEO Paddy Rodgers, his phantom stocks were waived. As of December 31, 2020, 71,854 phantom stocks were outstanding. The LTIP 2018 qualifies as a cash-settled share-based payment transaction. The Company recognizes a liability in respect of its obligations under the LTIP 2018, measured based on the Company’s share price at the reporting date, and taking into account the extent to which the services have been rendered to date. The compensation income recognized in the consolidated statement of profit or loss during 2020 was $0.4 million (2019: expense of $0.7 million and 2018: expense of $0.5 million).
Transaction Based Incentive Plan 2019 (Cash-settled)
NOTES TO CONSOLIDATED FINANCIAL STATEMENTS 2020
Note 23 - Share-based payment arrangements (Continued)
The Group’s Supervisory Board has implemented in 2019 a transaction-based incentive plan ("TBIP") for key management personnel. Under the terms of this TBIP, key management personnel is eligible to receive phantom stock unit grants. Each phantom stock unit grants the holder a conditional right to receive an amount of cash equal to the Fair Market Value ("FMV") of one share of the Company multiplied by the number of phantom stock units that have vested prior to the settlement date. The TBIP defines FMV as the volume weighted average price of the shares on the New York Stock Exchange over the thirty (30) Business Days preceding such date. The vesting and settlement of the TBIP is spread over a time frame of five years. The phantom stock awarded matures in 4 tranches: the first tranche of 12% vesting when the FMV reaches $12 (decreased with the amount of dividend paid since grant, if any), the second tranche of 19% vesting when the FMV reaches $14 (decreased with the amount of dividend paid since grant, if any), the third tranche of 25% vesting when the FMV reaches $16 (decreased with the amount of dividend paid since grant, if any) and the fourth tranche of 44% vesting when the FMV reaches $18 (decreased with the amount of dividend paid since grant, if any). In total a number of 1,200,000 phantom stock units were granted on January 8, 2019 and the first tranche of 12% was vested in the first quarter of 2020. Following the resignation of our former CEO Paddy Rodgers, his phantom stocks were waived. As of December 31, 2020, 704,000 phantom stocks were outstanding. The TBIP 2019 qualifies as a cash-settled share-based payment transaction as the Company receives services from the participants and incur an obligation to settle the transaction in cash. The Company recognizes a liability at fair value in respect of its obligations under the TBIP 2019. The fair value of the plan is being determined using a binominal model with cost being spread of the expected vesting period over the various tranches. The compensation income recognized in the consolidated statement of profit or loss during 2020 was $0.4 million (2019: expense of $1.8 million).
Long term incentive plan 2019 (Equity-settled)
The Group’s Supervisory Board has implemented in 2019 an additional long term incentive plan (‘LTIP’) for key management personnel. Under the terms of this LTIP, key management personnel will obtain 100% of their respective LTIP in the form of Euronav restricted stock units (‘RSU’s’). The RSU’s vest over three years in 3 equal annual installments at the three anniversary dates from the reference date (April 1, 2019) and will be settled in shares. In total 152,346 RSU’s were granted on April 1, 2019. As of December 31, 2020, 12,696 RSU’s were vested, however vested RSU’s will not be delivered in shares until the first business day after April 1, 2022. The compensation expense recognized in the consolidated statement of profit or loss during 2020 was $0.1 million.
Long term incentive plan 2020 (Equity-settled)
The Group’s Supervisory Board has implemented in 2020 an additional long term incentive plan (‘LTIP’) for key management personnel. Under the terms of this LTIP, key management personnel will obtain 100% of their respective LTIP in the form of Euronav restricted stock units (‘RSU’s’). The RSU’s vest over three years in 3 equal annual installments at the three anniversary dates from the reference date (April 1, 2020) and will be settled in shares. In total 144,392 RSU’s were granted on April 1, 2020.
Measurement of Fair Value
The fair value of the employee share options under the 2013 program and the 2015 LTIP has been measured using the Black-Scholes formula. Service and non-market performance conditions attached to the transactions were not taken into account in measuring fair value.
NOTES TO CONSOLIDATED FINANCIAL STATEMENTS 2017
Note 22 - Share-based payment arrangements (Continued)
The inputs used in measurement of the fair values at grant date for the equity-settled share option programs were as follows:
| | | | | Share option program 2013 | | LTIP 2015 | | | | LTIP 2015 |
| (figures in EUR) | | Tranche 1 | | Tranche 2 | | Tranche 3 | | Tranche 1 | | Tranche 2 | | Tranche 3 | (figures in EUR) | | | Tranche 1 | | Tranche 2 | | Tranche 3 |
| Fair value at grant date | | 2.270 |
| | 2.260 |
| | 2.120 |
| | 1.853 |
| | 1.853 |
| | 1.853 |
| Fair value at grant date | | | 1.853 | | | 1.853 | | | 1.853 | |
| Share price at grant date | | 6.070 |
| | 6.070 |
| | 6.070 |
| | 10.050 |
| | 10.050 |
| | 10.050 |
| Share price at grant date | | | 10.050 | | | 10.050 | | | 10.050 | |
| Exercise price | | 5.770 |
| | 5.770 |
| | 5.770 |
| | 10.0475 |
| | 10.0475 |
| | 10.0475 |
| Exercise price | | | 10.0475 | | | 10.0475 | | | 10.0475 | |
| Expected volatility (weighted average) | | 40 | % | | 40 | % | | 40 | % | | 39.63 | % | | 39.63 | % | | 39.63 | % | Expected volatility (weighted average) | | | 39.63 | % | | 39.63 | % | | 39.63 | % |
| Expected life (Days) (weighted average) | | 303 |
| | 467 |
| | 730 |
| | 365 |
| | 730 |
| | 1,095 |
| |
| Expected life (days) (weighted average) | | Expected life (days) (weighted average) | | | 365 | | | 730 | | | 1,095 | |
| Expected dividends | | — |
| | — |
| | — |
| | 8 | % | | 8 | % | | 8 | % | Expected dividends | | | 8 | % | | 8 | % | | 8 | % |
| Risk-free interest rate | | 1 | % | | 1 | % | | 1 | % | | 0.66 | % | | 0.66 | % | | 0.66 | % | Risk-free interest rate | | | 0.66 | % | | 0.66 | % | | 0.66 | % |
Expected volatility has been based on an evaluation of the historical volatility of the Company's share price, particularly over the historical periods commensurate with the expected term. The expected term of the instruments has been based on historical experience and general option holder behavior using a Monte Carlo simulation.
The fair value of the RSUs under the 2015 LTIP was measured with reference to the Euronav share price at the grant date. All of the RSUs granted on February 12, 2015 remained outstanding as of December 31, 2017 and had not yet vested.
NOTES TO CONSOLIDATED FINANCIAL STATEMENTS 2020
Note 23 - Share-based payment arrangements (Continued)
The liability in respect of its obligations under the LTIP 2016, LTIP 2017 and LTIP 20172018 is measured based on the Company'sCompany’s share price at the reporting date and taking into account the extent to which the services have been rendered to date. AllOne-third of the phantom stocks granted on February 2, 2016 was vested on the second anniversary, one-third on the third anniversary and one-third on the fourth anniversary. As of December 31, 2020, 0 phantom stocks remained outstanding. One-third of the phantom stocks granted on February 9, 2017 respectively,was vested on the second anniversary and one-third on the third anniversary, 16,210 phantom stocks remained outstanding as of December 31, 2017.2020. One-third of the phantom stocks granted on February 16, 2018 was vested on the second anniversary, 71,854 phantom stocks remained outstanding as of December 31, 2020. The Company'sCompany’s share price was EUR 10.613 at the grant date of the LTIP 2016, and EUR 7.268 at the grant date of the LTIP 2017 and EUR 7.237 at the grant date of the LTIP 2018, and was EUR 7.6846.60 as at December 31, 2017.2020.
The Company recognizes a liability at fair value in respect of its obligations under the TBIP 2019. The fair value of the plan is being determined using a binominal model with cost being spread of the expected vesting period over the various tranches. The vesting and settlement of the TBIP is spread over a timeframe of five years. The phantom stock awarded matures in four tranches: the first tranche of 12% vesting when the Fair Market Value ("FMV") reaches USD 12 (decreased with the amount of dividend paid since grant, if any), the second tranche of 19% vesting when the FMV reaches USD 14 (decreased with the amount of dividend paid since grant, if any), the third tranche of 25% vesting when the FMV reaches USD 16 (decreased with the amount of dividend paid since grant, if any) and the fourth tranche of 44% vesting when the FMV reaches USD 18 (decreased with the amount of dividend paid since grant, if any). The TBIP defines FMV as the volume weighted average price of the shares on the New York Stock Exchange over the thirty (30) Business Days preceding such date. In total a number of 1,200,000 phantom stock units were granted on January 8, 2019 and the first tranche of 12% was vested in the first quarter of 2020. Following the resignation of our former CEO Paddy Rodgers, his phantom stocks were waived. As of December 31, 2020, 704,000 phantom stocks were outstanding.
The inputs used in measurement of the fair value at grant date for the TBIP was as follows:
| | | | | | | | | | | | | | | | | | | | | | | | | | | | | |
| | | | | | | TBIP |
| | | | | | | Tranche 1 | | Tranche 2 | | Tranche 3 | | Tranche 4 |
| Risk-free interest rate | | | | | | | 1.69 | % | | 1.69 | % | | 1.69 | % | | 1.69 | % |
| Annual volatility | | | | | | | 33.43 | % | | 33.43 | % | | 33.43 | % | | 33.43 | % |
| Expected vesting period (years) | | | | | | | 3.05 | | 3.38 | | 3.69 | | 3.98 |
The liability in respect of its obligations under the LTIP 2019 is subject for 75% to a relative TSR (Total Shareholder Return) compared to a peer group over a three years period. Each yearly measurement to be worth 1/3rd of 75% of the award. And subject for 25% to an absolute TSR of the Company’s Shares measured each year for 1/3 of 25% of the award. In total 152,346 RSU’s were granted on April 1, 2019. As of December 31, 2020, 12,696 RSU’s were vested, however vested RSU’s will not be delivered in shares until the first business day after April 1, 2022.
Expenses recognized in profit or loss
For details on related employee benefits expense, see Note 5.5 and Note 17. The expenses related to the LTIP 2016, LTIP 2017, LTIP 2018, TBIP 2019 and LTIP 2017 (USD 0.72019 (2020: income of $1.2 million, 2019: expense of -$2.5 million and 2018: expense of -0.5 million) are included in the Provision for employee benefits.
NOTES TO CONSOLIDATED FINANCIAL STATEMENTS 2020
Note 23 - Share-based payment arrangements (Continued)
Reconciliation of outstanding share options
The number and weighted-average exercise prices of options under the 2013 share option program and the 2015 LTIP are as follows:
| | | | | | | | | | | | | | | | | | | | | | | | | | |
| (figures in EUR) | | Number of options 2020 | | Weighted average exercise price 2020 | | Number of options 2019 | | Weighted average exercise price 2019 |
| Outstanding at January 1 | | 236,590 | | | 7.732 | | | 236,590 | | | 7,732.000 | |
| Forfeited during the year | | 0 | | | 0 | | | 0 | | | 0 | |
| Exercised during the year | | 0 | | | 0 | | | 0 | | | 0 | |
| Granted during the year | | 0 | | | 0 | | | 0 | | | 0 | |
| Outstanding at December 31 | | 236,590 | | | 7.732 | | | 236,590 | | | 7.732 | |
| Vested at December 31 | | 236,590 | | | 0 | | | 236,590 | | | 0 | |
|
| | | | | | | | | | | | |
| (figures in EUR) | | Number of options 2017 | | Weighted average exercise price 2017 | | Number of options 2016 | | Weighted average exercise price 2016 |
| Outstanding at January 1 | | 586,590 |
| | 7.495 |
| | 703,257 |
| | 7.209 |
|
| Forfeited during the year | | 0 |
| | 0 |
| | 0 |
| | 0 |
|
| Exercised during the year | | — |
| | — |
| | (116,667 | ) | | 5.770 |
|
| Granted during the year | | 0 |
| | 0 |
| | — |
| | — |
|
| Outstanding at December 31 | | 586,590 |
| | 7.495 |
| | 586,590 |
| | 7.495 |
|
| Vested at December 31 | | 507,726 |
| | 0 |
| | 428,863 |
| | 0 |
|
In 2016 the Company bought back 692,415 shares and delivered 116,667 shares upon the exercise of share options under the 2013 program. In 2017 Euronav did not buy back or dispose of any own shares.
The weighted-average share price at the date of exercise for the share options exercised in 2016 was EUR 8.99.
NOTES TO CONSOLIDATED FINANCIAL STATEMENTS 2017
2020
Note 2324 - Group entities
|
| | | | | | | | | | | | | |
| | | Country of incorporation | | Consolidation method | | Ownership interest |
| | | | | | | December 31, 2017 |
| | December 31, 2016 |
| | December 31, 2015 |
|
| Parent | | | | | | | | | | |
| Euronav NV | | Belgium | | full | | 100.00 | % | | 100.00 | % | | 100.00 | % |
| | | | | | | | | | | |
| Subsidiaries | | | | | | | | | | |
| Euronav Tankers NV | | Belgium | | full | | 100.00 | % | | 100.00 | % | | 100.00 | % |
| Euronav Shipping NV | | Belgium | | full | | 100.00 | % | | 100.00 | % | | 100.00 | % |
| Euronav (UK) Agencies Limited | | UK | | full | | 100.00 | % | | 100.00 | % | | 100.00 | % |
| Euronav Luxembourg SA | | Luxembourg | | full | | 100.00 | % | | 100.00 | % | | 100.00 | % |
| Euronav sas | | France | | full | | 100.00 | % | | 100.00 | % | | 100.00 | % |
| Euronav Ship Management sas | | France | | full | | 100.00 | % | | 100.00 | % | | 100.00 | % |
| Euronav Ship Management Ltd | | Liberia | | full | | 100.00 | % | | 100.00 | % | | 100.00 | % |
| Euronav Ship Management Hellas (branch office) | | | | | | | | | | |
| Euronav Hong Kong | | Hong Kong | | full | | 100.00 | % | | 100.00 | % | | 100.00 | % |
| Euro-Ocean Ship Management (Cyprus) Ltd | | Cyprus | | full | | 100.00 | % | | 100.00 | % | | 100.00 | % |
| Euronav Singapore | | Singapore | | full | | 100.00 | % | | 100.00 | % | | 100.00 | % |
| Fiorano Shipholding Ltd | | Hong Kong | | full | | 100.00 | % | | 100.00 | % | | NA |
|
| Larvotto Shipholding Ltd | | Hong Kong | | full | | 100.00 | % | | 100.00 | % | | NA |
|
| Euronav MI Inc | | Marshall Islands | | full | | 100.00 | % | | NA |
| | NA |
|
| | | | | | | | | | | |
| Joint ventures | | | | | | | | | | |
| Fiorano Shipholding Ltd | | Hong Kong | | equity | | NA |
| | NA |
| | 50.00 | % |
| Fontvieille Shipholding Ltd | | Hong Kong | | equity | | NA |
| | NA |
| | 50.00 | % |
| Great Hope Enterprises Ltd | | Hong Kong | | equity | | NA |
| | NA |
| | 50.00 | % |
| Kingswood Co. Ltd | | Marshall Islands | | equity | | 50.00 | % | | 50.00 | % | | 50.00 | % |
| Larvotto Shipholding Ltd | | Hong Kong | | equity | | NA |
| | NA |
| | 50.00 | % |
| Moneghetti Shipholding Ltd | | Hong Kong | | equity | | NA |
| | NA |
| | 50.00 | % |
| TI Africa Ltd | | Hong Kong | | equity | | 50.00 | % | | 50.00 | % | | 50.00 | % |
| TI Asia Ltd | | Hong Kong | | equity | | 50.00 | % | | 50.00 | % | | 50.00 | % |
| Tankers Agencies (UK) Ltd | | UK | | equity | | 50.00 | % | | NA |
| | NA |
|
| Tankers International LLC | | Marshall Islands | | equity | | 50.00 | % | | NA |
| | NA |
|
| | | | | | | | | | | |
| Associates | | | | | | | | | | |
| Tankers International LLC | | Marshall Islands | | equity | | NA |
| | 40.00 | % | | 40.00 | % |
In 2015 two joint ventures, Asia Conversion Corporation and Africa Conversion Corporation, were dissolved.
In 2016, the Group transferred its equity interests in Moneghetti Shipholding Ltd. and Fontvieille Shipholding Ltd. and acquired Bretta Tanker Holdings' equity interests in Fiorano Shipholding Ltd. and Larvotto Shipholding Ltd. As a result, the Group's equity interest in Fiorano Shipholding Ltd. and Larvotto Shipholding Ltd. increased from 50% to 100% (see Note 24). In 2016 one joint venture, Great Hope Enterprises Ltd was dissolved.
In the fourth quarter of 2017, Euronav NV incorporated a new subsidiary, Euronav MI Inc (see Note 26).
In 2017, the corporate structure of Tankers International pool (“TI Pool”) was rationalized. Under the new structure, the shares of Tankers UK Agencies (“TUKA”), fully held at the time by Tankers International LLC (“TI LLC”), an entity incorporated under the laws of the Marshall Islands, have been distributed to the two remaining founding members of the TI Pool (namely Euronav NV and International Seaways INC), to form a 50-50 joint venture.
| | | | | | | | | | | | | | | | | | | | | | | | | | | | | | | | |
| | | Country of incorporation | | Consolidation method | | Ownership interest |
| | | | | | December 31, 2020 | | December 31, 2019 | | December 31, 2018 |
| Parent | | | | | | | | | | |
| Euronav NV | | Belgium | | full | | 100.00 | % | | 100.00 | % | | 100.00 | % |
| Euronav NV, Antwerp, Geneva (branch office) | | | | | | | | | | |
| Euronav NV, London (branch office) | | | | | | | | | | |
| | | | | | | | | | |
| Subsidiaries | | | | | | | | | | |
| Euronav Tankers NV | | Belgium | | full | | 100.00 | % | | 100.00 | % | | 100.00 | % |
| Euronav Shipping NV | | Belgium | | full | | 100.00 | % | | 100.00 | % | | 100.00 | % |
| Euronav (UK) Agencies Limited | | UK | | full | | 100.00 | % | | 100.00 | % | | 100.00 | % |
| Euronav Luxembourg SA | | Luxembourg | | full | | 100.00 | % | | 100.00 | % | | 100.00 | % |
| Euronav sas | | France | | full | | 100.00 | % | | 100.00 | % | | 100.00 | % |
| Euronav Ship Management sas | | France | | full | | 100.00 | % | | 100.00 | % | | 100.00 | % |
| Euronav Ship Management Antwerp (branch office) | | | | | | | | | | |
| Euronav Ship Management Ltd | | Liberia | | full | | 100.00 | % | | 100.00 | % | | 100.00 | % |
| Euronav Ship Management Hellas (branch office) | | | | | | | | | | |
| Euronav Hong Kong | | Hong Kong | | full | | 100.00 | % | | 100.00 | % | | 100.00 | % |
| Euro-Ocean Ship Management (Cyprus) Ltd | | Cyprus | | full | | 100.00 | % | | 100.00 | % | | 100.00 | % |
| Euronav Singapore | | Singapore | | full | | 100.00 | % | | 100.00 | % | | 100.00 | % |
| Fiorano Shipholding Ltd | | Hong Kong | | full | | NA | | NA | | NA |
| Larvotto Shipholding Ltd | | Hong Kong | | full | | NA | | NA | | NA |
| Euronav MI II Inc | | Marshall Islands | | full | | 100.00 | % | | 100.00 | % | | 100.00 | % |
| Gener8 Maritime Subsidiary II Inc. | | Marshall Islands | | full | | 100.00 | % | | 100.00 | % | | 100.00 | % |
| Gener8 Maritime Subsidiary New IV Inc. | | Marshall Islands | | full | | 100.00 | % | | 100.00 | % | | 100.00 | % |
| Gener8 Maritime Management LLC | | Marshall Islands | | full | | 100.00 | % | | 100.00 | % | | 100.00 | % |
| Gener8 Maritime Subsidiary V Inc. | | Marshall Islands | | full | | NA | | 100.00 | % | | 100.00 | % |
| Gener8 Maritime Subsidiary VIII Inc. | | Marshall Islands | | full | | NA | | 100.00 | % | | 100.00 | % |
| Gener8 Maritime Subsidiary Inc. | | Marshall Islands | | full | | NA | | 100.00 | % | | 100.00 | % |
| GMR Zeus LLC | | Marshall Islands | | full | | NA | | 100.00 | % | | 100.00 | % |
| GMR Atlas LLC | | Marshall Islands | | full | | NA | | 100.00 | % | | 100.00 | % |
| GMR Hercules LLC | | Marshall Islands | | full | | NA | | 100.00 | % | | 100.00 | % |
| GMR Ulysses LLC | | Marshall Islands | | full | | NA | | 100.00 | % | | 100.00 | % |
| GMR Posseidon LLC | | Marshall Islands | | full | | NA | | 100.00 | % | | 100.00 | % |
| Victory Ltd. | | Bermuda | | full | | NA | | NA | | 100.00 | % |
| Vision Ltd. | | Marshall Islands | | full | | NA | | NA | | 100.00 | % |
| GMR Spartiate LLC | | Marshall Islands | | full | | NA | | 100.00 | % | | 100.00 | % |
| GMR Maniate LLC | | Marshall Islands | | full | | NA | | 100.00 | % | | 100.00 | % |
| GMR St Nikolas LLC | | Marshall Islands | | full | | NA | | 100.00 | % | | 100.00 | % |
| GMR George T LLC | | Marshall Islands | | full | | NA | | 100.00 | % | | 100.00 | % |
| GMR Kara G LLC | | Liberia | | full | | NA | | 100.00 | % | | 100.00 | % |
| GMR Harriet G LLC | | Liberia | | full | | NA | | 100.00 | % | | 100.00 | % |
| GMR Orion LLC | | Marshall Islands | | full | | NA | | 100.00 | % | | 100.00 | % |
| GMR Argus LLC | | Marshall Islands | | full | | NA | | 100.00 | % | | 100.00 | % |
| GMR Spyridon LLC | | Marshall Islands | | full | | NA | | NA | | 100.00 | % |
NOTES TO CONSOLIDATED FINANCIAL STATEMENTS 20172020
Note 2324 - Group entities (Continued)
| | | | | | | | | | | | | | | | | | | | | | | | | | | | | | | | |
| GMR Horn LLC | | Marshall Islands | | full | | NA | | 100.00 | % | | 100.00 | % |
| GMR Phoenix LLC | | Marshall Islands | | full | | NA | | 100.00 | % | | 100.00 | % |
| GMR Strength LLC | | Liberia | | full | | NA | | NA | | 100.00 | % |
| GMR Daphne LLC | | Marshall Islands | | full | | NA | | NA | | 100.00 | % |
| GMR Defiance LLC | | Liberia | | full | | NA | | 100.00 | % | | 100.00 | % |
| GMR Elektra LLC | | Marshall Islands | | full | | NA | | NA | | 100.00 | % |
| Companion Ltd. | | Bermuda | | full | | NA | | 100.00 | % | | 100.00 | % |
| Compatriot Ltd. | | Bermuda | | full | | NA | | 100.00 | % | | 100.00 | % |
| Consul Ltd. | | Bermuda | | full | | NA | | NA | | 100.00 | % |
| GMR Agamemnon LLC | | Liberia | | full | | NA | | NA | | 100.00 | % |
| Gener8 Neptune LLC | | Marshall Islands | | full | | NA | | 100.00 | % | | 100.00 | % |
| Gener8 Athena LLC | | Marshall Islands | | full | | NA | | 100.00 | % | | 100.00 | % |
| Gener8 Apollo LLC | | Marshall Islands | | full | | NA | | 100.00 | % | | 100.00 | % |
| Gener8 Ares LLC | | Marshall Islands | | full | | NA | | 100.00 | % | | 100.00 | % |
| Gener8 Hera LLC | | Marshall Islands | | full | | NA | | 100.00 | % | | 100.00 | % |
| Gener8 Constantine LLC | | Marshall Islands | | full | | NA | | 100.00 | % | | 100.00 | % |
| Gener8 Oceanus LLC | | Marshall Islands | | full | | NA | | 100.00 | % | | 100.00 | % |
| Gener8 Nestor LLC | | Marshall Islands | | full | | NA | | 100.00 | % | | 100.00 | % |
| Gener8 Nautilus LLC | | Marshall Islands | | full | | NA | | 100.00 | % | | 100.00 | % |
| Gener8 Macedon LLC | | Marshall Islands | | full | | NA | | 100.00 | % | | 100.00 | % |
| Gener8 Noble LLC | | Marshall Islands | | full | | NA | | 100.00 | % | | 100.00 | % |
| Gener8 Ethos LLC | | Marshall Islands | | full | | NA | | 100.00 | % | | 100.00 | % |
| Gener8 Perseus LLC | | Marshall Islands | | full | | NA | | 100.00 | % | | 100.00 | % |
| Gener8 Theseus LLC | | Marshall Islands | | full | | NA | | 100.00 | % | | 100.00 | % |
| Gener8 Hector LLC | | Marshall Islands | | full | | NA | | 100.00 | % | | 100.00 | % |
| Gener8 Strength Inc. | | Marshall Islands | | full | | NA | | NA | | 100.00 | % |
| Gener8 Supreme Inc. | | Marshall Islands | | full | | NA | | NA | | 100.00 | % |
| Gener8 Andriotis Inc. | | Marshall Islands | | full | | NA | | NA | | 100.00 | % |
| Gener8 Militiades Inc. | | Marshall Islands | | full | | NA | | NA | | 100.00 | % |
| Gener8 Success Inc. | | Marshall Islands | | full | | NA | | NA | | 100.00 | % |
| Gener8 Chiotis Inc. | | Marshall Islands | | full | | NA | | NA | | 100.00 | % |
| Gener8 Tankers 1 Inc. | | Marshall Islands | | full | | NA | | NA | | 100.00 | % |
| Gener8 Tankers 2 Inc. | | Marshall Islands | | full | | NA | | NA | | 100.00 | % |
| Gener8 Tankers 3 Inc. | | Marshall Islands | | full | | NA | | NA | | 100.00 | % |
| Gener8 Tankers 4 Inc. | | Marshall Islands | | full | | NA | | NA | | 100.00 | % |
| Gener8 Tankers 5 Inc. | | Marshall Islands | | full | | NA | | NA | | 100.00 | % |
| Gener8 Tankers 6 Inc. | | Marshall Islands | | full | | NA | | NA | | 100.00 | % |
| Gener8 Tankers 7 Inc. | | Marshall Islands | | full | | NA | | NA | | 100.00 | % |
| Gener8 Tankers 8 Inc. | | Marshall Islands | | full | | NA | | NA | | 100.00 | % |
| | | | | | | | | | |
| Joint ventures | | | | | | | | | | |
| Kingswood Co. Ltd | | Marshall Islands | | equity | | NA | | 50.00 | % | | 50.00 | % |
| TI Africa Ltd | | Hong Kong | | equity | | 50.00 | % | | 50.00 | % | | 50.00 | % |
| TI Asia Ltd | | Hong Kong | | equity | | 50.00 | % | | 50.00 | % | | 50.00 | % |
| Tankers Agencies (UK) Ltd | | UK | | equity | | 50.00 | % | | 50.00 | % | | 50.00 | % |
| Tankers International LLC | | Marshall Islands | | equity | | 50.00 | % | | 50.00 | % | | 50.00 | % |
| Bari Shipholding Ltd | | Hong Kong | | equity | | 50.00 | % | | 50.00 | % | | NA |
| Bastia Shipholding Ltd | | Hong Kong | | equity | | 50.00 | % | | 50.00 | % | | NA |
Further, following the withdrawal in December 2017 of one of its members, TI LLC, which was previously an associate of the Group, became a joint venture of the Group as from that time.
Additionally, a new company, Tankers International Ltd. ("TIL"), was incorporated under the laws of the United Kingdom, and is fully owned by TUKA. TIL became the disponent owner of all of the vessels in the TI Pool as all the vessels are now time chartered to TIL at a floating rate equivalent to the average spot rate achieved by the pool times the pool points assigned to each vessel.
This new structure allowed the TI Pool to arrange for a credit line financing in order to lower the working capital requirement for the Pool participants which potentially can attract additional pool participants.
At December 31, 2017,2020, the Group held 50% of the voting rights in TUKA but held 61% of the outstanding shares that participate in the result of the entity. As Euronav acquired ownership of these shares on December 28, 2017, the Group's share of the profit of the entity, as well as the Group's balances and transactions with this joint venture were not significant as of and for the year ended December 31, 2017.
NOTES TO CONSOLIDATED FINANCIAL STATEMENTS 2020
Note 24 - Group entities (Continued)
At December 31, 2017,2020, the Group held 50% of the voting rights in TI LLC but held 59% of the outstanding shares that participate in the result of the entity. The Group's share
In 2018 2 subsidiaries, Fiorano Shipholding Ltd and Larvotto Shipholding Ltd were dissolved.
Due to the merger with Gener8 Maritime Inc. on June 12, 2018 as set out in Note 25, the Group acquired new subsidiaries. Those subsidiaries were used by Gener8 mostly as SPV to own individual vessels. All of the profitvessels have been transferred to Euronav NV in 2018. The Group intends to liquidate a majority of those subsidiaries as soon as possible. In 2019 the following subsidiaries were dissolved:
| | | | | | | | | | | | | | | | | | | | |
| Gener8 Maritime Subsidiary V Inc. | | | | | | | GMR Defiance LLC | | | |
| Gener8 Maritime Subsidiary VIII Inc. | | | | | | | Companion Ltd. | | | |
| Gener8 Maritime Subsidiary Inc. | | | | | | | Compatriot Ltd. | | | |
| GMR Zeus LLC | | | | | | | Gener8 Neptune LLC | | | |
| GMR Atlas LLC | | | | | | | Gener8 Athena LLC | | | |
| GMR Hercules LLC | | | | | | | Gener8 Apollo LLC | | | |
| GMR Ulysses LLC | | | | | | | Gener8 Ares LLC | | | |
| GMR Poseidon LLC | | | | | | | Gener8 Hera LLC | | | |
| GMR Spartiate LLC | | | | | | | Gener8 Constantine LLC | | | |
| GMR Maniate LLC | | | | | | | Gener8 Oceanus LLC | | | |
| GMR St Nikolas LLC | | | | | | | Gener8 Nestor LLC | | | |
| GMR George T LLC | | | | | | | Gener8 Nautilus LLC | | | |
| GMR Kara G LLC | | | | | | | Gener8 Macedon LLC | | | |
| GMR Harriet G LLC | | | | | | | Gener8 Noble LLC | | | |
| GMR Orion LLC | | | | | | | Gener8 Ethos LLC | | | |
| GMR Argus LLC | | | | | | | Gener8 Perseus LLC | | | |
| GMR Horn LLC | | | | | | | Gener8 Theseus LLC | | | |
| GMR Phoenix LLC | | | | | | | Gener8 Hector LLC | | | |
In 2019, Euronav NV, Antwerp, Geneva (branch office), was established and incorporated in the third quarter of 2019.
In the fourth quarter of 2019, 2 new joint ventures Bari Shipholding Ltd. and Bastia Shipholding Ltd. were incorporated (see Note 26).
In 2020 1 joint venture, Kingswood Co. Ltd, was dissolved.
In 2020, Euronav NV, London (branch office), was established and incorporated in the third quarter of 2020.
The Group holds 100% of the entity, as well as the Group's balances and transactions with this joint venture were not significant asvoting rights in all of and for the year ended December 31, 2017.its subsidiaries.
NOTES TO CONSOLIDATED FINANCIAL STATEMENTS 2020
Note 2425 - Business combinations
On May 20, 2016, the Group announced the termination of the joint ventures with Bretta Tanker Holdings, Inc. covering four Suezmax vessels. Euronav assumed full ownership of the companies owning the two youngest vessels, the Captain Michael (2012 - 157,648 dwt) and the Maria (2012 - 157,523 dwt) on June 2, 2016.
On June 2, 2016, the Group entered into a share swap and claims transfer agreement whereby:
The Group transferred its equity interests in Moneghetti Shipholding Ltd. (hereafter 'Moneghetti') and Fontvieille Shipholding Ltd. (hereafter 'Fontvieille') and acquired Bretta Tanker Holdings' equity interests in Fiorano Shipholding Ltd. (hereafter 'Fiorano') and Larvotto Shipholding Ltd. (hereafter 'Larvotto'); and
The Group transferred its claims arising from the shareholder loans to Moneghetti and Fontvieille and acquired Bretta Tanker Holdings' claims arising from the shareholder loans to Fiorano and Larvotto.
As a result, the Group's equity interest in both Fiorano and Larvotto increased from 50% to 100% giving the Group control of both companies. The Group no longer has an equity interest in Moneghetti and Fontvieille. Before the swap agreement, the Group accounted for the four entities using the equity method. Following the acquisition, Fiorano and Larvotto are fully consolidated as of June 2, 2016.
With this transaction, the Group has become the full owner of the two youngest vessels, the Captain Michael and the Maria, while Bretta has become the full owner of the Devon and the Eugenie.
Consideration transferred
|
| | |
(in thousands of USD) | Fair value at acquisition date |
Cash | 15,110 |
|
Shares in Fontvieille and Moneghetti | (21,498 | ) |
Shareholders' loan receivable | 39,973 |
|
| |
Total consideration transferred | 33,585 |
|
NOTES TO CONSOLIDATED FINANCIAL STATEMENTS 2017
Note 24 - Business combinations ( continued)
Contribution to revenue and profit/loss
Since their acquisition by the Group on June 2, 2016, the 2 acquired companies contributed revenue of USD 4.8 million and a profit of USD 0.1 million to the Group's consolidated results for the year ended December 31, 2016. If the acquisition had occurred on 1 January 2016, management estimates that the Group's consolidated revenue for the year ended December 31, 2016 would have been USD 698.3 million and consolidated profit for the twelve month period ended December 31, 2016 would have been USD 205.1 million. In determining these amounts, management has assumed that the fair value adjustments, that arose on the date of acquisition would have been the same if the acquisition had occurred on 1 January 2016.
Acquisition related costs
The Group did not incur any material acquisition-related costs for the business combination and these costs were expensed as incurred.
Step acquisition
The transaction resulted in a loss of USD 24.2 million. This loss was recognized in the consolidated statement of profit or loss for the year ended December 31, 2016 under the heading 'Loss on disposal of investments in equity accounted investees'. In accordance with IFRS 3 (Business Combinations), Euronav accounted for this transaction as a step acquisition and therefore had to re-measure at the acquisition date to fair value Euronav's non-controlling equity interest in the two joint ventures it acquired (loss of USD 13.5 million) as well as to measure at fair value the consideration transferred, including Euronav's interest in the other two joint ventures (loss of USD 10.7 million). At acquisition date, the fair value of the Group's non-controlling interest in the two acquired joint ventures amounted to USD (18.6) million.
Identifiable assets acquired and liabilities assumed
The following table summarizes the recognized amounts of assets acquired and liabilities assumed at the acquisition date.
|
| | |
(in thousands of USD) | Fair value at acquisition date |
Property, plant and equipment (Note 8) | 120,280 |
|
Trade receivables | 3,685 |
|
Cash and cash equivalents | 8,355 |
|
Loans and borrowings (Note 15) | (61,065 | ) |
Trade and other payables | (4,086 | ) |
| |
|
Total identifiable net assets acquired | 67,169 |
|
Measurement of fair values
|
| |
Assets acquired | Valuation techniques |
Property, plant and equipment | The price was agreed among parties by reference to valuation reports by brokers |
Goodwill
The transaction did not give rise to the recognition of any goodwill:
|
| | |
(in thousands of USD) | Fair value at acquisition date |
Consideration transferred | 33,585 |
|
Fair value of pre-existing interests in Larvotto and Fiorano | (18,633 | ) |
Fair value of identifiable net assets | (67,169 | ) |
Fair value of shareholders' loan liabilities versus Bretta Tanker Holdings, transferred to Euronav | 52,217 |
|
| |
|
Goodwill | — |
|
NOTES TO CONSOLIDATED FINANCIAL STATEMENTS 2017
Note 24 - Business combinations ( continued)
Merger with Gener8 Maritime, Inc. ('Gener8')
On December 21, 2017, EuronavJune 11, 2018, the Group announced that Gener8's shareholders approved the Company has reached an agreement on a stock-for-stock merger forthat day between the entire issued and outstanding share capital of Gener8 Maritime, Inc. (“Gener8“) pursuant totwo companies by which Gener8 would becomebecame a wholly-owned subsidiary of Euronav. Gener8 Maritime Inc. a corporation incorporated under the laws of the Republic of the Marshall Islands, was a leading U.S.-based provider of international seaborne crude oil transportation services, resulting from a transformative merger between General Maritime Corporation, a well-known tanker owner, and Navig8 Crude Tankers Inc., a company sponsored by the Navig8 Group, an independent vessel pool manager. General Maritime Corporation was founded in 1997 and has been an active owner and operator in the crude tanker sector. At the date of the merger, Gener8 owned a fleet of 29 tankers on the water, consisting of 21 VLCC vessels, 6 Suezmax vessels, and 2 Panamax vessels, with an aggregate carrying capacity of approximately 7.4 million dwt, which includes 19 “eco” VLCC newbuildings delivered from 2015 through 2017 equipped with advanced, fuel-saving technology, that were constructed at highly reputable shipyards.
The merger created the world’s leading independent crude tanker operator with 72 large crude tankers focused predominately on the VLCC and Suezmax asset classes and 2 FSO vessels in joint venture and provide tangible economies of scale via pooling arrangements, procurement opportunities, reduced overhead and enhanced access to capital.
Furthermore it will offer a well-capitalized, highly liquid company for investors to participate in the tanker market and through commitment to the Tankers International Pool (a spot market-oriented tanker pool), provide the lowest commercial fees as a percentage of revenue in the sector upon closing of the merger.
The “Exchange Ratio“ of 0.7272 Euronav shares for each share of Gener8 is expected to resultresulted in the issuance of approximately 60.9 million60,815,764 new Euronavordinary shares to Gener8 shareholders.on June 12, 2018. The Exchange Ratio impliesimplied a premium of 35% paid on Gener8 shares based on the closing share prices on 20 December 2017. The merger will resultresulted in Euronav shareholders owning approximately 72% of the issued share capital of the combined entity and Gener8 shareholders owning approximately 28% (based on the fully diluted share capital of Euronav and the fully diluted share capital of Gener8). The merger is subject to the approval of Gener8’s shareholders, the consent of certain of Gener8’s lenders to assign certain debt facilities toEuronav as the combined entity remain listed on NYSE and Euronext under the effectivenesssymbol "EURN".
Subsequently, Euronav sold certain subsidiaries owning 6 VLCCs to International Seaways ("INSW") for a total cash payment of $141.0 million of which $120.0 million was received on June 14, 2018, the date of closing. The remaining balance of $20.9 million was paid in Q4. This sale was an important part of the wider merger with Gener8 Maritime transaction as it allows Euronav to retain leverage around a registration statementlevel of 50% and to be filed by Euronav withretain substantial liquidity going forward. The 6 vessels are the U.S. SecuritiesGener8 Miltiades (2016 – 301,038 dwt), Gener8 Chiotis (2016 – 300,973 dwt), Gener8 Success (2016 – 300,932 dwt), Gener8 Andriotis (2016 – 301,014 dwt), Gener8 Strength (2015 – 300,960 dwt) and Exchange Commission (the “SEC”) to register the Euronav shares to be issued in the merger (the “New Registration Statement”), the listingGener8 Supreme (2016 – 300,933 dwt). The assets and liabilities of such sharesthese companies were recognized at fair value on the New York Stock Exchange (the “NYSE”) and other customary closing conditions. Certain of these closing conditions are substantive, and these conditions have not yet been met. The Gener8 shares will be contributed to Euronav in applicationdate of the Belgian Companies Code procedure of a capital increase through contribution in kind. The increaseclosing of the Euronav share capital will occur undermerger. This fair value took into consideration the existing authorized capitalprovisions of USD 150.0the sale and purchase agreement with INSW and accordingly, no result was recorded on this transaction.
Consideration transferred
| | | | | | | | |
| (in USD) | | Total Business combinations |
| | |
| Gener8 shares outstanding | | 83,267,426 |
| RSU | | 362,613 |
| Total Gener8 shares | | 83,630,039 |
| Ratio | | 0.7272 |
| Issued Euronav shares | | 60,815,764 |
| Closing price Euronav on June 11, 2018 | | 9.1 |
| | |
| Total consideration transferred | | 553,423,452 | |
Contribution to revenue and profit/loss
Since their acquisition by the Group on June 12, 2018, the acquired companies contributed revenue of $16.5 million and a loss of $43.7 million to the Group’s consolidated results for the year ended December 31, 2018. If the acquisition had occurred on 1 January 2018, management estimates that the Group’s consolidated revenue for the year ended December 31, 2018 would have been $665.5 million and consolidated loss for the twelve month period ended December 31, 2018 would have been $(160.1) million. In determining these amounts, management has assumed that the fair value adjustments, that arose on the date of acquisition would have been the same if the acquisition had occurred on 1 January 2018.
Acquisition related costs
NOTES TO CONSOLIDATED FINANCIAL STATEMENTS 20172020
Note 25 - Business combinations (Continued)
The Group incurred approximately $5.0 million relating to external legal fees, due to diligence costs and advisory fees. These acquisition-related costs for the business combination were expensed as incurred and are included in 'General and administrative expenses'.
Repayment Blue mountain note
As part of the Merger Agreement and the Letter agreement between Gener8 and certain affiliates of BlueMountain Capital Management LLC, the Senior Note with a carrying value of $205.7 million was prepaid on June 12, 2018. The repayment of the Senior Notes was financed in full by Euronav under its existing liquidity (cash at hands and credit facilities) (see Note 16).
Bank loans
At the time of the merger, Gener8 had 3 senior secured credit facilities: (i) the KEXIM Credit Agreement, (ii) the Nordea Credit Agreement and (iii) the Sinosure Credit Agreement of which the first 2 were assumed by Euronav in the merger and the latter was acquired by INSW when they acquired certain subsidiaries owning 6 VLCCs. Prior to the merger, Gener8 was not in compliance with the interest expense coverage ratio covenant for which they obtained short-term waivers from its lenders. Following the merger, the Kexim Credit Agreement was amended to align the covenants with the other senior credit facilities of the Group, resolving the non-compliance. The Group, in advance negotiations to refinance the Nordea Credit Agreement, decided not to amend this senior secured credit facility and as such, given the non-compliance and remaining duration of the short-term waiver, classified the entire facility as short term. On September 17, 2018, this facility was repaid in full.
Identifiable assets acquired and liabilities assumed
The following table summarizes the recognized amounts of assets acquired and liabilities assumed at the acquisition date.
| | | | | | | | | | | | | | | | | |
| (in thousands of USD) | | Total | | Gener8 Subsidiaries | INSW Subsidiaries |
| Vessels (Note 8) | | 1,704,250 | | 1,270,250 | 434,000 |
| Other tangible assets | | 345 | | 345 | 0 |
| Intangible assets | | 152 | | 152 | 0 |
| Receivables | | 16,750 | | 9,599 | 7,151 |
| Current assets | | 79,459 | | 64,829 | 14,629 |
| Cash and cash equivalents | | 126,288 | | 126,288 | 0 |
| Loans and borrowings (Note 16) | | (1,312,446) | | (1,001,478) | (310,968) |
| Provision onerous contracts (Note 21) | | (5,303) | | (5,303) | 0 |
| Current liabilities | | (33,012) | | (29,160) | (3,852) |
| | | | | |
| Total identifiable net assets acquired | | 576,482 | | 435,522 | 140,960 |
| | | | | |
| | | | | |
| (in thousands of USD) | | Fair value at acquisition date | | | |
| Consideration transferred | | 553,423 | | | |
| Total identifiable net assets acquired | | 576,482 | | | |
| | | | | |
| Bargain Purchase | | 23,059 | | | |
The transaction resulted in a bargain purchase gain of $23.1 million as the fair value of assets acquired and liabilities assumed exceeded the total of the fair value of consideration paid. Euronav’s management has reassessed whether they had correctly identified all of the assets acquired and all of the liabilities assumed and this excess remains.
Euronav’s management believes that the bargain purchase price is a direct consequence of Gener8 limited liquidity and its shares trading under the net asset value per share prior to and at the time of the agreed ratio as well as a small uptick in the fair value of the vessels between the time of the agreed exchange ratio and the date of the merger when the valuation of the vessels was assessed.
This gain was recognized in the consolidated statement of profit or loss for 2018, under the heading ‘Gain on bargain purchase’.
As at June 12, 2018, the gross contractual amounts receivable acquired amounted to $98.2 million and the amounts expected not to collect amounted to $2.0 million which gives a net amount receivable of $96.2 million (see table above, sum of receivables and current assets).
NOTES TO CONSOLIDATED FINANCIAL STATEMENTS 2020
Note 2526 - Equity-accounted investees
| | | | | | | | | | | | | | |
| (in thousands of USD) | | December 31, 2020 | | December 31, 2019 |
| Assets | | | | |
| Interest in joint ventures | | 51,703 | | | 50,322 | |
| Interest in associates | | 0 | | | 0 | |
| TOTAL ASSETS | | 51,703 | | | 50,322 | |
| | | | |
| Liabilities | | | | |
| Interest in joint ventures | | 0 | | | 0 | |
| Interest in associates | | 0 | | | 0 | |
| TOTAL LIABILITIES | | 0 | | | 0 | |
|
| | | | | | |
| (in thousands of USD) | | December 31, 2017 | | December 31, 2016 |
| Assets | | | | |
| Interest in joint ventures | | 30,595 |
| | 16,867 |
|
| Interest in associates | | — |
| | 1,546 |
|
| TOTAL ASSETS | | 30,595 |
| | 18,413 |
|
| | | | | |
| Liabilities | | | | |
| Interest in joint ventures | | — |
| | — |
|
| Interest in associates | | — |
| | — |
|
| TOTAL LIABILITIES | | — |
| | — |
|
Associates
|
| | | | | | |
| (in thousands of USD) | | December 31, 2017 | | December 31, 2016 |
| Carrying amount of interest at the beginning of the period | | 1,546 |
| | 1,212 |
|
| Group's share of profit (loss) for the period | | 149 |
| | 334 |
|
| Dividend in kind (shares TUKA) distributed by associate (Note 23) | | (1,559 | ) | | — |
|
| Reclassification of associate to joint venture (Note 23) | | (136 | ) | | — |
|
| Carrying amount of interest at the end of the period | | — |
| | 1,546 |
|
NOTES TO CONSOLIDATED FINANCIAL STATEMENTS 2017
Note 25 - Equity-accounted investees (Continued)
Joint Ventures
The following table contains a roll forward of the balance sheet amounts with respect to the Group's joint ventures: |
| | | | | | | | | | | | |
| | | ASSET | | LIABILITY |
| (in thousands of USD) | | Investments in equity accounted investees | | Shareholders loans | | Investments in equity accounted investees | | Shareholders loans |
| Gross balance | | (89,338 | ) | | 363,414 |
| | (5,880 | ) | | — |
|
| Offset investment with shareholders loan | | 105,643 |
| | (105,643 | ) | | — |
| | — |
|
| Balance at January 1, 2015 | | 16,305 |
| | 257,771 |
| | (5,880 | ) | | — |
|
| | | | | | | | | |
| Group's share of profit (loss) for the period | | 51,407 |
| | — |
| | — |
| | — |
|
| Group's share of other comprehensive income | | 1,610 |
| | — |
| | — |
| | — |
|
| Capital increase/(decrease) in joint ventures | | (1,499 | ) | | — |
| | 5,880 |
| | — |
|
| Dividends received from joint ventures | | (275 | ) | | — |
| | — |
| | — |
|
| Movement shareholders loans to joint ventures | | — |
| | (45,665 | ) | | — |
| | — |
|
| | | | | | | | | |
| Gross balance | | (38,095 | ) | | 317,749 |
| | — |
| | — |
|
| Offset investment with shareholders loan | | 58,520 |
| | (58,520 | ) | | — |
| | — |
|
| Balance at December 31, 2015 | | 20,425 |
| | 259,229 |
| | — |
| | — |
|
| | | | | | | | | |
| Group's share of profit (loss) for the period | | 40,161 |
| | — |
| | — |
| | — |
|
| Group's share of other comprehensive income | | 1,224 |
| | — |
| | — |
| | — |
|
| Group's share on upstream transactions | | 4,646 |
| | — |
| | — |
| | — |
|
| Capital increase/(decrease) in joint ventures | | (3,737 | ) | | — |
| | — |
| | — |
|
| Dividends received from joint ventures | | (23,478 | ) | | — |
| | — |
| | — |
|
| Movement shareholders loans to joint ventures | | — |
| | (18,499 | ) | | — |
| | — |
|
| Business combinations | | 15,981 |
| | (95,738 | ) | | — |
| | — |
|
| | | | | | | | | |
| Gross balance | | (3,298 | ) | | 203,512 |
| | — |
| | — |
|
| Offset investment with shareholders loan | | 20,165 |
| | (20,165 | ) | | — |
| | — |
|
| Balance at December 31, 2016 | | 16,867 |
| | 183,348 |
| | — |
| | — |
|
NOTES TO CONSOLIDATED FINANCIAL STATEMENTS 2020
Note 26 - Equity-accounted investees (Continued)
| | | | | | | | | | | | | | | | | | |
| | | ASSET | | |
| (in thousands of USD) | | Investments in equity accounted investees | | Shareholders loans | | | | |
| Gross balance | | 27,565 | | | 162,763 | | | | | |
| Offset investment with shareholders loan | | 3,030 | | | (3,030) | | | | | |
| Balance at January 1, 2018 | | 30,595 | | | 159,733 | | | | | |
| | | | | | | | |
| Group's share of profit (loss) for the period | | 16,076 | | | 0 | | | | | |
| Group's share of other comprehensive income | | (459) | | | 0 | | | | | |
| | | | | | | | |
| | | | | | | | |
| | | | | | | | |
| | | | | | | | |
| | | | | | | | |
| Movement shareholders loans to joint ventures | | 0 | | | (134,097) | | | | | |
| | | | | | | | |
| | | | | | | | |
| Gross balance | | 43,182 | | | 28,666 | | | | | |
| Offset investment with shareholders loan | | 0 | | | 0 | | | | | |
| Balance at December 31, 2018 | | 43,182 | | | 28,666 | | | | | |
| | | | | | | | |
| Group's share of profit (loss) for the period | | 16,460 | | | 0 | | | | | |
| Group's share of other comprehensive income | | (720) | | | 0 | | | | | |
| | | | | | | | |
| | | | | | | | |
| Dividends received from joint ventures | | (12,600) | | | 0 | | | | | |
| | | | | | | | |
| | | | | | | | |
| Movement shareholders loans to joint ventures | | 0 | | | 31,713 | | | | | |
| | | | | | | | |
| Initial capital provided to joint ventures | | 4,000 | | | 0 | | | | | |
| | | | | | | | |
| Gross balance | | 50,322 | | | 60,379 | | | | | |
| Offset investment with shareholders loan | | 0 | | | 0 | | | | | |
| Balance at December 31, 2019 | | 50,322 | | | 60,379 | | | | | |
| | | | | | | | |
NOTES TO CONSOLIDATED FINANCIAL STATEMENTS 2020
Note 26 - Equity-accounted investees (Continued)
| | | | | | | | | | | | | | | | | | |
| | | ASSET | | |
| (in thousands of USD) | | Investments in equity accounted investees | | Shareholders loans | | | | |
| Group's share of profit (loss) for the period | | 10,917 | | | 0 | | | | | |
| Group's share of other comprehensive income | | (2) | | | 0 | | | | | |
| | | | | | | | |
| Dividends received from joint ventures | | (7,534) | | | 0 | | | | | |
| | | | | | | | |
| | | | | | | | |
| Movement shareholders loans to joint ventures | | 0 | | | (26,443) | | | | | |
| | | | | | | | |
| Repayment capital provided to joint ventures | | (2,000) | | | 0 | | | | | |
| | | | | | | | |
| Gross balance | | 51,703 | | | 33,936 | | | | | |
| Offset investment with shareholders loan | | 0 | | | 0 | | | | | |
| Balance at December 31, 2020 | | 51,703 | | | 33,936 | | | | | |
The decrease in the balance of shareholders’ loans to joint ventures in 2018 is primarily due to the $220.0 million senior secured credit facility which TI Asia Ltd. and TI Africa Ltd. entered into March 29, 2018. The shareholders loans were partially repaid by using a part of the proceeds of this new borrowing. In this context, the Company provided a guarantee for the revolving tranche of the above credit facility.
The increase in the balance of the shareholders' loan to joint ventures in 2019 is attributable to the shareholders loans to newly set-up joint ventures Bari Shipholding Ltd and Bastia Shipholding Ltd (see Note 10).
The decrease in the balance of the shareholders' loan to joint ventures in 2020 is attributable to the repayment of the shareholders loans to TI Africa, Bari Shipholding Ltd. and Bastia Shipholding Ltd., the latter following the sale of the vessel in September 2020.
| | | | | | | | |
| Joint venture | Segment | Description |
| | |
| EURONAV NV | |
NOTES TO CONSOLIDATED FINANCIAL STATEMENTS 2017
Note 25 - Equity-accounted investees (Continued)
|
| | | | | | | | | | | | |
| | | ASSET | | LIABILITY |
| (in thousands of USD) | | Investments in equity accounted investees | | Shareholders loans | | Investments in equity accounted investees | | Shareholders loans |
| Group's share of profit (loss) for the period | | 29,933 |
| | — |
| | — |
| | — |
|
| Group's share of other comprehensive income | | 483 |
| | — |
| | — |
| | — |
|
| Dividends received from joint ventures | | (1,250 | ) | | — |
| | — |
| | — |
|
| Dividend in kind (shares TUKA) received from associate (Note 23) | | 1,559 |
| | — |
| | — |
| | — |
|
| Reclassification of associate to joint venture (Note 23) | | 136 |
| | — |
| | — |
| | — |
|
| Movement shareholders loans to joint ventures | | — |
| | (40,750 | ) | | — |
| | — |
|
| | | | | | | | | |
| Gross balance | | 27,565 |
| | 162,763 |
| | — |
| | — |
|
| Offset investment with shareholders loan | | 3,030 |
| | (3,030 | ) | | — |
| | — |
|
| Balance at December 31, 2017 | | 30,595 |
| | 159,733 |
| | — |
| | — |
|
The Group's share on upstream transactions in 2016 related to the buy-out of the joint venture partner to obtain full control of the VLCC V.K. Eddie. On November 23, 2016, the Group purchased the VLCC V.K. Eddie from its 50% joint venture Seven Seas Shipping Ltd. In the Group's consolidated financial statements, 50% of the gain recognized on this transaction by Seven Seas Shipping Ltd. was eliminated.
The decrease in the balance of shareholders' loans to joint ventures since December 31, 2015 is primarily due to the disposal of two joint ventures and the acquisition two of other joint ventures on June 2, 2016, as set out in Note 24, resulting in the settlement or consolidation, respectively, of the Group's shareholders' loan balances versus these entities. For more details, we refer to the table summarizing the financial information of the Groups' joint ventures further below. |
| | |
Joint venture | Segment | Description |
Great Hope Enterprises Ltd | Tankers | No operating activities, liquidated in 2016 |
| Kingswood Co. Ltd | Tankers | Holding company; parent of Seven Seas Shipping Ltd. and to be liquidated in the future2020 |
| Seven Seas Shipping Ltd | Tankers | Formerly owner of 1 VLCC bought in 2016 by Euronav. Wholly owned subsidiary of Kingswood Co. Ltd. and liquidated in 2020 |
Fiorano Shipholding Ltd | Tankers | Single ship company, owner of 1 Suezmax, acquired Bretta's equity interest in 2016 |
Larvotto Shipholding Ltd | Tankers | Single ship company, owner of 1 Suezmax, acquired Bretta's equity interest in 2016 |
Fontvieille Shipholding Ltd | Tankers | Single ship company, owner of 1 Suezmax, sold our equity interest to Bretta in 2016 |
Moneghetti Shipholding Ltd | Tankers | Single ship company, owner of 1 Suezmax, sold our equity interest to Bretta in 2016 |
| Tankers Agencies (UK) Ltd | Tankers | Parent company of Tankers International Ltd |
| Tankers International LLC | Tankers | The manager of the Tankers International Pool who commercially manages the majority of the Group's VLCCs
|
| Bari Shipholding Ltd | Tankers | Single ship company, owner of 1 Suezmax |
| Bastia Shipholding Ltd | Tankers | Formerly owner of 1 Suezmax, dormant company |
| TI Africa Ltd | FSO | Operator and owner of a single floating storage and offloading facility (FSO Africa) * |
| TI Asia Ltd | FSO | Operator and owner of a single floating storage and offloading facility (FSO Asia) * |
* Both FSO Asia and FSO Africa are on a time charter contract to North Oil Company (NOC), the new operator of Al Shaheen field, until mid-2022.
mid 2032.
NOTES TO CONSOLIDATED FINANCIAL STATEMENTS 20172020
Note 2526 - Equity-accounted investees (Continued)
The following table contains summarized financial information for all of the Group's joint ventures:
| | | | | Asset | | Liability | | | | Asset | |
| (in thousands of USD) | | Great Hope Enterprises Ltd |
| | Kingswood Co. Ltd |
| | Seven Seas Shipping Ltd |
| | Fiorano Shipholding Ltd |
| | Fontvieille Shipholding Ltd |
| | Larvotto Shipholding Ltd |
| | Moneghetti Shipholding Ltd |
| | TI Africa Ltd |
| | TI Asia Ltd |
| | Total |
| | Africa Conversion Corp |
| | Asia Conversion Corp |
| | Total |
| (in thousands of USD) | | | Kingswood Co. Ltd | | Seven Seas Shipping Ltd | | | TI Africa Ltd | | TI Asia Ltd | | Tankers Agencies (UK) Ltd (see Note 24) | | TI LLC (see Note 24) | | Total | |
| December 31, 2015 | | | | | |
| At December 31, 2018 | | At December 31, 2018 | | | | | | |
| Percentage ownership interest | | 50 | % | | 50 | % | | 50 | % | | 50 | % | | 50 | % | | 50 | % | | 50 | % | | 50 | % | | 50 | % | | 50 | % | | 50 | % | | 50 | % | | | Percentage ownership interest | | | 50 | % | | 50 | % | | | 50 | % | | 50 | % | | 50 | % | | 50 | % | | |
| | | | | | | | | | | | | | | | | |
| Non-Current assets | | — |
| | 520 |
| | 33,052 |
| | 78,031 |
| | 65,837 |
| | 73,234 |
| | 70,159 |
| | 215,184 |
| | 208,405 |
| | 744,422 |
| | — |
| | — |
| | — |
| Non-Current assets | | | 522 | | | 0 | | | | 154,553 | | | 147,962 | | | 306 | | | 0 | | | 303,343 | | |
| of which Vessel | | — |
| | — |
| | 33,052 |
| | 78,031 |
| | 65,837 |
| | 73,234 |
| | 70,159 |
| | 208,030 |
| | 200,452 |
| | 728,795 |
| | — |
| | — |
| | — |
| |
| of which vessel | | of which vessel | | | 0 | | | 0 | | | | 153,404 | | | 146,654 | | | 0 | | | 0 | | | 300,058 | | |
| Current Assets | | 102 |
| | 489 |
| | 7,463 |
| | 6,498 |
| | 4,195 |
| | 7,873 |
| | 7,219 |
| | 12,144 |
| | 41,744 |
| | 87,727 |
| | — |
| | — |
| | — |
| Current Assets | | | 0 | | | 792 | | | | 9,119 | | | 22,450 | | | 351,702 | | | 288 | | | 384,351 | | |
| of which cash and cash equivalents | | 59 |
| | — |
| | 1,528 |
| | 552 |
| | 186 |
| | 1,578 |
| | 4,891 |
| | 880 |
| | 30,465 |
| | 40,139 |
| | — |
| | — |
| | — |
| of which cash and cash equivalents | | | 0 | | | 696 | | | | 484 | | | 2,561 | | | 2,487 | | | 0 | | | 6,227 | | |
| Non-Current Liabilities | | — |
| | — |
| | 521 |
| | 84,094 |
| | 77,485 |
| | 81,424 |
| | 79,647 |
| | 303,018 |
| | 223,552 |
| | 849,740 |
| | — |
| | — |
| | — |
| Non-Current Liabilities | | | 0 | | | 522 | | | | 130,068 | | | 74,171 | | | 0 | | | 0 | | | 204,760 | | |
| Of which bank loans | | — |
| | — |
| | — |
| | 27,813 |
| | 30,470 |
| | 29,143 |
| | 43,750 |
| | — |
| | 75,343 |
| | 206,519 |
| | — |
| | — |
| | — |
| |
| of which bank loans | | of which bank loans | | | 0 | | | 0 | | | | 70,080 | | | 67,551 | | | 0 | | | 0 | | | 137,630 | | |
| Current Liabilities | | 15 |
| | 2 |
| | 239 |
| | 5,981 |
| | 6,656 |
| | 6,621 |
| | 7,099 |
| | 1,155 |
| | 30,832 |
| | 58,601 |
| | — |
| | — |
| | — |
| Current Liabilities | | | 6 | | | 1 | | | | 24,400 | | | 23,699 | | | 349,096 | | | 48 | | | 397,250 | | |
| Of which bank loans | | — |
| | — |
| | — |
| | 4,250 |
| | 4,000 |
| | 3,970 |
| | 4,000 |
| | — |
| | 28,858 |
| | 45,078 |
| | — |
| | — |
| | — |
| |
| of which bank loans | | of which bank loans | | | 0 | | | 0 | | | | 23,867 | | | 23,015 | | | 64,500 | | | 0 | | | 111,382 | | |
| Net assets (100%) | | 87 |
| | 1,007 |
| | 39,755 |
| | (5,546 | ) | | (14,109 | ) | | (6,939 | ) | | (9,368 | ) | | (76,845 | ) | | (4,235 | ) | | (76,192 | ) | | — |
| | — |
| | — |
| Net assets (100%) | | | 516 | | | 269 | | | | 9,205 | | | 72,542 | | | 2,912 | | | 240 | | | 85,685 | | |
| | | | | | | | | | | | | | | | | | | | | | | | | | | | | | | | | | | | | | | |
| Group's share of net assets | | 43 |
| | 504 |
| | 19,878 |
| | (2,773 | ) | | (7,054 | ) | | (3,469 | ) | | (4,684 | ) | | (38,423 | ) | | (2,118 | ) | | (38,096 | ) | | — |
| | — |
| | — |
| Group's share of net assets | | | 258 | | | 134 | | | | 4,603 | | | 36,271 | | | 1,774 | | | 141 | | | 43,182 | | |
| | | | | | | | | | | | | | | | | | | | | | | | | | | | | | | | | |
| Shareholders loans to joint venture | | — |
| | — |
| | — |
| | 28,141 |
| | 23,507 |
| | 26,141 |
| | 17,949 |
| | 149,615 |
| | 72,397 |
| | 317,750 |
| | — |
| | — |
| | — |
| Shareholders loans to joint venture | | | 0 | | | 0 | | | | 28,665 | | | 0 | | | 0 | | | 0 | | | 28,665 | | |
| | | | | | | | | | | | | | | | | | | | | | | | | | | | | | | | | |
| Net Carrying amount of interest in joint venture | | 43 |
| | 504 |
| | 19,878 |
| | — |
| | — |
| | — |
| | — |
| | — |
| | — |
| | 20,424 |
| | — |
| | — |
| | — |
| Net Carrying amount of interest in joint venture | | | 258 | | | 134 | | | | 4,603 | | | 36,271 | | | 1,774 | | | 141 | | | 43,182 | | |
| | | | | | | | | | | | | | | | | | | | | | | | | | | | | | | | | | | | | | | |
| Remaining shareholders loan to joint venture | | — |
| | — |
| — |
| — |
| — |
| 25,368 |
| — |
| 16,453 |
| — |
| 22,672 |
| — |
| 13,265 |
| — |
| 111,193 |
| — |
| 70,280 |
| — |
| 259,229 |
| — |
| — |
| — |
| — |
| — |
| — |
| Remaining shareholders loan to joint venture | | | 0 | | | 0 | | | | 28,665 | | | 0 | | | 0 | | | 0 | | | 28,665 | | |
| | | | | | | | | | | | | | | | | |
| Revenue | | 1 |
| | — |
| | 18,701 |
| | 21,050 |
| | 21,509 |
| | 22,837 |
| | 21,317 |
| | 64,627 |
| | 64,382 |
| | 234,425 |
| | — |
| | — |
| | — |
| Revenue | | | 0 | | | 1 | | | | 49,129 | | | 49,180 | | | 749,229 | | | 0 | | | 847,540 | | |
| Depreciations and amortization | | — |
| | — |
| | (3,601 | ) | | (4,852 | ) | | (4,832 | ) | | (4,571 | ) | | (4,630 | ) | | (18,209 | ) | | (17,933 | ) | | (58,628 | ) | | — |
| | — |
| | — |
| Depreciations and amortization | | | 0 | | | 0 | | | | (18,209) | | | (17,933) | | | (71) | | | 0 | | | (36,213) | | |
| Interest Expense | | — |
| | — |
| | (102 | ) | | (530 | ) | | (851 | ) | | (644 | ) | | (1,170 | ) | | (1,220 | ) | | (6,106 | ) | | (10,623 | ) | | — |
| | — |
| | — |
| Interest Expense | | | 0 | | | 0 | | | | (3,857) | | | (3,733) | | | (2,571) | | | 0 | | | (10,161) | | |
| Income tax expense | | — |
| | — |
| | — |
| | — |
| | — |
| | — |
| | — |
| | 259 |
| | 106 |
| | 365 |
| | — |
| | — |
| | — |
| Income tax expense | | | 0 | | | 0 | | | | (1,585) | | | (1,611) | | | (216) | | | 0 | | | (3,412) | | |
| Profit (loss) for the period (100%) | | 3 |
| | (4 | ) | | 11,791 |
| | 6,361 |
| | 6,330 |
| | 6,762 |
| | 5,661 |
| | 35,329 |
| | 30,580 |
| | 102,814 |
| | — |
| | — |
| | — |
| Profit (loss) for the period (100%) | | | (2) | | | (5) | | | | 15,742 | | | 15,977 | | | 352 | | | 10 | | | 32,074 | | |
| Other comprehensive income (100%) | | Other comprehensive income (100%) | | | 0 | | | 0 | | | | (477) | | | (441) | | | 0 | | | 0 | | | (918) | | |
| | Group's share of profit (loss) for the period | | Group's share of profit (loss) for the period | | | (1) | | | (2) | | | | 7,871 | | | 7,989 | | | 214 | | | 6 | | | 16,076 | | |
| | Group's share of other comprehensive income | | Group's share of other comprehensive income | | | 0 | | | 0 | | | | (239) | | | (220) | | | 0 | | | 0 | | | (459) | | |
NOTES TO CONSOLIDATED FINANCIAL STATEMENTS 20172020
Note 2526 - Equity-accounted investees (Continued)
| | | | | | | | | | | | | | | | | | | | | | | | | | | | | | | | | | | | | | | | | | | | | | | | | | | | | | | | | | | | | | | | |
| | | | | Asset | | |
| (in thousands of USD) | | | | Kingswood Co. Ltd | | Seven Seas Shipping Ltd | | TI Africa Ltd | | TI Asia Ltd | | Tankers Agencies (UK) Ltd (see Note 24) | | TI LLC (see Note 24) | | Bari Shipholding Ltd | | Bastia Shipholding Ltd | | Total | | | | | | |
| At December 31, 2019 | | | | | | | | | | | | | | | | | | | | | | | | | | |
| Percentage ownership interest | | | | 50 | % | | 50 | % | | 50 | % | | 50 | % | | 50 | % | | 50 | % | | 50 | % | | 50 | % | | | | | | | | |
| | | | | | | | | | | | | | | | | | | | | | | | | | |
| Non-Current assets | | | | 530 | | | 0 | | | 137,426 | | | 128,722 | | | 944 | | | 0 | | | 21,833 | | | 21,628 | | | 311,083 | | | | | | | |
| of which vessel | | | | 0 | | | 0 | | | 135,195 | | | 128,722 | | | 0 | | | 0 | | | 21,833 | | | 21,628 | | | 307,377 | | | | | | | |
| Current Assets | | | | 0 | | | 800 | | | 10,809 | | | 10,001 | | | 418,505 | | | 267 | | | 1,573 | | | 5,577 | | | 447,531 | | | | | | | |
| of which cash and cash equivalents | | | | 0 | | | 800 | | | 1,701 | | | 917 | | | 3,246 | | | 0 | | | 0 | | | 250 | | | 6,913 | | | | | | | |
| Non-Current Liabilities | | | | 0 | | | 525 | | | 97,514 | | | 49,026 | | | 490 | | | 0 | | | 18,390 | | | 18,773 | | | 184,718 | | | | | | | |
| of which bank loans | | | | 0 | | | 0 | | | 45,567 | | | 43,927 | | | 0 | | | 0 | | | 0 | | | 0 | | | 89,495 | | | | | | | |
| Current Liabilities | | | | 10 | | | 1 | | | 26,370 | | | 27,318 | | | 415,301 | | | 51 | | | 705 | | | 4,328 | | | 474,085 | | | | | | | |
| of which bank loans | | | | 0 | | | 0 | | | 24,856 | | | 23,968 | | | 135,000 | | | 0 | | | 0 | | | 0 | | | 183,824 | | | | | | | |
| Net assets (100%) | | | | 520 | | | 274 | | | 24,351 | | | 62,379 | | | 3,658 | | | 216 | | | 4,310 | | | 4,104 | | | 99,811 | | | | | | | |
| | | | | | | | | | | | | | | | | | | | | | | | | | |
| Group's share of net assets | | | | 260 | | | 137 | | | 12,175 | | | 31,189 | | | 2,227 | | | 127 | | | 2,155 | | | 2,052 | | | 50,322 | | | | | | | |
| | | | | | | | | | | | | | | | | | | | | | | | | | |
| Shareholders loans to joint venture | | | | 0 | | | 0 | | | 23,215 | | | 0 | | | 0 | | | 0 | | | 18,390 | | | 18,773 | | | 60,379 | | | | | | | |
| | | | | | | | | | | | | | | | | | | | | | | | | | |
| Net Carrying amount of interest in joint venture | | | | 260 | | | 137 | | | 12,175 | | | 31,189 | | | 2,227 | | | 127 | | | 2,155 | | | 2,052 | | | 50,322 | | | | | | | |
| | | | | | | | | | | | | | | | | | | | | | | | | | |
| Remaining shareholders loan to joint venture | | | | 0 | | | 0 | | | 23,215 | | | 0 | | | 0 | | | 0 | | | 18,390 | | | 18,773 | | | 60,379 | | | | | | | |
| | | | | | | | | | | | | | | | | | | | | | | | | | |
| Revenue | | | | 0 | | | 8 | | | 49,434 | | | 49,487 | | | 1,307,523 | | | 0 | | | 938 | | | 1,970 | | | 1,409,360 | | | | | | | |
| Depreciations and amortization | | | | 0 | | | 0 | | | (18,209) | | | (17,933) | | | (67) | | | 0 | | | (273) | | | (507) | | | (36,988) | | | | | | | |
| Interest expense | | | | 0 | | | 0 | | | (4,633) | | | (4,482) | | | (3,292) | | | 0 | | | (155) | | | (202) | | | (12,764) | | | | | | | |
| Income tax expense | | | | 0 | | | 0 | | | (1,588) | | | (1,573) | | | (243) | | | 0 | | | 0 | | | 0 | | | (3,405) | | | | | | | |
| Profit (loss) for the period (100%) | | | | (3) | | | 6 | | | 15,881 | | | 15,743 | | | 746 | | | (24) | | | 310 | | | 104 | | | 32,763 | | | | | | | |
| Other comprehensive income (100%) | | | | 0 | | | 0 | | | (735) | | | (706) | | | 0 | | | 0 | | | 0 | | | 0 | | | (1,441) | | | | | | | |
| | | | | | | | | | | | | | | | | | | | | | | | | | |
| Group's share of profit (loss) for the period | | | | (1) | | | 3 | | | 7,941 | | | 7,871 | | | 454 | | | (14) | | | 155 | | | 52 | | | 16,460 | | | | | | | |
| | | | | | | | | | | | | | | | | | | | | | | | | | |
| Group's share of other comprehensive income | | | | 0 | | | 0 | | | (367) | | | (353) | | | 0 | | | 0 | | | 0 | | | 0 | | | (720) | | | | | | | |
|
| | | | | | | | | | | | | | | | | | | | | | | | | | | | | | | | | | | | | | | | | | | | | | | | | | |
| Other comprehensive income (100%) | | — |
| | — |
| | — |
| | — |
| | — |
| | | | — |
| | — |
| | 3,220 |
| | 3,220 |
| | — |
| | — |
| | — |
|
| | | | | | | | | | | | | | | | | | | | | | | | | | | |
| Group's share of profit (loss) for the period | | 2 |
| | (2 | ) | | 5,895 |
| | 3,181 |
| | 3,165 |
| | 3,381 |
| | 2,831 |
| | 17,664 |
| | 15,290 |
| | 51,407 |
| | — |
| | — |
| | — |
|
| | | | | | | | | | | | | | | | | | | | | | | | | | | |
| Group's share of other comprehensive income | | — |
| | — |
| | — |
| | — |
| | — |
| | — |
| | — |
| | — |
| | 1,610 |
| | 1,610 |
| | — |
| | — |
| | — |
|
|
| | | | | | | | | | | | | | | | | | | | | | | | | | | | | | | | | | | | | | | | | | | | | | | | | | |
| | | Asset | | Liability |
| (in thousands of USD) | | Great Hope Enterprises Ltd |
| | Kingswood Co. Ltd |
| | Seven Seas Shipping Ltd |
| | Fiorano Shipholding Ltd |
| | Fontvieille Shipholding Ltd |
| | Larvotto Shipholding Ltd |
| | Moneghetti Shipholding Ltd |
| | TI Africa Ltd |
| | TI Asia Ltd |
| | Total |
| | Africa Conversion Corp |
| | Asia Conversion Corp |
| | Total |
|
| At December 31, 2016 | | | | | | | | | | | | | | | | | | | | | | | | | | |
| Percentage ownership interest | | 50 | % | | 50 | % | | 50 | % | | 50 | % | | 50 | % | | 50 | % | | 50 | % | | 50 | % | | 50 | % | | | | 50 | % | | 50 | % | | |
| Non-Current assets | | — |
| | 946 |
| | — |
| | — |
| | — |
| | — |
| | — |
| | 198,826 |
| | 192,344 |
| | 392,116 |
| | — |
| | — |
| | — |
|
| of which Vessel | | — |
| | — |
| | — |
| | — |
| | — |
| | — |
| | — |
| | 189,821 |
| | 182,519 |
| | 372,340 |
| | — |
| | — |
| | — |
|
| Current Assets | | — |
| | 76 |
| | 3,221 |
| | — |
| | — |
| | — |
| | — |
| | 38,206 |
| | 47,889 |
| | 89,392 |
| | — |
| | — |
| | — |
|
| of which cash and cash equivalents | | — |
| | — |
| | 555 |
| | — |
| | — |
| | — |
| | — |
| | 26,928 |
| | 36,591 |
| | 64,074 |
| | — |
| | — |
| | — |
|
| Non-Current Liabilities | | — |
| | — |
| | 946 |
| | — |
| | — |
| | — |
| | — |
| | 276,498 |
| | 132,763 |
| | 410,207 |
| | — |
| | — |
| | — |
|
| Of which bank loans | | — |
| | — |
| | — |
| | — |
| | — |
| | — |
| | — |
| | — |
| | — |
| | — |
| | — |
| | — |
| | — |
|
| Current Liabilities | | — |
| | 2 |
| | 132 |
| | — |
| | — |
| | — |
| | — |
| | 863 |
| | 76,899 |
| | 77,896 |
| | — |
| | — |
| | — |
|
| Of which bank loans | | — |
| | — |
| | — |
| | — |
| | — |
| | — |
| | — |
| | — |
| | 75,343 |
| | 75,343 |
| | — |
| | — |
| | — |
|
| Net assets (100%) | | — |
| | 1,020 |
| | 2,143 |
| | — |
| | — |
| | — |
| | — |
| | (40,329 | ) | | 30,571 |
| | (6,595 | ) | | — |
| | — |
| | — |
|
| | | | | | | | | | | | | | | | | | | | | | | | | | | |
| Group's share of net assets | | — |
| | 510 |
| | 1,072 |
| | — |
| | — |
| | — |
| | — |
| | (20,165 | ) | | 15,285 |
| | (3,298 | ) | | — |
| | — |
| | — |
|
| | | | | | | | | | | | | | | | | | | | | | | | | | | |
| Shareholders loans to joint venture | | — |
| | — |
| | — |
| | — |
| | — |
| | — |
| | — |
| | 137,615 |
| | 65,897 |
| | 203,512 |
| | — |
| | — |
| | — |
|
| | | | | | | | | | | | | | | | | | | | | | | | | | | |
| Net Carrying amount of interest in joint venture | | — |
| | 510 |
| | 1,072 |
| | — |
| | — |
| | — |
| | — |
| | — |
| | 15,285 |
| | 16,867 |
| | — |
| | — |
| | — |
|
| | | | | | | | | | | | | | | | | | | | | | | | | | | |
| Remaining shareholders loan to joint venture | | — |
| | — |
| — |
| — |
| — |
| — |
| — |
| — |
| — |
| — |
| — |
| — |
| — |
| 117,451 |
| — |
| 65,897 |
| — |
| 183,348 |
| — |
| — |
| — |
| — |
| — |
| — |
|
| | | | | | | | | | | | | | | | | | | | | | | | | | | |
| Revenue | | — |
| | — |
| | 13,646 |
| | 7,182 |
| | 6,404 |
| | 6,901 |
| | 7,471 |
| | 65,188 |
| | 65,063 |
| | 171,855 |
| | — |
| | — |
| | — |
|
NOTES TO CONSOLIDATED FINANCIAL STATEMENTS 20172020
Note 2526 - Equity-accounted investees (Continued)
| | | | | | | | | | | | | | | | | | | | | | | | | | | | | | | | | | | | | | | | | | | | | | | | | | | | | | | | | | | | | |
| | | | | Asset | |
| (in thousands of USD) | | | | Kingswood Co. Ltd | | Seven Seas Shipping Ltd | | TI Africa Ltd | | TI Asia Ltd | | Tankers Agencies (UK) Ltd (see Note 24) | | TI LLC (see Note 24) | | Bari Shipholding Ltd | | Bastia Shipholding Ltd | | Total | |
| At December 31, 2020 | | | | | | | | | | | | | | | | | | | | | |
| Percentage ownership interest | | | | 50 | % | | 50 | % | | 50 | % | | 50 | % | | 50 | % | | 50 | % | | 50 | % | | 50 | % | | | |
| | | | | | | | | | | | | | | | | | | | | |
| Non-Current assets | | | | 0 | | | 0 | | | 118,337 | | | 112,160 | | | 720 | | | 0 | | | 20,079 | | | 0 | | | 251,296 | | |
| of which vessel | | | | 0 | | | 0 | | | 118,337 | | | 112,160 | | | 0 | | | 0 | | | 20,079 | | | 0 | | | 250,576 | | |
| Current Assets | | | | 0 | | | 0 | | 10,187 | | | 10,176 | | | 232,865 | | | 243 | | | 2,609 | | | 514 | | | 256,595 | | |
| of which cash and cash equivalents | | | | 0 | | | 0 | | | 1,138 | | | 1,109 | | | 3,124 | | | 0 | | | 1,573 | | | 193 | | | 7,137 | | |
| Non Current Liabilities | | | | 0 | | | 0 | | 65,355 | | | 30,652 | | | 276 | | | 0 | | | 17,271 | | | 0 | | | 113,554 | | |
| of which bank loans | | | | 0 | | | 0 | | | 19,929 | | | 19,215 | | | 0 | | | 0 | | | 0 | | | 0 | | | 39,144 | | |
| Current Liabilities | | | | 0 | | | 0 | | 29,277 | | | 30,547 | | | 228,851 | | | 61 | | | 2,856 | | | 345 | | | 291,937 | | |
| of which bank loans | | | | 0 | | | 0 | | | 25,886 | | | 24,961 | | | 37,500 | | | 0 | | | 0 | | | 0 | | | 88,347 | | |
| Net assets (100%) | | | | 0 | | | 0 | | | 33,893 | | | 61,136 | | | 4,458 | | | 182 | | | 2,562 | | | 170 | | | 102,401 | | |
| | | | | | | | | | | | | | | | | | | | | |
| Group's share of net assets | | | | 0 | | | 0 | | | 16,946 | | | 30,568 | | | 2,715 | | | 107 | | | 1,281 | | | 85 | | | 51,703 | | |
| | | | | | | | | | | | | | | | | | | | | |
| Shareholders loans to joint venture | | | | 0 | | | 0 | | | 16,665 | | | 0 | | | 0 | | | 0 | | | 17,271 | | | 0 | | | 33,936 | | |
| | | | | | | | | | | | | | | | | | | | | |
| Net Carrying amount of interest in joint venture | | | | 0 | | | 0 | | | 16,946 | | | 30,568 | | | 2,715 | | | 107 | | | 1,281 | | | 85 | | | 51,703 | | |
| | | | | | | | | | | | | | | | | | | | | |
| Remaining shareholders loan to joint venture | | | | 0 | | | 0 | | | 16,665 | | | 0 | | | 0 | | | 0 | | | 17,271 | | | 0 | | | 33,936 | | |
| | | | | | | | | | | | | | | | | | | | | |
| Revenue | | | | 0 | | | 0 | | | 49,922 | | | 49,976 | | | 1,478,909 | | | 0 | | | 12,288 | | | 14,131 | | | 1,605,227 | | |
| Depreciations and amortization | | | | 0 | | | 0 | | | (16,858) | | | (16,562) | | | (56) | | | 0 | | | (4,257) | | | (2,871) | | | (40,604) | | |
| Interest expense | | | | 0 | | | 0 | | | (3,358) | | | (3,233) | | | (1,651) | | | 0 | | | (1,834) | | | (1,251) | | | (11,327) | | |
| Income tax expense | | | | 0 | | | 0 | | | (10,397) | | | (10,135) | | | (232) | | | 0 | | | 0 | | | 0 | | | (20,764) | | |
| Profit (loss) for the period (100%) | | | | (1) | | | (1) | | | 9,549 | | | 9,855 | | | 800 | | | (34) | | | (1,748) | | | 3,246 | | | 21,666 | | |
| Other comprehensive income (100%) | | | | 0 | | | 0 | | | (1) | | | (3) | | | 0 | | | 0 | | | 0 | | | 0 | | | (4) | | |
| | | | | | | | | | | | | | | | | | | | | |
| Group's share of profit (loss) for the period | | | | 0 | | | 0 | | | 4,775 | | | 4,927 | | | 487 | | | (20) | | | (874) | | | 1,623 | | | 10,917 | | |
| | | | | | | | | | | | | | | | | | | | | |
|
| | | | | | | | | | | | | | | | | | | | | | | | | | | | | | | | | | | | | | | | | | | | | | | | | | |
| Depreciations and amortization | | — |
| | — |
| | (3,344 | ) | | (2,047 | ) | | (2,037 | ) | | (1,929 | ) | | (2,049 | ) | | (18,209 | ) | | (17,933 | ) | | (47,548 | ) | | — |
| | — |
| | — |
|
| Interest Expense | | — |
| | — |
| | (3 | ) | | (223 | ) | | (377 | ) | | (288 | ) | | (537 | ) | | (400 | ) | | (4,703 | ) | | (6,531 | ) | | — |
| | — |
| | — |
|
| Income tax expense | | — |
| | — |
| | — |
| | — |
| | — |
| | — |
| | — |
| | (326 | ) | | (106 | ) | | (432 | ) | | — |
| | — |
| | — |
|
| Profit (loss) for the period (100%) | | (32 | ) | | 12 |
| | 7,469 |
| | 1,146 |
| | 500 |
| | 1,082 |
| | 1,270 |
| | 36,515 |
| | 32,359 |
| | 80,322 |
| | — |
| | — |
| | — |
|
| Other comprehensive income (100%) | | — |
| | — |
| | — |
| | — |
| | — |
| | | | — |
| | — |
| | 2,448 |
| | 2,448 |
| | — |
| | — |
| | — |
|
| | | | | | | | | | | | | | | | | | | | | | | | | | | |
| Group's share of profit (loss) for the period | | (16 | ) | | 6 |
| | 3,735 |
| | 573 |
| | 250 |
| | 541 |
| | 635 |
| | 18,257 |
| | 16,180 |
| | 40,161 |
| | — |
| | — |
| | — |
|
| | | | | | | | | | | | | | | | | | | | | | | | | | | |
| Group's share of other comprehensive income | | — |
| | — |
| | — |
| | — |
| | — |
| | — |
| | — |
| | — |
| | 1,224 |
| | 1,224 |
| | — |
| | — |
| | — |
|
|
| | | | | | | | | | | | | | | | | | | | | | | | | | | | | | | |
| | Asset | | Liability |
| (in thousands of USD) | | Kingswood Co. Ltd |
| | Seven Seas Shipping Ltd |
| | TI Africa Ltd |
| | TI Asia Ltd |
| | Tankers Agencies (UK) Ltd (see Note 23) |
| | TI LLC (see Note 23) |
| | Total |
| | Africa Conversion Corp |
| | Asia Conversion Corp |
| | Total |
|
| At December 31, 2017 | | | | | | | | | | | | | | | | | | | | |
| Percentage ownership interest | | 50 | % | | 50 | % | | 50 | % | | 50 | % | | 50 | % | | 50 | % | | | | 50 | % | | 50 | % | | |
| | | | | | | | | | | | | | | | | | | | | |
| Non-Current assets | | 629 |
| | — |
| | 182,298 |
| | 175,826 |
| | 363 |
| | 98 |
| | 359,214 |
| | — |
| | — |
| | — |
|
| of which Vessel | | — |
| | — |
| | 171,612 |
| | 164,587 |
| | — |
| | — |
| | 336,199 |
| | — |
| | — |
| | — |
|
| Current Assets | | — |
| | 993 |
| | 12,639 |
| | 10,521 |
| | 149,650 |
| | 1,108 |
| | 174,912 |
| | — |
| | — |
| | — |
|
| of which cash and cash equivalents | | — |
| | 689 |
| | 4,062 |
| | 1,968 |
| | 1,889 |
| | — |
| | 8,608 |
| | — |
| | — |
| | — |
|
| Non Current Liabilities | | — |
| | 629 |
| | 200,231 |
| | 128,653 |
| | — |
| | — |
| | 329,514 |
| | — |
| | — |
| | — |
|
| Of which bank loans | | — |
| | — |
| | — |
| | — |
| | — |
| | — |
| | — |
| | — |
| | — |
| | — |
|
| Current Liabilities | | 111 |
| | 91 |
| | 766 |
| | 687 |
| | 147,453 |
| | 975 |
| | 150,083 |
| | — |
| | — |
| | — |
|
| Of which bank loans | | — |
| | — |
| | — |
| | — |
| | 43,000 |
| | — |
| | 43,000 |
| | — |
| | — |
| | — |
|
| Net assets (100%) | | 518 |
| | 273 |
| | (6,060 | ) | | 57,007 |
| | 2,560 |
| | 232 |
| | 54,530 |
| | — |
| | — |
| | — |
|
| | | | | | | | | | | | | | | | | | | | | |
| Group's share of net assets | | 259 |
| | 137 |
| | (3,030 | ) | | 28,503 |
| | 1,559 |
| | 136 |
| | 27,565 |
| | — |
| | — |
| | — |
|
| | | | | | | | | | | | | | | | | | | | | |
| Shareholders loans to joint venture | | — |
| | — |
| | 100,115 |
| | 62,647 |
| | — |
| | — |
| | 162,762 |
| | — |
| | — |
| | — |
|
| | | | | | | | | | | | | | | | | | | | | |
| Net Carrying amount of interest in joint venture | | 259 |
| | 137 |
| | — |
| | 28,503 |
| | 1,559 |
| | 136 |
| | 30,595 |
| | — |
| | — |
| | — |
|
| | | | | | | | | | | | | | | | | | | | | |
NOTES TO CONSOLIDATED FINANCIAL STATEMENTS 20172020
Note 2526 - Equity-accounted investees (Continued)
|
| | | | | | | | | | | | | | | | | | | | | | | | | | | | | | | |
| Remaining shareholders loan to joint venture | | — |
|
| — |
|
| 97,085 |
|
| 62,647 |
|
| — |
| | — |
| | 159,732 |
|
| — |
|
| — |
| — |
| — |
|
| | | | | | | | | | | | | | | | | | | | | |
| Revenue | | — |
| | 61 |
| | 61,015 |
| | 58,011 |
| | — |
| | — |
| | 119,087 |
| | — |
| | — |
| | — |
|
| Depreciations and amortization | | — |
| | — |
| | (18,209 | ) | | (17,933 | ) | | — |
| | — |
| | (36,142 | ) | | — |
| | — |
| | — |
|
| Interest Expense | | — |
| | — |
| | (90 | ) | | (1,961 | ) | | — |
| | — |
| | (2,052 | ) | | — |
| | — |
| | — |
|
| Income tax expense | | — |
| | — |
| | 383 |
| | (3,359 | ) | | — |
| | — |
| | (2,976 | ) | | — |
| | — |
| | — |
|
| Profit (loss) for the period (100%) | | (2 | ) | | 130 |
| | 34,269 |
| | 25,467 |
| | — |
| | — |
| | 59,865 |
| | — |
| | — |
| | — |
|
| Other comprehensive income (100%) | | — |
| | — |
| | — |
| | 966 |
| | — |
| | — |
| | 966 |
| | — |
| | — |
| | — |
|
| | | | | | | | | | | | | | | | | | | | | |
| Group's share of profit (loss) for the period | | (1 | ) | | 65 |
| | 17,135 |
| | 12,734 |
| | — |
| | — |
| | 29,932 |
| | — |
| | — |
| | — |
|
| | | | | | | | | | | | | | | | | | | | | |
| Group's share of other comprehensive income | | — |
| | — |
| | — |
| | 483 |
| | — |
| | — |
| | 483 |
| | — |
| | — |
| | — |
|
| | | | | | | | | | | | | | | | | | | | | | | | | | | | | | | | | | | | | | | | | | | | | | | | | | | | | | | | | | | | | |
| Group's share of other comprehensive income | | | | 0 | | | 0 | | | 0 | | | (1) | | | 0 | | | — | | | 0 | | | 0 | | | (2) | | |
Loans and borrowings
In October 2008,On March 29, 2018, TI Asia LtdLtd. and TI Africa Ltd concludedLtd. entered into a USD 500$220.0 million senior secured credit facility. The facility consists of a term loan of USD 180$110.0 million which was used to finance the acquisition of two ULCC vessels, the TI Asia and the TI Africa respectively from Euronav and International Seaways, Inc. (formerly "OSG") and a project financerevolving loan of USD 320$110.0 million for the purpose of refinancing the two FSOs as well as for general corporate purposes. The Company provided a guarantee for the revolving credit facility tranche. The fair value of this guarantee is not significant given the long term contract both FSOs have with North Oil Company until mid 2032, which has been used to financeresults in sufficient repayment capacity under these facilities. Transaction costs for a total amount of $2.2 million are amortized over the conversionlifetime of the above mentioned vessels into FSO. The tranche related to FSO Asia maturedinstrument using the effective interest rate method. As of December 31, 2020 the outstanding balance on this facility was $90.4 million in 2017 and had a rate of Libor plus a margin of 1.15%. The tranche related to FSO Africa matured in August 2013 with a balloon of USD 45.0 million and had a rate of Libor plus a margin of 2.25%. In 2013, the Africa Tranche was extended until 2015 and on August 28, 2015 it was fully repaid.aggregate.
All bank loans in the joint ventures are secured by the underlying vessel or FSO.FSO and subject to specific covenants.
The following table summarizes the terms and debt repayment profile of the bank loans held by the joint ventures:
| | | (in thousands of USD) | | | | | | | | December 31, 2017 | | December 31, 2016 | (in thousands of USD) | | | | | | | | December 31, 2020 | | December 31, 2019 |
| | | Curr. | | Nominal interest rate | | Year of mat. | | Facility size | | Drawn | | Carrying value | | Facility size | | Drawn | | Carrying value | | | Curr. | | Nominal interest rate | | Year of mat. | | Facility size | | Drawn | | Carrying value | | Facility size | | Drawn | | Carrying value |
| TI Asia Ltd * | | USD | | libor +1.15% | | 2017 |
| | — |
| | — |
| | — |
| | 75,343 |
| | 75,343 |
| | 75,343 |
| |
| TI Asia Ltd revolving loan 54M* | | TI Asia Ltd revolving loan 54M* | | USD | | libor + 2.0% | | 2022 | | | 22,179 | | | 22,179 | | | 22,088 | | | 34,163 | | | 34,163 | | | 33,948 | |
| TI Asia Ltd loan 54M* | | TI Asia Ltd loan 54M* | | USD | | libor + 2.0% | | 2022 | | | 22,179 | | | 22,179 | | | 22,088 | | | 34,163 | | | 34,163 | | | 33,948 | |
| TI Africa Ltd revolving loan 56M* | | TI Africa Ltd revolving loan 56M* | | USD | | libor + 2.0% | | 2022 | | | 23,001 | | | 23,001 | | | 22,908 | | | 35,429 | | | 35,429 | | | 35,212 | |
| TI Africa Ltd loan 56M* | | TI Africa Ltd loan 56M* | | USD | | libor + 2.0% | | 2022 | | | 23,001 | | | 23,001 | | | 22,908 | | | 35,429 | | | 35,429 | | | 35,212 | |
| | Total interest-bearing bank loans | Total interest-bearing bank loans | | | | — |
| | — |
| | — |
| | 75,343 |
| | 75,343 |
| | 75,343 |
| Total interest-bearing bank loans | | | | 90,360 | | | 90,360 | | | 89,991 | | | 139,183 | | | 139,183 | | | 138,319 | |
* The mentioned secured bank loans are subject to loan covenants such as an Asset Protection clause.covenants.
Loan covenant
Because the tranche related to FSO Asia matured in 2017, loan covenants were no longer applicable as atAs of December 31, 2017.2020, all joint ventures were in compliance with the covenants, as applicable, of their respective loans.
NOTES TO CONSOLIDATED FINANCIAL STATEMENTS 2017
Note 25 - Equity-accounted investees (Continued)
Interest rate swaps
Two of the Group's JV companies in connection to the FSO conversion project of theIn 2018, TI Asia and TI Africa also entered in twoseveral Interest Rate Swap (IRSs) instruments for a combined notional value of USD 480$208.8 million (Euronav's(Euronav’s share amounts to 50%). in connection to the $220.0 million facility. These IRSs wereare used to hedge the risk related to anythe fluctuation of the Libor rate and had a duration of 8 years starting respectively in July 2009 and September 2009 for FSO Asia and FSO Africa.
Following the restructuring of the original service contract related to the FSO Africa on January 22, 2010 and the consecutive reduction of financing, the hedge related to that tranche lost its qualificationqualify as hedging instrumentinstruments in a cash flow hedge relationship under IAS 39. As such the cash flows from this IRS affected profit or loss of the joint venture as from 2010 through 2017.
However the hedge related to the financing of FSO Asia qualified fully as a hedging instrument in a cash flow hedge relationship under IAS 39. This instrument wasIFRS 9. These instruments are measured at their fair value; effective changes in fair value werehave been recognized in equity of the joint ventureOCI and the ineffective portion was recordedhas been recognized in profit or lossloss. These IRSs have a remaining duration between one and two years matching the repayment profile of the joint venture.that facility and mature on July 21, 2022 and September 22, 2022 for FSO Asia and FSO Africa respectively (see Note 14).
Both IRSs matured in 2017.
NOTES TO CONSOLIDATED FINANCIAL STATEMENTS 2020
Note 26 - Equity-accounted investees (Continued)
Vessels
On June 2, 2016,November 19, 2019, the Groupgroup entered into a share swapjoint venture together with affiliates of Ridgebury Tankers and claims transfer agreement (see Note 24). Asclients of Tufton Oceanic. Each 50%-50% joint venture company has acquired 1 Suezmax vessel. The joint ventures have acquired 2 Suezmax tankers (Bari & Bastia) for a result, the Group became the full ownertotal consideration of the two youngest vessels, the Captain Michael (2012 – 157,648 dwt) and the Maria (2012 – 157,523 dwt), while Bretta became the full owner$40.6 million. The vessel Bastia was sold on September 15, 2020 for a net sale price of the Devon and the Eugenie.
On November 23, 2016, Seven Seas Shipping Ltd delivered the VLCC V.K. Eddie (2005 – 305,261 dwt) to the Group after the sale announced on November 2, 2016 for USD 39.0$20.1 million. Seven Seas Shipping Ltd recognizedThe Company recorded a capital gain of USD 9.3$0.8 million on this transaction in the lastthird quarter of 2016. In the Group's consolidated financial statements, 50% of this gain was eliminated.2020 upon delivery to its new owner on September 30, 2020.
There were no0 capital commitments as of December 31, 2017,2020, December 31, 20162019 and December 31, 2015.2018.
Cash and cash equivalents
| | | | | | | | | | | | | | |
| (in thousands of USD) | | 2020 | | 2019 |
| | | | |
| Cash and cash equivalents of the joint ventures | | 7,137 | | | 6,913 | |
| Group's share of cash and cash equivalents | | 3,912 | | | 3,814 | |
| | | | |
Services
The Group entered into an agreement with its joint venture to manage commercially both vessels by the Group's chartering desk. Furthermore the Group also entered into an agreement to render accounting, assistance and administrative services. In 2020 the Group invoiced a total amount of $667,500 (2019: $18,222).
Furthermore, the joint venture entered into an agreement with the Group to invoice us management fees to do the follow up of the external shipmanagement. In 2020, the joint-venture invoiced the Group $453,600. (2019: $40,050).
|
| | | | | | |
| (in thousands of USD) | | 2017 | | 2016 |
| | | | | |
| Cash and cash equivalents of the joint ventures | | 8,608 |
| | 64,074 |
|
| Group's share of cash and cash equivalents | | 4,304 |
| | 32,037 |
|
| of which restricted cash | | — |
| | 6,789 |
|
NOTES TO CONSOLIDATED FINANCIAL STATEMENTS 20172020
Note 26 - Subsidiaries
The Group holds 100% of the voting rights in all of its subsidiaries (see Note 23).
In 2015 one new wholly owned subsidiary, Euronav Singapore Pte Ltd, incorporated in the second quarter of 2015 was included in the consolidation scope.
In 2016 the Group entered into a share swap and claims transfer agreement whereby the Group's equity interest in both Fiorano Shipholding Ltd. and Larvotto Shipholding Ltd. increased from 50% to 100%.
In the fourth quarter of 2017, Euronav NV incorporated a new subsidiary, Euronav MI Inc.
This subsidiary was incorporated in connection with the intended merger with Gener8 Maritime, Inc. (Note 24) and did not have any activities as at December 31, 2017.
Note 27 - Major exchange rates
The following major exchange rates have been used in preparing the consolidated financial statements:
| | | | | | | | | | | | | | | | | | | | | | | | | | | | | | | | | | | | | | |
| | | closing rates | | average rates |
| 1 XXX = x,xxxx USD | | December 31, 2020 | | December 31, 2019 | | December 31, 2018 | | 2020 | | 2019 | | 2018 |
| EUR | | 1.2271 | | | 1.1234 | | | 1.1450 | | | 1.1384 | | | 1.1213 | | | 1.1838 | |
| GBP | | 1.3649 | | | 1.3204 | | | 1.2800 | | | 1.2860 | | | 1.2755 | | | 1.3374 | |
|
| | | | | | | | | | | | | | | | | | |
| | | closing rates | | average rates |
| 1 XXX = x,xxxx USD | | December 31, 2017 | | December 31, 2016 | | December 31, 2015 | | 2017 | | 2016 | | 2015 |
| EUR | | 1.1993 |
| | 1.0541 |
| | 1.0887 |
| | 1.1249 |
| | 1.1061 |
| | 1.1154 |
|
| GBP | | 1.3517 |
| | 1.2312 |
| | 1.4833 |
| | 1.2880 |
| | 1.3662 |
| | 1.5315 |
|
Note 28 - Audit fees
The audit fees for the Group amounted to USD 0.9 million (2016: USD 1.0 million and 2015: USD 0.7 million). During the year the statutory auditor and persons professionally related to him performed additional audit related services amounting to USD 0.0 million (2016: USD 0.0 million and 2015: USD 0.2 million) and tax services for fees of USD 0.0 million (2016: USD 0.0 million and 2015: 0.0 million). The 2015 audit related services mainly related to the Group's series of capital transactions, including the Group's US listing.
Note 2928 - Subsequent events
On March 22, 2018, the Group signed a loan agreement for an amount of USD 173.6 million with the purpose of financing up to 70 per cent of the aggregate contract price of the four Ice Class Suezmax vessels (see Note 8).
On March 26, 2018,In January 2021, Euronav took delivery of the first Ice Class2 of 4 newbuildings, Delos (2021 – 300,200 dwt) and Diodorus (2021 – 300,200 dwt), which have been purchased in February 2020. In February 2021, Euronav took delivery of the third newbuilding, Doris (2021 – 300,200 dwt) and in March 2021, Euronav took delivery of the fourth newbuilding, Dickens (2021 – 300,200 dwt).
On February 3, 2021, Euronav announced it has entered into an agreement for the acquisition through resale of 2 eco-Suezmax newbuilding contracts. Currently completing construction at the Daehan Shipyard in South Korea, these modern vessels are being acquired for an en-bloc price of $113.0 million. Both vessels are due for delivery in January 2022. The vessels are the latest generation of Suezmax Cap Quebec (2018 - 156,600 dwt).Eco-type tankers. They will be fitted with Exhaust Gas Scrubber technology and Ballast Water Treatment systems. The vessels have the structural notation to be LNG Ready. Euronav is working closely with the shipyard to also have the structural notation to be Ammonia Ready. This provides the option to switch to other fuels at a later stage.
On February 23, 2021, Euronav announced that it has entered into a sale and leaseback agreement for the VLCC Newton (2009 – 307,284) with Taiping & Sinopec Financial Leasing Ltd Co. The vessel was sold for $36.0 million. The Company will record a capital gain of approximately $1.2 million in the first quarter of 2021 upon delivery to their new owners on February 22, 2021. Euronav has leased back the vessel under a 36 months bareboat contract at an average rate of $22,500 per day. At the end of the bareboat contract, the vessel will be redelivered to its owners.
On March 29, 2018, TI Asia Ltd and TI Africa Ltd concluded26, 2021, the Supervisory Board proposed the Annual Shareholders' meeting be held on May 20, 2021, to approve a USD 220.0 Senior Secured Credit Facility. The facility consistsfull year dividend for 2020 of a term loan$1.40 per share. Taking into account the interim dividends paid based on the Group’s policy to return 80% of USD 110.0 million and a revolving credit facility of USD 110.0 million for the purpose of refinancing the two FSOs as well as for general corporate purposes. The Group provided a guarantee for the revolving credit facility tranche.net income to shareholders , no closing dividend will be paid.