UNITED STATES
SECURITIES AND EXCHANGE COMMISSION
Washington D.C. 20549
FORM 20-F
☐ REGISTRATION STATEMENT PURSUANT TO SECTION 12(b) OR (g) OF THE SECURITIES EXCHANGE ACT OF 1934
OR
☒ ANNUAL REPORT PURSUANT TO SECTION 13 OR 15(d) OF THE SECURITIES EXCHANGE ACT OF 1934
For the fiscal year ended June 30, 20172022
OR
☐ TRANSITION REPORT PURSUANT TO SECTION 13 OR 15(d) OF THE SECURITIES EXCHANGE ACT OF 1934
For the transition period from __________ to __________
OR
☐ SHELL COMPANY REPORT PURSUANT TO SECTION 13 OR 15(d) OF THE SECURITIES EXCHANGE ACT OF 1934
Date of event requiring this shell company report.................report
Commission file number 000-38104
IMMURON LIMITED
(Exact name of Registrant as specified in its charter
and translation of Registrant’s name into English)
Australia
(Jurisdiction of incorporation or organization)
Level 3, 62 Lygon Street, Carlton South, Victoria, 3053, Australia 3053
(Address of principal executive offices)
Dr Jerry Kanellos, InterimMr. Steven Lydeamore, Chief Executive Officer
Level 3, 62 Lygon Street, Carlton South, Victoria, 3053, Australia 3053
+61 (0)3 9824 5254(phone);+61 (0)3 9822 7735(fax)
(Name, telephone, e-mail and/or facsimile number and address of company contact person)
Securities registered or to be registered pursuant to Section 12(b) of the Act:
| Title of each class | Trading Symbol | Name of each exchange on which registered | ||
American Depositary Shares, each representing | IMRN | The NASDAQ Stock Market LLC | ||
| Warrants | IMRNW | The NASDAQ
|
Securities registered or to be registered pursuant to Section 12(g) of the Act:None
Securities for which there is a reporting obligation pursuant to Section 15(d) of the Act:None
Indicate the number of outstanding shares of each of the issuer’s classes of capital or common stock as of the close of the period covered by the annual report:
Ordinary Shares, as of June 30, 2017…………………..130,041,4172022 227,798,346
Indicate by check mark if the registrant is a well-known seasoned issuer, as defined in Rule 405 of the Securities Act.
Yes ☐ No ☒
If this report is an annual or transition report, indicate by check mark if the registrant is not required to file reports pursuant to Section 13 or 15(d)15 (d) of the Securities Exchange Act of 1934.
Yes ☐ No ☒
Indicate by check mark whether the registrant (1) has filed all reports required to be filed by Section 13 or 15(d) of the Securities Exchange Act of 1934 during the preceding 12 months (or for such shorter period that the registrant was required to file such reports), and (2) has been subject to such filing requirements for the past 90 days.
Yes ☒ No ☐
Indicate by check mark whether the registrant has submitted electronically and posted on its corporate Web site, if any, every Interactive Data File required to be submitted and posted pursuant to Rule 405 of Regulation S-T (232.405(§2232.405 of this chapter) during the preceding 12 months (or for such shorter period that the registrant was required to submit and post such files).
Yes ☐☒ No ☐ [not applicable]
Indicate by check mark whether the registrant is a large accelerated filer, an accelerated filer, a non-accelerated filer, or an emerging growth company. See the definitions of “large accelerated filer,” “accelerated filer,” and “emerging growth company” in Rule 12b-2 of the Exchange Act.
| Large accelerated filer ☐ | Accelerated filer ☐ |
| Emerging growth company | Non-accelerated filer |
If an emerging growth company that prepares its financial statements in accordance with U.S. GAAP, indicate by check mark if the registrant has elected not to use the extended transition period for complying with any new or revised financial accounting standards† provided pursuant to Section 13(a) of the Exchange Act. ☐
† The term “new or revised financial accounting standard” refers to any update issued by the Financial Accounting Standards Board to its Accounting Standards Codification after April 5, 2012.
Indicate by check mark whether the registrant has filed a report on and attestation to its management’s assessment of the effectiveness of its internal control over financial reporting under Section 404(b) of the Sarbanes-Oxley Act (15 U.S.C. 7262(b)) by the registered public accounting firm that prepared or issued its audit report. ☐
Indicate by check mark which basis of accounting the registrant has used to prepare the financial statements included in this filing:
| U.S. GAAP ☐ | International Financial Reporting Standards as issued by the International Accounting Standards Board ☒ | Other ☐ |
If “Other” has been checked in response to the previous question, indicate by check mark which financial statement item the registrant has elected to follow:
Item 17 ☐ Item 18 ☐
If this is an annual report, indicate by check mark whether the registrant is a shell company (as defined in Rule 12b-2 of the Exchange Act).
Yes ☐ No ☒
INTRODUCTION
We are a commercial and clinical-stage biopharmaceutical company with a proprietary technology platform focused on the development and commercialization of a novel class of immunomodulatorspecifically targeted polyclonal antibodies that we believe can address significant unmet medical needs. This is a large addressable market which continues to grow as we seek to increase sales of our existing commercial products and to expand our product portfolio and distribution capability.
We currently market our flagship commercial products Travelan® and Protectyn® in Australia, where both products are listed medicines on the Australian Register for Therapeutic Goods. Travelan® (AUST L 106709) is an over-the-counter product indicated to reduce the risk of travelers’ diarrhea, reduce the risk of minor gastro-intestinal disorders and is antimicrobial and is sold in pharmacies throughout Australia. Protectyn® is currently sold online and in health practitioner clinics and is marketed as an immune supplement to help maintain a healthy digestive function and liver. We also market Travelan® (NPN 80046016) in Canada where it is licensed as a natural health product indicated to reduce the risk of travelers’ diarrhea, and presently market Travelan® in the U.S. as a dietary supplement for digestive tract protection.
Our oral polyclonal antibodies offer targeted delivery within the gastrointestinal (GI) track but(“GI”) tract and do not cross into the bloodstream, potentially leading to much improved safety and tolerability, without sacrificing efficacy. Our technology platform can be used to target viruses or bacteria and neutralize the toxins they produce at mucosal surfaces. We believe that our two lead immunomodulator productdrug candidates IMM-124E and IMM-529,currently entering the clinical development phase have the potential to transform the existing treatment paradigms for (Non Alcoholic Steatohepatitis) (“NASH”)moderate to severe campylobacteriosis, Enterotoxigenic Escherichia coli (ETEC) infections, travelers’ diarrhea and for ClostridiumClostridiodes difficile (“C.difficile(C.difficle) ”), respectively. We also market an over-the-counter (OTC) product, Travelan, that is the only product approved as a preventative to Traveler’s Diarrhea. Travelan is also based on the same technology. We recently began to market Protectyn,a health product targeting LPS bacteria in the gut to prevent gut dysbiosis, improve bacterial clearance, reduce chronic inflammation and improve immune function.The safety profile of our compounds, which have a Generally Regarded as Safe (“GRAS”) status, enables us to commercialize our platform-derived products through a range of regulatory pathways, including prescriptions (Rx), medical foods, OTC medicines and dietary supplements.infections.
OurAmerican Depositary Shares (each, an “ADS” and, collectively the “ADSs”) and warrants (each, a “Warrant”) are listed on theThe NASDAQ Capital Market under the symbols “IMRN” and “IMRNW”, respectively. Each ADS represents forty (40)40 of our ordinary shares. Each Warrant has a per ADS exercise price of US$10.00, and expires five years from the date of issuance.shares, no par value. Our ordinary shares are also listed on the Australian Securities Exchange under the symbol “IMC.”
Our consolidated financial statements appearing in this annual report are prepared in Australian dollars and in accordance with the International Financial Reporting Standards, or IFRS, as issued by the International Accounting Standards Board, or IASB. Our consolidated financial statements appearing in this annual report comply with the IFRS.
In this annual report, all references to “U.S. dollars” or “US$” are to the currency of the United States, and all references to “Australian dollars”, “A$” or “AUD$“$” are to the currency of Australia. Unless otherwise indicated or the context implies otherwise, items included in the financial statements of each of the group’s entities are measured using the currency of the primary economic environment in which the entity operates (‘the functional currency’). The consolidated financial statements are presented in Australian dollar (“A$” or “$”), which is Immuron Limited’s functional and presentation currency. Unless otherwise indicated or the context implies otherwise all references to “we,” “us,” or “ our”“our” refers to Immuron Limited, an Australian corporation.
Statements made in this annual report concerning the contents of any contract, agreement or other document are summaries of such contracts, agreements or documents and are not complete descriptions of all of their terms. If we filed any of these documents as an exhibit to this annual report or to any registration statement or annual report that we previously filed, you may read the document itself for a complete description of its terms.
Except for the historical information contained in this annual report, the statements contained in this annual report are “forward-looking statements” within the meaning of Section 27A of the Securities Act of 1933, as amended, and Section 21E of the Securities Exchange Act of 1934, as amended, or the Exchange Act, and the Private Securities Litigation Reform Act of 1995, as amended, with respect to our business, financial condition and results of operations. Such forward-looking statements reflect our current view with respect to future events and financial results. We urge you to consider that statements which use the terms “anticipate,” “believe,” “do not believe,” “expect,” “plan,” “intend,” “estimate,” and similar expressionsor the negative of these terms or other comparable terminology. are intended to identify forward-looking statements. We remind readers that forward-looking statements are merely predictions and therefore inherently subject to uncertainties and other factors and involve known and unknown risks that could cause the actual results, performance, levels of activity, or our achievements, or industry results, to be materially different from any future results, performance, levels of activity, or our achievements expressed or implied by such forward-looking statements. Readers are cautioned not to place undue reliance on these forward-looking statements, which speak only as of the date hereof. Except as required by applicable law, including the securities laws of the United States, we undertake no obligation to publicly release any update or revision to any forward-looking statements to reflect new information, future events or circumstances, or otherwise after the date hereof. We have attempted to identify significant uncertainties and other factors affecting forward-looking statements in the Risk Factors section that appears in Item 3.D. “Key Information-Risk Factors.”
ii Australian Disclosure Requirements
Our ordinary shares are primarily quoted on the Australian Securities Exchange (“ASX”) in addition to our listing of our ADSs on the NASDAQ Global Select Market. As part of our ASX listing, we are required to comply with various disclosure requirements as set out under the Australian Corporations Act 2001 and the ASX Listing Rules. Information furnished under the sub-heading “Australian Disclosure Requirements” is intended to comply with ASX listing and Corporations Act 2001 disclosure requirements and is not intended to fulfill information required by this annual report on Form 20F.
TABLE OF CONTENTS
iii i
iv
ii
PART I
ITEM 1. IDENTITY OF DIRECTORS, SENIOR MANAGEMENT AND ADVISERS
Not applicable.
ITEM 2. OFFER STATISTICS AND EXPECTED TIMETABLE
Not applicable.
ITEM 3. KEY INFORMATION
A. Selected Consolidated Financial Data
We prepare ourThe tables below set forth selected consolidated financial statements in accordance with IFRS,data as issued by the IASB.
The following selected consolidated statement of operations dataand for the fiscalfive years ended June 30, 2017, 20162022, which is derived from our audited consolidated financial statements. The audited consolidated financial statements as of June 30, 2022 and 20152021 appear in this annual report. The consolidated income statement data for the years ended June 30, 2022, 2021 and 2020 and the selected consolidated balance sheet data as of June 30, 20172022 and 2016,2021 are derived from our audited consolidated financial statements included in “ITEM 18: Financial Statements”. The consolidated financial data as of June 30, 2020, 2019 and 2018 and for the years ended June 30, 2019 and 2018 have been derived from our audited consolidated financial statements, included elsewhere in this annual report. Selected consolidated balance sheet data as of June 30, 2015 has been derived from our audited consolidated financial statementswhich are not included in this annual report.
The selected consolidated financial data set forth below should be read in conjunction with and is qualified entirely by reference to Item 5. “Operating“Operating and Financial Review and Prospects”Prospects” and our consolidated financial statements and notes thereto included elsewhere in this annual report.
Statement of Comprehensive Income:
| For the year ended June 30, | ||||||||||||
2017 AUD$ | 2016 AUD$ | 2015 AUD$ | ||||||||||
| Consolidated Statement of Profit or Loss and Other Comprehensive Income Data: | ||||||||||||
| Revenue: | ||||||||||||
| Operating Revenue | 1,396,197 | 1,001,077 | 1,002,380 | |||||||||
| Total Operating Revenue | 1,396,197 | 1,001,077 | 1,002,380 | |||||||||
| Cost of Goods Sold | (337,546 | ) | (301,435 | ) | (316,128 | ) | ||||||
| Gross Profit | 1,058,651 | 699,642 | 686,252 | |||||||||
| Sales and Marketing Costs | (407,751 | ) | (133,781 | ) | (76,794 | ) | ||||||
| Freight Costs | (135,377 | ) | (134,967 | ) | (116,379 | ) | ||||||
| Total Gross Profit less Direct Selling Costs | 515,523 | 430,894 | 493,079 | |||||||||
| Other Income | 1,614,373 | 1,539,015 | 1,591,021 | |||||||||
| Expenses: | ||||||||||||
| Consulting, Employee and Director | (1,689,521 | ) | (2,840,037 | ) | (728,140 | ) | ||||||
| Corporate Administration | (1,381,809 | ) | (1,320,570 | ) | (557,422 | ) | ||||||
| Depreciation | (4,922 | ) | (3,892 | ) | (3,719 | ) | ||||||
| Finance Costs | (24,483 | ) | (341,600 | ) | — | |||||||
| Impairment of Inventory | (136,494 | ) | (4,176 | ) | (35,340 | ) | ||||||
| Marketing and Promotion | (789,608 | ) | (487,591 | ) | (304,687 | ) | ||||||
| Research and Development | (4,630,674 | ) | (3,623,961 | ) | (3,018,294 | ) | ||||||
| Travel and Entertainment | (276,539 | ) | (416,849 | ) | (128,318 | ) | ||||||
| Loss before income tax | (6,804,154 | ) | (7,068,767 | ) | (2,691,820 | ) | ||||||
| Income tax expense | — | — | — | |||||||||
| Loss for the period | (6,804,154 | ) | (7,068,767 | ) | (2,691,820 | ) | ||||||
| Other Comprehensive Income / (Loss) | 40,017 | 8,846 | (12,581 | ) | ||||||||
| Total Comprehensive Loss for the Period | (6,764,137 | ) | (7,059,921 | ) | (2,704,401 | ) | ||||||
| Loss per share, basic and diluted (in cents per share) | $ | 6.400 | $ | 9.248 | $ | 3.592 | ||||||
| Weighted-average number of shares outstanding, basic and diluted | 105,866,110 | 76,435,993 | 74,935,902 | |||||||||
| As of June 30, | ||||||||||||
2017 AUD$ | 2016 AUD$ | 2015 AUD$ | ||||||||||
| Consolidated Statement of Financial Position Data: | ||||||||||||
| Cash and cash equivalents | 3,994,924 | 2,290,639 | 3,116,074 | |||||||||
| Total current assets | 8,267,654 | 8,809,421 | 5,998,898 | |||||||||
| Total assets | 8,286,491 | 8,827,484 | 6,018,412 | |||||||||
| Total current liabilities | 1,711,565 | 3,886,921 | 1,207,810 | |||||||||
| Total liabilities | 1,711,565 | 3,886,921 | 1,207,810 | |||||||||
| Total equity | 6,574,926 | 4,940,563 | 4,810,602 | |||||||||
Exchange Rate Information
The following tables set forth, for the periods and dates indicated, certain information regarding the rates of exchange of A$1.00 into US$ based on rates published by the Reserve Bank of Australia (RBA). Each period end rate is the average ask price for the day. The average rate is the average of all the ask prices for the given time period. The high rate is the highest bid rate for the given time period. The low rate is the lowest bid rate for the given time period. We make no representation that any Australian dollar or U.S. dollar amounts could have been, or could be, converted into U.S. dollars or Australian dollars, as the case may be, at any particular rate, the rates stated below, or at all.
The Australian dollar is convertible into U.S. dollars at freely floating rates. There are no legal restrictions on the flow of Australian dollars between Australia and the U.S.
Year Ended June 30, | At Period End | Average Rate | High | Low | ||||
| 2013 | 0.9275 | 1.0271 | 1.0593 | 0.9202 | ||||
| 2014 | 0.9420 | 0.9187 | 0.9672 | 0.8716 | ||||
| 2015 | 0.7680 | 0.8382 | 0.9452 | 0.7590 | ||||
| 2016 | 0.7426 | 0.7283 | 0.7812 | 0.6867 | ||||
| 2017 | 0.7692 | 0.7545 | 0.7724 | 0.7202 |
Month | High | Low |
| April 2017 | 0.7602 | 0.7475 |
| May 2017 | 0.7539 | 0.7352 |
| June 2017 | 0.7692 | 0.7390 |
| July 2017 | 0.8046 | 0.7585 |
| August 2017 | 0.8011 | 0.7842 |
| September 2017 | 0.8121 | 0.7813 |
The exchange rate on October 31, 2017 was US$0.7656 = A$1.00.
Not applicable.
Not applicable.
| For the year ended June 30, | ||||||||||||||||||||
2022 A$ | 2021 A$ | 2020 A$ | 2019 A$ | 2018 A$ | ||||||||||||||||
| Consolidated Statement of Profit or Loss and Other Comprehensive Income Data: | ||||||||||||||||||||
| Revenue from contracts with customers | 765,193 | 145,776 | 2,518,566 | 2,387,426 | 1,842,909 | |||||||||||||||
| Cost of Goods Sold | (241,691 | ) | (51,071 | ) | (688,836 | ) | (667,371 | ) | (418,693 | ) | ||||||||||
| Gross Profit | 523,502 | 94,705 | 1,829,730 | 1,720,055 | 1,424,216 | |||||||||||||||
| Other Income | 957,725 | 617,110 | 473,674 | 532,050 | 1,849,163 | |||||||||||||||
| Net foreign exchange gains/(losses)* | 247,558 | (582,528 | ) | 11,335 | 51,807 | 258,767 | ||||||||||||||
| Net impairment losses* | — | (759,765 | ) | — | (13,394 | ) | (163,600 | ) | ||||||||||||
| Expenses: | ||||||||||||||||||||
| General and administrative expenses | (3,524,388 | ) | (6,094,692 | ) | (3,170,078 | ) | (5,037,806 | ) | (3,470,229 | ) | ||||||||||
| Research and development expenses | (657,715 | ) | (1,367,054 | ) | (1,178,685 | ) | (1,044,528 | ) | (2,257,224 | ) | ||||||||||
| Selling and marketing expenses | (416,537 | ) | (287,684 | ) | (871,551 | ) | (864,644 | ) | (686,714 | ) | ||||||||||
| Operating loss | (2,869,855 | ) | (8,379,908 | ) | (2,905,575 | ) | (4,656,460 | ) | (3,045,621 | ) | ||||||||||
| Finance income | 21,785 | 9,204 | — | 39 | 1,238 | |||||||||||||||
| Finance expenses | (6,184 | ) | (13,761 | ) | (21,631 | ) | — | (24,199 | ) | |||||||||||
| Finance costs - net | 15,601 | (4,557 | ) | (21,631 | ) | 39 | (22,961 | ) | ||||||||||||
| Loss before income tax | (2,854,254 | ) | (8,384,465 | ) | (2,927,206 | ) | (4,656,421 | ) | (3,068,582 | ) | ||||||||||
| Income Tax Expense | — | — | — | — | — | |||||||||||||||
| Loss for the period | (2,854,254 | ) | (8,384,465 | ) | (2,927,206 | ) | (4,656,421 | ) | (3,068,582 | ) | ||||||||||
Other comprehensive income | ||||||||||||||||||||
| Items that may be reclassified to profit or loss: | ||||||||||||||||||||
| Exchange differences on translation of foreign operations | 6,708 | (14,953 | ) | 102,938 | 61,846 | (79,599 | ) | |||||||||||||
| Total Comprehensive Loss for the Period | (2,847,546 | ) | (8,399,418 | ) | (2,824,268 | ) | (4,594,575 | ) | (3,148,181 | ) | ||||||||||
| Loss per share, basic and diluted (in cents per share) | (1.25 | ) | (3.79 | ) | (1.66 | ) | (3.22 | ) | (2.30 | ) | ||||||||||
| Weighted-average number of shares outstanding, basic and diluted | 227,579,684 | 221,062,229 | 176,393,354 | 144,740,535 | 133,660,556 | |||||||||||||||
| As of June 30, | ||||||||||||||||||||
| 2022 A$ | 2021 A$ | 2020 A$ | 2019 A$ | 2018 A$ | ||||||||||||||||
| Consolidated Statement of Financial Position Data: | ||||||||||||||||||||
| Cash and cash equivalents | 22,110,278 | 25,047,281 | 3,250,468 | 5,119,887 | 4,727,430 | |||||||||||||||
| Total current assets | 23,672,152 | 25,752,778 | 4,409,041 | 6,682,444 | 7,050,437 | |||||||||||||||
| Total assets | 24,855,824 | 27,053,106 | 6,202,163 | 8,561,647 | 9,242,688 | |||||||||||||||
| Total current liabilities | 1,502,976 | 1,121,853 | 516,411 | 1,195,531 | 803,338 | |||||||||||||||
| Total liabilities | 1,678,423 | 1,158,049 | 558,250 | 1,210,511 | 803,338 | |||||||||||||||
| Total equity | 23,177,401 | 25,895,057 | 5,643,913 | 7,351,136 | 8,439,350 | |||||||||||||||
B. Capitalization and Indebtedness
Not applicable.
C. Reasons for the Offer and Use of Proceeds
Not applicable.
D. Risk Factors
Investing in our American Depositary SharesADSs involves a high degree of risk and uncertainty. You should carefully consider the risks and uncertainties described below before investing in our American Depositary Shares.ADSs. Additional risks and uncertainties not presently known to us or that we believe to be immaterial may also adversely affect our business. If any of the following risks actually occurs, our business, prospects, financial condition and results of operations could be harmed. In that case, the daily price of our depositary sharesADSs could decline, and you could lose all or part of your investment.
Summary of Risk Factors
The following summarizes some, but not all, of the risks provided below. Please carefully consider all of the information discussed in this Item 3.D. “Risk Factors” in this annual report for a more thorough description of these and other risks:
Summary of Risks Related to Our Financial Condition
As a company predominantly focused on theundertaking research and development activities of our existing patent portfolio pipeline we have incurred operating losses; we expect tomay continue to incur operating losses for the foreseeable future and may never achieve or maintain profitability.
Summary of Risks Related to Our Business
Clinical trials are expensive and time consuming, and their outcome is uncertain.
We may not be successful in obtaining or maintaining other rights necessary for the development of our pipeline through acquisitions and in-licenses.
We grant licenses to our collaborators to use our hyper-immune colostrum technology exclusively for the development of product candidates for certain conditions.
We may not be able to complete the development of IMM-124E, IMM-529 or develop other pharmaceutical products.
Our research and development efforts will be seriously jeopardized if we are unable to retain key personnel and cultivate key academic and scientific collaborations.
Acceptance of our products in the marketplace is uncertain, and failure to achieve market acceptance will negatively impact our business and operations.
We face competition from entities that have developed or may develop product candidates for our target disease indications, including companies developing novel treatments and technology platforms based on modalities and technology similar to ours. If these companies develop technologies or product candidates more rapidly than we do or their technologies, including delivery technologies, are more effective, our ability to develop and successfully commercialize product candidates may be compromised.
Our product candidates and the process for administering our product candidates may cause undesirable side effects or have other properties that could delay or prevent their regulatory approval, limit the commercial profile of an approved label, or result in significant negative consequences following any potential marketing approval.
We currently depend upon a sole manufacturer of our lead compound and on a sole manufacturer to produce finished drug products and could incur significant costs and delays if we are unable to promptly find a replacement for either of them.
Our future prospects may also be dependent on our or our collaborators’ ability to successfully develop a pipeline of additional product candidates, and we and our collaborators may not be successful in efforts to use our platform technologies to identify or discover additional product candidates.
We may not be able to obtain orphan drug exclusivity for some of our product candidates.
Summary of Risks Related to Government Regulation
If we do not obtain the necessary governmental approvals, we will be unable to commercialize our pharmaceutical products.
Our product candidates are based on our hyper-immune colostrum technology. Currently, no prescription product candidates utilizing our technology have been approved for commercial sale and our approach to the development of our technology may not result in safe, effective or marketable products.
We are early in our product development efforts and have only two product candidates in early-stage clinical trials. All of our other current product candidates are still in preclinical development. We have no late-stage clinical trials (post-proof of concept) and may not be able to obtain regulatory approvals for the commercialization of some or all of our product candidates.
Summary of Risks Related to Our Intellectual Property
Our success depends upon our ability to protect our intellectual property and our proprietary technology, to operate without infringing the proprietary rights of third parties and to obtain marketing exclusivity for our products and technologies.
We may face difficulties in certain jurisdictions in protecting our intellectual property rights, which may diminish the value of our intellectual property rights in those jurisdictions.
Confidentiality agreements with employees and others may not adequately prevent disclosure of trade secrets and protect other proprietary information.
Summary of Risks Related to Our Securities
The dual listing of our ordinary shares and the ADSs may adversely affect the liquidity and value of the ADS.
As a foreign private issuer, we are permitted, and we expect to follow certain home country corporate governance practices in lieu of certain NASDAQ requirements applicable to domestic issuers. This may afford less protection to holders of our ADSs.
As a foreign private issuer, we are permitted to file less information with the SEC than a company incorporated in the U.S. Accordingly, there may be less publicly available information concerning us than there is for companies incorporated in the U.S.
If we fail to comply with the rules under the Sarbanes-Oxley Act of 2002 related to accounting controls and procedures in the future, or, if we discover additional material weaknesses and other deficiencies in our internal control and accounting procedures, the price of our ordinary shares and ADSs could decline significantly and raising capital could be more difficult.
ADS holders may be subject to additional risks related to holding ADS rather than ordinary shares.
Our Constitution and Australian laws and regulations applicable to us may adversely affect our ability to take actions that could be beneficial to our shareholders.
You will have limited ability to bring an action against us or against our directors and officers, or to enforce a judgment against us or them, because we are incorporated in Australia and certain of our directors and officers reside outside the U.S.
Australian companies may not be able to initiate shareholder derivative actions, thereby depriving shareholders of the ability to protect their interests.
Anti-takeover provisions in our Constitution and our right to issue preference shares could make a third-party acquisition of us difficult.
Risks Related to Our Financial Condition
COVID-19
Judgement has been exercised in considering the impacts that the Coronavirus (COVID-19) pandemic has had, or may have, on the group based on known information. This consideration extends to the nature of the products and services offered, customers, supply chain, staffing and geographic regions in which the group operates. Sales of Travelan have significantly dropped from March 2020, however during the fiscal year 2022 sales have started to recover.
As a company undertaking research and development activities of our existing patent portfolio we have incurred operating losses; we may continue to incur operating losses for the foreseeable future and may never achieve or maintain profitability.
We have incurred losses in every period since we began operations in 1994 and we have reported net losses of A$6,804,154,2,854,254, A$7,068,7678,384,465, A$2,927,206, A$4,656,421 and A$2,691,8203,068,582 during the fiscal years ended June 30, 2017, 20162022, 2021, 2020, 2019 and 2015,2018, respectively. As of June 30, 2017,2022, our accumulated deficit was A$49,528,486.68,425,281. We are budgeting tomay continue to incur additional operating losses for the next several years as we expand our research and development activities in fatty-liverfor the treatment of infectious diseases, commence new trials for our product candidate IMM-529 for C.difficile, and potential other assets/indications. We may never be able to achieve or maintain profitability.
Our actual cash requirements may vary materially from those now planned and will depend upon numerous factors, including:
| ● | the continued increase in sales of our marketed products, Travelan® and Protectyn®; | |
| ● | the continued progress of our research and development programs; |
| ● | the timing, scope, results and costs of pre-clinical studies and clinical trials; |
| ● | the cost, timing and outcome of regulatory submissions and approvals; |
| ● | determinations as to the commercial potential of our product candidates; |
| ● | spending on our marketed assets; |
| ● | our ability to successfully expand our contract manufacturing services; |
| ● | our ability to establish and maintain collaborative arrangements; and |
| ● | the status and timing of competitive developments. |
As of June 30, 2017, our2022, we had A$22,110,278 in cash and cash equivalents were A$3,994,924.equivalents. Developing prescription products is expensive and we willmay need to secure additional financing in order to continue to meet our longer-term business objectives, including advancement of our research and development programs. We may also require additional funds to pursue regulatory clearances, defend our intellectual property rights, establish commercial scale manufacturing facilities, develop marketing and sales capabilities and fund operating expenses. We intend tomay seek such additional funding through public or private financings and/or through licensing of our assets or strategic alliances or other arrangements with corporate partners. The global economic climate could adversely impact our ability to obtain such funding, license our assets or enter into alliances or other arrangements with corporate partners. Any shortfall in funding could result in our having to curtail or cease our operations, including our research and development activities, which would be expected to adversely affect our business, financial condition and results of operations.
We have never generated any revenue from prescription product sales and this area of our business may never be profitable.
Our ability to generate significant revenue from prescription products and achieve profitability depends on our ability to, alone or with strategic collaboration partners, successfully complete the development of and obtain the regulatory approvals for our prescription product candidates, to manufacture sufficient supply of our product candidates, to establish a sales and marketing organization or suitable third-party alternative for the marketing of any approved products and to successfully commercialize any approved products on commercially reasonable terms. All of these activities will require us to raise sufficient funds to finance business activities. Currently, we do not expect any milestone payments from our collaborative partners to be significant in the foreseeable future howeverfuture. However, we are actively pursuing potential partner collaboration. In addition, we do not anticipate generating revenue from commercializing new product candidates for the foreseeable future, if ever.
Our ability to generate future revenues from commercializing our intellectual property (IP)(“IP”) assets depends heavily on our success in:
| ● | increasing sales of commercial products through investment in sales and marketing initiatives, expansion in sales channels and geographies, product development and broader applications; | |
| ● | establishing proof of concept in preclinical studies and clinical trials for our product candidates; |
| ● | successfully completing clinical trials of our product candidates; |
| ● | obtaining regulatory and marketing approvals for product candidates for which we complete clinical trials; |
| ● | maintaining, protecting and expanding our intellectual property portfolio, and avoiding infringing on intellectual property of third parties; |
| ● | establishing and maintaining successful licenses, collaborations and alliances with third parties; |
| ● | developing a sustainable, scalable, reproducible and transferable manufacturing process for our product candidates; |
| ● | establishing and maintaining supply and manufacturing relationships with third parties that can provide products and services adequate, in amount and quality, to support clinical development and commercialization of our product candidates, if approved; |
| ● | launching and commercializing any product candidates for which we obtain regulatory and marketing approval, either by collaborating with a partner or, if launched independently, by establishing a sales, marketing and distribution infrastructure; |
| ● | obtaining market acceptance of any product candidates that receive regulatory approval as viable treatment options; |
| ● | obtaining favorable coverage and reimbursement rates for our products from third-party payors; |
| ● | addressing any competing technological and market developments; |
| ● | identifying and validating new product candidates; and |
| ● | negotiating favorable terms in any collaboration, licensing or other arrangements into which we may enter. |
The process of developing product candidates for fatty-liverthe prevention and anti-infective conditionstreatment of gut mediated pathogens contains a number ofseveral inherent risks and uncertainties, including clinical and regulatory risks.
Even if one or more of our product candidates is approved for commercial sale, we may incur significant costs associated with commercializing any approved product candidate. As one example, our expenses could increase beyond expectations if we are required by the Food and Drug Administration, or FDA, or other regulatory agencies, domestic or foreign, to perform clinical and other studies in addition to those that we currently anticipate. Even if we are able to generate revenues from the sale of any approved products, we may not become profitable and may need to obtain additional funding to continue operations, which could have an adverse effect on our business, financial condition, results of operations and prospects.
We are a commercial and development stage company and our success is uncertain.
We are a clinical development stagecommercial and clinical-stage biopharmaceutical company and our pharmaceutical products are designed to treat a range of anti-inflammatory and anti-infectives.infectious diseases. Other than our Travelan and Protectyn products, we have not sufficiently advanced the development of any of our products, including our current lead product candidate, IMM-124E, to market or generate revenues from their commercial application. Our current or any future product candidates, if successfully developed, may not generate sufficient or sustainable revenues to enable us to be profitable.
We receive Australian government research and development income tax concessionincentive refunds. If our research and development expenditures are not deemed to be eligible for the refund, we may encounter difficulties in the funding of future research and development projects, which could harm our operating results.
We have historically received, and expect to continue to receive, refunds from the Australian Federal Government’s Research and Development Tax Incentive program, under which the government provides a cash refund for the 43.5% of eligible research and development expenditures by small to medium size Australian entities during the year ended June 30, 2017,2022, which are defined as Australian entities with less than A$20 million in revenue, having a tax loss.
The Research and Development Tax Incentive refunds are made by the Australian federal government for eligible research and development purposes based on the filing of an annual application and subsequent income tax returns for the fiscal year. We recognized Research and Development Tax Concession Incentive refunds in the fiscal years ended June 30, 2016,2021, June 30, 20152020, June 30, 2019 and June 30, 2018 of A$1,512,840,356,209, A$1,478,581,308,225, A$531,005 and A$1,849,123, respectively, and we have recognized - A$1,575,315257,500 for the fiscal year ended June 30, 2017,2022, that includes an estimate of the receipt for the claim yet to be filed.
These refunds are available to fund our company’s ongoing activities including our research and development activities in Australia, as well as activities in Europe, the U.S. and Israel to the extent such overseas-based expenses relate to our activities in Australia, do not exceed half the expenses for the relevant activities and are approved by the Australian government. To the extent our research and development expenditures are deemed to be “ineligible,” then our refunds would decrease. In addition, the Australian government may in the future modify the requirements of or reduce the amounts or percentage claimable in turn reducing the refunds available under the Research and Development Tax Incentive program, or discontinue the incentive program entirely. Any such change in the Research and Development Tax Incentive program would have a negative effect on our future cash flows and our potential associated future expenditures.
Risks Related to Our Business
A variety of general risk factors associated with commercializing our products and product candidates internationally could materially adversely affect our business.
We, or our licensing partners, may seek regulatory approval for our products or product candidates in multi- jurisdictions, accordingly, we expect that we will be subject to additional risks for our products and product candidates related to operating in foreign countries if we obtain the necessary approvals, including:
| ● | differing regulatory requirements in foreign countries; |
| ● | unexpected changes in tariffs, trade barriers, price and exchange controls and other regulatory requirements; |
| ● | economic weakness, including inflation, or political instability in particular foreign economies and markets; |
| ● | compliance with tax, employment, immigration and labour laws for employees living or traveling abroad; |
| ● | foreign taxes, including withholding of payroll taxes; |
| ● | foreign currency fluctuations, which could result in increased operating expenses and reduced revenues, and other obligations incident to doing business in another country; |
| ● | difficulties staffing and managing foreign operations; |
| ● | workforce uncertainty in countries where labour unrest is more common than in the U.S.; |
| ● | potential liability under the Foreign Corrupt Practices Act of 1977 or comparable foreign regulations; |
| ● | challenges enforcing our contractual and intellectual property rights, especially in those foreign countries that do not respect and protect intellectual property rights to the same extent as in the EU or the U.S.; |
| ● | production shortages resulting from any events affecting raw material supply or manufacturing capabilities abroad; and |
| ● | business interruptions resulting from geo-political actions, including war and terrorism. |
These and other risks associated with our or our licensing partners’ international operations may materially adversely affect our ability to attain or maintain profitable operations.
We are faced with uncertainties related to our research.
Our research programs are based on scientific hypotheses and experimental approaches that may not lead to desired results. In addition, the timeframe for obtaining proof of principle and other results may be considerably longer than originally anticipated, or may not be possible given time, resource, financial, strategic and collaborator scientific constraints. Success in one stage of testing is not necessarily an indication that the particular program will succeed in later stages of testing and development. It is not possible to predict whether any of the drugs designed for these programs will prove to be safe, effective, and suitable for human use. Each drug will require additional research and development, scale-up, formulation and extensive clinical testing in humans. Unsatisfactory results obtained from a particular study relating to a program may cause us to abandon our commitment to that program or to the lead compound or product candidate being tested. The discovery of toxicities, lack of sufficient efficacy, unacceptable pharmacology, inability to increase scale of manufacture, market attractiveness, regulatory hurdles, competition, as well as other factors, may make our targets, lead therapies or product candidates unattractive for further development or unsuitable for human use, and we may abandon our commitment to that program, target, lead therapy or product candidate. Any delay in obtaining or failure to obtain required approvals could materially and adversely affect our ability to generate revenue from the particular product candidate, which likely would result in significant harm to our financial position and adversely impact the price of the ADS. Furthermore, any regulatory approval to market a product may be subject to limitations on the indicated uses for which we may market the product. These limitations may limit the size of the market for the product.
Clinical trials are expensive and time consuming, and their outcome is uncertain.
In order to obtain approvals to market a new drug product, we or our potential partners must demonstrate proof of safety and efficacy in humans. To meet these requirements, we or our potential partners will have to conduct extensive preclinical testing and “adequate and well-controlled”well- controlled” clinical trials. Conducting clinical trials is a lengthy, time-consuming and expensive process. The length of time may vary substantially according to the type, complexity, novelty and intended use of the product candidate, and often can be several years or more per trial. Even if we obtain positive results from preclinical or initial clinical trials, we may not achieve the same success in future trials. Clinical trials may not demonstrate statistically sufficient safety and effectiveness to obtain the requisite regulatory approvals for product candidates employing our technology. The failure of clinical trials to demonstrate safety and efficacy for a particular desired indication could harm development of that product candidate for other indications as well as other product candidates.
We expect to commence new clinical trials from time to time in the course of our business as our product development work continues. Any change in, or termination of, our clinical trials could materially harm our business, financial condition and results of operations.
We rely on third parties to conduct our preclinical studies and clinical trials. If these third parties do not meet our deadlines or otherwise conduct the studies as required, we may be delayed in progressing, or ultimately may not be able to progress, product candidates to clinical trials, our clinical development programs could be delayed or unsuccessful, and we may not be able to commercialize or obtain regulatory approval for our product candidates when expected, or at all.
We do not have the ability to conduct all aspects of our preclinical testing or clinical trials ourselves. We are dependent on third parties to conduct the clinical trials for IMM-124E and IMM-529, and preclinical studies for our other product candidates, and therefore the timing of the initiation and completion of these trials and studies is reliant on third parties and may occur at times substantially different from our estimates or expectations.
If we cannot contract with acceptable third parties on commercially reasonable terms, or if these third parties do not carry out their contractual duties, satisfy legal and regulatory requirements for the conduct of preclinical studies or clinical trials or meet expected deadlines, our clinical development programs could be delayed or discontinued.
We may experience delays in one or any of our clinical trial programprograms that could have an adverse effect on our business and operations, and future commercialization opportunities of our clinical pipeline.
To the extendextent we do our best to plan and mitigate against known risk aspects of our clinical trial programs, we do not know with any certainty whether the planned clinical trials will begin on time, whether we will complete any of our clinical trials on schedule, or at all, or within the forecasted budget. Our ability to commence and complete clinical trials may be delayed by many factors, including, but not limited to:
| ● | government or regulatory delays, including delays in obtaining approvals from applicable hospital ethics committees and internal review boards; |
| ● | slower than expected patient enrollment; |
| ● | our inability to manufacture sufficient quantities of our new proprietary compound or our other product candidates or matching controls; |
| ● | unforeseen safety issues; or |
| ● | lack of efficacy or unacceptable toxicity during the clinical trials or non-clinical studies. |
Patient enrollment is a function of, among other things, the nature of the clinical trial protocol, the existence of competing protocols, the size and longevity of the target patient population, and the availability of patients who comply with the eligibility criteria for the clinical trial. Delays in planned patient enrollment may result in increased costs, delays or termination of the clinical trials. Moreover, we rely on third parties such as clinical research organizations to assist us in clinical trial management functions including;including clinical trial database management, statistical analyses, site management and monitoring. Any failure by these third parties to perform under their agreements with us may cause the trials to be delayed or result in a failure to complete the trials.
If we experience delays in testing, the grainin gaining the receipt of necessary approvals, or if we need to perform more, larger or more complex clinical trials than planned, our product development costs may increase. Significant delays could adversely affect the commercial prospects of our product candidates and our business, financial condition and results of operations.
We may not be successful in obtaining or maintaining other rights necessary for the development of our pipeline through acquisitions and in-licenses.
Our product candidates may require specific formulations to work effectively, and efficiently, and rights to such formulations may be held by others. We may be unable to acquire or in-license any compositions, methods of use, processes or other third-party intellectual property rights from third parties that we identify on terms that we find acceptable, or at all. The licensing and acquisition of third-party intellectual property rights is a competitive area, and a number of more established companies are also pursuing strategies to license or acquire third-party intellectual property rights that we may consider attractive. These established companies may have a competitive advantage over us due to their size, cash resources and greater clinical development and commercialization capabilities.
For example, we sometimes collaborate with U.S. and foreign academic institutions to accelerate our preclinical research or development under written agreements with these institutions. Typically, these institutions provide us with an option to negotiate a license to any of the institution’s rights in technology resulting from the collaboration. Regardless of such right of first negotiation for intellectual property, we may be unable to negotiate a license within the specified time frame or under terms that are acceptable to us. If we are unable to do so, the institution may offer the intellectual property rights to other parties, potentially blocking our ability to pursue our program.
In addition, companies that perceive us to be a competitor may be unwilling to assign or license rights to us. We also may be unable to license or acquire third-party intellectual property rights on terms that would allow us to make an appropriate return on our investment. If we are unable to successfully obtain rights to required third-party intellectual property rights, our business, financial condition and prospects for growth could suffer.
We rely on research institutions to conduct our clinical trials and we may not be able to secure and maintain research institutions to conduct our future trials.
Our reliance upon research institutions, including public and private hospitals and clinics, provides us with less control over the timing and cost of clinical trials, clinical study management personnel and the ability to recruit subjects. If we are unable to reach agreements with suitable research institutions on acceptable terms, or if any resulting agreement is terminated, we may be unable to secure, maintain, or quickly replace the research institution with another qualified institution on acceptable terms.
We grant licenses to our collaborators to use our hyper-immune colostrum technology exclusively for the development of product candidates for certain conditions.
We may out-license to our collaborators the right to use our hyper-immune colostrum technology for the development of product candidates for certain conditions, so long as our collaborators comply with certain requirements. That means that once our technology is licensed to a collaborator for a specified condition, we are generally prohibited from developing product candidates for that condition and from licensing to any third party for that condition. The limitations imposed by these exclusive licenses could prevent us from expanding our business and increasing our development of product candidates with new collaborators, both of which could adversely affect our business and results of operations.
We may not be able to complete the development of IMM-124E, IMM-529 or develop other pharmaceutical products.
We may not be able to progress with the development of our current, or any future, pharmaceutical product candidates to a stage that will attract a suitable collaborative partner for the development of any current or future pharmaceutical product candidates. The projects initially specified in connection with any such collaboration and any associated funding may change or be discontinued as a result of changing interests of either the collaborator or us, and any such change may change the budget for the projects under the collaboration. Additionally, our research may not lead to the discovery of additional product candidates, and any of our current and future product candidates may not be successfully developed, prove to be safe and efficacious in clinical trials, meet applicable regulatory standards and receive regulatory approval, be capable of being produced in commercial quantities at reasonable costs, or be successfully or profitably marketed, either by us or a collaborative partner. The products we develop may not be able to penetrate the potential market for a particular therapy, or indication, or gain market acceptance among health care providers, patients and third-party payers. We cannot predict if or when the development of IMM-124E, IMM-529 or any future pharmaceutical product will be completed or commercialized, whether funded by us, as part of a collaboration or through a grant.
We may need to prioritize the development of our most promising candidates at the expense of the development of other products.
We may need to prioritize the allocation of development resources and/or funds towards what we believe to be our most promising product or products. The nature of the drug development process is such that there is a constant availability of new information and data whichthat could positively or adversely affect any of our products in development. We cannot predict how such new information and data may impact in the future the prioritization of the development of our current or future product candidates or that any of our products, regardless of its development stage or the investment of time and funds in its development, will continue to be funded or developed.
Our research and development efforts will be seriously jeopardized if we are unable to retain key personnel and cultivate key academic and scientific collaborations.
Our future success depends to a large extent on the continued services of our senior management and key scientific personnel, including Dr. Jerry Kanellos (PhD)Mr Steven Lydeamore who is currently our Interim Chief Executive Officer and Dr. Jerry Kanellos who is currently our Chief Operating and Scientific Officer, and Dr. Dan Peres (MD), our Medical Director, together with a number of their support staff. The loss of the services from Dr. Kanellos and/or Dr. Peres could negatively affect our business.Officer.
Competition among biotechnology and pharmaceutical companies for qualified employees is intense, including competition from larger companies with greater resources, and we may not be able to continue to attract and retain qualified management, technical and scientific personnel critical to our success. Our success is highly dependent on our ability to develop and maintain important relationships with leading academic institutions and scientists who conduct research at our request or assist us in formulating our research and development strategies. These academic and scientific collaborators are not our employees and may have commitments to, or consulting or advisory contracts with, other entities that may limit their availability to us. In addition, these collaborators may have arrangements with other companies to assist such companies in developing technologies that may prove competitive to ours.
If we are unable to successfully keep pace with technological change or with the advances of our competitors, our technology and products may become obsolete or non-competitive.
The biotechnology and pharmaceutical industries are subject to rapid and significant technological change. Our competitors are numerous and include major pharmaceutical companies, biotechnology firms, universities and other research institutions. These competitors may develop technologies and products that are more effective than any that we are developing, or which would render our technology and products obsolete or non-competitive. Many of these competitors have greater financial and technical resources and manufacturing and marketing capabilities than we do. In addition, many of our competitors have much more experience than we do in pre-clinical testing and human clinical trials of new or improved drugs, as well as in obtaining regulatory approvals.
We know that competitors are developing or manufacturing various technologies or products for the treatment of diseases that we have targeted for product development. Some of these competitive products use therapeutic approaches that compete directly with our product candidates. Our ability to further develop our products may be adversely affected if any of our competitors were to succeed in obtaining regulatory approval for their competitive products sooner than us.
Acceptance of our products in the marketplace is uncertain, and failure to achieve market acceptance will negatively impact our business and operations.
Our current or future products may not achieve market acceptance even if they are approved by regulatory authorities. The degree of market acceptance of such products will depend on a number of factors, including:
| ● | the receipt and timing of regulatory approvals for the uses that we are studying; |
| ● | the establishment and demonstration to the medical community of the safety, clinical efficacy or cost-effectiveness of our product candidates and their potential advantages over existing therapeutics and technologies; and |
| ● | the pricing and reimbursement policies of governments and third-party payors. |
Physicians, patients, third-party payors or others in the medical community may not be receptive to our product candidates, and we may not generate any future revenue from the sale or licensing of our product candidates.
Even if we obtain approval for a product candidate, we may not generate or sustain revenue from sales of the product if the product cannot be sold at a competitive cost or if it fails to achieve market acceptance by physicians, patients, third-party payors or others in the medical community. These market participants may be hesitant to adopt a novel treatment based on hyper-immune colostrum technology, and we may not be able to convince the medical community and third-party payors to accept and use, or to provide favorable reimbursement for, any product candidates developed by us or our existing or future collaborators. Market acceptance of our product candidates will depend on, among other factors:
| ● | the safety and efficacy of our product candidates; |
| ● | our ability to offer our products for sale at competitive prices; |
| ● | the relative convenience and ease of administration of our product candidates; |
| ● | the prevalence and severity of any adverse side effects associated with our product candidates; |
| ● | the terms of any approvals and the countries in which approvals are obtained; |
| ● | limitations or warnings contained in any labeling approved by the FDA or comparable foreign regulatory authorities; |
| ● | conditions upon the approval imposed by FDA or comparable foreign regulatory authorities, including, but not limited to, a Risk Evaluation and Mitigation Strategy (“REMS”); |
| ● | the willingness of patients to try new treatments and of physicians to prescribe these treatments; |
| ● | the availability of government and other third-party payor coverage and adequate reimbursement; and |
| ● | availability of alternative effective treatments for the disease indications our product candidates are intended to treat and the relative risks, benefits and costs of those treatments. |
Additional risks apply in relation to any disease indications we pursue which are classified as rare diseases and allow for orphan drug designation by regulatory agencies in major commercial markets, such as the U.S. or European Union. If pricing is not approved or accepted in the market at an appropriate level for any approved product for which we pursue and receive an orphan drug designation, such product may not generate enough revenue to offset costs of development, manufacturing, marketing and commercialization despite any benefits received from the orphan drug designation, such as market exclusivity, for a period of time. Orphan exclusivity could temporarily delay or block approval of one of our products if a competitor obtains orphan drug designation for its product first. However, even if we obtain orphan exclusivity for one of our products upon approval, our exclusivity may not block the subsequent approval of a competitive product that is shown to be clinically superior to our product.
Market size is also a variable in disease indications not classified as rare. Our estimates regarding potential market size for any indication may be materially different from what we discover to exist at the time we commence commercialization, if any, for a product, which could result in significant changes in our business plan and have a material adverse effect on our business, financial condition, results of operations and prospects.
We face competition from entities that have developed or may develop product candidates for our target disease indications, including companies developing novel treatments and technology platforms based on modalities and technology similar to ours. If these companies develop technologies or product candidates more rapidly than we do or their technologies, including delivery technologies, are more effective, our ability to develop and successfully commercialize product candidates may be compromised.
The development and commercialization of pharmaceutical products is highly competitive. We compete with a variety of multinational pharmaceutical companies and specialized biotechnology companies, as well as technology being developed at universities and other research institutions. Our competitors have developed, are developing or could develop product candidates and processes competitive with our product candidates. Competitive therapeutic treatments include those that have already been approved and accepted by the medical community, patients and third-party payors, and any new treatments that enter the market.
We believe that a significant number of products are currently under development, and may become commercially available in the future, for the treatment of conditions for which we are developing, and may in the future try to develop, product candidates. We are aware of multiple companies that are working in the field of fatty-liverinfectious diseases, travelers’ diarrhea and C.difficiletherapeutics, including Intercept, Gilead, Genfit, Tobira, GalmedCosmo Technologies, PanTheryx, PaxVax Bermuda Limited, Proctor and Gamble, Salix Pharmaceuticals Inc and Scandinavian BioPharma which are all developing therapeutics for fatty-liver diseasestravelers’ diarrhea and, Acetelion, Assembly Biotechnology, Creston Pharma, Da Volterra, Finch Therapeutics, MaaT Pharma, Merck, Rebiotix Inc., Seres, Synthetic Biotechnology and Assembly BiotechnologyVedanta Biosciences for C.difficile.
We have limited large scale manufacturing experience with our product candidates. Delays in manufacturing sufficient quantities of such materials to the required standards for pre-clinical and clinical trials may negatively impact our business and operations.
While we have extensive experience in producing therapeutic colostrum, we may not be able to manufacture sufficient quantities of our product candidates in a cost-effective or timely manner. Manufacturing includes the production, formulation and stability testing of an active pharmaceutical ingredient and its formulation into pharmaceutical products, such as capsules or tablets. Any delays in production would delay our pre-clinical and human clinical trials, which could adversely affect our business, financial condition and operations.
We may be required to enter into contracting arrangements with third parties to manufacture our product candidates for large-scale, pre-clinical and/or clinical trials. We may not be able to make the transition from laboratory-scale to development-scale or from development-scale to commercial production. We may need to develop additional manufacturing resources, enter into collaborative arrangements with other parties who have established manufacturing capabilities, or have third parties manufacture our products on a contract basis. We may not have access on acceptable terms to the necessary and substantial financing that would be required to scale-up production and develop effective commercial manufacturing processes and technologies. We may not be able to enter into collaborative or contracting arrangements on acceptable terms with parties that will meet our requirements for quality, quantity and timeliness.
If we are not able to obtain an acceptable purity for any product candidate or an acceptable product specification, pre-clinical and clinical trials would be delayed, which could adversely affect the priority of the development of our product candidates, our business, financial condition and results of operations. This may adversely impact the cost of goods or feasibility of market scale.
Our product candidates and the process for administering our product candidates may cause undesirable side effects or have other properties that could delay or prevent their regulatory approval, limit the commercial profile of an approved label, or result in significant negative consequences following any potential marketing approval.
Treatment with our product candidates may produce undesirable side effects or adverse reactions or events. If any such adverse events occur, our clinical trials could be suspended or discontinued, and the FDA or comparable foreign regulatory authorities could order us to cease further development or deny approval of our product candidates for any or all targeted indications. The product-related side effects could affect patient recruitment or the ability of enrolled patients to complete the trial. If we elect or are required to delay, suspend or discontinue any clinical trial of any of our product candidates, the commercial prospects of such product candidates will be harmed and our ability to generate product revenues from any of these product candidates will be delayed or eliminated. Any of these occurrences may harm our business, financial condition and prospects significantly.
We currently depend upon a sole manufacturer of our lead compound and on a sole manufacturer to produce finished drug products and could incur significant costs and delays if we are unable to promptly find a replacement for either of them.
At this time, we are relying on a single manufacturer to develop Good Manufacturing Practice (GMP)(“GMP”), processes for our lead compound. Our lead compound, IMM-124E, is manufactured by Synlait Milk Limited based in New Zealand. This manufacturer enables efficient large scalelarge-scale manufacture of colostrum to provide drug substance for our current and prospective trials in fatty-liver patients.clinical trials. We also rely on contract manufacturers such as Catalent Australia,Mayne Pharma International and Australian Blister Sealing to produce all of our marketed products and Pharmaceutical Packaging Professionals and Australian Blister SealingPCI Clinical Services to package our investigational drug products. We are actively seeking additional and back-up manufacturers but may be unsuccessful in our efforts or may incur material additional costs and substantial delays.
The failure to establish sales, marketing and distribution capability would materially impair our ability to successfully market and sell our pharmaceutical products.
We currently have limited experience in the marketing, sales or distribution of pharmaceutical products. If we develop any commercially marketable pharmaceutical products and decide to perform our own sales and marketing activities, we will require additional resources and, will need to hire sales and marketing personnel which will require additional capital. Qualified personnel may not be available in adequate numbers or at a reasonable cost. Furthermore, our sales staff may not achieve success in their marketing efforts. Alternatively, we may be required to enter into marketing arrangements with other parties who have established appropriate marketing, sales and distribution capabilities. We may not be able to enter into marketing arrangements with any marketing partner, or if such arrangements are established, our marketing partners may not be able to commercialize our products successfully. Other companies offering similar or substitute products may have well-established and well-funded marketing and sales operations in place that will allow them to market their products more effectively. Failure to establish sufficient marketing capabilities would materially impair our ability to successfully market and sell our pharmaceutical products.
If healthcare insurers and other organizations do not pay for our products, or impose limits on reimbursement, our future business may suffer.
The drugs we hope to develop may be rejected by the marketplace due to many factors, including cost. The continuing efforts of governments, insurance companies, health maintenance organizations and other payors of healthcare costs to contain or reduce healthcare costs may affect our future revenues and profitability and those of our potential customers, suppliers and collaborative partners, as well as the availability of capital. In Australia and certain foreign markets, the pricing or profitability of prescription pharmaceuticals is already subject to government control. We expect initiatives for similar government control at both the state and federal level to continue in the U.S. and elsewhere. The adoption of any such legislative or regulatory proposals could adversely affect our business and prospects.
Our ability to commercially exploit our products successfully will depend in part on the extent to which reimbursement for the cost of our products and related treatment will be available from government health administration authorities, private health coverage insurers and other organizations. Third-party payors, such as government and private health insurers, are increasingly challenging the price of medical products and services. Uncertainty exists as to the reimbursement status of newly approved health care products and in foreign markets, including the U.S. If third-party coverage is not available to patients for any of the products we develop, alone or with collaborators, the market acceptance of these products may be reduced, which may adversely affect our future revenues and profitability. In addition, cost containment legislation and reductions in government insurance programs may result in lower prices for our products and could materially adversely affect our ability to operate profitably.
We may be exposed to product liability claims, which could harm our business.
The testing, marketing, and sale of human health care products also entail the inherent risk of product liability. We may incur substantial liabilities or be required to limit development or commercialization of our products if we cannot successfully defend ourselves against product liability claims. We have historically obtained no fault compensation insurance for our clinical trials and will continue to obtain similar coverage for all future clinical trials. Such coverage may not be available in the future on acceptable terms, or at all. This may result in our inability to pursue further clinical trials or to obtain adequate protection in the event of a successful claim. We may not be able to obtain product liability insurance in the event of the commercialization of a product or such insurance may not be available on commercially reasonable terms. Even if we have adequate insurance coverage, product liability claims, or recalls could result in negative publicity or force us to devote significant time, attention and financial resources to those matters.
Breaches of network or information technology security, natural disasters or terrorist attacks could have an adverse effect on our business.
Cyber-attacks or other breaches of network or information technology (IT)(“IT”) security, natural disasters, terrorist acts or acts of war may cause equipment failures or disrupt our research and development operations. In particular, both unsuccessful and successful cyber-attacks on companies have increased in frequency, scope and potential harm in recent years. Such an event may result in our inability, or the inability of our partners, to operate the research and development facilities, which even if the event is for a limited period of time, may result in significant expenses and/or significant damage to our experiments and trials. In addition, a failure to protect employee confidential data against breaches of network or IT security could result in damage to our reputation. Any of these occurrences could adversely affect our results of operations and financial condition.
To date, we have not had any such occurrence of cyber-attacks to our networks and IT infrastructure through cyber-attack, malware, computer viruses and other means of unauthorized access or other cyber incidents, individually or in the aggregate, however, should this occur in the future, it may result in a material impact to our operations or financial condition.
We expect to expand our drug development, regulatory and business development capabilities, and as a result, we may encounter difficulties in managing our growth, which could disrupt our operations.
We expect to experience significant growth in the number of our employees and consultants and the scope of our operations, particularly in the areas of drug development, regulatory affairs and business development. To manage our anticipated future growth, we must continue to implement and improve our managerial, operational and financial systems, expand our facilities and continue to recruit and train additional qualified personnel. Due to our limited financial resources and the limited experience of our management team in managing a company with such anticipated growth, we may not be able to effectively manage the expansion of our operations or recruit and train additional qualified personnel. The expansion of our operations may lead to significant costs and may divert our management and business development resources. Any inability to manage growth could delay the execution of our business plans or disrupt our operations and have a materially adverse effect on our business.
Preliminary positive results from the clinical trial of our leading product candidate, IMM-124E, are not necessarily predictive of the final results of the trial, and positivePositive results from preclinical studies of our product candidates are not necessarily predictive of thefuture results of our planned clinical trials of our product candidates.
In 2012, 10 biopsy-proven NASH patients were dosed for 30 days with IMM-124E in a Phase 1 study aimed to assess the safety of IMM-124E in NASH patients. The preliminary results from this trial are not necessarily predictive of the final results of the trial. The biological effect observed in this trial has been observed in only those 10 patients, is not statistically significant and might not be observed in any other patients treated with IMM-124E.
In addition, positivePositive results in preclinical proof-of-concept and animal studies of our product candidates may not result in positive results in clinical trials in humans. Many companies in the pharmaceutical and biotechnology industries have suffered significant setbacks in clinical trials after achieving positive results in preclinical development or early stage clinical trials, and we cannot be certain that we will not face similar setbacks. These setbacks have been caused by, among other things, preclinical findings made while clinical trials were underway or safety or efficacy observations made in clinical trials, including adverse events. Moreover, preclinical and clinical data are often susceptible to varying interpretations and analyses, and many companies that believed their product candidates performed satisfactorily in preclinical studies and clinical trials nonetheless failed to obtain FDA or other regulatory authority approval. If we fail to produce positive results in our clinical trials of our product candidates, the development timeline and regulatory approval and commercialization prospects for our product candidates, and, correspondingly, our business and financial prospects, would be negatively impacted.
Our future prospects may also be dependent on our or our collaborators’ ability to successfully develop a pipeline of additional product candidates, and we and our collaborators may not be successful in efforts to use our platform technologies to identify or discover additional product candidates.
The success of our business depends primarily upon our ability to identify, develop and commercialize products based on our platform technology. We only have twothree product candidates currently in clinical development IMM-124E and IMM-529.several in early stage research and preclinical development.
Our other product candidates derived from our platform technology may not successfully complete IND-enabling studies, and our research programs may fail to identify other potential product candidates for clinical development for a number of reasons. Our and our collaborators’ research methodology may be unsuccessful in identifying potential product candidates, our potential product candidates may not demonstrate the necessary preclinical outcomes to progress to clinical studies, or our product candidates may be shown to have harmful side effects or may have other characteristics that may make the products unmarketable or unlikely to receive marketing approval.
If any of these events occur, we may be forced to discontinue our development efforts for a program or programs. Research programs to identify new product candidates require substantial technical, financial and human resources. We may focus our efforts and resources on potential programs or product candidates that ultimately prove to be unsuccessful.
We may not be able to obtain orphan drug exclusivity for some of our product candidates.
Of our current product candidates, the only one designed for treatment of an indication that would likely qualify for rare disease status is IMM-529 for the treatment of recurrent C.difficile. Regulatory authorities in some jurisdictions, including the U.S. and the European Union, may designate drugs or biological products for relatively small patient populations as orphan drugs. Under the Orphan Drug Act, the FDA may designate a product as an orphan drug if it is a product intended to treat a rare disease or condition, which is generally defined as a patient population of fewer than 200,000 individuals annually in the U.S. The FDA may also designate a product as an orphan drug if it is intended to treat a disease or condition of more than 200,000 individuals in the U.S. and there is no reasonable expectation that the cost of developing and making a drug or biological product available in the U.S. for this type of disease or condition will be recovered from sales of the product candidate. Under the European Union orphan drug legislation, a rare disease or condition means a disease or condition which affects not more than five in ten thousand persons in the European Union at the time of the orphan drug designation application.
Generally, if a product with an orphan drug designation subsequently receives the first marketing approval for the indication for which it has such designation, the product is entitled to a period of marketing exclusivity, which precludes the FDA from approving another marketing application for the same drug for that time period. During the marketing exclusivity period, in the European Union, the European Medicines Agency, or the EMA, is precluded from approving a similar drug with an identical therapeutic indication. The applicable period is seven years in the U.S. and ten years in the European Union. The European Union exclusivity period can be reduced to six years if a drug no longer meets the criteria for orphan drug designation or if the drug is sufficiently profitable so that market exclusivity is no longer justified. Orphan drug exclusivity may be lost if the FDA or EMA determines that the request for designation was materially defective or if the manufacturer is unable to assure sufficient quantity of the drug to meet the needs of patients with the rare disease or condition.
Even if we obtain orphan drug exclusivity for a product, that exclusivity may not effectively protect the product from competition because different drugs can be approved for the same condition, and the same drug could be approved for a different condition. Even after an orphan drug is approved, the FDA can subsequently approve the same drug, made by a competitor, for the same condition if the FDA concludes that the competitive product is clinically superior in that it is shown to be safer, more effective or makes a major contribution to patient care. In the European Union, the EMA can approve a competitive product if the orphan drug no longer meets the criteria for orphan designation (including sufficient profitability), if the competitive product is safer, more effective or otherwise clinically superior, or if the orphan drug cannot be supplied in sufficient quantities.
We have not entered into agreements with any third-party manufacturers to support commercialization of our pharmaceutical product candidates. Additionally, no manufacturers have experience producing our product candidates at commercial levels, and any manufacturer that we work with may not achieve the necessary regulatory approvals or produce our product candidates at the quality, quantities, locations and timing needed to support commercialization.
We have not yet secured manufacturing capabilities for commercial quantities of our product candidates or established facilities in the desired locations to support commercialization of our product candidates. We intend to rely on third-party manufacturers for commercialization, and currently we have only entered into agreements with such manufacturers to support our clinical trials for IMM-124E. We may be unable to negotiate agreements with third-party manufacturers to support our commercialization activities on commercially reasonable terms.
We may encounter technical or scientific issues related to manufacturing or development that we may be unable to resolve in a timely manner or with available funds. Currently, we do not have the capacity to manufacture our product candidates on a commercial scale. In addition, our product candidates are novel, and no manufacturer currently has experience producing our product candidates on a large scale. If we are unable to engage manufacturing partners to produce our product candidates on a larger scale on reasonable terms, our commercialization efforts will be harmed.
Even if we timely develop a manufacturing process and successfully transfer it to the third-party manufacturers of our product candidates, if such third-party manufacturers are unable to produce the necessary quantities of our product candidates, or do so in compliance with cGMPCurrent Good Manufacturing Practice (“cGMP”) or with pertinent foreign regulatory requirements, and within our planned time frame and cost parameters, the development and sales of our product candidates, if approved, may be impaired.
Risks Related to Government Regulation
If we do not obtain the necessary governmental approvals, we will be unable to commercialize our pharmaceutical products.
Our ongoing research and development activities are, and the production and marketing of our pharmaceutical product candidates derived from such activities will be, subject to regulation by numerous international regulatory authorities. Prior to marketing, any therapeutic product developed must undergo rigorous pre-clinical testing and clinical trials and, to the extent that any of our pharmaceutical products under development are marketed abroad, by the relevant international regulatory authorities. For example, in Australia, principally the Therapeutics Goods Administration (TGA)(“TGA”), the FDA in the U.S.; the Medicines and Healthcare products Regulatory Agency, (MHRA)(“MHRA”) in the United Kingdom; the Medical Products Agency (MPA)(“MPA”) in Sweden; and the European Medicines Agency (EMA)EMA in Europe. These regulatory processes can take many years and require the expenditure of substantial resources. Governmental authorities may not grant regulatory approval due to matters arising from pre-clinical animal toxicology, safety pharmacology, drug formulation and purity, clinical side effects or patient risk profiles, or medical contraindications. Failure or delay in obtaining regulatory approvals would adversely affect the development and commercialization of our pharmaceutical product candidates. We may not be able to obtain the clearances and approvals necessary for clinical testing or for manufacturing and marketing our pharmaceutical product candidates.
We will not be able to commercialize any current or future product candidates if we fail to adequately demonstrate their safety, efficacy and superiority over existing therapies.
Before obtaining regulatory approvals for the commercial sale of any of our pharmaceutical products, we must demonstrate through pre-clinical testing and clinical studies that our product candidates are safe and effective for use in humans for each target indication. Results from early clinical trials may not be predictive of results obtained in large-scale, later-stage clinical testing. Even though a potential drug product shows promising results in clinical trials, regulatory authorities may not grant the necessary approvals without sufficient safety and efficacy data.
We may not be able to undertake further clinical trials of our current and future product candidates as therapies for fatty-liver disease,infectious diseases, C.difficileor other indications or to demonstrate the safety and efficacy or superiority of any of these product candidates over existing therapies or other therapies under development, or enter into any collaborative arrangement to commercialize our current or future product candidates on terms acceptable to us, or at all. Clinical trial results that show insufficient safety and efficacy could adversely affect our business, financial condition and results of operations.
Even if we obtain regulatory approval for a product candidate, our products may remain subject to regulatory scrutiny.
Even if we obtain regulatory approval in a jurisdiction, the regulatory authority may still impose significant restrictions on the indicated uses or marketing of our product candidates or impose ongoing requirements for potentially costly post-approval studies or post-market surveillance. For example, the holder of an approved biologics license application (BLA)(“BLA”) is obligated to monitor and report to the FDA adverse events and any failure of a product to meet the specifications in the BLA. The holder of an approved BLA must also submit new or supplemental applications and obtain FDA approval for certain changes to the approved product, product labeling or manufacturing process.
Advertising and promotional materials must comply with FDA rules and are subject to FDA review, in addition to other potentially applicable foreign, federal and state laws.
If we fail to comply with applicable regulatory requirements following approval of any of our product candidates, a regulatory agency may:
| ● | issue a warning letter asserting that we are in violation of the law; |
| ● | seek an injunction or impose civil or criminal penalties or monetary fines; |
| ● | suspend or withdraw regulatory approval; |
| ● | suspend any ongoing clinical trials; |
| ● | refuse to permit government reimbursement of our product by government-sponsored third-party payors; |
| ● | refuse to approve a pending BLA or supplements to a BLA submitted by us for other indications or new product candidates; |
| ● | seize our product; or |
| ● | refuse to allow us to enter into or continue supply contracts, including government contracts. |
Any government investigation of alleged violations of law could require us to expend significant time and resources in response and could generate negative publicity. The occurrence of any event or penalty described above may inhibit our ability to commercialize our product candidates and generate revenues.
Healthcare reform measures and other statutory or regulatory changes could adversely affect our business.
In both the U.S.United States and certain foreign jurisdictions, there have been a number of legislative and regulatory proposals to change the healthcare system in ways that could impact our business. For example, the Patient Protection and Affordable Care Act and the Health Care and Education Affordability Reconciliation Act of 2010 (collectively, the “ACA”), enacted in March 2010, substantially changeschanged the way healthcare is financed by both governmental and private insurers, and significantly impacts the pharmaceutical industry.
The Trump Administration and the U.S. Congress may seek to take further action regarding the ACA, including, but not limited to, repeal or replacement. Additionally, all or a portion of the ACA and related subsequent legislation may be modified, repealed or otherwise invalidated through judicial challenge, which could result in lower numbers of insured individuals, reduced coverage for insured individuals and adversely affect our results of operations.
In addition, other legislative changes have been proposed and adopted since the Affordable Care Act was enacted. We expect additional state and federal healthcare reform measures to be adopted in the future, any of which could limit reimbursement for healthcare products and services, which could result in reduced demand for our products or additional pricing pressure.
With regard to pharmaceutical products, among other things, the ACA is expected to expand and increase industry rebates for drugs covered under Medicaid programs and make changes to the coverage requirements under the Medicare D program.
If we fail to comply with our reporting and payment obligations under the Medicaid program or other governmental pricing programs, we could be subject to additional reimbursement requirements, penalties, sanctions and fines which could have a material adverse effect on our business, financial condition, results of operations and growth prospects.
If we obtain FDA approval for any of our product candidates and begin commercializing those products in the U.S.,United States, our operations may be directly or indirectly through our customers, subject to various federal and state fraud and abuse laws, including, without limitation, the federal Anti-Kickback Statute, the federal False Claims Act, and physician sunshine laws and regulations.
The pharmaceutical and biotechnology industries are subject to extensive regulation, and from time to time legislative bodies and governmental agencies consider changes to such regulations that could have significant impact on industry participants. For example, in light of certain highly-publicized safety issues regarding certain drugs that had received marketing approval, the U.S. Congress has considered various proposals regarding drug safety, including some which would require additional safety studies and monitoring and could make drug development more costly.costlier. Additional legislation or regulation, if any, relating to safetythe implementation of cost containment measures or other aspects of drug development may be enacted in the future, whichprevent us from being able to generate revenue, attain profitability, or commercialize our products. Such reforms could have an adverse effect on anticipated revenues from product candidates that we may successfully develop and for which we may obtain regulatory approval and may affect our business.overall financial condition and ability to develop product candidates. In addition, it is possible that there will be further legislation or regulation that could harm our business, financial condition and results of operations.
Our product candidates are based on our hyper-immune colostrum technology. Currently, no prescription product candidates utilizing our technology have been approved for commercial sale and our approach to the development of our technology may not result in safe, effective or marketable products.
We have concentrated our product research and development efforts on our hyper-immune colostrum technology, and our future success depends on successful clinical development of this technology. We plan to develop a pipeline of product candidates using our technology and deliver therapeutics for a number of chronicinfectious and life-threatening conditions, including fatty-liver diseasesmoderate to severe campylobacteriosis, C. difficile Infections (“CDI”), Shigellosis (bacillary dysentery) and C.difficileInfections (CDI).Traveler’s Diarrhea.
The scientific research that forms the basis of our efforts to develop product candidates is based on the pre-clinical and clinical data in conditions such as moderate to severe campylobacteriosis, CDI, Shigellosis (bacillary dysentery) and Traveler’s Diarrhea, NASH and C.difficile, and the identification, optimization and delivery of hyper-immune colostrum-basedcolostrum- based product candidates is relatively new. The scientific evidence to support the feasibility of successfully developing therapeutic treatments based on our technology is preliminary and limited. There can be no assurance that any development and technical problems we experience in the future will not cause significant delays or unanticipated costs, or that such development problems can be solved. We may be unable to reach an agreement on favorable terms, or at all, with providers of vectors needed to optimize delivery of our product candidates to target disease cells and we may also experience unanticipated problems or delays in expanding our manufacturing capacity or transferring our manufacturing process to commercial partners, any of which may prevent us from completing our clinical trials or commercializing our products on a timely or profitable basis, if at all.
Only a few product candidates based on our technology have been tested in either animals or humans. We may discover that the applications of IMM-124E and IMM-529our pharmaceutical drug candidates do not possess properties required for a therapeutic benefit, such as the ability to sufficiently suppress the immune system for the period of time required to be approved as a NASH or CDI therapeutic.benefit. In addition, application of hyper-immune-basedhyper-immune- based products in humans may result in safety problems. We currently have only limited long-term data, and no conclusive evidence, to suggest that we can effectively produce efficacious therapeutic treatments using our hyper-immune colostrum technology.
We are early in our product development efforts and have only two product candidates in early-stage (Phase I) and mid-stage (Phase II) clinical trials. All of our other current product candidates are still in preclinical development. We have no late-stage clinical trials (post-proof of concept) and may not be able to obtain regulatory approvals for the commercialization of some or all of our product candidates.
The research, testing, manufacturing, labeling, approval, selling, marketing and distribution of biologics is subject to extensive regulation by the FDA and other regulatory authorities, and these regulations differ from country to country. We do not have any prescription products on the market and are early in our development efforts. We have two product candidates in clinical trials and all of our other product candidates are in preclinical development. All of our current and future product candidates are subject to the risks of failure typical for development of biologics. The development and approval process is expensive and can take many years to complete, and its outcome is inherently uncertain. In addition, the outcome of preclinical testing and early clinical trials may not be predictive of the success of later clinical trials, and interim results of a clinical trial do not necessarily predict final results.
We have not submitted an application, or received marketing approval, for any of our product candidates and will not submit any applications for marketing approval for several years. We have limited experience in conducting and managing clinical trials necessary to obtain regulatory approvals for prescription product candidates. To receive approval, we must, among other things, demonstrate with evidence from clinical trials that the product candidate is both safe and effective for each indication for which approval is sought, and failure can occur in any stage of development. Satisfaction of the approval requirements typically takes several years and the time needed to satisfy them may vary substantially, based on the type, complexity and novelty of the pharmaceutical product. We cannot predict if or when we might receive regulatory approvals for any of our product candidates currently under development.
The FDA and foreign regulatory authorities also have substantial discretion in the pharmaceutical and biological product approval process. The numbers, types and sizes of preclinical studies and clinical trials that will be required for regulatory approval varies depending on the product candidate, the disease or condition that the product candidate is designed to address and the regulations applicable to any particular product candidate. Approval policies, regulations or the type and amount of clinical data necessary to gain approval may change during the course of a product candidate’s clinical development and may vary among jurisdictions, and there may be varying interpretations of data obtained from preclinical studies or clinical trials, any of which may cause delays or limitations in the approval or the decision not to approve an application. Regulatory agencies can delay, limit or deny approval of a product candidate for many reasons, including:
| ● | the FDA or comparable foreign regulatory authorities may disagree with the design or implementation of our clinical trials; |
| ● | we may be unable to demonstrate to the satisfaction of the FDA or comparable foreign regulatory authorities that a product candidate is safe and effective for its proposed indication; |
| ● | the results of clinical trials may not meet the level of statistical or clinical significance required by the FDA or comparable foreign regulatory authorities for approval; |
| ● | the patients recruited for a particular clinical program may not be sufficiently broad or representative to assure safety in the full population for which we seek approval; |
| ● | the results of clinical trials may not confirm the positive results from earlier preclinical studies or clinical trials; |
| ● | we may be unable to demonstrate that a product candidate’s clinical and other benefits outweigh its safety risks; |
| ● | the FDA or comparable foreign regulatory authorities may disagree with our interpretation of data from preclinical studies or clinical trials; |
| ● | the data collected from clinical trials of our product candidates may not be sufficient to the satisfaction of FDA or comparable foreign regulatory authorities to support the submission of a biologics license application, or BLA, or other comparable submission in foreign jurisdictions or to obtain regulatory approval in the U.S. or elsewhere; |
| ● | the FDA or comparable foreign regulatory authorities may only agree to approve a product candidate under conditions that are so restrictive that the product is not commercially viable; |
| ● | regulatory agencies might not approve or might require changes to our manufacturing processes or facilities; or |
| ● | regulatory agencies may change their approval policies or adopt new regulations in a manner rendering our clinical data insufficient for approval. |
Any delay in obtaining or failure to obtain required approvals could materially and adversely affect our ability to generate revenue from the particular product candidate, which likely would result in significant harm to our financial position and adversely impact the price of the ADSs. Furthermore, any regulatory approval to market a product may be subject to limitations on the indicated uses for which we may market the product. These limitations may limit the size of the market for the product.
We are not permitted to market our product candidates in the U.S. or in other countries until we receive approval of a BLA from the FDA or marketing approval from applicable regulatory authorities outside the U.S. Obtaining approval of a BLA can be a lengthy, expensive and uncertain process. If we fail to obtain FDA approval to market our product candidates, we will be unable to sell our product candidates in the U.S., which will significantly impair our ability to generate any revenues. In addition, failure to comply with FDA and non-U.S. regulatory requirements may, either before or after product approval, if any, subject us to administrative or judicially imposed sanctions, including:
| ● | restrictions on our ability to conduct clinical trials, including full or partial clinical holds on ongoing or planned trials; |
| ● | restrictions on the products, manufacturers or manufacturing process; |
| ● | warning letters; |
| ● | civil and criminal penalties; |
| ● | injunctions; |
| ● | suspension or withdrawal of regulatory approvals; |
| ● | product seizures, detentions or import bans; |
| ● | voluntary or mandatory product recalls and publicity requirements; |
| ● | total or partial suspension of production; |
| ● | imposition of restrictions on operations, including costly new manufacturing requirements; and |
| ● | refusal to approve pending BLAs or supplements to approved BLAs. |
Even if we do receive regulatory approval to market a product candidate, any such approval may be subject to limitations on the indicated uses for which we may market the product. It is possible that none of our existing product candidates or any product candidates we may seek to develop in the future will ever obtain the appropriate regulatory approvals necessary for us or our collaborators to commence product sales.
Any delay in obtaining, or an inability to obtain, applicable regulatory approvals would prevent us from commercializing our product candidates, generating revenues and achieving and sustaining profitability.
If our ability to use cumulative carry forward net operating losses is or becomes subject to certain limitations, our results of operations and financial condition may be adversely affected.
We are an Australian company subject to taxation in Australia and other jurisdictions. As of June 30, 2022, our cumulative operating losses have a total potential tax benefit of A$12,014,532 at local tax rates (excluding other temporary differences). These losses may be available for use once we are in a tax profitable position. These losses were incurred in different jurisdictions and can only be offset against profits earned in the relevant jurisdictions. Tax losses are able to be carried forward at their nominal amount indefinitely in Australia and for losses generated prior to January 1, 2018 for up to 20 years in the U.S. as long as certain conditions are met. In order to use these tax losses, it is necessary to satisfy certain tests and, as a result, we cannot assure you that the tax losses will be available to offset profits if and when we earn them. Utilization of our net operating loss and research and development credit carryforwards in the U.S. may be subject to substantial annual limitation due to ownership change limitations that could occur in the future provided by Section 382 of the Internal Revenue Code of 1986, as amended. Our carry forward net operating losses in the U.S. first start to expire in 2035.
We could be adversely affected by violations of the U.S. Foreign Corrupt Practices Act.
Our business operations may be subject to anti-corruption laws and regulations, including restrictions imposed by the U.S. Foreign Corrupt Practices Act the FCPA. The FCPA and similar anti-corruption laws in other jurisdictions generally prohibit companies and their intermediaries from making improper payments to government officials for the purpose of obtaining or retaining business. We cannot provide assurance that our internal controls and procedures will always protect us from criminal acts committed by our employees or third parties with whom we work. If we are found to be liable for violations of the FCPA or similar anti-corruption laws in international jurisdictions, either due to our own acts or out of inadvertence, or due to the acts or inadvertence of others, we could suffer from criminal or civil penalties which could have a material and adverse effect on our results of operations, financial condition and cash flows.
Risks Related to Our Intellectual Property
Our success depends upon our ability to protect our intellectual property and our proprietary technology, to operate without infringing the proprietary rights of third parties and to obtain marketing exclusivity for our products and technologies.
Any future success will depend in large part on whether we can:
| ● | obtain and maintain patents to protect our own products and technologies; |
| ● | obtain orphan designation for our products and technologies; |
| ● | obtain licenses to the patented technologies of third parties; |
| ● | operate without infringing on the proprietary rights of third parties; and |
| ● | protect our trade secrets, know-how and other confidential information. |
Patent matters in biotechnology are highly uncertain and involve complex legal and factual questions. Accordingly, the availability and breadth of claims allowed in biotechnology and pharmaceutical patents cannot be predicted. Any of the pending or future patent applications filed by us or on our behalf may not be approved, we may not develop additional proprietary products or processes that are patentable, or we may not be able to license any other patentable products or processes.
Our products may be eligible for orphan designation for particular therapeutic indications that are of relatively low prevalence and for which there is no effective treatment. Orphan drug designation affords market exclusivity post marketing authorization for a product for a specified therapeutic utility. The period of orphan protection is dependent on jurisdiction, for example, seven years in the U.S. and ten years in Europe. The opportunity to gain orphan drug designation depends on a variety of requirements specific to each marketing jurisdiction and can include; a showing of improved benefit relative to marketed products, that the mechanism of action of the product would provide plausible benefit and the nature of the unmet medical need within a therapeutic indication. It is uncertain if our products will be able to obtain orphan drug designation for the appropriate indications and in the jurisdictions sought.
Our commercial success will also depend, in part, on our ability to avoid infringement of patents issued to others. If a court determines that we were infringing any third-party patents, we could be required to pay damages, alter our products or processes, obtain licenses or cease certain activities. Licenses required under patents held by third parties may not be made available on terms acceptable to us, or at all. To the extent that we are unable to obtain such licenses, we could be foreclosed from the development, export, manufacture or commercialization of the product requiring such license or encounter delays in product introductions while we attempt to design around such patents, and any of these circumstances could adversely affect our business, financial condition and results of operations.
We may have to resort to litigation to enforce any patents issued or licensed to us or to determine the scope and validity of third partythird-party proprietary rights. We may have to defend the validity of our patents in order to protect or enforce our rights against a third party. Third parties may, in the future, assert against us infringement claims or claims that we have infringed a patent, copyright, trademark or other proprietary right belonging to them. Any infringement claim, even if not meritorious, could result in the expenditure of significant financial and managerial resources and could negatively affect our profitability. While defending our patents, the scope of the claim may be reduced in breadth and inventorship of the claimed subject matter, and proprietary interests in the claimed subject matter may be altered or reduced. Some of our competitors may be able to sustain the costs of such litigation or proceedings more effectively than we can because of their substantially greater financial resources. Any such litigation or proceedings, regardless of outcome, could be expensive and time consuming, and adverse determinations in any such litigation or proceedings could prevent us from developing, manufacturing or commercializing our products and could adversely affect our business, financial condition and results of operations.
The patents for our product candidates have varying expiration dates and, if these patents expire, we may be subject to increased competition and we may not be able to recover our development costs or market any of our approved products profitably. In some of the larger potential market territories, such as the U.S. and Europe, patent term extension or restoration may be available to compensate for time taken during aspects of the product’s development and regulatory review or by procedural delays before the relevant patent office. However, such an extension may not be granted, or if granted, the applicable time period or the scope of patent protection afforded during any extension period may not be sufficient. In addition, even though some regulatory authorities may provide some other exclusivity for a product under their own laws and regulations, we may not be able to qualify the product or obtain the exclusive time period. If we are unable to obtain patent term extension/restoration or some other exclusivity, we could be subject to increased competition and our opportunity to establish or maintain product revenue could be substantially reduced or eliminated. Furthermore, we may not have sufficient time to recover our development costs prior to the expiration of our U.S. and non-U.S. patents.
We may face difficulties in certain jurisdictions in protecting our intellectual property rights, which may diminish the value of our intellectual property rights in those jurisdictions.
The laws of some jurisdictions do not protect intellectual property rights to the same extent as the laws in the U.S. and the European Union, and many companies have encountered significant difficulties in protecting and defending such rights in such jurisdictions. If we or our collaboration partners encounter difficulties in protecting, or are otherwise precluded from effectively protecting, the intellectual property rights important for our business in such jurisdictions, the value of these rights may be diminished and we may face additional competition from others in those jurisdictions.
Many countries have compulsory licensing laws under which a patent owner may be compelled to grant licenses to third parties. In addition, many countries limit the enforceability of patents against government agencies or government contractors. In these countries, the patent owner may have limited remedies, which could materially diminish the value of such patent. If we or any of our licensors is forced to grant a license to third parties with respect to any patents relevant to our business, our competitive position may be impaired and our business, financial condition and results of operations may be adversely affected.
Intellectual property rights do not address all potential threats to our competitive advantage.
The degree of future protection afforded by our intellectual property rights is uncertain because intellectual property rights have limitations, and may not adequately protect our business, or permit us to maintain our competitive advantage. The following examples are illustrative:
| ● | Others may be able to make products that are similar to ours but that are not covered by the claims of the patents that we |
| ● | Others may independently develop similar or alternative technologies or otherwise circumvent any of our technologies without infringing our intellectual property |
| ● | We or any of our collaboration partners might not have been the first to conceive and reduce to practice the inventions covered by the patents or patent applications that we own, license or will own or |
| ● | We or any of our collaboration partners might not have been the first to file patent applications covering certain of the patents or patent applications that we or they own or have obtained a license, or will own or will have obtained a |
| ● | It is possible that our pending patent applications will not lead to issued |
| ● | Issued patents that we own may not provide us with any competitive advantage, or may be held invalid or unenforceable, as a result of legal |
| ● | Our competitors might conduct research and development activities in countries where we do not have patent rights, or in countries where research and development safe harbor laws exist, and then use the information learned from such activities to develop competitive products for sale in our major commercial |
| ● | The patents of third parties or pending or future applications of third parties, if issued, may have an adverse effect on our |
| ● | Compulsory licensing provisions of certain governments to patented technologies that are deemed necessary for the government to access. |
Changes in patent laws or patent jurisprudence could diminish the value of patents in general, thereby impairing our ability to protect our products or product candidates.
As is the case with other pharmaceutical companies, our success is heavily dependent on intellectual property, particularly patents. Obtaining and enforcing patents involves both technological complexity and legal complexity and is costly, time-consuming and inherently uncertain. In addition, the America Invents Act was recently enacted in the U.S., resulting in significant changes to the U.S. patent system. The U.S. Supreme Court has ruled on several patent cases in recent years, either narrowing the scope of patent protection available in certain circumstances or weakening the rights of patent owners in certain situations. In addition to increasing uncertainty with regard to our ability to obtain patents in the future, this combination of events has created uncertainty with respect to the value of patents, once obtained. Depending on decisions by the U.S. Congress, the federal courts, and the U.S. Patent and Trademark Office, or USPTO, the laws and regulations governing patents could change in unpredictable ways that could weaken our ability to obtain new patents or to enforce our existing patents and patents that we might obtain in the future. Similarly, the complexity and uncertainty of European patent laws has also increased in recent years. In addition, the European patent system is relatively stringent with regard to the type of amendments that are allowed during prosecution. These changes could limit our ability to obtain new patents in the future that may be important for our business.
Confidentiality agreements with employees and others may not adequately prevent disclosure of trade secrets and protect other proprietary information.
We consider proprietary trade secrets and/or confidential know-how and unpatented know-how to be important to our business. We may rely on trade secrets and/or confidential know-how to protect our technology, especially where patent protection is believed by us to be of limited value. However, trade secrets and/or confidential know-how can be difficult to maintain as confidential.
To protect this type of information against disclosure or appropriation by competitors, our policy is to require our employees, consultants, contractors and advisors to enter into confidentiality agreements with us. However, current or former employees, consultants, contractors and advisers may unintentionally or willfully disclose our confidential information to competitors, and confidentiality agreements may not provide an adequate remedy in the event of unauthorized disclosure of confidential information. Enforcing a claim that a third-party obtained illegally and is using trade secrets and/or confidential know-how is expensive, time consuming and unpredictable. The enforceability of confidentiality agreements may vary from jurisdiction to jurisdiction.
Failure to obtain or maintain trade secrets and/or confidential know-how trade protection could adversely affect our competitive position. Moreover, our competitors may independently develop substantially equivalent proprietary information and may even apply for patent protection in respect of the same. If successful in obtaining such patent protection, our competitors could limit our use of our trade secrets and/or confidential know-how.
Risks Related to Our Securities
The market price and trading volume of our ADS may be volatile and may be affected by economic conditions beyond our control.
The market price of our ADS may be highly volatile and subject to wide fluctuations. In addition, the trading volume of the ADS may fluctuate and cause significant price variations to occur. If the market price of the ADS declines significantly, you may be unable to resell your ADS at or above the purchase price, if at all. We cannot assure you that the market price of the ADS will not fluctuate or significantly decline in the future.
Some specific factors that could negatively affect the price of the ADS or result in fluctuations in their price and trading volume include:
| ● | actual or expected fluctuations in our operating results; |
| ● | changes in market valuations of similar companies; |
| ● | changes in our key personnel; |
| ● | changes in financial estimates or recommendations by securities analysts; |
| ● | trading prices of our ordinary shares on the |
| ● | changes in trading volume of ADS on The NASDAQ Capital Market, or NASDAQ, and of our ordinary shares on the ASX; |
| ● | sales of the ADS or ordinary shares by us, our executive officers or our shareholders in the future; and |
| ● | conditions in the financial markets or changes in general economic conditions. |
The dual listing of our ordinary shares and the ADSs may adversely affect the liquidity and value of the ADS.
Our ordinary shares are listed on the ASX. We cannot predict the effect of this dual listing on the value of our ordinary shares and ADS. However, the dual listing of our ordinary shares and ADS may dilute the liquidity of these securities in one or both markets and may impair the development of an active trading market for the ADS in the U.S. The trading price of the ADSs could also be adversely affected by trading in our ordinary shares on the ASX.
As a foreign private issuer, we are permitted, and we expect to follow certain home country corporate governance practices in lieu of certain NASDAQ requirements applicable to domestic issuers. This may afford less protection to holders of our ADSs.
As a foreign private issuer whose shares are listed on the NASDAQ, Capital Market, we are permitted to follow certain home country corporate governance practices instead of certain requirements of the NASDAQ Stock Market Rules. Among other things, as a foreign private issuer we have elected to follow home country practice with regard to, the composition of the board of directors and the audit committee, the financial expert, director nomination procedure, compensation of officers and quorum at shareholders’ meetings. In addition, we may follow our home country law, instead of the NASDAQ Stock Market Rules, which require that we obtain shareholder approval for certain dilutive events, such as for the establishment or amendment of certain equity based compensation plans, an issuance that will result in a change of control of the company, certain transactions other than a public offering involving issuances of a 20% or more interest in the company and certain acquisitions of the stock or assets of another company. Accordingly, our shareholders may not be afforded the same protection as provided under NASDAQ’s corporate governance rules.See Item 16G - Corporate Governance.
As a foreign private issuer, we are permitted to file less information with the SEC than a company incorporated in the U.S. Accordingly, there may be less publicly available information concerning us than there is for companies incorporated in the U.S.
As a foreign private issuer, we are exempt from certain rules under the Exchange Act that impose disclosure requirements as well as procedural requirements for proxy solicitations under Section 14 of the Exchange Act. In addition, our officers, directors and principal shareholders are exempt from the reporting and “short-swing” profit recovery provisions of Section 16 of the Exchange Act. Moreover, we are not required to file periodic reports and financial statements with the SEC as frequently or as promptly as a company that files as a U.S. company whose securities are registered under the Exchange Act, nor are we required to comply with the SEC’s Regulation FD, which restricts the selective disclosure of material non-public information. Accordingly, there may be less information publicly available concerning us than there is for a company that files as a domestic issuer.
We are an emerging growth company as definedIf we fail to comply with the rules under the Sarbanes-Oxley Act of 2002 related to accounting controls and procedures in the JOBS Actfuture, or, if we discover additional material weaknesses and the reduced disclosure requirements applicable to emerging growth companies may make the ADS less attractive to investorsother deficiencies in our internal control and as a result, adversely affectaccounting procedures, the price of the ADSour ordinary shares and result in a less active trading market for the ADS.ADSs could decline significantly and raising capital could be more difficult.
We are an emerging growth company as definedIf we fail to comply with the rules under the Sarbanes-Oxley Act of 2002 related to disclosure controls and procedures in the JOBS Act,future, or, if we discover material weaknesses and we may take advantage of certain exemptions from various reporting requirements that are applicable to other public companies that are not emerging growth companies. For example, we have elected to rely on an exemption from the auditor attestation requirements ofdeficiencies in our internal control and accounting procedures, our stock price could decline significantly and raising capital could be more difficult. Section 404 of the Sarbanes-Oxley Act relating to internal control over financial reporting, and we will not provide such an attestation from our auditors for so long as we qualify as an emerging growth company.
We may avail ourselvesrequires annual management assessments of these disclosure exemptions until we are no longer an emerging growth company. We cannot predict whether investors will find the ADS less attractive because of our reliance on some or all of these exemptions. If investors find the ADS less attractive, it may cause the trading price of the ADS to decline and there may be a less active trading market for the ADS.
We will cease to be an emerging growth company upon the earliest of:
If we fail to establish and maintain proper internal financial reporting controls, our ability to produce accurate consolidated financial statements or comply with applicable regulations could be impaired.
Section 404(a) of the Sarbanes-Oxley Act requires that, beginning with our second annual report after our IPO, our management assess and report annually on the effectiveness of our internal controlscontrol over financial reporting and identify anyreporting. As of June 30, 2022, our management determined that we had no material weaknesses in our internal controlscontrol over financial reporting. Although Section 404(b) of the Sarbanes-Oxley Act requires our independent registered public accounting firm to issue an annual report that addresses the effectiveness of our internal controls over financial reporting, we have opted to rely on the exemptions provided in the JOBS Act, and consequently will not be required to comply with SEC rules that implement Section 404(b) of the Sarbanes-Oxley Act until such time as we are no longer an emerging growth company.
Our first Section 404(a) assessment will take place beginning with our second annual report. The presence ofIf material weaknesses could result in financial statement errors which, in turn, could leador significant deficiencies are discovered or if we otherwise fail to errors in our financial reports and/or delays in our financial reporting, which could require us to restate our operating results. We might not identify one or more material weaknesses in our internal controls in connection with evaluating our compliance with Section 404(a) of the Sarbanes-Oxley Act. In order toachieve and maintain and improve the effectiveness of our disclosure controls and procedures and internal controls over financial reporting, we will need to expend significant resources and provide significant management oversight. Implementing any appropriate changes to our internal controls may require specific compliance training of our directors and employees, entail substantial costs in order to modify our existing accounting systems, take a significant period of time to complete and divert management’s attention from other business concerns. These changes may not, however, be effective in maintaining the adequacy of our internal control.
Ifcontrol, we are unablemay not be able to ensure that we can conclude on an ongoing basis that we have effective internal controls over financial reporting investors may lose confidence in our operating results, the price of the ADS could decline and we may be subject to litigation or regulatory enforcement actions. In addition, if we are unable to meet the requirements ofaccordance with Section 404 of the Sarbanes-Oxley Act, the ADS may not be able to remain listed on NASDAQ.
Management has identified certain matters involving ourAct. Moreover, effective internal controls overare necessary for us to produce reliable financial reports and are important to helping prevent financial fraud. If we cannot provide reliable financial reports or prevent fraud, our financial reporting that are material weaknesses under applicable standards.
In connection with the preparation of our financial statements for the year ended 30 June 2016, material weaknesses were identified in some aspects of our internal control over financial reporting for previous periods. Given these material weaknesses, management concluded that we did not maintain effective internal control over financial reporting. Once identified, we commenced the evaluation of the material weaknesses noted in our internal control over financial reporting specifically surrounding our monitoring controls when assessing certain significant transactionsbusiness and properly performing certain reviews and monitoring controls in the preparation of the financial statements in accordance with IFRS, as promulgated by the IASB. This resulted in the restatement of our financial statements in prior periods. While we have made improvements to our financial reporting processes surrounding the errors identified in prior fiscal periods, some areas of our financial reporting process require additional improvement. Given these material weaknesses, as described above, management concluded that we did not maintain effective internal control over financial reporting as of 30 June 2017. To address this weakness, we have improved the training of our finance team with respect to the applicable financial reporting requirements and will continue to do so.
Any future failure to maintain such internal controlsoperating results could adversely impact our ability to report our financial results on a timely and accurate basis, whichbe harmed, investors could result in our inability to satisfy our reporting obligations or result in material misstatements in our financial statements. If our financial statements are not accurate, investors may not have a complete understanding of our operations or may lose confidence in our reported financial information, which could result in a material adverse effect on our business or have a negative effect onand the trading price of our ordinary shares and ADSs.ADSs could drop significantly.
ADS holders may be subject to additional risks related to holding ADS rather than ordinary shares.
ADS holders do not hold ordinary shares directly and, as such, are subject to, among others, the following additional risks:
| ● | As an ADS holder, we will not treat you as one of our shareholders and you will not be able to exercise shareholder rights, except through the ADR depositary as permitted by the amended and revised deposit |
| ● | distributions on the ordinary shares represented by your ADS will be paid to the ADR depositary, and before the ADR depositary makes a distribution to you on behalf of your ADSs, any withholding taxes that must be paid will be deducted. Additionally, if the exchange rate fluctuates during a time when the ADR depositary cannot convert the foreign currency, you may lose some or all of the value of the |
| ● | We and the ADR depositary may amend or terminate the |
You must act through the ADR depositary to exercise your voting rights and, as a result, you may be unable to exercise your voting rights on a timely basis.
As a holder of ADS (and not the ordinary shares underlying your ADSs), we will not treat you as one of our shareholders, and you will not be able to exercise shareholder rights. The ADR depositary will be the holder of the ordinary shares underlying your ADS, and ADS holders will be able to exercise voting rights with respect to the ordinary shares represented by the ADS only in accordance with the deposit agreementDeposit Agreement relating to the ADS. There are practical limitations on the ability of ADS holders to exercise their voting rights due to the additional procedural steps involved in communicating with these holders. For example, holders of our ordinary shares will receive notice of shareholders’ meetings by mail and will be able to exercise their voting rights by either attending the shareholders meeting in person or voting by proxy. ADS holders, by comparison, will not receive notice directly from us. Instead, in accordance with the deposit agreement,Deposit Agreement, we will provide notice to the ADR depositary of any such shareholders meeting and details concerning the matters to be voted upon at least 30 days in advance of the meeting date. If we so instruct, the ADR depositary will mail to holders of ADS the notice of the meeting and a statement as to the manner in which voting instructions may be given by holders as soon as practicable after receiving notice from us of any such meeting. To exercise their voting rights, ADS holders must then instruct the ADR depositary as to voting the ordinary shares represented by their ADSs. Due to these procedural steps involving the ADR depositary, the process for exercising voting rights may take longer for ADS holders than for holders of ordinary shares. The ordinary shares represented by ADS for which the ADR depositary fails to receive timely voting instructions will not be voted.
If we are classified as a “passive foreign investment company,” then our U.S. shareholders could suffer adverse tax consequences as a result.
Generally, if, for any taxable year, at least 75% of our gross income is passive income (including our pro rata share of the gross income of our 25% or more owned corporate subsidiaries) or at least 50% of the average quarterly value of our total gross assets (including our pro rata share of the gross assets of our 25% or more owned corporate subsidiaries) is attributable to assets that produce passive income or are held for the production of passive income, including cash, we would be characterized as a passive foreign investment company, or PFIC, for U.S. federal income tax purposes. For purposes of these tests, passive income includes dividends, interest, and gains from the sale or exchange of investment property and rents and royalties other than rents and royalties which are received from unrelated parties in connection with the active conduct of a trade or business. If we are characterized as a PFIC, a U.S. holder of our ordinary shares or ADSs may suffer adverse tax consequences, including having gains recognized on the sale of our ordinary shares or ADSs treated as ordinary income, rather than capital gain, the loss of the preferential rate applicable to dividends received on our ordinary shares or ADSs by individuals who are U.S. holders, and having interest charges added to their tax on distributions from us and on gains from the sale of our ordinary shares or ADS. See “Taxation—U.S.United States Federal Income Tax Considerations—Passive Foreign Investment Company.”
Our status as a PFIC may also depend, in part, on how quickly we utilize theany cash proceeds from our IPO, in our business.any offering. Since PFIC status depends on the composition of our income and the composition and value of our assets, which may be determined in large part by reference to the market value of our ordinary shares or ADS, which may be volatile, there can be no assurance that we will not be a PFIC for any taxable year. While we expect that we were not a PFIC for our taxable year ended June 30, 2017,2022, no assurance of our PFIC status can be provided for such taxable year or future taxable years. Prospective U.S. investors should discuss the issue of our possible status as a PFIC with their tax advisors.
Currency fluctuations may adversely affect the price of our ordinary shares and ADS.
Our ordinary shares are quoted in Australian dollars on the ASX and the ADS are quoted in U.S. dollars on NASDAQ. Movements in the Australian dollar/U.S. dollar exchange rate may adversely affect the U.S. dollar price of the ADS. In the past year the Australian dollar has generally weakened against the U.S. dollar. However, this trend may not continue and may be reversed. If the Australian dollar weakens against the U.S. dollar, the U.S. dollar price of the ADS could decline, even if the price of our ordinary shares in Australian dollars increases or remains unchanged.
We have never declared or paid dividends on our ordinary shares and we do not anticipate paying dividends in the foreseeable future.
We have never declared or paid cash dividends on our ordinary shares. For the foreseeable future, we currently intend to retain all available funds and any future earnings to support our operations and to finance the growth and development of our business. Any future determination to declare cash dividends will be made at the discretion of our board of directors, subject to compliance with applicable laws and covenants under current or future credit facilities, which may restrict or limit our ability to pay dividends, and will depend on our financial condition, operating results, capital requirements, general business conditions and other factors that our board of directors may deem relevant. We do not anticipate paying any cash dividends on our ordinary shares in the foreseeable future. As a result, a return on your investment will only occur if our ADS price appreciates.
You may not receive distributions on our ordinary shares represented by the ADS or any value for such distribution if it is illegal or impractical to make them available to holders of ADS.
While we do not anticipate paying any dividends on our ordinary shares in the foreseeable future, if such a dividend is declared, the depositary for the ADS has agreed to pay to you the cash dividends or other distributions it or the custodian receives on our ordinary shares or other deposited securities after deducting its fees and expenses. You will receive these distributions in proportion to the number of our ordinary shares your ADS represent. However, in accordance with the limitations set forth in the deposit agreement,Deposit Agreement, it may be unlawful or impractical to make a distribution available to holders of ADS. We have no obligation to take any other action to permit the distribution of the ADS, ordinary shares, rights or anything else to holders of the ADS. This means that you may not receive the distributions we make on our ordinary shares or any value from them if it is unlawful or impractical to make them available to you. These restrictions may have a material adverse effect on the value of your ADS.
Australian takeover laws may discourage takeover offers being made for us or may discourage the acquisition of a significant position in our ordinary shares or ADS.
We are incorporated in Australia and are subject to the takeover laws of Australia. Among other things, we are subject to the Australian Corporations Act 2001, or the Corporations Act. Subject to a range of exceptions, the Corporations Act prohibits the acquisition of a direct or indirect interest in our issued voting shares if the acquisition of that interest will lead to a person’s voting power in us increasing to more than 20%, or increasing from a starting point that is above 20% and below 90%. Australian takeover laws may discourage takeover offers being made for us or may discourage the acquisition of a significant position in our ordinary shares. This may have the ancillary effect of entrenching our board of directors and may deprive or limit our shareholders’ or ADS holders’ opportunity to sell their ordinary shares or ADSs and may further restrict the ability of our shareholders and ADS holders to obtain a premium from such transactions. See Item 10. – Additional Information “Change of Control”.
Our Constitution and Australian laws and regulations applicable to us may adversely affect our ability to take actions that could be beneficial to our shareholders.
As an Australian company, we are subject to different corporate requirements than a corporation organized under the laws of the states of the U.S. Our Constitution, as well as the Australian Corporations Act, set forth various rights and obligations that are unique to us as an Australian company. These requirements may operate differently than those of many U.S. companies. See Item 10 - Additional Information.
You will have limited ability to bring an action against us or against our directors and officers, or to enforce a judgment against us or them, because we are incorporated in Australia and certain of our directors and officers reside outside the U.S.
We are incorporated in Australia, certain of our directors and officers reside outside the U.SU.S. and substantially all of the assets owned by thosesuch persons are located outside of the U.S also.U.S.. As a result, it may be impracticable or at least more expensive for you to bring an action against us or against these individuals in Australia in the event that you believe that your rights have been infringed under the applicable securities laws or otherwise.
You may be subject to limitations on transfer of the ADSs.
The ADSs are only transferable on the books of the depositary. However, the depositary may close its transfer books at any time or from time to time when it deems expedient in connection with the performance of its duties. In addition, the depositary may refuse to deliver, transfer or register transfers of ADSs generally when our books or the books of the depositary are closed, or at any time if we or the depositary deem it advisable to do so because of any requirement of law or of any government or governmental body, or under any provision of the Deposit Agreement, or for any other reason.
Australian companies may not be able to initiate shareholder derivative actions, thereby depriving shareholders of the ability to protect their interests.
Australian companies may not have standing to initiate a shareholder derivative action in a federal court of the U.S. The circumstances in which any such action may be brought, and the procedures and defenses that may be available in respect to any such action, may result in the rights of shareholders of an Australian company being more limited than those of shareholders of a company organized in the U.S. Accordingly, shareholders may have fewer alternatives available to them if they believe that corporate wrongdoing has occurred. Australian courts are also unlikely to recognize or enforce against us judgments of courts in the U.S. based on certain liability provisions of U.S. securities law and to impose liabilities against us, in original actions brought in Australia, based on certain liability provisions of U.S. securities laws that are penal in nature. There is no statutory recognition in Australia of judgments obtained in the U.S., althoughAlthough the courts of Australia may recognize and enforce the non-penal judgment of a foreign court of competent jurisdiction without retrial on the merits upon being satisfied about all the relevant circumstances inupon which thatsuch judgment was obtained.obtained, there is no statutory recognition in Australia of judgments obtained in the U.S..
Anti-takeover provisions in our Constitution and our right to issue preference shares could make a third-party acquisition of us difficult.
Some provisions of our Constitution may discourage, delay or prevent a change in control of our company or management that shareholders may consider favorable, including provisions that only require one-third of our board of directors to be elected annually and authorize our board of directors to issue an unlimited number of shares of capital stock and preference shares in one or more series and to designate the price, rights, preferences, privileges and restrictions of such preference shares by amending the Constitution.
ITEM 4. INFORMATION ON THE COMPANY
A. History and Development of the Company
We were incorporated under the laws of the Commonwealth of Australia in 1994 and have been listed on the Australian Securities Exchange (ASX)ASX since April 30, 1999. Our ADSs and Warrants have traded on The NASDAQ Capital Market since June 13, 2017, with the Warrants delisted in June 2022 in connection with their expiration. Our principal executive office is located at Level 3, 62 Lygon Street, Carlton South, Victoria, Australia 3053 and our telephone number is +61+61 (0)3 9824 5254. Our agent for service in the U.S. is Puglisi & Associates, 850 Library Avenue, Suite 204, Newark, DE 19711.
We have incurred losses from operations in each year since inception. Our net losses were A$6.8 million, A$7.1 million,SEC maintains an Internet site that contains reports, proxy and A$2.7 million forinformation statements, and other information regarding the fiscal years ended June 30, 2017, 2016 and 2015, respectively. The majority of our net losses resulted from costs incurred in connectiongroup that file electronically with our research and development programs and from general and administrative costs associated with our operations. We expect to continue to incur significant expenses and increasing operating losses for at least the next several years.SEC (https://www.sec.gov/edgar/browse/?CIK=1660046 &owner=exclude).
B. Business Overview
We are a commercial and clinical-stage biopharmaceutical company with a proprietary technology platform focused on the development and commercialization of a novel class of immunomodulatorspecifically targeted polyclonal antibodies that we believe can address significant unmet medical needs. Our oral polyclonal antibodies offer targeted delivery within the gastrointestinal (GI) track but do not cross into(“GI”) tract and our technology platform can be used to target viruses or bacteria and neutralize the bloodstream, potentially leadingtoxins they produce at mucosal surfaces. We currently market our flagship commercial products Travelan® and Protectyn® in Australia, where both products are listed medicines on the Australian Register for Therapeutic Goods. Travelan® (AUST L 106709) is an over-the-counter orally administered passive immunotherapeutic product and is indicated to much improved safetyreduce the risk of travelers’ diarrhea, reduce the risk of minor gastro-intestinal disorders and tolerability, without sacrificing efficacy.is antimicrobial and is sold in pharmacies throughout Australia. Protectyn® (AUST L 231001) is currently sold online and in health practitioner clinics and is marketed as an immune supplement to help maintain a healthy digestive function and liver. We believe that our twoalso market Travelan® (NPN 80046016) in Canada where it is licensed as a natural health product indicated to reduce the risk of travelers’ diarrhea, and presently market Travelan® in the U.S. as a dietary supplement for digestive tract protection.
We currently have three lead immunomodulator productdrug candidates IMM-124E and IMM-529,entering the clinical development phase, which we believe have the potential to transform the existing treatment paradigms for NASHmoderate to severe campylobacteriosis, Clostridiodies difficle (C.difficle) Infections, Enterotoxigenic Escherichia coli (ETEC) infections and for C. difficile infections, respectively.travelers’ diarrhea, a digestive tract disorder that is commonly caused by pathogenic bacteria and the toxins they produce.
We currently market an OTC product, Travelan, in Australia, Canada and in the U.S., for the prevention of Traveler’s Diarrhea. Travelan has been shown to be 90% effective in the prevention of diarrhea in several E-coli challenge placebo controlled studies. Travelan is based in the same platform as our immudolator product candidates and targets 13 strains of E-coli.
Travelan sales for fiscal year 20172022, 2021 and 2020 were gross A$1.40 million.We recently began to marketProtectyn, a health product targeting LPS bacteria in the gut to prevent gut dysbiosis, in Australia. Sales of Protectyn have not been material to date.
Our Platform
Our platform technology is based on oral immunoglobulins. Prior to calving, cows are immunized with proprietary vaccines to ensure maximum immunogenicity792 thousand (net: A$765 thousand), A$166 thousand (net: A$146 thousand) and after calving, the first milk is harvested and the polyclonal antibodies purified. This proprietary process ensures that the colostrum contains a high concentration of antibodies and high concentrations of Immunoglobulin G1. The technology is safe (classified as GRAS by the FDA)A$2.7 million (net: A$2.5 million), low cost, and can be applied to a variety of diseases.respectively.
The underlying nature of our platform technology enables the development of medicines across a large range of diseases, including infectious diseases and immune mediated disorders. The platform can be used to influence the cell-mediated immune system through regulatory T cell populations, or it can directly block viruses or bacteria at mucosal surfaces (such as the GI tract) and neutralize the toxins they produce. Additionally, the dairy origins of our antibodies enables us to commercialize our platform through most regulatory pathways, including prescription (Rx), medical foods, over-the-counter medicines, and dietary supplements. The GRAS status of our technology platform allows us to advance our preclinical programs into clinical trials faster relative to other companies due to the platform’s proven safety profile.
Our Pipeline
Fatty liver diseases are frequently caused by high weight and obesity, genetics, and diet that result in inflammation of the liver. We use an innovative approach to addressing this condition, one that focuses on treating pathogenic bacteria of the gut using a specific set of antibodies I which we designated as MM-124E. IMM-124E is designed to block and reduce bacteria growth without negatively impacting essential microbiota. This process has thus far produced a strong safety profile for IMM-124E, whose recent interim analysis indicated no safety concerns or adverse events.
We are currently in the process of executing three clinical trials for our drug candidate, IMM-124E, that we believe represents a solution for the millions of patients suffering from NASH. Our NASH phase II clinical study achieved its recruitment goal of at least 120 patients this year by successfully enrolling 133 patients with biopsy proven NASH. This study – led by Dr. Arun Sanyal, the former President of AASLD (American Association for the Study of Liver Diseases) and current Chair of the Liver Study Section at the National Institute of Health (NIH), is expected to yield top-line results in the first quarter of 2018.OUR STRATEGY
Dr. Arun Sanyal is also the lead Principal Investigator of our alcoholic steatohepatitis (“ASH”) clinical study at Duke University, which study is also funded by the NIH. Thus far, over 50% of the targeted 66 patients have been randomized into the study, whose top-line results are expected in first quarter of 2019.
We are also currently undergoing a NIH-funded Phase II double blind, placebo control, randomized clinical study of IMM-124E at Emory University, led by Dr. Miriam Vos, who specializes in the treatment of gastrointestinal disease in children as well as fatty liver disease and obesity. The study enrolled its first patient in February 2017, and has so far randomized over 20% of the targeted 40 patients into the study. The top-line results for this study are expected in the fourth quarter of 2018.
In July 2017, we reported data from an interim analysis to evaluate safety of IMM-124E. The report confirmed that there were no safety concerns or adverse events, and reported efficacy signals on liver enzymes (ALT and AST) that demonstrated a dose-related reduction in both treatment doses at 24 weeks, though not statistically different than placebo. As these parameters inherently fluctuate over time and are significantly affected by baseline values the interim analysis committee also had scheduled to perform additional analyses on the data set to correct for these inherent variations. Comparing the Area Under Curve for the ALT/AST data over time of IMM-124E to Placebo, accounts for all the available data. Such analysis demonstrated a significant reduction of ALT and AST over time (AUC ANCOVA analysis) compared to placebo. A dose-related effect was reported when the greatest decrease occurred in the highest dose group, with the low dose group decreasing by an intermediate amount compared with the placebo group. We believe that this documented effect, together with a correlation between ALT and AST, indicate the treatment has the potential to safely reduce liver injury.
We believe that our current strategy of executing three separate clinical trials at the same time for three different, but very related diseases, will ultimately put us on a quicker route to commercialization. The proprietary IMM-124E compound has clearly demonstrated its potential to be effective in the treatment of these fatty liver diseases, positioning us to fill a true void in the medical community and pharmaceutical industry.
IMM-529has successfully completed its pre-clinical program inCDIand we have initiated a Phase 1/2 trials in Israel in the second half of 2017. IMM-529 which was developed in collaboration with world leading C.difficileresearcher Dr. Dena Lyras and her team at Monash University, targets the virulent Toxin B, the spores and the vegetative cells. It is a three pronged approach that is unique and which has yielded exceptional results in the pre-clinical studies including (1) Prevention of primary disease, (2) Treatment of primary disease and (3) Suppression of recurrence. To our knowledge, it is to date the only investigational drug that has showed therapeutic benefits in all three phases of the disease.
In addition to these programs, we also have two research collaborations with the U.S. Department of Defense including with the U.S. Navy and with the U.S. Army, for the study of Shigella, Campylobacter and ETEC vaccines. ETEC is a type of E-coli and is one of the leading bacterial causes of diarrhea in the developing world, as well as the most common cause of travelers’ diarrhea.
We also started a pre-clinical program in Irritable Bowel Disease (“IBD”), in collaboration with renowned IBD Key Opinion Leader, Professor Gerhard Rogler, MD, PhD. and the University of Zurich, Switzerland.
We believe that the breath/depth of our assets and the support we are receiving from the NIH and the DoD, makes us truly a unique and attractive player in the therapeutic areas that we targeting.
Our Strategy
Our goal is to become one of the leading biopharmaceutical companycompanies developing and commercializing therapeutics to address increased unmet medical needs in inflammation-mediated diseases and anti-infectives.the anti-infective area. The critical components of our strategy include:
| ● |
| ● |
| ● |
| ● |
| ● | Protect and leverage our intellectual property portfolio and patents. We believe that our intellectual property protection strategy, grounded in securing composition of matter patents on the biologics we develop, as well as broader patents to protect our technology platform, has best positioned us to gain broad and strong protection |
OUR PLATFORM
WeOur platform technology is based on oral polyclonal immunoglobulins. Prior to calving, cows are immunized with proprietary vaccines to ensure maximum immunogenicity and after calving, the first milk, called bovine colostrum is harvested and processed to produce a clinical-stage biopharmaceutical company focused onhyper-immune bovine colostrum powder. This proprietary process of vaccinating cows with specific vaccines generated against antigens for therapeutic targets ensures that the colostrum contains a high concentration of polyclonal antibodies and high concentrations of immunoglobulin G1 against the specified antigens. The technology can be applied to a variety of diseases.
The underlying nature of our platform technology enables the development of medicines across a large range of infectious diseases. The platform can be used to block viruses or bacteria at mucosal surfaces (such as the GI tract) and commercializationneutralize the toxins they produce. Additionally, the dairy origins of our antibodies enable us to commercialize our platform through most regulatory pathways, including prescription (Rx), medical foods, over-the-counter medicines, and dietary supplements.
The active pharmaceutical ingredient (API) for a novel classparticular application is prepared using the first milking colostrum of immunomodulatordairy cows that have been immunized with patented vaccines for the specific therapeutic use to produce very high levels of antibodies against selected surface antigens. Pregnant dairy cows at commercial dairy farms are immunized through a proprietary process. Such inoculation of dairy cows with specific vaccines activates a generalized immune response in the host animal to produce antibodies which recognize and bind to bacterial cell-surface epitopes that the vaccines were designed against. These polyclonal antibodies in the harvested bovine colostrum are present in high concentration within the raw material which is further processed to treat liver diseases, infectious diseases and other immune-mediated diseases, suchproduce the final drug product which contains at least 35% immunoglobulins (Ig), composed mainly of IgG (mostly IgG1).
Risk management covering the source of colostrum must focus on assurance of absence of Bovine Spongiform Encephalopathy (“BSE”), commonly known as colitis. Our lead product candidate, IMM-124E,Mad Cow Disease attributable to the liquid raw product. BSE is a transmissible and fatal neurodegenerative disease that affects cattle. BSE has never been detected in cattle in Australia or New Zealand. The World Organization for Animal Health recognizes both countries as having a negligible BSE risk status. Australia and New Zealand are two of only 16 countries in the world to-date assessed by the European Union as meeting all criteria for the lowest geographical BSE risk level.
OUR PIPELINE
Immuron’s platform technology is based on oral polyclonal immunoglobulins. Prior to calving, cows are immunized with proprietary immunomodulator agent targetedimmunogens to ensure maximum antibody production. After calving, the first milk, called bovine colostrum is harvested and processed to produce a hyper-immune bovine colostrum powder. The underlying nature of our platform technology enables the development of medicines across a large range of infectious diseases. This approach can be used to block viruses or bacteria at mucosal surfaces (such as the GI immune mediated diseases including fatty-liver diseases. We are developing IMM-124Etract) and neutralize the toxins they produce.
Immuron has three lead clinical products entering the clinical development phase for the treatment of nonalcoholicmultiple high value enteric disease indications:
| 1. | Enterotoxigenic Escherichia coli (ETEC) infections and travelers’ diarrhea, a digestive tract disorder that is commonly caused by pathogenic bacteria and the toxins they produce. |
| 2. | Clostridioides difficile (C.difficile) infections, an infection of the colon caused by the bacteria C.difficile that produces toxins that cause inflammation and severe diarrhea. C.difficile can also result in serious disease complications including bowel perforation, toxic megacolon and sepsis, and it can prove fatal in the most severe cases. |
| 3. | Moderate to severe Campylobacteriosis. |
Collaborations with U.S. Army and U.S. Navy. We believe that our collaborations with the DoD are a powerful validation of the potential of our platform to develop novel anti-infectives. These collaborations also open the door to explore and develop potentially low risk / low cost therapeutics with some of the most advanced research facilities in the world. The DoD earlier commissioned several studies to characterize the polyclonal antibodies contained in Travelan. The aim was to conduct trials to determine the product’s effectiveness in neutralizing pathogenic GI bacterial infections as a preventative treatment for U.S. military personnel and civilians stationed or traveling in locations where such infections can be debilitating.
| 1. | Travelan® Biologics License Application (BLA) |
Immuron has an immediate focus on seeking FDA approval of Travelan® to prevent travelers’ (TD) diarrhea. According to the Centers for Disease Control and Prevention (CDC), an estimated 10 million international travelers develop travelers’ diarrhea every year. Approval of Travelan® as a preventative treatment for TD is expected to significantly increase commercial opportunities for Travelan® in the U.S., particularly as Travelan® is a non-antibiotic treatment having a considerable record of successful treatment. The company was awarded a USD $3.43 million grant from the US Department of Defense to test the efficacy of one large daily dose regimen of Travelan® in a controlled human infection model (CHIM) clinical study using the ETEC strain H10407. This dose regime is potentially more amenable for use in military populations. The US Naval Medical Research Center (NMRC), Silver Spring, MD, USA was also awarded over USD $1 million in a separate grant to provide immunological support for the Immuron clinical program. The company plans to submit an Investigational New Drug (IND) application with the US Food and Drug Administration (FDA). Up to 60 volunteers will be enrolled in the clinical study and will be randomly assigned to receive either a once-daily dose of 1200 mg of Travelan® or placebo. Results of the proposed clinical study will inform dosing in the planned pivotal Phase 3 studies for BLA licensure.
The US Department of Defense Uniformed Services University (USU) have also been awarded grant funding to conduct a clinical trial to evaluate the efficacy of Travelan® and a probiotic in Travelers’ Diarrhea. Enrollment of 1302 deployed military personnel or travelers will occur at sites within the Uniformed Services University of the Health Sciences Infectious Disease Clinical Research Program (IDCRP) network, the UK military, and at a civilian travel clinic in New York City. Subjects will be randomized to receive a masked regimen of Florastor®, Travelan®, or placebo. Findings from the clinical study will inform strategies for Defense Force Health Protection. The P3TD study is a randomized, double-blind, placebo controlled multicenter clinical trial designed to evaluate the effectiveness of a probiotic (Florastor®) and IMM-124E (Travelan®) passive immunoprophylaxis verses a placebo, for prophylaxis during deployment or travel to a high-TD risk region.
Infectious diarrhea is the most common illness reported by travelers visiting developing countries and among US troops deployed overseas. The morbidity and associated discomfort stemming from diarrhea decreases daily performance, affects judgment, decreases morale, and lowers operational readiness. The first line of treatment for infectious diarrhea is the prescription of antibiotics. Unfortunately, in the last decade, several enteric pathogens have an increasing resistance to commonly prescribed antibiotics. In addition, travelers' diarrhea is now recognized by the medical community to result in post-infectious sequelae, including post-infectious irritable bowel syndrome and several post-infectious autoimmune diseases. A preventative treatment that protects against enteric diseases, is a high priority objective for the US Military.
| 2. | IMM-529 to Treat Recurrent Clostridioides difficile Infections (CDI) |
Our second clinical asset IMM-529 is an oral biologic that targets the Clostridioides difficile (C. difficile) bacterium, IMM-529 can protect and prevent against enteric diarrheal symptoms associated with C.difficile infection. We have evidence to suggest IMM-529 treatment is effective and does not destroy the microbiome which is a side effect of treatment with many antibiotics. IMM-529 allows the microbiome to return to a healthy state while treating C. difficile infection (CDI). The antibodies in IMM-529 have been generated against the essential C. difficile virulence components, specifically, spores, vegetative cells and toxin B and shown to bind and neutralize a variety of human and animal C. difficile isolates. IMM-529, which was developed in collaboration with world-leading C.difficile Key Opinion Leader, Dr. Dena Lyras and her team at Monash University, has a Triple-Action MOA (antibodies to Toxin B + Spores + Vegetative Cells). It is a three-pronged approach that is novel, and which has yielded exceptional results in pre-clinical studies including (1) Prevention of primary disease, (2) Treatment of primary disease and (3) Suppression of recurrence. To date this is the only investigational drug that has showed positive therapeutic benefits in all three phases of the disease. In the preclinical stage, prevention studies demonstrated an 80% efficacy without the use of antibiotics. Furthermore, in treatment studies an 80% efficacy was demonstrated without the use of antibiotics like vancomycin. In relapse studies a 90% survival rate was noticed vs 22% survival rate in the control group. To our knowledge, it is to date the only investigational drug that has showed therapeutic benefits in all three phases of the disease. The Company’s plan to file an IND with FDA for further development of the drug candidate, with the initial focus on treating patients with recurrent disease. The trial is designed to study a total of 60 patients, diagnosed with CDI and have received standard of care antibiotic treatment. The primary objective is to assess IMM-529 safety and tolerability, while secondary end points are to evaluate the preliminary efficacy of IMM-529 as evaluated by duration and severity of symptoms and rate of disease recurrence.
IMM-529 has a unique competitive advantage:
| ● | Triple Mechanism of Action – IMM-529 not only targets the Toxin B, but it also contains antibodies to the spores and the vegetative cells. This is unique among all assets currently in development. |
| ● | Effective vs Virulent Strains –IMM-529 has been shown to be effective vs both the normal strains as well as the virulent strains of CDI, providing a strong Proof-of-Concept (POC) model that IMM-529 can be a front-line agent in the battle vs hypervirulent and difficult to treat strains. |
| ● | Effective in All phases of the Disease – IMM-529 has shown that it can be an effective agent in all phases of the disease including prevention of infection, treatment of primary disease and recurrence. This is novel amongst all of the competition and indicates a much larger potential use than current development programs which primarily target recurrence. |
| ● | Oral Therapy – IMM-529 is an oral therapy lessening costs/burden on the patient, hospitals and the healthcare system overall. |
| ● | Not an Antibiotic – IMM-529 is not an antibiotic, it only targets C. difficile its Toxin B, spores and vegetative cells. It therefore does not negatively impact the rest of the gut flora and allows the flora to return to normal, while fighting the primary infection/recurrence. |
CDI is an infection of the colon caused by the bacteria Clostridioides difficile that produces toxins that cause inflammation and severe diarrhea. CDI can also result in serious disease complications including bowel perforation, toxic megacolon and sepsis, and it can prove fatal in the most severe cases. In recent years, increases in the frequency and severity of CDI have been observed worldwide, as well as an increased risk of community-associated CDI, and CDI in persons previously thought to be low risk. It is estimated that CDI affects up to 1.2% of hospitalized patients in the United States, representing an estimated cost of USD 4.8 billion per year (source: CDC). In Europe, the estimated cost is approximately 3 billion per year, which is likely to increase concomitantly with a more elderly society; more than 134 million Europeans will be >65 years by 2050. In addition to hospitalization, the most significant predisposing factors for CDI include advanced age (>65 years) and antibiotic therapy (disrupts the normal gut microbiota). The most common antibiotics implicated to date include broad-spectrum cephalosporins, fluoroquinolones and clindamycin. The only remaining effective therapeutic agents are metronidazole, vancomycin and fidaxomicin. Vancomycin and metronidazole are the current standard of care, accounting for 80% of patients share in the US. However, these two therapies are plagued by a 25% rate of CDI recurrences and each recurrence predisposes to further recurrence. After two or more episodes of recurrence, the risk of subsequent recurrence may reach 65%. This underscores the need for new treatments. Against this backdrop, the last decade has seen the emergence of a new epidemic of CDI characterized by increased frequency and severity of enteric disease and increased resistance to antibiotic therapy.
The global therapeutics and prophylactics market for Clostridioides difficile infections (CDIs) will expand more than fourfold from USD 356.3 million in 2014 to over USD 1.5 billion by 2024, representing an impressive Compound Annual Growth Rate (CAGR) of 15.8%, according to research and consulting firm GlobalData. The company's report states that this increase will be driven by the modest uptake of patent-protected, CDI-specific antibiotics and the arrival of novel non-antibiotic approaches to treat and prevent recurrent CDI.
| 3. | Campylobacter and Enterotoxigenic Escherichia coli (CampETEC) therapeutic |
The Company is collaborating with the US Naval Medical Research Center (NMRC), Silver Spring, MD, USA to develop and clinically evaluate a new therapeutic to protect against Campylobacter and Enterotoxigenic Escherichia coli (ETEC) infections. The new Hyper-immune therapeutic contains high levels of antibodies which specifically target key protective antigenic targets Campylobacter jejuni capsule and Enterotoxigenic Escherichia coli (ETEC) colonization factor antigen I (CFA/I). The NMRC has submitted an IND application to the FDA for the new oral therapeutic and is preparing to commence the first of two planned clinical trials in the United States following approval of the application. The safety and protective efficacy of the product will be tested utilizing two controlled human infection-model clinical trials. One trial is designed to focus on the ability of the hyperimmune product to protect volunteers against ETEC infections, and the focus of the second trial is on protection of moderate to severe Campylobacteriosis. A total of 60 volunteers divided into two inpatient cohorts will be enrolled in the studies and randomly assigned to either Cohort 1 ETEC or Cohort 2 C. jejuni controlled human infection models.
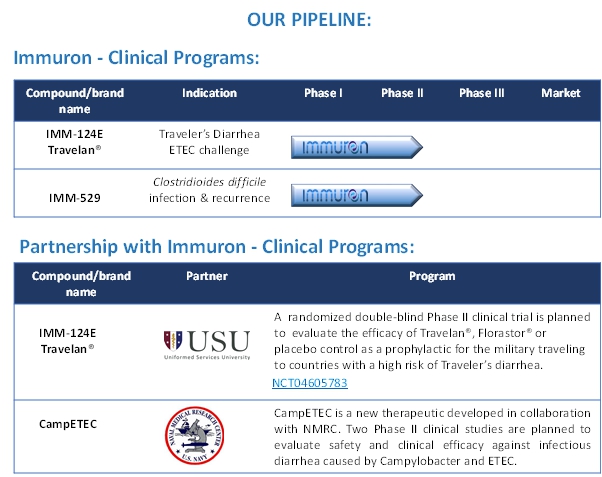
Immuron’s IMM-124E used to manufacture Travelan® and Protectyn® demonstrates antiviral activity against the COVID-19 virus in laboratory studies
Immuron enters FY23 with a newly appointed CEO who is completing an assessment of the entire product portfolio, target markets, competitive advantage, and key growth drivers. The company announced to the market in August 2022 that it has deprioritized SARS-CoV-2 research to focus on the clinical development of our more advanced stage therapeutic drug candidates. Immuron has dedicated significant resources to interrogate the mechanism of SARS-CoV-2 protection, however, the mechanism of how IMM-124E provides protection against SARS-CoV-2 viral infection remains unclear. In consideration of our research findings, the rapid evolution of the virus and changing treatment landscape presents significant challenges to conduct a clinical trial for SARS-CoV-2 with IMM-124E.
Immuron has previously reported IMM-124E research investigations demonstrating neutralizing activity against SARS-CoV-2 (ASX announcements dated 13 May 2021, 15 December 2020, and 21 July 2020). The company has been pursuing the antiviral activities of IMM-124E, focusing on establishing a better understanding of the mechanism of action associated with these initial observations. CSIRO conducted Quantitative Mass Spectrometry analysis (LC-MS/MS) to identify potential antiviral agents that are significantly enriched in IMM-124E. Quantitative proteomics identified at least 53 proteins that are significantly overexpressed in IMM-124E compared to the Milk Powder control samples. This included 17 immunoglobulin-like proteins that appear to be enriched between two- to nine-fold in Immuron Colostrum drug substance and several small antimicrobial proteins known to function in defense against bacterial infections. Testing completed by Research Scientists at the Peter Doherty Institute for Infection and Immunity detected no neutralizing antibodies in IMM-124E targeting SARS-CoV-2 (COVID-19) virus. Researchers analyzed immune fractions of IMM-124E, previously isolated by Monash University Scientists at the Biomedicine Discovery Institute, for antibody-mediated viral neutralization. Antiviral activity was undetectable in these immune fractions, suggesting an alternative, non-specific, mode of action is responsible for earlier preliminary results.
We know that SARS-CoV-2 causes an influenza-like disease that is primarily thought to infect the lungs with transmission through the respiratory route ranging from mild respiratory symptoms to severe lung injury, multiorgan failure, and death. Understandably, respiratory symptoms have dominated the clinical focus, however gastrointestinal symptoms such as diarrhea, vomiting, and abdominal pain are also observed in a subset of patients often presenting with no respiratory symptoms. In the United States the Centers for Disease Control and Prevention updated the symptoms of coronavirus to include diarrhea. Clinical research suggests that the Gastrointestinal tract may present another viral target organ. The virus RNA has been detected in anal swabs of some patients even after nasopharyngeal testing has turned negative, and cells in the inner-gut lining express high amounts of the angiotensin-converting enzyme 2 (ACE2) receptor that SARS-CoV-2 uses to gain entry to cells implying the potential for gastrointestinal infection and a fecal–oral transmission route. However, fecal–oral transmission has not been demonstrated to be a significant factor in the pandemic and the current research is still inconclusive. The company has filed a provisional patent application in respect of the findings.
US Department of Defense New Drug Candidate to treat moderate to severe campylobacteriosis and Enterotoxigenic Escherichia coli (ETEC) infections.
After more than 12 months’ COVID-19 related delay, Immuron’s clinical development collaboration with the US Department of Defence (DoD) resumed with the US Naval Medical Research Center (NMRC) filing an investigational new drug application with the U.S. Food and Drug administration (FDA). In July 2022, Immuron announced that the NMRC has received feedback from the FDA following a review of the Investigational New Drug (IND) application for a new oral therapeutic targeting Campylobacter and ETEC. The Agency has specified that the IND does not contain sufficient information required under 21 CFR 312.23 to assess the risk to subjects in the proposed clinical studies. The IND has been placed on Clinical Hold until the FDA have received and reviewed a response from the NMRC justifying dosing, safety monitoring and a risk mitigation plan. The NMRC has previously filed and had IND applications approved by the FDA on similar colostrum-based products without being requested for supporting pharmacology/toxicology data. The NMRC are currently addressing the clinical hold comments and plan to submit a complete response letter in September 2022 requesting a Type A meeting with the FDA to discuss the clinical hold and the necessary protocol amendments. The meeting will be scheduled in 30 calendar days from receipt of the NMRC meeting request and complete response letter. In July 2021, Immuron announced that the NMRC received written guidance from the U.S. Food and Drug administration (FDA) in relation to the clinical development pathway of a new investigational drug which the company is developing to treat moderate to severe campylobacteriosis and Enterotoxigenic Escherichia coli (ETEC) infections. The Type B meeting with the FDA discussed the Chemistry, Manufacturing and Controls including the proposed release testing specifications of the product as well as the planned clinical studies evaluating the safety and efficacy of the product.
The company initiated the second vaccination campaign in March 2022 and utilized the bispecific vaccine developed by the NMRC which is made up of the capsule of C. jejuni chemically conjugated to the CFA/I pilin of ETEC. The second vaccination campaign was successfully completed in May 2022 and each animal in the second herd received three doses of the vaccine. The hyper-immune colostrum was harvested in July 2022 and samples were shipped to the NMRC for immunological evaluation. The NMRC confirmed that the conjugated vaccine produced a robust immunological response and reported that the new Hyper-immune therapeutic contains high levels of antibodies which specifically target Campylobacter jejuni capsule and Enterotoxigenic Escherichia coli (ETEC) colonization factor antigen 1 (CFA/1). These are key antigenic targets predicted to be protective against diarrhea induced by both pathogens.
The manufacturing campaign for the drug substance was completed in August 2022 and the company plans to complete the manufacture of active drug product in October 2022. Once completed the investigational medical products will be transferred to the Johns Hopkins Bloomberg School of Public Health (JHBSPH) in the USA the clinical trial site which will be conducting the two planned Controlled Human Infection Model clinical studies. Work on the Investigational New Drug (IND) application and the clinical protocols for evaluating the safety and efficacy of the product in moderate to severe campylobacteriosis and Enterotoxigenic Escherichia coli (ETEC) infections continues. The NMRC now plans to file the IND application with the U.S. Food and Drug administration (FDA) in Q1 2022. The ability of the new hyperimmune product to protect volunteers from moderate to severe campylobacteriosis and ETEC disease will be assessed during two inpatient clinical trials the first of which is scheduled to commence in the first half of 2022.
For all the disruption caused by the COVID-19 pandemic, our partnerships with components of the US Department of Defense remain strong, close, and strategically vital. We will continue the clinical development of a new oral therapeutic to treat moderate to severe campylobacteriosis and Enterotoxigenic Escherichia coli (ETEC) infections in conjunction with the US Naval Medical Research Centre.
Immuron Awarded $6.2 Million to Clinically Evaluate a Military Strength Dosing Regimen for Travelan
Immuron is pursuing a regulatory pathway to license Travelan® (IMM-124E) with the Food and Drug Administration (FDA) via a Biologics License Application (BLA). The proposed indication is to reduce the risk of contracting travelers’ diarrhea caused by bacterial pathogens. The Company announced in January 2022 that it was awarded AU$4.8M (US$3.43M) by the Medical Technology Enterprise Consortium (MTEC) for the development of a Travelan® dosing regimen acceptable for use by the US military. The US Naval Medical Research Center (NMRC), Silver Spring, MD, USA was also awarded over AU$1.4M (USD $1M) in a separate grant to provide immunological support for the Immuron clinical program. In April 2022 the company also announced a new MTEC request for funding seeking an additional US$4M to fund the CMC Assay Development and Validation, Nonclinical Safety Studies and Stability Studies required to support the BLA. The focus of this new project proposal is to develop a self-administered non-vaccine oral immunotherapy to prevent endemic diarrheal disease by targeting multiple bacterial pathogens. The oral immunotherapy should mitigate symptoms, shorten the duration of illness, and/or reduce the risk of contracting bacterial diarrheal illnesses. The proposed immunotherapy product will target enterotoxigenic Escherichia coli (ETEC), and at least one other common bacterial diarrheal pathogen e.g., Campylobacter spp or Shigella spp. Immuron was formally notified that no government funding is immediately available, however, this application has been deemed ‘eligible for funding’ and will be eligible for award for a period of up to two years.
The major focus over this reporting period has been to establish and execute agreements to commence the MTEC award and perform a dose optimization controlled human infection model (CHIM) study with IMM-124E. Five Contract Research Organizations have been approached to conduct the CHIM study, quality, experience, timelines and budgets are the major factors under consideration. A SWOT and Risk analysis and due diligence of each site has been completed. The company expects to execute a Master Service Agreement in September 2022 with the preferred CRO. A Service Proposal has been executed with our Contract Manufacturing Organization and the manufacture of the investigational medical products (IMM-124E and placebo caplets) for the clinical study has been completed. The company is presently finalizing drafts of the Investigational brochure and clinical study protocol. The Chemistry Manufacturing and Control sections of the IND are also well advanced. The company plans to file the investigational new drug application with the FDA before the end of 2022 and commence the clinical study in 2023.
The proposed development program is based on the past commercial and clinical trial experience with Travelan®. Two company sponsored clinical studies have demonstrated that Travelan® conferred 84% to over 90% protective efficacy against moderate to severe diarrhea upon challenge with ETEC in comparison to a placebo. These clinical studies were performed using two different doses of Travelan® (200 mg and 400 mg), administered 3 times a day. Ongoing discussions with Army and Navy leadership have highlighted that such a regimen is cumbersome for military personnel deployed in austere environments and military field studies have shown that compliance is low with products dosed more than once per day. The rationale behind the company’s proposal is to leverage the current BLA program to obtain US Government funding to test the efficacy of one large daily dose regimen of Travelan® in a controlled human infection model (CHIM) clinical study using the ETEC strain H10407. This dose regime is potentially more amenable for use in military populations. Results of the proposed clinical study will inform dosing in the planned pivotal Phase 3 studies for BLA licensure.
In January 2022 the company announce the funding of a new research agreement with the U.S Department of Defense. The focus of this new agreement, entitled “Biologics License Application (BLA) of a therapeutic Bovine Immunoglobulin supplement targeting Travelers’ Diarrhea caused by Enterotoxigenic Escherichia Coli (ETEC)”, is aimed at testing and confirming the efficacy of a single larger dose regimen of Travelan® in a controlled human infection model (CHIM) clinical study using the enterotoxigenic Escherichia coli (ETEC) strain H10407. This single larger dosing regime is potentially more amenable for use in military populations. Up to 60 volunteers will be enrolled in the clinical study and will be randomly assigned to receive either a once-daily dose of 1200 mg of Travelan® or placebo. This study will occur across two cohorts (n=15 Travelan® subjects and n=15 placebo subjects per cohort), as the inpatient unit can accommodate up to 30 study participants at a time. A project kickoff meeting for this award was held on the 25 of January 2022 with the U.S Government sponsors and representatives of the company, the Naval Medical Research Center, Navy Advanced Medical Development and the Medical Technology Enterprise Consortium.
The award follows several pivotal meetings held last year with our US Department of Defense (US DoD) associates to review the proposed company sponsored phase III clinical trial strategy, address key questions identified by the FDA clinical reviewers and to identify potential endemic countries and clinical sites of interest to the US DoD. During these meetings the company was invited to present its strategic plan for the Biologics License Application (BLA), to the Military Infectious Diseases Research Program (MIDRP). MIDRP manages research and development programs for the US DoD and its mission is to protect the U.S. military against naturally occurring infectious diseases via the development of U.S. Food and Drug Administration (FDA) approved vaccines, drugs, and diagnostic assays. The meeting also focused on funding opportunities available to support the BLA and the associated approval process, as well as to provide some additional insights on the processes the company would need to navigate to advance Travelan with FDA licensure and DoD acquisition.
The company’s presentation was held on the 25 May 2022 and was well attended by the US Government sponsors. The Government reviewers were very much engaged and interested in the technology and the proposal. Advanced Technology International (ATI), the MTEC Consortium Management Firm formally notified the Company on the 25 June 2022 that our proposal was considered eligible for award and requested Immuron to submit a full proposal for consideration which was prepared and submitted to the MTEC Contracts team on the 13 July 2022. The company received formal notification confirming that the US Government sponsors had completed the evaluation of our proposal and intends to select it for award subject to funding availability.
Uniformed Services University Phase II P3TD Field Trial targeting travelers’ diarrhea
In May 2022 the company provided shareholders and the market with a progress update on the planned clinical field trial to evaluate the efficacy of Travelan® sponsored by the Uniformed Services University (USU) in Travelers’ Diarrhea (TD). USU’s Infectious Diseases Clinical Research Program (IDCRP), the UK Ministry of Defense and the New York City Travel Clinic are jointly planning to conduct the randomized clinical trial to evaluate the efficacy of two commercially available nutraceutical products for TD and inform strategies for Defense Force Health Protection. The P3TD study is a randomized, double-blind, placebo controlled multicenter clinical trial designed to evaluate the effectiveness of 2 nutraceuticals: A probiotic (Florastor®) and IMM-124E (Travelan®) passive immunoprophylaxis verses a placebo, for prophylaxis during deployment or travel to a high-TD risk region (ClinicalTrials.gov Identifier: NCT04605783). All study participants (1302 in total) will be randomized to one of the two active products or placebo (434 per arm).
The clinical protocol was amended in December 2021 removing the prebiotic (Bimuno®) from the active study arms. More changes have been recently made to the clinical study protocol to extend the treatment period from 13 days to 22 days to cover the COVID-19 quarantine period still required by some countries. The extended time is necessary as those travelers required to quarantine upon arrival who may be still at risk of diarrhea symptoms during this period. The protocol amendment has been submitted to the ethics board for approval and recruitment will commence once approval has been granted. USU expects to initiate the study by the end of this year and complete clinical trial enrolment in approximately 18 months.
IMM-124E is manufactured from colostrum harvested from dairy cows that have been immunized against the 13 most common pathogenic strains of enterotoxigenic E.coli (ETEC). IMM-124E is designed to block and reduce bacterial growth without negatively impacting essential microbiota, and is a first-in-class, oral polyclonal antibody therapeutic which targets gram negative ETEC and other cross-reactive pathogenic bacteria in the gut, leading to the blockage of their pathologic activities.
Earlier Clinical Studies on IMM-124E
IMM-124E was evaluated as a potential drug to treat non-alcoholic steatohepatitis (NASH) under FDA IND #014933. The primary endpoint was the mean change from baseline in the hepatic fat fraction (HFF, %), as measured by MRI at week 24 for two doses of IMM-124E compared with placebo. Both doses of IMM-124E did not lead to significant reduction in fat at the end of 24 weeks of therapy. Topline results from this earlier IMM-124E phase II NASH clinical study were reported in March 2019. The 24-week treatment study which was conducted in Australia, Israel, and the U.S. involved 133 biopsy-proven NASH patients. The study results demonstrated that IMM-124E, a first-in-class, oral antibody therapy targeting the endotoxin lipopolysaccharide (LPS) and other bacterial components in the gastrointestinal tract, resulted in a statistically significant reduction of serum LPS in patients with biopsy proven NASH. IMM-1214E was developed to target ETEC pathogens, preventing LPS from translocating into the portal circulation. The study results demonstrated a statistically significant reduction of serum LPS levels in the drug treatment arms when compared to placebo, providing proof-of-concept for a novel mechanism of action. Serum ALT was also significantly reduced when compared to placebo as well as AST and cytokeratin-18 (CK-18) demonstrating metabolic endotoxemia can be decreased with IMM-124E which can lower serum LPS levels and reduce LPS -associated liver inflammation. The data showed a small statistically significant reduction in serum lipopolysaccharide (LPS), and reductions in two biomarkers associated with liver function, but the drug did not display signs of clinical benefit in reducing fat content of the liver in patients with NASH. Consequently, we decided not to continue clinical development of IMM-124E specifically to treat NASH. Data from this trial, however, showed that IMM-124E was not systemically absorbed, and the trial provided further support for IMM-124E’s safety profile, and for its potential use in other therapeutics areas.
Two additional clinical studies, sponsored and funded by the National Institute of Health, have been performed with IMM-124E: 1) a Phase II clinical study in patients with severe alcoholic hepatitis (SAH) conducted under FDA IND #015675, and 2) a Phase II clinical study in pediatric patients with non-alcoholic fatty liver disease (NAFLD) conducted under FDA IND #017066.
Top-line results from the SAH trial with Dr. Arun Sanyal of Virginia Commonwealth University as the lead Principal Investigator were released on August 8, 2019. The primary objective of this study was to evaluate the safety and efficacy of IMM-124E at two oral dosage levels as compared with a placebo in patients with severe alcoholic hepatitis and with all patients being treated with steroids. A total of 57 patients with SAH with a model for end stage liver disease (MELD) score ranging from 21-28 were enrolled into the clinical study and were treated with either IMM-124E or NASH,placebo for which28 days (placebo N=20, IMM-124E 2400 mg/day N=18, IMM-124E 4800 mg/day N= 19). No suspected unexpected serious adverse reactions were reported and no differences in serious adverse events (SAE) were observed across the three arms of the study and no SAE was considered related to the study drug by investigators. Both doses of IMM-124E in the study (2400mg and 4800mg) were well tolerated. There were 9 deaths reported over a six-month period for the entire cohort and there were no significant differences across study groups. The data showed that IMM-124E is safe to use in patients with SAH but does not reduce circulating lipopolysaccharide levels, mortality or have an impact on MELD score in the study population, and we will not continue clinical development of IMM-124E specifically to treat SAH.
The COVID-19 pandemic has also impacted the IMM-124E pediatric clinical study in Nonalcoholic Fatty Liver Disease. The study’s Principle Investigator Dr Miriam Vos from the Emory University School of Medicine closed the study earlier this year with only 22 subjects out of a target 40 completed the study protocol. The study findings were reported as negative as there was no substantial changes in ALT (Primary study end point) in the active arm of the study when compared to placebo.
IMM-529 to Treat Recurrent C. difficile Infections (CDI)
The company is pursuing the clinical development of IMM-529 for FDA approval as drug to prevent recurrent Clostridiodes difficile Infection (CDI). The phase I/II, randomized, double blind, placebo-controlled clinical study of IMM-529 for the treatment of CDI is planned to be performed in 60 patients with recurrent CDI and will involve up to 12 clinical study sites in the USA and 4 clinical sites in Australia.
The company has established a Medical Advisory Committee to review the clinical development plans and establish a clinical protocol for IMM-529 in recurrent CDI. Members include Professor Teena Chopra, Professor of Medicine Wayne State University School of Medicine, Detroit Michigan. Professor Chopra is an Infectious Disease Epidemiologist with a specific interest in CDI. Professor Paul Feuerstadt assistant Clinical Professor of Medicine, Yale University School of Medicine and Professor Sahil Khanna, Professor of Medicine at the Mayo Clinic. The committee members have an in depth understanding on CDI and currently treat a large number of patients with recurring CDI. The Medical Advisory Committee has completed their review of the clinical trial protocol following several meetings and we are currently in Phase IIB. IMM-124E is also the investigational drugprocess of two NIH-sponsored Phase IIfinalizing the clinical trials in alcoholic steatohepatitis (ASH)protocol, identifying suitable clinical trial sites and Pediatric NASH. Dr. Arun Sanyal, one of NASH’s foremost thought leaders, isupdating the principal investigator of our NASH Phase II trial.
IMM-124E is a first in class oral, anti-LPS polyclonal antibody, with strong anti-inflammatory and anti-fibrotic properties, making NASH an ideal target for this compound. IMM-124E bindsProject plan which will be presented to the LPS endotoxinBoard of gram-negative bacteria and influencesDirectors for approval.
The company has completed the cell-mediated immune system through regulatory T cell populations, creating a downstream decrease of liver inflammation.
NASH is a severe type of non-alcoholic fatty liver disease (NAFLD). NAFLD is the most common liver disease and is associated with obesity and type-2 diabetes, and is characterized by the accumulation of fat in the liver with no other apparent causes. Approximately 10%-20% of people with NAFLD will progress to NASH. Current estimates place NASH prevalence at approximately 24 million people in the U.S., or 7%assessment of the population, with similar prevalence in other major developed markets.
There are currently no treatments approvedacceptability of the orphan drug designation (ODD) application for NASH and other compounds in development target primarily one biological pathway believedIMM-529. Based on the literature related to impact NASH. However, NASH is now increasingly recognized as a multi-factorial disease, creating a unique opportunity for IMM-124E given our broad and upstream anti-inflammatory properties.
Our second lead compound, IMM-529, targets the C.Clostridiodes difficile bacterium and contains polyclonal antibodies to the Toxin B, the spores, treatment of recurring infection, and the vegetative cells. We recently successfully completedinformation available on the Center for Disease Control (CDC) and prevention site, our pre-clinical program and are currently recruiting patients with CDI into a Phase I/II clinical trial.regulatory consultants have concluded that it would be challenging to secure an ODD designation for IMM-529 was developed and tested extensively in pre-clinical models in collaboration with Dr. Dena Lyras at Monash University, Australia. Dr. Lyras is one ofbased on the world’s foremost experts in C.difficile.available data.
Background on C. difficile
C. difficile, is a gram-positive, toxin-producing, spore-forming bacterium that generally causes severe and persistent diarrhea in infected individuals, but can also lead to more severe outcomes, including in the most serious cases, death. C.difficileinfection (CDI) is most often associated with the prior use of antibiotics. The U.S. Centers for Disease Control has identified CDI as one of the top three most urgent antibiotic-resistant bacterial threats in the U.S. Itand is now the most common cause of hospital acquired infection in the U.S. and has overtaken methicillin-resistant Staphylococcus aureus in prevalence. CDI is responsible for the death of approximately 29,000 Americans each year.
We market an OTC product, Travelan, in Australia, Canada, China and in the U.S., for the prevention of Traveler’s Diarrhea. Travelan has been shown to be 90% effective in the prevention of diarrhea in several E-coli challenge placebo controlled studies. Travelan is based in the same platform and targets 13 strains of E-coli. We also market Protectyn, a health product targeting LPS bacteria in the gut in Australia. Travelan and Protectyn sales for fiscal year 2017 were A$1.4 million and A$1.0 million for fiscal year 2016.
In addition to these two programs, we are also targeting other anti-infectious and anti-inflammation diseases such as Shigella, Campylobacter and colitis. These early programs are pursued in cooperation with some of the leading research institutions in the world including the U.S. Army, U.S. Navy and Zurich University.
Below is our clinical and pre-clinical pipeline. We believe that we have successfully developed one of the most comprehensive portfolios of fatty-liver disease programs in the industry, with three Phase 2 clinical trials including NASH, ASH and Pediatric NASH.
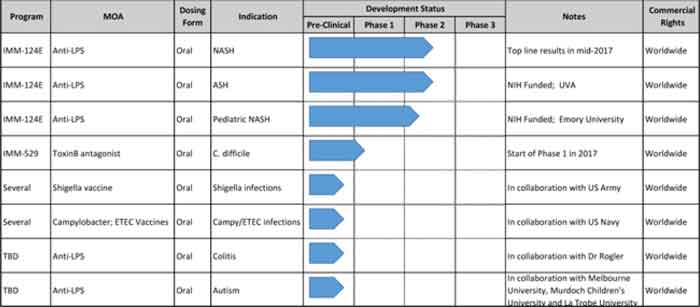
Our Major Markets
Our two lead assets target two prevalent diseases with major unmet need: NASH and C.difficile. The versatility of our platform allows us to target other immune mediated diseases such as IBD and infectious agents such as Shigella and Campylobacter. Both therapeutic areas encompass millions of potential patients and present significant unmet medical needs.
Fatty-Liver Diseases Overview
The increasing prevalence of obesity-related disorders has contributed to a rapid rise in the prevalence of NASH and NAFLD. In the U.S., NAFLD affects approximately 27%-34% of the population, or an estimated 86 million to 108 million people. Approximately 10%-20% of people with NAFLD will progress to NASH. Current estimates place NASH prevalence at approximately 24 million people in the U.S., or approximately 7% of the population, with similar prevalence in other major developed markets. Prevalence is also rising in developing regions, likely due to the adoption of a more sedentary lifestyle and westernized diet consisting of processed food with high fat and fructose content.
NASH is a progressive disease that displays an increasing burden of liver fibrosis as the disease gets progressively worse. It is estimated that 63% of all NASH patients, or approximately 15 million people, have either no scarring of the liver (F0) or present with evidence of mild fibrosis (F1)C. The other 37%, or approximately 9 million people, will present with either moderate (F2) or severe fibrosis (F3).
The high level of investment activity in the space, including licensing and M&A, is indicative of the high level of unmet need. This is driven by a few factors including the size of the population that might need interventional agents, the increasing recognition that NASH is a severe disease that needs to be treated and the belief that because NASH is a multi-factorial disease, there will be room for multiple therapies to offer choices to physicians and patients. An often-quoted analyst’s report by Deutsche Bank estimates that the NASH market will be A$35 billion by 2025. We believe that this is not unreasonable given that the statin branded market peaked at nearly A$30 billion worldwide and spanned multiple blockbuster drugs.
Pathophysiology of NASH
NAFLD/NASH is a disease that can evolve over time as the liver is subjected to an increasing amount of injury, which deepens liver inflammation and fibrosis, and can eventually lead to end-stage liver failure and liver cancer.
Inflammation plays a key role in the pathogenesis of NASH as conditions linked to the metabolic syndrome, including obesity, are all associated with an elevated state of chronic inflammation that cause damage to organs such as the pancreas and the liver. The pathogenesis is thought to be multi-factorial, and is a multiple-hit process involving insulin resistance, oxidative stress, apoptosis, and adipokines brought on by fatty diet, obesity, sedentary lifestyle and genetic pre-disposition.
In addition to the elevated state of inflammation suffered by NASH patients which perpetuates liver injury, it has also been shown that fatty diets, sugar and obesity are linked to an overgrowth of gram-negative bacteria within the gut. These gram-bacteria produce LPS (Lipopolysaccharides) products that elicit strong innate and cell-mediated immune responses in animals and humans, both from within the gut and through circulating endotoxins, particularly via Toll-like Receptor 4 on cells. The intraluminal LPS concentration is additionally thought to increase gut permeability, also known as “leaky gut”, enabling passage of endotoxins into the bloodstream and increasing the inflammatory response especially within the liver since 75% of the liver’s blood supply comes from the portal vein.
The importance of this LPS-driven inflammatory process is unfortunately often overlooked since there are no therapeutics that can effectively block gram-negative bacteria in the gut, except for broad-spectrum antibiotics which are not an option for long-term use in NASH patients.
The immune and inflammatory response to liver cell damage caused by these insults is mediated through a well-described signaling network of liver and immune cells. Kupffer cells, also known as resident liver macrophages, sense tissue injury and are the first responders to liver cell damage. Activated Kupffer cells initiate an inflammatory response to the liver injury and can activate HSCs (Hematopoietic Stem Cells) to transdifferentiate into myofibroblasts, the primary collagen-producing cell type responsible for liver fibrosis. The extent of this fibrosis can vary, and it is described in several stages. A normal liver is at a stage between F0 and F1. Stage F2 denotes light fibrosis, and F3 is severe fibrosis. Cirrhosis is defined from stage F4, when scar tissue exists throughout the liver.
Pediatric NASH is also a growing concern in many countries, and similar to NASH, Pediatric NASH is a progressive form of liver disease associated with excessive fat storage in the liver together with inflammation, which can then lead to liver fibrosis and cirrhosis. Pediatric NASH is believed to affect up to 5% - 10% of the U.S. pediatric population. A landmark U.S. study that examined the incidence of disease in 742 autopsied children who had died as the result of an accident, found that 17.3% of the children aged 15 to 19 years had NAFLD. There are currently no approved drug therapies for pediatric NASH.
ASH, is one of the hepatitis manifestations of alcohol abuse and typically occurs in an individual with long-standing history of alcohol intake. As in NASH, inflammation plays a key part in the development and worsening of ASH. More than 90% of heavy drinkers have steatosis, 10% to 35% have ASH, and 8% to 20% have alcoholic cirrhosis. While the consumption of alcohol is certainly a driving factor, especially if intake is high, other factors can contribute to the development of ASH in these patients, including diet, age and ethnicity. It is estimated that the prevalence of alcoholism in the U.S. is 8% of the U.S. population, or more than 15 million people. It is thought that at least 20% of patients with alcoholism have ASH or 3 million people in the U.S. alone.
IMM-124E for the treatment of fatty-liver diseases
IMM-124E, which is made of anti-LPS polyclonal antibodies, is manufactured from colostrum - harvested from dairy cows that have been immunized against bacterial LPS of the most common strains of ETEC. Such inoculation activates a generalized immune response in the host animal to produce antibodies which recognize and bind with the bacterial cell-surface epitopes presented. These antibodies are present in high concentration within our raw material.
IMM-124E contains at least 40% immunoglobulins (Ig), composed mainly of IgG (mostly IgG1), mostly targeting bacterial LPS specific sites and also have been additionally demonstrated to cross react with other types of bacteria such as Shigella and Salmonella.
We believe that there is a strong rationale supporting the clinical benefit of IMM-124E for the treatment of fatty-liver diseases:
The pre-clinical and clinical evidence gathered so far supports IMM-124E’s MOA as well as our position that IMM-124E is a unique and effective therapeutic for fatty-liver diseases including NASH, ASH and Pediatric NASH. This has been shown given this agent’s anti-fibrotic and anti-inflammatory properties, as well as its exceptional safety profile.
Pre-Clinical and Clinical Studies
Oral administration of IMM-124E has been tested in a Carbon-tetrachloride fibrosis mouse model and in an ob/ob metabolic model. Results demonstrate that IMM-124E has strong anti-fibrotic and anti-inflammatory effects on the liver and is associated with multiple biomarkers showing a similar response. IMM-124E had also been tested in a Phase I study of 10 (ten) biopsy-proven NASH and diabetes patients, conducted by investigators at Hadassah Medical Center, Jerusalem, Israel. All subjects did not present with any complications and demonstrated a beneficial effect on their existing disease.
Powerful Anti-Fibrotic and Anti-Inflammatory Effect Shown in CCl4 Mice Models
IMM-124E was tested in a Carbon-tetrachloride mouse model to determine the efficacy of orally administered IMM-124E to prevent hepatic inflammation and. 4 groups of mice (n = 6/8 per group) were utilized for the study as follow: Group A: (Positive Control) Intraperitoneal (IP) CCl4; Group B: IMM-124E (negative control); Group C: IP CCl4 + IMM-124E and Group D: IP CCl4 + IMM-124E (IMM-124E was administered two weeks before initiation of Carbon-tetrachloride).
The IMM-124E treatment group (Group C) demonstrated the following when compared to Control Group (Group A):
Kupffer Cells 4/80 Flow Cytometry and IHC
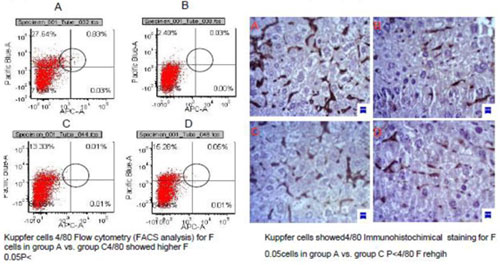
A representative macroscopic views of the livers from Group A (Positive Control) demonstrates the widespread fibrotic liver associated with this chemical insult, while the liver from the IMM-124E treated group (Group C) shows a normal liver, demonstrating the protective effect of IMM-124E even with the most aggressive of fibrosis models.
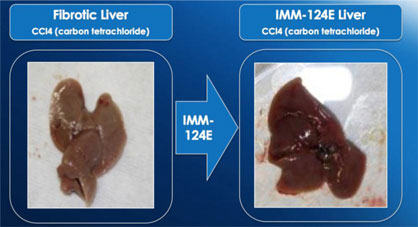
The effect of this fibrosis-protective effect is evident both macroscopically as well as histology and correlates with the reduced number of effector cells, activated pro-fibrotic F4/80high macrophages, associated with liver fibrosis, proving the mechanism by which fibrosis is halted.
Ob/Ob Mice Models Show Significant and Sustained Anti-Inflammatory and Anti-Metabolic Effects
We also conducted a study using ob/ob mice, which are a well-accepted mouse model for the metabolic syndrome showing insulin resistance, dyslipidemia, liver steatosis and elevated liver enzymes.
4 groups of ob/obmice were fed for 6 weeks with either IMM-124E or immunoglobulins purified from IMM-124E (3 doses). A positive Control was also established in parallel to the treatment groups. Mice were evaluated for their liver injury (serum ALT) metabolic state and immunological / inflammatory response using Flow cytometry to determine alterations in regulatory T-cell (Treg) and cytokines. Mice were also followed for liver enzymes, glucose levels, glucose tolerance test (GTT), hepatic and serum triglycerides (TGs) levels.
High dose of IMM-124E derived immunoglobulins demonstrated a statistically significant beneficial effect over control on all fronts, including a decrease in serum ALT, hepatic triglycerides and serum triglycerides. Glucose tolerance test (GTT) was improved within this group as well. The same group of mice showed a decrease in serum TNF-α, a strong pro-inflammatory cytokine, together with immune cellular shifts indicative of suppression of inflammation.
IMM-124E demonstrated a similar metabolic effect, with a statistically significant reduction in hepatic and serum triglycerides levels and an increase in CD4-CD25-FoxP3 cells which are strong immune regulatory cells.
Phase 1/2 - IMM-124E Demonstrated Safety and Significant Anti-Metabolic Effect in Patients with Biopsy-Proven NASH and Impaired Glucose Metabolism (i.e. type II DM or Insulin resistance)
We conducted a Phase 1/2 clinical trial to evaluate the safety and preliminary efficacy of IMM-124E in humans. This study was an open-label, single-center, 10 patient trial, conducted in subjects with impaired glucose tolerance and biopsy-proven NASH. All patients were treated for 30 days and were monitored for their liver enzymes, glucose metabolism markers, serum lipids and metabolic associated hormonal signals such as Adiponectin and GLP-1. Inflammation associated cytokines and regulatory immune cells were evaluated as well.
The primary endpoint of the study was safety and all patients completed the study according to protocol. No treatment related adverse events were reported by the investigators for any of the clinical or laboratory parameters during the treatment and follow-up.
We also observed multiple impact on the underlying disease relevant parameters including:
The combined results of these pre-clinical and clinical studies have clearly shown that IMM-124E exerts immunomodulatory and anti-inflammatory effects resulting in metabolic and liver related biomarker improvements, and showed strong inhibition of fibrosis. In addition, the oral administration of IMM-124E in the Phase I clinical study was reported to be well-tolerated with no treatment-related adverse events reported. We believe that the combination of the pre-clinical and the clinical studies, as well as the supporting literature linking LPS to NASH, establishes IMM-124E as a unique and potentially paradigm-changing option for NASH patients.
Global Phase II Clinical Trial in NASH
In November 2014, we initiated our global Phase II, multicenter, double blind placebo control, randomized clinical study with sites in the U.S., Australia and Israel. The study’s goal is to assess the safety and effectiveness of IMM-124E for the treatment of NASH. A total of 133 biopsy-proven NASH patients have being enrolled comparing 2 doses of IMM-124E to placebo within a 6 month treatment period. The study design had been reviewed by the FDA and finalized under the agency’s recommendation. The top line results of the study are expected to be reported in the first quarter of 2018.
The trial Principal Investigator is Dr. Arun Sanyal, one of the world’s foremost leaders in NASH. Dr. Sanyal is Professor of Medicine and Former Chairman of the Division of Gastroenterology, Hepatology and Nutrition at VCU Medical Center, Virginia, U.S. Dr. Sanyal is an internationally renowned expert in liver diseases. He is a former President of the AASLD (American Association for the Study of Liver Diseases) and is the current Chair of the Liver Study Section at the NIH.
NIH Funded Phase II Clinical Trials in ASH and in Pediatric NASH
In addition to our Phase II clinical study for the treatment of NASH, 2 studies evaluating IMM-124E were chosen to be funded by the American National Institute of Health (NIH).The first study is a Phase II clinical study for the treatment of Alcoholic SteatoHepatitis (ASH), in collaboration with Dr. Arun Sanyal at Virginia Commonwealth University (VCU). The trial is a 66 patient, randomized to placebo. The study is expected to generate safety as well as preliminary efficacy data and should be completed in in the first quarter of 2019.The second study is also a Phase II clinical study for the treatment of Pediatric NASH, in collaboration with Dr. Miriam Vos at Emory University, Atlanta. This Phase II trial aims to enroll 40 pediatric patients for three months treatment and aims at determining the safety and exploratory efficacy of IMM-124 in Pediatric NASH patients.
IMM-124E – Competitive Advantage
We believe that IMM-124E has a significant competitive advantage when compared to other assets in development:
C.difficile Infections (CDIs)
C.difficilecan cause symptoms ranging from diarrhea to life-threatening inflammation of the colon. In the most serious cases, C.C. difficileinfections (“CDIs”) CDIs can lead to fulminant colitis, megacolon and even death from colon perforation and peritonitis. Cdifficileis acquired from contact with humans or objects harboring these bacteria. It can be commonly acquired during hospitalization. Up to 30% of those who have spent a prolonged period in the hospital leave carrying these bacteria in the bowel flora, especially if antibiotics have been administered. This is because CDI is most often associated with the prior use of broad-spectrum antibiotics, which decrease the natural resistance of the body to C.C. difficile. Chronic CDI is estimated to occur in perhaps 15-30% of those infected. In some cases, reinfections can occur with the same or with a different strain. Risk factors for relapse include the number of previous episodes, the need to use antibiotics recurrently, and older age groups.
Human infection occurs through ingestion of the highly infectious spores, which survive acid and bile on itstheir passage into the bowelbowel. Normally, this infectious process may be eradicated or substantially reduced by the normal bowel flora since the microbes that collectively make up the flora provide colonization resistance against pathogenic species through competition for essential nutrients and attachment sites to the gut wall. However, if the bowel flora is suppressed because of concomitant use of antibiotics, or if the bowel flora has a deficiency, C.C. difficilecan colonize the flora and remain with the patient. In some individuals, it seems that antibiotics are not required for colonization to take place, which may be related to inadequate defense of the naturally occurring flora within the bowel.
When C.C. difficiletakes hold, the toxins produced by the bacterium, especially Toxin B, act by inactivation of Rho GTPases leading to cell death, and stimulation of an inflammatory cascade that exacerbates tissue damage, diarrhea, and pseudomembranous colitis. When faced with a CDI infection, the standard of care is typically either a course of Vancomycinvancomycin or metronidazole, both of which are broad spectrum antibiotics. While these agents are very effective at treating the primary infections, they also severely impact the rest of the gut flora, creating an ideal environment for the C.C. difficilespores to once again take hold. This creates a vicious cycle, as more courses of antibiotic treatments worsen recurrence. Vancomycin and metronidazole treatments are plagued by increasing rate of CDI recurrences, underscoring the need for new treatments. There is also growing concern of resistance to Vancomycinvancomycin treatment.
C.C. difficileis a very hardy organism, most likely because it shedsheds spores and these sporesthat are unable to be eradicated by any known antibiotics. Since C.difficilespores are able to survive for long periods of time outside of the body, and because healthcare settings are often sites of significant antibiotic use, CDI transmission rates in hospitals, long-term acute care facilities and nursing homes have been increasing. CDI is also a cause of morbidity and mortality among hospitalized cancer patients and bone marrow transplant patients, as their immune systems are suppressed by cytotoxic drugs and sometimes by antibiotics that are administered to prevent opportunistic infections.
The U.S. Centers for Disease Control has identified CDI as one of the top three most urgent antibiotic-resistant bacterial threats in the U.S. and is now the most common cause of hospital acquired infection in the U.S. CDI is responsible for approximately 29,000 deaths in the U.S. annually. The prevalence of CDI is estimated at more than 450,000 infections annually, with nearly 100,000 cases of first recurrences. Research suggests that the risk of recurrence is approximately 25% after the primary occurrence of CDI, 40% after a first recurrence and greater than 60% for those experiencing two or more recurrences. CDI leads to an increased length of hospitalization and an estimated A$1.1 billion in health care costs annually in the U.S. The rise of community-acquired CDI is now a growing problem and led to the recognition that CDI is not simply limited to just hospitals. This increase in CDI incidence, which is now a growing problem worldwide due to the widespread and increase use of antibiotics, is the driver behind a growing market for C.difficile therapeutics, which is estimated to reach A$1.5 billion by 2024, up from A$350 million today.
IMM-529 – A PotentiallyNovel Triple Action offers a Revolutionary Treatment for Recurrent CDI
Our second lead compound, IMM-529, targets the C. difficile bacterium and contains polyclonal antibodies cross-reactive to Toxin B, spores and vegetative cells of the bacterium. IMM-529 is an oral biologic which does not destroy the microbiome like antibiotic treatments, allowing the microbiome to return to a healthy state, while treating the virulent CDI. The antibodies in IMM-529 have been demonstrated to be cross-reactive with a variety of human and animal C.C. difficileisolates and to their associated Toxin B, vegetative cells and spore components.
The antibodies in IMM-529 have also been shown to neutralize Toxin B from a historical C.C. difficilestrain (630), and from a hypervirulent (HV) strain which caused recent worldwide outbreaks. Immunoglobulin G comprised almost 90% of total immunoglobulin present in IMM-529, with major subclass IgG1 making up over 65% of total immunoglobulins.
IMM-529 is in the IND stage, and has successfully completed its pre-clinical program in CDI. IMM-529, which was developed and tested extensively in pre-clinical models in collaboration with world-leading C.difficile Key Opinion Leader Dr. Dena Lyras and her team at Monash University, has a unique Triple-Action MOA (antibodies toAustralia. Dr. Lyras is one of the world’s foremost experts in C. difficile. IMM-529 targets the virulent Toxin B, + Spores + Vegetative Cells):
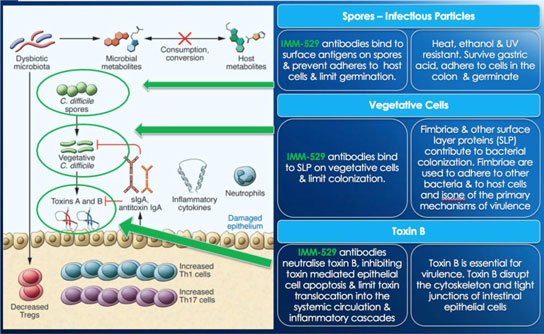
the spores and the vegetative cells. It is a three prongedthree-pronged approach that is unique and which has yielded exceptionalpromising results in the pre-clinical studies, including (1) Preventionprevention of primary disease, (2) Treatmenttreatment of primary disease and (3) Suppressionsuppression of disease recurrence. To our knowledge, itIMM-529 is, to date, the only investigational drug that has showed positiveshown therapeutic benefitspotential in all three phases of the disease.

Preclinical studies with IMM-529 yielded promising results in a number of pre-clinical animal models (shown below). All results were highly statistically significant:
| ● | Prevention of |
| ○ | Control group #1 (0/14) treated with water; and |
| ○ | Control group #2 (0/15) treated with non-hyperimmune colostrum. |


| ● | Treatment: approximately 80% survival (11/14) vs. <7% survival in the control groups: |
| ○ | Control group #1 (0/14): Treated with water alone following vancomycin treatment; and |
| ○ | Control group #2 (1/15): Treated with non-hyperimmune colostrum following vancomycin treatment. |
| ● | Relapse: approximately 90% survival in IMM-529 + vancomycin group (n=7/9); vs. 11% survival in the control group which received vancomycin alone (n=1/9). |
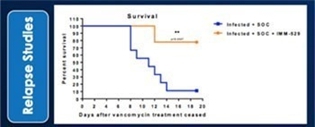
The results of these studies were published in Scientific Reports (Hutton et al. Bovine antibodies targeting primary and recurrent Clostridium difficle difficile disease are potent antibiotic alternatives), SCI Rep. 20172018 Jun 16:7(1):3665.
We have completed
Phase I/IIa clinical trial of IMM-529 in C. difficile patients
A first-in-man Phase I/II clinical trial was initiated at two clinical sites in Israel at the manufactureend of 2018 in CDI patients. This trial was intended to evaluate the safety, tolerability and effectiveness of IMM-529 together with standard of care (SOC) antibiotic treatment in patients with CDI.
On March 19, 2020, we provided an update regarding the status of the IMM-529 clinical supplies fortrial in patients with CDI, along with a refocusing of our efforts to develop IMM-529. The Phase I/II study andclinical trial of IMM-529 in patients with C. difficile initiated at the end of 2018 at two clinics in Israel provided us with disappointing numbers of enrolled patients. Only 9 out of 60 patients have opened the clinical site with the aim to recruit the first patientbeen randomized into the study and the company has decided to close these sites. We decided to further develop IMM-529 to treat CDI patients through a formal filing of an IND with FDA, and to develop a new clinical plan for the drug candidate with input from FDA. The focus for IMM-529 will be to explore how the drug can be developed to determine its impact on reducing recurrent CDI disease, a major unmet medical need in 2017.
treatment of patients suffering with C. difficile infections. We are planning to file a Type B meeting request with FDA to develop IMM-529 – Competitive Advantageto treat patients with CDI.
We believe that IMM-529 has a unique competitive advantage:
We are excited about the future prospects of this asset given the lack of treatment options that are available for this devastating disease. One of our major competitors, Seres Therapeutics, recently announced the interim results of a phase 2 trial with their SER-109 CDI therapeutic which failed to achieve the primary endpoint of reducing the risk of CDI recurrence. SER-109 (an ecology of bacterial spores enriched and purified from healthy, screened human donors) does not specifically target Toxin B, which has been proved time and again, especially through the work of Dr. Dena Lyras, to be the main driver of disease morbidity and mortality. We are confident in the long-term success of IMM-529 given its unique triple-action MOA which targets the Toxin B, the spores and the vegetative cells. We look forward to more data in the years ahead as we continue to develop this highly differentiated asset.
Other Development Programs
In addition to the IMM-124E and IMM-529 programs, weWe also have twoa research collaborations ongoingcollaboration with the U.S. Department of Defense including one(DoD) involving programs with theU.S. Walter Reed Army and a second collaboration with theU.S. Navy, Institute of Research, for the studydevelopment ofShigella, Campylobacter and ETEC vaccines. We also started a pre-clinical program targetingIrritable Bowel Diseases (IBD), in collaboration with renowned IBD Key Opinion Leader, Dr. Gerhard Rogler and the University of Zurich, Switzerland, and a pre-clinical Autism study with several universities / hospitals in Australia. three Shigella-specific therapeutic products.
Pre-Clinical - Colitis:The University of Zurich’s world renowned inflammatory bowel diseases researcher, Professor Gerhard Rogler, has teamed with us to launch a pre-clinical development program in colitis. The three-stage program will use well-known acute and chronic colitis models began in 2016 and continues through 2017.
Colitis, manifesting as a group of inflammatory bowel conditions, including Crohn’s Disease and Ulcerative Colitis, affects millions of people around the world. The global market for treatments of IBD, of which colitis is a significant component, is expected to reach an annual U.S. $10 billion by 2021.
Professor Rogler is Professor of Gastroenterology and Hepatology and Consultant Gastroenterologist at Zurich University Hospital Switzerland. He is also principal investigator of the Swiss Irritable Bowel Diseases cohort study, and the author of 200 original peer-reviewed articles.
Collaborations with U.S. Army and U.S. Navy:Navy. We believe that our collaborations with the DoD are a powerful validation of the potential of our platform to develop novel anti-infectives. These collaborations also open the door to explore and develop potentially low risk / low cost therapeutics with some of the most advanced research facilities in the world. The DoD earlier commissioned several studies to characterize the polyclonal antibodies contained in Travelan. The aim was to conduct trials to determine the product’s effectiveness in neutralizing pathogenic GI bacterial infections as a preventative treatment for U.S. military personnel and civilians stationed or traveling in locations where such infections can be debilitating.
U.S. Army –In June 2016, we signed an agreement with the Walter Reed ArmyArmed Forces Research Institute of Medical Sciences.
In January 2019, we reported that the DoD-commissioned study showed Travelan was immunologically reactive to a number of dangerous and potentially fatal infectious bacteria. The Department of Enteric Diseases unit of the Armed Forces Research (WRAIR) to developInstitute of Medical Sciences (“AFRIMS”) performed the study. It took place at a vaccine for a form of dysentery that kills up to one million people a year. WRAIR is the largest and most diverse biomedical research laboratory in Bangkok, Thailand. The study, one of three involving Travelan, looked at 60 clinical isolates of each of Campylobacter, ETEC, and Shigella obtained from infected U.S. defense personnel in southeast Asia between 1993 and 2016. The study indicated that, compared to the control, Travelan antibodies were reactive to all 180 clinical isolates.
In September 2019, we reported the findings of a study conducted by AFRIMS. The study evaluated the therapeutic potential of Travelan in a non-human primate (“NHP”) preclinical Shigella challenge model that closely mimics the disease seen in humans. The study was performed in collaboration with the Department of Defense. We will provideEnteric Diseases and the preclinical drug productDepartment of Veterinary Medicine, AFRIMS, and the Department of Enteric Infections, Bacterial Diseases Branch, WRAIR. The placebo-controlled study was carried out in 12 NHPs segregated into 2 groups: a Travelan treatment cohort of 8 and a placebo cohort of 4, which were treated with either Travelan or placebo respectively twice daily for the study.
a total of 12 doses over a 6-day period. The project aimsanimals received treatment for 3 days prior to develop a vaccine for shigellosis, a severe formoral challenge with approximately 3 x 10⁹ viable Shigella flexneri strain 2a organisms. All (4 of 4 - 100%) placebo-treated animals displayed acute dysentery that affects about 165 million people a year, mostly children, and causes upsymptoms within 24 to a million deaths. Symptoms of shigellosis, also known as bacillary dysentery, include severe and bloody diarrhea, fever, and stomach cramps. WRAIR aims to develop the vaccine for both civilian and military use in areas where endemic diseases such as shigellosis can compromise the health and readiness36 hours of the local community, travelers, contractors and defense personnel.
U.S. NavyShigella flexneri– In August 2016, we signed an agreement with 2a challenge. Seven of the U.S. Navyeight individuals in the Travelan treatment cohort (87.5%) remained symptom-free to test4 days post the reactivity and therapeutic effectiveness of Travelan against Campylobacter and ETEC, two common gram-negative bacterium. The next step would be to develop new vaccines. We will provide the preclinical drug products for the study.
Campylobacter’s main reservoir is poultry, however humans can contract the disease from contaminated food. At least a dozen species of Campylobacter have been implicated in human disease, with C. jejuni and C. coli being the most common. C. jejuni is now recognized asShigella flexneri 2a challenge. Only one of the main causesTravelan-treated cohort displayed dysentery symptoms during the same time frame as the placebo arm. Once the treatment period was concluded a second individual in the Travelan treatment group developed symptoms. Six of bacterial foodborne disease in many developed countries as well as developing countries where poultry is common.the eight Travelan treated cohort animals remained symptom-free to the conclusion of the study which was 11 days post the Shigella flexneri 2a challenge.
Enterotoxigenic escherichia coli is
In June 2020, we updated the market on the latest developments arising from our cooperative research and development efforts with the DoD. AFRIMS completed the histopathological analysis, which provides a type of Escherichia coli (E-coli) and onecomprehensive view of the leading bacterial causesclinical disease and its effect on tissues of diarrheagut, revealed that all animals in the developing world, as well asplacebo-treated group displayed severe inflammation in different parts of the most common causegastrointestinal tract. These animals also had very high levels of travelers’ diarrhea. Conservative estimatesinflammatory cytokines (IL-1b, IL-6 and IL-8) in fecal samples collected throughout the study. The inflammation seen in the gastrointestinal tract and the increase in inflammatory cytokines in the feces were closely associated with the observed clinical outcomes of dysentery. Only 3 of the 8 Travelan-treated animals had signs of inflammation in the gastrointestinal tract, and only 2 of those had high levels of inflammatory cytokines in fecal samples. All other animals in the Travelan-treated group were clinically healthy and did not excrete any inflammatory cytokines. Overall the results suggest that each year, about 157,000 deaths occur, mostlyTravelan® is functionally cross-reactive and may have prophylactic activity against Shigellosis.
In June 2020, we also reported the completion of the manufacture of three new Shigella-specific therapeutic products using proprietary vaccines developed by WRAIR. The immune reactivity of the three hyper-immune Shigella specific products were evaluated by the WRAIR using Enzyme-Linked ImmunoSorbent Assay and Western Blot analysis. The antibodies in children, from ETEC, but no vaccines exist, highlighting the need for new treatment modalities.products were shown to react with the specific antigens present in the vaccines. The antibodies within the three products were also reactive to 4 different clinical isolates of Shigella (S. flexneri 2a, S. flexneri 3a, S. flexneri 6, and S. sonnei). The three Immuron Shigella-specific therapeutic products will now go on to evaluation in WRAIR’s preclinical models of shigellosis.
Autism:In July 2016,September 2020, we announced a strategic partnership with three leading Australian research institutes focused on understanding how the genetic basis underlying Autism Spectrum Disorder (ASD) relates to changes toresults of the gut, and how our anti-LPS IMM-124E compound affects changes in mouse models for autism. This effort involves the University of Melbourne, La Trobe University and Murdoch Children’s Hospital.
Except for preclinical drug products, this unique collaboration has the potential for tremendous upside given that are no treatments approved for autism, and very few assets in development. This could also potentially open the door for other development partnerships in Central Nervous System (CNS) conditions such as Alzheimer’s.
In summary, we believe that the breadth and depth of our assets and the support we are receiving from the NIH,study, sponsored by the DoD and other leading institutionsfunded through the Defense Health Agency, which was performed at the overseas laboratory of the WRAIR located in Bangkok, Thailand. The goal was to investigate the breadth of Travelan®’s immunological reactivity against pathogenic Vibrio cholera bacterial isolates. Clinical isolates were collected from infected personnel located in Bangladesh, Cambodia, and Key Opinion Leaders, demonstrates the importance of our platform and makes us truly a unique and attractive playerThailand, enabling researchers to gauge Travelan®’s potential against bacterial strains typically seen in the therapeutic areas we target.field. When compared to a placebo control, researchers found that the polyclonal antibodies comprising Immuron’s Travelan® product were reactive to all 71 clinical isolates from these infected individuals. The ability of Travelan® to bind these bacteria highlights the broad-spectrum recognition by Travelan® of surface antigens on potentially debilitating and even life-threatening bacteria.
Our Advisory Board
OUR ADVISORY BOARD
Our company’s programs arehave been supported by an advisory board consisting of:
| ● | Professor Teena Chopra, Professor of Medicine Wayne State University School of Medicine, Detroit Michigan. Professor Chopra is an Infectious Disease Epidemiologist with a specific interest in CDI. |
| ● | Professor Paul Feuerstadt is an attending Gastroenterologist at the Gastroenterology Center of Connecticut/PACT-Gastroenterology Center Hamden, CT and is also an Assistant Clinical Professor of Medicine at and the Yale University School of Medicine, New Haven, CT and the Frank H. Netter School of Medicine of Quinnipiac University, Hamden, CT. |
| ● | Professor Sahil Khanna, Professor of Medicine at the Mayo Clinic. Professor Khanna clinical practice focusses on the care and treatment of patients with CDI and he was instrumental in the establishment and implementation of the Fecal Microbiota Transplantation program at Mayo Clinic, Rochester, MN. |
| ● | Dr. Glenn Tillotson is a healthcare scientist with sound global infectious disease (ID) background and experience in anti-infective drug development and global medical educational and medical affairs. He has developed a significant network of sites/experts in the ID field and has authored many publications in the various aspects of ID. |
| ● | Dr. Dena Lyras (PhD) – Monash University. Dr. Lyras, an associate professor at Monash University, is one of the world’s leading experts in C. difficile. Dr. Lyras has spent her research career developing world-leading knowledge of C. difficile. She was the lead author of a seminal study published in Nature in 2009, which shed new light on the essential role specific toxins play in causing disease, a discovery that disproved prevailing opinion. |
| ● | Dr. Arun Sanyal (MD) –University of Virginia. Professor of Medicine and Former Chairman of the Division of Gastroenterology, Hepatology and Nutrition, VCU Medical Center. Dr. Sanyal is an internationally renowned expert in liver diseases. He is a former President of the |
| ● | Dr. Stephen Harrison (MD) – Professor of Medicine, Uniformed Services University of the Health Sciences, Bethesda, Maryland; Physician, San Antonio Military Medical Center, Fort Sam Houston, San Antonio, Texas. Chief of Residents, Internal Medicine, Brooke U.S. Army Medical Center. Dr. Harrison is an internationally renowned expert in NASH and his group has published seminal work on many aspects in the field. Dr. Harrison is the Principal Investigator of Galectin’s GR-MD-02’s Phase 2 trial and hold’s key roles in other leading clinical NASH studies. |
| ● | Dr. Miriam Vos (MD) – Emory University. Dr. Vos is an associate professor of pediatrics at the Emory University School of Medicine, and an attending Hepatologist at Children’s Healthcare of Atlanta. She specializes in the treatment of GI disease in children as well as fatty liver disease and obesity. Dr. Vos is also the author of The No-Diet Obesity Solution for Kids. |
| ● | Dr. Manal Abdelmalek (MD) – Duke University Medical Center. Dr. Abdelmalek is Associate Professor of Medicine at Duke Medical University Medical Center, Division of Gastroenterology & Hepatology, Section of Hepatobiliary Diseases & Liver Transplantation. Dr. Abdelmalek is a leading investigator in the field of NASH. |
| ● | Dr. Gerhard Rogler (MD, PhD) – Zurich University. Dr. Rogler was the principal investigator of our Colitis preclinical program. He ceased to be a member of our advisory board when the scientific results were published on January 25, 2020. Dr. Rogler is the Chairman of the Scientific Advisory Board of the University of Zurich and Professor of Gastroenterology and Hepatology and Consultant Gastroenterologist at the Division of Gastroenterology & Hepatology, Department of Medicine, Zürich University Hospital, Switzerland. |
Our Marketed Assets
Travelan:Travelan
OUR MARKETED ASSETS
Our Flagship Commercial Assets. Immuron currently markets our flagship commercial products Travelan® and Protectyn® in Australia, where both products are listed medicines on the Australian Register for Therapeutic Goods. Travelan® (AUST L 106709) is the onlyan over-the-counter orally administered passive immunotherapeutic product currently sold for the prevention of Traveler’s Diarrhea (TD). Travelan uses hyperimmune BCP from cows vaccinated against various strains of ETECindicated to protect against TD and reducesreduce the risk of TD, along withtravelers’ diarrhea and reduce the symptomsrisk of minor gastrointestinal disorders. Travelangastro-intestinal disorders and is sold in pharmacies throughout Australia. Protectyn® (AUST L 231001) is currently the only therapy that prevents TD by up to 90%, with a very high safety profile. Travelansold online and in health practitioner clinics and is notmarketed as an antibiotic and so it does not have the side-effect profile of antibiotics and does not contribute to the worldwide concerns about bacterial drug resistance. Two independent, double-blinded, placebo-controlled clinical trials in Europe in 90 healthy volunteers showed protection of more than 90% against infection with the type of E.coli that causes TD, along with indicating a significant reduction in abdominal cramps and stomach pain. There were no reported side effects in the clinical trials. Sales in fiscal 2015, 2016 and 2017, were A$1.0 million, A$1.0 million and A$1.4 million, respectively.
Travelan is now marketed in four countries including Australia, the U.S., China and Canada and we planned to launch Travelan in additional countries.
Our marketing and sales strategies vary by territory. In Australia, Travelan is sold within most pharmacies, and we utilize trade promotions strategies, as well as a contracted field force, to ensure that our products are appropriately distributed throughout our partner pharmacies. In the U.S., we are heavily focused on driving demand through the travel clinics market, such as Passport Health, and also by partnering with large distributors such as Medique. In Canada, we are actively promoting Travelan in both retail stores and pharmacies. In all of our markets, we invest in social media marketing, trade marketing, traditional media marketing and PR to drive awareness and pull through of Travelan.
Overall, over 50 million people from developed nations travel to developing countries each year, 35%-50% of people traveling to developing countries will suffer from TD, and 70% of these TD episodes will be caused by Enterotoxigenic Escherichia coli (“ETEC”). TD is the most common health problem faced by these travelers; given this, we believe that an expanded sales and marketing campaign for Travelan would lead to a strong increase in sales. We are in the process of finding partners for other priority markets outside of Australia, the U.S., Canada and China. Our market research has shown that TD is a A$600 million market worldwide including therapeutics approved for the treatment of TD, and off-label use of non-TD approved therapeutics such as antibiotics and OTCs. As the only preventative treatment on the market, we believe that the potential worldwide peak sales for Travelan is 20% of the WW TD market, or A$120 million per year.
Protectyn –For Gut Dysbiosis.Last year we launched Protectyn in Australia, a health product targeting LPS bacteria in the gut to prevent gut dysbiosis, improve bacterial clearance, reduce chronic inflammation and improve immune function. This product has been formulatedsupplement to help maintain a healthy digestive function and help supportliver. In Canada, Travelan® (NPN 80046016) is a licensed natural health product and is indicated to reduce the liver. Protectynrisk of travelers’ diarrhea. In the U.S. Travelan® is currently only sold as a dietary supplement for digestive-tract protection in accordance with section 403 (r)(6) of the FDA. The Company plans to pursue clinical development of Travelan®) through a formal FDA registration pathway to gain FDA-approval as a drug to specifically reduce the Natural Healthcare Practitioners (Naturopath). Salesrisk of this product aretravelers’ diarrhea in travelers to endemic areas.
In Australia Travelan® is approved as a preventative for Traveler’s Diarrhea, the indications are;
| ● | Helps enhance/promote general health and wellbeing. | |
| ● | Decrease/reduce/relieve diarrhea. | |
| ● | Helps reduce occurrence of diarrhea. | |
| ● | Decrease/reduce loose stools. | |
| ● | Helps decrease/reduce/relieve symptoms of travelers’ diarrhea. | |
| ● | Helps reduce occurrence of symptoms of travelers’ diarrhea. | |
| ● | Helps restore good/beneficial/friendly intestinal/gut/bowel flora. | |
| ● | Helps enhance/improve/promote/increase healthy digestive system flora/good bacteria growth. | |
| ● | Helps enhance/promote gastrointestinal system health. | |
| ● | Maintain/support healthy gastrointestinal function. | |
| ● | Maintain/support gastrointestinal mucosal membrane health. | |
| ● | Aids/assists repair of gastrointestinal/gut wall lining. | |
| ● | Decrease/reduce/relieve abdominal cramping. | |
| ● | Helps decrease/reduce/relieve mild gastrointestinal tract inflammation. | |
| ● | Decrease/reduce/relieve gastrointestinal pain. | |
| ● | Enhance/improve/promote immune defense. | |
| ● | Maintain/support healthy gastrointestinal immune function. |
Travelan® contains high levels of specific antibodies generated against 13 strains of Enterotoxigenic E.coli bacteria, the most common cause of Travelers’ Diarrhea. Travelan® directly targets the pathogens in the very early stagesgut and prevents the infection and its resulting symptoms from occurring. The product achieved over 2.7 million AUD (net: A$2.5 million) in sales to date have not been material.30 June 2020 (FY20).
Our Technology Platform – Targeted Polyclonal Antibodies
 |  |
Overview
Our hyper-immune
The COVID-19 pandemic has significantly disrupted international travel throughout the world and continues to impact every Travelan® market. The International Air Transport Association has reported that the recovery in traffic will be very slow and probably will not return to pre-COVID-19 levels until 2024. The company is pleased to report a continued uplift of sales currently being observed in Australia and the USA as travel restrictions nationally and internationally increase. North America, Travelan® sales were up by 433%, reaching AU $0.6M in FY22, compared to AU $0.1M in FY21. Global sales of Travelan® and Protectyn® increased by 425% in the 2022 fiscal year to AU $0.8M, compared to AU $0.15M in FY21. This growth was attributable to increasing sales in both Passport Health Travel Clinics and on the Amazon e- commerce channel. While not at pre-pandemic peak, the sales numbers in the US are starting to considerably pick up again. In Australia, Travelan® and Protectyn® sales increased to AU $0.2M in FY22 representing a significant increase over FY21 (AU $0.1M). Coming out of the pandemic restrictions imposed by Government and with international travel on the increase we are starting to see positive signs as retail outlets start to restock product once again.
OVERVIEW OF TECHNOLOGY
Immuron Limited (NASDAQ: IMRN; ASX: IMC), is a commercial and clinical-stage Australian biopharmaceutical company with a proprietary technology platform focused on the development and commercialization of a novel class of orally delivered polyclonal antibodies for treatment of infectious diseases. Immuron’s technology is safe (GRAS), low cost, and can be applied to a varietyfocused on generation of diseases. Our platform technology is based on producing antigen targeted, hyper-immunehyperimmune antibody-rich bovine colostrum, powder (BCP) suitable for pharmaceutical use. Polyclonal antibodies are the purified from the colostrum. This proprietary process ensures that the colostrum contains a high concentration of antibodies and high concentration of Immunoglobulin G.providing antimicrobial therapy to treat gut-mediated diseases.
The underlying nature of our platform technology enables the development of medicines across a large range of diseases, including infectious diseases and immune-mediated disorders.diseases. The platform can be used to influence the cell-mediated immune system through regulatory T cell populations, or it can directly block viruses or bacteria and neutralize the toxins they produce at mucosal surfaces (such as the GI tract) and neutralize the toxins they produce.. Additionally, the dairy origins of our antibodies enablesenable us to commercialize our platform through most regulatory pathways, including prescription, (Rx), medical foods, over-the-counter medicines, and dietary supplements. The GRAS status of our technology platform will allow us to advance our preclinical programs into clinical trials in other diseases faster relative to other companies due to these characteristics.
Technology Platform – Targeted Polyclonal AntibodiesManufacturing Process
Our active ingredient is Bovine polyclonal antibodies purified from dairy cows that have been immunized with patented vaccines to produce very high levels of specific antibodies against targeted antigens.
These antibodies have powerful anti-inflammatory effect and work through two modes of action:
Our active ingredient targets a specific antigen. When bound by polyclonal antibodies, the antigenspharmaceutical ingredients are prevented from infecting the cells of the patient.
Our active ingredient modulates the body’s own immune system by boosting the right T-cells and suppressing “unwanted” T-cells through a cell-mediated immune response that functions against the antigen. The antibodies, once orally ingested, are presented in the peyers patches to the lymph system’s dendritic cells which sample the antibodies, thereby eliciting the cell mediated immune response. This response is associated with increased distribution of T regulatory lymphocytes and anti-inflammatory cytokines and decreased levels of pro-inflammatory cytokines.
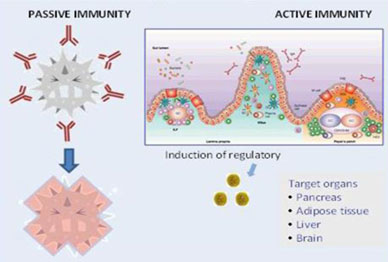
Manufacturing Process
Our active ingredient is manufactured under cGMP conditions and many of the components are the same as those of normal cow’s milk. However, the main differentiation between milk and our active ingredient constituents is the presence of antibodies in bovine colostrum of the order of 35-45% by weight of dry colostrum powder. The main classes of immunoglobulins found in the active ingredient are IgG with smaller amounts of IgM and IgA. Immunoglobulins account for up to 70–80% of the total protein content in colostrum, whereas in milk they account for only 1–2% of total protein. The major class of immunoglobulin G found in bovine colostrum is IgG1 making up between 65% and 90% of total immunoglobulins, in contrast to milk which comprises predominantly IgA.
Vaccination
The active drug substance is prepared using the first milking colostrum of dairy cows that have been immunized with a patented vaccinevaccines to produce very high levels of specific antibodies against selected surface antigens. Pregnant dairy cows at commercial dairy farms are immunized through a proprietary process that is approved by an independent animal ethics committee.process.
Colostrum
The colostrum is harvested from immunized Holstein Friesian and Jersey cows registered for milk production for human consumption and at the time of harvesting are free from antibiotics. They are not given steroids at any stage of the process. Colostrum is harvested at the first milking which will be within twelve hours of calving, leaving plenty for the calf to feed on.
Once harvested, preparation of the active ingredient complies with processes that are regulated by Dairy Safe standards in addition to the TGA, which is a Federal requirement and known globally for its stringent criteria. The raw colostrum material is first pasteurized then cooled and centrifuged using a milk separator to remove somatic cells, cell debris, some bacteria and fat. It is then pasteurized, cooled and subjected to membrane ultra-filtration, removing much of the water, salts and lactose. The colostrum wet concentrate is then lyophilizedspray dried to produce a powder, which is milled to 200 microns. The processes are typical for the dairy industry and for production of dairy foods. After spray drying, the active ingredient is ready for further processing into the oral dosage form.
Risk management on the source of colostrum must focus on assurance of freedom from Bovine Spongiform Encephalopathy (BSE or commonly known as Mad Cow Disease) of the liquid raw product. A small number of countries, including Australia and New Zealand, have been judged by the World Organization for Animal Health (OIE) to have the highest BSE free rating on the basis that they have never experienced BSE at any time. The definition of this status means that both Australia and New Zealand are currently certified as BSE free countries.Tableting
Tableting
The product excipients are all standard, FDA acceptable oral compounds that are granulated, milled and finally compressed into caplets and blister packaged (pharmaceutical grade packaging materials).
Batch Consistency
The IgG component of our active ingredient ranges between 36% and 45%. The parameters are stable within batches and across batches. Our product is stable according to ICH guidelines and the IgG component of our active ingredient is stable over time and is manufactured under full cGMP conditions with all associated QA and QC processes ensuring the stability of these parameters.
Trademarks
Trademarks
We have rights to trademarks and trade names (both registered and unregistered) used in this Annual Report on Form 20-F (this “Annual Report”) which are important to our business.
These trademarks are as follows:
| ● | Immuron (registration in |
| ● | Travelan (registration in U.S., Australia, Canada and China); and |
| ● | Protectyn (registration in Australia and |
Solely for convenience, trademarks and trade names referred to in this Annual Report appear without the “®” or “™” symbols, but such references are not intended to indicate, in any way, that we will not assert, to the fullest extent possible under applicable law, our rights or the rights of the applicable licensor to these trademarks and trade names. We do not intend our use or display of other companies’ trade names, trademarks or service marks to imply a relationship with, or endorsement or sponsorship of us by, any other companies. Each trademark, trade name or service mark of any other company appearing in this Annual Report is the property of its respective holder.
PATENTS
Patents
Worldwide, we have 14 issued patents and 22 pending patent applications. We have a policy to identify, capture and protect all relevant intellectual property associated within our core business strategies. We own a number of patent families that have been issued patentsfiled to protect both the vaccine that is used to generate our colostrum enriched with antibodies of choice, as well as methods of treating certain conditions with the resulting hyper-immune colostrum.
Our patent rights are supplemented by a comprehensive body of confidential and proprietary expertise that has been developed over many years and relates to the methods of production of the hyper-immune colostrum. These trade secrets include information relating to the production system and an effective immunization process that is approved by an independent animal ethics committee.
During the year ended June 30, 2022, we continued to expand our patent portfolio in various global jurisdictions. Notification of the intent to grant European Patent 14784945.9, entitled “Methods and Compositions for the treatment and/or prophylaxis of Clostridium difficile associated disease,” was received from the European Patent Office in July 2022. The European registration once formally granted will add to Immuron’s patent position for compositions and methods for the treatment and/or prophylaxis of Clostridioides difficile associated disease in Australia, New Zealand and the United States. European Patent 3159357, entitled “Composition and method for the treatment and prevention of enteric bacterial infections”, was granted on 5 January 2022. Immuron is in the U.S.,process of validating the patent in the following European member states, France, Spain, Sweden, Austria, Germany, Denmark, Finland, Greece and United Kingdom. The European registration adds to Immuron’s patent position in respect of compositions and methods for treating travelers’ diarrhea in Australia, India, Canada India, and New Zealand. These patents enhance the market exclusivity offered by the fact that our compounds are classified as biologics by the FDA.Unites States.
A summary of our principal patent families is set out in the table below:
| Number | Country | Status | Expiry | ||||||||||
| Composition and Method for the Treatment and Prevention of Enteric Bacterial Infections | |||||||||||||
| 2004216920 | Australia | Granted | March 4, 2024 | ||||||||||
| Granted | |||||||||||||
| 230,664 B | India | Granted | March 4, 2024 | ||||||||||
| 542088 | New Zealand | Granted | March 4, 2024 | ||||||||||
| 9,402,902 | USA | Granted | March 4, 2024 | ||||||||||
| 8,637,025 | USA | Granted | February 25, 2028 | ||||||||||
| 3159357 | Austria | Granted | March 4, 2024 | ||||||||||
| 3159357 | |||||||||||||
| Granted | |||||||||||||
| Granted | |||||||||||||
| Granted | |||||||||||||
| Granted | |||||||||||||
| Granted | |||||||||||||
| Granted | |||||||||||||
| Methods and Compositions for the Treatment and/or Prophylaxis of Clostridium Difficile Associated Disease | ||||||
| 2014253685 | Australia | Granted | April 17, 2034 | |||
| 2,909,636 | Canada | Pending | April 17, 2034 | |||
| 14784945.9 | Europe | Pending | April 17, 2034 | |||
| 10,144,775 | USA | Granted | April 17, 2034 | |||
| 20210506081.2 | China | Pending | April 17, 2034 | |||
| 713233 | April 17, | |||||
| PCT/AU2021/050772 | Pending | July 17, | ||||
Regulatory Considerations
REGULATORY CONSIDERATIONS
Our clinical assets are regulatedconsidered as biologics by the FDA, conferring it 12 years of market exclusivity from date of approval in the U.S. for approved drugs derived from our technology program. New products in Europe have 10 years of market exclusivity.
Our ongoing research and development activities, are, and the production and marketing of our pharmaceutical product candidates derived from those activities will be subject to regulation by human research ethics committees and institutional research boards, as well as numerous governmental authorities in Australia, principally the TGA, the FDA in the U.S., the MHRA in the United Kingdom and the EMA in Europe. Prior to marketing, any therapeutic product developed must undergo rigorous pre-clinical testing and clinical trials, as well as an extensive regulatory approval process mandated by the TGA and, to the extent that any of our pharmaceutical products under development are marketed abroad, by foreign regulatory agencies, including the FDA, EMA and MHRA.
Clinical trials can take many years to complete and require the expenditure of substantial resources. The length of time varies substantially according to the type, complexity, novelty and intended use of the product candidate. We cannot make any assurances that once clinical trials are completed by us or aour collaborative partner,partners, we will be able to submit as scheduled a marketing approval request to the applicable governmental regulatory authority, or that such request and application will be reviewed and cleared by such governmental authority in a timely manner, or at all. Although we intend to make use of fast-track and abbreviated regulatory approval programs when possible and commercially appropriate, we cannot be certain that we will be able to obtain the clearances and approvals necessary for clinical testing or for manufacturing and marketing our pharmaceutical products candidates. Delays in obtaining regulatory approvals could adversely affect the development and commercialization of our pharmaceutical product candidates and could adversely impact our business, financial condition and results of operations.
During the course of clinical trials and non-clinical studies, including toxicology studies, product candidates may exhibit unforeseen and unacceptable drug-related toxicities or side effects. If any unacceptable toxicities or side effects were to occur, we may, or regulatory authorities may require us to, interrupt, limit, delay or abort the development of our potential products. In addition, unacceptable toxicities could ultimately prevent the clearance of our product candidates by human research ethics committees, institutional research boards, the TGA, EMA, FDA or other regulatory authority for any or all targeted indications. Even after being cleared by a regulatory authority, any of our products may later be shown to be unsafe or not to have its purported effect, thereby preventing widespread use or requiring withdrawal from the market. We cannot make any assurances that IMM-124E, IMM-529 or any other development or product candidate will be safe or effective when administered to patients.
Australian Disclosure Requirements
Dividends
No dividends were declared or paid to members for the year ended June 30, 2022. The directors do not recommend that a dividend be paid in respect of the financial year.
C. ORGANIZATIONAL STRUCTURE
We have twothree wholly-owned subsidiaries, Immuron Inc.; and, Anadis EPS Pty Ltd (formed(formed for the sole purpose to act as trustee for the Immuron Limited Executive Officer Share Plan Trust). and Immuron Canada Ltd. All costs associated with the operations of this companythese companies are borne by Immuron Limited. Consolidated accounts have not been prepared as the net assets and trading activity of Anadis ESP Pty Ltd does not form a part of the consolidated accounts as they are not material.
D. PROPERTY, PLANT AND EQUIPMENT
Our corporate headquarters are located at Level 3, 62 Lygon Street, Carlton South, Victoria, 3053, Australia 3053 and consist of approximately 1,000 square feet of office space (which is provided as part of a services agreement which expires at-will upon six months written notice).Australia. Our principal officeis located at Suite 10-2510, 25-37 Chapman Street, Blackburn North, Victoria 3130 and consists of approximately 1,500 square feet of leased office and warehouse spacefacilities under a lease agreement which expires onis expiring in December 31, 2018,2024, with an ongoing further three-year option for extension. We have no dedicated research and development facility as our research and development activities are provided by third party suppliers who are responsible for their own premises. We believe that our existing facilities are adequate for our current needs.
ITEM 4A. UNRESOLVED STAFF COMMENTS
Not applicable.
ITEM 5. OPERATING AND FINANCIAL REVIEW AND PROSPECTS
The following discussion and analysis includes certain forward-looking statements with respect to the business, financial condition and results of operations of our company. The words “estimate,” “project,” “intend,”“estimate”, “project”, “intend”, “expect” and similar expressions are intended to identify forward-looking statements within the Private Securities Litigation Reform Act of 1995. These forward-looking statements are subject to risks and uncertainties that could cause actual results to differ materially from those contemplated by such forward-looking statements, including those risk factors contained in Item 3.D. of this annual report. You should read the following discussion and analysis in conjunction with our consolidated financial statements and the notes thereto included in this annual report.
A. Operating Results
Overview
Background
We were incorporatedunder the laws of Australia in 1994 and hashave been listed on the Australian Securities Exchange, or ASX since April 30, 1999. Since June 9, 2017, our Our ADSs and Warrants have traded on theThe NASDAQ Capital Market.Market since June 13, 2017.
Our consolidated financial statements appearing in this annual report comply with IFRS as issued by IASB. In this annual report, all references to “U.S. dollars” or “US$” are to the currency of the U.S., and all references to “Australian dollars”, “A$” or “AUD$“$” are to the currency of Australia. Unless otherwise indicated or the context implies otherwise, items included in the financial statements of each of the group’s entities are measured using the currency of the primary economic environment in which the entity operates (‘the functional currency’). The consolidated financial statements are presented in Australian dollar (“A$” or “$”), which is Immuron Limited’s functional and presentation currency. All of our revenues are generated in Australian dollars, except for interest earned on foreign currency bank accounts,United States dollars and Canadian dollars, and the majority of our expenses are incurred in Australian dollars.
Immuron Limited is a commercial and clinical-stage biopharmaceutical company with a proprietary technology platform focused on the development and commercialization of a novel class of specifically targeted polyclonal antibodies in the treatment of diseases with associated with the gastrointestinal tract. We believe that we can address this significant unmet medical need. Our oral polyclonal antibodies are orally active and offer localized delivery within the gastrointestinal (“GI”) tract. We currently market our flagship commercial products Travelan® and Protectyn® in Australia, both products are listed medicines on the Australian Register for Therapeutic Goods. Travelan® is an over-the-counter product indicated to reduce the risk of travelers’ diarrhea and is sold in pharmacies throughout Australia. Protectyn® is currently sold online and in health practitioner clinics and is marketed as an immune supplement to help maintain a healthy digestive function and liver. We also market Travelan® in Canada where it is licensed as a natural health product indicated to reduce the risk of travelers’ diarrhea, and presently market Travelan® in the U.S. as a dietary supplement for digestive tract protection.
We believe that our lead drug candidates, currently in clinical development have the potential to transform the existing treatment paradigms for moderate to severe campylobacteriosis, Enterotoxigenic Escherichia coli (ETEC) infections, travelers’ diarrhea and for Clostridiodes difficile infections.
Critical Accounting Policies
The following is a summary of the material accounting policies adopted by us in the preparation of the financial report. The accounting policies have been consistently applied, unless otherwise stated.
Basis of Consolidation
The consolidated financial statements incorporate the financial statements of our company and the entities controlled by us (our subsidiaries) referred to as ’the Group’“the group” or “the Group” in the financial statements. Control is achieved where the consolidated entity is exposed to, or has rights to, variable returns from its involvement with the entity and has the ability to affect those returns through its power to direct the activities of the entity.
A list of controlled entities is contained in Note 11note 10 to the financial statements. All controlled entities have a June 30 financial year-end. All intra-group transactions, balances, income and expenses are eliminated in full on consolidation. Accounting policies of subsidiaries have been changed where necessary to ensure consistency with those policies applied by the parent entity. Subsidiaries are accounted for at cost in the parent entity.
Revenue Recognition
(i) Sale of hyperimmune products
Revenue arises mainly from the sale hyperimmune products. To determine whether to recognize revenue, the group follows the process of identifying the contract with a customer, identifying the performance obligations, determining the transaction price, allocating the transaction price to the performance obligations and recognizing revenue when performance obligations are satisfied.
Revenue from the sale of hyperimmune products is measuredrecognized at a point in time upon when or as the fair valuegroup transfers control of the consideration received or receivable. Amounts disclosed as revenue are net of returns, trade allowances, rebates and amounts collected on behalf of third parties.assets to the customer.
We recognize revenue whenThere is no significant cost to obtain the contract. However, there is variable consideration due to rebates, discounts and refunds. The variable amount of consideration is allocated entirely to the distinct good that is consistent with the amount of consideration to which the revenuegroup expects to be entitled in exchange for transferring the promised goods to the customer. The group offers rebates of up to 10% to some loyal wholesalers in Australia. During the financial year 2022, to improve the relatively low sales during the previous financial year, the group initiated periodic discounts of up to 50% for Protectyn products purchased by the end customers via wholesalers. There are no warranties. Returns and refunds are provided where this is outlined in a customer agreement. The group does not have a formal policy in place relating to stock returns. In cases where we have a contract in place with a distributor, and that contract includes a stock return policy, we will adhere to the policy listed in the contract. For all other distributors, stock returns are negotiated on a case-by-case basis. The exception to this is where stock is short dated to within 3 months. In this case we will offer replacement stock or a refund.
(ii) Financing components
The group does not expect to have any contracts where the period between the transfer of the promised goods or services to the customer and payment by the customer exceeds one year. As a consequence, the group does not adjust any of the transaction prices for the time value of money.
Fair value of R&D tax incentive
The group’s research and development (R&D) activities are eligible under an Australian government tax incentive for eligible expenditure. Management has assessed these activities and expenditure to determine which are likely to be eligible under the incentive scheme. Amounts are recognized when it has been established that the conditions of the tax incentive have been met and that the expected amount can be reliably measured, it is probable that the future economic benefits will flow to the entity and specific criteria have been met for each of the activities as described below. The amount of the revenue is not considered to be reliably measured until all contingencies relating to the sale have been resolved.
The following specific revenue criteria must be met before revenue is recognized:
A difference of A$1,469,763 in the Accumulated losses balance at 30 June 2015 between this statement and the previous statement lodged with ASX relates to the previous recognition of fiscal year 2015 R&D refund in fiscal year 2016, which does not significantly affect the overall financial position and results presented in the previous statement.measured. For the fiscal years 2015 and 2016, we reassessed and made changes toyear ended June 30, 2022, the amount of R&D Tax Refund recognized as Other Income for the period as compared to the previous statements lodged with the ASX. These changes resultedgroup has included an item in a decrease in Otherother income of A$1,469,763, and257,500 (2021: A$356,209) to recognize income over the period necessary to match the grant on a related increase in Net Loss, in our Consolidated Statement of Profit or Loss and Other Comprehensive Income for fiscal year 2016.systematic basis with the costs that they are intended to compensate.
These adjustments were the result of additional information being made available us subsequent to the previous lodgments with ASX which changed the timing of recognition, but not the actual amount of the R&D refund.
We engaged experienced advisors to improve our internal process on advanced findings of the R&D activities, which includes determining and evaluating the eligibility of R&D related expenditure to support our submission of the R&D Tax Refund claim
Intangible Assets -– Research & Development
Expenditure on research activities, undertaken with the prospect of obtaining new scientific or technical knowledge and understanding, is recognized in the statement of profit or loss and other comprehensive income as an expense when it is incurred.
Expenditure on development activities, being the application of research findings or other knowledge to a plan or design for the production of new or substantially improved products or services before the start of commercial production or use, is capitalized if it is probable that the product or service is technically and commercially feasible, will generate probable economic benefits and adequate resources are available to complete development and cost can be measured reliably. Other development expenditure is recognized in the statement of profit or loss and other comprehensive income as an expense as incurred.
Interest Bearing Loans and Borrowings
Generally, loans and borrowings are initially recognized at cost, being the fair value of the consideration received net of issue costs associated with the borrowing. After initial recognition, interest bearing loans and borrowings are subsequently measured at amortized cost using the effective interest method. Amortized cost is calculated by taking into account any issue costs and any discount or premium on settlement.
The component of the convertible notes that were issued in connection with the February 2016 financing arrangement that exhibits characteristics of a liability is recognized as a liability in the statement of financial position. On the date of issuance and each subsequent reporting period, we record the entire hybrid instrument as measured at fair value through profit and loss. As the embedded derivative does not significantly modify the cash flows under the contract. The associated transaction costs have also been expensed as incurred and are recorded as finance costs in the statement of profit or loss and other comprehensive income.
This convertible notes obligation and associated liabilities were fully repaid and all debts and repayment pertaining to this convertible note arrangement satisfied on September 15, 2017 when the final tranche #18 was repaid.
Fair Value of Convertible Notes
The convertible notes were measured and disclosed as a level 3 instrument, using a three-level hierarchy, based on the lowest level of input that is significant to the entire fair value measurement, as defined below:
No transfers between the levels of the fair value hierarchy occurred during the current year.
Inventories
Raw materials, work in progress and finished goods are stated at the lower of cost and net realizable value. Cost comprises direct material, frightfreight and import duty. We classifyManagement classifies a portion of inventory as a current asset based on an assessment of expected use in the next 12 months. The remainder is classified as all amounts are held for the purpose of trading.a non-current asset.
Costs are assigned to individual items of finished goods inventory on basis of weighted average costs. Net realizable value is the estimated selling price in the ordinary course of business less the estimated costs of completion and the estimated costs necessary to make the sale.
Share-based payments
Share-based compensation benefits may be provided through the issue of fully paid ordinary shares under the Immuron Employee Share and OptionOmnibus Incentive Plan (“ESOP”OIP”). Options are also granted to employees and consultants in accordance with the terms of their respective employment and consultancy agreements. Any options granted are made in accordance with the terms of our ESOP.OIP.
The fair value of options granted under employment and consultancy agreements are recognized as an employee benefit expense with a corresponding increase in equity. The fair value is measured at grant date and recognized over the period during which the employees become unconditionally entitled to the options.
The fair value at grant date is determined using a Black-Scholes option pricing model that takes into account the exercise price, the term of the option, the vesting and performance criteria, the impact of dilution, the non-tradable nature of the option, the share price at grant date and expected price volatility of the underlying share, the expected dividend yield and the risk-free interest rate for the term of the option.
The fair value of the options granted excludes the impact of any non-market vesting conditions (for example, profitability and sales growth targets). Non-market vesting conditions are included in assumptions about the number of options that are expected to become exercisable. At each reporting date, the entity revises its estimate of the number of options that are expected to become exercisable. The employee benefit expense recognized each period takes into account the most recent estimate. The impact of the revision to original estimates, if any, is recognized in the statement of profit or loss and other comprehensive in come with a corresponding adjustment to equity.
Upon the exercise of options, the balance of the share-based payments reserve relating to those options is transferred to contributed equity.
Critical Accounting Estimates and Judgments
Management evaluates estimates and judgments incorporated into the financial statements based on historical knowledge and best available current information. Estimates assume a reasonable expectation of future events and are based on current trends and economic data, obtained both internally and externally.
Share-based payments
The value attributed to share options and remunerations shares issued is an estimate calculated using an appropriate mathematical formula based on an option pricing model. The choice of models and the resultant option value require assumptions to be made in relation to the likelihood and timing of the conversion of the options to shares and the value of volatility of the price of the underlying shares.
Fair value of options granted
The assessed fair value of options at grant date was determined using the Black-Scholes option pricing model that takes into account the exercise price, term of the option, security price at grant date and expected price volatility of the underlying security, the expected dividend yield, the risk-free interest rate for the term of the security and certain probability assumptions.
Impairment of inventories
The provision for impairment of inventories assessment requires a degree of estimation and judgment.judgement. The level of the provision is assessed by taking into account the recent sales experience, the ageing of inventoriesinventory, and in particular, the shelf life of inventories that affects obsolescence. Expected shelf-life is reassessed on a regular basis with reference to stability tests which are conducted by an expert engaged by the Company. A comprehensive stability study was completed in August 2020 and the reported findings support a shelf life of at least 130 months for the colostrum drug substance.
During year ended 30 June 2022, there was no finished goods impairment (2021: $328,833) and no raw materials impairment of inventories (2021: $430,932) recognized as a provision for inventory obsolescence in the consolidated statement of profit or loss and other comprehensive income.
Sales returns
Returns and refunds are provided where this is outlined in a customer agreement. The group does not have a formal policy in place relating to stock returns. In cases where we have a contract in place with a distributor, and that contract includes a stock return policy, we will adhere to the policy listed in the contract. For all other distributors, stock returns are negotiated on a case-by-case basis. The exception to this is where stock is short dated to within 3 months. In this case we will offer replacement stock or a refund.
The sales return provision has been assessed by management based on external reports on stock held by distributors. The timing and amount of the obligation are uncertain but are expected to be settled in the next year. The stock included in the provision is expiring within 6 months of the reporting period-end and not expected to be salable after returns.
Inventory split
During the year ended 30 June 2022, management performed an assessment of its raw materials and utilization within 12 months from reporting date. Management determined $137,206 of raw materials relating to Colostrum will be consumed within 12 months from reporting date (2021: Nil); the remaining balance of $956,936 (2021: $1,266,587) was estimated to be consumed beyond 12 months.
R&D tax incentive
The Group’s research and development activities are eligible under an Australian Government tax incentive for eligible expenditure from July 1, 2011. Management has assessed these activities and expenditure to determine which are likely to be eligible under the incentive scheme.
For the year ended June 30, 2022 the Group has recorded other income of $257,500 (2021: $356,209) to recognise income over the year necessary to match the R&D tax incentive on a systematic basis with the costs that they are intended to compensate.
Fair value measurement hierarchy
The preparation of the financial statements requires management to make judgments, estimates and assumptions that affect the reported amounts in the financial statements. Management continually evaluates its judgments, estimates in relation to assets, liabilities, contingent liabilities, revenue and expenses. Management bases its judgments, estimates, and assumptions on historical experience and on other various factors, including expectations of future events, management believes to be reasonable under the circumstances. The resulting accounting judgments and estimates will seldom equal the related actual results. The judgments, estimates and assumptions that have a significant risk of causing a material adjustment to the carrying amounts of assets and liabilities within the next financial year are discussed within the relevant sections where applicable.
The fair value of the convertible notes classified as Level 3 arewere determined by the use of valuation model. These include discounted cash flow analysis and the use of observable inputs that required significant adjustments based on unobservable inputs.
As at June 30, 2017, management assessedEstimates and judgements are continually evaluated. They are based on historical experience and other factors, including expectations of future events that may have a financial impact on the terms of the convertible notesentity and determined that in their view the fair value of the debt component is equal to the proceeds such that there is no residual amountare believed to be allocated to an equity component. In making this determination, management is ofreasonable under the view that the value of the consideration received, net of costs, provided reliable evidence of the fair value of the debt component of the convertible notes. Fair value has been determined by the income approach based on a discounted cash flow analysis, with the most significant inputs being the discount rate that reflects the investors’ credit risk. A slight increase or decrease in the discount rate used would not be material to the financial statements.circumstances.
Results of Operations
The following discussion relates to our consolidated results of operations, financial condition and capital resources. You should read this discussion in conjunction with our consolidated financial statements and the notes thereto contained elsewhere in this Annual Report.annual report.
Comparison of the fiscal years ended June 30, 20172022 and 20162021
Revenue and Other income
| For the fiscal year ended June 30, | Increase/ | |||||||||||
2017 AUD$ | 2016 AUD$ | Decrease AUD$ | ||||||||||
| Revenue: | ||||||||||||
| Sale of goods | 1,396,197 | 1,001,077 | 395,120 | |||||||||
| Other income: | ||||||||||||
| Australian Federal R&D Tax Concession Refund | 1,575,315 | 1,512,840 | 62,475 | |||||||||
| Interest income | 8,386 | 12,165 | (3,779 | ) | ||||||||
| Other | 30,672 | 14,010 | 16,662 | |||||||||
| Total Revenue and Other income | 3,010,570 | 2,540,092 | 470,478 | |||||||||
| For the fiscal year ended | ||||||||||||
| June 30, | Increase/ | |||||||||||
| 2022 | 2021 | (Decrease) | ||||||||||
| A$ | A$ | A$ | ||||||||||
| Revenue: | ||||||||||||
| Revenue from contracts with customers | 765,193 | 145,776 | 619,417 | |||||||||
| Other Income: | ||||||||||||
| Australian R&D tax incentive refund | 257,500 | 356,209 | (98,709) | |||||||||
| COVID-19 government assistance | - | 161,600 | (161,600 | ) | ||||||||
| HJF R&D grant | 306,595 | 74,821 | 231,774 | |||||||||
| MTEC R&D grant | 369,045 | - | 369,045 | |||||||||
| Other income | 24,585 | 24,480 | 105 | |||||||||
| Total Other Income | 957,725 | 617,110 | 340,615 | |||||||||
Revenues received from the sale of goods increased by A$395,000619,417, or 425%, from fiscal 20162021 to 2017.
Revenue increased by 40% and our geographicfiscal 2022, primarily due to the sales mix changed as we achieved a major advancement by releasing our flagship product Travelanrecovery in the U.S. by means of strategic supply arrangements with Passport Health, Medique, and McKesson, while also opening a new distribution channel into the Chinese market. While our Australian, product sales remained constant, we applied our resources to these new emerging market opportunities in the U.S. and China,North American markets for Travelan and weProtectyn products after the lockdowns and travel restrictions due to Covid-19 pandemic have instigated programs to reengage the Australian consumers. As these new markets mature over the coming 12 months, when combined with our existing market presence in Australia, webeen lifted. We anticipate that revenues received from sales of our Travelan product will continue to increase.increase in the future.
OurFor the fiscal 2022, the group has included an item in other income of $257,500 (2021: $356,209) to recognize income over the year necessary to match the R&D tax concessionincentive on a systematic basis with the costs that they are intended to compensate. As a result, our Australian R&D tax incentive refund increased by A$62,000, or 4.13%, from A$1.51 millionrecognized for fiscal 2022 has decreased as compared to for fiscal 2021. The overall decrease is attributed to a change in fiscal 2016R&D expenditure relating to A$1.58 million in fiscal 2017 due to an increased level of eligible research and development expenditures being incurred during the fiscal 2017. This research and development increase was predominantly due to the increased expenditures of our major Phase II NASH clinical trial as the program recruitment accelerated and more patients entered the trial.development.
InterestThe group’s other grant income decreasedconsists of grants received by A$4,000 or 31.06%,the group with relation to COVID-19 and other R&D grants. Grants are recognized as other income when the group is reasonably assured that it will comply with the conditions attaching to it and the grant will be received.
No further COVID-19 government assistance was recognized in other income for fiscal 2022 (2021: $161,600).
For the year ended 30 June 2022, the group has recognized $306,595 (2021: $74,821) R&D grant from the Henry M Jackson Foundation (“HJF”) and $369,045 (2021: Nil) R&D grant from Medical Technology Enterprise Consortium (“MTEC”).
Other (residual) income, which is income from inventory disposal and freight income, increased by A$12,000105 in fiscal 2016 to A$8,000 in fiscal 2017 as we depleted our cash reserves due to applying our financial resources to the increased areas of expenditure within our company. The lower cash reserves balance maintained throughout fiscal year 2017 generated and received less interest revenue.2022.
Cost of Goods Sold and Gross Profit and Direct Selling Costs
| For the fiscal year ended June 30, | Increase/ | |||||||||||
2017 AUD$ | 2016 AUD$ | Decrease AUD$ | ||||||||||
| Total Operating Revenue | 1,396,197 | 1,001,077 | 395,120 | |||||||||
| Cost of Goods Sold | (337,546 | ) | (301,435 | ) | (36,111 | ) | ||||||
| Gross Profit | 1,058,651 | 699,642 | 359,009 | |||||||||
| Less Direct Selling Costs: | ||||||||||||
| Sales and Marketing Costs | (407,751 | ) | (133,781 | ) | (273,970 | ) | ||||||
| Freight Costs | (135,377 | ) | (134,967 | ) | (410 | ) | ||||||
| Total Gross Profit less Direct Selling Costs | 515,523 | 430,894 | 84,629 | |||||||||
| For the fiscal year ended | ||||||||||||
| June 30, | Increase/ | |||||||||||
| 2022 | 2021 | (Decrease) | ||||||||||
| A$ | A$ | A$ | ||||||||||
| Revenue from contracts with customers | 765,193 | 145,776 | 619,417 | |||||||||
| Cost of Goods Sold | (241,691 | ) | (51,071 | ) | (190,620 | ) | ||||||
| Gross Profit | 523,502 | 94,705 | 428,797 | |||||||||
Our long-term relationships with our key manufacturing partners for Travelan, our flagship consumer product,
The Company’s gross profit margin increased to 68% in fiscal 2022 from 65% in fiscal 2021. The slight change in gross profit margin resulted from lower sales deductions and lower Canadian freight costs enabled us to continue improving ourdiscounts during the fiscal year 2022, and cost of goods sold ratiosdifference of two products of the Company, Travelan and Protectyn.
Expenses
| For the fiscal year ended | ||||||||||||
| June 30, | Increase/ | |||||||||||
| 2022 | 2021 | (Decrease) | ||||||||||
| A$ | A$ | A$ | ||||||||||
| Expenses: | ||||||||||||
| General and administrative expenses | 3,524,388 | 6,094,692 | (2,570,304 | ) | ||||||||
| Research and development expenses | 657,715 | 1,367,054 | (709,339 | ) | ||||||||
| Selling and marketing expenses | 416,537 | 287,684 | 128,853 | |||||||||
| Total expenses | 4,598,640 | 7,749,430 | (3,150,790 | ) | ||||||||
General and administrative expenses. General and administrative expenses decreased by A$2,570,304 from 30%fiscal 2021 to fiscal 2022. In which, share-based payment expenses decreased by A$2,021,122 from fiscal 2021 to fiscal 2022. The decrease mainly results from no share-based payments made to consultants and directors of operating revenuethe Company in fiscal year 2016, down2022. Total share-based payments made to 24%employees, consultants and directors of operating revenuethe Company is A$94,891 in fiscal year 2017, respectively. These key manufacturing partners provide us with steady, reliable product at a known price which2022 compared to A$2,116,013 in fiscal 2021. The remaining decrease of A$549,182 in general and administrative expenses is mainly attributed to less consulting service provided to the Company.
Research and development expenses. Research and development expenses decreased by A$709,339 from a strategic point of view provides certainty around the manufacturing margins. As we expand our sales effortsfiscal 2021 to fiscal 2022. The decrease in the US, we have been ableresearch and development expenditure reflects a short-term impact of the prolonged Covid-19 pandemic while the Company continue to achieve improved economies of scale thereby improving our cost of goods sold margins.pursue its strategic focus and development.
These strong manufacturing partnerships have also given rise to greater efficiencies in the manufacturing processes which not only resulted in the improvement in gross profit ratio but also an overall increase in gross profit.
Our introduction of Travelan into the U.S. and China required greater salesSelling and marketing support to ensure it gained traction. The expenditure to support this expansion resulted in an A$274,000 increase in salesexpenses. Selling and marketing costs in fiscal year 2017 in comparison to fiscal year 2016.
Expenses
| For the fiscal year ended June 30, | Increase/ | |||||||||||
2017 AUD$ | 2016 AUD$ | Decrease AUD$ | ||||||||||
| Expenses: | ||||||||||||
| Consulting, Employee and Director | (1,689,521 | ) | (2,840,037 | ) | 1,150,516 | |||||||
| Corporate Administration | (1,381,809 | ) | (1,320,570 | ) | (61,239 | ) | ||||||
| Depreciation | (4,922 | ) | (3,892 | ) | (1,030 | ) | ||||||
| Finance Costs | (24,483 | ) | (341,600 | ) | 317,117 | |||||||
| Impairment of Inventory | (136,494 | ) | (4,176 | ) | (132,318 | ) | ||||||
| Marketing and Promotion | (789,608 | ) | (487,591 | ) | (302,017 | ) | ||||||
| Research and Development | (4,630,674 | ) | (3,623,961 | ) | (1,006,713 | ) | ||||||
| Travel and Entertainment | (276,539 | ) | (416,849 | ) | 140,310 | |||||||
| Total expenses | (8,934,050 | ) | (9,038,676 | ) | 104,626 | |||||||
Consulting, Employee and Director.Consulting, employee and director expense decreased by A$1.15 million from fiscal 2016 to fiscal 2017 primarily due to a decrease in Share Based Payments made to Directors as no equity grants were made to Directors during fiscal year 2017.
Corporate Administration.Corporate Administration expense increased by A$61,000, or 4.64%, from fiscal 2016 to fiscal 2017 due to the general increase in the size of the business in combination with increases in expenses due to additional resources being implemented to assist our company through this period of growth.
The increase was also the result of an increase in a number of back-office support costs surrounding additional compliance and financial services for the organization during our expansion. These additional services were predominantly required due to the increase in compliance and internal control levels surrounding our NASDAQ listing. The organization employed new employees in fiscal 2017 and raised further capital while generally expanding, and increased conference and seminar costs as we increased our public profile around the world. The increase in Corporate Administration expense was partially offset by a decrease in legal expenditures during fiscal 2017.
There was an increase in our foreign currency realized losses as the overseas expenditure, predominantly in US$, became more expensive for our A$ financially denominated financial statements as the US$ strengthened against the A$ throughout the fiscal year 2017, in comparison to the relative strength of the A$ against the US$ in fiscal year 2016.
Finance Costs.Finance costs incurred by us in fiscal 2017 of A$24,000 which directly pertained to the finance fees of the SBI Investment Fund Convertible Loan Facility in February 2016. This facility provided us with the short to medium-term cash flow requirements needed to ensure the momentum surrounding our pipeline research programs was not diminished. In comparison, there was A$342,000 in finance expenses incurred under the SBI Investment Fund Convertible Loan Facility in fiscal 2016.
Impairment of Inventory. An Impairment of Inventory charge of A$136,000 was incurred in fiscal 2017 which related to the writing down of Colostrum in our inventory balance as it reached the expiry date.
Marketing and Promotion.Marketing and Promotion expenses increased by A$302,000128,853 from fiscal 20162021 to fiscal 20172022 as we increased our promotional efforts for Travelan, our existing flagship consumer product. The increased costs surrounding Travelan included costs associated withdiscounts and various marketing activities are required to boost sales after the expansion of the product’s footprint in the U.S. as well as launching the product in China’s consumer markets. We hope to see the benefits of these expansions come to fruition during the remainder of calendar year 2017prolonged Covid-19 pandemic lockdowns and future years, as these groundwork costs incurred mature into increased revenue in these large new markets.travel restrictions have been lifted.
Additional costs were also expended on investor and public relations efforts to lift both our and the Travelan profile and exposure in these new markets through the engagement of US and Australian investors relations advisors as well as attending and sponsoring key medical and broker seminars and forums.
Research and Development.Research and Development expense increased by A$1.0 million from fiscal 2016 to fiscal 2017, primarily due to the significant increase in our Phase II NASH clinical trial, together with the advancement of its other early pipeline products.
As the Phase II NASH clinical trial gained traction during fiscal year 2017 and the patient recruitment levels increased, we had more patients in the clinic being treated than during fiscal year 2016. We also brought on some additional clinical sites to increase patient recruitment rates. There are significant costs involved in not only increasing the number of patients in the trial, but also increasing the number of sites which requires onboarding and set-up costs.
As we prepared for the interim results analysis of its NASH clinical trial, additional costs were incurred for preparing all of the regulatory, advisory and testing procedures required to perform the interim analysis.
During fiscal year 2017, we also progressed our preclinical trial programs for C.difficile progressed resulting in successful results which have enabled us to move this program to the next stage of development.
Travel and Entertainment. Travel and Entertainment expense decreased by A$140,000 from fiscal 2016 to fiscal 2017 as our commercial and corporate activities expanded into the U.S. less travel was required by our officers during the year to maintain the clinical sites and provide U.S. promotional support as our CEO at the time was already based in the U.S.
Loss for the period. As a result of the foregoing, our loss for the period after income tax benefit decreased by A$265,000,5,530,211, or 3.74%66%, from A$7.07 million8,384,465 in fiscal 20162021 to A$6.80 million2,854,254 in fiscal 2017.2022.
Given our, and our subsidiaries’, history of recent losses, we have not recognized a deferred tax asset with regard to unused tax losses and other temporary differences, as it has not been determined whether we, or our subsidiaries, will generate sufficient future taxable income against which we can utilize these unused tax losses and any uncalculated potential deferred tax assets, together with any other temporary differences. Should the need arise, we can, and will, revisit this position.
Comparison of the fiscal years ended June 30, 2021 and 2020
| For the fiscal year ended | ||||||||||||
| June 30, | Increase/ | |||||||||||
| 2021 | 2020 | (Decrease) | ||||||||||
| A$ | A$ | A$ | ||||||||||
| Revenue: | ||||||||||||
| Revenue from contracts with customers | 145,776 | 2,518,566 | (2,372,790 | ) | ||||||||
| Other Income: | ||||||||||||
| Australian R&D tax incentive refund | 356,209 | 308,225 | 47,984 | |||||||||
| COVID-19 government assistance | 161,600 | 154,904 | 6,696 | |||||||||
| HJF R&D grant | 74,821 | — | 74,821 | |||||||||
| Other income | 24,480 | 10,545 | 13,935 | |||||||||
| Total Other Income | 617,110 | 473,674 | 143,436 | |||||||||
Revenues received from the sale of goods decreased by A$2,372,790, or 94%, from fiscal 2020 to fiscal 2021, primarily due to the sales decline in the Australian, U.S. and North American markets for Travelan products due to the prolonged Covid-19 pandemic.
For the fiscal 2021, the group has included an item in other income of $356,209 (2020: $308,225) to recognize income over the year necessary to match the R&D tax incentive on a systematic basis with the costs that they are intended to compensate. The group’s Australian R&D tax incentive refund includes $306,154 recognized for fiscal 2021 and an additional $50,055 received as part of the R&D claim for fiscal 2020. As a result, our Australian R&D tax incentive refund received for fiscal 2021 has slightly decreased as compared to for fiscal 2020. The overall decrease is attributed to a decrease in R&D expenditure relating to eligible research and development.
The group’s other grant income consists of grants received by the group with relation to COVID-19. Grants are recognized as other income when the group is reasonably assured that it will comply with the conditions attaching to it and the grant will be received. For the year ended 30 June 2021, the group has recognized $161,600 (2020: $154,904) in the COVID-19 government assistance packages and a $74,821 (2020: Nil) R&D grant from the Henry M Jackson Foundation (“HJF”).
Other (residual) income, which is income from inventory disposal and freight income, increased by A$13,935 in fiscal 2021, primarily due to the disposal of inventory of A$23,249.
Cost of Goods Sold and Gross Profit
| For the fiscal year ended | ||||||||||||
| June 30, | Increase/ | |||||||||||
| 2021 | 2020 | (Decrease) | ||||||||||
| A$ | A$ | A$ | ||||||||||
| Revenue from contracts with customers | 145,776 | 2,518,566 | (2,372,790 | ) | ||||||||
| Cost of Goods Sold | (51,071 | ) | (688,836 | ) | 637,765 | |||||||
| Gross Profit | 94,705 | 1,829,730 | (1,735,025 | ) | ||||||||
Our key manufacturing partners provide us with a quality product at a known price which from a strategic point of view provides us with certainty around the manufacturing margins. The Company’s cost of goods sold margin increased to 35% in fiscal 2021 from 27% in fiscal 2020. The increase in cost of goods sold margin resulted from relatively low sales during the fiscal year 2021, and cost of goods sold difference of two products of the Company, Travelan and Protectyn.
Expenses
| For the fiscal year ended | ||||||||||||
| June 30, | Increase/ | |||||||||||
| 2021 | 2020 | (Decrease) | ||||||||||
| A$ | A$ | A$ | ||||||||||
| Expenses: | ||||||||||||
| General and administrative expenses | 6,094,692 | 3,170,078 | 2,924,614 | |||||||||
| Research and development expenses | 1,367,054 | 1,178,685 | 188,369 | |||||||||
| Selling and marketing expenses | 287,684 | 871,551 | (583,867 | ) | ||||||||
| Total expenses | 7,749,430 | 5,220,314 | 2,529,116 | |||||||||
General and administrative expenses. General and administrative expenses increased by A$2,924,614 from fiscal 2020 to fiscal 2021. In which, share-based payment expenses increased by A$2,649,925 from fiscal 2020 to fiscal 2021. The increase is mainly attributed to the share-based payments made to employees, consultants and directors of the Company amounting to A$2,116,013 in fiscal 2021 compared to A$73,088 in fiscal 2020. In addition, options granted to a former managing director on 11 February 2019 and valued at $975,000 in the 30 June 2019 financials were subject to shareholder approval. In line with IFRS 2, these were re-measured at grant date 6 November 2019 after being approved by shareholders with a value of $368,000, being a remeasurement of $607,000 in the 30 June 2020 financials. The remaining increase of A$274,689 in general and administrative expenses is mainly attributed to additional consulting services provided to the Company.
Research and development expenses. Research and development expenses increased by A$188,369 from fiscal 2020 to fiscal 2021. The slight increase in the research and development expenditure reflects the Company’s continued strategic focus and development.
Selling and marketing expenses. Selling and marketing expenses decreased by A$583,867 from fiscal 2020 to fiscal 2021 as the sales decline due to the prolonged Covid-19 pandemic.
Loss for the period. As a result of the foregoing, our loss for the period after income tax benefit decreased by A$5,457,259, or 186%, from A$2,927,206 in fiscal 2020 to A$8,384,465 in fiscal 2021.
Given our and our subsidiaries’ history of recent losses, we have not recognized a deferred tax asset with regard to unused tax losses and other temporary differences, as it has not been determined whether we, or our subsidiaries, will generate sufficient future taxable income against which we can utilizedutilize these unused tax losses and any uncalculated potential deferred tax assets, together with any other temporary differences. Should the need arise, we can, and will, revisit this position.
Comparison of the fiscal years ended June 30, 2016 and 2015
Revenue and Other income
| For the fiscal year ended June 30, | Increase/ | |||||||||||
2016 AUD$ | 2015 AUD$ | Decrease AUD$ | ||||||||||
| Revenue: | ||||||||||||
| Sale of goods | 1,001,077 | 1,002,380 | (1,303 | ) | ||||||||
| Other income: | ||||||||||||
| Australian Federal R&D Tax Concession Refund | 1,512,840 | 1,478,581 | 34,259 | |||||||||
| Interest income | 12,165 | 112,440 | (100,275 | ) | ||||||||
| Other | 14,010 | — | 14,010 | |||||||||
| Total Revenue and Other income | 2,540,092 | 2,593,401 | (53,309 | ) | ||||||||
Revenues received from the sale of goods remain consistent for fiscal 2015 and 2016. While there appears to be no real perceived growth in our revenues, our geographic sales mix has changed as we achieved a major advancement by releasing Travelan, our flagship product in the U.S. by means of strategic supply arrangements with Passport Health, Medique and McKesson, while also opening a new distribution channel into the Chinese market. While our Australian product sales remained constant, we applied our resources and marketing efforts to these new emerging market opportunities in the U.S. and China, and we have instigated programs to reengage the Australian consumers. As these new markets mature over the coming 12 months, when combined with our existing market presence in Australia, we anticipate that revenues received from the sales of our Travelan product to increase.
R&D tax concession refund increased by A$34,000, or 2.32%, from A$1.48 million in fiscal 2015 to A$1.51 million in fiscal 2016 due to an increased level of eligible research and development expenditures being incurred during the fiscal 2016. This research and development increase was predominantly due to the increased expenditures of our major Phase II NASH clinical trial as the program recruitment accelerated and more patients entered the trial.
Interest income decreased by A$100,000 or 89.18%, from $A112,000 in fiscal 2015 to A$12,000 in fiscal 2016 as we depleted our cash reserves through applying our financial resources to the increased areas of expenditure within our company. The lower cash reserves therefore generated and received less interest revenue.
Cost of Goods Sold, Gross Profit and Direct Selling Costs
| For the fiscal year ended June 30, | Increase/ | |||||||||||
2016 AUD$ | 2015 AUD$ | Decrease AUD$ | ||||||||||
| Total Operating Revenue | 1,001,077 | 1,002,380 | (1,303 | ) | ||||||||
| Cost of Goods Sold | (301,435 | ) | (316,128 | ) | 14,693 | |||||||
| Gross Profit | 699,642 | 686,252 | 13,390 | |||||||||
| Less Direct Selling Costs: | ||||||||||||
| Sales and Marketing Costs | (133,781 | ) | (76,794 | ) | (56,987 | ) | ||||||
| Freight Costs | (134,967 | ) | (116,379 | ) | (18,588 | ) | ||||||
| Total Gross Profit less Direct Selling Costs | 430,894 | 493,079 | (62,185 | ) | ||||||||
Our strong mature relationships with its key manufacturing partners for Travelan, our flagship consumer product, has enabled us to maintain consistent cost of goods sold ratios from 32% of operating revenue, and then down to 30% of operating revenue, for the 2015 and 2016 fiscal years, respectively. These key manufacturing partners provide us with steady, reliable product for a known price which from a strategic point of view provides certainty around the manufacturing margins.
These strong manufacturing partnerships have also given rise to greater efficiencies in the manufacturing processes which not only resulted in the improvement in gross profit ratio but also an overall increase in Gross Profit.
Our introduction of Travelan into the U.S. and China required greater sales and marketing support to ensure it gained traction. The expenditure to support this expansion resulted in an A$57,000 increase in sales and marketing costs in fiscal year 2016 in comparison to fiscal year 2015, and also an A$19,000 increase in freight costs through the additional logistical implications of shipping Travelan overseas.
Expenses
| For the fiscal year ended June 30, | Increase/ | |||||||||||
2016 AUD$ | 2015 AUD$ | Decrease AUD$ | ||||||||||
| Expenses: | ||||||||||||
| Consulting, Employee and Director | (2,840,037 | ) | (728,140 | ) | (2,111,897 | ) | ||||||
| Corporate Administration | (1,320,570 | ) | (557,422 | ) | (763,148 | ) | ||||||
| Depreciation | (3,892 | ) | (3,719 | ) | (173 | ) | ||||||
| Finance Costs | (341,600 | ) | — | (341,600 | ) | |||||||
| Impairment of Inventory | (4,176 | ) | (35,340 | ) | 31,164 | |||||||
| Marketing and Promotion | (487,591 | ) | (304,687 | ) | (182,904 | ) | ||||||
| Research and Development | (3,623,961 | ) | (3,018,294 | ) | (605,667 | ) | ||||||
| Travel and Entertainment | (416,849 | ) | (128,318 | ) | (288,531 | ) | ||||||
| Total expenses | (9,038,676 | ) | (4,775,920 | ) | (4,262,756 | ) | ||||||
Consulting, Employee and Director.Consulting, employee and director expense increased by A$2.11 million from fiscal 2015 to fiscal 2016 due primarily to our employing more permanent full-time senior management, and additional operational employees within the organization due to our expansion, which was offset by the use of fewer part-time consulting and advisory providers.
The appointment of an additional Director in May 2015, who subsequently became Executive Vice Chairman, resulted in an increase in the overall Director’s fees paid during fiscal year 2016, in comparison to fiscal year 2015.
On top of this increase, there was an A$1.6 million share-based payments expense realized during fiscal year 2016 which was not present in fiscal year 2015, which pertained to the issuance of six (6) million unlisted options exercisable at A$0.50 per option expiring on November 27, 2019 to our four Directors. The unlisted options were issued to the Directors in lieu of cash payment for additional services each director performed which were deemed to be far over and above those services usually performed by Non-Executive Directors of a company like ours. The issuance of these options was designed to also encapsulate the additional services the Directors will be required to perform over the subsequent 12 – 24-month period as our company matures through a number of key milestone inflection points, where their guidance will be regularly required, during both the 2017 and 2018 fiscal years.
Corporate Administration.Corporate administration expense increased by A$763,000, or 137%, from fiscal 2015 to fiscal 2016 due to the general increase in the size of the business in combination with increases in consequent expenses due to additional resources being implemented to assist our growth.
The increase was also the result of an increase in a number of back-office support costs, fees associated with our OTCQB listing, legal fees surrounding the initial NASDAQ listing and additional programs and contracts required for the organization as it employed new employees and raised further capital while generally expanding, and increased conference and seminar costs as we increased our public profile around the world.
There was also a significant increase in the foreign currency realized losses as overseas expenditures, predominantly in US$, became more expensive for our A$ denominated financial statements as the US$ strengthened against the A$ throughout fiscal year 2016, in comparison to the relative strength of the A$ against the US$ in fiscal year 2015, when the A$ was either at parity of at times even above parity with the US$.
Finance Costs. Finance costs incurred by us in fiscal 2016 of A$342,000 which directly pertained to the establishment of the SBI Investment Fund Convertible Loan Facility in February 2016. This facility provided us with the short to medium-term cash flow requirements we needed to ensure the momentum surrounding our pipeline research programs was not diminished. In comparison, there were no Finance Costs incurred in fiscal 2015.
Marketing and Promotion.Marketing and promotion expenses increased by A$183,000 from fiscal 2015 to fiscal 2016 as we increased our promotional efforts for Travelan. These increased costs included costs associated with the expansion of the product’s reach via a launch in both the U.S. and Chinese consumer markets. We hope to see the benefits of these expansions come to fruition during future years as the groundwork costs incurred mature into increased revenue in these large new markets.
Research and Development.Research and Development expense increased by A$606,000 from fiscal 2015 to fiscal 2016, primarily due to the significant increase in our Phase II NASH clinical trial, together with the advancement of our other early pipeline products.
During fiscal year 2016, we brought the management of our Phase II NASH clinical trial program in-house through the appointment of our own Medical Director and another clinical trial support staff member, thereby alleviating the need for some of the external outsourced management while also providing us with greater control over the program.
While costs were reduced by bringing the management of the trial in-house, the ramping up of this trial from development to extensive patient recruitment and testing, began to see the majority of the costs of the trial coming through causing an expected increase in the overall research and development expenditures of our company.
Travel and Entertainment. Travel and entertainment expense increased by A$289,000 from fiscal 2015 to fiscal 2016 as our activities expanded into the U.S. through the appointment of a U.S.-based Chief Executive Officer and U.S. Sales Director, as well as an Israeli-based Medical Director. These overseas appointments were critical for us to begin our expansion into the U.S. capital markets through the initial OTCQB listing, and subsequently the NASDAQ Market listing, and into the product markets for Travelan’s expansion into the U.S. Having an Israeli-based Medical Director also brought us within close proximity to our major-research collaboration partner Hadassah Hospital in Israel.
Loss for the period. As a result of the foregoing, our loss for the period after income tax benefit increased by A$4.38 million, or 163%, from A$2.69 million in fiscal 2015 to A$7.07 million in fiscal 2016.
Given our, and our subsidiaries’ history of recent losses, we have not recognized a deferred tax asset with regard to unused tax losses and other temporary differences, as it has not been determined whether we, or our subsidiaries, will generate sufficient future taxable income against which we can utilized these unused tax losses and any uncalculated potential deferred tax assets, together with any other temporary differences. Should the need arise, we can, and will, revisit this position.
Inflation and Seasonality
Management believes inflation has not had a material impact on our company’s operations or financial condition and that our operations are not currently subject to seasonal influences.
Conditions in Australia
We are incorporated under the laws of, and our principal offices and research and development facilities are located in, the Commonwealth of Australia. Therefore, we are directly affected by political and economic conditions in Australia. See Item 3.D. “Key Information – Risk Factors – Risks Relating to Our Location in Australia”Factors” for a description of factors that could materially affect our operations.
Recently Issued International Accounting Standards and PronouncementsAustralian Disclosure Requirements
NewSignificant Changes in the State of Affairs
There have been no significant changes within the state of affairs during the year ended June 30, 2022 except as noted in the “Business Overview” section included in item 4.B.
Likely Developments and amended Accounting StandardsExpected Results of Operations
The group aims to create value for shareholders through a two-pronged approach. In the short- and Interpretations issuedmedium-term, Immuron Limited sells and effective
We have adopted all oflicenses Travelan and Protectyn, over-the-counter products. Beyond this, the new, revised or amending Accounting Standardsgroup is researching and Interpretation issued by the IASB that are mandatoryclinically developing products, principally for the current reporting period. treatment of moderate to severe campylobacteriosis, travelers’ diarrhea and Clostridium difficile infections.
More information on these developments is noted in the “Business Overview” section included in item 4.B.
Environmental Regulations
The adoption of these Accounting Standards and Interpretations didgroup is not haveaffected by any significant impact on our financial performance or financial position.environmental regulation in respect of its operations.
Accounting StandardsB. Liquidity and Interpretations that have recently been issued or amended but are not yet effective and have not been adopted by us for the annual reporting period ended 30 June 2017 are outlined in the table below.Capital Resources
Management has determined that the standards that have been adopted in fiscal year 2018 have not had a material impact on us. Management is currently assessing the impact of the standards to be adopted in fiscal year 2019 and forward.
Liquidity and Capital Resources
We have incurred cumulative losses and negative cash flows from operations since our inception in 1994 and as of June 30, 20172022 we had accumulated losses of A$49.5 million.68,425,281.
In July 2020, the Company completed a registered direct offering of 1,066,668 ADSs at a purchase of US$18.75 per ADS for gross proceeds US$20,000,025 (prior to deducting underwriting discounts, commissions and other estimated offering expenses). In July 2019, the Company completed an underwritten public offering of 339,130 ADSs at a public offering price of US$4.00 per ADS for gross proceeds US$1,356,520 (prior to deducting underwriting discounts, commissions and other estimated offering expenses). In May 2019, the Company completed an underwritten public offering of 500,000 ADSs at a public offering price of US$4.00 per ADS for gross proceeds US$2,000,000 (prior to deducting underwriting discounts, commissions and other estimated offering expenses). In June 2017, we sold 610,000 ADSs and warrantsWarrants to purchase 701,500 ADSs (not including the 35,075 Representative’s Warrants) in an initial public offering in the U.S. The aggregate net offering proceeds to us, after deducting underwriting discounts and commissions, was US$5,673,000. Additionally, in mid-March 2018, we completed a A$5,161,585 private placement with a large US institutional investment fund. The net proceeds improvedfunds will support current and future clinical programs, support continued Travelan marketing, and our financial condition.working capital. We anticipate for the foreseeable future that we will continue to incur losses for at least the next several years.foreseeable future. We expect that as we continue research efforts and the development of our product candidates, hire additional staff, including clinical, scientific, operational, financial and management personnel and incur additional costs associated with our securities being listed both on the ASX and NASDAQ, we will need additional capital to fund our operations which we may raise through a combination of equity offerings, debt financings, other third-party funding and other collaborations, strategic alliances and licensing arrangements.
The commitment to these projects will require additional external funding, at least until we are able to generate sufficient cash flow from sale of one or more of our products to support our continued operations. If adequate funding is not available, we may be required to delay, scale back or eliminate certain aspects of our operations or attempt to obtain funds through unfavorable arrangements with partners or others that may force us to relinquish rights to certain of our technologies, products or potential markets or that could impose onerous financial or other terms. Management is continuing its efforts to obtain additional funds so that we can meet our obligations and sustain operations.
We plan to continue to fund losses from operations and capital funding needs through future debt and equity financing, as well as potential additional collaborations or strategic partnerships with other companies or through non-dilutive financings. The sale of additional equity or convertible debt could result in additional dilution to our shareholders. The incurrence of indebtedness would result in debt service obligations and could result in operating and financing covenants that would restrict our operations. We can provide no assurance that financing will be available in the amounts we need or on terms acceptable to us, if at all. If we are unable to secure adequate additional funding we may be forced to make reductions in spending, extend payment terms with suppliers, liquidate assets where possible, and/or suspend or curtail planned programs. Any of these actions could materially harm our business.
We had A$1.69 million and A$1.87 million of net borrowings/(repayments) in fiscal 2017 and fiscal 2016, respectively. We do not currently have any credit facilities in place.
As of June 30, 2017,2022, we had cash and cash equivalents of A$4.0 million22,110,278 as compared to cash and cash equivalents of A$2.3 million25,047,281 as of June 30, 2016. Additionally, we also recognized a total of A$1,768,237 in receivables, including A$1,498,112 related to R&D Tax Concession, which has not yet been received. On this basis, even though we have been2021. The company is in a loss-making position historically, managementto meet future commitments in the current business cycle and pay its debts as and when they fall due. Furthermore, the company is satisfiedable to progress its research and development programs for at least the next 12 months. The annual report has been prepared on a going concern basis. Accordingly, the annual report does not include adjustments relating to the recoverability and classification of recorded asset amounts, or the amounts and classification of liabilities that with receipt ofmight be necessary should the R&D Tax Concession refund for fiscal year 2017 R&D expenditures, and the anticipated increase in Travelan sales in both the Australian and US marketsgroup not continue as the product is now starting to gain traction , oura going concern. The company is a going concern and is of the opinion that no asset is likely to be realized for an amount lower than the amount at which it is recorded in theour Consolidated Statement of Financial Position atas of June 30, 2017.2022.
We expect that our current cash, cash equivalents will be sufficient to fund our capital requirements for at least 12 months from the issuance date of the financial statements. Our future funding requirements will depend on many factors, including, but not limited to:
| ● | the timing and costs of our planned clinical trials for our product candidates; |
| ● | the timing and costs of our planned preclinical studies for our product candidates; |
| ● | the number and characteristics of product candidates that we pursue; |
| ● | the outcome, timing and costs of seeking regulatory approvals; |
| ● | revenue received from commercial sales of any of our product candidates that may receive regulatory approval; |
| ● | the terms and timing of any future collaborations, licensing, consulting or other arrangements that we may establish; |
| ● | the amount and timing of any payments we may be required to make, or that we may receive, in connection with the licensing, filing, prosecution, defense and enforcement of any patents or other intellectual property rights; |
| ● | the costs of preparing, filing and prosecuting patent applications, maintaining and protecting our intellectual property rights and defending against intellectual property related claims; and |
| ● | the extent to which we need to in-license or acquire other products and technologies. |
In connection with our initial public offering in June 2017, we sold Warrants to purchase 701,500 ADSs at an initial exercise price of $10.00US$10.00 per ADS. The Warrants will expireexpired five years from the date of issuance. The initial public offering price for each ADS was $9.99 and $0.01 per Warrant. Any proceeds from the exercise of the Warrants will bewere added to our working capital.
Upon the closing of our initial public offering, we issued warrantsWarrants to purchase 35,07530,500 ADSs to the representatives (the “Representative’s Warrants”). The Representative’s Warrants are exercisable at a per ADS exercise price equal to $12.50.US$12.50. The Representative’s Warrants are exercisable at any time and from time to time, in whole or in part, during the four yearfour-year period commencing one year from the effective date of the registration statement related to this offering. Any proceeds from the exercise of the Representative’s Warrants will be added to our working capital.
In connection with our public offering in May and July 2019, we issued Warrants to purchase 20,000 and 13,565 ADSs to the representatives (the “Representative’s Warrants”), respectively. The Representative’s Warrants are exercisable at a per ADS exercise price equal to US$5.00. The Representative’s Warrants are exercisable at any time and from time to time, in whole or in part, during the four-year period commencing one year from the effective date of the offering. Any proceeds from the exercise of the Representative’s Warrants will be added to our working capital.
In connection with the registered direct offering in July 2020, we issued Warrants to purchase 64,000 ADSs to the representatives (the “Representative’s Warrants”), respectively. The Representative’s Warrants are exercisable at a per ADS exercise price equal to US$23.4375. The Representative’s Warrants are exercisable at any time and from time to time, in whole or in part, during the four-year period commencing one year from the effective date of the offering. Any proceeds from the exercise of the Representative’s Warrants will be added to our working capital.
Cash flows
The following table sets forth the primary sources and uses of cash for each of the periods set forth below:
| For the year ended June 30, | ||||||||||||
2017 AUD$ | 2016 AUD$ | 2015 AUD$ | ||||||||||
| Net cash used in operating activities | (7,031,088 | ) | (5,158,336 | ) | (3,020,933 | ) | ||||||
| Net cash used in investing activities | (5,696 | ) | (2,441 | ) | (3,168 | ) | ||||||
| Net cash provided by (used in) financing activities | 8,701,052 | 4,335,342 | (1,614 | ) | ||||||||
| For the year ended June 30, | ||||||||||||
| 2022 | 2021 | 2020 | ||||||||||
| A$ | A$ | A$ | ||||||||||
| Net cash used in operating activities | (3,147,793 | ) | (4,078,747 | ) | (3,147,328 | ) | ||||||
| Net cash (used in)/from investing activities | 11,737 | 2,574 | (864 | ) | ||||||||
| Net cash from financing activities | (42,447 | ) | 26,480,182 | 1,156,952 | ||||||||
Comparison of the fiscal years ended June 30, 2017 and 2016
Operating activities.During the twelve months ended June 30, 20172021 and 2016,2022, net cash used in operating activities decreased by A$930,954 from A$4,078,747 to A$3,147,793, respectively. Net cash used in operating activities increased by A$1.87 million931,419 from A$5.2 million3,147,328 in fiscal year 2020 to A$7.0 million, respectively.4,078,747 in fiscal year 2021. The use of net cash in all periods resulted from our ordinary business operations. Net cash used in operating activities increaseddecreased by more 37% and this was primarilyapproximately 23% in fiscal year 2022 due to our Phase II clinical trial programed increasehigher receipts from customers and more government grants and other grants received which resulted in activity with increased patient and testing activities resultingdecrease in increasednet operational cash payments.outflow.
Investing activities.Net cash used in investing activities during the twelve months ended June 30, 20172022, 2021 and 2016 was2020 were relatively minimal whichand solely related to interest received and pertained to purchases of office and computer equipment.
Financing activities.During the twelve months ended June 30, 2017,2022, net cash outflow in relation to financing activities was A$42,447, which comprised of principal elements of lease payments and interest paid.
During the twelve months ended June 30, 2021, net cash provided by financing activities was A$8.7 million,26,480,182, which comprised of (i) proceeds from issue of securities on the Australia Stock Exchangethrough a public offering of ADSs (less costs associated with the offer), (ii) proceeds from issue of securities as part of our Initial Public Offering on the NASDAQ Capital Market (less costs associated with the offering), (iii) receipt of borrowings from short-term R&D Tax Concession loan advances from a related party (iv) repayments of borrowing principal of the convertible notes and R&D Tax Concession loan advancesissue).
Comparison of the fiscal years ended June 30, 2016 and 2015
Operating activities. ForDuring the twelve months ended June 30, 2016 and 2015, net cash used in operating activities increased by A$2.14 million from A$3.02 million to A$5.16 million respectively. The use of net cash in all periods resulted from our ordinary business operations. Cash flows from operating activities for the fiscal years 2016 and 2015 also included inflows of A$1.47 million and A$722,000, respectively in relation to refunds received through the Australian Federal Government’s Research and Development Income Tax Incentive program for eligible expenditure. As discussed earlier, the major increase of net cash outflows surrounding Operating Activities, results from the significant increase in the costs associated with our research and development programs, as well as our overall general internal expansion and shift to overseas markets.
Investing activities. Net cash used in investing activities in fiscal 2016 and 2015 was A$2,400 and A$3,200, which expenditures pertain to purchases of office equipment.
Financing activities. For the twelve months ended June 30, 2016,2020, net cash provided by financing activities was A$4.34 million,1,156,952, which comprised of (i) proceeds from issue of securities and exercisethrough a public offering of options of A$2.46 million, net of capital raisingADSs (less costs (ii) proceeds fromassociated with the issuance of convertible notes pertaining to the convertible loan funding arrangement establishedissue).
Contractual Obligations
The group had no contractual obligations other than those disclosed in February 2016, and other borrowings of A$2.95 million less repayments of A$1.08 million related to these borrowings. In the fiscal year endedNote 9(d) Leases. The group had no contingent liabilities at 30 June 30, 2015, net cash used in financing activities of A$1,614 was related to the payment of minor subsequent capital raising costs.2022 (2021: nil).
Off balance sheet arrangements
We are not a party to any material off-balance sheet arrangements. In addition, we have no unconsolidated special purpose financing or partnership entities that are likely to create material contingent obligations.
Quantitative and qualitative disclosures about market risks
We are exposed to market risk related to changes in interest rates and exchange rates. As of June 30, 2017,2022, we had cash and cash equivalents of A$4.0 million,22,110,278, primarily held in bank accounts. Our primary exposure to market risk is interest rate sensitivity, which is affected primarily by changes in the general level of Australian interest rates. We are exposed to interest rate risks via therelating to our cash and cash equivalents and borrowings that it holds.borrowings. Interest rate risk is the risk that a financial instrumentsinstrument’s value will fluctuate as a result of changes in market interest rates.
We are exposed to fluctuations in foreign currencies that arise from foreign currencies held in bank accounts and the translation of results from our operations outside Australia. Our foreign exchange exposure is primarily to the U.S. dollar and New ZealandCanadian dollar. Foreign currency risks arising from commitments in foreign currencies are managed by holding cash in that currency. Foreign currency translation risk is not hedged.
C. Research and Development, Patents and Licenses
In recent years, we have continued our practice of building valuable research collaborations with institutes based in Australia, the United States, the United KingdomEurope and other countries to enable us to investigate a variety of therapeutic indications including Autism Spectrum Disorders, Inflammatory Bowel Disease such as colitis, Campylobacter, ETEC, Shigella and Uropathogenic EcoliClostridiodies Infections. These collaborative arrangements ensure that we work with well-respected key optionopinion leaders and laboratories with specific expertise in screening and animal modelling of relevance to the particular indication, without incurring ongoing administrative and personnel costs. We maintain in-house patent counsel and research and development project expertise to coordinate these research collaborations.
When a lead compound is identified as suitable for clinical development, we establish a project team to coordinate all non-clinical and clinical development and manufacturing activities. Typically, we would project manage all the project activities, tasks and milestones and engage clinical research organizations and contract manufacturing organizations to assist. We manage our manufacturing campaigns through contract manufacturing organizations for quality assurance and GMPcGMP compliance. All clinical, non-clinical, clinical development and manufacturing of our compounds is performed in compliance with the appropriate governing authorities, regulators and standards (for example, the International Conference on Harmonisation of Technical Requirements for Registration of Pharmaceuticals for Human Use).
Research and development expenses amounted to A$3,018,294,1,178,685, A$3,623,9611,367,054 and A$4,630,674657,715 during the years ended June 30, 2015, 20162020, 2021 and 2017,2022, respectively. Costs associated with patent applications and defense of patent applications are classified as research and development expenses and amounted to approximately A$290,000,79,000, A$61,000 and A$190,000 and A$100,00097,000, during the years ended June 30, 2017, 20162020, 2021 and 20152022, respectively.
Our research and development expenses consist primarily of expenses for contracted research and development activities conducted by third parties on our behalf, including personnel, testing facilities and other payments in accordance with our research and clinical agreements. Research and development expenses also include costs associated with the acquisition and development of patents. Due to the numerous variables and the uncertain nature of the development of a clinical compound, including obtaining regulatory approvals, we are not able to reasonably estimate the nature, timing and costs of the future expenditures necessary to complete our research and development projects, the anticipated completion dates of each project and when material net cash flows from our research and development programs will commence.
D. Trend Information
We are a commercial and clinical development stage company, and while we believe that our technology will offer novel therapeutic strategies into an expanding market, we cannot predict with any degree of accuracy the outcome of our research or commercialization efforts. Accordingly, any trends within the markets in which we operate are expected to have more direct impact on our business in the event that we are successful in commercializing our new product candidates, including our current lead product candidates.
Over the past few years, there has been increasing pressure to reduce drug prices in the developed markets as a consequence of political initiatives and regulations aiming to curb continuous increases in healthcare spending. Any revenue we earn in the future may be negatively affected by such political initiatives and regulations. The increased burden of healthcare costs in the aging population have led to an increased focus on reducing costs and, therefore, have further increased the pressure to lower drug prices. We expect this trend to continue in the years ahead. However, we believe spending in the healthcare industry, as compared to many other industries, is less linked to economic trends. We expect sales growth to continue at higher levels in emerging markets and also for niche, orphan indications. We also expect that demographic developments, increased treatment penetration, especially in newly established drug markets, and better diagnostic tools to enable the tailoring of drugs to specific needs, will result in continuing growth in overall global drug sales.
D. Off-Balance Sheet ArrangementsITEM 6. DIRECTORS, SENIOR MANAGEMENT AND EMPLOYEES
We are not a party to any material off-balance sheet arrangements. In addition, we have no unconsolidated special purpose financing or partnership entities that are likely to create material contingent obligations.(Start of the Remuneration Report for Australian Disclosure Requirements)
E. Tabular DisclosureThe Immuron Limited Board of Contractual Obligations
Directors (“the Board”) presents the 2021/2022 Remuneration Report, which has been prepared in accordance with the relevant Corporations Act 2001 (“Corporations Act”) and accounting standards requirements. The following table summarizesremuneration report sets out remuneration information for our minimum contractual obligationscompany’s key management personnel (“KMP”) as ofdefined in the International Accounting Standards 24 ‘Related Party Disclosures’ and the Australian Corporations Act 2001 for the financial year ended June 30, 2017. We have2022. The remuneration report has been audited as required by s308 (3C) of the ability to scale down our operations and prioritize our research and development programs in neurology to reduce expenditures as discussed in Item 5B. Liquidity and Capital Resources.Corporations Act.
| Contractual Obligations | Payments due by period | |||||||||||||||||||
| more | ||||||||||||||||||||
| less than | 3-5 | than | ||||||||||||||||||
| Total | 1 year | 1-3 years | Years | 5 years | ||||||||||||||||
| AUD$ | AUD$ | AUD$ | AUD$ | AUD$ | ||||||||||||||||
| Operating lease obligations | 59,286 | 39,524 | 19,762 | — | — | |||||||||||||||
| Total | 59,286 | 39,524 | 19,762 | — | — | |||||||||||||||
A. Directors and Senior Management
OurAs of September 9, 2022, our directors and executive officers are as follows:
| Name | Age | Position | ||
| Dr. Roger Aston | Non-Executive Chairman | |||
| Mr. | ||||
| Mr. | Non-Executive Director | |||
| Non-Executive Director | ||||
| Non-Executive Director | ||||
| Mr. Steven Lydeamore | 54 | Chief Executive Officer | ||
| Dr. Jerry Kanellos, | ||||
Mr.Peter Anastasiou and Mr. Stephen Anastasiou are brothers. Other than such relationship, thereThere are no family relationships among our directors and senior executives.
Dr. Roger Astonhas been a member of our board of directors and the board’s non-executiveIndependent Non-Executive Chairman since March 2012. He also has special responsibilities as a member of the audit and risk committee and chair of the remuneration committee. Dr. Aston is bothholds a scientistBSc (Hons) and a seasoned biotechnology entrepreneur, with a successful track record in both fields, and brings to the BoardPhD. He has more than 20 years ofyears’ experience in the pharmaceutical and biotechbiotechnology industries. Dr.Dr Aston was previously the chief executive officer and a director of Mayne Pharma Group Limited (ASX: MYX). Prior to his position at Mayne Pharma, some of his previous positions have included chief executive officer of Peptech Limited (ASX: PTD), director of Cambridge Antibody Technology Limited (LSE: CAT and NASDAQ: CATG) and chairman of Bio Focus Plc (formerly: Cambridge Drug Discovery Limited). Dr Aston was also founder and chief executive officer of Biokine Technology Ltd (UK) prior to its acquisition by the Peptech Group. Dr Aston was also a director of pSivida Ltd. During the past 20 years of his career, Dr Aston has been closely involved in start-up companiesthe development of many successful pharmaceutical and major pharmaceuticalbiotechnology companies. Aspects of hisHe has extensive experience include FDA and EUincluding negotiating global license agreements, overseeing product registration activities with the FDA, the establishment and implementation of guidelines and operating procedures for manufacturing and clinical trials, global licensing agreements, fundraising throughoverseeing manufacturing of human and veterinary products, private placements, and a networkpublic fund-raising activities and the introduction of contacts withincorporate governance procedures. Dr. Aston’s other current directorships are with Pharmaust Limited (ASX: PAA) since August 2013, and Resapp Health Limited (ASX: RAP) since July 2015. Former public company directorship held by Mr. Aston in the pharmaceutical, banking and stock broking sectors.last three years: Oncosil Limited (ASX: OSL), until 19 October 2021.
Dr. Aston has had extensive experience on boards of many biopharmaceutical companies including Directorships/Chairmanships with Clinuvel Limited (ASX:CUV), HalcyGen Limited (ASX:HGN) and Ascent Pharma Health Limited (ASX:APH). During 2007 and 2008, Dr Aston was a member of the AusIndustry Biological Committee advising the Industry Research and Development Board. More recently, Dr Aston was Executive Chairman of Mayne Pharma Group from 2009 to 2011 and CEO of Mayne Pharma Group until 2012.
Dr. Aston has also been a director of IDT (ASX:IDT) Limited, Cynata Limited (ASX:CYP), Calzada Limited (now Polynovo Limited), Biolife Limited (now Immugene ASX:IMU, Director and Chairman of Regeneus Limited (ASX:RGS), Director and Chairman of Oncosil Medical Limited (ASX:OSL) and Director and Chairman of ResApp Limited (ASX:RAP). Roger Aston is also currently the Executive Chairman of Pharmaust Ltd (ASX:PAA).
Peter AnastasiouMr. Daniel Pollock has been a member of our board of directors and our Executive Vice ChairmanIndependent Non-Executive Director since May 2015. Mr. Anastasiou’s involvement with us commenced in May 2013 following his substantial underwriting support of our Renounceable Rights Issue, which was surpassed by his further funding supportOctober 2012. He also has special responsibilities as chair of the A$9.66 million capital raising in February 2014 resulting in an ownership of approximately 15% of our company through his associated investment funds. Mr. Anastasiou is an entrepreneuraudit and investor with extensive experience in business both in Australiarisk committee and overseas. Mr. Anastasiou was the founding Chairman of the ACSI Group of Companies, which has owned and managed successful consumer companies such as SABCO, Britex Carpet Care, Rug Doctor and Crystal Clear. Mr. Anastasiou also has a number of philanthropic interests including being a patron of the Identity Theatre for men, a prior board member and supporter of the Indigenous Eye Health Unit at Melbourne University, a supporter of the John Fawcett Foundation in Bali, and a founding investor and Director of Melbourne Victory Football Club. Mr. Anastasiou is the brother of Stephen Anastasiou.
Daniel Pollockhas been a member of our boardthe remuneration committee. Mr. Pollock holds a Bachelor of directors since October 2012. Mr. PollockLaws and Diploma in Professional Legal Practice and is a lawyer admitted in both Scotland and Australia and holding Practicing Certificatespracticing certificates in both jurisdictions. He is a sole practitioner in his own legal firm based in Melbourne Australia which operates internationally and specializes in commercial law. Mr. PollockFurther, he is also Executive Directorexecutive director and co-owner of Great Accommodation P/LPty Ltd, a property management business operating in Victoria. Mr. Pollock is also the former Chairmanhas had historical involvement as a seed investor and board member of Amaero Engineering Pty Ltd, a number of small unlisted companies. The most recent of these was an e-pharmacy company establishedwhere he was heavily involved in its commercial growth and ultimate sale to commercialize laser based 3D print additive manufacturing emerging from Monash University.a large listed health services company.
Mr. Stephen Anastasiouhas been a member of our board of directors and our Independent Non-Executive Director since May 2013. Mr. Anastasiou holds a Bachelor of Science (Hons), Graduate Diploma in Marketing and Master of Business Administration. He has over 20 years’years of experience in general management, marketing and strategic planning within the healthcare industry. His breadth of experience incorporates medical diagnostics, pharmaceuticals, hospital, dental and OTCover-the-counter products, with companies including the international pharmaceutical company Bristol - Myers Squibb.Bristol-Myers Squibb (NYSE: BMY). While working with KPMG Peat Marwick as a management consultant, Mr. Anastasiou previously led project teams in a diverse range of market development and strategic planning projects in both the public and private sector. He is also a director and shareholder of a number of unlisted private companies, covering a variety of industry sectors that include healthcare and funds management. Mr. Anastasiou is the brotherAnastasiou’s companies have participated in several corporate transactions involving business units and brands of Peter Anastasiou.multinational and Australian companies.
Professor Ravi Savarirayanwas appointed ashas been a member of our board of directors and our Independent Non-Executive Director since April 2017. Prof. Savarirayan holds a Doctor of our company on April 7, 2017.Medicine from the University of Melbourne, a Bachelor of Medicine and Bachelor of Surgery from the University of Adelaide, is a Fellow of the Royal Australasian College of Physicians (FRACP) and is a member of the American Academy of Physician Assistants (ARC-PA, Hons). He ishas been a consultant clinical geneticist at the Victorian Clinical Genetics Services since August 1999, as well as Professorprofessor and Research Group Leader (Skeletal Biologyresearch group leader of skeletal biology and Disease)disease at the Murdoch Children’s Research Institute since September 2000. Mr.Prof. Savarirayan ishas served as a founding member of the Skeletal Dysplasia Management Consortium since January 2011 and has beenacted as the Chairchair of the Specialist Advisory Committeespecialist advisory committee in Clinical Genetics,clinical genetics at the Royal Australasian College of Physicians since February 2009 .2009. He was president of the International Skeletal Dysplasia Society from July 2009 to June 2011 and has been an invited member of several International Working Committeesinternational working committees on Constitutional Diseasesconstitutional diseases of Bone. Mr.bone. Prof. Savarirayan’s primary research focus is on inherited disorders of the skeleton causing short stature, arthritis and osteoporosis. He has published over 150 peer-reviewed articles, collaborating with peers from over 30 countries, andcountries. He has been on the editorial board of Human Mutation since January 2009, European Journal of Human Genetics since July 2007, American Journal of Medical Genetics since December 2011 and the Journal of Medical Genetics since June 2005.
Mr. Savarirayan received his MBBSPaul Brennan has been a member of our board of directors and our Independent Non-Executive Director since March 2022. Mr Brennan holds an MBA from Swinburne University, a Bachelor of Science from the University of AdelaideNew England in 1990NSW, Certificate in Midwifery Central Coast Areas Health Service NSW and becameGeneral Nursing certificate from St Vincent’s Hospital Darlinghurst NSW. He has extensive experience in the health system through his clinical background and commercial exposure with various multinational companies. Mr Brennan was Chief Executive Officer (CEO) of PolyNovo Limited (ASX: PNV) for 7 years from 2015 to 2021 and took the company from a fellowmarket capitalisation of $30M to a high of $2B. Prior to this he was Marketing Director Australia and New Zealand and Sales Director New Zealand for Smith & Nephew Healthcare for 6 years. Mr. Brennan has coordinated the marketing, global strategy development, new product development and regulatory processes for the Asia-Pacific region for industry-leading organisations in relation to medical products and devices. He has an intimate knowledge of the Royal Australasian College of Physicians in December 1997. He was certified as a specialist in clinical genetics from the Human Genetics Society of Australasia in 1998manufacturing and received his Doctor of Medicine from the University of Melbourne in 2004, for his thesis “Clinical and Molecular Studiesproduction processes. Former public company directorship held by Mr. Brennan in the Osteochondrodysplasias.”last three years: Polynovo Limited (ASX: PNV), until 5 November 2021.
Dr. Jerry KanellosMr. Steven Lydeamore(PhD)has been our Chief OperatingExecutive Officer since June 2022. He has 30 years international pharmaceutical experience, working in Australia, Canada and ScientificUSA. Mr. Lydeamore brings valuable international experience having spent eleven years working at Canadian global pharmaceutical company Apotex Inc., and four years for Mayne Pharma (USA) Limited. This includes valuable experience in mergers and acquisitions, finance, business development, sales and marketing, manufacturing, and research and development. Mr. Lydeamore was most recently Chief Executive Officer (CEO) of Anatara Lifesciences Limited (ASX: ANR), during which time the company successfully transitioned from a preclinical to a clinical company following development of a gastrointestinal tract delivery technology from which two products have commenced human clinical trials.
Dr. Jerry Kanellos, Ph.D. served as our Chief Executive Officer from March 2020 to June 2022 and our Chief Operating Officer since July 2015. He also served as our Chief Scientific Officer from July 2015 and on August 1, 2017 was appointed Interim CEOto November 2018. In addition, since April 2018, Dr. Kanellos has served as a director of our company.Immuron Canada Limited. Dr. Kanellos has over twenty-five years’25 years of experience in the pharmaceutical and biotechnology industry, and has held leadership roles in executive management, business development, project management, intellectual property portfolio management research and development. From 2008 until 2012, Dr. Kanellos was the Chief Operating Officer of TransBio Limited where he was responsible for the strategic identification, development and maintenance of commercial partnerships globally, along with development, management and maintenance responsibility for the intellectual property portfolio, research and development and technology transfer. Prior to this, Dr. Kanellos workworked for five years as a consultant to the biotechnology industry and has provided development and commercialization strategies for various bodies including academic institutes, private and publicly listed companies and government departments both national and international. He has also been involved in the establishment and management of several startup biotechnology companies. During his ten year tenure in research and development at CSL Limited, a global specialty biotherapeutics company that develops and delivers innovative biotherapies, Dr. Kanellos gained considerable experience in the international drug development process, formulation development through to pharmaceutical scale up and cGMP manufacture successfully leading the Chemistry Manufacturing and Controls (CMC) programs for the approval, manufacture and launch of several products. Dr. Kanellos holds a PhD degree in Medicine from the University of Melbourne.
Company secretary
Dr. Dan PeresMr. Phillip Hains (MD)has served in various clinical and medical managerial roles in pharmaceutical and medical device companies suchwas appointed as Exalenz Bioscience, CarboFix Orthopedics Ltd, NMB Medical Applications Ltd, ByPass Makafim Ltd, IOPtima Ltd and NovoNordisk Israel. In addition, Dr. Peres has been responsible for operational, marketing and business development activities throughout his career in the life sciences industry. Dr. Peres began his career as a physician and medical director in the Israeli army. Dr. Peres’ expertise lies with medical strategy, research and development, and the management of clinical studies and other laboratory processors. He has extensive knowledgesecretary of the leading international centers for liver disease and has established relationships with key opinion leaders, including those currently participatingCompany in our NASH and ASH trials. Dr. Peres has been a certified physician since 2002 when he graduated from the Sackler School of Medicine at Tel-Aviv University.
Phillip Hainshas been our joint Chief Financial Officer (CFO) and Company Secretary since April 2013. Mr. Hains is a Chartered Accountant operating a specialist public practice, ‘The CFO Solution’. The CFO Solution focuses on providing back office support, financial reporting and compliance systems for listed public companies. A specialist in the public company environment. Heenvironment, Mr. Hains has served the needs of a number of public company boards of directors and their related committees. He has over 20 years’30 years of experience in providing businesses with accounting, administration, compliance and general management services. He holds a MastersMaster of Business Administration from RMIT University and a Public Practice Certificate from the Institute of Chartered Accountants of Australia.Australia and New Zealand.
Peter VaughanB. Compensationhas been our joint Chief Financial Officer (CFO) and Company Secretary since April 2013. Mr. Vaughan is a Chartered Accountant who has worked in the listed company environment for 13 years across a number of industries. He has served on, and provided accounting, administration, compliance and general management services to, a number of private, not-for-profit, and listed public company boards of directors and related committees. Mr. Vaughan also holds a Senior Executive Masters of Business Administration from Melbourne University.
Mr. Thomas Liquard resigned as our Chief Executive Officer on August 3, 2017 but executed a Consulting Agreement on the same day to remain with us for a further three (3) month period until the end of October 2017 to ensure a smooth transition.
Our remuneration policy is designed to ensure that directors and senior management are appropriately remunerated having regard to their relevant experience, their performance, the performance of our company, industry norms and standards and the general pay environment as appropriate. The Remuneration PolicyOur remuneration policy has been established to enable us to attract, motivate and retain suitably qualified directors and senior Managementmanagement who will create value for shareholders.
Our Remuneration Policyremuneration policy is not directly based on our earnings. Our earnings have remained negative since inception due to the nature of our company. Shareholder wealth reflects this speculative and volatile market sector. No dividends have ever been declared by us. We continue to focus on the research and development of our intellectual property portfolio with the objective of achieving key development and commercial milestones in order to add further shareholder value.
Non-Executive Director Remuneration
Our Remuneration PolicySimilarly, our remuneration policy is designed to ensure that Non-Executive Directorsnon-executive directors are appropriately remunerated with respect to their relevant experience, individual performance, the performance of our company, industry norms/standards and the general pay environment as appropriate.
Our Constitution and the ASX Listing Rules specify that the aggregate remuneration of Non-Executive Directorsnon-executive directors shall be determined from time to time by a meeting of shareholders. An amount (not exceeding the amount approved at the Shareholders Meeting)shareholders’ meeting) is determined by the Board and then divided between the Non-Executive Directors as agreed.non-executive directors. The latest determination was at the Shareholders Meetingshareholders’ meeting held on November 8, 2005October 29, 2020 when shareholders approved the aggregate maximum cash sum to be paid or provided as remuneration to the Directorsdirectors as a whole (other than the Managing Directormanaging director and Executive Directors)executive directors) for their services as A$350,000750,000 per annum. This compensation isAs per the ASX announcement on 27 April 2020, the Board of Directors have resolved, for the foreseeable future, to relinquish cash basedpayments of fees from 1 April 2020 and does not includein lieu of the same receive common stock based compensation.in the company. Cash payments of fees were subsequently reinstated from 1 January 2021.
In the year ended June 30, 2017,2022, our Non-Executive Directorsdirectors received an aggregate of A$178,873,353,210, including superannuation, and our Executive Directorsexecutive director (Mr. Peter Anastasiou resigned on 24 September 2021) received A$42,500.12,500. The manner in which the aggregate remuneration is apportioned among Non-Executive Directorsnon-executive directors is reviewed periodically. The Board is responsible for reviewing its own performance. Both Board and Board committee performance is monitored on an informal basis throughout the year with a formal review conducted during the financial year. No retirement benefits are payable other than statutory superannuation, if applicable.
Executive Director and Executive Officer Remuneration
Our remuneration policy is also designed to ensure that Executive Directorsexecutive directors are appropriately remunerated with respect to their relevant experience, individual performance, the performance of our company, industry norms/standards and the general pay environment as appropriate.
Our Non-Executive Directorsnon-executive directors are responsible for evaluating the performance of the Chief Executive Officer (CEO)(“CEO”) who in turn evaluates the performance of the other Senior Executives.senior executives. The evaluation process is intended to assess our business performance, whether long-term strategic objectives are being achieved, and the achievement of individual performance objectives.
The performance of theour CEO and Senior Executivessenior executives are monitored on an informal basis throughout the year and a formal evaluation is performed annually.
Fixed Remuneration.Executives’ fixed remuneration comprises salary and superannuation and is reviewed annually by the CEO, and in turn, the Remuneration Committee. This review takes into account the Executives’executives’ experience, performance in achieving agreed objectives and market factors as appropriate.
Variable Remuneration -– Short Term Incentive Scheme.Executives may be entitled to receive a combination of short term incentives (STI)(“STI”) and long term incentives (LTl)(“LTI”) as part of their total remuneration if they achieve certain performance indicators as set by the Board. These STI /LTI may be paid either by cash, or a combination of cash and the issue of equity in our company, at the determination of the Board and Remuneration Committee.
The Remuneration Committee approves the issueissuance of bonuses following the recommendations of the CEO in the annual review of the performance of the Executives,executives, and our company as a whole, against agreed Key Performance Indicators (KPIs)key performance indicators (“KPIs”).
Variable Remuneration - – Long Term Incentive Scheme.Scheme. Executives may also be provided with longer-term incentives through our Employee Share and OptionOmnibus Incentive Plan (ESOP)(“OIP”) that was approved by shareholders at the Annual General Meetingour annual general meeting held on November 13, 2014.December 15, 2021. The aimgoal of the ESOPOIP is to allow the Executivesexecutives to participate in, and benefit from, the growth of our company as a result of their efforts and to assist in motivating and retaining those key employees over the long term. Continued service is the condition attached to the vesting of the options. The Board at its discretion determines the total number of options granted to each Executive.executive.
Remuneration paid in Fiscal 20172021 and 2022
The following table sets forth all compensation we paid for the year ended June 30, 20172022 with respect to each of our executive officers and directors during the 20172022 fiscal yearyear:
| Cash | Non- | |||||||||||||||||||||||
| salary and | Cash | monetary | Super- | Shares/ | ||||||||||||||||||||
| fees | bonus | benefits | annuation | Options | Total | |||||||||||||||||||
| AUD$ | AUD$ | AUD$ | AUD$ | AUD$ | AUD$ | |||||||||||||||||||
| Directors | ||||||||||||||||||||||||
| Dr. Roger Aston | 64,375 | — | — | 6,116 | 212,400 | 282,891 | ||||||||||||||||||
| Mr. Daniel Pollock | 48,750 | — | — | 4,631 | 26,550 | 79,931 | ||||||||||||||||||
| Mr. Stephen Anastasiou | 42,500 | — | — | — | 26,550 | 69,050 | ||||||||||||||||||
| Mr. Peter Anastasiou | 42,500 | — | — | — | 26,550 | 69,050 | ||||||||||||||||||
| Prof. Ravi Savarirayan | 12,501 | — | — | — | — | 12,501 | ||||||||||||||||||
| Total | 210,626 | — | — | 10,747 | 292,050 | 513,423 | ||||||||||||||||||
| Other key management personnel | ||||||||||||||||||||||||
| Dr. Jerry Kanellos | 160,000 | — | — | 15,200 | 28,620 | 203,820 | ||||||||||||||||||
| Mr. Thomas Liquard | 311,040 | — | — | — | 33,000 | 344,040 | ||||||||||||||||||
| Total | 471,040 | — | — | 15,200 | 61,620 | 547,860 | ||||||||||||||||||
| Total | 681,666 | — | — | 25,947 | 353,670 | 1,061,283 | ||||||||||||||||||
| 2022 | Short-term benefits | Post- employment benefits | Long- term benefits | Share- based payments | ||||||||||||||||||||||||
| Cash salary and fees | Annual leave | Super- annuation | Long service leave | Shares1 | Options2 | Total | ||||||||||||||||||||||
| A$ | A$ | A$ | A$ | A$ | A$ | A$ | ||||||||||||||||||||||
| Non-executive directors | ||||||||||||||||||||||||||||
| Dr. Roger Aston | 96,250 | — | 9,625 | — | — | — | 105,875 | |||||||||||||||||||||
| Mr. Daniel Pollock3 | 86,250 | — | 8,625 | — | — | — | 94,875 | |||||||||||||||||||||
| Mr. Stephen Anastasiou | 65,000 | — | — | — | — | — | 65,000 | |||||||||||||||||||||
| Prof. Ravi Savarirayan | 65,001 | — | — | — | — | — | 65,001 | |||||||||||||||||||||
| Mr. Paul Brennan4 | 20,417 | — | 2,042 | — | — | — | 22,459 | |||||||||||||||||||||
| Executive director | ||||||||||||||||||||||||||||
| Mr. Peter Anastasiou5 | 12,500 | — | — | — | — | 12,500 | ||||||||||||||||||||||
| Other KMP | ||||||||||||||||||||||||||||
| Mr. Steven Lydeamore6 | 6,288 | 541 | 629 | 4 | — | 25,322 | 32,784 | |||||||||||||||||||||
| Dr. Jerry Kanellos7 | 260,000 | 24,426 | 23,568 | 15,164 | 39,960 | 29,608 | 392,726 | |||||||||||||||||||||
| Total KMP compensation | 611,706 | 24,967 | 44,489 | 15,168 | 39,960 | 54,930 | 791,220 | |||||||||||||||||||||
Notes
| 1. | 333,000 shares were granted under OIP to Dr. Jerry Kanellos on 26 October 2021 and valued at a market price of A$0.12 per share. |
| 2. | 500,000 options and 1,430,000 options were granted under OIP to Dr. Jerry Kanellos on 26 October 2021 and Mr. Steven Lydeamore on 27 June 2022, respectively. The options are valued using the Black-Scholes option pricing model at the fair value over the 3-year vesting period and share-based payment expenses in the current reporting period has been recognized accordingly. |
| 3. | In addition, during the fiscal year 2022 the group engaged Mr Daniel Pollock for legal services which amounted to $20,000. |
| 4. | Mr. Paul Brennan appointed on 16 March 2022. |
| 5. | Mr. Peter Anastasiou resigned on 24 September 2021. |
| 6. | Mr. Steven Lydeamore, Chief Executive Officer (appointed on 27 June 2022). |
| 7. | Dr. Jerry Kanellos, Chief Operating Officer (resigned as Chief Executive Officer on 27 June 2022). |
The following table sets forth all compensation we paid for the year ended June 30, 2021 with respect to each of our executive officers and directors during the 2021 fiscal year:
| 2021 | Short-term benefits | Post- employment benefits | Long- term benefits | Share- based payments | ||||||||||||||||||||||||||||||||
| Cash salary and fees | Cash bonus | Annual leave | Super- annuation | Long service leave | Other* | Shares1 | Options2 | Total | ||||||||||||||||||||||||||||
| A$ | A$ | A$ | A$ | A$ | A$ | A$ | A$ | A$ | ||||||||||||||||||||||||||||
| Non-executive directors | ||||||||||||||||||||||||||||||||||||
| Dr. Roger Aston3 | 35,000 | - | - | 3,325 | - | 178,500 | 37,837 | 394,020 | 648,682 | |||||||||||||||||||||||||||
| Mr. Daniel Pollock4 | 30,000 | - | - | 2,850 | - | 178,500 | 33,075 | 394,020 | 638,445 | |||||||||||||||||||||||||||
| Mr. Stephen Anastasiou5 | 25,000 | - | - | - | - | 178,500 | 25,000 | 394,020 | 622,520 | |||||||||||||||||||||||||||
| Prof. Ravi Savarirayan6 | 25,002 | - | - | - | - | 178,500 | 25,000 | 394,020 | 622,522 | |||||||||||||||||||||||||||
| Executive directors | ||||||||||||||||||||||||||||||||||||
| Mr. Peter Anastasiou7 | 25,000 | - | - | - | - | 857,138 | 25,000 | 394,020 | 1,301,158 | |||||||||||||||||||||||||||
| Other KMP | ||||||||||||||||||||||||||||||||||||
| Dr. Jerry Kanellos | 260,000 | 50,000 | 32,609 | 21,694 | 8,220 | - | - | - | 372,523 | |||||||||||||||||||||||||||
| Total KMP compensation | 400,002 | 50,000 | 32,609 | 27,869 | 8,220 | 1,571,138 | 145,912 | 1,970,100 | 4,205,850 | |||||||||||||||||||||||||||
Notes
| 1. | Due to the ongoing crisis of COVID-19, the groups directors decided to forgo cash payments of their director fees from 1 April 2020 to 31 December 2020 and instead receive shares of that value. At 30 June 2020, no shares have been issued to directors however the expense of the shares owed to them is $73,088. As at 30 June 2021, the expenses of have been reclassified from reserves to share capital and 2,737,500 shares with a total value of $219,000 have been issued to directors given the shareholders’ approval at the AGM held on 29 October 2020. |
| 2. | Given the shareholders’ approval at the AGM held on 29 October 2020, a total of 9,000,000 ESOP Options were issued to directors on 13 November 2020 and valued at $1,970,100 in total using the Black-Scholes option pricing model. |
Notes to Other*
| 3. | Dr. Roger Aston received $178,500 of consulting services in relation to research and development portfolio and clinical review. |
| 4. | Mr. Daniel Pollock received $178,500 of consulting services in relation to contracts and legal activities. |
| 5. | Mr. Stephen Anastasiou received $178,500 of consulting services in relation to strategic marketing consultancy and monitoring, strategic market analysis, planning and trend monitoring. |
| 6. | Prof. Ravi Savarirayan received $178,500 of consulting services in relation to scientific strategy and evaluation of current and future medical/scientific projects, patent lodging, and day to day operational management inputs/activities. |
| 7. | Mr. Peter Anastasiou resigned on 24 September 2021. During FY 2021, he received $857,138 of consulting fees for the development of the IMM-124E cover antibody research and patents, fees and bonuses for initiation, management of capital raise. |
Australian Disclosure Requirements
Relative proportions of fixed vs variable remuneration expense
The following table shows the relative proportions of remuneration that are linked to performance and those that are fixed, based on the amounts disclosed as statutory remuneration expense above:
| Name | Fixed remuneration | At risk - STI | At risk - LTI | |||||||||||||||||||||
| 2022 % | 2021 % | 2022 % | 2021 % | 2022 % | 2021% | |||||||||||||||||||
| Non-executive director | ||||||||||||||||||||||||
| Dr. Roger Aston | 100 | 33 | — | 9 | — | 58 | ||||||||||||||||||
| Mr. Daniel Pollock | 100 | 33 | — | 8 | — | 59 | ||||||||||||||||||
| Mr. Stephen Anastasiou | 100 | 33 | — | 6 | — | 61 | ||||||||||||||||||
| Prof. Ravi Savarirayan | 100 | 33 | — | 6 | — | 61 | ||||||||||||||||||
| Mr. Paul Brennan1 | 100 | — | — | — | — | — | ||||||||||||||||||
| Executive director | ||||||||||||||||||||||||
| Mr. Peter Anastasiou2 | 100 | 68 | — | 3 | — | 29 | ||||||||||||||||||
| Other KMP | ||||||||||||||||||||||||
| Mr. Steven Lydeamore3 | 23 | — | — | 77 | — | |||||||||||||||||||
| Dr. Jerry Kanellos4 | 79 | 98 | 10 | — | 11 | 2 | ||||||||||||||||||
| 1. | Mr. Paul Brennan appointed on 16 March 2022. |
| 2. | Mr. Peter Anastasiou resigned on 24 September 2021. |
| 3. | Mr. Steven Lydeamore, Chief Executive Officer (appointed on 27 June 2022). |
| 4. | Dr. Jerry Kanellos, Chief Operating Officer (resigned as Chief Executive Officer on 27 June 2022). |
Terms and conditions of the share-based payment arrangements
Options
The terms and conditions of each grant of options affecting remuneration in the current or a future reporting year are as follows:
| Grant date | Vesting and exercise date | Expiry date | Exercise price ($) | Value per option at grant date ($) | Vested (%) | |||||||||||
| 2020-10-29 | 2020-11-13 | 2024-04-14 | 0.12 | 0.2189 | 100 | % | ||||||||||
| 2021-10-26 | 2021-10-26 | 2025-10-25 | 0.25 | 0.0886 | 100 | % | ||||||||||
| 2021-10-26 | 2022-10-26 | 2025-10-25 | 0.25 | 0.0886 | — | |||||||||||
| 2021-10-26 | 2023-10-26 | 2025-10-25 | 0.25 | 0.0886 | — | |||||||||||
| 2022-06-27 | 2022-06-27 | 2026-06-27 | 0.12 | 0.0530 | 100 | % | ||||||||||
| 2022-06-27 | 2023-06-27 | 2026-06-27 | 0.12 | 0.0530 | — | |||||||||||
| 2022-06-27 | 2024-06-27 | 2026-06-27 | 0.12 | 0.0530 | — | |||||||||||
Reconciliation of options and ordinary shares held by KMP
Option holdings
| 2022 | Balance at start of the year1 | Granted as remuneration2 | Exercised | Other changes3 | Balance at end of the year4 | Vested and exercisable | ||||||||||||||||||
| Options | ||||||||||||||||||||||||
| Dr. Roger Aston | 1,800,000 | — | — | — | 1,800,000 | 1,800,000 | ||||||||||||||||||
| Mr. Daniel Pollock | 1,800,000 | — | — | — | 1,800,000 | 1,800,000 | ||||||||||||||||||
| Mr. Stephen Anastasiou | 3,108,280 | — | — | (1,308,280 | ) | 1,800,000 | 1,800,000 | |||||||||||||||||
| Prof. Ravi Savarirayan | 900,000 | — | — | — | 900,000 | 900,000 | ||||||||||||||||||
| Mr. Paul Brennan5 | — | — | — | — | — | — | ||||||||||||||||||
| Mr. Peter Anastasiou6 | 1,814,400 | — | — | (14,400 | ) | 1,800,000 | 1,800,000 | |||||||||||||||||
| Mr. Steven Lydeamore7 | — | — | — | — | — | — | ||||||||||||||||||
| Dr. Jerry Kanellos8 | 1,000,000 | 500,000 | — | (1,000,000 | ) | 500,000 | 165,000 | |||||||||||||||||
| 10,422,680 | 500,000 | — | (2,322,680 | ) | 8,600,000 | 8,265,000 | ||||||||||||||||||
Notes
| 1. | Balance may include shares held prior to individuals becoming KMP. For individuals who became KMP during the period, the balance is as at the date they became KMP. |
| 2. | No performance conditions were attached to the options granted and these vested on issue. This is in line with the aim of the ESOP plan to provide long-term incentives to remain with the company and long-term incentives to participate in, and benefit from the growth of the company. Vested options have a condition of continued service with the company. |
| 3. | Other changes incorporate changes resulting from the expiration/forfeiture of options. |
| 4. | For former KMP, the balance is as at the date they cease being KMP. |
| 5. | Mr. Paul Brennan appointed on 16 March 2022. There are 1,000,000 options granted to Mr. Brennan upon his appointment, subject to shareholders’ approval after the reporting period. |
| 6. | Mr. Peter Anastasiou resigned on 24 September 2021. |
| 7. | Mr. Steven Lydeamore, Chief Executive Officer (appointed on 27 June 2022). There are 1,430,000 options granted to Mr. Lydeamore on 27 June 2022 and subsequently issued after the reporting period, on 1 July 2022. |
| 8. | Dr. Jerry Kanellos, Chief Operating Officer (resigned as Chief Executive Officer on 27 June 2022). |
Share holdings
| 2022 | Balance at the start of the year1 | Granted as remuneration | Received on exercise of options | Other changes3 | Balance at the end of the year3 | |||||||||||||||
| Ordinary shares | ||||||||||||||||||||
| Dr. Roger Aston | 1,520,376 | — | — | — | 1,520,376 | |||||||||||||||
| Mr. Daniel Pollock | 768,030 | — | — | — | 768,030 | |||||||||||||||
| Mr. Stephen Anastasiou | 4,882,388 | — | — | — | 4,882,388 | |||||||||||||||
| Prof. Ravi Savarirayan | 877,840 | — | — | — | 877,840 | |||||||||||||||
| Mr. Paul Brennan4 | — | — | — | — | — | |||||||||||||||
| Mr. Peter Anastasiou5 | 12,247,019 | — | — | — | 12,247,019 | |||||||||||||||
| Mr. Steven Lydeamore6 | — | — | — | — | — | |||||||||||||||
| Dr. Jerry Kanellos7 | — | 333,000 | — | — | 333,000 | |||||||||||||||
| 20,295,653 | 333,000 | — | — | 20,628,653 | ||||||||||||||||
Notes
| 1. | Balance may include shares held prior to individuals becoming KMP. For individuals who became KMP during the year, the balance is as at the date they became KMP. |
| 2. | Other changes incorporate changes resulting from the acquisition or disposal of shares. |
| 3. | For former KMP, the balance is as at the date they cease being KMP. |
| 4. | Mr. Paul Brennan appointed on 16 March 2022. |
| 5. | Mr. Peter Anastasiou resigned on 24 September 2021. |
| 6. | Mr. Steven Lydeamore, Chief Executive Officer (appointed on 27 June 2022). |
| 7. | Dr. Jerry Kanellos, Chief Operating Officer (resigned as Chief Executive Officer on 27 June 2022). |
Other transactions with key management personnel
Mr. Stephen Anastasiou and Mr. Peter Anastasiou (a director resigned on 24 September 2021) are directors and majority shareholders of Wattle Laboratories Pty Ltd. Immuron Limited has rented an office suite from Wattle Laboratories Pty Ltd since 1 January 2016 under a three-year agreement, renewed for another three years on 1 January 2019 and an additional three years on 1 January 2022. The rental agreement is based on normal commercial terms and conditions.
Mr. Stephen Anastasiou and Mr. Peter Anastasiou (a director resigned on 24 September 2021) are directors and majority shareholders of Grandlodge Capital Pty Ltd (Grandlodge). An annual agreement commenced on 1 July 2020 and 2021. Grandlodge was contracted on commercial terms to provide warehousing, distribution and invoicing services for Immuron’s products for $70,000 and $77,000 per annum, respectively. The terms of the agreement were to have fees payable in cash. Furthermore, in fiscal 2022 an additional A$35,000 was recognized and paid in shares to Grandlodge as per the shareholders’ approval at the AGM held on December 15, 2021.
Aggregate amounts of each of the above types of other transactions with key management personnel of Immuron Limited:
| 2022 $ | 2021 $ | |||||||
| Amounts recognised as expense | ||||||||
| Rental of an office suite from Wattle Laboratories Pty Ltd | 42,364 | 40,607 | ||||||
| Services rendered by Grandlodge Capital Pty Ltd | 112,000 | 70,000 | ||||||
| 154,364 | 110,607 | |||||||
Voting of shareholders at last year’s annual general meeting
Immuron Limited received more than 75 percent of favorable votes on its remuneration report for the 2021 financial year. The company did not receive any specific feedback at the 2021 annual general meeting or throughout the year on its remuneration practices.
Employment Agreements with Executive Officers
We have contracts with all of our senior management and employees, and letters of appointment for each of our Directors.directors.
Thomas LiquardSteven Lydeamore
On August 24, 2016,June 27, 2022, we entered into an Executive Service Agreement with Thomas Liquard,Mr. Steven Lydeamore (the “Lydeamore Agreement”), pursuant to which Mr. Lydeamore is serving as our former Chief Executive Officer. The term ofPursuant to the agreement was for three years unless terminated earlierLydeamore Agreement, we will pay Mr. Lydeamore A$415,000 per annum. In addition to the base salary, contributions will be made to the superannuation fund in accordance with the agreement. We agreedminimum amount prescribed by relevant superannuation legislation which shall not be limited by any maximum superannuation contribution base. Mr. Lydeamore may be eligible to payparticipate in bonus plans, share plans or other incentive plans approved by the Board. There are 1,430,000 options granted to Mr. Liquard A$300,000 per year. We also paid A$15,000 towards Mr. Liquard’s health insurance. The agreement also provided for certain short-termLydeamore with a nil purchase price, and long-term incentive milestones. Under his agreement, either party was able to terminate the agreement without cause on six months’ written notice. Subject to the applicable rules and laws (including the rulesan exercise price of 145% of the ASX Limited)5 Day rolling VWAP on the day he starts June 27, 2022 (with a cashless exercise provision), we hadand an expiry date four years after grant date all in accordance with the right to pay six months base salary and superannuation in lieu of notice.Immuron Omnibus Incentive Plan (“OIP”).
Mr. Liquard resigned from our companyThe mentioned options have been subsequently issued after the reporting period on August 3, 2017, but continues to provide consulting services for a service period through the end of October 2017. For his consulting services, Mr. Liquard receives A$27,500 per month for the three-month consulting period. The consulting agreement may be terminated by us with one-day’s written notice, with any balance of fees remaining under the remainder of the agreement to be paid to Mr. Liquard within seven (7) days of termination. At the time of his resignation, Mr. Liquard had not met any of the short-term or long-term incentives of his Executive Services Agreement and accordingly no incentives have or will be issued.July 1, 2022.
Jerry Kanellos
On July 23, 2015, we entered into an Executive Service Agreement (the “Kanellos Agreement”) with Dr. Jerry Kanellos (the “Kanellos Agreement”), pursuant to which Dr. Kanellos is serving as our Chief Operating & Scientific Officer. Pursuant to the Kanellos Agreement, we will pay Dr. Kanellos A$160,000 per annum. AlthoughFollowing Dr. Kanellos’ appointment as Interim-Chief Executive Officer on August 3, 2017, we increased his base salary to A$210,000 per annum plus 9.5% Australia superannuation guarantee equating to a total remuneration package of A$229,950 per annum. On November 19, 2018, Dr. Jerry Kanellos resigned as Interim CEO and moved to the role of Chief Operating Officer on the same date with no change in remuneration. On March 25, 2020, Dr. Jerry Kanellos Agreement provides that our Board will consider a short and long term share and/or share option incentive package forwas appointed as CEO. Following Dr. Kanellos after twelve months of continuous employment, subjectKanellos’ appointment as CEO, we increased his base salary to any applicable shareholder approval. Our Board has approved the issuance of 200,000 optionsA$260,000 per annum plus Australian statutory superannuation guarantee. There were no changes to Dr. Kanellos under our existing ESOP. this compensation upon his resignation as CEO since June 27, 2022.
Our Board will consider a short and long term share and/or share option incentive package for Dr. Kanellos after twelve months of continuous employment, subject to any applicable shareholder approval. We or Dr. Kanellos may terminate the Kanellos Agreement without cause on thirty days’ written notice. Subject to applicable laws and rules, we may elect to pay Dr. Kanellos thirty days’ base salary in lieuinstead of providing notice. We may also terminate the Kanellos Agreement for Causecause (as defined in the Kanellos Agreement).
Following Dr. Kanellos’ promotion to Interim-Chief Executive Officer on 3 August 2017, we increased his base salary to A$210,000 per annum plus 9.5% Australia superannuation guarantee equating to a total remuneration package of A$229,950 per annum.
Dan Peres
On March 29, 2017, we re-entered into a Consultancy Agreement (the “Peres Agreement”) with Dan Peres. Pursuant to the terms of the Peres Agreement, we will provide the following Services: oversight of the clinical trial of IMM-124E-2001 for treatment of NASH; and active involvement in all our other activities related to pipeline products in the U.S. and elsewhere. Dr. Peres will introduce us to qualified personnel for the assistance in the delivery of the Services at our cost. Dr. Peres utilizes a clinical support person in Israel that we pay a monthly sum of approximately US$9,500. The term of Dr. Peres’ updated Agreement commenced on April 1, 2017 and will terminate on April 30, 2018. We agreed to pay Dr. Peres US$16,667 per month. As the 1,000,000 options which were issued to Dr. Peres under his original Consultancy Agreement expired on April 1, 2017, we agreed to issue Dr. Peres 1,000,000 replacement options exercisable at A$0.50 on or before October 1, 2018. Dr. Pere’s consultancy Agreement may be terminated in writing by either us or Dr. Peres at any time with three months’ notice.Omnibus Incentive Plan
Employee Share Option Plan
Under the term of the ESOPOIP the Board may offer options to key management staff and consultants and in special circumstances may provide financial assistance to an entitled option holder to assist in the exercise of the ESOPOIP options. The aggregate number of shares that may be issued upon the exercise of the ESOPOIP options, together with all other share purchase plans for eligible persons, may not at any time exceed 5% of the total number of our outstanding ordinary shares.
During the 2017 fiscal year the options were issued under the ESOP to the following Directors or Key Management Personnel as stock based compensation:
| Issue Date | Number of Options | Vesting Conditions | Expiry Date | Exercise Price AUD$ | ||||||||
| Prof. Ravi Savarirayan(i) | 22 June 2017 | 1,000,000 | Nil | 27 Nov 2019 | A$ | 0.50 | ||||||
| Dr. Dan Peres | 22 June 2017 | 1,000,000 | Nil | 1 Oct 2018 | A$ | 0.50 | ||||||
| Dr. Jerry Kanellos | 9 Dec 2016 | 200,000 | Nil | 27 Nov 2019 | A$ | 0.50 | ||||||
The terms and conditions of each grant of options affecting remuneration in the current or future reporting period are as follows:
| Issue Date | Number of Options | Vesting Conditions | Expiry Date | Exercise Price AUD$ | ||||||||
| 27 Nov 2015(ii) | 6,000,000 | (ii) | 27 Nov 2019 | A$ | 0.500 | |||||||
| 22 June 2017(i) | 1,000,000 | Nil | 27 Nov 2019 | A$ | 0.500 | |||||||
| 22 June 2017 | 1,000,000 | Nil | 1 Oct 2018 | A$ | 0.500 | |||||||
| 9 Dec 2016 | 200,000 | Nil | 27 Nov 2019 | A$ | 0.500 | |||||||
(i) On 22 June 2017, we issued Professor Ravi Savarirayan, 1,000,000 unlisted options exercisable at A$0.50 on or before 27 Nov 2019. These options are currently held in escrow and cannot be exercised until shareholder approval is granted.
(ii) The options with an issue date of 27 November 2015, entitle the holder to purchase our ordinary shares at an exercise price of A$0.50 per share. Options vest based on months of continuous services completed as per the following:
The assessed fair value of options granted to personnel at their grant date is allocated equally over the period from grant date to vesting date, and the amount for the 2017current financial year is included in the remuneration table as set out above. Fair values at grant date are determined using the Black-Scholes option pricing model that takes into account the exercise price, the term of the option, the impact of dilution, the share price at grant date and expected price volatility of the underlying share, the expected dividend yield and the risk-free interest rate for the term of the option. The expected price volatility is based on the historic volatility (based on the remaining life of the options), adjusted for any expected changes to future volatility due to publicly available information.
As atof June 30, June 20172022 the number of options over ordinary shares in our company held during the financial year by each Directordirector and other Key Management Personnelkey management personnel of our company, including their personally related parties, are set out below:below.
As of June 30, June 2017,2022 our directors and executive officers and directors as a group, then consisting of 9seven persons, held options under our ESOPOIP to purchase an aggregate of 8,200,0006,300,000 ordinary shares at an exercise price of A$0.50 per share. Of such options,0.12 expire on April 14, 2024.
(End of the Remuneration Report for Australian Disclosure Requirements)
Other Australian Disclosure Requirements
Shares under option
(a) Unissued ordinary shares
Unissued ordinary shares of Immuron Limited under option at the date of this report are as follows:
| Date options granted | Expiry date | Issue price of shares ($) | Number under option | |||||||
| 2018-03-15 | 2023-03-15 | 0.468 | 7,897,647 | |||||||
| 2018-03-15 | 2023-03-15 | 0.585 | 526,510 | |||||||
| 2019-05-23 (warrants) | 2024-05-23 | USD | 0.125 | 173,600 | ||||||
| 2019-07-16 (warrants) | 2024-07-16 | USD | 0.125 | 116,120 | ||||||
| 2020-10-29 | 2024-04-14 | 0.12 | 8,100,000 | |||||||
| 2020-07-24 (warrants) | 2025-07-21 | USD | 0.5859 | 2,560,000 | ||||||
| 2021-10-26 | 2025-10-26 | 0.25 | 500,000 | |||||||
| 2022-06-27 | 2026-06-27 | 0.12 | 1,430,000 | |||||||
| Total | 21,303,877 | |||||||||
No option holder has any right under the options to purchase 1,000,000participate in any other share issue of the company or any other entity.
(b) Shares issued on the exercise of options
No ordinary shares expireof Immuron Limited were issued during the year ended 30 June 2022 on 1 October 2018the exercise of options granted.
Insurance of officers and optionsindemnities
(a) Insurance of officers
During the financial year, Immuron Limited paid a premium of $285,000 to purchase 7,200,000 ordinary shares (including 1,000,000 options granted subjectinsure the directors and secretary of the company. The liabilities insured are legal costs that may be incurred in defending civil or criminal proceedings that may be brought against the officers in their capacity as officers of entities in the group, and any other payments arising from liabilities incurred by the officers in connection with such proceedings. This does not include such liabilities that arise from conduct involving a wilful breach of duty by the officers or the improper use by the officers of their position or of information to shareholder approval) expiregain advantage for themselves or someone else or to cause detriment to the company. It is not possible to apportion the premium between amounts relating to the insurance against legal costs and those relating to other liabilities.
(b) Indemnity of auditors
Immuron Limited has not, during or since the financial year, indemnified or agreed to indemnify the auditor of the company or any related entity against a liability incurred by the auditor. During the financial year, the company has not paid a premium in respect of a contract to insure the auditor of the company or any related entity.
Proceedings on 27 November 2019.behalf of the company
No person has applied to the Court under section 237 of the Corporations Act 2001 for leave to bring proceedings on behalf of the company, or to intervene in any proceedings to which the company is a party, for the purpose of taking responsibility on behalf of the company for all or part of those proceedings.
No proceedings have been brought or intervened in on behalf of the company with leave of the Court under section 237 of the Corporations Act 2001.
Non-audit services
During the year ended June 30, 2022, the group did not engage the external auditor to provide non-audit services.
Auditor’s Independence Declaration
There were no former partners or directors of Grant Thornton Audit Pty Ltd, the Company’s auditor, who were or were at any time during the financial year an officer of the Company.
A copy of the auditor’s independence declaration under Section 307C of the Corporations Act in relation to the audit for the year ended June 30, 2022 is included in Exhibit 23.2 of this annual report on Form 20-F.
Rounding of amounts
The company is of a kind referred to in ASIC Legislative Instrument 2016/191, relating to the ‘rounding off’ of amounts in the directors’ report. Amounts in the directors’ report have been rounded off in accordance with the instrument to the nearest dollar.
This report is made in accordance with a resolution of directors.
Corporate governance statement
In accordance with ASX listing Rule 4.10.3, the Group’s 2022 Corporate Governance Statements can be found on its website at www.immuron.com.au.
Signed in accordance with a resolution of the Directors made pursuant to s298(2) of the Corporations Act 2001.
| /s/ Roger Aston | |
| Chairman | |
| Melbourne | |
September 9, 2022 |
Our
C. Board Practices
As of June 30, 2022, our board of directors currently consistsconsisted of fourfive members. Directors are elected at each annual general meeting of our shareholders and serve until their successors are elected or appointed unless their office is earlier vacated. We believe that each of our directors has relevant industry experience. The membership of our board of directors is directed by the following requirements:
| ● | our Constitution specifies that there must be a minimum of three directors and a maximum of |
| ● | as set forth in our Board Charter, the membership of the board of directors should consist of a majority of independent directors who satisfy the criteria recommended by the |
| ● | the Chairman of our Board should be an independent director who satisfies the criteria for independence recommended by the ASX Corporate Governance Principles and Recommendations; and |
| ● | our board of directors should, collectively, have the appropriate level of personal qualities, skills, experience, and time commitment to properly fulfill its responsibilities or have ready access to such skills where they are not available. |
Our board of directors has delegated responsibility for the conduct of our businesses to the Chief Executive Officer, but remains responsible for overseeing the performance of management. Our board of directors’directors has established delegated limits of authority, which define the matters that are delegated to management and those that require board of directors’ approval. Under the Corporations Act, at least two of our directors must be resident Australians. None of our directors have any service contracts with us that provide for benefits upon termination of employment.
We have not entered into any service contracts with our directors providing for benefits upon termination of employment.
The Board meets to discuss business regularly throughout the year, with additional meetings being held when circumstances warrant. Included in the table below are details of the meetings of the Board and the sub-committees of the Board that were held during the 2022 financial year.
| Directors’ meetings | Audit Committee meetings | Remuneration Committee meetings | ||||||||||||||||||||||
| Attended | Eligible | Attended | Eligible | Attended | Eligible | |||||||||||||||||||
| Dr. Roger Aston | 8 | 8 | 2 | 2 | 1 | 1 | ||||||||||||||||||
| Mr. Daniel Pollock | 8 | 8 | 2 | 2 | 1 | 1 | ||||||||||||||||||
| Mr. Stephen Anastasiou | 8 | 8 | - | - | 1 | 1 | ||||||||||||||||||
| Prof. Ravi Savarirayan | 8 | 8 | - | - | 1 | 1 | ||||||||||||||||||
| Mr. Paul Brennan1 | 1 | 1 | - | - | - | - | ||||||||||||||||||
| Mr. Peter Anastasiou2 | 1 | 1 | - | - | - | - | ||||||||||||||||||
| 1. | Mr. Paul Brennan appointed on 16 March 2022. |
| 2. | Mr. Peter Anastasiou resigned on 24 September 2021. |
Committees
To assist our board of directors with the effective discharge of its duties, it has established a Remuneration and Nomination Committee and an Audit and Risk Committee, which committees operate under a specific charter approved by our board of directors.
Remuneration and Nomination Committee
The members of our Remuneration and Nomination Committee are Roger Aston and Daniel Pollock, each of whom our board of directors has determined meets the criteria for independence under NASDAQ Listing Rule 5605(a)(2). Dr. Aston acts as chairman of the committee. The committee’s role involves:
| ● | identifying, evaluating and recommending qualified nominees to serve on our board of directors; |
| ● | evaluating, adopting and administering our compensation plans and similar programs advisable for us, as well as modifying or terminating existing plans and programs; |
| ● | establishing policies with respect to equity compensation arrangements; and |
| ● | overseeing, reviewing and reporting on various remuneration matters to our board of directors. |
Audit and Risk Committee
The members of our Audit and Risk Committee are Daniel Pollock and Roger Aston, each of whom our board of directors has determined meets the criteria for independence of audit committee members set forth in Rule 10A-3(b)(1) under the Securities Exchange Act of 1934, as amended, or the Exchange Act, and the applicable rules of the NASDAQ Capital Market. Each member of our audit committee meets the financial literacy requirements of the listing standards of the NASDAQ Capital Market. Daniel Pollock acts as the chairman of the audit committee. The principal duties and responsibilities of our audit committee include, among other things:
| ● | overseeing and reporting on various auditing and accounting matters to our board of directors, including the selection of our independent accountants, the scope of our annual audits, fees to be paid to the independent accountants, the performance of our independent accountants and our accounting practices; |
| ● | overseeing and reporting on various risk management matters to our board of directors; |
| ● | considering and approving or disapproving all related-party transactions; |
| ● | reviewing our annual and semi-annual financial statements and reports and discussing the statements and reports with our independent registered public accounting firm and management; |
| ● | reviewing and pre-approving the engagement of our independent registered public accounting firm to perform audit services and any permissible non-audit services; |
| ● | evaluating the performance of our independent registered public accounting firm and deciding whether to retain their services; and |
| ● | establishing procedures for the receipt, retention and treatment of complaints received by us regarding financial controls, accounting or auditing matters. |
Code of Conduct
We have established a Corporate Governance Statement, which includes a code of conduct. Our Corporate Governance Statement, sets out the standards of behavior that apply to every aspect of our dealings and relationships, both within and outside our company. The following standards of behavior apply to all directors, executive officers and employees of our company:
The Code of Conduct is available on our website at Immuron.com.
D. Employees
At
As of June 30, 2017,2022, we had 7five full-time employees. Of these full-time employees, 3two are engaged in researchour Global Manufacturing Quality Director and development activities, 2 are employed in manufacturingour Research and quality control activities, 1Development Manager, one is employed in US sales.U.S. sales, one is our COO and 1 was engaged as theone is our CEO.
Our employees are located in Australia Israel and the U.S.
At June 30, 2016, we had 8 full-time employees. Of these full-time employees, 4 were engaged in research and development activities, 3 were employed in manufacturing, quality control and general activities, 1 was employed in US sales. Our employees were located in Australia, Israel and the U.S.E. Share Ownership
At June 30, 2015, we had 8 full-time employees. Of these full-time employees, 4 were engaged in research and development activities, 4 were employed in manufacturing, quality control and general activities, 1 was employed in US sales. Our employees were located in Australia, Israel and the U.S.
Beneficial Ownership of Executive Officers and Directors
The following table sets forth certain information as of 31 October 2017September 2, 2022 regarding the beneficial ownership of our ordinary shares by each of our directors and executive officers and by all of our directors and executive officers as a group.
Unless otherwise indicated, to our knowledge each shareholder possesses sole voting and investment power over the ordinary shares listed subject to community property laws, where applicable. None of our shareholders have different voting rights from other shareholders.
| Name | Number of Ordinary Shares Beneficially Owned(1) | Percentage of Ownership(2) | ||||||
| Dr. Roger Aston(3) | 4,034,066 | 3.02 | % | |||||
| Mr. Peter Anastasiou(4) | 20,682,053 | 15.25 | % | |||||
| Mr. Daniel Pollock(5) | 1,509,600 | 1.15 | % | |||||
| Mr. Stephen Anastasiou(6) | 8,623,154 | 6.45 | % | |||||
| Prof. Ravi Savarirayan | — | — | ||||||
| Dr. Jerry Kanellos (PhD)(7) | 200,000 | * | ||||||
| Dr. Dan Peres (MD)(8) | 1,079,899 | * | ||||||
| Mr. Phillip Hains(9) | 1,242,336 | * | ||||||
| Mr. Peter Vaughan | — | — | ||||||
| Officers and directors as a group (9 persons)(10) | 37,371,108 | 25.79 | % | |||||
| Name | Number of Ordinary Shares Beneficially Owned (1) | Percentage of Ownership (2) | ||||||
| Dr. Roger Aston(3) | 3,320,376 | 1.45 | % | |||||
| Mr. Daniel Pollock(4) | 2,568,030 | 1.12 | % | |||||
| Mr. Stephen Anastasiou(5) | 6,682,388 | 2.91 | % | |||||
| Prof. Ravi Savarirayan(6) | 1,777,840 | * | ||||||
| Mr. Paul Brennan | — | * | ||||||
| Mr. Steven Lydeamore(7) | 1,430,000 | * | ||||||
| Dr. Jerry Kanellos(8) | 833,000 | * | ||||||
| Mr. Phillip Hains | 816,804 | * | ||||||
| Officers and directors as a group (8 persons)(9) | 17,428,438 | 7.38 | % | |||||
| * | Less than 1% |
| (1) | Beneficial ownership is determined in accordance with the rules of the SEC and generally includes voting or investment power with respect to securities. Ordinary shares relating to options currently exercisable or exercisable within 60 days of the date of this table are deemed outstanding for computing the percentage of the person holding such securities but are not deemed outstanding for computing the percentage of any other person. Except as indicated by footnote, and subject to community property laws where applicable, the persons named in the table above have sole voting and investment power with respect to all shares shown as beneficially owned by them. Except as set forth herein, the address for each of the persons listed in the table above is Immuron Limited, Level 3, 62 Lygon Street, Carlton South, Victoria, Australia 3053. |
| (2) | The percentages shown are based on |
| (3) | Includes |
| (4) | Includes |
| (5) | Includes |
| (6) | Includes | |
| (7) | Includes warrants to purchase 1,430,000 ordinary shares. | |
| (8) | Includes warrants to purchase 500,000 ordinary shares. |
| (9) | Includes options to purchase |
ITEM 7. MAJOR SHAREHOLDERS AND RELATED PARTY TRANSACTIONS
A. Major Shareholders
The address for each of the persons listed in the table above is Immuron Limited, Level 3, 62 Lygon Street, Carlton South, Victoria, Australia 3053.
The following table sets forth as of October 31, 2017September 2, 2022 certain information regarding the beneficial ownership by all shareholders known to us to own beneficially 5.0%5% or more of our ordinary shares:
| Ordinary Shares Beneficially Owned(1) | ||||||||
| Shareholder | Number | Percent(2) | ||||||
| Grandlodge Capital Pty Ltd(3) | 20,682,053 | 15.25 | % | |||||
| Authentics Australia Pty Ltd(4) | 12,249,999 | 9.14 | % | |||||
| Ordinary Shares Beneficially Owned (1) | ||||||||
| Shareholder | Number | Percent (2) | ||||||
| BNYMC Group | 79,882,600 | 35.07 | % | |||||
| Per the most recent substantial shareholder notices released to the ASX. |
| (1) | Beneficial ownership is determined in accordance with the rules of the SEC and generally includes voting or investment power with respect to securities. Ordinary shares relating to options currently exercisable or exercisable within 60 days of the date of this table are deemed outstanding for computing the percentage of the person holding such securities but are not deemed outstanding for computing the percentage of any other person. Except as indicated by footnote, and subject to community property laws where applicable, the persons named in the table above have sole voting and investment power with respect to all shares shown as beneficially owned by them. |
| (2) | The percentages shown are based on |
Significant Changes in the Ownership of Major Shareholders
Previous substantial shareholders Inverary Pty Ltd and Retzos Pty Ltd ceased to be major shareholders following the issuance of securities pursuant to our NASDAQ listing on 9 June 2017 as their existing shareholdings were diluted below 5% ownership following our initial public offeringThere have been no significant changes in the U.S.ownership of major shareholders.
Major Shareholders Voting Rights
A major shareholder would notAll of our shareholders, including the shareholders listed below, have differentthe same voting rights.
rights attached to their ordinary shares.
Record Holders
As at October 31, 2017of September 2, 2022, there were 1,5812,693 Immuron shareholders holding 130,440,462227,798,346 fully paid ordinary ASX shares. These numbers are not representative of the number of beneficial holders of our shares nor are they representative of where such beneficial holders reside, since many of these ordinary shares were held of record by brokers or other nominees. The majority of trading by our U.S. investors is done by means of ADS that are held onof record by HSBC Nominees Ltd., which held 17,999,749 (13.80%79,677,424 (34.98%) of our ordinary shares as of such date.
B. Related Party Transactions
Grandlodge Capital Pty Ltd (Grandlodge) is an entity part-owned and operated by Immuron Directors Peter andour non-executive director Mr. Stephen Anastasiou. Mr. Peter Anastasiou (a director resigned on 24 September 2021) and Mr. David Plush isare also an ownerowners of Grandlodge, and its associated entities.
On December 1, 2015,
Commenced on June 6, 2016 and May 9, 2017, we executed short-term funding agreements with Grandlodge for a principal amount of A$1,000,000 (interest rate of 13%), A$750,000 (interest rate of 15%) and A$500,000 (interest rate of 15%), respectively. The short-term funding was a cash advance against the anticipated refund receivable from the Australian Taxation Office under the Research and Development Income Tax Concession Incentive for our eligible R&D expenditure incurred for the financial years of 2015, 2016 and 2017. The loans from December 2015, June 2016 and May 2017, plus applicable fees and interest, were repaid to Grandlodge on February 10, 2016, December 2, 2016 and June 23, 2017, respectively. Interest expense was approximately A$57,000 and A$31,000 for the years ended June 30, 2017 and 2016, respectively. In addition, the Company incurred approximately A$35,000 of loan fees for the year ended June 30, 2016.
Grandlodge, and its associated entities, are marketing, warehousing and distribution logistics companies. Commencing on 1, June 2013, Grandlodge was verbally contracted terms to provideprovides warehousing, distribution and invoicing services for our products for A$70,000 per year. TheseDuring the 2020 financial year, the fees will be payable in new fully paidof A$70,000 equivalent were repaid by issuance of 437,500 ordinary shares based on a price of A$0.16 per share representing the share price of our companyordinary shares at the commencement date of an oral agreement between us and Grandlodge. During the 2019 financial year, the fees of A$70,000 equivalent were repaid by issuance of 437,500 ordinary shares based on a price of A$0.16 per share representing the share price of our ordinary shares at the commencement date of an oral agreement between us and Grandlodge. During the 2018 financial year, the fees of A$140,000 equivalent were repaid by issuance of 875,000 ordinary shares based on a set price of A$0.16 per share representing the share price of our ordinary shares at the commencement date of the verbal agreement.
an oral agreement between us and Grandlodge. The 875,000 shares to be issued to Grandlodge or its associated entities,were in relation to the 2017 and 2018 financial years.
Fair value of equity instruments: Shares issued to Grandlodge Pty Ltd for services. Commencing 1 June 2013, Immuron Limited contracted Grandlodge on normal commercial terms and conditions to provide warehousing, distribution, and invoicing services for Immuron’s products for A$70,000 per annum. The terms of the agreement was to have fees payable in new fully paid ordinary shares in Immuron Limited as compensationa set price of A$0.16 per share. The fair value of the equity instrument has been identified as not having been previously assessed and accounted for in lieuaccordance with IFRS 2 Share Based Payments. Management has undertaken an assessment of cash paymentthe impact of this and concluded this to be an immaterial error. This has been corrected in the prior year by restating the prior period financial statements presented and the related notes included herein to present the fair value of equity instruments issued. The immaterial error to record the fair value of the equity instruments issued for the years 30 June 2014 to 30 June 2017 resulted in an increase of A$297,204 in share capital and a corresponding increase in accumulated losses. The impact of the 2014-2017 revision has been also reflected in the 30 June 2018 and 30 June 2019 years presented. General and administrative expenses have been revised to increase by A$57,653 and A$23,678 for the fair value of the equity instruments issued in 2018 and 2019 respectively, with a corresponding increase in share capital for the same amount.
An annual agreement commenced on 1 July 2020 and 2021. Grandlodge was contracted on commercial terms to provide warehousing, distribution and invoicing services rendered under this verbalfor Immuron’s products for A$70,000 and A$77,000 per annum, respectively. The terms of the agreement were subject to have fees payable in cash. Furthermore, in fiscal 2022 an additional A$35,000 was paid in shares to Grandlodge as per the shareholders' approval of our shareholders at Company shareholder meetingsthe AGM held over the past 18 months.on 15 December 2021.
Grandlodge will also beis reimbursed in cash for all reasonable costs and expenses incurred in accordance with their scope of works under the verbaloral agreement, unless both partiesGrandlodge and we agree to an alternative method of payment. The verbaloral agreement is cancellablemay be terminated by either party upon providing the other party with 30 days written notice of the termination of the agreement. During the fiscal years ended June 30, 2015, 2016 and 2017, we paid A$11,667, A$87,500 and A$Nil for such services respectively via the issues of new shares in accordance with the agreement.
Commencing on 1Effective January 2016, we executed a Lease Agreement with Wattle Laboratories Pty Ltd, (“Wattle”), an entity part-owned and operated by Peter andour non-executive director, Mr. Stephen Anastasiou, whereby we will lease part of their Blackburn office facilities for our operations at a rental rate of A$38,940 per year, payable in monthly instalments.installments. The rental agreement is subject to annual rental increases, and effective 1 January 2017, the annual rent was increased to A$39,525. The lease is for a three (3) yearthree-year term with an additional 3 yearthree-year option period. The lease is cancellablemay be terminated by either party upon 6 monthssix months’ written notice of termination of the agreement.notice. During the fiscal years ended June 30, 2015, 20162018, 2019 and 2017,2020, we paid Wattle A$Nil,30,019, A$19,47053,958 and A$35,79241,369 (excluding GST)Goods and Services Tax), respectively. The lease was renewed, commencing January 1, 2019 for three years. During the fiscal years ended June 30, 2021 and 2022, we paid Wattle A$40,607 and A$42,364 (excluding Goods and Services Tax), respectively.
Grandlodge purchased US$1,500,000 on behalfDuring the fiscal year 2022, the group engaged a non-executive director, Mr Daniel Pollock, for legal services which amounted to $20,000.
C. Interests of our company at the cost of A$1,968,762 on 25 August 2016Experts and on the same day we paid Grandlodge A$1,968,762 to settle this transaction. On 12 September, 2016 Grandlodge returned the US$1,500,000 they purchased on our behalf to us. Grandlodge received no financial gains or benefits for this transaction.Counsel
As at 30 June 2016, we committed to issue 18,045,512 ordinary shares in relation to the $4,511,378 received in a capital raising transaction. These shares were subsequently issued to respective holders on 7 July 2016. Of such shares, 2,418,129 shares and options were issued to Grandlodge on the same terms and conditions as all other subscribers.Not applicable.
ITEM 8. FINANCIAL INFORMATION
Grandlodge participated in our NASDAQ IPO
A. Consolidated Statements and acquired 32,707 ADSs and 32,707 Warrants.Other Financial Information
Not applicable.
See our consolidated financial statements, including the notes thereto, included in Item 18.
Legal Proceedings
We are not involved in any legal proceedings nor are we subject to any threatened litigation that is material to our business or financial condition.
Dividend Distribution Policy
We have never paid cash dividends to our shareholders. We intend to retain future earnings for use in our business and do not anticipate paying cash dividends on our ordinary shares in the foreseeable future. Any future dividend policy will be determined by the Board of Directors and will be based upon various factors, including our results of operations, financial condition, current and anticipated cash needs, future prospects, contractual restrictions and other factors as the Board of Directors may deem relevant.
B. Significant Changes
There have been no significant changes in the operation or financial condition of our company since June 30, 2017.
2022.
ITEM 9. THE OFFER AND LISTING
A. Offer and Listing Details
Australian Securities Exchange
Our ordinary shares have traded on the ASX since our initial public offering. The following table sets forth, forApril 30, 1999 under the periods indicated, the high and low market quotations for our ordinary shares, as quoted on the ASX.symbol IMC.
| Per Ordinary Share (A$) | |||||||||
| High | Low | ||||||||
| Fiscal Year Ended June 30, | |||||||||
| 2013 | 0.1586 | 0.1586 | |||||||
| 2014 | 0.1982 | 0.1982 | |||||||
| 2015 | 0.2280 | 0.2280 | |||||||
| 2016 | 0.2550 | 0.2500 | |||||||
| 2017 | 0.2800 | 0.2700 | |||||||
| Fiscal Year Ended June 30, 2015: | ||||||||
| First Quarter | 0.3172 | 0.3172 | ||||||
| Second Quarter | 0.1735 | 0.1735 | ||||||
| Third Quarter | 0.1586 | 0.1586 | ||||||
| Fourth Quarter | 0.2280 | 0.2280 | ||||||
| Fiscal Year Ended June 30, 2016 | ||||||||
| First Quarter | 0.4460 | 0.4460 | ||||||
| Second Quarter | 0.4856 | 0.4856 | ||||||
| Third Quarter | 0.3965 | 0.3965 | ||||||
| Fourth Quarter | 0.2550 | 0.2500 | ||||||
| Fiscal Year Ended June 30, 2017 | ||||||||
| First Quarter | 0.2600 | 0.2450 | ||||||
| Second Quarter | 0.2700 | 0.2700 | ||||||
| Third Quarter | 0.4350 | 0.3800 | ||||||
| Fourth Quarter | 0.2800 | 0.2700 | ||||||
| Month Ended: | |||||||||
| May 2017 | 0.5000 | 0.5000 | |||||||
| June 2017 | 0.2800 | 0.2700 | |||||||
| July 2017 | 0.2050 | 0.1850 | |||||||
| August 2017 | 0.2000 | 0.1900 | |||||||
| September 2017 | 0.1900 | 0.1700 | |||||||
| October 2017 | 0.1700 | 0.1400 | |||||||
On October 31, 2017 the closing price of our ordinary shares on the ASX was A$0.17.
NASDAQ Capital Market
Since June 13, 2017, OurADSs and Warrants arehave been listed on theThe NASDAQ Capital Market under the symbol “IMRN” and “IMRNW”, respectively.respectively, since June 13, 2017. The following table sets forth, for the periods indicated, the high askWarrants expired in June 2022 and low bid priceswere delisted June 10, 2022.
B. Plan of our ADSs on the NASDAQ Capital Market as adjusted to give effect to the reverse ordinary share to ADS ratio implemented on March 24, 2016.
| Per ADS (U.S. $) | ||||||||
| High | Low | |||||||
| Fiscal Year Ended June 30, | ||||||||
| 2017 (From June 13, 2017) | 10.00 | 7.66 | ||||||
Month Ended: | ||||||||
| June 2017 | 10.00 | 7.66 | ||||||
| July 2017 | 9.20 | 5.47 | ||||||
| August 2017 | 6.50 | 4.47 | ||||||
| September 2017 | 6.50 | 5.00 | ||||||
| October 2017 | 5.78 | 4.63 | ||||||
On October 31, 2017 the closing price of our ADSs on the NASDAQ Capital Market was US$5.23.
| Per Warrant (U.S. $) | ||||||||
| High | Low | |||||||
| Fiscal Year Ended June 30, | ||||||||
| 2017 (From June 13, 2017) | 2.70 | 1.45 | ||||||
| Month Ended: | ||||||||
| June 2017 | 2.70 | 1.45 | ||||||
| July 2017 | 1.94 | 1.05 | ||||||
| August 2017 | 1.29 | 0.56 | ||||||
| September 2017 | 1.10 | 0.56 | ||||||
| October 2017 | 1.47 | 0.90 | ||||||
On October 31, 2017 the closing price of our Warrants on the NASDAQ Capital Market was US$1.40.
Distribution
Not applicable.
C. Markets
The principal listing of our ordinary shares is on the ASX, and since June 9, 2017, our ADSs and Warrantswarrants have traded on the NasdaqThe NASDAQ Capital Market. The Warrants expired in June 2022 and were delisted June 10, 2022.
D. Selling Shareholders
Not applicable.
E. Dilution
Not applicable.
F. Expenses of the Issue
Not applicable.
ITEM 10. ADDITIONAL INFORMATION
A. Share Capital
Not applicable.
B. Memorandum and Articles of Association
Not applicable.
Not applicable.
Not applicable.
Our Constitution
Our Constitution is similar in nature to the bylaws of a U.S. corporation. It does not provide for or prescribe any specific objectives or purposes of our company. Our Constitution is subject to the terms of the ASX Listing Rules and the Corporations Act. It may be amended or repealed and replaced by special resolution of shareholders, which is a resolution passed by at least 75% of the votes cast by shareholders entitled to vote on the resolution.
Under Australian law, a company has the legal capacity and powers of an individual both within and outside Australia. The material provisions of our Constitution are summarized below. This summary is not intended to be complete or to constitute a definitive statement of the rights and liabilities of our shareholders. Our Constitution is filed as an exhibit to the registration statement, of which this Annual Report forms a part.annual report.
Interested Directors
A director may not vote in respect of any contract or arrangement in which the director has, directly or indirectly, any material interest according to our Constitution. Such director must not be counted in a quorum, must not vote on the matter and must not be present at the meeting while the matter is being considered. However, that director may execute or otherwise act in respect of that contract or arrangement notwithstanding any material personal interest.
Unless a relevant exception applies, the Corporations Act requires our directors to provide disclosure of certain interests or conflicts of interests and prohibits directors from voting on matters in which they have a material personal interest and from being present at the meeting while the matter is being considered. In addition, the Corporations Act and the ASX Listing Rules require shareholder approval of any provision of related party benefits to our directors.
Borrowing Powers Exercisable by Directors
Pursuant to our Constitution, the management and control of our business affairs are vested in our board of directors. Our board of directors has the power to raise or borrow money, and charge any of our property or business or any uncalled capital, and may issue debentures or give any other security for any of our debts, liabilities or obligations or of any other person, in each case, in the manner and on terms it deems fit.
Retirement of Directors
Pursuant to our Constitution and the ASX Listing Rules, there must be an election of Directorsdirectors at each annual general meeting. The directors, other than the managing director, who are to stand for election at each annual general meeting are: (i) any Directordirector required to retire after a period of 3three years in office, (ii) any Directordirector appointed by the other Directorsdirectors in the year preceding the annual general meeting, (iii) any new directors, or (iv) if no person is standing for election for the aforementioned reasons then the director longest in office since last being elected. A director, other than the director who is the Chief Executive Officer, must retire from office at the conclusion of the third annual general meeting after which the director was elected. Retired directors are eligible for a re-election to the board of directors unless disqualified from acting as a director under the Corporations Act or our Constitution.
Rights and Restrictions on Classes of Shares
The rights attaching to our ordinary shares are detailed in our Constitution. Our Constitution provides that our directors may issue shares with preferred, deferred or other special rights, whether in relation to dividends, voting, return of share capital or otherwise as our board of directors may determine. Subject to any approval which is required from our shareholders under the Corporations Act and the ASX Listing Rules (see “—Exemptions from Certain NASDAQ Corporate Governance Rules” and “—Change of Control”), any rights and restrictions attached to a class of shares, we may issue further shares on such terms and conditions as our board of directors resolve. Currently, our outstanding share capital consists of only one class of ordinary shares.
Dividend Rights
Our board of directors may from time to time determine to pay dividends to shareholders. All dividends unclaimed for one year after having been declared may be invested or otherwise made use of by our board of directors for our benefit until claimed or otherwise disposed of in accordance with our Constitution.
Voting Rights
Under our Constitution, and subject to any voting exclusions imposed under the ASX Listing Rules (which typically exclude parties from voting on resolutions in which they have an interest), the rights and restrictions attaching to a class of shares, each shareholder has one vote on a show of hands at a meeting of the shareholders unless a poll is demanded under the Constitution or the Corporations Act. On a poll vote, each shareholder shall have one vote for each fully paid share and a fractional vote for each share held by that shareholder that is not fully paid, such fraction being equivalent to the proportion of the amount that has been paid to such date on that share. Shareholders may vote in person or by proxy, attorney or representative. Under Australian law, shareholders of a public company are not permitted to approve corporate matters by written consent. Our Constitution does not provide for cumulative voting.
Note that ADS holders may not directly vote at a meeting of the shareholders but may instruct the depositary to vote the number of deposited ordinary shares their ADSs represent.
Right to Share in Our Profits
Pursuant to our Constitution, our shareholders are entitled to participate in our profits only by payment of dividends. Our board of directors may from time to time determine to pay dividends to the shareholders; however, no dividend is payable except in accordance with the thresholds set out in the Corporations Act.
Rights to Share in the Surplus in the Event of Liquidation
Our Constitution provides for the right of shareholders to participate in a surplus in the event of our liquidation, subject to the rights attaching to a class of shares.
No Redemption Provision for Ordinary Shares
There are no redemption provisions in our Constitution in relation to ordinary shares. Under our Constitution, any preference shares may be issued on the terms that they are, or may at our option be, liable to be redeemed.
Variation or Cancellation of Share Rights
Subject to the terms of issue of shares of that class, the rights attached to shares in a class of shares may only be varied or cancelled by a special resolution of our company together with either:
| ● | a special resolution passed at a separate general meeting of members holding shares in the class; or |
| ● | ||
| the written consent of members with at least 75% of the shares in the class. |
Directors May Make Calls
Our Constitution provides that subject to the terms on which the shares have been issued directors may make calls on a shareholder for amounts unpaid on shares held by that shareholder, other than monies payable at fixed times under the conditions of allotment. Shares represented by the ADSs are fully paid and are not be subject to calls by directors.
General Meetings of Shareholders
General meetings of shareholders may be called by our board of directors. Except as permitted under the Corporations Act, shareholders may not convene a meeting. The Corporations Act requires the directors to call and arrange to hold a general meeting on the request of shareholders with at least 5% of the votes that may be cast at a general meeting or at least 100 shareholders who are entitled to vote at the general meeting. Notice of the proposed meeting of our shareholders is required at least 28 clear days prior to such meeting under the Corporations Act.
Foreign Ownership Regulation
There are no limitations on the rights to own securities imposed by our Constitution. However, acquisitions and proposed acquisitions of securities in Australian companies may be subject to review and approval by the Australian Federal Treasurer under the Foreign Acquisitions and Takeovers Act 1975, or the FATA, which generally applies to acquisitions or proposed acquisitions:
| ● | by a foreign person (as defined in the FATA) or associated foreign persons that would result in such persons having an interest in 20% or more of the issued shares of, or control of 20% or more of the voting power in, an Australian company; and |
| ● | by non-associated foreign persons that would result in such foreign person having an interest in 40% or more of the issued shares of, or control of 40% or more of the voting power in, an Australian company, where the Australian company is valued above the monetary threshold prescribed by FATA. |
However, no such review or approval under the FATA is required if the foreign acquirer is a U.S. entity and the value of the target is less than A$1.094 million.
The Australian Federal Treasurer may prevent a proposed acquisition in the above categories or impose conditions on such acquisition if the Treasurer is satisfied that the acquisition would be contrary to the national interest. If a foreign person acquires shares or an interest in shares in an Australian company in contravention of the FATA, the Australian Federal Treasurer may order the divestiture of such person’s shares or interest in shares in that Australian company.
Ownership Threshold
There are no provisions in our Constitution that require a shareholder to disclose ownership above a certain threshold. The Corporations Act, however, requires a shareholder to notify us and the ASX once it, together with its associates, acquires a 5% interest in our ordinary shares, at which point the shareholder will be considered to be a “substantial” shareholder. Further, once a shareholder owns a 5% interest in us, such shareholder must notify us and the ASX of any increase or decrease of 1% or more in its holding of our ordinary shares, and must also notify us and the ASX on its ceasing to be a “substantial” shareholder.
Issues of Shares and Change in Capital
Subject to our Constitution, the Corporations Act, the ASX Listing Rules and any other applicable law, we may at any time issue shares and grant options or warrants on any terms, with preferred, deferred or other special rights and restrictions and for the consideration and other terms that the directors determine.
Subject to the requirements of our Constitution, the Corporations Act, the ASX Listing Rules and any other applicable law, including relevant shareholder approvals, we may consolidate or divide our share capital into a larger or smaller number by resolution, reduce our share capital (provided that the reduction is fair and reasonable to our shareholders as a whole and does not materially prejudice our ability to pay creditors) or buy back our ordinary shares whether under an equal access buy-back or on a selective basis.
Change of Control
Takeovers of listed Australian public companies, such as ours are regulated by the Corporations Act, which prohibits the acquisition of a “relevant interest” in issued voting shares in a listed company if the acquisition will lead to that person’s or someone else’s voting power in our company increasing from 20% or below to more than 20% or increasing from a starting point that is above 20% and below 90%, subject to a range of exceptions.
Generally, a person will have a relevant interest in securities if the person:
| ● | is the holder of the securities; |
| ● | has power to exercise, or control the exercise of, a right to vote attached to the securities; or |
| ● | has the power to dispose of, or control the exercise of a power to dispose of, the securities, including any indirect or direct power or control. |
If, at a particular time, a person has a relevant interest in issued securities and the person:
| ● | has entered or enters into an agreement with another person with respect to the securities; |
| ● | has given or gives another person an enforceable right, or has been or is given an enforceable right by another person, in relation to the securities (whether the right is enforceable presently or in the future and whether or not on the fulfillment of a condition); |
| ● | has granted or grants an option to, or has been or is granted an option by, another person with respect to the securities; or |
| ● | the other person would have a relevant interest in the securities if the agreement were performed, the right enforced or the option exercised; the other person is presumed to already have a relevant interest in the securities. |
There are a number of exceptions to the above prohibition on acquiring a relevant interest in issued voting shares above 20%. In general terms, some of the more significant exceptions include:
| ● | when the acquisition results from the acceptance of an offer under a formal takeover bid; |
| ● | when the acquisition is conducted on market by or on behalf of the bidder under a takeover bid, the acquisition occurs during the bid period, the bid is for all the voting shares in a bid class and the bid is unconditional or only conditioned on prescribed matters set out in the Corporations Act; |
| ● | when shareholders of our company approve the takeover by resolution passed at general meeting; |
| ● | an acquisition by a person if, throughout the six months before the acquisition, that person or any other person has had voting power in our company of at least 19% and, as a result of the acquisition, none of the relevant persons would have voting power in our company more than three percentage points higher than they had six months before the acquisition; |
| ● | when the acquisition results from the issue of securities under a rights issue; |
| ● | when the acquisition results from the issue of securities under dividend reinvestment schemes; |
| ● | when the acquisition results from the issue of securities under underwriting arrangements; |
| ● | when the acquisition results from the issue of securities through operation of law; |
| ● | an acquisition that arises through the acquisition of a relevant interest in another listed company which is listed on a prescribed financial market or a financial market approved by ASIC; |
| ● | an acquisition arising from an auction of forfeited shares conducted on-market; or |
| ● | an acquisition arising through a compromise, arrangement, liquidation or buy-back. |
Breaches of the takeovers provisions of the Corporations Act are criminal offenses. ASIC and the Australian Takeover Panel have a wide range of powers relating to breaches of takeover provisions, including the ability to make orders canceling contracts, freezing transfers of, and rights attached to, securities, and forcing a party to dispose of securities. There are certain defenses to breaches of the takeover provisions provided in the Corporations Act.
Access to and Inspection of Documents
Inspection of our records is governed by the Corporations Act. Any member of the public has the right to inspect or obtain copies of our registers on the payment of a prescribed fee. Shareholders are not required to pay a fee for inspection of our registers or minute books of the meetings of shareholders. Other corporate records, including minutes of directors’ meetings, financial records and other documents, are not open for inspection by shareholders. Where a shareholder is acting in good faith and an inspection is deemed to be made for a proper purpose, a shareholder may apply to the court to make an order for inspection of our books.
C. Material Contracts
We entered into a Development and Supply Agreement by and between us andwith Synlait Milk Ltd. datedon June 21, June 2016.
Pursuant to the agreement, is. Synlait Milk, a large dairy farm company located in New Zealand, has agreed to vaccinate their cow herds with IMM-124EIMM- 124E vaccine , and to collect the hyperimmune colostrum from the first milking of the cows at calving. This colostrum, which contains the vaccine antibodies, is then spray or freeze dried and tested for the vaccine properties. If levels of the vaccine are sufficient and meet our product specifications, the dried hyperimmune colostrum is then shipped to our warehouse in Melbourne, Australia.
Convertible Security and Share Purchase Agreement by and between Immuron Limited and SBI Investments dated February 16, 2016.
D. Exchange Controls
This agreement provided us with a line of funding from which we could draw down funding to continue our ongoing operations. The convertible note comprised of three tranches, of which we drew down the first two tranches, totaling A$1.2 million in the aggregate. The note was repayable in 18 equal monthly installments payable on the 15th day of each month either by the issuance of equity at a discount to the market rate at the time of issue, or by a cash payment plus a 2.5% premium. The final payment with respect to this convertible note was repaid on 10 September 2017 and this liability is fully extinguished.
Australia has largely abolished exchange controls on investment transactions. The Australian dollar is freely convertible into U.S. dollars. In addition, there are currently no specific rules or limitations regarding the export from Australia of profits, dividends, capital, or similar funds belonging to foreign investors, except that certain payments to non-residents must be reported to the Australian Cash Transaction Reports Agency, which monitors such transactions, and amounts on account of potential Australian tax liabilities may be required to be withheld unless a relevant taxation treaty can be shown to apply.
The Foreign Acquisitions and Takeovers Act 1975
Under Australian law, in certain circumstances foreign persons are prohibited from acquiring more than a limited percentage of the shares in an Australian company without notification to or approval from the Australian Treasurer. These limitations are set forth in the Australian Foreign Acquisitions and Takeovers Act, or the Takeovers Act.
Under the Takeovers Act, as currently in effect, any foreign person, together with associates, is prohibited from acquiring 15% or more of the shares in any company having total assets exceeding A$252 million or more. In addition, a foreign person may not acquire shares in a company having total assets of A$252 million or more if, as a result of that acquisition, the total holdings of all foreign persons and their associates will exceed 40% in aggregate without the approval of the Australian Treasurer. However, for “U.S. Investors” and investors from certain other countries, a threshold of A$1.094 million applies (except in certain circumstances) to each of the previous acquisitions. A “U.S. Investor” is defined by the Takeovers Act as a U.S. national or a U.S. enterprise.
If the necessary approvals are not obtained, the Treasurer may make an order requiring the acquirer to dispose of the shares it has acquired within a specified period of time. Under the current Australian foreign investment policy, however, it is unlikely that the Treasurer would make such an order where the level of foreign ownership exceeds 40% in the ordinary course of trading, unless the Treasurer finds that the acquisition is contrary to the national interest. The same rule applies if the total holdings of all foreign persons and their associates already exceeds 40% and a foreign person (or its associate) acquires any further shares, including in the course of trading in the secondary market of the ADSs. At present, we do not have total assets of A$252 million.
If the level of foreign ownership exceeds 40% at any time, we would be considered a foreign person under the Takeovers Act. In such event, we would be required to obtain the approval of the Treasurer for our company, together with our associates, to acquire (i) more than 15% of an Australian company or business with assets totaling over A$252 million; or (ii) any direct or indirect ownership interest in Australian residential real estate.
The percentage of foreign ownership in our company would also be included in determining the foreign ownership of any Australian company or business in which it may choose to invest. Since we have no current plans for any such acquisitions and do not own any property, any such approvals required to be obtained by us as a foreign person under the Takeovers Act will not affect our current or future ownership or lease of property in Australia.
Our Constitution does not contain any additional limitations on a non-resident’s right to hold or vote our securities.
Australian law requires the transfer of shares in our company to be made in writing. No stamp duty will be payable in Australia on the transfer of ADSs.
E. Taxation
The following is a discussion of Australian and U.S. tax consequencesconsiderations material to our shareholders. To the extent that the discussion is based on tax legislation which has not been subject to judicial or administrative interpretation, the views expressed in the discussion might not be accepted by the tax authorities in question or by court. The discussion is not intended, and should not be construed, as legal or professional tax advice and does not exhaust all possible tax considerations.
Holders of our ADSs should consult their own tax advisors as to the United States, Australian or other tax consequences of the purchase, ownership and disposition of ADSs, including, in particular, the effect of any foreign, state or local taxes.
AUSTRALIAN TAX CONSEQUENCESCONSIDERATIONS
In this section, we discuss the material Australian tax considerations that apply to non-Australian tax residents with respect to the acquisition, ownership and disposal of the absolute beneficial ownership of ADSs, which are evidenced by ADRs. This discussion is based upon existing Australian tax law as of the date of this annual report, which is subject to change, possibly retrospectively. This discussion does not address all aspects of Australian income tax law which may be important to particular investors in light of their individual investment circumstances, such as ADSs or shares held by investors subject to special tax rules (for example, financial institutions, insurance companies or tax exempt organizations). In addition, this summary does not discuss any foreign or state tax considerations, other than stamp duty.
Prospective investors are urged to consult their tax advisors regarding the Australian and foreign income and other tax considerations of the purchase, ownership and disposition of the ADSs or shares.
Nature of ADSs for Australian Taxation Purposes
Holders of our ADSs are treated as the owners of the underlying ordinary shares for Australian income tax and capital gains tax purposes.
Therefore, dividends paid on the underlying ordinary shares will be treated for Australian tax purposes as if they were paid directly to the owners of ADSs, and the disposal of ADSs will be treated for Australian tax purposes as the disposal of the underlying ordinary shares. In the following analysis we discuss the application of the Australian income tax and capital gains tax rules to non-Australian resident holders of ADSs.
Taxation of Dividends
Australia operates a dividend imputation system, under which dividends may be declared to be ’franked’‘franked’ to the extent of tax paid on company profits. Fully franked dividends are not subject to dividend withholding tax. Dividends that are not franked or are partly franked and are paid to non-Australian resident shareholders are subject to dividend withholding tax, but only to the extent the dividends are not franked.
Unfranked dividends paid to a non-resident shareholder are subject to withholding tax at 30%, unless the shareholder is a resident of a country with which Australia has a double taxation agreement. In accordance with the provisions of the Double Taxation Convention between Australia and the U.S., the maximum rate of Australian tax on unfranked dividends to which a resident of the U.S. is beneficially entitled is 15%, where the U.S. resident holds less than 10% of the voting rights in our company, or 5% where the U.S. resident holds 10% or more of the voting rights in our company. The Double Taxation Convention between Australia and the U.S. does not apply to limit the tax rate on dividends where the ADSs are effectively connected to a permanent establishment or a fixed base carried on by the owner of the ADSs in Australia through which the shareholder carries on business or provides independent personal services, respectively.
Tax on Sales or other Dispositions of Shares - Capital Gains Tax
Australian capital gains derived by non-Australian residents in respect of the disposal of capital assets that are not taxable Australian property will be disregarded. Non-Australian resident shareholders will not be subject to Australian capital gains tax on the capital gain made on a disposal of our shares, unless they, together with associates, hold 10% or more of our issued capital, tested either at the time of disposal or over any continuous 12 month period in the 24 months prior to disposal, and the value of our shares at the time of disposal are wholly or principally attributable to Australian real property assets.
Australian capital gains tax applies to net capital gains at a taxpayer’s marginal tax rate. Previously, certain shareholders, such as individuals were entitled to a discount of 50% for capital gains on shares held for greater than 12 months. However, as part of the 2012-2013 Federal Budget measures, the Australian Government announced changes to the application of the CGT discount for foreign resident individuals on taxable Australian assets, including shares. These changes became effective on 29 June 2013.
The effect of the change is to:
| ● | Retain access to the full CGT discount for discount capital gains of foreign resident individuals in respect of the increase in the value of a CGT asset that occurred before 9 May 2013; and |
| ● | Remove the CGT discount for discount capital gains for foreign resident individuals that arise after 8 May 2013. |
Foreign residents will still have access to a discount on discount capital gains accrued prior to 8 May 2013 provided they choose to obtain a market valuation for their assets as at that date.
Net capital gains are calculated after reduction for capital losses, which may only be offset against capital gains.
Tax on Sales or other Dispositions of Shares - Shareholders Holding Shares on Revenue Account
Some non-Australian resident shareholders may hold shares on revenue rather than on capital account, for example, share traders. These shareholders may have the gains made on the sale or other disposal of the shares included in their assessable income under the ordinary income provisions of the income tax law, if the gains are sourced in Australia.
Non-Australian resident shareholders assessable under these ordinary income provisions in respect of gains made on shares held on revenue account would be assessed for such gains at the Australian tax rates for non-Australian residents, which start at a marginal rate of 32.5% for non-Australian resident individuals. Some relief from the Australian income tax may be available to such non-Australian resident shareholders under the Double Taxation Convention between the U.S. and Australia, for example, because the shareholder does not have a permanent establishment in Australia.
To the extent an amount would be included in a non-Australian resident shareholder’s assessable income under both the capital gains tax provisions and the ordinary income provisions, the capital gain amount would generally be reduced, so that the shareholder would not be subject to double tax on any part of the income gain or capital gain.
Dual Residency
If a shareholder were a resident of both Australia and the U.S. under those countries’ domestic taxation laws, that shareholder may be subject to tax as an Australian resident. If, however, the shareholder is determined to be a U.S. resident for the purposes of the Double Taxation Convention between the U.S. and Australia, the Australian tax applicable would be limited by the Double Taxation Convention. Shareholders should obtain specialist taxation advice in these circumstances.
Stamp Duty
A transfer of shares of a company listed on the ASX is not subject to Australian stamp duty except in some circumstances where one person, or associated persons, acquires 90% or more of the shares.
Australian Death Duty
Australia does not have estate or death duties. No capital gains tax liability is realized upon the inheritance of a deceased person’s shares.
The disposal of inherited shares by beneficiaries, may, however, give rise to a capital gains tax liability.
Goods and Services Tax
The issue or transfer of shares will not incur Australian goods and services.
UNITED STATES FEDERAL INCOME TAX CONSEQUENCESCONSIDERATIONS
The following is a summary of certain material U.S. federal income tax consequences that generally apply to U.S. Holders (as defined below) who hold ADSs as capital assets. This summary is based on the U.S. Internal Revenue Code of 1986, as amended or the Code,(the “Code”), Treasury regulations promulgated thereunder, judicial and administrative interpretations thereof, and the bilateral taxation convention between Australia and the U.S. (the “Tax Treaty”), or the Tax Treaty, all as in effect on the date hereof and all of which are subject to change either prospectively or retroactively.
This summary does not discuss all the tax consequences that may be relevant to an investment in ADSs by a U.S. Holder in light of such holder’s particular circumstances or to U.S. Holders subject to special rules, including broker-dealers, banks or other financial institutions, certaintraders in securities who elect to use a mark-to-market method of accounting for securities holdings, insurance companies, investors liable for alternative minimum tax, tax-exempt organizations, regulated investment companies or real estate investment trusts, non-resident aliens of the U.S. or taxpayers whose functional currency is not the U.S. dollar, persons who hold the ADSs through partnerships or other pass-through entities for U.S. federal income tax purposes or persons holding ADSs through any such entities, persons who acquired their ADSs through the exercise or cancellation of any employee stock options or otherwise as compensation for their services, investors that actually or constructively own 10% or more of our shares by vote or value, and investors holding ADSs as part of a straddle or appreciated financial position or as part of a hedging or conversion transaction.
If a partnership or an entity treated as a partnership for U.S. federal income tax purposes owns ADSs, the U.S. federal income tax treatment of a partner in such a partnership will generally depend upon the status of the partner and the activities of the partnership. A partnership that owns ADSs and the partnerseach partner in such partnership should consult theirits own tax advisors about the U.S. federal income tax consequences of holding and disposing of ADSs.
This summary does not address the effect of any U.S. federal taxation other than U.S. federal income taxation. In addition, this summary does not include any discussion of U.S. federal estate and gift tax, state, local or foreign taxation. You are urged to consult your tax advisors regarding the particular U.S. federal income tax consequences to you relating to the purchase, ownership and disposition of ADSs, the consequences to you under any foreign andtaxing jurisdiction, as well as the U.S. federal, state and local tax considerations of an investment in ADSs.
For purposes of this summary, the term “U.S. Holder” means an (i) individual who is a citizen or, for U.S. federal income tax purposes, a resident of the U.S., (ii) a corporation or other entity taxable as a corporation created or organized in or under the laws of the U.S. or any political subdivision thereof, (iii) an estate whose income is subject to U.S. federal income tax regardless of its source, or (iv) a trust if (a) a court within the U.S. is able to exercise primary supervision over administration of the trust, and one or more U.S. persons have the authority to control all substantial decisions of the trust or (b) it has a valid election in effect under applicable U.S. Treasury regulations to be treated as a U.S. person.
Taxation of Dividends on ADSs
For U.S. federal income tax purposes, U.S. Holders of ADSs will be treated as owning the underlying ordinary shares represented by the ADSs held by them. Subject to the passive foreign investment company, or PFIC rules discussed below, the gross amount of any distributions received with respect to the underlying ordinary shares represented by the ADSs, including the amount of any Australian taxes withheld therefrom, will constitute dividends for U.S. federal income tax purposes, to the extent of our current and accumulated earnings and profits, as determined under U.S. federal income tax principles. You will be required to include this amount of dividends in gross income as ordinary income. Distributions in excess of our earnings and profits will be treated as a non-taxable return of capital to the extent of your tax basis in the ADSs, and any amount in excess of your tax basis will be treated as gain from the sale of ADSs. See “Disposition“Disposition of ADSs”ADSs” below for the discussion on the taxation of capital gains. Dividends will not qualify for the dividends-received deduction generally available to corporations under Section 243 of the Code.
Dividends that we pay in Australian dollars, including the amount of any Australian taxes withheld therefrom, will be included in your income in a U.S. dollar amount calculated by reference to the exchange rate in effect on the day such dividends are received. A U.S. Holder who receives payment in Australian dollars and converts Australian dollars into U.S. dollars at an exchange rate other than the rate in effect on such day will likely have a foreign currency exchange gain or loss, which would be treated as U.S.-source ordinary income or loss for purposes of U.S. foreign tax credit.loss.
Subject to complex limitations, any Australian withholding tax imposed on our dividends will be a foreign income tax eligible for credit against a U.S. Holder’s U.S. federal income tax liability (or, alternatively, for deduction against income in determining such tax liability). The limitations set forth in the Code include computational rules under which foreign tax credits allowable with respect to specific classes of income cannot exceed the U.S. federal income taxes otherwise payable with respect to each such class of income. Dividends generally will be treated as foreign-source passive category income or general category income for U.S. foreign tax credit purposes, depending upon the holder’s circumstances. A U.S. Holder will be denied a foreign tax credit with respect to Australian income tax withheld from dividends received with respect to the underlying ordinary shares represented by the ADSs to the extent such U.S. Holder has not held the ADSs for at least 16 days of the 31-day period beginning on the date that is 15 days before the ex-dividend date or to the extent such U.S. Holder is under an obligation to make related payments with respect to substantially similar or related property. Any days during which a U.S. Holder has substantially diminished its risk of loss on the ADSs are not counted toward meeting the 16-day holding period required by the statute. The rules relating to the determination of the foreign tax credit are complex. You should consult with your own tax advisors to determine whether and to what extent you would be entitled to this credit.
Subject to certain limitations, “qualified dividend income” received by a non-corporate U.S. Holder will be subject to tax at a reduced maximum tax rate of 20 percent. Distributions taxable as dividends generally qualify for the 20 percent rate provided that either: (i) the issuer is entitled to benefits under the Tax Treaty or (ii) the ADSs are readily tradable on an established securities market in the U.S. and certain other requirements are met. We believe that we are entitled to benefits under the Tax Treaty and that the ADSs currently are readily tradable on an established securities market in the U.S. However, no assurance can be given that the ADSs will remain readily tradable. Furthermore, the reduced rate does not apply to dividends received from PFICs. The amount of foreign tax credit is limited in the case of foreign qualified dividend income. U.S. Holders of ADSs should consult their own tax advisors regarding the effect of these rules in their particular circumstances.
Disposition of ADSs
If you sell or otherwise dispose of ADSs, you will recognize gain or loss for U.S. federal income tax purposes in an amount equal to the difference between the amountamounts realized on the sale or other disposition and your adjusted tax basis in the ADSs. Subject to the PFIC rules discussed below, such gain or loss generally will be capital gain or loss and will be long-term capital gain or loss if you have held the ADSs for more than one year at the time of the sale or other disposition. In general, any gain that you recognize on the sale or other disposition of ADSs will be U.S.-source for purposes of the foreign tax credit limitation; losses will generally be allocated against U.S.-source income. Deduction of capital losses is subject to certain limitations under the Code.
In U.S. Holders are urged to consult their tax advisors regarding the case oftax consequences that may occur when a cash basis U.S. Holder who receives Australian dollars in connection with the sale orforeign withholding tax is imposed on a disposition of our ADSs, including the amount realized will be based on the U.S. dollar valueavailability of the Australian dollars received with respect to the ADSs as determined on the settlement date offoreign tax credit under such exchange. A U.S. Holder who receives payment in Australian dollars and converts them into U.S. dollars at a conversion rate other than the rate in effect on the settlement date may have a foreign currency exchange gain or loss that would be treated as ordinary income or loss.
Holder’s particular circumstances.
An accrual basis U.S. Holder may elect the same treatment of foreign currency gain or loss required of cash basis taxpayers with respect to a sale or disposition of ADSs, provided that the election is applied consistently from year to year. Such election may not be changed without the consent of the Internal Revenue Service, or IRS. In the event that an accrual basis U.S. Holder does not elect to be treated as a cash basis taxpayer (pursuant to the Treasury regulations applicable to foreign currency transactions), such U.S. Holder may have a foreign currency gain or loss for U.S. federal income tax purposes because of differences between the U.S. dollar value of the Australian dollars received prevailing on the trade date and the settlement date. Any such currency gain or loss would be treated as ordinary income or loss and would be in addition to gain or loss, if any, recognized by such U.S. Holder on the sale or other disposition of such ADSs.
Passive Foreign Investment CompaniesCompany
The Code provides special, generally adverse, rules regarding certain distributions received by U.S. holdersHolders with respect to, and sales, exchanges and other dispositions, including pledges, of, shares of stock of a PFIC. A foreign corporation will be a PFIC for any taxable year if at least 75% of its gross income for the taxable year is passive income or at least 50% of its gross assets during the taxable year, based on a quarterly average and generally by value, produce or are held for the production of passive income. Passive income for this purpose generally includes, among other things, dividends, interest, rents, royalties, gains from commodities and securities transactions and gains from the disposition of assets that produce or are held for the production of passive income. In determining whether a foreign corporation is a PFIC, a pro-rata portion of the income and assets of each corporation in which it owns, directly or indirectly, at least a 25% interest (by value) is taken into account.
Based on our business results for the last fiscal year and the composition of our assets, we believe that we were not a PFIC for U.S. federal income tax purposes for the taxable year ended June 30, 2016. Similarly, based on our business projections and the anticipated composition of our assets for our current taxable year ending June 30, 2017, we expect that we will not be a PFIC for such taxable year.2022. However, the determination of PFIC status is a factual determination that must be made annually at the close of each taxable year and therefore, there can be no certainty as to our PFIC status for a taxable year until the close of that taxable year. Our PFIC status could change depending upon, among other things, upon a decrease in the trading price of our ordinary shares or ADSs and how quickly we make use of the cash proceeds from the IPO,any offering, as well as changes in the composition and relative values of our assets and the composition of our income. Moreover, the rules governing whether certain assets are active or passive are complex and in some cases their application can be uncertain. If we were a PFIC in any year during a U.S. holder’sHolder’s holding period for the ordinary shares or ADSs, we generally would continue to be treated as a PFIC for each subsequent year during which the U.S. holderHolder owned the ordinary shares or ADSs.
If we are a PFIC for any taxable year during which a U.S. holderHolder holds ordinary shares or ADSs, any “excess distribution” that the holder receives and any gain recognized from a sale or other disposition (including a pledge) of such ordinary shares or ADSs will be subject to special tax rules, unless the holderU.S. Holder makes a mark-to-market election (provided the ADSs are “marketable”) or qualified electing fund election, as discussed below. Any distribution in a taxable year that is greater than 125% of the average annual distribution received by a U.S. holderHolder during the shorter of the three preceding taxable years or such holder’s holding period for the ordinary shares or ADSs will be treated as an excess distribution. Under these special tax rules:
| ● | the excess distribution or gain will be allocated ratably over the U.S. |
| ● | the amount allocated to the current taxable year, and any taxable year prior to the first taxable year in which we were a PFIC in the U.S. |
| ● | the amount allocated to each other year will be subject to income tax at the highest rate in effect for that year and applicable to the U.S. |
If we are a PFIC, the tax liability for amounts allocated to years prior to the year of disposition or excess distribution cannot be offset by any net operating loss, and gains (but not losses) recognized on the transfer of the ordinary shares or ADSs cannot be treated as capital gains, even if the ordinary shares or ADSs are held as capital assets. In addition, non-corporate U.S. holdersHolders will not be eligible for reduced rates of taxation on any dividends that we pay if we are a PFIC for either the taxable year in which the dividend is paid or the preceding year. Furthermore, unless otherwise provided by the U.S. Treasury Department, each U.S. holderHolder of a PFIC is required to file an annual report containing such information as the U.S. Treasury Department may require.
If we are a PFIC for any taxable year during which any of our non-U.S. subsidiaries is also a PFIC, a U.S. holderHolder of ordinary shares or ADSs during such year would be treated as owning a proportionate amount (by value) of the shares of the lower-tier PFIC for purposes of the application of these rules to such subsidiary. You should consult your tax advisors regarding the tax consequences if the PFIC rules apply to any of our subsidiaries.
In certain circumstances, in lieu of being subject to the specialadverse tax rules discussed above, you may make an election to include gain on the stock of a PFIC as ordinary income under a mark-to-market method, provided that such stock is regularly traded on a qualified exchange.exchange, or “marketable”. Under current law, the mark-to-market election may be available to U.S. holdersHolders of ADSs if the ADSs are listed on NASDAQ, which constitutes a qualified exchange, althoughexchange. As stated above, the ADSs will be listed on NASDAQ. However, there can be no assurance that the ADSs will be “regularly traded” for purposes of the mark-to-market election. It should also be noted that it is intended that only the ADSs and not the ordinary shares will be listed on NASDAQ. While we would expect the Australian Stock Exchange, on which the ordinary shares are listed, to be considered a qualified exchange, no assurance can be given as to whether the Australian Stock Exchange is a qualified exchange, or that the ordinary shares would be traded in sufficient frequency to be considered regularly traded for these purposes. Additionally, because a mark-to-market election cannot be made for equity interests in any lower-tier PFIC that we may own, a U.S. holderHolder that makes a mark-to-markmark-to-market election with respect to usits ADSs may continue to be subject to the PFIC rules with respect to any indirect investments held by us that are treated as an equity interest in a PFIC for U.S. federal income tax purposes. If you make an effective mark-to-market election, you will include as ordinary income in each year that we are a PFIC, as ordinary income the excess of the fair market value of your ordinary shares or ADSs at the end of your taxable year over your adjusted tax basis in thesuch ordinary shares or ADSs. You will be entitled to deduct as an ordinary loss in each such year the excess of your adjusted tax basis in the ordinary shares or ADSs over their fair market value at the end of the year, but only to the extent of the net amount previously included in income as a result of the mark-to-market election. If you make an effective mark-to-market election, any gain you recognize upon the sale or other disposition of your ordinary shares or ADSs in a year that we are a PFIC will be treated as ordinary income and any loss will be treated as ordinary loss, but only to the extent of the net amount previously included in income as a result of the mark-to-market election. Any gain or loss you recognize upon the sale or other disposition of your ordinary shares or ADSs in a year when we are not a PFIC will be a capital gain or loss. SeeDisposition of ADSs abovefor the treatment of capital gains and losses.
Your adjusted tax basis in the ordinary shares or ADSs will be increased by the amount of any income inclusion and decreased by the amount of any deductionslosses under the mark-to-market rules. If you make a mark-to-market election, it will be effective for the taxable year for which the election is made and all subsequent taxable years unless the ordinary shares or ADSs are no longer regularly traded on a qualified exchange or the IRS consents to the revocation of the election. You are urged to consult your tax advisors about the availability of the mark-to-market election, and whether making the election would be advisable in your particular circumstances. In the case of a valid mark-to-market election, any distributions we make would generally be subject to the rules discussed above under “—“Taxation of Dividends,” except the reduced rates of taxation on any dividends received from us would not apply if we are a PFIC.
Alternatively, you can sometimes avoid the PFIC rules described above by electing to treat us as a “qualified electing fund” under Section 1295 of the Code. However, this option will not be available to you because we do not intend to comply with the requirements necessary to permit you to make this election.
U.S. holdersHolders are urged to contact their own tax advisors regarding the determination of whether we are a PFIC and the tax consequences of such status.
Additional Tax on Investment Income
U.S. Holders that are individuals, estates, or trusts and whose income exceeds certain thresholds will be subject to a 3.8% Medicare contribution tax on net investment income, which will include dividends on and capital gains from the sale or other taxable disposition of ADSs, subject to certain limitations and exceptions.
Backup Withholding and Information Reporting
Payments in respect of ADSs may be subject to information reporting to the IRS and to U.S. backup withholding tax at a rate equal to the fourth lowest income tax rate applicable to individuals (which, under current law, is 28%24%). Backup withholding will not apply, however, if you (i) are a corporation or come within certain exempt categories and demonstrate the fact when so required or (ii) furnish a correct taxpayer identification number and make any other required certification.
Backup withholding is not an additional tax. Amounts withheld under the backup withholding rules may be credited against a U.S. Holder’s U.S. tax liability. A U.S. Holder may obtain a refund of any excess amounts withheld under the backup withholding rules by timely filing the appropriate claim for refund with the IRS, which is generally an annual income tax return.
U.S. Holders who are individuals who holdgenerally will be required to report our name, address, and such information relating to an interest in the ADSs as is necessary to identify the class or issue of which the ADSs are a part. These requirements are subject to exceptions, including an exception for ADSs held in accounts maintained by certain specifiedfinancial institutions and an exception applicable if the aggregate value of all “specified foreign financial assets, including stockassets” (as defined in a foreign corporation, with values in excess of certain thresholds are required to file IRS Form 8938 withthe Code) does not exceed $50,000.
U.S. Holders should consult their U.S. federal income tax return. Such form requires disclosure of information concerning such foreign assets, including their value. Failure to file the form when required is subject to penalties. An exemption from reporting applies to foreign assets held through a U.S. financial institution, generally including a non-U.S. branch or subsidiary of a U.S. institution and a U.S. branch of a non-U.S. institution. Investors are encouraged to consult with their own tax advisors regarding the possible application of this disclosure requirement to their investment in our ADSs.these information reporting rules.
F. Dividends And Paying Agents
Not applicable.
G. Statement By Experts
Not applicable.
H. Documents on display
We are subject to the reporting requirements of the Exchange Act, as applicable to “foreign private issuers” as defined in Rule 3b-4 thereunder. As a foreign private issuer, we are exempt from certain provisions of the Exchange Act. Accordingly, our proxy solicitations are not subject to the disclosure and procedural requirements of Regulation 14A under the Exchange Act, transactions in our equity securities by our officers and directors are exempt from reporting and the “short-swing” profit recovery provisions contained in Section 16 of the Exchange Act. In addition, we are not required to file periodic reports and financial statements as frequently or as promptly as U.S. companies whose securities are registered under the Exchange Act. However, we file with the Securities and Exchange Commission an annual report on Form 20-F containing financial statements that have been examined and reported on, with an opinion expressed by, an independent registered public accounting firm, and we submit reports to the Securities and Exchange Commission on Form 6-K containing (among other things) press releases and unaudited financial information for the first six months of each fiscal year. We post our annual report on Form 20-F on our website (www.Immuronbio.com)(www.immuron.com.au/corporate-directory-and-governance) promptly following the filing of our annual report with the Securities and Exchange Commission. The information on our website is not incorporated by reference into this annual report.
This annual report and the exhibits thereto and any other document we file pursuant to the Exchange Act may be inspected without charge and copied at prescribed rates at the Securities and Exchange Commission public reference room at 100 F Street, N.E., Room 1580, Washington, D.C. 20549. You may obtain information on the operation of the Securities and Exchange Commission’s public reference room in Washington, D.C. by calling the Securities and Exchange Commission at 1-800-SEC-0330. The Exchange Act file number for our Securities and Exchange Commission filings is 001-38104.
The Securities and Exchange Commission maintains a website atwww.sec.gov that contains reports, proxy and information statements, and other information regarding registrants that make electronic filings with the Securities and Exchange Commission using its EDGAR (Electronic Data Gathering, Analysis, and Retrieval) system.
The documents concerning our company referred to in this annual report may also be inspected at our offices located at Level 3, 62 Lygon Street, Carlton Victoria, Australia, 3053.
I. Subsidiary Information
Not applicable.
ITEM 11. QUANTITATIVE AND QUALITATIVE DISCLOSURES ABOUT MARKET RISK
We invest our excess cash and cash equivalents in interest-bearing accounts and term deposits with banks in Australia. Our management believes that the financial institutions that hold our investments are financially sound and accordingly, minimal credit risk exists with respect to these investments. Certain of our cash equivalents are subject to interest rate risk. Due to the short duration and conservative nature of these instruments, we do not believe that we have a material exposure to interest rate risk. Our major market risk is changes in foreign exchange rates as we had approximately A$3,994,924 22,110,278 on deposit on June 30, 2017.2022.
We conduct our activities almost exclusively in Australia. We are required to make certain payments in U.S. dollars and other currencies, however such payments are not significant to our operations and we believe an adverse movement in end-of-period exchange rates would not have a material impact on our operating results. In the twelve months ended June 30, 2017,2022, the Australian dollar appreciateddepreciated against the U.S. dollar.
We do not currently utilize derivative financial instruments or other financial instruments subject to market risk.
ITEM 12. DESCRIPTION OF SECURITIES OTHER THAN EQUITY SECURITIES
A. Debt Securities
Not applicable.
B. Warrants and Rights
Description of the WarrantWarrants
The following summary of certain terms of the Warrants is not complete and is subject to, and qualified in its entirety by the provisions of the ADS Warrant Agent Agreement and Form of Global Warrant to Purchase ADSs, which are incorporated by reference as exhibits to this annual report.Not applicable.
● Global Certificates, Book-entry InterestsC. Other Securities. The Warrants are represented by one or more global certificates in registered form. The global certificate are deposited with the Warrant Agent as custodian for DTC and registered in the name of Cede & Co., as nominee of DTC. Ownership of interests in the global warrant certificate will be limited to persons that have accounts with DTC or persons that have accounts with DTC participants. Book-entry interests in the Warrants will be shown on, and transfers of such interests will be effected only through records maintained by DTC and its participants. So long as the Warrants are held in global form, DTC will be considered the sole holder of the Warrants. Beneficial owners must rely on the procedures of the participants through which they own book-entry interests to exercise their Warrants or transfer their Warrants.
● Exercisability. The Warrants are exercisable immediately upon issuance and at any time up to the date that is five years from the date of issuance. The Warrants are exercisable, at the option of each holder, in whole or in part by delivering to us a duly executed exercise notice accompanied by payment in full for the number of ADSs purchased upon such exercise. The Company will pay the ADS issuance fee of US$0.05 per ADS and any other applicable charges and taxes in connection with any such exercise.Not applicable.
● Maximum Percentage. A holder of a Warrant will not have the right to exercise such Warrant, to the extent that after giving effect to such exercise, such person (together with such person’s affiliates and certain other persons), would beneficially own in excess of 4.99% (the “Maximum Percentage”) of the ordinary shares outstanding immediately after giving effect to such exercise. Subject to certain exceptions, “beneficial ownership” for purposes of determining the Maximum Percentage is calculated in accordance with Section 13(d) of the Exchange Act and the regulations of the SEC thereunder. Upon request by a Warrant holder, we will provide current information regarding the number of our outstanding ordinary shares.
● Exercise Price. The initial exercise price per ADS purchasable upon exercise of the Warrants is US$10.00.
● Restrictive Legend Events. We will notify the Warrant Agent and each holder if we are unable to deliver ADSs via DTC transfer or otherwise (without restrictive legend), because (a) the SEC has issued a stop order with respect to the registration statement relating to the ADSs, (b) the SEC otherwise has suspended or withdrawn the effectiveness of such registration statement, either temporarily or permanently, (c) we have suspended or withdrawn the effectiveness of the registration statement, either temporarily or permanently, or (d) otherwise (each a “Restrictive Legend Event”). If a Restrictive Legend Event occurs after a Warrant holder has exercised a Warrant in accordance with its terms but prior to the delivery of the ADSs, or if we do not cause the depositary to timely deliver ADSs to a Warrant holder upon exercise of the Warrants, we will be obligated to pay a cash buy-in amount to the holder of the Warrants who did not receive ADSs upon such holder’s exercise of Warrants.
D. American Depository Shares
● Anti-Dilution Provisions. The exercise price per Warrant and the numbers of Warrants will be subject to adjustment from time to time in accordance with the ASX Listing Rules upon the occurrence of certain stock dividends and distributions, stock splits, stock subdivisions and combinations, reclassifications, rights issues, or similar events affecting our ADSs or ordinary shares, or upon the occurrence of a change in ADS ratio.
● Warrant Agent and Exchange Listing. The Warrants are issued in registered form under an ADS Warrant Agent Agreement between The Bank of New York Mellon, as warrant agent and us and listed on the NASDAQ Capital Market under the symbol “IMRNW”.
● Rights as a Shareholder. Except as otherwise provided in the ADS Warrant Agent Agreement or by virtue of such holder’s ownership of ADSs or ordinary shares, holders of Warrants do not have rights or privileges of a holder of ADSs or ordinary shares, including any voting rights, until the holder exercises the Warrant.
Fees and Charges Payable by ADS Holders
The table below summarizes the fees and charges that a holder of our ADSs may have to pay, directly or indirectly, to our depositary, The Bank of New York Mellon, pursuant to the Amended and RestatedRevised Deposit Agreement, between Immuron Limited and The Bank of New York Mellon, as depositary, and Owners and Holders of the American Depositary Shares, which was filed as Exhibit 4.1 to Amendment No.4 of our Registration Statement on Form F-1/A filed with the SEC on May 18, 2017, and the types of services and the amount of the fees or charges paid for such services. The disclosure under this heading “Fees and Charges Payable by ADS Holders” is subject to and qualified in its entirety by reference to the full text of the Deposit Agreement. The holder of an ADS may have to pay fees and charges in connection with ownership of the ADS:
| Persons depositing or withdrawing shares or ADS holders must | For: | |
| US$5.00 (or less) per 100 ADSs (or portion of 100 ADSs) | Issuance of ADSs, including issuances resulting from a distribution of shares or rights or other property | |
| Cancellation of ADSs for the purpose of withdrawal, including if the | ||
| US$0.05 (or less) per ADS | Any cash distribution to ADS holders | |
| A fee equivalent to the fee that would be payable if securities distributed to you had been shares and the shares had been deposited for issuance of ADSs | Distribution of securities distributed to holders of deposited securities which are distributed by the depositary to ADS holders | |
| US$0.05 (or less) per ADS per calendar year | Depositary services | |
| Registration or transfer fees | Transfer and registration of shares on our share register to or from the name of the depositary or its agent when you deposit or withdraw shares | |
| Expenses of the depositary | Cable, telex and facsimile transmissions (when expressly provided in the Deposit Agreement) converting foreign currency to U.S. dollars | |
| Taxes and other governmental charges the depositary or the custodian has to pay on any ADSs or shares underlying ADSs, such as stock transfer taxes, stamp duty or withholding taxes | As necessary | |
| Any charges incurred by the depositary or its agents for servicing the deposited securities | As necessary |
The depositary collects its fees for delivery and surrender of ADSs directly from investors depositing shares or surrendering ADSs for the purpose of withdrawal or from intermediaries acting for them. The depositary collects fees for making distributions to investors by deducting those fees from the amounts distributed or by selling a portion of distributable property to pay the fees. The depositary may collect its annual fee for depositary services by deduction from cash distributions or by directly billing investors or by charging the book-entry system accounts of participants acting for them. The depositary may collect any of its fees by deduction from any cash distribution payable to ADS holders that are obligated to pay those fees. The depositary may generally refuse to provide fee-attracting services until its fees for those services are paid.
From time to time, the depositary may make payments to us to reimburse and/or share revenue from the fees collected from ADS holders, or waive fees and expenses for services provided, generally relating to costs and expenses arising out of establishment and maintenance of the ADS program. In performing its duties under the deposit agreement,Deposit Agreement, the depositary may use brokers, dealers or other service providers that are affiliates of the depositary and that may earn or share fees or commissions.
Fees and Payments Made by Us to the Depositary
For the year ended June 30, 2017,2022, we paid The Bank of New York Mellon a total of US$18,3009,608 for services pursuant to the NASDAQ listing.
2021 Annual General Meeting (AGM).
PART II
ITEM 13. DEFAULTS, DIVIDEND ARREARAGES AND DELINQUENCIES
Not applicable.
ITEM 14. MATERIAL MODIFICATIONS TO THE RIGHTS OF SECURITY HOLDERS AND USE OF PROCEEDS
There were no modifications to the rights of our security holders in the fiscal year.Not applicable.
ITEM 15. CONTROLS AND PROCEDURES
In June 2017, we sold 610,000 ADSs, each representing forty ordinary shares, and warrants to purchase 701,500 ADSs in our IPO at a public offering price of US$9.99 per ADS and $0.01 per Warrant, respectively, for aggregate net offering proceeds to us, after deducting underwriting discounts and commissions, of US$5,673,000.
The offering commenced on June 8, 2017. Joseph Gunner & Co., LLC and Rodman & Renshaw, a unit of H.C. Wainwright & Co., LLC acted as the representatives of the underwriters. None of the payments described in this Item 14. were direct or indirect payments to our directors, officers, general partners or their associates, or any persons owning 10% or more of our ordinary shares, or our affiliates.
There has been no material change in the planned use of proceeds from our initial public offering, as described in our final prospectus filed with the SEC pursuant to rule 424(b) under the Securities Act on June 12, 2017.
A. Disclosure Controls and Procedures
We maintain disclosure controls and procedures that are designed to ensure that information required to be disclosed in our reports under the Exchange Act is recorded, processed, summarized and reported within the time periods specified in the SEC’s rules and forms, and that such information is accumulated and communicated to our management, including our Chief Executive Officer and our Chief Financial Officer, as appropriate, to allow timely decisions regarding required disclosures. Any controls and procedures, no matter how well designed and operated, can provide only reasonable assurance of achieving the desired control objectives. Our management, after evaluating the effectiveness of our disclosure controls and procedures as of the evaluation date, concluded that as of the evaluation date of June 30, 2022, our disclosure controls and procedures were effective.
In connection withB. Management’s Annual Report on Internal Control over Financial Reporting
Our management is responsible for establishing and maintaining adequate internal control over financial reporting. Internal control over financial reporting is defined in Rule 13a-15(f) or 15d-15(f) promulgated under the Exchange Act as a process designed by, or under the supervision of, the company’s principal executive and principal financial officers and effected by the company’s board of directors, management and other personnel, to provide reasonable assurance regarding the reliability of financial reporting and the preparation of our financial statements for external purposes in accordance with generally accepted accounting principles and includes those policies and procedures that:
| ● | pertain to the maintenance of records that in reasonable detail accurately and fairly reflect the transactions and dispositions of the assets of the company; |
| ● | provide reasonable assurance that transactions are recorded as necessary to permit preparation of financial statements in accordance with generally accepted accounting principles, and that receipts and expenditures of the company are being made only in accordance with authorizations of management and directors of the company; and |
| ● | provide reasonable assurance regarding prevention or timely detection of unauthorized acquisition, use of disposition of the company’s assets that could have a material effect on the financial statements. |
Because of its inherent limitations, internal control over financial reporting may not prevent or detect misstatements. Projections of any evaluation of effectiveness to future periods are subject to the year ended 30 June 2016, material weaknesses were identifiedrisk that controls may become inadequate because of changes in some aspectsconditions, or that the degree of compliance with the policies or procedures may deteriorate.
Our management assessed the effectiveness of our internal control over financial reporting for previous periods. Given these material weaknesses,as of June 30, 2022. In making this assessment, our management used the criteria set forth by the Committee of Sponsoring Organizations of the Treadway Commission (COSO) in Internal Control-Integrated Framework (2013). Based on that assessment, our management concluded that we did not maintain effective internal control over financial reporting. Once identified, we commenced the evaluationas of the material weaknesses noted inJune 30, 2022, our internal control over financial reporting specifically surrounding our monitoring controls when assessing certain significant transactions and properly performing certain reviews and monitoring controls in the preparation of the financial statements in accordance with IFRS, as promulgated by IASB. This resulted in the restatement of our financial statements in prior periods. While we have made improvements to our financial reporting processes surrounding the errors identified in prior fiscal periods, some areas of our financial reporting process require additional improvement. Given these material weaknesses, as described above, management concluded that we did not maintain effective internal control over financial reporting as of the end of the period covered by this Annual Report on Form 20-F. To address this weakness, we have improved the training of our finance team with respect to the applicable financial reporting requirements and will continue to do so.is effective.
This annual report does not include a report of management’s assessment regarding internal control over financial reporting due to a transition period established by rules of the Securities and Exchange Commission for newly public companies.
C. Attestation Report of the Registered Public Accounting Firm
This annual report on Form 20-F does not include an attestation report ofon ICFR from our company’s Registered Public Accountingindependent public accounting firm because we are neither an emerging growth companyaccelerated filer nor a large accelerated filer, as such terms are defined in Rule 12b-2 under JOBS Act is exempted from such attestation requirement.the Exchange Act.
D. Changes in Internal Control over Financial Reporting
During the period covered by this annual report,As of September 9, 2022, there werehave been no changes in our internal control over financial reporting (as defined in Rules 13a-15(f) or 15d-15(f) of the Exchange Act) that occurred during the period covered by this annual report that have materially affected, or are reasonably likely to materially affect, ourthe Company’s internal control over financial reporting.
ITEM 16. RESERVED
ITEM 16A. AUDIT COMMITTEE FINANCIAL EXPERT
We currently do not have a financial expert sitting as a member of the audit committee. We believe that the cost related to retaining a financial expert on the audit committee at this time is prohibitive as we are a small company that needs to apply itsour limited cash resources to the development of our product portfolio, which we believe is in the best interest of our shareholders. Our audit committee members include a highly experienced commercial lawyer, and a former biotechnology and pharmaceutical company CEO who continues to serve as a director of many other biotechnology and pharmaceutical companies. The committee currently believes that these skills sets, together with the support of our two Company SecretariesSecretary and CFO’sCFO who also sit as advisors to this committee and who both hold Accounting, Chartered Accountant, and MBA degrees, provide sufficient expertise for this committee to be able to serve and function effectively for the purpose for which it is intended.
ITEM 16B. CODE OF ETHICS
We have adopted a code of ethics that applies to all senior financial officers of our company, including our interim chief executive officer, chief financial officer, chief accounting officer or controller, or persons performing similar functions. The code of ethics is publicly available under “Investor Centre” on our website atwww.Immuron.com. Written copies are available upon request. If we make any substantive amendment to the code of ethics or grant any waivers, including any implicit waiver, from a provision of the codes of ethics, we will disclose the nature of such amendment or waiver on our website.
ITEM 16C. PRINCIPAL ACCOUNTANT FEES AND SERVICES
Fees Paid to Independent Public Accountants
The following table sets forth, for each of the years indicated, the fees billed by Marcum LLP, which has served as our principal independent registered public accounting firm since July 8, 2016.Grant Thornton Audit Pty Ltd.
Year Ended June 30, | ||||||||
| Services Rendered | 2017 | 2016 | ||||||
| Audit | A$ | 91,175 | — | |||||
| Audit-Related | — | — | ||||||
| Other (2) | A$ | 470,503 | — | |||||
| Total | A$ | 561,678 | — | |||||
94
| Year Ended June 30, | ||||||||
| 2022 A$ | 2021 A$ | |||||||
| Audit and review of financial statements (1) | 173,631 | 179,742 | ||||||
| 173,631 | 179,742 | |||||||
| (1) | Audit fees consist of services that would normally be provided in connection with statutory and regulatory filings or engagements, including services that generally only the independent accountant can reasonably provide. |
Since November 29, 2014, William Buck has served as our auditor in connection with our audit in conformance with Australian IFRS.
Pre-Approval Policies and Procedures
Our Audit Committee has adopted policies and procedures for the pre-approval of audit and non-audit services rendered by our independent registered public accounting firm. Pre-approval of an audit or non-audit service may be given as a general pre-approval, as part of the audit committee’s approval of the scope of the engagement of our independent registered public accounting firm, or on an individual basis. Any proposed services exceeding general pre-approved levels also requires specific pre-approval by our audit committee. The policy prohibits retention of the independent registered public accounting firm to perform the prohibited non-audit functions defined in Section 201 of the Sarbanes-Oxley Act or the rules of the Securities and Exchange Commission, and also requires the audit committee to consider whether proposed services are compatible with the independence of the registered public accounting firm. All of the fees described above were pre-approvedpre- approved by our Audit Committee.
ITEM 16D. EXEMPTIONS FROM THE LISTING STANDARDS FOR AUDIT COMMITTEES
Not applicable.
ITEM 16E. PURCHASES OF EQUITY SECURITIES BY THE ISSUER AND AFFILIATED PURCHASERS
Issuer Purchase of Equity Securities
Neither we, nor any affiliated purchaser of our company, has purchased any of our securities during the year ended June 30, 2017.2022.
ITEM 16F. CHANGE IN REGISTRANT’S CERTIFYING ACCOUNTANT.
None.Not applicable.
ITEM 16G. CORPORATE GOVERNANCE
UnderThe NASDAQ Stock Market Rule 5615(a)(3),rules allow for a foreign private issuers,issuer, such as our company, are permitted to follow certainour home country practices in lieu of certain of the NASDAQ’s corporate governance standards. We rely on exemptions from certain corporate governance standards that are contrary to the laws, rules, regulations or generally accepted business practices instead of certain provisions of the NASDAQ Stock Market Rules. A foreign private issuer that elects to follow a home country practice instead of any NASDAQ rule must submit to NASDAQ, in advance, a written statement from an independent counsel in such issuer’s home country certifying that the issuer’s practicesAustralia. These exemptions being sought are not prohibited by the home country’s laws.described below:
Subsequent to our NASDAQ offering, we submitted a notice to NASDAQ informing them of that we have elected to follow home country practice instead of a NASDAQ rule. Our notice indicated that:
| ● | We |
| ● | We |
| ● | We |
| ● | We |
ITEM 16H. MINE SAFETY DISCLOSURE
Not applicable.
ITEM 16I. DISCLOSURE REGARDING FOREIGN JURISDICTIONS THAT PREVENT INSPECTIONS.
Not applicable.
PART III
ITEM 17. FINANCIAL STATEMENTS
Our company has elected to furnish financial statements and related information specified in Item 18.
ITEM 18. FINANCIAL STATEMENTS
| Index to Consolidated Financial Statements | F-1 |
| Report of Independent Registered Public Accounting Firm(PCAOB ID 02233) | F-2 |
| ConsolidatedStatement of Profit or Loss and Other Comprehensive Income | |
| F-4 | |
* Filed with this annual report on Form 20-F
(1) Confidential treatment has been sought for certain portions of this document
INDEX TO CONSOLIDATED FINANCIAL STATEMENTS
| Consolidated Statement of Financial Position | F-5 |
| Consolidated Statement of Changes in Equity | F-6 |
| Consolidated Statement of Cash Flows | F-7 |
| Notes to Consolidated Financial Statements | F-8 |
INDEX TO CONSOLIDATED FINANCIAL STATEMENTS
