-AsAs filed with the Securities and Exchange Commission onApril 4, 2018-on March 18, 2020
UNITED STATES
SECURITIES AND EXCHANGE COMMISSION
Washington, D.C. 20549
FORM 20-F
☐REGISTRATION STATEMENT PURSUANT TO SECTION 12(b) OR (g) OF THE SECURITIES EXCHANGE ACT OF 1934
| ¨ | REGISTRATION STATEMENT PURSUANT TO SECTION 12(b) OR (g) OF THE SECURITIES EXCHANGE ACT OF 1934 |
OR
| x | ANNUAL REPORT PURSUANT TO SECTION 13 OR 15(d) OF THE SECURITIES EXCHANGE ACT OF 1934 |
☒ANNUAL REPORT PURSUANT TO SECTION 13 OR 15(d) OF THE SECURITIES EXCHANGE ACT OF 1934
For the fiscal year ended December 31, 20172019
OR
| ¨ | TRANSITION REPORT PURSUANT TO SECTION 13 OR 15(d) OF THE SECURITIES EXCHANGE ACT OF 1934 |
☐TRANSITION REPORT PURSUANT TO SECTION 13 OR 15(d) OF THE SECURITIES EXCHANGE ACT OF 1934
OR
| ¨ | SHELL COMPANY REPORT PURSUANT TO SECTION 13 OR 15(d) OF THE SECURITIES EXCHANGE ACT OF 1934 |
☐SHELL COMPANY REPORT PURSUANT TO SECTION 13 OR 15(d) OF THE SECURITIES EXCHANGE ACT OF 1934
Commission File Number: 1-14728
LATAM Airlines Group S.A.
(Exact name of registrant as specified in its charter)
| LATAM Airlines Group S.A. | | Republic of Chile |
| (Translation of registrant’s name into English) | | (Jurisdiction of incorporation or organization) |
Presidente Riesco 5711, 20th Floor
Las Condes
Santiago, Chile
(Address of principal executive offices)
Andrés del Valle
Tel.: 56-2-2565-876556-2-2565-2525·— E-mail: InvestorRelations@latam.cominvestorrelations@latam.com
Presidente Riesco 5711, 20th Floor
Las Condes
Santiago, Chile
(Name, telephone, e-mail and/or facsimile number and address of company contact person)
Securities registered or to be registered pursuant to Section 12(b) of the Act:
Title of each class: | | Trading Symbol(s) | | Name of each exchange on
which registered: |
American Depositary Shares (as evidenced by AmericanAmerican) Depositary Receipts), each representing one share of Common Stock, without par value | | “LTM” | | New York Stock Exchange |
*Not for trading, but only in connection with the registration of the American Depository Shares pursuant to the requirements of the New York Stock Exchange. | | “LTM” | | New York Stock Exchange* |
Securities registered or to be registered pursuant to Section 12(g) of the Act:
None
Securities for which there is a reporting obligation pursuant to Section 15(d) of the Act:
None
Indicate the number of outstanding shares of each of the issuer’s classes of capital or common stock as of the close of the period covered by the annual report: 606,407,693.
Indicate by check mark if the registrant is a well-known seasoned issuer, as defined in Rule 405 of the Securities Act. Yes x☒ No ¨☐
If this report is an annual or transition report, indicate by check mark if the registrant is not required to file reports pursuant to Section 13 or 15(d) of the Securities Exchange Act of 1934. Yes ¨☐ No x☒
Indicate by check mark whether the registrant (1) has filed all reports required to be filed by Section 13 or 15(d) of the Securities Exchange Act of 1934 during the preceding 12 months (or for such shorter period that the registrant was required to file such reports), and (2) has been subject to such filing requirements for the past 90 days. Yes x☒ No ¨☐
Indicate by check mark whether the registrant has submitted electronically and posted on its corporate Web site, if any, every Interactive Data File required to be submitted and posted pursuant to Rule 405 of Regulation S-T (§232.405 of this chapter) during the preceding 12 months (or for such shorter period that the registrant was required to submit and post such files). Yes ¨☒ No x☐
Indicate by check mark whether the registrant is a large accelerated filer, an accelerated filer, or a non-accelerated filer. See definition of “accelerated filer and large accelerated filer” in Rule 12b-2 of the Exchange Act. (Check one):
Large Accelerated filer x☒ | Accelerated filer ¨☐ | Non-Accelerated filer ☐ | ¨ |
| | | Emerging Growth Company ☐ | ¨ |
If an emerging growth company that prepares its financial statements in accordance with U.S. GAAP, indicate by check mark if the registrant has elected not to use the extended transition period for complying with any new or revised financial accounting standards† provided pursuant to Section 13(a) of the Exchange Act. ¨☐
†The term “new or revised financial accounting standard” refers to any update issued by the Financial Accounting Standards Board to its Accounting Standards Codification after April 5, 2012.
Indicate by check mark which basis of accounting the registrant has used to prepare the financial statements included in this filing:
U.S. GAAP ¨☐ | International Financial Reporting Standards as issued | |
| by the International Accounting Standards Board x☒ | Other ¨☐ |
If “Other” has been checked in response to the previous question, indicate by check mark which financial statement item the registrant has elected to follow:
Item 17 ¨☐ Item 18 ¨☐
If this is an annual report, indicate by check mark whether the registrant is a shell company (as defined in Rule 12b-2 of the Exchange Act). Yes ¨☐ No x☒
TABLE OF CONTENTS
PRESENTATION OF INFORMATION
Throughout this annual report on Form 20-F we make numerous references to “LATAM”. Unless the context otherwise requires, references to “LATAM Airlines Group” are to LATAM Airlines Group S.A., the unconsolidated operating entity, and references to “LATAM,” “we,” “us” or the “Company” are to LATAM Airlines Group S.A. and its consolidated affiliates: Transporte Aéreo S.A. (“LATAM Airlines Chile”), LATAM Airlines Peru S.A. (f/k/a LAN Perú S.A. (“LATAMPeru S.A, “LATAM Airlines Peru”), Aerolane, Líneas Aéreas Nacionales del Ecuador S.A. (“LATAM Airlines Ecuador”), LAN Argentina S.A. (“LATAM Airlines Argentina,” previously Aero 2000 S.A.), Aerovías de Integración Regional, Aires S.A. (“LATAM Airlines Colombia”), TAM S.A. (“TAM” or “LATAM Airlines Brazil”), LAN Cargo S.A. (“LATAM Cargo”) and its threetwo regional affiliates: Aero Transportes Mas de Carga S.A. de C.V. (“MasAir”) in Mexico, Linea Aerea Carguera de Colombia S.A. (“LANCO”) in Colombia and Aerolinhas Brasileiras S.A. (“ABSA”) in Brazil. Other references to “LATAM”, as the context requires, are to the LATAM brand which was launched in 2016 and brings together, under one internationally recognized name, all of the affiliate brands such as LATAM Airlines Chile, LATAM Airlines Peru, LATAM Airlines Argentina, LATAM Airlines Colombia, LATAM Airlines Ecuador and LATAM Airlines Brazil.
References to “LAN” are to LAN Airlines S.A., currently known as LATAM Airlines Group S.A., and its consolidated affiliates, in connection with circumstances and facts occurring prior to the completion date of the combination between LAN Airlines S.A. and TAM S.A. See “Item 4. Information on the Company—A. History and Development of the Company.”
In this annual report on Form 20-F, unless the context otherwise requires, references to “TAM” are to TAM S.A., and its consolidated affiliates, including TAM Linhas Aereas S.A. (“TLA”), which does business under the name “LATAM Airlines Brazil”, Multiplus S.A. (“Multiplus”), Fidelidade Viagens e Turismo Limited (“TAM Viagens”) and Transportes Aéreos Del Mercosur S.A. (“TAM Mercosur”).
LATAM Airlines Group and the majority of our affiliates maintain their accounting records and prepare their financial statements in U.S. dollars. Some of our affiliates, however, maintain their accounting records and prepare their financial statements in Chilean pesos, Argentinean pesos, Colombian pesos or Brazilian real. In particular, TAM maintains its accounting records and prepares its financial statements in Brazilian real. Our audited consolidated financial statements include the results of these affiliates translated into U.S. dollars. International Financial Reporting Standards (“IFRS”) as issued by the International Accounting Standards Board (“IASB”), require assets and liabilities to be translated at period-end exchange rates, while revenue and expense accounts are translated at each transaction date, although a monthly rate may also be used if exchange rates do not vary widely.
In this annual report on Form 20-F, all references to “Chile” are references to the Republic of Chile. This annual report contains conversions of certain Chilean peso and Brazilian real amounts into U.S. dollars at specified rates solely for the convenience of the reader. These conversions should not be construed as representations that the Chilean peso and the Brazilian real amounts actually represent such U.S. dollar amounts or could be converted into U.S. dollars at the rate indicated. Unless we specify otherwise, all references to “$”, “US$”, “U.S. dollars” or “dollars” are to United States dollars, references to “pesos,” “Chilean pesos” or “Ch$” are to Chilean pesos. References to “real,” “Brazilian real” or “R$” are to Brazilian real, and references to “UF” are toUnidades de Fomento, a daily indexed Chilean peso-denominated monetary unit that takes into account the effect of the Chilean inflation rate. Unless we indicate otherwise, the U.S. dollar equivalent for information in Chilean pesos used in this annual report and in our audited consolidated financial statements is based on the “dólar observado” or “observed” exchange rate published byBanco Central de Chile (which we refer to as the Central Bank of Chile) on December 31, 2017,2019, which was Ch$615.22744.62 = US$1.00. The observed exchange rate on, April 3, 2018,March 18, 2020, was Ch$604.06855.09 = US$1.00. Unless we indicate otherwise, the U.S. dollar equivalent for information in Brazilian real used in this annual report and in our audited consolidated financial statements is based on the average “bid and offer rate” published by Banco Central do Brasil (which we refer to as the Central Bank of Brazil) on December 31, 2017,2019, which was R$3.314.03 = US$1.00. The observed exchange rate on April 3, 2018,March 18, 2020, was R$3.325.11 = US$1.00. The Federal Reserve Bank of New York does not report a noon buying rate for Chilean pesos or Brazilian real.
LATAM has a single series of shares of Common Stock, without par value, listed on Chilean Stock Exchange and American Depositary Shares (evidenced by American Depositary Receipts), each representing one share of Common Stock, that are listed on the New York Stock Exchange under the Symbol “LTM”
We have rounded percentages and certain U.S. dollar, Chilean peso and Brazilian real amounts contained in this annual report for ease of presentation. Any discrepancies in any table between totals and the sums of the amounts listed are due to rounding.
LATAM’s audited consolidated financial statements for the periods ended December 31, 2013, 2014, 2015, 2016, 2017, 2018 and 20172019 were prepared in accordance with IFRS.
This annual report contains certain terms that may be unfamiliar to some readers. You can find a glossary of these terms on page 32 of this annual report.
FORWARD-LOOKING STATEMENTS
This annual report contains forward-looking statements. Such statements may include words such as “anticipate,” “estimate,” “expect,” “project,” “intend,” “plan,” “believe” or other similar expressions. Forward-looking statements, including statements about our beliefs and expectations, are not statements of historical facts. These statements are based on current plans, estimates and projections, and, therefore, you should not place undue reliance on them. Forward-looking statements involve inherent risks and uncertainties. We caution you that a number of important factors could cause actual results to differ materially from those contained in any forward-looking statement. These factors include, but are not limited to:
the factors described in “Item 3. Key Information—Risk Factors”;
our ability to service our debt and fund our working capital requirements;
future demand for passenger and cargo air services in Chile, Brazil, other countries in Latin America and the rest of the world;
the determination of relationships with customers;
the state of the Chilean, Brazilian, other Latin American and world economies and their impact on the airline industry;
the effects of competition;
future terrorist incidents, cyberattacks or related activities affecting the airline industry;
future outbreak of diseases, or the spread of already existing diseases, affecting traveling behavior and/or exports;
natural disasters affecting traveling behavior and/or exports;
the relative value of the Chilean peso and other Latin American currencies compared to other world currencies;
inflation;
competitive pressures on pricing;
our capital expenditure plans;
changes in labor costs, maintenance costs and insurance premiums;
fluctuation of crude oil prices and its effect on fuel costs;
cyclical and seasonal fluctuations in our operating results;
defects or mechanical problems with our aircraft;
our ability to successfully implement our growth strategy;
increases in interest rates; and
changes in regulations, including regulations related to access to routes in which we operate and environmental regulations.
| ● | the factors described in “Item 3. Key Information—Risk Factors”; |
| ● | our ability to service our debt and fund our working capital requirements; |
| ● | future demand for passenger and cargo air services in Chile, Brazil, other countries in Latin America and the rest of the world; |
| ● | the determination of relationships with customers; |
| ● | the state of the Chilean, Brazilian, other Latin American and world economies and their impact on the airline industry; |
| ● | the effects of competition in the airline industry; |
| ● | future terrorist incidents, cyberattacks or related activities affecting the airline industry; |
| ● | future outbreak of diseases, or the spread of already existing diseases, affecting travel behavior and/or exports; |
| ● | natural disasters affecting travel behavior and/or exports; |
| ● | the relative value of the Chilean peso and other Latin American currencies compared to other world currencies; |
| ● | competitive pressures on pricing; |
| ● | our capital expenditure plans; |
| ● | changes in labor costs, maintenance costs and insurance premiums; |
| ● | fluctuation of crude oil prices and its effect on fuel costs; |
| ● | cyclical and seasonal fluctuations in our operating results; |
| ● | defects or mechanical problems with our aircraft; |
| ● | our ability to successfully implement our growth strategy; |
| ● | our plans relative to acquisitions, joint ventures, strategic alliances or divestitures; |
| ● | increases in interest rates; and |
| ● | changes in regulations, including regulations related to access to routes in which we operate and environmental regulations. |
Forward-looking statements speak only as of the date they are made, and we undertake no obligation to publicly update any of them, whether in light of new information, future events or otherwise. You should also read carefully the risk factors described in “Item 3. Key Information—Risk Factors.”
GLOSSARY OF TERMS
The following terms, as used in this annual report, have the meanings set forth below.
| Consolidated Affiliates of LATAM: | |
| | |
| “ABSA” | | Aerolinhas Brasileiras S.A., incorporated in Brazil. |
| | | |
| “LANCO” | | Línea Aérea Carguera de Colombia S.A., incorporated in Colombia. |
| | | |
| “LATAM Airlines Argentina” | | LAN Argentina S.A., incorporated in Argentina. |
| | |
| “LATAM Airlines Chile” | | Transporte Aéreo S.A., incorporated in Chile. |
| “LATAM Airlines Colombia” | | Aerovías de Integración Regional, Aires S.A., incorporated in Colombia. |
| | | |
| “LATAM Airlines Ecuador” | Aerolane, Líneas Aéreas Nacionales del | LATAM-Airlines Ecuador S.A., incorporated in Ecuador. |
| | |
| “LATAM Airlines Peru” | | LATAM Airlines Peru S.A. (f/ka LAN PerúPeru S.A.), incorporated in Peru. |
| | |
| “LATAM Cargo” | | LAN Cargo S.A., incorporated in Chile. |
| | |
“MasAir” | Aero Transportes Mas de Carga S.A. de C.V., incorporated in Mexico. |
| |
| “TAM” | | TAM S.A., incorporated in Brazil. |
| Capacity Measurements: | | |
| | |
| “available seat kilometers” or “ASKs” | | The sum, across our network, of the number of seats made available for sale on each flight multiplied by the kilometers flown by the respective flight. |
| | | |
| “available ton kilometers” or “ATKs” | | The sum, across our network, of the number of tons available for the transportation of revenue load (cargo) on each flight multiplied by the kilometers flown by the respective flight. |
| | | |
| Traffic Measurements: | | |
| | |
| “revenue passenger kilometers” or “RPKs” | | The sum, across our network, of the number of revenue passengers on each flight multiplied by the number of kilometers flown by the respective flight. |
| | | |
| “revenue ton kilometers” or “RTKs” | | The sum, across our network, of the load (cargo) in tons on each flight multiplied by the kilometers flown by the respective flight. |
| | | |
| “traffic revenue” | | Revenue from passenger and cargo operations. |
| | | |
| Yield Measurements: | | |
| | |
| “cargo yield” | | Revenue from cargo operations divided by RTKs. |
| | | |
| “passenger yield” | | Revenue from passenger operations divided by RPKs. |
| | | |
| Load Factors: | | |
| | |
| “cargo load factor” | | RTKs expressed as a percentage of ATKs. |
| | | |
| “passenger load factor” | | RPKs expressed as a percentage of ASKs. |
| | | |
| Other: | | |
| | |
| “Airbus A320-Family Aircraft” | | The Airbus A319, Airbus A320, Airbus A320 neo and Airbus A321 models of aircraft.aircraft, including both ceo and neo variants. |
| | |
| “m²” | | Square meters. |
| | | |
| “ton” | | A metric ton, equivalent to 2,204.6 pounds. |
| | |
| “utilization rates” | | The actual number of service hours per aircraft per operating day. |
| “operating expenses” | | Operating expenses, which are calculated in accordance with IFRS, comprise the sum of the line items “cost of sales” plus “distribution costs” plus “administrative expenses” plus “other operating expenses,” as shown on our consolidated statement of comprehensive income. These operating expenses include: wages and benefits, fuel, depreciation and amortization, commissions to agents, aircraft rentals, other rental and landing fees, passenger services, aircraft maintenance and other operating expenses. |
| | | |
| “MiSchDynamicDT” | | Market Intelligence Schedule Dynamic Table. |
| | | |
“Diio“Diio Mi” | | Data In Intelligence Out Market Intelligence. |
| | | |
| “CO2” | Carbon Dioxide Gas | carbon dioxide gas |
| | 5 | |
| “PIS/COFINS” | | “Program of Social Integration” and “Contribution for the Financing of Social Security” federal taxes in Brazil |
PART I
| ITEM 1. | IDENTITY OF DIRECTORS, SENIOR MANAGEMENT AND ADVISERS |
Not applicable.
| ITEM 2. | OFFER STATISTICS AND EXPECTED TIMETABLE |
Not applicable.
A. Selected Financial Data
LATAM’s Historical Financial Information
The summary consolidated annual financial information of LATAM as of December 31, 2019, 2018, 2017, 2016, 2015, 2014 and 20132015 has been prepared in accordance with IFRS(*)IFRS. In 2019, the Company adopted IFRS 16,Leases, retrospectively; restating the comparative figures as of December 31, 2018 and for the years ended December 31, 2018 and 2017, in accordance with the provisions of IAS 8,Accounting Policies, Changes in Accounting Estimates and Errors. The selected Statement of Income Data for the years ended 2016 and 2015 and the selected Balance Sheet Data as of December 31, 2017, 2016 and 2015 have not been restated.
LATAM’s Annual Financial Information
| | | Year ended December 31, | | | Year ended December 31, | |
| | | 2017 | | 2016 | | 2015 | | 2014 | | 2013 | | | 2019 | | | 2018
restated | | | 2017
restated | | | 2016 | | | 2015 | |
| | | (in US$ millions, except per share and capital stock data) | | | (in US$ millions, except per share and capital stock data) | |
| The Company(1)(2) | | | | | | | | | | | | | | | | | | | | | |
| Statement of Income Data: | | | | | | | | | | | | | | | | | | | | | |
| The Company Statement of Income Data(1)(2)(3): | | | | | | | | | | | | |
| Operating revenues | | | | | | | | | | | | | | | | | | | | | | | | | | | | | | | | | | | | | | | | |
| Passenger | | | 8,494.5 | | | | 7,877.7 | | | | 8,410.6 | | | | 10,380.1 | | | | 11,061.5 | | | | 9,005.6 | | | | 8,709.0 | | | | 8,494.5 | | | | 7,877.7 | | | | 8,410.6 | |
| Cargo | | | 1,119.4 | | | | 1,110.6 | | | | 1,329.4 | | | | 1,713.4 | | | | 1,863.0 | | | | 1,064.4 | | | | 1,186.5 | | | | 1,119.4 | | | | 1,110.6 | | | | 1,329.4 | |
| | | | | | | | | | | | | | | | | | | | | | | | | | | | | | | | | | | | | | | | | |
| Total operating revenues | | | 9,613.9 | | | | 8,988.3 | | | | 9,740.0 | | | | 12,093.5 | | | | 12,924.5 | | | | 10,070.1 | | | | 9,895.5 | | | | 9,613.9 | | | | 8,988.3 | | | | 9,740.0 | |
| | | | | | | | | | | | | | | | | | | | | | |
| Cost of sales | | | (7,441.8 | ) | | | (6,967.0 | ) | | | (7,636.7 | ) | | | (9,624.5 | ) | | | (10,054.2 | ) | | | (7,951.3 | ) | | | (7,773.4 | ) | | | (7,279.4 | ) | | | (6,967.0 | ) | | | (7,636.7 | ) |
| | | | | | | | | | | | | | | | | | | | | | | | | | | | | | | | | | | | | | | | | |
| Gross margin | | | 2,172.1 | | | | 2,021.3 | | | | 2,103.3 | | | | 2,469.0 | | | | 2,870.3 | | | | 2,118.8 | | | | 2,122.0 | | | | 2.334,5 | | | | 2,021.3 | | | | 2,103.3 | |
Other operating income(3)(4) | | | 549.9 | | | | 538.7 | | | | 385.8 | | | | 377.6 | | | | 341.6 | | | | 360.9 | | | | 472.8 | | | | 549.9 | | | | 538.7 | | | | 385.8 | |
| Distribution costs | | | (699.6 | ) | | | (747.4 | ) | | | (783.3 | ) | | | (957.1 | ) | | | (1,025.9 | ) | | | (580.0 | ) | | | (615.2 | ) | | | (696.8 | ) | | | (747.4 | ) | | | (783.3 | ) |
| Administrative expenses | | | (938.9 | ) | | | (873.0 | ) | | | (878.0 | ) | | | (980.7 | ) | | | (1,136.1 | ) | | | (735.2 | ) | | | (736.3 | ) | | | (952.8 | ) | | | (873.0 | ) | | | (878.0 | ) |
| Other expenses | | | (368.9 | ) | | | (373.7 | ) | | | (324.0 | ) | | | (401.0 | ) | | | (408.7 | ) | | | (422.8 | ) | | | (356.3 | ) | | | (365.5 | ) | | | (373.7 | ) | | | (324.0 | ) |
| Other gains/(losses) | | | (7.8 | ) | | | (72.6 | ) | | | (55.3 | ) | | | 33.5 | | | | (55.4 | ) | | | 11.5 | | | | 53.5 | | | | (7.8 | ) | | | (72.6 | ) | | | (55.3 | ) |
| Financial income | | | 78.7 | | | | 74.9 | | | | 75.1 | | | | 90.5 | | | | 72.8 | | | | 26.3 | | | | 53.3 | | | | 78.7 | | | | 74.9 | | | | 75.1 | |
| Financial costs | | | (393.3 | ) | | | (416.3 | ) | | | (413.4 | ) | | | (430.0 | ) | | | (462.5 | ) | | | (589.9 | ) | | | (539.1 | ) | | | (579.2 | ) | | | (416.3 | ) | | | (413.4 | ) |
| Equity accounted earnings | | | 0.0 | | | | 0.0 | | | | 0.0 | | | | (6.5 | ) | | | 2.0 | | | | 0.0 | | | | 0.0 | | | | 0.0 | | | | 0.0 | | | | 0.0 | |
| Exchange rate differences | | | (18.7 | ) | | | 121.7 | | | | (467.9 | ) | | | (130.2 | ) | | | (482.2 | ) | |
| Foreign exchange gains/losses | | | | (32.6 | ) | | | (38.1 | ) | | | (48,5 | ) | | | 121.7 | | | | (467.9 | ) |
| Result of indexation units | | | 0.7 | | | | 0.3 | | | | 0.6 | | | | 0.1 | | | | 0.3 | | | | (15.0 | ) | | | (0.9 | ) | | | 0.7 | | | | 0.3 | | | | 0.6 | |
| | | | | | | | | | | | | | | | | | | | | | | | | | | | | | | | | | | | | | | | | |
| Income (loss) before income taxes | | | 374.2 | | | | 273.9 | | | | (357.1 | ) | | | 65.2 | | | | (283.8 | ) | | | 141.9 | | | | 415.7 | | | | 313.4 | | | | 273.9 | | | | (357.1 | ) |
| Income (loss) tax expense/benefit | | | (173.5 | ) | | | (163.2 | ) | | | 178.4 | | | | (292.4 | ) | | | 20.0 | | | | 53.7 | | | | (73.9 | ) | | | (159.0 | ) | | | (163.2 | ) | | | 178.4 | |
| | | | | | | | | | | | | | | | | | | | | | | | | | | | | | | | | | | | | | | | | |
| Net (loss) income for the period | | | 200.7 | | | | 110.7 | | | | (178.7 | ) | | | (227.2 | ) | | | (263.8 | ) | |
| Income (loss) attributable to the parent company’s equity holders | | | 155.3 | | | | 69.2 | | | | (219.3 | ) | | | (260.0 | ) | | | (281.1 | ) | |
| Net (loss) income for the year | | | | 195.6 | | | | 341.8 | | | | 154.4 | | | | 110.7 | | | | (178.7 | ) |
| Income (loss) attributable to owners of the parent | | | | 190.4 | | | | 309.8 | | | | 108.9 | | | | 69.2 | | | | (219.3 | ) |
| Income (loss) attributable to non-controlling interests | | | 45.4 | | | | 41.5 | | | | 40.5 | | | | 32.8 | | | | 17.3 | | | | 5.2 | | | | 32.0 | | | | 45.5 | | | | 41.5 | | | | 40.5 | |
| | | | | | | | | | | | | | | | | | | | | | | | | | | | | | | | | | | | | | | | | |
| Net income (loss) for the year | | | 200.7 | | | | 110.7 | | | | (178.7 | ) | | | (227.2 | ) | | | (263.8 | ) | | | 195.6 | | | | 341.8 | | | | 154.4 | | | | 110.7 | | | | (178.7 | ) |
| | | | | | | | | | | | | | | | | | | | | | | | | | | | | | | | | | | | | | | | | |
| Earnings per share | | | | | | | | | | | | | | | | | | | | | | | | | | | | | | | | | | | | | | | | |
| Average number of Shares | | | 606,407,693 | | | | 546,559,599 | | | | 545,547,819 | | | | 545,547,819 | | | | 487,930,977 | | | | 606,407,693 | | | | 606,407,693 | | | | 606,407,693 | | | | 546,559,599 | | | | 545,547,819 | |
| Basic earnings (loss) per share (US$) | | | 0.25610 | | | | 0.12665 | | | | (0.40193 | ) | | | (0.47656 | ) | | | (0.57613 | ) | | | 0.31403 | | | | 0.51090 | | | | 0.17958 | | | | 0.12665 | | | | (0.40193 | ) |
| Diluted earnings (loss) per share (US$) | | | 0.25610 | | | | 0.12665 | | | | (0.40193 | ) | | | (0.47656 | ) | | | (0.57613 | ) | | | 0.31403 | | | | 0.51090 | | | | 0.17958 | | | | 0.12665 | | | | (0.40193 | ) |
| | | As of December 31, | |
| | | 2019 | | | 2018
restated | | | 2017 | | | 2016 | | | 2015 | |
| | | (in US$ millions, except per share and capital stock data) | |
| Balance Sheet Data: | | | |
| Cash, and cash equivalents | | | 1,072.6 | | | | 1,081.6 | | | | 1,142.0 | | | | 949.3 | | | | 753.5 | |
| Other current assets in operation | | | 2,460.5 | | | | 2,188.5 | | | | 2,312.4 | | | | 2,340.3 | | | | 2,067.4 | |
| Non-current assets and disposal groups held for sale | | | 485.2 | | | | 5.8 | | | | 291.1 | | | | 337.2 | | | | 2.0 | |
| | | | | | | | | | | | | | | | | | | | | |
| Total current assets | | | 4,018.2 | | | | 3,275.9 | | | | 3,745.5 | | | | 3,626.8 | | | | 2,822.9 | |
| Property and equipment | | | 12,919.6 | | | | 12,501.8 | | | | 10,065.3 | | | | 10,498.1 | | | | 10,938.7 | |
| Other non-current assets | | | 4,150.0 | | | | 4,301.1 | | | | 4,987.2 | | | | 5,073.3 | | | | 4,339.8 | |
| | | | | | | | | | | | | | | | | | | | | |
| Total non-current assets | | | 17,069.6 | | | | 16,802.9 | | | | 15,052.5 | | | | 15,571.4 | | | | 15,278.5 | |
| | | | | | | | | | | | | | | | | | | | | |
| Total assets | | | 21,087.8 | | | | 20,078.7 | | | | 18,798.0 | | | | 19,198.2 | | | | 18,101.4 | |
| Total current liabilities | | | 6,960.9 | | | | 5,932.2 | | | | 5,842.7 | | | | 6,222.2 | | | | 5,641.0 | |
| Total non-current liabilities | | | 10,997.7 | | | | 10,705.9 | | | | 8,688.0 | | | | 8,790.7 | | | | 9,522.9 | |
| | | | | | | | , | | | | | | | | | | | | | |
| Total liabilities | | | 17,958.6 | | | | 16,638.1 | | | | 14,530.7 | | | | 15,012.9 | | | | 15,163.9 | |
| Share capital | | | 3,146.3 | | | | 3,146.3 | | | | 3,146.3 | | | | 3,149.6 | | | | 2,545.7 | |
| Net equity attributable to the parent company’s equity holders | | | 3,130.8 | | | | 3,360.7 | | | | 4,176.1 | | | | 4,096.7 | | | | 2,856.5 | |
| Non-controlling interest | | | (1.6 | ) | | | 79.9 | | | | 91.1 | | | | 88.6 | | | | 81.0 | |
| | | | | | | | | | | | | | | | | | | | | |
| Total equity | | | 3,129.2 | | | | 3,440.6 | | | | 4,267.2 | | | | 4,185.3 | | | | 2,937.5 | |
| | | | | | | | | | | | | | | | | | | | | |
| Shares Outstanding | | | 606,407,693 | | | | 606,407,693 | | | | 606,407,693 | | | | 606,407,693 | | | | 545,547,819 | |
| | | Year ended December 31, | |
| | | 2017 | | | 2016 | | | 2015 | | | 2014 | | | 2013 | |
| | | (in US$ millions, except per share and capital stock data) | |
| Balance Sheet Data: | | | | | | | | | | | | | | | | | | | | |
| Cash, and cash equivalents | | | 1,142.0 | | | | 949.3 | | | | 753.5 | | | | 989.4 | | | | 1,984.9 | |
| Other current assets in operation | | | 2,312.4 | | | | 2,340.3 | | | | 2,067.4 | | | | 2,644.1 | | | | 2,992.2 | |
| Non-current assets and disposal groups held for sale | | | 291.1 | | | | 337.2 | | | | 2.0 | | | | 1.1 | | | | 2.4 | |
| Total current assets | | | 3,745.5 | | | | 3,626.8 | | | | 2,822.9 | | | | 3,634.6 | | | | 4,979.5 | |
| Property and equipment | | | 10,065.3 | | | | 10,498.1 | | | | 10,938.7 | | | | 10,773.1 | | | | 10,982.8 | |
| Other non-current assets | | | 4,987.2 | | | | 5,073.3 | | | | 4,339.8 | | | | 6,076.7 | | | | 6,668.8 | |
| Total non-current assets | | | 15,052.5 | | | | 15,571.4 | | | | 15,278.5 | | | | 16,849.8 | | | | 17,651.6 | |
| Total assets | | | 18,798.0 | | | | 19,198.2 | | | | 18,101.4 | | | | 20,484.4 | | | | 22,631.1 | |
| Total current liabilities | | | 5,842.7 | | | | 6,222.2 | | | | 5,641.0 | | | | 5,829.7 | | | | 6,509.1 | |
| Total non-current liabilities | | | 8,688.0 | | | | 8,790.7 | | | | 9,522.9 | | | | 10,151.0 | | | | 10,795.6 | |
| Total liabilities | | | 14,530.7 | | | | 15,012.9 | | | | 15,163.9 | | | | 15,980.7 | | | | 17,304.7 | |
| Issued capital | | | 3,146.3 | | | | 3,149.6 | | | | 2,545.7 | | | | 2,545.7 | | | | 2,389.4 | |
| Net equity attributable to the parent company’s equity holders | | | 4,176.1 | | | | 4,096.7 | | | | 2,856.5 | | | | 4,401.9 | | | | 5,238.8 | |
| Non-controlling interest | | | 91.1 | | | | 88.6 | | | | 81.0 | | | | 101.8 | | | | 87.7 | |
| Total net equity | | | 4,267.2 | | | | 4,185.3 | | | | 2,937.5 | | | | 4,503.7 | | | | 5,326.5 | |
| | | | | | | | | | | | | | | | | | | | | |
| Shares Outstanding | | | 606,407,693 | | | | 606,407,693 | | | | 545,547,819 | | | | 545,547,819 | | | | 535,243,229 | |
| (1) | For more information on the affiliatessubsidiaries included, in this consolidated information, see Note 1 to our audited consolidated financial statements. |
| (2) | The addition of the items may differ from the total amount due to rounding. |
| (3) | For the effects of the adoption of IFRS 15 and IFRS 16 see Note 2.1 to the Fnancial Statements” |
| (4) | Other operating income included in this Statement of Income Data is equivalent to the sum of income derived from Coalition and Loyalty Program, Tours, Duty free, aircraft leasing, Maintenance, customs and warehousing operations, and other miscellaneous income. For more information, see Note 28 to our audited consolidated financial statements. |
(*)Law No. 20,780 issued on September 29, 2014, introduced modifications to the income tax system in Chile and other tax matters. On October 17, 2014 the Chilean Comission for the Finance Market (the “CMF”) (previously, the Superintendency of Securities) issued Circular No. 856, which established that the effects of the change in the income tax rates on deferred tax assets and liabilities must be recognized directly on the Balance Sheet within “Retained earnings” instead of on the Income Statement as required by IAS 12. In order to comply with IAS 12, the financial statements in this document for the period ended December 31, 2014 are different from those presented to the CMF as the modifications introduced by Law No. 20,780 have been recognized within the income statement. For more information on the reconciliation of such differencessee Note 18 to our audited consolidated financial statements.
The table below presents LATAM’s unaudited operating data as of and for the year ended December 31, 2013, December 31, 2014, December 31, 2015, December 31, 2016, December 31, 2017, December 31, 2018 and December 31, 2017.2019. LATAM believes this operating data is useful in reporting the operating performance of its business and may be used by certain investors in evaluating companies operating in the global air transportation sector. However, these measures may differ from similarly titled measures reported by other companies, and should not be considered in isolation or as a substitute for measures of performance in accordance with IFRS. This unaudited operating data is not included in or derived from LATAM’s financial statements.
| | | For the year ended and as of December 31, | | | Year ended December 31, | |
| Operating Data: | | 2017 | | 2016 | | 2015 | | 2014 | | 2013 | | | 2019 | | | 2018 | | | 2017 | | | 2016 | | | 2015 | |
| ASKs (million) | | | 136,398.4 | | | | 134,967.7 | | | | 134,167.1 | | | | 130,200.9 | | | | 131,690.9 | | | | 149,111.9 | | | | 143,264.7 | | | | 136,398.4 | | | | 134,967.7 | | | | 134,167.1 | |
| RPKs (million) | | | 115,692.7 | | | | 113,626.9 | | | | 111,509.9 | | | | 108,534.0 | | | | 106,466.5 | | | | 124,521.1 | | | | 119,077.4 | | | | 115,692.7 | | | | 113,626.9 | | | | 111,509.9 | |
| ATKs (million) | | | 6,230.1 | | | | 6,704.1 | | | | 7,082.8 | | | | 7,219.7 | | | | 7,651.9 | | | | 6,356.7 | | | | 6,497.6 | | | | 6,230.3 | | | | 6,704.1 | | | | 7,082.8 | |
| RTKs (million) | | | 3,421.2 | | | | 3,465.9 | | | | 3,797.0 | | | | 4,317.2 | | | | 4,466.7 | | | | 3,526.0 | | | | 3,582.5 | | | | 3,421.3 | | | | 3,465.9 | | | | 3,797.0 | |
Dividend Policy
In accordance with theLey sobre Sociedades Anónimas No. 18,046 (“Chilean Corporation Act”) and theReglamento de Sociedades Anónimas(“Regulation to the Chilean Corporation Act”, and together with the Chilean Corporation Act, the “Chilean Corporation Law”), we must pay annual cash dividends equal to at least 30.0% of our annual consolidated net income for the prior year, subject to limited exceptions. LATAM Airlines Group’s board of directors has the authority to declare interim dividends. Year-end dividends, if any, are declared by our shareholders at our annual meeting. For a description of our dividend policy, see “Item 8. Financial Information—Consolidated Financial Statements and Other Financial Information—Dividend Policy” and “Item 10. Additional Information—Dividend and Liquidation Rights” LATAM did not pay dividends in 2014, 2015 or 2016. On May 18, 2017, LATAM paid US$20,766,119 in dividends in respect of the year ended December 31, 2016. On May 17, 2018, LATAM paid US$46,591,193 in dividends in respect of year ended December 31, 2017. On May 17, 2019, LATAM paid US$54,580,443 in dividends in respect of year ended December 31, 2018. In addition, dividend reserves of US$46,591,19357,129,120 were set aside for 2017,2019, to be paid in 2018.
2020.
We declare cash dividends in U.S. dollars, but make dividend payments in Chilean pesos, converted from U.S. dollars at the observed exchange rate two business days prior to the day we first make payment to shareholders. Payments of cash dividends to holders of ADSs, if any, are made in Chilean pesos to the custodian, who converts those Chilean pesos into U.S. dollars and delivers U.S. dollars to the depositary for distribution to holders of ADS. The amount of U.S. dollars distributed to holders of ADSs may be adversely affected by a devaluation of the Chilean currency that may occur before such dividends are converted and remitted.
LATAM’s Dividend Payments
The table below sets forth the cash dividends per common share and per ADS paid by LATAM, as well as the number of common shares entitled to such dividends, for the years indicated. Dividends per common share amounts reflect common share amounts outstanding immediately prior to the distribution of such dividend.
| Dividend for year: | | Payment date(s) | | Total dividend
payment | | Number of
common
shares
entitled to
dividend | | Cash
dividend per
common
share | | Cash
dividend per
ADS | | | Payment date(s) | | Total dividend
payment | | Number of
common
shares
entitled to
dividend | | Cash
dividend per
common
share | | Cash
dividend per
ADS | |
| | | | | (U.S. dollars) | | (in millions) | | (U.S. dollars) | | (U.S. dollars) | | | | | (U.S. dollars) | | (in millions) | | (U.S. dollars) | | (U.S. dollars) | |
| | | | | | | | | | | | | | | | | | | | | | | | | | | | |
| 2016 | | May 18, 2017 | | | 20,766,119 | | | | 606.41 | | | | 0.03424 | | | | 0.03424 | | | May 18, 2017 | | $ | 20,766,119 | | | | 606.41 | | | $ | 0.03424 | | | $ | 0.03424 | |
| 2017 | | | May 17, 2018 | | $ | 46,591,193 | | | | 606.41 | | | $ | 0.07683 | | | $ | 0.07683 | |
| 2018 | | | May 16, 2019 | | $ | 54,580,443 | | | | 606.41 | | | $ | 0.09001 | | | $ | 0.09001 | |
Chilean Peso Exchange Rates
The following table sets forth, for the periods indicated, the high, low, average and period-end observed exchange rate for the purchase of U.S. dollars, expressed in Chilean pesos per U.S. dollar. The rates have not been restated in constant currency units. On April 3, 2018 the observed exchange rate was Ch$604.06 = US$1.00.
| | | Daily Observed Exchange Rate | |
Year Ended December 31, | | High | | | Low | | | Average(1) | | | Period-End | |
| | | Ch$ per US$ | |
| | | | | | | | | | | | | |
| 2013 | | | 533.95 | | | | 466.50 | | | | 495.00 | | | | 523.76 | |
| 2014 | | | 621.41 | | | | 524.61 | | | | 570.01 | | | | 607.38 | |
| 2015 | | | 715.66 | | | | 597.10 | | | | 654.25 | | | | 707.34 | |
| 2016 | | | 730.31 | | | | 645.22 | | | | 676.83 | | | | 667.29 | |
| 2017 | | | 679.05 | | | | 615.22 | | | | 649.33 | | | | 615.22 | |
| 2017 | | | | | | | | | | | | | | | | |
| October | | | 640.52 | | | | 619.68 | | | | 629.55 | | | | 636.49 | |
| November | | | 642.41 | | | | 629.21 | | | | 633.77 | | | | 642.41 | |
| December | | | 655.74 | | | | 615.22 | | | | 636.92 | | | | 615.22 | |
| | | | | | | | | | | | | | | | | |
| 2018 | | | | | | | | | | | | | | | | |
| | | | | | | | | | | | | | | | | |
| January | | | 614.75 | | | | 599.33 | | | | 605.53 | | | | 604.42 | |
| February | | | 603.25 | | | | 588.28 | | | | 596.84 | | | | 589.15 | |
| March | | | 609.58 | | | | 593.61 | | | | 603.45 | | | | 605.26 | |
Source: Central Bank of Chile
| (1) | For each year, the average daily exchange rates for the relevant year. For each month, the average daily exchange rate for the relevant month. |
B. Capitalization and Indebtedness
Not applicable.
C. Reasons for the Offer and Use of Proceeds
Not applicable.
D. Risk Factors
The following important factors, and those important factors described in other reports we submit to or file with the Securities and Exchange Commission (“SEC”), could affect our actual results and could cause our actual results to differ materially from those expressed in any forward-looking statements made by us or on our behalf. In particular, as we are a non-U.S. company, there are risks associated with investing in our ADSs that are not typical for investments in the shares of U.S. companies. Prior to making an investment decision, you should carefully consider all of the information contained in this document, including the following risk factors.
Risk Factors Relating to our Company
LATAM does not control the voting shares or board of directors of TAM
Due to Brazilian law restrictions on foreign ownership of Brazilian airlines, LATAM does not control the voting shares or board of directors of TAM. As of February 28, 2018, the ownership structure of TAM is as follows:
| • | Holdco I owns 100% of the TAM common shares previously outstanding; |
| | |
the Amaro family (the “Amaro Group”) own approximately 51% of the outstanding Holdco I voting shares through TEP Chile S.A. (“TEP Chile”, a Chilean entity wholly owned by the TAM Controlling Shareholders) and LATAM owns the remainder of the voting shares;
LATAM owns 100% of the outstanding Holdco I non-voting shares, entitling it to substantially all of the economic rights in respect of the TAM common shares held by Holdco I as well as approximately 49% of the outstanding Holdco I voting shares; and
LATAM owns 100% of the TAM preferred shares previously outstanding.
As a result of this ownership structure:
The Amaro Group retains voting and board control of TAM and each subsidiary of TAM; and
LATAM is entitled to substantially all of the economic rights in TAM.
LATAM Airlines Group and TEP Chile and other parties have entered into shareholders’ agreements that establish agreements and restrictions relating to corporate governance with respect to TAM. Certain specified actions require supermajority approval, which in turn means they require the prior approval of both LATAM and TEP Chile. Examples of actions requiring supermajority approval by the board of directors of Holdco I or TAM include, among others, entering into acquisitions or business collaborations, amending or approving budgets, business plans, financial statements and accounting policies, incurring indebtedness, encumbering assets, entering into certain agreements, making certain investments, modifying rights or claims, entering into settlements, appointing executives, creating security interests, issuing, redeeming or repurchasing securities and voting on matters as a shareholder of affiliates of TAM. Actions requiring supermajority shareholder approval of Holdco I or TAM include, among others, certain changes to the by-laws of Holdco I, TAM or TAM’s affiliates or any dissolution/liquidation, corporate reorganization, payment of dividends, issuance of securities, disposal or encumbrance of certain assets, creation of security interests or entering into guarantees and agreements with related parties. For more information on the shareholders’ agreements, see “Item 7. Controlling Shareholders and Related Party Transactions—Shareholders’ Agreements”.
Our assets include a significant amount of goodwill.
Our assets included US$2,672.62,209.6 million of goodwill as of December 31, 2017.2019. Under IFRS, goodwill is subject to an annual impairment test and may be required to be tested more frequently if events or circumstances indicate a potential impairment. In 2017,2019, mainly as a result of the depreciation of the Brazilian real against the U.S. dollar, during 2017, the value of our goodwill decreased by 1.4%3.7% as compared with 2016.2018. Any impairment could result in the recognition of a significant charge to earnings in our statement of income, which could materially and adversely impact our consolidated results for the period in which the impairment occurs.
A failure to successfully implement our strategy or a failure adjusting the strategy to the current economic situation would harm our business and the market value of our ADSs and common shares.
We have developed a strategic plan with the goal of becoming one of the most admired airlines in the world and renewing our commitment to sustained profitability and superior returns to shareholders. Our strategy requires us to identify value propositions that are attractive to our clients, to find efficiencies in our daily operations, and to transform ourselves into a stronger and more risk-resilient company. A tenet of our strategic plan is the continuing adoption of a new travel model for domestic and international services (in the six countries where we have domestic operations) to address the changing dynamics of customers and the industry, and to increase our competitiveness. The new travel model is based on a continued reduction in air fares that makes air travel accessible to a wider audience, and in particular to those wish to fly more frequently. This model requires continued cost reduction efforts and increasing revenues from ancillary activities. In connection with these efforts, the Company is implementingcontinues to implement a series of initiatives to reduce cost per ASK in all its domestic operations as well as developing new ancillary revenue initiatives.
Difficulties in implementing our strategy may adversely affect our business, results of operation and the market value of our ADSs and common shares.
A failure to successfully transfer the value proposition of the LAN and TAM brands to a new single brand, may adversely affect our business and the market value of our ADSs and common shares.
Following the combination in 2012, LAN and TAM continued to operate with their original brands. During 2016, we began the transition of LAN and TAM into a single brand. LAN and TAM had different value propositions, and there can be no assurances that we will be able to fully transfer the value of the original LAN and TAM brands to our new single brand “LATAM”. Difficulties in implementing our single brand may prevent us from consolidating as a customer preferred carrier and may adversely affect our business and results of operations and the market value of our ADSs and common shares.
It may take time to combine the frequent flyer programs of LAN and TAM.
We have integrated the separate frequent flyer programs of LAN and TAM so that passengers can use frequent flyer miles or points earned with either LAN or TAM interchangeably. During 2016, LAN and TAM announced their revamped frequent flyer programs, which have new names: LATAM Pass and LATAM Fidelidade, respectively. The change is part of the process of consolidating the airline group’s new brand identity (LATAM) and the evolution of the programs, which enhances existing benefits and introduces new benefits for program members. However, there is no guarantee that full integration of the two plans will be completed in the near term or at all. Even if the integration occurs, the successful integration of these programs will involve some time and expense. Moreover, during 2016, LATAM Pass and LATAM Fidelidade approved changes in their mileage earning policy which may impact the attractiveness of the programs to passengers. Until we effectively combine these programs, passengers may prefer frequent flyer programs offered by other airlines, which may adversely affect our business.
Our financial results are exposed to foreign currency fluctuations.
We prepare and present our consolidated financial statements in U.S. dollars. LATAM and its affiliates operate in numerous countries and face the risk of variation in foreign currency exchange rates against the U.S. dollar or between the currencies of these various countries. Changes in the exchange rate between the U.S. dollar and the currencies in the countries in which we operate could adversely affect our business, financial condition and results of operations. If the value of the Brazilian real, Chilean peso or other currencies in which revenues are denominated declines against the U.S. dollar, our results of operations and financial condition will be affected. The exchange rate of the Chilean peso, Brazilian real and other currencies against the U.S. dollar may fluctuate significantly in the future.
Changes in Chilean, Brazilian and other governmental economic policies affecting foreign exchange rates could also adversely affect our business, financial condition, results of operations and the return to our shareholders on their common shares or ADSs. For further information, see “Item 11. Quantitative and Qualitative Disclosures About Market Risk—Risk of Variation in Foreign Exchange Rates.”
We depend on strategic alliances or commercial relationships in many of the countries in which we operate, and our business may suffer if any of our strategic alliances or commercial relationships terminates.
We maintain a number of alliances and other commercial relationships in many of the jurisdictions in which LATAM and its affiliates operate. These alliances or commercial relationships allow us to enhance our network and, in some cases, to offer our customers services that we could not otherwise offer. If any of our strategic alliances or commercial relationships deteriorates, or any of these agreements are terminated, our business, financial condition and results of operations could be adversely affected.
Our business and results of operations may suffer if we fail to obtain and maintain routes, suitable airport access, slots and other operating permits. Also, technical and operational problems with the airport infrastructure of cities in which we have a focus may have a material adverse effect on us.
Our business depends upon our access to key routes and airports. Bilateral aviation agreements between countries, open skies laws and local aviation approvals frequently involve political and other considerations outside of our control. Our operations could be constrained by any delay or inability to gain access to key routes or airports, including:
limitations on our ability to process more passengers;
the imposition of flight capacity restrictions;
the inability to secure or maintain route rights in local markets or under bilateral agreements; or
the inability to maintain our existing slots and obtain additional slots.
| ● | limitations on our ability to process more passengers; |
| ● | the imposition of flight capacity restrictions; |
| ● | the inability to secure or maintain route rights in local markets or under bilateral agreements; or |
| ● | the inability to maintain our existing slots and obtain additional slots. |
We operate numerous international routes subject to bilateral agreements, as well as domestic flights within Chile, Peru, Brazil, Argentina, Ecuador and Colombia, subject to local route and airport access approvals. See “Item 4. Information on the Company—B. Business Overview—Regulation.”
There can be no assurance that existing bilateral agreements with the countries in which our companies are based and permits from foreign governments will continue. A modification, suspension or revocation of one or more bilateral agreements could have a material adverse effect on our business, financial condition and results of operations. The suspension of our permission to operate in certain airports, destinations or slots, or the imposition of other sanctions could also have a material adverse effect. A change in the administration of current laws and regulations or the adoption of new laws and regulations in any of the countries in which we operate that restrict our route, airport or other access may have a material adverse effect on our business, financial condition and results of operations.
Moreover, our operations and growth strategy are dependent on the facilities and infrastructure of key airports, including Santiago’s International Airport, São Paulo’s Guarulhos International and Congonhas International Airports, Brasilia’s International Airport and Lima’s Jorge Chavez International Airport.
Santiago’s Comodoro Arturo Merino Benítez International Airport is currently facing an important expansion, which is expected to be completed by 2020.2021. If the expansion is not carried out timely,continues to be delayed, this will likely reduce significantlyimpact our operations and adverselymay affect our ability to remain competitive.
One of the major operational risks we face on a daily basis at Lima’s Jorge Chavez International Airport is the limited number of parking positions. Additionally, the indoor infrastructure of the airport limits our ability to manage connections and launch new flights due to the lack of gates and increasing security and immigration controls. We expect that for the next few years, Lima’s airport’s capacity will remain as itJorge Chavez International Airport is today, limitingcurrently undergoing an expansion, which is expected to be completed by 2024. Any delays could negatively impact our operations limit our ability to grow and affectingaffect our competitiveness in the country and in the region.
Brazilian airports, such as the Brasília,Brasilia, and São Paulo (Guarulhos) international airports,International Airports, have limited the number of takeoff and landing slots per day due to infrastructural limitations. Any condition that would prevent or delay our access to airports or routes that are vital to our strategy, or our inability to maintain our existing slots and obtain additional slots, could materially adversely affect our operations.
A significant portion of our cargo revenue comes from relatively few product types and may be impacted by events affecting their production, trade or demand.
Our cargo demand, especially from Latin American exporters, is concentrated in a small number of product categories, such as exports of fish, sea products and fruits from Chile, asparagus from Peru and fresh flowers from Ecuador and Colombia. Events that adversely affect the production, trade or demand for these goods may adversely affect the volume of goods that we transport and may have a significant impact on our results of operations. Future trade protection measures by or against the countries for which we provide cargo services may have an impact in cargo traffic volumes and adversely affect our financial results. Some of our cargo products are sensitive to foreign exchange rates and, therefore, traffic volumes could be impacted by the appreciation or depreciation of local currencies.
Our operations are subject to fluctuations in the supply and cost of jet fuel, which could adversely impact our business.
Higher jet fuel prices could have a materially adverse effect on our business, financial condition and results of operations. Jet fuel costs have historically accounted for a significant amount of our operating expenses, and accounted for 24.5%30.2% of our operating expenses in 2017.2019. For additional information, see “Item 4. Information on the Company – Company—B. Business Overview – Overview—Fuel Supplies”. Both the cost and availability of fuel are subject to many economic and political factors and events that we can neither control nor predict, including international political and economic circumstances such as the political instability in major oil-exporting countries. Any future fuel supply shortage (for example, as a result of production curtailments by the Organization of the Petroleum Exporting Countries, or “OPEC”), a disruption of oil imports, supply disruptions resulting from severe weather or natural disasters, labor actions such as the 2018 trucking strike in Brazil, the continued unrest in the Middle East or other events could result in higher fuel prices or further reductions in scheduled airline services. We cannot ensure that we would be able to offset any increases in the price of fuel by increasing our fares. In addition, lower fuel prices may result in lower fares through the reduction or elimination of fuel surcharges. We have entered into fuel hedging arrangements, but there can be no assurance that such arrangements will be adequate to protect us from an increase in fuel prices in the near future or in the long term. Also, while these hedging arrangements are designed to limit the effect of an increase in fuel prices, our hedging methods may also limit our ability to take advantage of any decrease in fuel prices, as was the case in 2015 and, to a lesser extent, in 2016. See “Item 11. Quantitative and Qualitative Disclosures About Market Risk—Risk of Variation in Fuel Prices.”
We rely on maintaining a high aircraft utilization rate to increase our revenues and absorb our fixed costs, which makes us especially vulnerable to delays.
A key element of our strategy is to maintain a high daily aircraft utilization rate, which measures the number of hours we use our aircraft per day. High daily aircraft utilization allows us to maximize the amount of revenue we generate from our aircraft and absorb the fixed costs associated with our fleet and is achieved, in part, by reducing turnaround times at airports and developing schedules that enable us to increase the average hours flown per day. Our rate of aircraft utilization could be adversely affected by a number of different factors that are beyond our control, including air traffic and airport congestion, adverse weather conditions, unanticipated maintenance and delays by third-party service providers relating to matters such as fueling and ground handling. If an aircraft falls behind schedule, the resulting delays could cause a disruption in our operating performance and have a financial impact on our results.
We fly and depend upon Airbus and Boeing aircraft, and our business could suffer if we do not receive timely deliveries of aircraft, if aircraft from these companies become unavailable or if the public negatively perceives our aircraft.
As our fleet has grown, our reliance on Airbus and Boeing has also grown. As of December 31, 2017,2019, LATAM Airlines Group has a total fleet of 235263 Airbus and 8079 Boeing aircraft. Risks relating to Airbus and Boeing include:
our failure or inability to obtain Airbus or Boeing aircraft, parts or related support services on a timely basis because of high demand or other factors;
the interruption of fleet service as a result of unscheduled or unanticipated maintenance requirements for these aircraft;
the issuance by the Chilean or other aviation authorities of directives restricting or prohibiting the use of our Airbus or Boeing aircraft, or requiring time-consuming inspections and maintenance;
adverse public perception of a manufacturer as a result of safety concerns, negative publicity or other problems, whether real or perceived, in the event of an accident; or
delays between the time we realize the need for new aircraft and the time it takes us to arrange for Airbus and Boeing or for a third-party provider to deliver this aircraft.
| ● | our failure or inability to obtain Airbus or Boeing aircraft, parts or related support services on a timely basis because of high demand, aircraft delivery backlog or other factors; |
| ● | the interruption of fleet service as a result of unscheduled or unanticipated maintenance requirements for these aircraft; |
| ● | the issuance by the Chilean or other aviation authorities of directives restricting or prohibiting the use of our Airbus or Boeing aircraft, or requiring time-consuming inspections and maintenance; |
| ● | adverse public perception of a manufacturer as a result of safety concerns, negative publicity or other problems, whether real or perceived, in the event of an accident; or |
| ● | delays between the time we realize the need for new aircraft and the time it takes us to arrange for Airbus and Boeing or for a third-party provider to deliver this aircraft. |
The occurrence of any one or more of these factors could restrict our ability to use aircraft to generate profits, respond to increased demands, or could otherwise limit our operations and adversely affect our business. For further information, related to current contractual obligations, see “Item 5. Operating and Financial Review and Prospects—F. Long term Indebtedness- Indebtedness—Tabular Disclosure of Contractual Obligations.”
If we are unable to incorporate leased aircraft into our fleet at acceptable rates and terms in the future, our business could be adversely affected.
A large portion of our aircraft fleet is subject to long-term operating leases. Our operating leases typically run from three to 12 years from the date of delivery.execution. We may face more competition for, or a limited supply of, leased aircraft, making it difficult for us to negotiate on competitive terms upon expiration of our current operating leases or to lease additional capacity required for our targeted level of operations. If we are forced to pay higher lease rates in the future to maintain our capacity and the number of aircraft in our fleet, our profitability could be adversely affected.
Our business may be adversely affected if we are unable to service our debt or meet our future financing requirements.
We have a high degree of debt and payment obligations under our aircraft operating leases and financial debt arrangements. We require significant amounts of financing to meet our aircraft capital requirements and may require additional financing to fund our other business needs. We cannot guarantee that we will have access to or be able to arrange for financing in the future on favorable terms. Higher financing costs could affect our ability to expand or renew our fleet, which in turn could adversely affect our business.
In addition, the majority of our property and equipment is subject to liens securing our indebtedness. In the event that we fail to make payments on secured indebtedness, creditors’ enforcement of liens could limit or end our ability to use the affected property and equipment to fulfill our operational needs and thus generate revenue. For further information, related to current contractual obligations, see “Item 5. Operating and Financial Review and Prospects—F. Long term Indebtedness- Indebtedness—Tabular Disclosure of Contractual Obligations.”
Moreover, external conditions in the financial and credit markets may limit the availability of funding at particular times or increase its costs, which could adversely affect our profitability, our competitive position and result in lower net interest margins, earnings and cash flows, as well as lower returns on shareholders’ equity and invested capital. Factors that may affect the availability of funding or cause an increase in our funding costs include global macro-economic crises, reductionreductions in our credit rating or in that of our credit rating,issuances, and other potential market disruptions.
We have significant exposure to LIBOR and other floating interest rates; increases in interest rates will increase our financing costs and may have adverse effects on our financial condition and results of operations.
We are exposed to the risk of interest rate variations, principally in relation to the U.S. dollar London Interbank Offer Rate (“LIBOR”). Many of our financial leases are denominated in U.S. dollars and bear interest at a floating rate. 36.9%38.4% of our outstanding consolidated debt as of December 31, 20172019 bears interest at a floating rate after(after giving effect to interest rate hedging agreements.agreements). Volatility in LIBOR or other reference rates could increase our periodic interest and lease payments and have an adverse effect on our total financing costs. We may be unable to adequately adjust our prices to offset any increased financing costs, which would have an adverse effect on our revenues and our results of operations.
On July 27, 2017, the Financial Conduct Authority (the authority that regulates LIBOR) announced that it intends to stop compelling banks to submit rates for the calculation of LIBOR after 2021. It is unclear whether new methods of calculating LIBOR will be established such that it continues to exist after 2021. The U.S. Federal Reserve, in conjunction with the Alternative Reference Rates Committee, is considering replacing U.S. dollar LIBOR with a newly created index, calculated based on repurchase agreements backed by treasury securities. The impact of such a transition away from LIBOR could be significant for us because of our substantial indebtedness. It is not possible to predict the effect of these changes, other reforms or the establishment of alternative reference rates in the United Kingdom, the United States or elsewhere. See also the discussion of interest rate risk in “Item 11. Quantitative and Qualitative Disclosures About Market Risk—”Risk of Fluctuations in Interest Rates.”
Increases in insurance costs and/or significant reductions in coverage could harm our financial condition and results of operations.
Major events affecting the aviation insurance industry (such as terrorist attacks, hijackings or airline crashes) may result in significant increases of airlines’ insurance premiums or in significant decreases of insurance coverage, as occurred after the September 11, 2001 terrorist attacks. As a result, furtherFurther increases in insurance costs or reductions in available insurance coverage could have an adverse impact on our financial results and results of operations and increasesincrease the risk that we experience uncovered losses.
Problems with air traffic control systems or other technical failures could interrupt our operations and have a material adverse effect on our business.business
Our operations, including our ability to deliver customer service, are dependent on the effective operation of our equipment, including our aircraft, maintenance systems and reservation systems. Our operations are also dependent on the effective operation of domestic and international air traffic control systems and the air traffic control infrastructure by the corresponding authorities in the markets in which we operate. Equipment failures, personnel shortages, air traffic control problems and other factors that could interrupt operations could adversely affect our operations and financial results as well as our reputation.
We depend on a limited number of suppliers for certain aircraft and engine parts.
We depend on a limited number of suppliers for aircraft, aircraft engines and many aircraft and engine parts. As a result, we are vulnerable to any problems associated with the supply of those aircraft, parts and engines, including design defects, mechanical problems, contractual performance by the suppliers, or adverse perception by the public that would result in unscheduled maintenance requirements, in customer avoidance or in actions by the aviation authorities resulting in an inability to operate our aircraft. During the year 2017,2019, LATAM Airlines’sAirline’s main suppliers were aircraft manufacturers Airbus and Boeing.
In addition to Airbus and Boeing, LATAM Airlines has a number of other suppliers, primarily related to aircraft accessories, spare parts, and components, including Pratt & Whitney, MTU Maintenance, Rolls-Royce, and Pratt and Whitney Canada.
As of February 9, 2018,During 2019, Airbus has been experiencing difficultiesexperienced delays in the delivery of A320neo aircraft worldwide which we understandworldwide. LATAM is stated to be due to problems with the aircraft’s Pratt & Whitney engines. We are currently expecting delivery of seventhree A320neo and 2 A321neofamily aircraft during 2018, and2020, but any delays in the delivery of thesesdelays could adversely affect our operations. In addition, we currently have four A320neo
Rolls-Royce continues to face delays with its Trent 1000 engine program, used to power LATAM’s Boeing 787 fleet, with increased demand for inspections and maintenance. This has affected the availability and the operational flexibility of this aircraft in our fleet, and problems associatedfor operators worldwide, with the lack of availability of these engines could potentially prevent these aircrafts from remaining operational.
We understandimpact for LATAM reaching its peak in July 2018. LATAM currently has three aircraft on ground awaiting for engines. While the situation has improved considerably, there is no guarantee that Rolls Royce is experiencing problems withthis will not continue and therefore reduce the availability of Rolls Royce Trent 1000 engines in connection with engine maintenance programs, affecting our Boeing 787 aircraft, thus negatively affecting operations and potentially our A350 aircraft. Any prolonged problems, could adversely affect our operations.financial results.
Our business relies extensively on third-party service providers. Failure of these parties to perform as expected, or interruptions in our relationships with these providers or in their provision of services to us, could have an adverse effect on our financial position and results of operations.
We have engaged a significant number of third-party service providers to perform a large number of functions that are integral to our business, including regional operations, operation of customer service call centers, distribution and sale of airline seat inventory, provision of information technology infrastructure and services, performance of business processes, including purchasing and cash management, provision of aircraft maintenance and repairs, catering, ground services, and provision of various utilities and performance of aircraft fueling operations, among other vital functions and services. We do not directly control these third-party service providers, although we do enter into agreements with many of them that define expected service performance. Any of these third-party service providers, however, may materially fail to meet their service performance commitments, may suffer disruptions to their systems that could impact their services, or the agreements with such providers may be terminated. For example, flight reservations booked by customers and/or travel agencies via third-party GDSs (Global Distribution Systems) may be adversely affected by disruptions in our business relationships with GDS operators.operators or by issues in the GDS’s operations. Such disruptions, including a failure to agree upon acceptable contract terms when contracts expire or otherwise become subject to renegotiation, may cause the carriers’ flight information to be limited or unavailable for display, significantly increase fees for both us and GDS users, and impair our relationships with customers and travel agencies. The failure of any of our third-party service providers to adequately perform their service obligations, or other interruptions of services, may reduce our revenues and increase our expenses or prevent us from operating our flights and providing other services to our customers. In addition, our business, financial performance and reputation could be materially harmed if our customers believe that our services are unreliable or unsatisfactory.
Disruptions or security breaches of our information technology infrastructure or systems could interfere with our operations, compromise passenger or employee information, and expose us to liability, possibly causing our business and reputation to suffer.
A serious internal technology error, failure, or cybersecurity incident impacting systems hosted internally at our data centers, or externally at third-party locations or cloud providers, or large-scale interruption in technology infrastructure we depend on, such as power, telecommunications or the internet, may disrupt our technology network with potential impact on our operations. Our technology systems and related data may also be vulnerable to a variety of sources of interruption, including natural disasters, terrorist attacks, telecommunications failures, computer viruses, cyber attacks and other security issues. These systems include our computerized airline reservation system, flight operations system, telecommunications systems, website, customer, self-service applications (“apps”), maintenance systems, check-in kiosks, in-flight entertainment systems and data centers.
In addition, as a part of our ordinary business operations, we collect and store sensitive data, including personal information of our passengers and employees and information of our business partners. The secure operation of the networks and systems on which this type of information is stored, processed and maintained is critical to our business operations and strategy. Unauthorized parties may attempt to gain access to our systems or information through fraud, deception, or cybersecurity incident. Hardware or software we develop or acquire may contain defects that could unexpectedly compromise information security. The compromise of our technology systems resulting in the loss, disclosure, misappropriation of, or access to, customers’, employees’ or business partners’ information could result in legal claims or proceedings, liability or regulatory penalties under laws protecting the privacy of personal information, disruption to our operations and damage to our reputation, any or all of which could adversely affect our business.
Increases in our labor costs, which constitute a substantial portion of our total operating expenses, could directly impact our earnings.
Labor costs constitute a significant percentage of our total operating expenses (21.4%(18.5% in 2017)2019) and at times in our operating history we have experienced pressure to increase wages and benefits for our employees. A significant increase in our labor costs could result in a material reduction in our earnings.
Our business may experience adverse consequences if we are unable to reach satisfactory collective bargaining agreements with our unionized employees.
As of December 31, 2017, approximately 86% of our employees, including administrative personnel, cabin crew, flight attendants, pilots and maintenance technicians are members of unions and have contracts and collective bargaining agreements which expire on a regular basis. Our business, financial condition and results of operations could be materially adversely affected by a failure to reach agreement with any labor union representing such employees or by an agreement with a labor union that contains terms that are not in line with our expectations or that prevent us from competing effectively with other airlines. For further information regarding the unions representing our employees in each country in which we operate and with which we have established collective bargaining agreements, see “Item 6. Directors, Senior Management and Employees—D. Employees – Labor Relations.”
Collective action by employees could cause operating disruptions and adversely impact our business.
Certain employee groups such as pilots, flight attendants, mechanics and our airport personnel have highly specialized skills. As a consequence, actions by these groups, such as strikes, walk-outs or stoppages, could severely disrupt our operations and adversely impact our operating and financial performance, as well as our image.
A strike, work interruption or stoppage or any prolonged dispute with our employees who are represented by any of these unions could have an adverse impact on our operations. These risks are typically exacerbated during periods of renegotiation with the unions, which typically occurs every two to four years depending on the jurisdiction and the union. Any renegotiated collective bargaining agreement could feature significant wage increases and a consequent increase in our operating expenses. Any failure to reach an agreement during negotiations with unions may require us to enter into arbitration proceedings, use financial and management resources, and potentially agree to terms that are less favorable to us than our existing agreements. Employees who are not currently members of unions may also form new unions that may seek further wage increases or benefits.
Our business may experience adverse consequences if we are unable to reach satisfactory collective bargaining agreements with our unionized employees.
As of December 31, 2019, approximately 46% of our employees, including administrative personnel, cabin crew, flight attendants, pilots and maintenance technicians are members of unions and have contracts and collective bargaining agreements which expire on a regular basis. Our business, financial condition and results of operations could be materially adversely affected by a failure to reach agreement with any labor union representing such employees or by an agreement with a labor union that contains terms that are not in line with our expectations or that prevent us from competing effectively with other airlines. For further information regarding the unions representing our employees in each country in which we operate and with which we have established collective bargaining agreements, see “Item 6. Directors, Senior Management and Employees—D. Employees—Labor Relations.”
We may experience difficulty finding, training and retaining employees.
Our business is labor intensive. We employ a large number of pilots, flight attendants, maintenance technicians and other operating and administrative personnel. The airline industry has, from time to time, experienced a shortage of qualified personnel, especially pilots and maintenance technicians. In addition, as is common with most of our competitors, we may, from time to time, face considerable turnover of our employees. Should the turnover of employees, particularly pilots and maintenance technicians, sharply increase, our training costs will be significantly higher. We cannot assure you that we will be able to recruit, train and retain the managers, pilots, technicians and other qualified employees that we need to continue our current operations or replace departing employees. An increase in turnover or failure to recruit, train and retain qualified employees at a reasonable cost could materially adversely affect our business, financial condition, and results of operations.
Risks Related to the Airline Industry and the Countries in Which We Operate
Our performance is heavily dependent on economic conditions in the countries in which we do business. Negative economic conditions in those countries could adversely impact our business and results of operations and cause the market price of our common shares and ADSs to decrease.
Passenger and cargo demand is heavily cyclical and highly dependent on global and local economic growth, economic expectations and foreign exchange rate variations, among other things. In the past, our business has been adversely affected by global economic recessionary conditions, weak economic growth in Chile, recession in Brazil and Argentina and poor economic performance in certain emerging market countries in which we operate. The occurrence of similar events in the future could adversely affect our business. We plan to continue to expand our operations based in Latin America and our performance will, therefore, continue to depend heavily on economic conditions in the region.
Any of the following factors could adversely affect our business, financial condition and results of operations in the countries in which we operate:
| ·● | changes in economic or other governmental policies; |
| ·● | changes in regulatory, legal or administrative practices; |
| ·● | weak economic performance, including, but not limited to, a slowdown in the Brazilian economy, and political instability low economic growth, low consumption and/or investment rates, and increased inflation rates; or |
| ·● | other political or economic developments over which we have no control. |
No assurance can be given that capacity reductions or other steps we may take in response to weakened demand will be adequate to offset any future reduction in our cargo and/or air travel demand in markets in which we operate. Sustained weak demand may adversely impact our revenues, results of operations or financial condition.
An adverse economic environment, whether global, regional or in a particular country, could result in a reduction in passenger traffic, as well as a reduction in our cargo business, and could also impact our ability to raise fares, which in turn would materially and negatively affect our financial condition and results of operations.
We are exposed to increases in landing fees and other airport service charges that could adversely affect our margin and competitive position. Also, it cannot be assured that in the future we will have access to adequate facilities and landing rights necessary to achieve our expansion plansplans.
We must pay fees to airport operators for the use of their facilities. Any substantial increase in airport charges, including at Guarulhos International Airport in São Paulo, Jorge Chavez International Airport in Lima or Comodoro Arturo Merino Benitez International Airport in Santiago, could have a material adverse impact on our results of operations. Passenger taxes and airport charges have increased substantially in recent years. We cannot assure you that the airports in which we operate will not increase or maintain high passenger taxes and service charges in the future. Any such increases could have an adverse effect on our financial condition and results of operations.
Certain airports that we serve (or that we plan to serve in the future) are subject to capacity constraints and impose various restrictions, including takeoff and landing slot restrictions during certain periods of the day and limits on aircraft noise levels. We cannot be certain that we will be able to obtain a sufficient number of slots, gates and other facilities at airports to expand our services in line with our growth strategy. It is also possible that airports not currently subject to capacity constraints may become so in the future. In addition, an airline must use its slots on a regular and timely basis or risk having those slots re-allocated to others. Where slots or other airport resources are not available or their availability is restricted in some way, we may have to amend our schedules, change routes or reduce aircraft utilization. It is also possible that aviation authorities in the countries in which we operate, change the rules for the assignment of takeoff and landing slots, as it was the case with the São Paulo airport (Congonhas) in 2019 where the slots previously operated by Avianca Brazil were reassigned. Any of these alternatives could have an adverse financial impact on our operations. We cannot ensure that airports at which there are no such restrictions may not implement restrictions in the future or that, where such restrictions exist, they may not become more onerous. Such restrictions may limit our ability to continue to provide or to increase services at such airports.
Our business is highly regulated and changes in the regulatory environment in the countries in which we operate may adversely affect our business and results of operations.
Our business is highly regulated and depends substantially upon the regulatory environment in the countries in which we operate or intend to operate. For example, price controls on fares may limit our ability to effectively apply customer segmentation profit maximization techniques (“passenger revenue management”) and adjust prices to reflect cost pressures. High levels of government regulation may limit the scope of our operations and our growth plans. The possible failure of aviation authorities to maintain the required governmental authorizations or our failure to comply with applicable regulations, may adversely affect our business and results of operations.
Our business, financial condition, results of operations and the price of preferred shares and ADSs may be adversely affected by changes in policy or regulations at the federal, state or municipal level in the countries in which we operate, involving or affecting factors such as:
interest rates;
currency fluctuations;
monetary policies;
inflation;
liquidity of capital and lending markets;
tax and social security policies;
labor regulations;
energy and water shortages and rationing; and
other political, social and economic developments in or affecting Brazil, Chile, Peru, and the United States, among others.
| ● | liquidity of capital and lending markets; |
| ● | tax and social security policies; |
| ● | energy and water shortages and rationing; and |
| ● | other political, social and economic developments in or affecting Brazil, Chile, Peru, and the United States, among others. |
For example, the Brazilian federal government has frequently intervened in the domestic economy and made drastic changes in policy and regulations to control inflation and affect other policies and regulations. This required the federal government to increase interest rates, change taxes and social security policies, implement price controls, currency exchange and remittance controls, devaluations, capital controls and limits on imports.
Uncertainty over whether the Brazilian federal government will implement changes in policy or regulation affecting these or other factors may contribute to economic uncertainty in Brazil and to heightened volatility in the Brazilian securities markets and securities issued abroad by Brazilian companies. These and other developments in the Brazilian economy and governmental policies may adversely affect us and our business and results of operations and may adversely affect the trading price of our preferred shares and ADSs.
We are also subject to international bilateral air transport agreements that provide for the exchange of air traffic rights between the countries where we operate, and we must obtain permission from the applicable foreign governments to provide service to foreign destinations. There can be no assurance that such existing bilateral agreements will continue, or that we will be able to obtain more route rights under those agreements to accommodate our future expansion plans. Certain bilateral agreements also include provisions that require substantial ownership or effective control. Any modification, suspension or revocation of one or more bilateral agreements could have a material adverse effect on our business, financial condition and results of operations. The suspension of our permits to operate to certain airports or destinations, the inability for us to obtain favorable take-off and landing authorizations at certain high-density airports or the imposition of other sanctions could also have a negative impact on our business. We cannot be certain that a change in ownership or effective control or in a foreign government’s administration of current laws and regulations or the adoption of new laws and regulations will not have a material adverse effect on our business, financial condition and results of operations.
Losses and liabilities in the event of an accident involving one or more of our aircraft could materially affect our business.
We are exposed to potential catastrophic losses in the event of an aircraft accident, terrorist incident or any other similar event. There can be no assurance that, as a result of an aircraft accident or significant incident:
we will not need to increase our insurance coverage;
our insurance premiums will not increase significantly;
our insurance coverage will fully cover all of our liability; or
we will not be forced to bear substantial losses.
| 17● | we will not need to increase our insurance coverage; |
| ● | our insurance premiums will not increase significantly; |
| ● | our insurance coverage will fully cover all of our liability; or |
| ● | we will not be forced to bear substantial losses. |
Substantial claims resulting from an accident or significant incident in excess of our related insurance coverage could have a material adverse effect on our business, financial condition and results of operations. Moreover, any aircraft accident, even if fully insured, could cause the negative public perception that our aircraft are less safe or reliable than those operated by other airlines, or by other flight operators, which could have a material adverse effect on our business, financial condition and results of operations.
Insurance premiums may also increase due to an accident or incident affecting one of our alliance partners or other airlines, or due to a perception of increased risk in the industry related to concerns about war or terrorist attacks.attacks, the general industry, or general industry safety.
High levels of competition in the airline industry, such as the presence of low-cost carriers in the domestic markets in which we operate, may adversely affect our level of operations.
Our business, financial condition and results of operations could be adversely affected by high levels of competition within the industry, particularly the entrance of new competitors into the markets in which we operate. Airlines compete primarily over fare levels, frequency and dependability of service, brand recognition, passenger amenities (such as frequent flyer programs) and the availability and convenience of other passenger or cargo services. New and existing airlines (and companies providing ground cargo or passenger transportation) could enter our markets and compete with us on any of these bases, including by offering lower prices, more attractive services or increasing their route offerings in an effort to gain greater market share. For more information regarding our main competitors, see “Item 4. Information of the Company—B. Business Overview – Overview—Passenger Operations – Operations—International Passenger Operations” and “Item 4. Information of the Company��Company—B. Business Overview – Overview—Passenger Operations - Operations—Business Model for Domestic Operations.”
Low-cost carriers have an important impact in the industry’s revenues given their low unit costs. Lower costs allow low-cost carriers to offer inexpensive fares which, in turn, allow price sensitive customers to fly or to shift from large to low cost carriers. In past years we have seen more interest in the development of the low-cost model throughout Latin America. For example, in the Chilean domestic market, Sky Airlines,Airline, our main competitor, has been migrating to a low-cost model since 2015, while in July 2017, JetSmart, a new low-cost airline, started operations. In the Peruvian domestic market, VivaAir Peru, a new low-cost airline, started operations in May 2017.2017, and in April 2019, another low-cost airline, Sky Airline Peru, started operations. In Colombia, low-cost competitor VivaColombia has been operating in the domestic market since May 2012. Low-cost competitorcompetitors Flybondi and Norwegian began operations in the Argentinian domestic market during 2018, while Norwegian began internationaland in April 2019, JetSmart, another low-cost airline, started operations between London and Buenos Airesannounced the acquisition of Norwegian´s Argetinian subsidiary operations in 2018.December 2019. A number of low-cost carriers have announced growth strategies including commitments to acquire significant numbers of aircraft for delivery in the next few years. The entry of the low-cost carriers local into markets in which we compete, including those described above, could have a material adverse effect on our operations and financial performance.
Our international strategic growth plans rely, in part, upon receipt of regulatory approvals of the countries in which we plan to expand our operations of certainwith a Joint Business Agreements (JBAs)Agreement (JBA). We may not be able to obtain those approvals, while other competitors might be approved. Accordingly, we might not be able to compete for the same routes as our competitors, which could diminish our market share and adversely impact our financial results. No assurances can be given as to any benefits, if any, that we may derive from such agreements.
Some of our competitors may receive external support, which could adversely impact our competitive position.
Some of our competitors may receive support from external sources, such as their national governments, which may be unavailable to us. Support may include, among others, subsidies, financial aid or tax waivers. This support could place us at a competitive disadvantage and adversely affect our operations and financial performance. For example, Aerolineas Argentinas has historically been government subsidized.
Moreover, as a result of the competitive environment, there may be further consolidation in the Latin American and global airline industry, whether by means of acquisitions, joint ventures, partnerships or strategic alliances. We cannot predict the effects of further consolidation on the industry. Furthermore, consolidation in the airline industry and changes in international alliances will continue to affect the competitive landscape in the industry and may result in the development of airlines and alliances with increased financial resources, more extensive global networks and reduced cost structures.
Some of the countries where we operate may not comply with international agreements previously established, which could increase the risk perception of doing business in that specific market and as a consequence impact our business and financial results.
Rulings by a bankruptcy court in Brazil and by higher judicial authorities related to the bankruptcy proceedings of Avianca Brazil may appear to be inconsistent with the Cape Town Convention (CTC) treaty that Brazil has signed, thus raising concerns about the rights of creditors in respect of financings secured by aircraft. Accordingly, if creditors perceive that an increase business risk is created by these rulings for leasing or other financing transactions involving aircraft in Brazil, there is a possibility that rating agencies may issue lower credit ratings in respect of financings that are secured by aircraft in Brazil. As a result, our business and financial results may be adversely affected if our financing activities in Brazil are impacted by such events.
Our operations are subject to local, national and international environmental regulations; costs of compliance with applicable regulations, or the consequences of noncompliance, could adversely affect our results, our business or our reputation.
Our operations are affected by environmental regulations at local, national and international levels. These regulations cover, among other things, emissions to the atmosphere, disposal of solid waste and aqueous effluents, aircraft noise and other activities incident to our business. Future operations and financial results may vary as a result of such regulations. Compliance with these regulations and new or existing regulations that may be applicable to us in the future could increase our cost base and adversely affect our operations and financial results. In addition, failure to comply with these regulations could adversely affect us in a variety of ways, including adverse effects on our reputation.
In 2016, the International Civil Aviation Organization (“ICAO”) adopted a resolution creating the Carbon Offsetting and Reduction Scheme for International Aviation (CORSIA), providing a framework for a global market-based measure to stabilize carbon dioxide (“CO2”) emissions in international civil aviation (i.e., civil aviation flights that depart in one country and arrive in a different country). CORSIA will be implemented in phases, starting with the participation of ICAO member states on a voluntary basis during a pilot phase (from 2021 through 2023), followed by a first phase (from 2024 through 2026) and a second phase (from 2027). Currently, CORSIA focuses on defining standards for monitoring, reporting and verification of emissions from air operators, as well as on defining steps to offset CO2 emissions after 2020. To the extent most of the countries in which we operate continue to be ICAO member states, in the future we may be affected by regulations adopted pursuant to the CORSIA framework.
The proliferation of national regulations and taxes on CO2 emissions in the countries that we have domestic operations, including environmental regulations that the airline industry is facing in Colombia, may also affect our costs of operations and our margins.
Our business may be adversely affected by a downturn in the airline industry caused by exogenous events that affect travel behavior or increase costs, such as outbreak of disease, weather conditions and natural disasters, war or terrorist attacks.
Demand for air transportation may be adversely impacted by exogenous events, such as adverse weather conditions and natural disasters, epidemics (such as Ebola and Zika), and outbreaks such as the recent coronavirus, terrorist attacks, war or political and social instability. Situations such as these in one or more of the markets in which we operate could have a material impact on our business, financial condition and results of operations. Furthermore, these typesthe current spread of situationsthe coronavirus and other adverse public health developments could have a prolonged effect on air transportation demand and on certain cost items.any prolonged or widespread effects could significantly impact our operations.
After the terrorist attacks in the United States on September 11, 2001, the Company made the decision to reduce its flights to the United States. In connection with the reduction in service, the Company reduced its workforce resulting in additional expenses due to severance payments to terminated employees during 2001. Therefore, anyAny future terrorist attacks or threat of attacks, whether or not involving commercial aircraft, any increase in hostilities relating to reprisals against terrorist organizations or otherwise and any related economic impact could result in decreased passenger traffic and materially and negatively affect our business, financial condition and results of operations.
After the 2001 terrorist attacks, airlines have experienced increased costs resulting from additional security measures that may be made even more rigorous in the future. In addition to measures imposed by the U.S. Department of Homeland Security and the TSA, IATA and certain foreign governments have also begun to institute additional security measures at foreign airports we serve.
Revenues for airlines depend on the number of passengers carried, the fare paid by each passenger and service factors, such as the timeliness of flight departures and arrivals. During periods of fog, ice, low temperatures, storms or other adverse weather conditions, some or all of our flights may be cancelled or significantly delayed, reducing our profitability. In addition, fuel prices and supplies, which constitute a significant cost for us, may increase as a result of any future terrorist attacks, a general increase in hostilities or a reduction in output of fuel, voluntary or otherwise, by oil-producing countries. Such increases may result in both higher airline ticket prices and decreased demand for air travel generally, which could have an adverse effect on our revenues and results of operations.
A pandemic or the widespread outbreak of contagious illnesses can have a material adverse effect on our business and results of operations.
The widespread outbreak of a contagious illness such as the novel COVID-19 (Coronavirus), first identified in Wuhan, Hubei Province, China and which has been declared a pandemic by the World Health Organization (WHO), or fear of such an event, is materially reducing demand for, and availability of, worldwide air travel and therefore is having a material adverse effect on our business and results of operations.
In 2003, an outbreak of a coronavirus known as severe acute respiratory syndrome (SARS) originating in China became an epidemic and resulted in a slowdown of passenger air traffic due contagion fears. At the time, RPK growth was reduced due to oversupply in the market as airlines tried to cut capacity.
The recent outbreak of Coronavirus has negatively affected global economic conditions, disrupted supply chains and otherwise negatively impacted aircraft manufacturing operations and may reduce the availability of aircraft and aircraft spare parts. The ultimate severity of the Coronavirus outbreak is uncertain at this time and therefore we cannot predict the impact it may have on the availability of aircraft or aircraft spare parts. However, the effect on our results may be material and adverse if supply chain disruptions persist and preclude our ability to adequately maintain our fleet.
The recent outbreak of Coronavirus has also led to government-imposed travel restrictions, flight cancellations, and a marked decline in passenger demand for air travel. Accordingly, LATAM Airlines Group and its affiliates implemented a reduction in international flights of approximately 30% and recently updatedthe decrease in capacity to approximately 70% of the total operations, corresponding 90% to international operations and 40% to domestic operations. These measures will apply principally to flights from South America to Europe and the US between April 1 and May 30, 2020. The potential for a period of significantly reduced demand for travel has and will likely continue to result in significant lost revenue. As a result of these or other conditions beyond our control, our results of operations could be volatile and subject to rapid and unexpected change. In addition, if the spread of the Coronavirus were to continue unabated, our operations could also be negatively affected if employees are quarantined as the result of exposure to the contagious illness.We cannot currently fully predict the impact that the Coronavirus outbreak will have on global air travel and the extent to which it may impact the demand for air travel in the regions we operate. Continued travel restrictions or operational issues resulting from the rapid spread of the Coronavirus or other contagious illnesses that adversely reduce demand for air travel in a part of the world in which we have significant operations could a material adverse effect on our business and results of operations.
We are subject to risks related to litigation and administrative proceedings that could adversely affect our business and financial performance in the event of an unfavorable ruling.
The nature of our business exposes us to litigation relating to labor, insurance and safety matters, regulatory, tax and administrative proceedings, governmental investigations, tort claims and contract disputes. Litigation is inherently costly and unpredictable, making it difficult to accurately estimate the outcome among other matters. Currently, as in the past, we are subject to proceedings or investigations of actual or potential litigation. Although we establish accounting provisions as we deem necessary, the amounts that we reserve could vary significantly from any amounts we actually pay due to the inherent uncertainties in the estimation process. We cannot assure you that these or other legal proceedings will not materially affect our business. For further information,see “Item 8. Financial Information—Legal and Arbitration Proceedings.”and Note 31 ofto our audited consolidated financial statements included in this report.
We are subject to anti-corruption, anti-bribery, anti-money laundering and antitrust laws and regulations in Chile, the United States and in the various countries we operate. Violations of any such laws or regulations could have a material adverse impact on our reputation and results of operations and financial condition.
We are subject to anti-corruption, anti-bribery, anti-money laundering, antitrust and other international laws and regulations and are required to comply with the applicable laws and regulations of all jurisdictions where we operate. In addition, we are subject to economic sanctions regulations that restrict our dealings with certain sanctioned countries, individuals and entities. There can be no assurance that our internal policies and procedures will be sufficient to prevent or detect all inappropriate practices, fraud or violations of law by our affiliates, employees, directors, officers, partners, agents and service providers or that any such persons will not take actions in violation of our policies and procedures. Any violations by us of anti-bribery and anti-corruption laws or sanctions regulations could have a material adverse effect on our business, reputation, results of operations and financial condition.
The Brazilian government hasLatin American governments have exercised and may continue to exercise significant influence over their economies.
Governments in Latin America frequently intervene in the Brazilian economy, which mayeconomies of their respective countries and occasionally make significant changes in policy and regulations. Governmental actions have an adverse impactoften involved, among other measures, nationalizations and expropriations, price controls, currency devaluations, mandatory increases on ourwages and employee benefits, capital controls and limits on imports. Our business, financial condition and results of operations.operations may be adversely affected by changes in government policies or regulations, including such factors as exchange rates and exchange control policies; inflation control policies; price control policies; consumer protection policies; import duties and restrictions; liquidity of domestic capital and lending markets; electricity rationing; tax policies, including tax increases and retroactive tax claims; and other political, diplomatic, social and economic developments in or affecting the countries where we operate.
The Brazilian economy has been characterized byFor example, the significant involvement of the Brazilian government, which often changes monetary, credit, fiscal and other policies to influence Brazil’s economy. The Brazilian government’s actions to control inflation and implement other policies have involved wage and price controls, depreciation of the real, controls over remittance of funds abroad, intervention by the Central Bank to affect base interest rates and other measures. We have no control over, and cannot predict what measures or policiesIn the Brazilian government may take infuture, the future.
The Peruvian government has exercised, andlevel of intervention by Latin American governments may continue to exercise, significant influence overor increase. We cannot assure you that these or other measures will not have a material adverse effect on the Peruvian economy which may have an adverse impact onof each respective country and, consequently, will not adversely affect our business, financial condition and results of operations.
Political instability and social unrest in Latin America may adversely affect our business.
We operate primarily within Latin America and are thus subject to a full range of risks associated with our operations in this region. These risks may include unstable political or social conditions, lack of well-established or reliable legal systems, exchange controls and other limits on our ability to repatriate earnings and changeable legal and regulatory requirements.
Although political and social conditions in one country may differ significantly from another country, events in any of our key markets could adversely affect our business, financial conditions or results of operations.
For example, in Brazil, in the last couple of years, as a result of the ongoing Operation Car Wash (Lava Jato investigation), a number of senior politicians have resigned or been arrested and other senior elected officials and public officials are being investigated for allegations of corruption. One of the most significant events that elapsed from this operation was the impeachment of the former President Rousseff by the Brazilian Senate on August, 2016, for violations of fiscal responsibility laws and the governing of its Vice-President, Michel Temer, during the last two years of the presidential mandate, which due to the development of the investigations conducted by the Federal Police Department and the General Federal Prosecutor’s Office indicted President Temer on corruption charges. Along with the political and economic uncertainty period the country was facing, in July 2017, former President Luiz Inácio Lula da Silva was convicted of corruption and money laundering by a lower federal court in the State of Paraná in connection with the Operation Car Wash (Lava Jato). In addition, Argentine presidential elections held in October 2019, saw the return of the former president of Argentina, Cristina Fernandez de Kirchner who was elected Vice-President and who was previously prosecuted for alleged corruption. In 2019, Peru experienced a constitutional crisis began when President Martín Vizcarra dissolved the Congress of Peru on September 30, 2019. The Peruvian Congress responded by declaring Vizcarra's presidency suspended and appointed Vice President Mercedes Aráoz as interim president, moves that were largely seen as null and void. The Peruvian Constitutional Court ruled that President Martín Vizcarra had not exceeded his powers when he took the step amid a stand-off between the government and opposition-controlled Congress. Opposition lawmakers had denounced it as a coup but the heads of armed forces and the police backed the president. In October 2019. Chile saw significant protests associated with economic conditions resulting in the declaration of a state of emergency in several major cities. The protests in Chile began over criticisms about a lack of quality education, weak pensions, increasing prices and low minimum wage. Current initiatives to address the concerns of the protesters are under discussion in the Chilean Congress. These initiatives include labor reforms, tax reforms and pension reforms, among others. It is not possible to predict the effect of these changes as they are still under discussion, but could potentially result in higher payments of wages and salaries and an increase in taxes. On April 26, 2020, Chile will hold a referendum on whether and how to change the current constitution, which could lead to additional protests. If social unrest in Chile were to continue or intensify, it could lead to operational delays or adversely impact our ability to operate in Chile. LATAM took a series of measures to alleviate the impact for its passengers, including refunds and changes of tickets. The Company estimated a total impact of approximately US$40 million for 2019.
Although conditions throughout Latin America vary from country to country, our customers’ reactions to developments in Latin America generally may result in a reduction in passenger traffic, which could materially and negatively affect our financial condition and results of operations.
Latin American countries have experienced periods of adverse macroeconomic conditions.
Our business is dependent upon economic conditions prevalent in Latin America. Latin American countries have historically experienced economic instability, including uneven periods of economic growth as well as significant downturns. High interest, inflation (in some cases substantial and prolonged), and unemployment rates generally characterize each economy. Because commodities such as agricultural products, minerals, and metals represent a significant percentage of exports of many Latin American countries, the economies of those countries are particularly sensitive to fluctuations in commodity prices. Investments in the region may also be subject to currency risks, such as restrictions on the flow of money in and out of the country, extreme volatility relative to the U.S. dollar, and devaluation.
For example, in the past, Peru has experienced periods of severe economic recession, currency devaluation, high inflation, and political instability, which have led to adverse economic consequences. We cannot assure you that Peru will not experience similar adverse developments in the future even though for some years now, several democratic procedures have been completed without any violence. We cannot assure you that the current or any future administration will maintain business-friendly and open-market economic policies or policies that stimulate economic growth and social stability. AnyIn Brazil, the Brazil Real GDP decreased 3.5% in 2015, decreased 3.3% in 2016, increased 1.1% in 2017 and increased 1.1% in 2018, according to the Brazilian Institute for Geography and Statistics (Instituto Brasileiro de Geografia e Estadística, or “IGBE”). In addition, the credit rating of the Brazilian federal government was downgraded in 2015 and 2016 by all major credit rating agencies and is no longer investment grade. We can offer no assurances as to the policies that may be implemented by the recently elected Argentine administration, or that political developments in Argentina will not adversely affect the Argentine economy.
Accordingly, any changes in the Peruvian economyeconomies of the Latin American countries in which LATAM and its affiliates operate or the Peruvian government’sgovernments’ economic policies may have a negative effect on our business, financial condition and results of operations.
Instability and political unrest in Latin America may adversely affect our business.
We operate primarily within Latin America and are thus subject to a full range of risks associated with our operations in this region. These risks may include unstable political or economic conditions, lack of well-established or reliable legal systems, exchange controls and other limits on our ability to repatriate earnings and changeable legal and regulatory requirements. In Venezuela, for example, foreign companies may only repatriate cash through specific governmental programs, which may effectively preclude us from repatriating cash for periods of time.
Although conditions throughout Latin America vary from country to country, our customers’ reactions to developments in Latin America generally may result in a reduction in passenger traffic, which could materially and negatively affect our financial condition and results of operations
Risks Related to our Common Shares and ADSs
Our major shareholders may have interests that differ from those of our other shareholders.
One of ourThe major shareholder groups,group, the Cueto Group (the “LATAM Controlling Shareholders”“Cueto Group”),which as of February 28, 2018, beneficially owned 27.91%21.46% of our common shares is entitled to elect threeas of the nine members of our board of directors and is in a position to direct our management.February 29, 2020. In addition, the LATAM Controlling Shareholders haveCueto Group entered into a shareholdersshareholders’ agreement with the Amaro Group (the “Amaro Group”), which as of February 28, 2018,29, 2020, held 2.58%1.98% of LATAM shares through TEP Chile, in addition to the indirect stake it has through the 21.88% interest it holds in Costa Verde Aeronáutica S.A., the main legal vehicle through which the Cueto Group holds LATAM shares, pursuant to which these two major shareholder groups have agreed to vote together to elect individuals to our board of directors in accordance with their direct and indirect shareholder interest in LATAM. Pursuant to athe shareholders’ agreement, the LATAM Controlling ShareholdersCueto Group and the Amaro Group have also agreed to use their good faith efforts to reach an agreement and act jointly on all actions to be taken by our board of directors or shareholdersshareholders’ meeting, and if unable to reach to such agreement, to follow the proposals made by our board of directors. Decisions by the Company that require supermajority votes under Chilean law are also subject to voting arrangements by the LATAM Controlling ShareholdersCueto Group and the Amaro Group. In addition, another major shareholder,other shareholders including, Delta Air Lines, Inc, which, as of February 29, 2020, held 20.00% of our common shares, and Qatar Airways Investments (UK) Ltd., which as of February 28, 2018,29, 2020, held 10.03%110.00% of our common shares, is entitled to appoint one individual to our board of directors. Thecould have interests of our major shareholdersthat may differ from those of our other shareholders. See “Item 7. ControllingMajor Shareholders and Related Party Transactions—A. Major Shareholders.”
(1) Qatar owns 9.999999918% of total issued shares of LATAM.
Under the terms of the deposit agreement governing the ADSs, if holders of ADSs do not provide JP Morgan Chase Bank, N.A., in its capacity as depositary for the ADSs, with timely instructions on the voting of the common shares underlying their ADRs, the depositary will be deemed to have been instructed to give a person designated by the board of directors the discretionary right to vote those common shares. The person designated by the board of directors to exercise this discretionary voting right may have interests that are aligned with our controlling shareholders, which may differ from those of our other shareholders. Historically, our board of directors has designated its chairman. Thechairman to exercise this right; for example, the members of the new board of Directorsdirectors elected by the shareholders in 20172019 designated Ignacio Cueto, to serve in this role.
Trading of our ADSs and common shares in the securities markets is limited and could experience further illiquidity and price volatility.
Our common shares are listed on the various Chilean stock exchanges. Chilean securities markets are substantially smaller, less liquid and more volatile than major securities markets in the United States. In addition, Chilean securities markets may be materially affected by developments in other emerging markets, particularly other countries in Latin America. Accordingly, although you are entitled to withdraw the common shares underlying the ADSs from the depositary at any time, your ability to sell the common shares underlying ADSs in the amount and at the price and time of your choice may be substantially limited. This limited trading market may also increase the price volatility of the ADSs or the common shares underlying the ADSs.
Holders of ADRs may be adversely affected by currency devaluations and foreign exchange fluctuations.
If the Chilean peso exchange rate falls relative to the U.S. dollar, the value of the ADSs and any distributions made thereon from the depositary could be adversely affected. Cash distributions made in respect of the ADSs are received by the depositary (represented by the custodian bank in Chile) in pesos, converted by the custodian bank into U.S. dollars at the then-prevailing exchange rate and distributed by the depositary to the holders of the ADRs evidencing those ADSs. In addition, the depositary will incur foreign currency conversion costs (to be borne by the holders of the ADRs) in connection with the foreign currency conversion and subsequent distribution of dividends or other payments with respect to the ADSs.
Future changes in Chilean foreign investment controls and withholding taxes could negatively affect non-Chilean residents that invest in our shares.
Equity investments in Chile by non-Chilean residents have been subject in the past to various exchange control regulations that govern investment repatriation and earnings thereon. Although not currently in effect, regulations of the Central Bank of Chile have in the past required, and could again require, foreign investors acquiring securities in the secondary market in Chile to maintain a cash reserve or to pay a fee upon conversion of foreign currency to purchase such securities. Furthermore, futureany changes in withholding taxes could negatively affect non-Chilean residents that invest in our shares.
We cannot assure you that additional Chilean restrictions applicable to the holders of ADRs, the disposition of the common shares underlying ADSs or the repatriation of the proceeds from an acquisition, a disposition or a dividend payment, will not be imposed or required in the future, nor could we make an assessment as to the duration or impact, were any such restrictions to be imposed or required. For further information, see “Item 10. Additional Information—D. Exchange Controls—Foreign Investment and Exchange Controls in Chile.”
Our ADS holders may not be able to exercise preemptive rights in certain circumstances.
The Chilean Corporation Law provides that preemptive rights shall be granted to all shareholders whenever a company issues new shares for cash, giving such holders the right to purchase a sufficient number of shares to maintain their existing ownership percentage. We will not be able to offer shares to holders of ADSs and shareholders located in the United States pursuant to the preemptive rights granted to shareholders in connection with any future issuance of shares unless a registration statement under the U.S. Securities Act of 1933, as amended, (the “Securities Act”), is effective with respect to such rights and shares, or an exemption from the registration requirements of the Securities Act is available. At the time of any rights offering, we will evaluate the potential costs and liabilities associated with any such registration statement in light of any indirect benefit to us of enabling U.S. holders of ADRs evidencing ADSs and shareholders located in the United States to exercise preemptive rights, as well as any other factors that may be considered appropriate at that time, and we will then make a decision as to whether we will file a registration statement. We cannot assure you that we will decide to file a registration statement or that such rights will be available to ADS holders and shareholders located in the United States.
We are not required to disclose as much information to investors as a U.S. issuer is required to disclose and, as a result, you may receive less information about us than you would receive from a comparable U.S. company.
The corporate disclosure requirements that apply to us may not be equivalent to the disclosure requirements that apply to a U.S. company and, as a result, you may receive less information about us than you would receive from a comparable U.S. company. We are subject to the reporting requirements of the Securities Exchange Act of 1934, as amended, or the Exchange Act. The disclosure requirements applicable to foreign issuers under the Exchange Act are more limited than the disclosure requirements applicable to U.S. issuers. Publicly available information about issuers of securities listed on Chilean stock exchanges also provides less detail in certain respects than the information regularly published by listed companies in the United States or in certain other countries. Furthermore, there is a lower level of regulation of the Chilean securities market and of the activities of investors in such markets as compared with the level of regulation of the securities markets in the United States and in certain other developed countries. For further information, see “Item 16. Reserved—G. Corporate Governance.”
| ITEM 4. | INFORMATION ON THE COMPANY |
A. HISTORY AND DEVELOPMENT OF THE COMPANY
General
LATAM Airlines Group is a Chilean-based airline holding company formed through the business combination of LAN Airlines S.A. of Chile and TAM of Brazil in 2012. Following the combination, LAN Airlines S.A. became “LATAM Airlines Group S.A.” and TAM S.A. continues to exist as a subsidiary of LATAM. The Company is primarily involved in the transportation of passengers and cargo and operates as one unified business enterprise. During 2016, we began the transition of unifying LAN and TAM into a single brand: LATAM.
LATAM’s airline holdings include LATAM and its affiliates in Chile, Peru, Argentina, Colombia and Ecuador, and LATAM Cargo and its affiliates MasAir (in Mexico) andaffiliate LANCO (in Colombia), as well as TAM S.A. and its affiliates TAM Linhas Aereas S.A (LATAM Airlines Brazil), TAM Transportes Aereos del Mercosur S.A., (LATAM Airlines Paraguay), and LATAM Cargo and Multiplus.Cargo. LATAM is a publicly traded corporation listed on the Santiago Stock Exchange (“SSE”), the Valparaiso Stock Exchange, the Chilean Electronic Exchange and the New York Stock Exchange (“NYSE”). with a market capitalization of US$4.12 billion as of February 29, 2020.
LATAM’s history goes back to 1929, when the Chilean government founded LAN. In 1989, the Chilean government sold 51.0% of LAN’s capital stock to Chilean investors and to theSAS, Scandinavian Airlines System. In 1994, LATAM’s current controlling shareholders, together with other major shareholders, acquired 98.7% of LAN’s stock, including the remaining shares then held by the Chilean government. In 1997, LAN became the first Latin American airline to list its shares (which trade in the form of ADSs) on the New York Stock Exchange.
Over the past decade, LATAM has significantly expanded its operations in Latin America, initiating services in Peru in 1999, Argentina in 2005, Ecuador in 2009, and Colombia in 2010 through the acquisition of Aerovias de Integracion Regional, Aires S.A. (“LAN Colombia”).2010. The business combination of LAN and TAM in June 2012 further expanded the Company’s operations in Brazil, where TAM Linhas Aéreas S.A. (“TLA” or “LATAM Airlines Brazil”), the TAM operating entity, is a leading domestic and international airline offering flights throughout Brazil with a strong domestic market share, international passenger services and significant cargo operations. TAM was founded in May 1997 (under the nameCompanhia de Investimentos em Transportes), for the purpose of participating in, managing and consolidating shareholdings in airlines. In September 2002, TAM’s name was changed to TAM S.A. and its shares were listed on the Brazilian Stock Exchange (“Bovespa”) in June 2005. From 2006 until the combination with LAN in 2012, TAM ADSs were also listed on the NYSE.
Our principal executive offices are located at Presidente Riesco 5711, 20th floor, Las Condes, Santiago, Chile and our general telephone number at this location is (56-2) 2565-8765.2565-2525. We have designated LATAM Airlines Group as our agent in the United States, located at 970 South Dixie Highway, Miami, Florida 33156. Our website address is www.latamairlinesgroup.net. Information obtained on, or accessible through, this website is not incorporated by reference herein and shall not be considered part of this annual report. For more information contact Andrés del Valle, Senior Vice President of Corporate Finance and Investor Relations, at InvestorRelations@latam.com.
The SEC maintains an internet site at http://www.sec.gov that contains reports, information statements, and other information regarding issuers that file electronically with the SEC.
Capital Expenditures
For a description of our capital expenditures, see “Item 5. Operating and Financial Review and Prospects—B. Liquidity and Capital Resources—Capital Expenditures.”
B. BUSINESS OVERVIEW
General
LATAM Airlines Group is the largest passenger and cargo airline group in South America. We are also one of the largest airline groups in the world in terms of network connections, providing passenger transport services to approximately 137145 destinations in 2426 countries and cargo services to approximately 144151 destinations in 29 countries, with aan operating fleet of 307331 aircraft and a set of bilateral alliances. In total, LATAM Airlines Group has approximately 43,00042,000 employees. For the year 2017,2019, LATAM transported 67approximately 74 million passengers. LATAM Airlines Group and its affiliates currently provide domestic services in Brazil, Chile, Perú,Peru, Argentina, Colombia and Ecuador; weand also provide intra-regional and long-haul operations. The cargo affiliate carriers of LATAM in Chile, Brazil, Colombia and MexicoColombia carry out cargo operations through the use of belly spacesspace on the passenger flights and dedicated cargo operations using freight aircraft. We also offer other services, such as ground handling, courier, logistics and maintenance.
As of December 31, 2017,2019, we provided scheduled passenger service to 17 destinations in Chile, 1820 destinations in Peru, fivesix destinations in Ecuador, 1513 destinations in Argentina, 14 destinations in Colombia, 4145 destinations in Brazil, 1110 destinations in other Latin American countries and the Caribbean, fiveseven destinations in North America, sixseven destinations in Europe, four destinations in the South PacificAustralasia, one destination in Asia and one destination in Africa.
In addition, as of December 31, 2017,2019, through our various code-sharing and interline agreements, we offer service to 7066 destinations in North America, 4467 destinations in Europe, 1715 destinations in Australasia, 1322 destinations in Asia and four7 destinations in Africa.
Competitive Strengths
Our strategy is to maintain LATAM Airlines Group’s position as the leading airline in South America by leveraging our unique position in the airline industry. LATAM Airlines Group is the only airline group in the region with a domestic presence in six markets, as well as intra-regional and long-haul operations.operations to five continents. As a result, the Company has geographical diversity and operational flexibility, as well as a proven track record of acting quickly to adapt its business to economic challenges. Moreover, LATAM’s unique leadership position in a region with growth potential and the focus on our existing competitive strengths, will allow us to continue building our business model and fuel our future growth, ensuring LATAM’s long term sustainability. We believe our most important competitive strengths are:
Leader in the South America Airlines Space, with a Unique Leadership Position among Global Airlines
Through a successful regional expansion strategy, LATAM Airlines Group has become the leading international and domestic passenger airline group in South America, as well as the largest cargo operator in Latin America. LATAM and its affiliates have domestic passenger operations in Chile, Brazil, Peru, Argentina, Colombia and Ecuador. We are also the largest operator of intra-regional routes, connecting the main cities and also some secondary cities in South America. Furthermore, through our significant presence in the largest hubs in South America—Lima and São Paulo—we are able to offer the best connectivity options between South America and the rest of the world. In addition, our cargo companies are the largest air cargo operators within, to and from Latin America, and particularly in Brazil.
Geographically Diversified Revenue Base, including both Passenger and Cargo Operations
Our operations are highly geographically diversified, including domestic operations in six different countries, as well as operations within South America and connecting South America with various international destinations. We believe this provides resilience to external shocks that may occur in any particular market. Furthermore, we believe that one of our distinct competitive advantages is our ability to profitably integrate our scheduled passenger and cargo operations. We take into account potential cargo services when planning passenger routes, and also serve certain dedicated cargo routes using our freighter aircraft when needed. By adding cargo revenues to our existing passenger service, we are able to increase the productivity of our assets and maximize revenue, reducing our break-even load factors and enhancing our per flight profitability. Additionally, this revenue diversification helps offset seasonal revenue fluctuations and reduces the volatility of our business over time. For the year ended December 31, 2017,2019, passenger, cargo and other revenues accounted for 83.6%86.3%, 11.0%10.2% and 5.4%3.5% of total revenues respectively.
Modern Fleet and Optimized Fleet Strategy
The average age of our fleet is approximately eightnine years, making it one of the most modern in Latin America and in the world. A younger fleet makes us more cost competitive because it reduces fuel consumption and maintenance costs, and enables us to enjoy a high degree of performance reliability. In addition, a modern and fuel-efficient fleet reflects our strong commitment to the environment as new aircraft incorporate the industry’s latest technology, allowing for a substantial reduction in emissions, and also in noise levels.
We select our aircraft based on their ability to effectively and efficiently serve our short- and long-haul flight needs, while still striving to minimize the number of different aircraft types we operate.
The Company’s current fleet plan envisageincludes a short-haul fleet formed exclusively by aircraft from the A320 family, with a focus on the A321 and A320neo, a re-engined A320 that the Company received for the first time in 2016, becoming the first airline in Latin America to fly this model. During 2017,2019, LATAM incorporated twonine additional A320neosA320neo into its fleet.
For long-haul passenger flights, we operate the Boeing 767-300ER, the Boeing 787-8, the Boeing 787-9, the Boeing 777-300ER and the Airbus A350-900 which started operations in 2016. The Boeing 787 and Airbus A350 models allow us to achieve important savings in fuel consumption, while incorporating modern technology to deliver the best travel experience for our passengers. In 2017,2019, we incorporated four Airbus 350-900 and two Boeing 787-9 into our fleet.
LATAM continues to take a flexible approach to its fleet plan in order to better align it to market conditions. During 2017,2019, LATAM further restructured its fleet delivery schedule, achieving a reduction of US$1.1 billion in fleet commitments for the Company received four aircraft, the lowest number in the historyperiod 2020-2022, equivalent to a reduction of LATAM, and subleased some aircraft to third parties to adjust to demand during the year.approximately 38% of total fleet commitments for this period.
Strong Brand Teamed with Key Global Strategic Alliances
In May 2016 our new brand, LATAM, was officially launched. We believe that our new brand is associated with superior service and technologically advanced operations, and is well recognized and respected in the markets in which we operate. In 2017,2019, LATAM Airlines Group was named Bestfor the second year running as the ‘Best Global Airline toin South AmericaAmerica’ in the 14th annual Global Traveler GT Tested Reader Survey Awards, and South America’s LeadingPassenger Experience Association of Airlines (APEX) Passenger Choice Awards. In addition, for the second year in a row, LATAM Airlines Group led the rankings of the “Punctuality List 2020,” compiled by the Official Airline Guide (OAG), which highlights LATAM Airlines Group as the global leader in the World Travel Awards 2017, recognizing customers’ preference“Mega Airlines” category. In addition, LATAM also received the first place in punctuality in the global category, according to the annual On-Time Performance (OTP) report compiled for LATAM’s brand over other South American Airlines.
the year 2019 by Cirium, expert consultants in analysis of travel data.
LAN joined theoneworld®alliance, one of the world’s leading airline alliances, in 2000. TAM (now LATAM Airlines Brazil) joinedoneworld®in 2014, marking a significant milestone and completing the entry of all LATAM Airlines into oneworld®. To our passengers, this means greater convenience when traveling, since they will have the same standard of high-quality customer service, regardless of their international destination. Our strategic global alliances and existing commercial agreements provide our customers with access to more than 1,000 destinations worldwide, a combined reservations system, itinerary flexibility and various other benefits, which substantially enhance our competitive position within the Latin American market.
In 20162019, LATAM entered into two joint business agreements: ana framework agreement with American AirlinesDelta Air Lines, Inc. that will we expect to unlock new growth opportunities, building upon Delta’s and anLATAM’s global footprint. For more information on the framework agreement with British Airwayssee “Item 4. Information on the Company—B. Business Overview—Passenger Alliances and Iberia. These agreements further strengthen our relationship with otheroneworld® partners. Both agreements will allow LATAM to expand its network to more than 420 destinations worldwide, operating routes from South America to the United States and Canada with American Airlines and routes from South America to Europe with British Airways and Iberia. Some approvals have already been granted during 2017. The administrative court of economic defense of the CADE (Administrative Council for Economic Defense) in Brazil and the Civil Aviation Authority in Colombia approved the agreements with American Airlines and British Airways and Iberia. During the review, the authorities evaluated the scope of the agreement in terms of free competition and the benefits that it will bring to passengers, including improved connectivity, expansion of the destination network and reduced prices. Both agreements were approved in Uruguay in 2016. The agreements remain subject to the sign off by the Executive branch in Brazil and to regulatory approval in Chile and in the United States (LATAM – American Airlines).
Commercial Agreements.”
Financial Flexibility
We have historically managed our business to maintain financial flexibility and a strong balance sheet, seeking to accommodate our growth objectives while having the ability to respond to changing market conditions. Our financial flexibility has allowed us to secure large aircraft deliveries, including an important part of our current re-fleeting program, at attractive financing rates. Our wide array of funding sources includes bilateral loans, syndicated loans, aircraft rentals and a variety of capital markets structures, among others.
Recognized Loyalty ProgramsProgram
Our frequent flyer programs, LATAM Fidelidade andprogram, LATAM Pass, together representis the leading frequent flyer programsprogram in South America, with strong participation rates and brand recognition by our customers. Customers in eachthe program earn points or miles based on the price paid for the ticket, class of ticket purchased, and elite level, as well as by using the services of outside partners in the program. In addition, in 2009 TAM launched its affiliate Multiplus, a coalition of loyalty programs, which allows members to accumulate points not just by flying with LATAM, but also by making purchases through credit cards or using services and products at partner establishments, and allows members to redeem points for LATAM Airlines flights and other products at partner establishments.
We believe these flexible programs arethat our program is attractive to customers because they doit does not impose restrictions on those flights for which points can be redeemed, or limit the number of seats available on any particular flight to members using the loyalty program. LATAM Pass and LATAM Fidelidade members can also accrue and redeem points for flights on otheroneworld® member airlines. airlines with whom we have bilateral commercial agreements.
Business Strategy
Our mission is to connect people safely, with operational excellence and a personal touch, seeking to become one of the most admired airline groups in the world. In order to achieve our mission, the principal areas on which we plan to focus our efforts going forward are as follows:
Continually Strengthen Our Network
We intend to continue to strengthen our route network in South America, offering the best connectivity within the region at competitive prices and ensuring that we are the most convenient option for our passengers. We believe that we are the only airline group in the world with a local presence in six home markets and an international and intra-regional operation. This position is bolstered by our enhanced infrastructure in several of our key hubs, allowing us to further strengthen our network. We intend to leverage our position to create a leading portfolio of services and destinations, providing more options to our passengers and building a platform to support continued growth.
Enhance Brand Leadership and Customer Experience
We will always seek to be the preferred choice of passengers in South America. Our efforts are supported by a differentiated passenger experience and our leveraging of mobile digital technologies. We continue working on the implementation of our single, unified brand, culture, product and value proposition for our passengers. Additionally, we are focused on defining LATAM’s digital strategy, including applications to achieve ancillary revenues and improving the management of contingencies, so that we are able to provide information and solutions to our customers in a timely and transparent manner. We continually assess opportunities to incorporate service improvements in order to respond effectively to our customers’ needs.
Improving Efficiency and Cost Competitiveness
We are continually working to maintain a competitive cost structure and further improve our efficiency, simplify our organization and increase flexibility and speed in decision-making. Cost savings include reductions in fuel and fees, procurement, operations, overhead and distribution costs, among others, as well as the implementation of a customized service offering in domestic and international markets. We are currently working at an accelerated pace on cost initiatives in all these areas.
Organizational Strength
We aspire to be a group of passionate people, working in a simple and aligned manner, with inspiring leaders making agile decisions. This will allow us to deliver a distinctive value proposition to our customers and operate sustainably over the long term.
Proactive Risk Management
We strive to have a holistic and responsible view of risk in decision-making. We put special focus on risks that have high potential impact and low probability of occurrence, which could significantly affect LATAM’s strategic objectives.
Airline Operations and Route Network
The following tables set forth our operating revenues by activity and point of sale for the periods indicated:
| | | Year ended December 31, | |
| | | 2017 | | | 2016 | | | 2015 | |
| | | (in US$ millions) | |
| Total passenger revenues | | | 8,494.5 | | | | 7,877.7 | | | | 8,410.6 | |
| Total cargo revenues | | | 1,119.4 | | | | 1,110.6 | | | | 1,329.4 | |
| Total traffic revenues | | | 9,613.9 | | | | 8,988.3 | | | | 9,740.0 | |
| | | Year ended December 31, | |
| | | 2019 | | | 2018 | | | 2017 | |
| | | (in US$ millions) | |
| Total passenger revenues | | | 9,005.6 | | | | 8,709.0 | | | | 8,494.5 | |
| Total cargo revenues | | | 1,064.4 | | | | 1,186.5 | | | | 1,119.4 | |
| Total traffic revenues | | | 10,070.1 | | | | 9,895.5 | | | | 9,613.9 | |
| | | Year ended December 31, | |
| | | 2017 | | | 2016 | | | 2015 | |
| | | (in US$ millions) | |
| | | | | | | | | | |
| Peru | | | 626.3 | | | | 627.2 | | | | 681.3 | |
| Argentina | | | 1,113.5 | | | | 1,031.0 | | | | 979.3 | |
| United States | | | 900.4 | | | | 933.1 | | | | 1,025.5 | |
| Europe | | | 676.3 | | | | 714.4 | | | | 723.1 | |
| Colombia | | | 359.3 | | | | 343.0 | | | | 353.0 | |
| Brazil | | | 3,436.4 | | | | 2,974.2 | | | | 3,464.3 | |
| Ecuador | | | 190.3 | | | | 198.2 | | | | 238.5 | |
| Chile | | | 1,527.2 | | | | 1,512.6 | | | | 1,575.5 | |
| Asia Pacific and rest of Latin America | | | 784.3 | | | | 654.6 | | | | 699.5 | |
| Total Operating Revenues | | | 9,613.9 | | | | 8,988.3 | | | | 9,740.0 | |
| | | Year ended December 31, | |
| | | 2019 | | | 2018 | | | 2017 | |
| | | (in US$ millions) | |
| | | | | | | | | | |
| Peru | | | 802.0 | | | | 705.1 | | | | 626.3 | |
| Argentina | | | 585.0 | | | | 989.9 | | | | 1,113.5 | |
| United States | | | 1,004.2 | | | | 985.9 | | | | 900.4 | |
| Europe | | | 726.2 | | | | 782.2 | | | | 676.3 | |
| Colombia | | | 380.4 | | | | 372.8 | | | | 359.3 | |
| Brazil | | | 3,949.8 | | | | 3,433.9 | | | | 3,436.4 | |
| Ecuador | | | 203.3 | | | | 203.8 | | | | 190.3 | |
| Chile | | | 1,547.0 | | | | 1,591.3 | | | | 1,527.2 | |
| Asia Pacific and rest of Latin America | | | 872.2 | | | | 830.5 | | | | 784.2 | |
| Total Operating Revenues | | | 10,070.1 | | | | 9,895.5 | | | | 9,613.9 | |
Passenger Operations
General
As of December 31, 2017,2019, our passenger operations were performed through airlines in Chile, Brazil, Peru, Argentina, Colombia and Ecuador, where we operate both domestic and international services. We collect and report operating data for our passenger operations in three categories: international (connecting more than one country), Domestic operations in Spanish speaking countries or “SSC” (including Chile, Peru, Argentina, Colombia, and Ecuador), and Domestic Brazil (wholly within Brazil).
The following table sets forth certain of our passenger operating data for international and domestic routes for the periods indicated:
| | | Year ended and as at December 31 | |
| | | 2017 | | | 2016 | | | 2015 | |
| | | | | | | | | | |
| ASKs (million) (at period end) | | | | | | | | | | | | |
| International | | | 76,366.1 | | | | 73,541.9 | | | | 69,615.9 | |
| SSC | | | 23,821.0 | | | | 23,847.1 | | | | 22,072.8 | |
| Domestic Brazil | | | 36,211.3 | | | | 37,578.7 | | | | 42,478.5 | |
| Total | | | 136,398.4 | | | | 134,967.7 | | | | 134,167.1 | |
| | | | | | | | | | | | | |
| RPKs (million) | | | | | | | | | | | | |
| International | | | 66,344.2 | | | | 63,392.6 | | | | 59,003.4 | |
| SSC | | | 19,407.9 | | | | 19,293.7 | | | | 17,858.4 | |
| Domestic Brazil | | | 29,940.6 | | | | 30,940.5 | | | | 34,648.1 | |
| Total | | | 115,692.7 | | | | 113,626.9 | | | | 111,509.9 | |
| | | | | | | | | | | | | |
| Passengers (thousands) | | | | | | | | | | | | |
| International | | | 16,057 | | | | 15,107 | | | | 14,156 | |
| SSC | | | 22,775 | | | | 22,829 | | | | 21,540 | |
| Domestic Brazil | | | 28,314 | | | | 29,024 | | | | 32,139 | |
| Total | | | 67,146 | | | | 66,960 | | | | 67,835 | |
| | | | | | | | | | | | | |
| | | Year ended and as at December 31 | | | Year ended December 31, | |
| | | | 2019 | | | 2018 | | | 2017 | |
| | | | | | | | | |
| ASKs (million) (at period end) | | | | | | | | |
| International | | | | 81,332.3 | | | | 81,059.5 | | | | 76,366.1 | |
| SSC | | | | 27,337.2 | | | | 24,664.0 | | | | 23,821.0 | |
| Domestic Brazil | | | | 40,442.3 | | | | 37,541.2 | | | | 36,211.3 | |
| Total | | | | 149,111.9 | | | | 143,264.7 | | | | 136,398.4 | |
| | | | | | | | | | | | | | |
| RPKs (million) | | | | | | | | | | | | | |
| International | | | | 69,065.4 | | | | 68,365.3 | | | | 66,344.2 | |
| SSC | | | | 22,092.7 | | | | 20,220.6 | | | | 19,407.9 | |
| Domestic Brazil | | | | 33,363.0 | | | | 30,491.5 | | | | 29,940.6 | |
| Total | | | | 124,521.1 | | | | 119,077.4 | | | | 115,692.7 | |
| | | | | | | | | | | | | | |
| Passengers (thousands) | | | | | | | | | | | | | |
| International | | | | 16,186 | | | | 16,456 | | | | 16,057 | |
| SSC | | | | 26,619 | | | | 23,928 | | | | 22,775 | |
| Domestic Brazil | | | | 31,384 | | | | 28,422 | | | | 28,314 | |
| Total | | | | 74,189 | | | | 68,806 | | | | 67,146 | |
| | | 2017 | | 2016 | | 2015 | | | | | | | | | | | | | |
| Passenger RASK (passenger revenues/ASK, in US cents) | | | | | | | | | | | | | | | | | | | | | | | | |
| International(1) | | | US¢6.2 | | | | US¢5.8 | | | | US¢6.5 | | | US¢ | 5.8 | | | US¢ | 6.1 | | | US¢ | 6.2 | |
| SSC(1) | | | US¢7.3 | | | | US¢6.9 | | | | US¢8.3 | | | US¢ | 6.5 | | | US¢ | 7.1 | | | US¢ | 7.3 | |
| Domestic Brazil(1) | | | US¢6.6 | | | | US¢5.8 | | | | US¢5.9 | | | US¢ | 6.9 | | | US¢ | 6.3 | | | US¢ | 6.6 | |
| Combined Passenger RASK(2) | | | US¢6.2 | | | | US¢5.8 | | | | US¢6.3 | | | US¢ | 6.0 | | | US¢ | 6.1 | | | US¢ | 6.2 | |
| | | | | | | | | | | | | | | | | | | | | | | | | |
| Passenger load factor (%) | | | | | | | | | | | | | | | | | | | | | | | | |
| International | | | 86.9 | % | | | 86.2 | % | | | 84.8 | % | | | 84.9 | % | | | 84.3 | % | | | 86.9 | % |
| SSC | | | 81.5 | % | | | 80.9 | % | | | 80.9 | % | | | 80.8 | % | | | 82.0 | % | | | 81.5 | % |
| Domestic Brazil | | | 82.7 | % | | | 82.3 | % | | | 81.6 | % | | | 82.5 | % | | | 81.2 | % | | | 82.7 | % |
| Combined load factor | | | 84.8 | % | | | 84.2 | % | | | 83.1 | % | | | 83.5 | % | | | 83.1 | % | | | 84.8 | % |
| (1) | RASK information for each of our business units is provided because LATAM believes that it is useful information to understand trends in each of our operations. We use our revenues as defined under IFRS to calculate this metric. The revenues per business unit include ticket revenue, breakage, excess baggage fee, frequent flyer program revenues and other revenues. These operating measures may differ from similarly titled measures reported by other companies and should not be considered in isolation or as a substitute for measures of performance in accordance with IFRS. This unaudited operating data is not included in or derived from LATAM’s financial statements. |
| (2) | The combined Passenger RASK for LATAM is calculated by dividing passenger revenues by total passenger ASKs. |
International Passenger Operations
Our international network combinesincludes the international operations of our Chilean, Peruvian, Ecuadorian, Argentinean, Colombian and Brazilian affiliates. WeLATAM Airlines Group and its affiliates have operated international services out of Chile since 1946 and have since greatly expanded our international services, offering flights out of Peru, Ecuador, Argentina, Colombia and Brazil. As of December 31, 2017, we offer 272019, LATAM offers 30 international destinations in 1820 countries, in addition to our domestic destinations and international flights and connections between our domestic destinations.
OurThe general strategy to expand our international network is aimed at enhancing our value proposition by offering customers more destinations and routing alternatives, and promoting tourism to and within South America.alternatives. Sustained development of ourLATAM’s international network is a crucial factor in ourthe long-term strategy. The group provides long-haul services out of Santiago, Lima, Guayaquil, Buenos Aires, Bogota, Sao Paulo and Rio de Janeiro. The group also provides regional services from Chile, Peru, Ecuador, Argentina, Colombia and Brazil.
During 2017, we received two Boeing 787-9 Dreamliners (we have orders for eight more), which will allow us to achieve important savings on fuel consumption, while incorporating modern technology, to deliver the best travel experience for our passengers and reduce our carbon footprint, as the Dreamliner produces up to 20% less CO2 than similar aircraft. We also took delivery of two Airbus A320neos, out of an order of 32 aircraft of this model, becoming the first airline in Latin America to fly this model.
During 2017,2019, the group has continued to grow at Guarulhos Airport in SaoSão Paulo, Jorge Chavez Airport in Lima and Comodoro Arturo Merino Benítez Airport in Santiago, launching 11 new international routes (excluding new seasonal routes) during the year and announcing 1126 new routes, to be launched during 2018 (excluding new seasonal routes operated by LATAM Brazil and LATAM Chile), including additional destinations such as San José in Costa Rica, Boston in the U.S. and Rome in Europe.especially from our main hubs.
As part of our mission, LATAM seeks to promote tourism to South America. Due to our large network of services, visitors from around the world can experience world-renowned destinations such as Cusco, Easter Island, the Galapagos Islands, Iguazu Falls in Brazil, and Patagonia in Chile and Argentina, including the cities of Punta Arenas, Puerto Natales, Ushuaia, El Calafate and Bariloche.
Market Share Information
The following table presents air passenger traffic information for international flights (including intra-regional flights) and LATAM’s market share in each geographic market in which we operate:
| | | | LATAM passenger figures | | | LATAM’s Market Share | | | |
| Country | | LATAM passenger figures | | LATAM’s Market Share | | % variation 2019-2018 | | | 2019 | | | 2018 | | | % variation |
| | | % variation 2017-2016 | | 2017 | | 2016 | | % variation | |
| Brazil(1) | | | +6.3% | | | | 74.9 | % | | | 78.9 | % | | -4.0 p.p. | | | +0.2 | % | | | 26.6 | % | | | 29.2 | % | | -2.6 p.p. |
| Chile(2) | | | +10.3% | | | | 58.4 | % | | | 61.3 | % | | -2.9 p.p. | | | -2.1 | % | | | 52.6 | % | | | 55.6 | % | | -3.0 p.p. |
| Argentina(3) | | | +9.5% | | | | 12.7 | % | | | 11.7 | % | | +1.0 p.p. | | | -16.9 | % | | | 21.0 | % | | | 25.6 | % | | -4.6 p.p. |
| Peru(4) | | | +9.8% | | | | 44.8 | % | | | 43.1 | % | | +1.7 p.p | | | +4.3 | % | | | 42.9 | % | | | 41.6 | % | | +1.3 p.p. |
| Colombia(5) | | | +8.7% | | | | 8.7 | % | | | 8.0 | % | | +0.7 p.p | | | +0.5 | % | | | 5.4 | % | | | 6.2 | % | | -0.9 p.p. |
Ecuador(3)(6) | | | +14.0% | | | | 15.6 | % | | | 18.4 | % | | -2.8 p.p. | | | +2.5 | % | | | 11.4 | % | | | 14.9 | % | | -3.5 p.p. |
| (1) | Source: ANAC Brazil’s website. Variation and marketPassenger figures considers passengers carried in 2019 vs 2018. Market share considering RPK. Figures are considering only Brazilian airlinesconsiders passengers carried as of December. |
| (2) | Source: JAC Chile’s website. Variation and marketPassenger figures considers passengers carried in 2019 vs 2018. Market share considering numberconsiders passenger carried of passengers carried.December. |
| (3) | Source: Diio.net. Variation and marketANAC Argentina’s website. Passenger figures considers passengers carried in 2019 vs 2018. Market share considering ASKs.considers passenger carried as of December. |
| (4) | Source: Ministry of Transportation Peru’s website. Variation and marketPassenger figures considers passengers carried in 2019 vs 2018. Market share consideringconsiders number of passengers carried.carried as of December. |
| (5) | Source: DGAC Colombia’s website. Variation and marketDiio.net. Passenger figures considers ASK changes in 2019 vs 2018. Market share considering RPK.considers ASKs as of December. |
| (6) | Source: Diio.net. Passenger figures considers ASK changes in 2019 vs 2018. Market share considers ASKs as of December. |
Competitors in international routes
The following table shows LATAM’s main competitors in each geographic market in which we operate:
| Country | | Route | | Competitors |
| Brazil | | North America | | American Airlines, United Airlines, Azul Linhas Aereas, Delta Air Lines, Azul Linhas AereasAir Canada, Aeromexico and Avianca Brazil.GOL. |
| | | | |
| | Latin America | | Copa, Gol,GOL, Avianca, Aerolineas Argentinas, Aeromexico, Azul Linhas Aereas, and Avianca Brazil. Sky Airline. |
| | | | |
| | Europe | | TAP Portugal, Air France-KLM, Lufthansa,IAG, Alitalia, British Airways, Iberia and Air Europa.Lufthansa. |
| | | | |
| | Africa | | Ethiopian Airlines, South African Airways, Royal Air Maroc, EthiopianTAAG Angola Airlines, and TAAG AngolaCabo Verde Airlines. |
| | | | |
| Chile | | North America | | American Airlines, Air Canada, Delta Air Lines, United Airlines, and Delta Air Lines.Aeromexico. |
| | | | |
| | Latin America | | Copa, Avianca, Sky Airline, Avianca, JetSmart Aeromexico, Gol, and Aerolineas Argentinas..Argentinas. |
| | | | |
| | Europe | | IAG, Air France-KLM, Iberia, Alitalia, British Airways and Air Europa.Alitalia. |
| | | | |
| | Pacific | | Qantas Airways. |
| | | | |
| Argentina | | North America | | American Airlines, Aerolíneas Argentinas, Copa,Aeromexico, United Airlines, and Delta Air Lines. |
| | | | | |
| | Latin America | | Aerolineas Argentinas, Gol, Copa, GOL, Avianca, and Aeromexico. |
| | | | Azul Linhas Aereas. |
| Peru | | North America | | American Airlines, Avianca, Aeromexico, InterJet, United Airlines, Air Canada, Delta Air Lines, AviancaJetBlue Airways and JetBlue Airways.Spirit Airlines. |
| | | | |
| | Latin America | | Avianca, Copa, Aeromexico.Aeromexico, InterJet, JetSMART, and Sky Airline. |
| | | | |
| | Europe | | Air France-KLM, Iberia,IAG, Air Europa, and British Airways. |
| | | | Plus Ultra. |
| Colombia | | North America | | Avianca, InterJet, American Airlines, Spirit Airlines, Aeromexico, JetBlue Airways, United Airlines, JetBlue Airways. Spirit AirlinesAir Canada and Delta Air Lines. |
| | | | | |
| | Latin America | | Avianca, Copa,InterJet, Aeromexico, ABC Aerolineas S.A. de C.V. and Aerolineas Argentinas. |
| | | | Copa. |
| Ecuador | | North America | | American Airlines, TAME Linea Aerea del Ecuador,JetBlue Airways, InterJet, Delta Air Lines, United Airlines, and JetBlue Airways.Spirit Airlines. |
| | | | |
| | Latin America | | Avianca, Copa, InterJet, Aeromexico, TAME Linea Aerea del Ecuador and Avior AirlinesGOL |
| | | | |
| | Europe | | Air France-KLM, Iberia and Air Europa. |
Source: Diio.net considering ASKs.
Domestic Passenger Operations
As of December 31, 2017,2019, domestic passenger services within Chile, Brazil, Peru, Ecuador, Argentina and Colombia were operated by LATAM Airlines Chile, LATAM Airlines Brazil, LATAM Airlines Peru, LATAM Airlines Ecuador, LATAM Airlines Argentina and LATAM Airlines Colombia, respectively.
Business Model for Domestic Operations
In November 2016, the group announced an important project to revamp the business model of our domestic services offerings in the six domestic markets where the group operateswe operate in South America. The purpose of this change iswas to increase our competitiveness and ensure the long-term sustainability of our domestic business model. As of December 2017, LATAMWe implemented this new travelbusiness model in itsall of our domestic operations, in Brazil, Chile, Colombia, Ecuador and Peru. This project seeks to increase our operational efficiency, allowing us to provide more competitive fares and contributing to the development of tourism and the growth of air travel per capita in the region. The new domestic service model requires continuous cost reduction efforts, and we are implementingcontinue to implement a series of initiatives to reduce cost per ASK in all domestic operations. These efforts are aimed at significantly reducing selling and distribution expenses, increasing fleet utilization and operational productivity and simplifying back-office and support functions, thereby allowing us to expand our operations while controlling fixed costs.
Another key element of this business model is initiatives to increase our ancillary revenues, while allowing passengers to customize their journey. Customers on domestic flights are now are able to access a simpler sales platform, which allows them to choose their fare depending on the type of journey they want, and to purchase additional services such as extra luggage, a variety of food and beverage options on board, preferred seating options and the flexibility to change tickets.
In January 2020, LATAM Airlines Group announced that it will introduce its superior cabin class, Premium Economy, in all domestic and international flights within Latin America operated by the Airbus A320 family (A319, A320, A320neo and A321; “short-/medium-haul”) aircraft, starting March 16, 2020. This cabin class offers premium services both at the airport and in-flight, including priority check-in and boarding, VIP lounge access in airports where available, a differentiated onboard service (including complimentary snacks and drinks), an exclusive overhead bin for hand luggage and a blocked-middle seat, providing greater space and privacy.
We continue to develop digital initiatives to empower passengers providing them an enhanced digital experience with end-to-end control of their reservation. LATAM customers will increasingly be able to buy, check-in and manage the after sale service in a simpler and faster manner through their smartphones.
The new domestic strategy was implemented by the affiliate airlines in five out of six countries during 2017.
The following table shows LATAM’s number of destinations, passengers transported, market share and main competitors in each domestic market in which we operate:
| | | Brazil | | | Chile | | | Argentina | | | Peru | | | Colombia | | | Ecuador | |
| Destinations | | | 45 | | | | 17 | | | | 13 | | | | 20 | | | | 14 | | | | 6 | |
| Passengers Transported (million) | | | 31.4 | | | | 8.5 | | | | 2.5 | | | | 8.6 | | | | 5.9 | | | | 1.2 | |
| Change (YoY) | | | 10.4 | % | | | 6.6 | % | | | 5.2 | % | | | 16.6 | % | | | 16.8 | % | | | (2.2 | %) |
| | | | | | | | | | | | | | | | | | | | | | | | | |
| Market share | | | 38 | %(1) | | | 57 | %(2) | | | 16 | %(3) | | | 63 | %(4) | | | 25 | %(5) | | | 32 | %(5) |
| Main competitors | | | Gol, Azul | | | | Sky Airlines, JetSmart | | | | Aerolíneas Argentinas, Flybondi, JetSmart, Norwegian, Andes | | | | Sky Airlines Peru, Viva Airlines Peru, Star Peru, Avianca | | | | Avianca, Viva Colombia, EasyFly, Satena, Copa Airlines Colombia (“Wingo”) | | | | Tame, Avianca | |
| | | Brazil | | Chile | | Argentina(6) | | Peru | | Colombia | | Ecuador |
| | | | | | | | | | | | | |
| Destinations | | 41 | | 16 | | 15 | | 18 | | 14 | | 5 |
| | | | | | | | | | | | | |
| Passengers Transported (million)Change (YoY) | | 28.3
(2.4%) | | 7.7
(2.2%) | | 2.5
(2.5%) | | 6.7
1.8% | | 4.8
0.4% | | 1.0
4.6% |
| | | | | | | | | | | | | |
| Market share | | 33%(1) | | 71%(2) | | 18%(3) | | 58%(4) | | 23%(5) | | 36%(3) |
| | | | | | | | | | | | | |
| Main competitors | | Gol, Azul, Avianca Brazil | | Sky Airlines, JetSmart | | Aerolíneas Argentinas, Andes | | Peruvian Airlines, Avianca, LC Peru, Star Perú, Viva Air Peru | | Avianca, Viva Colombia, Satena, Copa Airlines Colombia (“Wingo”) | | Tame, Avianca |
| (1) | Source: ANAC Brazil’s website. Market share considers RPKs.RPKs as of December 2019. |
| (2) | Source: JAC Chile’s website. Market share considers RPKs.RPK as of December 2019. |
| (3) | Source: Diio.net.EANA Argentina’s website. Market share considers ASKs.passenger transported as of December 2019. |
| (4) | Source: Ministry of Transportation Peru’s website. Market share considers number of passengers carried as of December 2017.2019. |
| (5) | Source: DGAC Colombia’s website.Diio.net. Market share considers RPKsASKs as of December 2019. |
| (6) | Business model not yet implemented |
On April 3, 2019, LATAM Airlines Brazil, announced that it had been approached by Elliott Associates L.P., Elliott International L.P., and Manchester Securities Corporation (jointly “Elliott”), the largest debt holders of Oceanair Linhas Aéreas S.A. and AVB Holding S.A. (jointly “Avianca Brasil”), in connection with the auction of one independent productive unit (“IPU”) of Avianca Brazil (including but not limited to certain contracts, operating certificates, permits, and slots). The auction was part of Elliot’s restructuring proposal and included bidsinthe minimum amount of US$70 million. In addition, as part of the proposed restructuring, LATAM Airlines Brazil extended to Avianca Brasil US$13 million of debtor–in–possession loans to finance, in part, working capital in support of their operations, amount that will be reimbursed to LATAM Airlines Brazil if the restructuring proposal is successful.
On July 10, 2019, LATAM Airlines Brazil presented winning bids for the IPUs ‘B’ and ‘C’, valued at US$70 million and US$10,000, respectively. The adjudication, and the payment, of the aforementioned productive units is subject to any and all required governmental and antitrust approvals. However, the ANAC in Brazil distributed slots according to its regular procedures, with the exception of Congonhas’ airport in São Paulo, for which ANAC defined a new distribution rule that resulted in LATAM Airlines Brazil not receiving slots at that airport.
Passenger Alliances and Commercial Agreements
Strategic Alliance with Delta
On September 26, 2019, LATAM entered into a framework agreement (the “Framework Agreement”) with Delta Air Lines, Inc. (“Delta”) relating to(i) the creation of a strategic alliance between the two airlines,(ii) the purchase by Delta of a number of common shares representing up to 20% of LATAM share capital through a tender offer process, (iii) payment by Delta of certain transition costs and provision of certain support services, and(iv) the purchase by Delta of certain aircraft currently owned by LATAM and the assignment to and assumption by Delta of certain aircraft ordered by LATAM. Below is a brief summary of main details of the partnership.
StrategicAlliance.Under the Framework Agreement, LATAM and Delta agreed to enter into a strategic alliance with respect to passenger and cargo networks, on routes between the United Stated and Canada and certain countries in Latin America, allowing LATAM and Delta to offer their customers access to a greatly expanded array of destinations. The implementation of the strategic alliance is subject to governmental and regulatory approvals, including antitrust requirements.
Tender offer and investment.Under the Framework Agreement, Delta commenced a public tender offer for the acquisition of up to 20% of LATAM common shares at a price per share of U.S. $16. On December 29, 2019, the public tender offer was finalized, resulting in Delta acquiring a total amount of 121,281,538 shares, representing 20% of the total common shares issued, subscribed and paid of LATAM Airlines for an overall investment of approximately U.S. $ 1.9 billion. The settlement of the tender offer occurred on January 3, 2020. In connection with consummation of the tender offer, Delta is now entitled to representation on the LATAM board of directors.
Transition costs and support services. Under the Framework Agreement, Delta agreed to(i)pay LATAM certain transition costs that LATAM is currentlyexpected to incur in connection with the framework agreement, for an overall amount of U.S. $ 350 million, and(ii)providing certain transition support services to LATAM.
Aircraft purchase and assumptions.Under the Framework Agreement, Delta, in support of its ongoing fleet transformation, agreed to(i)purchase from LATAM four Airbus A350 aircraft, and(ii) assume LATAM’s commitment to purchase 10 additional Airbus A350 aircrafts that are to be delivered beginning in 2021 through 2025.
Termination of previous arrangements and alliances and subscription of new codeshare agreements
On September 26, 2019, and after being a member for around 20 years, LATAM communicated its decision to exit the oneworld global alliance, and indicated that it would not be entering in any other global alliance at this time. In line with this decision, LATAM also announced the termination of the global marketing allianceoneworld, which includescodeshare agreements with American Airlines effective January 31, 2020, and that it will not participate in the previously announced JBA.
In addition, on December 2, 2019, the group’s affiliates in Colombia, Peru and Ecuador signed codeshare agreements with Delta to provide greater connectivity with the United States starting the first quarter of 2020, also subject to applicable regulatory approval.
On December 6, 2019, LATAM Airlines Group announced that it will not participate in the proposed joint business agreement (JBA) with International Airlines Group (IAG; the parent company of British Airways Cathay Pacific Airways, Finnair, Iberia, Japan Airlines, Malaysia Airlines, Qantas, Qatar Airways, Royal Jordanian, Sri Lankan and S7 Airlines. InIberia). The decision was made for commercial reasons and in the aggregate,oneworld® members serve more than 1,000 destinationscontext of changes in 150 countries, operating approximately 13,000 daily departures.the aviation market since the JBA was first announced in January 2016.
Other alliances and material commercial agreements
In addition, LATAM and its affiliates have ongoing passenger commercial agreements with several airlines, including American Airlines, Iberia, Quantas,Qantas, British Airways, Lufthansa, Swiss, Interjet, All NipponQatar Airways, Korean Air, China Eastern, Cathay Pacific, Japan Airlines and Jetstar Airways, among others. These commercial agreements allow us to provide additional benefits to our passengers, including access to a wider network, more flight options with better connectionconnections times, more competitive fares to destinations not served by LATAM, and increased potential for developing new routes and adding direct flights to new destinations and to destinations already served by LATAM.
Moreover, on January 14, 2016, we entered into two joint business agreements: an agreement with American Airlines and an agreement with British Airways and Iberia. These agreements further strengthen our relationship with theseoneworld® partners. The agreements remain subject to regulatory approval in different countries. Both agreements have been approved in Uruguay on 2016. During 2017, joint business agreement with American Airlines was approved without mitigation measures by the competition authorities of Colombia and Brazil in May and September, respectively. The agreement with airlines of the IAG group (Iberia and British Airways) was authorized by the antitrust authorities of Brazil and Colombia in March and July, respectively. In Chile, the agreements are in a consultation process with TDLC (“Tribunal de la Libre Competencia”). Finally, the Department of Transportation of the United States (US - DOT) requires the ratification by Brazil of open skies with the United States to review the JBA with American Airlines notified in May 2016. In this regard, in December 2017 and in March 2018, the Chamber of Deputies and the Senate of Brazil, respectively, approved the ratification of the open skies agreement between both countries, which remains subject to approval by the Executive branch.
Passenger Marketing and Sales
During 2019, the LATAM Group continued to strengthen its network, especially from its main hubs in São Paulo (Guarulhos), Lima and Santiago. In connection with these efforts, LATAM’s affiliates launched new non-stop routes connecting Guarulhos with Santa Cruz, Navegantes, Ilheus and Ribeirao Preto, Lima with Cali, Ilo, Calama, Brasilia, Porto Alegre and Montego Bay, and Santiago with Sydney, Quito, Porto Alegre and Brasilia, among others.
Our long-haul marketing strategy emphasizes attributes valued by our international customers: reliable, high-quality
In 2019 the LATAM Group introduced the new Premium Business experience that incorporates the enhanced new cabins; aimed at transforming the travel experience. The investment in this program exceeded US$500 million, including, US$400 million in cabin renovation. In 2019 the cabin transformation was implemented in five Boeing 777 aircraft, five 767 aircraft and 32 A320 aircraft. The new service centered onand gastronomic concept of the Premium Business class, provides greater rest, comfort and entertainmentprivacy so that passengers can arrive fresh at their destination.
As part of our commitment to offer more options, customization and flexibility to serve all types of passengers, the new ‘Basic’ fare was introduced, thus replacing the previous ‘Promo’ option for long-haul travel. We also highlight our extensive network, which coversdomestic flights, becoming the company’s most economical option for passengers.
In addition, LATAM received several awards and recognitions; LATAM was elected as the most important destinations in South America and the Caribbean and provides frequent service to major overseas gateways such as New York, Los Angeles, Miami, Orlando, London, Madrid, Paris, Frankfurt, Milan, Barcelona, Johannesburg and Sydney. In a continuing effort to strengthen our network, during 2017 we launched a new direct route between Santiago and Melbourne (our longest flight).
Our short-haul operations are designed to fit our customers’ needs: punctuality, reliability, frequency, modern aircraft and efficient operations. To deliver this value proposition, we have been increasing our fleet and frequencies with more point-to-point flights, and streamlined processes including Internet sales, web and mobile check-in and airport self-check-in and self-bag-tag. We also launched Mercado LATAM, a new buy on board service for food and beverages in our domestic flights in Brazil, Chile, Peru, Colombia and Ecuador.
We strive to deliver on our promise to our customers. Therefore, we constantly monitor customer satisfaction with in-flight surveys and research, and measure our performance against the highest standards. This commitment to excellence is reflectedpunctual airline group in the numerous prizes and recognitions earnedworld by the Company.Official Airline Guide (OAG) and Cirium. For the fourth consecutive year, LATAM Airlines was named the ‘Best Airline to South America’ at the Global Traveler GT Tested Reader Survey Awards. LATAM was also recognized as ‘South America’s Leading Airline’ in the World Travel Awards 2017 for the second year in a row.row, LATAM Airlines Group led the rankings of the “Punctuality List 2020,” compiled by OAG, which highlights LATAM Group as the global leader in the “Mega Airlines” category. In addition, LATAM also received first place in punctuality in the global category, according to the annual On-Time Performance (OTP) report compiled by Cirium. LATAM Airlines Group was recognized as the ‘Best Airline in South America’ in Skytrax World Airline Awards, LATAM also was awarded by passengers as the “Best global Airline of South America” according to the awards APEX Passenger Choice.
LATAM Airlines Group was listed in the ‘World’ category of the Dow Jones Sustainability Index (DJSI) for the sixth consecutive year; recognition of the company’s ongoing commitment to incorporating sustainable practices into every aspect of its operations. Today, LATAM Airlines Group is the only airline group in the Americas with a presence in this category and one of the only three airline groups in the world in the category.
LATAM was also named as the “Official Airline” of the Lima 2019 Panamerican and Parapanamerican Games, which were held for the first time in Peru.
Branding
During 2019 the loyalty programs of LATAM Pass and LATAM Fidelidade were combined under the single brand, LATAM Pass, to deliver to our customers a unified and integrated experience with the benefits of LATAM Airlines. Since October 1, 2019, LATAM Pass is LATAM’s single loyalty program, becoming the fourth largest program in the world and the largest in South America, with more than 33 million members worldwide. See “Item 4. Information on the Company—B. Business Overview—Frequent Flyer Program.”
Our brand, “LATAM”, was officially launched in May 2016. The new brand brings together all
In October 2019, continuing our commitment to deliver a world-class experience to our customers, we unveiled our Star Wars-inspired Boeing 777 “Stormtrooper Plane” under a partnership with Disney, just days after the passenger and cargo airline operationsofficial premiere launch of the LATAM Airlines Group carriers. We seek to continue the legacy of leadership started decades ago by LAN, TAM and their respective affiliate carriers. movie, Star Wars: Gallaxy’s Edge zone Disney Hollywood Studios park in Orlando, Florida.
We are committed to the future of South America and to connecting it to the world. Our new brand allows us to offer a better, more consistent service throughout our network, which in turn strengthens our position in the region.
Using a single brand enables LATAM’s customers to better understand the common service and operating standards among its airlines. LATAM’s unified image has improved its visibility, thereby increasing the efficiency of its marketing efforts.
Since the launch of our new brand, we have made significant progress on its implementation, making our brand visible to our passengers. The new brand has been adopted at most of our airports, and we now offer a new single website for all of our different points of sale. The LATAM brand has also been applied to 63 aircraft. We also launched new uniforms for our crew, adopting the Company’s colors of indigo and coral while providing elegance and comfort for our crew.
Distribution Channels
We are committed to being the preferred choice of our customers, placing the passenger at the center of our decision making. Our distribution structure is divided into direct and indirect distribution channels, both focused on improving their respective platforms to allow for easy interaction for our client in sales and services alike. Direct channels owned by LATAM are comprised of city ticket offices, contact-centers and e-Business (including website, mobile and smart business), and accounted for approximately 55%53% of total passengerssales in 20172019 (including award passenger)passengers). These direct channels support sales and service, both before and after the flight.
Our city ticket offices include additional services in order to complement the experience of our customers. Our contact centers are a multi-service channel providing support in six languages (Spanish, English, Portuguese, French, German and Italian).
The e-Business channel is an integral partWe are committed to constantly improving the way we offer our products via our distribution channels, including the adoption of our commercial, marketing and service efforts, and during 2017 our Internet-related sales increased by 8.5% compared to 2016.new technology. The Company will continue to improve its e-Business platforms to support expected future growth and simplify our customer’s purchasingcustomers’ online experience.
Our digital strategy includes mobile applications that provide trip information to our passengers. These applications improve management of contingencies, enable us to provide information and solutions to our customers in a timely and transparent manner and serve as a new direct sales channel.
Our city ticket offices include additional services in order to complement the experience of our customers. Our contact centers are a multi-service channel providing support in six languages (Spanish, English, Portuguese, French, German and Italian).
Indirect channels currently include travel agencies, general sales agencies, direct channels from other airlines and online agencies, and accounted for a 45%47% of total passengerssales in 2017.2019. LATAM offers travel agencies different options to connect to our systems and provide their customers our best product offering. These options include Global Distribution Systems as well as our direct connection eLATAM, which we are continuously expanding and improving.
Frequent Flyer ProgramsProgram
Our frequent flyer programs areprogram is a key element of our marketing and loyalty strategy. These programs rewardThe program rewards customer loyalty, and, as a result, generategenerates incremental revenue and promotes customer retention.
In 2016,2019 we announcedestablished a new way to qualify for “Elite” status in our revamped frequent flyer programs named LATAM Pass and LATAM Fidelidade. This change is part of the process of consolidating our new brand identity (LATAM) and the evolution of the programs, which enhances existing benefits and introduces new benefits for program members.
During 2017 LATAM Pass and LATAM Fidelidade improved the way members earn points and kilometers from the prior system (based on the distance flown) to a new method based on the price paid for the ticket. In addition, during 2017,ticket, and is aligned with a simpler methodology for mileage accrual, generating simplicity and efficiency to our frequent flyer program. As a LATAM Pass announcedmember, you can access superior categories and enjoy better benefits by earning Qualifying Points on all your flights. Qualifying Points are different from LATAM Pass Points, which you can use to redeem for tickets and on-board benefits. The amount of Qualifying Points you earn depends on the changedollars spent on purchasing the ticket (discounting charges, taxes and additional services) and the multiplier of the currency of the program from kilometers to miles, effective January 3, 2018, in line with industry standardsdestination (domestic or international).
Also, a new alliance with Amazon was implemented, strengthening the value of miles available for redemption.
During 2019, LATAM Airlines Brazil acquired the 27.3% minority stake of Multiplus S.A. (“Multiplus”), a former subsidiary of TAM. Multiplus was launched by TAM in 2009 and in February 2010 it became a publicly traded company in Brazil following its initial public offering, and TAM S.A continued to own 72.74% of the ordinary shares of Multiplus. On September 5, 2018, it was announced that (i) LATAM Airlines Brazil did not intend to extend or renew the operational agreement entered into with Multiplus after December 31, 2024, and (ii) LATAM Airlines Brazil intended to launch a tender offer to acquire all of the outstanding shares of Multiplus that LATAM’s affiliates do not currently own, and to subsequently delist Multiplus from the B3 Novo Mercado and cancel its registration. After acquiring 100% of Multiplus, in May 31, 2020, LATAM Airlines Brazil merged with Multiplus, bringing more flexibility to offer program members a better value proposition for redeeming points and increase the preference for our services.
The frequent flyer program is a strategic asset for the airline group, and a core source of value that differentiates LATAM from other carriers. The acquisition of Multiplus and its full integration into LATAM’s network will, together with LATAM Pass, create what LATAM estimates to be the fourth largest frequent flyer and loyalty program in the world (measured by member base). LATAM Airline Brazil’s decision is consistent with recent transactions in the industry, and with the strategy of in-house frequent flyer business models of the largest global airlines.
In addition, a new tier category, Gold Plus, was launched in its market with focus on recovering Brazilian’s domestic corporate market share delivering to a specific type of customer a better experience at the airport, and also a better mileage accrual. Improvements for the Gold category include priority check-in in all flights (for Gold category only in international flights) and free same day changes for Brazilian domestic flights.
As of December 31, 2017,2019, LATAM Pass and LATAM Fidelidade had 29.7approximately 33 million members, which representsrepresenting an increase of 13.7%8.5% compared to 2016.2018. Members of LATAM’s loyalty programsthe LATAM Pass program receive benefits and increased pointsincrease miles for ticket purchases in accordance with their elite level status, as well as by purchasing the services of other partners in the LATAM Pass and LATAM Fidelidade programs.program. Customers of the program can redeem miles or points for free tickets as well as for other products. LATAM Pass and LATAM Fidelidade members are classified in fourfive elite levels: Gold, Gold Plus, Platinum, Black and Black Signature. These different groups determine which benefits customers are eligible to receive, including mile earning bonuses, free upgrades, VIP lounge access and preferred boarding and check-in.
Multiplus
In 2009, TAM launched Multiplus, a company designed to create a broader network in which LATAM Airlines Brazil’s customers can earn points through the LATAM Fidelidade program. Multiplus is a coalition of loyalty programs that permits the accrual of points that can be redeemed for products and services offered by many different partner companies, in addition to LATAM Airlines. We believe this expanded network acts as a sales channel for LATAM Airlines, helping to capture and retain customers and increase sales. Multiplus is attractive to our frequent flyers because it allows them to accrue loyalty points in other ways besides flying, including, day-to-day purchases such as: credit card points, gas station, sporting goods, toys, insurance and the purchase of mobile and fixed-line telephone services.
In 2017, non-air redemption reached 18% of the total points. At the end of 2017, Multiplus had more than 300 partners and approximately 19.6 million participants that can accrue Multiplus points directly (through LATAM Fidelidade, co-branded cards, apps, retail partners, etc.) and indirectly (by transferring points from a partner program).
Multiplus became a publicly traded company in Brazil following its initial public offering in February 2010. TAM S.A continues to own 72.74% of the ordinary shares of Multiplus.
On December 10, 2009, Multiplus entered into an Operating Agreement with LATAM Airlines Brazil, effective as of January 1, 2010, which established the terms and conditions governing the relationship with TLA (the “Operating Agreement”). Under the Operating Agreement, Multiplus became responsible for, among other tasks, processing information on accumulating and redeeming points under the LATAM Airlines Brazil Loyalty Program, and delivering awards to the members of said program, in accordance with the rules of the TAM Loyalty Program and the Multiplus network. The Operating Agreement is valid for 15 years and is automatically renewed every five years thereafter.check-in privileges.
On January 24, 2017, Multiplus S.A. and Banco Itaucard S/A (“Itaucard”) launched their first co-branded credit card, a result of the partnership announced in July 2016 by both companies. The new Multiplus Itaucard card comes to the market with the best point accumulation per dollar spent by means of conversion and differentiated bonuses. Carrying the MasterCard banner, the card is available in the International, Gold, Platinum and Black versions.
On February 14, 2017, aiming to increase the value created to Multiplus and LATAM shareholders, and to improve the alignment of interests between Multiplus and TLA, we announced the annual revision of the cost per seat (transfer price) and the approval of the point redemption tables pursuant to the Operating Agreement. The revision was a result of a detailed evaluation, considering the weighted average for each market, region of origin/flight destination, fare class, demand, distance and season, generating approximately 11,000 different combinations. We do not believe that the revision will result in any increase to the Company's unit cost.
On February 24, 2017, Multiplus S.A. and Banco Citibank S/A (“Citi”) enhanced their partnership by offering holders of Citi credit cards the ability to accumulate points directly within the loyalty network. Citi and Multiplus previously shared a benefits program available on Diners card, the points from which can be transferred to Multiplus.
In 2017, Multiplus S.A. and Telefônica Brasil S.A - Vivo (“Vivo Valoriza”) launched a partnership with the aim of bringing together two leaders in their respective segments, in a quest to offer the best benefits to their Multiplus members and Vivo Valoriza’s customers, including credit for the use of fixed-line telephones, broadband and TV services.
On August, 28, 2017 Multiplus S.A. announced unrestricted access to flights of the LATAM Group, LATAM Airlines Brasil, LATAM Airlines Chile and other airlines that will be joining the Group in the future, thus increasing ticket redemption options for airline tickets by members of the Company's coalition network, with particular emphasis on destinations such as: Sydney, Melbourne, Miami, New York, Los Angeles, Barcelona, Madrid, Lima, Cusco, Cartagena, Buenos Aires, Bariloche, and Easter Island. Multiplus will also have the right to operate exclusively as a coalition in the following regions: Brazil, Paraguay, Mexico, the United States and all European countries, while LATAM will have the right to exploit the business of the coalition exclusively in Central and South America (except for Mexico, Paraguay and Brazil). These changes will be implemented during 2018.
The remaining provisions established in the original Operating Agreement, including, without limitation, those relating to reciprocal exclusivity, term of effectiveness and situations for termination with or without cause, remain, in their essence, unchanged.
One of Multiplus’ advantages is the expansion of the airline network available for point redemption by passengers. In October, Multiplus also introduced a new version of our hotel reservation platform in partnership with Hotéis.com, expanding the portfolio to more than 300,000 hotels and hostels around the world and offering the option of paying in up to 12 installments, including facilitating payment prior to trip, upon arrival at the travel destination, or at the time of check-out. Members can also accrue points on purchases.
All of the gains and achievements mentioned above serve to demonstrate Multiplus’ focus and investment in delivering the best experience to our more than 19.6 million members, in order to be the best loyalty network.
Cargo Operations
The Cargo business is operated internationally and domestically by affiliate airlines under the unified LATAM Cargo brand, which has acquired significant market recognition. The cargo business generally operates on the same route network used by the passenger airline business. It includes approximately 144151 destinations; of which around 137approximately 145 are served by passenger and/or freighter aircraft and 7six are served only by freighter aircraft.
The following table sets forth certain of our cargo-operating statistics for domestic and international routes for the periods indicated:
| | | Year ended and as at
December 31, | | | Year ended and as at
December 31, | |
| | | 2017 | | 2016 | | 2015 | | | 2019 | | | 2018 | | | 2017 | |
| | | | | | | | | | | | | | | |
| ATKs (millions) | | | 6,230.3 | | | | 6,704.1 | | | | 7,082.8 | | | | 6,356.7 | | | | 6,497.6 | | | | 6,230.3 | |
| RTKs (millions) | | | 3,421.3 | | | | 3,465.9 | | | | 3,797.0 | | | | 3,526.0 | | | | 3,582.5 | | | | 3,421.3 | |
| Weight of cargo carried (thousands of tons) | | | 895.9 | | | | 944.3 | | | | 1,008.7 | | | | 903.8 | | | | 920.6 | | | | 895.9 | |
| Total cargo yield (cargo revenues/RTKs, in U.S. cents) | | | 32.7 | | | | 32.0 | | | | 35.0 | | | | 30.2 | | | | 33.1 | | | | 32.7 | |
| Total cargo load factor (%) | | | 54.9 | % | | | 51.7 | % | | | 53.6 | % | | | 55.5 | % | | | 55.1 | % | | | 54.9 | % |
We derive our revenues from the transport of cargo through our dedicated freighter fleet and in the bellies of our passenger aircraft.
1)Bellies of our passenger aircraft. We consider our passenger network to be a key competitive advantage due to the synergies between passenger and cargo operations and, accordingly, we have developed a strategy to increase our competitiveness by enhancing our belly offering.
2)Dedicated freighterFreighter fleet. As of December 31, 2017,2019, our dedicated freighter fleet under operation consisted of ninetwelve Boeing 767-300 freighters, each with a capacity for 58 structural tons of freight each. In 2017 we continued ourfreight. Our freighter fleet optimization efforts, subleasing partunder operation consisted of eleven Boeing 767-300F since one of our Boeing 767-300F and Boeing 777-200F aircraft to a third party. As of December 31, 2017, one Boeing 767-300F and one Boeing 777-200F werewas subleased to a third party.MasAir S.A. The freighter fleet program has two main focus areas: first, to support the group’s belly business, improving its load factor by feeding cargo into our passenger routes, and second, to provideenhance our product offering by providing our customers flexibility in scheduling, origins, destinations and destinations. With these two objectivestypes of cargo.
The United States is the main market for cargo traffic to and from Latin America. Besides being the main market for Latin American exports by air, cargo consolidated in mind,the United States accounts for the majority of goods transported by air to Latin American countries. Accodingly, we are complementing and enhancinghave headquartered our network. Ininternational cargo operations in Miami. This geographical location is a natural gateway between Latin America and the principalUnited States. We also utilize of passenger flights to and from New York, Los Angeles, Orlando and Boston and our dedicated freighter service to Chicago. Additionally, we operated road-feeder network to feed traffic from other origins ofin the United States,
The LATAM Group also transports cargo to and from nine destinations in Europe: London, Barcelona, Milan, Paris, Lisbon, Frankfurt, Madrid, Amsterdam and Brussels. The first five points are served only via passenger aircraft. Frankfurt and Madrid are served by both passenger and freighter aircraft, while Amsterdam and Brussels are only served through freighter operations. We operate a road-feeder service within Europe to expand our cargo are footprint and balance traffic between our different origins.
Chile, Colombia, Peru, Ecuador, Brazil and Argentina, whichBrazil represent a large part of ourthe northbound traffic. This demand is mainly concentrated on a small number of product categories, such as exports of fish, sea products and fruits from Chile, asparagus and fruits from Peru, and exports of fresh flowers from Ecuador and Colombia.
For theThe main destinations for southbound flights,traffic are Brazil, is the main import market.Chile, Colombia and Peru. Southbound demand is mainly concentrated on a small number of product categories including high-tech equipment, mining equipment, electronics, auto parts and pharmaceuticals.
The largest domestic cargo operations are in Brazil, where ABSALATAM Cargo Brasil remains the market leader, there, carrying cargo for a variety of customers, including other international air carriers, freight-forwarding companies, export-orientedlogistics operators, e-commerce companies and individual consumers.
The United States accounts for the majority of cargo traffic to and from Latin America. Besides being the main market for Latin American exports by air, the United States is also the main supplier of goods transported by air to Latin American countries. We have thus headquartered our international cargo operations in Miami. This geographical location is a natural gateway between Latin America and the United States. We also transport cargo to and from eight destinations in Europe: London, Madrid, Milan, Paris, Barcelona, Frankfurt, Amsterdam and Basel. The first six are served via passenger aircraft, and we serve Amsterdam, Frankfurt and Basel through freighter operations.
During 2017,2019, cargo traffic decreased 1.3%,1.6% mainly due to a reduction in cargoweaker imports to Latin America. Cargo capacity of 7.1%decreased 2.2% and as a result of capacity adjustments in the passenger network during 2016, primarily in the routes between Brazil to the United States, and a reduction in the capacity of the dedicated freighter operations during 2017. As a result cargo load factors increased by 3.2%, reaching 54.9%improved 0.4 points to 55.5%. Cargo yields improved 2.1%decreased 8.8% during 2017,2019, mainly due to an improvement in imports from Northa lower air cargo demand into Latin America and Europe to Brazil driven by major imports of electronics and spare parts, as a result of more stable market conditionsan increase in the country as well as the appreciation of the Brazilian Real.
industrial capacity in certain Trans-Atlantic markets.
The cargo business in the region is highly competitive, as international and regional carriers often have spare capacity in their cargo operations. Despite this, we have been able to maintain solid market shares through efficient utilization of ourthe fleet and network. Today, on Latin America-United States routes, ourthe main competitors are Centurion,Atlas Air, Avianca Cargo Atlas Air and American Airlines. On the Latin America-Europe routes, ourthe main competitors are Cargolux, Lufthansa Cargo, MartinairAir France/KLM, IAG Cargo and Emirates Airlines.Qatar Airways.
Divestiture of Aerotransportes Mas de Carga, S.A. de C.V. (November 30th 2018)
On November 30, 2018, LATAM Airlines Group sold its direct and indirect stakes in Mexican cargo airline MasAir S.A. At the time, MasAir operated one Boeing 767-300F subleased from the Company. As of December 31, 2019, MasAir continued operating this aircraft under a sublease. As a result of this sale MasAir no longer consolidates with LATAM.
Cargo-Related Investigations
See “Item 8. Financial Information—A. Consolidated Financial Statements and Other Financial Information—Legal and Arbitration Proceedings.”
Fleet
General
As of December 31, 2017, the Group2019, we operated a fleet of 307331 aircraft, comprised of 298320 passenger aircraft and nine11 cargo aircraft. Along with that,In addition, we subleased nine11 aircraft, comprised of seven10 passenger aircraft and two1 cargo aircraft to third parties (one of them not included in the table below as it was reclassified from property plant and equipment to held for sale).parties.
| | | Number of aircraft | | | | | | | | | | |
| | | Total | | | Owned(1) | | | Operating Lease | | | Average term of
lease remaining
(years) | | | Average
age (years) | |
| Passenger aircraft(2) | | | | | | | | | | | | | | | | | | | | |
| Airbus A320-Family Aircraft | | | | | | | | | | | | | | | | | | | | |
| Airbus A319-100 | | | 46 | | | | 37 | | | | 9 | | | | 4.6 | | | | 10,1 | |
| Airbus A320-200(3) | | | 131 | | | | 93 | | | | 38 | | | | 3.1 | | | | 9.4 | |
| Airbus A321-200 | | | 47 | | | | 30 | | | | 17 | | | | 8.3 | | | | 3.7 | |
| Airbus A320-200neo | | | 4 | | | | 1 | | | | 3 | | | | 10.8 | | | | 0.7 | |
| Airbus A350-Family Aircraft | | | | | | | | | | | | | | | | | | | | |
| Airbus A350-900(4) | | | 7 | | | | 5 | | | | 2 | | | | 10.8 | | | | 1.5 | |
| Boeing Aircraft | | | | | | | | | | | | | | | | | | | | |
| Boeing 767-300ER | | | 36 | | | | 34 | | | | 2 | | | | 2.8 | | | | 9.2 | |
| Boeing 787-8 | | | 10 | | | | 6 | | | | 4 | | | | 8.2 | | | | 4.1 | |
| Boeing 787-9 | | | 14 | | | | 4 | | | | 10 | | | | 10.1 | | | | 2.0 | |
| Boeing 777-300ER | | | 10 | | | | 4 | | | | 6 | | | | 6.9 | | | | 6.7 | |
| | | | | | | | | | | | | | | | | | | | | |
| Total passenger aircraft | | | 305 | | | | 214 | | | | 91 | | | | 5.9 | | | | 7.7 | |
| Cargo aircraft | | | | | | | | | | | | | | | | | | | | |
| Boeing 767-300 Freighter(5) | | | 10 | | | | 8 | | | | 2 | | | | 2.0 | | | | 14.4 | |
| Boeing 777-200 Freighter(6) | | | 0 | | | | 0 | | | | 0 | | | | 0 | | | | 0 | |
| Total cargo aircraft | | | 10 | | | | 8 | | | | 2 | | | | 2.0 | | | | 14.4 | |
| Total fleet | | | 315 | | | | 222 | | | | 93 | | | | 5.8 | | | | 7.9 | |
| | | Number of aircraft in operation | |
| | | Total | | | Aircraft included in Property, plant and equipment | | | Aircraft included as Rights of use assets | | | Average term of lease remaining (years) | | | Average age (years) | |
| Passenger aircraft(1) | | | | | | | | | | | | | | | |
| Airbus A320-Family Aircraft | | | | | | | | | | | | | | | | | | | | |
| Airbus A319-100 | | | 46 | | | | 37 | | | | 9 | | | | 2.6 | | | | 12.1 | |
| Airbus A320-200(2) | | | 142 | | | | 96 | | | | 46 | | | | 4.4 | | | | 10.6 | |
| Airbus A321-200 | | | 49 | | | | 30 | | | | 19 | | | | 6.5 | | | | 5.6 | |
| Airbus A320-neo | | | 13 | | | | 7 | | | | 6 | | | | 10.1 | | | | 1.3 | |
| Airbus A350-Family Aircraft | | | | | | | | | | | | | | | | | | | | |
| Airbus A350-900(3) | | | 13 | | | | 6 | | | | 7 | | | | 10.6 | | | | 2.3 | |
| Boeing Aircraft | | | | | | | | | | | | | | | | | | | | |
| Boeing 767-300ER(4) | | | 31 | | | | 29 | | | | 2 | | | | 0.8 | | | | 10.4 | |
| Boeing 787-8 | | | 10 | | | | 6 | | | | 4 | | | | 6.2 | | | | 6.1 | |
| Boeing 787-9 | | | 16 | | | | 6 | | | | 10 | | | | 8.1 | | | | 3.5 | |
| | | | | | | | | | | | | | | | | | | | | |
| Boeing 777-300ER | | | 10 | | | | 4 | | | | 6 | | | | 6.1 | | | | 8.7 | |
| | | | | | | | | | | | | | | | | | | | | |
| Total passenger aircraft | | | 330 | | | | 221 | | | | 109 | | | | 5.8 | | | | 8.8 | |
| Cargo aircraft | | | | | | | | | | | | | | | | | | | | |
| Boeing 767-300 Freighter(5) | | | 12 | | | | 11 | | | | 1 | | | | 2.0 | | | | 16.0 | |
| Total cargo aircraft | | | 12 | | | | 11 | | | | 1 | | | | 2.0 | | | | 16.0 | |
| Total fleet | | | 342 | | | | 232 | | | | 110 | | | | 5.7 | | | | 9.1 | |
| (1) | Aircraft included within property, plant and equipment. |
| (2) | All passenger aircraft bellies are available for cargo. |
| (3)(2) | Five A320-200 aircraft A320-200 leased to a third part. Does not include one A320-200 that was reclassified from property, plant and equipmentparty. |
| (3) | Five A350-900 aircraft leased to a third party, four of which are classified as held for salesale. |
| (4) | Two aircraft A350-900 leased to a third part.Includes one Boeing 767-300ER classified as held for sale. |
| (5) | One Boeing 767-300F aircraft B767-300F leased to a third part. |
| (6) | Does not include two B777-200F (one currently lease to a third party), that were reclassified from property, plant and equipment to held for sale.party. |
The airline group operatesLATAM Airlines Group and its affiliantes operate various different aircraft types that are best suited for our different services, which include short-haul domestic and continentalintracontinental trips as well as long-haul transcontinentalintercontinental flights. WeThe aircraft have been selected our aircraft based on their ability to effectively and efficiently serve all of these missionsroutes while trying to minimize the number of aircraft families we operate.
For short-haul domestic and continental flights, the group operatesLATAM Airlines Group and its affiliantes operate Airbus A320-Family aircraft. The Airbus A320-Family has been incorporated into our fleet pursuant to operating leases orand has been acquired directly from Airbus pursuant to various purchase agreements since 1999. In 2017,2019, we redelivered 17 A319 andtwo A320 aircraft under operatinga lease, disassembled one A320 aircraft, received fourteen A320 aircraft under leases and received twonine A320neo aircraft.
in accordance with our purchases agreement with Airbus. For long-haul passenger wepassengers LATAM Airlines Group and its affiliates operate the Boeing 767-300ER, the Boeing 787-8 and 787-9, the Boeing 777-200ER and 777-300ER, and the Airbus A350-900 aircraft.
In 2019, we sold two Boeing 767 and received four Airbus A350-900 and two Boeing 787-9 in accordance with various purchases agreement.
For cargo flights, we operate the Boeing 767-300F aircraft.
In 2019, two Boeing 767 passenger aircraft were converted into two Boeing 767-300F aircraft.
The average utilization rates of LATAM’s aircraft for each of the periods indicated are set forth below, in hours per day.
| | | 2019 | | | 2018 | | | 2017 | |
| Passenger aircraft | | | | | | | | | |
| Boeing 767-300ER | | | 10.1 | | | | 10.2 | | | | 9.4 | |
| Boeing 787-8/9 | | | 11.0 | | | | 9.3 | | | | 11.2 | |
| Airbus A320-Family | | | 10.0 | | | | 9.7 | | | | 9.2 | |
| Boeing 777-300ER | | | 10.1 | | | | 11.0 | | | | 11.6 | |
| Airbus A350-900 | | | 7.6 | | | | 8.2 | | | | 9.1 | |
| | | | | | | | | | | | | |
| Total passenger aircraft | | | 10.0 | | | | 9.7 | | | | 9.5 | |
| Cargo aircraft | | | | | | | | | | | | |
| Boeing 767-300 Freighter | | | 12.3 | | | | 11.9 | | | | 11.5 | |
| Boeing 777-200 Freighter(1) | | | - | | | | 7.7 | | | | 12.6 | |
| | | | | | | | | | | | | |
| Total cargo aircraft | | | 12.3 | | | | 11.8 | | | | 11.7 | |
| | | | | | | | | | | | | |
| Total passenger and cargo | | | 10.1 | | | | 9.8 | | | | 9.6 | |
| 35(1) | Aircraft sold in April 2018. |
| | | 2017 | | | 2016 | | | 2015 | |
| | | | | | | |
| Passenger aircraft | | | | | | | | | | | | |
| Boeing 767-300ER | | | 9.4 | | | | 10.0 | | | | 11.3 | |
| Boeing 787-8/9 | | | 11.2 | | | | 11.0 | | | | 11.7 | |
| Airbus A320-Family | | | 9.2 | | | | 8.9 | | | | 9.5 | |
| Boeing 777-300ER | | | 11.6 | | | | 11.7 | | | | 12.2 | |
| Airbus A330-200 | | | - | | | | 4.4 | | | | 6.2 | |
| Airbus A350-900 | | | 9.1 | | | | 8.5 | | | | 0.8 | |
| Total passenger aircraft | | | 9.5 | | | | 9.0 | | | | 9.7 | |
| | | | | | | | | | | | | |
Cargo aircraft | | | | | | | | | | | | |
| Boeing 767-300 Freighter | | | 11.5 | | | | 12.0 | | | | 10.9 | |
| Boeing 777-200 Freighter | | | 12.6 | | | | 13.6 | | | | 13.0 | |
| Total cargo aircraft | | | 11.7 | | | | 12.5 | | | | 11.5 | |
| | | | | | | | | | | | | |
| Total passenger and cargo | | | 9.6 | | | | 9.1 | | | | 9.8 | |
Fleet Leasing and Financing Arrangements
LATAM’s fleet financing and leasing structures include borrowing from financial institutions and leasing under financial leases, tax leases, sale-leaseback transactions and pure operating leases. As of December 31, 2017,2019, LATAM had 315a total fleet of 342 aircraft, of which eighteleven were subleased to third parties resulting in 307331 aircraft in operation. Of the aircraft in operation, 155 are operated by LATAM Airlines and 143 aircraft are operated by LATAM Airlines Brazil and 9 are operated by LATAM Airlines Cargo.
As of December 31, 2017,2019, LATAM’s operating fleet was comprised of 174142 financial leases, 1225 tax leases, 83 operating97 leases, 1039 aircraft as loan guarantees and 28 unencumbered aircraft. Most of LATAM’s financial and tax leases are structured with a 12-year initial term. LATAM has 4032 financial aircraft leases supported by the U.S. Export-Import Bank (“EXIM Bank”) and 8168 supported by the European Export Credit Agencies (the “ECAs”). LATAM’s operating lease maturities initially range from three to 12twelve years.
LATAM’s aircraft debt, which is comprised of financial and tax leases, is denominated in U.S. dollars and typically has quarterly amortization payments. Both the financial leases and tax leases have a bank (or a group of banks) as counterparty; however, the tax leases also include third parties. 63.3%49.59% of our aircraft debt has a fixed interest rate and the balance has a floating rate based on USD LIBOR.
In order to reduce LATAM Airlines Brazil’s balance sheet FX exposure to the Brazilian real, as part of the integration plan following the combination with TAM, we have sought to transfer the majority of the LATAM Airlines Brazil aircraft under financial leases to the LATAM level. As of December 31, 2017, we have transferred 512019, only eight aircraft are subject to LATAM. This program has helped reduce the exposure to approximately US$0.8 billion equivalent.financial leases by LATAM Airlines Brazil. See “Item 5. Operating and Financial Review and Prospects—B. Liquidity and Capital Resources—Sources of financing” and “Item 5. Operating and Financial Review and Prospects—B. Liquidity and Capital Resources—Capital Expenditures” for a description of expected sources of financing and expected expenditures on aircraft.
The leases provide us with flexibility to adjust our fleet to any demand volatility that may affect the airline industry and therefore we consider such arrangements to be of great value to our strategy and financial performance. The aircraft lease obligation as of December 31, 2019 was US$ 3,801.8 million, for all remaining periods through maturity (the latest of which expires in 2032). See “—F. Long Term Indebtedness—Tabular Disclosure of Contractual Obligations.”
Under the aforementioned leases, LATAM is responsible for all maintenance, insurance and other costs associated with operating these aircraft. The Company has not made any residual value or similar guarantees to our lessors. There are certain guarantees and indemnities to other unrelated parties that are not reflected on the Company’s balance sheet, but we believe that these will not have a significant impact on our results of operations or financial condition.
See Note 32 to our audited consolidated financial statements for a more detailed discussion of these commitments.
Maintenance
LATAM Maintenance
Our heavy maintenance, line maintenance and component shops are equipped and certified to service our entire fleet of Airbus and Boeing aircraft. Our maintenance capabilities allow us flexibility in scheduling airframe maintenance, offering us an alternative to third-party maintenance providers. More than 4,000 LATAM Maintenance professionals ensure our fleet operates safely and in compliance with all local and international regulations. We strive to provide the best experience to our passengers through the highest standards of safety, on-time performance and cabin image and functionality.
OurThe heavy maintenance and component repair shop facilities are located in São Carlos (Brazil) and Santiago (Chile), adding up to a total of up tenthirteen heavy maintenance production lines, including painting capabilities, and more than 30 component repair shops, including landing gear, hydraulics, pneumatics, avionics, electroplating, composites, wheels and brakes, emergency equipment, galleys and structures.
LATAM Line Maintenance
The Line Maintenance Network serves over 150160 locations and carried out over 2.22.3 million man hours of preventive and corrective maintenance tasks on the LATAM fleet during 2017.2019. We also rely on certified third party services in a fewmany of our international destinations where it is economically convenient, such as in Frankfurt, (where we are served by Lufthansa Technik), Milan (served by Air France-KLM), and Johannesburg (served by South African Airways)., among others.
LATAM Maintenance continues to innovate through LEAN methodology, to achieve increased productivity and higher levels of reliability. In the past years,2019 we implemented our mobile strategy, offering sustainablecreated a new Digital team to work on projects and scalable planning, productive and operational processes. We have deployed more than 700 tablets in order to:initiatives grouped under 3 pillars:
| 1) | Provide fastPaperless: replacement of physical records by digital records, to minimize documentary losses and simplified access to technical documents throughachieve a native app called Content Management System (CMS Mobile);more agile and efficient operation |
| 2) | Provide accessBig Data: compilation and analysis of massive data to our Maintenance System called Maintenixidentify patterns and in-house coordination apps;predict outputs, with the aim of anticipating and reducing failures. |
| 3) | Improve our internal communication through messageReal Time and video call apps;Mobile: access to online information and work from mobile devices, which allows for better decision making. |
| 4) | Allow use of in-house developments systems like MaintCraft (allocates man hours resources and Gantt charts to each specific maintenance tasks) and MaintControl (manages the execution of the planned tasks of MaintCraft through a friendly interface, showing all the tasks that each technician has to perform throughout the shift). MaintControl also serves as a platform where the maintenance leaders can monitor their team’s progress and solve problems that arise |
MaintCraft and MaintControl are currently being developed in a partnership with a world class leader in maintenance software development, IFS MXI. Through this joint venture, IFS MXI is releasing, to other airlines and operators, all these applications using a SAAS strategy
LATAM Line Maintenance Network has hangar facilities in Santiago, São Carlos, São Paulo (CGH)(CGH and GRU), Lima, Miami, Buenos Aires (AEP) and Brasilia,Bogota, among others. These multiple locations improve the flexibility of the Line Maintenance Network by allowing the execution of tasks that previously might be restricted because of adverse weather conditions and environmental authority restrictions.
In order to strictly comply with applicable regulations, all of our maintenance operations are supervised and audited by the local authorities and international entities around the Network, such as DGAC Chile,Dirección Nacional de Aeronáutica Civil (“DGAC”), ANAC Brazil, the Federal Aviation Administration in the United States (“FAA”), the International Air Transport Association Operational Safety Audit (“IOSA”) (from(by the International Air Transport Association or “IATA”) and the International Civil Aviation Organization (“ICAO”), among others. The audits are conducted in connection with each country’s certification procedures and enable us to perform maintenance for the aircraft types registered in the certificating jurisdictions. Our repair stations hold FAA Part-145 certifications under these approvals.
In addition, to ensure the most qualified personnel as needed for safe, accurate and on-time Line Maintenance, we seekLATAM Airlines Group seeks to improve our technicians’ skills through extensive training programs at our LATAM Technical Training CenterCenters in Chile and Brasil, and through specific training programs designed and conducted by our partnerships.
LATAM MRO
OurThe two main MRO (“Maintenance, Repair and Overhaul”Overhaul (“MRO”) facilities, one in São Carlos (Brazil) and one in Santiago (Chile), are equipped and certified to service our fleet of Airbus and Boeing aircraft and provide 78%71% of all heavy maintenance services that LATAM demands.demands as well as, effectively executed 1.35 million man-hours. The services not executed internally are contracted to our extensive network of MRO partners around the globe. Both of our MRO facilities are FAA Part-145 certified repair stations. We occasionally performOccasionally certain heavy maintenance and component services for other airlines or OEMs.OEMs are performed. LATAM MRO is also responsible for the planning and execution of aircraft redeliveries.
In MRO São Carlos (LATAM Airlines Brazil MRO), we areLATAM is prepared to service up to eight aircraft (narrow and wide body) simultaneously with a dedicated hangar for stripping and painting. In this facility we also have 22 technical component shops, including a full landing gear repair & overhaul shop, hydraulics, pneumatics, electronics, electrical components, electroplating, composites, wheels & brakes, interiors and emergency equipment shops. MRO São Carlos is certified and audited by major international aeronautical authorities such as the FAA, the European Aviation Safety Agency (“EASA”), ANAC Brazil, the Chilean DGAC, the ArgentineanAdministración Nacional de Aviación Civil (“ANAC Argentina”), the EcuadorianDirección General de Aviación Civil(“DGCA”), the ParaguayanDirección Nacional de Aeronautica Civil (“DINAC”), and Transport Canada (“TC”) , among others, for Heavy Maintenance and Components Repair and Overhaul for the Airbus A-320 family (A318, A319, A320 and A321), Airbus A330, Boeing 767, ATR-42/72 and the Embraer E-Jet 170/190 families.767. The MRO also has some minor capabilities for the repair and overhaul of Boeing 777 components. MRO São Carlos includes its own support engineering capabilities and a full technical training center.
In MRO Santiago, located near Comodoro Arturo Merino Benítez International Airport in Santiago, we have two hangars capable of servicing one wide body aircraft and two narrow body aircraft simultaneously. MRO Santiago is certified and audited by FAA, ANAC Brazil, DGAC, ANAC Argentina and DGCA, among others, for Heavy Maintenanceheavy maintenance services for the Airbus A320-Family (A318, A319, A320 and A321) and Boeing 767. MRO Santiago has 10 shops prepared to support hangar activities such as cabin shops, galleys, structures and composite materials. We also have the capability to retrofit aircraft interiors, including the installation of IFE (in-flight entertainment) equipment and blended winglets in the Boeing 767 fleet.equipment.
During 2017,2019, LATAM MRO effectively executed 1.2 million man-hours in more than 340425 services, including C checks (107)(150) and Special Checks (233)(275) for the LATAM fleet, maintaining our 2016 labor production. Our shops delivered more than 55,000 components and performed 18 landing gear overhauls.fleet.
LATAM Safety and Security
Our most important priority is theThe safety and security of our passengers and employees. Weemployees is LATAM’s highest priority. It is for this reason that we have been working to standardizeput significant efforts in standardizing our operational indicators regarding safety, audits and emergency response throughout our operations.response.
The divisions that currently support theseThis standardization is achieved through our Safety, Security and Emergency Management Departments, which functions are Safety Management, Emergency Response Management, and Security Management. These divisions function on the basis of uniform policies and procedures issuedthroughout the whole company, ranging from the Corporate Safety and Security Vice presidency locatedour corporate headquarters in Santiago, Chile to every affiliated location within LATAM Airlines Group. As a result of this unification, we can ensure the highest levels of safety and are represented in each affiliated company.security throughout our entire network.
OrganizationOrganizational Structure of the LATAM Safety and Security Vice presidencyVice-presidency
Safety Management Corporate
We give the highest priority toThis Department ensures that providing safe and reliable air service. Our Safety Management isservice remains LATAM’s highest priority. Given the operational complexity, as well as the multicultural challenges that we face, LATAM has decided to concentrate its safety management activities under the umbrella of a single organization (Corporate) thatcoordinated structure, which is responsible for the definitionimplementation and oversight of processesunified policies and procedures for LATAMthroughout the group.
The core foundation of this department lies within its robust Safety Management System (SMS), which is built upon four main components (Policies and forObjectives, Risk Management, Safety Assurance, and Safety Promotion). These components give the oversightSMS a proper structure and provide management with the necessary tools to oversee the safety of our operations. For example, through Flight Data Monitoring (FDM), also known as Flight Operations Quality Assurance (FOQA), we are able to capture, analyze and even visualize the affiliates that applydata recorded during revenue flights and implement those processescompare it with the company’s Standard Operating Procedures (SOPS). In parallel, the Line Operations Monitoring Program (LOMP) permits us to monitor Flight Crew performance and procedures.
All LATAM affiliates havedetect errors ahead of time. As a result of these proactive activities, we are able to improve overall safety, management system (“SMS”) documentation thatincrease maintenance effectiveness, and reduce operational costs. The company’s SMS is publicly documented and it provides clear definitions of the functionsguidelines and responsibilities regarding operational safety for all persons involved, fromthat each employee must meet, regardless of function or hierarchy, which in turn assures our commitment towards safety. Furthermore, IOSA certification ensures the top toproper qualification of our employees, including the bottomprovision of the operational structure in the airline.
All systems are IOSA certified and have an executive who isa Senior Safety Manager responsible for each system implementation and for settingwithin the Safety Department, as well as defining standardized procedures for measuring the quality and safety of services provided by third party companies or professional contractors that affect the operational safety of LATAM.and contractors.
Emergency Response Management Corporate
The emergency response management teamThis Department is responsible for managing the administration of thecompany’s Emergency Response Plan (“ERP”)(ERP). It has been developed for thedesigned to provide an effective management of different kinds of emergencies (aircraftresponse to various emergency scenarios, such as aircraft accidents, natural disasters, union strikes and pandemics) withpandemics. We are therefore able to mitigate the purpose of mitigating the impacts of emergenciesimpact that these contingencies have on our passengers and their relatives, as well as onin addition to ensuring the continuation of our operations. The structure of the ERP includes among others,(but is not limited to) Emergency Process and Procedures, Emergency Control Centers, a Relatives & Passengers Assistance Team, a Notification Team, Aircraft Recovery, and a dedicated “Go Team” which is a special team that can be dispatched in the case of anactivated and address any given emergency and assume responsibility for emergency management.situation.
Security Management Corporate
The Company ensuresSecurity Management Department is responsible to coordinate the highest levelssecurity of security for all of itsLATAM’s passengers, employees, aircraft, equipment and facilitiesfacilities. This department secures LATAM’s infrastructure while protecting people against any threatsthreat or unlawful action.
Corporate Security policiesPolicies and a Security Management System (“SeMS”) have been implemented to detect any vulnerabilities in our security operations and to prevent acts of unlawful interference. Through the use of audits, inspections and risk analysis, we are able to establish the different security protocols required in our international and domestic operations. The results ofacts. These policies, as well as the SeMS itself, are constantly evaluated, analyzed and assigned a risk level (high, medium or low) by LATAMqualified Corporate Security Managers, who are in turn responsible for determiningestablishing new security protocols. In addition,protocols or modifying current ones Corporate Security Management then oversees all of thethese security processes and procedures through the execution of annual audits.
In addition to protecting the organization against any threat or unlawful action, LATAM is committed to the general health and safety of all of its employees. Therefore, through Security Management, LATAM has created a dedicated Health, Safety and Environment (HSE) Team that, in addition to safeguarding the general wellbeing of its employees, is responsible for ensuring a safe work environment and educate against common dangers/risks associated with everyday activities.
Furthermore,Lastly, every LATAM affiliate has to abide by ais responsible for complying with the Security Program approved by the relevantappropriate local authority. These Security Programs provide clear definitions of the security functions required for every operation.
Fuel Supplies
Fuel costs comprise one of the single largest categories of our operating expenses. In 2016, mainly due to the significant drop in the international price of crude oil, LATAM saw a drop in its jet fuel costs, while incosts. In 2017 and 2018, crude oil prices increased resulting in higher fuel costs for LATAM.LATAM, while in 2019, average market price for JetFuel declined by 7.3% year-over-year, and thus, reducing costs per gallon. In 2017,2019, total fuel costs represented 24.5%30.2% of our total operating expenses. Our average into-wing price for 20172019 (fuel price plus taxes and transportation costs, including hedge)hedging and gains/losses) was US$2.002.30 per gallon, representing an increasea decrease of 17.5%7.5% from the 20162018 into-wing average fuel price. We can neither control nor accurately predict the volatility of fuel prices. Despite the foregoing, we believe it is possible to partially offset the price volatility risk through our hedging and fuel surcharge programs, which is in place in both our passenger and cargo business. For more information, see “Item 11. Quantitative and Qualitative Disclosures About Market Risk—Risk of Fluctuations in Jet Fuel Prices.”
The following table details our consolidated fuel consumption and operating expenses, after related hedging gains and losses (which exclude fuel costs related to charter operations because fuel expenses are covered by the entity that charters the flight) duringfor the last three years.
| | | Year ended December 31,(1) | | | Year ended December 31,(1) | |
| | | 2017 | | | 2016 | | | 2015 | | | 2019 | | | 2018 | | | 2017 | |
| Fuel consumption (thousands of gallons) | | | 1,156,062.3 | | | | 1,185,508.8 | | | | 1,221,096.9 | | | | 1,272,676.8 | | | | 1,205,188.8 | | | | 1,156,062.3 | |
| ASK (millions) | | | 136,398.4 | | | | 134,967.7 | | | | 134,167.1 | | | | 149,116.6 | | | | 143,264.7 | | | | 136,398.4 | |
| Fuel gallons consumed per 1,000 ASK | | | 8.48 | | | | 8,78 | | | | 9,10 | | | | 8.53 | | | | 8.41 | | | | 8.48 | |
| Total fuel costs (US$ thousands) | | | 2,318,816 | | | | 2,056,643 | | | | 2,651,067 | | | | 2,929,008 | | | | 2,983,028 | | | | 2,318,816 | |
| Cost per gallon (US$) | | | 2.00 | | | | 1.70 | | | | 2.19 | | | | 2.30 | | | | 2.49 | | | | 2.00 | |
| Total fuel costs as a percentage of total operating expenses | | | 24.5 | % | | | 23.0 | % | | | 27.6 | % | | | 30.2 | % | | | 31.5 | % | | | 25 | % |
| (1) | See “Item 5. Operating and Financial Review and Prospects—A. Operating Results—LATAM Airlines Group Financial Results Discussion: Year ended December 31, 20172018 compared to year ended December 31, 2016.2017.” Total fuel costs (US$ thousands) include Hedging gains/losses. |
In our fuel supply agreements, we manage different price structures and price update calculations. The main price structure is Jet Fuel plus fixed fees and taxes, and the main fuel price updates are in a weekly, bi-weekly and monthly basis. Brazil, being our biggestlargest market, bases its price inon a refinery posting updated every month, and reportedwhich is set in Brazilian real per liter, plus fees and taxes. Refinery prices in Brazil have stabilized recently creating a more competitive market for the region.
Our fuel supply agreements vary by airport and are distributed among 30 suppliers. TheOur fuel consumption volume is mainly concentrated in Brazil (39%(40%), Chile (16%), the United States (11%(9%) and Peru (12%). During 2017,2019, we re-negotiated our fuel supply contracts in Chile, Peru, Colombia,Brazil, Argentina, major European, and certain Australian and United States airports. In 2019 we continued to strengthen our relationship with global fuel suppliers, extended our credit terms and achieved conditions that improved LATAM´s cash flow.
In Chile and Peru, we use a fuel import model is used in addition to the traditional local refinery supply, creating a more competitive market and ensuring our supply with different supplying methods.sources. During 2018 we implemented the fuel import model in Brazil, by creating a jet fuel import project that will allow imported jet fuel to reach the Terminal of San Sebastian in São Paulo and move from there to Guarulhos, São Paulo’s International Airport. LATAM was awarded pipeline capacity to move product from the Terminal into Guarulhos and became the first airline to do so. In 2019 refinery prices in Brasil stabilized as a result of the fuel import project from LATAM. During 2019 we also worked along with ALTA (Latin American and Caribbean Air Transport Association) to ensure a more competitive refinery price in Uruguay and reached an agreement that lowered its price by approximately 50 cents per gallon and which we believe achieved competitive parity with the rest of the region.
As part of a comprehensive energy efficiency initiative, LATAM Airlines Group worked with a team of stakeholders to generate a streamlined fuel efficiency program (the “LATAM Fuel Efficiency Program”), which encompasses a wide range of different innovations and technologies for fuel efficiency:
| ·● | Investments in more modern and efficient aircraft, such as the Boeing 787, the Airbus A350 and the Airbus A320neo. Investment has been carried out to perform retrofits to a portion of our Airbus A320 fleet, allowing more efficient standard operational procedures. |
| ·● | Weight reduction measures, such as minimizing unnecessary onboard water, using ultra-light service carts, optimizing fuel according to destination, improving the distribution of weight to have an optimal center of gravity and the improvement of freight factor (the combination of passenger and cargo services). |
| ·● | As of 2019, LATAM Pilot Tools, an in-house developed mobile app was deployed. This app allows personalized feedback to flight crews, focusing on captain fuel requests and usage, and ground fuel consumption, among other efficiency and safety indicators. This app is groundbreaking as it is the first time a direct communication channel has been created between the flight crews and the Company’s Safety Efficiency operations. As of December 2019, fuel efficiency initiatives were added to the pilot app, giving more visibility to their KPIs and adding significant savings. |
| ● | Standardized operational procedures on every stage of the flight (taxiing, climb, cruise, approach and landing), as well as; for example, changes in climb profiles that generate savings with minimum changes in the workload of the flight crew, or minimizing the use of the auxiliary power unit when aircraft is on the ground. |
| ·● | Monitoring maintenance and performance of the fleet, including frequent engine washes, which allow more efficient combustion of fuel and reduce emissions in airport areas. |
| ·● | Improvements of the flight plan, management, including continuous feedback using a post flight analysis tool called Full Tracks developed by the Fuel Team with the support and collaboration of Operations and Safety. This tool allows us to better program and optimize our flight plans. During 2019, policy changes were implemented, optimizing fuel planning according to destination, standardizing policies for all dispatch centers, allowing for centralized performance tracking and unified criteria. |
As a direct result of this program, LATAM Airlines Group has been recognized since 2014 by the Dow Jones Sustainability Index as one of the world’s leading companies in eco-efficiency. The magnitude of this program has allowed the Company to reduce their operational costs along with the improvement of its environmental performance, and to enhance environmental awareness both within the Company and externally.
Ground Facilities and Services
OurLATAM’s main operations are based at the Guarulhos Airport in São Paulo, Brazil. WeLATAM also operateoperates significant ground facilities and services at LATAM Airlines Brazil’s headquarters located at Congonhas International Airport in São Paulo, Brazil. In 2013,2018, LATAM Airlines Brazil inaugurated two new facilities for ground handling equipment maintenance and repair (at São Paulo’sa Maintenance Hangar in Guarulhos Airport with 17,416 m² and at Rio de Janeiro’s Galeão Airport with 4,109 m²)an approximate area of 65,080m².
We also have significant operations at the Comodoro Arturo Merino Benítez International Airport in Santiago, Chile, where we operate hangars, aircraft parking and other airport service facilities pursuant to concessions granted by the DGAC and other outsourced concessions. We also maintain a customs warehouse at the Comodoro Arturo Merino Benítez International Airport, additional customs warehouses in Chile and Argentina (Aeroparque) and operate cargo warehouses at the Miami International Airport to service our cargo customers. Our facilities at Miami International Airport include corporate offices for our cargo and passenger operations and temperature-controlled and freezer space for imports and exports. We also operate from various other airports in Chile and abroad.
We incur certain airport usage fees and other charges for services performed by the various airports where we operate, such as air traffic control charges, take-off and landing fees, aircraft parking fees and fees payable in connection with the use of passenger waiting rooms and check-in counter space.
Ancillary Airline Activities
In recent years, LATAM has been developing different initiatives to increase its ancillary revenues generated by its airline operations. The implementation of these initiatives aims to offer a better on-board experience, while allowing passengers to customize their journey. LATAM’s customers are able to purchase for additional services such as extra luggage, preferred seating options and the flexibility to change tickets on the same day of their flight, among others.
In addition to airline operations, LATAM generates revenues from a variety of other activities, including aircraft leases (including subleases, dry-leases, wet-leases and capacity sales to certain alliance partners) and charter flights, tours, duty-free in-flight sales, maintenance services for third parties, handling, storage and customs services, handling and activities and revenues of Multiplus and the sale of certain LATAM Pass miles to third parties.services. In 2017,2019, LATAM generated other revenues of US$549.9361.1 million from these activities.
Insurance
We maintainLATAM maintains aviation insurance policies as required by law, relevant regulations and aircraft financing and leasing agreements, for its whole fleet, aircraft that LATAM and its affiliates own, operate orand are responsible for. These policies providesprovide all risk coverage for aircraft hulls (including war risks and spares) and, third-party legal liability for passengers, cargo, baggage, injuries, property damage and injuries to third parties. Theseloss of cargo. LATAM´s policies are in full force through April 1, 2019 and are renewed annually in concertalong with IAG Group (British Airways, Iberia and their affiliates and franchises)affiliates), which allows usLATAM to obtain better premiums and improved coverage at the best level of the aviation industry.
WeLATAM also maintain insurance to cover the risk ofinsures its physical properties and equipment from theft, fire, flood, electrical damageearthquake, hurricane, and similar events for equipment and buildings we own or weother damages. All of LATAM´s vehicles are responsible for. Similarly, we maintain vehicle insuranceinsured against the risk of robbery, theft,damages, fire and civil liability against third parties for all vehicles we own or we are responsible for.liability.
Information Technology
Passenger Service SystemsInformation and Digital Technologies
As part of our agenda of transformation of the customer experience atDuring 2019 LATAM we have redefined our travel experience model and will continue to redesign our passenger service systems with the aim of providing a unified experience to our customers. Since the 2012 combination of LAN and TAM,capitalized on a series of transformational initiatives aimed at increasing the value delivered in projects, have been implementedmove to communicatea more data driven culture and increase the unionreliability of the companies to our customers. Intense efforts have been made to standardize processes such as passenger recognition, attention at contact centers, sales offices and airports, in-flight services, e-commerce, loyalty programs and IT backbone such as communications and data centers. However, many of these efforts are in progress as we finalize the integration of LAN’s and TAM’s processes and systems.technological platforms.
In 2014,the area of projects, our new practices allowed us to improve our on-time delivery, expand our product offering and support and grow our digital channels. Likewise, we redefinedalso started a strong focus towards innovation. Examples of such initiatives include pilot programs for biometric boarding or the use of automatized drones to improve the efficiency and reliability of aircraft visual inspections. LATAM was recognized by the national civil agency in Brazil (ANAC) for its contribution to innovation by the development of the app called Pilot LATAM. This application allows our travel experience model based onpilots to have improved visibility of their security indicators and compare them to their peers identifying improvement opportunities in a timely and confidential fashion.
To strengthen our data culture, in 2019 we started the needsconstruction of our target customer, reinforcing six key elements: transparencyData Lake. The objective of information, early solutions, passenger choice, digital simplicity, end-to-end rapiditythis initiative is to consolidate all LATAM data and care forgenerate the conditions to ensure this data is both integrated and consistent. We also believe the Data Lake will enable more profound analysis by accessing historical data. In 2019 we also grew our customer. In ordermachine learning capabilities by creating predictive models to implement this model, during 2017 we continued our work of previous years, adopting several measures to unify our processesanticipate events, behaviors and systems:purchase preferences, among others.
| · | We incorporated innovative products with functional features into our mobile platform for passenger service crews. Our new self-service platform allows the cabin crew to be connected and updated with all relevant human resources and flight information. |
| · | Airports: we implemented a unique solution for self service in kiosks, with self-service bag tag functionality. |
| · | Contingency: we continue improving our mobile platform for agents to manage contingency processes, adding features to manage basic services to our passengers in contingencies and compensation in case of disruption. We also implemented a passenger notification tool to manage both commercial and operational schedule changes. |
| · | Contact Center: we developed new front-ends to simplify the interaction of our agents with passengers, with more intelligent recognition and more functionality to provide faster, more uniform and personalized attention. We implemented a world class solution to manage all customer service cases in a unified manner, solving problems faster and with fewer interactions. We also implemented an automatic tool to automate the calculation of refunds and reduced the time required to process refunds. |
| · | Loyalty and customers: we continued to unify our systems to support our loyalty program with a world-class solution. We continued the implementation of a campaign management tool to centralize and control all the interactions with marketing campaigns with our customers. |
| · | Digital Channels: We continue increasing the functionality available to digital channels. |
From the integration perspective,In technology platforms we continue working to reach a simplifiedkeep taking strides towards simplification and consistent technological platform. For example, we implemented a unified Revenue Accounting System for the passenger business, and we have improved our airport management, loyalty program, contact center, customer database, and marketing tools applications.reliability. We continue to worksimplify our footprint and move towards modern cloud based technologies. Besides, the optimization of our technological landscape, cybersecurity remains high in our priorities with SABRE to unify the Passenger Service Platforman Information Security Office with dedicated staff and strategic partners specialized in an effort to obtain operational and financial synergies, as set forth below.all areas of CyberSecurity, which includes organized units focused on potential cyber attacks.
During 2018, we expectWe continue our engagement to continue developing solutions aimed at improvingmake information and technology a competitive advantage for LATAM. Our improvements aim to continually transform and upgrade the travel experience of our customers’ experience.
LATAM PSS Migrationcustomers and Digital Platform
Prior tofacilitate the 2012 combination, LAN and TAM used different passenger service platform (“PSP”) solutions, TAM used Amadeus and LAN used SABRE. LATAM has since decided to unify the Passenger Service Platform in an effort to obtain operational and financial synergies. As a result, the PSS Migration Program began in 2014.
After running a Request for Proposal (“RFP”) process with both providers (SABRE and Amadeus) in May 2015, LATAM signed a 10-year contract with SABRE. Since June 2015, LATAM and SABRE have jointly started the executionwork of PSS Migration, which should be fully implemented by 2018.our employees.
Maintenance
In 2013, LATAM Airlines Brazil began a Maintenix implementation project which was completed in the first quarter of 2016. This project included standardization of all of our network’s maintenance processes, permitting optimization of stocks of components and seeking to take advantage of synergies in the maintenance process, while maintaining operational safety as the key pillar.
Disaster Recovery Plan
As of December 2017, LATAM has two data centers in Chile and one in Brazil. Design and configuration of two data centers and a Disaster Recovery Plan for LATAM was completed in 2015 and implementation was done during 2016. LATAM performs testings of critical systems every year.
Regulation
Below is a brief reference to the material effects of aeronautical and other regulations in force in the relevant jurisdictions in which we operate.
We are subject to the jurisdiction of various regulatory and enforcement agencies in each of the countries where we operate. We believe we have obtained and maintain the necessary authority, including authorizations and operative certificates where required, which are subject to ongoing compliance with statutes, rules and regulations pertaining to the airline industry, including any rules and regulations that may be adopted in the future.
The countries where we carry out most of our operations are contracting states and permanent members of the ICAO, an agency of the United Nations established in 1947 to assist in the planning and development of international air transportation. The ICAO establishes technical standards for the international aviation industry. In the absence of an applicable local regulation concerning safety or maintenance, the countries where we operate have incorporated by reference the majority of the ICAO’s technical standards. We believe that we are in material compliance with all such relevant technical standards.
Environmental and Noise Regulation. ThereT
here are no material environmental regulations or controls imposed upon airlines, applicable to aircraft, or that otherwise affect us, except for environmental laws and regulations of general applicability.
In Argentina, Brazil, Colombia, Ecuador, Peru and the United States, aircraft must comply with certain noise restrictions. We believe ourLATAMs aircraft substantially comply with all such restrictions. Chilean authorities are planning to pass a noise-related regulation governing aircraft that fly to and within Chile, observing a standard known as “Stage 3 requirements”. Our fleet already complies with such standards, so we do not believe that enactment of the proposed standards would impose a material burden on us.
In 2016, the ICAO adopted a resolution creating the Carbon Offsetting and Reduction Scheme for International Aviation (CORSIA), providing a framework for a global market-based measure to stabilize CO2 emissions in international civil aviation (i.e., civil aviation flights that depart in one country and arrive in a different country). With the adoption of this framework, the aviation industry became the first industry to achieve an agreement with respect to its CO2 emissions. The scheme, which defines a unified standard to regulate CO2 emissions in international flights, will be implemented in various phases by ICAO member states starting in 2020.
Safety and Security.
Our operations are subject to the jurisdiction of various agencies in each of the countries where we operate, which set standards and requirements for the operation of aircraft and its maintenance.
In the United States, the Aviation and Transportation Security Act requires, among other things, the implementation of certain security measures by airlines and airports, such as the requirement that all passenger bags be screened for explosives. Funding for airline and airport security required under the Aviation Security Act is provided in part by a US$5.60 per segment passenger security fee, subject to a US$11.20 per roundtrip cap; however, airlines are responsible for costs in excess of this fee. Implementation of the requirements of the Aviation Security Act has resulted in increased costs for airlines and their passengers. Since the events of September 11, 2001, Congress has mandated, and the TSA has implemented, numerous security procedures and requirements that have imposed and will continue to impose burdens on airlines, passengers and shippers.
Below are some specific aeronautical regulations related to route rights and pricing policy in the countries where we operate.
Chile
Aeronautical Regulation
Both the Dirección Nacional de Aeronáutica Civil (“DGAC”)DGAC and the Junta de Aeronáutica Civil (“JAC”) oversee and regulate the Chilean aviation industry. The DGAC reports directly to the Chilean Air Force and is responsible for supervising compliance with Chilean laws and regulations relating to air navigation. The JAC is the Chilean civil aviation authority. Primarily on the basis of Decree Law No. 2,564, which regulates commercial aviation, the JAC establishes the main commercial policies for the aviation industry in Chile and regulates the assignment of international routes and the compliance with certain insurance requirements, while the DGAC regulates flight operations, including personnel, aircraft and security standards, air traffic control and airport management. We have obtained and maintain the necessary authority from the Chilean government to conduct flight operations, including authorization certificates from the JAC and technical operative certificates from the DGAC, the continuation of which is subject to the ongoing compliance with applicable statutes, rules and regulations pertaining to the airline industry, including any rules and regulations that may be adopted in the future.
Chile is a contracting state, as well as a permanent member, of the ICAO. Chilean authorities have incorporated ICAO’s technical standards for the international aviation industry into Chilean laws and regulations. In the absence of an applicable Chilean regulation concerning safety or maintenance, the DGAC has incorporated by reference the majority of the ICAO’s technical standards. We believe that we are in material compliance with all such relevant technical standards.
Route Rights
Domestic Routes.Chilean airlines are not required to obtain permits in order to carry passengers or cargo on any domestic routes, but mustonly to comply with the technical and insurance requirements established respectively by the DGAC and the JAC. There are no regulatory barriers that would prevent a foreign airline from creating a Chilean subsidiary and entering the Chilean domestic market using that subsidiary. On January 18, 2012 the Secretary of Transportation and the Secretary of Economics of Chile announced a unilateral opening of the Chilean domestic skies. This was confirmed on November 2013, and has been in force since that date.
International Routes.As an airline providing services on international routes, LATAM is also subject to a variety of bilateral civil air transportation agreements that provide for the exchange of air traffic rights between Chile and various other countries. There can be no assurance that existing bilateral agreements between Chile and foreign governments will continue, and a modification, suspension or revocation of one or more bilateral treaties could have a material adverse effect on our operations and financial results.
International route rights, as well as the corresponding landing rights, are derived from a variety of air transportation agreements negotiated between Chile and foreign governments. Under such agreements, the government of one country grants the government of another country the right to designate one or more of its domestic airlines to operate scheduled services to certain destinations of the former and, in certain cases, to further connect to third-country destinations. In Chile, when additional route frequencies to and from foreign cities become available, any eligible airline may apply to obtain them. If there is more than one applicant for a route frequency, the JAC awards it through a public auction for a period of five years. The JAC grants route frequencies subject to the condition that the recipient airline operate them on a permanent basis. If an airline fails to operate a route for a period of six months or more, the JAC may terminate its rights to that route. International route frequencies are freely transferable. In the past, we have generally paid only nominal amounts for international route frequencies obtained in uncontested auctions.
Airfare Pricing Policy.Policy
Chilean airlines are permitted to establish their own domestic and international fares without government regulation. For more information, see “—Antitrust Regulation” below. In 1997, the Antitrust Commission approved and imposed a specific self-regulatory fare plan for our domestic operations in Chile consistent with the Antitrust Commission’s directive to maintain a competitive environment. According to this plan, we must file notice with the JAC of any increase or decrease in standard fares on routes deemed “non-competitive” by the JAC and any decrease in fares on “competitive” routes at least 20 days in advance. We must file notice with the JAC of any increase in fares on “competitive” routes at least 10 days in advance. In addition, the Chilean authorities now require that we justify any modification that we make to our fares on non-competitive routes. We must also ensure that our average yields on a non-competitive route are not higher than those on competitive routes of similar distance.
Argentina
Aeronautical Regulation
Both the Administración Nacional de Aviación Civil (“ANAC”) and the Ministry of Transport oversee and regulate the Argentinean aviation industry. ANAC regulates flight operations, including personnel, aircraft and security standards, air traffic control and airport management, and reports directly to the Ministry of Transport. ANAC also is responsible for supervising compliance with Argentinean laws and regulations relating to air navigation. The Ministry of Transport regulates the assignment of international routes and matters related to tariff regulation policies. We have obtained and maintain the necessary authorizations from the Argentinean government to conduct flight operations, including authorization certificates and technical operative certificates from ANAC, the continuation of which is subject to the ongoing compliance with applicable statutes, rules and regulations pertaining to the airline industry, including any rules and regulations that may be adopted in the future.
Argentina is a contracting state and a permanent member of the ICAO.ICAO, an agency of the United Nations established in 1947 to assist in the planning and development of international air transport. The ICAO establishes technical standards for the international aviation industry, which Argentinean authorities have incorporated into Argentinean laws and regulations. In the absence of applicable Argentinean regulation concerning safety or maintenance, the ANAC has incorporated by reference the majority of the ICAO’s technical standards. We believe that we are in material compliance with all such relevant technical standards.
Route Rights
Domestic Routes. In Argentina, airlines are required to obtain permits in connection with carrying passengers or cargo on any domestic routes, and to comply with the technical requirements established by the local authority. There are no regulatory barriers preventing a foreign airline from creating an Argentine subsidiary and entering the Argentine domestic market using that subsidiary. However, ownership of such subsidiary by the foreign airline may not be direct, but through a subsidiary formed in Argentina, which in turn may be directly or indirectly owned by the foreign company. However, such subsidiary should operate Argentine-registered aircraft and employ Argentine aeronautical personnel.
International Routes. As an airline providing services on international routes, LATAM Argentina is also subject to a variety of bilateral civil air transport agreements that provide for the exchange of air traffic rights between Argentina and various other countries. There can be no assurance that existing bilateral agreements between Argentina and foreign governments will continue. Furthermore, a modification, suspension or revocation of one or more bilateral treaties could have a material adverse effect on our operations and financial results.
International route rights, as well as the corresponding landing rights, are derived from a variety of air transport agreements negotiated between Argentina and foreign governments. Under such agreements, the government of one country grants the government of another country the right to designate one or more of its domestic airlines to operate scheduled services to certain destinations of the former and, in certain cases, to further connect to third-country destinations. In Argentina, when additional route frequencies to and from foreign cities become available, any eligible airline may apply to obtain them. ANAC grants route frequencies subject to the condition that the recipient airline operate them on a permanent basis. If an airline fails to operate a route for a period of six months or more, the ANAC may terminate its rights to that route.
Airfare Pricing Policy.
Argentine airlines are permitted to establish their own international fares without government regulation, as long as they do not abuse any dominant market position they may enjoy. However, there areIn the case of domestic flights, government-fixed minimum prices for domestic flights. Government-fixed maximum prices were in place until February 3, 2016, when the government eliminated the controls that limited maximum prices. However, there remain government-fixed minimum prices while retainingfor one-way tickets, and also for tickets sold within 30 days before the minimum prices.flight. Prices for roundtrip tickets sold 30 days or more before the flight were de-regulated on July 31, 2018.
Peru
Aeronautical Regulation
The Peruvian DGAC (“PDGAC”) oversees and regulates the Peruvian aviation industry. The PDGAC reports directly to the Ministry of Transportation and Communications and is responsible for supervising compliance with Peruvian laws and regulations relating to air navigation. In addition, the PDGAC regulates the assignment of national and international routes, and the compliance with certain insurance requirements, and it regulates flight operations, including personnel, aircraft and security standards, air traffic control and airport management. We have obtained and maintain the necessary authorizations from the Peruvian government to conduct flight operations, including authorization and technical operative certificates, the continuation of which is subject to the ongoing compliance with applicable statutes, rules and regulations pertaining to the airline industry, including any rules and regulations that may be adopted in the future.
Peru is a contracting state and a permanent member of the ICAO. The ICAO establishes technical standards for the international aviation industry, which Peruvian authorities have incorporated into Peruvian laws and regulations. In the absence of an applicable Peruvian regulation concerning safety or maintenance, the PDGAC has incorporated by reference the majority of the ICAO’s technical standards. We believe that we are in material compliance with all relevant technical standards.
Route Rights
Domestic Routes.Peruvian airlines are required to obtain permits in connection with carrying passengers or cargo on any domestic routes and to comply with the technical requirements established by the PDGAC. Non-Peruvian airlines are not permitted to provide domestic air service between destinations in Peru.
International Routes.As an airline providing services on international routes, LATAM Peru is also subject to a variety of bilateral civil air transport agreements that provide for the exchange of air traffic rights between Peru and various other countries. There can be no assurance that existing bilateral agreements between Peru and foreign governments will continue, and a modification, suspension or revocation of one or more bilateral treaties could have a material adverse effect on our operations and financial results.
International route rights, as well as the corresponding landing rights, are derived from a variety of air transport agreements negotiated between Peru and foreign governments. Under such agreements, the government of one country grants the government of another country the right to designate one or more of its domestic airlines to operate scheduled services to certain destinations of the former and, in certain cases, to further connect to third-country destinations. In Peru, when additional route frequencies to and from foreign cities become available, any eligible airline may apply to obtain them. If there is more than one applicant for a route frequency, the PDGAC awards it through a public auction for a period of four years. The PDGAC grants route frequencies subject to the condition that the recipient airline operate them on a permanent basis. If an airline fails to operate a route for a period of 90 days or more, the PDGAC may terminate its rights to that route. Last year the PDGAC revoked the unused route although that has never happened in practice.frequencies of a couple Peruvian operators.
Ecuador
Aeronautical Regulation
There are two institutions that control commercial aviation on behalf of the State: (i) The National Civil Aviation Board (“CNAC”), which directs aviation policy; and (ii) the General Civil Aviation Bureau (“EDGAC”), which is a technical regulatory and control agency. The CNAC issues operating permits and grants operating concessions to national and international airlines. It also issues opinions on bilateral and multilateral air transportation treaties, allocates routes and traffic rights, and approves joint operating agreements such as wet leases and shared codes.
Fundamentally, the EDGAC is responsible for:
| ·● | ensuring that the national standards and technical regulations and international ICAO standards and regulations are observed; |
| ·● | keeping records on insurance, airworthiness and licenses of Ecuadorian civil aircraft; |
| ·● | maintaining the National Aircraft Registry; |
| ·● | issuing licenses to crews; |
| ·● | controlling air traffic control inside domestic air space; |
| ·● | approving shared codes; and |
| ·● | modifying operations permits. |
The EDGAC also must comply with the standards and recommended methods of ICAO since Ecuador is a signatory of the 1944 Chicago Convention.
Route Rights
Domestic Routes.Airlines must obtain authorization from CNAC (an operating permit or concession) to provide air transportation. For domestic operations, only companies incorporated in Ecuador can operate locally, and only Ecuadorian-licensed aircraft and dry leases are authorized to operate domestically.
International Routes.Permits for international operations are based on air transportation treaties signed by Ecuador or, otherwise, the principle of reciprocity is applied. All airlines doing business in Latin America that are incorporated in countries that are members of theComunidad Andina de Naciones (the Andean Community, or “CAN”) obtain their traffic rights on the basis of decisions currently in force under that regime, in particular decision N°582 of 2004, which guarantee free access to markets, with no type of restriction except technical considerations.
Airfare Pricing Policy.Policy
On October 13, 2011, The Statutory Law of Regulation and Control of the Market Power was passed with a purpose to avoid, prevent, correct, eliminate and sanction the abuse of economic operators with market power, as well as to sanction restrictive, disloyal and agreements involving collusive practices. This Law creates a new public entity as the maximum authority of application and establishes the procedures of investigation and the applicable sanctions, which are severe. Rates are not regulated and are subject only to registration. In general, bilateral treaties regarding air transportation provide for airfares to be regulated by the regulation of the country of origin.
Brazil
Aeronautical Regulation
The Brazilian aviation industry is regulated and overseen by the ANAC. The ANAC reports directly to the Civil Aviation Secretary, which is subordinated by the Federal Executive Power of this country. Primarily on the basis of Law No. 11.182/2005, ANAC was created to regulate commercial aviation, air navigation, the assignment of domestic and international routes, compliance with certain insurance requirements, flight operations, including personnel, aircraft and security standards, air traffic control, in this case sharing its activities and responsibilities with theDepartamento de Controle do Espaço Aéreo (Department of Airspace Control) (“DECEA”),which is a public secretary also subordinated to the Brazilian Defense Ministry, and airport management, in this last case sharing responsibilities with theEmpresa Brasileira de Infra-Estrutura Aeroportuária (the Brazilian Airport Infrastructure Company, or “INFRAERO”), a public company that was created by Law No. 5862/72, and is responsible for administrating, operating and exploring Brazilian airports industrially and commercially (with the exception of Guarulhos International Airport, Viracopos International Airport and Brasilia International Airport, which were privatized in 2012 and are administrated by concession agreement).
We have obtained and maintain the necessary authority from the Brazilian government to conduct flight operations, including authorization and technical operative certificates from ANAC, the continuation of which is subject to ongoing compliance with applicable statutes, rules and regulations pertaining to the airline industry, including any rules and regulations that may be adopted in the future.
ANAC is the Brazilian civil aviation authority and it is responsible for supervising compliance with Brazilian laws and regulations relating to air navigation. Brazil is a contracting state and a permanent member of the ICAO. The ICAO establishes technical standards for the international aviation industry, which Brazilian authorities, represented by the Brazilian Defense Ministry, have incorporated into Brazilian laws and regulations. In the absence of an applicable Brazilian regulation concerning safety or maintenance, ANAC has incorporated by reference the majority of the ICAO’s technical standards.
Route Rights
Domestic Routes. Brazilian airlines operate under a public services concession, and for that reason Brazilian airlines are not required to obtain permits in connection witha concession to provide passenger and cargo air transportation services from the Brazilian authorities. In addition, an Air Operator Certificate (AOC) is also required for Brazilian Airlines to provide regular domestic passenger or cargo transportation but onlyservices. Brazilian Airlines also need to comply with theall technical requirements established by ANAC.the Brazilian Aviation Authority (ANAC). Based on the Brazilian Aeronautical Code (“CBA”) established by Brazilian Federal Law No. 7.565/7,565/86, there are no limitations to ownership of Brazilian airlines by foreign investors. The CBA also states that non-Brazilian airlines are not permittedauthorized to provide domestic air service between destinationstransportation services in Brazil. The same law prevents a foreign airline from creating a Brazilian subsidiary and entering the Brazilian domestic market using that subsidiary. Brazil
International Routes. Brazilian and non-Brazilian airlines providing services on international routes are also subject to a variety of bilateral civil air transport agreements that provide for the exchange of air traffic rights between Brazil and various other countries. International route rights, as well as the corresponding landing rights, are derived from a variety of air transport agreements negotiated between Brazil and foreign governments. Under such agreements, the government of one country grants the government of another country the right to designate one or more of its domestic airlines to operate scheduled services to certain destinations of the former and, in certain cases, to further connect to third-country destinations. In Brazil, when additional route frequencies to and from foreign cities become available, any eligible airline may apply to obtain them. If there is more than one applicant for a route frequency ANAC must carry out a public bid and award it to the elected airline. ANAC grants route frequencies subject to the condition that the recipient airline operate them on a permanent basis. If an airline failsANAC’s resolution 491/18 indicates the requirements to operateestablish the underuse of a route for a period of six months or more, ANAC may terminate its rights to that route. ANAC may also terminate its right if the recipient airline does not operate at least 80%frequency, and how it could be revoked and reassigned. This provision of the frequency given for that specific route.resolution came into force on September 2019.
Airfare Pricing Policy.
Brazilian and non-Brazilian airlines are permitted to establish their own international and domestic fares, in this last case only for Brazilian airlines, without government regulation, as long as they do not abuse any dominant market position they may enjoy. Airlines may file complaints before the Antitrust Court with respect to monopolistic or other pricing practices by other airlines that violate Brazil’s antitrust laws.
Colombia
Aeronautical Regulation
The governmental entity in charge of regulating, directing and supervising civil aviation in Colombia is the Aeronáutica Civil (“AC”), a technical agency ascribed to the Ministry of Transportation. The AC is the aeronautical authority for the entire domestic territory, in charge of regulating and supervising the Colombian air space. The AC may interpret, apply and complement all civil aviation and air transportation regulation to ensure compliance with the Colombian Aeronautical Regulations (“RAC”). The AC also grants the necessary permits for air transportation.
Route Rights
The AC grants operation permits to domestic and foreign carriers that intend to operate in, from and to Colombia. In the case of Colombian airlines, in order to obtain the operational permit, the company must comply with the RAC and fulfill legal, economic and technical requirements, to later be subject to public hearings where the public convenience and necessity of the service is considered. The same process must be followed to add national or international routes,routes; whose concession is subject to the bilateral instruments entered into by Colombia. Routes cannot be transferred under any circumstance and there is no limit to foreign investment in domestic airlines.
Airfare Pricing Policy.Policy
Since July 2007, as stated in resolution 3299 of the Aeronautical Civil entity, bottom level airfares for both international and domestic transportation were eliminated. Under resolution 904 issued in February 2012, the Aeronautical Civil authority ceased to impose the obligation of charging a fuel surcharge for both domestic and international transportation of passengers and cargo. As of April 1, 2012, air carriers may now freely decide whether or not to charge a fuel surcharge. In the case that a fuel surcharge is charged, it must be part of the fare, but shall be informed separately on the tickets, advertising or other methods of marketing used by the company.
In the same line, as of April 1, 2012, there is no longer any restriction on maximum fares published by the airlines or with respect to the obligations for air carriers to report to the Aeronautical civil authority the fares and conditions the day after being published.
Administrative fares are not subject to any changes, and its charge is mandatory for the transport of passengers under Aeronautical Civil Regulations. Differential administrative fares apply to ticket sales made through Internet channels.
Antitrust Regulation
The Chilean antitrust authority, which we refer to as the Antitrust Court (previously the Antitrust Commission)National Economic Prosecutor Office (“FNE” by its Spanish name), oversees and investigates antitrust matters, which are governed by Decree Law No. 211 of 1973, as amended, or the Antitrust Law.“Antitrust Law”. The Antitrust Law prohibitsstates as anticompetitive, any entity from preventing, restrictingconduct that prevents, restricts or distortinghinders competition, in any market or any part of any market. sets out to produce said effects.
The Antitrust Law also prohibits any businesscontinues by giving examples of the following anticompetitive conducts: (i) cartels; (ii) abuse of dominance; and (iii) interlocking. The Antitrust Law defines abusive practices as “The abusive exploitation on the part of an economic agent, or businesses that havea group thereof, of a dominant position in anythe market, fixing sale or purchase prices, imposing on a substantial partsale the acquisition of anyanother product, allocating territories or market from abusing thatquotas or imposing similar abuses on others; as well as predatory practices, or unfair competition, carried out with the purpose of reaching, maintaining or increasing a dominant position. position.”
An aggrieved person may sue for damages arising from a breach of Antitrust Law and/or file a complaint withby suing in the AntitrustChilean Competition Court requesting an order to enjoin the violation of the Antitrust Law.(“TDLC” by its Spanish name). The Antitrust CourtTDLC has the authority to impose a variety of sanctions for violations of the Antitrust Law, includingincluding: (i) amendment or termination of contracts contraryacts and contracts; (ii) amendment or dissolution of legal entities involved in the punished conducts; and/or (iii) imposition a fine up to 30% of the sales of the infringing entity corresponding to the Antitrust Law, dissolutionline of products and/or services associated to the infraction, during the entire term for which the infringement lasted; alternatively, a company and impositionfine equal to the double of fines and daily penalties on businesses. Courts may award damages and other remedies (such as an injunction) in appropriate circumstances. the economic benefit obtained by the infringing company. When none of these alternatives can be applied, a fine up to USD 50,000,000 approximately (60,000 UTA).
As described above under “—Route Rights—Airfare Pricing Policy,” in October 1997, the Antitrust CourtResolution N°445 of August 1995, the TDLC approved in with a merger control transaction, imposed the merged airline to a specific self-regulatory fare plan for usdomestic air passenger market consistent with the Antitrust Court’sTDLC’s directive to maintain a competitive environment within the domestic market. This Airfare Pricing Policy Plan was updated by the TDLC particularly to maintain it objective which consists of a tariff regulation, through which maximum rates are established on non-competitive routes under a monthly compliance scheme.
Since October 1997, LATAM and LATAM Chile follow a self-regulatory plan, which was modified and approved by the Tribunal de la Libre Competencia (the Antitrust Court)TDLC in July 2005, and further in September 2011. In February 2010, the Fiscalía Nacional Economica (the National Economic Prosecutor’s Office) finalizedFNE closed the investigation initiated in 2007 regarding our compliance with this self-regulatory plan and no further observations were made.
As a condition to the combination between LAN and TAM in June 2012, the antitrust authorities in Chile and in Brazil each imposed certain mitigation measures as part of their approval of the combination .merger transaction. Furthermore, the association was also submitted to the antitrust authorities in Germany, Italy and Spain. All these jurisdictions granted unconditional clearances for this transaction. The associationmerger was filed with the Argentinean antitrust authorities,authorities; which approval is still pending. For more information regarding these mitigation measures please see below:
Chile
On September 21, 2011, the TDLC issued a decision (the “Decision”) with respect to the consultation procedure initiated on January 28, 2011 in connection with the proposed combination between LAN and TAM. The TDLC, in the Decision, approved the proposed combination between LAN and TAM, subject to 14 conditions, as generally described below:
| 1. | exchange of certain slots in the Guarulhos Airport at SaoSão Paulo, Brazil; |
| 2. | extension of the frequent flyer program to airlines operating or willing to operate the Santiago-SaoSantiago-São Paulo, Santiago-Río de Janeiro, Santiago-Montevideo and Santiago-Asunción routes during the five-year period from the effective time of the combination; |
| 3. | execution of interline agreements with airlines operating the Santiago-SaoSantiago-São Paulo, Santiago-Río de Janeiro and Santiago-Asunción routes; |
| 4. | certain capacity and other transitory restrictions applicable to the Santiago-São Paulo route; |
| 5. | certain amendments to LAN’s self-regulatory fare plan approved by the TDLC with respect to LAN’s domestic passenger business; |
| 6. | the obligation of LATAM to renounce to one global airline alliance within 24 months from the date in which the combination becomes effective, except in the case that the TDLC approves otherwise, or to elect not to participate in any global airline alliance; |
| 7. | certain restrictions on code-sharing agreements outside the global airline alliance to which LATAM belongs for routes with origin or destination in Chile or that connect to North America and Europe, or with Avianca/TACA or Gol for international routes in South America, including the obligation to consult with, and obtain approval from, the TDLC prior to its execution of certain of those codeshare agreements; |
| 8. | the abandonment of four air traffic frequencies with fifth freedom rights between Chile and PerúPeru and limitations on acquiring in excess of 75%, as applicable, of the air traffic frequencies in that route and the period that certain air traffic frequencies may be granted by the Chilean air transport authorities to LATAM; |
| 9. | issuance of a statement by LATAM supporting the unilateral opening of the Chilean domestic skies (cabotage) and abstention from any actions that would prevent such opening; |
| 10. | promotion by LATAM of the growth and normal operation of the Guarulhos (Brazil) and Arturo Merino Benítez (Chile) airports, to facilitate access thereto to other airlines; |
| 11. | certain restrictions regarding incentives to travel agencies; |
| 12. | to maintain temporarily 12 round trip flights per week between Chile and the United States and at least seven round trip non-stop flights per week between Chile and Europe; |
| 13. | certain transitory restrictions on increasing fares in the Santiago-SaoSantiago-São Paulo and Santiago-Río de Janeiro routes for the passenger business and for the Chile-Brazil routes for the cargo business; and |
| 14. | engaging an independent consultant, expert in airline operations, which for 36 months, and in coordination with the FNE, will monitor and audit compliance with the conditions imposed by the Decision. |
On or about June 2015, the FNE initiated a legal claim against LATAM before the TDLC alleging that LATAM was not complying with certain mitigation conditions related to the code share agreements with airlines outside LATAM’s global alliance as referenced above. Although LATAM opposed this allegation and responded the claim accordingly, a settlement agreement was reached between the FNE and LATAM. The Settlement Agreement approved by the TDLC on December 22, 2015 terminated the legal proceeding initiated by the FNE and did not establish any violation of the TDLC resolutions or any applicable antitrust regulations by LATAM. The Agreement did establish the obligation of LATAM to amend/terminate certain code share agreements and contract an independent third party consultant, which would act as an advisor to the FNE to monitor the compliance by LATAM of the Seventh Condition and the Agreement.
On October 31, 2018, the TDLC approved the joint business agreements between LATAM and American Airlines, and between LATAM and IAG, subject to nine mitigation measures. On May 23, 2019 the Supreme Court of Chile revoked the TDLC decision, and both agreements were rejected. On September 26, 2019, LATAM announced that the JBA with American Airlines would be terminated and, on December 6, 2019, LATAM announced that the JBA with IAG would not be implemented.
Brazil
The Brazilian Council for Economic Defense – CADE approved the LAN/TAM merger by unanimous decision during the hearing session of December 14, 2011, subject to the following conditions: (1) the new combined group (LATAM) should leave one of the two global alliances to which it was part (Star Alliance oroneworld); and (2) the new combined group (LATAM) should offer to swap two pairs of slots in Guarulhos International Airport, to be used by an occasional third party interested in offering direct non-stop flights between São Paulo and Santiago, Chile. These impositions are in line with the mitigation measures adopted by the TDLC, in Chile.
C. ORGANIZATIONAL STRUCTURE
LATAM Airlines Group and LATAM Airlines Brazil ownership structure as of February 29, 2020 is as follows:
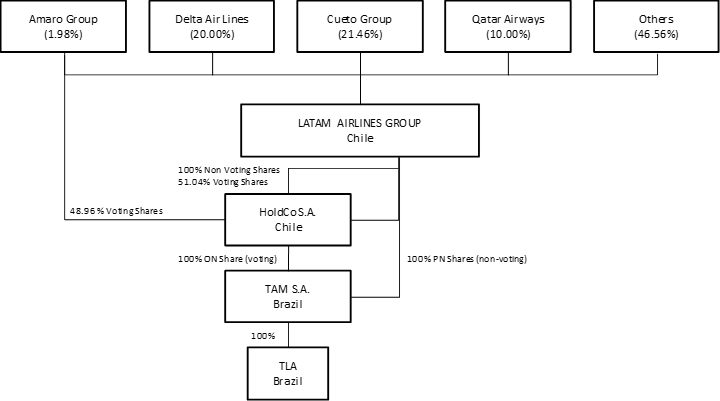
The LATAM Group is composed of eight main airlines: LATAM Airlines Group S.A., incorporated in Chile; Transporte Aéreo S.A. (“LATAM Airlines Chile”), a Chilean subsidiary; LANLATAM Airlines Peru S.A. (“LATAM( “LATAM Airlines Peru”), a Peruvian subsidiary, LATAM-Airlines Ecuador S.A. (“LATAM Airlines Ecuador”, previously Aerolane Líneas Aéreas Nacionales del Ecuador S.A. (“LATAM Airlines Ecuador”), andan Ecuadorian subsidiary, LAN Argentina S.A. (“LATAM Airlines Argentina,” previously Aero 2000 S.A.), an Argentinian subsidiary, Aerovías de Integración Regional, Aires S.A. (“LATAM Airlines Colombia”), a Colombian subsidiary; TAM Linhas Aereas S.A. (“LATAM Airlines Brazil”) incorporated in Brazil; and Transportes Aéreos del MercosurLAN Cargo S.A. (“LATAM Airlines Paraguay”Cargo”), a Paraguayan subsidiary..
As of February 28, 2018December 31, 2019 we held a 100% stake in Transporte Aéreo S.A. through direct and indirect interests, a 70% stake in LANLATAM Airlines Peru through direct and indirect interests, a 55.00% stake of the voting shares of LANLATAM-Airlines Ecuador and a 100% of the non-voting shares of Holdco Ecuador S.A., who has 45.00% of the voting shares of LANLATAM-Airlines Ecuador, a 99.87% indirect stake in LANLATAM Airlines Argentina, a 99.19%99.20% indirect stake in LANLATAM Airlines Colombia and a 100.00% stake of the non-voting shares of TAM, and 48.99%51.04% of the voting shares and 100% of the non-voting shares of Holdco I S.A., which has 100.00% of the voting shares of TAM. Following changes in Brazilian law, which now permitpermits foreign persons to own up to 49%100% of the voting capital of Brazilian airlines, on April 20, 2016,February, 2019, we increased our ownership of the voting shares of Holdco I S.A. to 48.99%51.04%.
The cargoCargo operations are carried out by the affiliates under the brand LATAM Cargo. Our cargo operations are complemented by the operations of certain related companies, such as MasAir in Mexico, ABSA and TAMLATAM Cargo in Brazil and LANCO inLATAM Cargo Colombia. As of February 28, 2018,December 31, 2019, we indirectly held 100% of the non-voting shares and 24.99%20% (preferred) of TAM S.A. (a total of 63,09% of TAM S.A.) which is the voting sharessole shareholder of MasAir, 100% of the non-voting shares and 20% of the voting shares of ABSA,LATAM Cargo Brazil and a 90% stake in LANCOLATAM Cargo Colombia through direct and indirect participations. TAM S.A. has 100% of the non-voting shares and 100% of the voting shares of ABSA..LATAM Cargo Brazil. In the cargo business, we market ourselves internationally primarily under the LATAM Cargo brand internationally.brand. Cargo Operation, in Perú, are carried out by LATAM Airlines Peru.
D. PROPERTY, PLANT AND EQUIPMENT
Chile
Headquarters
Our main facilities are located on approximately five acres of land that we ownrent near the Comodoro Arturo Merino Benítez International Airport. The complex includes approximately 150,695 square feet14,000 m2 of office space, 32,292 square feet3,000 m2 of conference space and training facilities, 9,688 square feet1,000 m2 of dining facilities and mock-up cabins used for crew instruction.
In addition, we occupy 139,400 square feetrent 10,000 m2 for our executive offices in a central location of Santiago, Chile. This space includes five floors owned by LATAMis distributed in one building and ten leasedeleven floors in an adjacent building.four buildings. We also occupy 49,400 square feet,lease 5,000 m2, in twelve floors in downtown (of which LATAM owns ten floors) in Santiago, Chile.
Finally, last year we acquired a 17,000 m2 land, on which we plan to build our new main headquarters during 2020.
Maintenance Base
Our 877,258 square feet 82,000 m2maintenance base is located on a site that we own inside Comodoro Arturo Merino Benítez International Airport. This facility contains our aircraft hangar, warehouses, workshops and offices, as well as a 559,720 square feet52,000 m2 aircraft parking area capable of accommodating up to seventeen short-haul aircraft. We have a 53,820 square feet5,000 m2 office building plus a 10,000 square feet 1,000 m2office and workshop space. We also lease from the Sociedad Concesionaria Nuevo Pudahuel S.A. approximately 124,000 square feet 5,000 m2of space inside the Comodoro Arturo Merino Benítez International Airport for operational and service purposes. The lease has a duration of 30 days and is renewed monthly.
Other Facilities
We own sixteen acres of land and a building on the west side of the Comodoro Arturo Merino Benítez International Airport that houses a flight-training center. This facility features three full-flight simulators (which are not property of LATAM) for, one Boeing 767,787 and two Airbus A320 and Boeing 737 aircraft.
Fast Air Almacenes de Carga S.A. (“Fast Air”), one of our affiliates that operates import customs warehouses, utilizes a 5,600 m² warehouse located at Comodoro Arturo Merino Benítez International Airport.
Brazil
Headquarters
LATAM Airlines Brazil’s main facilities are located in São Paulo, in hangars within the Congonhas Airport and nearby. At Congonhas Airport, LATAM Airlines Brazil leases office facilities in converted hangars belonging to INFRAERO (the Local Airport Administrator). These facilities comprise 60,380an area of approximately 38,807 m².
The LATAM Service Academy is located at Rua Atica, about 2.5 km from Congonhas Airport. This property, which LATAM Airlines Brazil owns, is used for human resources selection, medical services, training, mock-ups and offices- The Service Academy comprises 15,342 m² of land area and 9,032 m² of building area.
We also lease office space for corporate purposesoffices in the city of São Paulo, where we operate 1,5001,225 workstations distributed in 11spread over 9 floors.
Maintenance Base
At Hangars II and V in Congonhas Airport, which LATAM Airlines Brazil leases from INFRAERO, LATAM Airlines Brazil has 21,72723,886 m² of offices and hangars with about 1,300 workstations. This site also houses the aircraft maintenance, procurement, aeronautical materials logistics and retrofitting departments.
Headquarters of the Presidency
The Headquarters of the Presidency are located at Rua Verbo Divino 2001 Floor 17th, Chácara Santo Antonio, São Paulo, since March 2017.Paulo.
Other Facilities
In São Paulo, LATAM Airlines Brazil has other facilities, including: a Call Center Building with 3,199 m2, distributed over five floors (plus a ground floor and a basement) that currently holds about 272 workstations and support rooms (meetings / training / dining room / coordination) of the operations of Call Center Reservations, Talk to People and ABSA back office.
In Guarulhos, LATAM has a total area of approximately 12,89412,649 m2 distributed within the Passenger Terminal, including areas such as Check-in, Ticket Sales, Check Out, Operations Areas, a VIP Lounges,Lounge and Aircraft Maintenance GSE, Cargo Terminal, Distribution Centers, etc.spaces. The Cargo TerminalHangar Complex adds an area of 65.080 m². The cargo terminal has 164252 m2²of office and 8,534 m217,215 m2 of open area. Our Distribution Centre Supplies area occupies 3,030 m2².
New Facilities
LATAM Airlines Brazil completed several infrastructure projects in Brazil during 2017,2019, including:
| 1. | New cargo logistic terminal in Curitiba: 700m2Opening of Maringá Station: 238m² |
| 2. | New cargo logistic terminalGround Handling area reduction of 12,150m² due to third party outsourcing in Imperatriz: 304m2Guarulhos including a space reduction of 12.150m² |
| 3. | ImprovementsMaintenance and Supply areas’ relocation to the Hangar 2 and 5 at Congonhas: 4,000m2Complex in GRU: including a space reduction of 1,306m² |
| 4. | ImprovementCargo Terminal optimization in Viracopos: including a space reduction of 864m² |
| 5. | New area for Recovery Kit storage in GRU: including an expansion of 1.000m² |
| 6. | Perishables Hub - Cold Storage Unit for Transfer Cargo |
| 7. | Transfer of Multiplus S/A Fidelidade company (currently LATAM Pass) with the relocation of rented property (2,400 m2) to training facilities in São Paulo: 9,000m2the EENU Verbo Divino building. |
Other locations
We occupy a 36.3 acre36.3-acre site at the Miami International Airport that has been leased to us under a concession agreement by the Miami Dade Aviation Department. Our facilities include a 44,650 square-feet13,609 m² corporate building, a 380,000 square-feet115,824 m² cargo warehouse (including 116,670 square-feet35,561 m² refrigerated area) and a 783,000 square-feet238,658 m² aircraft-parking platform. These facilities were constructed and are now leased to us under a long-term contract by Aero Term, a division of Real Term Global. For the year ended 2017,2019, we paid US$9.6 9.8 million in rent under the foregoing leases.
In February 2014, the Company entered into a lease agreement with Miami- Dade County covering approximately 1.81 acres of land located on the grounds of the Miami International Airport. The lease has a term of 30 years with a total annual rentland cost of $125,745. US$172,080.
Under the lease, we retained the right to construct a hangar facility on the leased premises. The Company completed the construction in November 2015 and itthe hangar has been operational since June 2016. The property has a 50,785 square-feet15,479 m² aircraft maintenance space, sufficient to house a Boeing B777 aircraft, in addition to a 32,440 square-feet9,888 m² area designated for office space. Total investment ofin this hangar in construction and related expenditures by LATAM was US$16.5 million.
In addition, LATAM holds leases to airport concessions, administrative and sale offices, hangars and maintenance areas in Argentina, Colombia, Ecuador, and Peru.
| ITEM 4A | UNRESOLVED STAFF COMMENTS |
None.
| ITEM 5. | OPERATING AND FINANCIAL REVIEW AND PROSPECTS |
You should read the following discussion of our financial condition and results of operations together with our audited consolidated financial statements and the accompanying notes beginning on page F-1 of this annual report.
The summary consolidated annual financial information as of December 31, 2017, 20162019, 2018 and 20152017 and for the years ended December 31, 2017, 20162019, 2018 and 2015,2017, has been prepared in accordance with IFRS and has been derived from our audited consolidated annual financial statements included in this annual report.
Overview
We derive our revenues primarily from transporting passengers on our passenger aircraft, as well as from transporting cargo in the belly of our passenger aircraft and in our dedicated freighter aircraft. In 2017, 83.6%2019, 86.3% of our total revenues (including in the total for this purpose other income from operating activities) came from passenger revenues and 11.0%10.2% came from our cargo business. The remaining 5.4%3.5% was classified as other operating income, which consists primarily of revenues generated from our coalition and loyalty program Multiplus before its acquisition and merger with LATAM Airlines Brazil, tour operator services, aircraft leasing, customs and warehousing services, third-party maintenance duty free sales and other miscellaneous income.
Our operating environment in 20172019 was marked by a recoveryvolatility in the macroeconomic environment in Latin Americaregion mainly resultedresulting from the GDP growthtrade war between the United States and China–which generated volatility and devaluation of the currencies in Brazil the region–and Argentina. In Brazil specifically, GDP increased by 1.1% in 2017, the first year of growth after two consecutive years of GDP contraction, while GDPeconomic decline in Argentina increased by 2.5%and protests at the end of the year in 2017, after a decline of 2.2% in 2016. On the other hand, other relevant markets for the Company such asEcuador, Chile Peru and Colombia, showed a decline in their GDP growth rates during 2017 as compared to 2016. In addition, during 2017 LATAM faced additional competition from new low-cost airlines with the start of operations of Viva Air in Peru in May 2017 and JetSmart in Chile in July 2017.Colombia.
Passenger Operations
In general, our passenger revenues are driven by international and country-specific political and economic conditions, competitive activity, and the attractiveness of the destinations that we serve. Passenger revenues are also affected by our capacity, traffic, load factors, yield and unit revenue. Our capacity is measured in terms of available seat kilometers, or ASKs, which represents the sum, across our network, of the number of seats we make available for sale on each flight, multiplied by the kilometers flown by the respective flight. We measure traffic in RPKs, as the sum, across our network, of the number of revenue passengers on each flight multiplied by the number of kilometers flown by the respective flight. Load factors represent RPKs (traffic) as a percentage of ASKs (capacity), or the percentage of our capacity that is actually used by paying customers. We use yield, revenue from passenger operations divided by RPKs, to measure the average amount that one passenger pays to fly one kilometer and unit revenue, or revenue per ASK, to measure the effect of capacity on revenues. See “Item 3. Key Information—A. Selected Financial Data.”
Passenger demand during 20172019 showed a recovery as compared to the previous year, mainly as a result ofin our domestic operations, in which we carried 5.7 million more passengers compared to the improvementdomestic passengers carried in 2018, despite the economic environmentincrease in Brazil, as well as the appreciation of the Brazilian real, while in other Latin American countries we faced slower GDP growth (with the exception of Argentina and Ecuador) and increased competition from operators to South America and within the region.
in our domestic markets.
During 2017,2019, domestic operations of our affiliate carriers based in SSC, which accountsaccount for 17.5%18.3% of total passenger capacity, showed an increase of 0.6%9.3% in passenger traffic while capacity decreased 0.1%increased 10.8% as compared to 2016.2018. As a result, the passenger load factor increased 0.6declined by 1.2 percentage points to 81.5%80.8%. This capacity discipline helped to increase the yieldsDespite intensifying competition in these markets, especially in Chile, Peru and Argentina, LATAM Airlines affiliates in the SSC domestic markets and resultedcarried 2.7 million more passengers than in a 4.5% increase in revenue2018. Revenue per ASK in US dollars asdeclined by 7.4% compared to 2016.
2018 mainly due to the devaluation of the Argentinian Peso, Colombian Peso and Chilean Peso.
In ourthe domestic operations in Brazil, LATAM Airlines Brazil reducedincreased capacity by 3.6%7.7% in 2017 as a result2019, higher than anticipated at the beginning of the capacity adjustments madeyear due to changes in 2016, in response to a weak demand environment.the competitive landscape resulting from the end of operations by Avianca Brazil. Passenger traffic decreasedincreased by 3.2%9.4%, allowing forresulting in an improvementincrease of 0.31.3 percentage points in passenger load factors, which reached 82.7%82.5%. LATAM Airlines Brazil ended the year with an increase of 12.4%9.7% in revenues per ASK in US dollars, despite the the devaluation of the Brazilian Real during 2019, as revenue per ASK in Brazilian Reals increased by 19.2% as compared to 2016, driven by a 2.8% increase in RASK in BRL as well as2018.
In international operations, LATAM maintained relatively flat its passenger capacity due to challenging market conditions for international passengers generated by the 8.4% average appreciationdevaluation and volatility of the Brazilian Real.
In our international operations, we increased our passenger capacity by adding new destinations and strengthening the use of our regional hubs, mainly from Santiago and Lima, consistent with the Company’s focus on network improvements. Capacity increases were mainly driven by growth in SSC, while during early 2017 LATAM Airlines Brazil reduced its international capacity mainly driven by adjustments made in 2016, in which the Company reduced its capacity for routes with weaker demand, specifically between Brazil and the US. During the second half of 2017, the Company started to grow againcurrencies in the routes between Brazil and the US mainly driven by improved demand and the appreciation of the Brazilian Real. As a result, capacityregion. Capacity in international operations increased by 3.8%, while0.3% and traffic increased 4.7%1.0%, resulting in an improvementincrease of 0.70.6 percentage points in passenger load factors, which reached 86.9%, while the revenue84.9%. Revenue per ASK increased 6.6%decreased 5.4% in US dollars.
dollars, especially in the first half of the year, prior to capacity adjustments across most of our international network.
Cargo Operations
The cargoCargo operations depend on exports from South America to North America and Europe, and imports from North America and Europe to South America, where Brazil is the main import market. Cargo markets are affected by economic conditions, foreign exchange rates, changes in international trade, the health of particular industries and competition and fuel prices (which we usually pass on to our customers through a cargo fuel surcharge). Cargo revenues are affected by our capacity, traffic, cargo load factors and yield. Our capacity is measured in terms of available ton kilometers, or ATKs, which represents the number of tons available across our network for the transportation of cargo on each flight, multiplied by the kilometers flown by the respective flights. We measure traffic in revenue ton kilometers, or RTKs, as the amount of cargo loads (measured in tons) on each flight multiplied by the number of kilometers flown by the respective flights. Load factors represent RTKs (traffic) as a percentage of ATKs (capacity), or the percentage of our cargo capacity that is actually used to transport cargo for our customers. Finally, we use cargo yield, or revenue from cargo operations divided by RTKs, to measure the average amount that our customers pay to transport one ton of cargo one kilometer.
During 2017,2019, cargo traffic decreased 1.3%, mainly as a result of the reduction indeclined by 1.6% while cargo capacity of 7.1% as compared to 2016,declined by 2.2%, which led to an improvement of 3.2 percentile0.4 percentage points in cargo load factors to 54.9%55.5%. In 2017, we started to see an improvement in imports from North AmericaCargo yields decreased by 8.8%, and Europe to Brazil, which was the result of better economic conditions in the country and the appreciation of the Brazilian Real. Asas a result, revenues per ATK increaseddecreased by 8.5%8.3% as compared to last year, the first increaseprevious year. Decline in recent history.yields was driven by weak import markets, mainly due to the devaluation of the currencies in the region. The Companygroup continued its rational and disciplined approach toward freighter capacity utilization,deployment, while we focused on maximizing the belly utilization of ourthe passenger fleet. Consistent with this approach, we are currently sub-leasing one of our 767-300Fs to a third party operating in a different market and during 2017 we removed two Boeing 777-200Fs from service.
Cost Structure
LATAM Airlines Group’s costs are largely driven by the size of our operations, fuel prices, fleet costs and exchange rates. Our operating expenses are calculated in accordance with IFRS and comprise the sum of the line items “cost of sales” plus “distribution costs” plus “administrative expenses” plus “other operating expenses,” as shown on our consolidated statement of comprehensive income. These operating expenses include wages and benefits, fuel, depreciation and amortization, commissions to agents, aircraft rentals, other rental and landing fees, passenger services, aircraft maintenance and other operating expenses. The following is a discussion of the drivers of the most important costs.
As an airline, we are subject to fluctuations in costs that are outside of our control, particularly fuel prices. During 2017,2019, average Jet fuel prices increased 22.4%, principally due to the agreement among oil exporter countries (mainly OPEC members) to cut oil production until 2018, natural disasters in North America (specifically hurricanes Harvey and Irma) and geopolitical factors in oil exporter countries such as Lybia, Iraq and Nigeria.decreased 7.3%. LATAM Airlines Group has a hedging policy to protect medium term liquidity risk from fuel price increases, while participating in the benefits of fuel price reductions. Cost of fuel is also affected by the amount of gallons we consume, which depends on the size of our operation, the efficiency of our fleet and the impact of our efficiency programs.
Personnel expenses are another significant component of our overall costs. Because a significant portion of our labor costs are denominated in Chilean pesos and in Brazilian Reals, appreciation of these currencies against the U.S. dollar as well as increases in local inflation rates can result in increased costs in U.S. dollar terms and can negatively affect our results. Depreciation of local currencies results in decreases in costs in dollars. Other important drivers of personnel expenses are average headcount and average wages.
Commissions paid to travel and cargo agents are also a significant cost to the Company. We compete with other airlines over the amount of commission we pay per sale, particularly in connection with special programs and marketing efforts, and to maintain competitive incentives with travel agents.
Fleet related expenses, namely aircraft rentals and depreciation, are another significant cost, and mainly depend on the number and type of aircraft that are owned and that are under operating leases. These costs are largely fixed and can be reduced on a per unit basis by achieving higher aircraft utilization rates.
Results of Operations
LATAM Airlines Group Financial Results Discussion: Year ended December 31, 20172019 compared to year ended December 31, 2016.2018.
The following table sets forth certain income statement data for LATAM Airlines Group, for the year ended December 31, 2017,2019, and December 31, 2016.2018. Financial information for 2018 was restated to give effect to the application of IFRS16. For certain operating data for these periods, see “Item 3. Key Information—A. Selected Financial Data.”
| | | Year Ended December 31, | |
| | | 2017 | | | 2016 | | | 2017 | | | 2016 | | | | |
| | | (in US$ millions, except per
share and capital stock data) | | | As a percentage of total
operating revenues | | | 2017/2016
% change | |
| Consolidated Results of Income by Function | | | | | | | | | | | | | | | |
| Operating revenues | | | | | | | | | | | | | | | | | | | | |
| Passenger | | | 8,494.5 | | | | 7,877.7 | | | | 88.4 | % | | | 87.6 | % | | | 7.8 | % |
| Cargo | | | 1,119.4 | | | | 1,110.6 | | | | 11.6 | % | | | 12.4 | % | | | 0.8 | % |
| Total operating revenues | | | 9,613.9 | | | | 8,988.3 | | | | 100.0 | % | | | 100.0 | % | | | 7.0 | % |
| | | | | | | | | | | | | | | | | | | | | |
| Cost of sales | | | (7,441.8 | ) | | | (6,967.0 | ) | | | (77.4) | % | | | (77.5) | % | | | 6.8 | % |
| Gross margin | | | 2,172.1 | | | | 2,021.3 | | | | 22.6 | % | | | 22.5 | % | | | 7.5 | % |
| Other operating income | | | 549.9 | | | | 538.7 | | | | 5.7 | % | | | 6.0 | % | | | 2.1 | % |
| Distribution costs | | | (699.6 | ) | | | (747.4 | ) | | | (7.3) | % | | | (8.3) | % | | | (6.4 | )% |
| Administrative expenses | | | (938.9 | ) | | | (873.0 | ) | | | (9.8) | % | | | (9.7) | % | | | 7.5 | % |
| Other operating expenses | | | (368.9 | ) | | | (373.7 | ) | | | (3.8) | % | | | (4.2) | % | | | (1.3 | )% |
| Financial income | | | 78.7 | | | | 74.9 | | | | 0.8 | % | | | 0.8 | % | | | 5.1 | % |
| Financial costs | | | (393.3 | ) | | | (416.3 | ) | | | (4.1) | % | | | (4.6) | % | | | (5.5 | )% |
| Share of profit of investments accounted for using the equity method | | | 0.0 | | | | 0.0 | | | | 0.0 | % | | | 0.0 | % | | | 0.0 | % |
| Foreign exchange gains/(losses) | | | (18.7 | ) | | | 121.7 | | | | (0.2) | % | | | 1.4 | % | | | (115.4 | )% |
| Result of indexation units | | | 0.7 | | | | 0.3 | | | | 0.0 | % | | | 0.0 | % | | | 133.3 | % |
| Other gains/(losses) | | | (7.8 | ) | | | (72.6 | ) | | | (0.1) | % | | | (0.8) | % | | | (89.3 | )% |
| Income (loss) before income taxes | | | 374.2 | | | | 273.9 | | | | 3.9 | % | | | 3.1 | % | | | 36.6 | % |
| Income (loss) tax expense | | | (173.5 | ) | | | (163.2 | ) | | | (1.8) | % | | | (1.8) | % | | | 6.3 | % |
| | | | | | | | | | | | | | | | | | | | | |
| Net income (loss) for the period | | | 200.7 | | | | 110.7 | | | | 2.1 | % | | | 1.3 | % | | | 81.3 | % |
| | | | | | | | | | | | | | | | | | | | | |
| Income (loss) for the period attributable to the parent company’s equity holders | | | 155.3 | | | | 69.2 | | | | 1.6 | % | | | 0.8 | % | | | 124.4 | % |
| | | | | | | | | | | | | | | | | | | | | |
| Income (loss) for the period attributable to non-controlling interests | | | 45.4 | | | | 41.5 | | | | 0.5 | % | | | 0.5 | % | | | 9.4 | % |
| | | | | | | | | | | | | | | | | | | | | |
| Net income (loss) for the period | | | 200.7 | | | | 110.7 | | | | 2.1 | % | | | 1.3 | % | | | 81.3 | % |
| | | | | | | | | | | | | | | | | | | | | |
| Earnings per share | | | | | | | | | | | | | | | | | | | | |
| Basic earnings per share (US$) | | | 0.25610 | | | | 0.12665 | | | | n.a. | | | | n.a. | | | | 102.2 | % |
| Diluted earnings per share (US$) | | | 0.25610 | | | | 0.12665 | | | | n.a. | | | | n.a. | | | | 102.2 | % |
| | | Year Ended December 31, | |
| | | 2019 | | | 2018 | | | 2019 | | | 2018 | | | | |
| | | (in US$ millions, except per
share data) | | | As a percentage of total
operating revenues | | | 2019/2018
% change | |
| Consolidated Results of Income by Function | | | | | | | | | | | | | | | |
| Operating revenues | | | | | | | | | | | | | | | |
| Passenger | | | 9,005.6 | | | | 8,709.0 | | | | 89.4 | % | | | 88.0 | % | | | 3.4 | % |
| Cargo | | | 1,064.4 | | | | 1,186.5 | | | | 10.6 | % | | | 12.0 | % | | | (10.3 | )% |
| Total operating revenues | | | 10,070.1 | | | | 9,895.5 | | | | 100.0 | % | | | 100.0 | % | | | 1.8 | % |
| Cost of sales | | | (7,951.3 | ) | | | (7,773.4 | ) | | | (79.0 | )% | | | (78.6 | )% | | | 2.3 | % |
| Gross margin | | | 2,118.8 | | | | 2,122.0 | | | | 21.1 | % | | | 21.4 | % | | | (0.2 | )% |
| Other operating income | | | 360.9 | | | | 472.8 | | | | 3.6 | % | | | 4.8 | % | | | (23.7 | )% |
| Distribution costs | | | (580.0 | ) | | | (615.2 | ) | | | (5.8 | )% | | | (6.2 | )% | | | (5.7 | )% |
| Administrative expenses | | | (735.2 | ) | | | (736.3 | ) | | | (7.3 | )% | | | (7.4 | )% | | | (0.1 | )% |
| Other operating expenses | | | (422.8 | ) | | | (356.3 | ) | | | (4.2 | )% | | | (3.6 | )% | | | 18.7 | % |
| | | Year Ended December 31, | |
| | | 2019 | | | 2018 | | | 2019 | | | 2018 | | | | |
| | | (in US$ millions, except per
share data) | | | As a percentage of total
operating revenues | | | 2019/2018
% change | |
| Financial income | | | 26.3 | | | | 53.3 | | | | 0.3 | % | | | 0.5 | % | | | (50.7 | )% |
| Financial costs | | | (589.9 | ) | | | (539.1 | ) | | | (5.9 | )% | | | (5.4 | )% | | | 9.4 | % |
| Foreign exchange gains/(losses) | | | (32.6 | ) | | | (38.1 | ) | | | (0.3 | )% | | | (0.4 | )% | | | (14.4 | )% |
| Result of indexation units | | | (15.0 | ) | | | (0.9 | ) | | | (0.1 | )% | | | 0.0 | % | | | n.a. | |
| Other gains/(losses) | | | 11.5 | | | | 53.5 | | | | 0.1 | % | | | 0.5 | % | | | (78.5 | )% |
| Income (loss) before income taxes | | | 141.9 | | | | 415.7 | | | | 1.4 | % | | | 4.2 | % | | | (65.9 | )% |
| Income (loss) tax expense | | | 53.7 | | | | (73.9 | ) | | | 0.5 | % | | | (0.7 | )% | | | (172.7 | )% |
| Net income (loss) for the period | | | 195.6 | | | | 341.8 | | | | 1.9 | % | | | 3.5 | % | | | (42.8 | )% |
| | | | | | | | | | | | | | | | | | | | | |
| Income (loss) for the period attributable to the parent company’s equity holders | | | 190.4 | | | | 309.8 | | | | 1.9 | % | | | 3.1 | % | | | (38.5 | )% |
| | | | | | | | | | | | | | | | | | | | | |
| Income (loss) for the period attributable to non-controlling interests | | | 5.2 | | | | 32.0 | | | | 0.1 | % | | | 0.3 | % | | | (83.8 | )% |
| | | | | | | | | | | | | | | | | | | | | |
| Net income (loss) for the period | | | 195.6 | | | | 341.8 | | | | 1.9 | % | | | 3.5 | % | | | (42.8 | )% |
| | | | | | | | | | | | | | | | | | | | | |
| Earnings per share | | | | | | | | | | | | | | | | | | | | |
| Basic earnings per share (US$) | | | 0.31403 | | | | 0.51090 | | | | n.a | | | | n.a. | | | | (38.5 | )% |
| Diluted earnings per share (US$) | | | 0.31403 | | | | 0.51090 | | | | n.a | | | | n.a. | | | | (38.5 | )% |
* The abbreviation “n.a.” means not available.
Net Income
Net income for the year ended December 31, 2017 equaled US$200.7 million, representing an increase of US$90.0 million from a net income of US$110.7 million in 2016. Net income attributable to the parent company’s shareholders was US$155.3 million in 2017, representing an increase of US$86.1 million compared with a net income of US$69.2 million in 2016.
Operating Revenues
Our total operating revenues increased by 7.0%1.8% to US$9,613.910,070.1 million in the year ended December 31, 20172019 compared to revenues of US$8,988.39,895.5 million in 2016.2018. The 20172019 increase in operating revenues was attributable to a 7.8%3.4% increase in passenger revenues, andpartially offset by a 0.8% increase10.3% decrease in cargo revenues in 2017.revenues. Passenger and cargo revenues accounted for 88.4%89.4% and 11.6%10.6% of total operating revenues in 2017,2019, respectively.
Our consolidated passenger revenues increased by 7.8%3.4% to US$8,494.59,005.6 million in 20172019 from US$7,877.78,709.0 million in 2016,2018, as a result of a 4.1% increase in capacity and the recognition of Multiplus revenues under passenger revenues after the integration of Multiplus into LATAM Airlines Brasil in May 2019. This was offset by a 0.6% decrease in RASK due to a 1.1% decrease in yields, which were impacted by softer international demand in the region due to currency devaluations in South America. In addition, load factor reached 83.5% in 2019, which represents an increase of 6.7% in our unit revenues (“RASK”) and a capacity increase of 1.1% compared0.4 percentage points with respect to 2016. Increases in RASK reflect an increase of 5.9% in consolidated yields, resulting mainly from the recovery in yields in the domestic and international operations in Brazil as a result of capacity adjustments made in 2016 and the appreciation of the Brazilian real. The increase in capacity was a result of a 3.8% increase in our international operations, partially offset by a decrease of 3.6% in capacity in our domestic Brazil operations. Capacity in domestic SSC operations decreased slightly by 0.1%.
2018.
Cargo revenues increaseddecreased by 0.8%10.3%, to US$1,119.41,064.4 million in 20172019 from US$1,110.61,186.5 million in 2016, as a result of an increase of 8.5% in unit revenues (“RATK”), partially offset by a decrease of 7.1%2018. Decrease in cargo capacity (“ATK”). The decreaserevenues is explained by an 8.8% decline in our cargo capacity resulted from reduced freighter operations, whileyields and a 1.6% decline in traffic measured in RTK. Decline in yields was explained by weaker import markets, especially in Brazil and Argentina, mainly due to currency devaluation. In addition, exports in Chile were affected by the Company focused cargo operations usingsocial unrest in fourth quarter 2019. Finally, the bellysale of the passenger aircrafts. IncreasesMexican subsidiary MasAir during the last quarter of 2018, explained the decline of approximately US$37 million in RATK reflected a more stable market conditions in Brazil, as well as the appreciation of the Brazilian real. During 2017, imports into the region showed an improvement ascargo revenues during 2019 compared to 2016, especially to Brazil from North America and Europe, which resulted in higher cargo yields, which increased by 2.1% in 2017 as compared to 2016.2018.
Cost of Sales
Cost of sales increased by 6.8%2.3% to US$7,441.87,951.3 million for the year ended December 31, 20172019 (from US$6,967.07,773.4 million in 2016)2018), mainly due to higher aircraft fuel expenses during the year, the impactmore operations and an increase on 7.8% in passengers carried in 2019 compared to 2018. Cost of the appreciation of local currencies on certain costs denominated on those currencies and additional expenses mainly associated with fleet redeliveries. Assales as a percentage of total operating revenues, cost of sales decreasedincreased to 79.0% in 2019 from 77.5%78.6% in 2016 to 77.4% in 2017.2018.
The table below presents cost of sales information for the fiscal year ended December 31, 20172019 and 2016.2018.
| | | Year Ended December 31, | | | Year Ended December 31, | |
| | | 2017 | | 2016 | | 2017 | | 2016 | | 2017/2016
% change | | | 2019 | | | 2018 | | | 2019 | | | 2018 | | | | |
| | | (in US$ millions, except
as otherwise stated) | | As a percentage of total
operating revenues | | | | | | (in US$ millions, except
as otherwise stated) | | As a percentage of total
operating revenues | | | 2019/2018
% change | |
| Revenues | | | 9,613.9 | | | | 8,988.3 | | | | 100.0 | % | | | 100.0 | % | | | 7.0 | % | | | 10,070.1 | | | | 9,895.5 | | | | 100.0 | % | | | 100.0 | % | | | 1.8 | % |
| Cost of sales | | | (7,441.8 | ) | | | (6,967.0 | ) | | | (77.4 | )% | | | (77.5 | )% | | | 6.8 | % | | | (7,951.3 | ) | | | (7,773.4 | ) | | | (79.0 | )% | | | (78.6 | )% | | | 2.3 | % |
| | | | | | | | | | | | | | | | | | | | | | |
| Aircraft Fuel | | | (2,318.8 | ) | | | (2,056.6 | ) | | | (24.1 | )% | | | (22.9) | % | | | 12.7 | % | | | (2,929.0 | ) | | | (2,983.0 | ) | | | (29.1 | )% | | | (30.1 | )% | | | (1.8 | )% |
| Wages and Benefits | | | (1,545.6 | ) | | | (1,479.5 | ) | | | (16.1 | )% | | | (16.5 | )% | | | 4.5 | % | | | (1,452.9 | ) | | | (1,442.2 | ) | | | (14.4 | )% | | | (14.6 | )% | | | 0.7 | % |
| Other Rental and Landing Fees | | | (1,172.1 | ) | | | (1,077.4 | ) | | | (12.2 | )% | | | (12.0 | )% | | | 8.8 | % | | | (1,275.9 | ) | | | (1,206.9 | ) | | | (12.7 | )% | | | (12.2 | )% | | | 5.7 | % |
| Depreciation and Amortization | | | (1,001.6 | ) | | | (960.3 | ) | | | (10.4 | )% | | | (10.7 | )% | | | 4.3 | % | | | (1,470.0 | ) | | | (1,372.6 | ) | | | (14.6 | )% | | | (13.9 | )% | | | 7.1 | % |
| Aircraft Rentals | | | (579.6 | ) | | | (569.0 | ) | | | (6.0 | )% | | | (6.3 | )% | | | 1.9 | % | |
| Aircraft Maintenance | | | (430.8 | ) | | | (366.2 | ) | | | (4.5 | )% | | | (4.1 | )% | | | 17.6 | % | | | (444.6 | ) | | | (366.6 | ) | | | (4.4 | )% | | | (3.7 | )% | | | 21.3 | % |
| Passenger Services | | | (288.7 | ) | | | (286.6 | ) | | | (3.0 | )% | | | (3.2 | )% | | | 0.7 | % | | | (261.3 | ) | | | (280.3 | ) | | | (2.6 | )% | | | (2.8 | )% | | | (6.8 | )% |
| Other Costs of Sales | | | (104.6 | ) | | | (171.4 | ) | | | (1.1 | )% | | | (2.8 | )% | | | (39.0 | )% | | | (117.6 | ) | | | (121.8 | ) | | | (1.2 | )% | | | (1.2 | )% | | | (3.4 | )% |
The increase in our cost of sales was drivenFuel costs declined by higher aircraft fuel expenses, which increased by 12.7% to US$2,318.8 million in 20171.8%, as a result of a 21.1% increase9.1% decrease in the full year average fuel price per gallon (excluding hedge), as compared to 2018. The latter was partially offset by 2.5% decreasea 5.6% increase in the gallons of fuel consumed.consumption, associated to an increase in capacity. In addition, LATAMin 2019, the Company recognized a net gain of US$15.121.2 million in fuel hedging in 2017, compared to a fuel hedge loss of US$48.0 million in 2016. In 2017, the Company also recognized a US$9.7 million hedge loss related to foreign currencyhedging contracts, which were recognized in the fuel cost line comparedcompares to a US$40.347.3 million loss in 2016.gain 2018.
Wages and benefits increased by 4.5% to US$1,545.6 million in 2017 from US$1,479.5 million in 2016,0.7%, mainly explained by an increase of 1.4% in the appreciationnumber of local currencies during the year and the annual increase in unit salaries due to the inflation adjustment (which was based on 2016 inflation rates), especially in Brazil. This wasemployees, partially offset by a 6.1% decline in headcount during the year.depreciation of local currencies.
Other rental and landing fees increased 5.7%, mainly due to a 7.8% increase in passengers carried and higher handling costs associated to an increase in the operations.
Depreciation and amortization grew by 8.8% to7.1%, mainly explained by 29 additional planes we received during 2019, the retrofit of the cabins and digital and IT projects during 2019.
Aircraft maitenance increased by US$1,172.178.0 million in 2017 from U$1,077.4 million in 2016, mainly due to an increase in landing fees, particularly in Argentina, as well as higher handling costs.
Depreciationline maintenance associated to improve reliability of our operations and amortization increased by US$41.3 million, amounting to US$1,001.6 million, which represents an increasethe reception and operation of 4.3% due to the higher depreciation cost per aircraft due to the incorporation of larger and more expensive fleet on the balance sheet, partially offset by a four unit reduction in the average number of aircraft compared with 2016.
Aircraft rentals increased by 1.9% to US$579.6 million in 2017 from US$569.0 million in 2016 as a result of the incorporation of larger and more modern aircraft under operating leases (i.e. Boeing 787s and Airbus A320 neos), partially offset by fewer29 aircraft in the fleet under operating leases. Aircraft maintenance expenses increasedyear.
Passenger service declined by 17.7%, from US$366.2 million in 2016 to US$430.8 million in 2017,6.8% mainly due to redelivery costs, as the Company returned 21 aircraftexplained by a lower rate of passenger contingencies during the year. Passenger service expenses increased by 0.7%, to US$288.7 million in 2017quarter compared to US$286.6 million in 2016, in line with the increasesame period of 0.3% in the number of passengers transported.2018.
As a result of the above, gross margin (defined as operating revenue minus cost of sales) increased by 7.5% fromequaled US$2,021.32,118.8, compared to US$2,122.0 million in 2016 to US$2,172.1 million in 2017.2018.
Other Consolidated Results
Other operating income increaseddecreased in 20172019 by 2.1%23.7%, from US$538.7360.9 million in 20162019 to US$549.9472.8 million in 2017,2019, mainly due to higherthe acquisition and subsequent merger of Multiplus with LATAM Airlines Brazil. Revenues from Multiplus are now registered under Passenger revenues, while previous to the merger with LATAM Brazil, revenues from Multiplus and aircraft leases as compared to 2016.were registered under Other operating income.
Distribution costs decreased by 6.4%5.7% from US$747.4615.2 million in 20162018 to US$699.6580.0 million in 2017,2019, mainly as a result of lower commissionsreserve systems and data processing costs and wages and benefits costs, due to agents (which decreased by 6.2%, from US$269.3 million to US$252.5 million)a decrease in average headcount and the passenger businesses.devalution of local currencies.
Administrative expenses increasedremained relatively flat year-over-year, decreasing by 7.6%0.1% from US$873.0736.3 million in 20162018 to US$938.9735.2 million in 2017, mainly2019, due to the impact of the appreciationdevaluation of local currencies, duringoffset by an increase of 1.4% in the year on wages denominated in those currencies, and the annual increase in unit salaries due to the inflation adjustment (which was based on 2016 inflation rates), especially in Brazil,number of employees.
Other operating expenses increased by 18.7% from US$356.3 million in 2018 to US$422.8 million in 2019 as a result of an increase of 7.8% of passenger carried and a non-recurring adjustment in the fourth quarter of 2018 associated with a reversal of a provision of PIS/COFINS.
Financial income decreased by 1.3%50.7% to US$26.3 million in 2019 compared with US$53.3 million in 2018, mainly due to the merger of Multiplus with LATAM Airlines Brazil. Investments made by Multiplus in 2018 were recorded under interest income, while investments made by LATAM with the cash that belonged to Multiplus are now recorded under Other gains (losses).
Financial costs increased by 9.4% to US$589.9 million in 2019 from US$373.7539.1 million in 20162018, mainly due to the early redemption of LATAM’s 2020 unsecured bond and the issuance of US$368.9800 million unsecured notes due 2026.
Foreign exchange result decreased by 14.4% to a net loss of US$32.6 million in 20172019, mainly as a result of the Company’s ongoing efficiency initiatives.
Financial income increased by 5.0% to US$78.7 million indevaluation of 3.7% and 58.9% of the year ended December 31, 2017 compared with US$74.9 million in 2016, mainly due to an increase in cash.
Financial costs decreased by 5.5% to US$393.3 million in 2017 from US$416.3 million in 2016, mainly due to a reduction in our gross debt.Brazilian Real and the Argentinean Peso, respectively.
Income tax expensebenefit for 20172019 amounted to US$173.553.7 million as compared to an income tax expense of US$163.273.9 million in 2016.2018. This increasevariation is explained mainly by improveda decline in pre-tax resultsincome in 20172019 (US$374.2141.9 million gain)pre-tax income) compared with 20162018 (US$273.9415.7 million gain)pre-tax income), resulting in an increased income tax charges.charges, and the none recognition of deferred taxes related to tax losses by TAM S.A. and LATAM Argentina in 2018. For more information, see Note 18 to our audited consolidated financial statements.
Net Income
Net income for the year ended December 31, 2019 equaled US$195.6 million, representing a decrease of US$146.2 million. Net income attributable to the parent company’s shareholders was US$190.4 million in 2019, representing a decrease of US$119.4 million.
LATAM Airlines Group Financial Results Discussion: Year ended December 31, 20162018 compared to year ended December 31, 2015.2017.
The following table sets forth certain income statement data for LATAM Airlines Group, for the year ended December 31, 2016,2018, and December 31, 2015.2017. Financial information for 2018 and 2017 was restated to give effect to the application of IFRS16. For certain operating data for these periods, see “Item 3. Key Information—A. Selected Financial Data.”
| | | Year Ended December 31, | |
| | | 2018 | | | 2017 | | | 2018 | | | 2017 | | | | |
| | | (in US$ millions, except per
share data) | | | As a percentage of total
operating revenues | | | 2018/2017
% change | |
| Consolidated Results of Income by Function | | | | | | | | | | | | | | | |
| Operating revenues | | | | | | | | | | | | | | | |
| Passenger | | | 8,709.0 | | | | 8,494.5 | | | | 88.0 | % | | | 88.4 | % | | | 2.5 | % |
| Cargo | | | 1,186.5 | | | | 1,119.4 | | | | 12.0 | % | | | 11.6 | % | | | 6.0 | % |
| Total operating revenues | | | 9,895.5 | | | | 9,613.9 | | | | 100.0 | % | | | 100.0 | % | | | 2.9 | % |
| Cost of sales | | | (7,773.4 | ) | | | (7,279.3 | ) | | | (78.6 | )% | | | (75.7 | )% | | | 6.8 | % |
| Gross margin | | | 2,122.0 | | | | 2,334.6 | | | | 21.4 | % | | | 24.3 | % | | | (9.1 | )% |
| Other operating income | | | 472.8 | | | | 549.8 | | | | 4.8 | % | | | 5.7 | % | | | (14.0 | )% |
| Distribution costs | | | (615.2 | ) | | | (696.7 | ) | | | (6.2 | )% | | | (7.2 | )% | | | (11.7 | )% |
| Administrative expenses | | | (736.3 | ) | | | (952.8 | ) | | | (7.4 | )% | | | (9.9 | )% | | | (22.7 | )% |
| Other operating expenses | | | (356.3 | ) | | | (365.5 | ) | | | (3.6 | )% | | | (3.8 | )% | | | (2.5 | )% |
| Financial income | | | 53.3 | | | | 78.6 | | | | 0.5 | % | | | 0.8 | % | | | (32.2 | )% |
| Financial costs | | | (539.1 | ) | | | (579.2 | ) | | | (5.4 | )% | | | (6.0 | )% | | | (6.9 | )% |
| Foreign exchange gains/(losses) | | | (38.1 | ) | | | (48.4 | ) | | | (0.4 | )% | | | (0.5 | )% | | | (21.3 | )% |
| Result of indexation units | | | (0.9 | ) | | | (0.7 | ) | | | 0.0 | % | | | 0.0 | % | | | 28.6 | % |
| Other gains/(losses) | | | 53.5 | | | | (7.8 | ) | | | 0.5 | % | | | (0.1 | )% | | | n.a. | |
| Income (loss) before income taxes | | | 415.7 | | | | 313.3 | | | | 4.2 | % | | | 3.3 | % | | | 32.7 | % |
| Income (loss) tax expense | | | (73.9 | ) | | | (158.9 | ) | | | (0.7 | )% | | | (1.7 | )% | | | (53.5 | )% |
| Net income (loss) for the period | | | 341.8 | | | | 154.4 | | | | 3.5 | % | | | 1.6 | % | | | 121.4 | % |
| Income (loss) for the period attributable to the parent company’s equity holders | | | 309.8 | | | | 108.9 | | | | 3.1 | % | | | 1.1 | % | | | 184.5 | % |
| | | Year Ended December 31, | |
| | | 2018 | | | 2017 | | | 2018 | | | 2017 | | | | |
| | | (in US$ millions, except per
share and capital stock data) | | | As a percentage of total
operating revenues | | | 2018/2017
% change | |
| Income (loss) for the period attributable to non-controlling interests | | | 32.0 | | | | 45.4 | | | | 0.3 | % | | | 0.5 | % | | | (29.5 | )% |
| Net income (loss) for the period | | | 341.8 | | | | 154.4 | | | | 3.5 | % | | | 1.6 | % | | | 121.4 | % |
| | | | | | | | | | | | | | | | | | | | | |
| Earnings per share | | | | | | | | | | | | | | | | | | | | |
| Basic earnings per share (US$) | | | 0.51090 | | | | 0.17958 | | | | n.a | | | | n.a. | | | | 184.5 | % |
| Diluted earnings per share (US$) | | | 0.51090 | | | | 0.17958 | | | | n.a | | | | n.a. | | | | 184.5 | % |
| 56* | The abbreviation “n.a.” means not available. |
| | | Year Ended December 31, | |
| | | 2016 | | | 2015 | | | 2016 | | | 2015 | | | | |
| | | (in US$ millions, except per
share and capital stock data) | | | As a percentage of total
operating revenues | | | 2016/2015
% change | |
| Consolidated Results of Income by Function | | | | | | | | | | | | | | | | | | | | |
| Operating revenues | | | | | | | | | | | | | | | | | | | | |
| Passenger | | | 7,877.7 | | | | 8,410.6 | | | | 87.6 | % | | | 86.4 | % | | | (6.3 | )% |
| Cargo | | | 1,110.6 | | | | 1,329.4 | | | | 12.4 | % | | | 13.6 | % | | | (16.5 | )% |
| Total operating revenues | | | 8,988.3 | | | | 9,740.0 | | | | 100.0 | % | | | 100.0 | % | | | (7.7 | )% |
| | | | | | | | | | | | | | | | | | | | | |
| Cost of sales | | | (6,967.0 | ) | | | (7,636.7 | ) | | | (77.5 | )% | | | (78.4 | )% | | | (8.8 | )% |
| Gross margin | | | 2,021.3 | | | | 2,103.3 | | | | 22.5 | % | | | 21.6 | % | | | (3.9 | )% |
| Other operating income | | | 538.7 | | | | 385.8 | | | | 6.0 | % | | | 4.0 | % | | | 39.6 | % |
| Distribution costs | | | (747.4 | ) | | | (783.3 | ) | | | (8.3 | )% | | | (8.0 | )% | | | (4.6 | )% |
| Administrative expenses | | | (873.0 | ) | | | (878.0 | ) | | | (9.7 | )% | | | (9.0 | )% | | | (0.6 | )% |
| Other operating expenses | | | (373.7 | ) | | | (324.0 | ) | | | (4.2 | )% | | | (3.3 | )% | | | 15.4 | % |
| Financial income | | | 74.9 | | | | 75.1 | | | | 0.8 | % | | | 0.8 | % | | | (0.3 | )% |
| Financial costs | | | (416.3 | ) | | | (413.4 | ) | | | (4.6 | )% | | | (4.2 | )% | | | 0.7 | % |
| Share of profit of investments accounted for using the equity method | | | 0.0 | | | | 0.0 | | | | 0.0 | % | | | 0.0 | % | | | 0.0 | % |
| Foreign exchange gains/(losses) | | | 121.7 | | | | (467.9 | ) | | | 1.4 | % | | | (4.8 | )% | | | (126.0) | % |
| Result of indexation units | | | 0.3 | | | | 0.6 | | | | 0.0 | % | | | 0.0 | % | | | (50.0) | % |
| Other gains/(losses) | | | (72.6 | ) | | | (55.3 | ) | | | (0.8 | )% | | | (0.6 | )% | | | 31.3 | % |
| Income (loss) before income taxes | | | 273.9 | | | | (357.1 | ) | | | 3.1 | % | | | (3.5 | )% | | | (17.7 | )% |
| Income (loss) tax expense | | | (163.2 | ) | | | 178.4 | | | | (1.8 | )% | | | 1.8 | % | | | (16.2 | )% |
| | | | | | | | | | | | | | | | | | | | | |
| Net income (loss) for the period | | | 110.7 | | | | (178.7 | ) | | | 1.3 | % | | | (1.7 | )% | | | (38.1 | )% |
| | | | | | | | | | | | | | | | | | | | | |
| Income (loss) for the period attributable to the parent company’s equity holders | | | 69.2 | | | | (219.3 | ) | | | 0.8 | % | | | (2.3 | )% | | | (131.6 | )% |
| | | | | | | | | | | | | | | | | | | | | |
| Income (loss) for the period attributable to non-controlling interests | | | 41.5 | | | | 40.5 | | | | 0.5 | % | | | 0.4 | % | | | 2.2 | % |
| | | | | | | | | | | | | | | | | | | | | |
| Net income (loss) for the period | | | 110.7 | | | | (178.7 | ) | | | 1.3 | % | | | (1.7 | )% | | | (38.1 | )% |
| | | | | | | | | | | | | | | | | | | | | |
| Earnings per share | | | | | | | | | | | | | | | | | | | | |
| Basic earnings per share (US$) | | | 0.12665 | | | | (0.40193 | ) | | | n.a. | | | | n.a. | | | | (131.5 | )% |
| Diluted earnings per share (US$) | | | 0.12665 | | | | (0.40193 | ) | | | n.a. | | | | n.a. | | | | (131.5 | )% |
* The abbreviation “n.a.” means not available.
Net Income
Net income for the year ended December 31, 2016 equaled US$110.7 million, representing an improvement of US$289.4 million from a net loss of US$178.7 million in 2015. Net income attributable to the parent company’s shareholders was US$69.2 million in 2016, compared with a net loss of US$219.3 million in 2015. Results were positively impacted by a foreign exchange gain of US$ 121.7 million, compared to a net foreign exchange loss of US$467.9 million in 2015.
Operating Revenues
Our total operating revenues decreasedincreased by 7.7%2.9% to US$8,988.39,895.5 million in the year ended December 31, 20162018 compared to revenues of US$9,740.09,613.9 million in 2015.2017. The 2016 decrease2018 increase in operating revenues was attributable to a 6.3% decrease2.5% increase in passenger revenues, and a 16.5% decrease6.0% increase in cargo revenues. Passenger and cargo revenues accounted for 87.6%88.0% and 12.4%12.0% of total operating revenues in 2016,2018, respectively.
Our consolidated passenger revenues decreasedincreased by 6.3%2.5% to US$7,877.78,709.0 million in 20162018 from US$8,410.68,494.5 million in 2015,2017, as a result of a 5.0% increase in capacity, offset by a decrease of 6.9%2.4% in our unit revenues (“RASK”). Our capacity increased by 0.6%The passenger RASK decline resulted from a 0.4% yield reduction, together with a load factor decline of 1.7 percentage points, which reached 83.1%. The increase in capacity was a resultdevaluation of an 8.0% increase in our domestic SSC operationsthe Argentinean Peso and a 5.6% increasethe Brazilian Real during 2018 negatively affected demand, especially in our international operations, partially offsetoperations. Cargo revenues increased by 6.0%, to US$1,186.5 million in 2018 from US$1,119.4 million in 2017, driven by a decrease4.3% increase in cargo capacity and an increase of 11.5% in capacity in our domestic Brazil operations. Decreases in RASK reflect a decrease of 8.1% in consolidated yields, resulting from the slowdown in economic activity in the region, the depreciation of local currencies, a more competitive environment, and the pass-through of the savings in fuel costs to customers.
Cargo revenues decreased by 16.5%, to US$1,110.6 million in 2016 from US$1,329.4 million in 2015, as a result of a decrease of 5.3% in capacity (ATK) and a decrease of 11.7%1.6% in unit revenues (“RATK”). Capacity decreased in our cargo operations mainly as a resultCargo yields increased 1.2%, while load factor reached 55.1%, an improvement of a reduced freighter operation. Decreases0.2 points compared to 2017. Increases in RATK reflectreflected an improvement in market conditions in Brazil, especially during the still challenging cargo scenario in South America and in particular the weaknessfirst half of the imports into the region, mainly to Brazilyear, while import markets from North America and Europe which has affected our cargoto Brazil weakened in the second half of 2018, pressuring yields which decreased by 8.5% in 2016 as comparedand traffic to 2015.the region.
Cost of Sales
Cost of sales decreasedincreased by 8.8%6.8% to US$6,967.07,883.4 million for the year ended December 31, 20162018 (from US$7,636.77,279.3 million in 2015)2017), mainly due to lowerhigher aircraft fuel expenses during the year and the positive impact of the depreciation of local currencies as well as our ongoing cost reduction program.expenses. As a percentage of total operating revenues, cost of sales decreasedincreased from 78.4%75.7% in 20152017 to 77.5%78.6% in 2016.2018.
The table below presents cost of sales information for the fiscal year ended December 31, 20162018 and 2015.2017.
| | | Year Ended December 31, | | | Year Ended December 31, | |
| | | 2016 | | 2015 | | 2016 | | 2015 | | 2016/2015
% change | | | 2018 | | | 2017 | | | 2018 | | | 2017 | | | | |
| | | (in US$ millions, except
as otherwise stated) | | As a percentage of total
operating revenues | | | | | | (in US$ millions, except
as otherwise stated) | | | As a percentage of total
operating revenues | | | 2018/2017
% change | |
| Revenues | | | 8,988.3 | | | | 9,740.0 | | | | 100.0 | % | | | 100.0 | % | | | (7.8 | )% | | | 9,895.5 | | | | 9,613.9 | | | | 100.0 | % | | | 100.0 | % | | | 2.9 | % |
| Cost of sales | | | (6,967.0 | ) | | | (7,636.7 | ) | | | (77.5 | )% | | | (78.4 | )% | | | (8.8 | )% | | | (7,773.4 | ) | | | (7,279.3 | ) | | | (78.6 | )% | | | (75.7 | )% | | | 6.8 | % |
| | | | | | | | | | | | | | | | | | | | | | |
| Aircraft Fuel | | | (2,056.6 | ) | | | (2,651.1 | ) | | | (22.9 | )% | | | (27.2 | )% | | | (22.4 | )% | | | (2,983.0 | ) | | | (2,318.8 | ) | | | (30.1 | )% | | | (24.1 | )% | | | 28.6 | % |
| Wages and Benefits | | | (1,479.5 | ) | | | (1,553.8 | ) | | | (16.5 | )% | | | (16.0 | )% | | | (4.8 | )% | | | (1,442.2 | ) | | | (1,545.6 | ) | | | (14.6 | )% | | | (16.1 | )% | | | (6.7 | )% |
| Other Rental and Landing Fees | | | (1,077.4 | ) | | | (1,109.8 | ) | | | (12.0 | )% | | | (11.4 | )% | | | (2.9 | )% | | | (1,206.9 | ) | | | (1,233.6 | ) | | | (12.2 | )% | | | (12.8 | )% | | | (2.2 | )% |
| Depreciation and Amortization | | | (960.3 | ) | | | (934.4 | ) | | | (10.7 | )% | | | (9.6 | )% | | | 2.8 | % | | | (1,372.6 | ) | | | (1,377.1 | ) | | | (13.9 | )% | | | (14.3 | )% | | | (0.3 | )% |
| Aircraft Rentals | | | (569.0 | ) | | | (525.1 | ) | | | (6.3 | )% | | | (5.4 | )% | | | 8.3 | % | |
| Aircraft Maintenance | | | (366.2 | ) | | | (437.2 | ) | | | (4.1 | )% | | | (4.5 | )% | | | (16.3 | )% | | | (366.6 | ) | | | (422.9 | ) | | | (3.7 | )% | | | (4.4 | )% | | | (13.3 | )% |
| Passenger Services | | | (286.6 | ) | | | (295.4 | ) | | | (3.2 | )% | | | (3.0 | )% | | | (3.0 | )% | | | (280.3 | ) | | | (288.7 | ) | | | (2.8 | )% | | | (3.0 | )% | | | (2.9 | )% |
| Other Costs of Sales | | | (171.4 | ) | | | (129.9 | ) | | | (2.8 | )% | | | (1.3 | )% | | | 49.8 | % | | | (121.8 | ) | | | (92.5 | ) | | | (1.2 | )% | | | (1.0 | )% | | | 31.6 | % |
The decreaseincrease in our cost of sales was driven by lowerhigher aircraft fuel expenses, which decreasedincreased by 22.4%28.6% to US$2,056.62,983.0 million in 20162018 as a result of a 16.6% decrease25.1% increase in the full year average fuel price (excluding hedge).hedging expenses and gains/losses) and a 4.2% increase in the gallons of fuel consumed. LATAM recognized a net lossgain of US$48.029.7 million in fuel hedging in 2016,2018, compared to a fuel hedge lossgain of US$239.415.1 million in 2015.2017. In 2016,2018, the Company also recognized a US$40.318.3 million hedge lossgain related to foreign currency contracts, which were recognized in the fuel cost line, compared to a US$19.2 gain9.7 million loss in 2017.
Wages and benefits decreased by 6.7% to US$1,442.5 million in 2015.
Depreciation and amortization increased2018 from US$1,545.6 million in 2017, explained by US$25.9 million, amounting to US$960.3 million, which represents an increase of 2.8% due to the increase3.9% decline in the number of owned aircraft, partially offset byaverage headcount as well as the positive impact of the 4.5% depreciation of local currencies during the Brazilian real.year.
Other rental and landing fees decreased by 2.9%2.2% to US$1,077.41,206.9 million in 20162018 from U$1,109.81,233.6 million in 2015,2017, due to a reduction of freighter operations and the lower availability of the fleet Boeing 787 due to engine maintenance delays.
Depreciation and amortization decreased by 0.3%, amounting to US$1,372.6 million in 2018, mainly due to a decline in the rentaldepreciation of passenger and cargo capacity from third parties as well as lower handling costs.the Brazilian real.
Aircraft maintenance expenses decreased by 16.3%13.3%, from US$437.2422.9 million in 20152017 to US$366.2366.6 million in 2016,2018, mainly due to cost efficiencies related withfewer redelivery costs, as the renewal of our fleet and lower maintenance expenses related to the redelivery of aircraft.
Aircraft rentals increased by 8.3% to US$569.0 million in 2016 from US$525.1 million in 2015 as a result of the incorporation of larger and more modernCompany returned less aircraft under operating leases (i.e. Boeing 787s and Airbus A350s), whereas returned aircraft have mainly been older models (i.e. Airbus A319s and A330s).during 2018.
Passenger service expenses decreased by 3.0%2.9%, to US$286.6280.3 million in 20162018 compared to US$295.4288.7 million in 2015,2017, due mainly to a decreaselower catering costs related to the implementation of 1.3%our buy-on-board system in the numberdomestic flights, generating savings of passengers transported, as well as the decrease in on board services expenses, offset in part by an increase in passenger compensation.US$14.2 million.
As a result of the above, gross margin (defined as operating revenue minus cost of sales) decreased by 3.9%9.1% from US$2,103.32,334.6 million in 20152017 to US$2,021.32,122.0 million in 2016.2018.
Other Consolidated Results
Other operating income increaseddecreased in 20162018 by 39.6%14.0%, from US$385.8549.8 million in 20152017 to US$538.7472.8 million in 2016,2018, mainly due to a US$80.1 million gains derivedthe adoption of IFRS15, lower revenues from Multiplus driven by the devaluation of the Brazilean real, and lower revenues from aircraft sales and leaseback transaction (resulting insubleases to third parties. Please see “Recently Issed Acounting Pronouncement” for an explanation of the impact of the adoption of IFRS15 on our operating lease) as well as a US$41.8 million increase in revenues from freighter aircraft leases and sales of fixed assets.results.
Distribution costs decreased by 4.6%11.7% from US$783.3696.7 million in 20152017 to US$747.4615.2 million in 2016,2018, mainly as a result of lower commissions to agents (which decreased by 11.1%, from US$302.8 million to US$269.3 million), in both the passenger and cargo businesses, representing a greater percentage decline than the 7.7% decline in passenger and cargo revenues.businesses.
Administrative expenses decreased by 0.6%22.7% from US$878.0952.8 million in 20152017 to US$873.0736.3 million in 2016,2018, mainly due to a decrease of 4.8% in wages3.9% headcount reduction and benefits (as a result of a 6.2% decline in average headcount), as well as the positive impact of the depreciation of certain local currencies during the year, especially the 14.5% of the Brazilian Real and the 69.6% of the Argentinean Peso, on wages denominated in those currencies.currencies, partially offset by the annual increase in unit salaries due to inflation adjustments.
Other operating expenses increaseddecreased by 15.4%2.5% from US$324.0365.5 million in 20152017 to US$373.7356.3 million in 2016, driven by higher costs associated with fleet sales and redeliveries, and due to a lower cost in 20152018 as a result of negotiations with third parties relating to our passenger service system.the Company’s ongoing efficiency initiatives.
Financial income was essentially unchangeddecreased by 32.3% to US$74.953.3 million in the year ended December 31, 20162018 compared with US$75.178.6 million in 2015).2017, as a result of lower interest rates in Brazil and the depreciation of the Brazilian Real.
Financial costs increaseddecreased by 0.7%6.9% to US$416.3539.1 million in 20162018 from US$413.4579.2 million in 2015,2017, mainly due to base interest rate increases on floating ratea reduction in our gross debt.
Exchange rate differences increasedForeign exchange result decreased US$10.3 million to a gain of US$121.7 million in 2016 from anet loss of US$467.938.1 million in 2015,2018, mainly resulting fromas a result of the 16.5% appreciationdevaluation of 17.2% of the Brazilian real between December 31, 2015Real and December 31, 2016.102.3% of the Argentinean Peso.
Income tax expense for 2016 amounteddecreased by 53.5% to US$163.273.9 million for 2018, as compared to an income tax benefit of US$178.4158.9 million in 2015.2017. This variationdecrease is explained mainly by improved pre-tax results in 2016 (US$273.9 million gain) compared with 2015 (US$357.1 million loss) resulting in increaseddifferent income distribution by subsidiary and by accumulated deferred tax chargesliabilities due to the dissolution of US$196 million;some subsidiaries originally used for the non-recognitionacquisition of deferred taxes related to tax losses in Brazil fromaircraft that were sold during the fourth quarter of 2015 (non-recognition of US$90.4 million in 2016 vs US$16.9 million in 2015); the reversal in 2016 of tax provisions in Brazil in the amount of US$61.2 million in 2015; and other items of US$10 million. For more information, see Note 18 to our audited consolidated financial statements.year.
Net Income
Out of Period Adjustments
The Company recorded out of period adjustments resulting in an aggregate net decrease of US$18.2 million to “NetNet income (loss) for the period” for the year ended December 31, 2016. These adjustments include2018 equaled US$341.8 million, representing an increase of US$187.4 million from a lossnet income of US$39.5154.4 million resulting from an account reconciliation process initiated after TAM S.A. and its subsidiaries completed the implementation of the SAP system. A further US$11.0 million decrease reflects adjustments related to foreign exchange differences, also relatingin 2017. Net income attributable to the Company’s subsidiariesparent company’s shareholders was US$309.8 million in Brazil. The balance2018, representing an increase of US$32.3154.5 million includes mainly the adjustmentcompared with a net income of unclaimed fees for expired tickets for the Company and its affiliates outside Brazil. Management of TAM S.A. has concluded that the out of period adjustments that have been identified are material to the 2015 financial statements of TAM S.A., which should therefore require a restatement of TAM’s financial statements. However, LATAM has evaluated the impact of all out of period adjustments, both individually andUS$155.3 million in the aggregate, and concluded that due to their relative size and to qualitative factors they are not material to the annual consolidated financial statements of LATAM for the year ended December 31, 2016, or to any previously reported consolidated financial statements, therefore no restatement or revision is necessary.2017.
U.S. Dollar Presentation and Price-Level Adjustments
General
Foreign currency transactions
| (a) | Presentation and functional currencies |
The items included in the financial statements of each of the entities of LATAM Airlines Group S.A. and Subsidiaries are valued using the currency of the main economic environment in which eachthe entity operates (the “functional currency”)functional currency). The functional currency of LATAM Airlines Group S.A. is the U.S.United States dollar which is also the presentation currency of presentation of the audited consolidated financial statements of LATAM Airlines Group S.A. and its affiliates.
Subsidiaries.
| (b) | Transactions and balances |
Foreign currency transactions are translated to the functional currency using the exchange rates on the transaction dates. Foreign currency gains and losses resulting from the liquidation of these transactions and from the translation, at the closing exchange rates, of the monetary assets and liabilities denominated in foreign currency are shown in the consolidated statement of income.income by function except when deferred in Other comprehensive income as qualifying cash flow hedges.
| (c) | Adjustment due to hyperinflation |
After July 1, 2018, the Argentine economy was considered, for purposes of IFRS, hyperinflationary. The financial statements of the subsidiaries whose functional currency is the Argentine Peso have been restated.
The non-monetary items of the statement of financial position as well as the income statement, comprehensive incomes and cash flows of the Argentine's entities, whose functional currency corresponds to a hyperinflationary economy, are adjusted for inflation and re-expressed in accordance with the variation of the consumer price index ("CPI"), at each presentation date of its financial statements. The re-expression of non-monetary items is made from the date of initial recognition in the statements of financial position and considering that the financial statements are prepared under the historical cost criterion.
Net losses or gains arising from the re-expression of non-monetary items and income and costs are recognized in the consolidated income statement under "Result of indexation units".
Net gains and losses on the re-expression of opening balances due to the initial application of IAS 29 are recognized in the consolidated retained earnings.
Re-expression due to hyperinflation will be recorded until the period in which the economy of the entity ceases to be considered as a hyperinflationary economy, at that time, the adjustments made by hyperinflation will be part of the cost of non-monetary assets and liabilities.
The comparative amounts in the Consolidated financial statements of the Company are presented in a stable currency and are not adjusted for subsequent changes in the price level or exchange rates.
The results and the financial positionsituation of all the LATAMGroup's entities, (none of which operated in a hyper-inflationary economy) that have awhose functional currency other thanis different from the presentation currency of the consolidated financial statements, of LATAM Airlines Group S.A., which does not correspond to the currency of presentationa hyperinflationary economy, are translated toconverted into the currency of presentation as follows:
| (i) | The assetsAssets and liabilities of each consolidated statement of financial position are translated at the closing exchange rate on the date of the consolidated statement of financial position;position date; |
| (ii) | The revenues and expenses of each resultsincome statement account are translated at monthly average rates;the exchange rates prevailing on the transaction dates; and |
| (iii) | All the resultingresultant exchange differences by conversion are shown as a separate component in net equity.other comprehensive income. |
For consolidation purposes, exchange differences arising from the translation of a net investment in foreign entities (or in local entities with a functional currency different to that of the parent), and of loans and other foreign currency instruments designated as hedges for such investments, are recorded within net equity. When the investment is sold, these exchange differences are shown in the consolidated statement of income as part of the loss or gain on the sale.
Adjustments to the goodwill and fair value arising from the acquisition of a foreign entity are treated as assets and liabilities of the foreign entity and are translated at the period-end exchange rate.
Effects of Exchange Rate Fluctuations
Our functional currency is the U.S. dollar in terms of the pricing of our products, composition of our balance sheet and effects on our results of operations. Most of our revenues (58% in 2017)57% are in U.S. dollars or in prices pegged to the U.S. dollar and a substantial portion of our expenses (58% in 2017)63% is denominated in dollars or pegged to the U.S. dollar, particularly fuel costs, landing and over-flight fees, aircraft rentals, insurance and aircraft components and supplies.
A substantial majority of our liabilities are denominated in U.S. dollars (71.1%(74.6% as of December 31, 2017)2019), including bank loans, certain air traffic liabilities, and certain amounts payable to our suppliers. As ofDecember 31, 2017, 60.5%2019, 66.0% of our assets were denominated in U.S. dollars, principally aircraft, cash and cash equivalents, accounts receivable and other fixed assets. Substantially all of our commitments, including operating lease and purchase commitments for aircraft, are denominated in U.S. dollars.
Balance sheet imbalance denominated in currencies other than the functional currency of each specific entity creates a foreign exchange rate exposure that impacts our foreign exchange losses and gains due to exchange rate fluctuations. We recorded net foreign exchange losses of US$121.738.1 million in 20162018 and net foreign exchange gainslosses of US$18.732.6 million gain in 2017,2019, which are set forth in our consolidated statement of income under “Foreign Exchange gains/(losses).” For more information, see Notes 2.3 and 29 to our audited consolidated financial statements.
Critical Accounting Policies
The Company has used estimates to value and record certain assets, liabilities, revenue, expenditure, and commitments. These estimates principally relate to:
| (a) | Evaluation of possible losses throughdue to impairment of goodwill and intangible assets with an indefinite useful life. |
| (b) | Useful life, residual value, and impairment of property, plant, and equipment |
| (c) | Recoverability of deferred tax assets |
| (d) | Air tickets sold that arewill not actuallybe used. |
| (e) | Valuation of miles and points awarded to holders of loyalty points and kilometers granted to loyalty program members,programs, pending usage.use. |
| (f) | Required provisions and their valuation when required |
| (h) | Investment in subsidiary (TAM) |
Please see Note 4 – Accounting estimates and judgments – to our audited consolidated financial statements for a full description of our critical accounting policies.
Recently Issued Accounting Pronouncements
a) Accounting pronouncements with implementation effective from January 1, 2019
(a) Accounting pronouncements with implementation effective from January 1, 2016: | | Date of issue | | Mandatory
Application: Annual
periods beginning
on or after |
| | | | | | |
(i) Standards and amendments | | | | | | |
| | | | | | |
Amendment IAS 7: Statement of Cash Flows. | | Disclosure Initiative | | January 2016 | | January 1, 2017 |
| | | | | | |
Amendment to IFRS 12: Disclosure of interests in other entities. | | Investment Entities: Applying the consolidation exception | | January 2016 | | January 1, 2017 |
| | | | | | |
(ii) Improvements | | | | | | |
| | | | | | |
Improvements to International Financial Reporting Standards (2014-2016 cycle): | | | | December 2016 | | January 1, 2017 |
| | | | | | |
IFRS 12 Disclosure of interests in other entities | | Clarification of the scope of the Standard. | | | | |
The application of standards, amendments, interpretations and improvements had no material impact on the consolidated financial statements of the Company.
(b) Accounting pronouncements not yet in force for financial years beginning on January 1, 2016 and for which early adoption has not been effected : | | Date of issue | | Mandatory
Application: Annual
periods beginning on
or afterEffective Date: |
| | | | | |
| (i) Standards and amendments | | | | | | |
| | | | | | |
Amendment to IAS 7: Statement of Cash Flows. | | Disclosure initiative | | January 2016 | | January 1, 2017 |
| | | | | | |
Amendment to IAS 12: Income Taxes. | | Recognition of Deferred Tax Assets for Unrealized Losses | | January 2016 | | January 1, 2017 |
| | | | | | |
IFRS 9: Financial instruments. | | Disclosure initiative | | December 200916: Leases. | | January 1, 20182016 |
| | 01/01/2019 |
| | | | | |
Amendment to IFRS 9: Financial instruments.instruments | | Novation of derivatives and continuation of hedge accountingOctober 2017 | | November 2013 | | January 1, 2018 |
| | | | | | |
IFRS 15: Revenue from contracts with customers(1). | | Implementation | | May 2014 | | January 1, 2018 |
| | | | | | |
Amendment to IFRS 15: Revenue from contracts with customers. | | Clarifications | | April 2016 | | January 1, 2018 |
| | | | | | |
Amendment to IFRS 2: Share-based payments | | Classification and measurement of share based payment transactions | | June 2016 | | January 1, 2018 |
| | | | | | |
Amendment to IFRS 4: Insurance contracts. | | Pendiente Applying IFRS 9 Financial Instruments with IFRS 4 Insurance Contracts | | September 2016 | | January 1, 2018 |
| | | | | | |
Amendment to IFRS 40: Investment property | | Transfers of investment property | | December 2016 | | January 1, 2018 |
| | | | | | |
IFRS 16: Leases(2). | | Disclosure initiative | | January 2016 | | January 1, 01/01/2019 |
| | | | | | |
Amendment to IFRS 9: Financial Instruments | | Prepayment Features with Negative Compensation | | October 2017
| | January 1, 2019 |
| | | | | | |
| Amendment to IAS 28: Investments in associates and joint ventures | | Long-term interests in associates and joint ventures | | October 2017 | | January 1, 01/01/2019 |
| | | | | | |
IFRS 17: Insurance contracts | | Disclosure initiative | | May 2017 | | January 1, 2021 |
| | | | | | |
Amendment to IFRS 10: Consolidated financial statements and IAS 28 Investments in associates and joint ventures.19: Benefits to employees | | Sale or contribution of assets between an Investor and its associate or joint ventureFebruary 2018 | | September 2014 | | To be determined |
(b) Accounting pronouncements not yet in force for financial years beginning on January 1, 2016 and for which early adoption has not been effected : | | Date of issue | | Mandatory
Application: Annual
periods beginning
on or after01/01/2019 |
| | | | | |
| (ii) Improvements | | | | |
| | | | | |
Improvements to International Financial Reporting Standards (2012-2014 cycle): | | December 2016 | | |
| | | | |
(cycle 2015-2017) IFRS 1: First-time adoption of international financial reporting standards. | | Deletion of short-term exemptions3: Business combination; IAS 12: Income tax; IFRS 11: Joint agreements and IAS 23 Costs for first-time adopters | | | | January 1, 2018 |
| | | | | | |
IAS 28 investments in associates and joint ventures. | | Measuring an associate or joint venture at fair value | | | | January 1, 2018 |
| | | | | | |
Improvements to International Financial Reporting Standards (2015-2017 cycle):loans. | | December 2017 | | January 1, 01/01/2019 |
| | | | |
IFRS 3: Business combinations | | Previously held interest in a joint operation. | | | | |
| | | | | | |
IAS 12: Income tax | | Income tax consequences of payments on financial instruments classified as equity | | | | |
| | | | | | |
IFRS 11: Joint arrangements | | Previously held interest in a joint operation. | | | | |
| | | | | | |
IAS 23: Borrowing costs | | Borrowing costs eligible for capitalisation | | | | |
| | | | | | |
| (iii) Interpretations | | | | | | |
| | | | | | |
IFRIC 22: Foreign currency transactions and advance consideration | | Disclosure initiative | | December 2016 | | January 1, 2018 |
| | | | | | |
| IFRIC 23: Uncertain tax positions | | Uncertainty over Income Tax TreatmentsJune 2017 | | June01/01/2019 |
The application of these accounting pronouncements as of January 1, 2019, had no significant effects on the consolidated financial statements of the Company; with the exception of those originated by the application of IFRS 16: Leases described below.
During the year, the Company has recognized the changes, in the consolidated financial statements, as a result of the adoption of IFRS 16 retrospectively; restating the comparative figures, in accordance with the provisions of IAS 8 Accounting policies, changes in accounting estimates and errors.
The Company has modified the initial balances corresponding to January 1, 2018. The disclosures corresponding to the initial application of IFRS 9 and IFRS 15, which also originated changes, have been maintained in the consolidated financial statements.
The impacts of the adoption of IFRS 9 Financial Instruments, IFRS 15 Revenue from contracts with customers and IFRS 16 Leases are as follows:
Consolidated statement of financial position (extract)
a) As of January 1, 2017:
| | | | | As of | | | Adoption | | | As of | |
| | | | | December 31 | | | impact | | | January 1, | |
| | | Note | | 2016 | | | IFRS 16 | | | 2017 | |
| | | | | ThUS$ | | | ThUS$ | | | ThUS$ | |
| | | | | | | | | | | Restated | |
| | | | | | | | | | | | |
| Current assets | | | | | | | | | | | |
| Other non-financial assets, current | | 12 | | | 212,242 | | | | (25,567 | )(9) | | | 186,675 | |
| | | | | | | | | | | | | | | |
| Non-current assets | | | | | | | | | | | | | | |
| Properties, plants and equipment | | 17 | | | 10,498,149 | | | | 2,931,101 | (9) | | | 13,429,250 | |
| | | | | | | | | | | | | | | |
| Current liabilities | | | | | | | | | | | | | | |
| Other current financial liabilities | | 7 - 19 | | | 1,839,528 | | | | 311,307 | (11) | | | 2,150,835 | |
| | | | | | | | | | | | | | | |
| Non-current liabilities | | | | | | | | | | | | | | |
| Other non current financial liabilities | | 7-19 | | | 6,796,952 | | | | 2,881,149 | (11) | | | 9,678,101 | |
| Accounts payable commercial and other | | 7 - 24 | | | 359,391 | | | | 20,065 | (9) | | | 379,456 | |
| Deferred tax liability | | 18 | | | 915,759 | | | | (61,343 | )(10) | | | 854,416 | |
| Equity | | | | | | | | | | | | | | |
| Equity attributable to the owners of the parent | | | | | | | | | | | | | | |
| Accumulated earnings | | 25 | | | 366,404 | | | | (460,173 | )(12) | | | (93,769 | ) |
| Other reserves | | 25 | | | 580,870 | | | | 215,299 | (12) | | | 796,169 | |
| Non-controlling interest | | 14 | | | 88,644 | | | | (771 | )(12) | | | 87,873 | |
b) As of January 1, 2018:
| | | | | As of | | | Adoption | | | As of | | | Adoption | | | As of | |
| | | | | December 31, | | | impact | | | January 1 | | | impact | | | January 1, | |
| | | Note | | 2017 | | | IFRS 9 | | | IFRS 15 | | | 2018 | | | IFRS 16 | | | 2018 | |
| | | | | ThUS$ | | | THUS$ | | | ThUS$ | | | ThUS$ | | | ThUS$ | | | ThUS$ | |
| | | | | | | | | | | | | | | | | | | | Restated | |
| Current assets | | | | | | | | | | | | | | | | | | | | |
| Other non-financial assets, current | | 12 | | | 221,188 | | | | - | | | | 54,361 | (4) | | | 275,549 | | | | (30,771 | )(9) | | | 244,778 | |
| Trade debtors and other accounts receivable, current | | 7 - 8 | | | 1,214,050 | | | | (11,105 | )(1) | | | - | | | | 1,202,945 | | | | - | | | | 1,202,945 | |
| | | | | | | | | | | | | | | | | | | | | | | | | | | |
| Non-current assets | | | | | | | | | | | | | | | | | | | | | | | | | | |
| Other non-financial assets, non current | | 12 | | | 220,807 | | | | - | | | | - | | | | 220,807 | | | | (8,604 | )(9) | | | 212,203 | |
| Properties, plants and equipment | | 17 | | | 10,065,335 | | | | - | | | | - | | | | 10,065,335 | | | | 2,865,317 | (9) | | | 12,930,652 | |
| Deferred tax assets | | 18 | | | 364,021 | | | | 89 | (2) | | | 6,005 | (7) | | | 370,115 | | | | 449 | (10) | | | 370,564 | |
| | | | | | | | | | | | | | | | | | | | | | | | | | | |
| Current liabilities | | | | | | | | | | | | | | | | | | | | | | | | | | |
| Other current financial liabilities | | 7 - 19 | | | 1,300,949 | | | | - | | | | - | | | | 1,300,949 | | | | 319,030 | (11) | | | 1,619,979 | |
| Trade and other accounts payables | | 7 - 20 | | | 1,695,202 | | | | - | | | | (22,192 | )(5) | | | 1,673,010 | | | | (4,398 | )(9) | | | 1,668,612 | |
| Other non-financial liabilities, current | | 22 | | | 2,823,963 | | | | - | | | | 77,640 | (6) | | | 2,901,603 | | | | - | | | | 2,901,603 | |
| | | | | | | | | | | | | | | | | | | | | | | | | | | |
| Non-current liabilities | | | | | | | | | | | | | | | | | | | | | | | | | | |
| Other non current financial liabilities | | 7 - 19 | | | 6,605,508 | | | | - | | | | - | | | | 6,605,508 | | | | 2,827,942 | (11) | | | 9,433,450 | |
| Accounts payable commercial and other | | 7 - 24 | | | 498,832 | | | | - | | | | - | | | | 498,832 | | | | 60,611 | (9) | | | 559,443 | |
| Deferred tax liability | | 18 | | | 949,697 | | | | (1,021 | )(2) | | | 4,472 | (5) | | | 953,148 | | | | (75,400 | )(10) | | | 877,748 | |
| | | | | | | | | | | | | | | | | | | | | | | | | | | |
| Equity | | | | | | | | | | | | | | | | | | | | | | | | | | |
| Equity attributable to the owners of the Accumulated earnings | | 25 | | | 475,118 | | | | (9,995 | )(3) | | | 446 | (8) | | | 465,569 | | | | (506,581 | )(12) | | | (41,012 | ) |
| Other reserves | | 25 | | | 554,884 | | | | - | | | | - | | | | 554,884 | | | | 205,877 | (12) | | | 760,761 | |
| Non-controlling interest | | 14 | | | 91,147 | | | | - | | | | - | | | | 91,147 | | | | (690 | )(12) | | | 90,457 | |
c) As of December 31, 2018:
| | | | | As of | | | Adoption | | | As of | |
| | | | | December 31, | | | impact | | | December 31, | |
| | | Note | | 2018 | | | IFRS 16 | | | 2018 | |
| | | | | ThUS$ | | | ThUS$ | | | ThUS$ | |
| | | | | | | | | | | Restated | |
| Current assets | | | | | | | | | | | |
| Other non-financial assets, current | | 12 | | | 320,977 | | | | (30,501 | )(9) | | | 290,476 | |
| | | | | | | | | | | | | | | |
| Non-current assets | | | | | | | | | | | | | | |
| Other non-financial assets, non current | | 12 | | | 233,741 | | | | (6,200 | )(9) | | | 227,541 | |
| Properties, plants and equipment | | 17 | | | 9,953,365 | | | | 2,548,444 | (9) | | | 12,501,809 | |
| Deferred tax assets | | 18 | | | 273,328 | | | | 201 | (10) | | | 273,529 | |
| | | | | | | | | | | | | | | |
| Current liabilities | | | | | | | | | | | | | | |
| Other current financial liabilities | | 7 - 19 | | | 1,430,789 | | | | 363,497 | (11) | | | 1,794,286 | |
| | | | | | | | | | | | | | | |
| Non-current liabilities | | | | | | | | | | | | | | |
| Other non current financial liabilities | | 7 - 19 | | | 5,864,910 | | | | 2,494,552 | (11) | | | 8,359,462 | |
| Accounts payable commercial and other | | 7 - 24 | | | 483,656 | | | | 45,621 | (9) | | | 529,277 | |
| Deferred tax liability | | 18 | | | 872,121 | | | | (85,550 | )(10) | | | 786,571 | |
| | | | | | | | | | | | | | | |
| Equity | | | | | | | | | | | | | | |
| Equity attributable to the owners of the Accumulated earnings | | 25 | | | 597,676 | | | | (378,705 | )(12) | | | 218,971 | |
| Other reserves | | 25 | | | (76,926 | ) | | | 72,561 | (12) | | | (4,365 | ) |
| Non-controlling interest | | 14 | | | 79,940 | | | | (32 | )(12) | | | 79,908 | |
- Application of standards as of January 1, 2018.
- Effects of adopting IFRS 9
| (1) | Expected credit losses: The Company modified the calculation of the impairment provision to comply with the expected credit loss model, established in IFRS 9 Financial Instruments, which replaces the current loss impairment model incurred. To calculate percentage of credit losses, a risk matrix was used, grouping the portfolio, according to similar characteristics of risk and maturity. This change resulted in the recognition of an increase in the provision for impairment losses of US$11.1 million. |
This standard also includes requirements related to the classification and measurement of financial assets and liabilities and an expected credit loss model that replaces the current loss impairment model incurred.
As of January 1, 2018, the calculation of the impairment losses provision is as follows:
| | | Portfolio maturity | |
| | | | | | | | | Up to | | | Up to | | | More than | | | | |
| | | | | | Up to | | | 91 to | | | 181 to | | | 360 | | | | |
| | | Up to date | | | 90 days | | | 180 days | | | 360 days | | | days | | | Total | |
| | | ThUS$ | | | ThUS$ | | | ThUS$ | | | ThUS$ | | | ThUS$ | | | ThUS$ | |
| Expected loss rate | | | 1 | % | | | 21 | % | | | 46 | % | | | 67 | % | | | 94 | % | | | 8 | % |
| Gross book value | | | 1,046,909 | | | | 36,241 | | | | 12,001 | | | | 14,623 | | | | 66,022 | | | | 1,175,796 | |
| Impairment provision | | | (13,570 | ) | | | (7,774 | ) | | | (5,499 | ) | | | (9,803 | ) | | | (61,787 | ) | | | (98,433 | ) |
| (2) | Deferred tax adjustments originated by the application of IFRS 9. |
| (3) | Net effect on accumulated results of the adjustments indicated above. |
In addition to the impacts on the consolidated statement of financial position, the application of IFRS 9: Financial Instruments requires the classification of financial instruments according to the business model, to determine the form of measurement of financial instruments, after their initial recognition.
The Company analyzed the business models and classified its financial assets and liabilities according to the following:
| | | Classification IAS 39 | | | Classification IFRS 9 | |
| | | | | | | | | | | | Initial | | | | | | | | | | |
| | | Loans | | | Hedge | | | Held | | | as fair value | | | | | | At fair value | | | | |
| | | and | | | and | | | for | | | through profit | | | Cost | | | with changes | | | | |
| Assets | | receivables | | | derivatives | | | trading | | | and loss | | | amortized | | | in results | | | Total | |
| | | ThUS$ | | | ThUS$ | | | ThUS$ | | | ThUS$ | | | ThUS$ | | | ThUS$ | | | ThUS$ | |
| | | | | | | | | | | | | | | | | | | | | | |
| Balance as of December 31, 2017 | | | 2,446,864 | | | | 62,867 | | | | 1,915 | | | | 501,890 | | | | - | | | | - | | | | 3,013,536 | |
| Cash and cash equivalents | | | (1,112,346 | ) | | | - | | | | - | | | | (29,658 | ) | | | 1,112,346 | | | | 29,658 | | | | - | |
| Other financial assets, current | | | (23,918 | ) | | | - | | | | (1,421 | ) | | | (472,232 | ) | | | 23,918 | | | | 473,653 | | | | - | |
| Trade debtors and other accounts receivable, current | | | (1,214,050 | ) | | | - | | | | - | | | | - | | | | 1,214,050 | | | | - | | | | - | |
| Accounts receivable from entities related, current | | | (2,582 | ) | | | - | | | | - | | | | - | | | | 2,582 | | | | - | | | | - | |
| Other financial assets, non-current | | | (87,077 | ) | | | - | | | | (494 | ) | | | - | | | | 87,077 | | | | 494 | | | | - | |
| Accounts receivable, non-current | | | (6,891 | ) | | | - | | | | - | | | | - | | | | 6,891 | | | | - | | | | - | |
| Balance as of January 1, 2018 | | | - | | | | 62,867 | | | | - | | | | - | | | | 2,446,864 | | | | 503,805 | | | | 3,013,536 | |
| | | Classification IAS 39 | | | Classification IFRS 9 | | | | |
| | | Others | | | Held | | | | | | | |
| | | financial | | | hedge | | | Cost | | | | |
| Liabilities | | liabilities | | | derivatives | | | amortized | | | Total | |
| | | ThUS$ | | | ThUS$ | | | ThUS$ | | | ThUS$ | |
| | | | | | | | | | | | | |
| Balance as of December 31, 2017 | | | 10,086,434 | | | | 14,817 | | | | - | | | | 10,101,251 | |
| Other current financial liabilities | | | (1,288,749 | ) | | | - | | | | 1,288,749 | | | | - | |
| Trade accounts payable and other accounts payable, current | | | (1,695,202 | ) | | | - | | | | 1,695,202 | | | | - | |
| Accounts payable to related entities, current | | | (760 | ) | | | - | | | | 760 | | | | - | |
| Other financial liabilities, not current | | | (6,602,891 | ) | | | - | | | | 6,602,891 | | | | - | |
| Accounts payable, not current | | | (498,832 | ) | | | - | | | | 498,832 | | | | - | |
| Balance as of January 1, 2018 (*) | | | - | | | | 14,817 | | | | 10,086,434 | | | | 10,101,251 | |
(*) Balances as of January 1, 2018 do not contain the re-expression effects originated by IFRS 16.
- Effects of adopting IFRS 15
(4) Contract costs: The Company has capitalized the costs related to the revenues from air transport of passengers, corresponding to the commissions charged by the credit card administrators for US$22.0 million and the air ticket booking services through the GDSs for US$15.6 million. Additionally, there is a reclassification of commissions from travel agencies for US$16.8 million, these previously were presented, according IAS 18, net of the liability to fly in other non-financial liabilities.
(5) Contract liabilities: The Company has adjusted certain concepts that were recorded as obligations with suppliers and customers, which must now be treated as contract liabilities; therefore, they must be deferred until the benefit of the service have been rendered. These concepts are mainly related to ground transportation service for US$15.6 million and travelers checks (US$6.6 million).
(6) Performance Obligations: The Company analyzed the moment at which the performance obligations identified in the contracts with customers must be recognized in the consolidated result. During this analysis, some concepts were identified which must be deferred until the moment of service provision, mainly related to land transportation services, charges for modifications to the initial contract in the sale of tickets and redemption of some products associated with loyalty programs for US$60.8 million. Additionally, there is the reclassification detailed in numeral (4) for US$ 16.8 million.
(7) Deferred tax adjustments originated by the application of IFRS 15.
(8) Net effect on accumulated results of the adjustments indicated above.
Additionally, the Company concluded that, in the rendering of certain services, it acted as agent in the provision of these services, therefore some reclassifications were made in the consolidated income statement to reflect the corresponding commission.
- Effects of adopting IFRS 16
(9) Company recognized under Property, plant and equipment right of use assets for US$2,865.3 million as of January 1, 2018 and US$2,548.4 as of December 31, 2018, associated with contracts that meet the definition of lease (note 2.21 & 17).
The Company decreased other financial assets related to advance payments for leases for US$39.4 million as of January 1, 2018 and US$36.7 as of December 31, 2018, since with the application of the standard these amounts are considered in the initial measurement of the right of use of asset.
The Company increased the cost of restoration associated with the return of aircraft and engines for US$56.2 million as of January 1, 2018 and US$45.6 million as of December 31, 2018. With the application of the standard, the net present value of this cost was included in the right of use of asset and its counterpart in the line of accounts payable, current or non-current, depending on the return date of the aircraft or engines.
(10) Deferred taxes: adjustments originated by the application of IFRS 16.
(11) Lease liabilities: The Company recognized within the Other financial liabilities for lease for US$3,147.0 million as of January 1, 2018 and US$2,858.0 million as of December 31, 2018, associated with contracts that meet the definition of lease (note 2.21 & 19).
(12) The effect of the recognition of the leases under IFRS 16 generated a decrease in retained earnings of US$506.6 million as of January 1, 2018 (US$378.7 million as of December 31, 2018). The increase in Other reserves of US$205.9 million as of January 1, 2018 (decrease of US$72,5 million as of December 31, 2018), was caused by the Cumulative translation adjustment of those subsidiaries with functional currencies other than the US dollar. The application of IFRS 16 also affected non-controlling interests.
The effects of the changes recognized in the application of IFRS 15 and IFRS 16 as of December 31, 2017 are presented in the consolidated income statement:
| | | | | For the year ended december 31, 2017 | |
| Reconciliation income | | | | Adjustments for reconciliation | |
| | | | | Results | | | Adoption | | | Results | |
| | | | | under | | | impact | | | under | |
| | | Nota | | IAS 17 | | | IFRS16 | | | IFRS 16 | |
| | | | | ThUS$ | | | ThUS$ | | | ThUS$ | |
| | | | | Published | | | | | | Restated | |
| Revenue | | 26 | | | 9,613,907 | | | | - | | | | 9,613,907 | |
| Cost of sales | | | | | (7,441,849 | ) | | | 162,491 | | | | (7,279,358 | ) |
| Gross margin | | | | | 2,172,058 | | | | 162,491 | | | | 2,334,549 | |
| | | | | | | | | | | | | | | |
| Other income | | 28 | | | 549,889 | | | | - | | | | 549,889 | |
| Distribution costs | | | | | (699,600 | ) | | | 2,816 | | | | (696,784 | ) |
| Administrative expenses | | | | | (938,931 | ) | | | (13,837 | ) | | | (952,768 | ) |
| Other expenses | | | | | (368,883 | ) | | | 3,423 | | | | (365,460 | ) |
| Other gains (losses) | | | | | (7,754 | ) | | | - | | | | (7,754 | ) |
| Income from operation activities | | | | | 706,779 | | | | 154,893 | | | | 861,672 | |
| | | | | | | | | | | | | | | |
| Financial income | | | | | 78,695 | | | | - | | | | 78,695 | |
| Financial costs | | 27 | | | (393,286 | ) | | | (185,947 | ) | | | (579,233 | ) |
| Foreign exchange gains (losses) | | 29 | | | (18,718 | ) | | | (29,780 | ) | | | (48,498 | ) |
| Result of indexation units | | | | | 748 | | | | - | | | | 748 | |
| Income (loss) before taxes | | | | | 374,218 | | | | (60,834 | ) | | | 313,384 | |
| Income (loss) tax expense / benefit | | 18 | | | (173,504 | ) | | | 14,506 | | | | (158,998 | ) |
| NET INCOME (LOSS) FOR THE YEAR | | | | | 200,714 | | | | (46,328 | ) | | | 154,386 | |
| Income (loss) attributable to owners of the parent | | | | | 155,304 | | | | (46,408 | ) | | | 108,896 | |
| Income (loss) attributable to non- controlling interest | | 14 | | | 45,410 | | | | 80 | | | | 45,490 | |
| Net income (loss) for the year | | | | | 200,714 | | | | (46,328 | ) | | | 154,386 | |
The effects of the changes recognized in the application of IFRS 15 and IFRS 16 as of December 31, 2018 are presented in the consolidated income statement:
| | | | | For the year ended december 31, 2018 | |
| Reconciliation Revenue | | | | | | | Adjustments for reconciliation | | | | |
| | | | | Results | | | Adoption | | | Results | | | | | | Deferred
revenues | | | | | | Results | |
| | | | | under | | | impact | | | under | | | Contract | | | recognition | | | | | | under | |
| | | Nota | | IFRS 15 | | | IFRS16 | | | IFRS 15 | | | costs (4) | | | [(5), (6)] | | | Reclassifications | | | IAS 18 | |
| | | | | ThUS$ | | | ThUS$ | | | ThUS$ | | | ThUS$ | | | ThUS$ | | | ThUS$ | | | ThUS$ | |
| | | | | Published | | | | | | Restated | | | | | | | | | | | | | |
| | | | | | | | | | | IFRS 16 | | | | | | | | | | | | | |
| Revenue | | 26 | | | 9,895,456 | | | | - | | | | 9,895,456 | | | | - | | | | 48,561 | | | | 31,501 | | | | 9,975,518 | |
| Cost of sales | | | | | (7,962,843 | ) | | | 189,411 | | | | (7,773,432 | ) | | | - | | | | (34,986 | ) | | | - | | | | (7,808,418 | ) |
| Gross margin | | | | | 1,932,613 | | | | 189,411 | | | | 2,122,024 | | | | - | | | | 13,575 | | | | 31,501 | | | | 2,167,100 | |
| Other income | | 28 | | | 472,758 | | | | - | | | | 472,758 | | | | - | | | | - | | | | 42,563 | | | | 515,321 | |
| Distribution costs | | | | | (619,200 | ) | | | 3,986 | | | | (615,214 | ) | | | (43 | ) | | | - | | | | (20,003 | ) | | | (635,260 | ) |
| Administrative expenses | | | | | (721,270 | ) | | | (15,063 | ) | | | (736,333 | ) | | | (806 | ) | | | - | | | | (54,061 | ) | | | (791,200 | ) |
| Other expenses | | | | | (359,781 | ) | | | 3,531 | | | | (356,250 | ) | | | - | | | | - | | | | - | | | | (356,250 | ) |
| Other gains (losses) | | | | | 53,499 | | | | - | | | | 53,499 | | | | - | | | | - | | | | - | | | | 53,499 | |
| Income from operation activities | | | | | 758,619 | | | | 181,865 | | | | 940,484 | | | | (849 | ) | | | 13,575 | | | | - | | | | 953,210 | |
| Financial income | | | | | 53,253 | | | | - | | | | 53,253 | | | | - | | | | - | | | | - | | | | 53,253 | |
| Financial costs | | 27 | | | (356,269 | ) | | | (182,868 | ) | | | (539,137 | ) | | | - | | | | - | | | | - | | | | (539,137 | ) |
| Foreign exchange gains (losses) | | 29 | | | (157,709 | ) | | | 119,639 | | | | (38,070 | ) | | | - | | | | - | | | | - | | | | (38,070 | ) |
| Result of indexation units | | | | | (865 | ) | | | - | | | | (865 | ) | | | - | | | | - | | | | - | | | | (865 | ) |
| Income (loss) before taxes | | | | | 297,029 | | | | 118,636 | | | | 415,665 | | | | (849 | ) | | | 13,575 | | | | - | | | | 428,391 | |
| Income (loss) tax expense / benefit | | 18 | | | (83,782 | ) | | | 9,903 | | | | (73,879 | ) | | | (23 | ) | | | (1,030 | ) | | | - | | | | (74,932 | ) |
| NET INCOME (LOSS) FOR THE YEAR | | | | | 213,247 | | | | 128,539 | | | | 341,786 | | | | (872 | ) | | | 12,545 | | | | - | | | | 353,459 | |
| Income (loss) attributable to owners of the parent | | | | | 181,935 | | | | 127,876 | | | | 309,811 | | | | (872 | ) | | | 12,545 | | | | - | | | | 321,484 | |
| Income (loss) attributable to non- controlling interest | | 14 | | | 31,312 | | | | 663 | | | | 31,975 | | | | - | | | | - | | | | - | | | | 31,975 | |
| Net income (loss) for the period | | | | | 213,247 | | | | 128,539 | | | | 341,786 | | | | (872 | ) | | | 12,545 | | | | - | | | | 353,459 | |
In the income statement, with the implementation of the IFRS16 standard, restatements were made in the following lines:
| - | Cost of sale, distribution costs, administrative expenses: net effect of derecognized of rental cost and recognition of the depreciation of the right of use. |
| - | Financial Costs: interest expense corresponding to the lease liability. |
Impact recognized as a result of the adoption of IFRS 16 for the year ended December 31, 2017 and 2018 are presented in the consolidated statement of cash flows:
| | | For the year ended | | | Adoption | | | For the year ended | |
| | | December 31 | | | impact | | | December 31, | |
| | | 2017 | | | IFRS 16 | | | 2017 | |
| | | ThUS$ | | | ThUS$ | | | ThUS$ | |
| | | | | | | | | Restated | |
| | | | | | | | | | |
| Payments to suppliers for goods and services | | | (6,722,713 | ) | | | 520,082 | (1) | | | (6,202,631 | ) |
| Net cash flows from operating activities | | | (6,722,713 | ) | | | 520,082 | | | | (6,202,631 | ) |
| | | | | | | | | | | | | |
| Loans repayments | | | (1,829,191 | ) | | | (344,901 | )(2) | | | (2,174,092 | ) |
| Payments of finance lease liabilities | | | (344,901 | ) | | | 344,901 | (2) | | | - | |
| Payments of lease liabilities | | | - | | | | (338,179 | )(1) | | | (338,179 | ) |
| Interest paid | | | (389,724 | ) | | | (181,903 | )(1) | | | (571,627 | ) |
| Net cash flows (used in) financing activities | | | (2,563,816 | ) | | | (520,082 | ) | | | (3,083,898 | ) |
| | | For the year ended | | | Adoption | | | For the year ended | |
| | | December 31 | | | impact | | | December 31, | |
| | | 2018 | | | IFRS 16 | | | 2018 | |
| | | ThUS$ | | | ThUS$ | | | ThUS$ | |
| | | | | | | | | Restated | |
| | | | | | | | | | |
| Payments to suppliers for goods and services | | | (7,331,390 | ) | | | 556,387 | (1) | | | (6,775,003 | ) |
| Net cash flows from operating activities | | | (7,331,390 | ) | | | 556,387 | | | | (6,775,003 | ) |
| | | | | | | | | | | | | |
| Loans repayments | | | (1,045,662 | ) | | | (692,687 | )(2) | | | (1,738,349 | ) |
| Payments of finance lease liabilities | | | (692,687 | ) | | | 692,687 | (2) | | | - | |
| Payments of lease liabilities | | | - | | | | (373,439 | )(1) | | | (373,439 | ) |
| Interest paid | | | (357,355 | ) | | | (182,948 | )(1) | | | (540,303 | ) |
| Net cash flows (used in) financing activities | | | (2,095,704 | ) | | | (556,387 | ) | | | (2,652,091 | ) |
(1) Correspond to the reclassification of lease payments, principal to payment of lease liability and interest to interest paid.
(2) Correspond to the reclassification of leases payments previously classified as financial lease.
(b) Accounting pronouncements not yet in force for financial years beginning on January 1, 2019 and which has not been effected early adoption:
| | Date of issue | | Effective Date |
| | | | |
| (i) Standards and amendments | | | | |
| IFRS 17: Insurance contracts | | May 2017 | | January 1, 2021 |
| Amendment to IFRS 10: Consolidated financial statements and IAS 28 Investments in associates and joint ventures. | | September 2014 | | To be determined |
| Amendment to IFRS 3: Business combination | | October 2018 | | January 1, 2020 |
| Amendment to IAS 1: Presentation of financial statements and IAS 8 Accounting Policies, Changes in Accounting Estimates and Errors | | October 2018 | | January 1, 2020 |
| Amendment to IFRS 9: Financial instruments; IAS 39: Financial instruments: Recognition and measurement; Y IFRS 7: Financial instruments: Disclosures | | September 2019 | | January 1, 2020 |
The Company’s management believesof the Company estimates that the adoption of the standards, amendments and interpretationsInterpretations described above, butwill not yet effective would not have had a significant impact on the Company’s consolidated financial statements in the year of their first application, except for IFRS 15 and IFRS 16.
| (1) | IFRS 15 – “Revenue from Contracts with Customers” supersedes the standard for revenue recognition currently used by the Company, i.e. IAS 18 Revenue and IFRIC 13 Customer Loyalty Programmes. The core principle of IFRS 15 is that an entity recognizes revenue to depict the transfer of promised goods or services to customers in an amount that reflects the consideration to which the entity expects to be entitled in exchange for those goods or services. IFRS 15 supersedes the following standards and interpretations: IAS 11 Construction Contracts, IAS 18 Revenue, IFRIC 13 Customer Loyalty Programmes, IFRIC 15 Agreements for the Construction of Real Estate, IFRIC 18 Transfers of Assets from Customers; and SIC-31 Revenue - Barter Transactions Involving Advertising Services. |
The Company evaluated the possible adoption impacts that this new standard will have on our consolidated financial statements and has identified changes in: i) the recognition of the income associated with the fines for changes, which were previously recognized at the time of the sale and now will be considered as a modification of the initial transport contract and therefore the recognition must be deferred until the rendering of the service; ii) the moment of recognition of the income from the sale of some services or products, where the Company concluded that it acted as principal, and therefore the revenues must be deferred until the service is rendered; and iii) the presentation of the income associated with the sale of products, where the Company concluded that it acted as agent and therefore the income must be presented net of the associated costs.
| (2) | IFRS 16 – “Leases” adds important changes in the accounting for lessees by introducing a similar treatment to financial leases for all operating leases with a term of more than 12 months. This means, in general terms, that an asset should be recognized for the right to use the underlying leased assets and a liability representing its present value of payments associated with the agreement. Monthly lease payments will be replaced by asset depreciation and a financial cost on the income statement. |
We are currently evaluating the impact of the adoption of the leases recognition standard on our Consolidated Financial Statements. Currently, we believe that the adoption of this new standard will have a significant impact on the consolidated statement of financial position due to the recording of an asset for right of use and a liability, corresponding to the recordingstatements of the leases that are currently registered as operating leases.
LATAM Airlines Group S.A.Company in the application of its first adoption. At the close consolidated financial statements, the Company is analyzing the possible effects of the amendment issued in September 2019 to IFRS 9, IAS 39 and affiliates are still assessing these standards to determineIFRS 7 for the effect on their Financial Statements, covenants and other financial indicators.reform of interest rates of reference.
IFRS/Non-IFRS Reconciliation
We use “Cost per ASK” and “Cost per ASK excluding fuel price variations” in analyzing operating expenses on a per unit basis. “ASKs” (available seat kilometers) measures the number of seats of capacity available for the transportation of passengers multiplied by the kilometers flown.flown across our network. To obtain our unit costs, which are used by our management in the analysis of our results, we divide our total Operating Expenses by our total ASKs. The cost component is further adjusted to obtain “costs per ASK excluding fuel price variations,” in order to remove the impact of changes in fuel prices for the year. “Cost per ASK” and “Cost per ASK excluding fuel price variations” do not have a standardized meaning, and as such may not be comparable to similarly titled measures provided by other companies. These metrics should not be considered in isolation or as a substitute for operating expenses or as indicators of performance or cash flows or as a measure of liquidity.
| | | 2017 | | 2016 | | 2015 | | | 2019 | | 2018 | | 2017 | |
| Cost per ASK | | | | | | | | | | | | | | |
| Operating expenses (US$ thousands) | | | 9,449,262 | | | | 8,959,185 | | | | 9,611,907 | | | | 9,689,325 | | | | 9,481,230 | | | | 9,291,672 | |
| Divided by ASK (million) | | | 136,398.4 | | | | 134,967.7 | | | | 134,167.1 | | | | 149,111.9 | | | | 143,264.7 | | | | 136,398.4 | |
| = Cost per ASK (US$ cents) | | | 6.93 | | | | 6.64 | | | | 7.16 | | | | 6.50 | | | | 6.62 | | | | 6.81 | |
| | | | | | | | | | | | | | | | | | | | | | | | | |
| Cost per ASK excluding fuel price variations | | | | | | | | | | | | | | | | | | | | | | | | |
| Operating expenses (US$ thousands) | | | 9,449,262 | | | | 8.959,185 | | | | 9,611,907 | | | | 9,689,325 | | | | 9,481,230 | | | | 9,291,672 | |
| – Aircraft fuel (US$ thousands) | | | 2,318,816 | | | | 2,056,643 | | | | 2,651,067 | | | | 2,929,008 | | | | 2,983,028 | | | | 2,318,816 | |
| Divided by ASK (million) | | | 136,398.4 | | | | 134,967.7 | | | | 134,301.8 | | | | 149,111.9 | | | | 143,264.7 | | | | 136,398.4 | |
| = Cost per ASK excluding fuel price variations (US$ cents) | | | 5.23 | | | | 5.11 | | | | 5.19 | | | | 4.53 | | | | 4.54 | | | | 5.11 | |
Other Operating Measures
LATAM uses revenues per ASK or ATK, as applicable, in analyzing revenues on a per unit basis. To obtain unit revenues, we divide our passenger revenues by our total ASKs and our cargo revenues by our total ATKs. We use our revenues as defined under IFRS for purposes of the calculation of this metric. Revenues per ASK or ATK, as the case may be, do not have a standardized meaning, and as such may not be comparable to similarly titled measures provided by other companies. This metric is not an IFRS measure of performance or liquidity. It should not be considered in isolation or as a substitute for revenues or as indicators of performance or cash flows as a measure of liquidity.
The table below shows the calculation of our revenues per ASK or ATK, as applicable, in each of the periods indicated.
| | | 2017 | | | 2016 | | | 2015 | |
| | | | | | | | | | |
| Passenger Revenues (US$ thousands) | | | 8,494.477 | | | | 7,877,715 | | | | 8,410,614 | |
| ASK (million) | | | 136,398.4 | | | | 134,967.7 | | | | 134,167.1 | |
| Passenger Revenues/ASK (US$ cents) | | | 6.23 | | | | 5.84 | | | | 6.27 | |
| Cargo Revenues (US$ thousands) | | | 1,119,430 | | | | 1,110,625 | | | | 1,329,431 | |
| ATK (million) | | | 6,230.3 | | | | 6,704.1 | | | | 7,082.8 | |
| Cargo Revenues/ATK (US$ cents) | | | 17.97 | | | | 16.57 | | | | 18.77 | |
| | | 2019 | | | 2018 | | | 2017 | |
| | | | | | | | | | |
| Passenger Revenues (US$ thousands) | | | 9,005,629 | | | | 8,708.988 | | | | 8,494.477 | |
| ASK (million) | | | 149,111.9 | | | | 143,264.7 | | | | 136,398.4 | |
| Passenger Revenues/ASK (US$ cents) | | | 6.04 | | | | 6.08 | | | | 6.23 | |
| Cargo Revenues (US$ thousands) | | | 1,064,434 | | | | 1,186,468 | | | | 1,119,430 | |
| ATK (million) | | | 6,356.7 | | | | 6,497.6 | | | | 6,230.3 | |
| Cargo Revenues/ATK (US$ cents) | | | 16.75 | | | | 18.26 | | | | 17.97 | |
Seasonality
Our operating revenues are substantially dependent on overall passenger and cargo traffic volume, which is subject to seasonal and other changes in traffic patterns. Our passenger revenues are generally higher in the first and fourth quarters of each year, during the southern hemisphere’s spring and summer. In the Brazilian passenger air transportation market, there is generally higher demand for air transportation services in the second half of the year, making the second quarter the weakest for the Company. However, seasonality is partially mitigated by LATAM’s higher-than-market average concentration offocus on business travelpassengers (which isare less sensitive to seasonality). Additionally, the expansion of the Company into other countries with different seasonal patterns has also moderated the overall seasonality of the passenger business.
B. Liquidity and Capital Resources
LATAM’s cash and cash equivalents totaledamounted to US$1,072.6 million as of December 31, 2019, US$1,081.6 million as of December 31, 2018 and US$1,142.0 million as of December 31, 2017, US$949.3 million as of December 31, 2016 and US$753.5 million as of December 31, 2015.2017. Additionally, the Company had short term marketable securities totaling US$386.7 million as of December 31, 2019, US$322.4 million as of December 31, 2018 and US$472.2 million as of December 31, 2017, US$537.0 million as of December 31, 2016 and US$606.4 million as of December 31, 2015.2017. LATAM’s cash and cash equivalents and marketable securities totaled US$1,459.2 million as of December 31, 2019, US$1,404.1 million as of December 31, 2018 and US$1,614.2 million as of December 31, 2017, US$1,486.3 million as of December 31, 2016 and US$1,359.9 million as of December 31, 2015.2017.
The US$127.955.1 million increase in cash and cash equivalents and marketable securities from 20162018 to 2017 is the result of2019 can be explained mainly by an increase in the cash flowproceeds from operations, which reached US$1,666.7 million,sales, partially offset mainly by the repayment of the Company’s financial obligations.expenditures in aircraft acquisitions.
The US$126.4210.2 million increasedecrease in cash and cash equivalents and in marketablemarketables securities from 20152017 to 2016 is2018 can be explained mainly by the resultdepreciation of a reduction in the cash flow from operations that was compensated by a US$556.9 million inflow from pre-delivery payments during 2016Brazilian and the subscription by Qatar Airways of a capital increase of US$608.5 million in LATAM.Argentinian currencies.
We believe that our working capital will be sufficient during the next 12 months to meet our liquidity requirements.
Cash position and liquidity
The following table provides a summary of our cash flows from operating activities, investing activities and financing activities for the years ended December 31, 2017, 20162019, 2018 and 20152017 and our total cash position as of December 31, 2017, 20162019, 2018 and 2015.2017.
| | | 2017 | | 2016 | | 2015 | | | 2019 | | 2018 | | 2017 | |
| | | (in US$ million) | | | (in US$ million) | |
| Net cash flows from operating activities | | | 1,666.7 | | | | 980.9 | | | | 1,672.1 | | |
| Net cash flow from operating activities | | | | 2,826.7 | | | | 2,073.3 | | | | 2,186.8 | |
| Net cash flow from (used in) investing activities | | | (287.4 | ) | | | (431.8 | ) | | | (1,695.7 | ) | | | (1,419.2 | ) | | | (358.4 | ) | | | (293.9 | ) |
| Net cash flows from (used in) financing activities | | | (1,179.1 | ) | | | (396.3 | ) | | | (128.4 | ) | |
| Net cash flow from (used in) financing activities | | | | (1,343.5 | ) | | | (1,608.6 | ) | | | (1,692.7 | ) |
| Effects of variation in the exchange rate on cash and cash equivalents | | | (7.6 | ) | | | 43.0 | | | | (83.9 | ) | | | (73.0 | ) | | | (166.7 | ) | | | (7.7 | ) |
| | | | | | | | | | | | | | | | | | | | | | | | | |
| Cash and cash equivalents at the beginning of the year | | | 949.3 | | | | 753.5 | | | | 989.4 | | | | 1,081.6 | | | | 1,142.0 | | | | 949.3 | |
| Cash and cash equivalents at the end of the year | | | 1,142.0 | | | | 949.3 | | | | 753.5 | | | | 1,072.6 | | | | 1,081.6 | | | | 1,142.0 | |
In addition to cash and marketable securities, LATAM has access to short term uncommited credit lines. As of December 31, 2017,2019, LATAM also had long-term working capital uncommitted credit facilities for a total amount of US$1,230 million, of which US$561 million was drawn as of December 31, 2017, and committed credit lines in the form of a fully undrawn revolving credit facility (“RCF”) of US$450600 million21. The RCF is secured by spare parts, engines, and aircrafts. See Note 32 to our audited consolidated financial statements for a more detailed discussion of these commitments.
Net cash flowsflow from operating activities
Cash flow from operations derives primarily from providing air passenger and cargo transportation to customers. Operating cash outflows are primarily related to expenses of airline operations, including fuel consumption. Net cash inflows from operating activities in 20172019 increased by US$685.9753.3 million, or 69.9%36.3%, up from US$980.92,073.3 million, mainly thanksdue to an increase in operating margin, which was drivenproceeds from sales explained by the economic recovery of the region, better operatinga stronger performance in Brazil and Peru and from the compensation received from Delta Air Lines related to the transition costs for the implementation of the framework agreement between LATAM and Delta Air Lines.
Cash flow from operating activities in 2018 decreased by US$113.5 million, or 5.2%, down from US$2,186.8 million, mainly due to a decrease in operating margin, driven higher fuel prices and the depreciation of the Brazilian and Argentinian currencies. In turn, this impact was partially offset by LATAM’s ongoing cost efficiency initiatives.
2Subject to borrowing base availability
Net cash inflows from operating activities in 2016 decreased US$691.2 million, or 41.3%, from US$1,672.1 million, mainly due to changes in working capital. The main impacts on working capital were theinitiatives such as headcount reduction in prepayments of credit card receivables in Brazil in the amount of US$255.4 and the US$ 108.0 million related to the non-payment in 2015 of the performance bonuses of 2014.higher aircraft utilization.
Net cash flow used in investing activities
Net cash used in investing activities in 2017 decreased2019 increased to US$287.4 1,419.2 million from US$431.8358.4 million in 2016, due to a reduction in purchases of property, plant and equipment. This reduction resulted2018. The increase is explained mainly from not having anyby capital expenditures in aircraft, in contrast with ahigher maintenance expenses and investment projects related to cabin retrofit.
The inflow related to the net predelivery payments received by LATAM reached US$861.1 263.4 million outflow for year 2016; which was offset by2019, higher than the net predelivery payments outflows of US$126.5 million54.7million for year 2017, in contrast with the net predelivery payments inflow of US$556.9 million for year 2016.2018. For further details, please refer to Note 35 to our audited consolidated financial statements.
Net cash used in investing activities in 2016 decreased2018 increased to US$1,263.9 358.4 million from US$1,695.7293.9 million in 2015 to US$431.8 million in 2016,2017, due to a reductionan increase in purchases of property, plant and equipment primarily driven byincluding cabin retrofit, IT, and digital investments. In 2018, as in 2017, the company did not incur in any capital expenditures in aircraft. In 2018, the outflow related to the net predelivery payments reached US$ 54.7 million for year 2018, a 43.2% lower than the net predelivery payments outflows of US$556.9126.5 million inflow from pre-delivery payments during 2016 in contrast with an outflow of US$128.0 million during 2015. In addition, during 2016 there was a net inflow of US$263.0 million from the sale and purchase of debt instruments of other entities in contrast with an outflow of US$184.7 million during 2015.for year 2017. For further details, please refer to Note 35 to our audited consolidated financial statements.
Net cash flows used in financing activities
In 2017,2019, net cash used in financing activities totaledamounted to US$1,179.11,343.5 million, a decrease of US$265.1 million from the US$1,608.6 million in cash used in financing activities in 2018. In 2019, the company paid US$1,860.5 million in loan repayments and issued US$1,781.7 million in new debt. Total debt issuances in year 2019 amounted to US$1,781.7 million, an increase of US$782.81,002.7 million as compared to US$779.1 million issued in 2018.
In 2018, net cash used in financing activities amounted to US$1,608.6 million, an increase of US$84.0 million from the US$396.31,692.7 million in cash generated by financing activities in 2016.2017. In 2017,2018, the companyCompany paid US$1,829.21,738.3 million in loan repayments – including TAM notes due in 2017 and 2021 which amounted to US$300.0 million and US$500.0 million respectively – which were offset by US$1,305,4779.1 million in debt issuances. Total debt issuances in year 20172018 amounted to US$1,305.4779.1 million, a decrease of US$514.6526.3 million compared to US$1,820.01,305.4 million issued in 2016.2017.
| 1 | Subject to borrowing base availability |
In 2016, net cash used in financing activities totaled US$396.3 million, an increase of US$267.9 million from the US$128.4 million in cash generated by financing activities in 2015. The variation resulted primarily from a significant increase in loan repayments from US$1,263.8 million in 2015 to US$2,121.1 million in 2016, which was compensated by the capital increase of US$608.5 million subscribed and paid during 2016.
Sources of financing
Long term
We typically finance our fleet with long-term loans covering between 80% and 100% of the net purchase price. We also finance our aircraft under sale and leaseback arrangements in order to add flexibility to our fleet. For more information regarding fleet financing, please refer to the information below and to “—F. Long Term Indebtedness—Tabular Disclosure of Contractual Obligations.”
From time to time in the past, we have considered, and may consider in the future, other forms of financing such as equity or debt, either secured or unsecured, securitization of ticket receivables or the securitization of fleet and engines.
Short term
We have generally been able to arrange for short-term loans with local and international banks when we have needed to finance working capital expenditures or increase our liquidity. As of December 31, 2017,2019, we maintainedhas an outstanding stock of US$ 1,680340 million in short-term credit linesloans with both local and international banks, including US$450 million of committed credit lines3 which was fully undrawn as of December 31, 2017.banks.
3Subject to borrowing base availability
We have diversified our sources of short term financing to include the following: PAE (“Prestamos a Exportadores”Exportadores”), which are foreign currency short term loans granted to exporting parties in Chile mainly to finance working capital; and credit card discounting in Brazil, a financing alternative where a bank provides in advance to the Company a percentage of the cash inflows related to the credit card installment sales and margin loans.sales.
Capital expenditures
Our capital expenditures are related to the acquisition of aircraft, aircraft-related equipment, IT equipment, support infrastructure and the funding of pre-delivery deposits. LATAM’s capital expenditures totaled US$ 1,276.6 million in 2019, US$660.7 million in 2018 and US$403.7 million in 2017, US$694.4 million in 2016 and US$1,569.7 million in 2015, and purchases of intangible assets totaled US$ 140.2 million in 2019, US$96.2 million in 2018 and US$87.3 million in 2016, US$88.6 million in 2016 and US$52.5 million in 2015.2017. See “—Sources of financing” above.
The following chart sets forth the Company’s estimated capital expenditures for 2018, 20192020, 2021 and 20202022 calendar years:years(1):
| | | Estimated capital expenditures by year,
as of December 31, 2017 | | | Estimated capital expenditures by year,
as of December 31, 2019 | |
| | | 2018 | | 2019 | | 2020 | | | 2020 | | 2021 | | 2022 | |
| | | (in US$ millions) | | | (in US$ millions) | |
| Fleet Commitments(1) | | | 714 | | | | 1,213 | | | | 1,344 | | | | 408 | | | | 773 | | | | 574 | |
| PDPs(2) | | | 219 | | | | 123 | | | | 0 | | | | 42 | | | | (23 | ) | | | (39 | ) |
| Other expenditures(3) | | | 650 | | | | 794 | | | | 661 | | | | 1,050 | | | | 950 | | | | 930 | |
| (1) | The amount of Fleet Commitments presented includes all the committed deliveries with estimates regarding (i) changes in scheduled delivery dates; (ii) conversion of certain aircraft types and (iii) aircraft of which we do not expect to take delivery, regardless of the financing of the aircraft will have upon arrival, thus representing the sum of aircraft capex and future sale and leasebacks. |
| (2) | Represents pre-delivery payments made by LATAM, or inflows received by LATAM after the delivery of the aircraft is made. |
| (3) | Other Expenditures include estimates of capital expenditures on spare engines and parts, maintenance of on balance fleet, projects and others, plus purchases of intangible assets. LATAM can give no assurance that these estimates and expected costs and prices are correct; and actual costs, expenses and prices may differ from these original estimates. |
At this time, LATAM is not able to fully determine the adjusted levels of estimated capital expenditures in light of the expected lower demand on air travel. The actual amount and timing of our future capital expenditures may be materially lower than our estimates as a result of the impact of the spread of coronavirus (COVID-19) on demand for air travel in the regions we operate.
C.Research and Development, Patents and Licenses, etc.
During 2019 LATAM continued with the registration of its brands to guarantee its protection worldwide, thus strengthening the presence of the brand.
TrademarkLATAMin Argentina, Bolivia, Canadá, China, Colombia, South Korea, Costa Rica, Cuba, Ecuador, El Salvador, Guatemala, Honduras, Hong Kong, India, Japan, Mexico, Nicaragua, New Zealand, Panama, Paraguay, Peru, Dominican Republic, Taiwan, European Union, Uruguay, USA and Venezuela; TrademarkLATAM AIRLINESin Argentina, Bolivia, China, Colombia, South Korea, Cuba, Ecuador, El Salvador, Spain, Guatemala, Honduras, India, Japan, Mexico, Nicaragua, Panama, Paraguay, Peru, Portugal, Dominican Republic, Taiwan, European Union, Uruguay and Venezuela.
LATAM AIRLINES ARGENTINAin Argentina;LATAM AIRLINES COLOMBIA in Colombia;LATAM AIRLINES ECUADOR in Ecuador;LATAM AIRLINES PARAGUAY in Paraguay andLATAM AIRLINES PERU in Peru.LATAM CARGOhas been registered and/or renewed in Argentina, Bolivia, Colombia, Ecuador, Mexico, Paraguay, Peru, European Union, Uruguay, USA, Venezuela and Australia.LATAM CARGO BRAZILin Brazil;LATAM CARGO COLOMBIAin Colombia;LATAM CARGO MEXICOin Mexico.
LATAM CORPORATEin Argentina, Bolivia, Colombia, Costa Rica, Cuba, Ecuador, El Salvador, Guatemala, Honduras, Mexico,Nicaragua, Panama, Paraguay, Peru, Dominican Republic, European Union and Uruguay.LATAM FIDELIDADEin the following countries, Argentina, Australia, Bolivia, Colombia, Ecuador, Mexico, New Zealand, Paraguay, Peru, European Union, Uruguay, USA and Venezuela.LATAM LINEAS AEREASin Argentina, Colombia, Ecuador and Peru;LATAM MROin Argentina; Bolivia, Colombia, Ecuador, Mexico, Paraguay, Peru, European Union, Uruguay, USA, Venezuela and Australia.LATAM PASSin Argentina, Australia, Bolivia, Canada, Colombia, Ecuador, Mexico, New Zealand, Paraguay, Peru, European Union, Uruguay, USA, Venezuela and Australia.LATAM PASS MILESin New Zealand and Australia.LATAM TOURS inArgentina, Colombia, Ecuador and Peru.LATAM TRADEin Argentina, Bolivia, Colombia, Costa Rica, Cuba, Ecuador, El Salvador, Guatemala, Honduras, Mexico, Nicaragua, Panama, Paraguay, Peru, Dominican Republic, European Union and Uruguay. TrademarkLATAM TRAVELin Argentina, Bolivia, Colombia, Ecuador, Mexico, Paraguay, Peru, European Union, Uruguay, USA, Venezuela and Australia; trademarkLATAM TRAVEL SOLUTIONSin Panama;LATAM VIAGENSin Brazil;LATAM, JUNTOS MÁS LEJOSin Argentina and Ecuador.LATAM, TOGETHER, FURTHERin Australia, New Zealand, European Union and USA.
LATAMPLAYin Argentina, Colombia and Ecuador.LATIN AIRLINE NETWORKin Mexico, Nicaragua, New Zealand and European Union.LIBREVOLADORin Bolivia, Ecuador, Paraguay and Peru.LIBREVOLADORESin Bolivia, Ecuador, Paraguay and Peru.LIDERES DEL SERVICIOin Argentina,LINEA AEREA CARGUERA DE COLOMBIAin Colombia.
TAM has filed for trademark registration, registered or renewed the following trademarks “LAN” with the trademark officein Brazil,LATAM;LATAM AIRLINES;LATAM AIRLINES BRAZIL;LATAM CARGO, LATAM CARGO BRAZIL;LATAM FIDELIDADE;LATAM MRO,LATAM PASS; LATAM TRADE; LATAM TRAVEL LATAM VIAGENS;LATAM TRADE; LATAM TRAVEL; LATAMPLAY;MEGA PROMO;MERCADO LATAM;VAMOS LATAM.
FIDELIDAD in Argentina;FIDELIDAD TAM in Paraguay;LATAM AIRLINES ARGENTINAin Argentina;LATAM AIRLINES COLOMBIA in Colombia;LATAM AIRLINES ECUADOR in Ecuador;LATAM AIRLINES PARAGUAY in Paraguay México, Taiwan and South Korea, “LAN AIRLINES” and “LAN CARGO” with the trademark officeLATAM AIRLINES PERU in Taiwan and South Korea, “LATAM CORPORATE” with the trademark office in Chile, Colombia, Peru, México, Argentina, Bolivia, Ecuador, Paraguay, Uruguay and the European Union, and “LATAM TRAVEL” with the trademark office in Chile, Argentina, Bolivia, Colombia, Ecuador, Mexico, Paraguay, Peru and Uruguay. We license certain brands, logos and trade dress under the alliance agreement with oneworld® related to LATAM’s alliance. As long as LATAM is a member of oneworld®, it will have the right to continue to use current logos on its aircraft.
TAM has filed for trademark registration trademarks, “PONTOS MY LATAM”, “LATAM TRAVEL” and “LATAM CORPORATE” before the Instituto Nacional da Propriedade Industrial (“INPI”), the body with jurisdiction for registering trademarks and patents in Brazil and renewed 2 trademarks “TAM”, before the bodies with jurisdiction for registering trademarks in Macao where TAM operates.Peru.
D. Trend Information
For 2018, LATAM expects total passenger ASK growth to be between 5% and 7%. International passenger ASK growth for full year 2018 is expected to be between 6% and 8%.On March 12, 2020, LATAM Airlines Brazil’s domestic passenger ASKsannounced the suspension of its guidance for 2020 in light of the Brazilian market are expecteduncertainty due to increase between 2%the COVID-19 (coronavirus) outbreak that is affecting the demand for air traffic. As of this date, it is not possible to quantify the exact impact on demand or how long it may take to recover, making it impossible to estimate results for the full year.
LATAM is taking immediate measures to minimize possible effects of the current scenario, including cost reduction and 4%. ASKscapacity adjustments. Along these lines, and in SSC are expectedaddition to increasethe significant efforts being made by LATAM to protect the health and safety of its passengers and workers, the LATAM group announces a decrease in capacity of approximately 6% to 8%.30% of international operations for April and May 2020.
Regarding cargoOn March 16, 2020, LATAM Airlinesand its affiliatesupdated the decrease in capacity to approximately 70% of total operations, LATAM expects cargo ATKscorresponding 90% to increase between 1%international operations and 3% for full year 2018, driven by the increases in the capacity of LATAM’s international passenger operations which result in additional capacity related40% to the space in the belly of those aircrafts. As a result, 2018 will be the first year that LATAM is increasing capacity across all its business units since the business combination between LAN and TAM.
During 2017, LATAM operated in a context of increasing competitive pressures from different players across the region, including low cost operators, and the Company expects this trend to continue during 2018. LATAM’s goal is to continue to increase the efficiency of its operations, allowing the Company to provide the best and most convenient options for its customers with the distinctive customer experience LATAM passengers expect. In this context, the group has implemented significant changes with the objective of transforming LATAM into a simpler, leaner and more efficient organization. During 2017 LATAM introduced a new travel model for domestic operations in the five of its six domestic markets where it operates in South America (Brazil, Chile, Colombia, Ecuador and Peru), in order to address the changing dynamics of customers and the industry. During 2018, LATAM will continue with the transformation process in the different markets with the objective of increasing LATAM’s competitiveness to ensure the sustainability of its domestic operations business model in the long term. For more information on this new travel model, see “Item 4. Information on the Company—B. Business Overview—Passenger Operations—Business Model for Domestic Operations”.
Over the last year, the Company has continued to strengthen its network, taking advantage of specific opportunities for profitable growth in LATAM’s South American Spanish-speaking markets (SSC, which include Chile, Peru, Argentina, Colombia and Ecuador). During 2017, LATAM inaugurated new routes connecting its Lima hub with Argentina, Brazil and Colombia, its Santiago hub with secondary cities in Argentina, and launched a new flight from Santiago to Melbourne, the longest non-stop flight operated by LATAM. For 2018, the Company announced the launch of new destinations departing from its Sao Paulo hub, including Boston, Las Vegas and Rome.operations.
At this time, LATAM will continueis not able to use fuel hedging programs and fuel surcharge mechanismsfully determine the impact on financial results in both our passenger and cargo businesses to help minimizelight of the expected lower demand on air travel as a result of the impact of short-term movementsthe spread of coronavirus (COVID-19) on demand for air travel in crude oil prices. As of April 3, 2018, LATAM has hedged approximately 20%, 40%, 44% and 23% of its estimated fuel consumption for the first, second, third and fourth quarters of 2018 respectively.regions we operate.
E. Off-Balance Sheet Arrangements
As of December 31, 2017, the Company had entered into operating leases for 84 aircraft (of which 6 are obligations of LATAM Airlines Brazil and 78 are obligations of LATAM) and 8 aircraft engines. These operating leases provide us with flexibility to adjust ourThe company does not currently have off-balance sheet fleet to any demand volatility and therefore we consider such arrangements to be of great value to our strategy and financial performance. The total future lease payments related to our operating leases as of December 31, 2017 was US$ 3,580.5 million, for all remaining periods through maturity (the latest of which expires in 2029). See “—F. Long Term Indebtedness—Tabular Disclosure of Contractual Obligations.”
Under the aforementioned operating leases, LATAM is responsible for all maintenance, insurance and other costs associated with operating these aircraft. The Company has not made any residual value or similar guarantees to our lessors. There are certain guarantees and indemnities to other unrelated parties that are not reflected on the Company’s balance sheet, but we believe that these will not have a significant impact on our results of operations or financial condition.
LATAM operates 12 aircraft under tax leasing structures. These methods involve the creation of special purpose entities that acquire aircraft with bank and third-party financing. Under IFRS, these aircraft are shown in the consolidated statement of financial position as part of “Property, plant and equipment” and the corresponding debt is shown as a liability. Of LATAM’s total tax leases, nine are classified as operating leases for accounting purposes as of December 31, 2017.
As of December 31, 2017, we are not aware of any event, lawsuit, commitment, trend or uncertainty that may result in, or is reasonably likely to result in, the termination of the operating leases.adoption of IFRS 16. See Note 3217 to our audited consolidated financial statements for a more detailed discussion of these commitments.
For other commitments, see Note 32 - (b) Other commitments - to our consolidated financial statements.
F. Long Term Indebtedness
Long Term Indebtedness
Secured Debt
Aircraft Debt
| 1. | ECA/EX-IM: Bank bonds guaranteed by Export-Import Bank of the United States (“EX-IM Bank”) and Export Credit Agency (“ECA”) guaranteed loan debt. As of December 31, 2017,2019, the total outstanding amount under these facilties was US$2,7391,637 million. In general, ECA and EX –IM financingEX–IM financings have a 12-year repayment profiles.profile. |
| 2. | Enhanced Equipment Trust Certificates (“EETC”): In June 2015, LATAM issued the first EETC in Latin America for an aggregate face amountpar value of approximately US$1,021 million to finance 17 new aircraft deliveries comprising 11 Airbus A321-200, 2 Airbus A350-900 and 4 Boeing 787-9, with delivery dates from July 2015 through March 2016. The offering is comprised of Class A Certificates maturing in November 2027 and Class B Certificates maturing in November 2023. The annual interest rate for Class A and B Certificates are 4.20% and 4.50%, respectively. In April 2017, LATAM issued and privately placed Class C Certificates for an amount of US$140 million under the current EETC structure. The Class C Certificates have a six yearsix-year term, maturing in May 2023. As of December 31, 2017,2019, the outstanding EETC debt was US$1,029863 million. |
| 3. | Commercial Bank Commercial Loans: As of December 31, 2017,2019, secured commercial bank commercial loans debt wastotalled US$1,5201,744 million. |
| 4. | Tax Leases: LATAM has secured debt through Japanese Leases with a call option (“JOLCO”). As of December 31, 2017,2019, the outstanding obligations under these tax leases were US$100623 million. |
Non Aircraft Debt
| 1. | 2013-1 Series Note: LATAM issued a securitized bond in the amount of US$450 million in November 2013 with a seven yearseven-year term and a two yeartwo-year interest-only period (the “2013-1 Series Note”). This bond is secured by future flows of credit card sales of LATAM Airlines in the United States and Canada. The coupon is 6.0% fixed with quarterly payments. As of December 31, 2017,2019, the principal outstanding amount of the 2013-1 Series Note was US$285 million. |
| 2. | Bank Commercial Loans: As of December 31, 2017, bank commercial loans debt was US$56101 million. |
Other
| 1. | Pre-Delivery Payments (“PDP”) financing: As of December 31, 2017,2019, outstanding amount under PDP financings was US$203133 million. |
Unsecured Debt
| 1. | LATAM 2020 Notes: On June 9, 2015, LATAM Airlines Group S.A. issued long-term bonds in the international markets in the amount of US$500 million, maturing in 2020 with an interest rate of 7.25% per year. As of December 31, 2017, outstanding amounts under the LATAM 2020 Notes was US$495 million. |
| 2. | LATAM 2024 Notes: On April 11, 2017, LATAM Finance Limited, an affiliate of LATAM Airlines Group S.A., issued long-term bonds in the international markets in the amount of US$700 million, maturing in 2024 with an annual interest rate of 6.875%. As of December 31, 2017,2019, the outstanding amount under the LATAM 2024 Notes was US$708709 million. |
| 2. | 2026 Notes: On February 4, 2019, LATAM Finance Limited, an affiliate of LATAM Airlines Group S.A., issued long-term bonds in the international markets in the amount of US$600 million, maturing in 2026 with an annual interest rate of 7.000% (the “2026 Notes”). On July 11, 2019, LATAM Finance Limited, an affiliate of LATAM Airlines Group S.A., issued a re-opening of the 2026 notes in the amount of US$200 million, maturing in 2026 with an annual interest rate of 7.000%. As of December 31, 2019, the outstanding amount under the 2026 Notes was US$822 million |
| 3. | Local Bonds: On August 17, 2017, LATAM Airlines Group S.A. issued local bonds on the Santiago Stock Exchange in the aggregate amount of UF 9,000,000 comprised of the Series A Bonds (BLATM-A), Series B Bonds (BLATM-B), Series C Bonds (BLATM-C) and Series D Bonds (BLATM-D), which correspond to the first issue of bonds charged tounder the bond line inscribedregistered in the Securities Registry of the CMF under number 862. The total amount of Series A Bonds issued was UF 2,500,000 with a maturity date of June 1, 2022 bearing nominal interest rate at 5.25% annually. The total amount of Series B Bonds issued was UF 2,500,000 with a maturity date of January 1, 2028 bearing nominal interest rate at 5.75% annually. The total amount of Series C Bonds issued was UF 1,850,000 with a maturity date of June 1, 2022 bearing nominal interest rate at 5.25% annually. The total amount of Series D Bonds issued was UF 1,850,000, with a maturity date of January 1, 2028 bearing nominal interest rate at 5.75% annually. On June 6, 2019, LATAM Airlines Group S.A. issued local bonds listed on the Santiago Stock Exchange designated as the Series E Bonds (BLATM-E), which correspond to the first issue of bonds under the bond line registered in the Securities Registry of the CMF under number 921. The total amount of Series E Bonds issued was UF 5,500,000 with a maturity date of April 15, 2029 bearing nominal interest rate at 3.60% annually. As of December 31, 2017,2019, the outstanding amount of Local Bonds was US$381 million.534 million |
| 4. | Commercial Bank Loans: As of December 31, 2017,2019, unsecured Commercial Bank Commercial loans debt wasstood at US$37679 million. |
As of December 31, 2017,2019, the average interest rate of our debt was 4.13%4.63%. Out of the total debt, 63.3%61.6% accrues interest at a fixed rate (either through a stated fixed interest rate or through the use of interest rate swap agreements) or is subject to interest rate caps.
As of December 31, 2017,2019, LATAM had US$1,2891,367 million in current debt liabilities. Of this amount, US$259340 million consisted of short-term debt, which represents 20%25% of our total current debt liabilities.
LATAMThe Company entered into various EX-IM Bank loans forloan agreements in connection with the financing of Boeing 767, 767 freighter, 777 freighter and 787 aircraft that containare guaranteed by the United States Export–Import Bank, which include covenant based on financial covenants and other restrictions, including restrictionsindicators on a consolidated basis, in shareholder composition and disposalrespect of assets. which, in any case, non-compliance does not result in the acceleration of the payment of the loans. For more information, please see Note 32 to our audited consolidated financial statements.
As of December 31, 2017,2019, we also had purchase obligations totaling US$ 7.33.4 billion (US7.4 billion according to manufacturer’s list price), with deliveries between 20172020 and 2022,2026, as set forth below:
| · | Airbus A320-Family, passenger aircraft deliveries: 5242 |
| · | Wide-body passenger aircraft deliveries (which include the Airbus A350 900XWB,includes the Airbus A350 1000XWB the Boeing 777, and the Boeing 787-9): 308 |
Tabular Disclosure of Contractual Obligations
The following table sets forth our material expected obligations and commitments as of December 31, 2017:2019:
| | | Payments due by period, as of December 31, 2017 | | Payments due by period, as of December 31, 2019 | |
| (US$ in millions) | | Total | | | Less than 1
year | | | 1-3 years | | | 3-5 years | | | More than
5 years | | | Total | | Less than 1
year | | 1-3 years | | 3-5 years | | More than
5 years | |
| Financial debt obligations(1) | | US$ | 7,892 | | | US$ | 1,289 | | | US$ | 2,720 | | | US$ | 1,393 | | | US$ | 2,491 | | | US$ | 7,194 | | US$ | 1,367 | | US$ | 2,007 | | US$ | 1,637 | | US$ | 2,183 | |
| Operating lease obligations | | US$ | 3,580 | | | US$ | 462 | | | US$ | 866 | | | US$ | 754 | | | US$ | 1,498 | | |
| Lease obligations | | | US$ | 3,955 | | US$ | 596 | | US$ | 1,040 | | US$ | 942 | | US$ | 1,377 | |
| Fleet Commitments | | US$ | 7,259 | | | US$ | 948 | | | US$ | 3,112 | | | US$ | 3,199 | | | US$ | 0 | | | US$ | 3,402 | | US$ | 408 | | US$ | 1,348 | | US$ | 1,271 | | US$ | 376 | |
| TOTAL | | US$ | 18,731 | | | US$ | 2,699 | | | US$ | 6,698 | | | US$ | 5,346 | | | US$ | 3,989 | | | US$ | 14,551 | | | US$ | 2,371 | | | US$ | 4,395 | | | US$ | 3,850 | | | US$ | 3,936 | |
| (1) | Financial debt obligations reflect principal payments on outstanding debt obligations, including aircraft debt, senior notes, long-term and short-term bank loans and PDP financing. |
20172019 Fleet AcquisitionsAdditions
During 2017,2019, LATAM completed the acquisitionaddition of the following wide body aircraft:
| · | OneThree Airbus A350-900 through leases, one Airbus A350-900 through cash payment and two Boeing 787-9 through a tax lease. |
During 2019, LATAM completed the addition of the following narrow body aircraft:
| · | Fourteen Airbus A320-200 and three A320 Neo through leases and six Airbus A320 Neo thorugh tax leases. |
2018 Fleet Additions
During 2018, LATAM completed the addition of the following wide body aircraft:
| · | Two Airbus A350-900 passenger aircraft, financed through an operating lease with a 12 year term. |
| · | One Boeing 787-9 passenger aircraft, financed through a sale and leaseback transactiontransactions with a 12 year12-year term. |
During 2017,2018, LATAM completed the acquisitionaddition of the following narrow body aircraft:
| · | Two Airbus 320neoA321 passenger aircraft, financed through sale and leaseback transactionsleases with 1210.5 year terms. |
2016 Fleet Acquisitions
During 2016, LATAM completed the acquisition of the following wide body aircraft:
| · | One Boeing 787-9 passenger aircraft, financed through an operating lease. |
| · | Three Boeing 787-9 and two Airbus 350-900 passenger aircraft, financed through sale and leaseback transactions. |
| · | One Boeing 787-9 and one Airbus 350-900 passenger aircraft, financed through the EETC issuance. |
| · | Three Airbus A350-900 passenger aircraft, financed through commercial loans. |
The Boeing 787-9 aircraft financed through an operating lease has a 12 year term and monthly payments. The four Boeing 787-9 and two Airbus 350-900 aircraft financed through sale and leaseback transactions have lease terms of 12 years. These leases are denominated in U.S. dollars and have monthly payments. Aircraft financed through EETC are under the terms described above. The three Airbus 350-900 financed through commercial loans have a Senior and Junior tranche, which have terms of 12 and 7 years, respectively.
During 2016, LATAM completed the acquisition of the following narrow body aircraft:
| · | Seven Airbus 321-211 and one A320neo passenger aircraft, financed through sale and leaseback transactions. |
| · | Four Airbus 321-211 passenger aircraft, financed through the EETC facility. |
| · | One Airbus A320neo passenger aircraft, financed through commercial loans. |
Narrow body aircraft financed through sale and leaseback transactions have lease terms of 12 years. These leases are denominated in U.S. dollars and have monthly payments. Aircraft financed through EETC are under the terms described under “Item 5. Operating and Financial Review and Prospects — F. Long Term Indebtedness — Secured Debt. The A320neo passenger aircraft financed through commercial loans has a Senior and Junior tranche, which have terms of 12 and 7 years, respectively.
The ECA-guaranteed loans have an advance rate equal to 80% of the net purchase price of the aircraft for a 12-year period, with the remaining 20% of the aircraft being financed by the Company’s available cash flows.
| ITEM 6. | DIRECTORS, SENIOR MANAGEMENT AND EMPLOYEES |
A. Directors and Senior Management
The LATAM Airlines Group board of directors consists of nine directors who are elected every two years for two-year terms at annual regular shareholders’ meetings or, if necessary, at an extraordinary shareholders’ meeting, and may be re-elected. The board of directors may appoint replacements to fill any vacancies that occur during periods between elections. Scheduled meetings of the board of directors are held once a month and extraordinary board of directors’ meetings are called by the chairman of the board of directors. Extraordinary meetings can be called by the chairman, or when requested by one or more directors if the need for such a meeting is previously approved by the chairman, unless the meeting is requested by a majority of the directors, in which case the meeting must be held without the previous approval of the chairman.
On September 10, LATAM announced that the CEO of the LATAM Airlines Group, Enrique Cueto, after 25 years of service, will leave his position of CEO as of March 31, 2020 and will be replaced by the current Chief Commercial Officer, Roberto Alvo, effective on March 31, 2020.
The current board of directors was elected at the ordinary shareholders��shareholders’ meeting held on April 27, 2017 and will hold office25, 2019 for two years.a two-year period.
The following are LATAM Airlines Group’s directors:
| Directors | | Position |
| Ignacio Cueto(1) | | Director / Chairman |
| Carlos Heller(2) | | Director |
| Juan José Cueto(1) | | Director |
| Nicolás Eblen(3) | | Director |
| Henri Philippe Reichstul | | Director |
Georges de BourguignonPatrick Horn | | Director |
| Giles Agutter | | Director |
| Eduardo Novoa | | Director |
Antonio Luiz PizarroSonia Villalobos | | Director |
| Senior Management | | Position |
| Enrique Cueto(1) | | CEO LATAM |
| Ramiro Alfonsín | | CFO LATAM |
| Roberto Alvo | | Senior VP CommercialCCO LATAM |
Claudia SenderPaulo Miranda | | Senior VP Customers LATAM |
| Hernán Pasman | | Senior VP Operations, MaitenanceMaintenance and Fleet LATAM |
| Emilio del Real | | Senior VP Human Resources |
| Juan Carlos Menció | | Senior VP Legal |
| | |
| (1) | Messrs. Ignacio, Enrique and Juan José Cueto are brothers. All three are members of the Cueto Group, which is defined in “Item 7” as a “Major Shareholder,Shareholder.” and are the LATAM Controlling Shareholders. |
| (2) | Mr. Carlos Heller is a member of the Bethia Group, which is defined in “Item 7” as a “Major Shareholder.” |
| (3) | Mr. Nicolás Eblen is a member of the Eblen Group, which is defined in “Item 7” as a “Major Shareholder.” |
Biographical Information
Set forth below are brief biographical descriptions of LATAM Airlines Group’s directors and senior management. All of LATAM’s directors were elected or reelected, asare Chilean citizens, with the case may be, on April 27, 2017 for a two-year term, which expires in April 2019.exception of three members.
Directors
Mr. Ignacio Cueto,has served as a member of LATAM Airlines Group’s board of directors and as Chairman since April 2017.2017 and was re-elected to the board of directors of LATAM in April 2019. Mr. Cueto’s career in the airline industry extends over 30 years. In 1985, Mr. Cueto assumed the position of Vice President of Sales at Fast Air Carrier, a national cargo company of that time. In 1985, Mr. Cueto became Service Manager and Commercial Manager for the Miami sales office. Mr. Cueto later served on the board of directors of Ladeco (from 1994 to 1997) and LAN (from 1995 to 1997). Mr. Cueto served as President of LAN Cargo from 1995 to 1998, as Chief Executive Officer-Passenger Business from 1999 to 2005, and as President and Chief Operating Officer of LAN since 2005 until the combination with TAM in 2012. Mr. Cueto later served as LAN’s CEO until April 2017. Mr. Cueto also led the establishment of the different affiliates that the Company has in South America, as well as the implementation of key alliances with other airlines. Mr. Cueto is a member of the Cueto Group (LATAM Airlines Group’s Controlling Shareholder).Group. As of February 28, 2018,29, 2020, Mr. Cueto shared in the beneficial ownership of 169,248,377130,165,390 common shares of LATAM Airlines Group (27.91%(21.46% of LATAM Airlines Group’s outstanding shares) held by the Cueto Group. For more information, see “Item 7. ControllingMajor Shareholders and Related Party Transactions.”
Mr. Carlos Heller, joined the board of LAN in May 2010 and was re-elected to the Boardboard of Directorsdirectors of LATAM in April 2017.2019. Mr. Heller has vast experience in retail, communications, transport and agriculture industries. Mr. Heller is president of Bethia S.A. (“Bethia”) (parent company of Axxion S.A. and Inversiones HS SpA). He is also President of the Boards of Falabella Retail S.A., Red Televisiva Megavision S.A., Club Hípico de Santiago S.A., Sotraser S.A., and Blue Express S.A. and “Azul S.A.” concessionaire of the Corporación de Fútbol Profesional de la Universidad de Chile. On February 28, 2018,29, 2020, Mr. Heller indirectly held 33,367,35725,662,136 ordinary shares of LATAM Airlines Group through Axxion S.A. and Inversiones HS Spa (5.50%(4.23% of the shares of LATAM Airlines Group). For more information, see “Item 7. Major Shareholders and Related Party Transactions.”
Mr. Juan José Cueto, has served on LAN’s board of directors since 1994 and was reelected to the board of directors of LATAM in April 2017. Mr. Cueto currently serves as Executive Vice President of Inversiones Costa Verde S.A., a position he has held since 1990, and serves on the boards of directors of Consorcio Maderero S.A., Inversiones del Buen Retiro S.A., Costa Verde Aeronáutica S.A., Sinergia Inmobiliaria S.A., Valle Escondido S.A. and Fundación Colunga. Mr. Cueto is the brother of Messrs. Enrique and Ignacio Cueto, Plaza, LATAM Airlines Group Executive Vice-PresidentCEO and LAN CEO,Chairman, respectively. Mr. Cueto is a member of the Cueto Group (LATAM Airlines Group’s Controlling Shareholder).Group. As of February 28, 2018,29, 2020, Mr. Cueto shared in the beneficial ownership of 169,248,377130,165,390 common shares of LATAM Airlines Group (27.91%(21.46% of LATAM Airlines Group’s outstanding shares) held by the Cueto Group. For more information, see “Item 7. ControllingMajor Shareholders and Related Party Transactions.”
Mr. Nicolás Eblen, has served on LATAM’s board of directors since April 2017.2017 and was re-elected to the board of directors of LATAM in April 2019. Mr. Eblen currently serves as CEO of Inversiones Andes SpA, a position he has held since 2010. In addition, he serves on the board of directors of Granja Marina Tornagaleones S.A., Río Dulce S.A., Patagonia SeaFarms Inc., SalmonChile A.G., and Sociedad Agrícola La Cascada Ltda. Mr. Eblen holds a Bachelor’s degree in Industrial Engineering, major in Computer Science from Pontificia Universidad Católica de Chile and a Master in Business Administration from Harvard Business School. As of February 28, 2018,29, 2020, the Eblen Group had the beneficial ownership of 35,945,19927,644,702 common shares of LATAM Airlines Group (5.93%(4.56% of LATAM Airlines Group’s outstanding shares). For more information, see “Item 7. ControllingMajor Shareholders and Related Party Transactions.”
Mr. Henri Philippe Reichstul, joined LATAM’s board of directors in April 2014 and was reelected to the board of directors of LATAM in April 2017.2019. Mr. Reichstul is a Brazilian citizen and has served as President of Petrobras and the IPEA-Institute for Economic and Social Planning and Executive Vice President of Banco Inter American Express S.A. Currently, in addition to his roles as Administrative Board member of TAM and LATAM Group, he is also a member of the Boardboard of Directorsdirectors of Peugeot Citroen and chairman of the board of Fives, among others. Mr. Reichstul is an economist with an undergraduate degree from the Faculty of Economics and Administration, University of São Paulo, and postgraduate work degrees in the same discipline—Hertford College—Oxford University.
Mr. Georges de BourguignonPatrick Horn, has served on LATAM Airlines Group’s board of directors since September 2012 and was reelected to the board of directors of LATAM in April 2017.2019. He is co-foundercurrently a Member of Assetthe Economic Council of theUniversidad de los Andes and director of non-profits such asAportes Chile S.A.. He has more than 35 years’ experience as an executive, both in Chile and abroad, in companies including British American Tobacco Co., Unilever, Compañía Chilean investment bank,Sudamericana de Vapores and Grupo Ultramar, where he was appointed chairman in January 2018. Currently, he also has a board seat in K+S Chile S.A.; Embotelladora Andina S.A.; and Asset AGF,director of subsidiaries. Mr. Horn graduated as chairman. Inan Industrial Civil Engineer from the past, he has participated in various directories at public and private companies, and non-profit organizations as well. Between 1990 and 1993 he worked as Manager of Financial Institutions at Citibank N.A. in Chile and as a Professor of Economics at the Pontificia Universidad Católica de Chile where he earnedValparaiso and holds a degreeMaster of Science in Economics. Mr. de Bourguignon also has an MBAIndustrial Engineering from the HarvardGeorgia Institute of Technolgy, USA. He has participated in executive programs at the training centers of British American Tobacco Co. and Unilever in London, and at Kellogg Business School. He also completed a business management program (PADE) at theUniversidad de los Andes business school (ESE).
Mr. Giles Agutter has served on LATAM Airlines Group’s board of directors since January 2017 and was reelected to the board of directors of LATAM in April 2017.2019. Mr. Agutter is the owner and Chief Executive Officer of Southern Sky Ltd, an airline consultant company specializing in airline strategy, fleet planning, aircraft acquisition and aircraft financing. He is also currently a member of the Boardboard of Directorsdirectors of Air Italy. Mr. Agutter has had vast experience in advising airlines, including Qatar Airways, on significant Merger and Acquisition projects within the airline industry. Mr Agutter is a British citizen and has a degree in Aerospace Engineering from Manchester University and he currently resides in England.University.
Mr. Eduardo Novoa has served on LATAM’s board of directors since April 2017.2017 and was reelected to the board of directors of LATAM in April 2019. In addition, Mr. Novoa serves on the board of directors of Cementos Bio-Bio, Grupo Ecomac, ESSAL and is a member of the advisory board of STARS and Endeavor. He was also a member of the board of directors of Esval, Soquimich, Grupo Drillco, Techpack, Endesa-Americas, Grupo Saesa, Grupo Chilquinta, and several companies in the region that were subsidiaries of Enersis and AFP Provida. He has also been a member of the board of Amcham-Chile, the Association of Electric Companies, YPO-Chile, Chile Global Angels and several Start-Ups. Between 1990 and 2007 he was an executive of several companies such as CorpGroup, Enersis, Endesa, Blue Circle, PSEG and Grupo Saesa. Mr. Novoa has a Bachelor of Business and Administration from the Universidad de Chile and a Master in Business Administration from the University of Chicago. He has participated in executive programs at Harvard, Stanford and Kellogg and was professor of finance and economics at several universities in Chile.
Mr. Antonio Luiz PizarroMrs. Sonia J.S. Villalobos, has served on LATAM’s boardjoined the Board of directors since April 2017. In addition, Mr. Pizarro serves onLATAM Airlines in August 2018 and was reelected to the board of directors of Banco Caixa Geral Brasil SA since 2009, TAM Aviação Executiva S.A. since 2012LATAM in April 2019. Mrs. Villalobos is a Brazilian citizen and TAM S.A. since 2017. In 1995, Mr. Pizarro became CFO of Embraer, a position he held until 2008. He was also aregular member of the boardsboard of directors of Solví Participacões S.A., Itapoá Terminais Portuários S.A, TAM S.A.Petrobras and LM Wind Power do Brasil. Mr. Pizarro earned his mechanical engineering degreeTelefónica Vivo. She is a founding partner of the company Villalobos Consultoria since 2009 and a professor of post-graduate courses in finance at Insper since 2016. Between 2005 and 2009, she was the Manager of Funds in Latin America, in Chile, managing mutual and institutional funds of Larrain Vial AGF. From 1996 to 2002, she was responsible for Private Equity investments in Brazil, Argentina and Chile for Bassini, Playfair & Associates, LLC. As of 1989 she was Head of Research of Banco Garantia. She graduated in Public Administration from Escuela Politécnica of Pontificia Universidad Católica de Rio de JaneiroEAESP / FGV in 1984 and hasobtained a graduate degreeMaster in Finance from the Instituto Brasileiro de Mercado de Capitales.same institution in 2004. She was the first person to receive the CFA certification in Latin America, in 1994. As a volunteer, she participates in the Board of the CFA Society Brazil, a non-profit association that brings together nearly 1,000 professionals who hold the CFA (Chartered Financial Analyst) certification in Brazil.
Senior Management
Mr. Enrique Cueto Plaza, is LATAM Airlines Group’s Chief Executive Officer (“CEO”) and has been inheld this position since the combination between LAN and TAM in June 2012. From 1983 to 1993, Mr. Cueto was Chief Executive Officer of Fast Air, a Chilean Cargo airline. From 1993 to 1994, Mr Cueto was a member of the board of LAN Airlines. Thereafter, Mr. Cueto held the position of CEO of LAN until June 2012. Mr. Cueto is member of the oneworld® Alliance Governing Board, the IATA (International Air Transport Association) Board of Governors. He is also member of the Board of the Endeavor foundation, an organization dedicated to the promotion of entrepreneurship in Chile, and Executive Member of the Latin American and Caribbean Air Transport Association (ALTA). Mr. Cueto is the brother of Messrs. Juan José and Ignacio Cueto, members of the board. Mr. Cueto is also a member of the Cueto Group (LATAM Airlines Group’s Controlling Shareholder).Group. As of February 28, 2018,29, 2020, Mr. Cueto jointly shared in the beneficial ownership of 169,248,377130,165,390 common shares of LATAM Airlines Group (27.91%(21.46% of LATAM Airlines Group’s outstanding shares) held by the Cueto Group. For more information, see “Item 7. ControllingMajor Shareholders and Related Party Transactions.”
Mr. Ramiro Alfonsín, is LATAM’s Chief Financial Officer (“CFO”), a position he holds since July 2016. Over the past 16 years, before joining LATAM, he worked for Endesa, a leading utility company, in Spain, Italy and Chile, having served as Deputy Chief Executive Officer and Chief Financial Officer for their Latin American operations. Before joining the utility sector, he worked for five years in Corporate and Investment Banking for several European banks. Mr. Alfonsín holds a degree in business administration from Pontificia Universidad Católica de Argentina.
Mr. Roberto Alvois SeniorLATAM’s Chief Commercial Vice President of LATAMOfficer (“CCO”), a position he holds since May 2017 being responsible of the Group’s passenger and cargo revenue management, with all the commercial units reporting to him. Previously, he was Senior Vice-President of International and Alliances at LATAM Airlines since 2015, and Vice-President of Strategic Planning and Development since 2008. Mr Alvo joined LAN Airlines in November 2001, where he served as Chief Financial Officer of LAN Argentina, as Manager of Development and Financial Planning at LAN Airlines, and as Deputy Chief Financial Officer of LAN Airlines. Before 2001, Mr. Alvo held various positions at Sociedad Química y Minera de Chile S.A., a leading Chilean non-metallic mining company. He is a civil engineer, and holds an MBA from IMD in Lausanne, Switzerland.
Mrs. Claudia SenderMr. Paulo Miranda, is the SeniorLATAM’s Customers Vice-President, of LATAMa position he holds since May 2017. Previously, she served as TAM Airlines’ President since May 2013. Mrs. Sender joined the Company in December 2011, as Commercial and Marketing Vice-President. After June 2012, with the conclusion2019. Mr. Miranda has over 20 years of TAM-LAN combination and the creation of LATAM Airlines Group, she became the head of Brazil’s Domestic Business Unit, and her functions were expanded to include TAM’s entire Customer Service structure. Prior to joining LATAM Airlines, she was Marketing Vice-President at Whirlpool Latin America for seven years. She also worked as a consultant at Bain & Company, developing projects for large companies in various industries, including TAM Airlines and other companiesexperience in the global aviation sector. She hasindustry with different positions first at Delta Air Lines in the United States and then at Gol Linhas Aereas in Brazil. In his last role, Mr. Miranda was responsible for customer experience, having previously worked in finance, alliances as well as on the negotiation and implementation of joint ventures. Mr. Miranda holds a bachelor’sBusiness Administration degree in Chemical Engineering from the PolytechnicCarlson School of Management at the University of São Paulo (“USP”) and an MBA from Harvard Business School.Minnesota, USA.
Mr. Hernán Pasman, has been the Senior Vice-President of Operations, Maintenance and Fleet of LATAM airlines group since October, 2015. He joined LAN Airlines in 2005 as a head of strategic planning and financial analysis of the technical areas. Between 2007 and 2010, Mr. Pasman was the Chief operating officer of LAN Argentina, then, in 2011 he served as Chief Executive Officer for LAN Colombia. Prior to joining the company, between 2001 and 2005, Mr. Pasman was a consultant at McKinsey & Company in Chicago. Between 1995 and 2001, Hernan held positions at Citicorp Equity Investments, Telefonica de Argentina and Argentina Motorola. Mr. Pasman holds a Civil Engineering degree from ITBA (1995) and an MBA from Kellogg Graduate School of Management (2001).
Mr. Emilio del Real, is LATAM’s Vice-President of Human Resources, a position he assumed in August 2005. Between 2003 and 2005, Mr. del Real was the Human Resources Manager of D&S, a Chilean retail company. Between 1997 and 2003 Mr. del Real served in various positions at Unilever, including Human Resources Manager of Unilever Chile, and Manager of Training and Recruitment and Management Development for Latin America. Mr. del Real has a degree in Psychology from the Universidad Gabriela Mistral.
Mr. Juan Carlos Menció, is Senior Vice President of Legal Affairs and Compliance for LATAM Airlines Group a position he holds since September 1, 2014. Mr. Mencio previously held the position of General Counsel for North America for LATAM Airlines Group and its related companies, as well as General Counsel for its worldwide Cargo Operations, both since 1998. Prior to joining LAN, he was in private practice in New York and Florida representing various international airlines. Mr. Mencio obtained his Bachelor’s Degree in International Finance and Marketing from the School of Business at the University of Miami and his Juris Doctor Degree from Loyola University.
Mr. Emilio del Real, is LATAM’s Senior Vice-President of Human Resources, a position he assumed in August 2005. Between 2003 and 2005, Mr. del Real was the Human Resources Manager of D&S, a Chilean retail company. Between 1997 and 2003 Mr. del Real served in various positions at Unilever, including Human Resources Manager of Unilever Chile, and Manager of Training and Recruitment and Management Development for Latin America. Mr. del Real has a degree in Psychology from the Universidad Gabriela Mistral.
B. Compensation
In 2017,2019, the Company paid its principal executives (executives who define the Company’s policies and major guidelines and who directly affect the results of the business, including Vice-Presidents, Chief Executives and Senior Directors) thea total gross remuneration of US$69.260.4 million.
Under Chilean law, LATAM Airlines Group must disclose in its annual report details of all compensation paid to its directorsboard members during the relevant fiscal year, including any amounts that they received from LATAM Airlines Group for functions or employment other than serving as a member of the board of directors, including amounts received as per diem stipends, bonuses and, generally, all other payments. Additionally, pursuant to regulations of the CMF, the Chilean securities regulator, the annual report must also include the total compensation and severance payments received by managers and principal executives, and the terms of and the manner in which board members and executive officers participated in any stock option plans.
LATAM Airlines Group’s directorsboard members are paid 60 UF per meeting (120 UF for the chairman of the board) and 48 UF for attendance to the subcommittee of Directors meetings. LATAM Airlines Group also provides certain benefits to its directorsboard members and executive officers, such as free and discounted airline tickets and health insurance. We do not have contracts with any of our directorsboard members to provide benefits upon termination of employment.
As set forth in further detail in the following table, in 20172019 the members of our board of directors including directors who were members of the Board until April 27, 2017, received fees and salaries in the aggregate amount of US$385,147.413,219.
| Board Members | | Fees (US$)(1) | |
| Ignacio Cueto Plaza | | | 48,65059,134 | |
Mauricio Rolim AmaroCarlos Heller Solari | | | 6,290 | |
Ramon Eblén Kadis | | | 17,017 | |
Juan Gerardo Jofré Miranda | | | 17,017 | |
Henri Philippe Reichstul | | | 26,09524,433 | |
| Juan José Cueto Plaza | | | 36,236 | |
Carlos Heller Solari | | | 14,842 | |
Georges de Bourguignon Arndt | | | 71,662 | |
Antonio Luiz Pizarro | | | 22,146 | |
Eduardo Novoa Castellón | | | 56,64536,224 | |
| Nicolás Eblén Hirmas | | | 54,64573,070 | |
| Henri Philippe Reichstul | | | 29,045 | |
| Sonia Villalobos | | | 30,316 | |
| Eduardo Novoa Castellón | | | 73,070 | |
| Giles Agutter | | | 15,90216,546 | |
| Patrick Horn | | | 50,460 | |
| Georges de Bourguignon Arndt(2) | | | 20,921 | |
| Total | | | 385,147413,219 | |
| (1) | Includes fees paid to members of the board of directors’ committee, as described below. |
Former board member, leaving the board on April 25, 2019.The above-mentioned directorsboard members were elected to the LATAM board of directors inon April 27, 2017, with the exception of Mauricio Rolim Amaro, Ramón Eblén Kadis and Juan Gerardo Jofré Miranda, who were members of the board of directors until April 27, 2017.25, 2019.
As required by Chilean law, LATAM Airlines Group makes obligatory contributions to the privatized pension fund system on behalf of its senior managers and executives, but it does not maintain any separate program to provide pension, retirement or similar benefits to these or any other employees.
C. Board Practices
Our board of directors is currently comprised of nine members. The terms of each of our current directors will expire in April 2019.2021. See “—Directors and Senior Management” above.
Committees
Board of Directors’ Committee and Audit Committee
Pursuant to Chilean Corporation Law, LATAM Airlines Group must have a board of directors’ committee composed of no less than three board members. LATAM Airlines Group has established a three-person Boardboard of Directors’directors’ Committee, which, among other duties, is responsible for:
| ● | examining the reports of LATAM Airlines Group’s external auditors, the balance sheets and other financial statements submitted by LATAM Airlines Group’s administrators to the shareholders, and issuing an opinion with respect thereto prior to their presentation to the shareholders for their approval; |
examining the reports of LATAM Airlines Group’s external auditors, the balance sheets and other financial statements submitted by LATAM Airlines Group’s administrators to the shareholders, and issuing an opinion with respect thereto prior to their presentation to the shareholders for their approval;
| ● | evaluating and proposing external auditors and rating agencies; |
evaluating and proposing external auditors and rating agencies;
| ● | reviewing internal control reports pertaining to related-party transactions; |
reviewing internal control reports pertaining to related-party transactions;
| ● | examining and reporting on all related-party transactions; and |
examining and reporting on all related-party transactions; and
reviewing the pay scale of LATAM Airlines Group’s senior management.
| ● | reviewing the pay scale of LATAM Airlines Group’s senior management. |
Under Chilean Corporation Law we are required, to the extent possible, to appoint a majority of independent directorsboard members to the Boardboard of Directorsdirectors Committee. A directorboard member is considered independent when he or she can be elected regardless of the voting of the controlling shareholders. See “Item 16. Reserved—G. Corporate Governance.”
Pursuant to U.S. regulations, we are required to have an audit committee of at least three board members, which complies with the independence requirements set forth in Rule 10A-3 under the Exchange Act. Given the similarity in the functions that must be performed by our Boardboard of Directors’directors’ Committee and the audit committee, our Boardboard of Directors’directors’ Committee serves as our Audit Committee for purposes of Rule 10A-3 under the Exchange Act.
As of December 31, 2017,2019, all of the members of our Boardboard of Directors’directors’ Committee, which also serves as our Audit Committee, were independent under Rule 10A-3 of the Exchange Act. As of December 31, 2017,2019, the committee members were Mr. Eduardo Novoa Castellón, Mr. Nicolás Eblen Hirmas and Mr. Georges de Bourguignon.Patrick Horn García. We pay each member of the committee 80 UFs per monthly assistance to meetings.
Other LATAM Board Committees
LATAM’s board of directors also has established four other committees to review, discuss and make recommendations to our board of directors. These include a Strategy & Sustainability Committee, a Leadership Committee, a Finance Committee and a Customers and Businesses Committee. The Strategy & Sustainability Committee focuses on the corporate strategy, current strategic issues and the three-year plans and budgets for the main business units and functional areas and high-level competitive strategy reviews. The Leadership Committee focuses on, among other things, group culture, high-level organizational structure, appointment of the LATAM CEO and his or her other reports, corporate compensation philosophy, compensation structures and levels for the LATAM CEO and other key executives, succession or contingency planning for the LATAM CEO and performance assessment of the LATAM CEO. The Finance Committee is responsible for financial policies and strategy, capital structure, monitoring policy compliance, taxation strategy and the quality and reliability of financial information. Finally, the Customers and Businesses Committee is responsible for setting the competitive strategies of the Customers and Commercial Vice Presidencies with a focus on sales, marketing, network and fleet initiatives, customer experience and revenue management.
On June, 2014 LATAM’s board of directors established a Risk Committee to oversee the creation, implementation and management of a risk matrix for the Company.
Corporate Governance Practices
On March 30, 2018,December, 2019, LATAM Airlines Group filed the Company’s Corporate Practices Report prepared according to General Rule N° 385, previously N°341, of the Securities and InsuranceChilean Financial Market Commission (“CMF”) issued June 8, 2015. The reporting obligation stipulated in this rule is for practices in place as of December 31st of each year and the report must be presented no later than March 31st of the following year.
The report provided each year to the Commission must cover the following subjects:
| ·● | the relationship between the company, shareholders and the public in general; |
| ·● | how senior officers are replaced and compensated; and |
| ·● | the definition, implementation and supervision of internal control and risk management policies and procedures inside the company. |
D. Employees
The following table sets forth the number of employees in various positions at the Company.
| Employees ending the period | | As of December 31, | | | As of December 31, | |
| | | 2017(1) | | 2016 | | 2015 | | | 2019(1) | | | 2018 | | | 2017 | |
| Administrative | | | 6,922 | | | | 8,010 | | | | 9,118 | | | | 6,966 | | | | 6,380 | | | | 6,922 | |
| Sales | | | 3,332 | | | | 4,235 | | | | 5,022 | | | | 2,505 | | | | 3,106 | | | | 3,332 | |
| Maintenance | | | 4,742 | | | | 4,895 | | | | 5,990 | | | | 4,911 | | | | 4,928 | | | | 4,742 | |
| Operations | | | 15,126 | | | | 15,924 | | | | 16,878 | | | | 13,538 | | | | 13,391 | | | | 15,126 | |
| Cabin crew | | | 9,016 | | | | 8,970 | | | | 9,383 | | | | 9,511 | | | | 9,196 | | | | 9,016 | |
| Cockpit crew | | | 3,957 | | | | 3,882 | | | | 4,022 | | | | 4,298 | | | | 4,169 | | | | 3,957 | |
| Total | | | 43,095 | | | | 45,916 | | | | 50,413 | | | | 41,729 | | | | 41,170 | | | | 43,095 | |
| (1) | AtAs December 31, 2017,2019, approximately 52% of our employees worked in Brazil, 27%25% in Chile, 19%10% in other Latin American countriesPeru, 5% in Argentina, 4% in Colombia, 2% in Ecuador and 3%2% in the rest of the world. |
Our salary structure is comprised of: (a) fixed payments (base salary and other fixed payments such as legal gratifications, local bonus, company seniority and others, depending on each country’s law and market practice); (b) short term incentives (associated with corporate, area and individual performance), applicable to our ground staff; (c) long term incentives (applicable to our senior executives (Senior Directors and above)).
According to the local law requirements, we make pension and social security contributions on behalf of our employees. Additionally, for our air staff and specialized professionals such as mechanics, we have fixed and variable payments, subject to the local collective agreements.
Regarding benefits, we usually provide life insurance and medical insurance, complementary of the coverage provided by the legal system. We also grant other benefits, according to local market practice (meal, transportation, maternal and paternal leave, etc.). Additionally, we have a global staff travel program, which grants free and discounted tickets to our permanent employees.
Long Term Incentive Compensation Program
At the Extraordinary Shareholders Meeting held on June 11, 2013, the Company’s shareholders approved a capital increase and the allocation of 1,500,000 shares to compensation plans for employees of the Company pursuant to Article 24 of the Chilean Corporations Law. The Company has not defined a date for implementation of this compensation plan yet.
| 2. | Compensation plan 2016-2018 |
The Company implemented a long-term retention plan for executives, with an end date of December 2018 and a vesting period between October 2018 and March 2019. The plan contemplates an extraordinary bonus to be paid in cash, whose calculation formula based on the variation of the value of the Company’s shares over time.
| 2. | LP2 compensation plans (2019-2020) |
The company implemented a long-term retention plan for executives effective between October 2019 and March 2020 that expires in March 2020, which consists of an extraordinary bonus based on the the value of the shares of LATAM. To date no payments have been made under this plan.
| 3. | SubsidiariesLP3 compensation plans (2020-2023) |
The Company implemented a program for a group of executives effective between October 2020 and March 2023 tha expires in March 2023, which consists of a extraordinary bonus that may be paid anually or subject to accrual and is based on target prices of the shares of LATAM.
| 4. | Subsidiary’s compensation plans |
| a. | As consequence of the resignation of the executives of Multiplus, S.A., a subsidiary of TAM S.A., has outstanding stock options at December 31, 2017, which amounted to 316,025 sharesthe option plans granted in respect of Multiplus S.A. (atwere canceled (as of December 31, 2016,2018, the distribution of outstanding stock options for current shares amounted to 394,698247,500 shares offor Multiplus S.A.). |
| b. | In MayAs of 2014December 31, 2019, payment contracts based on restricted shares signed with the Management Councilexecutives of Multiplus S.A. approved a plan to grant restricted stock, a total of 91,103 shares of Multiplus S.A.were canceled. |
For more information, please see noteNote 34 Note to our consolidated financial statements.
Labor Relations
We believe we generally maintain good relations with our employees and the unions, and expect to continue to enjoy good relations with our employees and the unions in the future. We also believe that we have built a solid base among our employees that will support and facilitate our growth plans. We can provide no assurance, however, that our employee compensation arrangements may not be subject to change or modification after the expiration of the contracts currently in effect, or that we will not be subject to labor-related disruptions due to strikes, stoppages or walk-outs.
Chile
AsDuring the year 2019, ten collective bargaining processes were carried out, all of them anticipated or not regulated, which implies that the union renounces the possibility of a general labor relations policystrike as a means of exerting legal pressure in Chile, we negotiate labor contracts with unions in anticipation of their scheduled expirations. As a non-negotiable clause, allthe negotiations. All the collective bargaining agreements are signed forthat were entered into have a duration of three years, which is the maximum legal term namely, four years. During 2017,allowed and, allows job stability for that time.
In parallel, during 2019s two new unions were formed: Labor Union of Workers of Easter Island, and Workers Union of LATAM did not have scheduled negotiations with itsTravel, forming a total of 20 unions but participated in anticipated collective bargaining negotiations with the following unions: LAN Express Cabin Crew Union and LAN Cabin Crew Union, with whom the Company has not yet reached an agreement but is expected to be concluded in 2018. In addition, during 2018 LATAM has a scheduled negotiations with LATAM Cargo pilots.Chile.
Ecuador
Three employee associations were formed in 2012, including pilots, other general employees but composed mostly of maintenance employees and other composed mostly by employees of airport administration. In November 2015, the Company signed a voluntary agreement with the association of pilots, in force until July 2019. The Company expects to participate in an anticipated negotiation with its pilots during 2018.
Additionally, in 2011 a union previously exclusive to cabin crew employees was integrated into the general employeesemployee’s union. This group maintains relations with the Company, but does not have the right to enter into or negotiate collective bargaining agreements under Ecuadorian law because less than 50%half of our employees eligible for membership are members of this union.
Additionally, three employee associations were formed in 2012, including pilots, other general employees but composed mostly of maintenance employees and other composed mostly by employees of airport administration. In July 2019, the Company renewed the voluntary agreement with the pilot’s association, valid until July 2023.
Argentina
In Argentina, 83% percent of September 2019, we began salary negotiations with unions with respect to adjustment for inflation and reached an agreement on January 17, 2020.
LATAM employees are affiliated with at least one of eight unions.CARGO international operations based in EZEIZA Airport were outsourced during last September despite a labor union disagreement.
In November 2017September 2019, we started to negotiateimplemented an Aircraft Interchange Agreement as a new operational model. This new operation process was supported by most of the annual adjustment for inflation with the eight unions, which we conluded in January 2018.pilots despite APLA (Asociación de Pilotos de Líneas Aéreas), disagreement. As a result of this action, a new trade union was created (UPAL - Unión de Pilotos Aviadores de LATAM).
In 20172020 we succeeded in implementing the Company’s planned changes to reduce operational labor and overhead costs, without significant protests or union intervention.During 2018 Argentina will continue working on different initiatives based on productivity and efficiency, avoiding conflicts or strikes, focusing on transforming LATAM Airlines Argentina into a more efficient company.
Colombia
In Colombia we have five different unions. The company held negotiations with: (i) the Technicians Union (ACMA), in 2014,2018, and reached an agreement that will be in force until June of 2018,2021, (ii) the Cabin Crew Union (ACAV), in 2014,2018, and reached an agreement that will be in force until DecemberJune of 2018,2021, (iii) the Industrial Union of Aviation Workers (SINTRATAC), in June 2016,2018, and reached an agreement that will be in force until MayJune of 2021, (iv) the Pilots’ Latam Colombia Union (ADALAC), in 2018, and (iv)reached an agreement that will be in force until January of 2021 and (v) the pilots’ union, ACDAC, in an arbitral hearingarbitration during the last quarter of 2017.
Peru
In Peru, there are six unions representingthat represent workers from different functional areas: pilots, cabin crew, aircraft technicians, flight dispatchers and airport workers. Our current collective agreements have a term of four years.
In 2017,2019, LATAM Airlines Peru continuedconcluded negotiations with the pilots union, and during 2017 negotiations began with the aeronautical technicians union (March) and the cabin crew union (August)and one of our aeronautical technicians' unions. Collective bargaining with the cabin crew union concluded through arbitration and with the aeronautical technician union in direct agreement.
During 2019, negotiation continued with the flight dispatchers’ union (negotiation began in September 2018). These three negotiations are expected to conclude with a collective bargaining agreement in the first half of 2018.2020.
During 2018, LATAM Airlines Peru will begin negotiations with the union of aircraft technicians and coordinators of ground operations (January), the airport workers union (March) and the flight dispatchers union (August). The negotiations are expected to conclude with a collective agreement in December 2018.
Brazil
Under Brazilian law, the term of collective bargaining agreements is limited to two years. LATAM Airlines Brazil’s collective bargaining agreements are valid for one year (in respect of the economic terms) and for two years (in respect of social terms).year. LATAM Airlines Brazil has historically negotiated collective bargaining agreements with teneleven unions in Brazil—one crew flight union, which represents pilots, copilots and flight attendants, and nineten ground staff unions. In December 2017,2019, LATAM Airlines Brazil renegotiated collective bargaining agreements with all the unions, which included a wage increase of 2.45%3.37%, in line with the inflation rate of the last 12 mounths plus 0.5 percentile points above inflation. For ground staff workers with salaries up to ten thousand dollars, the increase was R$ 245.00.months.
E. Share Ownership
As of December 31, 2017,2019, the members of our Boardboard of Directorsdirectors and our executive officers as a group owned 39.3%30.3% of our shares. See “Item 7. ControllingMajor Shareholders and Related Party Transactions.”
For a description of stock options granted to our executive officers, see “—D.Employees—D. Employees—Long Term Incentive Compensation Program.”
| ITEM 7. | CONTROLLINGMAJOR SHAREHOLDERS AND RELATED PARTY TRANSACTIONS |
A. Major Shareholders
Mr. Ignacio Cueto Plaza (Chairman of the Board of LATAM), Mr. Enrique Cueto Plaza (the CEO LATAM) and certain other Cueto family members and entities controlled by them, comprise the Cueto Group. As of February 28, 201829, 2020 the Cueto Group beneficially owned (as defined in Rule 13d-3 under the Securities Exchange Act) 27.91%21.46% of LATAM Airlines Group’s common shares. The Cueto Group is entitled to elect three of the nine members of our board of directors and is in a position to direct the management of the Company. In connection with our combination with TAM, members of the Cueto Group (which we also refer to collectively as the “LATAM Controlling Shareholders”) entered into a shareholder’s agreement with the Amaro Family, acting through TEP Chile, and TEP Chile entered into shareholder’s agreements with LATAM and TAM. See “—Shareholders’ Agreements.”
Following the combination with TAM, the Amaro Group became a major shareholder of LATAM Airlines Group. Through their 100% ownership of TEP Chile and majority ownership of the voting shares of Holdco I, which in turn owns 100% of the common shares of TAM, the Amaro Group, are controlling shareholders of TAM. This is the case even though LATAM is entitled to substantially all the economic rights arising from the operations of TAM by virtue of LATAM’s ownership of 100% of Holdco I and TAM non-voting shares. Please see Item 4. Information on the Company – History and Development of the Company. As of February 28, 2018,29, 2020, the Amaro Group owned 2.58%1.98%(2) of LATAM Airlines Group’s common shares. The terms of the shareholders’ agreement among the Amaro Group, LATAM and the LATAM Controlling ShareholdersCueto Group require the LATAM Controlling ShareholdersCueto Group and the Amaro Group to vote to elect individuals nominated to our board of directors in accordance with the direct and indirect shareholder interests in LATAM. See “—Shareholders’ Agreements.”
In addition to the Cueto Group and the Amaro Group, threefour other groups or entities are major shareholders of LATAM. As of February 28, 2018,29, 2020, the Eblen Group, which includes our director Nicolás Eblen, Hirmas, owned 5.93%4.56% of our common shares; the Bethia Group, which includes our vice-president of the Boardboard of Directorsdirectors, Carlos Heller, Solari, owned 5.50%4.23% of our common shares; and Qatar Airways Investments (UK) Ltd., whose nominee, Giles Agutter, is one of our directors, owned 10.03%10.00%(4)of our common shares and Delta Air Lines owned 20.00% of our common shares.
The table below sets forth additional information regarding the beneficial ownership of our common shares, as of February 28, 2018,29, 2020, by our controlling shareholders, other major shareholders or shareholder groups, and minority shareholders.
| | | Beneficial ownership
(as of February 29, 2020) | |
| | | Number of shares
of common stock
beneficially owned | | | Percentage of
common stock
beneficially owned | |
| Shareholder | | | | | | |
| | | | | | | |
| Cueto Group(1) | | | 130,165,390 | | | | 21.46 | % |
| Costa Verde Aeronautica S.A(2) (3) | | | 67,878,651 | | | | 11.19 | % |
| Costa Verde Aeronautica Tres SpA | | | 27,148,493 | | | | 4.48 | % |
| Inversiones Nueva Costa Verde Aeronautica Ltda. | | | 18,133,406 | | | | 2.99 | % |
| Costa Verde Aeronautica SpA | | | 9,228,949 | | | | 1.52 | % |
| Others | | | 7,775,891 | | | | 1.28 | % |
| | | | | | | | | |
| Delta Air Lines | | | 121,281,538 | | | | 20.00 | % |
| Delta Air Lines, Inc. | | | 121,281,538 | | | | 20.00 | % |
| | | | | | | | | |
| Qatar Airways(4) | | | 60,640,768 | | | | 10.00 | % |
| Qatar Airways Investments (UK) Ltda. | | | 60,640,768 | | | | 10.00 | % |
| | | | | | | | | |
| Amaro Group(2)(3) | | | 12,009,257 | | | | 1.98 | % |
| TEP Chile S.A. | | | 12,009,257 | | | | 1.98 | % |
| | | | | | | | | |
| Eblen Group | | | 27,644,702 | | | | 4.56 | % |
| Inversiones Andes SpA. | | | 13,187,037 | | | | 2.17 | % |
| Inversiones Andes II SpA | | | 6,152,633 | | | | 1.01 | % |
| Inversiones PIA SpA. | | | 4,155,953 | | | | 0.69 | % |
| Comercial las Vertientes SpA | | | 4,149,079 | | | | 0.68 | % |
| | | | | | | | | |
| Bethia Group | | | 25,662,136 | | | | 4.23 | % |
| Axxion S.A. | | | 14,207,454 | | | | 2.34 | % |
| Inversiones HS SpA. | | | 11,454,682 | | | | 1.89 | % |
| | | | | | | | | |
| All other minority shareholders | | | 229,003,902 | | | | 37.76 | % |
| | | | | | | | | |
| Total | | | 606,407,693 | | | | 100.00 | % |
| | | Beneficial ownership
(as of February 28, 2018) | |
| | | Number of shares
of common stock
beneficially owned | | | Percentage of
common stock
beneficially owned | |
| Shareholder | | | | | | | | |
| | | | | | | | | |
| Cueto Group(1) | | | 169,248,377 | | | | 27.91 | % |
| Costa Verde Aeronautica S.A(2) (3) | | | 88,259,650 | | | | 14.55 | % |
| Inversiones Costa Verde Aeronautica Tres SpA | | | 35,300,000 | | | | 5.82 | % |
| Inversiones Nueva Costa Verde Aeronautica Ltda. | | | 23,578,077 | | | | 3.89 | % |
| Costa Verde Aeronautica SpA | | | 12,000,000 | | | | 1.98 | % |
| Others | | | 10,110,650 | | | | 1.67 | % |
| | | | | | | | | |
| Qatar Airways(4) | | | 60,837,452 | | | | 10.03 | % |
| Qatar Airways Investments (UK) Ltda. | | | 60,837,452 | | | | 10.03 | % |
| | | | | | | | | |
| Eblen Group. | | | 35,945,199 | | | | 5.93 | % |
| Inversiones Andes SpA. | | | 17,146,529 | | | | 2.83 | % |
| Inversiones Andes II SpA | | | 8,000,000 | | | | 1.32 | % |
| Inversiones PIA SpA. | | | 5,403,804 | | | | 0.89 | % |
| Comercial las Vertientes SpA | | | 5,394,866 | | | | 0.89 | % |
| | | | | | | | | |
| Bethia Group. | | | 33,367,357 | | | | 5.50 | % |
| Axxion S.A. | | | 18,473,333 | | | | 3.05 | % |
| Inversiones HS SpA. | | | 14,894,024 | | | | 2.45 | % |
| | | | | | | | | |
| Amaro Group(2)(3) | | | 15,615,113 | | | | 2.58 | % |
| TEP Chile S.A. | | | 15,615,113 | | | | 2.58 | % |
| | | | | | | | | |
| All other minority shareholders | | | 291,394,195 | | | | 48.05 | % |
| | | | | | | | | |
| Total | | | 606,407,693 | | | | 100.00 | % |
(1)
| (1) | The ownership figures for the Cueto Group in this table exclude shares held directly by TEP Chile S.A. which are subject to the shareholders’ agreements described below. |
| (2) | Members of the Amaro Group also hold a 21.88% economic interest in Costa Verde Aeronáutica S.A. |
| (3) | The ownership figures for the Amaro Group in this table exclude shares held by the Cueto Group which are subject to the shareholders’ agreements described below. |
| (4) | Qatar owns 9.999999918% of total issued shares of LATAM. |
As of February 28, 2018, 3.98%29, 2020, 3.32% of our capital stock was held in the form of ADSs. Chilean pension funds held 21.75%17.32% of our capital stock and other minority investors held 22.33%17.12% in the form of common shares. It is not practicable for us to determine the number of ADSs or common shares beneficially owned in the United States. As of February 28, 2018,29, 2020, we had 1,4761,315 record holders of our common shares. It is not practicable for us to determine the portion of shares held in Chile or the number of record holders in Chile. All of our shareholders have identical voting rights.
Shareholders’ Agreements
Following the combination of LAN and TAM in June 2012, TAM S.A. continues to exist as a subsidiary of Holdco I and a subsidiary of LATAM, and LAN Airlines S.A. has been redesignated as “LATAM Airlines Group S.A.”
Prior to the consummation of the business combination, LATAM Airlines Group and the LATAM Controlling Shareholders entered into several shareholders’ agreements with TAM, the Amaro Group (acting through TEP Chile) and Holdco I, establishing agreements and restrictions relating to corporate governance in an attempt to balance LATAM Airlines Group’s interests, as the owner of substantially all of the economic rights in TAM, and those of the Amaro Group as the continuing controlling shareholders of TAM under Brazilian law, by prohibiting the taking of certain specified material corporate actions and decisions without prior supermajority approval of the shareholders and/or the board of directors of Holdco I or TAM. These shareholders’ agreements also set forth the parties’ agreement regarding the governance and management of the LATAM Airlines Group following the consummation of the combination of LAN and TAM.
Governance and Management of LATAM Airlines Group
We refer to the shareholders’ agreement among the LATAM Controlling Shareholders and the Amaro Group (acting through TEP Chile), which sets forth the parties’ agreement concerning the governance, management and operation of the LATAM Airlines Group, and voting and transfer of their respective LATAM Airlines Group common shares and TEP Chile’s voting shares of Holdco I, as the “control group shareholders’ agreement.” We refer to the shareholders’ agreement between LATAM Airlines Group S.A. and TEP Chile, which sets forth agreements concerning the governance, management and operation of the LATAM Airlines Group, as the “LATAM Airlines Group-TEP shareholders’ agreement.” The control group shareholders’ agreement and the LATAM Airlines Group-TEP shareholders’ agreement set forth the parties’ agreement on the governance and management of the LATAM Airlines Group following the effective time.
This section describes the key provisions of the control group shareholders’ agreement and the LATAM Airlines Group-TEP shareholders’ agreement. The description of the LATAM Airlines Group-TEP shareholders’ agreement summarized below and elsewhere in this annual report on Form 20-F is qualified in its entirety by reference to the full text of such shareholders’ agreements, which has been filed as exhibit to this annual report on Form 20-F.
Composition of the LATAM Airlines Group Board
Since April 2017, there are no restrictions in the control group shareholders’ agreement nor in the LATAM Airlines Group-TEP shareholders’ agreement regarding the composition of LATAM Airlines Group’s board of directors. Therefore, once elected in accordance with Chilean regulation, members of the LATAM Airlines Group’s board of directors have the right to appoint any member as the chairman of LATAM Airlines Group’s board of directors, from time to time, in accordance with the LATAM Airlines Group’s by-laws. Accordingly, on May, 2017 and on May 14, 2019, Mr. Ignacio Cueto Plaza was electedelgected as President of the Board.
Also, on April, 2017,On August 2018, Mr. Maurício Rolim AmaroAntonio Pizarro resigned tofrom the LATAM Airline’s Group’s Boardboard of Directors. Also indirectors, and as his replacement, the board of directors appointed Mrs. Sonia Villalobos, who was elected by the shareholders on the Ordinary Meeting of April, 2017, Mr. Reichstul was re-elected to the Board of Directors with the favorable vote of TEP Chile S.A. pursuant to applicable regulations.
25th 2019
Management of the LATAM Airlines Group
Mr.On September 10, 2019, LATAM announced that Enrique Cueto Plaza, has served as CEOChief Executive Officer of LATAM (“CEO LATAM”) since June 2012.2012, will leave this position as of March 31, 2020, being replaced as of such date by Mr. Roberto Alvo, current Chief Commercial Officer of LATAM. The CEO LATAM is the highest ranked officer of LATAM Airlines Group and reports directly to the LATAM board of directors. The CEO LATAM is charged with the general supervision, direction and control of the business of the LATAM Airlines Group and certain other responsibilities set forth in the LATAM Airlines Group-TEP shareholders’ agreement. After any departure of the current CEO LATAM, our board of directors will select his or her successor after receiving the recommendation of the Leadership Committee.
The head office of the LATAM Airlines Group continues to be located in Santiago, Chile.
Governance and Management of Holdco I and TAM
We refer to the shareholders’ agreement between us, Holdco I and TEP Chile, which sets forth our agreement concerning the governance, management and operation of Holdco I, and voting and transfer of voting shares of Holdco I, as the “Holdco I shareholders’ agreement” and to the shareholders’ agreement between us, Holdco I, TAM and TEP Chile, which sets forth our agreement concerning the governance, management and operation of TAM and its subsidiaries following the effective time, as the “TAM shareholders’ agreement.” The Holdco I shareholders’ agreement and the TAM shareholders’ agreement set forth the parties’ agreement on the governance and management of Holdco I, TAM and its subsidiaries (collectively, the “TAM Group”) following the combination of LAN and TAM.
This section describes the key provisions of the Holdco I shareholders’ agreement and the TAM shareholders’ agreement. The description of the Holdco I shareholders’ agreement and the TAM shareholders’ agreement summarized below and elsewhere in this annual report on Form 20-F are qualified in their entirety by reference to the full text of the aforementioned shareholders’ agreements, which have been filed as exhibits to this annual report on Form 20-F.
Composition of the Holdco I and TAM Boards
The Holdco I shareholders’ agreement and TAM shareholders’ agreement generally provide for identical boards of directors and the same chief executive officer at Holdco I and TAM, with LATAM appointing two directors and TEP Chile appointing four directors (including the chairman of the board of directors).
The control group shareholders’ agreement provides that the persons elected by or on behalf of the LATAM Controlling Shareholders or the Amaro Group to our board of directors must also serve on the boards of directors of both Holdco I and TAM.
Management of Holdco I and TAM
The day-to-day business and affairs of Holdco I will be managed by the TAM Group CEO under the oversight of the board of directors of Holdco I. The day-to-day business and affairs of TAM will be managed by the TAM Diretoria under the oversight of the board of directors of TAM. The TAM Diretoria will be comprised of the TAM Group CEO, the TAM CFO, the TAM COO and the TAM CCO, currently the CEO of TAM, will be the initial CEO of Holdco I and TAM, or the “TAM Group CEO” and any successor CEO will be selected by LATAM from three candidates proposed by TEP Chile. The TAM Group CEO will have general supervision, direction and control of the business and operations of the TAM Group (other than the international passenger business of the LATAM Airlines Group) and will carry out all orders and resolutions of the board of directors of TAM. The initial chief financial officer of TAM, or the “TAM CFO,” has been jointly selected by LATAM and TEP Chile and any successor CFO will be selected by TEP Chile from three candidates proposed by LATAM. The chief operating officer of TAM, or the “TAM COO,” and chief commercial officer of TAM, or the “TAM CCO,” will be jointly selected and recommended to the TAM board of directors by the TAM Group CEO and TAM CFO and approved by the TAM board of directors. These shareholders’ agreements also regulate the composition of the boards of directors of subsidiaries of TAM.
Following the combination, TAM continues to be headquartered in São Paulo, Brazil.
Supermajority Actions
Certain actions by Holdco I or TAM require supermajority approval by the board of directors or the shareholders of Holdco I or TAM which effectively require the approval of both LATAM and TEP Chile before the specified actions can be taken. Actions that require supermajority approval of the Holdco I board of directors or the TAM board of directors include, as applicable:
to approve the annual budget and business plan and the multi-year business (which we refer to collectively as the “approved plans”), as well as any amendments to these plans;
to take or agree to take any action which causes, or will reasonably cause, individually, or in the aggregate, any capital, operating or other expense of any TAM Company and its subsidiaries to be greater than (i) the lesser of 1% of revenue or 10% of profit under the approved plans, with respect to actions affecting the profit and loss statement, or (ii) the lesser of 2% of assets or 10% of cash and cash equivalents (as defined by IFRS) as set forth in the approved plan then in effect, with respect to actions affecting the cash flow statement;
to create, dispose of or admit new shareholders to any subsidiary of the relevant company, except to the extent expressly contemplated in the approved plans;
to approve the acquisition, disposal, modification or encumbrance by any TAM company of any asset greater than $15 million or of any equity securities or securities convertible into equity securities of any TAM Company or other company, except to the extent expressly contemplated in the approved plans;
| ● | to approve the annual budget and business plan and the multi-year business (which we refer to collectively as the “approved plans”), as well as any amendments to these plans; |
| ● | to take or agree to take any action which causes, or will reasonably cause, individually, or in the aggregate, any capital, operating or other expense of any TAM Company and its subsidiaries to be greater than (i) the lesser of 1% of revenue or 10% of profit under the approved plans, with respect to actions affecting the profit and loss statement, or (ii) the lesser of 2% of assets or 10% of cash and cash equivalents (as defined by IFRS) as set forth in the approved plan then in effect, with respect to actions affecting the cash flow statement; |
| ● | to create, dispose of or admit new shareholders to any subsidiary of the relevant company, except to the extent expressly contemplated in the approved plans; |
| ● | to approve the acquisition, disposal, modification or encumbrance by any TAM company of any asset greater than $15 million or of any equity securities or securities convertible into equity securities of any TAM Company or other company, except to the extent expressly contemplated in the approved plans; |
| ● | to approve any investment in assets not related to the corporate purpose of any TAM company, except to the extent expressly contemplated in the approved plans; |
| ● | to enter into any agreement in an amount greater than $15 million, except to the extent expressly contemplated in the approved plans; |
| ● | to enter into any agreement related to profit sharing, joint ventures, business collaborations, alliance memberships, code sharing arrangements, except as approved by the business plans and budget then in effect, except to the extent expressly contemplated in the approved plans; |
| ● | to terminate, modify or waive any rights or claims of a relevant company or its subsidiaries under any arrangement in any amount greater than $15 million, except to the extent expressly contemplated in the approved plans; |
| ● | to commence, participate in, compromise or settle any material action with respect to any litigation or proceeding in an amount greater than $15 million, relating to the relevant company, except to the extent expressly permitted in the approved plans; |
to approve any investment in assets not related to the corporate purpose of any TAM company, except to the extent expressly contemplated in the approved plans;
to enter into any agreement in an amount greater than $15 million, except to the extent expressly contemplated in the approved plans;
to enter into any agreement related to profit sharing, joint ventures, business collaborations, alliance memberships, code sharing arrangements, except as approved by the business plans and budget then in effect, except to the extent expressly contemplated in the approved plans;
to terminate, modify or waive any rights or claims of a relevant company or its subsidiaries under any arrangement in any amount greater than $15 million, except to the extent expressly contemplated in the approved plans;
to commence, participate in, compromise or settle any material action with respect to any litigation or proceeding in an amount greater than $15 million, relating to the relevant company, except to the extent expressly permitted in the approved plans;
to approve the execution, amendment, termination or ratification of agreements with related parties, except to the extent expressly contemplated in the approved plans;
to approve any financial statements, amendments, or any accounting, dividend or tax policy of the relevant company;
to approve the grant of any security interest or guarantee to secure obligations of third parties;
to appoint executives other than the Holdco I CEO or the TAM Director or to re-elect the then current TAM CEO or TAM CFO; and
to approve any vote to be cast by the relevant company or its subsidiaries in its capacity as a shareholder.
| ● | to approve the execution, amendment, termination or ratification of agreements with related parties, except to the extent expressly contemplated in the approved plans; |
| ● | to approve any financial statements, amendments, or any accounting, dividend or tax policy of the relevant company; |
| ● | to approve the grant of any security interest or guarantee to secure obligations of third parties; |
| ● | to appoint executives other than the Holdco I CEO or the TAM Director or to re-elect the then current TAM CEO or TAM CFO; and |
| ● | to approve any vote to be cast by the relevant company or its subsidiaries in its capacity as a shareholder. |
Actions requiring supermajority shareholder approval include:
to approve any amendments to the by-laws of any relevant company or its subsdiaries in respect to the following matters: (i) corporate purpose; (ii) corporate capital; (iii) the rights inherent to each class of shares and its shareholders; (iv) the attributions of shareholder regular meetings or limitations to attributions of the board of directors; (v) changes in the number of directors or officers; (vi) the term; (vii) the change in the corporate headquarters of a relevant company; (viii) the composition, attributions and liabilities of management of any relevant company and (ix) dividends and other distributions;
to approve the dissolution, liquidation, or winding up of a relevant company;
to approve the transformation, merger, spin-up or any kind of corporate re-organization of a relevant company;
to pay or distribute dividends or any other kind of distribution to the shareholders;
to approve the issuance, redemption or amortization of any debt securities, equity securities or convertible securities;
to approve a plan or the disposal by sale, encumbrance or otherwise of 50% or more of the assets, as determined by the balance sheet of the previous year, of Holdco I;
| •● | to approve any amendments to the by-laws of any relevant company or its subsidiaries in respect to the following matters: (i) corporate purpose; (ii) corporate capital; (iii) the rights inherent to each class of shares and its shareholders; (iv) the attributions of shareholder regular meetings or limitations to attributions of the board of directors; (v) changes in the number of directors or officers; (vi) the term; (vii) the change in the corporate headquarters of a relevant company; (viii) the composition, attributions and liabilities of management of any relevant company and (ix) dividends and other distributions; |
| ● | to approve the dissolution, liquidation, or winding up of a relevant company; |
| ● | to approve the transformation, merger, spin-up or any kind of corporate re-organization of a relevant company; |
| ● | to pay or distribute dividends or any other kind of distribution to the shareholders; |
| ● | to approve the issuance, redemption or amortization of any debt securities, equity securities or convertible securities; |
| ● | to approve a plan or the disposal by sale, encumbrance or otherwise of 50% or more of the assets, as determined by the balance sheet of the previous year, of Holdco I; |
| ● | to approve the disposal by sale, encumbrance of otherwise of 50% or more of the assets of a subsidiary of Holdco I representing at least 20% of Holdco I or to approve the sale, encumbrance or disposition of equity securities such that Holdco I loses control; |
to approve the grant of any security interest or guarantee to secure obligations in excess of 50% of the assets of the relevant company; and
to approve the execution, amendment, termination or ratification of acts or agreement with related parties but only if applicable law requires approval of such matters.
| ● | to approve the grant of any security interest or guarantee to secure obligations in excess of 50% of the assets of the relevant company; and |
| ● | to approve the execution, amendment, termination or ratification of acts or agreement with related parties but only if applicable law requires approval of such matters. |
Voting Agreements, Transfers and Other Arrangements
Voting Agreements
The LATAM Controlling Shareholders and TEP Chile have agreed in the control group shareholdersshareholder’s agreement to vote their respective LATAM Airlines Group common shares as follows:
the parties agree to vote their LATAM Airlines Group common shares to assist the other parties in removing and replacing the directors such other parties elected to the LATAM Airlines Group board of directors;
the parties agree to consult with one another and use their good faith efforts to reach an agreement on all actions (other than actions requiring supermajority approval under Chilean law) to be taken by the LATAM board of directors or the LATAM shareholders, and if unable to reach such agreement, to follow the proposal made by our board of directors;
the parties agree to maintain the size of the LATAM Airlines Group board of directors at a total of nine directors and to maintain the quorum required for action by the LATAM Airlines Group board of directors at a majority of the total number of directors of the LATAM Airlines Group board of directors; and
| ● | the parties agree to vote their LATAM Airlines Group common shares to assist the other parties in removing and replacing the directors such other parties elected to the LATAM Airlines Group board of directors; |
if, after good faith efforts to reach an agreement with respect to any action that requires supermajority approval under Chilean law and a mediation period, the parties do not reach such an agreement, then TEP Chile has agreed to vote its shares on such supermajority matter as directed by the LATAM Controlling Shareholders, which we refer to as a “directed vote.”
| ● | the parties agree to consult with one another and use their good faith efforts to reach an agreement on all actions (other than actions requiring supermajority approval under Chilean law) to be taken by the LATAM board of directors or the LATAM shareholders, and if unable to reach such agreement, to follow the proposal made by our board of directors; |
| ● | the parties agree to maintain the size of the LATAM Airlines Group board of directors at a total of nine directors and to maintain the quorum required for action by the LATAM Airlines Group board of directors at a majority of the total number of directors of the LATAM Airlines Group board of directors; and |
| ● | if, after good faith efforts to reach an agreement with respect to any action that requires supermajority approval under Chilean law and a mediation period, the parties do not reach such an agreement, then TEP Chile has agreed to vote its shares on such supermajority matter as directed by the LATAM Controlling Shareholders, which we refer to as a “directed vote.” |
The parties to the Holdco I shareholdersshareholder’s agreement and TAM shareholders agreement have agreed to vote their voting shares of Holdco I and shares of TAM so as to give effect to the agreements with respect to representation on the TAM board of directors discussed above.
Transfer Restrictions
Pursuant to the control group shareholders’ agreement, the LATAM Controlling Shareholders and TEP Chile are subject to certain restrictions on sales, transfers and pledges of the LATAM Airlines Group common shares and (in the case of TEP Chile only) the voting shares of Holdco I beneficially owned by them. Except for a limited amount of LATAM Airlines Group common shares, neither the LATAM Controlling Shareholders nor TEP Chile were permitted to sell any of their LATAM Airlines Group common shares, and TEP Chile was not permitted to sell its voting shares of Holdco I, until June 2015. Since then, sales of LATAM Airlines Group common shares by either party are permitted, subject to (i) certain limitations on the volume and frequency of such sales and (ii) in the case of TEP Chile only, TEP Chile satisfying certain minimum ownership requirements. On or after December 31, 2021, TEP Chile may sell all of its LATAM Airlines Group common shares and voting shares of Holdco I as a block, subject to (x) approval of the transferee by the LATAM board of directors, (y) the condition that the sale not have an adverse effect and (z) a right of first offer in favor of the LATAM Controlling Shareholders, which we refer to collectively as “block sale provisions.” An “adverse effect” is defined in the control group shareholders agreement to mean a material adverse effect on our and Holdco I’s ability to own or receive the full benefits of ownership of TAM and its subsidiaries or the ability of TAM and its subsidiaries to operate their airline businesses worldwide. The LATAM Controlling Shareholders have agreed to transfer any voting shares of Holdco I acquired pursuant to such right of first offer to LATAM for the same consideration paid for such shares.
In addition, TEP Chile may sell all LATAM Airlines Group common shares and voting shares of Holdco I beneficially owned by it as a block, subject to satisfaction of the block sale provisions, if a release event (as described below) occurs or if TEP Chile is required to make two or more directed votes during any 24-month period at two meetings (consecutive or not) of the shareholders of LATAM Airlines Group held at least 12 months apart and LATAM Airlines Group has not yet fully exercised its conversion option described below. A “release event” will occur if (i) a capital increase of LATAM Airlines Group occurs, (ii) TEP Chile does not fully exercise the preemptive rights granted to it under applicable law in Chile with respect to such capital increase in respect of all of its restricted LATAM Airlines Group common shares, and (iii) after such capital increase is completed, the individual designated by TEP Chile for election to the board of directors of LATAM Airlines Group with the assistance of the LATAM Controlling Shareholders is not elected to the board of directors of LATAM Airlines Group.
In addition, after December 31, 2021 and after the occurrence of the full ownership trigger date (as described below under the “—Conversion Option” section), TEP Chile may sell all or any portion of its LATAM Airlines Group common shares, subject to (x) a right of first offer in favor of the LATAM Controlling Shareholders and (y) the restrictions on sales of LATAM Airlines Group common shares more than once in a 12-month period.
The control group shareholders agreement provides certain exceptions to these restrictions on transfer for certain pledges of LATAM Airlines Group common shares made by the parties and for transfers to affiliates, in each case under certain limited circumstances.
In addition, TEP Chile agreed in the Holdco I shareholders agreement not to vote its voting shares of Holdco I, or to take any other action, in support of any transfer by Holdco I of any equity securities or convertible securities issued by it or by any of TAM or its subsidiaries without our prior written consent.
Restriction on transfer of TAM shares
LATAM agreed in the Holdco I shareholders’ agreement not to sell or transfer any shares of TAM stock to any person (other than our affiliates) at any time when TEP Chile owns any voting shares of Holdco I. However, LATAM will have the right to effect such a sale or transfer if, at the same time as such sale or transfer, LATAM (or its assignee) acquires all the voting shares of Holdco I beneficially owned by TEP Chile for an amount equal to TEP Chile’s then current tax basis in such shares and any costs TEP Chile is required to incur to effect such sale or transfer. TEP Chile has irrevocably granted us the assignable right to purchase all of the voting shares of Holdco Ibeneficially owned by TEP Chile in connection with any such sale.
Conversion Option
Pursuant to the control group shareholders’ agreement and the Holdco I shareholders’ agreement, we have the unilateral right to convert our shares of non-voting stock of Holdco I into shares of voting stock of Holdco I to the maximum extent allowed under law and to increase our representation on the TAM and Holdco I boards of directors if and when permitted in accordance with foreign ownership control laws in Brazil and other applicable laws if the conversion would not have an adverse effect (as defined above under the “—Transfer Restrictions” section). In February 2019, we completed the procedures for the exchange of shares of Holdco I S.A., through which LATAM Airlines Group SA increased its indirect participation in TAM S.A., from 48.99% to 51.04%. This transaction was undertaken pursuant to the Provisional Measure 863/2018 of December 13, 2018, through which the participation of up to 100% of foreign capital in airlines in Brazil is permitted.
On or after December 31, 2021, and after we have fully converted all of our shares of non-voting stock of Holdco I into shares of voting stock of Holdco I as permitted by Brazilian law and other applicable laws, we will have the right to purchase all of the voting shares of Holdco I held by the controlling shareholders of TAM for an amount equal to their then current tax basis in such shares and any costs incurred by them to effect such sale, which amount we refer to as the “sale consideration.” If we do not timely exercise our right to purchase these shares or if, after December 31, 2021, we have the right under applicable law in Brazil and other applicable law to fully convert all the shares of non-voting stock of Holdco I beneficially owned by us into shares of voting stock of Holdco I and such conversion would not have an adverse effect but we have not fully exercised such right within a specified period, then the controlling shareholders of TAM will have the right to put their shares of voting stock of Holdco I to us for an amount equal to the sale consideration.
Acquisitions of TAM Stock
The parties have agreed that all acquisitions of TAM common shares by LATAM Airlines Group, Holdco I, TAM or any of their respective subsidiaries from and after the effective time of the combination will be made by Holdco I.
B. Related Party Transactions
General
We have engaged in a variety of transactions with our affiliates, including entities owned or controlled by certain of our controlling shareholders. In the ordinary course of our business we render to and receive from related companiescompanies’ services of various types, including aircraft leases, aircraft interchanges, freight transportation and reservation services. Such transactions, none of which is individually material, are summarized in Note 33 to our audited consolidated financial statements for the fiscal year ended December 31, 2017.2019.
On August 2, 2016, the Boardboard of Directorsdirectors approved the Policy on Control of Related-Party Transactions of LATAM Airlines Group S.A. and its subsidiaries, which states:
| · | Related-party means, among others, subsidiaries, affiliates, natural persons or legal entities with control of 10% or more of the Company’s voting stock, vice presidents, directors or senior executives as well as their respective spouses, relatives, and companies in which said persons are either direct or indirect owners of 10% or more of the Company’s voting stock, or in which they have held a position over the last 18 months. |
| · | Related-Party Transactions can only be executed if said transactions are in LATAM’s interest and adjust to price, terms and conditions prevalent in the market for similar transactions with other third parties at the time of its approval. |
| · | Any and all negotiations, acts, contracts or operations in which a company of the LATAM Group and a party related to such company serve as the participants will be subject to the Policy. |
| ITEM 8. | FINANCIAL INFORMATION |
A. Consolidated Financial Statements and Other Financial Information
See “Item 3. Key Information—A. Selected Financial Data,” “Item 18. Financial Statements” and pages F-1 through F-131.
F-142.
Legal and Arbitration Proceedings
We are involved in routine litigation and other proceedings relating to the ordinary course of our business. The following is a description of all the material legal and arbitration proceedings.
In February 2006 the European Commission (“EC”), the Department of Justice of the United States (“DOJ”), the Canadian Competition Bureau (“CCB”), and Conselho Administrativo de Defesa Econômica (“CADE”), among others, initiated a global investigation of a large number of international cargo airlines (among them LAN Cargo) for possible price fixing of cargo fuel surcharges and other fees in the European and United States air cargo markets. As previously announced, LAN Cargo reached plea agreements with the DOJ and the CCB, which included the payment of fines, in relation to such investigation. On November 9, 2010, the EC imposed fines on 11 air carriers for a total amount of €799.4 million (equivalent to approximately US$1.1 billion). The fine imposed against LAN Cargo and its parent company, LAN, totaled €8.2 million (equivalent to approximately US$10.99.4 million). LAN provisioned US$25 million during the fourth quarter of 2007 for such fines, and maintained this provision until the fine was imposed in 2010. In 2010, LAN recorded a US$14.1 million gain (pre-tax) from the reversal of a portion of this provision. This was the lowest fine applied by the EC, which includes a significant reduction due to LAN’s cooperation with the Commission during the course of the investigation. In accordance with European Union law, on January 24, 2011 this administrative decision was appealed by LAN Cargo and LAN to the General Court in Luxembourg. Any judgment by the General Court may also be appealed to the Court of Justice of the European Union. The European Court of Justice overtuned overturnedthe Commission’s decision on December 16, 2015. On May 20 2016 the EC confirmed that they had decided not to appeal the case and to issue a new decision with the aim of correcting the faults identified in the judgement by the European Court of Justice. On March17, March 2017, the EC re-adopted its decision and imposed on LAN Cargo and its parent company, LATAM, a fine in the same amount, €8.2 million, as the original fine. On May 31, 2017 LAN Cargo and LATAM requested the annulment of this EC decision to the General Court of the European Union. On December 2017 LAN Cargo and LATAM presented their arguments for this annulment.annulment and on July 2019 LAN CARGO and LATAM participated in a hearing in the Court of Justice of the European Union.LATAM is waiting for the outcome and expects a favorablefurther reduction of the fine included in the decision by the General Courtgeneral court of the European Union at this time.Union.
Civil actions have also been initiated against many airlines, including LAN Cargo and LATAM Airlines Group, in various European countries (Great Britain, Norway, Holland and Germany). In the particular case of Great Britain there was a mediation process, at the end of the year 2018, with the participation of all airlines involved to try to reach an agreement. LATAM Airlines Group S.A., reached an agreement for approximately GBP 636,000. A settlement was signed in December 2018 and payment was made in January 2019. This mediation process concluded the claim for all class actions except one, for which a settlement was negotiated during the year 2009, and which settled in December 2019 for the amount of approximately GBP 222,469.63. The payment was made during the month of January 2020. This concluded the claim for all class-actions in Great Britain.
On September 3, 2013, CADE published its decision to impose a fine of US$51.0 million against ABSA, after an investigation, commenced in 2008, against several cargo airlines and airlines officers over allegations of anticompetitive practices regarding fuel surcharges in the air cargo business. CADE also imposed fines upon a former Director and two former employees in the amounts of US$1.0 million and US$510,000 respectively. On December 5, 2013 ABSA filed its application for Administrative Reconsideration before CADE. On December 19, 2014, CADE issued a new decision which reduced the fine against ABSA to US$ 9.823,1359,823,135 (based on an exchange rate of US$ 1 = R$ 3.3080). CADE also reduced the fines against ABSA’s Director and employees to US$ 247,896 and US$ 123,040, respectively (also based on an exchange rate of US$ 1 = R$ 3.3080). ABSA has initiated a judicial appeal against the Union Federal seeking an additional reduction of the fine amount. In December 2018, a Federal Court Judge ruled against ABSA, indicating that it will not apply an additional reduction to the light of said pending judicial appeal,fine imposed. The court’s decision was published in March 12, 2019. On March 13, we cannot predict the ultimate outcome of this matter at this time.
The investigations by the DOJ, CCB and the EC prompted the filing of civil actions and claims by freight forwarding and shipping companies against many airlines, including LAN Cargo and LATAM Airlines Group. LAN Cargo and ABSA reachedfiled a settlement agreement with the class action plaintiffs / non-class action claimants in the United States on August 6, 2012, and in Canada on August 20, 2013.
Civil actions have also been initiated against many airlines, including LAN Cargo and LATAM Airlines Group, in various European countries (Great Britain, Norway, Holland and Germany). The activity and progress of said civil actions is limited, in that they are now directly contingent upon the decisionmotion seeking clarification of the EC to issue a new decision correcting the faults identified in the judgement. We cannot predict the ultimate outcome of these cases at this time.federal court’s decision.
Agreements with the DOJ and the SEC. In 2011, authorities in Chile and the United States initiated investigations relating to certain payments by LATAM Airlines Group S.A. (formerly LAN Airlines S.A.) to a consultant who assisted in the resolution of labor issues in Argentina in 2006-2007. The Company voluntarily reported this situation to the Securities and Exchange Commission (“SEC”) and the Justice Department of the United States (“DOJ”) and actively cooperated in those investigations. On February 4, 2016, Ignacio Cueto, the former CEO of LAN, consented to entry of a cease-and-desist order by the SEC relating to the payments described above. Mr. Cueto agreed to pay a US$75,000 penalty to the SEC, to remain in compliance with LATAM’s compliance structure and internal accounting controls and to comply with the SEC’s books and records requirements. In July 2016, after multiple and prolonged exchanges of opinions and conversations with the DOJ and the SEC, LATAM also reached definitive agreements with both authorities.
In the case of the DOJ, the agreement took the form of a Deferred Prosecution Agreement (“DPA”), pursuant to which the DOJ will dismiss the charges after the expiration of a three-year period if LATAM complies with all terms of the DPA. Pursuant to the DPA, LATAM has admitted that the accounting for the payments made to the consultant in Argentina was incorrect and that, at the time that such payments were made (2006-2007), it lacked adequate internal controls. LATAM has also accepted an independent consultant, for 27 months, whose function will be to monitor, evaluate, and report to the DOJ on the effectiveness of LATAM’s compliance program. LATAM also committed to reporting to the DOJ on the effectiveness of the aforementioned compliance program for 9 months after the work of the independent consultant is finished. Lastly, LATAM paid a fine of US$12,750,000 to the DOJ.
The settlement with the SEC included the issuance by the SEC of a cease-and-desist order, which is an administrative order closing the investigation whereby LATAM has accepted certain obligations and statements of fact. The order also refers to the obligations related to the monitorship agreed under the DPA with the DOJ. LATAM paid a fine of US$6.74 million and interest of US$2.69 million.million to the SEC. On May 15, 2019, the external consultant certified that the anti-corruption compliance program of LATAM Airlines Group S.A. LATAM’s anti-corruption program was reasonably designed and implemented to prevent and detect violations within LATAM to anti-corruption laws. On July 23, 2019, the DOJ approved the certification made by the consultant on May 15, 2019 regarding the anticorruption compliance program of LATAM Airlines Group S.A. On January 31, 2020, the Florida Court approved the motion of the DOJ regarding the withdrawal of the criminal action against LATAM Airlines Group SA, in response to compliance with all the conditions of the DPA by LATAM, closing the process before the DOJ.
On September 27, 2019 a lawsuit was filed against LATAM Airlines Group S.A. in the U.S. District Court for the Southern District of Florida under the Cuban Liberty and Democratic Solidarity Act, 22 U.S.C. Section 6021 et seq., (the "Helms-Burton Act"). Plaintiff Jose Ramon Lopez Regueiro alleged in the complaint that he holds an interest in the Jose Marti Airport which was confiscated by the Cuban government in 1959, and that LATAM Airlines Group S.A. unlawfully "trafficked" in the said property. The plaintiff seeks all available statutory remedies, including the award of damages for the alleged trafficking in the expropriated property, plus reasonable attorney's fees and costs incurred, treble damages, post-judgment interest, and any other relief deemed appropriate by the court. LATAM is in the process of defending the claim, having filed motion to dismiss followed by a motion to stay discovery pending a ruling on the motion to dismiss. The matter is still in preliminary stages, and very little precedent has yet to be established to predict the final outcome of litigation should the matter proceed to trial and/or to determine the amount of reserve, if any.
Legal proceedings involving TAM
TAM Linhas Aéreas is party to one action filed by relatives of victims of an accident that occurred in October 1996 involving one of its Fokker 100 aircraft, which crashed during departure, in addition to 22 actions filed by residents of the region where the accident occurred, who are claimingclaimed pain and suffering, and a class action related to this crash.accident. All suits have now been concluded except one suit brought by the association of residents of a local street in respect of which TAM has been found liable by the 2nd Instance Court for damages to be assessed, subject to an appeal to the Superior Court. Most residents of the relevant street appear to have already been compensated through individual claims, which have been satisfied and thus should not be entitled to further compensation. No steps have been taken by any residents to try to obtain further compensation through the decision in favor of the residents association. Any further damages resulting from the aforementioned legal claimsclaim are covered by the civil liability guarantee provided for in TAM’s insurance policy with Itaú Unibanco Seguros S.A. We believe that the(now Chubb Seguros). The cap of US$400 million in that insurance policy is sufficient to cover any further potential penalties and judicial or extrajudicial agreements arising as a result of this matter.matter
Insurance coverage has been sufficientIn relation to cover the liabilities arising from an accident that occurred in July 2007 involving an Airbus A320 aircraft from(PR-MBK) accident of TAM Linhas Aereas. Settlements have been madeAéreas (TAM) at CGH on July 17, 2007, settlements were concluded directly between the insurance companyinsurers/reinsurers and the victims’ families. Asfamilies, third parties and ex-employees. Almost all claims and suits have now been concluded and there is ongoing litigation against TAM relating to only one fatal victim and one third party land owner. The administrative action regarding the extent of December 31, 2013, approximately 196 settlements have occurred and others are under negotiation between the insurance company and victims’ families. Management believes that theprimary insurance coverage payable regarding victims on board the aircraft remains on appeal by TAM and the other defendants to the Superior Court in Brasília. No steps have been taken by any party to attempt preliminary execution of the 2nd Instance decision and there should be good arguments to defend any such action based on the releases signed by all claimants upon receiving final compensation. The insurance coverage with Itaú Unibanco Seguros S.A. (now Chubb Seguros) is adequate to cover any further liabilities arising and that LATAM Airlines Brazil will not incur any expenses that were not contemplated by the scope of the insurance policy that would result in TAM’s obligation to pay damages.policy.
On January 31, 2018, Airbus S.A.S., Airbus North America Customer Services, Inc. and Allianz Corporate & Specialty SE (France) filed an arbitration claim with the International Centre for Dispute Resolution against AIG Europe Limited (“AIG”), TAM S.A. (“TSA”) and TAM Linhas Aéreas S.A. (“TLA”) seeking a decision on the validity of a shared-defense agreement that had been discussed but never finalized or executed by the parties. The plaintiffs allege that the parties exchanged enough correspondence and drafts to reflect the terms of a contract. Based on this alleged contract, they are demanding that TAM reimburse Airbus a sum of approximately US$9,200 for settlement costs and US$3,000 for legal fees, in addition to interest and any other amount decided by the Arbitrator On October 8, 2018, the plaintiffs filed a formal complaint that contained declarations by their supporting experts. On November 7, 2018, the Arbitrator issued a procedural ruling dividing the jurisdiction phase from the grounds-for-arbitration phase, thus expressing his agreement with the arguments by TSA and TLA as well as AIG. Upon request of the parties, the Arbitrator postponed the respondents' deadline of December 14, 2018 to submit their briefs contesting jurisdiction, while the parties held settlement negotiations. Finally, in December 2018, the parties agreed to hold a meeting to discuss a potential settlement that resulted in an agreement whereby Allianz Corporate & Speciality SE payed AIG US$95 million toward the loss already settled by AIG for the accident. In exchange, all lawsuits and arbitration claims were withdrawn at no additional cost to LATAM. The arbitration has concluded.
Tax related
TAM Linhas Aereas and other plaintiffs filed an ordinary actionclaim with a request for injunctive relief for non-payment of the Airline Workers Fund, a tax charged monthly at the rate of 2.5% of an airline’s total payroll. Currently, judgment is pending on an appeal that TAM lodged challenging the initial decision (which was ruled in favor of the Brazilian National Institute of Social Security (“INSS”)). InRegarding the period between 2004 and 2011,2012, the INSS issued ana tax assessment notice tolling the Statute of Limitations of the social security creditcharging amounts as a result of TAM Linhas Aereas’ non-payment of the Airline Workers Fund. The company made deposits with the Court of total amounts required to guarantee the debts potentially owed. The administrative proceedings have been suspended until completionthe conclusion of the judicial process.claim. The approximate adjusted value of thisamounts potentially due in such proceeding as of December 31, 2012 was US$43.3 million. In the opinion of our legal advisors, the chance of losing in this proceeding is possible.probable. Assuming payment of this tax is required by law, we have established a provision in the amount of US$100.287,4 million (R$ 331 million)352.220.015,07) related to the TAM’s part as of December 31, 2017, pending the final outcome of the matter.
2019. TAM Linhas Aereas is a plaintiff in an action filedjudicial claim against the Brazilian government infrom 1993 seeking indemnity for damages forsuffered because of the break-up of an air transportation concession agreement that resulted in the freezing of TAM’s prices from 1988 to September 1993 in order to maintain operations with the prices set by the Brazilian government during that period. The process is currently being heard before the Federal Regional Court and judgment is pending an appeal by TAM. The estimated value of the action on December 31, 20172019 is MUS$240.3US$197.3 million (R$795million). This sum is subject to delinquent interest since September 1993 and inflation adjustment since November 1994. Based on the opinion of TAM’s legal advisors, and recent rulings handed down by the Brazilian Supreme Court of Justice in favor of airlines in similar cases (specifically, actions filed by Transbrasil and Varig), we believe that TAM’s likelihood of success is probable.probable once the second judicial level court issued decision denying the claim. The Company filed a motion for clarification on the basis of omitted points in the judgment, which is pending in the Court. We have not recognized these credits in our financial statements and will only do so if and when the aforementioned decision is final. rendered final by the Court.
TAM Linhas Aereas filed an ordinary claim, with a request for early judgment, in relation to a dispute concerningdiscuss the legality of charging the Adicional das Tarifas Aeroportuárias (“Additional Airport Tariffs,” or “ATAERO”), which are charged at a rate of 50% on the value of tariffs and airport tariffs. A decision by the superior court is pending. The amount of potential recovery is indeterminate at this time.
In addition, one administrative proceeding had been filed against TAM Linhas Aéreas concerning the alleged failure to pay an Industrialized Products Tax (“IPI”) and Import Tax (“II”) due on imported aircraft. In response, we filed the appropriate challenges on the basis that no federal tax should be payable on the imported aircraft because it is a leased aircraft. The total amount involved in this administrative proceeding is MUS$US$2.33 (R$7.7 million)million as of December 31, 2017. The administrative proceeding awaits a decision. In the opinion of our legal advisors, the chance of losing in this proceeding is possible.
A tax assessment was issued by the Brazilian IRS for the collection of Income Tax ("IRPJ") and Social Contribution on Net Income ("CSLL"), and a fine of 150% and interest was imposed on TAM. In summary, the RFBBrazilian IRS intends to requirelevy IRPJ and CSLL on the alleged capital gain earned by TAM S/A, as a result of the reduction of the capital stock of the controlled company Multiplus S/A. On December 31, 20172019 the updated amount of the assessment and fees discussed was approximately MUS$148.73US$132.2 million (R$ 492533 million). TheseThe Administrative Court issued a second level decision canceling the tax proceedings are currently in process and subject to reviewassessment. This decision can still be challenged by the Brazilian IRS before the third level – Administrative Superior Court (CARF) and awaiting final administrative decision.
A tax assessment was issued by the SaoSão Paulo Municipality in order to charge tax (ISS) on tour packages sold by Fidelidade Viagens e Turismo S/A between 2010 and 2015. On December 31, 20172019 the updated amount of the assessment discussed was approximately MUS$108.22US$95 million (R$ 358383 million). The Company believes that a favorable outcome is not likely. These tax proceedings are currently in a judicial discussion (Annulatory Action filed in January 2018).probable. A first level decision was issued favorable to the company, but remains subject to appeal by the counterparty.
A tax assessment of PIS/COFINS credits was issued by the Brazilian IRS on International Air Freight Shipping Services in the amount of MUS$73.76US$65.76 million (R$244244.65 million) as of December 31, 2019. The Administrative Court issued decisions canceling the total penalty and the major part of the amounts owed. The remaining amount is still under determination by the Brazilian IRS.
Federal Revenue Service issued a tax assessment notice against TLA in the amount of US$121 million (R$485 million) as of December 31, 2019, due to alleged irregularities of the Company related to the social security contribution on the risks of work accident (GILRAT - former "SAT"), in the term from November 2013 until December 2017. TLA has presented their defense to the Administrative Court, but on February 7, 2019 the court denied the defense and kept the tax assessment. The possible outcomeproceedings are now pending the judgment on the appeal filed before second level Court (CARF). In the opinion of our legal advisors, losing in this proceeding is probable. It is important to highlight that the Company recently won a similar case is likely to be unfavorable and a penalty of MUS$60.78, (R$168 million) is expected. These tax proceedings are currently in process and subject to reviewwhere the Brazilian IRS was seeking the same contribution related the years 2011-2012. This assessment was canceled by the Administrative Superior Court (CARF) awaiting final administrative decision.Court.
On December 12, 2019 Brazilian IRS issued a Tax Assessment of PIS COFINS credits related to 2014 on the amount of US$ 42 million (R$170million). The company will file defense in the same ground of the case reported above.
It is important to highlight that TAM Linhas Aereas has other relevant legal cases involving tax issues.
In addition, there are a few claims made to, and/or legal proceedings filed against the Company, though those are not expected to have a material impact on the Group’s financial situation or profitability. While it is not feasible to predict the outcome of the pending claims, proceedings, and investigations described with certainty, management is of the opinion that their ultimate disposition should not have a material adverse effect on the Company’s financial position, cash flows, or results of operations.
For additional Legal Proceedings relating to the ordinary course of our business, please see Note 3031 – Contingencies – to our audited consolidated financial statements.
Dividend Policy
In accordance with the Chilean Corporation Law, LATAM must distribute cash dividends equal to at least 30% of its annual consolidated net income calculated in accordance with IFRS subject to the terms ofOficio Circular No. 856 issued on October 17, 2014 by the Chilean Superintendency of Securities and Insurance.Financial Market Commission. If there is no net income in a given year, LATAM can elect but is not legally obligated to distribute dividends out of retained earnings. The board of directors may declare interim dividends out of profits earned during such interim period. Pursuant to LATAM’s by-laws, the annual cash dividend is approved by the shareholders at the annual ordinary shareholders’ meeting held between February 1 and April 30 of the year following the year with respect to which the dividend is proposed. All outstanding common shares are entitled to share equally in all dividends declared by LATAM, unless the shares have not been fully paid by the shareholder after being subscribed.
Holders of ADSs will be entitled to receive dividends on the underlying common shares to the same extent as holders of common shares. Holders of ADRs on the applicable record dates will be entitled to receive dividends paid on the common shares represented by the ADSs evidenced by such ADRs. Dividends payable to holders of ADSs will be paid by us to the depositary in Chilean pesos and remitted by the depositary to such holders net of foreign currency conversion fees and expenses of the depositary and will be subject to Chilean withholding tax currently imposed at a rate of 35% (subject to credits in certain cases as described under “Item 10. Additional Information— E. Taxation—Cash Dividends and Other Distributions”). Owners of the ADSs will not be charged any dividend remittance fee by the depositary with respect to cash dividends.
Chilean law requires that holders of shares of Chilean companies that are not residents of Chile register as foreign investors under one of the foreign investment regimes established by Chilean law in order to have dividends, sale proceeds or other amounts with respect to their shares remitted outside Chile through the Formal Exchange Market (Mercado Cambiario Formal). Under our Foreign Investment Contract, the depositary, on behalf of ADS holders, will be granted access to the Formal Exchange Market to convert cash dividends from pesos to U.S. dollars and to pay such U.S. dollars to ADS holders outside Chile.
B. Significant Changes
None.
| ITEM 9. | THE OFFER AND LISTING |
A. Offer and Listing Details
The principal trading market for our common shares is the Santiago Stock Exchange (“SSE”). The common shares have been listed on the SSE under the symbol “LAN” since 1989, and the ADSs have beenwere listed on the NYSE under the symbol “LFL” sinceon November 7, 1997. On May 15, 2017, LATAM changed the symbol of its ADSs listed on the NYSE from “LFL” to “LTM”, as well as its shares listed on the SSE formfrom “LAN” to “LTM”. The common shares also trade on the Bolsa de Valores de Valparaíso and the Bolsa Electrónica de Chile. The outstanding ADSs are identified by the CUSIP number 501723100. The following table sets forth, for the periods indicated, the high and low closing sale prices on the SSE for the common shares and the high and low closing prices on the NYSE for the common shares represented by ADSs. The information set forth in the table below reflects actual historical amounts and has not been restated in constant Chilean pesos.
| | Ch$ per Common Share | | | US$ per ADS | |
| Period | | Low | | | High | | | Low | | | High | |
| | | | | | | | | | | | | |
| 2013 | | | 5,967.3 | | | | 11,755.4 | | | | 11.62 | | | | 24.84 | |
| | | | | | | | | | | | | | | | | |
| | | | | | | | | | | | | | | | | |
| 2014 | | | 6,533.3 | | | | 8,791.6 | | | | 10.60 | | | | 16.36 | |
| | | | | | | | | | | | | | | | | |
| | | | | | | | | | | | | | | | | |
| 2015 | | | 3,270.2 | | | | 7,198.3 | | | | 4.64 | | | | 11.82 | |
| | | | | | | | | | | | | | | | | |
| 2016 | | | | | | | | | | | | | | | | |
| Quarters: | | | | | | | | | | | | | | | | |
| First | | | 3,276.4 | | | | 4,730.5 | | | | 4.49 | | | | 7.00 | |
| Second | | | 4,163.5 | | | | 4,893.4 | | | | 5.86 | | | | 7.40 | |
| Third | | | 4,350.6 | | | | 5,855.8 | | | | 6.53 | | | | 8.96 | |
| Fourth | | | 5,341.6 | | | | 6,460.4 | | | | 8.18 | | | | 9.86 | |
| | | | | | | | | | | | | | | | | |
| | | | | | | | | | | | | | | | | |
| | | | | | | | | | | | | | | | | |
| Annual: | | | | | | | | | | | | | | | | |
| Annual 2016 | | | 3,276.4 | | | | 6,460.4 | | | | 4.49 | | | | 9.86 | |
| | | | | | | | | | | | | | | | | |
| | | | | | | | | | | | | | | | | |
| 2017 | | | | | | | | | | | | | | | | |
| Quarters: | | | | | | | | | | | | | | | | |
| First | | | 5,574.1 | | | | 8,759.0 | | | | 8.18 | | | | 13.24 | |
| Second | | | 7,298.5 | | | | 8,810.0 | | | | 10.97 | | | | 13.62 | |
| Third | | | 7,387.0 | | | | 8,950.0 | | | | 11.04 | | | | 14.40 | |
| Fourth | | | 7,924.0 | | | | 8,887.2 | | | | 12.08 | | | | 14.48 | |
| | | | | | | | | | | | | | | | | |
| Months: | | | | | | | | | | | | | | | | |
| September | | | 7,960.2 | | | | 8,950.9 | | | | 12.78 | | | | 14.40 | |
| October | | | 8,454.4 | | | | 8,887.2 | | | | 13.33 | | | | 14.03 | |
| November | | | 8,128.4 | | | | 8,856.0 | | | | 12.65 | | | | 14.48 | |
| December | | | 7,924.0 | | | | 8,773.1 | | | | 12.08 | | | | 13.95 | |
| | | | | | | | | | | | | | | | | |
| Annual: | | | | | | | | | | | | | | | | |
| Annual 2017 | | | 5,574.1 | | | | 8,950.9 | | | | 8.18 | | | | 14.48 | |
| | | | | | | | | | | | | | | | | |
| 2018 | | | | | | | | | | | | | | | | |
| Months: | | | | | | | | | | | | | | | | |
| January | | | 8,662.5 | | | | 10,467.0 | | | | 14.27 | | | | 17.19 | |
| February | | | 9,183.6 | | | | 10,299.0 | | | | 15.47 | | | | 17.13 | |
| March | | | 9,131.0 | | | | 9,761.2 | | | | 14.91 | | | | 16.34 | |
Source: Bloomberg
As of December 31, 2017,2019, a total of 606,407,693 million common shares were outstanding, including common shares represented by ADSs.
B. Plan of Distribution
Not applicable.
C. Markets
Trading
Chile
The Chilean stock market, which is regulated by the CMF under Law 18,045 of October 22, 1981, as amended, which we refer to as the Securities Market Law, is one of the most developed among emerging markets, reflecting the particular economic history and development of Chile. The Chilean government’s policy of privatizing state-owned companies, implemented during the 1980s, led to an expansion of private ownership of shares, resulting in an increase in the importance of stock markets. Privatization extended to the social security system, which was converted into a privately managed pension fund system. These pension funds have been allowed, subject to certain limitations, to invest in stocks and are currently major investors in the stock market. Some market participants, including pension fund administrators, are highly regulated with respect to investment and remuneration criteria, but the general market is less regulated than the U.S. market with respect to disclosure requirements and information usage.
Equities, closed-end funds, fixed-income securities, short-term and money market securities, gold and U.S. dollars are traded on the SSE. In 1991, the SSE initiated a futures market with two instruments: U.S. dollar futures and Selective Shares Price Index, or IPSA, futures. Securities are traded primarily through an open voice auction system; a firm offers system or daily auctions. Trading through the open voice system occurs on each business day from 9:30 a.m. to 4:30 p.m. The SSE has an electronic system of trade, calledTelepregón HT, which operates continuously for stocks trading in high volumes from 9:30 a.m. to 4:00 p.m. (or 5:00 p.m., depending on the period of the year). The Chilean Electronic Stock Exchange operates continuously from 9:30 a.m. to 4:30 p.m. (or 5:30 p.m., depending on the period of the year) on each business day. In February 2000, the SSE Off-Shore Market began operations. In the Off-Shore Market, publicly offered foreign securities are traded and quoted in U.S. dollars.
D. Selling Shareholders
Not applicable.
E. Dilution
Not applicable.
F. Expenses of the Issue
Not applicable.
| ITEM 10. | ADDITIONAL INFORMATION |
This Item reflects legal amendments effected by Chilean Law No. 20,382 on Corporate Governance, which was enacted on October 13, 2009, and came into effect on October 20, 2009, and Chilean Law No. 20,552, which modernized and encouraged competition in the financial system, was enacted on November 6, 2011 and came into effect on December 17, 2011.
A. Share Capital
Not applicable.
B. Memorandum and Articles of Association
Set forth below is information concerning our share capital and a brief summary of certain significant provisions of our by-laws and Chilean law. This description contains all material information concerning the common shares but does not purport to be complete and is qualified in its entirety by reference to our by-laws, the Chilean Corporation Law and the Securities Market Law, each referred to below. For additional information regarding the common shares, reference is made to our by-laws, a copy of which is included as Exhibit 1.1 to this annual report on Form 20-F.
Organization and Register
LATAM Airlines Group is a publicly held stock corporation (sociedad anónima abierta) incorporated under the laws of Chile. LATAM Airlines Group was incorporated by a public deed dated December 30, 1983, an abstract of which was published in the Chilean Official Gazette (Diario Oficial de la República de Chile) No. 31.75931,759 on December 31, 1983, and registered on page 20,341, No. 11,248 of the Chilean Real Estate and Commercial Registrar (Registro de Comercio del Conservador de Bienes Raices de Santiago) for the year 1983. Our corporate purpose, as stated in our by-laws, is to provide a broad range of transportation and related services, as more fully set forth in Article Four thereof.
General
Shareholders’ rights in a Chilean companycorporation are generally governed by the company’s by-laws and the Chilean Corporation Law. Article 22 of the Chilean Corporation LawAct states that the purchaser of shares of a companycorporation implicitly accepts its by-laws and any prior agreements adopted at shareholders’ meetings. Additionally, the Chilean Corporation Law regulates the government and operation of corporations (“sociedades anónimas,” or S.A.) and provides for certain shareholder rights. Article 137 of the Chilean Corporation LawAct provides that the provisions of the Chilean Corporation LawAct take precedence over any contrary provision in a corporation’s by-laws. The Chilean Corporation Law and our by-laws also provide that all disputes arising among shareholders in their capacity as such or between us or our administrators and the shareholders may either be submitted to arbitration in Chile or to the courts of Chile at the election of the plaintiff initiating the action. Despite the foregoing, a recent legal amendment hasit is forbidden for certain individuals (directors, senior managers, administrators and main executives of the corporation, and any shareholder that directly or indirectly holds shares whose book or market value exceed 5,000 UF at the moment of filing of the action) from submitting such action before the ordinary courts, thus obligating them to proceed with arbitration in all situations. Finally, Decree-Law No. 3,500 on Pension Fund Administrators, which allows pension funds to invest in the stock of qualified corporations, indirectly affects corporate governance and prescribes certain rights of shareholders. The Chilean Corporation LawAct sets forth the rules and requirements under which a corporation is deemed to be “publicly held.” Article 2 of the Chilean Corporation LawAct defines publicly held corporations as corporations that register their shares with theRegistro de Valores (Securities Registry) of the CMF, either voluntarily or pursuant to a legal obligation. In addition, Article 5 of the Chilean Securities Market Law indicates which corporation’s shares must be registered with the Securities Registry:
| 88● | one with 500 or more shareholders; |
| ● | one in which 100 or more shareholders own at least 10% of the subscribed capital (excluding any direct or indirect individual holdings exceeding 10%); and |
| ● | one in which the shareholders agreed voluntarily to be registered. |
one with 500 or more shareholders; and
one in which 100 or more shareholders own at least 10% of the subscribed capital (excluding any direct or indirect individual holdings exceeding 10%).
The framework of the Chilean securities market is regulated by the CMF under the Securities Market Law and the Chilean Corporation Law, which imposes certain disclosure requirements, restricts insider trading, prohibits price manipulation and protects minority investors. In particular, the Securities Market Law establishes requirements for public offerings, stock exchanges and brokers and outlines disclosure requirements for corporations that issue publicly offered securities.
Ownership Restrictions
Under Articles 12 and 20 of the Securities Market Law and General Rule 269 issued by the SVS in 2009, certain information regarding transactions in shares of publicly held corporations must be reported to the CMF and the Chilean stock exchanges on which the shares are listed. Since the ADRs are deemed to represent the shares underlying the ADSs, transactions in ADRs will be subject to those reporting requirements. Among other matters, the beneficial owners of ADSs that directly or indirectly hold 10% or more of the subscribed capital of LATAM Airlines Group, or that reach or exceed such percentage through an acquisition, are required to report to the CMF and the Chilean stock exchanges, the day following the event:
any acquisition or sale of shares; and
any acquisition or sale of contracts or securities the price or performance of which depends on the price variation of the LATAM Airlines Group’s shares.
| ● | any acquisition or sale of shares; and |
| ● | any acquisition or sale of contracts or securities the price or performance of which depends on the price variation of the LATAM Airlines Group’s shares. |
These obligations are extended (i) to certain individuals (immediate family, next of kin and others) if the ADS holder is a natural person; (ii) to any entity controlled by the holder, if the ADS is a legal entity; and (iii) to groups, if a holder has any joint action agreement with other holders and the group reaches or exceeds the cited threshold.
In addition, majority shareholders must state in their report whether their purpose is to acquire control of the company or if they are making a financial investment.
Under Article 54 of the Securities Market Law and under CMF regulations, persons or entities that intend to acquire control, whether directly or indirectly, of a publicly traded company, must follow certain notice requirements, regardless of the acquisition vehicle or procedure or whether the acquisition will be made through direct subscriptions or private transactions. In the first place, the potential acquiroracquirer must send a written communication to the target corporation, any companies controlling or controlled by the target corporation, the CMF and the Chilean stock exchanges on which the target’s securities are listed, stating, among other things, the person or entity purchasing or selling and the price and conditions of any negotiations. Subsequently, the potential acquiroracquirer must also inform the public of its planned acquisition by means of a publication in two Chilean newspapers with national distribution and by uploading such notice to the acquiror’sacquirer’s website, if available. Both requirements shall be met at least ten business days prior to the date on which the acquisition transaction is to close, and in any event, as soon as negotiations regarding the change of control have been formalized or when confidential information or documents concerning the target are delivered to the potential acquiror.acquirer. The notices must state, among other things, the person or entity purchasing or selling and the price and conditions of any negotiations.
In addition to the foregoing, Article 54A of the Securities Market Law requires that within two business days of the completion of the transactions pursuant to which a person has acquired control of a publicly traded company, a notice shall be published in the same newspapers in which the notice referred to above was published and notices shall be sent to the same persons mentioned in the preceding paragraphs.
Consequently, a beneficial owner of ADSs intending to acquire control of LATAM Airlines Group will be subject to the foregoing reporting requirements.
The provisions of the aforementioned articles do not apply whenever the acquisition is being made through a tender or exchange offer.
Title XXV of the Securities Market Law on tender offers and CMF regulations provide that the following transactions shall be carried out through a tender offer:
an offer which allows the taking control of a publicly traded company, unless the shares are being sold by a controlling shareholder of such company at a price in cash which is not substantially higher than the market price and the shares of such company are actively traded on a stock exchange;
| •● | an offer which allows the taking control of a publicly traded company, unless the shares are being sold by a controlling shareholder of such company at a price in cash which is not substantially higher than the market price and the shares of such company are actively traded on a stock exchange; |
| ● | an offer for all the outstanding shares of a publicly traded company upon acquiring two-thirds or more of its voting shares (this offer must be made at a price not lower than the price at which appraisal rights may be exercised, that is, book value if the shares of the company are not actively traded or, if the shares of the company are actively traded, the weighted average price at which the stock has been traded during the 60 stock-exchange-business-day period between the 30th and the 90th stock-exchange-business-days immediately preceding the acquisition); and |
an offer for a controlling percentage of the shares of a publicly traded company if the acquiror intends to take control of the company (whether publicly traded or privately held) controlling such publicly traded company, to the extent that the latter represents 75.0% or more of the consolidated net assets of the former.
| ● | an offer for a controlling percentage of the shares of a publicly traded company if the acquirer intends to take control of the company (whether publicly traded or privately held) controlling such publicly traded company, to the extent that the latter represents 75.0% or more of the consolidated net assets of the former. |
Article 200 of the Securities Market Law prohibits any shareholder that has taken control of a publicly traded company from acquiring, for a period of 12 months from the date of the transaction that granted it control of the publicly traded company, a number of shares equal to or higher than 3.0% of the outstanding issued shares of the target without making a tender offer at a price per share not lower than the price paid at the time of taking control. Should the acquisition from the other shareholders of the company be made on the floor of a stock exchange and on a pro rata basis, the controlling shareholder may purchase a higher percentage of shares, if so permitted by the regulations of the stock exchange.
Title XV of the Securities Market Law sets forth the basis for determining what constitutes a controlling power, a direct holding and a related party.
Capitalization
Under Chilean law, the shareholders of a company, acting at an extraordinary shareholders’ meeting, have the power to authorize an increase in the company’s share capital. When an investor subscribes issued shares, the shares are registered in that investor’s name even without payment, and the investor is treated as a shareholder for all purposes except with regard to receipt of dividends and return of capital, provided that the shareholders may, by amending the by-laws, also grant the right to receive dividends of distribution of capital despite not having paid for the subscribed shares. The investor becomes eligible to receive dividends once it has paid for the shares, or, if it has paid for only a portion of such shares, it is entitled to receive a corresponding pro rata portion of the dividends declared with respect to such shares, unless the company’s by-laws provide otherwise. If an investor does not pay for shares for which it has subscribed on or prior to the date agreed upon for payment, the company is entitled under Chilean law to auction the shares on the appropriate stock exchange, and it has a cause of action against the investor to recover the difference between the subscription price and the price received for the sale of those shares at auction. However, until such shares are sold at auction, the investor continues to exercise all the rights of a shareholder (except the right to receive dividends and return of capital, as noted above). Regarding shares issued but not paid for within the period determined by the extraordinary shareholders’ meeting for their payment (which period cannot exceed three years from the date of such shareholders’ meeting), until January 1, 2010 they were canceled and no longer available for issuance by us.subscription and payment. As of January 1, 2010, the board of directors of LATAM Airlines Group has a legal obligation to initiate the necessary legal actions to collect the unpaid amounts, unless the shareholders’ meeting which authorized the capital increase allowed the board to abstain from taking such action by a vote of two thirds of the issued shares, in which case the former rule still applies. Once the foregoing legal actions are exhausted, the board of directors shall propose to the shareholders’ meeting the appropriate capital adjustment measures, to be decided by simple majority. Fully paid shares are not subject to further calls or assessments or to liabilities of LATAM Airlines Group.
As of February, 28, 2017, our shareDecember 31, 2019, the Company's statutory capital consisted of 608,374,525 commonis represented by 606,407,693 ordinary shares of which 606,407,693without nominal value. All shares are subscribed and fully paid shares and 1,966,832 shares are pendingconsidering the capital reduction that occurred in full, after the legal period of subscription and payment. The unsubscribedthree years to subscribe the balance of 466,832 outstanding shares, include (i) 1,500,000 shares allocated to stock option compensation plans and (ii) 466,832 that remain unsubscribed following our most recent capital increase. The current share capital amount reflects the expiration of stock options, covering 4,789,718 shares that had been granted under employee compensation plans. Upon the expiration of the stock options on December 21, 2016,last capital increase approved in August of the Company’s capital stock was reduced to 608,374,525 shares.
year 2016. Chilean law recognizes the right of corporations to issue shares of common and preferred shares.stock. To date, we have issued and are authorized by our shareholders to issue only shares of common shares.stock. Each share of common stock is entitled to one vote. Pursuant to one employee compensation plan approved by extraordinary shareholders’ meeting held on June 11, 2013, the issuance of the shares for this compensation plan has been authorized but has not been made effective.
Preemptive Rights and Increases in Share Capital
The Chilean Corporation Law requires Chilean companies to offer existing shareholders the right to purchase a sufficient number of shares to maintain their existing percentage of ownership in a company whenever that company issues new shares for cash, except for up to 10% of the subscribed shares arising from the capital increase which may be designated to employee compensation pursuant to article 24 of the Corporation Law.Act. Under this requirement, any preemptive rights will be offered by us to the depositary as the registered owner of the common shares underlying the ADSs, but holders of ADSs and shareholders located in the United States will not be allowed to exercise preemptive rights with respect to new issuances of shares by us unless a registration statement under the Securities Act is effective with respect to those common shares or an exemption from the registration requirements thereunder is available.
We intend to evaluate at the time of any preemptive rights offering the costs and potential liabilities associated with the preparation and filing of a registration statement with the SEC, as well as the indirect benefits of enabling the exercise by the holders of ADSs and shareholders located in the United States of preemptive rights and any other factors we consider appropriate at the time. No assurances can be given that any registration statement would be filed. If preemptive rights are not made available to ADS holders, the depositary may sell those holders’ preemptive rights and distribute the proceeds thereof if a secondary market for such rights exists and a premium can be recognized over the cost of such sale. In the event that the depositary does not sell such rights at a premium over the cost of any such sale, all or certain holders of ADRs may receive no value for the preemptive rights. The inability of holders of ADSs to exercise preemptive rights in respect of common shares underlying their ADSs could result in a change in their percentage ownership of common shares following a preemptive rights offering.
Under Chilean law, preemptive rights are freely exercisable, transferable or waived by shareholders during a 30-day period commencing upon publication of the official notice announcing the start of the preemptive rights period in the newspaper designated by the shareholders’ meeting. The preemptive right of the shareholders is the pro rata amount of the shares registered in their name in the shareholders’ registry of LATAM Airlines Group as of the fifth business day prior to the date of publication of the notice announcing the start of the preemptive rights period. During such 30-day period (except for shares as to which preemptive rights have been waived), Chilean companies are not permitted to offer any newly issued common shares for sale to third parties. For that 30-day period and an additional 30-day period, Chilean publicly held corporations are not permitted to offer any unsubscribed common shares for sale to third parties on terms that are more favorable to the purchaser than those offered to shareholders. At the end of such additional 30-day period, Chilean publicly held corporations are authorized to sell non-subscribed shares to third parties on any terms, provided they are sold on a Chilean stock exchange.
Directors
Our by-laws provide for a board of nine directors. Compensation to be paid to directors must be approved by vote at the annual shareholders’ meeting. We hold elections for all positions on the board of directors every two years. Under our by-laws, directors are elected by cumulative voting. Each shareholder has one vote per share and may cast all of his or her votes in favor of one nominee or may apportion his or her votes among any number of nominees. These voting provisions currently ensure that a shareholder owning more than 10% of our outstanding shares is able to elect at least one representative to our board of directors.
Under the Chilean Corporation Law, transactions of a publicly-traded company with a “related” party must be conducted on an arm’s-length basis and must satisfy certain approval and disclosure requirements which are different from the ones that apply to a privately-held company. The conditions apply to the publicly-traded company and to all of its subsidiaries .subsidiaries.
These transactions include any negotiation, act, contract or operation in which the publicly-traded company intervenes together with either (i) parties which are legally deemed related pursuant to article 100 of the Chilean Securities Market Law, (ii) a director, senior manager, administrator, main executive or liquidator of the company, either on their own behalf or on behalf of a third party, including those individuals’ spouses or close relatives, (iii) companies in which the foregoing individuals own at least 10% (directly or indirectly), or in which they serve as directors, senior managers, administrators or main executives, (iv) parties indicated as such in the publicly-traded company’s by-laws, or identified by the directors’ committee or (v) those who have served as directors, senior managers, administrators, main executives or liquidators of the counterparty in the last 18 months and are now serving in one of those positions at the publicly-traded company.
Corporations may enter into transactions with related parties if (i) the transaction is in the interest of the corporation, (ii) the transaction is made on an arm’s-length basis at market conditions, (iii) the individuals involved in the transactions report them immediately to the board, (iv) the transaction is approved after a reasoned explanation by the majority of the board, excluding those directors or liquidators that are involved in the transaction (who shall, nonetheless, render an opinion on the matter if required by the board), (v) the decisions of the board are disclosed at the next shareholders’ meeting, and (vi) in case the majority of the board is disqualified to vote, the majority of the non-involved directors have approved the transaction, or two thirds of the voting shares have approved the transaction).
If, as noted in clause (vi) of the preceding paragraph, the transaction is to be approved by the shareholders’ meeting, the following additional rules apply: (i) the board shall appoint an independent appraiser that shall report to the shareholders on the transaction, (ii) the director’s committee or the non-involved directors may appoint a second independent appraiser, (iii) the appraiser’s reports shall be made available for 15 days, (iv) the receipt and availability of the reports shall be disclosed as a material fact and (iv) directors shall render an opinion on the transaction within five business days after receiving the reports.
Transactions which do not meet the foregoing requirements are valid and enforceable, but neither the corporation nor its shareholders shall have a cause of action to sue the infringing party for reimbursement on behalf of the corporation, for a total of the benefits reported to the interested party, in addition to indemnification for the damages caused. In such proceedings, the defendant shall prove that the transaction met the legal requirements.
The Chilean Corporation Law sets forth a number of exceptions to the foregoing rules. In the following situations, transactions with related parties may be carried out without complying with the foregoing rules: (i) if a transaction does not involve a substantial amount (it is deemed that a transaction does not involve a substantial amount if it does not exceed 1.0% of the net worth of the company and does not exceed the equivalent of 2,000 UF or approximately US$89,23879,352 as of the date of this annual report on Form 20-F) unless such a transaction exceeds 20,000 UF (for this calculation all similar transactions carried out within a consecutive 12-month period between the same parties or for the same subject matter, shall be deemed as a single transaction), (ii) transactions which according to the policies determined by the board of directors, are deemed to be within the ordinary course of business (the determination of such policies shall be disclosed as a material fact and made available to shareholders), and (iii) if the counterparty is an entity in which the publicly-traded company has, directly or indirectly, at least a 95.0% ownership. As per the exemption indicated in (ii) above, on December 29, 2009, the Boardboard of Directorsdirectors of LATAM Airlines Group established policies setting forth the transactions that fall within the ordinary course of business. That determination was publicly disclosed on the same day and is currently available on LATAM Airlines Group’s website under the “Corporate Governance” section.
Shareholders’ Meetings and Voting Rights
The Chilean Corporation Law requires that an ordinary annual meeting of shareholders be held within the first four months of each year after being called by the board of directors (generally they are held in April, but in any case following the preparation of our financial statements, including the report of our auditors, for the previous fiscal year). LATAM Airlines Group’s by-laws further provide that the ordinary annual meeting of shareholders must take place between February 1 and April 30. The shareholders at the ordinary annual meeting approve the annual financial statements, including the report of our auditors, the annual report, the dividend policy and the final dividend on the prior year’s profits, elect the board of directors (in our case, every two years or earlier if a vacancy occurs) and approve any other matter that does not require an extraordinary shareholders’ meeting. The most recent extraordinary meeting of our shareholders was held on April 27, 2017, and the most recent ordinary annual meeting of our shareholders was held on April 27, 2017.26, 2018.
Extraordinary shareholders’ meetings may be called by the board of directors, if deemed appropriate, and ordinary or extraordinary shareholders’ meetings must be called by the board of directors when requested by shareholders representing at least 10.0% of the issued voting shares or by the CMF. In addition, as from January 1, 2010 there are two new rules in this regard: (i) the CMF may directly call for an extraordinary shareholders’ meeting in case of a publicly-traded company, and (ii) any kind of shareholders’ meeting may be self-convened and take place if all voting shares attend, regardless of the fulfillment of the notice and other type of procedural requirements.
Notice to convene the ordinary annual meeting or an extraordinary meeting is given by means of three notices which must be published in a newspaper of our corporate domicile (currently Santiago, Chile) designated by the shareholders at their annual meeting and, if the shareholders fail to make such designation, the notice must be published in the Chilean Official Gazette pursuant to legal requirements. The first notice must be published not less than 15 days and not more than 20 days in advance of the scheduled meeting. Notice also must be mailed not less than 15 days in advance of the meeting to each shareholder and to the CMF and the Chilean stock exchanges. Currently, we publish our official notices in the newspaperLa Tercera(available online at www.latercera.com).
The quorum for a shareholders’ meeting is established by the presence, in person or by proxy, of shareholders representing a majority of our issued common shares. If that quorum is not reached, the meeting can be reconvened within 45 days, and at the second meeting the shareholders present are deemed to constitute a quorum regardless of the percentage of the common shares that they represent.
Only shareholders registered with us on the fifth business day prior to the date of a meeting are entitled to attend and vote their shares. A shareholder may appoint another individual (who need not be a shareholder) as his or her proxy to attend and vote on his or her behalf. Proxies addressed to us that do not designate a person to exercise the proxy are taken into account in order to determine if there is a sufficient quorum to hold the meeting, but the shares represented thereby are not entitled to vote at the meeting. The proxies must fulfill the requirements set forth by the Chilean Corporation Law and its regulatory norms. Every shareholder entitled to attend and vote at a shareholders’ meeting has one vote for every share subscribed.
The following matters can only be considered at an extraordinary shareholders’ meeting:
| ● | a merger, transformation, division or other change in our corporate form or the amendment of our by-laws; |
| ● | the issuance of bonds or debentures convertible into shares; |
| ● | the conveyance of 50% or more of our assets (whether or not it includes our liabilities); |
| ● | the adoption or amendment of any business plan which contemplates the conveyance of assets in excess of the foregoing percentage; |
| ● | the conveyance of 50% or more of the assets of a subsidiary, if the latter represents at least 20% of our assets; |
| ● | the conveyance of shares of a subsidiary which entails the transfer of control; |
| ● | granting of a security interest or a personal guarantee in each case to secure the obligations of third parties, unless to secure or guarantee the obligations of a subsidiary, in which case only the approval of the board of directors will suffice; and |
our dissolution;
a merger, transformation, division or other change in our corporate form or the amendment of our by-laws;
the issuance of bonds or debentures convertible into shares;
the conveyance of 50% or more of our assets (whether or not it includes our liabilities);
the adoption or amendment of any business plan which contemplates the conveyance of assets in excess of the foregoing percentage;
the conveyance of 50% or more of the assets of a subsidiary, if the latter represents at least 20% of our assets;
the conveyance of shares of a subsidiary which entails the transfer of control;
granting of a security interest or a personal guarantee in each case to secure the obligations of third parties, unless to secure or guarantee the obligations of a subsidiary, in which case only the approval of the board of directors will suffice; and
other matters that require shareholder approval according to Chilean law or the by-laws.
| ● | other matters that require shareholder approval according to Chilean law or the by-laws. |
The matters referred to in the first seven items listed above may only be approved at a meeting held before a notary public, who shall certify that the minutes are a true record of the events and resolutions of the meeting.
The by-laws establish that resolutions are passed at shareholders’ meetings by the affirmative vote of an absolute majority of those voting shares present or represented at the meeting. However, under the Chilean Corporation Law, the vote of a two-thirds majority of the outstanding voting shares is required to approve any of the following actions:
a change in our corporate form, division or merger with another entity;
amendment to our term of existence, if any;
our early dissolution;
change in our corporate domicile;
decrease of our capital stock;
approval of contributions and the assessment thereof whenever consisting of assets other than money;
any modification of the authority reserved for the shareholders’ meetings or limitations on the powers of the board of directors;
decrease in the number of members of the board of directors;
the conveyance of 50% or more of our assets (whether or not it includes our liabilities);
the adoption or amendment of any business plan which contemplates the conveyance of assets in excess of the foregoing percentage;
the conveyance of 50% or more of the assets of a subsidiary, if the latter represents at least 20% of our assets;
the conveyance of shares of a subsidiary which entails the transfer of control;
the form that dividends are paid in;
granting a security interest or a personal guarantee in each case to secure obligations of third parties that exceeds 50% of our assets, unless to secure or guarantee the obligations of a subsidiary, in which case only approval of the board of directors will suffice;
the acquisition of our own shares, when, and on the terms and conditions, permitted by law;
all other matters provided for in the by-laws;
the correction of any formal defect in our incorporation or any amendment to our by-laws that refers to any of the matters indicated in the first 13 items listed above;
the institution of the right of the controlling shareholder who has purchased at least 95% of the shares to purchase shares of the outstanding minority shareholders pursuant to the procedure set forth in article 71 bis of the Corporation Law; and
the approval or ratification of transactions with related parties, as per article 147 of the Corporation Law (described above).
| ● | a change in our corporate form, division or merger with another entity; |
| 93● | amendment to our term of existence, if any; |
| ● | change in our corporate domicile; |
| ● | decrease of our capital stock; |
| ● | approval of contributions and the assessment thereof whenever consisting of assets other than money; |
| ● | any modification of the authority reserved for the shareholders’ meetings or limitations on the powers of the board of directors; |
| ● | decrease in the number of members of the board of directors; |
| ● | the conveyance of 50% or more of our assets (whether or not it includes our liabilities); |
| ● | the adoption or amendment of any business plan which contemplates the conveyance of assets in excess of the foregoing percentage; |
| ● | the conveyance of 50% or more of the assets of a subsidiary, if the latter represents at least 20% of our assets; |
| ● | the conveyance of shares of a subsidiary which entails the transfer of control; |
| ● | the form that dividends are paid in; |
| ● | granting a security interest or a personal guarantee in each case to secure obligations of third parties that exceeds 50% of our assets, unless to secure or guarantee the obligations of a subsidiary, in which case only approval of the board of directors will suffice; |
| ● | the acquisition of our own shares, when, and on the terms and conditions, permitted by law; |
| ● | all other matters provided for in the by-laws; |
| ● | the correction of any formal defect in our incorporation or any amendment to our by-laws that refers to any of the matters indicated in the first 13 items listed above; |
| ● | the institution of the right of the controlling shareholder who has purchased at least 95% of the shares to purchase shares of the outstanding minority shareholders pursuant to the procedure set forth in article 71 bis of the Corporation Law; and |
| ● | the approval or ratification of transactions with related parties, as per article 147 of the Corporation Law (described above). |
Amendments to the by-laws that have the effect of establishing, modifying or eliminating any special rights pertaining to any series of shares require the consenting vote of holders of two-thirds of the shares of the affected series. As noted above, LATAM Airlines Group does not have special series of shares.
In general, Chilean law does not require a publicly held corporation to provide the level and type of information that the U.S. securities laws require a reporting company to provide to its shareholders in connection with a solicitation of proxies. However, shareholders are entitled to examine the books of the company and its subsidiaries within the 15-day period before a scheduled meeting. No later than 15 business days of the scheduled shareholder’s meeting, the board of directors of a publicly held corporation is required to send to every shareholder notice by regular mail, a notice containing a reference to the issues that will be discussed, together with instructions to obtain all the appropriate documentation regarding those issues, and publish such notice on its website. The board is also required to make available to the shareholders the annual report and the financial statements of the company, and to publish such information in the company’s webpage at least 10 days in advance of the scheduled shareholders meeting. In addition to these requirements, we regularly have provided, and currently intend to continue to provide, together with the notice of shareholders’ meeting, a proposal for the final annual dividend for shareholder approval. See “—Dividend and Liquidation Rights” below.
The Chilean Corporation Law provides that, whenever shareholders representing 10% or more of the issued voting shares so request, a Chilean company’s annual report must include such shareholders’ comments and proposal in relation to the company’s affairs, together with the comments and proposals set forth by the directors’ committee. Similarly, the Chilean Corporation Law provides that whenever the board of directors of a publicly held corporation convenes an ordinary meeting of the shareholders and solicits proxies for that meeting, or distributes information supporting its decisions or other similar material, it is obligated to include as an annex to its annual report any pertinent comments and proposals that may have been made by shareholders owning 10% or more of the company’s voting shares who have requested that such comments and proposals be included, together with the comments and proposals set forth by the directors’ committee.
Dividend and Liquidation Rights
In accordance with the Chilean Corporation Law, LATAM Airlines Group must distribute an annual cash dividend equal to at least 30% of its annual net income calculated in accordance with IFRS, unless otherwise decided by a unanimous vote of the holders of all issued shares, and unless and except to the extent it has accumulated losses. If there is no net income in a given year, LATAM Airlines Group can elect but is not legally obligated to distribute dividends out of retained earnings. All outstanding common shares are entitled to share equally in all dividends declared by LATAM Airlines Group, unless the shares have not been fully paid by the shareholder after being subscribed.
For all dividend distributions agreed by the board of directors in excess of the mandatory minimum of 30% noted in the preceding paragraph, LATAM Airlines Group may grant an option to its shareholders to receive those dividends in cash, or in shares issued by either LATAM Airlines Group or other corporations. Shareholders who do not expressly elect to receive a dividend other than in cash are legally presumed to have decided to receive the dividend in cash. A U.S. holder of ADSs may, in the absence of an effective registration statement under the Securities Act or an available exemption from the registration requirement thereunder, effectively is required to receive a dividend in cash. See “—Preemptive Rights and Increases in Share Capital” above.
Dividends that are declared but not paid within the appropriate time period set forth in the Chilean Corporation Law (as to minimum dividends, 30 days after declaration; as to additional dividends, the date set for payment at the time of declaration) are adjusted to reflect the change in the value of the UF. The UF is a daily indexed, Chilean peso-denominated accounting unit designed to discount the effect of Chilean inflation and it is based on the previous month’s inflation rate as officially determined. Such dividends also accrue interest at the then-prevailing rate for UF-denominated deposits during such period. The right to receive a dividend lapses if it is not claimed within five years from the date such dividend is payable. After that period, the amount not claimed is given to a non-profit organization, theCuerpos de Bomberos de Chile(the National Corporation of Firefighters).
In the event of LATAM Airlines Group’s liquidation, the holders of fully paid common shares would participate pro rata in the distribution of assets remaining after payment of all creditors. Holders of shares not fully paid will participate in such distribution in proportion to the amount paid.
Approval of Financial Statements
The board of directors is required to submit our consolidated financial statements to the shareholders for their approval at the annual ordinary shareholders’ meeting. If the shareholders reject the financial statements, the board of directors must submit new financial statements not later than 60 days from the date of that meeting. If the shareholders reject the new financial statements, the entire board of directors is deemed removed from office and a new board is to be elected at the same meeting. Directors who approved such financial statements are disqualified for re-election for the ensuing period.
Right of Dissenting Shareholders to Tender Their Shares
The Chilean Corporation Law provides that, upon the adoption at an extraordinary meeting of shareholders of any of the resolutions or if any of the situations enumerated below takes place, dissenting or affected shareholders acquire the right to withdraw and to compel the company to repurchase their shares, subject to the fulfillment of certain terms and conditions. However, such right shall be suspended if we are a debtor in a bankruptcy liquidation proceeding, or if we are subject to a reorganization agreement approved in accordance with Chilean law No. 20,720, unless such agreement allows the right to withdraw, or unless it is terminated by the issuance of a liquidation resolution. In the case of holders of ADRs, however, in order to exercise such rights, holders of ADRs would be required to first withdraw the common shares represented by the ADRs pursuant to the terms of the deposit agreement. Such holders of ADRs would need to perfect the withdrawal of the common shares on or before the fifth business day prior to the date of the meeting.
“Dissenting shareholders” are defined as those who attend a shareholders’ meeting and vote against a resolution which results in the withdrawal right, or, if absent at such a meeting, those who state in writing to the company their opposition to such resolution within the following 30 days. Dissenting shareholders must perfect their withdrawal rights by tendering their stock to the company within thirty days after adoption of the resolution.
The price to be paid to a dissenting shareholder of a publicly held corporation is the weighted average of the sales prices for the shares as reported on the Chilean stock exchanges on which the shares are quoted during the 60 stock-exchange-business-day period elapsed between the 30th and the 90th stock-exchange-business-days-preceding the eventshareholder meeting giving rise to the withdrawal right. If, because of the volume, frequency, number and diversity of the buyers and sellers, the CMF determines that the shares are not shares actively traded on a stock exchange (acciones de transacción bursátil), the price to be paid to the dissenting shareholder is the book value.value of the shares. Book value for this purpose equals paid capital plus reserves and profits, less losses, divided by the total number of subscribed shares (whether entirely or partially paid). For the purpose of making this calculation, the last annual balance sheet is used and adjusted to reflect inflation up to the date of the shareholders’ meeting that gave rise to the withdrawal right.
The resolutions and situations that result in a shareholder’s right to withdraw are the following:
| •● | the transformation of the company; |
| •● | the merger of the company with or into another company; |
the conveyance of 50% or more of the assets of the company, whether or not such sale includes the company’s liabilities;
the adoption or amendment of any business plan which contemplates the conveyance of assets in excess of the foregoing percentage;
the conveyance of 50% or more of the assets of a subsidiary, if the latter represents at least 20% of our assets;
the conveyance of shares of a subsidiary which entails the transfer of control;
the creation of preferential rights for a class of shares or an extension, amendment or reduction to those already existing, in which case the right to withdraw only accrues to the dissenting shareholders of the class or classes of shares adversely affected;
the correction of any formal defect in the incorporation of the company or any amendment to the company’s by-laws that grants the right to withdraw;
the granting of security interests or personal guarantees to secure or guarantee third parties’ obligations exceeding 50% of the company’s assets, except with regard to subsidiaries;
resolutions of the shareholders’ meeting approving the decision to make private a public corporation in case the requirements set forth in “—General” cease to be met;
if a publicly-traded company ceases to be obligated to register its shares in the Securities Registry of the CMF, and an extraordinary shareholders’ meeting agrees to de-register the shares and finalize its disclosure obligations mandated by the Corporation Law;
if the controlling shareholder of a publicly-traded company reaches over 95% of the shares (in such case, the right must be exercised within 30 days of the date in which the threshold is reached, circumstance that must be communicated by means of a publication); and
such other causes as may be established by the company’s by-laws (no such additional resolutions currently are specified in our by-laws).
| ● | the conveyance of 50% or more of the assets of the company, whether or not such sale includes the company’s liabilities; |
| ● | the adoption or amendment of any business plan which contemplates the conveyance of assets in excess of the foregoing percentage; |
| ● | the conveyance of 50% or more of the assets of a subsidiary, if the latter represents at least 20% of our assets; |
| ● | the conveyance of shares of a subsidiary which entails the transfer of control, if the subsidiary represents at least 20% of our assets; |
| ● | the creation of preferential rights for a class of shares or an extension, amendment or reduction to those already existing, in which case the right to withdraw only accrues to the dissenting shareholders of the class or classes of shares adversely affected; |
| ● | the correction of any formal defect in the incorporation of the company or any amendment to the company’s by-laws that grants the right to withdraw; |
| ● | the granting of security interests or personal guarantees to secure or guarantee third parties’ obligations exceeding 50% of the company’s assets, except with regard to subsidiaries; |
| ● | resolutions of the shareholders’ meeting approving the decision to make private a publicly held corporation in case the requirements set forth in “—General” cease to be met; |
| ● | if a publicly-traded company ceases to be obligated to register its shares in the Securities Registry of the CMF, and an extraordinary shareholders’ meeting agrees to de-register the shares and finalize its disclosure obligations mandated by the Corporation Law; |
| ● | if the controlling shareholder of a publicly-traded company reaches over 95% of the shares (in such case, the right must be exercised within 30 days of the date in which the threshold is reached, circumstance that must be communicated by means of a publication); and |
| ● | such other causes as may be established by the company’s by-laws (no such additional resolutions currently are specified in our by-laws). |
In addition, shareholders of publicly held corporations have the right to withdraw if a person acquires two-thirds or more of the outstanding shares of such corporation with the right to vote (except as a result of other shareholders not having subscribed and paid a capital increase) and does not make a tender offer for the remaining shares within 30 days after acquisition.
Under article 69 bis of the Chilean Corporation Law,Act, the right to withdraw also is granted to shareholders (other than pension funds that administer private pension plans under the national pension law), under certain terms and conditions, if a company were to become controlled by the Chilean government, directly or through any of its agencies, and if two independent rating agencies downgrade the rating of its stock from first class because of certain actions specified in Article 69 bis undertaken by the company or the Chilean government that affect negatively and substantially the earnings of the company. Shareholders must perfect their withdrawal rights by tendering their shares to the company within 30 days of the date of the publication of the new rating by two independent rating agencies. If the withdrawal right is exercised by a shareholder invoking Article 69 bis, the price paid to the dissenting shareholder shall be the weighted average of the sales price for the shares as reported on the stock exchanges on which the company’s shares are quoted for the six-month period preceding the publication of the new rating by two independent rating agencies. If, as previously described, the CMF determines that the shares are not actively traded on a stock exchange, the price shall be the book value calculated as described above.
There is no legal precedent as to whether a shareholder that has voted both for and against a proposal (such as the depositary) may exercise withdrawal rights with respect to the shares voted against the proposal. As such, there is doubt as to whether holders of ADRs who have not surrendered their ADRs and withdrawn common shares on or before the fifth business day prior to the shareholder meeting will be able to exercise withdrawal rights either directly or through the depositary with respect to the shares represented by ADRs. Under the provisions of the deposit agreement the depositary will not exercise these withdrawal rights.
The circumstance indicated above regarding ownership in excess of 95% by the controlling shareholder creates not only a withdrawal right for the remaining minority shareholders, but as of January 1, 2010, it also creates a “squeeze out” right by the controlling shareholder with respect to those same shareholders (granting a call option by means of which the controlling shareholder may buy-out the existing ownership participations pursuant to the provisions of article 71 bis of the Corporation Law)Act).
Registration and Transfers
TheDepósito Central de Valores (“DCV”), a local depository corporation, acts as LATAM Airlines Group’s registration agent. In the case of jointly owned common shares, an attorney-in-fact must be appointed to represent the joint owners in dealings with us.
C. Material Contracts
Table of Material Contracts for the Purchase of Aircrafts
| Agreement | | Date | | Aircraft (number purchased) | | Estimated Gross
Value of Aircraft
at List Price |
| Boeing 767-300 Fleet |
|
| Purchase Agreement No. 2126 with the Boeing Company | | January 30, 1998 | | Ø⮚ Boeing 767-300 passenger aircrafts (2)
| | US$200,000,000 |
| | | | | | |
| Supplemental Agreement No. 16 to Purchase Agreement No. 2126 | | November 11, 2004 | | Ø⮚ Boeing 767-300 passenger aircrafts (3)
Ø⮚ Boeing 767-300 freighter aircraft (1)
| | US$140,000,000 |
| | | | | | |
| Supplemental Agreement No. 20 to Purchase Agreement No. 2126 | | April 28, 2005 | | Ø⮚ Boeing 767-300 passenger aircraft (1)
Ø⮚ Boeing 767-300 freighter aircrafts (2)
| | US$300,000,000 |
| | | | | | |
| Supplemental Agreement No. 21 to Purchase Agreement No. 2126 | | July 20, 2005 | | Ø⮚ Boeing 767-300 passenger aircrafts (3)
| | US$410,000,000 |
| | | | | | |
| Supplemental Agreement No. 22 to Purchase Agreement No. 2126 | | March 31, 2006 | | Ø⮚ Boeing 767-300 (3)
Ø⮚ Converted two (2) Boeing 767-300 freighter aircrafts to two (2) Boeing 767-300 passenger aircrafts
| | US$430,000,000 |
| | | | | | |
| Supplemental Agreement No. 23 to Purchase Agreement No. 2126 | | December 14, 2006 | | Ø⮚ Boeing 767-300 passenger aircrafts (3)
| | US$460,000,000 |
Agreement | | Date | | Aircraft (number purchased) | | Estimated Gross
Value of Aircraft |
| Supplemental Agreement No. 24 to Purchase Agreement No. 2126 | | November 10, 2008 | | Ø⮚ Boeing 767-300 passenger aircrafts (4)
Ø⮚ Two (2) aircrafts delivered in 2011, and two (2) aircrafts delivered in 2012
Ø⮚ Two purchase rights for Boeing 767-300 aircraft
| | US$636,000,000 |
| | | | | | |
| Supplemental Agreement No. 28 to the Purchase Agreement No. 2126 | | March 22, 2010 | | Ø⮚ Accelerate the delivery of ten 787-8 aircraft, substitute four aircraft from 787-9 to 787-8 and substitute three 767-316ER to 767-316F freighter aircraft
| | |
| | | | | | |
| Supplemental Agreement No. 29 to the Purchase Agreement No. 2126 | | November 10, 2010 | | Ø⮚ Accelerate the delivery of three Aircraft and substitute those three aircraft from 767-316F to 767-316ER.
| | |
| | | | | | |
| Supplemental Agreement No. 30 to Purchase Agreement No. 2126 | | February 15, 2011 | | Ø⮚ Boeing 767-300 passenger aircrafts (3)
Ø⮚ Delivery was scheduled to take place in 2012
| | US$510,000,000 |
| | | | | | |
| Supplemental Agreement No. 31 to Purchase Agreement No. 2126 | | May 10, 2011 | | Ø⮚ Boeing 767-300 passenger aircrafts (5)
Ø⮚ Four purchase rights for Boeing 767-300 passsengerpassenger aircraft
Ø⮚ Delivery was scheduled to take place in 2012
| | US$780,000,000 |
| | | | | | |
| Supplemental Agreement No. 32 to Purchase Agreement No. 2126 | | December 22, 2011 | | Ø⮚ Exercise two purchase options for Boeing 767-300 aircrafts (2)
Ø⮚ Delivery was scheduled to take place in 2012
Ø⮚ Remaining purchase options deleted
| | US$340,000,000 |
| | | | | | |
| Boeing 787-8/9 Fleet |
| Purchase Agreement No. 3256 with the Boeing Company | | October 29, 2007 | | Ø⮚ Boeing 787-8 aircrafts (18)
Ø⮚ Boeing 787-9 aircrafts (8)
Ø⮚ Option of purchasing fifteen additional aircraft to be delivered in 2017 and 2018
| | US$3,200,000,000 |
| | | | | | |
| Supplemental Agreement No. 1 to the Purchase Agreement No. 3256 | | March 22, 2010 | | Ø⮚ Advance scheduled delivery date of ten Boeing 787-8 aircraft and substitute four Boeing 787-9 aircraft into four Boeing 787-8 aircraft.
| | |
| | | | | | |
Supplemental Agreement No. 2 to the Purchase Agreement No. 3256 | | July 8, 2010 | | Ø Advance scheduled delivery date of two Boeing 787-8 aircraft. | | |
| | | | | | |
| Supplemental Agreement No. 3 to the Purchase Agreement No. 3256 | | August 24, 2012 | | Ø⮚ Replace two Boeing 787-8 aircraft with two Boeing 787-8 aircraft with a later delivery.
| | |
Agreement | | Date | | Aircraft (number purchased) | | Estimated Gross
Value of Aircraft
|
| Delay Settlement Agreement to the Purchase Agreement No. 3256 | | September 16, 2013 | | Ø⮚ Agreed to update delivery dates, settle consequences of delays and convert several future deliveries of B787-8 aircraft to B787-9 aircraft. This agreement was amended on April 22, 2015 to update delivery dates of certain aircraft.
| | |
| | | | | | |
| Supplemental Agreement No. 4 to the Purchase Agreement No. 3256 | | April 22, 2015 | | Ø⮚ Reschedule the delivery dates of four Boeing 787-8 aircraft and replace four Boeing 787-8 aircraft with four Boeing 787-9 aircraft.
| | |
| | | | | | |
Supplemental Agreement No. 5 to the Purchase Agreement No. 3256 | | July 3, 2015 | | Ø Reschedule the delivery date of one Boeing 787-8 aircraft. | | |
| | | | | | |
| Supplemental Agreement No. 6 to the Purchase Agreement No. 3256 | | May 27, 2016 | | Ø⮚ Convert four Model 787-8 Aircraft to four Model 787-9 Aircraft, and Defer of two Model 787-9 Aircraft from 1Q 2018 and 2Q 2018 to 3Q 2018 and 4Q 2018 respectively.
| | |
| Supplemental Agreement No. 13 to the Purchase Agreement No. 3256 | July 3, 2019 | | | | To include certain letter agreements | |
Supplemental Agreement No. 714 to the Purchase Agreement No. 3256 | October 11, 2019 | December 20, 2016 | | ØReschedule the delivery dates of four Model 787-9 Aircraft and document the actual delivery months for two Model 787-9 Aircraft in 2019. | | |
| | | | | Boeing 787-8 aircraft | |
Supplemental Agreement No. 815 to the Purchase Agreement No. 3256 | | July 28, 2017 | | Ø Reschedule the delivery of two Model 787-9 Aircraft and document the actual delivery months for two Model 787-9 Aircraft inOctober 11, 2019 | | |
| | | | | To incorporate Exhibit A1 | |
Supplemental Agreement No. 816 to the Purchase Agreement No. 3256 | October 11, 2019 | December 7, 2017 | | Ø Reschedule the deliveryDeferral of two Model 787-9 Aircraft | | |
| | | | | PDPs. | |
| Boeing 777 Freighter Fleet |
| Purchase Agreement No. 3194 with the Boeing Company | | July 3, 2007 | | Ø⮚ Boeing 777 freighter aircrafts (2)
Ø⮚ Delivery was scheduled to take place in 2011 and 2012
| | US$545,000,000 |
| | | | | | |
| Letter Agreement 6-1162-KSW-6454R2 to the Purchase Agreement No. 3194 | | March 22, 2010 | | Ø⮚ Transfer two purchase rights from Purchase Agreement No. 2126 to Purchase Agreement No. 3194.
| | |
| | | | | | |
| Supplemental Agreement No. 2 to Purchase Agreement No. 3194 | | November 2, 2010 | | Ø⮚ Exercise purchase option for Boeing 777 freighter aircraft (1)
| | US$280,000,000 |
| | | | | | |
Supplemental Agreement No. 3 to the Purchase Agreement No. 3194 | | September 22, 2011 | | Ø Advance the scheduled delivery date of one firm Boeing 777 freighter aircraft during 2012. | | |
| | | | | | |
| Supplemental Agreement No. 4 to the Purchase Agreement No. 3194 | | August 9, 2012 | | Ø⮚ Reflect the configuration of the aircraft covered under such Purchase Agreement.
| | |
Agreement | | Date | | Aircraft (number purchased) | | Estimated Gross
Value of Aircraft |
| Airbus A320-Family Fleet |
| Second A320-Family Purchase Agreement with Airbus S.A.S. | | March 20, 1998 | | Ø⮚ Airbus A320-Family aircrafts (5)
| | US$230,000,000 |
| | | | | | |
| Amendment No. 1 to the Second A320-Family Purchase Agreement | | November 14, 2003 | | Ø⮚ Exercise three purchase rights for Airbus 319 aircraft, among other things.
| | |
| | | | | | |
| Amendment No. 2 to the Second A320-Family Purchase Agreement | | October 4, 2005 | | Ø⮚ Acquire 25 additional Airbus 320 family aircraft and 15 purchase rights for Airbus A320-Family aircraft.
| | |
| | | | | | |
| Amendment No. 3 to the Second A320-Family Purchase Agreement | | March 6, 2007 | | Ø⮚ Exercise 15 purchase rights for 15 Airbus A320-Family Aircraft.
Ø⮚ According to clause 12.2 of the Second A320-Family Purchase Agreement, applicable to all subsequent amendments, in case of a failure, as defined in such agreement, a service life policy for a period of 12 years after delivery of any given aircraft shall apply.
| | |
| | | | | | |
| Amendment No. 5 to the Second A320-Family Purchase Agreement | | December 23, 2009 | | Ø⮚ Airbus A320-Family aircrafts (30)
| | US$2,000,000,000 |
| | | | | | |
| Amendment No. 6 to the Second A320-Family Purchase Agreement | | May 10, 2010 | | Ø⮚ Convert the aircraft type of three aircraft and advance the scheduled delivery date of 13 aircraft.
| | |
| | | | | | |
Amendment No. 7 to the Second A320-Family Purchase Agreement | | May 19, 2010 | | Ø Advance the scheduled delivery date of three aircraft. | | |
| | | | | | |
| Amendment No. 8 to the Second A320-Family Purchase Agreement | | September 23, 2010 | | Ø⮚ Convert the aircraft type of one aircraft and advance the scheduled delivery date of four aircraft.
| | |
| | | | | | |
| Amendment No. 9 to the Second A320-Family Purchase Agreement | | December 21, 2010 | | Ø⮚ Airbus A320-Family aircrafts (50)
| | US$2,600,000,000 |
| | | | | | |
| Amendment No. 10 to the Second A320-Family Purchase Agreement | | June 10, 2011 | | Ø⮚ Convert the aircraft type of three aircraft, to select sharklets for some aircraft and to notify delivery dates for some aircraft.
| | |
| | | | | | |
| Amendment No. 11 to the Second A320-Family Purchase Agreement | | November 3, 2011 | | Ø⮚ Convert the aircraft type of three aircraft and defer the scheduled delivery date of four aircraft.
| | |
| | | | | | |
| Amendment No. 12 to the Second A320-Family Purchase Agreement | | November 19, 2012 | | Ø⮚ Convert the aircraft type of three aircraft, identify certain aircraft as Sharklet Installed Aircraft and others as Sharklet Capable Aircraft, as those are defined in such Purchase Agreement, and notify the scheduled delivery month for certain aircraft.
| | |
Agreement | | Date | | Aircraft (number purchased) | | Estimated Gross
Value of Aircraft
|
| Amendment No. 13 to the Second A320-Family Purchase Agreement | | August 19, 2013 | | Ø⮚ Convert several A320 aircraft to A321 aircraft and to postpone the scheduled delivery dates of several aircraft.
| | |
| | | | | | |
Amendment No. 14 to the Second A320-Family Purchase Agreement | | March 31, 2014 | | Ø Covering the rescheduling of the scheduled delivery date of one Aircraft. | | |
| | | | | | |
Amendment No. 15 to the Second A320-Family Purchase Agreement | | May 16, 2014 | | Ø Covering the rescheduling of the scheduled delivery month of certain Aircraft. | | |
| | | | | | |
| Amendment No. 16 to the Second A320-Family Purchase Agreement | | July 15, 2014 | | Ø⮚ Covering cancellation and substitution of certain Aircraft.
| | |
| | | | | | |
| Novation Agreement to the Second A320-Family Purchase Agreement | | October 30, 2014 | | Ø⮚ Novation of the original TAM A320/A330 Family Purchase Agreement from TAM to LATAM.
| | |
| | | | | | |
| Amendment No. 17 to the Second A320-Family Purchase Agreement | | December 11, 2014 | | Ø⮚ Covering the substitution of certain Aircraft.
| | |
| | | | | | |
| Airbus A320 NEO-Family Fleet |
| A320 NEO Purchase Agreement | | June 22, 2011 | | Ø⮚ Airbus 320 NEO Family aircraft (20)
Ø⮚ Delivery scheduled to take place in 2017 and 2018
| | US$1,700,000,000 |
| | | | | | |
| Amendment No. 1 to the A320 NEO Purchase Agreement | | February 27, 2014 | | Ø⮚ Covering the advancement of the date by which LATAM selects the propulsion systems.
| | |
| | | | | | |
| Amendment No. 2 to the A320 NEO Purchase Agreement | | July 15, 2014 | | Ø⮚ Covering the order of incremental A320 NEO Aircraft.
| | |
| | | | | | |
| Amendment No. 3 to the A320 NEO Purchase Agreement | | December 11, 2014 | | Ø⮚ Covering the order of incremental A320 NEO Aircraft and A321 NEO Aircraft.
| | |
| | | | | | |
| Amendment No. 4 to the A320 NEO Purchase Agreement | | April 15, 2016 | | Ø⮚ Covering the reschedule of the delivery of eight Original NEO Aircraft and the conversion of four Original NEO Aircraft into A321 NEO Aircraft
| | |
| | | | | | |
| Amendment No. 5 to the A320 NEO Purchase Agreement | | April 15, 2016 | | Ø⮚ Changes in the technical specifications of the aircraft to be received under this agreement.
| | |
| | | | | | |
| Amendment No. 6 to the A320 NEO Purchase Agreement | | August 8, 2016 | | Ø⮚ Covering the cancellation of the delivery of four A320 NEO Aircraft.
| | |
Agreement | | Date | | Aircraft (number purchased) | | Estimated Gross
Value of Aircraft |
| TAM Material Contracts – A320/A330 Family Purchase Agreement |
| Purchase Agreement with Airbus S.A.S. | | November 2006 | | Ø⮚ Airbus A320-Family aircrafts (31)
Ø⮚ Airbus A330-200 aircrafts (6)
Ø⮚ Delivery was scheduled to take place between 2007 and 2010
| | US$3,300,000,000 |
| | | | | | |
| New Purchase Agreement with Airbus S.A.S. | | January 2008 | | Ø⮚ Airbus A320-Family aircrafts (20)
Ø⮚ Airbus A330-200 aircrafts (4)
Ø⮚ Delivery was scheduled to take place between 2007 and 2014
| | US$2,140,000,000 |
| | | | | | |
| New Purchase Agreement with Airbus S.A.S. | | July 2010 | | Ø⮚ Airbus A320-Family aircrafts (20)
Ø⮚ Delivery was scheduled to take place between 2014 and 2015
| | US$1,450,000,000 |
| | | | | | |
| New Purchase Agreement with Airbus S.A.S. | | October 2011 | | Ø⮚ Airbus A320-Family aircrafts (10)
Ø⮚ Airbus A320 NEO Family aircrafts (22)
Ø⮚ Delivery scheduled to take place between 2016 and 2018
Ø⮚ Ten option rights for Airbus A320 NEO Family aircraft
| | US$1,730,000,000 |
| | | | | | |
Amendment No. 12 to the A320/A330 Purchase Agreement | | January 2012 | | Ø Reschedule the delivery dates of certain aircraft. | | |
| | | | | | |
| Amendment No. 13 to the A320/A330 Purchase Agreement | | November 2012 | | Ø⮚ Convert the aircraft type of A320 family aircraft.
| | |
| | | | | | |
| Amendment No. 14 to the A320/A330 Purchase Agreement | | December 2012 | | Ø⮚ Convert the aircraft type of an A320 family aircraft and reschedule the delivery date of such aircraft.
| | |
| | | | | | |
| Amendment No. 15 to the A320/A330 Purchase Agreement | | February 2013 | | Ø⮚ Changes to the scheduled delivery month of certain A320 Family Aircraft.
| | |
| | | | | | |
| Amendment No. 16 to the A320/A330 Purchase Agreement | | February 2013 | | Ø⮚ Change to the aircraft type of certain A320 Family Aircraft, to the scheduled delivery month/quarter of certain A320 Family Aircraft and make certain changes to the dates by which TAM will select the propulsion systems and NEO propulsion systems for certain Aircraft.
| | |
| | | | | | |
| Amendment No. 17 to the A320/A330 Purchase Agreement | | August 2013 | | Ø⮚ Change to the scheduled delivery month of a certain A320 Family Aircraft and to make the selection of the propulsion systems and NEO propulsion systems for certain Aircraft.
| | |
| | | | | | |
Amendment No. 19 to the A320/A330 Purchase Agreement | | December 2014 | | Ø Reschedule and substitute certain A321 Aircraft. | | |
Agreement | | Date | | Aircraft (number purchased) | | Estimated Gross
Value of Aircraft |
| Amendment No. 20 to the A320/A330 Purchase Agreement | | June 2015 | | Ø⮚ Change to the schedule delivery month of one A321 Aircraft.
| | |
| | | | | | |
| Amendment No. 21 to the A320/A330 Purchase Agreement | | December 2015 | | Ø⮚ Change to the schedule delivery month of two A320 NEO Aircraft.
| | |
| | | | | | |
Amendment No. 22 to the A320/A330 Purchase Agreement | | April 15, 2016 | | Ø Rescheduling of the delivery of one A321 Aircraft. | | |
| | | | | | |
| Amendment No. 23 to the A320/A330 Purchase Agreement | | April 15, 2016 | | Ø⮚ Reflect the changes in the technical specifications of the aircraft to be received under this agreement.
| | |
| | | | | | |
| Amendment No. 24 to the A320/A330 Purchase Agreement | | August 8, 2016 | | Ø⮚ Cancel the delivery of eight A320 NEO Aircraft.
| | |
| | | | | | |
Amendment No. 2526 to the A320/A330 Purchase Agreement | December 21, 2018 | September 22, 2017 | | Ø⮚ Reschedule of the delivery of one A321 Aircraft, onefive A320 NEO Aircraft and foureleven A321 NEO Aircraft
| Aircraft. ⮚ Cancel the delivery of one A321 Aircraft. | |
| | | | | | |
| TAM Material Contracts – A350 Family Purchase Agreement |
| Purchase Agreement with Airbus S.A.S. | | January 2008 | | Ø⮚ Airbus A350 aircrafts (22)
Ø⮚ Ten option rights for Airbus A350 aircraft
| | US$6,480,000,000 |
| | | | | | |
| Amendment No. 1 to the A350 Purchase Agreement | | July 2010 | | Ø⮚ Exercise its option of five A350 XWB options.
| | |
| | | | | | |
| Amendment No. 2 to the A350 Purchase Agreement | | July 2014 | | Ø⮚ Reschedule the delivery of certain A350-900XWB and to amend certain provisions to reflect the latest aircraft specification.
| | |
| | | | | | |
| Novation Agreement to the A350 Purchase Agreement | | July 2014 | | Ø⮚ Novating the A350 purchase agreement from TAM to LATAM.
| | |
| | | | | | |
Amendment No. 3 to the A350 Purchase Agreement | | October 2014 | | Ø Reschedule the scheduled delivery month of a certain A350-900XWB aircraft. | | |
| | | | | | |
| Amendment No. 4 to the A350 Purchase Agreement | | September 2015 | | Ø⮚ Modify certain terms and conditions of such agreement and to convert a number of A350-900 XWB Aircraft into A350-1000 XWB Aircraft.
| | |
| | | | | | |
| Amendment No. 5 to the A350 Purchase Agreement | | November 2015 | | Ø⮚ Convert a number of A350-900 XWB aircraft into six A350-1000 XWB aircraft and to reschedule the delivery of certain A350-900 XWB.
| | |
| | | | | | |
Agreement | | Date | | Aircraft (number purchased) | | Estimated Gross
Value of Aircraft
|
Amendment No. 6 to the A350 Purchase Agreement | | February 3, 2016 | | Ø Reschedule the delivery of two A350 - 900 XWB Aircraft. | | |
| | | | | | |
| Amendment No. 7 to the A350 Purchase Agreement | | August 8, 2016 | | Ø⮚ Change aircraft type, from two A350-900 XWB Aircraft to two A350 - 1000 XWB Aircraft.
| | |
| | | | | | |
Amendment No. 8 to the A350 Purchase Agreement | | September 9, 2016 | | Ø Reschedule the delivery of two A350 - 900 XWB Aircraft. | | |
| | | | | | |
Amendment No. 9 to the A350 purchase agreement | Purchase Agreement | September 22, 2017 | | Ø⮚ Convert two A350-1000 XWB Aircraft into A350-900 XWB Aircraft
| | |
| Amendment No. 10 to the A350 Purchase Agreement | December 21, 2018 | ⮚ Convert four A350-1000 XWB Aircraft into A350-900 XWB Aircraft. ⮚ Reschedule of six A350-900 XWB Aircraft and eight A350-1000 XWB. | |
| Amendment No. 11 to the A350 Purchase Agreement | April 29, 2019 | ⮚ Reschedule of two A350-900 XWB Aircraft | |
| Amendment No. 12 to the A350 Purchase Agreement | August 5, 2019 | ⮚ Reschedule of one A350-900 XWB Aircraft | |
| TAM Material Contracts – Boeing 777 Purchase Agreement |
| Purchase Agreement with Boeing | | February 2007 | | Ø⮚ Boeing 777-32WER aircrafts (4)
| | US$1,070,000 |
| | | | | | |
| Supplemental Agreement No. 1 to the Purchase Agreement | | August 2007 | | Ø⮚ Exercise four option aircraft and to define certain aircraft configuration.
| | |
| | | | | | |
| Supplemental Agreement No. 2 to the Purchase Agreement | | March 2008 | | Ø⮚ Document its agreement on the descriptions and pricing of some options and master changes related to certain aircraft.aircraft.
| | |
| | | | | | |
| Supplemental Agreement No. 3 to the Purchase Agreement | | December 2008 | | Ø⮚ Purchase of two incremental 777 aircraft.
| | |
| | | | | | |
| Supplemental Agreement No. 5 to the Purchase Agreement | | July 2010 | | Ø⮚ Reschedule the delivery of certain aircraft.
| | |
| | | | | | |
| Supplemental Agreement No. 6 to the Purchase Agreement | | February 2011 | | Ø⮚ Purchase of two incremental 777 aircraft.
| | |
| | | | | | |
| Supplemental Agreement No. 7 to the Purchase Agreement | | May 2014 | | Ø⮚ Substitute two 777-300ER Aircraftaircraft originally scheduled for delivery in 2014 for two 777-F aircraft for scheduled delivery in 2017.
| | |
| | | | | | |
| Supplemental Agreement No. 8 to the Purchase Agreement | | April 2015 | | Ø⮚ Reschedule the delivery of certain aircraft.
| |
| Supplemental Agreement No. 11 to the Purchase Agreement | October 11, 2019 | ⮚ Option to cancel two Aircraft | |
Other Material Contracts
Boeing
On May 9, 1997, we entered into the Aircraft General Terms Agreement with The Boeing Company (“AGTA”), applicable to all Boeing aircraft contracted for purchase from The Boeing Company.
Boeing Aircraft Holding Company
On May 8, 2018, we also entered into an Aircraft Lease Common Terms Agreement with The Boeing Aircraft Holding Company for the lease of two B777-200ER aircraft. The average term of the lease is 12 months.
Airbus A320-Family Fleet
Between April and August 2011, we entered into Buyback Agreements No. 3001, 3030, 3062, 3214 and 3216 with Airbus Financial Services for the sale of five A318 aircraft for approximately US$107 million.
Between August 2012 and January 2013, we entered into Buyback Agreements No. 3371, 3390, 3438, 3469 and 3509 with Airbus Financial Services for the sale of five A318 aircraft for approximately US$102 million.
Aercap Holdings N.V.
On May 28, 2013, we entered into a framework deed with Aercap Holdings N.V. for the sale and leaseback of several used A330-200 aircraft, which were returned to the lessor, and several new aircraft to be received from the manufacturer including A350-900, B787-8 and B787-9 aircraft. The estimated gross value (at list prices) of these aircraft is US$3.0 billion.
Aircastle Holding Corporation Limited
On February 21, 2014, we entered into a framework deed with Aircastle Holding Corporation Limited for the lease of four B777-300ER already in fleet. The four aircraft were manufactured in 2012 and the estimated market value (at list prices) of these aircraft is US$580 million. The average term of the original leases were 60 months, and the agreement was extended for another 84 months.
GE Commercial Aviation
On April 30, 2007, we also entered into an Aircraft Lease Common Terms Agreement with GE Commercial Aviation Services Limited and two Aircraft Lease Agreements with Wells Fargo Bank Northwest N.A., as owner trustee, for the lease of two Boeing B777-200LRF aircraft. These aircraft were delivered in 2009 and the leases shall remain in place for a term of 96 months.
GE Engine Services LLC
On June 12, 2014, we (and TAM Linhas Aereas S.A.) entered into engine services agreement with GE Engine Services, LLC and GE Celma Ltda. for the provision of maintenance services of CF6-80C2B6F engines (which powers our B767 fleet) during 200 shop visits or 10 years, whichever occurs first.
On July 28, 2009, TAM Linhas Aereas S.A. entered into an engine services agreement with GE Engine Services, Inc. for the provision of maintenance services of GE90-115BL engines, which power 10 B777 passenger fleet and 4 spare engines, for a period of 12 years per engine.
CFM International
On December 17, 2010, we entered into General Terms Agreement No. CFM-1-2377460475 (the “GTA”) and Letter Agreement No. 1 to GTA with CFM International, Inc. (“CFM”) for the sale and support by CFM of CFM56-5B engines to power 70 A320 family aircraft and up to 14 CFM56-5B spare engines. On the same date, we entered into a Rate Per Flight Hour Engine Shop Maintenance Services Agreement with CFM for the provision by CFM of maintenance services for the above-mentioned installed and spare engines.
On December 31, 2014, we entered Letter Agreement No. 2 to GTA with CFM International, Inc. (“CFM”) for the sale and support by CFM of CFM56-5B engines to power 20 A320 family aircraft and one spare engine.
On March 15, 2006, TAM Linhas Aereas S.A. entered into an engine services agreement with GE Celma Ltda. for the provision of maintenance services for CFM56-5B engines, which power 47 A320 Fam passenger fleet and 6 spare engines, for a period of 15 years per engine.
PW1100G-JM Engine Maintenance Agreement
In February 2014, we entered into an engine support and maintenance agreement with United Technologies InternationInternational Corporation, Pratt & Whitney Division (“PW”) for the sale, support and maintenance by PW of PW1100G-JM engines to power 42 A320NEO family aircraft and nine spare engines. It is also a rate per engine flight hour contract agreement, which includes cost control mechanisms for LATAM.
Rolls-Royce PLC & Rolls-Royce TotalCare Services Limited
On September 30, 2009, we entered into General Terms Agreement No. DEG5307 (the “GTA”) with Rolls-Royce PLC for the sale and support by Rolls-Royce of Trent 1000 engines to power 32 B787 family aircraft and up to 10 Trent 1000 spare engines. On the same date, we entered into a Rate Per Flight Hour Engine Shop Maintenance Services Agreement with Rolls-Royce TotalCare Services Limited for the provision by Rolls-Royce of maintenance services for the above-mentioned installed and spare engines, for a period of 15 years per engine.
On January 11, 2011, TAM Linhas Aereas S.A. entered into General Terms Agreement No. DEG5292 (the “GTA”) with Rolls-Royce PLC for the sale and support by Rolls-Royce of Trent XWB engines to power 27 A350XWB family aircraft and up to 7 Trent XWB spare engines. On the same date, we entered into a Rate Per Flight Hour Engine Shop Maintenance Services Agreement with Rolls-Royce TotalCare Services Limited for the provision by Rolls-Royce of maintenance services for the above-mentioned installed and spare engines, for a period of 12 years per engine. Subsequently, on July 31, 2015, the aforementioned agreements were novated,assigned, so that LATAM Airlines Group S.A. replaces TAM Linhas Aereas S.A. in both agreements.
International Aero Engines AG
On October 12, 2006, we entered into an engine services agreement with IAE International Aero Engines AG for the provision of maintenance services of V2500-A5 engines, which power 53 A320 Fam passenger fleet and 9 spare engines, for a period of 12 years per engine.
On October 21, 2010, TAM Linhas Aereas S.A. entered into an engine services agreement with IAE International Aero Engines AG for the provision of maintenance services of V2500-A5 engines, which power 26 A320 Fam passenger fleet and 7 spare engines, for a period of 12 years per engine.
CFM International
On June 29, 2016, we entered into a Rate Per Flight Hour Agreement for Engine Shop Maintenance Services with CFM International, Inc., covering the maintenance, repair and overhaul of certain CFM56-5B engines.
PAAL Gemini Company Limited – PAAL Aquila Company Limited
During 2016, we entered into operating lease agreements with PAAL Gemini Company Limited and PAAL Aquila Company Limited, for the sale and lease back of four Airbus A321 received in our fleet in 2016. The term of each of the leases is 10 years and the estimated market value (at list prices) of these aircraft is US$200 million.
Jackson Square
During 2016, we entered into operating lease agreements with JSA Aircraft 7126, LLC, JSA Aircraft 7128, LLC, JSA Aircraft 7239, LLC and JSA Aircraft 7298, LLC, for the sale and lease back of three Airbus A321 and one Airbus A320 Neo received in our fleet in 2016. The term of each of the leases is 10 years and the estimated market value (at list prices) of these aircraft is US$200 million.
Avolon Aerospace
On May 10, 2017, we entered into a Framework Agreement with Avolon Aerospace for the assignment of two A350-900 aircraft. The estimated market value of these aircraft is US$ 246,000,000.
On September 8, 2017, we entered into an Operatinga Lease Agreement with Avolon Aerospace for the Sale and Leaseback of five A320 neo aircraft. The estimated market value of these aircraft is US$ 241,000,000. The average term of the leases is 144 months.
SABRE Contract
In November 2009,On January 16, 2018, we entered into a master agreementLease Agreement with Avolon Aerospace of two A321-200 aircraft. The estimated market value of these aircraft is US$ 88,600,000. The average term of the lease is 124 months.
Aircastle
On January 11, 2019, we entered into lease agreements with Aircastle for the lease of 10 A320 aircraft. The lease agreements are for a duration of approximately seven to eight years.
Vermillion
On September 2019, we entered into lease agreements with Vermillion for the lease of 4 A320 aircraft. The lease agreements are for a duration of approximately seven and eight years.
SABRE Inc., pursuant to which LATAM was granted with access and use of certain reservation systems and other SABRE software solutions. This agreement will remain in force for five years or until the expiration of all Work Orders to the agreement. In addition, onContract
On May 4, 2015, we entered into a Master Services License Agreement with SABRE Inc. Pursuant to this agreement SABRE Inc., will grant LATAM access and use of certain reservation systems. This agreement will enter into force after the expiration of Work Order No. 1 to the agreement entered in November 2009 by LATAM and SABRE Inc.and will be effective for an initial period of 10 years.
In addition, LATAM has distribution agreements in place with SABRE as well as with other distribution providers.
CFM56-5B Engine Maintenance Contract
In March 2006, TAM entered into a services agreement with GE Celma, a Brazilian subsidiary of General Electric Engine Services division, for the maintenance by GE Celma of CFM56-5B engines to power 25 A320 family aircraft and four spare engines.
In March 2007 TAM entered into the Amendment 1 to the above-mentioned services agreement with GE Celma, extending the maintenance services to the engines powering additional 16 A320 family aircraft and two spare engines.
V2500-A5 Engine Maintenance Agreement
In 2000, TAM entered into an engine maintenance contract with MTU Motoren-und Turbinen-Union München GmbH, or MTU, pursuant to which MTU agreed to provide certain maintenance, refurbishment, repair and modification services with respect to approximately 105 TAY650-15 aircraft engines. This contract is complemented by a novation and amendment agreement between us and Rolls-Royce Brazil Ltda. pursuant to which Rolls-Royce Brazil Ltda. replaced MTU as contract counterparty. This agreement terminates on June 30, 2015.
SABRE ContractRaizen
In October 2003, TAMJanuary 2013, we entered into an Aviation Fuel Supply Agreement with Raizen Combustiveis S.A. and a generallocal agreement for services agreement with SABRE Travel International Limited, pursuant to which TAM was granted a license (relating to the provision of maintenance services) for electronic reservation technology and database backup. The term of the agreement was tacitly and automatically extended to cover all Work Orders currently in force under the agreement and will expire at the same time with the expiration of the last Work Order. In addition, TAM has distribution agreements in place with SABRE as well as with other distribution providers.
In adittion, on May 4,Brazil. On December 28, 2015, we entered into a Master Services LicenseFirst Amendment to the agreement to extend its term and modify some commercial conditions for the services in Brazil. On November 19th 2018, we entered into a Second Amendment to the agreement to establish new commercial conditions, effective from January 2019 and valid for 3 years.
Petrobras
In April 2019, we entered into an Aviation Fuel Supply Agreement with SABRE Inc. Pursuant to thisPetrobras Distribuidora S.A. and a local agreement SABRE Inc., will grant TAM access and use of certain reservation systems.for services in Brazil. This agreement will enter into force after the expiration of that Work Order No. 1 to the November 2009 agreement between LATAM and SABRE Inc., andAgreements will be effective until December 31, 2021.
In addition, we entered into an Aviation Fuel Supply Agreement with Esmax Distribuidora S.A (Ex Petrobras Chile) and a local agreement for an initial period of 10 years.services in Chile, in January 2019. These Agreements will be effective until December 31st 2021.
Amadeus ContractAir BP-Copec
In July 2009, TAM2018, we entered into an Aviation Fuel Supply Agreement with Air BP Copec S.A. for services in Chile. These Agreements will be effective until December 31st 2021.
Pure Biofuels
In November 2014, we entered into a generalGeneral Terms and Conditions of a Contract Confirmation with Pure Biofuels del Peru S.A.C. for fuel supply services in Peru. Later, in 2016 and 2017, the agreement with Amadeus IT Group S.A., pursuant to which TAM was grantedmodified by a license (relatingfirst and second amendment.
On January 1st 2018, we entered into a Third Amendment to the provision of maintenance services) for electronic reservation technologyagreement to establish new commercial conditions, effective from January 2018 and database backup. The term of this agreement was ten years, unless terminated early by either party. On March 1, 2016, as part of LATAM’s plan to unify the Passenger Service Platform and migrate to a single service provider, TAM sent Amadeus an early termination notice to be effective during 2017. In addition, TAM has distribution agreements in place with Amadeus as well as with other distribution providers.valid until November 11, 2020.
D. Exchange Controls
Foreign Investment and Exchange Controls in Chile
The Central Bank of Chile is responsible, among other things, for monetary policies and exchange controls in Chile. Equity investments, including investments in shares of stock by persons who are non-Chilean residents, have been generally subject in the past to various exchange control regulations restricting the repatriation of their investments and the earnings thereon.
Article 47 of the Central Bank Act and former Chapter XXVI of the Central Bank Foreign Exchange Regulations regulated the foreign exchange aspects of the issuance of ADSs by a Chilean company until April 2001. According to former Chapter XXVI, the Central Bank of Chile and the depositary had to enter into an agreement in order to gain access to the formal exchange market. The issuers of the shares underlying the ADSs and the custodian could also be parties to these agreements.
On April 16, 2001, the Central Bank of Chile agreed that, effective April 19, 2001:
prior foreign exchange restrictions would be eliminated; and
| ● | prior foreign exchange restrictions would be eliminated; and |
| •● | a new Compendium of Foreign Exchange Regulations (Compendio de Normas de Cambios Internacionales) would be applied. |
The main objective of these amendments, as declared by the Central Bank of Chile, is to facilitate movement of capital in and out of Chile and to encourage foreign investment.
In connection with the change in policy, the Central Bank of Chile eliminated the following restrictions:
a reserve requirement with the Central Bank of Chile for a period of one year (this mandatory reserve was imposed on foreign loans and funds brought into Chile to purchase shares other than those acquired in the establishment of a new company or in the capital increase of the issuing company; the reserve requirement was gradually decreased from 30% of the proposed investment to 0%);
| ● | a reserve requirement with the Central Bank of Chile for a period of one year (this mandatory reserve was imposed on foreign loans and funds brought into Chile to purchase shares other than those acquired in the establishment of a new company or in the capital increase of the issuing company; the reserve requirement was gradually decreased from 30% of the proposed investment to 0%); |
| 106● | the requirement of prior approval by the Central Bank of Chile for certain operations; |
| ● | mandatory return of foreign currency to Chile; and |
the requirement of prior approval by the Central Bank of Chile for certain operations;
mandatory return of foreign currency to Chile; and
mandatory conversion of foreign currency into Chilean pesos.
| ● | mandatory conversion of foreign currency into Chilean pesos. |
Under the new regulations, only the following limitations apply to these operations:
the Central Bank of Chile must be provided with information related to certain operations; and
| ● | the Central Bank of Chile must be provided with information related to certain operations; and |
certain operations must be conducted with the Formal Exchange Market.
| ● | certain operations must be conducted with the Formal Exchange Market. |
The Central Bank of Chile also eliminated Chapter XXVI of the Compendium of Foreign Exchange Regulations, which regulated the establishment of an ADR facility by a Chilean company. Pursuant to the new rules, it is no longer necessary to seek the Central Bank of Chile’s prior approval in order to establish an ADR facility or to enter into a foreign investment contract with the Central Bank of Chile. The establishment of an ADR facility is now regarded as an ordinary foreign investment, and simply requires that the Central Bank of Chile be informed of the transaction pursuant to Chapter XIV of the amended Compendium of Foreign Exchange Regulations and that the foreign currency transactions related thereby be conducted through the Formal Exchange Market.
However, all contracts executed under the provisions of former Chapter XXVI (including the foreign investment contract among LATAM Airlines Group, the Central Bank of Chile and the ADS depositary, or the “Foreign Investment Contract”), remained in full force and effect and continued to be governed by the provisions, and continued to be subject to the restrictions, set forth in former Chapter XXVI at the time of its abrogation. Our Foreign Investment Contract guaranteed ADS investors access to the Formal Exchange Market to convert amounts from Chilean pesos into U.S. dollars and repatriate amounts received with respect to deposited common shares or common shares withdrawn from deposit or surrender of ADRs (including amounts received as cash dividends and proceeds from the sale in Chile of the underlying common shares and any rights arising from them).
On May 10, 2007, the Board of the Central Bank of Chile resolved to interpret the regulations regarding the former Chapter XXVI in connection with the access granted to the Formal Exchange Market. These regulations allowed entities that carry out capital increases by means of the issuance of cash shares before August 31, 2007 to apply the aforementioned regulation to their capital increases, but only once and only if those shares can be fully subscribed and paid by August 31, 2008, among other conditions. Consequently, capital increases carried out after August 31, 2007 will have no guaranteed access to the Formal Exchange Market.
On October 17, 2012, the Central Bank of Chile, the depositary and LATAM Airlines Group entered into a termination agreement in respect of LATAM’s existing foreign investment contract. ADR holders were notified about this termination in accordance with Section 16 of the Deposit Agreement. Upon termination of the foreign investment contract, holders of ADSs and the depositary no longer have guaranteed access to the Formal Exchange Market. Currently, the ADS facility is governed by Chapter XIV of the Compendium on “Regulations applicable to Credits, Deposits, Investments and Capital Contributions from Abroad.” According to Chapter XIV, the establishment or maintenance of an ADS facility is regarded as an ordinary foreign investment, and it is not necessary to seek the Central Bank of Chile’s prior approval in order to establish an ADS facility. The establishment or maintenance of an ADS facility only requires that the Central Bank of Chile be informed of the transaction, and that the foreign currency transactions related thereby be conducted through the Formal Exchange Market.
Investment in Our Shares and ADRs after the business combination with TAM
As a result of the combination with TAM, investments made in shares of our common stock are subject to the following requirements:
any foreign investor acquiring shares of our common stock who brought funds into Chile for that purpose must bring those funds through an entity participating in the Formal Exchange Market;
| ● | any foreign investor acquiring shares of our common stock who brought funds into Chile for that purpose must bring those funds through an entity participating in the Formal Exchange Market; |
any foreign investor acquiring shares of our common stock to be converted into ADSs or deposited into an ADR program who brought funds into Chile for that purpose must bring those funds through an entity participating in the Formal Exchange Market;
| ● | any foreign investor acquiring shares of our common stock to be converted into ADSs or deposited into an ADR program who brought funds into Chile for that purpose must bring those funds through an entity participating in the Formal Exchange Market; |
in both cases, the entity of the Formal Exchange Market through which the funds are brought into Chile must report such investment to the Central Bank of Chile;
| ● | in both cases, the entity of the Formal Exchange Market through which the funds are brought into Chile must report such investment to the Central Bank of Chile; |
all remittances of funds from Chile to the foreign investor upon the sale of the acquired shares of our common stock or from dividends or other distributions made in connection therewith must be made through the Formal Exchange Market;
| ● | all remittances of funds from Chile to the foreign investor upon the sale of the acquired shares of our common stock or from dividends or other distributions made in connection therewith must be made through the Formal Exchange Market; |
all remittances of funds from Chile to the foreign investor upon the sale of shares underlying ADSs or from dividends or other distributions made in connection therewith must be made through the Formal Exchange Market; and
| ● | all remittances of funds from Chile to the foreign investor upon the sale of shares underlying ADSs or from dividends or other distributions made in connection therewith must be made through the Formal Exchange Market; and |
all remittances of funds made to the foreign investor must be reported to the Central Bank of Chile by the intervening entity of the Formal Exchange Market.
| 107● | all remittances of funds made to the foreign investor must be reported to the Central Bank of Chile by the intervening entity of the Formal Exchange Market. |
When funds are brought into Chile for a purpose other than to acquire shares to convert them into ADSs or deposit them into an ADR program and subsequently such funds are used to acquire shares to be converted into ADSs or deposited into an ADR program such investment must be reported to the Central Bank of Chile by the custodian within 10 days following the end of each month within which the custodian is obligated to deliver periodic reports to the Central Bank of Chile.
When funds to acquire shares of our common stock or to acquire shares to convert them into ADSs or deposit them into an ADR program are received by us abroad (i.e., outside of Chile), such investment must be reported to the Central Bank of Chile directly by the foreign investor or by an entity participating in the Formal Exchange Market within ten days following the end of the month in which the investment was made.
All payments in foreign currency in connection with our shares of common stock or ADSs made from Chile through the Formal Exchange Market must be reported to the Central Bank of Chile by the entity participating in the transaction. In the event there are payments made outside of Chile, the foreign investor must provide the relevant information to the Central Bank of Chile directly or through an entity of the Formal Exchange Market within the first ten calendar days of the month following the date on which the payment was made.
There can be no assurance that additional Chilean restrictions applicable to the holders of ADSs, the disposition of shares of our common shares underlying ADSs or the conversion or repatriation of the proceeds from such disposition will not be imposed in the future, nor can we assess the duration or impact of such restriction if imposed.
This summary does not purport to be complete and is qualified by reference to Chapter XIV of the Central Bank of Chile’s Foreign Exchange Regulations, a copy of which is available in Spanish and English versions at the Central Bank’s website at www.bcentral.cl.
Voting Rights
Holders of our ADSs, which represent common shares, may instruct the depositary to vote the shares underlying their ADRs. If we ask holders for instructions, the depositary will notify such holders of the upcoming vote and arrange to deliver our voting materials to such holders. The materials will describe the matters to be voted on and explain how holders may instruct the depositary to vote the shares or other deposited securities underlying their ADSs as they direct by a specified date. For instructions to be valid, the depositary must receive them on or before the date specified as “Vote Cut-Off Date.” The depositary will try, as far as practical, subject to Chilean law and the provisions of our by-laws, to vote or to have its agents vote the shares or other deposited securities as holders instruct. Otherwise, holders will not be able to exercise their right to vote unless they withdraw the shares. However, holders may not know about the meeting far enough in advance to withdraw the shares. We will use our best efforts to request that the depositary notify holders of upcoming votes and ask for their instructions.
If the depositary does not receive voting instructions from a holder by the specified date, it will consider such holder to have authorized and directed it to give a discretionary proxy to a person designated by our board of directors to vote the number of deposited securities represented by such holder’s ADSs. The depositary will give a discretionary proxy in those circumstances to vote on all questions to be voted upon unless we notify the depositary that:
we do not wish to receive a discretionary proxy;
| · | we do not wish to receive a discretionary proxy; |
we think there is substantial shareholder opposition to the particular question; or
| · | we think there is substantial shareholder opposition to the particular question; or |
we think the particular question would have an adverse impact on our shareholders.
| · | we think the particular question would have an adverse impact on our shareholders. |
The depositary will only vote or attempt to vote as such holder instructs or as described above.
| · | The depositary will only vote or attempt to vote as such holder instructs or as described above. |
We cannot assure holders that they receive the voting materials in time to ensure that they can instruct the depositary to vote their shares. This means that holders may not be able to exercise their right to vote and there may be nothing they can do if their shares are not voted as they requested.
Exchange Rates
Prior to 1989, Chilean law permitted the purchase and sale of foreign exchange only in those cases explicitly authorized by the Central Bank of Chile. The Central Bank Act liberalized the rules that govern the ability to buy and sell foreign currency. The Central Bank Act empowers the Central Bank of Chile to determine that certain purchases and sales of foreign currency specified by law must be carried out exclusively in the Formal Exchange Market, which is made up of the banks and other entities authorized by the Central Bank of Chile. All payments and distributions with respect to the ADSs must be conducted exclusively in the Formal Exchange Market.
For purposes of the operation of the Formal Exchange Market, the Central Bank of Chile sets a reference exchange rate (dó(dólar acuerdo)acuerdo). The Central Bank of Chile resets the reference exchange rate monthly, taking internal and external inflation into account, and adjusts the reference exchange rate daily to reflect variations in parities between the Chilean peso, the U.S. dollar, the Japanese yen and the European euro.
The observed exchange rate (dólar observado) is the average exchange rate at which transactions were actually carried out in the Formal Exchange Market on a particular day, as certified by the Central Bank of Chile on the next banking day.
Prior to September 3, 1999, the Central Bank of Chile was authorized to buy or sell dollars in the Formal Exchange Market to maintain the observed exchange rate within a specified range above or below the reference exchange rate. On September 3, 1999, the Central Bank of Chile eliminated the exchange band. As a result, the Central Bank of Chile may buy and sell foreign exchange in the Formal Exchange Market in order to maintain the observed exchange rate at a level the Central Bank of Chile determines.
Purchases and sales of foreign exchange may be effected outside the Formal Exchange Market through the Informal Exchange Market (Mercado Cambiario Informal) established by the Central Bank in 1990. There are no limits on the extent to which the rate of exchange in the Informal Exchange Market can fluctuate above or below the observed exchange rate.
Although our results of operations have not been significantly affected by fluctuations in the exchange rates between the peso and the U.S. dollar because our functional currency is the U.S. dollar, we are exposed to foreign exchange losses and gains due to exchange rate fluctuations. Even though the majority of our revenues are denominated in or pegged to the U.S. dollar, the Chilean government’s economic policies affecting foreign exchange and future fluctuations in the value of the peso against the U.S. dollar could adversely affect our results of operations and an investor’s return on an investment in ADSs.
E. Taxation
Chilean Tax
The following discussion relates to Chilean income tax laws presently in force, including Ruling No. 324 of January 29, 1990 of the Chilean Internal Revenue Service (“Chilean IRS”) and other applicable regulations and rulings, all of which are subject to change. The discussion summarizes the principal Chilean income tax consequences of an investment in the ADSs or common shares by a person who is neither domiciled in, nor a resident of, Chile or by a legal entity that is incorporated abroad not organized under the laws of Chile and does not have a branch or a permanent establishment located in Chile (such an individual or entity is referred to herein as a Foreign Holder). For purposes of Chilean tax law, an individual holder is a resident of Chile if such person has residedremains in Chile, whether continuously or not, for more than six consecutive months in one calendar yeara period or forperiods exceeding a total of six months in two consecutive tax years. In addition, an individual is considered domiciled in Chile in case he or she resides in Chile with the actual or presumptive intent of staying in the country.183 days, within any twelve-month period. The discussion is not intended as tax advice to any particular investor, which can be rendered only in light of that investor’s particular tax situation.
Under Chilean law, provisions contained in statutes such as tax rates applicable to foreign investors, the computation of taxable income for Chilean purposes and the manner in which Chilean taxes are imposed and collected may only be amended by another statute. In addition, the Chilean tax authorities enact rulings and regulations of either general or specific application and interpret the provisions of Chilean tax law. Chilean tax may not be assessed retroactively against taxpayers who act in good faith relying on such rulings, regulations and interpretations, but Chilean tax authorities may change these rulings, regulations and interpretations prospectively. On February 4, 2010, representatives of the governments of the United States and Chile signed an income tax treaty. The treaty will have to be approved by the U.S. Senate and the Chilean Congress before it becomes effective.effective (the Chilean Congress ratified it in 2017).
Law No. 20,780, enacted on September 29, 2014, in conjunction with Law No. 20,899, enacted on February 8, 2016 (both, the “Tax Reform Act”) introduced a comprehensive modification to the Chilean income tax system. The Tax Reform Act introduced changes to the corporate tax rate, mandating a gradual increase of the rate from 20% to 25% or 27% in certain cases, the rules regarding minimum capitalization, and the taxation of Chilean investments abroad (the controlled-foreign-corporation rules), and introduced two new alternative general income tax regimes for Chilean taxpayers (Fully Integrated Regime and Partially Integrated Regime), among others. The new rules are currently effective, with the implementation process having commenced on October 1, 2014. The Fully Integrated Regime and the Partially Integrated RegimeBoth regimes apply as from January 1, 2017. The mandatory regime for entities organized as stock corporations like Latam Airlines Group S.A. is the Partially Integrated System. TheSystem and the Corporate Income Tax rate for companies under this regime is 27% from 2018 onward. A transition rate of 25.5% applied in 2017.
In addition, on February 24, 2020 a new tax reform law was enacted which in general will be in force as of March 1, 2020 with some provisions entering into force at different dates. The main new rules are: (i) repealing both the Fully and the Partially Integrated Regimes. A new tax regime is established for small and medium enterprises (SMEs) whose sales do not exceed app US$2.55 million annually (the threshold might consider related party income) with a 25% rate Corporate Tax, and 100% of credit against final taxes (please note that amounts expressed in USD may be subject to change due to exchange rate fluctuations). The Partially Integrated regime would remain for companies exceeding such threshold; (ii) incorporating a surcharge of the current real estate tax applicable on the aggregate value of a taxpayer’s real estate higher than US$600,000 app; (iii) limiting and eventually impeding Chilean holding companies in a tax loss position from claiming a refund of the corporate taxes paid by local subsidiaries remitting dividends. Full implementation would occur in 2024; (iv) increasing the higher marginal personal income tax rate for Chilean domiciled individuals up to a 40% from the current 35%; and (v) modifying some requirements from the capital gain tax exemption in the sale of shares with high stock market presence, amongst other. We do not expect any material adverse effect on our business from this new tax reform law.
Cash Dividends and Other Distributions
Under the new Partially Integrated Regime, cash dividends we pay with respect to the ADSs or common shares held by a Foreign Holder will be subject to a 35% Chilean withholding tax, which we withhold and pay over to the Chilean tax authorities and which we refer to as the Withholding Tax. A credit against the Withholding Tax is available based on the corporate income tax rate of the year of distribution and provided a sufficient balance of accumulated corporate income tax credits is available. These credits correspond to corporate income tax we actually paid on the accumulated income (referred to herein as the First Category Tax or FCIT). However, this credit does not reduce the Withholding Tax on a one-for-one basis because it also increases the base on which the Withholding Tax is imposed. If we register net income but taxable losses, no credit against the Withholding Tax may be available. In addition, if we distribute less than all of our distributable income, the credit for First Category Tax we pay is proportionately reduced. If we register net income but taxable losses, no credit against the Withholding Tax may be available.
The Partially Integrated Regime reduces the amount of First Category Tax creditable against the Withholding Tax for certain Foreign Holders. As a general rule, only 65% of the First Category Income Tax credit will actually offset the Withholding Tax. 35% of the credit must be added back to the Withholding Tax amount to be paid into the Treasury (referred to herein as First Category Tax Credit Restitution). However, if a tax treaty is in place between Chile and the country of domicile of a Foreign Holder and such Foreign Holder is entitled to treaty benefits in relation to the income, the full First Category Tax credit will continue to be available to offset against the Withholding Tax.
Under a transitory provision in force until December 31, 2021, the full 27% First Category Tax will also be creditable against the 35% Withholding Tax if the recipient of a dividend distribution is a shareholder resident in a country with which Chile has a tax treaty signed before January 1st, 2019, although such treaty is not yet in force. The tax reform modifies this provision in terms of allowing the full First Category Tax credit until December 31, 2026 for treaties signed before January 1, 2020.
In general, the example below illustrates the effective Withholding Tax burden on a cash dividend received by a Foreign Holder assuming a Withholding Tax rate of 35%, a First Category Tax rate of 27% and a distribution of 30% of the consolidated net income of the Company after payment of the First Category Tax:
| | | Foreign Holder in Treaty
Country | | Foreign Holder in Non
Treaty country | | | Foreign Holder in
Treaty Country | | Foreign Holder in
Non Treaty Country | |
| The Company’s taxable income | | | 100.00 | | | | 100.00 | | | | 100.00 | | | | 100.00 | |
| First Category Tax (27% of Ch$100)(*) | | | (27.00 | ) | | | (27.00 | ) | |
| First Category Tax (27% of Ch$100) . | | | | (27.00 | ) | | | (27.00 | ) |
| Net distributable income | | | 73.00 | | | | 73.00 | | | | 73.00 | | | | 73.00 | |
| Dividend distributed (*) | | | 21.90 | | | | 21.90 | | | | 21.90 | | | | 21.90 | |
| First category increase | | | 8.10 | | | | 8.10 | | | | 8.10 | | | | 8.10 | |
| Amount subject to Withholding Tax (**) | | | 30.00 | | | | 30.00 | | | | 30.00 | | | | 30.00 | |
| Withholding Tax | | | (10.50 | ) | | | (10.50 | ) | | | (10.50 | ) | | | (10.50 | ) |
| Credit for First Category Tax | | | 8.10 | | | | 8.10 | | | | 8.10 | | | | 8.10 | |
| Add back 35% of the First Category Tax | | | N/A | | | | (2.84 | ) | | | N/A | | | | (2.84 | ) |
| Net tax withheld | | | (2.40 | ) | | | (5.24 | ) | | | (2.40 | ) | | | (5.27 | ) |
| Net dividend received | | | 19.5 | | | | 16.66 | | | | 19.5 | | | | 16.64 | |
| Effective dividend withholding rate | | | 11 | % | | | 24 | % | | | 11 | % | | | 24 | % |
| (*) | Special considerations apply to a distribution performed in 2017 |
| (**) | 30% of net distributable income. |
| (**) | The dividend of Ch$21.90 grossed up with the First Category Tax credit of Ch$8.10. |
The effective rate of Withholding Tax to be imposed on dividends we pay will depend on the First Category Tax rate applicable in the year of distribution and on the balance of First Category Income Tax credits accumulated by the company. The First Category Tax rate will be 27% for 2018 and following years. Special considerations applied to a distribution performed during 2017. These considerations are set out in a separate paragraph further below. The First Category Income Tax credits generated under the new tax regime, i.e. as of 2017, will be allocated first. Once the balance of First Category Tax credits generated as of 2017 are exhausted, the First Category Tax credits accumulated until December 31, 2016 will be used. In that event the First Category Tax credit available against the Withholding Tax will not correspond to the First Category Tax rate of the year of distribution but to the average rate of First Category Tax credits accumulated until December 31, 2016. This average rate will be determined by dividing the aggregate First Category Tax Credits accumulated until December 31, 2016 by the aggregate retained taxable profits accumulated at the same date. The First Category Tax credits accumulated until December 31, 2016 are not subject to the First Category Tax Credit Restitution irrespective of whether a tax treaty is in place with the country of the Foreign Holder or not.
The First Category Tax credits accumulated until December 31, 2016 correspond to the First Category Tax we actually paid on the income generated in a given year. For earnings generated from 1991 until 2001, the First Category Tax rate was 15%. The rate was 16.0% in 2002, 16.5% in 2003, 17% from 2004 until 2010, 20% from 2011 until 2013, 21% in 2014, 22.5% in 2015, and 24% in 2016.2016 and 25.5% in 2017 for companies subject to the Partially Integrated Regime.
In the event that the accumulated First Category Tax credits are not sufficient to cover any particular dividend, we will generally withhold tax from the dividend at the full 35% rate.
Dividend distributions made in kind would be subject to the same Chilean tax rules as cash dividends based on the fair market value of the relevant assets. Stock dividends and the distribution of preemptive rights are not subject to Chilean taxation.
Special Considerations for distributions performed during 2017
The First Category Tax rate for 2017 was 25.5%. However, in 2017 the First Category Tax credit available against the Withholding Tax did not correspond to the First Category Tax rate of the year but to the average rate of First Category Tax credits accumulated until December 31, 2016. This average rate is determined by dividing the aggregate First Category Tax Credits accumulated until December 31, 2016 by the aggregate retained taxable profits accumulated at the same date. These credits are not subject to the First Category Tax Credit Restitution, irrespective of whether a tax treaty is in place with the country of the Foreign Holder or not.
Capital Gains
Gain from the sale or other disposition by a Foreign Holder of ADRs evidencing ADSs outside Chile will not be subject to Chilean taxation. The deposit and withdrawal of common shares in exchange for ADRs will not be subject to any Chilean taxes.
Gain recognized on a sale or disposition of common shares by a Foreign Holder (as distinguished from sales or exchanges of ADRs evidencing ADSs representing such common shares) may be subject to a 35% Withholding Tax. Moreover, a gain not exceeding 10 Annual Tax Units (US$9,1697,310 as of December 31, 2017)February 28, 2020) recognized by a Foreign Holder without taxable presence in Chile in a sale to a non-related buyer will not be taxable.
The gain on the sale of shares of common stock by a Foreign Holder is subject to a withholding of 35% of the gain. If the gain subject to taxation cannot be determined, the Foreign Holder is subject to a provisional withholding of 10% of the total (sale price) amount, without any deduction, when the amounts are paid to, credited to, accounted for, put at the disposal of, or corresponding to, the Foreign Holder.TheHolder. The Foreign Holder would be entitled to request a tax refund for any amounts withheld in excess of the taxes actually due in April of the following year upon filing its corresponding tax return. Gain recognized in the transfer of common shares that have a high presence in the stock exchange, however, is not subject to capital gains tax in Chile, provided that the common shares are transferred in a local stock exchange or within the process of a public tender of common shares governed by the Securities Market Law. The common shares must have been acquired either in a local stock exchange, within the process of a public tender of common shares governed by the Securities Market Law, in an initial public offer of common shares resulting from the formation of a corporation or a capital increase of the same, or in an exchange of convertible bonds.
Notwithstanding the foregoing paragraph, Chile’s tax authority Ruling No. 1,480 (issued on August 22, 2014) confirmed that capital gains stemming from the sale of shares with high stock market presence acquired through the exchange of American Depositary Receipts (ADRs) for shares is not subject to capital gains tax in Chile. Such exemption is applicable provided that the ADRs comply with the requirements established by the CMF for the public offering of securities in Chile (i.e. if the ADRs are registered in the Foreign Securities Registry of the CMF, or their registration has been exempted by the CMF under a cooperation agreement signed with regulators of foreign markets), and the underlying shares have been registered in the Securities Registry of the CMF and on a Chilean Stock exchange. Shares are considered to have a high presence in the stock exchange when they:
are registered in the Securities Registry;
| · | are registered in the Securities Registry; |
are registered in a Chilean Stock exchange; and
| · | are registered in a Chilean Stock exchange; and |
meet at least one of the following requirements:
| · | meet at least one of the following requirements: |
| i. | have an adjusted presence equal to or above 25%; |
| ii. | have a Market Maker.Maker (this requirement is limited under the recently enacted tax reform law). |
To calculate the adjusted presence of a particular share, the aforementioned regulation first requires a determination of the number of days in which the operations regarding the stock exceeded, in Chilean pesos, the equivalent of 1,000 UF (US$43,59234,864 as of December 31, 2017)February 28, 2020) within the previous 180 business days of the stock market. That number must then be divided by 180, multiplied by 100, and expressed in a percentage value. This tax regime does not apply if the transaction involves an amount of shares that would allow the acquirer to take control of the publicly traded corporation, in which case the ordinary tax regime referred to in the previous paragraph will apply, unless the transfer is part of a tender offer governed by the Securities Market Law or the transfer is done on a Chilean stock exchange, without substantially exceeding the market price.
To meet the “Market Maker” requirement the issuer of the shares must execute a written contract with a stock broker incorporated in Chile that fulfills some additional requirements. The tax reform modifies this provision in those cases where the high stock market presence is given exclusively by virtue of a Market Maker. Under the proposed provision, the capital gain tax exemption would apply only for the term of one year from the first public offering of the securities.
A capital gains tax exemption for “foreign institutional investors” such as mutual funds and pension funds was repealed as from May 1, 2014 by Law 20,712. However, the law includes a grandfathering provision for shares acquired before May 1, 2014. This provision establishes an exemption on the capital gain obtained in the sale of shares that are publicly traded and have a high presence in a stock exchange when the sale is made by a foreign institutional investor, provided that the sale is made in a local stock exchange or in a public tender in accordance with the provisions of the Securities Market Law, or in the redemption of fund quotas, and the shares were acquired before May 1, 2014.
Pursuant to the regulations of the grandfathering rule, to qualify as a foreign institutional investor an entity must be formed outside of Chile, not have a domicile in Chile, and must be at least one of the following:
• a fund registered with a regulatory authority of a EU or OECD country, or other country duly authorized by the CMF;
| · | a fund registered with a regulatory authority of a EU or OECD country, or other country duly authorized by the CMF; |
• a pension fund that is formed exclusively by natural persons that receive pensions out of an accumulated capital in the fund, regulated by an authority of the countries mentioned above;
| · | a pension fund that is formed exclusively by natural persons that receive pensions out of an accumulated capital in the fund, regulated by an authority of the countries mentioned above; |
• an insurance company regulated by the competent regulatory authority of the insurance business, as appropriate, which must be part of IAIS,International Association of Insurance Supervisors, or ASSAL,Asociación de Supervisores de Seguros de América Latina;
| · | an insurance company regulated by the competent regulatory authority of the insurance business, as appropriate, which must be part of IAIS,International Association of Insurance Supervisors, or ASSAL,Asociación de Supervisores de Seguros de América Latina; |
• a foreign State or a division with political autonomy recognized by Chile, whether they invest through its government, central bank, issuing bank or corresponding monetary authority. Moreover, the investment can be made through investment authorities, investment agencies, investment corporations or other entities, provided that its purpose is to provide financial resources for the exclusive benefit of the foreign State or territorial division, and provided that the vehicle is not used also for investments or resources other than those of the sovereign fund; or
| · | a foreign State or a division with political autonomy recognized by Chile, whether they invest through its government, central bank, issuing bank or corresponding monetary authority. Moreover, the investment can be made through investment authorities, investment agencies, investment corporations or other entities, provided that its purpose is to provide financial resources for the exclusive benefit of the foreign State or territorial division, and provided that the vehicle is not used also for investments or resources other than those of the sovereign fund; or |
• an endowment funds duly registered in a EU or OECD country, or other country duly authorized by the CMF.
| · | an endowment funds duly registered in a EU or OECD country, or other country duly authorized by the CMF. |
The foreign institutional investor must not directly or indirectly participate in the control of the corporations issuing the shares it invests in, nor possess or participate directly or indirectly in 10% or more of the capital or the profits of such corporations.
Another requirement for the exemption is that the foreign institutional investor must execute a written contract with a bank or a stock broker incorporated in Chile. In this contract, the bank or stock broker must undertake to execute purchase and sale orders, verify the applicability of the tax exemption or tax withholding and inform the Chilean IRS of the investors it works with and the transactions it performs. Finally, the foreign institutional investor must register with the Chilean IRS by means of a sworn statement issued by such bank or stock broker.
The tax basis of common shares received in exchange for ADRs will be the acquisition value of the common shares on the date of exchange duly adjusted for local inflation. The valuation procedure set forth in the deposit agreement, which values common shares which are being exchanged at the highest price at which they trade on the SSE on the date of the exchange, will determine the acquisition value for this purpose. Consequently, the surrender of ADRs for common shares and the immediate sale of the common shares for the value established under the Deposit Agreement will not generate a capital gain subject to taxation in Chile, provided that the sale of the common shares is made on the same date on which the exchange of ADRs for common shares is recorded, or if the price of the common shares at the exchange date, as determined above, is higher than the price at which the common shares are sold.
The exercise of preemptive rights relating to the common shares will not be subject to Chilean taxation. Any gain obtained by a Foreign Holder without taxable presence in Chile on the sale of preemptive rights relating to the common shares will be subject to Withholding Tax (the former being creditable against the latter).
Other Chilean Taxes
There are no Chilean inheritance, gift or succession taxes applicable to the ownership, transfer or disposition of ADSs by a Foreign Holder, but such taxes generally will apply to the transfer at death or by gift of the common shares by a Foreign Holder. There are no Chilean stamp, issue, registration or similar taxes or duties payable by Foreign Holders of ADSs or common shares.
Withholding Tax Certificates
Upon request, we will provide to Foreign Holders appropriate documentation evidencing the payment of the Withholding Tax (net of the applicable First Category Tax credit).
Material United States Federal Income Tax Considerations
This section describes the material United StatesU.S. federal income tax consequences to a U.S. holder (as defined below) of owning common shares or ADSs. It applies to you only if you hold your common shares or ADSs as capital assets for tax purposes. This section does not purport to be a complete analysis or listing of all potential U.S. federal income tax considerations that may be relevant to U.S holders with respect to their ownership and disposition of ADSs or common shares. Accordingly, it is not intended to be, and should not be construed as, tax advice. This section does not apply to you if you are a member of a special class of holders subject to special rules, including:
a dealer in securities,
| ● | a trader in securities that elects to use a mark-to-market method of accounting for securities holdings, |
| ● | a tax-exempt organization, |
| ● | a financial institution, |
| ● | a regulated investment company, |
| ● | a real estate investment trust, |
| ● | a life insurance company, |
| ● | a person liable for alternative minimum tax, |
| ● | a person that directly, indirectly or constructively owns 10% or more of the vote or value of our stock, |
| ● | a person that holds common shares or ADSs as part of a straddle or a hedging or conversion transaction, |
| ● | a person that purchases or sells common shares or ADSs as part of a wash sale for tax purposes, |
| ● | a U.S. holder (as defined below) whose functional currency is not the U.S. dollar. |
a trader in securities that elects to use a mark-to-market method of accounting for securities holdings,
| ● | a person who acquired our ADSs or common shares pursuant to the exercise of any employee share option or otherwise as compensation, or |
a tax-exempt organization,
a financial institution,
a regulated investment company,
a real estate investment trust,
a life insurance company,
a person liable for alternative minimum tax,
a person that directly, indirectly or constructively owns 10% or more of the vote or value of our stock,
a person that holds common shares or ADSs as part of a straddle or a hedging or conversion transaction,
a person that purchases or sells common shares or ADSs as part of a wash sale for tax purposes, or
a U.S. holder (as defined below) whose functional currency is not the U.S. dollar.
| 113● | a partnership or other pass-through entity or arrangement treated as such (or a person holding our ADSs or common shares through a partnership or other pass through entity or arrangement treated as such). |
If you are a member of a special class of holders subject to special rules, you should consult your tax advisor with regard to the United StatesU.S. federal income tax treatment of an investment in the common shares or ADSs, including the potential impact of recently enacted legislation (P.L. 115-97) commonly referred to as the Tax Cut and Jobs Act (the “Act”). Moreover, this summary does not address the U.S. federal estate, gift, or alternative minimum tax considerations, or any U.S. state, local, or non-U.S. tax considerations of the acquisition, ownership and disposition of common shares and ADSs.
This section is based on the Internal Revenue Code of 1986, as amended, (the “Code”) its legislative history, existing and proposed Treasury regulations, published rulings and court decisions, all as currently in effect.of the date hereof. These laws are subject to change or differing interpretation, possibly on a retroactive basis. There is currently no comprehensiveNo ruling has been sought from the U.S. Internal Revenue Service with respect to any U.S. federal income tax treaty in effect betweenconsequences described below, and there can be no assurance that the U.S. Internal Revenue Service or a court will not take a contrary position. On February 4, 2010, representatives of the governments of the United States and Chile signed an income tax treaty but the Republic of Chile.treaty is not yet in effect since it has not yet been ratified by both the U.S. Senate and the Chilean Congress. In addition, this section is based in part upon the representations of the Depositary and the assumption that each obligation in the Deposit Agreement and any related agreement will be performed in accordance with its terms.
If a partnership holds the common shares or ADSs, the United StatesU.S. federal income tax treatment of a partner will generally depend on the status of the partner and the tax treatment of the partnership. A partner in a partnership holding the common shares or ADSs should consult its tax advisor with regard to the United StatesU.S. federal income tax treatment of an investment in the common shares or ADSs, including the potential impact of the Act.
You are a U.S. holder if you are a beneficial owner of common shares or ADSs and you are:
a citizen or resident of the United States,
| ● | an individual who is a citizen or resident of the United States, |
a domestic corporation,
| ● | a corporation (or other entity taxable as a corporation) created or organized under the laws of the United States, any state thereof or the District of Columbia, |
an estate whose income is subject to United States federal income tax regardless of its source, or
| ● | an estate whose income is subject to U.S. federal income tax regardless of its source, or |
a trust if a United States court can exercise primary supervision over the trust’s administration and one or more United States persons are authorized to control all substantial decisions of the trust.
You should consult your own tax advisor regarding the United States federal, state and local and the Chilean and other tax consequences of owning and disposing of common shares and ADSs in your particular circumstances.
| ● | a trust if (1) a United States court can exercise primary supervision over the trust’s administration and one or more United States persons are authorized to control all substantial decisions of the trust or (2) a valid election is in effect under applicable Treasury regulations to treat the trust as a U.S. person. |
ADSs
In general, and taking into account the earlier assumptions, for United StatesU.S. federal income tax purposes, if you hold ADRs evidencing ADSs, you will be treated as the beneficial owner of the common shares represented by those ADRs. Exchanges of common shares for ADRs, and ADRs for common shares, generally will not be subject to United StatesU.S. federal income tax.
The U.S. Treasury has expressed concerns that intermediaries in the chain of ownership between the holder of an ADS and the issuer of the security underlying the ADS may be taking actions that are inconsistent with the beneficial ownership of the underlying security. Accordingly, the creditability of any foreign taxes paid and the availability of the reduced tax rate for dividends received by certain non-corporate U.S. holders (as discussed below), could be affected by actions taken by intermediaries in the chain of ownership between the holders of ADSs and us if as a result of actions the holders of ADSs are not properly treated as beneficial owners of the underlying common shares.
Taxation of Dividends
Under the United StatesU.S. federal income tax laws, and subject to the passive foreign investment company (“PFIC”) rules discussed below, if you are a U.S. holder, the gross amount of any dividend we pay out of our current or accumulated earnings and profits (as determined for United StatesU.S. federal income tax purposes) is subject to United StatesU.S. federal income taxation. Distributions in excess of current and accumulated earnings and profits, as determined for U.S. federal income tax purposes, will be treated as a non-taxable return of capital to the extent of your adjusted tax basis in the common shares or ADSs, as the case may be, and thereafter as capital gain from the sale or exchange of the common shares or ADSs, as the case may be. However, we do not expect to calculate earnings and profits in accordance with U.S. federal income tax principles. Accordingly, you should expect to generally treat any distributions we make as dividend income for U.S. federal income tax purposes.
If you are a noncorporatean individual, trust, or estate U.S. holder, dividends paid on the ADSs or common shares that constitute qualified dividend income will be taxable to you at the preferential rates applicable to long-term capital gains if you hold the ADSs or common shares for more than 60 days during the 121-day period beginning 60 days before the ex-dividend date and meet other holding period requirements.. Dividends paid on the ADSs or common shares will be treated as qualified dividend income if:
the ADSs or common shares are readily tradable on an established securities market in the United States; and
| ● | (a) the ADSs or common shares are readily tradable on an established securities market in the United States; or (b) we are eligible for benefits of a comprehensive tax treaty with the United States, which the IRS determines is satisfactory for this purpose, which includes an exchange of information program; |
we were not, in the year prior to the year in which the dividend was paid, and are not, in the year in which the dividend is paid, a PFIC.
| ● | we were not, in the year prior to the year in which the dividend was paid, and are not, in the year in which the dividend is paid, a PFIC. |
| 114● | you hold the ADSs or common shares for more than 60 days during the 121-day period beginning 60 days before the ex-dividend date and meet other holding period requirement; and the U.S. holder is not under an obligation to make related payments with respect to positions ● in substantially similar or related property. |
We believe that our common shares and ADSs should not be treated as stock of a PFIC for United StatesU.S. federal income tax purposes. See “—PFIC Rules” below.
The ADSs are listed on the New York Stock Exchange, and willshould qualify as readily tradable on an established securities market in the United States so long as they are so listed. Accordingly, we expect that dividends we pay with respect to the ADSs will be qualified dividend income.income (provided that the other conditions listed above are met). Because our common shares are not expected to be listed on any United States securities market, it is unclear whether dividends we pay with respect to the common shares will alsonot be qualified dividend income. If dividends we pay with respect to our common shares are not qualified dividendincome(as long as there is no income thentax treaty in effect between Chile and the United States), and therefore, the U.S. dollar amount of such dividends received by aan individual, trust, or estate U.S. holder (including dividends received by a noncorporate U.S. holder) will be subject to taxation at ordinaryU.S. federal income tax rates. Corporate U.S. holders are taxed on dividend income at the U.S. federal corporate income tax rate whether or not the dividend income is qualified dividend income.
You must include any Chilean tax withheld from the dividend payment in this gross amount even though you do not in fact receive it. The dividend is taxable to you when you, in the case of common shares, or the Depositary, in the case of ADSs, receive the dividend, actually or constructively. The dividend will not be eligible for the dividends-received deduction generally allowed to United States corporations in respect of dividends received from other United States corporations or certain foreign corporations. The amount of the dividend distribution that you must include in your income as a U.S. holder will be the U.S. dollar value of the Chilean pesos payments made, determined at the spot Chilean pesos/U.S. dollar rate on the date the dividend distribution is includible in your income, regardless of whether the payment is in fact converted into U.S. dollars. Generally, any gain or loss resulting from currency exchange fluctuations during the period from the date you include the dividend payment in income to the date you convert the payment into U.S. dollars will be treated as ordinary income or loss and will not be eligible for the special tax rate applicable to qualified dividend income. The gain or loss generally will be income or loss from sources within the United States for foreign tax credit limitation purposes. Distributions in excessThe amount of current and accumulated earnings and profits, as determined for United States federal income tax purposes,any distribution of property other than cash will be treated as a non-taxable returnthe fair market value of capitalsuch property on the date of distribution.
The dividend income you have to include in gross income includes the extentamount of your basis inany Chilean tax withheld from the common shares or ADSs and thereafter as capital gain. However, wedividend payment even though you do not expect to calculate earnings and profits in accordance with United States federal income tax principles. Accordingly, you should expect to generally treat distributions we make as dividends.
fact receive such amount.Subject to generally applicable limitations and conditions under the Internal Revenue Code, Chilean Withholding Tax withheld and paid over to the Chilean tax authorities (after taking into account the credit for the First Category Tax, when it is available) generally will be creditable or deductible against your United StatesU.S. federal income tax liability. Special rules apply in determining the foreign tax credit limitation with respect to dividendsqualified dividend income that areis subject to the preferential U.S. federal income tax rates. To the extent a refund of the tax withheld is available to you under Chilean law, as is the case if the amount of Chilean Withholding Tax initially withheld from a dividend is determined to be excessive as described above under “—Taxation—Chilean Tax—Cash Dividends and Other Distributions,” the amount of tax withheld that is refundable will not be eligible for credit against your United States federal income tax liability.
Dividends will generally be income from sources outside the United States and will, depending on your circumstances, generally be either “passive” or “general”or “foreign branch” income for purposes of computing the foreign tax credit allowable to you. The rules relating to foreign tax credits and deductions are complex. U.S. holders should consult their tax advisors concerning the application of these rules in their particular circumstances.
Taxation of Capital Gains
Subject to the PFIC rules discussed below, if you sell or otherwise dispose of your common shares or ADSs, you will recognize capital gain or loss for United StatesU.S. federal income tax purposes equal to the difference between the U.S. dollar value of the amount that you realize and your adjusted tax basis, determined in U.S. dollars, in your common shares or ADSs. Capital gain of a noncorporatean individual trust, or estate U.S. holder is generally taxed at preferential rates(i.e. a maximum U.S. federal income tax rate of 20% plus 3.8% “Net Investment Income Tax” if certain income thresholds are met; see “Net Investment Income Tax” below)where the property is held for more than one year.The deductibility of capital losses is subject to significant limitations.The gain or loss will generally be income or loss from sources within the United States for foreign tax credit limitation purposes. Consequently, you may not be able to use the foreign tax credit arising from any Chilean tax imposed on the disposition of common shares or ADSs unlessas a foreign tax credit against your U.S. federal income tax liability on such disposition, but you may apply such Chilean taxes as a foreign tax credit can be applied against U.S. federal income tax due on other income you may have that is treated as derived from foreign sources in the appropriate foreign tax credit limitation category.
If the consideration received for our common shares or ADSs is paid in foreign currency (which should not be the case in respect of our ADSs), the amount realized will be the U.S. dollar value of the payment received translated at the spot rate of exchange on the date of disposition. If our common shares or ADSs are treated as traded on an established securities market and the relevant U.S. holder is either a cash basis taxpayer or an accrual basis taxpayer who has made a special election (which must be applied consistently from year to year and cannot be changed without the consent of the U.S. Internal Revenue Service), such holder will determine the U.S. dollar value of the amount realized in a foreign currency by translating the amount received at the spot rate of exchange on the settlement date of the sale. If our common shares or ADSs are not treated as traded on an established securities market, or the relevant U.S. holder is an accrual basis taxpayer that is not eligible to or does not elect to determine the amount realized using the spot rate on the settlement date, such U.S. holder will recognize foreign currency gain or loss to the extent of any difference between the U.S. dollar amount realized on the date of disposition (as determined above) and the U.S. dollar value of the currency received at the spot rate on the settlement date. A U.S. holder’s initial tax basis in our common shares or ADSs will equal the cost of such ADSs or common shares. If a U.S. holder used foreign currency to purchase our common shares or ADSs, the cost of our common shares or ADSs will be the U.S. dollar value of the foreign currency purchase price on the date of purchase. If our common shares or ADSs are treated as traded on an established securities market and the relevant U.S. holder is either a cash basis taxpayer or an accrual basis taxpayer who has made the special election described above, such holder will determine the U.S. dollar value of the cost of such common shares or ADSs by translating the amount paid at the spot rate of exchange on the settlement date of the purchase.
MedicareNet Investment Income Tax
A U.S. holder that is an individual or estate, or a trust that does not fall into a special class of trusts that is exempt from such tax, is subject to a 3.8%“net investment income”tax on the lesser of (1) the U.S. holder’s “net investment income” (or “undistributed net investment income” in the case of an estate or trust) for the relevant taxable year and (2) the excess of the U.S. holder’s modified adjusted gross income for the taxable year over a certain threshold (which in the case of individuals is between $125,000 and $250,000, depending on the individual’s circumstances). A holder’s net investment income generally includes its dividend income and its net gains from the disposition of common shares or ADSs, unless such dividend income or net gains are derived in the ordinary course of the conduct of a trade or business (other than a trade or business that consists of certain passive or trading activities). If you are a U.S. holder that is an individual, estate or trust, you are urged to consult your tax advisors regarding the applicability of the Medicare“net investment income” tax to your income and gains in respect of your investment in the common shares or ADSs.
PFIC Rules
We believe that common shares and ADSs should not be treated as stock of a PFIC for United States federal income tax purposes, but this conclusion is a factual determination that is made annually and thus may be subject to change. If we were to be treated as a PFIC, gain realized on the sale or other disposition of your common shares or ADSs would in general not be treated as capital gain.gain that is eligible for preferential tax rates in the case of non-corporate U.S. holders. Instead, if you are a U.S. holder, unless you electmake a timely “mark-to-market” election electing to be taxed annually on a mark-to-market basis with respect to your common shares or ADSs, or you electmake a timely “qualified electing fund” election electing to be taxed annually on the earnings and gains of the PFIC attributable to your shares or ADSs as a “qualified electing fund”(irrespective of distributions), you would be treated as if you had realized such gain and certain “excess distributions” ratably over your holding period forin the common shares or ADSs and would be taxed at the highest tax rate in effect for each such year to which the gain was allocated, together with an interest charge in respect of the tax attributable to each such year except for the current year. With certain exceptions, your common sharesIn addition, unless you make a timely “mark-to-market” election or ADSs will be treated as stock in a PFIC if we were a PFIC at any time during your holding period in your common shares or ADSs. Dividends“qualified electing fund” election, distributions that you receive from us as a direct or indirect U.S. holder will not be eligible for the specialpreferential tax rates applicable to qualified dividend income if we are treated as a PFIC with respect to you either in the taxable year of the distribution or the preceding taxable year, but instead will be taxable at the tax rates applicable to ordinary income.income, and to the extent they are treated as “excess distributions” under the PFIC rules, they will also be subject to the PFIC interest charge described above. A U.S. holder will be required to make an annual filing with the U.S. Internal Revenue Service if such holder holds or ADSs or common shares in any year in which we are classified as a PFIC. With certain exceptions, your common shares or ADSs will continue to be treated as stock in a PFIC if we were a PFIC at any time during your holding period in your common shares or ADSs even if we no longer meet the PFIC tests in a later year.
The U.S. federal income tax rules relating to PFICs are complex. Prospective U.S. investors are urged to consult their own tax advisers with respect to the application of the PFIC rules to their investment in the common shares or ADSs.
Information Reporting and Backup Withholding
U.S. information reporting and backup withholding tax requirements generally apply to certain payments to certain non-corporate holders of stock. Information reporting generally will apply to payments of dividends on, and to proceeds from the sale or redemption of, common shares or ADSs made within the United States to a holder of common shares or ADSs (other than an exempt recipient, including a corporation, a payee that is not a U.S. holder that provides an appropriate certification, and certain other persons).
A payor will be required to withhold backup withholding tax from any payments of dividends on, or the proceeds from the sale or redemption of, common shares or ADSs within the United States to you, unless you are an exempt recipient, if you fail to furnish your correct taxpayer identification number or otherwise fail to establish an exception from backup withholding tax requirements. U.S. holders who are required to establish their exempt status may be required to provide such certification on U.S. Internal Revenue Service Form W-9. Backup withholding is not an additional tax. The amount of any backup withholding from a payment to you may be allowed as a credit against your U.S. federal income tax liability and may entitle you to a refund, provided that the required information is furnished timely to the U.S. Internal Revenue Service.
Foreign Asset Reporting
Certain U.S. holders who are individuals (and certain entities) that hold an interest in “specified foreign financial assets” (which may include the shares)common shares or ADSs) with an aggregate value in excess of certain threshold amounts are required to report information relating to such assets, subject to certain exceptions (including an exception for stock held in accounts maintained by certain financial institutions). Penalties can apply if U.S. holders fail to satisfy such reporting requirements. U.S. holders should consult their tax advisors regarding the effect, if any, of this requirement on their ownership and disposition of common shares and ADSs.
F. Dividends and Paying Agents
Not applicable.
G. Statement by Experts
Not applicable.
H. Documents on Display
We are subject to the information requirements of the Exchange Act, as amended. In accordance with these requirements, we file reports, including annual reports on Form 20-F and other information with the SEC. These materials, including this annual report and the exhibits hereto, may be inspected and copied at the SEC’s public reference rooms in Washington, D.C. Please call the SEC at 1-800-SEC-0330 for further information on the public reference rooms. In addition, some of our SEC filings, including those filed on and after February 19, 2002, are also available to the public through the SEC’s website at www.sec.gov.
As a foreign private issuer, we are not subject to the same disclosure requirements as a domestic U.S. registrant under the Exchange Act. For example, we are not required to prepare and issue quarterly reports. However, we furnish our shareholders with annual reports containing financial statements audited by our independent auditors and make available to our shareholders quarterly reports containing unaudited financial data for the first three quarters of each fiscal year. We file such quarterly reports with the SEC within two months of each quarter of our fiscal year, and we file annual reports on Form 20-F within the time period required by the SEC, which is currently six months from December 31, the end of our fiscal year.
I. Subsidiary Information
Not applicable.
| ITEM 11. | QUANTITATIVE AND QUALITATIVE DISCLOSURES ABOUT MARKET RISK |
General
Given the nature of its business, LATAM is exposed mainly to three types of market risk:
Fuel price fluctuations;
| ● | Fuel price fluctuations; |
Foreign exchange fluctuations; and
| ● | Foreign exchange fluctuations; and |
Interest rate fluctuations.
| ● | Interest rate fluctuations. |
Management assesses the level of our exposure to these risks periodically to determine which oneshouldone should be hedged and the most effective mechanisms to be implemented. LATAM purchases derivative instruments in foreign markets to offset market risk exposure, typically utilizing a mix of financial and commodity derivatives. LATAM does not enter into or hold derivative contracts for trading purposes.
For more information on Market Risk, see Note 3 “Financial Risk Management” to our audited consolidated financial statements.
Risk of Fluctuations in Fuel Prices
Jet fuel price fluctuations are largely dependent on supply and demand for crude oil, OPEC decisions, refinery capacities, stock levels of crude oil, natural disasters, climatic risk and geopolitical factors.
LATAM fuel consumption for 20172019 was 1,179.6 million gallons and the consumption forecast for 2018 is 1,270.11,272.7 million gallons. To manage its exposure to the cost of fuel, LATAM has a hedging program based on aour Fuel Hedging Policy, which is annually updated and approved by Boardthe board of Directors.directors. LATAM’s Fuel Hedging Program seeksPolicy aims to mitigate the liquidity risk in the short/medium term.term, avoiding cash and financial distress. LATAM has defined different time periods to hedge the fuel exposure,established four hedging zones based on advance purchase behavior, by customers, pass-through and fuel invoicing process.
Jet Fuel is not the only underlying asset that LATAM may use for hedging purposes. It may also consider derivative instruments in other underlying commodity assets such as ICE Brent, West Texas Intermediate (WTI) or NYMEX Heating Oil (HO).
LATAM has decided to use protective and non-speculative instruments to reduce the operating margin exposure to fuel price volatility.exposure. Also, LATAM will not use financial derivatives to speculate on financial markets and consequently obtain gains from these types of transactions, and will not receive premiums as cash from sold options (nevertheless LATAM could buy and sell options as a structured product).
LATAM periodically reviews its exposure with each counterparty in order to monitor its credit concentration. For more information, see “Item 3. Key Information— D. Risk Factors—Risks Related to Our Operations and the Airline Industry—Our operations are subject to fluctuations in the supply and cost of jet fuel, which could adversely impact our business.”
During 2017, 20162019, 2018 and 20152017 we entered into a mix of swaps and option contracts on ICE BRENT, NYMEX HEATING OIL and JET FUEL 54 USGC with investment grade banks and other financial entities for notional fuel purchases (non-delivery). Details of the fuel hedging program are shown below:
| | | LATAM Fuel Hedging
Year ended December 31, | | | LATAM Fuel Hedging
Year ended December 31, | |
| | | 2017
LATAM | | | 2016
LATAM | | | 2015
LATAM | | | 2019
LATAM | | | 2018
LATAM | | | 2017
LATAM | |
| Gallons Purchased (million) | | | 441.1 | | | | 781.2 | | | | 544.7 | | | | 779.8 | | | | 521.9 | | | | 441.1 | |
| % Total Annual Fuel Consumption | | | 37.7 | % | | | 66.7 | % | | | 43.6 | % | | | 61.5 | % | | | 40.8 | % | | | 37.7 | % |
| Combined Result of Hedges (in million of US$) | | | 15.1 | | | | (48.0 | ) | | | (239.4 | ) | | | (23.1 | ) | | | 29.7 | | | | 15.1 | |
As of December 31, 2017,2019, the fair value of our outstanding fuel related derivative contracts was estimated to be US$ 10.748.5 million (positive).
Gains and losses on the hedging contracts outlined above are recognized as a cost of sales in the income statement when the fuel subject to the hedge is consumed. Premiums paid related to fuel derivative contracts are recorded as prepaid expenses (current assets) and recorded as an expense at the time the contract expires.
Under IFRS, the fair value of the hedging derivatives is booked as a non-current asset or liability if the remaining maturity of the item is hedged for more than 12 months, and as a current asset or liability if the remaining term of the item is hedged for less than 12 months. The fair value of the derivative contracts is deferred within an equity reserve account. Please see Note 2.10 to our audited consolidated financial statements. As the current positions do not represent changes in cash flows but a variation in the exposure to the market value, the Company’s current hedge positions have no impact on income; they are booked as cash flow hedge contracts, so a variation in fuel prices has an impact on the Company’s net equity.
The following table shows the sensitivity analysis of our hedging contracts to reasonable changes in fuel prices and their effect on equity. The term used for the projection was December 31, 2017,2019, the last maturity date of our current fuel hedge contracts. The calculations were made considering a parallel movement of US$5 per barrel in the curve of the BRENT and JET crude futures benchmark price at the end of December 2017, 20162019, 2018 and 2015.2017.
| | | LATAM fuel price sensitivity (effect on equity)
Position as of December 31, | | | LATAM fuel price sensitivity (effect on equity)
Position as of December 31, | |
| | | 2017
LATAM | | | 2016
LATAM | | | 2015
LATAM | | | 2019
LATAM | | | 2018
LATAM | | | 2017
LATAM | |
| | | (millions of US$ per barrel) | | | (millions of US$ per barrel) | |
| BRENT or JET benchmark price | | | | | | | | | | | | | |
| HO or JET benchmark price | | | | |
| +5 | | | +1.8 | | | | +3.1 | | | | +5.4 | | | | +15.4 | | | | +7.4 | | | | +1.8 | |
| –5 | | | -3.3 | | | | –4.8 | | | | –2.8 | | | | -34.5 | | | | -5.5 | | | | -3.3 | |
During the periods presented, the Company has not recorded amounts for ineffectiveness in the consolidated income statement pursuant to IFRS principles for recognizing and measuring financial instruments.
Given the fuel hedge structure as of December 31, 2017,2019, which reflects only a partial hedge of our expected fuel consumption, a vertical fall by US$5 in the BRENT and JET benchmark price (the monthly daily average) for each month would have meant savings of approximately US$ 109.7121.8 million in the cost of the Company’s total fuel consumption. A vertical increase by US$5 in the JET and BRENT benchmark price (the monthly daily average) for each month would have meant an additional cost of approximately US$ 110.5114.2 million of the Company’s total fuel consumption.
Risk of Variation in Foreign Exchange Rates
The functional currency of the LATAM holding company is the U.S. dollar. Since LATAM conducts its business in local currencies in several countries, it faces the risk of variations in multiple foreign currency exchange rates. Depreciation of these currencies against the U.S. dollar could have adverse effects both transactional and translational, because part of our revenues and expenses are denominated in those currencies.
At the same time, LATAM’s affiliates are exposed to foreign exchange risk, which could in turn impact the consolidated results of the Company.
The greatest exposure to future cash flows is mainly presented by the subsidiary TAM S.A.LATAM Airlines Brazil. and volatility in the R$/US$ exchange rate. TAM S.A.’sLATAM Airlines Brazil’s earnings are generated largely in R$. We actively manage the R$/US$ exchange rate risk by entering into FX derivative contracts and carrying out internal operations for obtaining natural hedging. Additionally, LATAM manages its economic exposures of future flows revenues on Great Britain Pound (GBP), by entering into FX derivative contracts.
In lower concentration, the company also faces foreign exchange risk relating to additional currencies such as: Great Britain Pound, Euro, Chilean Peso, Australian Dollars, Argentinean Peso, Paraguayan Guaraní, Mexican Peso, Peruvian Nuevo Sol, Colombian Peso and New Zealand Dollars. TheseThose currencies may alsocould be hedged where theas long as they turn relevant (higher exposure and volality is of concernvolatility) to the LATAM’s market risk management. As of December 31, 2017, the fair value of our FX derivative contracts was estimated to be2019, LATAM has US$ 4.415 million (positive).current hedge instruments in its portfolio.
Because of changes in the values of existing FX derivative positions do not represent changes in cash flows, but a variation in the exposure of market value, the outstanding hedging positions do not impact results (they are registered as cash flow hedges under IFRS, therefore, a change in the foreign exchange rate has an impact on the equity of the Company).
The following table shows the sensitivity of the fair value of financial instruments as a result of reasonable changes in the exchange rates of Brazilian Real. The term projection is defined until the end of the last hedging contract in force:
LATAM foreign exchange sensitivity Derivatives
Position as of December 31, 2017 |
| Appreciation (depreciation) of US$ | | Effect on equity
(Millions of US$) | |
| | | | |
| +10% | | | +9.7 | |
| | | | | |
| -10% | | | -10.7 | |
As of December 31, 2017,2019 the Company has FXentered into derivatives that are not registered under hedge accounting. The fair value of that derivatives was estimated to be US$180 0.04 million (notional) for FX BRL.
(negative). Balance sheet exposure of LATAM to the Brazilian Real is related to the functional currency of LATAM Airlines Brazil and its balance sheet currency mismatch, as LATAM Airlines Brazil has a net US$ liability position. When the balance sheet denominated in U.S. dollars is translated to Brazilian Real, the financial results of LATAM Airlines Brazil may fluctuate and therefore could impact LATAM’s financial results.
The exposure to the Brazilian real on TAM’sLATAM Airlines Brazil balance sheet has been reduced from over US$4.0 billion since the combination in June 2012 to around US$0.80.1 billion as of December 31, 2017.2019. The Company continues working to mitigate this exposure through financial and operational proposals.
The following table shows the sensitivity of TAM’sLATAM Airlines Brazil’s financial results to changes in the R$/US$ exchange rate:
| | | TAM exchange rate sensitivity
Position effect on pre-tax earnings as of December 31, | | | LATAM Airlines Brazil exchange rate sensitivity
Position effect on pre-tax earnings as of December 31, | |
| | | 2017 | | | 2016 | | | 2015 | | | 2019 | | | 2018 | | | 2017 | |
| | | LATAM | | LATAM | | LATAM | | | LATAM | | LATAM | | LATAM | |
| | | (millions of US$) | | | (millions of US$) | |
| Appreciation (depreciation) of R$/US$ | | | | | | | | | | | | | | | | | | | |
| –10% | | | +80.5 | | | | +119.2 | | | | +67.6 | | | | +9.5 | | | | +39.8 | | | | +80.5 | |
| +10% | | | -80.5 | | | | –119.2 | | | | –67.6 | | | | -9.5 | | | | -39.8 | | | | -80.5 | |
Our foreign currency exchange exposure as of December 31, 20172019 was as follows:
| | | LATAM foreign currency exchange exposure | | | LATAM foreign currency exchange exposure | |
| | | U.S.
Dollars
MUS$ | | | % of
total | | | Brazilian
real
MUS$ | | | % of
total | | | Chilean
pesos
MUS$ | | | % of
total | | | Other
currencies
MUS$ | | | % of
total | | | Total
MUS$ | | | U.S.
Dollars
MUS$ | | | % of
total | | | Brazilian
real
MUS$ | | | % of
total | | | Chilean
pesos
MUS$ | | | % of
total | | | Other
currencies
MUS$ | | | % of
total | | | Total
MUS$ | |
| Current assets | | | 1.713.681 | | | | 45,8 | % | | | 1.327.119 | | | | 35,4 | % | | | 281.530 | | | | 7,5 | % | | | 423.169 | | | | 11,3 | % | | | 3.745.499 | | | | 1,428,160 | | | | 35.1 | % | | | 1,938,824 | | | | 47.6 | % | | | 260,892 | | | | 6.4 | % | | | 444,346 | | | | 10.9 | % | | | 4,072,222 | |
| Other assets | | | 9.652.566 | | | | 64,1 | % | | | 5.182.800 | | | | 34,4 | % | | | 8.693 | | | | 0,1 | % | | | 208.393 | | | | 1,4 | % | | | 15.052.452 | | | | 12,425,903 | | | | 72.8 | % | | | 4,415,997 | | | | 25.9 | % | | | 31,202 | | | | 0.2 | % | | | 184,780 | | | | 1.1 | % | | | 17,057,882 | |
| Total assets | | | 11.366.247 | | | | 60,5 | % | | | 6.509.919 | | | | 34,6 | % | | | 290.223 | | | | 1,5 | % | | | 631.562 | | | | 3,4 | % | | | 18.797.951 | | | | 13,854,063 | | | | 65.6 | % | | | 6,354,821 | | | | 30.1 | % | | | 292,094 | | | | 1.4 | % | | | 629,126 | | | | 3.0 | % | | | 21,130,104 | |
| Current liabilities | | | 2.942.683 | | | | 50,4 | % | | | 1.777.575 | | | | 30,4 | % | | | 543.150 | | | | 9,3 | % | | | 579.298 | | | | 9,9 | % | | | 5.842.706 | | | | 3,516,716 | | | | 51.1 | % | | | 1,640,092 | | | | 23.8 | % | | | 708,145 | | | | 10.3 | % | | | 1,017,626 | | | | 14.8 | % | | | 6,882,579 | |
| Long-term liabilities | | | 7.385.258 | | | | 85,0 | % | | | 773.543 | | | | 8,9 | % | | | 507.784 | | | | 5,8 | % | | | 21.437 | | | | 0,2 | % | | | 8.688.022 | | | | 9,736,143 | | | | 87.6 | % | | | 661,063 | | | | 5.9 | % | | | 704,087 | | | | 6.3 | % | | | 17,067 | | | | 0.2 | % | | | 11,118,360 | |
| Total liabilities and shareholders’ equity | | | 10.327.941 | | | | 71,1 | % | | | 2.551.118 | | | | 17,6 | % | | | 1.050.934 | | | | 7,2 | % | | | 600.735 | | | | 4,1 | % | | | 14.530.736 | | | | 13,252,859 | | | | 73.6 | % | | | 2,301,155 | | | | 12.8 | % | | | 1,412,232 | | | | 7.8 | % | | | 1,034,693 | | | | 5.7 | % | | | 18,000,939 | |
For more information on Market Risk, see Note 3 “Financial Risk Management” to our audited consolidated financial statements.
Risk of Fluctuations in Interest Rates
As of December 31, 2017,2019, LATAM had US$7,9767,194 million in outstanding interest bearing loans. LATAM uses interest rate derivatives to reduce the impact of an increase of interest rates. 63.3%61.6% of LATAM outstanding debt as of December 31, 20172019 was effectively at a fixed rate, either as fixed rate loans or variable rate loans hedged using a floating to fixed rate derivative instrument.
LATAM’s interest bearing loans can be classified by: variable interest rate debt, fixed interest rate debt and interest rate hedged debt. LATAM’s variable interest rate debt amounts to US$2,9262,760 million, from which 86.7%82.7% is assigned to aircraft financing and 13.3%17.3% to non-aircraft financing. The fixed interest rate debt amounts are US$ 5,0504,368 million of which 58.2%50.4% is assigned to aircraft financing and 41.8%49.6% to non-aircraft financing. The interest rate hedged debt amounts to US$13566 million of which 100% is assigned to interest rate swaps.
Under IFRS, the positive fair value of these interest rate swaps is reflected in the balance sheet as hedging assets and the negative fair value of these agreements is reflected as hedging liabilities. As of December 31, 2017,2019, the fair value of all the interest rate swaps was US$ 6.62.6 million (negative)(positive).
The use of the aforementioned hedging instruments, combined with fixed interest rate financing for our aircraft financing, has enabled the Company to have predictable interest rate costs, reducing the cash volatility.
As of December 31, 2017,2019, the average interest rate of our entire outstanding interest-bearing long-term debt rate was 4.1%4.63%.
The following table summarizes our principal payment obligations on all of our interest-bearing debt as of December 31, 20172019 and the related average interest rate for such debt. The average interest rate has been calculated based on the prevailing interest rate on December 31, 20162019 for each loan.
| | | LATAM’s principal payment obligations by year of expected maturity(1) | |
| | | Average
interest rate(2) | | | 2018 | | | 2019 | | | 2020 | | | 2021 | | | 2022 | | | 2023 and
thereafter | |
| | | (millions of US$) | |
| Interest-bearing liabilities | | | 4.1 | % | | | 1,244 | | | | 1,332 | | | | 1,465 | | | | 634 | | | | 786 | | | | 2,513 | |
| | | LATAM’s principal payment obligations by year of expected maturity(1) | |
| | | Average
interest rate(2) | | | 2020 | | | 2021 | | | 2022 | | | 2023 | | | 2024 | | | 2025 and
thereafter | |
| | | (millions of US$) | |
| Interest-bearing liabilities | | | 4,63 | % | | | 1,367 | | | | 1,168 | | | | 839 | | | | 555 | | | | 1,082 | | | | 2,183 | |
| (2) | Average interest rate means the average prevailing interest rate on our debt on December 31, 20172019 after giving effect to hedging arrangements. |
The following table shows the sensitivity of changes in our long-term interest bearing liabilities and capital leases that are not hedged against interest-rate variations. These changes are considered reasonably possible based on current market conditions.
| | | LATAM’s interest rate sensitivity
(effect on pre-tax earnings)
Position as of December 31, | | | LATAM’s interest rate sensitivity
(effect on pre-tax earnings)
Position as of December 31, | |
| | | 2017
LATAM | | | 2016
LATAM | | | 2015
LATAM | | | 2019
LATAM | | | 2018
LATAM | | | 2017
LATAM | |
| | | (millions of US$) | | | (millions of US$) | |
| Increase (decrease) in LIBOR | | | | | | | | | | | | | | | | | | | |
| +100 basis points | | | -29.3 | | | | -32.2 | | | | –26.7 | | | | -27.6 | | | | -29.62 | | | | –29.26 | |
| –100 basis points | | | +29.3 | | | | +32.2 | | | | +26.7 | | | | +27.6 | | | | +29.62 | | | | +29.26 | |
Changes in market conditions produce a change in the valuation of current financial instruments hedging against fluctuations in interest rates, causing an effect on the Company’s equity (because they are booked as cash-flow hedges). These changes are considered reasonably possible based on current market conditions. The calculations were made by increasing (decreasing) 100 basis points of the three-month Libor futures curve.
| | | LATAM’s interest rate sensitivity
(effect on equity)
Position as of December 31, | | | LATAM’s interest rate sensitivity
(effect on equity)
Position as of December 31, | |
| | | 2017
LATAM | | | 2016
LATAM | | | 2015
LATAM | | | 2019
LATAM | | 2018
LATAM | | 2017
LATAM | |
| | | (millions of US$) | | | (millions of US$) | |
| Increase (decrease) in three month LIBOR | | | | | | | | | | | | | | | | | | | |
| Future rates | | | | | | | | | | | | | | | | | | | |
| +100 basis points | | | +1.9 | | | | +3.9 | | | | +8.7 | | | | +13.6 | | | | +0,7 | | | | +1,9 | |
| –100 basis points | | | -1.9 | | | | -4.0 | | | | -9.0 | | | | -14.7 | | | | -0,7 | | | | –1,9 | |
During the periods presented, the Company has not recorded amounts for ineffectiveness in the consolidated income statement pursuant to IFRS.
There are market-related limitations in the method used for the sensitivity analysis. These limitations derive from the fact that the levels indicated by the futures curves may not be necessarily met and may change in each period.
| ITEM 12. | DESCRIPTION OF SECURITIES OTHER THAN EQUITY SECURITIES |
A. Debt Securities
Not applicable.
B. Warrants and Rights
Not applicable.
C. Other Securities
Not applicable.
D. American Depositary Shares
In the United States, our common shares trade in the form of ADS. Since August 2007, each ADS represents one common share, issued by The Bank of New York Mellon, as Depositary pursuant to a Deposit Agreement. ADSs commenced trading on the NYSE in 1997. In October 2011, our Depositary bank changed from The Bank of New York Mellon to JP Morgan Chase Bank, N.A. (“JP Morgan”). The Company plans to enter into a Deposit Agreement with CitiBank, N.A. pursuant to which Citibank N.A. will replace JP Morgan as the Company’s Depository bank.
Fees and Charges for ADR Holders
The Bank of New York Mellon, and since October 2011 JP Morgan, as depositary, collects its fees for delivery and surrender of ADSs directly from investors depositing shares or surrendering ADSs for the purpose of withdrawal or from intermediaries acting for them. The depositary collects fees for making distributions to investors by deducting those fees from the amounts distributed or by selling a portion of the distributable property to pay the fees. The depositary may also collect its annual fee for depositary services by deductions from cash distributions, by directly billing investors or by charging the book-entry system accounts of participants acting for them. The depositary may generally refuse to provide fee-attracting services until its fees for those services are paid.
| Persons depositing or withdrawing shares must pay: | | For: |
| | | |
| US$5.00 (or less) per 100 ADSs (or portion of 100 ADSs) | | • | ● Issuance of ADSs, including issuances resulting from a distribution of shares or rights or other property |
| | | |
| | • | ● Cancellation of ADSs for the purpose of withdrawal, including if the deposit agreement terminates |
| | | |
US$$0.05 (or less) per ADS | | • | ● Any cash distribution to ADS registered holders |
| | | |
| A fee equivalent to the fee that would be payable if securities distributed had been shares and the shares had been deposited for issuance of ADSs | | • | ● Distribution of securities distributed to holders of deposited securities which are distributed by the depositary to ADS registered holders |
| Persons depositing or withdrawing shares must pay: | | For: |
| | | |
US$$0.0542 (or less) per ADSs per calendar year | | • | ● Depositary services |
| | | |
| Registration or transfer fees | | • | ● Transfer and registration of shares on the depositary’s share register to or from the name of the depositary or its agent when investors deposit or withdraw shares |
| | | | |
| Expenses of the depositary | | • | ● Cable, telex and facsimile transmissions |
| | | |
| | • | ● Conversion of foreign currencies into U.S. dollars |
| | | |
| Taxes and other governmental charges the depositary or the custodian has to pay on any ADS or share underlying an ADS, such as stock transfer taxes, stamp duty or withholding taxes | | • | ● As necessary |
| | | |
| Any charges incurred by the depositary or its agents for servicing the deposited securities | | • | ● As necessary |
Fees and Direct and Indirect Payments Made by the Depositary to the Foreign Issuer
Past Fees and Payments
During 2017,2019, the Company received US$703,745666,148 from the depositary for continuing annual stock exchange listing fees, standard out-of-pocket maintenance costs for the ADRs (consisting of the expenses of postage and envelopes for mailing annual and interim financial reports, printing and distributing dividend checks, electronic filing of U.S. Federal tax information, mailing required tax forms, stationery, postage, facsimile, and telephone calls), payments related to applicable performance indicators relating to the ADR facility, underwriting fees and legal fees.
Future Fees and Payments
JP Morgan, as the depositary bank, has agreed to reimburse the Company for certain of our reasonable expenses related to our ADS program and incurred by us in connection with the program. The reimbursements include direct payments (legal and accounting fees incurred in connection with preparation of Form 20-F and ongoing SEC compliance and listing requirements, listing fees, investor relations expenses, advertising and public relations expenses and fees payable to service providers for the distribution of hard copy materials to beneficial ADR holders in the Depositary Trust Company, such as information related to shareholders’ meetings and related voting instruction cards); and indirect payments (third-party expenses paid directly and fees waived).
Withdrawing Deposited Securities; there are no such fees in respect of the Shares as of the date of the Deposit Agreement), and (iv) expenses of the Depositary in connection with the conversion of foreign currency into U.S. dollars (which are paid out of such foreign currency). Such charges may at any time and from time to time be changed by agreement between the Company and the Depositary.
PART II
| ITEM 13. | DEFAULTS, DIVIDEND ARREARAGES AND DELINQUENCIES |
None.
| ITEM 14. | MATERIAL MODIFICATIONS TO THE RIGHTS OF SECURITY HOLDERS AND USE OF PROCEEDS |
None.
| ITEM 15. | CONTROLS AND PROCEDURES |
(a) Disclosure Controls and Procedures
Management carried out an evaluation, with the participation of the Chief Executive Officer and Chief Financial Officer, of the effectiveness of the design and operation of the Company’s disclosure controls and procedures as of December 31, 2017.2019. There are inherent limitations to the effectiveness of any system of disclosure controls and procedures, including the possibility of human error and the circumvention or overriding of the controls and procedures. Accordingly, even effective disclosure controls and procedures can only provide reasonable assurance of achieving their control objectives. Based upon such evaluation, management, with the participation of the chief executive officer and chief financial officer concluded that the disclosure controls and procedures, as of December 31, 2017,2019, were effective in providing reasonable assurance that information required to be disclosed by us in the reports we file or submit under the Exchange Act, as amended, is recorded, processed, summarized and reported within the time periods specified in the applicable rules and forms, and that it is accumulated and communicated to our management including our Chief Executive Officer and Chief Financial Officer as appropriate to allow timely decisions regarding required disclosure.
2 Withdrawing Deposited Securities; there are no such fees in respect of the Shares as of the date of the Deposit Agreement), and (iv) expenses of the Depositary in connection with the conversion of foreign currency into U.S. dollars (which are paid out of such foreign currency). Such charges may at any time and from time to time be changed by agreement between the Company and the Depositary.
(b) Management’s annual report on internal control over financial reporting
The management of the Company, including the Chief Executive Officer and the Chief Financial Officer, is responsible for establishing and maintaining adequate internal control over financial reporting, as such term is defined in Rules 13a-15(f) and 15d-15(f) under the Exchange Act, as amended.
The Company’s internal control over financial reporting is a process designed to provide reasonable assurance regarding the reliability of financial reporting and the preparation of financial statements for external purposes in accordance with generally accepted accounting principles. The Company’s internal control over financial reporting includes those policies and procedures that (i) pertain to the maintenance of records that, in reasonable detail, accurately and fairly reflect the transactions and dispositions of the assets of the Company; (ii) provide reasonable assurance that transactions are recorded as necessary to permit preparation of financial statements in accordance with generally accepted accounting principles, and that receipts and expenditures of the Company are being made only in accordance with authorizations of management and directors of the Company; and (iii) provide reasonable assurance regarding prevention or timely detection of unauthorized acquisition, use or disposition of the Company’s assets that could have a material effect on the financial statements.
Because of its inherent limitations, internal control over financial reporting may not prevent or detect misstatements. Also, projections of any evaluation of the effectiveness of internal control to future periods are subject to the risk that controls may become inadequate because of changes in conditions, and that the degree of compliance with the policies or procedures may deteriorate. LATAM Airlines Group S.A.’s management, including the Chief Executive Officer and the Chief Financial Officer, has assessed the effectiveness of the Company’s internal control over financial reporting as of December 31, 20172019 based on the criteria established in “Internal Control-Integrated Framework (2013)” issued by the Committee of Sponsoring Organizations of the Treadway Commission (“COSO”) and, based on such criteria, LATAM Airlines Group S.A.’s management has concluded that, as of December 31, 2017 ,2019, the Company’s internal control over financial reporting is effective. The company’s internal control over financial reporting effectiveness as of December 31, 20172019 has been audited by PricewaterhouseCoopers Consultores Auditores SpA, an independent registered public accounting firm, as stated in their report included herein.
(a)(c) Attestation report of the registered public accounting firm.firm. See page F-2 of our audited consolidated financial statements.
statements
(b)(d) Changes in internal controls over financial reporting.There have been no changes that have materiallyaffectedor are reasonably likely to materially affect the company’s internal control over financial reporting. There have been no changes have materially affected, or are likely to materially affect, our internal controls over financial reporting.
RESERVEDITEM 16 | A. AUDIT COMMITTEE FINANCIAL EXPERT |
A. AUDIT COMMITTEE FINANCIAL EXPERT
Our Boardboard of Directorsdirectors has designated Georges de Bourguignon Arndton June 11, 2019 Nicolás Eblen Hirmas as an “audit committee financial expert” within the meaning of this Item 16. A. Mr. de BourguignonEblen is independent within the meaning of Rule 10A-3 under the Exchange Act. See “Item 6. Directors, Senior Management and Employees— A. Directors and Senior Management.”
B. CODE OF ETHICS
We have adopted a code of ethics and conduct, as defined in Item 16B of Form 20-F under the Exchange Act. Our code of ethics applies to our senior management, including our Chief Executive Officer, our Chief Financial Officer and our Chief Accounting Officer, as well as to other employees. Our code is freely available online at our website, www.latam.com,www.latamairlinesgroup.net, under the heading “Corporate Governance” on the Investor Relations page. In addition, upon written request, by regular mail, to the following address: LATAM Airlines Group S.A., Investor Relations Department, attention: Investor Relations, Av. Presidente Riesco 5711, Piso 20, Comuna20th Floor, Las Condes, Santiago, Chile, or by e-mail at InvestorRelations@latam.com we will provide any person with a copy of it without charge. If we amend the provisions of our code of ethics that apply to our senior management or to other persons performing similar functions, or if we grant any waiver of such provisions, we will disclose such amendment or waiver on our website.
C. PRINCIPAL ACCOUNTANT FEES AND SERVICES
| ITEM 16 | C. PRINCIPAL ACCOUNTANT FEES AND SERVICES |
Audit and Non-Audit Fees
The following table sets forth the fees paid to our independent registered public accounting firm, PricewaterhouseCoopers, during the fiscal years ended December 31, 20172019 and 2016:2018:
| | | 2017 | | | 2016 | | | 2019 | | | 2018 | |
| | | USD (in thousands) | | | USD (in thousands) | |
| Audit fees | | | 1,780 | | | | 1,734 | | | | 1,821 | | | | 2,213 | |
| Audit-related fees | | | 19 | | | | 21 | | | | 11 | | | | 9 | |
| Tax fees | | | - | | | | - | | | | - | | | | - | |
| All Other fees | | | 15 | | | | 40 | | | | 30 | | | | 5 | |
| | | | | | | | | | |
| Total fees | | | 1,814 | | | | 1,795 | | | | 1,862 | | | | 2,227 | |
Audit-related fees in the above table are the aggregate fees billed by PricewaterhouseCoopers for assurance and related services that are reasonably related to the performance of the audit or review of our financial statements or that are traditionally performed by the external auditor, including due diligence and other audit related services. Fees in 20172019 and 2018 correspond to attestation services related with revenues in Argentina and expenses in Ecuador. Fees in 2016 correspond to review over sustentability report and attestation services related with revenues in Argentina.
Other fees in the table above table are fees billed by PricewaterhouseCoopers as of December 31, 2017 and2019 related to the Benchmark Study on Internal Audit departments. Fees incurred in 2018 correspond to training in connection with the Foreign Corrupt Practices Act. Fees in 2016 correspond primarily for review of requirements necessary for building construction authorization and survey salary in Peru.foreign trade & customs training.
Board of Directors’ Committee Pre-Approval Policies and Procedures
Since January 2004, LATAM has complied with SEC regulations regarding the type of additional services our independent auditors are authorized to offer to us. In addition, our Boardboard of Directors’directors’ Committee (which serves as our Audit Committee) has decided to automatically authorize any such accepted services for an amount of up to 10% of the fees charged by the auditing firm, and for an amount of up to 50% when adding all such services provided by the auditing firm in the aggregate. If the amount of any services is larger than these thresholds, approval by the Boardboard of Directors’directors’ Committee will be required.
D. EXEMPTIONS FROM THE LISTING STANDARDS FOR AUDIT COMMITTEES
| ITEM 16 | D. EXEMPTIONS FROM THE LISTING STANDARDS FOR AUDIT COMMITTEES |
None.
E. PURCHASES OF EQUITY SECURITIES BY THE ISSUER AND AFFILIATED PURCHASERS
| ITEM 16 | E. PURCHASES OF EQUITY SECURITIES BY THE ISSUER AND AFFILIATED PURCHASERS |
None.
| ITEM 16 | 124 | F. CHANGE IN REGISTRANT’S CERTIFYING ACCOUNTANT |
F. CHANGE IN REGISTRANT’S CERTIFYING ACCOUNTANT
None.
G. CORPORATE GOVERNANCE
| ITEM 16 | G. CORPORATE GOVERNANCE |
New York Stock Exchange Corporate Governance Comparison
Pursuant to Section 303A.11 of the Listed Company Manual of the NYSE, we are required to provide a summary of the significant ways in which our corporate governance practices differ from those required for U.S. companies under the NYSE listing standards. We are a Chilean corporation with shares listed on the SSE and the Chilean Electronic Exchange and the Valparaiso Stock Exchange and our ADSs listed on the NYSE. Our corporate governance practices are governed by our bylaws, the Chilean Corporation Law and the Securities Market Law.
The table below discloses the significant differences between our corporate governance practices and the NYSE standards.
| NYSE Standards | | Our Corporate Governance Practice |
| | | |
| Director Independence.Majority of board of directors must be independent. §303A.01 | | Under Chilean law, we are not required to have a majority of independent directors on our board. |
| | | |
| | | Our board of directors’ committee (all of whom are members of our board of directors) is composed of three directors,board members, two of whom must be independent if we have a sufficient number of independent directorsboard members on our board. |
| NYSE Standards | | Our Corporate Governance Practice |
| | | |
| | | The definition of independence applicable to us pursuant to the Chilean Corporation Law differs in certain respects from the definition applicable to U.S. issuers under the NYSE rules. |
| | | |
| | | Pursuant to Law No. 20,382 on Corporate Governance, which came into effect on January 1, 2010, we are also required to have at least one independent director.board member. |
| | | |
| | | Starting on January 1, 2010, directors are deemed to be independent if they have not fallen within any of the following categories during the 18 months prior to their election: (i) had a relevant relationship, interest or dependence on us, our affiliates, controlling shareholders, main executives or any of them, or had served any of the foregoing a directors, managers, administrators, main executives or advisors; (ii) had a close family relationship with any of the individuals indicated in (i); (iii) had served as directors, managers, administrators or main executives in a non-profit organization which received significant funds from the individuals indicated in (i); (iv) had been a partner or shareholder (with a direct or indirect participation in excess of 10%) in, or had served as directors, managers, administrators or main executives at a company which has rendered legal or consulting services (for relevant amounts) or external auditing services to the individuals indicated in (i); (v) had been a partner or shareholder (with a direct or indirect participation in excess of 10%) in, or had served as directors, managers, administrators or main executives, our main competitors, suppliers or clients. In addition, the election of such an independent director is subject to a procedure set forth by the cited Corporation Law. |
| | | |
| Executive Sessions.Non-management directors must meet regularly in executive sessions without management. Independent directors should meet alone in an executive session at least once a year. §303A.03 | | There is no similar requirement under our bylaws or under applicable Chilean law. |
NYSE Standards | | Our Corporate Governance Practice |
| | | |
| Audit committee.Audit committee satisfying the independence and other requirements of Rule 10A-3 under the Exchange Act, as amended, and the more stringent requirements under the NYSE standards is required. §§303A.06, 303A.07 | | We are in compliance with Rule 10A-3. We are not required to satisfy the NYSE independence and other audit committee standards that are not prescribed by Rule 10A-3. |
| | | |
| Nominating/corporate governance committee.Nominating/corporate governance committee of independent directors is required. The committee must have a charter specifying the purpose, duties and evaluation procedures of the committee. §303A.04 | | We are not required to have, and do not have, a nominating/corporate governance committee. |
| | | |
| Compensation committee.Compensation committee of independent directors is required, which must approve executive officer compensation. The committee must have a charter specifying the purpose, duties and evaluation procedures of the committee. §303A.05 | | We are not required to have a compensation committee. Pursuant to the Chilean Corporation Law, our board of directors’ committee must approve our senior management’s and employee’s compensation. |
| | | |
Equity compensation plans.Equity compensation plans require shareholder approval, subject to limited exemptions. §303A.08 | | Under the Chilean Corporation Law, equity compensation plans require shareholder approval. |
| NYSE Standards | | Our Corporate Governance Practice |
| | | |
Disclosure of Corporate GovernanceGovernance..Listed companies must adopt and disclose corporate governance guidelines. §303A.09 | | Chilean law does not require that corporate governance guidelines be adopted. Directors’ responsibilities and access to management and independent advisors are directly provided for by applicable law. Directors’ compensation is approved at the annual meeting of shareholders, pursuant to applicable law. |
| | | |
| Code of Ethics.Corporate governance guidelines and a code of business conduct and ethics is required, with disclosure of any waiver for directors or executive officers. §303A.10 | | We have adopted a code of ethics and conduct applicable to our senior management, including our chief executive officer, our chief financial officer and our chief accounting officer, as well as to other employees. Our code is freely available online at our website, www.latamairlinesgroup.net, under the heading “Corporate Governance” in the Investor Relations informational page. In addition, upon written request, by regular mail to LATAM Airlines Group S.A., Investor Relations Department, attention: Investor Relations, Av. Presidente Riesco 5711, 20th floor, Comuna Las Condes, Santiago, Chile or by e-mail at Investor.Relations@latam.com, we will provide any person with a copy of our code of ethics without charge. We are required by Item 16B of Form 20-F to disclose any waivers granted to our chief executive officer, chief financial officer, principal accounting officer and persons performing similar functions. |
| | | |
Disclosure of ComplianceCompliance..Each listed company CEO must (a) certify to the NYSE each year that he or she is not aware of any violation by the listed company of NYSE corporate governance listing standards; (b) promptly notify the NYSE in writing after any executive officer becomes aware of any material non-compliance with any applicable provisions of Section 303A; and (c) must submit an executed Written Affirmation annually to the NYSE. In addition, each listed company must submit an interim Written Affirmation as and when required by the interim Written Affirmation form specified by the NYSE. The annual and interim Written Affirmations must be in the form specified by the NYSE. §303A.12 | | Not required in the Chilean regulations. The Company must only comply with Section 303A.12 (b) and (c). |
The disclosure of the significant ways in which our corporate governance practices differ from those required for U.S. companies under the NYSE listing standards is also posted on our website and can be accessed at www.latamairlinesgroup.net
H. Mine Safety Disclosure
| ITEM 16 | H. Mine Safety Disclosure |
Not applicable.
| ITEM 17. | FINANCIAL STATEMENTS |
See “Item 18. Financial Statements.”
| ITEM 18. | FINANCIAL STATEMENTS |
See our consolidated Financial Statements beginning on page F-1.
Documents filed as exhibits to this annual report
Exhibit
No. | | Description |
| | | |
| 1.1* | | Amended By-laws of LATAM Airlines Group S.A.S.A.. |
| | | |
| 2.1 | | Second Amended and Restated Deposit Agreement, dated as of October 28, 2011, between the Company and JPMorgan Chase Bank, N.A. (incorporated by reference to our amended registration statement on Form F-4 (File No. 333-177984), filed on November 15, 2011). |
| | | |
2.32(d)* | | Description of Securities Disclosure. |
| | |
| 2.3 | | Indenture, dated as of April 25, 2007, among TAM Capital Inc., Tam S.A., TAM Linhas Aéreas S.A., The Bank of New York and The Bank of New York (Luxembourg) S.A., incorporated herein by reference from our second pre-effective amendment to our Registration Statement on Form F-4, File No. 333-131938. |
| | | |
| 2.4 | | Indenture, dated as of October 29, 2009, among TAM Capital 2 Inc., TAM S.A., TAM Linhas Aéreas S.A., The Bank of New York Mellon and The Bank of New York Mellon (Luxembourg) S.A., incorporated herein by reference from our Annual Report for the fiscal year ended December 31, 2009 on Form 20-F, filed June 30, 2010, File No. 333-131938. |
| | | |
| 2.5 | | Indenture, dated as of June 3, 2011, between TAM Capital 3 Inc., TAM S.A., TAM Linhas Aéreas S.A., The Bank of New York Mellon and The Bank of New York Mellon (Luxembourg) S.A., incorporated by reference to our annual report on Form 20-F (File No. 001-14728) filed on April 29, 2016. |
| | | |
| 2.6 | | Indenture, dated as of November 7, 2013, between Guanay Finance Limited and Citibank N.A., incorporated by reference to our annual report on Form 20-F (File No. 001-14728) filed on April 29, 2016. |
| | | |
| 2.7 | | Form of Indenture and Security Agreement between Parina Leasing Limited, Cuclillo Leasing Limited, Rayador Leasing Limited or Canastero Leasing Limited and Wilmington Trust Company (including Annex A), incorporated by reference to our annual report on Form 20-F (File No. 001-14728) filed on April 29, 2016. |
| | | |
| 2.8 | | Indenture, dated as of June 9, 2015, between LATAM Airlines Group S.A. and The Bank of New York Mellon, incorporated by reference to our annual report on Form 20-F (File No. 001-14728) filed on April 29, 2016. |
| | | |
2.9*2.9 | | Indenture, dated as of April 11, 2017, between LATAM Finance Limited, as issuer, LATAM Airlines Group S.A., as guarantor, and The Bank of New York Mellon, as trustee, transfer agent and paying agent. |
| | | |
| 2.10 | | Indenture dated as of February 11, 2019 by and among, Latam Finance Limited, as issuer, Latam Airlines Group S.A., as guarantor, and the Bank of New York Mellon, as trustee, registrar, transfer agent and paying agent in respect of the 7.00% Senior Notes Due 2026 incorporated by reference to our annual report on Form 20-F (File No. 001-14728), filed on April 15, 2019. |
| | |
| 2.11 | | We hereby agree to furnish to the SEC, upon its request, copies of any instruments defining the rights of holders of our long-term debt (or any long-term debt of our subsidiaries for which we are required to file consolidated or unconsolidated financial statements), where such indebtedness does not exceed 10% of our total consolidated assets. |
| | | |
4.14.1.1 | | Second A320-Family Purchase Agreement, dated March 20, 1998, between the Company and Airbus Industry relating to Airbus A320-Family Aircraft (incorporated by reference to our annual report on Form 20-F (File No. 001-14728), filed on June 24, 2001, and portions of which have been omitted pursuant to a request for confidential treatment). |
| | |
4.1.1 | | Amendment No. 1, dated as of November 14, 2003, and Amendment No. 2, dated as of October 4, 2005, to the Second A320-Family Purchase Agreement dated as of March 20, 1998, as amended and restated, between the Company and Airbus S.A.S. (as successor to Airbus Industry) (incorporated by reference to our amended annual report on Form 20-F (File No. 001-14728), filed on June 30, 2006, and portions of which have been omitted pursuant to a request for confidential treatment). |
| | | |
| 4.1.2 | | Amendment No. 3, dated as of March 6, 2007, to the Second A320-Family Purchase Agreement, dated as of March 20, 1998, as amended and restated, between the Company and Airbus S.A.S. (incorporated by reference to our amended annual report on Form 20-F (File No. 001-14728), filed on June 30, 2006, and portions of which have been omitted pursuant to a request for confidential treatment). |
| | | |
| 4.1.3 | | Amendment No. 5, dated as of December 23, 2009, to the Second A320-Family Purchase Agreement, dated as of March 20, 1998, as amended and restated, between the Company and Airbus S.A.S. (incorporated by reference to our amended annual report on Form 20-F (File No. 001-14728), filed on June 29, 2010, and portions of which have been omitted pursuant to a request for confidential treatment). |
Exhibit
No. | | Description |
| | | |
| 4.1.4 | | Amendments No. 6, 7, 8 and 9 (dated as of May 10, 2010, May 19, 2010, September 23, 2010 and December 21, 2010, respectively), to the Second A320-Family Purchase Agreement dated as of March 20, 1998, as amended and restated, between the Company and Airbus S.A.S. (incorporated by reference to our amended annual report on Form 20-F (File No. 001-14728), filed on May 5, 2011, and portions of which have been omitted pursuant to a request for confidential treatment). |
| | | |
| 4.1.5 | | Amendments No. 10 and 11 (dated as of June 10, 2011 and November 8, 2011, respectively), to the Second A320-Family Purchase Agreement, dated as of March 20, 1998, as amended and restated, between the Company and Airbus S.A.S. (incorporated by reference to our annual report on Form 20-F (File No. 001-14728), filed on April 2, 2012 and portions of which have been omitted pursuant to a request for confidential treatment). |
Exhibit
No. | | Description |
| | | |
| 4.1.6 | | Amendment No. 12 (dated as of November 19, 2012), to the Second A320-Family Purchase Agreement, dated as of March 20, 1998, as amended and restated, between the Company and Airbus S.A.S. (incorporated by reference to our annual report on Form 20-F (File No. 001-14728), filed on April 30, 2013, and portions of which have been omitted pursuant to a request for confidential treatment). |
| | | |
| 4.1.7 | | Amendment No. 13 (dated as of August 19, 2013), to the Second A320-Family Purchase Agreement dated as of March 20, 1998, as amended and restated, between the Company and Airbus S.A.S. Portions of these documents have been omitted pursuant to a request for confidential treatment. Such omitted portions have been filed separately with the Securities and Exchange Commission. |
| | | |
| 4.1.8 | | Amendments No. 14, 15, 16 and 17 (dated as of March 31, 2014, May 16, 2014, July 15, 2015 and December 11, 2014, respectively), to the Second A320-Family Purchase Agreement dated as of March 20, 1998, as amended and restated, between the Company and Airbus S.A.S. (incorporated by reference to our annual report on Form 20-F (File No. 001-14728) filed on April 1, 2015 and portions of which have been omitted pursuant to a request for confidential treatment). |
| | | |
| 4.1.9 | | Novation Agreement (dated as of October 30, 2014) between TAM Linhas Aereas S.A., LATAM Airlines Group S.A. and Airbus S.A.S., relating to the A320 Family/A330 purchase agreement dated November 14, 2006, as amended and restated, between Airbus S.A.S. and TAM Linhas Aereas S.A. (incorporated by reference to our annual report on Form 20-F (File No. 001-14728) filed on April 1, 2015 and portions of which have been omitted pursuant to a request for confidential treatment). |
| | | |
| 4.2 | | Purchase Agreement No. 2126, dated as of January 30, 1998, between the Company and The Boeing Company as amended and supplemented, relating to Model 767-316ER, Model 767-38EF, and Model 767-316F Aircraft (incorporated by reference to our amended annual report on Form 20-F (File No. 001-14728), filed on December 21, 2004, and portions of which have been omitted pursuant to a request for confidential treatment). |
| | | |
| 4.2.1 | | Supplemental Agreements No. 16, 19, 20, 21 and 22 (dated as of November 11, 2004, January 21, March 10, April 1, April 28, and July 20, 2005, and March 31, 2006, respectively) to the Purchase Agreement No. 2126, dated January 30, 1998, between the Company and The Boeing Company, relating to Model 767-316ER, Model 767-38EF, and Model 767-316F Aircraft (incorporated by reference to our amended annual report filed on Form 20-F (File No. 001-14728) filed on May 7, 2007 and portions of which have been omitted pursuant to a request for confidential treatment). |
| | | |
| 4.2.2 | | Supplemental Agreement No. 23, dated as of March 6, 2007, to the Purchase Agreement No. 2126, dated as of January 30, 1998, between the Company and The Boeing Company (incorporated by reference to our amended annual report on Form 20-F (File No. 001-14728), filed on April 23, 2007, and portions of which have been omitted pursuant to a request for confidential treatment). |
| | | |
| 4.2.3 | | Supplemental Agreement No. 24, dated as of November 10, 2008, to the Purchase Agreement No. 2126, dated as of January 30, 1998, between the Company and The Boeing Company. Portions of this document have been omitted pursuant to a request for confidential treatment (incorporated by reference to our amended annual report on Form 20-F (File No. 001-14728), filed on June 25, 2009, and portions of which have been omitted pursuant to a request for confidential treatment). |
| | | |
| 4.2.4 | | Supplemental Agreements No. 28 and 29 (dated as of March 22, 2010 and November 10, 2010, respectively), to the Purchase Agreement No. 2126, dated as of January 30, 1998, between the Company and The Boeing Company. Portions of these documents have been omitted pursuant to a request for confidential treatment (incorporated by reference to our amended annual report on Form 20-F (File No. 001-14728), filed on May 5, 2011, and portions of which have been omitted pursuant to a request for confidential treatment). |
Exhibit
No. | | Description |
| | | |
| 4.2.5 | | Supplemental Agreements No. 30, 31 and 32 (dated as of February 15, 2011, May 10, 2011 and December 22, 2011, respectively), to the Purchase Agreement No. 2126, dated as of January 30, 1998, between the Company and The Boeing Company (incorporated by reference to our annual report on Form 20-F (File No. 001-14728), filed on April 2, 2012, and portions of which have been omitted pursuant to a request for confidential treatment). |
| | | |
| 4.3 | | Aircraft Lease Common Terms Agreement between GE Commercial Aviation Services Limited and LAN Cargo S.A., dated as of April 30, 2007, and Aircraft Lease Agreements between Wells Fargo Bank Northwest N.A., as owner trustee, and LAN Cargo S.A., dated as of April 30, 2007 (incorporated by reference to our amended annual report on Form 20-F (File No. 001-14728), filed on May 7, 2007, and portions of which have been omitted pursuant to a request for confidential treatment). |
Exhibit
No. | | Description |
| | | |
| 4.4 | | Purchase Agreement No. 3194 between the Company and The Boeing Company relating to Boeing Model 777-Freighter aircraft, dated as of July 3, 2007, (incorporated by reference to our amended annual report on Form 20-F (File No. 001-14728), filed on June 25, 2008, and portions of which have been omitted pursuant to a request for confidential treatment). |
| | | |
| 4.4.1 | | Supplemental Agreement No. 2, dated as of November 2, 2010, to the Purchase Agreement No. 3194 between the Company and The Boeing Company, dated as of July 3, 2007 (incorporated by reference to our amended annual report on Form 20-F (File No. 001-14728), filed on May 5, 2011, and portions of which have been omitted pursuant to a request for confidential treatment). |
| | | |
| 4.4.2 | | Supplemental Agreement No. 3, dated as of September 24, 2011, to the Purchase Agreement No. 3194 between the Company and The Boeing Company, dated as of July 3, 2007 (incorporated by reference to our annual report on Form 20-F (File No. 001-14728), filed on April 2, 2012, and portions of which have been omitted pursuant to a request for confidential treatment). |
| | | |
| 4.4.3 | | Supplemental Agreement No. 4, dated as of August 9, 2012, to the Purchase Agreement No. 3194 between the Company and The Boeing Company, dated as of July 3, 2007 (incorporated by reference to our annual report on Form 20-F (File No. 001-14728), filed on April 30, 2013, and portions of which have been omitted pursuant to a request for confidential treatment). |
| | | |
| 4.5 | | Purchase Agreement No. 3256 between the Company and The Boeing Company relating to Boeing Model 787-8 and 787-9 aircraft, dated as of October 29, 2007, (incorporated by reference to our amended annual report on Form 20-F (File No. 001-14728), filed on June 25, 2008, and portions of which have been omitted pursuant to a request for confidential treatment). |
| | | |
| 4.5.1 | | Supplemental Agreements No. 1 and 2, (dated March 22, 2010 and July 8, 2010, respectively) to the Purchase Agreement No. 3256, dated October 29, 2007, as amended, between the Company and The Boeing Company (incorporated by reference to our amended annual report on Form 20-F (File No. 001-14728), filed on May 5, 2011, and portions of which have been omitted pursuant to a request for confidential treatment). |
| | | |
| 4.5.2 | | Supplemental Agreement No. 3, dated as of August 24, 2012, to the Purchase Agreement No. 3256, as amended, between the Company and The Boeing Company, dated as of October 29, 2007 (incorporated by reference to our annual report on Form 20-F (File No. 001-14728), filed on April 30, 2013, and portions of which have been omitted pursuant to a request for confidential treatment). |
| | | |
| 4.5.3 | | Delay Settlement Agreement, dated as of September 16, 2013, to the Purchase Agreement No. 3256, as amended, between the Company and The Boeing Company, dated as of October 29, 2007. Portions of this document have been omitted pursuant to a request for confidential treatment. Such omitted portions have been filed separately with the Securities and Exchange Commission. |
| | | |
| 4.5.4 | | Supplemental Agreements No. 4 and 5 (dated as of April 22, 2015 and July 3, 2015, respectively) to the Purchase Agreement No. 3256, as amended, between the Company and The Boeing Company, dated as of October 29, 2007 (incorporated by reference to our annual report on Form 20-F (File No. 001-14728) filed on April 29, 2016 and portions of which have been omitted pursuant to a request for confidential treatment). |
| | | |
| 4.5.5. | | Supplemental Agreements No. 6 and 7 (dated as of May 27, 2016 and December 20, 2016, respectively) to the Purchase Agreement No. 3256, as amended, between the Company and The Boeing Company, dated as of October 29, 2007. Portions of these documents have been omitted pursuant to a request for confidential treatment. Such omitted portions have been filed separately with the Securities and Exchange Commission. |
Exhibit
No. | | Description |
| | | |
| 4.6 | | General Terms Agreement No. CFM-1-2377460475 and Letter Agreement No. 1 to General Terms Agreement No. CFM-1-2377460475 between the Company and CFM International, Inc., both dated December 17, 2010 (incorporated by reference to our amended annual report on Form 20-F (File No. 001-14728), filed on May 5, 2011, and portions of which have been omitted pursuant to a request for confidential treatment). |
| | | |
| 4.7 | | Rate Per Flight Hour Engine Shop Maintenance Services Agreement between the Company and CFM International, Inc., dated December 17, 2010 (incorporated by reference to our amended annual report on Form 20-F (File No. 001-14728), filed on May 5, 2011, and portions of which have been omitted pursuant to a request for confidential treatment). |
Exhibit
No. | | Description |
| | | |
| 4.8 | | Implementation Agreement, dated as of January 18, 2011, among the Company, Costa Verde Aeronáutica S.A., Inversiones Mineras del Cantábrico S.A., TAM S.A., TAM Empreedimentos e Participações S.A. and Maria CláCláudia Oliveira Amaro, MaurícioMaurcio Rolim Amaro, Noemy Almeida Oliveira Amaro and João Francisco Amaro (incorporated by reference to our amended annual report on Form 20-F (File No. 001-14728), filed on May 5, 2011). |
| | | |
| 4.9.1 | | Extension Letter to the Implementation Agreement and Exchange Offer Agreement, dated January 12, 2012, among the Company, Costa Verde Aeronáutica S.A., Inversiones Mineras del CantáCantábrico S.A., TAM S.A., TAM Empreedimentos e Participações S.A. and Maria Cláudia Oliveira Amaro, Maurício Rolim Amaro, Noemy Almeida Oliveira Amaro and João Francisco Amaro (incorporated by reference to our amended registration statement on Form F-4 (File No. 333-177984), filed on November 15, 2011). |
| | | |
| 4.9 | | Exchange Offer Agreement, dated as of January 18, 2011, among LAN Airlines S.A., Costa Verde Aeronáutica S.A., Inversiones Mineras del CantáCantábrico S.A., TAM S.A., TAM Empreedimentos e Participações S.A. and Maria CláCláudia Oliveira Amaro, MauríMaurício Rolim Amaro, Noemy Almeida Oliveira Amaro and JoãJoão Francisco Amaro (incorporated by reference to our amended annual report on Form 20-F (File No. 001-14728), filed on May 5, 2011). |
| | | |
| 4.10 | | Shareholders Agreement, dated as of January 25, 2012, between the Company and TEP Chile S.A. (incorporated by reference to our amended registration statement on Form F-4 (File No. 333-177984), filed on November 15, 2011). |
| | | |
| 4.11 | | Shareholders Agreement, dated as of January 25, 2012, among the Company, TEP Chile S.A. and Holdco I S.A. (incorporated by reference to our amended registration statement on Form F-4 (File No. 333-177984), filed on November 15, 2011). |
| | | |
| 4.12 | | Shareholders Agreement, dated as of January 25, 2012, among the Company, TEP Chile S.A., Holdco I S.A. and TAM S.A. (incorporated by reference to our amended registration statement on Form F-4 (File No. 333-177984), filed on November 15, 2011). |
| | | |
| 4.13 | | Letter Agreement No. 12 (GTA No. 6-9576), dated July 11, 2011, between the Company and the General Electric Company (incorporated by reference to our annual report on Form 20-F (File No. 001-14728), filed on April 2, 2012 and portions of which have been omitted pursuant to a request for confidential treatment). |
| | | |
| 4.14 | | A320 NEO Purchase Agreement, dated as of June 22, 2011, between the Company and Airbus S.A.S. (incorporated by reference to our annual report on Form 20-F (File No. 001-14728), filed on April 2, 2012, and portions of which have been omitted pursuant to a request for confidential treatment). |
| | | |
| 4.14.1 | | Amendments No. 1, 2 and 3 (dated as of February 27, 2013, July 15, 2014 and December 11, 2014, respectively), to the A320 NEO Purchase Agreement dated as of June 22, 2011, between the Company and Airbus S.A. (incorporated by reference to our annual report on Form 20-F (File No. 001-14728) filed on April 1, 2015 and portions of which have been omitted pursuant to a request for confidential treatment). |
| | | |
| 4.14.2 | | Letter Agreement No. 1 (dated as of July 15, 2014) to Amendment No. 2 (dated as of July 15, 2014) to the A320 NEO Purchase Agreement dated as of June 22, 2011, between the Company and Airbus S.A. (incorporated by reference to our annual report on Form 20-F (File No. 001-14728) filed on April 1, 2015 and portions of which have been omitted pursuant to a request for confidential treatment). |
| | | |
| 4.14.3 | | Amendment No. 4, 5 and 6 (dated as of April 15, 2016, April 15, 2016, and August 8, 2016, respectively), to the A320 NEO Purchase Agreement dated as of June 22, 2011, between the Company and Airbus S.A.. Portions of these documents have been omitted pursuant to a request for confidential treatment. Such omitted portions have been filed separately with the Securities and Exchange Commission. |
Exhibit
No. | | Description |
| | | |
| 4.15 | | Buyback Agreement No. 3001 relating to One (1) Airbus A318-100 Aircraft MSN 3001, dated as of April 14, 2011, between the Company and Airbus Financial Services (incorporated by reference to our annual report on Form 20-F (File No. 001-14728), filed on April 2, 2012, and portions of which have been omitted pursuant to a request for confidential treatment). |
| | | |
| 4.16 | | Buyback Agreement No. 3030 relating to One (1) Airbus A318-100 Aircraft MSN 3003, dated as of August 10, 2011, between the Company and Airbus Financial Services (incorporated by reference to our annual report on Form 20-F (File No. 001-14728), filed on April 2, 2012, and portions of which have been omitted pursuant to a request for confidential treatment). |
Exhibit
No. | | Description |
| | | |
| 4.17 | | Buyback Agreement No. 3062, to One (1) Airbus A318-100 Aircraft MSN 3062, dated as of May 13, 2011, between the Company and Airbus Financial Services (incorporated by reference to our annual report on Form 20-F (File No. 001-14728), filed on April 2, 2012, and portions of which have been omitted pursuant to a request for confidential treatment). |
| | | |
| 4.18 | | Buyback Agreement No. 3214, to One (1) Airbus A318-100 Aircraft MSN 3214, dated as of June 9, 2011, between the Company and Airbus Financial Services (incorporated by reference to our annual report on Form 20-F (File No. 001-14728), filed on April 2, 2012, and portions of which have been omitted pursuant to a request for confidential treatment). |
| | | |
| 4.19 | | Buyback Agreement No. 3216, to One (1) Airbus A318-100 Aircraft MSN 3216, dated as of July 13, 2011, between the Company and Airbus Financial Services (incorporated by reference to our annual report on Form 20-F (File No. 001-14728), filed on April 2, 2012, and portions of which have been omitted pursuant to a request for confidential treatment). |
| | | |
| 4.20 | | Aircraft General Terms Agreement Number AGTA-LAN, dated May 9, 1997, between the Company and The Boeing Company (incorporated by reference to our annual report on Form 20-F (File No. 001-14728), filed on April 2, 2012, and portions of which have been omitted pursuant to a request for confidential treatment). |
| | | |
| 4.21 | | Buyback Agreement No. 3371, dated as of July 25, 2012, between the Company and Airbus Financial Services. Portions of this document have been omitted pursuant to a request for confidential treatment (incorporated by reference to our annual report on Form 20-F (File No. 001-14728), filed on April 30, 2013, and portions of which have been omitted pursuant to a request for confidential treatment). |
| | | |
| 4.22 | | Buyback Agreement No. 3390, dated as of October 26, 2012, between the Company and Airbus Financial Services. Portions of this document have been omitted pursuant to a request for confidential treatment (incorporated by reference to our annual report on Form 20-F (File No. 001-14728), filed on April 30, 2013, and portions of which have been omitted pursuant to a request for confidential treatment). |
| | | |
| 4.23 | | Buyback Agreement No. 3438, dated as of December 5, 2012, between the Company and Airbus Financial Services. Portions of this document have been omitted pursuant to a request for confidential treatment (incorporated by reference to our annual report on Form 20-F (File No. 001-14728), filed on April 30, 2013, and portions of which have been omitted pursuant to a request for confidential treatment). |
| | | |
| 4.24 | | Buyback Agreement No. 3469, dated as of January 4, 2013, between the Company and Airbus Financial Services. Portions of this document have been omitted pursuant to a request for confidential treatment (incorporated by reference to our annual report on Form 20-F (File No. 001-14728), filed on April 30, 2013, and portions of which have been omitted pursuant to a request for confidential treatment). |
| | | |
| 4.25 | | Buyback Agreement No. 3509, dated as of February 20, 2013, between the Company and Airbus Financial Services. Portions of this document have been omitted pursuant to a request for confidential treatment (incorporated by reference to our annual report on Form 20-F (File No. 001-14728), filed on April 30, 2013, and portions of which have been omitted pursuant to a request for confidential treatment). |
| | | |
| 4.26 | | A320 Family Purchase Agreement, dated March 19, 1998, between Airbus S.A.S. (formerly known as Airbus IndustrieIndustries GIE) and TAM Linhas AéAéreas S.A. (formerly known as TAM Transportes AéAéreas Meridionais S.A. and as successor in interest in TAM-Transportes AéAéreas Regionais S.A.), incorporated herein by reference from our sixth pre-effective amendment to our Registration Statement on Form F-1, filed March 2, 2006, File No. 333-131938. |
| | | |
| 4.26.1 | | Amendments No. 12, 13 and 14 (dated as of January 27, 2012 and November 30, 2012 and December 14, 2012, respectively), to the Second A320-Family Purchase Agreement, dated as of March 20, 1998, as amended and restated, between the Company and Airbus S.A.S. (incorporated by reference to our annual report on Form 20-F (File No. 001-14728), filed on April 30, 2013, and portions of which have been omitted pursuant to a request for confidential treatment). |
Exhibit
No. | | Description |
| | | |
| 4.27.1 | | A350 Family Purchase Agreement, dated December 20, 2005, as amended and restated on January 21, 2008, between Airbus S.A.S. and TAM Linhas Aereas S.A. (incorporated by reference to our annual report on Form 20-F (File No. 001-14728) filed on April 1, 2015 and portions of which have been omitted pursuant to a request for confidential treatment). |
| | | |
| 4.27.2 | | Amendments No. 1, 2 and 3 (dated July 28, 2010, July 15, 2014 and October 30, 2014, respectively) to the A350 Purchase Agreement, dated December 20, 2005, as amended and restated on January 21, 2008, between Airbus S.A.S. and TAM Linhas Aereas S.A. (incorporated by reference to our annual report on Form 20-F (File No. 001-14728) filed on April 1, 2015 and portions of which have been omitted pursuant to a request for confidential treatment). |
| | | |
| 4.27.3 | | Novation Agreement (dated as of July 21, 2014) between TAM Linhas Aereas S.A., LATAM Airlines Group S.A. and Airbus S.A.S., relating to the A350 Family Purchase Agreement, dated December 20, 2005, as amended and restated on January 21, 2008, between Airbus S.A.S. and TAM Linhas Aereas S.A. (incorporated by reference to our annual report on Form 20-F (File No. 001-14728) filed on April 1, 2015 and portions of which have been omitted pursuant to a request for confidential treatment). |
| | | |
| 4.27.4 | | Amendments No. 4 and 5 (dated September 15, 2015 and November 19, 2015, respectively) to the A350 Purchase Agreement, dated December 20, 2005, as amended and restated on January 21, 2008, between Airbus S.A.S. and TAM Linhas Aereas S.A. (incorporated by reference to our annual report on Form 20-F (File No. 001-14728) filed on April 29, 2016 and portions of which have been omitted pursuant to a request for confidential treatment). |
| | | |
| 4.27.5 | | Amendments No. 6, 7 and 8 (dated February 3, 2016, August 8, 2016, and September 9, 2016, respectively) to the A350 Purchase Agreement, dated December 20, 2005, as amended and restated on January 21, 2008, between Airbus S.A.S. and TAM Linhas Aereas S.A.. Portions of these documents have been omitted pursuant to a request for confidential treatment. Such omitted portions have been filed separately with the Securities and Exchange Commission. |
| | | |
| 4.29 | | V2500 Maintenance Agreement, dated September 14, 2000, between TAM Transportes AéAéreos Regionais S.A. (incorporated by TAM Linhas AéAéreas S.A.) and MTU Maintenance Hannover GmbH (MTU), incorporated herein by reference from our sixth pre-effective amendment to our Registration Statement on Form F-1, filed March 2, 2006, File No. 333-131938. |
| | | |
| 4.30 | | PW1100G-JM Engine Support and Maintenance Agreement, dated February 26, 2014, between LATAM Airlines Group S.A. and Pratt & Whitney Division. Portions of this document have been omitted pursuant to a request for confidential treatment. Such omitted portions have been filed separately with the Securities and Exchange Commission. |
| | | |
| 4.31 | | Framework Deed, dated May 28, 2013, between LATAM Airlines Group S.A. and Aercap Holdings N.V. Portions of this document have been omitted pursuant to a request for confidential treatment. Such omitted portions have been filed separately with the Securities and Exchange Commission. |
| | | |
| 4.32 | | A320 Family/A330 Purchase Agreement (dated as of November 14, 2006) between Airbus S.A.S. and TAM – Linhas Aereas S.A. (incorporated by reference to our annual report on Form 20-F (File No. 001-14728) filed on April 1, 2015 and portions of which have been omitted pursuant to a request for confidential treatment). |
| | | |
| 4.32.1 | | Amendments No. 15, 16, 17, 18, and 19 (dated as of February 18, 2013, February 27, 2013, August 19, 2013, July 15, 2014 and December 11, 2014, respectively) to the A320 Family/A330 Purchase Agreement (dated as of November 14, 2006) between Airbus S.A.S. and TAM – Linhas Aereas S.A. (incorporated by reference to our annual report on Form 20-F (File No. 001-14728) filed on April 1, 2015 and portions of which have been omitted pursuant to a request for confidential treatment). |
| | | |
| 4.32.2 | | Amendments No. 20 and 21 (dated as of June 3, 2015 and December 21, 2015, respectively) to the A320 Family/A330 Purchase Agreement (dated as of November 14, 2006) between Airbus S.A.S. and TAM – Linhas Aereas S.A. (incorporated by reference to our annual report on Form 20-F (File No. 001-14728) filed on April 1, 2015 and portions of which have been omitted pursuant to a request for confidential treatment). |


LATAM AIRLINES GROUP S.A. AND SUBSIDIARIES
CONSOLIDATED FINANCIAL STATEMENTS
DECEMBER 31, 20172019
CONTENTS
| CLP | - | CHILEAN PESO |
| ARS | - | ARGENTINE PESO |
| US$ | - | united states dollar |
| THUS$ | - | THOUSANDS OF UNITED STATES DOLLARS |
| mUS$ | - | millions of united states dollars |
| COP | - | COLOMBIAN PESO |
| brl/R$ | - | braZILIAN REAL |
| thr$ | - | Thousands of Brazilian reaL |
MXN | - | MEXICAN PESO |
VEF | - | STRONG Bolivar |


REPORT OF INDEPENDENT REGISTERED PUBLIC ACCOUNTING FIRM
To the Board of Directors and Shareholders
shareholders of Latam Airlines Group S.A.
Opinions on the Financial Statements and Internal Control over Financial Reporting
We have audited the accompanying consolidated statementstatements of financial position of Latam Airlines Group S.A. and its subsidiaries (the “Company”) as of December 31, 20172019 and 2016,2018, and the related consolidated statements of income by function, comprehensive income, changes in equity and cash flowsflows– direct – method for each of the three years in the period ended December 31, 2017,2019, including the related notes (collectively referred to as the “consolidated financial statements”). We also have audited the Company’s internal control over financial reporting as of December 31, 2017,2019, based on criteria established inInternal Control - Integrated Framework(2013) issued by the Committee of Sponsoring Organizations of the Treadway Commission (COSO).
In our opinion, the consolidated financial statements referred to above present fairly, in all material respects, the financial position of the Company as of December 31, 20172019 and 2016,2018, and the results of theirits operations and theirits cash flows for each of the three years in the period ended December, 31, 20172019 in conformity with International Financial Reporting Standards as issued by the International Accounting Standards Board. Also in our opinion, the Company maintained, in all material respects, effective internal control over financial reporting as of December 31, 2017,2019, based on criteria established inInternal Control - Integrated Framework(2013) issued by the COSO.
Change in Accounting Principle
As discussed in Note 2.1 to the consolidated financial statements, the Company changed the manner in which it accounts for leases in 2019.
Basis for Opinions
The Company’sCompany's management is responsible for these consolidated financial statements, for maintaining effective internal control over financial reporting, and for its assessment of the effectiveness of internal control over financial reporting, included in the accompanying Management’s Annual Report on Internal Control over Financial Reporting.Reporting appearing under Item 15. Our responsibility is to express opinions on the Company’s consolidated financial statements and on the Company’sCompany's internal control over financial reporting based on our audits. We are a public accounting firm registered with the Public Company Accounting Oversight Board (United States) (“PCAOB”)(PCAOB) and are required to be independent with respect to the Company in accordance with the U.S. federal securities laws and the applicable rules and regulations of the Securities and Exchange Commission and the PCAOB.
We conducted our audits in accordance with the standards of the PCAOB. Those standards require that we plan and perform the audits to obtain reasonable assurance about whether the consolidated financial statements are free of material misstatement, whether due to error or fraud, and whether effective internal control over financial reporting was maintained in all material respects.

| PwC Chile, Av. Andrés Bello 2711 - piso 5, Las Condes - Santiago, Chile
|
| RUT: 81.513.400-1 | Teléfono: (56 2) 22940 0000 | www.pwc.cl |
Latam Airlines Group S.A.
2
Our audits of the consolidated financial statements included performing procedures to assess the risks of material misstatement of the consolidated financial statements, whether due to error or fraud, and performing procedures that respond to those risks. Such procedures included examining, on a test basis, evidence regarding the amounts and disclosures in the consolidated financial statements. Our audits also included evaluating the accounting principles used and significant estimates made by management, as well as evaluating the overall presentation of the consolidated financial statements. Our audit of internal control over financial reporting included obtaining an understanding of internal control over financial reporting, assessing the risk that a material weakness exists, and testing and evaluating the design and operating effectiveness of internal control based on the assessed risk. Our audits also included performing such other procedures as we considered necessary in the circumstances. We believe that our audits provide a reasonable basis for our opinions.
Definition and Limitations of Internal Control over Financial Reporting
A company’s internal control over financial reporting is a process designed to provide reasonable assurance regarding the reliability of financial reporting and the preparation of financial statements for external purposes in accordance with generally accepted accounting principles. A company’s internal control over financial reporting includes those policies and procedures that (i) pertain to the maintenance of records that, in reasonable detail, accurately and fairly reflect the transactions and dispositions of the assets of the company; (ii) provide reasonable assurance that transactions are recorded as necessary to permit preparation of financial statements in accordance with generally accepted accounting principles, and that receipts and expenditures of the company are being made only in accordance with authorizations of management and directors of the company; and (iii) provide reasonable assurance regarding prevention or timely detection of unauthorized acquisition, use, or disposition of the company’s assets that could have a material effect on the financial statements.
Because of its inherent limitations, internal control over financial reporting may not prevent or detect misstatements. Also, projections of any evaluation of effectiveness to future periods are subject to the risk that controls may become inadequate because of changes in conditions, or that the degree of compliance with the policies or procedures may deteriorate.

The critical audit matters communicated below are matters arising from the current period audit of the consolidated financial statements that were communicated or required to be communicated to the audit committee and that (i) relate to accounts or disclosures that are material to the consolidated financial statements and (ii) involved our especially challenging, subjective, or complex judgments. The communication of critical audit matters does not alter in any way our opinion on the consolidated financial statements, taken as a whole, and we are not, by communicating the critical audit matters below, providing separate opinions on the critical audit matters or on the accounts or disclosures to which they relate.
Latam Airlines Group S.A.
Goodwill and Intangible Assets with Indefinite Useful Life (airport slots and loyalty program) Impairment Assessments
As described in Notes 2.8, 4(a), 15 and 16 to the consolidated financial statements, the Company’s consolidated goodwill and intangible assets with indefinite useful life (airport slots and loyalty program) balance at December 31, 2019 were US$2,210 million and US$1,110 million, respectively. Management conducts an impairment assessment annually or more frequently if events or changes in circumstances indicate potential impairment. An impairment loss is recognized for the amount by which the carrying amount of the cash generating unit exceeds its recoverable amount. The recoverable amount of the cash generating unit is the higher of value in use and fair value less costs to sell. The value in use is determined by management using a discounted cash flow model. Management’s cash flow projections included significant judgments and assumptions relating to revenue growth rates, exchange rates, discount rate, inflation rates and fuel price.
The principal considerations for our determination that performing procedures relating to goodwill and intangible assets with indefinite useful life (airport slots and loyalty program) impairment assessments is a critical audit matter are there was significant judgment by management when developing the value-in-use calculation. This in turn led to a high degree of auditor judgment, subjectivity and effort in performing procedures to evaluate management’s cash flow projections and significant assumptions, including the revenue growth rates, exchange rates, discount rate, inflation rates and fuel price. In addition, the audit effort involved the use of professionals with specialized skill and knowledge to assist in performing these procedures and evaluating the audit evidence obtained.
Addressing the matter involved performing procedures and evaluating audit evidence in connection with forming our overall opinion on the consolidated financial statements. These procedures included testing the effectiveness of controls relating to management’s goodwill and intangible assets with indefinite useful life (airport slots and loyalty program) impairment assessments, including controls over the valuation of the Company’s cash generating unit. These procedures also included, among others, testing management´s process for developing the estimate; evaluating the appropriateness of the discounted cash flow model; testing the completeness, accuracy, and relevance of underlying data used in the model; and evaluating the significant assumptions used by management, including the revenue growth rates, exchange rates, discount rate, inflation rates and fuel price. Evaluating management’s assumptions related to revenue growth rates, exchange rates, discount rate, inflation rates and fuel price involved evaluating whether the assumptions used by management were reasonable considering (i) the current and past performance of the cash generating unit, (ii) the consistency with external market and industry data, and (iii) whether these assumptions were consistent with evidence obtained in other areas of the audit. Professionals with specialized skill and knowledge were used to assist in the evaluation of the Company’s discounted cash flow model and significant assumptions, including the discount rate.
Latam Airlines Group S.A.
Recoverability of Deferred Tax Assets
As described in Notes 2.17, 4(c) and 18 to the consolidated financial statements, the Company has recorded US$236 million of deferred tax assets as of December 31, 2019. Management records deferred tax assets on the temporary differences arising between the tax bases of assets and their reported amounts. Deferred tax assets are recognized to the extent it is probable that future taxable profit will be available against which the temporary differences can be utilized. Management applied significant judgement in assessing the recoverability of these deferred tax assets. In determining the amount of deferred tax assets to be recognized, management considered historical profitability, projected future taxable profit, including assumptions related to the revenue growth rates, exchange rates, discount rate, inflation rates and fuel price, and the expected timing of the reversals of existing temporary differences.
The principal considerations for our determination that performing procedures relating to the recoverability of deferred tax assets is a critical audit matter are there was significant judgment by management in assessing the available positive and negative evidence surrounding the recoverability of deferred tax assets. This in turn led to a high degree of auditor judgment, subjectivity and effort in performing procedures and evaluating audit evidence relating to management’s significant assumptions related to projected future taxable profit and application of tax law. In addition, the audit effort involved the use of professionals with specialized skill and knowledge to assist in performing these procedures and evaluating the audit evidence obtained.
Addressing the matter involved performing procedures and evaluating audit evidence in connection with forming our overall opinion on the consolidated financial statements. These procedures included testing the effectiveness of controls relating to the recoverability of deferred tax asset, including controls over projected future taxable profit. These procedures also included, among others, evaluating management’s assessment of the recoverability of deferred tax assets, including evaluating the assumptions relating to the projected future taxable profit. Evaluating management’s assumptions related to the projected future taxable profit involved evaluating historical profitability as well as other audit evidence related to management’s forecasts. Professionals with specialized skill and knowledge were also used to assist in evaluating management’s application of income tax law and the recoverability of deferred tax assets.
Valuation of Loyalty Programs Breakage
As described in Notes 2.20, 4(e) and 22 to the consolidated financial statements, the Company has recorded deferred income of US$3,540 million as of December 31, 2019, of which US$1,687 million was related to deferred income associated with the loyalty programs. The deferred income of loyalty programs is determined based on the estimated stand-alone selling price of unused miles and points awarded to the members of the loyalty programs reduced for breakage. Management used statistical models to estimate the breakage which involved significant judgments and assumptions relating to the historical redemption and expiration activity and forecasted redemption and expiration patterns.
Latam Airlines Group S.A.
The principal considerations for our determination that performing procedures relating to the valuation of loyalty programs breakage is a critical audit matter are there was significant judgment by management to develop the breakage estimate. This in turn led to a high degree of auditor judgment, subjectivity and effort in performing procedures to evaluate the underlying assumptions used by the Company to estimate the historical redemption and expiration activity and forecasted redemption and expiration patterns. In addition, the audit effort involved the use of professionals with specialized skill and knowledge to assist in performing these procedures and evaluating the audit evidence obtained.
Addressing the matter involved performing procedures and evaluating audit evidence in connection with forming our overall opinion on the consolidated financial statements. These procedures included testing the effectiveness of controls relating to management’s accounting for its loyalty programs, including controls over management’s review of the statistical models and resulting breakage estimates. These procedures also included, among others, testing management’s process for developing the breakage estimate; evaluating the appropriateness of the statistical models; testing the completeness, accuracy, and relevance of underlying data used in the models. Evaluating management’s assumptions used to develop the breakage estimate involved evaluating whether the assumptions used by management were reasonable considering (i) the available information regarding the miles and points redemption and expiration patterns, (ii) management’s actions to incentive holders of the loyalty programs to redeem their miles and points, and (iii) whether these assumptions were consistent with evidence obtained in other areas of the audit. Professionals with specialized skill and knowledge were also used to assist in the evaluation of the Company’s methodology and assumptions used to develop the breakage estimate.
/s/ PricewaterhouseCoopers | |
PricewaterhouseCoopers Consultores
Auditores SpA | |
Santiago – Chile
April 4, 2018March 16, 2020
We have served as the Company’s auditor since 1991
1991.
Contents of the notesNotes to the consolidated financial statements of LATAM Airlines Group S.A. and Subsidiaries.
LATAM AIRLINES GROUP S.A. AND SUBSIDIARIES
CONSOLIDATED STATEMENT OF FINANCIAL POSITION
| ASSETS | | | | | | | | | | | |
| | | | | As of | | | As of | | | As of | |
| | | | | December 31, | | | December 31, | | | January 1, | |
| | | Note | | 2019 | | | 2018 | | | 2018 | |
| | | | | ThUS$ | | | ThUS$ | | | ThUS$ | |
| | | | | | | | Restated | | | Restated | |
| Cash and cash equivalents | | | | | | | | | | | |
| Cash and cash equivalents | | 6 - 7 | | | 1,072,579 | | | | 1,081,642 | | | | 1,142,004 | |
| Other financial assets | | 7 - 11 | | | 499,504 | | | | 383,984 | | | | 559,919 | |
| Other non-financial assets | | 12 | | | 313,449 | | | | 290,476 | | | | 244,778 | |
| Trade and other accounts receivable | | 7 - 8 | | | 1,244,348 | | | | 1,162,582 | | | | 1,202,945 | |
| Accounts receivable from related entities | | 7 - 9 | | | 19,645 | | | | 2,931 | | | | 2,582 | |
| Inventories | | 10 | | | 354,232 | | | | 279,344 | | | | 236,666 | |
| Current tax assets | | 18 | | | 29,321 | | | | 69,134 | | | | 77,987 | |
| | | | | | | | | | | | | | | |
Total current assets other than non-current assets
(or disposal groups) classified as held for sale or as held for distribution to owners | | | | | 3,533,078 | | | | 3,270,093 | | | | 3,466,881 | |
| | | | | | | | | | | | | | | |
| Non-current assets (or disposal groups) classified as held for sale or as held for distribution to owners | | 13 | | | 485,150 | | | | 5,768 | | | | 291,103 | |
| | | | | | | | | | | | | | | |
| Total current assets | | | | | 4,018,228 | | | | 3,275,861 | | | | 3,757,984 | |
| | | | | | | | | | | | | | | |
| Non-current assets | | | | | | | | | | | | | | |
| Other financial assets | | 7 - 11 | | | 46,907 | | | | 58,700 | | | | 88,090 | |
| Other non-financial assets | | 12 | | | 204,928 | | | | 227,541 | | | | 212,203 | |
| Accounts receivable | | 7 - 8 | | | 4,725 | | | | 5,381 | | | | 6,891 | |
| Intangible assets other than goodwill | | 15 | | | 1,448,241 | | | | 1,441,072 | | | | 1,617,247 | |
| Goodwill | | 16 | | | 2,209,576 | | | | 2,294,072 | | | | 2,672,550 | |
| Property, plant and equipment | | 17 | | | 12,919,618 | | | | 12,501,809 | | | | 12,930,652 | |
| Current tax assets, non-current | | 18 | | | - | | | | 757 | | | | 17,532 | |
| Deferred tax assets | | 18 | | | 235,583 | | | | 273,529 | | | | 370,564 | |
| Total non-current assets | | | | | 17,069,578 | | | | 16,802,861 | | | | 17,915,729 | |
| Total assets | | | | | 21,087,806 | | | | 20,078,722 | | | | 21,673,713 | |
The accompanying Notes 1 to 37 form an integral part of these consolidated financial statements.
LATAM AIRLINES GROUP S.A. AND SUBSIDIARIES
CONSOLIDATED STATEMENT OF FINANCIAL POSITION
ASSETS
| | | | | As of | | | As of | |
| | | | | December 31, | | | December 31, | |
| | | Note | | 2017 | | | 2016 | |
| | | | | ThUS$ | | | ThUS$ | |
| Current assets | | | | | | | | | | |
| Cash and cash equivalents | | 6 - 7 | | | 1,142,004 | | | | 949,327 | |
| Other financial assets | | 7 - 11 | | | 559,919 | | | | 712,828 | |
| Other non-financial assets | | 12 | | | 221,188 | | | | 212,242 | |
| Trade and other accounts receivable | | 7 - 8 | | | 1,214,050 | | | | 1,107,889 | |
| Accounts receivable from related entities | | 7 - 9 | | | 2,582 | | | | 554 | |
| Inventories | | 10 | | | 236,666 | | | | 241,363 | |
| Tax assets | | 18 | | | 77,987 | | | | 65,377 | |
| Total current assets other than non-current assets (or disposal groups) classified as held for sale or as held for distribution to owners | | | | | 3,454,396 | | | | 3,289,580 | |
| Non-current assets (or disposal groups) classified as held for sale or as held for distribution to owners | | 13 | | | 291,103 | | | | 337,195 | |
| Total current assets | | | | | 3,745,499 | | | | 3,626,775 | |
| Non-current assets | | | | | | | | | | |
| Other financial assets | | 7 - 11 | | | 88,090 | | | | 102,125 | |
| Other non-financial assets | | 12 | | | 220,807 | | | | 237,344 | |
| Accounts receivable | | 7 - 8 | | | 6,891 | | | | 8,254 | |
| Intangible assets other than goodwill | | 15 | | | 1,617,247 | | | | 1,610,313 | |
| Goodwill | | 16 | | | 2,672,550 | | | | 2,710,382 | |
| Property, plant and equipment | | 17 | | | 10,065,335 | | | | 10,498,149 | |
| Tax assets | | 18 | | | 17,532 | | | | 20,272 | |
| Deferred tax assets | | 18 | | | 364,021 | | | | 384,580 | |
| Total non-current assets | | | | | 15,052,473 | | | | 15,571,419 | |
| Total assets | | | | | 18,797,972 | | | | 19,198,194 | |
| LIABILITIES AND EQUITY | | | | | | | | | | | |
| | | | | As of | | | As of | | | As of | |
| | | | | December 31, | | | December 31, | | | January 1, | |
| LIABILITIES | | Note | | 2019 | | | 2018 | | | 2018 | |
| | | | | ThUS$ | | | ThUS$ | | | ThUS$ | |
| | | | | | | | Restated | | | Restated | |
| Current liabilities | | | | | | | | | | | |
| | | | | | | | | | | | |
| Other financial liabilities | | 7 - 19 | | | 1,885,660 | | | | 1,794,286 | | | | 1,619,979 | |
| Trade and other accounts payables | | 7 - 20 | | | 2,222,874 | | | | 1,674,303 | | | | 1,668,612 | |
| Accounts payable to related entities | | 7 - 9 | | | 56 | | | | 382 | | | | 760 | |
| Other provisions | | 21 | | | 5,206 | | | | 4,794 | | | | 2,783 | |
| Current tax liabilities | | 18 | | | 11,925 | | | | 3,738 | | | | 3,511 | |
| Other non-financial liabilities | | 22 | | | 2,835,221 | | | | 2,454,746 | | | | 2,901,603 | |
Total current liabilities other than non-current liabilities (or disposal groups) classified as held for sale | | | | | 6,960,942 | | | | 5,932,249 | | | | 6,197,248 | |
| Liabilities included in disposal groups classified as held for sale | | 13 | | | - | | | | - | | | | 15,546 | |
| Total current liabilities | | | | | 6,960,942 | | | | 5,932,249 | | | | 6,212,794 | |
| Non-current liabilities | | | | | | | | | | | | | | |
| Other financial liabilities | | 7 - 19 | | | 8,530,418 | | | | 8,359,462 | | | | 9,433,450 | |
| Accounts payable | | 7 - 24 | | | 619,110 | | | | 529,277 | | | | 559,443 | |
| Other provisions | | 21 | | | 286,403 | | | | 303,495 | | | | 374,593 | |
| Deferred tax liabilities | | 18 | | | 616,803 | | | | 786,571 | | | | 877,748 | |
| Employee benefits | | 23 | | | 93,570 | | | | 82,365 | | | | 101,087 | |
| Other non-financial liabilities | | 22 | | | 851,383 | | | | 644,702 | | | | 158,305 | |
| Total non-current liabilities | | | | | 10,997,687 | | | | 10,705,872 | | | | 11,504,626 | |
| Total liabilities | | | | | 17,958,629 | | | | 16,638,121 | | | | 17,717,420 | |
| | | | | | | | | | | | | | | |
| EQUITY | | | | | | | | | | | | | | |
| Share capital | | 25 | | | 3,146,265 | | | | 3,146,265 | | | | 3,146,265 | |
| Retained earnings | | 25 | | | 352,272 | | | | 218,971 | | | | (41,012 | ) |
| Treasury Shares | | 25 | | | (178 | ) | | | (178 | ) | | | (178 | ) |
| Other reserves | | | | | (367,577 | ) | | | (4,365 | ) | | | 760,761 | |
| Parent’s ownership interest | | | | | 3,130,782 | | | | 3,360,693 | | | | 3,865,836 | |
| Non-controlling interest | | 14 | | | (1,605 | ) | | | 79,908 | | | | 90,457 | |
| Total equity | | | | | 3,129,177 | | | | 3,440,601 | | | | 3,956,293 | |
| Total liabilities and equity | | | | | 21,087,806 | | | | 20,078,722 | | | | 21,673,713 | |
The accompanying Notes 1 to 37 form an integral part of these consolidated financial statements.
LATAM AIRLINES GROUP S.A. AND SUBSIDIARIES
CONSOLIDATED STATEMENT OF INCOME BY FUNCTION
| | | | | For the year ended
December 31, | |
| | | Note | | 2019 | | | 2018 | | | 2017 | |
| | | | | ThUS$ | | | ThUS$
Restated | | | ThUS$
Restated | |
| Revenue | | 26 | | | 10,070,063 | | | | 9,895,456 | | | | 9,613,907 | |
| Cost of sales | | | | | (7,951,269 | ) | | | (7,773,432 | ) | | | (7,279,358 | ) |
| Gross margin | | | | | 2,118,794 | | | | 2,122,024 | | | | 2,334,549 | |
| Other income | | 28 | | | 360,864 | | | | 472,758 | | | | 549,889 | |
| Distribution costs | | | | | (580,046 | ) | | | (615,214 | ) | | | (696,784 | ) |
| Administrative expenses | | | | | (735,218 | ) | | | (736,333 | ) | | | (952,768 | ) |
| Other expenses | | | | | (422,792 | ) | | | (356,250 | ) | | | (365,460 | ) |
| Other gains/(losses) | | | | | 11,525 | | | | 53,499 | | | | (7,754 | ) |
| Income from operation activities | | | | | 753,127 | | | | 940,484 | | | | 861,672 | |
| Financial income | | | | | 26,283 | | | | 53,253 | | | | 78,695 | |
| Financial costs | | 27 | | | (589,934 | ) | | | (539,137 | ) | | | (579,233 | ) |
| Foreign exchange gains/(losses) | | 29 | | | (32,571 | ) | | | (38,070 | ) | | | (48,498 | ) |
| Result of indexation units | | | | | (14,989 | ) | | | (865 | ) | | | 748 | |
| Income (loss) before taxes | | | | | 141,916 | | | | 415,665 | | | | 313,384 | |
| Income tax expense / benefit | | 18 | | | 53,697 | | | | (73,879 | ) | | | (158,998 | ) |
| NET INCOME (LOSS) FOR THE YEAR | | | | | 195,613 | | | | 341,786 | | | | 154,386 | |
| Income (loss) attributable to owners of the parent | | | | | 190,430 | | | | 309,811 | | | | 108,896 | |
| Income (loss) attributable to non-controlling interest | | 14 | | | 5,183 | | | | 31,975 | | | | 45,490 | |
| Net income (loss) for the year | | | | | 195,613 | | | | 341,786 | | | | 154,386 | |
| EARNINGS PER SHARE | | | | | | | | | | | | | | |
| Basic earnings (losses) per share (US$) | | 30 | | | 0.31403 | | | | 0.51090 | | | | 0.17958 | |
| Diluted earnings (losses) per share (US$) | | 30 | | | 0.31403 | | | | 0.51090 | | | | 0.17958 | |
The accompanying Notes 1 to 37 form an integral part of these consolidated financial statements.
LATAM AIRLINES GROUP S.A. AND SUBSIDIARIES
CONSOLIDATED STATEMENT OF COMPREHENSIVE INCOME
| | | | | | For the year ended | |
| | | | | | December 31, | |
| | | Note | | | 2019 | | | 2018 | | | 2017 | |
| | | | | | ThUS$ | | | ThUS$ | | | ThUS$ | |
| | | | | | | | | Restated | | | Restated | |
| NET INCOME | | | | | | 195,613 | | | | 341,786 | | | | 154,387 | |
| Components of other comprehensive income that will not be reclassified to income before taxes | | | | | | | | | | | | | | | |
| Other comprehensive income, before taxes, gains by new measurements on defined benefit plans | | 25 | | | | (10,636 | ) | | | (5,819 | ) | | | 2,763 | |
| Total other comprehensive (loss) that will not be reclassified to income before taxes | | | | | | (10,636 | ) | | | (5,819 | ) | | | 2,763 | |
| Components of other comprehensive income that will be reclassified to income before taxes | | | | | | | | | | | | | | | |
| Currency translation differences Gains (losses) on currency translation, before tax | | 29 | | | | (243,271 | ) | | | (743,516 | ) | | | (56,917 | ) |
| Other comprehensive loss, before taxes, currency translation differences | | | | | | (243,271 | ) | | | (743,516 | ) | | | (56,917 | ) |
| Cash flow hedges | | | | | | | | | | | | | | | |
| Gains (losses) on cash flow hedges before taxes | | 19 | | | | 66,856 | | | | (27,797 | ) | | | 18,344 | |
| Other comprehensive income (losses), before taxes, cash flow hedges | | | | | | 66,856 | | | | (27,797 | ) | | | 18,344 | |
| Total other comprehensive (loss) that will be reclassified to income before taxes | | | | | | (176,415 | ) | | | (771,313 | ) | | | (38,573 | ) |
| Other components of other comprehensive income (loss), before taxes | | | | | | (187,051 | ) | | | (777,132 | ) | | | (35,810 | ) |
| Income tax relating to other comprehensive income that will not be reclassified to income | | | | | | | | | | | | | | | |
| Income tax relating to new measurements on defined benefit plans | | 18 | | | | 2,873 | | | | 1,566 | | | | (785 | ) |
| Accumulate income tax relating to other comprehensive income (loss) that will not be reclassified to income | | | | | | 2,873 | | | �� | 1,566 | | | | (785 | ) |
| Income tax relating to other comprehensive income (loss) that will be reclassified to income | | | | | | | | | | | | | | | |
| Income tax related to cash flow hedges in other comprehensive income (loss) | | | | | | 414 | | | | (269 | ) | | | (1,770 | ) |
| Income taxes related to components of other comprehensive loss will be reclassified to income | | | | | | 414 | | | | (269 | ) | | | (1,770 | ) |
| Total Other comprehensive (loss) | | | | | | (183,764 | ) | | | (775,835 | ) | | | (38,365 | ) |
| Total comprehensive income (loss) | | | | | | 11,849 | | | | (434,049 | ) | | | 116,022 | |
| Comprehensive income (loss) attributable to owners of the parent | | | | | | 15,250 | | | | (452,844 | ) | | | 73,046 | |
| Comprehensive income (loss) attributable to non-controlling interests | | | | | | (3,401 | ) | | | 18,795 | | | | 42,976 | |
| TOTAL COMPREHENSIVE INCOME (LOSS) | | | | | | 11,849 | | | | (434,049 | ) | | | 116,022 | |
The accompanying Notes 1 to 37 form an integral part of these consolidated financial statements.
LATAM AIRLINES GROUP S.A. AND SUBSIDIARIES
CONSOLIDATED STATEMENT OF CHANGES IN EQUITY
| | | | | Attributable to owners of the parent | | | | | | | |
| | | | | | | | | | | Change in other reserves | | | | | | | | | | | | | |
| | | | | | | | | | | | | | | | | Actuarial gains | | | | | | | | | | | | | | | | | | | | | | |
| | | | | | | | | | | | | | | | | or losses on | | | | | | | | | | | | | | | | | | | | | | |
| | | | | | | | | | | Currency | | | Cash flow | | | defined benefit | | | Shares based | | | Other | | | Total | | | | | | Parent’s | | | Non- | | | | |
| | | | | Share | | | Treasury | | | translation | | | hedging | | | plans | | | payments | | | sundry | | | other | | | Retained | | | ownership | | | controlling | | | Total | |
| | | Note | | capital | | | shares | | | reserve | | | reserve | | | reserve | | | reserve | | | reserve | | | reserve | | | earnings | | | interest | | | interest | | | equity | |
| | | | | ThUS$ | | | ThUS$ | | | ThUS$ | | | ThUS$ | | | ThUS$ | | | ThUS$ | | | ThUS$ | | | ThUS$ | | | ThUS$ | | | ThUS$ | | | ThUS$ | | | ThUS$ | |
| Equity as of January 1, 2019 | | | | | | | | | | | | | | | | | | | | | | | | | | | | | | | | | | | | | | |
| Restated | | | | | 3,146,265 | | | | (178 | ) | | | (2,656,644 | ) | | | (9,333 | ) | | | (15,178 | ) | | | 37,874 | | | | 2,638,916 | | | | (4,365 | ) | | | 218,971 | | | | 3,360,693 | | | | 79,908 | | | | 3,440,601 | |
| Total increase (decrease) in equity | | | | | | | | | | | | | | | | | | | | | | | | | | | | | | | | | | | | | | | | | | | | | | | | | | |
| Net income for the year | | 25 | | | - | | | | - | | | | - | | | | - | | | | - | | | | - | | | | - | | | | - | | | | 190,430 | | | | 190,430 | | | | 5,183 | | | | 195,613 | |
| Other comprehensive income | | | | | - | | | | - | | | | (233,643 | ) | | | 66,225 | | | | (7,762 | ) | | | - | | | | | | | | (175,180 | ) | | | - | | | | (175,180 | ) | | | (8,584 | ) | | | (183,764 | ) |
| Total comprehensive income | | | | | - | | | | - | | | | (233,643 | ) | | | 66,225 | | | | (7,762 | ) | | | - | | | | - | | | | (175,180 | ) | | | 190,430 | | | | 15,250 | | | | (3,401 | ) | | | 11,849 | |
| Transactions with shareholders | | | | | | | | | | | | | | | | | | | | | | | | | | | | | | | | | | | | | | | | | | | | | | | | | | |
| Dividends | | 25 | | | - | | | | - | | | | - | | | | - | | | | - | | | | - | | | | - | | | | - | | | | (57,129 | ) | | | (57,129 | ) | | | - | | | | (57,129 | ) |
| Increase (decrease) through transfers and other changes, equity | | 25-34 | | | - | | | | - | | | | - | | | | - | | | | - | | | | (1,585 | ) | | | (186,447 | ) | | | (188,032 | ) | | | - | | | | (188,032 | ) | | | (78,112 | ) | | | (266,144 | ) |
| Total transactions with shareholders | | | | | - | | | | - | | | | - | | | | - | | | | - | | | | (1,585 | ) | | | (186,447 | ) | | | (188,032 | ) | | | (57,129 | ) | | | (245,161 | ) | | | (78,112 | ) | | | (323,273 | ) |
| Closing balance as of December 31, 2019 | | | | | 3,146,265 | | | | (178 | ) | | | (2,890,287 | ) | | | 56,892 | | | | (22,940 | ) | | | 36,289 | | | | 2,452,469 | | | | (367,577 | ) | | | 352,272 | | | | 3,130,782 | | | | (1,605 | ) | | | 3,129,177 | |
The accompanying Notes 1 to 37 form an integral part of these consolidated financial statements.
LATAM AIRLINES GROUP S.A. AND SUBSIDIARIES
CONSOLIDATED STATEMENT OF FINANCIAL POSITIONCHANGES IN EQUITY
LIABILITIES AND EQUITY
| | | | | As of | | | As of | |
| | | | | December 31, | | | December 31, | |
| | | Note | | 2017 | | | 2016 | |
| | | | | ThUS$ | | | ThUS$ | |
| LIABILITIES | | | | | | | | | | |
| Current liabilities | | | | | | | | | | |
| Other financial liabilities | | 7 - 19 | | | 1,300,949 | | | | 1,839,528 | |
| Trade and other accounts payables | | 7 - 20 | | | 1,695,202 | | | | 1,593,068 | |
| Accounts payable to related entities | | 7 - 9 | | | 760 | | | | 269 | |
| Other provisions | | 21 | | | 2,783 | | | | 2,643 | |
| Tax liabilities | | 18 | | | 3,511 | | | | 14,286 | |
| Other non-financial liabilities | | 22 | | | 2,823,963 | | | | 2,762,245 | |
| | | | | | 5,827,168 | | | | 6,212,039 | |
| Liabilities included in disposal groups classified as held for sale | | 13 | | | 15,546 | | | | 10,152 | |
| Total current liabilities | | | | | 5,842,714 | | | | 6,222,191 | |
| Non-current liabilities | | | | | | | | | | |
| Other financial liabilities | | 7 - 19 | | | 6,605,508 | | | | 6,796,952 | |
| Accounts payable | | 7 - 24 | | | 498,832 | | | | 359,391 | |
| Other provisions | | 21 | | | 374,593 | | | | 422,494 | |
| Deferred tax liabilities | | 18 | | | 949,697 | | | | 915,759 | |
| Employee benefits | | 23 | | | 101,087 | | | | 82,322 | |
| Other non-financial liabilities | | 22 | | | 158,305 | | | | 213,781 | |
| Total non-current liabilities | | | | | 8,688,022 | | | | 8,790,699 | |
| Total liabilities | | | | | 14,530,736 | | | | 15,012,890 | |
| EQUITY | | | | | | | | | | |
| Share capital | | 25 | | | 3,146,265 | | | | 3,149,564 | |
| Retained earnings | | 25 | | | 475,118 | | | | 366,404 | |
| Treasury Shares | | 25 | | | (178 | ) | | | (178 | ) |
| Other reserves | | | | | 554,884 | | | | 580,870 | |
| Parent's ownership interest | | | | | 4,176,089 | | | | 4,096,660 | |
| Non-controlling interest | | 14 | | | 91,147 | | | | 88,644 | |
| Total equity | | | | | 4,267,236 | | | | 4,185,304 | |
| Total liabilities and equity | | | | | 18,797,972 | | | | 19,198,194 | |
| | | | | Attributable to owners of the parent | | | | | | | |
| | | | | | | | | | | Change in other reserves | | | | | | | | | | | | | |
| | | | | | | | | | | | | | | | | Actuarial gains | | | | | | | | | | | | | | | | | | | | | | |
| | | | | | | | | | | | | | | | | or losses on | | | | | | | | | | | | | | | | | | | | | | |
| | | | | | | | | | | Currency | | | Cash flow | | | defined benefit | | | Shares based | | | Other | | | Total | | | | | | Parent’s | | | Non- | | | | |
| | | | | Share | | | Treasury | | | translation | | | hedging | | | plans | | | payments | | | sundry | | | other | | | Retained | | | ownership | | | controlling | | | Total | |
| | | Note | | capital | | | shares | | | reserve | | | reserve | | | reserve | | | reserve | | | reserve | | | reserve | | | earnings | | | interest | | | interest | | | equity | |
| | | | | ThUS$ | | | ThUS$ | | | ThUS$ | | | ThUS$ | | | ThUS$ | | | ThUS$ | | | ThUS$ | | | ThUS$ | | | ThUS$ | | | ThUS$ | | | ThUS$ | | | ThUS$ | |
| Equity as of January 1, 2018 | | | | | 3,146,265 | | | | (178 | ) | | | (1,925,714 | ) | | | 18,140 | | | | (10,926 | ) | | | 39,481 | | | | 2,639,780 | | | | 760,761 | | | | (31,464 | ) | | | 3,875,384 | | | | 90,457 | | | | 3,965,841 | |
| Increase (decrease) by application of new accounting standards | | 2 - 25 | | | - | | | | - | | | | - | | | | - | | | | - | | | | - | | | | - | | | | - | | | | (9,548 | ) | | | (9,548 | ) | | | - | | | | (9,548 | ) |
| Initial balance Restated | | | | | 3,146,265 | | | | (178 | ) | | | (1,925,714 | ) | | | 18,140 | | | | (10,926 | ) | | | 39,481 | | | | 2,639,780 | | | | 760,761 | | | | (41,012 | ) | | | 3,865,836 | | | | 90,457 | | | | 3,956,293 | |
| Total increase (decrease) in equity | | | | | | | | | | | | | | | | | | | | | | | | | | | | | | | | | | | | | | | | | | | | | | | | | | |
| Net income for the year | | 25 | | | - | | | | - | | | | - | | | | - | | | | - | | | | - | | | | - | | | | - | | | | 309,811 | | | | 309,811 | | | | 31,975 | | | | 341,786 | |
| Other comprehensive loss | | | | | - | | | | - | | | | (730,930 | ) | | | (27,473 | ) | | | (4,252 | ) | | | - | | | | - | | | | (762,655 | ) | | | - | | | | (762,655 | ) | | | (13,180 | ) | | | (775,835 | ) |
| Total comprehensive income | | | | | - | | | | - | | | | (730,930 | ) | | | (27,473 | ) | | | (4,252 | ) | | | - | | | | - | | | | (762,655 | ) | | | 309,811 | | | | (452,844 | ) | | | 18,795 | | | | (434,049 | ) |
| Transactions with shareholders | | | | | | | | | | | | | | | | | | | | | | | | | | | | | | | | | | | | | | | | | | | | | | | | | | |
| Dividends | | 25 | | | - | | | | - | | | | - | | | | - | | | | - | | | | - | | | | - | | | | - | | | | (54,580 | ) | | | (54,580 | ) | | | - | | | | (54,580 | ) |
| Increase (decrease) through transfers and other changes, equity | | 25-34 | | | - | | | | - | | | | - | | | | - | | | | - | | | | (1,607 | ) | | | (864 | ) | | | (2,471 | ) | | | 4,752 | | | | 2,281 | | | | (29,344 | ) | | | (27,063 | ) |
| Total transactions with shareholders | | | | | - | | | | - | | | | - | | | | - | | | | - | | | | (1,607 | ) | | | (864 | ) | | | (2,471 | ) | | | (49,828 | ) | | | (52,299 | ) | | | (29,344 | ) | | | (81,643 | ) |
| | | | | | | | | | | | | | | | | | | | | | | | | | | | | | | | | | | | | | | | | | | | | | | | | | |
| Closing balance as of December 31, 2018 Restated | | | | | 3,146,265 | | | | (178 | ) | | | (2,656,644 | ) | | | (9,333 | ) | | | (15,178 | ) | | | 37,874 | | | | 2,638,916 | | | | (4,365 | ) | | | 218,971 | | | | 3,360,693 | | | | 79,908 | | | | 3,440,601 | |
The accompanying Notes 1 to 37 form an integral part of these consolidated financial statements.
LATAM AIRLINES GROUP S.A. AND SUBSIDIARIES
CONSOLIDATED STATEMENT OF INCOME BY FUNCTIONCHANGES IN EQUITY
| | | | | For the period ended | |
| | | | | December 31, | |
| | | Note | | 2017 | | | 2016 | | | 2015 | |
| | | | | ThUS$ | | | ThUS$ | | | ThUS$ | |
| Revenue | | 26 | | | 9,613,907 | | | | 8,988,340 | | | | 9,740,045 | |
| Cost of sales | | | | | (7,441,849 | ) | | | (6,967,037 | ) | | | (7,636,709 | ) |
| Gross margin | | | | | 2,172,058 | | | | 2,021,303 | | | | 2,103,336 | |
| Other income | | 28 | | | 549,889 | | | | 538,748 | | | | 385,781 | |
| Distribution costs | | | | | (699,600 | ) | | | (747,426 | ) | | | (783,304 | ) |
| Administrative expenses | | | | | (938,931 | ) | | | (872,954 | ) | | | (878,006 | ) |
| Other expenses | | | | | (368,883 | ) | | | (373,738 | ) | | | (323,987 | ) |
| Other gains/(losses) | | | | | (7,754 | ) | | | (72,634 | ) | | | (55,280 | ) |
| Income from operation activities | | | | | 706,779 | | | | 493,299 | | | | 448,540 | |
| Financial income | | | | | 78,695 | | | | 74,949 | | | | 75,080 | |
| Financial costs | | 27 | | | (393,286 | ) | | | (416,336 | ) | | | (413,357 | ) |
| Share of profit of investments accounted for using the equity method | | | | | - | | | | - | | | | 37 | |
| Foreign exchange gains/(losses) | | 29 | | | (18,718 | ) | | | 121,651 | | | | (467,896 | ) |
| Result of indexation units | | | | | 748 | | | | 311 | | | | 481 | |
| Income (loss) before taxes | | | | | 374,218 | | | | 273,874 | | | | (357,115 | ) |
| Income (loss) tax expense / benefit | | 18 | | | (173,504 | ) | | | (163,204 | ) | | | 178,383 | |
| NET INCOME (LOSS) FOR THE PERIOD | | | | | 200,714 | | | | 110,670 | | | | (178,732 | ) |
| Income (loss) attributable to owners of the parent | | | | | 155,304 | | | | 69,220 | | | | (219,274 | ) |
| Income (loss) attributable to non-controlling interest | | 14 | | | 45,410 | | | | 41,450 | | | | 40,542 | |
| Net income (loss) for the year | | | | | 200,714 | | | | 110,670 | | | | (178,732 | ) |
| EARNINGS PER SHARE | | | | | | | | | | | | | | |
| Basic earnings (losses) per share (US$) | | 30 | | | 0.25610 | | | | 0.12665 | | | | (0.40193 | ) |
| Diluted earnings (losses) per share (US$) | | 30 | | | 0.25610 | | | | 0.12665 | | | | (0.40193 | ) |
| | | | | Attributable to owners of the parent | | | | | | | |
| | | | | | | | | | | Change in other reserves | | | | | | | | | | | | | |
| | | Note | | Share
capital | | | Treasury
shares | | | Currency
translation
reserve | | | Cash flow
hedging
reserve | | | Actuarial gains
or losses on
defined benefit
plans
reserve | | | Shares based
payments
reserve | | | Other
sundry
reserve | | | Total
other
reserve | | | Retained
earnings | | | Parent’s
ownership
interest | | | Non-
controlling
interest | | | Total
equity | |
| | | | | ThUS$ | | | ThUS$ | | | ThUS$ | | | ThUS$ | | | ThUS$ | | | ThUS$ | | | ThUS$ | | | ThUS$ | | | ThUS$ | | | ThUS$ | | | ThUS$ | | | ThUS$ | |
| Equity as of January 1, 2017 | | | | | 3,149,564 | | | | (178 | ) | | | (2,086,555 | ) | | | 1,506 | | | | (12,900 | ) | | | 38,538 | | | | 2,640,281 | | | | 580,870 | | | | 366,404 | | | | 4,096,660 | | | | 88,644 | | | | 4,185,304 | |
| Increase (decrease) by application of new accounting standards | | 2 - 25 | | | - | | | | - | | | | 215,299 | | | | - | | | | - | | | | - | | | | - | | | | 215,299 | | | | (460,173 | ) | | | (244,874 | ) | | | (771 | ) | | | (245,645 | ) |
| Initial balance Restated | | | | | 3,149,564 | | | | (178 | ) | | | (1,871,256 | ) | | | 1,506 | | | | (12,900 | ) | | | 38,538 | | | | 2,640,281 | | | | 796,169 | | | | (93,769 | ) | | | 3,851,786 | | | | 87,873 | | | | 3,939,659 | |
| Total increase (decrease) in equity | | | | | | | | | | | | | | | | | | | | | | | | | | | | | | | | | | | | | | | | | | | | | | | | | | |
| Net income for the year | | 25 | | | - | | | | - | | | | - | | | | - | | | | - | | | | - | | | | - | | | | - | | | | 108,896 | | | | 108,896 | | | | 45,491 | | | | 154,387 | |
| Other comprehensive income | | | | | - | | | | - | | | | (54,458 | ) | | | 16,634 | | | | 1,974 | | | | - | | | | - | | | | (35,850 | ) | | | - | | | | (35,850 | ) | | | (2,515 | ) | | | (38,365 | ) |
| Total comprehensive income | | | | | - | | | | - | | | | (54,458 | ) | | | 16,634 | | | | 1,974 | | | | - | | | | - | | | | (35,850 | ) | | | 108,896 | | | | 73,046 | | | | 42,976 | | | | 116,022 | |
| Transactions with shareholders | | | | | | | | | | | | | | | | | | | | | | | | | | | | | | | | | | | | | | | | | | | | | | | | | | |
| Dividends | | 25 | | | - | | | | - | | | | - | | | | - | | | | - | | | | - | | | | - | | | | - | | | | (46,591 | ) | | | (46,591 | ) | | | - | | | | (46,591 | ) |
| Increase (decrease) through transfers and other changes, equity | | 25-34 | | | (3,299 | ) | | | - | | | | - | | | | - | | | | - | | | | 943 | | | | (501 | ) | | | 442 | | | | - | | | | (2,857 | ) | | | (40,392 | ) | | | (43,249 | ) |
| Total transactions with shareholders | | | | | (3,299 | ) | | | - | | | | - | | | | - | | | | - | | | | 943 | | | | (501 | ) | | | 442 | | | | (46,591 | ) | | | (49,448 | ) | | | (40,392 | ) | | | (89,840 | ) |
| Closing balance as of December 31, 2017 Restated | | | | | 3,146,265 | | | | (178 | ) | | | (1,925,714 | ) | | | 18,140 | | | | (10,926 | ) | | | 39,481 | | | | 2,639,780 | | | | 760,761 | | | | (31,464 | ) | | | 3,875,384 | | | | 90,457 | | | | 3,965,841 | |
The accompanying Notes 1 to 37 form an integral part of these consolidated financial statements.
LATAM AIRLINES GROUP S.A. AND SUBSIDIARIES
CONSOLIDATED STATEMENT OF COMPREHENSIVE INCOMECASH FLOWS DIRECT – METHOD
| | | | | For the period ended | |
| | | | | December 31, | |
| | | Note | | 2017 | | | 2016 | | | 2015 | |
| | | | | ThUS$ | | | ThUS$ | | | ThUS$ | |
| NET INCOME (LOSS) | | | | | 200,714 | | | | 110,670 | | | | (178,732 | ) |
| Components of other comprehensive income that will not be reclassified to income before taxes | | | | | | | | | | | | | | |
| Other comprehensive income, before taxes, gains (losses) by new measurements on defined benefit plans | | 25 | | | 2,763 | | | | (3,105 | ) | | | (14,631 | ) |
| Total other comprehensive income that will not be reclassified to income before taxes | | | | | 2,763 | | | | (3,105 | ) | | | (14,631 | ) |
| Components of other comprehensive income that will be reclassified to income before taxes | | | | | | | | | | | | | | |
| Currency translation differences | | | | | | | | | | | | | | |
| Gains (losses) on currency translation, before tax | | 29 | | | (47,495 | ) | | | 494,362 | | | | (1,409,439 | ) |
| Other comprehensive income, before taxes, currency translation differences | | | | | (47,495 | ) | | | 494,362 | | | | (1,409,439 | ) |
| Cash flow hedges | | | | | | | | | | | | | | |
| Gains (losses) on cash flow hedges before taxes | | 19 | | | 18,344 | | | | 127,390 | | | | 80,387 | |
| Other comprehensive income (losses), before taxes, cash flow hedges | | | | | 18,344 | | | | 127,390 | | | | 80,387 | |
| Total other comprehensive income that will be reclassified to income before taxes | | | | | (29,151 | ) | | | 621,752 | | | | (1,329,052 | ) |
| Other components of other comprehensive income (loss), before taxes | | | | | (26,388 | ) | | | 618,647 | | | | (1,343,683 | ) |
| Income tax relating to other comprehensive income that will not be reclassified to income | | | | | | | | | | | | | | |
| Income tax relating to new measurements on defined benefit plans | | 18 | | | (785 | ) | | | 921 | | | | 3,911 | |
| Accumulate income tax relating to other comprehensive income that will not be reclassified to income | | | | | (785 | ) | | | 921 | | | | 3,911 | |
| Income tax relating to other comprehensive income that will be reclassified to income | | | | | | | | | | | | | | |
| Income tax related to cash flow hedges in other comprehensive income | | | | | (1,770 | ) | | | (34,695 | ) | | | (21,103 | ) |
| Income taxes related to components of other comprehensive income that will be reclassified to income | | | | | (1,770 | ) | | | (34,695 | ) | | | (21,103 | ) |
| Total Other comprehensive income | | | | | (28,943 | ) | | | 584,873 | | | | (1,360,875 | ) |
| Total comprehensive income (loss) | | | | | 171,771 | | | | 695,543 | | | | (1,539,607 | ) |
| Comprehensive income (loss) attributable to owners of the parent | | | | | 128,876 | | | | 648,539 | | | | (1,551,331 | ) |
| Comprehensive income (loss) attributable to non-controlling interests | | | | | 42,895 | | | | 47,004 | | | | 11,724 | |
| TOTAL COMPREHENSIVE INCOME (LOSS) | | | | | 171,771 | | | | 695,543 | | | | (1,539,607 | ) |
| | | | | For the year ended December 31, | |
| | | Note | | 2019 | | | 2018 | | | 2017 | |
| | | | | ThUS$ | | | ThUS$ | | | ThUS$ | |
| | | | | | | | Restated | | | Restated | |
| Cash flows from operating activities | | | | | | | | | | | |
| Cash collection from operating activities | | | | | | | | | | | |
| Proceeds from sales of goods and services | | | | | 11,079,333 | | | | 10,787,804 | | | | 10,595,718 | |
| Other cash receipts from operating activities | | | | | 127,683 | | | | 95,099 | | | | 73,668 | |
| Payments for operating activities | | | | | | | | | | | | | | |
| Payments to suppliers for goods and services | | | | | (6,663,875 | ) | | | (6,775,003 | ) | | | (6,202,631 | ) |
| Payments to and on behalf of employees | | | | | (1,644,806 | ) | | | (1,789,022 | ) | | | (1,955,310 | ) |
| Other payments for operating activities | | | | | (267,643 | ) | | | (255,988 | ) | | | (223,706 | ) |
| Income taxes (paid) | | | | | (45,311 | ) | | | (29,186 | ) | | | (91,986 | ) |
| Other cash inflows (outflows) | | 35 | | | 241,286 | | | | 39,612 | | | | (8,931 | ) |
| Net cash flows from operating activities | | | | | 2,826,667 | | | | 2,073,316 | | | | 2,186,823 | |
| Cash flows from investing activities | | | | | | | | | | | | | | |
| Cash flows from losses of control of subsidiaries or other businesses | | | | | - | | | | 69,724 | | | | 6,503 | |
| Other cash receipts from sales of equity or debt instruments of other entities | | | | | 4,063,582 | | | | 3,640,208 | | | | 3,248,693 | |
| Other payments to acquire equity or debt instruments of other entities | | | | | (4,131,890 | ) | | | (3,542,839 | ) | | | (3,106,411 | ) |
| Amounts raised from sale of property, plant and equipment | | | | | 50,322 | | | | 223,753 | | | | 51,316 | |
| Purchases of property, plant and equipment | | | | | (1,276,621 | ) | | | (660,707 | ) | | | (403,666 | ) |
| Purchases of intangible assets | | | | | (140,173 | ) | | | (96,206 | ) | | | (87,318 | ) |
| Interest received | | | | | 17,822 | | | | 10,175 | | | | 12,684 | |
| Other cash inflows (outflows) | | 35 | | | (2,249 | ) | | | (2,476 | ) | | | (9,223 | ) |
| Net cash flow (used in) investing activities | | | | | (1,419,207 | ) | | | (358,368 | ) | | | (287,422 | ) |
| Cash flows from financing activities | | 35 | | | | | | | | | | | | |
| Payments for changes in ownership interests in subsidiaries that do not result in loss of control | | | | | (294,105 | ) | | | (2 | ) | | | - | |
| Amounts raised from long-term loans | | | | | 1,781,728 | | | | 779,062 | | | | 1,305,384 | |
| Amounts raised from short-term loans | | | | | 93,000 | | | | 293,000 | | | | 132,280 | |
| Loans repayments | | | | | (1,860,455 | ) | | | (1,738,348 | ) | | | (2,174,092 | ) |
| Payments of lease liabilities | | | | | (398,992 | ) | | | (373,439 | ) | | | (338,179 | ) |
| Dividends paid | | | | | (55,116 | ) | | | (72,620 | ) | | | (66,642 | ) |
| Interest paid | | | | | (550,877 | ) | | | (540,303 | ) | | | (571,627 | ) |
| Other cash inflows (outflows) | | | | | (58,704 | ) | | | 44,053 | | | | 13,706 | |
| Net cash flows (used in) financing activities | | | | | (1,343,521 | ) | | | (1,608,597 | ) | | | (1,699,171 | ) |
| Net increase in cash and cash equivalents before effect of exchanges rate change | | | | | 63,939 | | | | 106,351 | | | | 200,230 | |
| Effects of variation in the exchange rate on cash and cash equivalents | | | | | (73,002 | ) | | | (166,713 | ) | | | (7,553 | ) |
| Net increase (decrease) in cash and cash equivalents | | | | | (9,063 | ) | | | (60,362 | ) | | | 192,677 | |
| CASH AND CASH EQUIVALENTS AT THE BEGINNING OF YEAR | | 6 | | | 1,081,642 | | | | 1,142,004 | | | | 949,327 | |
| CASH AND CASH EQUIVALENTS AT THE END OF YEAR | | 6 | | | 1,072,579 | | | | 1,081,642 | | | | 1,142,004 | |
The accompanying Notes 1 to 37 form an integral part of these consolidated financial statements.
LATAM AIRLINES GROUP S.A. AND SUBSIDIARIES
CONSOLIDATED STATEMENT OF CHANGES IN EQUITY
| | | | | Attributable to owners of the parent | | | | | | | |
| | | | | | | | | | | Change in other reserves | | | | | | | | | | | | | |
| | | | | | | | | | | | | | | | | Actuarial gains or | | | | | | | | | | | | | | | | | | | | | | |
| | | | | | | | | | | Currency | | | Cash flow | | | losses on defined | | | Shares based | | | Other | | | Total | | | | | | Parent's | | | Non- | | | | |
| | | | | Share | | | Treasury | | | translation | | | hedging | | | benefit plans | | | payments | | | sundry | | | other | | | Retained | | | ownership | | | controlling | | | Total | |
| | | Note | | capital | | | shares | | | reserve | | | reserve | | | reserve | | | reserve | | | reserve | | | reserve | | | earnings | | | interest | | | interest | | | equity | |
| | | | | ThUS$ | | | ThUS$ | | | ThUS$ | | | ThUS$ | | | ThUS$ | | | ThUS$ | | | ThUS$ | | | ThUS$ | | | ThUS$ | | | ThUS$ | | | ThUS$ | | | ThUS$ | |
| Equity as of January 1, 2017 | | | | | 3,149,564 | | | | (178 | ) | | | (2,086,555 | ) | | | 1,506 | | | | (12,900 | ) | | | 38,538 | | | | 2,640,281 | | | | 580,870 | | | | 366,404 | | | | 4,096,660 | | | | 88,644 | | | | 4,185,304 | |
| Total increase (decrease) in equity | | | | | | | | | | | | | | | | | | | | | | | | | | | | | | | | | | | | | | | | | | | | | | | | | | |
| Comprehensive income | | | | | | | | | | | | | | | | | | | | | | | | | | | | | | | | | | | | | | | | | | | | | | | | | | |
| Gain (losses) | | 25 | | | - | | | | - | | | | - | | | | - | | | | - | | | | - | | | | - | | | | - | | | | 155,304 | | | | 155,304 | | | | 45,410 | | | | 200,714 | |
| Other comprehensive income | | | | | - | | | | - | | | | (45,036 | ) | | | 16,634 | | | | 1,974 | | | | - | | | | | | | | (26,428 | ) | | | - | | | | (26,428 | ) | | | (2,515 | ) | | | (28,943 | ) |
| Total comprehensive income | | | | | - | | | | - | | | | (45,036 | ) | | | 16,634 | | | | 1,974 | | | | - | | | | - | | | | (26,428 | ) | | | 155,304 | | | | 128,876 | | | | 42,895 | | | | 171,771 | |
| Transactions with shareholders | | | | | | | | | | | | | | | | | | | | | | | | | | | | | | | | | | | | | | | | | | | | | | | | | | |
| Dividens | | 25 | | | - | | | | - | | | | - | | | | - | | | | - | | | | - | | | | - | | | | - | | | | (46,590 | ) | | | (46,590 | ) | | | - | | | | (46,590 | ) |
| Increase (decrease) through transfers and other changes, equity | | 25-34 | | | (3,299 | ) | | | - | | | | - | | | | - | | | | - | | | | 943 | | | | (501 | ) | | | 442 | | | | - | | | | (2,857 | ) | | | (40,392 | ) | | | (43,249 | ) |
| Total transactions with shareholders | | | | | (3,299 | ) | | | - | | | | - | | | | - | | | | - | | | | 943 | | | | (501 | ) | | | 442 | | | | (46,590 | ) | | | (49,447 | ) | | | (40,392 | ) | | | (89,839 | ) |
| Closing balance as of December 31, 2017 | | | | | 3,146,265 | | | | (178 | ) | | | (2,131,591 | ) | | | 18,140 | | | | (10,926 | ) | | | 39,481 | | | | 2,639,780 | | | | 554,884 | | | | 475,118 | | | | 4,176,089 | | | | 91,147 | | | | 4,267,236 | |
The accompanying Notes 1 to 37 form an integral part of these consolidated financial statements.
LATAM AIRLINES GROUP S.A. AND SUBSIDIARIES
CONSOLIDATED STATEMENT OF CHANGES IN EQUITY
| | | | | Attributable to owners of the parent | | | | | | | |
| | | | | | | | | | | Change in other reserves | | | | | | | | | | | | | |
| | | | | | | | | | | | | | | | | Actuarial gains or | | | | | | | | | | | | | | | | | | | | | | |
| | | | | | | | | | | Currency | | | Cash flow | | | losses on defined | | | Shares based | | | Other | | | Total | | | | | | Parent's | | | Non- | | | | |
| | | | | Share | | | Treasury | | | translation | | | hedging | | | benefit plans | | | payments | | | sundry | | | other | | | Retained | | | ownership | | | controlling | | | Total | |
| | | Note | | capital | | | shares | | | reserve | | | reserve | | | reserve | | | reserve | | | reserve | | | reserve | | | earnings | | | interest | | | interest | | | equity | |
| | | | | ThUS$ | | | ThUS$ | | | ThUS$ | | | ThUS$ | | | ThUS$ | | | ThUS$ | | | ThUS$ | | | ThUS$ | | | ThUS$ | | | ThUS$ | | | ThUS$ | | | ThUS$ | |
| Equity as of January 1, 2016 | | | | | 2,545,705 | | | | (178 | ) | | | (2,576,041 | ) | | | (90,510 | ) | | | (10,717 | ) | | | 35,647 | | | | 2,634,679 | | | | (6,942 | ) | | | 317,950 | | | | 2,856,535 | | | | 81,013 | | | | 2,937,548 | |
| Total increase (decrease) in equity | | | | | | | | | | | | | | | | | | | | | | | | | | | | | | | | | | | | | | | | | | | | | | | | | | |
| Comprehensive income | | | | | | | | | | | | | | | | | | | | | | | | | | | | | | | | | | | | | | | | | | | | | | | | | | |
| Gain (losses) | | 25 | | | - | | | | - | | | | - | | | | - | | | | - | | | | - | | | | - | | | | - | | | | 69,220 | | | | 69,220 | | | | 41,450 | | | | 110,670 | |
| Other comprehensive income | | | | | - | | | | - | | | | 489,486 | | | | 92,016 | | | | (2,183 | ) | | | - | | | | | | | | 579,319 | | | | - | | | | 579,319 | | | | 5,554 | | | | 584,873 | |
| Total comprehensive income | | | | | - | | | | - | | | | 489,486 | | | | 92,016 | | | | (2,183 | ) | | | - | | | | - | | | | 579,319 | | | | 69,220 | | | | 648,539 | | | | 47,004 | | | | 695,543 | |
| Transactions with shareholders | | | | | | | | | | | | | | | | | | | | | | | | | | | | | | | | | | | | | | | | | | | | | | | | | | |
| Equity issue | | 25-34 | | | 608,496 | | | | - | | | | - | | | | - | | | | - | | | | - | | | | - | | | | - | | | | - | | | | 608,496 | | | | - | | | | 608,496 | |
| Dividens | | 25 | | | - | | | | - | | | | - | | | | - | | | | - | | | | - | | | | - | | | | - | | | | (20,766 | ) | | | (20,766 | ) | | | - | | | | (20,766 | ) |
| Increase (decrease) through transfers and other changes, equity | | 25-34 | | | (4,637 | ) | | | - | | | | - | | | | - | | | | - | | | | 2,891 | | | | 5,602 | | | | 8,493 | | | | - | | | | 3,856 | | | | (39,373 | ) | | | (35,517 | ) |
| Total transactions with shareholders | | | | | 603,859 | | | | - | | | | - | | | | - | | | | - | | | | 2,891 | | | | 5,602 | | | | 8,493 | | | | (20,766 | ) | | | 591,586 | | | | (39,373 | ) | | | 552,213 | |
| Closing balance as of December 31, 2016 | | | | | 3,149,564 | | | | (178 | ) | | | (2,086,555 | ) | | | 1,506 | | | | (12,900 | ) | | | 38,538 | | | | 2,640,281 | | | | 580,870 | | | | 366,404 | | | | 4,096,660 | | | | 88,644 | | | | 4,185,304 | |
The accompanying Notes 1 to 37 form an integral part of these consolidated financial statements.
LATAM AIRLINES GROUP S.A. AND SUBSIDIARIES
CONSOLIDATED STATEMENT OF CHANGES IN EQUITY
| | | | | Attributable to owners of the parent | | | | | | | |
| | | | | | | | | | | Change in other reserves | | | | | | | | | | | | | |
| | | | | | | | | | | | | | | | | Actuarial gains or | | | | | | | | | | | | | | | | | | | | | | |
| | | | | | | | | | | Currency | | | Cash flow | | | losses on defined | | | Shares based | | | Other | | | Total | | | | | | Parent's | | | Non- | | | | |
| | | | | Share | | | Treasury | | | translation | | | hedging | | | benefit plans | | | payments | | | sundry | | | other | | | Retained | | | ownership | | | controlling | | | Total | |
| | | Note | | capital | | | shares | | | reserve | | | reserve | | | reserve | | | reserve | | | reserve | | | reserve | | | earnings | | | interest | | | interest | | | equity | |
| | | | | ThUS$ | | | ThUS$ | | | ThUS$ | | | ThUS$ | | | ThUS$ | | | ThUS$ | | | ThUS$ | | | ThUS$ | | | ThUS$ | | | ThUS$ | | | ThUS$ | | | ThUS$ | |
| Equity as of January 1, 2015 | | | | | 2,545,705 | | | | (178 | ) | | | (1,193,871 | ) | | | (151,340 | ) | | | - | | | | 29,642 | | | | 2,635,748 | | | | 1,320,179 | | | | 536,190 | | | | 4,401,896 | | | | 101,799 | | | | 4,503,695 | |
| Total increase (decrease) in equity | | | | | | | | | | | | | | | | | | | | | | | | | | | | | | | | | | | | | | | | | | | | | | | | | | |
| Comprehensive income | | | | | | | | | | | | | | | | | | | | | | | | | | | | | | | | | | | | | | | | | | | | | | | | | | |
| Gain (losses) | | 25 | | | - | | | | - | | | | - | | | | - | | | | - | | | | - | | | | - | | | | - | | | | (219,274 | ) | | | (219,274 | ) | | | 40,542 | | | | (178,732 | ) |
| Other comprehensive income | | | | | - | | | | - | | | | (1,382,170 | ) | | | 60,830 | | | | (10,717 | ) | | | - | | | | | | | | (1,332,057 | ) | | | - | | | | (1,332,057 | ) | | | (28,818 | ) | | | (1,360,875 | ) |
| Total comprehensive income | | | | | - | | | | - | | | | (1,382,170 | ) | | | 60,830 | | | | (10,717 | ) | | | - | | | | - | | | | (1,332,057 | ) | | | (219,274 | ) | | | (1,551,331 | ) | | | 11,724 | | | | (1,539,607 | ) |
| Transactions with shareholders | | | | | | | | | | | | | | | | | | | | | | | | | | | | | | | | | | | | | | | | | | | | | | | | | | |
| Increase (decrease) through transfers and other changes, equity | | 25-34 | | | - | | | | - | | | | - | | | | - | | | | - | | | | 6,005 | | | | (1,069 | ) | | | 4,936 | | | | 1,034 | | | | 5,970 | | | | (32,510 | ) | | | (26,540 | ) |
| Total transactions with shareholders | | | | | - | | | | - | | | | - | | | | - | | | | - | | | | 6,005 | | | | (1,069 | ) | | | 4,936 | | | | 1,034 | | | | 5,970 | | | | (32,510 | ) | | | (26,540 | ) |
| Closing balance as of December 31, 2015 | | | | | 2,545,705 | | | | (178 | ) | | | (2,576,041 | ) | | | (90,510 | ) | | | (10,717 | ) | | | 35,647 | | | | 2,634,679 | | | | (6,942 | ) | | | 317,950 | | | | 2,856,535 | | | | 81,013 | | | | 2,937,548 | |
The accompanying Notes 1 to 37 form an integral part of these consolidated financial statements.
LATAM AIRLINES GROUP S.A. AND SUBSIDIARIES
CONSOLIDATED STATEMENT OF CASH FLOWS DIRECT – METHOD
| | | | | For the periods ended | |
| | | | | December 31, | |
| | | Note | | 2017 | | | 2016 | | | 2015 | |
| | | | | ThUS$ | | | ThUS$ | | | ThUS$ | |
| Cash flows from operating activities | | | | | | | | | | | | | | |
| Cash collection from operating activities | | | | | | | | | | | | | | |
| Proceeds from sales of goods and services | | | | | 10,595,718 | | | | 9,918,589 | | | | 11,372,397 | |
| Other cash receipts from operating activities | | | | | 73,668 | | | | 70,359 | | | | 88,237 | |
| Payments for operating activities | | | | | | | | | | | | | | |
| Payments to suppliers for goods and services | | | | | (6,722,713 | ) | | | (6,756,121 | ) | | | (7,029,582 | ) |
| Payments to and on behalf of employees | | | | | (1,955,310 | ) | | | (1,820,279 | ) | | | (2,165,184 | ) |
| Other payments for operating activities | | | | | (223,706 | ) | | | (162,839 | ) | | | (351,177 | ) |
| Income taxes refunded (paid) | | | | | (91,986 | ) | | | (59,556 | ) | | | (57,963 | ) |
| Other cash inflows (outflows) | | 35 | | | (8,931 | ) | | | (209,269 | ) | | | (184,627 | ) |
| Net cash flows from operating activities | | | | | 1,666,740 | | | | 980,884 | | | | 1,672,101 | |
| Cash flows used in investing activities | | | | | | | | | | | | | | |
| Cash flows from losses of control of subsidiaries or other businesses | | | | | 6,503 | | | | - | | | | - | |
| Other cash receipts from sales of equity or debt instruments of other entities | | | | | 3,248,693 | | | | 2,969,731 | | | | 519,460 | |
| Other payments to acquire equity or debt instruments of other entities | | | | | (3,106,411 | ) | | | (2,706,733 | ) | | | (704,115 | ) |
| Amounts raised from sale of property, plant and equipment | | | | | 51,316 | | | | 76,084 | | | | 57,117 | |
| Purchases of property, plant and equipment | | | | | (403,666 | ) | | | (694,370 | ) | | | (1,569,749 | ) |
| Amounts raised from sale of intangible assets | | | | | - | | | | 1 | | | | 91 | |
| Purchases of intangible assets | | | | | (87,318 | ) | | | (88,587 | ) | | | (52,449 | ) |
| Interest received | | | | | 12,684 | | | | 11,242 | | | | 43,374 | |
| Other cash inflows (outflows) | | 35 | | | (9,223 | ) | | | 843 | | | | 10,576 | |
| Net cash flow from (used in) investing activities | | | | | (287,422 | ) | | | (431,789 | ) | | | (1,695,695 | ) |
| Cash flows from (used in) financing activities | | | | | | | | | | | | | | |
| Amounts raised from issuance of shares | | | | | - | | | | 608,496 | | | | - | |
| Amounts raised from long-term loans | | | | | 1,305,384 | | | | 1,820,016 | | | | 1,791,484 | |
| Amounts raised from short-term loans | | | | | 132,280 | | | | 279,593 | | | | 205,000 | |
| Loans repayments | | | | | (1,829,191 | ) | | | (2,121,130 | ) | | | (1,263,793 | ) |
| Payments of finance lease liabilities | | | | | (344,901 | ) | | | (314,580 | ) | | | (342,614 | ) |
| Dividends paid | | 35 | | | (66,642 | ) | | | (41,223 | ) | | | (35,032 | ) |
| Interest paid | | | | | (389,724 | ) | | | (398,288 | ) | | | (383,648 | ) |
| Other cash inflows (outflows) | | 35 | | | 13,706 | | | | (229,163 | ) | | | (99,757 | ) |
| Net cash flows from (used in) financing activities | | | | | (1,179,088 | ) | | | (396,279 | ) | | | (128,360 | ) |
| Net increase (decrease) in cash and cash equivalents before effect of exchanges rate change | | | | | 200,230 | | | | 152,816 | | | | (151,954 | ) |
| Effects of variation in the exchange rate on cash and cash equivalents | | | | | (7,553 | ) | | | 43,014 | | | | (83,945 | ) |
| Net increase (decrease) in cash and cash equivalents | | | | | 192,677 | | | | 195,830 | | | | (235,899 | ) |
| CASH AND CASH EQUIVALENTS AT BEGINNING OF PERIOD | | 6 | | | 949,327 | | | | 753,497 | | | | 989,396 | |
| CASH AND CASH EQUIVALENTS AT END OF PERIOD | | 6 | | | 1,142,004 | | | | 949,327 | | | | 753,497 | |
The accompanying Notes 1 to 37 form an integral part of these consolidated financial statements.
LATAM AIRLINES GROUP S.A.AND SUBSIDIARIES
NOTES TO THE CONSOLIDATED FINANCIAL STATEMENTS
AS OF DECEMBER 31, 20172019 AND 2018
NOTE 1 - GENERAL INFORMATION
LATAM Airlines Group S.A. (the “Company”) is a public limited company registered with the Commission for the Financial Market (1), under No.306,No. 306, whose shares are quotedlisted in Chile on the Stock Brokers -Electronic Stock Exchange (Valparaíso)of Chile - the Chilean Electronic Stock Exchange and the Santiago Stock Exchange; it is also quotedExchange - Stock Exchange, besides being listed in the United States of America on the New York Stock Exchange (“NYSE”) in New York, in the form of American Depositary Receipts (“ADRs”).
Its principalmain business is passengerthe air transport of passengers and cargo, air transportation, both in the domestic markets of Chile, Peru, Argentina, Colombia, Ecuador and Brazil, andas well as in a developed series of regional and international routes in America, Europe and Oceania. These businesses are developed directly or by theirits subsidiaries in different countries.Ecuador, Peru, Brazil, Colombia, Argentina and Paraguay. In addition, the Company has subsidiaries operatingthat operate in the freightcargo business in Mexico,Chile, Brazil and Colombia.
The Company is located in Chile, in the city of Santiago, Chile, aton Avenida Américo Vespucio Sur No. 901, commune of Renca.Renca commune.
Corporate Governance practicesAs of the Company are set in accordance with Securities Market Law the Corporations Law and its regulations, and the regulations of the Commission for the Financial Market (1) and the laws and regulations of the United States of America and the U.S. Securities and Exchange Commission (“SEC”) of that country, with respect to the issuance of ADRs (2).
At December 31, 2017,2019, the Company'sCompany’s statutory capital stock is represented by 608,374,525 shares, all common606,407,693 ordinary shares without par value, which is divided into: (a) the 606,407,693nominal value. All shares are subscribed and paid shares; and (b) 1,966,832 shares pendingconsidering the capital reduction that occurred in full, after the legal period of subscription and payment, of which: (i) 1,500,000 shares are allocatedthree years to compensation stock option plan; And (ii) 466,832 correspond tosubscribe the balance of 466,832 outstanding shares, pending of placement of the last capital increase approved atin August of the extraordinary meeting of shareholders of August 18,year 2016.
(1) On February 23, 2017 the Law No. 21,000 was published in the Official Journal, creating the new Commission for the Financial Market (CMF), a collegiate and technical entity that replaced the Superintendency of Securities and Insurance (SVS).
(2) As reported in due course, during 2016, LATAM discontinued its Brazilian receipts program - BDR level III, currently LATAM not counting with securities in the Brazilian market.
The Board of the Company is composed of nine members who are elected every two years by the ordinary shareholders' meeting. The Board meets in regular monthly sessions and in extraordinary sessions as the corporate needs demand. Of the nine board members, three form part of its Directors’ Committee which fulfills both the role foreseen in the Corporations Law and the functions of the Audit Committee required by the Sarbanes Oxley Law of the United States of America and the respective regulations of the SEC.
The majority shareholder major of the Company is the Cueto Group, which through the companies Costa Verde Aeronáutica S.A., Costa Verde Aeronáutica SpA, Costa Verde Aeronáutica Tres SpA, Inversiones Nueva Costa Verde Aeronáutica Ltda., Inversiones Priesca Dos y Cía. Ltda., Inversiones Caravia Dos y Cía. Ltda., Inversiones El Fano Dos y Cía. Ltda., Inversiones La Espasa Dos S.A. ande Inversiones La Espasa Dos y Cía. Ltda., owns 27.91%Owns 21.46% of the shares issued by the Company, and therefore is the controlling shareholder of the Company in accordance with the provisions of the letter b) of Article 97 and Article 99 of the Securities Market Law, given that there is a decisive influence on its administration.Company.
As of December 31, 2017,2019, the Company had a total of 1,485 registered shareholders.1,228 shareholders in its registry. At that date, approximately 4.14%4.17% of the Company’s share capitalproperty was in the form of ADRs.
For the period ended December 31, 2017,2019, the Company had an average of 43,59341,043 employees, ending this period with a total number of 43,09541,729 people, distributed in 6,966 Administration employees, spread over 6,922 Administrative employees, 4,7424,911 in Maintenance, 15,12613,538 in Operations, 9,016 in9,511 Cabin Crew, 3,957 in Controls4,298 Cockpit Crew and 3,3322,505 in Sales.
The main subsidiaries included in these consolidated financial statements are as follows:
| | | | | | | | | As December 31, 2017 | | As December 31, 2016 | | As December 31, 2015 | | |
| | | | | Country | | Functional | | | | | | | | | | | | | | | | | | | | | | | Country | | Functional | | As December 31, 2019 | | As December 31, 2018 | | As December 31, 2017 | |
| Tax No. | | Company | | of origin | | Currency | | Direct | | Indirect | | Total | | Direct | | Indirect | | Total | | Direct | | Indirect | | Total | | | Company | | of origin | | Currency | | Direct | | Indirect | | Total | | Direct | | Indirect | | Total | | Direct | | Indirect | | Total | |
| | | | | | | | | % | | % | | % | | % | | % | | % | | % | | % | | % | | | % | | % | | % | | % | | % | | % | | % | | % | | % | |
| | | | | | | | | | | | | | | | | | | | | | | | | | | |
| 96.518.860-6 | | Latam Travel Chile S.A. and Subsidary (*) | | Chile | | US$ | | | 99.9900 | | | | 0.0100 | | | | 100.0000 | | | | 99.9900 | | | | 0.0100 | | | | 100.0000 | | | | 99.9900 | | | | 0.0100 | | | | 100.0000 | | | Latam Travel Chile S.A. and Subsidiary | | Chile | | US$ | | | - | | | | - | | | | - | | | | 99.9900 | | | | 0.0100 | | | | 100.0000 | | | | 99.9900 | | | | 0.0100 | | | | 100.0000 | |
| 96.763.900-1 | | Inmobiliaria Aeronáutica S.A. | | Chile | | US$ | | | 0.0000 | | | | 0.0000 | | | | 0.0000 | | | | 99.0100 | | | | 0.9900 | | | | 100.0000 | | | | 99.0100 | | | | 0.9900 | | | | 100.0000 | | |
| 96.969.680-0 | | Lan Pax Group S.A. and Subsidiaries | | Chile | | US$ | | | 99.8361 | | | | 0.1639 | | | | 100.0000 | | | | 99.8361 | | | | 0.1639 | | | | 100.0000 | | | | 99.8361 | | | | 0.1639 | | | | 100.0000 | | | Lan Pax Group S.A. and Subsidiaries | | Chile | | US$ | | | 99.8361 | | | | 0.1639 | | | | 100.0000 | | | | 99.8361 | | | | 0.1639 | | | | 100.0000 | | | | 99.8361 | | | | 0.1639 | | | | 100.0000 | |
| Foreign | | Lan Perú S.A. | | Peru | | US$ | | | 49.0000 | | | | 21.0000 | | | | 70.0000 | | | | 49.0000 | | | | 21.0000 | | | | 70.0000 | | | | 49.0000 | | | | 21.0000 | | | | 70.0000 | | |
| Foreign | | Lan Chile Investments Limited and Subsidiary | | Cayman Ins land | | US$ | | | 0.0000 | | | | 0.0000 | | | | 0.0000 | | | | 0.0000 | | | | 0.0000 | | | | 0.0000 | | | | 99.9900 | | | | 0.0100 | | | | 100.0000 | | | Latam Airlines Perú S.A. | | Peru | | US$ | | | 49.0000 | | | | 21.0000 | | | | 70.0000 | | | | 49.0000 | | | | 21.0000 | | | | 70.0000 | | | | 49.0000 | | | | 21.0000 | | | | 70.0000 | |
| 93.383.000-4 | | Lan Cargo S.A. | | Chile | | US$ | | | 99.8939 | | | | 0.0041 | | | | 99.8980 | | | | 99.8939 | | | | 0.0041 | | | | 99.8980 | | | | 99.8939 | | | | 0.0041 | | | | 99.8980 | | | Lan Cargo S.A. | | Chile | | US$ | | | 99.8940 | | | | 0.0041 | | | | 99.8981 | | | | 99.8940 | | | | 0.0041 | | | | 99.8981 | | | | 99.8940 | | | | 0.0041 | | | | 99.8981 | |
| Foreign | | Connecta Corporation | | U.S.A. | | US$ | | | 0.0000 | | | | 100.0000 | | | | 100.0000 | | | | 0.0000 | | | | 100.0000 | | | | 100.0000 | | | | 0.0000 | | | | 100.0000 | | | | 100.0000 | | | Connecta Corporation | | U.S.A. | | US$ | | | 100.0000 | | | | 0.0000 | | | | 100.0000 | | | | 0.0000 | | | | 100.0000 | | | | 100.0000 | | | | 0.0000 | | | | 100.0000 | | | | 100.0000 | |
| Foreign | | Prime Airport Services Inc. and Subsidary | | U.S.A. | | US$ | | | 0.0000 | | | | 100.0000 | | | | 100.0000 | | | | 0.0000 | | | | 100.0000 | | | | 100.0000 | | | | 0.0000 | | | | 100.0000 | | | | 100.0000 | | | Prime Airport Services Inc. and Subsidiary | | U.S.A. | | US$ | | | 99.9714 | | | | 0.0286 | | | | 100.0000 | | | | 0.0000 | | | | 100.0000 | | | | 100.0000 | | | | 0.0000 | | | | 100.0000 | | | | 100.0000 | |
| 96.951.280-7 | | Transporte Aéreo S.A. | | Chile | | US$ | | | 0.0000 | | | | 100.0000 | | | | 100.0000 | | | | 0.0000 | | | | 100.0000 | | | | 100.0000 | | | | 0.0000 | | | | 100.0000 | | | | 100.0000 | | | Transporte Aéreo S.A. | | Chile | | US$ | | | 99.9999 | | | | 0.0001 | | | | 100.0000 | | | | 0.0000 | | | | 100.0000 | | | | 100.0000 | | | | 0.0000 | | | | 100.0000 | | | | 100.0000 | |
| Foreign | | Aircraft International Leasing Limited | | U.S.A. | | US$ | | | 0.0000 | | | | 0.0000 | | | | 0.0000 | | | | 0.0000 | | | | 0.0000 | | | | 0.0000 | | | | 0.0000 | | | | 100.0000 | | | | 100.0000 | | |
| 96.631.520-2 | | Fast Air Almacenes de Carga S.A. | | Chile | | CLP | | | 0.0000 | | | | 100.0000 | | | | 100.0000 | | | | 0.0000 | | | | 100.0000 | | | | 100.0000 | | | | 0.0000 | | | | 100.0000 | | | | 100.0000 | | | Fast Air Almacenes de Carga S.A. | | Chile | | CLP | | | 99.8900 | | | | 0.1100 | | | | 100.0000 | | | | 0.0000 | | | | 100.0000 | | | | 100.0000 | | | | 0.0000 | | | | 100.0000 | | | | 100.0000 | |
| 96.631.410-9 | | Ladeco Cargo S.A. | | Chile | | CLP | | | 0.0000 | | | | 0.0000 | | | | 0.0000 | | | | 0.0000 | | | | 0.0000 | | | | 0.0000 | | | | 0.0000 | | | | 100.0000 | | | | 100.0000 | | |
| Foreign | | Laser Cargo S.R.L. | | Argentina | | ARS | | | 0.0000 | | | | 100.0000 | | | | 100.0000 | | | | 0.0000 | | | | 100.0000 | | | | 100.0000 | | | | 0.0000 | | | | 100.0000 | | | | 100.0000 | | | Laser Cargo S.R.L. | | Argentina | | ARS | | | 96.2208 | | | | 3.7792 | | | | 100.0000 | | | | 0.0000 | | | | 100.0000 | | | | 100.0000 | | | | 0.0000 | | | | 100.0000 | | | | 100.0000 | |
| Foreign | | Lan Cargo Overseas Limited and Subsidiaries | | Bahamas | | US$ | | | 0.0000 | | | | 100.0000 | | | | 100.0000 | | | | 0.0000 | | | | 100.0000 | | | | 100.0000 | | | | 0.0000 | | | | 100.0000 | | | | 100.0000 | | | Lan Cargo Overseas Limited and Subsidiaries | | Bahamas | | US$ | | | 99.9800 | | | | 0.0200 | | | | 100.0000 | | | | 0.0000 | | | | 100.0000 | | | | 100.0000 | | | | 0.0000 | | | | 100.0000 | | | | 100.0000 | |
| 96.969.690-8 | | Lan Cargo Inversiones S.A. and Subsidary | | Chile | | US$ | | | 0.0000 | | | | 100.0000 | | | | 100.0000 | | | | 0.0000 | | | | 100.0000 | | | | 100.0000 | | | | 0.0000 | | | | 100.0000 | | | | 100.0000 | | | Lan Cargo Inversiones S.A. and Subsidiary | | Chile | | US$ | | | 99.0000 | | | | 1.0000 | | | | 100.0000 | | | | 0.0000 | | | | 100.0000 | | | | 100.0000 | | | | 0.0000 | | | | 100.0000 | | | | 100.0000 | |
| 96.575.810-0 | | Inversiones Lan S.A. and Subsidiaries | | Chile | | US$ | | | 99.7100 | | | | 0.2900 | | | | 100.0000 | | | | 99.7100 | | | | 0.2900 | | | | 100.0000 | | | | 99.7100 | | | | 0.2900 | | | | 100.0000 | | | Inversiones Lan S.A. and Subsidiaries | | Chile | | US$ | | | 99.7100 | | | | 0.2900 | | | | 100.0000 | | | | 99.7100 | | | | 0.2900 | | | | 100.0000 | | | | 99.7100 | | | | 0.2900 | | | | 100.0000 | |
| 96.847.880-K | | Technical Trainning LATAM S.A. | | Chile | | CLP | | | 99.8300 | | | | 0.1700 | | | | 100.0000 | | | | 99.8300 | | | | 0.1700 | | | | 100.0000 | | | | 99.8300 | | | | 0.1700 | | | | 100.0000 | | | Technical Trainning LATAM S.A. | | Chile | | CLP | | | 99.8300 | | | | 0.1700 | | | | 100.0000 | | | | 99.8300 | | | | 0.1700 | | | | 100.0000 | | | | 99.8300 | | | | 0.1700 | | | | 100.0000 | |
| Foreign | | Latam Finance Limited | | Cayman Ins land | | US$ | | | 100.0000 | | | | 0.0000 | | | | 100.0000 | | | | 0.0000 | | | | 0.0000 | | | | 0.0000 | | | | 0.0000 | | | | 0.0000 | | | | 0.0000 | | | Latam Finance Limited | | Cayman Island | | US$ | | | 100.0000 | | | | 0.0000 | | | | 100.0000 | | | | 100.0000 | | | | 0.0000 | | | | 100.0000 | | | | 100.0000 | | | | 0.0000 | | | | 100.0000 | |
| Foreign | | Peuco Finance Limited | | Cayman Ins land | | US$ | | | 100.0000 | | | | 0.0000 | | | | 100.0000 | | | | 0.0000 | | | | 0.0000 | | | | 0.0000 | | | | 0.0000 | | | | 0.0000 | | | | 0.0000 | | | Peuco Finance Limited | | Cayman Island | | US$ | | | 100.0000 | | | | 0.0000 | | | | 100.0000 | | | | 100.0000 | | | | 0.0000 | | | | 100.0000 | | | | 100.0000 | | | | 0.0000 | | | | 100.0000 | |
| Foreign | | Profesional Airline Services INC. | | U.S.A. | | US$ | | | 100.0000 | | | | 0.0000 | | | | 100.0000 | | | | 0.0000 | | | | 0.0000 | | | | 0.0000 | | | | 0.0000 | | | | 0.0000 | | | | 0.0000 | | | Profesional Airline Services INC. | | U.S.A. | | US$ | | | 100.0000 | | | | 0.0000 | | | | 100.0000 | | | | 100.0000 | | | | 0.0000 | | | | 100.0000 | | | | 100.0000 | | | | 0.0000 | | | | 100.0000 | |
| Foreign | | TAM S.A. and Subsidiaries (**) | | Brazil | | BRL | | | 63.0901 | | | | 36.9099 | | | | 100.0000 | | | | 63.0901 | | | | 36.9099 | | | | 100.0000 | | | | 63.0901 | | | | 36.9099 | | | | 100.0000 | | | Jarletul S.A. | | Uruguay | | US$ | | | 99.0000 | | | | 1.0000 | | | | 100.0000 | | | | 99.0000 | | | | 1.0000 | | | | 100.0000 | | | | 99.0000 | | | | 1.0000 | | | | 100.0000 | |
| Foreign | | | TAM S.A. and Subsidiaries (*) | | Brazil | | BRL | | | 63.0901 | | | | 36.9099 | | | | 100.0000 | | | | 63.0901 | | | | 36.9099 | | | | 100.0000 | | | | 63.0901 | | | | 36.9099 | | | | 100.0000 | |
| (*) | In June 2016, Lantours Division de Servicios Terrestres S.A. changes its name to Latam Travel Chile S.A. |
| (**) | As of December 31, 2017,2019, the indirect ownership participation percentage on TAM S.AS.A. and subsidiariesSubsidiaries is from Holdco I S.A., a company over which LATAM is entitled to 99,9983% of theAirlines Group S.A. it has a 99.9983% share on economic rights and 49%51.04% of political rights. Its percentage arise as a result of the rights politicians product of provisional measure No. 714863 of the Brazilian Governmentgovernment implemented during 2016 whichin December 2018 that allows foreign capital to have up to 49%100% of the property. |
Thus, since April 2016, LATAM Airlines Group S.A. owns 901 voting shares of Holdco I S.A., equivalent to 49% of the total shares with voting rights of said company and TEP Chile S.A. owns 938 voting shares of Holdco I S.A., equivalent to 51% of the total voting shares of that company.
| | | | | Statement of financial position | | | Net Income | |
| | | | | | | | | | | | | | | | | | | | | | | | | | | | | | | | For the periods ended | |
| | | | | | | | | | | | | | December 31, | |
| | | | | As of December 31, 2017 | | | As of December 31, 2016 | | | As of December 31, 2015 | | | 2017 | | | 2016 | | | 2015 | |
| Tax No. | | Company | | Assets | | | Liabilities | | | Equity | | | Assets | | | Liabilities | | | Equity | | | Assets | | | Liabilities | | | Equity | | | | | | Gain/(loss) | | | | |
| | | | | ThUS$ | | | ThUS$ | | | ThUS$ | | | ThUS$ | | | ThUS$ | | | ThUS$ | | | ThUS$ | | | ThUS$ | | | ThUS$ | | | ThUS$ | | | ThUS$ | | | ThUS$ | |
| | | | | | | | | | | | | | | | | | | | | | | | | | | | | | | | | | | | | | | |
| 96.518.860-6 | | Latam TravelChile S.A. and Subsidary (*) | | | 6,771 | | | | 2,197 | | | | 4,574 | | | | 5,468 | | | | 2,727 | | | | 2,741 | | | | 5,613 | | | | 5,522 | | | | 91 | | | | 1,833 | | | | 2,650 | | | | 2,341 | |
| 96.763.900-1 | | Inmobiliaria Aeronáutica S.A. | | | - | | | | - | | | | - | | | | 36,756 | | | | 8,843 | | | | 27,913 | | | | 39,302 | | | | 14,832 | | | | 24,470 | | | | - | | | | 3,443 | | | | 1,404 | |
| 96.969.680-0 | | Lan PaxGroup S.A. and Subsidiaries (**) | | | 499,345 | | | | 1,101,548 | | | | (596,406 | ) | | | 475,763 | | | | 1,045,761 | | | | (561,472 | ) | | | 519,663 | | | | 1,049,232 | | | | (521,907 | ) | | | (35,943 | ) | | | (36,331 | ) | | | (35,187 | ) |
| Foreign | | Lan Perú S.A. | | | 315,607 | | | | 303,204 | | | | 12,403 | | | | 306,111 | | | | 294,912 | | | | 11,199 | | | | 255,691 | | | | 240,938 | | | | 14,753 | | | | 1,205 | | | | (2,164 | ) | | | 5,068 | |
| Foreign | | Lan Chile Investments Limited and Subsidiary (**) | | | - | | | | - | | | | - | | | | - | | | | - | | | | - | | | | 2,015 | | | | 13 | | | | 2,002 | | | | - | | | | 23 | | | | (13 | ) |
| 93.383.000-4 | | Lan Cargo S.A. | | | 584,169 | | | | 371,934 | | | | 212,235 | | | | 480,908 | | | | 239,728 | | | | 241,180 | | | | 483,033 | | | | 217,037 | | | | 265,966 | | | | (30,220 | ) | | | (24,813 | ) | | | (74,408 | ) |
| Foreign | | Connecta Corporation | | | 38,735 | | | | 17,248 | | | | 21,487 | | | | 31,981 | | | | 23,525 | | | | 8,456 | | | | 37,070 | | | | 38,298 | | | | (1,228 | ) | | | 13,013 | | | | 9,684 | | | | 194 | |
| Foreign | | Prime Airport Services Inc. and Subsidary (**) | | | 12,671 | | | | 15,722 | | | | (3,051 | ) | | | 7,385 | | | | 11,294 | | | | (3,909 | ) | | | 6,683 | | | | 11,180 | | | | (4,497 | ) | | | 857 | | | | 588 | | | | 279 | |
| 96.951.280-7 | | Transporte Aéreo S.A. | | | 324,498 | | | | 104,357 | | | | 220,141 | | | | 340,940 | | | | 124,805 | | | | 216,135 | | | | 331,117 | | | | 122,666 | | | | 208,451 | | | | 2,172 | | | | 8,206 | | | | 5,878 | |
| Foreign | | Aircraft International Leasing Limited | | | | | | | | | | | | | | | - | | | | - | | | | - | | | | - | | | | 4 | | | | (4 | ) | | | - | | | | 9 | | | | (4 | ) |
| 96.631.520-2 | | Fast Air Almacenes de Carga S.A. | | | 12,931 | | | | 4,863 | | | | 8,068 | | | | 10,023 | | | | 3,645 | | | | 6,378 | | | | 8,985 | | | | 4,641 | | | | 4,344 | | | | 939 | | | | 1,717 | | | | 1,811 | |
| Foreign | | Laser Cargo S.R.L. | | | 18 | | | | 27 | | | | (9 | ) | | | 21 | | | | 32 | | | | (11 | ) | | | 27 | | | | 39 | | | | (12 | ) | | | 2 | | | | (1 | ) | | | 69 | |
| Foreign | | Lan Cargo Overseas Limited and Subsidiaries (**) | | | 66,039 | | | | 42,271 | | | | 18,808 | | | | 54,092 | | | | 35,178 | | | | 15,737 | | | | 62,406 | | | | 43,759 | | | | 15,563 | | | | 3,438 | | | | 176 | | | | 3,344 | |
| 96.969.690-8 | | Lan Cargo Inversiones S.A. and Subsidary (**) | | | 144,884 | | | | 156,005 | | | | (10,112 | ) | | | 80,644 | | | | 95,747 | | | | (13,506 | ) | | | 54,179 | | | | 68,220 | | | | (12,601 | ) | | | 3,389 | | | | (910 | ) | | | 113 | |
| 96.575.810-0 | | Inversiones Lan S.A. and Subsidiaries (**) | | | 11,681 | | | | 5,201 | | | | 6,377 | | | | 10,971 | | | | 6,452 | | | | 4,452 | | | | 16,512 | | | | 14,676 | | | | 1,828 | | | | 1,561 | | | | 2,549 | | | | 2,772 | |
| 96.847.880-K | | Technical Trainning LATAM S.A. | | | 1,967 | | | | 367 | | | | 1,600 | | | | 1,745 | | | | 284 | | | | 1,461 | | | | 1,527 | | | | 266 | | | | 1,261 | | | | 109 | | | | 73 | | | | (72 | ) |
| Foreign | | Latam Finance Limited | | | 678,289 | | | | 708,306 | | | | (30,017 | ) | | | - | | | | - | | | | - | | | | - | | | | - | | | | - | | | | (30,017 | ) | | | - | | | | - | |
| Foreign | | Peuco Finance Limited | | | 608,191 | | | | 608,191 | | | | - | | | | - | | | | - | | | | - | | | | - | | | | - | | | | - | | | | - | | | | - | | | | - | |
| Foreign | | Profesional Airline Services INC. | | | 3,703 | | | | 3,438 | | | | 265 | | | | - | | | | - | | | | - | | | | - | | | | - | | | | - | | | | 294 | | | | - | | | | - | |
| Foreign | | TAM S.A. and Subsidiaries (**) | | | 4,490,714 | | | | 3,555,423 | | | | 856,829 | | | | 5,287,286 | | | | 4,710,308 | | | | 495,562 | | | | 4,969,553 | | | | 4,199,223 | | | | 423,190 | | | | 160,582 | | | | 2,107 | | | | (183,581 | ) |
| | | | | Statement of financial position | | | Net Income | |
| | | | | | | | | | | | | | | | | | | | | | | | | | | | | | | | For the year ended | |
| | | | | | | | | | | | | | December 31, | |
| | | | | As of December 31, 2019 | | | As of December 31, 2018 | | | As of December 31, 2017 | | | 2019 | | | 2018 | | | 2017 | |
| Tax No. | | Company | | Assets | | | Liabilities | | | Equity | | | Assets | | | Liabilities | | | Equity | | | Assets | | | Liabilities | | | Equity | | | | | | Gain /(loss) | | | | |
| | | | | ThUS$ | | | ThUS$ | | | ThUS$ | | | ThUS$ | | | ThUS$ | | | ThUS$ | | | ThUS$ | | | ThUS$ | | | ThUS$ | | | ThUS$ | | | ThUS$ | | | ThUS$ | |
| | | | | | | | | | | | | | | | | Restated | | | | | | | | | Restated | | | | | | | | | Restated | | | Restated | |
| 96.518.860-6 | | Latam Travel Chile S.A. and Subsidiary | | | - | | | | - | | | | - | | | | 10,841 | | | | 3,909 | | | | 6,932 | | | | 6,771 | | | | 2,197 | | | | 4,574 | | | | - | | | | 2,385 | | | | 1,833 | |
| 96.969.680-0 | | Lan Pax Group S.A. and Subsidiaries (*) | | | 632,673 | | | | 1,487,248 | | | | (853,624 | ) | | | 526,017 | | | | 1,281,800 | | | | (751,960 | ) | | | 499,345 | | | | 1,101,548 | | | | (596,406 | ) | | | (26,551 | ) | | | (48,061 | ) | | | (35,943 | ) |
| Foreign | | Latam Airlines Perú S.A. | | | 519,363 | | | | 510,672 | | | | 8,691 | | | | 419,325 | | | | 409,221 | | | | 10,104 | | | | 315,607 | | | | 303,204 | | | | 12,403 | | | | (3,550 | ) | | | 5,416 | | | | 1,205 | |
| 93.383.000-4 | | Lan Cargo S.A. | | | 634,852 | | | | 462,666 | | | | 172,186 | | | | 513,367 | | | | 336,715 | | | | 176,652 | | | | 584,169 | | | | 371,934 | | | | 212,235 | | | | (4,157 | ) | | | (34,322 | ) | | | (30,220 | ) |
| Foreign | | Connecta Corporation | | | 64,110 | | | | 24,023 | | | | 40,087 | | | | 66,593 | | | | 28,183 | | | | 38,410 | | | | 38,735 | | | | 17,428 | | | | 21,487 | | | | 1,677 | | | | 16,923 | | | | 13,030 | |
| Foreign | | Prime Airport Services Inc. and Subsidiary (*) | | | 22,068 | | | | 23,102 | | | | (1,034 | ) | | | 15,817 | | | | 17,654 | | | | (1,837 | ) | | | 12,671 | | | | 15,722 | | | | (3,051 | ) | | | 802 | | | | 1,225 | | | | 857 | |
| 96.951.280-7 | | Transporte Aéreo S.A. | | | 359,335 | | | | 142,423 | | | | 216,912 | | | | 331,496 | | | | 129,233 | | | | 202,263 | | | | 324,498 | | | | 104,357 | | | | 220,141 | | | | 14,610 | | | | (17,609 | ) | | | 2,172 | |
| 96.631.520-2 | | Fast Air Almacenes de Carga S.A. | | | 20,182 | | | | 12,601 | | | | 7,581 | | | | 17,057 | | | | 9,614 | | | | 7,443 | | | | 12,931 | | | | 4,863 | | | | 8,068 | | | | 796 | | | | (3 | ) | | | 939 | |
| Foreign | | Laser Cargo S.R.L. | | | (10 | ) | | | - | | | | (10 | ) | | | 26 | | | | 13 | | | | 13 | | | | 18 | | | | 27 | | | | (9 | ) | | | - | | | | (3 | ) | | | 2 | |
| Foreign | | Lan Cargo Overseas Limited and Subsidiaries (*) | | | 48,929 | | | | 15,228 | | | | 33,450 | | | | 53,326 | | | | 13,040 | | | | 40,028 | | | | 66,039 | | | | 42,271 | | | | 18,808 | | | | (6,579 | ) | | | 19,121 | | | | 3,438 | |
| 96.969.690-8 | | Lan Cargo Inversiones S.A. and Subsidiary (*) | | | 65,422 | | | | 78,890 | | | | (12,111 | ) | | | 181,522 | | | | 192,059 | | | | (9,614 | ) | | | 144,884 | | | | 156,005 | | | | (10,112 | ) | | | (2,497 | ) | | | 497 | | | | 3,389 | |
| 96.575.810-0 | | Inversiones Lan S.A. and Subsidiaries (*) | | | 1,329 | | | | 50 | | | | 1,279 | | | | 1,383 | | | | 50 | | | | 1,333 | | | | 11,681 | | | | 5,201 | | | | 6,377 | | | | (54 | ) | | | (4,774 | ) | | | 1,561 | |
| 96.847.880-K | | Technical Trainning LATAM S.A. | | | 2,378 | | | | 1,075 | | | | 1,303 | | | | 2,879 | | | | 1,031 | | | | 1,848 | | | | 1,967 | | | | 367 | | | | 1,600 | | | | (282 | ) | | | 884 | | | | 109 | |
| Foreign | | Latam Finance Limited | | | 1,362,762 | | | | 1,531,238 | | | | (168,476 | ) | | | 679,034 | | | | 756,774 | | | | (77,740 | ) | | | 678,289 | | | | 708,306 | | | | (30,017 | ) | | | (90,736 | ) | | | (47,723 | ) | | | (30,017 | ) |
| Foreign | | Peuco Finance Limited | | | 664,458 | | | | 664,458 | | | | - | | | | 608,191 | | | | 608,191 | | | | - | | | | 608,191 | | | | 608,191 | | | | - | | | | - | | | | - | | | | - | |
| Foreign | | Profesional Airline Services INC. | | | 3,509 | | | | 1,950 | | | | 1,559 | | | | 2,430 | | | | 1,967 | | | | 463 | | | | 3,703 | | | | 3,438 | | | | 265 | | | | 1,096 | | | | 197 | | | | 294 | |
| Foreign | | Jarletul S.A. | | | 150 | | | | 860 | | | | (710 | ) | | | 18 | | | | 125 | | | | (107 | ) | | | - | | | | - | | | | - | | | | (603 | ) | | | (107 | ) | | | - | |
| Foreign | | TAM S.A. and Subsidiaries (*) | | | 5,090,180 | | | | 3,550,875 | | | | 1,539,305 | | | | 4,420,546 | | | | 3,256,017 | | | | 1,164,529 | | | | 4,490,714 | | | | 3,555,423 | | | | 856,829 | | | | 186,140 | | | | 389,072 | | | | 160,582 | |
| (*) | In June 2016, Lantours Division of Terrestrial Services S.A. changed its name to Latam Travel Chile S.A. |
| (**) | The Equity reported corresponds to Equity attributable to owners of the parent, it does not include Non-controlling interest. |
Additionally, we have proceeded to consolidate the following special purpose entities:entities have been consolidated: 1. Chercán Leasing Limited, created to finance the pre-delivery payments on aircraft;for aircraft advances financing; 2. Guanay Finance Limited, created to issue a bond collateralizedfor the issuance of secured bonds with future credit card receivables;payments; 3. Private investment funds andfunds; 4. AvocetaDia Patagonia Limited, Alma Leasing C.O. Limited, FC Initial Leasing Limited, Vari Leasing Limited, Dia Iguazu Limited, Condor Leasing C.O. Limited, FI Timothy Leasing Limited, Yamasa Sangyo Aircraft LA1 Kumiai, Yamasa Sangyo Aircraft LA2 Kumiai, LS-Aviation No.19 C.O. Limited, LS-Aviation No.20 C.O. Limited, LS-Aviation No.21 C.O. Limited, LS-Aviation No.22 C.O. Limited and LS-Aviation No.23 Co. Limited created to finance the pre-delivery payments on aircraft. Thesefor aircraft financing. Those companies have been consolidated as required by IFRS 10.
All controlled entities have been included in the consolidation.
Changes occurred in the scope of consolidation perimeter between January 1, 20162018 and December 31, 2017,2019, are detailed below:
| (1) | Incorporation or acquisition of companies |
| - | On January 2016, the increase in the share capital and statutory amendment for the purpose of creating a new class of shares of Lan Argentina SA, a subsidiary of22, 2018, Lan Pax Group SA, for a total amount was registered in the Public RegistryS.A., purchased 17,717 shares of Commerce. of 90,000,000 nominated "C" class shares not endorsable and without the rightLaser Cargo SRL. to vote.Andes Airport Service S.A., consequently Lan Pax Group S.A. participated in this capital increase, modifying its ownership in 4.87%is 3.77922% and Lan Cargo S.A. with a 96.22078% share of Laser Cargo SRL. |
| - | On March 13, 2018, the company Jarletul S.A., as a result of which, the indirect participationwas create. The company ownership is 99% of LATAM Airlines Group S.A. increases to 99.8656%.and a 1% is from Inversiones Lan S. A., and its main activity is a travel agency. |
| - | On April 1, 2016, Multiplus Corretora de Seguros Ltda. was created, the ownership of which corresponds to 99.99% of Multiplus S.A. direct subsidiary of TAM S.A. |
| - | On September 2016, Latam Finance Limited, a wholly-owned subsidiary of LATAM Airlines Group S.A., was created. Company operation started on April 2017. |
| - | On November 2015, the company Peuco Finance Limited was created, whose ownership corresponds 100% to LATAM Airlines Group S.A. The operation of this company began in December 2017. |
| - | Prismah Fidelidade Ltda. is constituted on June 29, 2012, whose ownership corresponds 99.99% to Multiplus S.A. direct subsidiary of TAM S.A. The operation of this company began in December 2017. |
| - | On December 11, 2017, a capital increase was made in TAM S.A. for a total of MR $ 697,935 (ThUS $ 210,000), with no new shares issues. This capital increase was paid a whole 100% by the shareholder LATAM Airlines Goup S.A. |
The foregoing, in accordance with the TAM's shareholder Holdco I S.A., who renounces to any right arisinged from this increase.
| - | As of December 31, 2017,2018, Inversiones LAN S.A., subsidiary of LATAM Airlines Group S.A., acquired 4,9515,319 shares of Aerovías de Integración Regional Aires S.A. a non-controlling shareholder, equivalent to 0.09498%, consequently, the indirect participation of LATAM Airlines Group S.A. increasescorresponds to 99.19414% |
| (2) | Dissolution of companies99.2012%. |
| - | In April 2019, TAM Linhas Aereas S.A, through a public offering of shares, acquired 27.26% of the shares of Multiplus S.A., owned by minority shareholders. Subsequently, the Company TAM S.A assigned 72.74% of its stake in Multiplus S.A., through a capital increase, to TAM Linhas Aerea S.A.; Because of 100% of the shares remain under the control of TAM Linhas Aereas S.A. a merge with Multiplus S.A. was materialized, leaving Multiplus S.A. from being an independent company on May 31, 2019. As result of the merger by incorporation, the Coalition and Loyalty Program of Multiplus S.A. which was identified as an independent Cash Generating Unit (CGU), and which also represented an operating segment, becomes part, as well as, the other loyalty programs of the group (LATAM Pass and LATAM Fidelidade), of the CGU Air Transport. Additionally, from that moment LATAM has a single operating segment within the Group. |
The value of the acquisition of this transaction was ThUS $ 294,105.
| - | During the period 2016, Lan Chile Investments Limited, a subsidiary ofBy public deed dated November 20, 2019 LATAM Airlines Group S.A.; and Aircraft International Leasing Limited, a subsidiary of Lan Cargo S.A., were dissolved. |
| - | On November 20, 2017 LATAM Airlines Group S.A. acquired acquires 100% of the shares of Inmobiliaria AeronáuticaLATAM Travel Chile S.A., a merger and subsequent dissolution of said company was carried out. |
Under the provisions of No. 2 of Art. 103 of Law No. 18,046 on Corporations, for having collected all the shares held by a single shareholder and for having elapsed the period of 10 days without having amended said situation, the company LATAM Travel Chile S.A. It has been fully dissolved on December 1, 2019.
As a result of the dissolution of the company LATAM Travel Chile S.A., the company LATAM Airlines Group S.A. assumes from that date all obligations and rights corresponding to the first.
| (2) | (3) | SaleDisposal of companies. |
| - | On May 5, 2017 Lan Pax Group S.A. and Inversiones Lan S.A., both subsidiaries of7, 2018 LATAM Airlines Group S.A. and its subsidiaries Inversiones LAN S.A. and LAN Pax Group S.A., sold, assigned and transferred to Talma Servicios Aeroportuariosthe Spanish companies Acciona Airport Services, S.A. and Inversiones Talma S.A.C.Acciona Aeropuertos, S.L., 100% of its shares in the capital stock of Rampassubsidiary Andes Airport Services S.A. |
The sale value of Rampas Andes Airport Services S.A. it was ThUS $ 8,624.ThUS$ 39,108
| - | On November 30, 2018, Mas Investment Limited, a subsidiary of LATAM Airlines Group S.A., sold to Puente Aéreo Corporación S.A. de C.V. his participation in the companies Aero Transportes Mas de Carga S.A. de C.V. and Promotora Aérea Latino Americana S.A. de C.V. |
The sale value of this transaction was ThUS$ 29,466.
NOTE 2 - SUMMARY OF SIGNIFICANT ACCOUNTING POLICIES
The following describes the principal accounting policies adopted in the preparation of these consolidated financial statements.
TheThese consolidated financial statements of LATAM Airlines Group S.A. for the period ended December 31, 2017, have been prepared in accordance with the International Financial Reporting Standards (IFRS) issued by the International Accounting Standards Board (“IASB”) incorporated therein and with the interpretations issued by the interpretations committee of the International Financial Reporting Standards Interpretations Committee (IFRIC).
The consolidated financial statements have been prepared under the historic-cost criterion, although modified by the valuation at fair value of certain financial instruments.
The preparation of the consolidated financial statements in accordance with IFRS requires the use of certain critical accounting estimates. It also requires management to use its judgment in applying the Company’s accounting policies. Note 4 shows the areas that imply a greater degree of judgment or complexity or the areas where the assumptions and estimates are significant to the consolidated financial statements.
During 2016 the Company recorded out of period adjustments resulting in an aggregate net decrease of US$ 18.2 million to "Net income (loss) for the period" for the year ended December 31, 2016. These adjustments include US$ 39.5 million (loss) resulting from an account reconciliation process initiated after the Company's afiliate TAM S.A. and its subsidiaries completed the implementation of the SAP system. A further US$ 11.0 million (loss) reflect adjustments related to foreign exchange differences, also relating to the Company's subsidiaries in Brazil. The balance of US$ 32.3 million (gain) includes principally the adjustment of unclaimed fees for expired tickets for the Company and its affiliates outside Brazil. Management of TAM S.A. has concluded that the out of period adjustments that have been identified are material to the 2015 financial statements of TAM S.A., which should therefore require a restatement in Brazil. However, Management of LATAM has evaluated the impact of all out of period adjustments, both individually and in the aggregate, and concluding that due to their relative size and to qualitative factors they are not material to the annual consolidated financial statements for 2016 of Latam Airlines Group S.A. or to any previously reported consolidated financial statements, therefore no restatement or revision is necessary.
In order to facilitate comparison, some minor reclassifications have been made toprepared in accordance with the accounting policies used by the Company for the consolidated financial statements 2018, except for the previous year.standards and interpretations adopted as of January 1, 2019.
| (a) | Accounting pronouncements with implementation effective from January 1, 2017: |
(a) Accounting pronouncements with implementation effective from January 1, 2019:
(i) Standards and amendments | | Date of issue | | Mandatory
Application:
Annual periods
beginning on or after
Effective Date: |
| | | | |
| (i) Standards and amendments | | | | |
| | | | |
| IFRS 16: Leases. | | january 2016 | | 01/01/2019 |
| | | | |
| Amendment to IFRS 9: Financial instruments | | october 2017 | | 01/01/2019 |
| | | | | |
Amendment to IAS 7: Statement of cash flow28: Investments in associates and joint ventures | | January 2016october 2017 | | 01/01/20172019 |
| | | | | |
Amendment to IAS 12: Income tax19: Benefits to employees | | January 2016february 2018 | | 01/01/20172019 |
| | | | | |
| (ii) Improvements | | | | |
| | | | | |
Improvements to International Financial Reporting Standards (2014-2016 cycle): IFRS 12 Disclosure of interests in other entities | | December 2016 | | 01/01/2017 |
The application of standards, amendments, interpretations and improvements had no material impact on the consolidated financial statements of the Company.
(b) Accounting pronouncements not yet in force for financial years beginning on January 1, 2017 and which has not been effected early adoption
(i) Standards and amendments | | Date of issue | | Mandatory
Application:
Annual periods
beginning on or after
|
| | | | |
IFRS 9: Financial instruments. | | December 2009 | | 01/01/2018 |
| | | | |
Amendment to IFRS 9: Financial instruments. | | November 2013 | | 01/01/2018 |
| | | | |
IFRS 15: Revenue from contracts with customers (1). | | May 2014 | | 01/01/2018 |
| | | | |
Amendment to IFRS 15: Revenue from contracts with customers. | | April 2016 | | 01/01/2018 |
| | | | Mandatory |
| | | | Application: |
(i) Standards and amendments | | Date of issue | | Annual periods
beginning on or after |
| | | | |
Amendment to IFRS 2: Share-based payments | | June 2016 | | 01/01/2018 |
| | | | |
Amendment to IFRS 4: Insurance contracts. | | September 2016 | | 01/01/2018 |
| | | | |
Amendment to IAS 40: Investment property | | December 2016 | | 01/01/2018 |
| | | | |
IFRS 16: Leases (2). | | January 2016 | | 01/01/2019 |
| | | | |
Amendment to IFRS 9: Financial Instruments | | October 2017 | | 01/01/2019 |
| | | | |
Amendment to IAS 28: Investments in associates and joint ventures | | October 2017 | | 01/01/2019 |
| | | | |
IFRS 17: Insurance contracts | | May 2017 | | 01/01/2021 |
| | | | |
Amendment to IFRS 10: Consolidated financial statements and IAS 28 Investments in associates and joint ventures. | | September 2014 | | To be determined |
| | | | |
(ii) Improvements | | | | |
| | | | |
Improvements to International Financial Reporting Standards. (cycle 2014-2016) IFRS 1: First-time adoption of international financial reporting standards and IAS 28 investments in associates and joint ventures. | | December 2016 | | 01/01/2018 |
| | | | |
Improvements to International Financial Reporting Standards. (cycle 2015-2017) IFRS 3: Business combinations, Business combination; IAS 12: Income tax,tax; IFRS 11: Joint arrangementsagreements and IAS 23: Borrowing costs23 Costs for loans. | | Decemberdecember 2017 | | 01/01/2019 |
| | | | | |
| (iii) Interpretations | | | | |
| | | | | |
IFRIC 22: Foreign currency transactions and advance consideration | | December 2016 | | 01/01/2018 |
| | | | |
IFRIC 23: Uncertain tax positions | | Junejune 2017 | | 01/01/2019 |
The application of these accounting pronouncements as of January 1, 2019, had no significant effects on the consolidated financial statements of the Company; with the exception of those originated by the application of IFRS 16: Leases described as follow.
During the year, the Company has recognized the changes, in the consolidated financial statements, as a result of the adoption of IFRS 16 retrospectively; restating the comparative figures, in accordance with the provisions of IAS 8 Accounting policies, changes in accounting estimates and errors.
The impacts of the adoption of IFRS 9 Financial Instruments, IFRS 15 Revenue from contracts with customers and IFRS 16 Leases are as follows:
Consolidated statement of financial position (extract)
a) As of January 1, 2017:
| | | | | As of | | | Adoption | | | As of | |
| | | | | December 31 | | | impact | | | January 1, | |
| | | Note | | 2016 | | | IFRS 16 | | | 2017 | |
| | | | | ThUS$ | | | ThUS$ | | | ThUS$ | |
| | | | | | | | | | | Restated | |
| Current assets | | | | | | | | | | | |
| Other non-financial assets, current | | 12 | | | 212,242 | | | | (25,567 | )(9) | | | 186,675 | |
| | | | | | | | | | | | | | | |
| Non-current assets | | | | | | | | | | | | | | |
| Properties, plants and equipment | | 17 | | | 10,498,149 | | | | 2,931,101 | (9) | | | 13,429,250 | |
| | | | | | | | | | | | | | | |
| Current liabilities | | | | | | | | | | | | | | |
| Other current financial liabilities | | 7-19 | | | 1,839,528 | | | | 311,307 | (11) | | | 2,150,835 | |
| | | | | | | | | | | | | | | |
| Non-current liabilities | | | | | | | | | | | | | | |
| Other non current financial liabilities | | 7-19 | | | 6,796,952 | | | | 2,881,149 | (11) | | | 9,678,101 | |
| Accounts payable commercial and other | | 7-24 | | | 359,391 | | | | 20,065 | (9) | | | 379,456 | |
| Deferred tax liability | | 18 | | | 915,759 | | | | (61,343 | )(10) | | | 854,416 | |
| Equity | | | | | | | | | | | | | | |
| Equity attributable to the owners of the parent | | | | | | | | | | | | | | |
| Accumulated earnings | | 25 | | | 366,404 | | | | (460,173 | )(12) | | | (93,769 | ) |
| Other reserves | | 25 | | | 580,870 | | | | 215,299 | (12) | | | 796,169 | |
| Non-controlling interest | | 14 | | | 88,644 | | | | (771 | )(12) | | | 87,873 | |
b) As of January 1, 2018:
| | | | | As of | | | Adoption | | | As of | | | Adoption | | | As of | |
| | | | | December 31, | | | impact | | | January 1 | | | impact | | | January 1, | |
| | | Note | | 2017 | | | IFRS 9 | | | IFRS 15 | | | 2018 | | | IFRS 16 | | | 2018 | |
| | | | | ThUS$ | | | THUS$ | | | ThUS$ | | | ThUS$ | | | ThUS$ | | | ThUS$ | |
| | | | | | | | | | | | | | | | | | | | Restated | |
| Current assets | | | | | | | | | | | | | | | | | | | | |
| Other non-financial assets, current | | 12 | | | 221,188 | | | | - | | | | 54,361 | (4) | | | 275,549 | | | | (30,771 | )(9) | | | 244,778 | |
| Trade debtors and other accounts receivable, current | | 7 - 8 | | | 1,214,050 | | | | (11,105 | )(1) | | | - | | | | 1,202,945 | | | | - | | | | 1,202,945 | |
| | | | | | | | | | | | | | | | | | | | | | | | | | | |
| Non-current assets | | | | | | | | | | | | | | | | | | | | | | | | | | |
| Other non-financial assets, non current | | 12 | | | 220,807 | | | | - | | | | - | | | | 220,807 | | | | (8,604 | )(9) | | | 212,203 | |
| Properties, plants and equipment | | 17 | | | 10,065,335 | | | | - | | | | - | | | | 10,065,335 | | | | 2,865,317 | (9) | | | 12,930,652 | |
| Deferred tax assets | | 18 | | | 364,021 | | | | 89 | (2) | | | 6,005 | (7) | | | 370,115 | | | | 449 | (10) | | | 370,564 | |
| | | | | | | | | | | | | | | | | | | | | | | | | | | |
| Current liabilities | | | | | | | | | | | | | | | | | | | | | | | | | | |
| Other current financial liabilities | | 7 - 19 | | | 1,300,949 | | | | - | | | | - | | | | 1,300,949 | | | | 319,030 | (11) | | | 1,619,979 | |
| Trade and other accounts payables | | 7 - 20 | | | 1,695,202 | | | | - | | | | (22,192 | )(5) | | | 1,673,010 | | | | (4,398 | )(9) | | | 1,668,612 | |
| Other non-financial liabilities, current | | 22 | | | 2,823,963 | | | | - | | | | 77,640 | (6) | | | 2,901,603 | | | | - | | | | 2,901,603 | |
| | | | | | | | | | | | | | | | | | | | | | | | | | | |
| Non-current liabilities | | | | | | | | | | | | | | | | | | | | | | | | | | |
| Other non current financial liabilities | | 7 - 19 | | | 6,605,508 | | | | - | | | | - | | | | 6,605,508 | | | | 2,827,942 | (11) | | | 9,433,450 | |
| Accounts payable commercial and other | | 7 - 24 | | | 498,832 | | | | - | | | | - | | | | 498,832 | | | | 60,611 | (9) | | | 559,443 | |
| Deferred tax liability | | 18 | | | 949,697 | | | | (1,021 | )(2) | | | 4,472 | (5) | | | 953,148 | | | | (75,400 | )(10) | | | 877,748 | |
| | | | | | | | | | | | | | | | | | | | | | | | | | | |
| Equity | | | | | | | | | | | | | | | | | | | | | | | | | | |
| Equity attributable to the owners of the Accumulated earnings | | 25 | | | 475,118 | | | | (9,995 | )(3) | | | 446 | (8) | | | 465,569 | | | | (506,581 | )(12) | | | (41,012 | ) |
| Other reserves | | 25 | | | 554,884 | | | | - | | | | - | | | | 554,884 | | | | 205,877 | (12) | | | 760,761 | |
| Non-controlling interest | | 14 | | | 91,147 | | | | - | | | | - | | | | 91,147 | | | | (690 | )(12) | | | 90,457 | |
c) As of December 31, 2018:
| | | | | As of | | | Adoption | | | As of | |
| | | | | December 31, | | | impact | | | December 31, | |
| | | Note | | 2018 | | | IFRS 16 | | | 2018 | |
| | | | | ThUS$ | | | ThUS$ | | | ThUS$ | |
| | | | | | | | | | | Restated | |
| Current assets | | | | | | | | | | | |
| Other non-financial assets, current | | 12 | | | 320,977 | | | | (30,501 | )(9) | | | 290,476 | |
| | | | | | | | | | | | | | | |
| Non-current assets | | | | | | | | | | | | | | |
| Other non-financial assets, non current | | 12 | | | 233,741 | | | | (6,200 | )(9) | | | 227,541 | |
| Properties, plants and equipment | | 17 | | | 9,953,365 | | | | 2,548,444 | (9) | | | 12,501,809 | |
| Deferred tax assets | | 18 | | | 273,328 | | | | 201 | (10) | | | 273,529 | |
| | | | | | | | | | | | | | | |
| Current liabilities | | | | | | | | | | | | | | |
| Other current financial liabilities | | 7-19 | | | 1,430,789 | | | | 363,497 | (11) | | | 1,794,286 | |
| | | | | | | | | | | | | | | |
| Non-current liabilities | | | | | | | | | | | | | | |
| Other non current financial liabilities | | 7-19 | | | 5,864,910 | | | | 2,494,552 | (11) | | | 8,359,462 | |
| Accounts payable commercial and other | | 7-24 | | | 483,656 | | | | 45,621 | (9) | | | 529,277 | |
| Deferred tax liability | | 18 | | | 872,121 | | | | (85,550 | )(10) | | | 786,571 | |
| Equity | | | | | | | | | | | | | | |
| Equity attributable to the owners of the parent | | | | | | | | | | | | | | |
| Accumulated earnings | | 25 | | | 597,676 | | | | (378,705 | )(12) | | | 218,971 | |
| Other reserves | | 25 | | | (76,926 | ) | | | 72,561 | (12) | | | (4,365 | ) |
| Non-controlling interest | | 14 | | | 79,940 | | | | (32 | )(12) | | | 79,908 | |
- Effects of adopting IFRS 9
| (1) | Expected credit losses: The Company modified the calculation of the impairment provision to comply with the expected credit loss model, established in IFRS 9 Financial Instruments, which replaces the current loss impairment model incurred. To the calculate percentage of credit losses, a risk matrix was used, grouping the portfolio, according to similar characteristics of risk and maturity. This change resulted in the recognition of an increase in the provision for impairment losses of US $ (11.1) million. |
This standard also includes requirements related to the classification and measurement of financial assets and liabilities and an expected credit loss model that replaces the current loss impairment model incurred.
As of January 1, 2018, the calculation of the impairment losses provision are as follows:
| | | Portfolio maturity | |
| | | | | | | | | Up to | | | Up to | | | More than | | | | |
| | | | | | Up to | | | 91 to | | | 181 to | | | 360 | | | | |
| | | Up to date | | | 90 days | | | 180 days | | | 360 days | | | days | | | Total | |
| | | ThUS$ | | | ThUS$ | | | ThUS$ | | | ThUS$ | | | ThUS$ | | | ThUS$ | |
| Expected loss rate | | | 1 | % | | | 21 | % | | | 46 | % | | | 67 | % | | | 94 | % | | | 8 | % |
| Gross book value | | | 1,046,909 | | | | 36,241 | | | | 12,001 | | | | 14,623 | | | | 66,022 | | | | 1,175,796 | |
| Impairment provision | | | (13,570 | ) | | | (7,774 | ) | | | (5,499 | ) | | | (9,803 | ) | | | (61,787 | ) | | | (98,433 | ) |
| (2) | Deferred tax adjustments originated by the application of IFRS 9. |
| (3) | Net effect on accumulated results of the adjustments indicated above. |
In addition to the impacts on the consolidated statement of financial position, the application of IFRS 9: Financial Instruments requires the classification of financial instruments according to the business model, to determine the form of measurement of financial instruments, after their initial recognition.
The Company analyzed the business models and classified its financial assets and liabilities according to the following:
| | | Classification IAS 39 | | | Classification IFRS 9 | | | | |
| Assets | | Loans
and
receivables | | | Hedge
and
derivatives | | | Held
for
trading | | | Initial
as fair value
through profit
and loss | | | Cost
amortized | | | At fair value
with changes
in results | | | Total | |
| | | ThUS$ | | | ThUS$ | | | ThUS$ | | | ThUS$ | | | ThUS$ | | | ThUS$ | | | ThUS$ | |
| Balance as of December 31, 2017 | | | 2,446,864 | | | | 62,867 | | | | 1,915 | | | | 501,890 | | | | - | | | | - | | | | 3,013,536 | |
| Cash and cash equivalents | | | (1,112,346 | ) | | | - | | | | - | | | | (29,658 | ) | | | 1,112,346 | | | | 29,658 | | | | - | |
| Other financial assets, current | | | (23,918 | ) | | | - | | | | (1,421 | ) | | | (472,232 | ) | | | 23,918 | | | | 473,653 | | | | - | |
| Trade debtors and other accounts receivable, current | | | (1,214,050 | ) | | | - | | | | - | | | | - | | | | 1,214,050 | | | | - | | | | - | |
| Accounts receivable from entities related, current | | | (2,582 | ) | | | - | | | | - | | | | - | | | | 2,582 | | | | - | | | | - | |
| Other financial assets, non-current | | | (87,077 | ) | | | - | | | | (494 | ) | | | - | | | | 87,077 | | | | 494 | | | | - | |
| Accounts receivable, non-current | | | (6,891 | ) | | | - | | | | - | | | | - | | | | 6,891 | | | | - | | | | - | |
| Balance as of January 1, 2018 | | | - | | | | 62,867 | | | | - | | | | - | | | | 2,446,864 | | | | 503,805 | | | | 3,013,536 | |
| | | Classification IAS 39 | | | Classification IFRS 9 | | | | |
| Liabilities | | Others
financial
liabilities | | | Held
hedge
derivatives | | | Cost
amortized | | | Total | |
| | | ThUS$ | | | ThUS$ | | | ThUS$ | | | ThUS$ | |
| Balance as of December 31, 2017 | | | 10,086,434 | | | | 14,817 | | | | - | | | | 10,101,251 | |
| Other current financial liabilities | | | (1,288,749 | ) | | | - | | | | 1,288,749 | | | | - | |
| Trade accounts payable and other accounts payable, current | | | (1,695,202 | ) | | | - | | | | 1,695,202 | | | | - | |
| Accounts payable to related entities, current | | | (760 | ) | | | - | | | | 760 | | | | - | |
| Other financial liabilities, not current | | | (6,602,891 | ) | | | - | | | | 6,602,891 | | | | - | |
| Accounts payable, not current | | | (498,832 | ) | | | - | | | | 498,832 | | | | - | |
| Balance as of January 1, 2018 (*) | | | - | | | | 14,817 | | | | 10,086,434 | | | | 10,101,251 | |
| (*) | Balances as of January 1, 2018 do not contain the re-expression effects originated by IFRS 16. |
- Effects of adopting IFRS 15
(4) Contract costs: The Company has capitalized the costs related to the revenues from air transport of passengers, corresponding to: the commissions charged by the credit card administrators for US$ 22.0 million and the air ticket booking services through the system general distribution (GDS) for US$ 15.6 million. Additionally, there is a reclassification of commissions from travel agencies for US$ 16.8 million, which previously were presented, according IAS 18, net of the liability to fly in other non-financial liabilities.
(5) Contract liabilities: The Company has adjusted certain concepts that were recorded as obligations with suppliers and customers, which must now be treated as contract liabilities; therefore, they must be deferred until the benefit of the service have been rendered. These concepts are mainly related to the ground transportation service for US $ 15.6 million and traveler’s checks for US $ 6.6 million.
(6) Performance Obligations: The Company analyzed the moment in which the performance obligations identified in the contracts with customers must be recognized in the consolidated result. During this analysis, some concepts were identified which must be deferred until the moment of service provision, mainly related to land transportation services, charges for modifications to the initial contract in the sale of tickets and redeem of some products associated with loyalty programs for US$ 60.8 million. Additionally, there is the reclassification detailed in numeral (4) for US$ 16.8 million.
(7) Deferred tax adjustments originated by the application of IFRS 15.
(8) Net effect on accumulated results of the adjustments indicated above.
Additionally, the Company concluded that, in the rendering of certain services, it acted as agent in the provision of these services, therefore some reclassifications were made in the consolidated income statement to reflect the corresponding commission.
- Effects of adopting IFRS 16
(9) Company recognized under Property, plant and equipment right of use assets for US $ 2,865.3 million as of January 1, 2018 and US $ 2,548.4 as of December 31, 2018, associated with contracts that meet the definition of lease (Note 2.21 & 17).
The Company decrease other financial assets related to advance payments for leases for US $ 39.4 million as of January 1, 2018 and US $ 36.7 as of December 31, 2018, since with the application of the standard these amounts are considered in the initial measurement of the right of use asset.
The Company increased the cost of restoration associated with the return of aircraft and engines for US $ 56.2 million as of January 1, 2018 and US $ 45.6 million as of December 31, 2018. With the application of the standard, the net present value of this cost was included in the asset for right of use and its counterpart in the line of accounts payable, current or non-current, depending on the return date of the aircraft or engines.
(10) Deferred taxes: adjustments originated by the application of IFRS 16.
(11) Lease liabilities: The Company recognized within the Other financial liabilities for lease for US$ 3,147.0 million as of January 1, 2018 and US$ 2,858.0 million as of December 31, 2018, associated with contracts that meet the definition of lease (Note 2.21 & 19).
(12) The effect of the recognition of the leases under IFRS 16 generated a decrease in retained earnings of US$ 506.6 million as of January 1, 2018 (US$ 378.7 million as of December 31, 2018). The increase in Other reserves of US$ 205.9 million as of January 1, 2018 (decrease of US$ 72,5 million as of December 31, 2018), was caused by the Cumulative translation adjustment of those subsidiaries with functional currencies other than the US dollar. The application of IFRS 16 also affected non-controlling interests.
The effects of the changes recognized in the application of IFRS 15 and IFRS 16 as of December 31, 2017 are presented in the consolidated income statement:
Impact recognized as a result of the adoption of IFRS 16 as of December 31, 2017 are presented in the consolidated income statement:
| | | | | For the year ended december 31, 2017 | |
| Reconciliation income | | | | Adjustments for reconciliation | |
| | | | | Results under | | | Adoption impact | | | Results under | |
| | | Nota | | IAS 17 | | | IFRS16 | | | IFRS 16 | |
| | | | | ThUS$ | | | ThUS$ | | | ThUS$ | |
| | | | | Published | | | | | | Restated | |
| Revenue | | 26 | | | 9,613,907 | | | | - | | | | 9,613,907 | |
| Cost of sales | | | | | (7,441,849 | ) | | | 162,491 | | | | (7,279,358 | ) |
| Gross margin | | | | | 2,172,058 | | | | 162,491 | | | | 2,334,549 | |
| | | | | | | | | | | | | | | |
| Other income | | 28 | | | 549,889 | | | | - | | | | 549,889 | |
| Distribution costs | | | | | (699,600 | ) | | | 2,816 | | | | (696,784 | ) |
| Administrative expenses | | | | | (938,931 | ) | | | (13,837 | ) | | | (952,768 | ) |
| Other expenses | | | | | (368,883 | ) | | | 3,423 | | | | (365,460 | ) |
| Other gains (losses) | | | | | (7,754 | ) | | | - | | | | (7,754 | ) |
| Income from operation activities | | | | | 706,779 | | | | 154,893 | | | | 861,672 | |
| | | | | | | | | | | | | | | |
| Financial income | | | | | 78,695 | | | | - | | | | 78,695 | |
| Financial costs | | 27 | | | (393,286 | ) | | | (185,947 | ) | | | (579,233 | ) |
| Foreign exchange gains (losses) | | 29 | | | (18,718 | ) | | | (29,780 | ) | | | (48,498 | ) |
| Result of indexation units | | | | | 748 | | | | - | | | | 748 | |
| Income (loss) before taxes | | | | | 374,218 | | | | (60,834 | ) | | | 313,384 | |
| Income (loss) tax expense / benefit | | 18 | | | (173,504 | ) | | | 14,506 | | | | (158,998 | ) |
| | | | | | | | | | | | | | | |
| NET INCOME (LOSS) FOR THE YEAR | | | | | 200,714 | | | | (46,328 | ) | | | 154,386 | |
| | | | | | | | | | | | | | | |
| Income (loss) attributable to owners of the parent | | | | | 155,304 | | | | (46,408 | ) | | | 108,896 | |
| Income (loss) attributable to non- controlling interest | | 14 | | | 45,410 | | | | 80 | | | | 45,490 | |
| Net income (loss) for the year | | | | | 200,714 | | | | (46,328 | ) | | | 154,386 | |
Impact recognized as a result of the adoption of IFRS 15 and IFRS 16 as of December 31, 2018 are presented in the consolidated income statement:
| | | | | | For the year ended december 31, 2018 | |
| Reconciliation Revenue | | | | | | | | Adjustments for reconciliation | | | | |
| | | Nota | | | Results
under
IFRS 15 | | | Adoption
impact
IFRS 16 | | | Results
under
IFRS 15 | | | Contract
costs (4) | | | Deferred
revenues
recognition
[(5), (6)] | | | Reclassifications | | | Results
under
IAS 18 | |
| | | | | | ThUS$ | | | ThUS$ | | | ThUS$ | | | ThUS$ | | | ThUS$ | | | ThUS$ | | | ThUS$ | |
| | | | | | Published | | | | | | Restated | | | | | | | | | | | | | |
| | | | | | | | | | | | IFRS 16 | | | | | | | | | | | | | |
| | | | | | | | | | | | | | | | | | | | | | | | | |
| Revenue | | | 26 | | | | 9,895,456 | | | | - | | | | 9,895,456 | | | | - | | | | 48,561 | | | | 31,501 | | | | 9,975,518 | |
| Cost of sales | | | | | | | (7,962,843 | ) | | | 189,411 | | | | (7,773,432 | ) | | | - | | | | (34,986 | ) | | | - | | | | (7,808,418 | ) |
| Gross margin | | | | | | | 1,932,613 | | | | 189,411 | | | | 2,122,024 | | | | - | | | | 13,575 | | | | 31,501 | | | | 2,167,100 | |
| Other income | | | 28 | | | | 472,758 | | | | - | | | | 472,758 | | | | - | | | | - | | | | 42,563 | | | | 515,321 | |
| Distribution costs | | | | | | | (619,200 | ) | | | 3,986 | | | | (615,214 | ) | | | (43 | ) | | | - | | | | (20,003 | ) | | | (635,260 | ) |
| Administrative expenses | | | | | | | (721,270 | ) | | | (15,063 | ) | | | (736,333 | ) | | | (806 | ) | | | - | | | | (54,061 | ) | | | (791,200 | ) |
| Other expenses | | | | | | | (359,781 | ) | | | 3,531 | | | | (356,250 | ) | | | - | | | | - | | | | - | | | | (356,250 | ) |
| Other gains (losses) | | | | | | | 53,499 | | | | - | | | | 53,499 | | | | - | | | | - | | | | - | | | | 53,499 | |
| Income from operation activities | | | | | | | 758,619 | | | | 181,865 | | | | 940,484 | | | | (849 | ) | | | 13,575 | | | | - | | | | 953,210 | |
| Financial income | | | | | | | 53,253 | | | | - | | | | 53,253 | | | | - | | | | - | | | | - | | | | 53,253 | |
| Financial costs | | | 27 | | | | (356,269 | ) | | | (182,868 | ) | | | (539,137 | ) | | | - | | | | - | | | | - | | | | (539,137 | ) |
| Foreign exchange gains (losses) | | | 29 | | | | (157,709 | ) | | | 119,639 | | | | (38,070 | ) | | | - | | | | - | | | | - | | | | (38,070 | ) |
| Result of indexation units | | | | | | | (865 | ) | | | - | | | | (865 | ) | | | - | | | | - | | | | - | | | | (865 | ) |
| Income (loss) before taxes | | | | | | | 297,029 | | | | 118,636 | | | | 415,665 | | | | (849 | ) | | | 13,575 | | | | - | | | | 428,391 | |
| Income (loss) tax expense / benefit | | | 18 | | | | (83,782 | ) | | | 9,903 | | | | (73,879 | ) | | | (23 | ) | | | (1,030 | ) | | | - | | | | (74,932 | ) |
| NET INCOME (LOSS) FOR THE YEAR | | | | | | | 213,247 | | | | 128,539 | | | | 341,786 | | | | (872 | ) | | | 12,545 | | | | - | | | | 353,459 | |
| Income (loss) attributable to owners of the parent | | | | | | | 181,935 | | | | 127,876 | | | | 309,811 | | | | (872 | ) | | | 12,545 | | | | - | | | | 321,484 | |
| Income (loss) attributable to non-controlling interest | | | 14 | | | | 31,312 | | | | 663 | | | | 31,975 | | | | - | | | | - | | | | - | | | | 31,975 | |
| Net income (loss) for the period | | | | | | | 213,247 | | | | 128,539 | | | | 341,786 | | | | (872 | ) | | | 12,545 | | | | - | | | | 353,459 | |
In the income statement, with the implementation of the IFRS16 standard, restated were made in the following lines:
| - | Cost of sale, distribution costs, administrative expenses: net effect of derecognized of rental cost and recognition of the depreciation of the right of use. |
| - | Financial Costs: interest expense corresponding to the lease liability. |
Impact recognized as a result of the adoption of IFRS 16 for the year ended of December 31, 2017 and 2018 are presented in the consolidated statement of cash flows:
| | | For the year ended | | | Adoption | | | For the year ended | |
| | | December 31, | | | impact | | | December 31, | |
| | | 2017 | | | IFRS 16 | | | 2017 | |
| | | ThUS$ | | | ThUS$ | | | ThUS$ | |
| | | | | | | | | Restated | |
| | | | | | | | | | |
| Payments to suppliers for goods and services | | | (6,722,713 | ) | | | 520,082 | (1) | | | (6,202,631 | ) |
| Net cash flows from operating activities | | | (6,722,713 | ) | | | 520,082 | | | | (6,202,631 | ) |
| | | | | | | | | | | | |
| Loans repayments | | | (1,829,191 | ) | | | (344,901 | )(2) | | | (2,174,092 | ) |
| Payments of finance lease liabilities | | | (344,901 | ) | | | 344,901 | (2) | | | - | |
| Payments of lease liabilities | | | - | | | | (338,179 | )(1) | | | (338,179 | ) |
| Interest paid | | | (389,724 | ) | | | (181,903 | )(1) | | | (571,627 | ) |
| Net cash flows (used in) financing activities | | | (2,563,816 | ) | | | (520,082 | ) | | | (3,083,898 | ) |
| | | For the year ended | | | Adoption | | | For the year ended | |
| | | December 31, | | | impact | | | December 31, | |
| | | 2018 | | | IFRS 16 | | | 2018 | |
| | | ThUS$ | | | ThUS$ | | | ThUS$ | |
| | | | | | | | | Restated | |
| | | | | | | | | | |
| Payments to suppliers for goods and services | | | (7,331,390 | ) | | | 556,387 | (1) | | | (6,775,003 | ) |
| Net cash flows from operating activities | | | (7,331,390 | ) | | | 556,387 | | | | (6,775,003 | ) |
| | | | | | | | | | | | | |
| Loans repayments | | | (1,045,662 | ) | | | (692,687 | )(2) | | | (1,738,349 | ) |
| Payments of finance lease liabilities | | | (692,687 | ) | | | 692,687 | (2) | | | - | |
| Payments of lease liabilities | | | - | | | | (373,439 | )(1) | | | (373,439 | ) |
| Interest paid | | | (357,355 | ) | | | (182,948 | )(1) | | | (540,303 | ) |
| Net cash flows (used in) financing activities | | | (2,095,704 | ) | | | (556,387 | ) | | | (2,652,091 | ) |
| (1) | Correspond to the reclassification of lease payments,principal to payment of lease liability and interest to interest paid. |
| | F-21 | |
| (2) | Correspond to the reclassification of leases payments previously classified as financial lease. |
(b) Accounting pronouncements not yet in force for financial years beginning on January 1, 2019 and which has not been early adopted.
(i) Standards and amendments | Date of issue | Effective Date |
| | |
IFRS 17: Insurance contracts | May 2017 | January 1, 2021 |
| | |
| Amendment to IFRS 10: Consolidated financial statements and IAS 28 Investments in associates and joint ventures. | September 2014 | To be determined |
| | |
| Amendment to IFRS 3: Business combination | October 2018 | January 1, 2020 |
| | |
| Amendment to IAS 1: Presentation of financial statements and IAS 8 Accounting Policies, Changes in Accounting Estimates and Errors | October 2018 | January 1, 2020 |
| | |
Amendment to IFRS 9: Financial instruments; IAS 39: Financial instruments: Recognition and measurement; Y IFRS 7: Financial instruments: Disclosures | September 2019 | January 1, 2020 |
The Company’s management believesof the Company estimates that the adoption of the standards, amendments and interpretationsInterpretations described above but not yet effective would not have a significant impact on the Company’s consolidated financial statements in the year of their first application, except for IFRS 15 and IFRS 16:
| (1) | IFRS 15 Revenue from Contracts with Customers supersedes actual standard for revenue recognition that actually uses the Company, as IAS 18 Revenue and IFRIC 13 Customer Loyalty Programmes. The core principle of IFRS 15 is that an entity recognizes revenue to depict the transfer of promised goods or services to customers in an amount that reflects the consideration to which the entity expects to be entitled in exchange for those goods or services. This standards supersedes IFRS 15 supersedes, IAS 11 Construction Contracts, IAS 18 Revenue, IFRIC 13 Customer Loyalty Programmes, IFRIC 15 Agreements for the Construction of Real Estate, IFRIC 18 Transfers of Assets from Customers; and SIC-31 Revenue - Barter Transactions Involving Advertising Services. |
The Company evaluated the possible adoption impacts that this new standard will have on the consolidated financial statements and has identified changes in: i) the recognition of the income associated with the fines for changes, which were previously recognized at the time of the sale and now will be considered as a modification of the initial transport contract and therefore the recognition must be deferred until the rendering of the service; ii) the moment of recognition of the income from the sale of some services or products, where the Company concluded that it acted as principal, and therefore the revenues must be deferred until the service is rendered; and iii) the presentation of the income associated with the sale of products, where the Company concluded that it acted as agent and therefore the income must be presented net of the associated costs.
As of December 31, 2017, the effect of the changes indicated above As of December 31, 2017, the effect of the changes indicated above, will not have a significant impact on the Company’s consolidated financial statements of the Company in the yearapplication of its first adoption. At the close consolidated financial statements, the Company is analyzing the possible effects of the amendment issued in September 2019 to IFRS 9, IAS 39 and IFRS 7 for the reform of interest rates of reference.
| (2) | The IFRS 16 Leases add important changes in the accounting for lessees by introducing a similar treatment to financial leases for all operating leases with a term of more than 12 months. This mean, in general terms, that an asset should be recognized for the right to use the underlying leased assets and a liability representing its present value of payments associate to the agreement. Monthly leases payments will be replace by the asset depreciation and a financial cost in the income statement. |
We are evaluating the impact that the adoption of the new lease rule will have on the consolidated financial statements. Currently, we believe that the adoption of this new standard will have a significant impact on the consolidated statement of financial position due to the recording of an asset for right of use and a liability, corresponding to the recording of the leases that are currently registered as operating leases.
LATAM Airlines Group S.A. and subsidiaries are still assessing this standard to determinate the effect on their Financial Statements, covenants and other financial indicators.
| 2.2. | 2.2. | Basis of Consolidation |
Subsidiaries are all the entities (including special-purpose entities) over which the Company has the power to control the financial and operating policies, which are generally accompanied by a holding of more than half of the voting rights. In evaluating whether the Company controls another entity, the existence and effect of potential voting rights that are currently exercisable or convertible at the date of the consolidated financial statements are considered. The subsidiaries are consolidated from the date on which control is passed to the Company and they are excluded from the consolidation on the date they cease to be so controlled. The results and flows are incorporated from the date of acquisition.
Balances, transactions and unrealized gains on transactions between the Company’s entities are eliminated. Unrealized losses are also eliminated unless the transaction provides evidence of an impairment loss of the asset transferred. When necessary in order to ensure uniformity with the policies adopted by the Company, the accounting policies of the subsidiaries are modified.
To account for and identify the financial information revealed when carrying out a business combination, such as the acquisition of an entity by the Company, is apply the acquisition method provided for in IFRS 3: Business combination.
| (b) | Transactions with non-controlling interests |
The CompanyGroup applies the policy of considering transactions with non-controlling interests, when not related to loss of control, as equity transactions without an effect on income.
When a subsidiary is sold and a percentage of participation is not retained, the Company derecognizes assets and liabilities of the subsidiary, the non-controlling and other components of equity related to the subsidiary. Any gain or loss resulting from the loss of control is recognized in the consolidated income statement in Other gains (losses).
If LATAM Airlines Group S.A. and Subsidiaries retain an ownership of participation in the sold subsidiary, and does not represent control, this is recognized at fair value on the date that control is lost, the amounts previously recognized in Other comprehensive income are accounted as if the Company had disposed directly from the assets and related liabilities, which can cause these amounts are reclassified to profit or loss. The percentage retained valued at fair value is subsequently accounted using the equity method.
| (d) | Investees or associates |
Investees or associates are all entities over which LATAM Airlines Group S.A. and Subsidiaries have significant influence but have no control. This usually arises from holding between 20% and 50% of the voting rights. Investments in associates are booked using the equity method and are initially recognized at their cost.
| 2.3. | Foreign currency transactions |
| (a) | Presentation and functional currencies |
The items included in the financial statements of each of the entities of LATAM Airlines Group S.A. and Subsidiaries are valued using the currency of the main economic environment in which the entity operates (the functional currency). The functional currency of LATAM Airlines Group S.A. is the United States dollar which is also the presentation currency of the consolidated financial statements of LATAM Airlines Group S.A. and Subsidiaries.
| (b) | Transactions and balances |
Foreign currency transactions are translated to the functional currency using the exchange rates on the transaction dates. Foreign currency gains and losses resulting from the liquidation of these transactions and from the translation at the closing exchange rates of the monetary assets and liabilities denominated in foreign currency are shown in the consolidated statement of income by function except when deferred in Other comprehensive income as qualifying cash flow hedges.
| (c) | Adjustment due to hyperinflation |
After July 1, 2018, the Argentine economy was considered, for purposes of IFRS, hyperinflationary. The financial statements of the subsidiaries whose functional currency is the Argentine Peso have been restated.
The non-monetary items of the statement of financial position as well as the income statement, comprehensive incomes and cash flows of the group’s entities, whose functional currency corresponds to a hyperinflationary economy, are adjusted for inflation and re-expressed in accordance with the variation of the consumer price index (“CPI”), at each presentation date of its financial statements. The re-expression of non-monetary items is made from the date of initial recognition in the statements of financial position and considering that the financial statements are prepared under the historical cost criterion.
Net losses or gains arising from the re-expression of non-monetary items and income and costs are recognized in the consolidated income statement under “Result of indexation units”.
Net gains and losses on the re-expression of opening balances due to the initial application of IAS 29 are recognized in the consolidated retained earnings.
Re-expression due to hyperinflation will be recorded until the period in which the economy of the entity ceases to be considered as a hyperinflationary economy, at that time, the adjustments made by hyperinflation will be part of the cost of non-monetary assets and liabilities.
The comparative amounts in the Consolidated financial statements of the Company are presented in a stable currency and are not adjusted for subsequent changes in the price level or exchange rates.
The results and the financial positionsituation of all the Group’s entities, whose functional currency is different from the presentation currency of the consolidated financial statements, of LATAM Airlines Group entities (none ofS.A., which hasdoes not correspond to the currency of a hyper-inflationary economy) that have a functionalhyperinflationary economy, are converted into the currency other than theof presentation currency are translated to the presentation currency as follows:
(i) Assets and liabilities of each consolidated statement of financial position presented are translated at the closing exchange rate on the consolidated statement of financial position date;
(ii) The revenues and expenses of each income statement account are translated at the exchange rates prevailing on the transaction dates, and
(iii) All the resultant exchange differences by conversion are shown as a separate component in other comprehensive income.
For those subsidiaries of the group whose functional currency is different from the presentation currency and, moreover, corresponds to the currency of a hyperinflationary economy; its restated results, cash flow and financial situation are converted to the presentation currency at the closing exchange rate on the date of the consolidated financial statements.
The exchange rates used correspond to those fixed in the country where the subsidiary is located, whose functional currency is different to the U.S. dollar.
Adjustments to the Goodwill and fair value arising from the acquisition of a foreign entity are treated as assets and liabilities of the foreign entity and are translated at the closing exchange rate or period informed.informed, restated when the currency came from the functional entity of the foreign entity corresponds to that of a hyperinflationary economy, the adjustments for the restatement of goodwill are recognized in the consolidated equity.
| 2.4. | Property, plant and equipment |
The land of LATAM Airlines Group S.A. and Subsidiaries, are recognized at cost less any accumulated impairment loss. The rest of the Properties, plants and equipment are recorded, both in their initial recognition and in their subsequent measurement, at their historical cost, restated for inflation when appropriate, less the corresponding depreciation and any loss due to deterioration.
The amounts of advances paid to the aircraft manufacturers are activated by the Company under Construction in progress until they are received.
Subsequent costs (replacement of components, improvements, extensions, etc.) are included in the value of the initial asset or are recognized as a separate asset, only when it is probable that the future economic benefits associated with the elements of property, plant and equipment, they will flow to the Company and the cost of the item can be determined reliably. The value of the replaced component is written off. The rest of the repairs and maintenance are charged to the result of the year in which they are incurred.
The depreciation of the properties, plants and equipment is calculated using the linear method over their estimated technical useful lives; except in the case of certain technical components which are depreciated on the basis of cycles and hours flown.
The residual value and the useful life of the assets are reviewed and adjusted, if necessary, once a year.
When the value of an asset exceeds its estimated recoverable amount, its value is immediately reduced to its recoverable amount (Note 2.8).
Losses and gains from the sale of property, plant and equipment are calculated by comparing the consideration with the book value and are included in the consolidated statement of income.
| 2.5. | Intangible assets other than goodwill |
| (a) | Airport slots and Loyalty program |
Airport slots and the Coalition and Loyalty program are intangible assets of indefinite useful life and are subject to impairment tests annually as an integral part of each CGU identified by the Company, in accordance with the premises that are applicable, included as follows:
Airport slots – Air transport CGU
Loyalty program – Coalition and loyalty program MultiplusAir transport CGU
(See Note 16)
The airport slots correspond to an administrative authorization to carry out operations of arrival and departure of aircraft at a specific airport, within a specified period.
The Loyalty program corresponds to the system of accumulation and redemption of points that has developed Multiplus S.A., subsidiaryprogram that is part of TAM Linhas Aereas S.A. (See Note 1).
The Brands, airport Slots and Loyalty program were recognized in fair values determined in accordance with IFRS 3, as a consequence of the business combination with TAM and Subsidiaries.
Licenses for computer software acquired are capitalized on the basis of the costs incurred in acquiring them and preparing them for using the specific software. These costs are amortized over their estimated useful lives, for which the Company has been defined useful lives between 3 and 10 years.
Expenses related to the development or maintenance of computer software which do not qualify for capitalization, are shown as an expense when incurred. The personnel costs and others costscost directly related to the production of unique and identifiable computer software controlled by the Company, are shown as intangible Assets others than Goodwill when they have met all the criteria for capitalization.
The Brands were acquired in the business combination with TAM S.A. andAnd Subsidiaries and recognized at fair value under IFRS. During the year 2016, the estimated useful life of the brands changechanges from an indefinite useful life to a five-year period, the period in which the value of the brands will be amortized (See Note 15).
Goodwill represents the excess of acquisition cost over the fair value of the Company’s participation in the net identifiable assets of the subsidiary orassociateon the acquisition date. Goodwill related to acquisition of subsidiaries is not amortized but tested for impairment annually or each time that there is evidence of impairment. Gains and losses on the sale of an entity include the book amount of the goodwill related to the entity sold.
Interest costs incurred for the construction of any qualified asset are capitalized over the time necessary for completing and preparing the asset for its intended use. Other interest costs are recognized in the consolidated income statement when they are accrued.
| 2.8. | Losses for impairment of non-financial assets |
Intangible assets that have an indefinite useful life and developing IT projects are not subject to amortization and are subject to annual testingtests for impairment losses or if there are indications of impairment. Assets subject to amortization are subjected toManagement conducts an impairment tests whenever any eventassessment annually or changemore frequently if events or changes in circumstances indicates that the book value of the assets may not be recoverable.indicate potential impairment. An impairment loss is recorded whenrecognized for the book value is greater thanamount by which the carrying amount of the cash generating unit exceeds its recoverable amount. The recoverable amount of an assetthe cash generating unit is the higher of itsvalue in use and fair value less costs to sell and itssell. The value in use. In evaluatinguse is determined by management using a discounted cash flow model. For the purpose of assessing impairment thelosses, assets are grouped at the lowest level for which cash flowsthere are separately identifiable (CGUs)cash flows (cash generating units). Non-financialPrior impairments of non-financial assets, other than goodwill, that have suffered an impairment loss are reviewed if there are indicators of reverse lossesfor possible reversal at each reporting date.
TheAs of January 1, 2018, the Company classifies its financial instrumentsassets in the following categories: financial assets at fair value (either through profitother comprehensive income, or through gains or losses), and loss and loans and receivables.at amortized cost. The classification depends on the purpose for whichbusiness model of the entity to manage the financial instruments were acquired. Management determinesassets and the classificationcontractual terms of the cash flows.
The group reclassifies debt investments when, and only when, it changes its financial instruments atbusiness model to manage those assets.
In the time of initial recognition, which occurs on the date of transaction.
| (a) | Financial assets at fair value through profit and loss |
Financial assetsCompany measures a financial asset at its fair value through profit and lossplus, in the case of a financial asset classified at amortized cost, the transaction costs that are directly attributable to the acquisition of the financial instruments heldasset. Transaction costs of financial assets accounted for trading and those which have been designated at fair value through profit or loss are recorded as expenses in their initial classification.the income statement.
The subsequent measurement of debt instruments depends on the group’s business model to manage the asset and cash flow characteristics of the asset. The Company has two measurement categories in which the group classifies its debt instruments:
Amortized cost: the assets held for the collection of contractual cash flows where those cash flows represent only payments of principal and interest are measured at amortized cost. A financialgain or loss on a debt investment that is subsequently measured at amortized cost and is not part of a hedging relationship is recognized in income when the asset is classified in this category if acquired mainly for the purpose of being sold in the near futurederecognized or whenimpaired. Interest income from these assets are managed and measured using fair value. Derivatives are also classified as held for trading unless they are designated as hedges. The financial assets is included in this category and have been designated initial recognitionfinancial income using the effective interest rate method.
Fair value through profit or loss,loss: assets that do not meet the criteria of amortized cost or FVOCI are classified as Cash and cash equivalents and Other current financial assets and those designated as instruments held for trading are classified as Other current and non-current financial assets.
Loans and receivables are non-derivative financial instruments with fixed or determinable payments not traded on an active market. These items are classified in current assets except for those with maturity over 12 months from the date of the consolidated statement of financial position, which are classified as non-current assets. Loans and receivables are included in trade and other accounts receivable in the consolidated statement of financial position (Note 2.12).
The regular purchases and sales of financial assets are recognized on the trade date – the date on which the Group commits to purchase or sell the asset. Investments are initially recognized at fair value plus transaction costs for all financial assets not carriedmeasured at fair value through profit or loss. Financial assets carriedA gain or loss on a debt investment that is subsequently measured at fair value through profit or losses are initiallyloss and is not part of a hedging relationship is recognized at fair value,in profit or loss and transaction costs are expensedis presented net in the income statement. Financial assets are derecognized whenstatement within other gains / (losses) in the rights to receive cash flows from the investments have expired or have been transferred and the Group has transferred substantially all risks and rewards of ownership.period in which it arises.
The
Changes in the fair value of financial assets at fair value through profit or loss are subsequently carried at fair value. Loans and receivables are subsequently carriedrecognized in other gains / (losses) in the statement of income as appropriate.
The Company evaluates in advance the expected credit losses associated with its debt instruments recorded at amortized cost using the effective interest rate method.
At the date of each consolidated statement of financial position, the Company assesses ifcost. The applied impairment methodology depends on whether there is objective evidence thathas been a financial asset or group of financial assets may have suffered an impairment loss.significant increase in credit risk.
| 2.10. | Derivative financial instruments and hedging activities |
Derivatives are bookedrecognized, in accordance with IAS 39 for hedge accounting and IFRS 9 for derivatives not qualify as hedge accounting, initially at fair value on the date on which the derivative contractscontract was made and are signed and later they continue to besubsequently valued at their fair value. The method for bookingto recognize the resultantresulting loss or gain depends on whether the derivative has been designated as a hedging instrument and, if so, the nature of the item being hedged. The Company designates certain derivatives as:
| (a) | Hedge of the fair value of recognized assets (fair value hedge); |
| (b) | Hedge of an identified risk associated with a recognized liability or an expected highly- Probable transaction (cash-flow hedge), or |
| (c) | Derivatives that do not qualify for hedge accounting. |
The Company documents, at the inception of each transaction, the relationship between the hedging instrument and the hedged item, as well as its objectives for managing risk and the strategy for carrying out various hedging transactions. The Company also documents its assessment, both at the beginning and on an ongoing basis, as to whether the derivatives used in the hedging transactions are highly effective in offsetting the changes in the fair value or cash flows of the items being hedged.
The total fair value of the hedging derivatives is booked as Other non-current financial asset or liability if the remaining maturity of the item hedged is over 12 months, and as an other current financial asset or liability if the remaining term of the item hedged is less than 12 months. Derivatives not booked as hedges are classified as Other financial assets or liabilities.
Changes in the fair value of designated derivatives that qualify as fair value hedges are shown in the consolidated statement of income, together with any change in the fair value of the asset or liability hedged that is attributable to the risk being hedged.
The effective portion of changes in the fair value of derivatives that are designated and qualify as cash flow hedges is shown in the statement of other comprehensive income. The loss or gain relating to the ineffective portion is recognized immediately in the consolidated statement of income under other gains (losses). Amounts accumulated in equity are reclassified to profit or loss in the periods when the hedged item affects profit or loss.
In case of variable interest-rate hedges, the amounts recognized in the statement of other comprehensive income are reclassified to results within financial costs at the same time the associated debts accrue interest.
For fuel price hedges, the amounts shown in the statement of other comprehensive income are reclassified to results under the line item Cost of sales to the extent that the fuel subject to the hedge is used.
For foreign currency hedges, the amounts recognized in the statement of other comprehensive income are reclassified to income as deferred revenue resulting from the use of points, are recognized as Income.
When hedging instrumentsinstrument mature, or areis sold or when they do notfails to meet the requirements to be accounted for as hedges, any gain or loss accumulated in the statement of Other comprehensive income until that moment, remains in the statement of other comprehensive income and is reclassified to the consolidated statement of income when the hedged transaction is finally recognized. When it is expected that the hedged transaction is no longer going to occur, the gain or loss accumulated in the statement of other comprehensive income is taken immediately to the consolidated statement of income as “Other gains (losses)”.
| (c) | Derivatives not booked as a hedge |
The changes in fair value of any derivative instrument that is not booked as a hedge are shown immediately in the consolidated statement of income in “Other gains (losses)”.
Inventories, detailed in Note 10, are shown at the lower of cost and their net realizable value. The cost is determined on the basis of the weighted average cost method (WAC). The net realizable value is the estimated selling price in the normal course of business, less estimated costs necessary to make the sale.
| 2.12. | Trade and other accounts receivable |
TradeCommercial accounts receivable are shown initially recognized at their fair value and latersubsequently at their amortized cost in accordance with the effective interest rate method, less the allowanceprovision for impairment according to the model of the expected credit losses. An allowance for impairment lossThe Company applies the simplified approach permitted by IFRS 9, which requires that expected lifetime losses be recognized upon initial recognition of trade accounts receivable is made when there is objective evidencereceivable.
In the event that the Company will not be abletransfers its rights to recover allany financial asset (generally accounts receivable) to a third party in exchange for a cash payment, the amounts due according toCompany evaluates whether al risks and rewards have been transferred, in which case the original terms of the accounts receivable.account receivable is derecognized.
The existence of significant financial difficulties on the part of the debtor, the probability that the debtor is entering bankruptcygoes bankrupt or financial reorganization and the default or delay in making payments are considered indicators that the receivable has been impaired. of a significant increase in credit risk.
The carrying amount of the provision is the difference between the book value of the assets and the present value of the estimated future cash flows, discounted at the original effective interest rate. The book value of the asset is reduced byas the amount of the allowanceprovision account is used and the loss is shownrecognized in the consolidated income statement under “Cost of income in Cost of sales.sales”. When an account receivable is written off, it is charged toregularized against the allowanceprovision account for accountsthe account receivable.
| 2.13. | Cash and cash equivalents |
Cash and cash equivalents include cash and bank balances, time deposits in financial institutions, and other short-term and highly liquid investments.
The common shares are classified as net equity.
Incremental costs directly attributable to the issuance of new shares or options are shown in net equity as a deduction from the proceeds received from the placement of shares.
| 2.15. | Trade and other accounts payables |
Trade payables and other accounts payable are initially recognized at fair value and subsequently at amortized cost.
| 2.16. | Interest-bearing loans |
Financial liabilities are shown initially at their fair value, net of the costs incurred in the transaction. Later, these financial liabilities are valued at their amortized cost; any difference between the proceeds obtained (net of the necessary arrangement| costs) and the repayment value, is shown in the consolidated statement of income during the term of the debt, according to the effective interest rate method.
Financial liabilities are classified in current and non-current liabilities according to the contractual payment dates of the nominal principal.
| 2.17. | Current and deferred taxes |
The tax expense by current tax is comprised offor the period comprises income and deferred taxes.
The charge for current income tax expense is calculated based on tax laws in force onenacted the date of statement of financial position, in the countries in which the subsidiaries and associates operate and generate taxable income.
Deferred taxes are calculated using the liability method,recognized, on the temporary differences arising between the tax bases of assets and liabilities and their book values.carrying amounts in the consolidated financial statements. However, deferred income tax is not accounted for if the temporary differences ariseit arises from the initial recognition of an assets or a liability or an asset in a transaction different fromother than a business combination that at the time of the transaction does not affect the accounting result or the tax gaintaxable profit or loss, they are not booked. The deferredloss. Deferred tax is determined using the tax rates (and laws) that have been enacted or substantially enacted at the date of the consolidated statements of financial statements close,position, and are expected to apply when the related deferred tax asset is realized or the deferred tax liability discharged.
Deferred tax assets are recognized whenonly to the extent it is probable that therethe future taxable profit will be sufficient future tax earnings withavailable against which tocompensate the temporary differences.differences can be utilized.
The tax (current and deferred) is recognized in statement of income by function, unless it relates to an item recognized in other comprehensive income, directly in equity or from business combination.equity. In thatthis case the tax is also recognized in other comprehensive income or, directly in the statement of income by function, or goodwill, respectively.
The Company recognizes the expense for personnel vacations on an accrual basis.
| (b) | Share-based compensation |
The compensation plans implemented based on the shares of the Company are recognized in the consolidated financial statements in accordance with IFRS 2: Share-based payments, for plans based on the granting of options, the effect of fair value is recorded in equity with a charge to remuneration in a linear manner between the date of grant of said options and the date on which they become irrevocable, for the plans considered as cash settled award the fair value, updated as of the closing date of each reporting period, is recorded as a liability with charge to remuneration.
| (c) | Post-employment and other long-term benefits |
Provisions are made for these obligations by applying the method of the projected unit credit method, and taking into accountconsidering estimates of future permanence, mortality rates and future wage increases determined on the basis of actuarial calculations. The discount rates are determined by reference to market interest-rate curves. Actuarial gains or losses are shown in other comprehensive income.
The Company has an annual incentives plan for its personnel for compliance with objectives and individual contribution to the results. The incentives eventually granted consist of a given number or portion of monthly remuneration and the provision is made on the basis of the amount estimated for distribution.
Provisions are recognized when:
| (i) | The Companyhas a present legal or implicit obligation as a result of past events; |
| (ii) | ItIt is probable that payment is going to be necessary to settle an obligation; and |
| (iii) | TheThe amount has been reliably estimated.estimated. |
| 2.20. | Revenue recognitionfrom contracts with customers |
Revenues include the fair value of the proceeds received or to be received on sales of goods and rendering services in the ordinary course of the Company’s business. Revenues are shown net of refunds, rebates and discounts.
| (a) | RenderingTransportation of services |
| (i) | Passengerpassengers and cargo transport |
The Company shows revenue fromrecognizes the sale for the transportation of passengers and cargo onceservice as a deferred income liability, which is recognized as income when the transportation service has been lent or expired. In the case of air transport services sold by the Company and that will be made by other airlines, the liability is reduced when they are remitted to said airlines. The Company periodically reviews whether it is necessary to make an adjustment to deferred income liabilities, mainly related to returns, changes, among others.
Compensations granted to clients for changes in the levels of services or billing of additional services such as additional baggage, change of seat, among others, are considered modifications of the initial contract, therefore, they are deferred until the corresponding service is provided.
| (b) | Expiration of air tickets |
Consistent
The Company estimates in a monthly basis the probability of expiration of air tickets, with refund clauses, based on the foregoing,history of use of the Company presentssame. Air tickets without refund clause are expired on the deferred revenues, generated by anticipateddate of the flight in case the passenger does not show up.
| (c) | Costs associated with the contract |
The costs related to the sale of flightair tickets are activated and freight services, in heading other non - financial liabilitiesdeferred until the corresponding service is provided. These assets are included under Other non-financial assets in the Consolidated Classified Statement of Financial Position.
| (ii)(d) | Frequent flyerpassenger program |
The Company currently has a frequent flyer programs,maintains the following loyalty programs: LATAM Pass, LATAM Pass Brasil, whose objective is building customer loyalty through the delivery of kilometersmiles or points.
Members of these programs accumulate miles when flying with LATAM Airlines Group or any other member airline of the oneworld® program, as well purchasing of products and services from network of non airlines partners.
When the miles and points fly whenever the programs holders make certain flights, useare exchanged for products and services other than the services provided by the Company, the income is immediately recognized. When the miles are redeemed through air tickets of entities registeredan airline of LATAM Airlines Group S.A. and subsidiaries, the income is deferred until the transportation service are rendered or expiration for non-use.
In addition, the Company has contracts with certain non-airline companies for the programsale of miles or make purchasespoints. These contracts include some performance obligations in addition to the sale of the mile or point, such as marketing, advertising and other benefits. The income associated with an associated credit card. The kilometers orthese concepts is recognized in the income statement to the extent that the miles are accredited.
Deferred income of loyalty programs is determined based on the estimated stand-alone selling price of unused miles and points earned can be exchangedawarded to the members of the loyalty programs, reduced for flight tickets or other services of associated entities.breakage.
The consolidated financial statements include liabilities for this concept (deferred income), according tomiles and points that the estimateCompany estimates will not be exchanged are recognized at the moment of the valuation established forearn. Management uses statistical models to estimate the kilometers or points accumulated pending use at that date, in accordance with IFRIC 13: Customer loyalty programs.breakage based on the latest available information regarding redemption and expiration patterns.
The Company records revenues for other services when these have been provided.
Dividend income is bookedrecognized when the right to receive the payment is established.
| (a) | When the Company is the lessee – financial lease |
The Company leases certain Property, plantrecognizes contracts that meet the definition of a lease, as a right of use asset and a lease liability on the date when the underlying asset is available for use.
Assets for right of use are measured at cost including the following:
| - | The amount of the initial measurement of the lease liability; |
| - | Lease payment made at or before commencement date; |
| - | Initial direct costs, and |
The assets by right of use are recognized in the statement of financial position in Properties, plants and equipment in which it has substantially all(See Note 17).
Lease liabilities include the risk and benefits deriving from the ownership; they are therefore classified as financial leases. Financial leases are initially recorded at the lower of the fairnet present value of the asset leased andfollowing payments:
| - | Fixed payments including in substance fixed payment. |
| - | Variable lease payments that depend on an index or a rate; |
| - | The exercise price of a purchase options, if is reasonably certain to exercise that option. |
The Company determines the present value of the minimum lease payments.payments using the implicit rates for the aircraft leasing contracts and for the rest of the underlying assets, uses the incremental borrowing rate.
Every lease payment is separated betweenLease liabilities are recognized in the liability component and the financial expenses so as to obtain a constant interest rate over the outstanding amount of the debt. The corresponding leasing obligations, netstatement of financial charges, are included in otherposition under Other financial liabilities. The element of interest in the financial cost is charged to the consolidated statement of income over the lease period so that it produces a constant periodic rate of interest on the remaining balance of the liability for each year. The asset acquired under a financial lease is depreciated over its useful life and is included in Property, plant and equipment.liabilities, current or non-current (See Note 19).
| (b) | When the Company is the lessee – operating lease |
Leases, in which the lessor retains an important part of the risks and benefits deriving from ownership, are classified as operating leases. Payments with respect to operating leases (net of any incentive received from the lessor) are chargedInterest accrued on financial liabilities is recognized in the consolidated statement of income in “Financial costs”.
Principal and interest are presented in the consolidated cash flow as “Payments of lease liability” and “Interest paid”, respectively, in cash flows use in financing activities.
Payments associated with short-term leases without purchase options and leases of low-value assets are recognized on a straight-line basis overin profit or loss at the termtime of accrual. Those payments are presented in cash flows use in operation activities.
The Company analyzes the financing agreements of aircrafts, mainly considering characteristics such as:
(a) that the Company initially acquired the aircraft or took an important part in the process of direct acquisition with the manufacturers.
(b) Due to the contractual conditions, it is virtually certain that the Company will execute the purchase option of the lease.aircraft at the end of the lease term.
Since these financing agreements are “substantially purchases” and not leases, the related liability is considered as a financial debt classified under IFRS 9 and continue to be presented within the “other financial liabilities” described in Note 19. On the other hand, aircraft are presented in Property, plants and equipment as described in Note 17, as “own aircrafts”.
The Group qualifies as sale and leaseback transactions, operations which lead to a sale according to IFRS 15. More specifically, a sale is considered as such if there is no repurchase option on the goods at the end of the lease term.
If the sale of the seller-lessee is classified as a sale in accordance with IFRS 15, the underlying asset is derecognized and an asset is recognized for the right to use equal to the retained part of the net carrying amount of the asset.
If the sale by the seller-lessee is not qualified as a sale in accordance with IFRS 15, the assets transferred are maintained in the financial statements and a financial liability is recognized equal to the sale price (received from the buyer-lessor).
| 2.22. | Non-current assets or disposal groups classified as held for sale |
Non-current assets (or disposal groups) classified as assets held for sale are shown at the lesser of their book value and the fair value less costs to sell.
The costs incurred for scheduled heavy maintenance of the aircraft’s fuselage and engines are capitalized and depreciated until the next maintenance. The depreciation rate is determined on technical grounds, according to the use of the aircraft expressed in terms of cycles and flight hours.
In case of own aircraft or under financial leases,include in property, plant and equipment, these maintenance cost are capitalized as Property, plant and equipment, while in the case of aircraft under operating leases,on right of use, a liability is accrued based on the use of the main components is recognized, since a contractual obligation with the lessor to return the aircraft on agreed terms of maintenance levels exists. These are recognized as Cost of sales.
Additionally, some leasescontracts that comply with the definition of lease establish the obligation of the lessee to make deposits to the lessor as a guarantee of compliance with the maintenance and return conditions. These deposits, often called maintenance reserves, accumulate until a major maintenance is performed, once made, the recovery is requested to the lessor. At the end of the contract period, there is comparison between the reserves that have been paid and required return conditions, and compensation between the parties are made if applicable.
The unscheduled maintenance of aircraft and engines, as well as minor maintenance, are charged to results as incurred.
Disbursements related to environmental protection are charged to results when incurred.
NOTE 3 - FINANCIAL RISK MANAGEMENT
| 3.1. | Financial risk factors |
The Company is exposed to different financial risks: (a) market risk, (b) credit risk, and (c) liquidity risk. The program overall risk management of the Company aims to minimize the adverse effects of financial risks affecting the company.
Due to the nature of its operations, the Company is exposed to market factors such as: (i) fuel-price risk, (ii) exchange -rate risk (FX), and (iii) interest -rate risk.
The Company has developed policies and procedures for managing market risk, which aim to identify, quantify, monitor and mitigate the adverse effects of changes in market factors mentioned above.
For this, the Administration monitors the evolution of price levels, exchange rates and interest rates, and quantifies their risk exposures (Value at Risk), and develops and implements hedging strategies.
Exposition:
For the execution of its operations the Company purchases a fuel called Jet Fuel grade 54 USGC, which is subject to the fluctuations of international fuel prices.
Mitigation:
To cover the risk exposure fuel, the Company operates with derivative instruments (swaps and options) whose underlying assets may be different from Jet Fuel, being possible use West Texas Intermediate (“WTI”) crude, Brent (“BRENT”) crude and distillate Heating Oil (“HO”), which have a high correlation with Jet Fuel and greater liquidity.
Fuel Hedging Results:
During the period ended Decemberdecember 31, 2017,2019, the Company recognized losses of US$ 23.1 million for fuel coverage net of premium. During the same period of 2018, the Company recognized gains of US $ 15.1 million for fuel net premium coverage. During the same period of 2016, the Company recognized losses of US $ 48.0US$ 29.7 million for the same concept.
As of Decemberdecember 31, 2017,2019, the market value of fuel positions amounted to US $ 10.7US$ 48.5 million (positive). At the end of December 2016,december 2018, this market value was US $ 8.1US$ 15.8 million (positive)(negative).
The following tables show the level of hedge for different periods:
| Positions as of December 31, 2017 (*) | | Maturities | | |
| | | Q118 | | Q218 | | Q318 | | Total | | |
| Positions as of December 31, 2019 (*) | | | Maturities | | | |
| | | | | | | | | | | | | | | | | | | Q120 | | Q220 | | Q320 | | Q420 | | Total | |
| Percentage of coverage over the expected volume of consumption | | | 19 | % | | | 12 | % | | | 5 | % | | | 12 | % | | | 65 | % | | | 61 | % | | | 20 | % | | | 19 | % | | | 41 | % |
(*) The volume shown in the table considers all the hedging instruments (swaps and options).
| (*) | The volume shown in the table considers all the hedging instruments (swaps and options). |
| Positions as of December 31, 2016 (*) | | Maturities | | |
| | | Q117 | | Q217 | | Total | | |
| Positions as of December 31, 2018 (*) | | | Maturities | | | |
| | | | | | | | | | | | | | | Q119 | | Q219 | | Q319 | | Q419 | | Total | |
| Percentage of coverage over the expected volume of consumption | | | 21 | % | | | 16 | % | | | 18 | % | | | 66 | % | | | 58 | % | | | 40 | % | | | 15 | % | | | 45 | % |
(*) The volume shown in the table considers all the hedging instruments (swaps and options).
| (*) | The volume shown in the table considers all the hedging instruments (swaps and options). |
Sensitivity analysis
A drop in fuel price positively affects the Company through a reduction in costs. However, also negatively affects contracted positions as these are acquired to protect the Company against the risk of a rise in price. The policy therefore is to maintain a hedge-free percentage in order to be competitive in the event of a drop in price.
The current hedge positions they are booked as cash flow hedge contracts, so a variation in the fuel price has an impact on the Company’s net equity.
The following table shows the sensitivity analysis of the financial instruments according to reasonable changes in the fuel price and their effect on equity. The term of the projection was defined until the end of the last current fuel hedge contract, being the last business day of the third quarter of 2018.2020.
The calculations were made considering a parallel movement of US$ 5 per barrel in the curve of the BRENT and JET crude futures benchmark price at the end of December 20172019 and the end of December 2016.2018.
| | | Positions as of December 31, 2017 | | Positions as of December 31, 2016 | | Positions as of december 31, 2019 | | Positions as of december 31, 2018 |
| Benchmark price | | effect on equity | | effect on equity | | effect on equity | | effect on equity |
| (US$ per barrel) | | (millions of US$) | | (millions of US$) | | (millions of US$) | | (millions of US$) |
| | | | | |
| +5 | | +1.8 | | +3.12 | | + 15.4 | | +7.4 |
| -5 | | - 3.3 | | -4.78 | | - 34.5 | | - 5.5 |
Given the structure of fuel coverage during 2017,2019, considers a hedge-free portion, a vertical drop of 5 dollars in the JET reference price (considered as the monthly average), would have meant an approximate impact US $ 109.7US$ 121.8 million of lower fuel costs. For the same period, a vertical rise of $US$ 5 in the JET reference price (considered as the monthly average) would have meant an impact of approximately US $ 110.5US$ 114.2 million of higher fuel costs.
| (ii) | Foreign exchange rate risk: |
Exposition:
The functional and presentation currency of the Financial Statementsfinancial statements of the Parent Company is the US dollar, so that the risk of the Transactional and Conversion exchange rate arises mainly from the Company'sCompany’s business, strategic and accounting operating activities that are expressed in a monetary unit other than the functional currency.
The subsidiaries of LATAM are also exposed to foreign exchange risk whose impact affects the Company'sCompany’s Consolidated Income.
The largest operational exposure to LATAM'sLATAM’s exchange risk comes from the concentration of businesses in Brazil, which are mostly denominated in Brazilian Real (BRL), and are actively managed by the company.
At a lower concentration, the Company is also exposed to the fluctuation of other currencies, such as: euro, poundEuro, Pound sterling, Australian dollar, Colombian peso, Chilean peso, Argentine peso, Paraguayan guarani,Guarani, Mexican peso, Peruvian nuevo solSol and New Zealand dollar.
Mitigation:
The Company mitigates currency risk exposures by contracting derivative instruments or through natural hedges or execution of internal operations.
FXExchange Rate Hedging Results (FX):
In order to reduceWith the objective of reducing exposure to the exchange rate risk in the operational cash flows of 2017,2019, and to ensuresecuring the operating margin, LATAM makes hedges using FX derivatives.
As of Decemberdecember 31, 2017,2019, the market value of FX derivative positions amounted to US $ 4.40.04 million (positive)(negative). At the end of December 2016, this market value was US $ 1.1 million (negative).2018, the Company did not maintain derivatives of current FX hedges.
During the period ended Decemberdecember 31, 2017,2019, the Company recognized lossesgains of US $ 9.71.9 million for FX coverage net premium coverage.of premiums. During the same period of 2016,2018, the companyCompany recognized lossesgains of US $ 40.3 million for this concept.US$ 18.3 million.
As of Decemberdecember 31, 2017,2019, the Company has contracted FX derivatives for US $ 18015 million for BRL. ByAt the end of December 2016,december 2018, the Company did not maintain current FX derivatives.
During 2018 the company had contracted FX derivatives forwhich were not registered under hedge accounting. As of december 31, 2019, the amount recognized in results amounts to US $ 606.2 million for BRL, and US $ 10 million for GBP.(negative) net of premiums.
Sensitivity analysis:
A depreciation of the R $ R$/ US $US$ exchange rate, negatively affects the Company'sCompany’s operating cash flows, however, also positively affects the value of the positions of derivatives contracted.
FX derivatives are recorded as cash flow hedge contracts; therefore, a variation in the exchange rate has an impact on the market value of the derivatives, the changes of which affect the Company'sCompany’s net equity.
The following table shows the awarenesssensitization of FX derivative instruments according to reasonable changes in the exchange rate and its effect on equity. The projection termperiod was defined until the end of the last coverage contract of coverage in force, beingwith the last business day of the secondfirst quarter of the year 2018:2020:
| Appreciation (depreciation) | | Effect at December 31, 2017 | | Effect at December 31, 2016 | |
| of R$ (*) | | Millions of US$ | | Millions of US$ | |
| | | | | | |
| Appreciation (depreciation)(*) | | | Effect at december 31, 2019 | | Effect at december 31, 2018 |
| of R$ | | | Millions of US$ | | Millions of US$ |
| -10% | | -10.7 | | -1.02 | | -0.6 | | - |
| +10% | | +9.7 | | +3.44 | | +1.1 | | - |
(*)Both currencies (BRL and GBP) only apply period to the closing of 2016.
| (*) | Appreciation (depreciation) of US$ regard to the covered currencies. |
During 2017,2018 and 2019, the Company contracted derivativeswap currency swaps to hedgederivatives for debt coverage issued the same year for a notional UF 8.7 million.million and UF 5.0 million, respectively. As of December 31, 2017,2019, the market value of the currency swaps derivative positions of currency swaps amounted to US$ 30.6US $ 22.7 million (positive)(negative).
As At the end of December 31, 2017, the Company has recorded an amount for ineffectiveness in the consolidated statement of income for2018, this type of hedges formarket value was US $ 6.215.1 million (positive).
In the case of TAM S.A, whose functional currency is the Brazilian real, a large part of its liabilities areis expressed in US dollars. Therefore, when converting financial assets and liabilities, from dollarsdollar to reais,real, they have an impact on the result of TAM S.A., which is consolidated in the Company'sCompany’s Income Statement.
With the objective of reducingIn order to reduce the impact on the Company's resultsCompany’s result caused by appreciations or depreciations of R$R $ /US $, the Company has executed internal operations to reduce the net exposure in US$US $ for TAM S.A.
The following table shows the variation of financial performance to appreciate or depreciate 10% exchange rate R$/US$:
| Appreciation (depreciation)* | | Effect at December 31, 2017 | | Effect at December 31, 2016 | |
| of R$/US$ | | Millons of US$ | | Millons of US$ | |
| | | | | | |
Appreciation (depreciation)(*) | | | Effect at december 31, 2019 | | Effect at december 31, 2018 |
| of R$/US$(*) | | | Millions of US$ | | Millions of US$ |
| -10% | | +80.5 | | +119.2 | | +9.5 | | +39.8 |
| +10% | | -80.5 | | -119.2 | | - 9.5 | | -39.8 |
(*) Appreciation (depreciation) of US$ regard to the covered currencies.
| (*) | Appreciation (depreciation) of US$ regard to the covered currencies. |
Effects of exchange rate derivatives in the Financial Statements
The profit or losses caused by changes in the fair value of hedging instruments are segregated between intrinsic value and temporary value. The intrinsic value is the actual percentage of cash flow covered, initially shown in equity and later transferred to income, while the hedge transaction is recorded in income. The temporary value corresponds to the ineffective portion of cash flow hedge which is recognized in the financial results of the Company (Note 19).
Due to the functional currency of TAM S.A. and Subsidiaries is the Brazilian real, the Company presents the effects of the exchange rate fluctuations in Other comprehensive income by converting the Statement of financial position and Income statement of TAM S.A. and Subsidiaries from their functional currency to the U.S. dollar, which is the presentation currency of the consolidated financial statement of LATAM Airlines Group S.A. and Subsidiaries. The Goodwill generated in the Business combination is recognized as an asset of TAM S.A. and Subsidiaries in Brazilian real whose conversion to U.S. dollar also produces effects in other comprehensive income.
The following table shows the change in Other comprehensive income recognized in Total equity in the case of appreciate or depreciate 10% the exchange rate R$/US$:
| Appreciation (depreciation) | | Effect at December 31, 2017 | | Effect at December 31, 2016 | | Effect at december 31, 2019 | | Effect at december 31, 2018 |
| of R$/US$ | | Millions of US$ | | Millions of US$ | | Millions of US$ | | Millions of US$ |
| | | | | |
| -10% | | +386.62 | | +351.04 | | +402.48 | | +384.73 |
| +10% | | -316.33 | | -287.22 | | -329.29 | | -314.78 |
| (iii) | Interest -rate risk: |
Exposition:
The Company is exposed to fluctuations in interest rates affecting the markets future cash flows of the assets, and current and future financial liabilities.
The Company is exposed in one portion to the variations of London Inter-Bank Offer Rate (“LIBOR”) and other interest rates of less relevance are Brazilian Interbank Deposit Certificate ("ILC"(“IDC”).
Mitigation:
In order to reduce the risk of an eventual rise in interest rates, the Company has signed interest-rate swap and call option contracts. Currently a 63% (63%62% (60% at December 31, 2016)2018) of the debt is fixed to fluctuations in interest rate.
Rate Hedging Results:
At DecemberAs of december 31 2017,, 2019, the market value of the derivative positions of interest rate derivativesrates amounted to US$ 6.62.6 million (negative)(positive). At the end of December 20162018, this market value was US$ 17.22.2 million (negative).
Sensitivity analysis:
The following table shows the sensitivity of changes in financial obligations that are not hedged against interest-rate variations. These changes are considered reasonably possible, based on current market conditions each date.
| Increase (decrease) | | Positions as of December 31, 2017 | | Positions as of December 31, 2016 | | Positions as of december 31, 2019 | | Positions as of december 31, 2018 |
| futures curve | | effect on profit or loss before tax | | effect on profit or loss before tax | | effect on profit or loss before tax | | effect on profit or loss before tax |
| in libor 3 months | | (millions of US$) | | (millions of US$) | | (millions of US$) | | (millions of US$) |
| | | | | | |
| +100 basis points | | -29.26 | | -32.16 | | -27.60 | | -29.62 |
| -100 basis points | | +29.26 | | +32.16 | | +27.60 | | +29.62 |
Much of the current rate derivatives are registered for as hedges of cash flow, therefore, a variation in the exchange rate has an impact on the market value of derivatives, whose changes impact on the Company’s net equity.
The calculations were made increasing (decreasing) vertically 100 basis points of the three-month Libor futures curve, being both reasonably possible scenarios according to historical market conditions.
| Increase (decrease) | | Positions as of December 31, 2017 | | Positions as of December 31, 2016 | | Positions as of december 31, 2019 | | Positions as of december 31, 2018 |
| futures curve | | effect on equity | | effect on equity | | effect on equity | | effect on equity |
| in libor 3 months | | (millions of US$) | | (millions of US$) | | (millions of US$) | | (millions of US$) |
| | | |
| +100 basis points | | +1.9 | | +3.93 | | +13.62 | | +0.70 |
| -100 basis points | | -1.9 | | -4.03 | | -14.71 | | -0.71 |
The assumptions of sensitivity calculation must assume that forward curves of interest rates do not necessarily reflect the real value of the compensation flows. Moreover, the structure of interest rates is dynamic over time.
During the periods presented, the Company has no registered amounts by ineffectiveness in consolidated statement of income for this kind of hedging.
Credit risk occurs when the counterparty to a financial agreement or instrument fails to discharge an obligation due or financial instrument, leading to a loss in market value of a financial instrument (only financial assets, not liabilities).
The Company is exposed to credit risk due to its operative and financial activities, including deposits with banks and financial institutions, investments in other kinds of instruments, exchange-rate transactions and the contracting of derivative instruments or options.
To reduce the credit risk associated with operational activities, the Company has established credit limits to abridge the exposure of their debtors which are monitored permanently (mainly in case of operational activities in Brazil with travel agents).
As a way to mitigate credit risk related to financial activities, the Company requires that the counterparty to the financial activities remain at least investment grade by major Risk Assessment Agencies. Additionally, the Company has established maximum limits for investments which are monitored regularly.
Cash surpluses that remain after the financing of assets necessary for the operation are invested according to credit limits approved by the Company’s Board, mainly in time deposits with different financial institutions, private investment funds, short-term mutual funds, and easily-liquidated corporate and sovereign bonds with short remaining maturities. These investments are booked as Cash and cash equivalents and other current financial assets.
In order to reduce counterparty risk and to ensure that the risk assumed is known and managed by the Company, investments are diversified among different banking institutions (both local and international). The Company evaluates the credit standing of each counterparty and the levels of investment, based on (i) their credit rating, (ii) the equity size of the counterparty, and (iii) investment limits according to the Company’s level of liquidity. According to these three parameters, the Company chooses the most restrictive parameter of the previous three and based on this, establishes limits for operations with each counterparty.
The Company has no guarantees to mitigate this exposure.
| (ii) | Operational activities |
The Company has four large sales “clusters”: travel agencies, cargo agents, airlines and credit-card administrators. The first three are governed by International Air Transport Association, international (“IATA”) organization comprising most of the airlines that represent over 90% of scheduled commercial traffic and one of its main objectives is to regulate the financial transactions between airlines and travel agents and cargo. When an agency or airline does not pay their debt, they are excluded from operating with IATA’s member airlines. In the case of credit-card administrators, they are fully guaranteed by 100% by the issuing institutions.
The exposure consists of the term granted, which fluctuates between 1 and 45 days.
One of the tools the Company uses for reducing credit risk is to participate in global entities related to the industry, such as IATA, Business Sales Processing (“BSP”), Cargo Account Settlement Systems (“CASS”), IATA Clearing House (“ICH”) and banks (credit cards). These institutions fulfill the role of collectors and distributors between airlines and travel and cargo agencies. In the case of the Clearing House, it acts as an offsetting entity between airlines for the services provided between them. A reduction in term and implementation of guarantees has been achieved through these entities. Currently the sales invoicing of TAM Linhas Aéreas S.A. related with travel agents and cargo agents for domestic transportation in Brazil is done directly by TAM Linhas Aéreas S.A.
Credit quality of financial assets
The external credit evaluation system used by the Company is provided by IATA. Internal systems are also used for particular evaluations or specific markets based on trade reports available on the local market. The internal classification system is complementary to the external one, i.e. for agencies or airlines not members of IATA, the internal demands are greater.
To reduce the credit risk associated with operational activities, the Company has established credit limits to abridge the exposure of their debtors which are monitored permanently (mainly in case of operational activities of TAM Linhas Aéreas S.A. with travel agents).The. The bad-debt rate in the principal countries where the Company has a presence is insignificant.
Liquidity risk represents the risk that the Company has no sufficient funds to meet its obligations.
Because of the cyclical nature of the business, the operation, and its investment and financing needs related to the acquisition of new aircraft and renewal of its fleet, plus the financing needs, the Company requires liquid funds, defined as cash and cash equivalents plus other short term financial assets, to meet its payment obligations.
The liquid funds, the future cash generation and the capacity to obtain additional funding, through bond issuance and banking loans, will allow the Company to obtain sufficient alternatives to face its investment and financing future commitments.
At Decemberdecember 31 2017 , 2019is US$ 1,6141,459 million (US$ 1,4861,404 million at Decemberdecember 31, 2016)2018), invested in short term instruments through financial high credit rating levels entities.
In addition to the balance of liquid funds, the Company has access to short termshort-term credit line.lines. As of Decemberdecember 31, 2017,2019, LATAM has credit lines for working capital credit lines with multiplethat are not committed to several banks and additionally has aan unused committed line of US$ 450600 million undrawn committed credit line (US$ 325600 million atas of December 31, 2016)2018) subject to borrowing base availability.availability of collateral.
Class of liability for the analysis of liquidity risk ordered by date of maturity as of December 31, 20172019
Debtor: LATAM Airlines Group S.A. and Subsidiaries, Tax No. 89.862.200-2 Chile.
| | | | | | | | | | | More than | | More than | | More than | | | | | | | | | | | | | | | | | | | | | More than | | More than | | More than | | | | | | | | | | | |
| | | | | | | | | Up to | | 90 days | | one to | | three to | | More than | | | | | | | | | | | | | | | | | Up to | | 90 days | | one to | | three to | | More than | | | | | | | | | |
| | | | | Creditor | | | | 90 | | to one | | three | | five | | five | | | | Nominal | | | | Effective | | Nominal | | | | | Creditor | | | | 90 | | to one | | three | | five | | five | | | | Nominal | | Effective | | Nominal | |
| Tax No. | | Creditor | | country | | Currency | | days | | year | | years | | years | | years | | Total | | value | | Amortization | | rate | | rate | | | Creditor | | country | | Currency | | days | | year | | years | | years | | years | | Total | | value | | Amortization | | rate | | rate | |
| | | | | | | | | ThUS$ | | ThUS$ | | ThUS$ | | ThUS$ | | ThUS$ | | ThUS$ | | ThUS$ | | | | % | | % | | | | | | | ThUS$ | | ThUS$ | | ThUS$ | | ThUS$ | | ThUS$ | | ThUS$ | | ThUS$ | | % | | % | |
| Loans to exporters | | | | | | | | | | | | | | | | | | | | | | | | | | | | | | | | | | | | | | | Loans to exporters | | | | | | | | | | | | | | | | | | | | | | | | | | | | | | | | | | | | | | | |
| | | | | | | | | | | | | | | | | | | | | | | | | | | | | | | | | | | | | | | | | | | | |
| 97.032.000-8 | | BBVA | | Chile | | US$ | | | 75,863 | | | | - | | | | - | | | | - | | | | - | | | | 75,863 | | | | 75,000 | | | At Expiration | | | 2.30 | | | | 2.30 | | | BBVA | | Chile | | | US$ | | | | 24,387 | | | | 76,256 | | | | - | | | | - | | | | - | | | | 100,643 | | | | 99,000 | | | At Expiration | | | 3.29 | | | | 3.29 | |
| 97.032.000-8 | | BBVA | | Chile | | UF | | | - | | | | 57,363 | | | | - | | | | - | | | | - | | | | 57,363 | | | | 55,801 | | | At Expiration | | | 3.57 | | | | 2.77 | | |
| 97.036.000-K | | SANTANDER | | Chile | | US$ | | | 30,131 | | | | - | | | | - | | | | - | | | | - | | | | 30,131 | | | | 30,000 | | | At Expiration | | | 2.49 | | | | 2.49 | | |
| 97.003.000-K | | | BANCO DO BRASIL | | Chile | | | US$ | | | | 151,489 | | | | 50,758 | | | | - | | | | - | | | | - | | | | 202,247 | | | | 200,000 | | | At Expiration | | | 2.93 | | | | 2.93 | |
| 76.100.458-1 | | | HSBC | | Chile | | | US$ | | | | 12,098 | | | | - | | | | - | | | | - | | | | - | | | | 12,098 | | | | 12,000 | | | At Expiration | | | 3.25 | | | | 3.25 | |
| 76.100.458-1 | | | BLADEX | | Chile | | | US$ | | | | - | | | | 29,277 | | | | - | | | | - | | | | - | | | | 29,277 | | | | 29,000 | | | At Expiration | | | 2.82 | | | | 2.82 | |
| | | | | | | | | | | | | | | | | | | | | | | | | | | | | | | | | | | | | | | | | | | | |
| Bank loans | | | | | | | | | | | | | | | | | | | | | | | | | | | | | | | | | | | | | | | | | | | |
| | | | | | | | | | | | | | | | | | | | | | | | | | | | | | | | | | | | | | | | | | | | |
| 97.023.000-9 | | | CORPBANCA | | Chile | | | UF | | | | 5,336 | | | | 10,544 | | | | - | | | | - | | | | - | | | | 15,880 | | | | 15,615 | | | Quarterly | | | 3.35 | | | | 3.35 | |
| 76.362.099-9 | | | BTG PACTUAL CHILE | | Chile | | | UF | | | | 484 | | | | 1,451 | | | | 63,872 | | | | - | | | | - | | | | 65,807 | | | | 62,769 | | | At Expiration | | | 3.10 | | | | 3.10 | |
| 0-E | | | SANTANDER | | Spain | | | US$ | | | | 1,514 | | | | 4,809 | | | | 141,719 | | | | - | | | | - | | | | 148,042 | | | | 137,860 | | | Quarterly | | | 3.62 | | | | 4.61 | |
| | | | | | | | | | | | | | | | | | | | | | | | | | | | | | | | | | | | | | | | | | | | |
| Obligations with the public | | Obligations with the public | | | | | | | | | | | | | | | | | | | | | | | | | | | | | | | | | | | | | | | | |
| | | | | | | | | | | | | | | | | | | | | | | | | | | | | | | | | | | | | | | | | | | | |
| 97.030.000-7 | | ESTADO | | Chile | | US$ | | | 40,257 | | | | - | | | | - | | | | - | | | | - | | | | 40,257 | | | | 40,000 | | | At Expiration | | | 2.57 | | | | 2.57 | | | BANCO ESTADO | | Chile | | | UF | | | | - | | | | 24,702 | | | | 208,681 | | | | 32,228 | | | | 410,774 | | | | 676,385 | | | | 518,032 | | | At Expiration | | | 4.81 | | | | 4.81 | |
| 97.003.000-K | | BANCO DO BRASIL | | Chile | | US$ | | | 100,935 | | | | - | | | | - | | | | - | | | | - | | | | 100,935 | | | | 100,000 | | | At Expiration | | | 2.40 | | | | 2.40 | | |
| 97.951.000-4 | | HSBC | | Chile | | US$ | | | 12,061 | | | | - | | | | - | | | | - | | | | - | | | | 12,061 | | | | 12,000 | | | At Expiration | | | 2.03 | | | | 2.03 | | |
| Bank loans | | | | | | | | | | | | | | | | | | | | | | | | | | | | | | | | | | | | | |
| 97.023.000-9 | | CORPBANCA | | Chile | | UF | | | 22,082 | | | | 22,782 | | | | 43,430 | | | | - | | | | - | | | | 88,294 | | | | 84,664 | | | Quarterly | | | 3.68 | | | | 3.68 | | |
| 0-E | | | BANK OF NEW YORK | | U.S.A. | | | US$ | | | | 28,000 | | | | 76,125 | | | | 208,250 | | | | 884,188 | | | | 884,000 | | | | 2,080,563 | | | | 1,500,000 | | | At Expiration | | | 7.16 | | | | 6.94 | |
| | | | | | | | | | | | | | | | | | | | | | | | | | | | | | | | | | | | | | | | | | | | |
| Guaranteed obligations | | Guaranteed obligations | | | | | | | | | | | | | | | | | | | | | | | | | | | | | | | | | | | | | | | | |
| | | | | | | | | | | | | | | | | | | | | | | | | | | | | | | | | | | | | | | | | | | | |
| 0-E | | | BNP PARIBAS | | U.S.A. | | | US$ | | | | 11,657 | | | | 50,428 | | | | 124,106 | | | | 124,167 | | | | 302,092 | | | | 612,450 | | | | 513,941 | | | Quarterly / Semiannual | | | 3.81 | | | | 3.81 | |
| 0-E | | | WILMINGTON TRUST COMPANY | | U.S.A. | | | US$ | | | | 31,733 | | | | 94,096 | | | | 244,836 | | | | 237,815 | | | | 438,659 | | | | 1,047,139 | | | | 866,223 | | | Quarterly | | | 4.45 | | | | 4.45 | |
| 0-E | | | CITIBANK | | U.S.A. | | | US$ | | | | 5,765 | | | | 17,296 | | | | 46,120 | | | | 46,117 | | | | 42,175 | | | | 157,473 | | | | 143,475 | | | Quarterly | | | 3.76 | | | | 2.68 | |
| 0-E | | | NATIXIS | | France | | | US$ | | | | 13,365 | | | | 40,159 | | | | 99,556 | | | | 86,984 | | | | 79,724 | | | | 319,788 | | | | 282,906 | | | Quarterly | | | 3.82 | | | | 3.82 | |
| 0-E | | | MUFG | | U.S.A. | | | US$ | | | | 5,552 | | | | 27,068 | | | | 73,726 | | | | 73,914 | | | | 209,621 | | | | 389,881 | | | | 322,660 | | | Quarterly | | | 3.43 | | | | 3.43 | |
| 0-E | | | INVESTEC | | England | | | US$ | | | | 1,980 | | | | 11,164 | | | | 26,153 | | | | 11,071 | | | | - | | | | 50,368 | | | | 44,087 | | | Semiannual | | | 6.35 | | | | 6.35 | |
| | | | | | | | | | | | | | | | | | | | | | | | | | | | | | | | | | | | | | | | | | | | |
| Other guaranteed obligation | | Other guaranteed obligation | | | | | | | | | | | | | | | | | | | | | | | | | | | | | | | | | | | | | | | | |
| | | | | | | | | | | | | | | | | | | | | | | | | | | | | | | | | | | | | | | | | | | | |
| 0-E | | | CREDIT AGRICOLE | | France | | | US$ | | | | 2,326 | | | | 6,740 | | | | 260,259 | | | | - | | | | - | | | | 269,325 | | | | 253,692 | | | At Expiration | | | 3.74 | | | | 3.74 | |
| 0-E | | | MUFG | | U.S.A. | | | US$ | | | | 26,607 | | | | 78,955 | | | | 198,783 | | | | 46,131 | | | | - | | | | 350,476 | | | | 328,023 | | | Quarterly | | | 3.54 | | | | 3.54 | |
| | | | | | | | | | | | | | | | | | | | | | | | | | | | | | | | | | | | | | | | | | | | |
| Financial lease | | | | | | | | | | | | | | | | | | | | | | | | | | | | | | | | | | | | | | | | | | | |
| | | | | | | | | | | | | | | | | | | | | | | | | | | | | | | | | | | | | | | | | | | | |
| 0-E | | | ING | | U.S.A. | | | US$ | | | | 4,025 | | | | 8,108 | | | | - | | | | - | | | | - | | | | 12,133 | | | | 11,806 | | | Quarterly | | | 5.71 | | | | 5.01 | |
| 0-E | | | CREDIT AGRICOLE | | France | | | US$ | | | | 4,994 | | | | 15,026 | | | | 6,671 | | | | - | | | | - | | | | 26,691 | | | | 26,091 | | | Quarterly | | | 3.15 | | | | 2.52 | |
| 0-E | | | CITIBANK | | U.S.A. | | | US$ | | | | 19,412 | | | | 56,148 | | | | 117,881 | | | | 16,653 | | | | - | | | | 210,094 | | | | 200,907 | | | Quarterly | | | 3.39 | | | | 2.80 | |
| 0-E | | | PEFCO | | U.S.A. | | | US$ | | | | 1,950 | | | | 1,950 | | | | - | | | | - | | | | - | | | | 3,900 | | | | 3,827 | | | Quarterly | | | 5.65 | | | | 5.03 | |
| 0-E | | | BNP PARIBAS | | U.S.A. | | | US$ | | | | 9,353 | | | | 25,211 | | | | 28,663 | | | | 22,502 | | | | 10,354 | | | | 96,083 | | | | 87,729 | | | Quarterly | | | 3.85 | | | | 3.72 | |
| 0-E | | BLADEX | | U.S.A. | | US$ | | | - | | | | 16,465 | | | | 15,628 | | | | - | | | | - | | | | 32,093 | | | | 30,000 | | | Semiannual | | | 5.51 | | | | 5.51 | | | WELLS FARGO | | U.S.A. | | | US$ | | | | 35,251 | | | | 105,691 | | | | 261,181 | | | | 203,232 | | | | 14,382 | | | | 619,737 | | | | 591,684 | | | Quarterly | | | 2.67 | | | | 1.98 | |
| 97.036.000-K | | SANTANDER | | Chile | | US$ | | | 2,040 | | | | 3,368 | | | | 202,284 | | | | - | | | | - | | | | 207,692 | | | | 202,284 | | | Quarterly | | | 4.41 | | | | 4.41 | | | SANTANDER | | Chile | | | US$ | | | | 6,145 | | | | 18,394 | | | | 47,911 | | | | 3,158 | | | | - | | | | 75,608 | | | | 72,551 | | | Quarterly | | | 3.00 | | | | 2.46 | |
| Obligations with the public | | | | | | | | | | | | | | | | | | | | | | | | | | | | | | | | | | | | | | | |
| 0-E | | BANK OF NEW YORK | | U.S.A. | | US$ | | | - | | | | 84,375 | | | | 650,625 | | | | 96,250 | | | | 772,188 | | | | 1,603,438 | | | | 1,200,000 | | | At Expiration | | | 7.44 | | | | 7.03 | | |
| 97.030.000-7 | | ESTADO | | Chile | | UF | | | - | | | | 20,860 | | | | 41,720 | | | | 226,379 | | | | 245,067 | | | | 534,026 | | | | 379,274 | | | At Expiration | | | 5.50 | | | | 5.50 | | |
| Guaranteed obligations | | | | | | | | | | | | | | | | | | | | | | | | | | | | | | | | | | | | | | | |
| 0-E | | CREDIT AGRICOLE | | France | | US$ | | | 8,368 | | | | 25,415 | | | | 56,305 | | | | 12,751 | | | | - | | | | 102,839 | | | | 98,091 | | | Quarterly | | | 2.66 | | | | 2.22 | | | RRPF ENGINE | | England | | | US$ | | | | 1,152 | | | | 3,432 | | | | 8,967 | | | | 8,679 | | | | 568 | | | | 22,798 | | | | 19,643 | | | Monthly | | | 4.01 | | | | 4.01 | |
| 0-E | | BNP PARIBAS | | U.S.A. | | US$ | | | 14,498 | | | | 59,863 | | | | 148,469 | | | | 145,315 | | | | 313,452 | | | | 681,597 | | | | 575,221 | | | Quarterly | | | 3.41 | | | | 3.40 | | | APPLE BANK | | U.S.A. | | | US$ | | | | 1,661 | | | | 4,977 | | | | 13,259 | | | | 7,380 | | | | - | | | | 27,277 | | | | 25,708 | | | Quarterly | | | 3.33 | | | | 2.73 | |
| 0-E | | WELLS FARGO | | U.S.A. | | US$ | | | 30,764 | | | | 92,309 | | | | 246,285 | | | | 246,479 | | | | 245,564 | | | | 861,401 | | | | 808,987 | | | Quarterly | | | 2.46 | | | | 1.75 | | | BTMU | | U.S.A. | | | US$ | | | | 3,367 | | | | 10,081 | | | | 26,827 | | | | 14,153 | | | | - | | | | 54,428 | | | | 51,340 | | | Quarterly | | | 3.33 | | | | 2.73 | |
| 0-E | | WILMINGTON TRUST COMPANY | | U.S.A. | | US$ | | | 32,026 | | | | 95,042 | | | | 253,469 | | | | 244,836 | | | | 676,474 | | | | 1,301,847 | | | | 1,034,853 | | | Quarterly | | | 4.48 | | | | 4.48 | | | NATIXIS | | France | | | US$ | | | | 759 | | | | 2,299 | | | | 2,330 | | | | - | | | | - | | | | 5,388 | | | | 5,154 | | | Quarterly | | | 4.41 | | | | 4.41 | |
| 0-E | | CITIBANK | | U.S.A. | | US$ | | | 14,166 | | | | 42,815 | | | | 114,612 | | | | 112,435 | | | | 102,045 | | | | 386,073 | | | | 351,217 | | | Quarterly | | | 3.31 | | | | 2.47 | | | KFW IPEX-BANK | | Germany | | | US$ | | | | 1,804 | | | | 3,607 | | | | - | | | | - | | | | - | | | | 5,411 | | | | 5,328 | | | Quarterly | | | 3.55 | | | | 3.55 | |
| 0-E | | BTMU | | U.S.A. | | US$ | | | 3,292 | | | | 9,997 | | | | 26,677 | | | | 26,704 | | | | 14,133 | | | | 80,803 | | | | 74,734 | | | Quarterly | | | 2.87 | | | | 2.27 | | | AIRBUS FINANCIAL | | U.S.A. | | | US$ | | | | 2,038 | | | | 5,746 | | | | - | | | | - | | | | - | | | | 7,784 | | | | 7,664 | | | Monthly | | | 3.31 | | | | 3.31 | |
| 0-E | | APPLE BANK | | U.S.A. | | US$ | | | 1,611 | | | | 4,928 | | | | 13,163 | | | | 13,196 | | | | 7,369 | | | | 40,267 | | | | 37,223 | | | Quarterly | | | 2.78 | | | | 2.18 | | | US BANK | | U.S.A. | | | US$ | | | | 18,328 | | | | 54,864 | | | | 145,364 | | | | 140,555 | | | | 17,681 | | | | 376,792 | | | | 349,127 | | | Quarterly | | | 4.01 | | | | 2.82 | |
| 0-E | | US BANK | | U.S.A. | | US$ | | | 18,485 | | | | 55,354 | | | | 146,709 | | | | 145,364 | | | | 158,236 | | | | 524,148 | | | | 472,833 | | | Quarterly | | | 4.00 | | | | 2.82 | | | PK AIRFINANCE | | U.S.A. | | | US$ | | | | 2,652 | | | | 8,136 | | | | 18,194 | | | | - | | | | - | | | | 28,982 | | | | 28,087 | | | Monthly | | | 3.45 | | | | 3.45 | |
| | | | | | | | | | | | | | | | | | | | | | | | | | | | | | | | | | | | | | | | | | | | |
| Other loans | | | | | | | | | | | | | | | | | | | | | | | | | | | | | | | | | | | | | | | | | | | |
| | | | | | | | | | | | | | | | | | | | | | | | | | | | | | | | | | | | | | | | | | | | |
| 0-E | | DEUTSCHE BANK | | U.S.A. | | US$ | | | 4,043 | | | | 12,340 | | | | 32,775 | | | | 32,613 | | | | 32,440 | | | | 114,211 | | | | 96,906 | | | Quarterly | | | 4.39 | | | | 4.39 | | | CITIBANK (*) | | U.S.A. | | | US$ | | | | 26,111 | | | | 78,742 | | | | - | | | | - | | | | - | | | | 104,853 | | | | 101,026 | | | Quarterly | | | 6.00 | | | | 6.00 | |
| 0-E | | NATIXIS | | France | | US$ | | | 18,192 | | | | 54,952 | | | | 129,026 | | | | 105,990 | | | | 166,011 | | | | 474,171 | | | | 413,011 | | | Quarterly | | | 3.42 | | | | 3.40 | | |
| 0-E | | PK AirFinance | | U.S.A. | | US$ | | | 2,375 | | | | 7,308 | | | | 20,812 | | | | 18,104 | | | | - | | | | 48,599 | | | | 46,500 | | | Monthly | | | 3.18 | | | | 3.18 | | |
| 0-E | | KFW IPEX-BANK | | Germany | | US$ | | | 2,570 | | | | 7,111 | | | | 16,709 | | | | 1,669 | | | | - | | | | 28,059 | | | | 26,888 | | | Quarterly | | | 3.31 | | | | 3.31 | | |
| 0-E | | AIRBUS FINANCIAL | | U.S.A. | | US$ | | | 2,033 | | | | 6,107 | | | | 15,931 | | | | - | | | | - | | | | 24,071 | | | | 22,925 | | | Monthly | | | 3.19 | | | | 3.19 | | |
| 0-E | | INVESTEC | | England | | US$ | | | 1,930 | | | | 11,092 | | | | 26,103 | | | | 26,045 | | | | 11,055 | | | | 76,225 | | | | 63,378 | | | Semiannual | | | 6.04 | | | | 6.04 | | |
| Other guaranteed obligations | | | | | | | | | | | | | | | | | | | | | | | | | | | | | | | | | | | | | | | |
| 0-E | | CREDIT AGRICOLE | | France | | US$ | | | 1,757 | | | | 5,843 | | | | 246,926 | | | | - | | | | - | | | | 254,526 | | | | 241,287 | | | At Expiration | | | 3.38 | | | | 3.38 | | |
| Financial leases | | | | | | | | | | | | | | | | | | | | | | | | | | | | | | | | | | | | | |
| 0-E | | ING | | U.S.A. | | US$ | | | 5,890 | | | | 12,076 | | | | 28,234 | | | | - | | | | - | | | | 46,200 | | | | 42,957 | | | Quarterly | | | 5.67 | | | | 5.00 | | |
| 0-E | | CITIBANK | | U.S.A. | | US$ | | | 12,699 | | | | 38,248 | | | | 91,821 | | | | 51,222 | | | | 2,880 | | | | 196,870 | | | | 184,274 | | | Quarterly | | | 3.78 | | | | 3.17 | | |
| 0-E | | PEFCO | | U.S.A. | | US$ | | | 13,354 | | | | 34,430 | | | | 23,211 | | | | - | | | | - | | | | 70,995 | | | | 67,783 | | | Quarterly | | | 5.46 | | | | 4.85 | | |
| 0-E | | BNP PARIBAS | | U.S.A. | | US$ | | | 13,955 | | | | 35,567 | | | | 50,433 | | | | 2,312 | | | | - | | | | 102,267 | | | | 98,105 | | | Quarterly | | | 3.66 | | | | 3.25 | | |
| 0-E | | WELLS FARGO | | U.S.A. | | US$ | | | 12,117 | | | | 38,076 | | | | 98,424 | | | | 66,849 | | | | 21,253 | | | | 236,719 | | | | 221,113 | | | Quarterly | | | 3.17 | | | | 2.67 | | |
| 97.036.000-K | | SANTANDER | | Chile | | US$ | | | 6,049 | | | | 18,344 | | | | 48,829 | | | | 47,785 | | | | 3,156 | | | | 124,163 | | | | 117,023 | | | Quarterly | | | 2.51 | | | | 1.96 | | |
| 0-E | | RRPF ENGINE | | England | | US$ | | | 370 | | | | 3,325 | | | | 8,798 | | | | 8,692 | | | | 9,499 | | | | 30,684 | | | | 25,983 | | | Monthly | | | 4.01 | | | | 4.01 | | |
| Other loans | | | | | | | | | | | | | | | | | | | | | | | | | | | | | | | | | | | | | |
| 0-E | | CITIBANK (*) | | U.S.A. | | US$ | | | 25,783 | | | | 77,810 | | | | 206,749 | | | | - | | | | - | | | | 310,342 | | | | 285,891 | | | Quarterly | | | 6.00 | | | | 6.00 | | |
| Derivatives of coverage | | | | | | | | | | | | | | | | | | | | | | | | | | | | | | | | | | | | | | | |
| Hedge derivative | | | | | | | | | | | | | | | | | | | | | | | | | | | | | | | | | | | | | | | | | | | |
| | | | | | | | | | | | | | | | | | | | | | | | | | | | | | | | | | �� | | | | | | | | | | |
| - | | Others | | - | | US$ | | | 5,656 | | | | 6,719 | | | | 6,228 | | | | - | | | | - | | | | 18,603 | | | | 17,407 | | | - | | | 0.00 | | | | 0.00 | | | OTHERS | | - | | | US$ | | | | - | | | | 11,582 | | | | 18,641 | | | | 13,530 | | | | - | | | | 43,753 | | | | 16,972 | | | - | | | - | | | | - | |
| | | Total | | | 535,352 | | | | 960,284 | | | | 3,010,385 | | | | 1,630,990 | | | | 2,780,822 | | | | 8,917,833 | | | | 7,633,613 | | | | | | | | | | | | | | | | | | | | | | | | | | | | | | | | | | | | | | | | | | | | | | | | | | | |
| | | | Total | | | | | | | 461,295 | | | | 1,013,822 | | | | 2,391,950 | | | | 1,972,457 | | | | 2,410,030 | | | | 8,249,554 | | | | 6,933,927 | | | | | | | | | |
(*) Bonus securitized with the future flows of credit card sales in the United States and Canada.
Class of liability for the analysis of liquidity risk ordered by date of maturity as of December 31, 2019
Debtor: TAM S.A. and Subsidiaries, Tax No. 02.012.862/0001-60, Brazil.
| | | | | | | | | | | | | | More than | | | More than | | | More than | | | | | | | | | | | | | | | | | | |
| | | | | | | | | | | Up to | | | 90 days | | | one to | | | three to | | | More than | | | | | | | | | | | | | | | |
| | | | | Creditor | | | | | | 90 | | | to one | | | three | | | five | | | five | | | | | | Nominal | | | | | Effective | | | Nominal | |
| Tax No. | | Creditor | | country | | | Currency | | | days | | | year | | | years | | | years | | | years | | | Total | | | value | | | Amortization | | rate | | | rate | |
| | | | | | | | | | | ThUS$ | | | ThUS$ | | | ThUS$ | | | ThUS$ | | | ThUS$ | | | ThUS$ | | | ThUS$ | | | | | % | | | % | |
| Bank loans | | | | | | | | | | | | | | | | | | | | | | | | | | | | | | | | | | | | | |
| | | | | | | | | | | | | | | | | | | | | | | | | | | | | | | | | | | | | | |
| 0-E | | NCM | | Holland | | | US$ | | | | 173 | | | | 499 | | | | 722 | | | | - | | | | - | | | | 1,394 | | | | 1,289 | | | Monthly | | | 6.01 | | | | 6.01 | |
| | | | | | | | | | | | | | | | | | | | | | | | | | | | | | | | | | | | | | | | | | | | | | | |
| Financial leases | | | | | | | | | | | | | | | | | | | | | | | | | | | | | | | | | | | | | | | | | | | | | | |
| | | | | | | | | | | | | | | | | | | | | | | | | | | | | | | | | | | | | | | | | | | | | | | |
| 0-E | | NATIXIS | | France | | | US$ | | | | 4,140 | | | | 7,965 | | | | 77,028 | | | | - | | | | - | | | | 89,133 | | | | 86,256 | | | Quarterly / Semiannual | | | 6.29 | | | | 6.29 | |
| 0-E | | WACAPOU LEASING S.A. | | Luxembourg | | | US$ | | | | 835 | | | | 2,450 | | | | 3,277 | | | | - | | | | - | | | | 6,562 | | | | 6,280 | | | Quarterly | | | 4.32 | | | | 4.32 | |
| 0-E | | SOCIÉTÉ GÉNÉRALE MILAN BRANCH | | Italy | | | US$ | | | | 11,286 | | | | 151,047 | | | | - | | | | - | | | | - | | | | 162,333 | | | | 169,931 | | | Quarterly | | | 5.39 | | | | 5.39 | |
| 0-E | | GA Telesis LLC | | U.S.A. | | | US$ | | | | 677 | | | | 1,753 | | | | 4,675 | | | | 4,675 | | | | 10,480 | | | | 22,260 | | | | 13,495 | | | Monthly | | | 14.72 | | | | 14.72 | |
| | | | | | | | | | | | | | | | | | | | | | | | | | | | | | | | | | | | | | | | | | | | | | | |
| | | Total | | | | | | | | | 17,111 | | | | 163,714 | | | | 85,702 | | | | 4,675 | | | | 10,480 | | | | 281,682 | | | | 277,251 | | | | | | | | | | | |
Class of liability for the analysis of liquidity risk ordered by date of maturity as of December 31, 2019
Debtor: LATAM Airlines Group S.A. and Subsidiaries, Tax No. 89.862.200-2, Chile.
| | | | | | | | | | | | More than | | | More than | | | More than | | | | | | | | | | |
| | | | | | | | | Up to | | | 90 days | | | one to | | | three to | | | More than | | | | | | | |
| | | | | Creditor | | | | 90 | | | to one | | | three | | | five | | | five | | | | | | Nominal | |
| Tax No. | | Creditor | | country | | Currency | | days | | | year | | | years | | | years | | | years | | | Total | | | value | |
| | | | | | | | | ThUS$ | | | ThUS$ | | | ThUS$ | | | ThUS$ | | | ThUS$ | | | ThUS$ | | | ThUS$ | |
| Lease Liability | | | | | | | | | | | | | | | | | | | | | | | | | | | |
| - | | AIRCRAFT | | OTHERS | | US$ | | | 146,036 | | | | 417,929 | | | | 1,002,564 | | | | 877,353 | | | | 1,357,910 | | | | 3,801,792 | | | | 3,042,231 | |
| - | | OTHER ASSETS | | OTHERS | | US$ | | | 3,017 | | | | 8,649 | | | | 21,381 | | | | 19,815 | | | | 16,314 | | | | 69,176 | | | | 53,931 | |
| | | | | | | CLP | | | 160 | | | | 478 | | | | 531 | | | | - | | | | - | | | | 1,169 | | | | 1,195 | |
| | | | | | | UF | | | 2,713 | | | | 4,736 | | | | 5,789 | | | | 1,373 | | | | 2,956 | | | | 17,567 | | | | 17,145 | |
| | | | | | | COP | | | 71 | | | | 161 | | | | 37 | | | | 2 | | | | - | | | | 271 | | | | 259 | |
| | | | | | | EUR | | | 163 | | | | 387 | | | | 592 | | | | 122 | | | | - | | | | 1,264 | | | | 1,175 | |
| | | | | | | GBP | | | 16 | | | | 10 | | | | - | | | | - | | | | - | | | | 26 | | | | 24 | |
| | | | | | | MXN | | | 37 | | | | 93 | | | | 245 | | | | 10 | | | | - | | | | 385 | | | | 359 | |
| | | | | | | PEN | | | 95 | | | | 129 | | | | 83 | | | | 16 | | | | - | | | | 323 | | | | 306 | |
| | | | | | | Other currencies | | | 2,770 | | | | 8,370 | | | | 8,508 | | | | 43,104 | | | | - | | | | 62,752 | | | | 55,532 | |
| Trade and other accounts payables | | | | | | | | | | | | | | | | | | | | | | | | | | | | | | | | |
| | | | | | | | | | | | | | | | | | | | | | | | | | | | | | | | | | | |
| - | | OTHERS | | OTHERS | | US$ | | | 371,527 | | | | 13,993 | | | | - | | | | - | | | | - | | | | 385,520 | | | | 385,520 | |
| | | | | | | CLP | | | 220,383 | | | | 905 | | | | - | | | | - | | | | - | | | | 221,288 | | | | 221,288 | |
| | | | | | | BRL | | | 486,082 | | | | 320 | | | | - | | | | - | | | | - | | | | 486,402 | | | | 486,402 | |
| | | | | | | Other currencies | | | 576,378 | | | | 1,716 | | | | - | | | | - | | | | - | | | | 578,094 | | | | 578,094 | |
| Accounts payable to related parties currents | | | | | | | | | | | | | | | | | | | | | | | | | | | | | | | | |
| 78.591.370-1 | | Bethia S.A. y Filiales | | Chile | | CLP | | | 53 | | | | - | | | | - | | | | - | | | | - | | | | 53 | | | | 53 | |
| Foreing | | Patagonia Seafarms INC | | U.S.A. | | CLP | | | 3 | | | | - | | | | - | | | | - | | | | - | | | | 3 | | | | 3 | |
| | | | | | | | | | | | | | | | | | | | | | | | | | | | | | | | | | | |
| | | Total | | | | | | | 1,809,504 | | | | 457,876 | | | | 1,039,730 | | | | 941,795 | | | | 1,377,180 | | | | 5,626,085 | | | | 4,843,517 | |
| | | | | | | | | | | | | | | | | | | | | | | | | | | | | | | | | | | |
| | | Total consolidated | | | | | | | 2,287,910 | | | | 1,635,412 | | | | 3,517,382 | | | | 2,918,927 | | | | 3,797,690 | | | | 14,157,321 | | | | 12,054,695 | |
Class of liability for the analysis of liquidity risk ordered by date of maturity as of December 31, 2018 Restated
Debtor: LATAM Airlines Group S.A. and Subsidiaries, Tax No. 89.862.200-2 Chile.
| | | | | | | | | | | | More than | | | More than | | | More than | | | | | | | | | | | | | | | | | | |
| | | | | | | | | Up to | | | 90 days | | | one to | | | three to | | | More than | | | | | | | | | | | | | | | |
| | | | | Creditor | | | | 90 | | | to one | | | three | | | five | | | five | | | | | | Nominal | | | | | Effective | | | Nominal | |
| Tax No. | | Creditor | | country | | Currency | | days | | | year | | | years | | | years | | | years | | | Total | | | value | | | Amortization | | rate | | | rate | |
| | | | | | | | | ThUS$ | | | ThUS$ | | | ThUS$ | | | ThUS$ | | | ThUS$ | | | ThUS$ | | | ThUS$ | | | | | % | | | % | |
| | | | | | | | | | | | | | | | | | | | | | | | | | | | | | | | | | | | |
| Loans to exporters | | | | | | | | | | | | | | | | | | | | | | | | | | | | | | | | | |
| | | | | | | | | | | | | | | | | | | | | | | | | | | | | | | | | | | | |
| 97.032.000-8 | | BBVA | | Chile | | US$ | | | 38,625 | | | | 76,275 | | | | - | | | | - | | | | - | | | | 114,900 | | | | 113,000 | | | At Expiration | | | 3.36 | | | | 3.36 | |
| 97.032.000-8 | | BBVA | | Chile | | UF | | | - | | | | 52,490 | | | | - | | | | - | | | | - | | | | 52,490 | | | | 50,785 | | | At Expiration | | | 3.31 | | | | 3.31 | |
| 97.036.000-K | | SANTANDER | | Chile | | US$ | | | 23,070 | | | | - | | | | - | | | | - | | | | - | | | | 23,070 | | | | 23,000 | | | At Expiration | | | 3.90 | | | | 3.90 | |
| 97.003.000-K | | BANCO DO BRASIL | | Chile | | US$ | | | 201,884 | | | | - | | | | - | | | | - | | | | - | | | | 201,884 | | | | 200,000 | | | At Expiration | | | 3.64 | | | | 3.64 | |
| 97.951.000-4 | | HSBC | | Chile | | US$ | | | 12,094 | | | | - | | | | - | | | | - | | | | - | | | | 12,094 | | | | 12,000 | | | At Expiration | | | 3.14 | | | | 3.14 | |
| | | | | | | | | | | | | | | | | | | | | | | | | | | | | | | | | | | | | | | | | | | | | |
| Bank loans | | | | | | | | | | | | | | | | | | | | | | | | | | | | | | | | | | | | | | | | | | | | |
| | | | | | | | | | | | | | | | | | | | | | | | | | | | | | | | | | | | | | | | | | | | | |
| 97.023.000-9 | | CORPBANCA | | Chile | | UF | | | 5,778 | | | | 17,086 | | | | 16,662 | | | | - | | | | - | | | | 39,526 | | | | 38,231 | | | Quarterly | | | 3.35 | | | | 3.35 | |
| 0-E | | BLADEX | | U.S.A. | | US$ | | | - | | | | 15,766 | | | | - | | | | - | | | | - | | | | 15,766 | | | | 15,000 | | | Semiannual | | | 6.74 | | | | 6.74 | |
| 97.036.000-K | | SANTANDER | | Chile | | US$ | | | 1,347 | | | | 587 | | | | 102,521 | | | | - | | | | - | | | | 104,455 | | | | 102,521 | | | Quarterly | | | 5.60 | | | | 5.60 | |
| 76.362.099-9 | | BTG | | Chile | | UF | | | 510 | | | | 1,531 | | | | 69,435 | | | | - | | | | - | | | | 71,476 | | | | 65,862 | | | At Expiration | | | 3.10 | | | | 3.10 | |
| | | | | | | | | | | | | | | | | | | | | | | | | | | | | | | | | | | | | | | | | | | | | |
| Obligations with the public | | | | | | | | | | | | | | | | | | | | | | | | | | | | | | | | | | | | | | | | | | |
| | | | | | | | | | | | | | | | | | | | | | | | | | | | | | | | | | | | | | | | | | | | | |
| 0-E | | BANK OF NEW YORK | | U.S.A. | | US$ | | | - | | | | 84,375 | | | | 614,375 | | | | 96,250 | | | | 724,063 | | | | 1,519,063 | | | | 1,200,000 | | | At Expiration | | | 7.44 | | | | 7.03 | |
| 97.030.000-7 | | ESTADO | | Chile | | UF | | | - | | | | 18,985 | | | | 37,970 | | | | 196,970 | | | | 213,114 | | | | 467,039 | | | | 345,182 | | | At Expiration | | | 5.50 | | | | 5.50 | |
| | | | | | | | | | | | | | | | | | | | | | | | | | | | | | | | | | | | | | | | | | | | | |
| Guaranteed obligations | | | | | | | | | | | | | | | | | | | | | | | | | | | | | | | | | | | | | | | | | | |
| | | | | | | | | | | | | | | | | | | | | | | | | | | | | | | | | | | | | | | | | | | | | |
| 0-E | | CREDIT AGRICOLE | | France | | US$ | | | 743 | | | | 2,201 | | | | 5,718 | | | | 2,086 | | | | - | | | | 10,748 | | | | 10,080 | | | Quarterly | | | 3.23 | | | | 3.23 | |
| 0-E | | BNP PARIBAS | | U.S.A. | | US$ | | | 14,741 | | | | 61,973 | | | | 152,826 | | | | 145,252 | | | | 250,387 | | | | 625,179 | | | | 511,698 | | | Quarterly | | | 4.55 | | | | 4.55 | |
| 0-E | | WILMINGTON TRUST COMPANY | | U.S.A. | | US$ | | | 31,336 | | | | 96,304 | | | | 248,720 | | | | 289,251 | | | | 509,168 | | | | 1,174,779 | | | | 952,758 | | | Quarterly | | | 4.47 | | | | 4.47 | |
| 0-E | | CITIBANK | | U.S.A. | | US$ | | | 12,757 | | | | 38,398 | | | | 102,062 | | | | 77,710 | | | | 65,232 | | | | 296,159 | | | | 269,365 | | | Quarterly | | | 3.82 | | | | 2.93 | |
| 0-E | | US BANK | | U.S.A. | | US$ | | | 18,406 | | | | 55,112 | | | | 146,045 | | | | 144,670 | | | | 86,076 | | | | 450,309 | | | | 411,684 | | | Quarterly | | | 4.00 | | | | 2.82 | |
| 0-E | | NATIXIS | | France | | US$ | | | 14,027 | | | | 42,132 | | | | 111,528 | | | | 92,228 | | | | 124,910 | | | | 384,825 | | | | 324,524 | | | Quarterly | | | 4.69 | | | | 4.69 | |
| 0-E | | PK AirFinance | | U.S.A. | | US$ | | | 2,490 | | | | 7,663 | | | | 25,610 | | | | 3,153 | | | | - | | | | 38,916 | | | | 37,615 | | | Monthly | | | 4.15 | | | | 4.14 | |
| 0-E | | INVESTEC | | England | | US$ | | | 2,004 | | | | 11,579 | | | | 26,874 | | | | 24,367 | | | | - | | | | 64,824 | | | | 54,014 | | | Semiannual | | | 7.17 | | | | 7.17 | |
| | | | | | | | | | | | | | | | | | | | | | | | | | | | | | | | | | | | | | | | | | | | | |
| Other guaranteed obligations | | | | | | | | | | | | | | | | | | | | | | | | | | | | | | | | | | | | | | | | | | |
| | | | | | | | | | | | | | | | | | | | | | | | | | | | | | | | | | | | | | | | | | | | | |
| 0-E | | CREDIT AGRICOLE | | France | | US$ | | | 2,576 | | | | 8,380 | | | | 273,122 | | | | - | | | | - | | | | 284,078 | | | | 253,692 | | | At Expiration | | | 4.11 | | | | 4.11 | |
| 0-E | | DVB BANK SE | | Germany | | US$ | | | 28,087 | | | | 83,260 | | | | 213,177 | | | | 122,674 | | | | 20,274 | | | | 467,472 | | | | 422,065 | | | Quarterly | | | 4.42 | | | | 4.42 | |
| | | | | | | | | | | | | | | | | | | | | | | | | | | | | | | | | | | | | | | | | | | | | |
| Financial lease | | | | | | | | | | | | | | | | | | | | | | | | | | | | | | | | | | | | | | | | | | |
| | | | | | | | | | | | | | | | | | | | | | | | | | | | | | | | | | | | | | | | | | | | | |
| 0-E | | ING | | U.S.A. | | US$ | | | 4,025 | | | | 12,075 | | | | 12,134 | | | | - | | | | - | | | | 28,234 | | | | 26,831 | | | Quarterly | | | 5.70 | | | | 5.01 | |
| 0-E | | CREDIT AGRICOLE | | France | | US$ | | | 7,618 | | | | 21,994 | | | | 27,811 | | | | 1,684 | | | | - | | | | 59,107 | | | | 56,403 | | | Quarterly | | | 3.66 | | | | 3.31 | |
| 0-E | | CITIBANK | | U.S.A. | | US$ | | | 14,870 | | | | 44,570 | | | | 83,389 | | | | 42,178 | | | | - | | | | 185,007 | | | | 172,158 | | | Quarterly | | | 4.40 | | | | 3.80 | |
| 0-E | | PEFCO | | U.S.A. | | US$ | | | 5,771 | | | | 13,541 | | | | 3,899 | | | | - | | | | - | | | | 23,211 | | | | 22,407 | | | Quarterly | | | 5.64 | | | | 5.02 | |
| 0-E | | BNP PARIBAS | | U.S.A. | | US$ | | | 8,467 | | | | 25,214 | | | | 26,933 | | | | 1,641 | | | | - | | | | 62,255 | | | | 59,567 | | | Quarterly | | | 3.90 | | | | 3.58 | |
| 0-E | | WELLS FARGO | | U.S.A. | | US$ | | | 35,458 | | | | 106,397 | | | | 282,923 | | | | 239,168 | | | | 99,232 | | | | 763,178 | | | | 719,338 | | | Quarterly | | | 2.77 | | | | 2.09 | |
| 97.036.000-K | | SANTANDER | | Chile | | US$ | | | 6,340 | | | | 19,025 | | | | 49,945 | | | | 26,779 | | | | - | | | | 102,089 | | | | 95,022 | | | Quarterly | | | 3.68 | | | | 3.14 | |
| 0-E | | RRPF ENGINE | | England | | US$ | | | 1,167 | | | | 3,480 | | | | 9,103 | | | | 8,826 | | | | 4,870 | | | | 27,446 | | | | 23,012 | | | Monthly | | | 4.01 | | | | 4.01 | |
| 0-E | | APPLE BANK | | U.S.A. | | US$ | | | 1,711 | | | | 5,175 | | | | 13,640 | | | | 13,394 | | | | 760 | | | | 34,680 | | | | 31,544 | | | Quarterly | | | 3.93 | | | | 3.33 | |
| 0-E | | BTMU | | U.S.A. | | US$ | | | 3,489 | | | | 10,485 | | | | 27,605 | | | | 27,062 | | | | 775 | | | | 69,416 | | | | 63,189 | | | Quarterly | | | 4.06 | | | | 3.46 | |
| 0-E | | NATIXIS | | France | | US$ | | | 4,242 | | | | 9,870 | | | | 9,815 | | | | 563 | | | | - | | | | 24,490 | | | | 23,161 | | | Quarterly | | | 4.28 | | | | 4.12 | |
| 0-E | | KFW IPEX-BANK | | Germany | | US$ | | | 1,764 | | | | 5,328 | | | | 5,378 | | | | - | | | | - | | | | 12,470 | | | | 12,215 | | | Quarterly | | | 4.20 | | | | 4.19 | |
| 0-E | | AIRBUS FINANCIAL | | U.S.A. | | US$ | | | 2,074 | | | | 6,197 | | | | 7,840 | | | | - | | | | - | | | | 16,111 | | | | 15,417 | | | Monthly | | | 4.19 | | | | 4.19 | |
| | | | | | | | | | | | | | | | | | | | | | | | | | | | | | | | | | | | | | | | | | | | | |
| Other loans | | | | | | | | | | | | | | | | | | | | | | | | | | | | | | | | | | | | | | | | | | |
| | | | | | | | | | | | | | | | | | | | | | | | | | | | | | | | | | | | | | | | | | | | | |
| 0-E | | CITIBANK (*) | | U.S.A. | | US$ | | | 25,705 | | | | 77,703 | | | | 103,341 | | | | - | | | | - | | | | 206,749 | | | | 196,211 | | | Quarterly | | | 6.00 | | | | 6.00 | |
| 0-E | | Boeing | | U.S.A. | | US$ | | | 559 | | | | 1,425 | | | | 55,728 | | | | - | | | | - | | | | 57,712 | | | | 55,727 | | | At Expiration | | | 4.01 | | | | 4.01 | |
| | | | | | | | | | | | | | | | | | | | | | | | | | | | | | | | | | | | | | | | | | | | | |
| Hedge derivative | | | | | | | | | | | | | | | | | | | | | | | | | | | | | | | | | | | | | | | | | | |
| | | | | | | | | | | | | | | | | | | | | | | | | | | | | | | | | | | | | | | | | | | | | |
| - | | OTHERS | | - | | US$ | | | 1,224 | | | | 2,484 | | | | 681 | | | | - | | | | - | | | | 4,389 | | | | 4,021 | | | - | | | - | | | | - | |
| | | | | | | | | | | | | | | | | | | | | | | | | | | | | | | | | | | | | | | | | | | | | |
| | | Total | | | | | | | 534,959 | | | | 1,039,060 | | | | 2,866,810 | | | | 1,555,906 | | | | 2,098,861 | | | | 8,095,596 | | | | 6,989,299 | | | | | | | | | | | |
(*) Bonus securitized with the future flows of credit card sales in the United States and Canada.
Class of liability for the analysis of liquidity risk ordered by date of maturity as of December 31, 2018 Restated
Debtor: TAM S.A. and Subsidiaries, Tax No. 02.012.862/0001-60, Brazil.
| | | | | | | | | | | | More than | | | More than | | | More than | | | | | | | | | | | | | | | | | | |
| | | | | | | | | Up to | | | 90 days | | | one to | | | three to | | | More than | | | | | | | | | | | | | | | |
| | | | | Creditor | | | | 90 | | | to one | | | three | | | five | | | five | | | | | | Nominal | | | | | Effective | | | Nominal | |
| Tax No. | | Creditor | | country | | Currency | | days | | | year | | | years | | | years | | | years | | | Total | | | value | | | Amortization | | rate | | | rate | |
| | | | | | | | | ThUS$ | | | ThUS$ | | | ThUS$ | | | ThUS$ | | | ThUS$ | | | ThUS$ | | | ThUS$ | | | | | % | | | % | |
| | | | | | | | | | | | | | | | | | | | | | | | | | | | | | | | | | | | |
| Bank loans | | | | | | | | | | | | | | | | | | | | | | | | | | | | | | | | |
| | | | | | | | | | | | | | | | | | | | | | | | | | | | | | | | | | | | |
| 0-E | | NEDERLANDSCHENCM | | Holland | | US$ | | | 175 | | | | 499 | | | | 1,332 | | | | 55 | | | | - | | | | 2,061 | | | | 1,851 | | | Monthly | | | 6.01 | | | | 6.01 | |
| | | | | | | | | | | | | | | | | | | | | | | | | | | | | | | | | | | | | | | | | | | | | |
| Financial leases | | | | | | | | | | | | | | | | | | | | | | | | | | | | | | | | | | | | | | | | | | |
| | | | | | | | | | | | | | | | | | | | | | | | | | | | | | | | | | | | | | | | | | | | | |
| 0-E | | NATIXIS | | France | | US$ | | | 4,195 | | | | 7,935 | | | | 46,780 | | | | 41,872 | | | | - | | | | 100,782 | | | | 95,789 | | | Quarterly / Semiannual | | | 6.87 | | | | 6.87 | |
| 0-E | | WACAPOU LEASING S.A. | | Luxembourg | | US$ | | | 839 | | | | 2,433 | | | | 6,542 | | | | - | | | | - | | | | 9,814 | | | | 9,226 | | | Quarterly | | | 4.81 | | | | 4.81 | |
| 0-E | | SOCIÉTÉ GÉNÉRALE MILAN BRANCH | | Italy | | US$ | | | 11,536 | | | | 32,312 | | | | 161,778 | | | | - | | | | - | | | | 205,626 | | | | 208,224 | | | Quarterly | | | 5.88 | | | | 5.82 | |
| 0-E | | GA Telesis LLC | | U.S.A. | | US$ | | | 680 | | | | 1,753 | | | | 4,675 | | | | 4,675 | | | | 11,318 | | | | 23,101 | | | | 13,202 | | | Monthly | | | 15.62 | | | | 15.62 | |
| | | | | | | | | | | | | | | | | | | | | | | | | | | | | | | | | | | | | | | | | | | | | |
| | | Total | | | | | | | 17,425 | | | | 44,932 | | | | 221,107 | | | | 46,602 | | | | 11,318 | | | | 341,384 | | | | 328,292 | | | | | | | | | | | |
Class of liability for the analysis of liquidity risk ordered by date of maturity as of December 31, 2017
Debtor: TAM S.A. and Subsidiaries, Tax No. 02.012.862/0001-60, Brazil.
| | | | | | | | | | | | More than | | | More than | | | More than | | | | | | | | | | | | | | | | | | |
| | | | | | | | | Up to | | | 90 days | | | one to | | | three to | | | More than | | | | | | | | | | | | | | | |
| | | | | Creditor | | | | 90 | | | to one | | | three | | | five | | | five | | | | | | Nominal | | | | | Effective | | | Nominal | |
| Tax No. | | Creditor | | country | | Currency | | days | | | year | | | years | | | years | | | years | | | Total | | | value | | | Amortization | | rate | | | rate | |
| | | | | | | | | ThUS$ | | | ThUS$ | | | ThUS$ | | | ThUS$ | | | ThUS$ | | | ThUS$ | | | ThUS$ | | | | | % | | | % | |
| Bank loans | | | | | | | | | | | | | | | | | | | | | | | | | | | | | | | | | | | | | | | | | | | | |
| 0-E | | NEDERLANDSCHE | | | | | | | | | | | | | | | | | | | | | | | | | | | | | | | | | | | | | | | | | | |
| | | CREDIETVERZEKERING MAATSCHAPPIJ | | Holland | | US$ | | | 176 | | | | 497 | | | | 1,332 | | | | 722 | | | | - | | | | 2,727 | | | | 2,382 | | | Monthly | | | 6.01 | | | | 6.01 | |
| Financial leases | | | | | | | | | | | | | | | | | | | | | | | | | | | | | | | | | | | | | | | | | | | | |
| 0-E | | NATIXIS | | France | | US$ | | | 4,248 | | | | 7,903 | | | | 23,141 | | | | 71,323 | | | | - | | | | 106,615 | | | | 99,036 | | | Quarterly / Semiannual | | | 5.59 | | | | 5.59 | |
| 0-E | | WACAPOU LEASING S.A. | | Luxembourg | | US$ | | | 837 | | | | 2,411 | | | | 6,509 | | | | 3,277 | | | | - | | | | 13,034 | | | | 12,047 | | | Quarterly | | | 3.69 | | | | 3.69 | |
| 0-E | | SOCIÉTÉ GÉNÉRALE MILAN BRANCH | | Italy | | US$ | | | 11,735 | | | | 32,230 | | | | 204,836 | | | | - | | | | - | | | | 248,801 | | | | 244,513 | | | Quarterly | | | 4.87 | | | | 4.81 | |
| 0-E | | BANCO IBM S.A | | Brazil | | BRL | | | 34 | | | | - | | | | - | | | | - | | | | - | | | | 34 | | | | 21 | | | Monthly | | | 6.89 | | | | 6.89 | |
| 0-E | | SOCIÉTÉ GÉNÉRALE | | France | | BRL | | | 161 | | | | 12 | | | | - | | | | - | | | | - | | | | 173 | | | | 109 | | | Monthly | | | 6.89 | | | | 6.89 | |
| | | Total | | | | | | | 17,191 | | | | 43,053 | | | | 235,818 | | | | 75,322 | | | | - | | | | 371,384 | | | | 358,108 | | | | | | | | | | | |
Class of liability for the analysis of liquidity risk ordered by date of maturity as of December 31, 20172018 Restated
Debtor: LATAM Airlines Group S.A. and Subsidiaries, Tax No. 89.862.200-2, Chile.
| | | | | | | | | | | | More than | | | More than | | | More than | | | | | | | | | | | | | | | | | | | |
| | | | | | | | | Up to | | | 90 days | | | one to | | | three to | | | More than | | | | | | | | | | | | | | | | |
| | | | | Creditor | | | | 90 | | | to one | | | three | | | five | | | five | | | | | | Nominal | | | | | | Effective | | | Nominal | |
| Tax No. | | Creditor | | country | | Currency | | days | | | year | | | years | | | years | | | years | | | Total | | | value | | | Amortization | | | rate | | | rate | |
| | | | | | | | | ThUS$ | | | ThUS$ | | | ThUS$ | | | ThUS$ | | | ThUS$ | | | ThUS$ | | | ThUS$ | | | | | | % | | | % | |
| | | | | | | | | | | | | | | | | | | | | | | | | | | | | | | | | | | | | |
| Trade and other accounts payables | | | | | | | | | | | | | | | | | | | | | | | | | | | | | | | | | | | | | | | | | | | | |
| | | | | | | | | | | | | | | | | | | | | | | | | | | | | | | | | | | | | | | | | | | | | | | |
| - | | OTHERS | | OTHERS | | ThUS$ | | | 566,838 | | | | - | | | | - | | | | - | | | | - | | | | 566,838 | | | | 566,838 | | | | - | | | | - | | | | - | |
| | | | | | | CLP | | | 165,299 | | | | - | | | | - | | | | - | | | | - | | | | 165,299 | | | | 165,299 | | | | - | | | | - | | | | - | |
| | | | | | | BRL | | | 315,605 | | | | - | | | | - | | | | - | | | | - | | | | 315,605 | | | | 315,605 | | | | - | | | | - | | | | - | |
| | | | | | | Other currencies | | | 290,244 | | | | 11,215 | | | | - | | | | - | | | | - | | | | 301,459 | | | | 301,459 | | | | - | | | | - | | | | - | |
| Accounts payable to related parties currents | | | | | | | | | | | | | | | | | | | | | | | | | | | | | | | | | | | | | | | | | | | | |
| 78.997.060-2 | | Viajes Falabella Ltda. | | Chile | | CLP | | | 534 | | | | - | | | | - | | | | - | | | | - | | | | 534 | | | | 534 | | | | - | | | | - | | | | - | |
| 0-E | | Inversora Aeronáutica Argentina | | Argentina | | ThUS$ | | | 4 | | | | - | | | | - | | | | - | | | | - | | | | 4 | | | | 4 | | | | - | | | | - | | | | - | |
| 0-E | | Consultoría Administrativa Profesional S.A. de C.V. | | Mexico | | MXN | | | 210 | | | | - | | | | - | | | | - | | | | - | | | | 210 | | | | 210 | | | | - | | | | - | | | | - | |
| 78.591.370-1 | | Bethia S.A. y Filiales | | Chile | | CLP | | | 12 | | | | - | | | | - | | | | - | | | | - | | | | 12 | | | | 12 | | | | - | | | | - | | | | - | |
| | | Total | | | | | | | 1,338,746 | | | | 11,215 | | | | - | | | | - | | | | - | | | | 1,349,961 | | | | 1,349,961 | | | | | | | | | | | | | |
| | | | | | | | | | | | | | | | | | | | | | | | | | | | | | | | | | | | | | | | | | | | | | | |
| | | Total consolidated | | | | | | | 1,891,289 | | | | 1,014,552 | | | | 3,246,203 | | | | 1,706,312 | | | | 2,780,822 | | | | 10,639,178 | | | | 9,341,682 | | | | | | | | | | | | | |
Class of liability for the analysis of liquidity risk ordered by date of maturity as of December 31, 2016
Debtor: LATAM Airlines Group S.A. and Subsidiaries, Tax No. 89.862.200-2 Chile.
| | | | | | | | | | | | More than | | | More than | | | More than | | | | | | | | | | | | | | | | | | |
| | | | | | | | | Up to | | | 90 days | | | one to | | | three to | | | More than | | | | | | | | | | | | | | | |
| | | | | Creditor | | | | 90 | | | to one | | | three | | | five | | | five | | | | | | Nominal | | | | | Effective | | | Nominal | |
| Tax No. | | Creditor | | country | | Currency | | days | | | year | | | years | | | years | | | years | | | Total | | | value | | | Amortization | | rate | | | rate | |
| | | | | | | | | ThUS$ | | | ThUS$ | | | ThUS$ | | | ThUS$ | | | ThUS$ | | | ThUS$ | | | ThUS$ | | | | | % | | | % | |
| | | | | | | | | | | | | | | | | | | | | | | | | | | | | | | | | | | | |
| Loans to exporters | | | | | | | | | | | | | | | | | | | | | | | | | | | | | | | | | | | | | | | | | | |
| | | | | | | | | | | | | | | | | | | | | | | | | | | | | | | | | | | | | | | | | | | | | |
| 97.032.000-8 | | BBVA | | Chile | | ThUS$ | | | 75,212 | | | | - | | | | - | | | | - | | | | - | | | | 75,212 | | | | 75,000 | | | At Expiration | | | 1.85 | | | | 1.85 | |
| 97.032.000-8 | | BBVA | | Chile | | ThUS$ | | | - | | | | 52,675 | | | | - | | | | - | | | | - | | | | 52,675 | | | | 50,381 | | | At Expiration | | | 5.23 | | | | 4.43 | |
| 97.036.000-K | | SANTANDER | | Chile | | ThUS$ | | | 30,193 | | | | - | | | | - | | | | - | | | | - | | | | 30,193 | | | | 30,000 | | | At Expiration | | | 2.39 | | | | 2.39 | |
| 97.030.000-7 | | ESTADO | | Chile | | ThUS$ | | | 40,191 | | | | - | | | | - | | | | - | | | | - | | | | 40,191 | | | | 40,000 | | | At Expiration | | | 1.91 | | | | 1.91 | |
| 97.003.000-K | | BANCO DO BRASIL | | Chile | | ThUS$ | | | 72,151 | | | | - | | | | - | | | | - | | | | - | | | | 72,151 | | | | 70,000 | | | At Expiration | | | 3.08 | | | | 3.08 | |
| 97.951.000-4 | | HSBC | | Chile | | ThUS$ | | | 12,054 | | | | - | | | | - | | | | - | | | | - | | | | 12,054 | | | | 12,000 | | | At Expiration | | | 1.79 | | | | 1.79 | |
| | | | | | | | | | | | | | | | | | | | | | | | | | | | | | | | | | | | | | | | | | | | | |
| Bank loans | | | | | | | | | | | | | | | | | | | | | | | | | | | | | | | | | | | | | | | | | | | | |
| | | | | | | | | | | | | | | | | | | | | | | | | | | | | | | | | | | | | | | | | | | | | |
| 97.023.000-9 | | CORPBANCA | | Chile | | UF | | | 20,808 | | | | 61,112 | | | | 63,188 | | | | 16,529 | | | | - | | | | 161,637 | | | | 153,355 | | | Quarterly | | | 4.06 | | | | 4.06 | |
| 0-E | | BLADEX | | U.S.A. | | ThUS$ | | | - | | | | 14,579 | | | | 31,949 | | | | - | | | | - | | | | 46,528 | | | | 42,500 | | | Semiannual | | | 5.14 | | | | 5.14 | |
| 0-E | | DVB BANK SE | | U.S.A. | | ThUS$ | | | 145 | | | | 199 | | | | 28,911 | | | | - | | | | - | | | | 29,255 | | | | 28,911 | | | Quarterly | | | 1.86 | | | | 1.86 | |
| 97.036.000-K | | SANTANDER | | Chile | | ThUS$ | | | 1,497 | | | | 4,308 | | | | 160,556 | | | | - | | | | - | | | | 166,361 | | | | 158,194 | | | Quarterly | | | 3.55 | | | | 3.55 | |
| | | | | | | | | | | | | | | | | | | | | | | | | | | | | | | | | | | | | | | | | | | | | |
| Obligations with the public | | | | | | | | | | | | | | | | | | | | | | | | | | | | | | | | | | | | | | | | | | |
| | | | | | | | | | | | | | | | | | | | | | | | | | | | | | | | | | | | | | | | | | | | | |
| 0-E | | BANK OF NEW YORK | | U.S.A. | | ThUS$ | | | - | | | | 36,250 | | | | 72,500 | | | | 518,125 | | | | - | | | | 626,875 | | | | 500,000 | | | At Expiration | | | 7.77 | | | | 7.25 | |
| | | | | | | | | | | | | | | | | | | | | | | | | | | | | | | | | | | | | | | | | | | | | |
| Guaranteed obligations | | | | | | | | | | | | | | | | | | | | | | | | | | | | | | | | | | | | | | | | | | |
| | | | | | | | | | | | | | | | | | | | | | | | | | | | | | | | | | | | | | | | | | | | | |
| 0-E | | CREDIT AGRICOLE | | France | | ThUS$ | | | 11,728 | | | | 30,916 | | | | 65,008 | | | | 33,062 | | | | 3,760 | | | | 144,474 | | | | 138,417 | | | Quarterly | | | 2.21 | | | | 1.81 | |
| 0-E | | BNP PARIBAS | | U.S.A. | | ThUS$ | | | 13,805 | | | | 56,324 | | | | 142,178 | | | | 141,965 | | | | 376,894 | | | | 731,166 | | | | 628,118 | | | Quarterly | | | 2.97 | | | | 2.96 | |
| 0-E | | WELLS FARGO | | U.S.A. | | ThUS$ | | | 35,896 | | | | 107,830 | | | | 287,878 | | | | 288,338 | | | | 411,076 | | | | 1,131,018 | | | | 1,056,345 | | | Quarterly | | | 2.37 | | | | 1.68 | |
| 0-E | | WILMINGTON TRUST COMPANY | | U.S.A. | | ThUS$ | | | 25,833 | | | | 79,043 | | | | 206,952 | | | | 200,674 | | | | 733,080 | | | | 1,245,582 | | | | 967,336 | | | Quarterly | | | 4.25 | | | | 4.25 | |
| 0-E | | CITIBANK | | U.S.A. | | ThUS$ | | | 20,224 | | | | 61,020 | | | | 164,077 | | | | 166,165 | | | | 184,053 | | | | 595,539 | | | | 548,168 | | | Quarterly | | | 2.72 | | | | 1.96 | |
| 97.036.000-K | | SANTANDER | | Chile | | ThUS$ | | | 5,857 | | | | 17,697 | | | | 47,519 | | | | 48,024 | | | | 26,448 | | | | 145,545 | | | | 138,574 | | | Quarterly | | | 1.98 | | | | 1.44 | |
| 0-E | | BTMU | | U.S.A. | | ThUS$ | | | 3,163 | | | | 9,568 | | | | 25,752 | | | | 26,117 | | | | 27,270 | | | | 91,870 | | | | 85,990 | | | Quarterly | | | 2.31 | | | | 1.72 | |
| 0-E | | APPLE BANK | | U.S.A. | | ThUS$ | | | 1,551 | | | | 4,712 | | | | 12,693 | | | | 12,891 | | | | 13,857 | | | | 45,704 | | | | 42,754 | | | Quarterly | | | 2.29 | | | | 1.69 | |
| 0-E | | US BANK | | U.S.A. | | ThUS$ | | | 18,563 | | | | 55,592 | | | | 147,357 | | | | 146,045 | | | | 230,747 | | | | 598,304 | | | | 532,608 | | | Quarterly | | | 3.99 | | | | 2.81 | |
| 0-E | | DEUTSCHE BANK | | U.S.A. | | ThUS$ | | | 6,147 | | | | 18,599 | | | | 31,640 | | | | 31,833 | | | | 48,197 | | | | 136,416 | | | | 117,263 | | | Quarterly | | | 3.86 | | | | 3.86 | |
| 0-E | | NATIXIS | | France | | ThUS$ | | | 14,779 | | | | 44,826 | | | | 116,809 | | | | 96,087 | | | | 206,036 | | | | 478,537 | | | | 422,851 | | | Quarterly | | | 2.60 | | | | 2.57 | |
| 0-E | | PK AirFinance | | U.S.A. | | ThUS$ | | | 2,265 | | | | 6,980 | | | | 19,836 | | | | 25,610 | | | | 3,153 | | | | 57,844 | | | | 54,787 | | | Monthly | | | 2.40 | | | | 2.40 | |
| 0-E | | KFW IPEX-BANK | | Germany | | ThUS$ | | | 2,503 | | | | 7,587 | | | | 18,772 | | | | 9,178 | | | | - | | | | 38,040 | | | | 36,191 | | | Quarterly | | | 2.55 | | | | 2.55 | |
| 0-E | | AIRBUS FINANCIAL | | U.S.A. | | ThUS$ | | | 1,982 | | | | 5,972 | | | | 16,056 | | | | 7,766 | | | | - | | | | 31,776 | | | | 30,199 | | | Monthly | | | 2.49 | | | | 2.49 | |
| 0-E | | INVESTEC | | England | | ThUS$ | | | 1,880 | | | | 10,703 | | | | 25,369 | | | | 25,569 | | | | 23,880 | | | | 87,401 | | | | 72,202 | | | Semiannual | | | 5.67 | | | | 5.67 | |
| Other guaranteed obligations | | | | | | | | | | | | | | | | | | | | | | | | | | | | | | | | | | | | | | | | | | |
| | | | | | | | | | | | | | | | | | | | | | | | | | | | | | | | | | | | | | | | | | | | | |
| 0-E | | CREDIT AGRICOLE | | France | | ThUS$ | | | 1,501 | | | | 4,892 | | | | 268,922 | | | | - | | | | - | | | | 275,315 | | | | 256,860 | | | At Expiration | | | 2.85 | | | | 2.85 | |
| Financial leases | | | | | | | | | | | | | | | | | | | | | | | | | | | | | | | | | | | | | | | | | | |
| | | | | | | | | | | | | | | | | | | | | | | | | | | | | | | | | | | | | | | | | | | | | |
| 0-E | | ING | | U.S.A. | | ThUS$ | | | 5,889 | | | | 17,671 | | | | 34,067 | | | | 12,134 | | | | - | | | | 69,761 | | | | 63,698 | | | Quarterly | | | 5.62 | | | | 4.96 | |
| 0-E | | CREDIT AGRICOLE | | France | | ThUS$ | | | 1,788 | | | | 5,457 | | | | - | | | | - | | | | - | | | | 7,245 | | | | 7,157 | | | Quarterly | | | 1.85 | | | | 1.85 | |
| 0-E | | CITIBANK | | U.S.A. | | ThUS$ | | | 6,083 | | | | 18,250 | | | | 48,667 | | | | 14,262 | | | | - | | | | 87,262 | | | | 78,249 | | | Quarterly | | | 6.40 | | | | 5.67 | |
| 0-E | | PEFCO | | U.S.A. | | ThUS$ | | | 17,558 | | | | 50,593 | | | | 67,095 | | | | 3,899 | | | | - | | | | 139,145 | | | | 130,811 | | | Quarterly | | | 5.39 | | | | 4.79 | |
| 0-E | | BNP PARIBAS | | U.S.A. | | ThUS$ | | | 13,744 | | | | 41,508 | | | | 79,165 | | | | 22,474 | | | | - | | | | 156,891 | | | | 149,119 | | | Quarterly | | | 3.69 | | | | 3.26 | |
| 0-E | | WELLS FARGO | | U.S.A. | | ThUS$ | | | 5,591 | | | | 16,751 | | | | 44,615 | | | | 44,514 | | | | 1,880 | | | | 113,351 | | | | 103,326 | | | Quarterly | | | 3.98 | | | | 3.54 | |
| 0-E | | DVB BANK SE | | U.S.A. | | ThUS$ | | | 4,773 | | | | 9,541 | | | | - | | | | - | | | | - | | | | 14,314 | | | | 14,127 | | | Quarterly | | | 2.57 | | | | 2.57 | |
| 0-E | | RRPF ENGINE | | England | | ThUS$ | | | - | | | | - | | | | 8,248 | | | | 8,248 | | | | 12,716 | | | | 29,212 | | | | 25,274 | | | Monthly | | | 2.35 | | | | 2.35 | |
| | | | | | | | | | | | | | | | | | | | | | | | | | | | | | | | | | | | | | | | | | | | | |
| Other loans | | | | | | | | | | | | | | | | | | | | | | | | | | | | | | | | | | | | | | | | | | |
| | | | | | | | | | | | | | | | | | | | | | | | | | | | | | | | | | | | | | | | | | | | | |
| 0-E | | BOEING | | U.S.A. | | ThUS$ | | | 163 | | | | 320 | | | | 26,214 | | | | - | | | | - | | | | 26,697 | | | | 26,214 | | | At Expiration | | | 2.35 | | | | 2.35 | |
| 0-E | | CITIBANK (*) | | U.S.A. | | ThUS$ | | | 25,802 | | | | 77,795 | | | | 207,001 | | | | 103,341 | | | | - | | | | 413,939 | | | | 370,389 | | | Quarterly | | | 6.00 | | | | 6.00 | |
| | | | | | | | | | | | | | | | | | | | | | | | | | | | | | | | | | | | | | | | | | | | | |
| Hedging derivatives | | | | | | | | | | | | | | | | | | | | | | | | | | | | | | | | | | | | | | | | | | |
| - | | OTROS | | - | | ThUS$ | | | 7,364 | | | | 15,479 | | | | 7,846 | | | | - | | | | - | | | | 30,689 | | | | - | | | - | | | 0.00 | | | | 0.00 | |
| - | | Total | | | | | | | 508,683 | | | | 944,749 | | | | 2,476,840 | | | | 2,002,850 | | | | 2,303,047 | | | | 8,236,169 | | | | 7,257,368 | | | | | | | | | | | |
(*) Securitized bond with the future flows from the sales with credit card in United States and Canada.
Clases de pasivo para el análisis del riesgo de liquidez agrupado por vencimiento al 31 de diciembre de 2016
Nombre empresa deudora: TAM S.A. y Filiales, Rut 02.012.862/0001-60, Brasil.
| | | | | | | | | | | | Más de | | | Más de | | | Más de | | | | | | | | | | | | | | | | | | |
| | | | | País de | | Descripción | | Hasta | | | 90 días | | | uno a | | | tres a | | | Más de | | | | | | Total | | | | | | | | | |
| Rut empresa | | | | empresa | | de la | | 90 | | | a un | | | tres | | | cinco | | | cinco | | | Total | | | Valor | | | Tipo de | | Tasa | | | Tasa | |
| acreedora | | Nombre empresa acreedora | | acreedora | | moneda | | días | | | año | | | años | | | años | | | años | | | Valor | | | nominal | | | amortización | | efectiva | | | nominal | |
| | | | | | | | | MUS$ | | | MUS$ | | | MUS$ | | | MUS$ | | | MUS$ | | | MUS$ | | | MUS$ | | | | | % | | | % | |
| | | | | | | | | | | | | | | | | | | | | | | | | | | | | | | | | | | | |
| Préstamos bancarios | | | | | | | | | | | | | | | | | | | | | | | | | | | | | | | | | | | | | | | | | | |
| | | | | | | | | | | | | | | | | | | | | | | | | | | | | | | | | | | | | | | | | | | | | |
| 0-E | | NEDERLANDSCHE CREDIETVERZEKERING MAATSCHAPPIJ | | Holanda | | US$ | | | 179 | | | | 493 | | | | 1,315 | | | | 1,314 | | | | 54 | | | | 3,355 | | | | 2,882 | | | Mensual | | | 6.01 | | | | 6.01 | |
| 0-E | | CITIBANK | | E.E.U.U. | | US$ | | | 1,528 | | | | 203,150 | | | | - | | | | - | | | | - | | | | 204,678 | | | | 200,000 | | | Al Vencimiento | | | 3.39 | | | | 3.14 | |
| | | | | | | | | | | | | | | | | | | | | | | | | | | | | | | | | | | | | | | | | | | | | |
| Obligaciones con el Público | | | | | | | | | | | | | | | | | | | | | | | | | | | | | | | | | | | | | | | | | | |
| | | | | | | | | | | | | | | | | | | | | | | | | | | | | | | | | | | | | | | | | | | | | |
| 0-E | | THE BANK OF NEW YORK | | E.E.U.U. | | US$ | | | - | | | | 352,938 | | | | 83,750 | | | | 562,813 | | | | - | | | | 999,501 | | | | 800,000 | | | Al Vencimiento | | | 8.17 | | | | 8.00 | |
| | | | | | | | | | | | | | | | | | | | | | | | | | | | | | | | | | | | | | | | | | | | | |
| Arrendamiento Financiero | | | | | | | | | | | | | | | | | | | | | | | | | | | | | | | | | | | | | | | | | | |
| | | | | | | | | | | | | | | | | | | | | | | | | | | | | | | | | | | | | | | | | | | | | |
| 0-E | | AFS INVESTMENT IX LLC | | E.E.U.U. | | US$ | | | 2,733 | | | | 7,698 | | | | 20,522 | | | | 8,548 | | | | - | | | | 39,501 | | | | 35,448 | | | Mensual | | | 1.25 | | | | 1.25 | |
| 0-E | | DVB BANK SE | | E.E.U.U. | | US$ | | | 120 | | | | 165 | | | | - | | | | - | | | | - | | | | 285 | | | | 282 | | | Mensual | | | 2.50 | | | | 2.50 | |
| 0-E | | GENERAL ELECTRIC CAPITAL CORPORATION | | E.E.U.U. | | US$ | | | 3,852 | | | | 5,098 | | | | - | | | | - | | | | - | | | | 8,950 | | | | 8,846 | | | Mensual | | | 2.30 | | | | 2.30 | |
| 0-E | | KFW IPEX-BANK | | Alemania | | US$ | | | 592 | | | | 1,552 | | | | - | | | | - | | | | - | | | | 2,144 | | | | 2,123 | | | Mensual/Trimestral | | | 2.80 | | | | 2.80 | |
| 0-E | | NATIXIS | | Francia | | US$ | | | 4,290 | | | | 7,837 | | | | 22,834 | | | | 40,968 | | | | 41,834 | | | | 117,763 | | | | 107,443 | | | Trimestral/Semestral | | | 4.90 | | | | 4.90 | |
| 0-E | | WACAPOU LEASING S.A. | | Luxemburgo | | US$ | | | 833 | | | | 2,385 | | | | 6,457 | | | | 6,542 | | | | - | | | | 16,217 | | | | 14,754 | | | Trimestral | | | 3.00 | | | | 3.00 | |
| 0-E | | SOCIÉTÉ GÉNÉRALE MILAN BRANCH | | Italia | | US$ | | | 11,875 | | | | 32,116 | | | | 85,995 | | | | 171,553 | | | | - | | | | 301,539 | | | | 279,335 | | | Trimestral | | | 4.18 | | | | 4.11 | |
| 0-E | | BANCO IBM S.A | | Brasil | | BRL | | | 380 | | | | 1,161 | | | | 35 | | | | - | | | | - | | | | 1,576 | | | | 1,031 | | | Mensual | | | 13.63 | | | | 13.63 | |
| 0-E | | HP FINANCIAL SERVICE | | Brasil | | BRL | | | 225 | | | | - | | | | - | | | | - | | | | - | | | | 225 | | | | 222 | | | Mensual | | | 10.02 | | | | 10.02 | |
| 0-E | | SOCIÉTÉ GÉNÉRALE | | Francia | | BRL | | | 146 | | | | 465 | | | | 176 | | | | - | | | | - | | | | 787 | | | | 519 | | | Mensual | | | 13.63 | | | | 13.63 | |
| | | Total | | | | | | | 26,753 | | | | 615,058 | | | | 221,084 | | | | 791,738 | | | | 41,888 | | | | 1,696,521 | | | | 1,452,885 | | | | | | | | | | | |
| | | | | | | | | | | | More than | | | More than | | | More than | | | | | | | | | | |
| | | | | | | | | Up to | | | 90 days | | | one to | | | three to | | | More than | | | | | | | |
| | | | | Creditor | | | | 90 | | | to one | | | three | | | five | | | five | | | | | | Nominal | |
| Tax No. | | Creditor | | country | | Currency | | days | | | year | | | years | | | years | | | years | | | Total | | | value | |
| | | | | | | | | ThUS$ | | | ThUS$ | | | ThUS$ | | | ThUS$ | | | ThUS$ | | | ThUS$ | | | ThUS$ | |
| Leases Liability | | | | | | | | | | | | | | | | | | | | | | | | | | | |
| - | | AIRCRAFT | | OTHERS | | US$ | | | 140,780 | | | | 420,561 | | | | 1,015,495 | | | | 785,417 | | | | 1,298,585 | | | | 3,660,838 | | | | 2,721,352 | |
| - | | OTHER ASSETS | | OTHERS | | US$ | | | 4,968 | | | | 14,536 | | | | 25,689 | | | | 20,029 | | | | 21,138 | | | | 86,360 | | | | 86,360 | |
| | | | | | | CLP | | | 57 | | | | 170 | | | | 1 | | | | - | | | | - | | | | 228 | | | | 228 | |
| | | | | | | UF | | | 1,683 | | | | 2,565 | | | | 667 | | | | 34 | | | | - | | | | 4,949 | | | | 4,949 | |
| | | | | | | COP | | | 304 | | | | 731 | | | | 366 | | | | 21 | | | | - | | | | 1,422 | | | | 1,422 | |
| | | | | | | EUR | | | 311 | | | | 431 | | | | 215 | | | | - | | | | - | | | | 957 | | | | 957 | |
| | | | | | | GBP | | | 45 | | | | 128 | | | | 36 | | | | - | | | | - | | | | 209 | | | | 209 | |
| | | | | | | MXN | | | 33 | | | | 92 | | | | 235 | | | | 115 | | | | - | | | | 475 | | | | 475 | |
| | | | | | | PEN | | | 183 | | | | 409 | | | | 114 | | | | - | | | | - | | | | 706 | | | | 706 | |
| | | | | | | | | | | | | | | | | | | | | | | | | | | | | | | | | | | |
| Trade and other accounts payables | | | | | | | | | | | | | | | | | | | | | | | | |
| | | | | | | | | | | | | | | | | | | | | | | | | | | | | | | | | | | |
| - | | OTHERS | | OTHERS | | US$ | | | 720,718 | | | | 9,979 | | | | - | | | | - | | | | - | | | | 730,697 | | | | 730,697 | |
| | | | | | | CLP | | | 74,566 | | | | 16,493 | | | | - | | | | - | | | | - | | | | 91,059 | | | | 91,059 | |
| | | | | | | BRL | | | 309,552 | | | | 66 | | | | - | | | | - | | | | - | | | | 309,618 | | | | 309,618 | |
| | | | | | | Other currencies | | | 252,116 | | | | 3,406 | | | | - | | | | - | | | | - | | | | 255,522 | | | | 255,522 | |
| Accounts payable to related parties currents | | | | | | | | | | | | | | | | | | | | | | | | |
| Foreign | | Inversora Aeronáutica Argentina S.A. | | Argentina | | ARS | | | 15 | | | | - | | | | - | | | | - | | | | - | | | | 15 | | | | 15 | |
| 78.591.370-1 | | Bethia S.A. y Filiales | | Chile | | CLP | | | 365 | | | | - | | | | - | | | | - | | | | - | | | | 365 | | | | 365 | |
| Foreign | | TAM Aviação Executiva e Taxi Aéreo S.A. | | Brazil | | BRL | | | 2 | | | | - | | | | - | | | | - | | | | - | | | | 2 | | | | 2 | |
| | | | | | | | | | | | | | | | | | | | | | | | | | | | | | | | | | | |
| | | Total | | | | | | | 1,505,698 | | | | 469,567 | | | | 1,042,818 | | | | 805,616 | | | | 1,319,723 | | | | 5,143,422 | | | | 4,203,936 | |
| | | | | | | | | | | | | | | | | | | | | | | | | | | | | | | | | | | |
| | | Total consolidated | | | | | | | 2,058,082 | | | | 1,553,559 | | | | 4,130,735 | | | | 2,408,124 | | | | 3,429,902 | | | | 13,580,402 | | | | 11,521,527 | |
Class of liability for the analysis of liquidity risk ordered by date of maturity as of December 31, 2016
Debtor: LATAM Airlines Group S.A. and Subsidiaries, Tax No. 89.862.200-2, Chile.
| | | | | | | | | | | | More than | | | More than | | | More than | | | | | | | | | | | | | | | | | | | |
| | | | | | | | | Up to | | | 90 days | | | one to | | | three to | | | More than | | | | | | | | | | | | | | | | |
| | | | | Creditor | | | | 90 | | | to one | | | three | | | five | | | five | | | | | | Nominal | | | | | | Effective | | | Nominal | |
| Tax No. | | Creditor | | country | | Currency | | days | | | year | | | years | | | years | | | years | | | Total | | | value | | | Amortization | | | rate | | | rate | |
| | | | | | | | | ThUS$ | | | ThUS$ | | | ThUS$ | | | ThUS$ | | | ThUS$ | | | ThUS$ | | | ThUS$ | | | | | | % | | | % | |
| | | | | | | | | | | | | | | | | | | | | | | | | | | | | | | | | | | | | |
| Trade and other accounts payables | | | | | | | | | | | | | | | | | | | | | | | | | | | | | | | | | | | | | | | | | | |
| | | | | | | | | | | | | | | | | | | | | | | | | | | | | | | | | | | | | | | | | | | | | | | |
| - | | OTHERS | | OTHERS | | ThUS$ | | | 549,897 | | | | 21,215 | | | | - | | | | - | | | | - | | | | 571,112 | | | | 571,112 | | | | - | | | | - | | | | - | |
| | | | | | | CLP | | | 48,842 | | | | (30 | ) | | | - | | | | - | | | | - | | | | 48,812 | | | | 48,812 | | | | - | | | | - | | | | - | |
| | | | | | | BRL | | | 346,037 | | | | 27 | | | | - | | | | - | | | | - | | | | 346,064 | | | | 346,064 | | | | - | | | | - | | | | - | |
| | | | | | | Others currencies | | | 140,471 | | | | 11,467 | | | | - | | | | - | | | | - | | | | 151,938 | | | | 151,938 | | | | - | | | | - | | | | - | |
| | | | | | | | | | | | | | | | | | | | | | | | | | | | | | | | | | | | | | | | | | | | | | | |
| Accounts payable to related parties currents | | | | | | | | | | | | | | | | | | | | | | | | | | | | | | | | | | | | | | | | |
| 0-E | | Consultoría Administrativa Profesional S.A. de C.V. | | Mexico | | MXN | | | 170 | | | | - | | | | - | | | | - | | | | - | | | | 170 | | | | 170 | | | | - | | | | - | | | | - | |
| 78.997.060-2 | | Viajes Falabella Ltda. | | Chile | | CLP | | | 46 | | | | - | | | | - | | | | - | | | | - | | | | 46 | | | | 46 | | | | - | | | | - | | | | - | |
| 0-E | | TAM Aviação Executiva e Taxi Aéreo S.A. | | Brazil | | BRL | | | 28 | | | | - | | | | - | | | | - | | | | - | | | | 28 | | | | 28 | | | | - | | | | - | | | | - | |
| 65.216.000-K | | Comunidad Mujer | | Chile | | CLP | | | 13 | | | | - | | | | - | | | | - | | | | - | | | | 13 | | | | 13 | | | | | | | | | | | | | |
| 78.591.370-1 | | Bethia S.A. y Filiales | | Chile | | CLP | | | 6 | | | | - | | | | - | | | | - | | | | - | | | | 6 | | | | 6 | | | | | | | | | | | | | |
| 79.773.440-3 | | Transportes San Felipe S.A. | | Chile | | CLP | | | 4 | | | | - | | | | - | | | | - | | | | - | | | | 4 | | | | 4 | | | | - | | | | - | | | | - | |
| 0-E | | Inversora Aeronáutica Argentina | | Argentina | | ThUS$ | | | 2 | | | | - | | | | - | | | | - | | | | - | | | | 2 | | | | 2 | | | | - | | | | - | | | | - | |
| | | Total | | | | | | | 1,085,516 | | | | 32,679 | | | | - | | | | - | | | | - | | | | 1,118,195 | | | | 1,118,195 | | | | | | | | | | | | | |
| | | | | | | | | | | | | | | | | | | | | | | | | | | | | | | | | | | | | | | | | | | | | | | |
| | | Total consolidated | | | | | | | 1,620,952 | | | | 1,592,486 | | | | 2,697,924 | | | | 2,794,588 | | | | 2,344,935 | | | | 11,050,885 | | | | 9,828,448 | | | | | | | | | | | | | |
The Company has fuel, interest rate and exchange rate hedging strategies involving derivatives contracts with different financial institutions. The Company has margin facilities with each financial institution in order to regulate the mutual exposure produced by changes in the market valuation of the derivatives.
At the end of 2016, the Company provided US$ 30.2 million in derivative margin guarantees, for cash and stand-by letters of credit. At December 31, 2017,2018, the Company had provideddelivered US$ 16.45.0 million in guarantees for Cashderivative margins, corresponding to cash and standby letters of credit. As of December 31, 2019, US$ 23.7 million were delivered in guarantees corresponding to cash equivalent and stand-bystandby letters of credit. The decreaseincrease was due at:to: i) maturitythe expiration of hedge contracts, ii) acquireacquisition of new fuel purchasehedge contracts, and iii) changes in fuel prices, changes in exchange raterates and interest rates.
| 3.2. | Capital risk management |
The Company���sCompany’s objectives, with respect to the management of capital, are (i) to comply with the restrictions of minimum equity and (ii) to maintain an optimal capital structure.
The Company monitors its contractual obligations and the regulatory limitations in the different countries where the entities of the group are domiciled to assure they meet the limit of minimum net equity, where the most restrictive limitation is to maintain a positive net equity.
Additionally, the Company periodically monitors the short and long term cash flow projections to assure the Company has adequate sources of funding to generate the cash requirement to face its investment and funding future commitments.
The Company international credit rating is the consequence of the Company capacity to face its long terms financing commitments. As of December 31, 20172019 the Company has an international long term credit rating of BB- with stable outlook by Standard & Poor’s, a B+BB- rating with stable outlook by Fitch Ratings and a B1Ba3 rating with stable outlook by Moody’s.
| 3.3. | Estimates of fair value. |
At Decemberdecember 31, 2017,2019, the Company maintained financial instruments that should be recorded at fair value. These are grouped into two categories:
This category includes the following instruments:
| - | Interest rate derivative contracts, |
| - | Fuel derivative contracts, |
| - | Currency derivative contracts. |
This category includes the following instruments:
| - | Investments in short-term Mutual Funds (cash equivalent), |
| - | Private investment funds. |
The Company has classified the fair value measurement using a hierarchy that reflects the level of information used in the assessment. This hierarchy consists of 3 levels (I) fair value based on quoted prices in active markets for identical assets or liabilities, (II) fair value calculated through valuation methods based on inputs other than quoted prices included within level 1 that are observable for the asset or liability, either directly (that is, as prices) or indirectly (that is, derived from prices) and (III) fair value based on inputs for the asset or liability that are not based on observable market data.
The fair value of financial instruments traded in active markets, such as investments acquired for trading, is based on quoted market prices at the close of the period using the current price of the buyer. The fair value of financial assets not traded in active markets (derivative contracts) is determined using valuation techniques that maximize use of available market information.
Valuation techniques generally used by the Company are quoted market prices of similar instruments and / or estimating the present value of future cash flows using forward price curves of the market at period end.
The following table shows the classification of financial instruments at fair value, depending on the level of information used in the assessment:
| | | As of December 31, 2017 | | | As of December 31, 2016 | |
| | | | | | Fair value measurements using values | | | | | | Fair value measurements using values | |
| | | | | | considered as | | | | | | considered as | |
| | | Fair value | | | Level I | | | Level II | | | Level III | | | Fair value | | | Level I | | | Level II | | | Level III | |
| | | ThUS$ | | | ThUS$ | | | ThUS$ | | | ThUS$ | | | ThUS$ | | | ThUS$ | | | ThUS$ | | | ThUS$ | |
| Assets | | | | | | | | | | | | | | | | | | | | | | | | | | | | | | | | |
| | | | | | | | | | | | | | | | | | | | | | | | | | | | | | | | | |
| Cash and cash equivalents | | | 29,658 | | | | 29,658 | | | | - | | | | - | | | | 15,522 | | | | 15,522 | | | | - | | | | - | |
| Short-term mutual funds | | | 29,658 | | | | 29,658 | | | | - | | | | - | | | | 15,522 | | | | 15,522 | | | | - | | | | - | |
| | | | | | | | | | | | | | | | | | | | | | | | | | | | | | | | | |
| Other financial assets, current | | | 536,001 | | | | 473,653 | | | | 62,348 | | | | - | | | | 548,402 | | | | 536,991 | | | | 11,411 | | | | - | |
| Fair value derived interest rate | | | 3,113 | | | | - | | | | 3,113 | | | | - | | | | - | | | | - | | | | - | | | | - | |
| Fair value of fuel derivatives | | | 10,711 | | | | - | | | | 10,711 | | | | - | | | | 10,088 | | | | - | | | | 10,088 | | | | - | |
| Fair value derived from foreign currency | | | 48,322 | | | | - | | | | 48,322 | | | | - | | | | 1,259 | | | | - | | | | 1,259 | | | | - | |
| Interest accrued since the last payment date of Cross Currency Swap | | | 202 | | | | - | | | | 202 | | | | - | | | | 64 | | | | - | | | | 64 | | | | - | |
| Private investment funds | | | 472,232 | | | | 472,232 | | | | - | | | | - | | | | 536,991 | | | | 536,991 | | | | - | | | | - | |
| Domestic and foreign bonds | | | 1,421 | | | | 1,421 | | | | - | | | | - | | | | - | | | | - | | | | - | | | | - | |
| | | | | | | | | | | | | | | | | | | | | | | | | | | | | | | | | |
| Other financial assets, not current | | | 519 | | | | - | | | | 519 | | | | - | | | | - | | | | - | | | | - | | | | - | |
| Fair value derived from foreign currency | | | 519 | | | | - | | | | 519 | | | | - | | | | - | | | | - | | | | - | | | | - | |
| | | | | | | | | | | | | | | | | | | | | | | | | | | | | | | | | |
| Liabilities | | | | | | | | | | | | | | | | | | | | | | | | | | | | | | | | |
| | | | | | | | | | | | | | | | | | | | | | | | | | | | | | | | | |
| Other financial liabilities, current | | | 12,200 | | | | - | | | | 12,200 | | | | - | | | | 24,881 | | | | - | | | | 24,881 | | | | - | |
| Fair value of interest rate derivatives | | | 8,919 | | | | - | | | | 8,919 | | | | - | | | | 9,579 | | | | - | | | | 9,579 | | | | - | |
| Fair value of foreign currency derivatives | | | 2,092 | | | | - | | | | 2,092 | | | | - | | | | 13,155 | | | | - | | | | 13,155 | | | | - | |
| Interest accrued since the last payment date of Currency Swap | | | 1,189 | | | | - | | | | 1,189 | | | | - | | | | 2,147 | | | | - | | | | 2,147 | | | | - | |
| | | | | | | | | | | | | | | | | | | | | | | | | | | | | | | | | |
| Other financial liabilities, non current | | | 2,617 | | | | - | | | | 2,617 | | | | - | | | | 6,679 | | | | - | | | | 6,679 | | | | - | |
| Fair value of interest rate derivatives | | | 2,617 | | | | - | | | | 2,617 | | | | - | | | | 6,679 | | | | - | | | | 6,679 | | | | - | |
| | | As of December 31, 2019 | | | As of December 31, 2018 | |
| | | | | | Fair value measurements using values considered as | | | | | | Fair value measurements using values considered as | |
| | | Fair value | | | Level I | | | Level II | | | Level III | | | Fair value | | | Level I | | | Level II | | | Level III | |
| | | ThUS$ | | | ThUS$ | | | ThUS$ | | | ThUS$ | | | ThUS$ | | | ThUS$ | | | ThUS$ | | | ThUS$ | |
| Assets | | | | | | | | | | | | | | | | | | | | | | | | |
| Cash and cash equivalents | | | 222,094 | | | | 222,094 | | | | - | | | | - | | | | 43,653 | | | | 43,653 | | | | - | | | | - | |
| Short-term mutual funds | | | 222,094 | | | | 222,094 | | | | - | | | | - | | | | 43,653 | | | | 43,653 | | | | - | | | | - | |
| | | | | | | | | | | | | | | | | | | | | | | | | | | | | | | | | |
| Other financial assets, current | | | 471,797 | | | | 386,688 | | | | 85,109 | | | | - | | | | 366,573 | | | | 343,218 | | | | 23,355 | | | | - | |
| Fair value interest rate derivatives | | | 27,044 | | | | - | | | | 27,044 | | | | - | | | | 19,460 | | | | - | | | | 19,460 | | | | - | |
| Fair value of fuel derivatives | | | 48,542 | | | | - | | | | 48,542 | | | | - | | | | - | | | | - | | | | - | | | | - | |
| Fair value of foreign currency derivative | | | 586 | | | | - | | | | 586 | | | | - | | | | 3,895 | | | | - | | | | 3,895 | | | | - | |
| Accrued interest since the last payment date Swap of currencies | | | 3 | | | | - | | | | 3 | | | | - | | | | - | | | | - | | | | - | | | | - | |
| Derivative not recognized as a hedge | | | - | | | | - | | | | - | | | | - | | | | 19,396 | | | | 19,396 | | | | - | | | | - | |
| Private investment funds | | | 386,669 | | | | 386,669 | | | | - | | | | - | | | | 322,428 | | | | 322,428 | | | | - | | | | - | |
| Certificate of Deposit (CBD) | | | 8,934 | | | | - | | | | 8,934 | | | | - | | | | - | | | | - | | | | - | | | | - | |
| Domestic and foreign bonds | | | 19 | | | | 19 | | | | - | | | | - | | | | 1,394 | | | | 1,394 | | | | - | | | | - | |
| | | | | | | | | | | | | | | | | | | | | | | | | | | | | | | | | |
| Liabilities | | | | | | | | | | | | | | | | | | | | | | | | | | | | | | | | |
| | | | | | | | | | | | | | | | | | | | | | | | | | | | | | | | | |
| Other financial liabilities, current | | | 50,372 | | | | - | | | | 50,372 | | | | - | | | | 33,633 | | | | 7,712 | | | | 25,921 | | | | - | |
| Fair value of interest rate derivatives | | | 302 | | | | - | | | | 302 | | | | - | | | | 335 | | | | - | | | | 335 | | | | - | |
| Fair value of fuel derivatives | | | - | | | | - | | | | - | | | | - | | | | 15,678 | | | | - | | | | 15,678 | | | | - | |
| Fair value of foreign currency derivatives | | | 48,347 | | | | - | | | | 48,347 | | | | - | | | | 7,587 | | | | - | | | | 7,587 | | | | - | |
| Interest accrued since the last payment date of Currency Swap | | | 1,723 | | | | - | | | | 1,723 | | | | - | | | | 2,321 | | | | - | | | | 2,321 | | | | - | |
| | | | | | | | | | | | | | | | | | | | | | | | | | | | | | | | | |
| Other financial liabilities, non current | | | - | | | | - | | | | - | | | | - | | | | 7,712 | | | | 7,712 | | | | - | | | | - | |
| Fair value of interest rate derivatives | | | - | | | | - | | | | - | | | | - | | | | 340 | | | | - | | �� | | 340 | | | | - | |
| Interest accrued since the last date of Swap interest rates | | | - | | | | - | | | | - | | | | - | | | | 340 | | | | - | | | | 340 | | | | - | |
Additionally, at DecemberDecember 31, 2017,2019, the Company has financial instruments which are not recorded at fair value. In order to meet the disclosure requirements of fair values, the Company has valued these instruments as shown in the table below:
| | | As of December 31, 2017 | | As of December 31, 2016 | | |
| | | Book | | Fair | | Book | | Fair | | | As of December 31, 2019 | | As of December 31, 2018 | |
| | | value | | value | | value | | value | | | Book value | | Fair value | | Book value | | Fair value | |
| | | ThUS$ | | ThUS$ | | ThUS$ | | ThUS$ | | | ThUS$ | | ThUS$ | | ThUS$ | | ThUS$ | |
| | | | | | | | | | | | | | | | Restated | | Restated | |
| Cash and cash equivalents | | | 1,112,346 | | | | 1,112,346 | | | | 933,805 | | | | 933,805 | | | | 850,486 | | | | 850,486 | | | | 1,037,989 | | | | 1,037,989 | |
| Cash on hand | | | 8,562 | | | | 8,562 | | | | 8,630 | | | | 8,630 | | | | 4,982 | | | | 4,982 | | | | 8,974 | | | | 8,974 | |
| Bank balance | | | 330,430 | | | | 330,430 | | | | 255,746 | | | | 255,746 | | | | 329,633 | | | | 329,633 | | | | 331,218 | | | | 331,218 | |
| Overnight | | | 239,292 | | | | 239,292 | | | | 295,060 | | | | 295,060 | | | | 350,080 | | | | 350,080 | | | | 282,164 | | | | 282,164 | |
| Time deposits | | | 534,062 | | | | 534,062 | | | | 374,369 | | | | 374,369 | | | | 165,791 | | | | 165,791 | | | | 415,633 | | | | 415,633 | |
| Other financial assets, current | | | 23,918 | | | | 23,918 | | | | 164,426 | | | | 164,426 | | | | - | | | | - | | | | 17,411 | | | | 17,411 | |
| Other financial assets | | | 23,918 | | | | 23,918 | | | | 164,426 | | | | 164,426 | | | | - | | | | - | | | | 17,411 | | | | 17,411 | |
| Trade debtors, other accounts receivable and Current accounts receivable | | | 1,214,050 | | | | 1,214,050 | | | | 1,107,889 | | | | 1,107,889 | | | | 1,244,348 | | | | 1,244,348 | | | | 1,162,582 | | | | 1,162,582 | |
| Accounts receivable from entities related, current | | | 2,582 | | | | 2,582 | | | | 554 | | | | 554 | | | | 19,645 | | | | 19,645 | | | | 2,931 | | | | 2,931 | |
| Other financial assets, not current | | | 87,571 | | | | 87,571 | | | | 102,125 | | | | 102,125 | | | | 46,907 | | | | 46,907 | | | | 58,700 | | | | 58,700 | |
| Accounts receivable, non-current | | | 6,891 | | | | 6,891 | | | | 8,254 | | | | 8,254 | | | | 4,725 | | | | 4,725 | | | | 5,381 | | | | 5,381 | |
| | | | | | | | | | | | | | | | | | | | | | | | | | | | | | | | | |
| Other current financial liabilities | | | 1,288,749 | | | | 1,499,495 | | | | 1,814,647 | | | | 2,022,290 | | | | 1,835,288 | | | | 2,019,068 | | | | 1,397,156 | | | | 1,942,332 | |
| Accounts payable for trade and other accounts payable, current | | | 1,695,202 | | | | 1,695,202 | | | | 1,593,068 | | | | 1,593,068 | | | | 2,220,500 | | | | 2,220,500 | | | | 1,674,303 | | | | 1,674,303 | |
| Accounts payable to entities related, current | | | 760 | | | | 760 | | | | 269 | | | | 269 | | | | 56 | | | | 56 | | | | 382 | | | | 382 | |
| Other financial liabilities, not current | | | 6,602,891 | | | | 6,738,872 | | | | 6,790,273 | | | | 6,970,375 | | | | 8,530,418 | | | | 8,846,418 | | | | 5,864,570 | | | | 8,387,939 | |
| Accounts payable, not current | | | 498,832 | | | | 498,832 | | | | 359,391 | | | | 359,391 | | | | 619,110 | | | | 619,110 | | | | 483,656 | | | | 483,656 | |
The book values of accounts receivable and payable are assumed to approximate their fair values, due to their short-term nature. In the case of cash on hand, bank balances, overnight, time deposits and accounts payable, non-current, fair value approximates their carrying values.
The fair value of other financial liabilities is estimated by discounting the future contractual cash flows at the current market interest rate for similar financial instruments (Level II). In the case of Other financial assets, the valuation was performed according to market prices at period end. The book value of Other financial liabilities, current or non-current, do not include lease liabilities.
NOTE 4 - ACCOUNTING ESTIMATES AND JUDGMENTS
The Company has used estimates to value and record certainsome of the assets, liabilities, revenue, expenditure,income, expenses and commitments. Basically, these estimates relaterefer to:
(a) Evaluation of possible losses throughdue to impairment of goodwill and intangible assets with an indefinite useful life.life
As of Decemberdecember 31, 2017, the2019, goodwill amountsamount to ThUS $ 2,672,550 (ThUS $ 2,710,382ThUS$ 2,209,576 (ThUS$ 2,294,072 as of Decemberdecember 31, 2016)2018), while the intangible assets comprise the Airport Slots for ThUS $ 964,513 (ThUS $ 978,849ThUS$ 845,959 (ThUS$ 828,969 as of Decemberdecember 31, 2016)2018) and Loyalty Program for ThUS $ 321,440 (ThUS $ 326,262ThUS$ 263,806 (ThUS$ 274,420 as of Decemberdecember 31, 2016)2018).
Management conducts an impairment test annually or more frequently if events or changes in circumstances indicate potential impairment. An impairment loss is recognized for the amount by which the carrying amount of the cash generating unit (CGU) exceeds its recoverable amount.
The Company checks at least once a year whether goodwill and intangible assets with an indefinite useful life have suffered an impairment loss. For this evaluation, the Company hashad identified two cash generating units (CGU), "Air transport"CGUs, “Air transport” and "Multiplus“Multiplus coalition and loyalty program". The book valueprogram”, until December 31, 2018. After the merger of Multiplus (see Note 1), administrator of the surplus value assigned to each CGUMultiplus coalition and loyalty program, the Company has determined air transport as a single CGU. The classification of December 31, 2017 amounted to ThUS $ 2,146,692 and ThUS $ 525,858 (ThUS $ 2,176,634 and ThUS $ 533,748 as of December 31, 2016), which include the following Intangibleintangible assets of indefinite useful life:life in the CGUs, before and after the merger of Multiplus S.A. are as follow:
| | | Air Transport
CGU | | Coalition and loyalty
Program Multiplus CGU | | | Air Transport
CGU | | Coalition and loyalty
Program Multiplus CGU | |
| | | As of | | As of | | As of | | As of | | | As of | | As of | | As of | | As of | |
| | | December 31, | | December 31, | | December 31, | | December 31, | | | December 31, | | December 31, | | December 31, | | December 31, | |
| | | 2017 | | 2016 | | 2017 | | 2016 | | | 2019 | | 2018 | | 2019 | | 2018 | |
| | | ThUS$ | | ThUS$ | | ThUS$ | | ThUS$ | | | ThUS$ | | ThUS$ | | ThUS$ | | ThUS$ | |
| | | | | | | | | | | | | | | | | | | |
| Goodwill | | | | 2,209,576 | | | | 1,845,136 | | | | - | | | | 448,936 | |
| Airport Slots | | | 964,513 | | | | 978,849 | | | | - | | | | - | | | | 845,959 | | | | 828,969 | | | | - | | | | - | |
| Loyalty program | | | - | | | | - | | | | 321,440 | | | | 326,262 | | | | 263,806 | | | | - | | | | - | | | | 274,420 | |
The recoverable value of these cash-generating units (CGUs) has been determined based onManagement’s value-in-use calculations of their value in use. The principalincluded significant judgments and assumptions used by the management include:relating to revenue growth rate,rates, exchange rate, discount rate, inflation rates, fuel prices, and other economic assumptions.price. The estimation of these assumptions requires significant judgment by the management, as these variables feature inherent uncertainty; however, the assumptions used are consistent with Company’s internal planning. Therefore, management evaluates and updates the estimates on an annual basis, in light of conditions that affect these variables. The mainlymain assumptions used as well as the corresponding sensitivity analyses are showed in Note 16.
(b) Useful life, residual value, and impairment of property, plant, and equipment
| (b) | Useful life, residual value, and impairment of property, plant, and equipment |
The depreciation of assets is calculated based on the linear model, except for certain technical components depreciated on cycles and hours flown. These useful lives are reviewed on an annual basis according with the Company’s future economic benefits associated with them.
Changes in circumstances such as: technological advances, business model, planned use of assets or capital strategy may render the useful life different to the lifespan estimated. When it is determined that the useful life of property, plant, and equipment must be reduced, as may occur in line with changes in planned usage of assets, the difference between the net book value and estimated recoverable value is depreciated, in accordance with the revised remaining useful life.
Residual values are estimated in accordance with the market value that these assets will have at the end of their useful life. The assets’ residual values and useful lives are reviewed, and adjusted if appropriate, once a year. An asset’s carrying amount is written down immediately to its recoverable amount if the asset’s carrying amount is greater than its estimated recoverable amount (note(Note 2.8).
| F-50(c) | Recoverability of deferred tax assets |
(c) Recoverability ofManagement records deferred tax assets
Deferred taxes are calculated according to the liability method, on the temporary differences that arisearising between the tax bases of assets and liabilities and their carrying amounts.amounts reported in the consolidated financial statements. Deferred tax assets on tax losses are recognized only to the extent that it is probable that the future tax benefitstaxable profit will be available withagainst which to offset the temporary differences. The Company makes financial and fiscal projections to evaluatedifferences can be utilized.
Management applied significant judgment in assessing the realization in timerecoverability of this deferred tax asset. Additionally, it ensures that these projectionsassets. In determining the amount of deferred tax assets to be recognized, management considered historical profitability, projected future taxable profit (including assumptions related the revenue growth rates, exchange rates, discount rate and fuel price which are consistentin line with those used to measure other long-lived assets. in the impairment analysis of the group’s cash generating unit) and the expected timing of the reversals of existing temporary differences.
As of December 31, 2017,2019, the Company has recognized deferred tax assets of ThUS $ 364,021 (ThUS $ 384,580ThUS$ 235,583 (ThUS$ 273,529 as of December 31, 2016)2018) and has ceased to recognize deferred tax assets on tax losses of ThUS $ 81,155 (ThUS $ 115,801 as ofThUS$ 110,933 (ThUS$ 137,761 December 31, 2016)2018) (Note 18).
(d) Air tickets sold that are not actually used.
| (d) | Air tickets sold that will not be finally used. |
The Company register advance salesrecords the anticipated sale of air tickets as deferred revenue. Revenueincome. Ordinary income from ticket salesthe sale of tickets is recognized in the income statement when the passenger transport service is provided or when the tickets expires unused, reducing the corresponding deferred revenue.expired for non-use. The Company evaluates monthly the probability thatof expiration of air tickets, expiry unused,with return clauses, based on the history of useduse of air tickets. ChangesA change in the exchangethis probability would havecould generate an impact ouron revenue in the year in which the change occurs and in future years. As of December 31, 2017,2019 the deferred revenueincome associated with the air tickets sold amountedamounts to ThUS$ 1,550,4471,511,991. - (ThUS$ 1,535,2291,299,304 as of December 31, 2016)2018). AnA hypothetical change of 1%one percentage point in passenger behavior regardingwith respect to the ticket usage, that is, if during the next six months after sells probability of used were 89% rather than 90%, as we consider, ituse would lead to a changeresult in the expiry period from six to seven months, which, would have an impact of up to ThUS$ 20,000 in the results of 2017.6,000 per month.
(e) Valuation of loyalty points and kilometers granted to loyalty program members, pending usage.
| (e) | Valuation of miles and points awarded to holders of loyalty programs, pending use. |
As of December 31, 2017 and 2016 the Company operated the following loyalty programs: LATAM Pass, LATAM Fidelidade and Multiplus, with the objective of enhancing customer loyalty by offering points or kilometers (see Note 22).
The members of these programs accumulate kilometers when they fly with LATAM Airlines Group or any other airline member of the onewordl® program, as well as use the services of the associated entities.
When kilometers and points are redeemed for products and services other than the services provided by the Company, revenue is recognized immediately; when they are redeemed for air tickets on airlines from LATAM Airlines Group S.A. and subsidiaries, revenue is deferred until the transport service is provided or the corresponding tickets expired.
Deferred revenue from loyalty programs at the closing date corresponds to the valuation of points and kilometers granted to loyalty program members, pending of use, weighted by the probability to be redeemed.
According to IFRIC-13, kilometers and points value that the Company estimate are not likely to be redeemed (“breakage”), they recognize the associated value proportionally during the period in which the remaining kilometers or points are expected to be redeemed. The Company uses statistical models to estimate the breakage, based on historical redemption patterns and projections prepared by external experts.
As of December 31, 2017,2019, the deferred revenueincome associated with the LATAM Pass loyalty program amounts to ThUS $ 853,505ThUS$ 1,332,173 (ThUS$ 896,1901,324,635 as of December 31, 2016)2018). A hypothetical change of one percentage point in the probability of exchange probabilityof miles would result in an impact of ThUS$ 31,565 in the results of 2019 (ThUS$ 27,726 in 2018). Deferred income associated with the LATAM Pass Brasil loyalty program (See Note 22) amounts to ThUS$ 354,847 as of December 31, 2017 of ThUS$ 25,0002019 (ThUS$ 30,632293,831 as of December 31, 2016). While the deferred revenues associated with the loyalty programs LATAM Fidelidade and Multiplus amount to ThUS $ 364,866 (ThUS$ 392,107 as of December 31, 2016)2018). A hypothetical change of two percentage points in the numberprobability of points pending to be exchanged would result in an impact ThUS$ 16,700 in 2017 (ThUS$ 14,639 in 2016).
The valueexchange of kilometers and other components are determined by the Company based on a fair value analysis. As of December 31, 2017 a hypothetical change of one percentage point in the fair value of the unused kilometerspoints would result in an impact of ThUS$ 8,00012,501 in 2017the results of 2019 (ThUS$ 8,40013,140 in 2016)2018).
(f) Provisions needs,Management used statistical models to estimate the miles and point awarded that will not be redeemed, by the programs members (breakage) which involved significant judgments and assumptions relating the historical redemption and expiration activity and forecasted redemption and expiration patterns.
For LATAM Pass Brazil, the expiration occurs after a fixed period from the time of the accumulation. Model is built by the management considering historical expiration rates, to costumers exchange behaviors and relevant segmentations.
For LATAM Pass there are rules that allow members to renew their valuation when requiredmiles, so the management in conjunction with an external specialist develop a predictive model of non-use miles, which allows to generate non-use rates on the basis of historical information, based on behavior of the accumulation, use and expiration of the miles.
| (f) | Provisions needs, and their valuation when required |
Known contingencies are recognized when: theThe Company has a present legal or constructive obligation as a result of past events; it is probable that an outflow of resources will be required to settle the obligation and the amount has been reliably estimated. The Company applies professional judgment, experience, and knowledge to use available information to determine these values, in light of the specific characteristics of known risks. This process facilitates the early assessment and valuation of potential risks in individual cases or in the development of contingent eventualities.
(g) Investment
The discount rate used to calculate the lease debt corresponds, for each aircraft, to the implicit interest rate induced by the contractual elements and residual market values. The implied rate of the contract is the discount rate that gives the aggregated present value of the minimum lease payments and the unguaranteed residual value. This present value should be equal to the sum of the fair value of the leased asset and any initial direct costs of the lessor.
For those leases other than aircraft, we use our estimated incremental borrowing rate, which is derived from information available at the lease commencement date, in subsidiary (TAM)determining the present value of lease payments. We consider to our recent debt issuances as well as publicly available data for instruments with similar characteristics when calculating our incremental borrowing rates.
A 100 basis point decrease in our estimate of the rate at January 1, 2019 (the date the adoption of the standard) would increase our lease liability by approximately US$ 105 million.
In determining the lease term, there are considers all facts and circumstances that create an economic incentive to exercise an extension option, or not exercise a termination option. Extension options (or periods after termination options) are only included in the lease term if the lease is reasonably certain to be extended (or not terminated). The assessment is reviewed if a significant event or a significant change in circumstances occurs which affects this assessment and that is within the control of the lessee.
| (h) | Investment in subsidiary (TAM) |
The management has applied its judgment in determining that LATAM Airlines Group S.A. controls TAM S.A. and Subsidiaries, for accounting purposes, and has therefore consolidated the financial statements.
The grounds for this decision are that LATAM issued ordinary shares in exchange for the majority of circulating ordinary and preferential shares in TAM, except for those TAM shareholders who did not accept the exchange, which were subject to a squeeze out, entitling LATAM to substantially all economic benefits generated by the LATAM Group, and thus exposing it to substantially all risks relating to the operations of TAM. This exchange aligns the economic interests of LATAM and all of its shareholders, including the controlling shareholders of TAM, thus insuringensuring that the shareholders and directors of TAM shall have no incentive to exercise their rights in a manner that would be beneficial to TAM but detrimental to LATAM. Furthermore, all significant actions necessary of the operation of the airlines require votes in favor by the controlling shareholders of both LATAM and TAM.
Since the integration of LAN and TAM operations, the most critical airline operations in Brazil have been managed by the CEO of TAM while global activities have been managed by the CEO of LATAM, who is in charge of the operation of the LATAM Group as a whole and reports to the LATAM Board.
The CEO of LATAM also evaluates the performance of LATAM Group executives and, together with the LATAM Board, determines compensation. Although Brazilian law currently imposes restrictions on the percentages of voting rights that may be held by foreign investors, LATAM believes that the economic basis of these agreements meets the requirements of accounting standards in force, and that the consolidation of the operations of LAN and LATAM is appropriate.
These estimates were made based on the best information available relating to the matters analyzed.
In any case, it is possible that events that may take place in the future could lead to their modification in future reporting periods, which would be made in a prospective manner.
NOTE 5 - SEGMENTAL INFORMATION
TheAs of December 31, 2019, the Company has determinedconsiders that it has twoa single operating segments: the air transportation business and the coalition and loyalty program Multiplus.
Thesegment, that of Air transportTransport. This segment corresponds to the route network for air transport and it is based on the way thatin which the business is run and managed, according to the centralized nature of its operations, the ability to open and close routes, and reallocate resources (aircraft,as well as reassignment (airplanes, crew, staff, etc..personnel, etc.) within the network, which isimplies a functional relationshipinterrelation between all of them, making them inseparable. This segment definition is one of the most common level used byworldwide in the global airline industry.
Until June 2019, the Company presented two operating segments, the one corresponding to Air transport and the Multiplus coalition and loyalty program segment, discussed in Note 1, the Company Multiplus S.A. Administrator of the Coalition and Loyalty Program Multiplus merged into TAM Linhas Aereas S.A., ceasing to be an entity with independent administration. The Multiplus coalition and Loyalty program, which was defined as an operating segment, due to this independent administration, became part of loyalty coalition called Multiplus, unlikethe Air Transport segment together with the LATAM Pass and LATAM Fidelidade, isfidelidades programs.
The company has restated the information corresponding to December 31, 2018 and 2017 for the presentation of a frequent flyer programs which operate as a unilateral systemsingle segment of loyalty that offers a flexible coalition system, interrelated among its members, with 19.4 million of members, along with being a regulated entity with a separately business and not directly related to air transport.information.
| For the year ended |
| | | Air | |
| | | Transportation | |
| | | At December 31, | |
| | | 2019 | | | 2018 | | | 2017 | |
| | | ThUS$ | | | ThUS$ | | | ThUS$ | |
| | | | | | Restated | | | Restated | |
| Income from ordinary activities from external customers (*) | | | 10,070,063 | | | | 9,895,456 | | | | 9,613,907 | |
| Passenger | | | 9,005,629 | | | | 8,708,988 | | | | 8,494,477 | |
| Freight | | | 1,064,434 | | | | 1,186,468 | | | | 1,119,430 | |
| Income from ordinary activities from transactions with other operating segments | | | - | | | | - | | | | - | |
| Other operating income | | | 360,864 | | | | 472,758 | | | | 549,889 | |
| Interest income | | | 26,283 | | | | 53,253 | | | | 78,695 | |
| Interest expense | | | (589,934 | ) | | | (539,137 | ) | | | (579,233 | ) |
| Total net interest expense | | | (563,651 | ) | | | (485,884 | ) | | | (500,538 | ) |
| Depreciation and amortization | | | (1,469,976 | ) | | | (1,372,628 | ) | | | (1,377,135 | ) |
| Material non-cash items other than depreciation and amortization | | | (130,011 | ) | | | (104,123 | ) | | | (105,404 | ) |
| Disposal of fixed assets and inventory losses | | | (60,893 | ) | | | (46,351 | ) | | | (39,238 | ) |
| Doubtful accounts | | | (21,558 | ) | | | (18,837 | ) | | | (18,416 | ) |
| Exchange differences | | | (32,571 | ) | | | (38,070 | ) | | | (48,498 | ) |
| Result of indexation units | | | (14,989 | ) | | | (865 | ) | | | 748 | |
| Income (loss) attributable to owners of the parents | | | 190,430 | | | | 309,811 | | | | 108,896 | |
| Expenses for income tax | | | 53,697 | | | | (73,879 | ) | | | (158,998 | ) |
| Segment profit / (loss) | | | 195,613 | | | | 341,786 | | | | 154,386 | |
| Assets of segment | | | 21,087,806 | | | | 20,078,722 | | | | 21,673,713 | |
| Segment liabilities | | | 17,958,629 | | | | 16,638,121 | | | | 17,717,420 | |
| Amount of non-current asset additions | | | 2,658,541 | | | | 1,090,177 | | | | 412,846 | |
| Property, plant and equipment | | | 2,519,305 | | | | 995,085 | | | | 325,513 | |
| Intangibles other than goodwill | | | 139,236 | | | | 95,092 | | | | 87,333 | |
| Purchase of non-monetary assets of segment | | | 1,416,794 | | | | 756,913 | | | | 499,872 | |
| F-53(*) | The Company does not have any interest income that should be recognized as income from ordinary activities by interest. |
| For the year ended | | | | | | | | | |
| | | Air | |
| | | Transportation | |
| | | At December 31, | |
| | | 2019 | | | 2018 | | | 2017 | |
| | | ThUS$ | | | ThUS$ | | | ThUS$ | |
| | | | | | Restated | | | Restated | |
| | | | | | (2) | | | (2) | |
| Net cash flows from | | | | | | | | | |
| Purchases of property, plant and equipment | | | 1,276,621 | | | | 660,707 | | | | 403,666 | |
| Additions associated with maintenance | | | 453,827 | | | | 375,634 | | | | 217,687 | |
| Other additions | | | 822,794 | | | | 285,073 | | | | 185,979 | |
| Purchases of intangible assets | | | 140,173 | | | | 96,206 | | | | 96,206 | |
| Net cash flows from (used in) operating activities | | | 2,826,667 | | | | 2,073,316 | | | | 2,186,823 | |
| Net cash flow from (used in) investing activities | | | (1,419,207 | ) | | | (358,368 | ) | | | (293,925 | ) |
| Net cash flows from (used in) financing activities | | | (1,343,521 | ) | | | (1,608,597 | ) | | | (1,692,668 | ) |
ForThe information by segments as of December 31, 2018 and 2017, which included the periods endedMultiplus Coalition and Loyalty Program segment has been restated to present its incorporation into the Air Transport segment. This restatement is presented in the following table:
| | | | | Coalition and | | | | | | |
| For the year ended | | | | | | | | | | |
| | | Air | | loyalty program | | | | | | | Air | | Segment | | | | Air | |
| | | transportation | | Multiplus | | Eliminations | | Consolidated | | | Transportation | | Adjustment | | Eliminations | | Transportation | |
| | | At December 31, | | At December 31, | | At December 31, | | At December 31, | | | At December 31, | | At December 31, | | At December 31, | | At December 31, | |
| | | 2017 | | 2016 | | 2015 | | 2017 | | 2016 | | 2015 | | 2017 | | 2016 | | 2015 | | 2017 | | 2016 | | 2015 | | | 2018 | | 2018 | | 2018 | | 2018 | |
| | | ThUS$ | | ThUS$ | | ThUS$ | | ThUS$ | | ThUS$ | | ThUS$ | | ThUS$ | | ThUS$ | | ThUS$ | | ThUS$ | | ThUS$ | | ThUS$ | | | ThUS$ | | ThUS$ | | ThUS$ | | ThUS$ | |
| | | | | | | | | | | | | | | | | | | | | | | | | | | | Previously reported | | | | | | Restated | |
| Income from ordinary activities from external customers (*) | | | 9,159,031 | | | | 8,587,772 | | | | 9,278,041 | | | | 454,876 | | | | 400,568 | | | | 462,004 | | | | - | | | | - | | | | - | | | | 9,613,907 | | | | 8,988,340 | | | | 9,740,045 | | | | 9,887,090 | | | | 60,020 | | | | (51,654 | ) | | | 9,895,456 | |
| | | | | | | | | | | | | | | | | | | | | | | | | | | | | | | | | | | | | | | | | | | | | | | | | | |
| LAN passenger | | | 4,313,287 | | | | 4,104,348 | | | | 4,241,918 | | | | - | | | | - | | | | - | | | | - | | | | - | | | | - | | | | 4,313,287 | | | | 4,104,348 | | | | 4,241,918 | | |
| TAM passenger | | | 3,726,314 | | | | 3,372,799 | | | | 3,706,692 | | | | 454,876 | | | | 400,568 | | | | 462,004 | | | | - | | | | - | | | | - | | | | 4,181,190 | | | | 3,773,367 | | | | 4,168,696 | | |
| Passenger | | | | 8,700,622 | | | | 60,020 | | | | (51,654 | ) | | | 8,708,988 | |
| Freight | | | 1,119,430 | | | | 1,110,625 | | | | 1,329,431 | | | | - | | | | - | | | | - | | | | - | | | | - | | | | - | | | | 1,119,430 | | | | 1,110,625 | | | | 1,329,431 | | | | 1,186,468 | | | | - | | | | - | | | | 1,186,468 | |
| | | | | | | | | | | | | | | | | | | | | | | | | | | | | | | | | | | | | | | | | | | | | | | | | | |
| Income from ordinary activities from transactions with other operating segments | | | 454,876 | | | | 400,568 | | | | 462,004 | | | | 67,554 | | | | 65,969 | | | | 67,826 | | | | (522,430 | ) | | | (466,537 | ) | | | (529,830 | ) | | | - | | | | - | | | | | | |
| | | | | | | | | | | | | | | | | | | | | | | | | | | | | | | | | | | | | | | | | | | | | | | | | | |
| Other operating income | | | 308,937 | | | | 364,551 | | | | 230,823 | | | | 240,952 | | | | 174,197 | | | | 154,958 | | | | - | | | | - | | | | - | | | | 549,889 | | | | 538,748 | | | | 385,781 | | | | 346,315 | | | | 126,443 | | | | - | | | | 472,758 | |
| | | | | | | | | | | | | | | | | | | | | | | | | | | | | | | | | | | | | | | | | | | | | | | | | | |
| Interest income | | | 28,184 | | | | 27,287 | | | | 21,818 | | | | 50,511 | | | | 58,380 | | | | 63,647 | | | | | | | | (10,718 | ) | | | (10,385 | ) | | | 78,695 | | | | 74,949 | | | | 75,080 | | | | 27,181 | | | | 26,072 | | | | - | | | | 53,253 | |
| Interest expense | | | (393,286 | ) | | | (427,054 | ) | | | (423,742 | ) | | | - | | | | - | | | | | | | | - | | | | 10,718 | | | | 10,385 | | | | (393,286 | ) | | | (416,336 | ) | | | (413,357 | ) | | | (539,137 | ) | | | - | | | | - | | | | (539,137 | ) |
| | | | | | | | | | | | | | | | | | | | | | | | | | | | | | | | | | | | | | | | | | | | | | | | | | |
| Total net interest expense | | | (365,102 | ) | | | (399,767 | ) | | | (401,924 | ) | | | 50,511 | | | | 58,380 | | | | 63,647 | | | | - | | | | - | | | | - | | | | (314,591 | ) | | | (341,387 | ) | | | (338,277 | ) | | | (511,956 | ) | | | 26,072 | | | | - | | | | (485,884 | ) |
| | | | | | | | | | | | | | | | | | | | | | | | | | | | | | | | | | | | | | | | | | | | | | | | | | |
| Depreciation and amortization | | | (994,416 | ) | | | (952,285 | ) | | | (923,311 | ) | | | (7,209 | ) | | | (8,043 | ) | | | (11,095 | ) | | | - | | | | - | | | | - | | | | (1,001,625 | ) | | | (960,328 | ) | | | (934,406 | ) | | | (1,365,809 | ) | | | (6,819 | ) | | | - | | | | (1,372,628 | ) |
| | | | | | | | | | | | | | | | | | | | | | | | | | | | | | | | | | | | | | | | | | | | | | | | | | |
| Material non-cash items other than depreciation and amortization | | | (75,479 | ) | | | 10,069 | | | | (507,921 | ) | | | (145 | ) | | | (991 | ) | | | 1,893 | | | | - | | | | - | | | | - | | | | (75,624 | ) | | | 9,078 | | | | (506,028 | ) | | | (104,038 | ) | | | (85 | ) | | | - | | | | (104,123 | ) |
| | | | | | | | | | | | | | | | | | | | | | | | | | | | | | | | | | | | | | | | | | | | | | | | | | |
| Disposal of fixed assets and inventory losses | | | (39,238 | ) | | | (82,734 | ) | | | (20,932 | ) | | | - | | | | - | | | | - | | | | - | | | | - | | | | - | | | | (39,238 | ) | | | (82,734 | ) | | | (20,932 | ) | | | (46,351 | ) | | | - | | | | - | | | | (46,351 | ) |
| Doubtful accounts | | | (18,272 | ) | | | (29,674 | ) | | | (18,292 | ) | | | (144 | ) | | | (476 | ) | | | 611 | | | | - | | | | - | | | | - | | | | (18,416 | ) | | | (30,150 | ) | | | (17,681 | ) | | | (18,741 | ) | | | (96 | ) | | | - | | | | (18,837 | ) |
| Exchange differences | | | (18,717 | ) | | | 122,129 | | | | (469,178 | ) | | | (1 | ) | | | (478 | ) | | | 1,282 | | | | - | | | | - | | | | - | | | | (18,718 | ) | | | 121,651 | | | | (467,896 | ) | | | (38,081 | ) | | | 11 | | | | - | | | | (38,070 | ) |
| Result of indexation units | | | 748 | | | | 348 | | | | 481 | | | | - | | | | (37 | ) | | | - | | | | - | | | | - | | | | - | | | | 748 | | | | 311 | | | | 481 | | | | (865 | ) | | | - | | | | - | | | | (865 | ) |
| | | | | | | | | | | | | | | | | | | | | | | | | | | | | | | | | | | | | | | | | | | | | | | | | | |
| Income (loss) atributable to owners of the parents | | | (3,482 | ) | | | (83,653 | ) | | | (356,039 | ) | | | 158,783 | | | | 152,873 | | | | 136,765 | | | | - | | | | - | | | | - | | | | 155,301 | | | | 69,220 | | | | (219,274 | ) | |
| | | | | | | | | | | | | | | | | | | | | | | | | | | | | | | | | | | | | | | | | | | | | | | | | | |
| Participation of the entity in the income of associates | | | - | | | | - | | | | 37 | | | | - | | | | - | | | | - | | | | - | | | | - | | | | - | | | | - | | | | - | | | | 37 | | |
| Income (loss) attributable to owners of the parents | | | | 200,209 | | | | 109,602 | | | | - | | | | 309,811 | |
| Expenses for income tax | | | (104,376 | ) | | | (92,476 | ) | | | 249,090 | | | | (69,128 | ) | | | (70,728 | ) | | | (70,707 | ) | | | - | | | | - | | | | - | | | | (173,504 | ) | | | (163,204 | ) | | | 178,383 | | | | 121,155 | | | | (47,276 | ) | | | - | | | | 73,879 | |
| Segment profit / (loss) | | | 41,931 | | | | (42,203 | ) | | | (315,497 | ) | | | 158,783 | | | | 152,873 | | | | 136,765 | | | | - | | | | - | | | | - | | | | 200,714 | | | | 110,670 | | | | (178,732 | ) | | | 287,206 | | | | 54,580 | | | | - | | | | 341,786 | |
| Assets of segment | | | 17,430,937 | | | | 17,805,749 | | | | 16,924,200 | | | | 1,373,049 | | | | 1,400,432 | | | | 1,182,111 | | | | (6,014 | ) | | | (7,987 | ) | | | (4,893 | ) | | | 18,797,972 | | | | 19,198,194 | | | | 18,101,418 | | | | 18,943,127 | | | | 1,145,942 | | | | (10,347 | ) | | | 20,078,722 | |
| Segment liabilities | | | 14,007,916 | | | | 14,469,505 | | | | 14,700,072 | | | | 563,849 | | | | 572,065 | | | | 490,076 | | | | (41,029 | ) | | | (28,680 | ) | | | (26,278 | ) | | | 14,530,736 | | | | 15,012,890 | | | | 15,163,870 | | | | 16,212,905 | | | | 449,347 | | | | (24,131 | ) | | | 16,638,121 | |
| | | | | | | | | | | | | | | | | | | | | | | | | | | | | | | | | | | | | | | | | | | | | | | | | | |
| Amount of non-current asset additions | | | 412,846 | | | | 1,481,090 | | | | 1,492,281 | | | | - | | | | - | | | | - | | | | - | | | | - | | | | - | | | | 412,846 | | | | 1,481,090 | | | | 1,492,281 | | | | 1,090,177 | | | | - | | | | - | | | | 1,090,177 | |
| | | | | | | | | | | | | | | | | | | | | | | | | | | | | | | | | | | | | | | | | | | | | | | | | | |
| Property, plant and equipment | | | 325,513 | | | | 1,390,730 | | | | 1,439,057 | | | | - | | | | - | | | | - | | | | - | | | | - | | | | - | | | | 325,513 | | | | 1,390,730 | | | | 1,439,057 | | | | 995,085 | | | | - | | | | - | | | | 995,085 | |
| Intangibles other than goodwill | | | 87,333 | | | | 90,360 | | | | 53,224 | | | | - | | | | - | | | | - | | | | - | | | | - | | | | - | | | | 87,333 | | | | 90,360 | | | | 53,224 | | | | 95,092 | | | | - | | | | - | | | | 95,092 | |
| | | | | | | | | | | | | | | | | | | | | | | | | | | | | | | | | | | | | | | | | | | | | | | | | | |
| Purchase of non-monetary assets of segment | | | 490,983 | | | | 782,957 | | | | 1,622,198 | | | | - | | | | - | | | | - | | | | - | | | | - | | | | - | | | | 490,983 | | | | 782,957 | | | | 1,622,198 | | | | 756,913 | | | | - | | | | - | | | | 756,913 | |
(*) The Company does not have any interest revenueincome that should be recognized as income from ordinary activities by interest.
| For the year ended | | | | | | | | | | | | |
| | | Air | | | Segment | | | | | | Air | |
| | | Transportation | | | Adjustment | | | Eliminations | | | Transportation | |
| | | At December 31, | | | At December 31, | | | At December 31, | | | At December 31, | |
| | | 2017 | | | 2017 | | | 2017 | | | 2017 | |
| | | ThUS$ | | | ThUS$ | | | ThUS$ | | | ThUS$ | |
| | | Previously reported | | | | | | | | | Restated | |
| Income from ordinary activities from external customers (*) | | | 9,159,031 | | | | 454,876 | | | | - | | | | 9,613,907 | |
| Passenger | | | 8,039,601 | | | | 454,876 | | | | - | | | | 8,494,477 | |
| Freight | | | 1,119,430 | | | | - | | | | - | | | | 1,119,430 | |
| Income from ordinary activities from transactions with other operating segments | | | 454,876 | | | | 67,554 | | | | (522,430 | ) | | | - | |
| Other operating income | | | 308,937 | | | | 240,952 | | | | - | | | | 549,889 | |
| Interest income | | | 28,184 | | | | 50,511 | | | | - | | | | 78,695 | |
| Interest expense | | | (579,233 | ) | | | - | | | | - | | | | (579,233 | ) |
| Total net interest expense | | | (551,049 | ) | | | 50,511 | | | | - | | | | (500,538 | ) |
| Depreciation and amortization | | | (1,384,344 | ) | | | 7,209 | | | | - | | | | (1,377,135 | ) |
| Material non-cash items other than depreciation and amortization | | | (105,259 | ) | | | (145 | ) | | | - | | | | (105,404 | ) |
| Disposal of fixed assets and inventory losses | | | (39,238 | ) | | | - | | | | - | | | | (39,238 | ) |
| Doubtful accounts | | | (18,272 | ) | | | (144 | ) | | | - | | | | (18,416 | ) |
| Exchange differences | | | (48,497 | ) | | | (1 | ) | | | - | | | | (48,498 | ) |
| Result of indexation units | | | 748 | | | | - | | | | - | | | | 748 | |
| Income (loss) attributable to owners of the parents (**) | | | (49,887 | ) | | | 158,783 | | | | - | | | | 108,896 | |
| Expenses for income tax | | | (89,870 | ) | | | (69,128 | ) | | | - | | | | (158,998 | ) |
| Segment profit / (loss) | | | (4,397 | ) | | | 158,783 | | | | - | | | | 154,386 | |
| Assets of segment | | | 17,430,937 | | | | 1,373,049 | | | | (6,014 | ) | | | 18,797,972 | |
| Segment liabilities | | | 14,007,916 | | | | 563,849 | | | | (41,029 | ) | | | 14,530,736 | |
| Amount of non-current asset additions | | | 412,846 | | | | - | | | | - | | | | 412,846 | |
| Property, plant and equipment | | | 325,513 | | | | - | | | | - | | | | 325,513 | |
| Intangibles other than goodwill | | | 87,333 | | | | - | | | | - | | | | 87,333 | |
| Purchase of non-monetary assets of segment | | | 490,983 | | | | - | | | | - | | | | 490,983 | |
| (*) | The Company does not have any interest income that should be recognized as income from ordinary activities by interest. |
| (**) | The result of the Company includes a net result of ThUS$ (8,162) resulting from the application of IAS 21 and IAS 29, for the subsidiaries that are in hyperinflationary economies. |
| For the year ended | | | | | | | | | | | | |
| | | Air | | | Segment | | | | | | Air | |
| | | Transportation | | | adjustment | | | Eliminations | | | Transportation | |
| | | At December 31, | | | At December 31, | | | At December 31, | | | At December 31, | |
| | | 2018 | | | 2018 | | | 2018 | | | 2018 | |
| | | ThUS$ | | | ThUS$ | | | ThUS$ | | | ThUS$ | |
| | | Previously reported | | | | | | | | | Restated | |
| Net cash flows from | | | | | | | | | | | | |
| Purchases of property, plant and equipment | | | 660,631 | | | | 76 | | | | - | | | | 660,707 | |
| Additions associated with maintenance | | | 375,634 | | | | - | | | | - | | | | 375,634 | |
| Other additions | | | 284,997 | | | | 76 | | | | - | | | | 285,073 | |
| Purchases of intangible assets (***) | | | 85,628 | | | | 10,578 | | | | - | | | | 96,206 | |
| Net cash flows from (used in) operating activities | | | 1,950,532 | | | | 111,161 | | | | 11,623 | | | | 2,073,316 | |
| Net cash flow from (used in) investing activities | | | (348,346 | ) | | | (10,022 | ) | | | - | | | | (358,368 | ) |
| Net cash flows from (used in) financing activities | | | (1,512,898 | ) | | | (95,699 | ) | | | - | | | | (1,608,597 | ) |
| (***) | The Company does not have cash flows from purchases of intangible assets associated with maintenance. |
| For the year ended | | | | | | | | | | | | |
| | | | | | | | | | | | | |
| | | Air | | | Segment | | | | | | Air | |
| | | Transportation | | | adjustment | | | Eliminations | | | Transportation | |
| | | At December 31, | | | At December 31, | | | At December 31, | | | At December 31, | |
| | | 2017 | | | 2017 | | | 2017 | | | 2017 | |
| | | ThUS$ | | | ThUS$ | | | ThUS$ | | | ThUS$ | |
| | | Previously reported | | | | | | | | | Restated | |
| Net cash flows from | | | | | | | | | | | | |
| Purchases of property, plant and equipment | | | 403,282 | | | | 384 | | | | - | | | | 403,666 | |
| Additions associated with maintenance | | | 218,537 | | | | - | | | | - | | | | 218,537 | |
| Other additions | | | 184,745 | | | | 384 | | | | - | | | | 185,129 | |
| Purchases of intangible assets (***) | | | 79,102 | | | | 8,216 | | | | - | | | | 87,318 | |
| Net cash flows from (used in) operating activities | | | 1,489,797 | | | | 186,367 | | | | (9,424 | ) | | | 1,666,740 | |
| Net cash flow from (used in) investing activities | | | (278,790 | ) | | | (8,632 | ) | | | - | | | | (287,422 | ) |
| Net cash flows from (used in) financing activities | | | (1,010,705 | ) | | | (168,383 | ) | | | - | | | | (1,179,088 | ) |
| (***) | F-54 | The Company does not have cash flows from purchases of intangible assets associated with maintenance. |
For the periods ended
| | | | | | Coalition and | | | | | | | |
| | | Air | | | loyalty program | | | | | | | |
| | | transportation | | | Multiplus | | | Eliminations | | | Consolidated | |
| | | At December 31, | | | At December 31, | | | At December 31, | | | At December 31, | |
| | | 2017 | | | 2016 | | | 2015 | | | 2017 | | | 2016 | | | 2015 | | | 2017 | | | 2016 | | | 2015 | | | 2017 | | | 2016 | | | 2015 | |
| | | ThUS$ | | | ThUS$ | | | ThUS$ | | | ThUS$ | | | ThUS$ | | | ThUS$ | | | ThUS$ | | | ThUS$ | | | ThUS$ | | | ThUS$ | | | ThUS$ | | | ThUS$ | |
| | | | | | | | | | | | | | | | | | | | | | | | | | | | | | | | | | | | | |
| Net cash flows from | | | | | | | | | | | | | | | | | | | | | | | | | | | | | | | | | | | | | | | | | | | | | | | | |
| Purchases of property, plant and equipment | �� | | 403,282 | | | | 693,581 | | | | 691,930 | | | | 384 | | | | 789 | | | | 2,440 | | | | - | | | | - | | | | - | | | | 403,666 | | | | 694,370 | | | | 694,370 | |
| Additions associated with maintenance | | | 218,537 | | | | 197,866 | | | | 230,526 | | | | - | | | | - | | | | - | | | | - | | | | - | | | | - | | | | 218,537 | | | | 197,866 | | | | 230,526 | |
| Other additions | | | 184,745 | | | | 495,715 | | | | 461,404 | | | | 384 | | | | 789 | | | | 2,440 | | | | - | | | | - | | | | - | | | | 185,129 | | | | 496,504 | | | | 463,844 | |
| Purchases of intangible assets | | | 79,102 | | | | 84,377 | | | | 41,399 | | | | 8,216 | | | | 4,210 | | | | 11,050 | | | | - | | | | - | | | | - | | | | 87,318 | | | | 88,587 | | | | 52,449 | |
| | | | | | | | | | | | | | | | | | | | | | | | | | | | | | | | | | | | | | | | | | | | | | | | | |
| Net cash flows from (used in) operating activities | | | 1,489,797 | | | | 827,108 | | | | 1,531,395 | | | | 186,367 | | | | 154,411 | | | | 147,348 | | | | (9,424 | ) | | | (635 | ) | | | (6,642 | ) | | | 1,666,740 | | | | 980,884 | | | | 1,672,101 | |
| Net cash flow from (used in) investing activities | | | (278,790 | ) | | | (426,989 | ) | | | (1,679,272 | ) | | | (8,632 | ) | | | (4,800 | ) | | | (16,423 | ) | | | - | | | | - | | | | - | | | | (287,422 | ) | | | (431,789 | ) | | | (1,695,695 | ) |
| Net cash flows from (used in) financing activities | | | (1,010,705 | ) | | | (246,907 | ) | | | (4,708 | ) | | | (168,383 | ) | | | (149,372 | ) | | | (123,652 | ) | | | - | | | | - | | | | - | | | | (1,179,088 | ) | | | (396,279 | ) | | | (128,360 | ) |
(**) The company does not have the cash flows of intangible asset acquisitions associated with maintenance.
The Company’s revenues by geographic area are as follows:
| | | For the period ended | | |
| | | At December 31, | | |
| | | 2017 | | 2016 | | 2015 | | | For the year ended At December 31, | |
| | | ThUS$ | | ThUS$ | | ThUS$ | | | 2019 | | | 2018 | | | 2017 | |
| | | | | | | | | | ThUS$ | | ThUS$ | | ThUS$ | |
| Peru | | | 626,316 | | | | 627,215 | | | | 681,340 | | | | 801,965 | | | | 705,133 | | | | 626,316 | |
| Argentina | | | 1,113,467 | | | | 1,030,973 | | | | 979,324 | | | | 584,959 | | | | 989,883 | | | | 1,113,467 | |
| U.S.A. | | | 900,413 | | | | 933,130 | | | | 1,025,475 | | | | 1,004,238 | | | | 985,919 | | | | 900,413 | |
| Europe | | | 676,282 | | | | 714,436 | | | | 723,062 | | | | 726,165 | | | | 782,197 | | | | 676,282 | |
| Colombia | | | 359,276 | | | | 343,001 | | | | 353,007 | | | | 380,449 | | | | 372,794 | | | | 359,276 | |
| Brazil | | | 3,436,402 | | | | 2,974,234 | | | | 3,464,297 | | | | 3,949,797 | | | | 3,433,877 | | | | 3,436,402 | |
| Ecuador | | | 190,268 | | | | 198,171 | | | | 238,500 | | | | 203,334 | | | | 203,842 | | | | 190,268 | |
| Chile | | | 1,527,158 | | | | 1,512,570 | | | | 1,575,519 | | | | 1,546,960 | | | | 1,591,313 | | | | 1,527,158 | |
| Asia Pacific and rest of Latin America | | | 784,325 | | | | 654,610 | | | | 699,521 | | | | 872,196 | | | | 830,498 | | | | 784,325 | |
| Income from ordinary activities | | | 9,613,907 | | | | 8,988,340 | | | | 9,740,045 | | | | 10,070,063 | | | | 9,895,456 | | | | 9,613,907 | |
| Other operating income | | | 549,889 | | | | 538,748 | | | | 385,781 | | | | 360,864 | | | | 472,758 | | | | 549,889 | |
The Company allocates revenues by geographic area based on the point of sale of the passenger ticket or cargo. Assets are composed primarily of aircraft and aeronautical equipment, which are used throughout the different countries, so it is not possible to assign a geographic area.
The Company has no customers that individually represent more than 10% of sales.
NOTE 6 - CASH AND CASH EQUIVALENTS
| | | As of | | | As of | |
| | | December 31, | | | December 31, | |
| | | 2017 | | | 2016 | |
| | | ThUS$ | | | ThUS$ | |
| | | | | | | |
| Cash on hand | | | 8,562 | | | | 8,630 | |
| Bank balances | | | 330,430 | | | | 255,746 | |
| Overnight | | | 239,292 | | | | 295,060 | |
| Total Cash | | | 578,284 | | | | 559,436 | |
| | | | | | | | | |
| Cash equivalents | | | | | | | | |
| Time deposits | | | 534,062 | | | | 374,369 | |
| Mutual funds | | | 29,658 | | | | 15,522 | |
| Total cash equivalents | | | 563,720 | | | | 389,891 | |
| Total cash and cash equivalents | | | 1,142,004 | | | | 949,327 | |
| | | As of
December 31,
2019 | | | As of
December 31,
2018 | |
| | | ThUS$ | | | ThUS$ | |
| Cash on hand | | | 4,982 | | | | 8,974 | |
| Bank balances | | | 329,632 | | | | 331,218 | |
| Overnight | | | 350,080 | | | | 282,164 | |
| Total Cash | | | 684,694 | | | | 622,356 | |
| Cash equivalents | | | | | | | | |
| Time deposits | | | 165,791 | | | | 415,633 | |
| Mutual funds | | | 222,094 | | | | 43,653 | |
| Total cash equivalents | | | 387,885 | | | | 459,286 | |
| Total cash and cash equivalents | | | 1,072,579 | | | | 1,081,642 | |
Cash and cash equivalents are denominated in the following currencies:
| | | | As of | | As of | |
| | | As of | | As of | | | December 31, | | December 31, | |
| Currency | | December 31, | | December 31, | | | 2019 | | | 2018 | |
| | | 2017 | | 2016 | | |
| | | ThUS$ | | ThUS$ | | |
| | | | | | | | ThUS$ | | ThUS$ | |
| Argentine peso | | | 12,135 | | | | 7,871 | | | | 16,579 | | | | 17,786 | |
| Brazilian real | | | 106,499 | | | | 97,401 | | | | 197,354 | | | | 131,760 | |
| Chilean peso | | | 81,845 | | | | 30,758 | | | | 50,521 | | | | 415,713 | |
| Colombian peso | | | 7,264 | | | | 4,336 | | | | 48,191 | | | | 10,843 | |
| Euro | | | 11,746 | | | | 1,695 | | | | 21,927 | | | | 20,339 | |
| US Dollar | | | 882,114 | | | | 780,124 | | | | 667,785 | | | | 394,215 | |
| Other currencies | | | 40,401 | | | | 27,142 | | | | 70,222 | | | | 90,986 | |
| Total | | | 1,142,004 | | | | 949,327 | | | | 1,072,579 | | | | 1,081,642 | |
NOTE 7 - FINANCIAL INSTRUMENTS
7.1. Financial instruments by category
| 7.1. | Financial instruments by category |
As of December 31, 20172019
| | | | | | | | | Initial designation | | | | |
| Assets | | Loans | | | | Held | | as fair value | | | | | Measured at amortized cost | | | At fair value with changes in results | | | Hedge derivatives | | | Total | |
| | | and | | Hedge | | for | | through | | | | |
| | | receivables | | derivatives | | trading | | profit and loss | | Total | | |
| | | ThUS$ | | ThUS$ | | ThUS$ | | ThUS$ | | ThUS$ | | |
| | | | | | | | | | | | | | ThUS$ | | ThUS$ | | ThUS$ | | ThUS$ | |
| Cash and cash equivalents | | | 1,112,346 | | | | - | | | | - | | | | 29,658 | | | | 1,142,004 | | | | 850,485 | | | | 222,094 | | | | - | | | | 1,072,579 | |
| Other financial assets, current (*) | | | 23,918 | | | | 62,348 | | | | 1,421 | | | | 472,232 | | | | 559,919 | | | | 36,660 | | | | 386,669 | | | | 76,175 | | | | 499,504 | |
| Trade and others accounts receivable, current | | | 1,214,050 | | | | - | | | | - | | | | - | | | | 1,214,050 | | | | 1,244,348 | | | | - | | | | - | | | | 1,244,348 | |
| Accounts receivable from related entities, current | | | 2,582 | | | | - | | | | - | | | | - | | | | 2,582 | | | | 19,645 | | | | - | | | | - | | | | 19,645 | |
| Other financial assets, non current (*) | | | 87,077 | | | | 519 | | | | 494 | | | | - | | | | 88,090 | | |
| Other financial assets, non current | | | | 46,907 | | | | - | | | | - | | | | 46,907 | |
| Accounts receivable, non current | | | 6,891 | | | | - | | | | - | | | | - | | | | 6,891 | | | | 4,725 | | | | - | | | | - | | | | 4,725 | |
| Total | | | 2,446,864 | | | | 62,867 | | | | 1,915 | | | | 501,890 | | | | 3,013,536 | | | | 2,202,770 | | | | 608,763 | | | | 76,175 | | | | 2,887,708 | |
| | | | Measured at amortized | | Hedge | | | |
| Liabilities | | Other | | Held | | | | | cost | | | derivatives | | | Total | |
| | | financial | | Hedge | | | | | ThUS$ | | ThUS$ | | ThUS$ | |
| | | liabilities | | derivatives | | Total | | |
| | | ThUS$ | | ThUS$ | | ThUS$ | | |
| | | | | | | | | |
| Other liabilities, current | | | 1,288,749 | | | | 12,200 | | | | 1,300,949 | | |
| Other financial liabilities, current | | | | 1,835,288 | | | | 50,372 | | | | 1,885,660 | |
| Trade and others accounts payable, current | | | 1,695,202 | | | | - | | | | 1,695,202 | | | | 2,222,874 | | | | - | | | | 2,222,874 | |
| Accounts payable to related entities, current | | | 760 | | | | - | | | | 760 | | | | 56 | | | | - | | | | 56 | |
| Other financial liabilities, non-current | | | 6,602,891 | | | | 2,617 | | | | 6,605,508 | | | | 8,530,396 | | | | 22 | | | | 8,530,418 | |
| Accounts payable, non-current | | | 498,832 | | | | - | | | | 498,832 | | | | 619,110 | | | | - | | | | 619,110 | |
| Total | | | 10,086,434 | | | | 14,817 | | | | 10,101,251 | | | | 13,207,724 | | | | 50,394 | | | | 13,258,118 | |
(*) The value presented as initial designation as fair value through profit and loss, corresponds mainly to private investment funds; and loans and receivables corresponds to guarantees given.
| (*) | The value presented as fair value with changes in the result, corresponds mainly to private investment funds, and as measured at amortized cost they correspond to guarantees delivered. |
As of December 31, 20162018 (Restated)
| | | | Measured at | | At fair value | | | | | |
| | | | | | | | | Initial designation | | | | | amortized | | with changes | | Hedge | | | |
| Assets | | Loans | | | | Held | | as fair value | | | | | cost | | | in results | | | derivatives | | | Total | |
| | | and | | Hedge | | for | | through | | | | |
| | | receivables | | derivatives | | trading | | profit and loss | | Total | | |
| | | ThUS$ | | ThUS$ | | ThUS$ | | ThUS$ | | ThUS$ | | |
| | | | | | | | | | | | | | ThUS$ | | ThUS$ | | ThUS$ | | ThUS$ | |
| Cash and cash equivalents | | | 933,805 | | | | - | | | | - | | | | 15,522 | | | | 949,327 | | | | 1,037,989 | | | | 43,653 | | | | - | | | | 1,081,642 | |
| Other financial assets, current (*) | | | 164,426 | | | | 11,411 | | | | - | | | | 536,991 | | | | 712,828 | | | | 16,203 | | | | 344,426 | | | | 23,355 | | | | 383,984 | |
| Trade and others accounts receivable, current | | | 1,107,889 | | | | - | | | | - | | | | - | | | | 1,107,889 | | | | 1,162,582 | | | | - | | | | - | | | | 1,162,582 | |
| Accounts receivable from related entities, current | | | 554 | | | | - | | | | - | | | | - | | | | 554 | | | | 2,931 | | | | - | | | | - | | | | 2,931 | |
| Other financial assets, non current (*) | | | 101,603 | | | | - | | | | 522 | | | | - | | | | 102,125 | | |
| Other financial assets, non current | | | | 58,700 | | | | - | | | | - | | | | 58,700 | |
| Accounts receivable, non current | | | 8,254 | | | | - | | | | - | | | | - | | | | 8,254 | | | | 5,381 | | | | - | | | | - | | | | 5,381 | |
| Total | | | 2,316,531 | | | | 11,411 | | | | 522 | | | | 552,513 | | | | 2,880,977 | | | | 2,283,786 | | | | 388,079 | | | | 23,355 | | | | 2,695,220 | |
| | | | Measured at | | At fair value | | | | | |
| | | | amortized | | with changes | | Hedge | | | |
| Liabilities | | Other | | Held | | | | | cost | | | in results | | | derivatives | | | Total | |
| | | financial | | Hedge | | | | | ThUS$ | | ThUS$ | | ThUS$ | | ThUS$ | |
| | | liabilities | | derivatives | | Total | | | Restated | | Restated | | | | Restated | |
| | | ThUS$ | | ThUS$ | | ThUS$ | | |
| | | | | | | | | |
| Other liabilities, current | | | 1,814,647 | | | | 24,881 | | | | 1,839,528 | | |
| Trade and others accounts payable, current | | | 1,593,068 | | | | - | | | | 1,593,068 | | |
| Other financial liabilities, current (*) | | | | 1,760,653 | | | | 7,712 | | | | 25,921 | | | | 1,794,286 | |
| Trade and others accounts payable, current accounts payables, current | | | | 1,674,303 | | | | - | | | | - | | | | 1,674,303 | |
| Accounts payable to related entities, current | | | 269 | | | | - | | | | 269 | | | | 382 | | | | - | | | | - | | | | 382 | |
| Other financial liabilities, non-current | | | 6,790,273 | | | | 6,679 | | | | 6,796,952 | | |
| Other financial liabilities, non current | | | | 8,359,122 | | | | - | | | | 340 | | | | 8,359,462 | |
| Accounts payable, non-current | | | 359,391 | | | | - | | | | 359,391 | | | | 529,277 | | | | - | | | | - | | | | 529,277 | |
| Total | | | 10,557,648 | | | | 31,560 | | | | 10,589,208 | | | | 12,323,737 | | | | 7,712 | | | | 26,261 | | | | 12,357,710 | |
(*) The value presented as initial designation as fair value through profit and loss, corresponds mainly to private investment funds; and loans and receivables corresponds to guarantees given.
| (*) | The value presented as initial designation as fair value through profit and loss, corresponds mainly to private investment funds; and as measured at amortized cost they correspond to the guarantees granted. |
| F-587.2. | Financial instruments by currency |
| | | As of | | | As of | |
| | | December 31, | | | December 31, | |
| a) Assets | | 2019 | | | 2018 | |
| | | ThUS$ | | | ThUS$ | |
| | | | | | Restated | |
| Cash and cash equivalents | | | 1,072,579 | | | | 1,081,642 | |
| Argentine peso | | | 16,579 | | | | 17,786 | |
| Brazilian real | | | 197,354 | | | | 131,760 | |
| Chilean peso | | | 50,521 | | | | 415,713 | |
| Colombian peso | | | 48,191 | | | | 10,843 | |
| Euro | | | 21,927 | | | | 20,339 | |
| US Dollar | | | 667,785 | | | | 394,215 | |
| Other currencies | | | 70,222 | | | | 90,986 | |
| | | | | | | | | |
| Other financial assets (current and non-current) | | | 546,411 | | | | 442,684 | |
| Argentine peso | | | 94 | | | | 152 | |
| Brazilian real | | | 417,477 | | | | 327,110 | |
| Chilean peso | | | 26,073 | | | | 25,972 | |
| Colombian peso | | | 522 | | | | 1,748 | |
| Euro | | | 1,525 | | | | 7,438 | |
| US Dollar | | | 97,988 | | | | 78,121 | |
| Other currencies | | | 2,732 | | | | 2,143 | |
| | | | | | | | | |
| Trade and other accounts receivable, current | | | 1,244,348 | | | | 1,162,582 | |
| Argentine peso | | | 47,079 | | | | 82,893 | |
| Brazilian real | | | 537,221 | | | | 511,171 | |
| Chilean peso | | | 126,821 | | | | 113,168 | |
| Colombian peso | | | 2,288 | | | | 7,259 | |
| Euro | | | 32,711 | | | | 49,044 | |
| US Dollar | | | 436,774 | | | | 110,312 | |
| Other currencies (*) | | | 61,454 | | | | 288,735 | |
| | | | | | | | | |
| Accounts receivable, non-current | | | 4,725 | | | | 5,381 | |
| Brazilian real | | | 3 | | | | 3 | |
| Chilean peso | | | 4,722 | | | | 5,378 | |
| | | | | | | | | |
| Accounts receivable from related entities, current | | | 19,645 | | | | 2,931 | |
| Brazilian real | | | - | | | | 293 | |
| Chilean peso | | | 42 | | | | 200 | |
| US Dollar | | | 19,603 | | | | 2,438 | |
| | | | | | | | | |
| Total assets | | | 2,887,708 | | | | 2,695,220 | |
| Argentine peso | | | 63,752 | | | | 100,831 | |
| Brazilian real | | | 1,152,055 | | | | 970,337 | |
| Chilean peso | | | 208,179 | | | | 560,431 | |
| Colombian peso | | | 51,001 | | | | 19,850 | |
| Euro | | | 56,163 | | | | 76,821 | |
| US Dollar | | | 1,222,150 | | | | 585,086 | |
| Other currencies | | | 134,408 | | | | 381,864 | |
7.2. Financial instruments by currency
a) Assets
| | | As of | | | As of | |
| | | December 31, | | | December 31, | |
| | | 2017 | | | 2016 | |
| | | ThUS$ | | | ThUS$ | |
| | | | | | | |
| Cash and cash equivalents | | | 1,142,004 | | | | 949,327 | |
| Argentine peso | | | 12,135 | | | | 7,871 | |
| Brazilian real | | | 106,499 | | | | 97,401 | |
| Chilean peso | | | 81,845 | | | | 30,758 | |
| Colombian peso | | | 7,264 | | | | 4,336 | |
| Euro | | | 11,746 | | | | 1,695 | |
| US Dollar | | | 882,114 | | | | 780,124 | |
| Other currencies | | | 40,401 | | | | 27,142 | |
| Other financial assets (current and non-current) | | | 648,009 | | | | 814,953 | |
| Argentine peso | | | 297 | | | | 337 | |
| Brazilian real | | | 475,810 | | | | 686,501 | |
| Chilean peso | | | 26,679 | | | | 668 | |
| Colombian peso | | | 1,928 | | | | 1,023 | |
| Euro | | | 7,853 | | | | 6,966 | |
| US Dollar | | | 133,431 | | | | 117,346 | |
| Other currencies | | | 2,011 | | | | 2,112 | |
| Trade and other accounts receivable, current | | | 1,214,050 | | | | 1,107,889 | |
| Argentine peso | | | 49,958 | | | | 82,770 | |
| Brazilian real | | | 635,890 | | | | 551,260 | |
| Chilean peso | | | 83,415 | | | | 92,791 | |
| Colombian peso | | | 3,249 | | | | 16,454 | |
| Euro | | | 48,286 | | | | 21,923 | |
| US Dollar | | | 257,324 | | | | 312,394 | |
| Other currencies (*) | | | 135,928 | | | | 30,297 | |
| Accounts receivable, non-current | | | 6,891 | | | | 8,254 | |
| Brazilian real | | | 4 | | | | 4 | |
| Chilean peso | | | 6,887 | | | | 8,250 | |
| Accounts receivable from related entities, current | | | 2,582 | | | | 554 | |
| Brazilian real | | | 2 | | | | - | |
| Chilean peso | | | 735 | | | | 554 | |
| US Dollar | | | 1,845 | | | | - | |
| Total assets | | | 3,013,536 | | | | 2,880,977 | |
| Argentine peso | | | 62,390 | | | | 90,978 | |
| Brazilian real | | | 1,218,205 | | | | 1,335,166 | |
| Chilean peso | | | 199,561 | | | | 133,021 | |
| Colombian peso | | | 12,441 | | | | 21,813 | |
| Euro | | | 67,885 | | | | 30,584 | |
| US Dollar | | | 1,274,714 | | | | 1,209,864 | |
| Other currencies | | | 178,340 | | | | 59,551 | |
(*) See the composition of the others currencies in Note 8 Trade, other accounts receivable and non-current accounts receivable.
| (*) | See the composition of the other currencies in Note 8 Trade, other accounts receivable and non-current accounts receivable. |
Liabilities information is detailed in the table within Note 3 Financial risk management.
NOTE 8 - TRADE AND OTHER ACCOUNTS RECEIVABLE CURRENT, AND NON-CURRENT ACCOUNTS RECEIVABLE
| | | As of | | As of | | | As of | | As of | |
| | | December 31, | | December 31, | | | December 31, | | December 31, | |
| | | 2017 | | 2016 | | | 2019 | | | 2018 | |
| | | ThUS$ | | ThUS$ | | | ThUS$ | | ThUS$ | |
| | | | | | | | | | Restated | |
| Trade accounts receivable | | | 1,175,796 | | | | 1,022,933 | | | | 1,073,599 | | | | 1,077,561 | |
| Other accounts receivable | | | 133,054 | | | | 170,264 | | | | 275,876 | | | | 188,393 | |
| Total trade and other accounts receivable | | | 1,308,850 | | | | 1,193,197 | | | | 1,349,475 | | | | 1,265,954 | |
| Less: Allowance for impairment loss | | | (87,909 | ) | | | (77,054 | ) | |
| Less: Expected credit loss | | | | (100,402 | ) | | | (97,991 | ) |
| Total net trade and accounts receivable | | | 1,220,941 | | | | 1,116,143 | | | | 1,249,073 | | | | 1,167,963 | |
| Less: non-current portion – accounts receivable | | | (6,891 | ) | | | (8,254 | ) | | | (4,725 | ) | | | (5,381 | ) |
| Trade and other accounts receivable, current | | | 1,214,050 | | | | 1,107,889 | | | | 1,244,348 | | | | 1,162,582 | |
The fair value of trade and other accounts receivable does not differ significantly from the book value.
The maturityTo determine the expected credit losses, the Company groups accounts receivable for passenger and cargo transportation; depending on the characteristics of these accounts at the end of each period is as follows:shared credit risk and maturity.
| | | As of | | | As of | |
| | | December 31, | | | December 31, | |
| | | 2017 | | | 2016 | |
| | | ThUS$ | | | ThUS$ | |
| | | | | | | |
| Fully performing | | | 1,040,671 | | | | 907,358 | |
| Matured accounts receivable, but not impaired | | | | | | | | |
| Expired from 1 to 90 days | | | 34,153 | | | | 27,651 | |
| Expired from 91 to 180 days | | | 10,141 | | | | 9,303 | |
| More than 180 days overdue (*) | | | 2,922 | | | | 1,567 | |
| Total matured accounts receivable, but not impaired | | | 47,216 | | | | 38,521 | |
| | | | | | | | | |
| Matured accounts receivable and impaired Judicial, pre-judicial collection and protested documents | | | 43,175 | | | | 34,909 | |
| Debtor under pre-judicial collection process and portfolio sensitization | | | 44,734 | | | | 42,145 | |
| Total matured accounts receivable and impaired | | | 87,909 | | | | 77,054 | |
| Total | | | 1,175,796 | | | | 1,022,933 | |
| | | As of December 31, 2019 | | | As December 31, 2018 | |
| | | Expected | | | Gross book | | | Impairment loss | | | Expected | | | Gross book | | | Impairment loss | |
| Portfolio maturity | | loss rate (1) | | | value (2) | | | Provision | | | loss rate (1) | | | value (2) | | | Provision | |
| | | % | | | ThUS$ | | | ThUS$ | | | % | | | ThUS$ | | | ThUS$ | |
| | | | | | | | | | | | | | | | | | | |
| Up to date | | | 2 | % | | | 875,889 | | | | (16,433 | ) | | | 3 | % | | | 888,930 | | | | (23,933 | ) |
| From 1 to 90 days | | | 8 | % | | | 56,537 | | | | (4,253 | ) | | | 5 | % | | | 91,387 | | | | (5,014 | ) |
| From 91 to 180 days | | | 28 | % | | | 16,922 | | | | (4,747 | ) | | | 45 | % | | | 11,085 | | | | (4,983 | ) |
| From 181 to 360 days | | | 39 | % | | | 47,865 | | | | (18,459 | ) | | | 65 | % | | | 15,078 | | | | (9,864 | ) |
| more of 360 days | | | 74 | % | | | 76,386 | | | | (56,510 | ) | | | 76 | % | | | 71,081 | | | | (54,197 | ) |
| Total | | | 9 | % | | | 1,073,599 | | | | (100,402 | ) | | | 9 | % | | | 1,077,561 | | | | (97,991 | ) |
(*) Value(1) Corresponds to the expected average rate.
(2) the gross book value represents the maximum growth risk value of this segment corresponds primarily totrade accounts receivable that were evaluated in their ability to recover, therefore not requiring a provision.receivable.
Currency balances that make up the Trade and other accounts receivable and non-current accounts receivable are the following:
| | | As of | | As of | | | As of | | As of | |
| | | December 31, | | December 31, | | | December 31, | | December 31, | |
| Currency | | 2017 | | 2016 | | | 2019 | | | 2018 | |
| | | ThUS$ | | ThUS$ | | | ThUS$ | | ThUS$ | |
| | | | | | | | | | | |
| Argentine Peso | | | 49,958 | | | | 82,770 | | | | 47,079 | | | | 82,893 | |
| Brazilian Real | | | 635,894 | | | | 551,264 | | | | 537,224 | | | | 511,174 | |
| Chilean Peso | | | 90,302 | | | | 101,041 | | | | 131,543 | | | | 118,546 | |
| Colombian peso | | | 3,249 | | | | 16,454 | | | | 2,288 | | | | 7,259 | |
| Euro | | | 48,286 | | | | 21,923 | | | | 32,711 | | | | 49,044 | |
| US Dollar | | | 257,324 | | | | 312,394 | | | | 436,774 | | | | 110,312 | |
| Other currency (*) | | | 135,928 | | | | 30,297 | | | | 61,454 | | | | 288,735 | |
| Total | | | 1,220,941 | | | | 1,116,143 | | | | 1,249,073 | | | | 1,167,963 | |
| | | | | | | | | | | | | | | | | |
| (*) Other currencies | | | | | | | | | | | | | | | | |
| Australian Dollar | | | 40,303 | | | | 5,487 | | | | 20,964 | | | | 100,733 | |
| Chinese Yuan | | | 37 | | | | 271 | | | | 2,145 | | | | 5,106 | |
| Danish Krone | | | 197 | | | | 151 | | | | 54 | | | | 475 | |
| Pound Sterling | | | 5,068 | | | | 3,904 | | | | 7,428 | | | | 18,129 | |
| Indian Rupee | | | 3,277 | | | | 303 | | | | 37 | | | | 7,163 | |
| Japanese Yen | | | 18,756 | | | | 2,601 | | | | 1,222 | | | | 56,589 | |
| Norwegian Kroner | | | 133 | | | | 184 | | | | 14 | | | | 283 | |
| Swiss Franc | | | 2,430 | | | | 1,512 | | | | 535 | | | | 5,046 | |
| Korean Won | | | 18,225 | | | | 4,241 | | | | 8,172 | | | | 31,381 | |
| New Taiwanese Dollar | | | 2,983 | | | | 662 | | | | 1,117 | | | | 6,180 | |
| Other currencies | | | 44,519 | | | | 10,938 | | | | 19,766 | | | | 57,650 | |
| Total | | | 135,928 | | | | 30,254 | | | | 61,454 | | | | 288,735 | |
The Company records allowances when there is evidencemovements of impairment of trade receivables. The criteria used to determine that there is objective evidence ofthe provision for impairment losses are the maturity of the portfolio, specific acts of damage (default)Trade Debtors and specific market signals.other accounts receivable are as follows:
| | | | | | Adoption | | | | | | | | | | |
| | | Opening | | | adjustment | | | | | | (Increase) | | | Closing | |
| | | balance | | | IFRS 9 (*) | | | Write-offs | | | Decrease | | | balance | |
| Periods | | ThUS$ | | | ThUS$ | | | ThUS$ | | | ThUS$ | | | ThUS$ | |
| From January 1 to December 31, 2017 | | | (77,054 | ) | | | - | | | | 8,249 | | | | (19,104 | ) | | | (87,909 | ) |
| From January 1 to December 31, 2018 | | | (87,909 | ) | | | (10,524 | ) | | | 8,620 | | | | (8,178 | ) | | | (97,991 | ) |
| From January 1 to December 31, 2019 | | | (97,991 | ) | | | - | | | | 12,569 | | | | (14,980 | ) | | | (100,402 | ) |
Maturity | (*) | Impairment | |
Judicial and pre-judicial collection assets | | | 100 | % |
Over 1 year | | | 100 | % |
Between 6 and 12 months | | | 50 | %Adjustment to the balance as of December 31, 2017 registered in retained earnings as of 01.01.2018 for the adoption of IFRS 9. |
Movement in the allowance for impairment loss of Trade and other accounts receivables are the following:
| | | Opening | | | | | | (Increase) | | | Closing | |
| | | balance | | | Write-offs | | | Decrease | | | balance | |
| Periods | | ThUS$ | | | ThUS$ | | | ThUS$ | | | ThUS$ | |
| From January 1 to December 31, 2015 | | | (71,042 | ) | | | 10,120 | | | | 850 | | | | (60,072 | ) |
| From January 1 to December 31, 2016 | | | (60,072 | ) | | | 20,910 | | | | (37,892 | ) | | | (77,054 | ) |
| From January 1 to December 31, 2017 | | | (77,054 | ) | | | 8,249 | | | | (19,104 | ) | | | (87,909 | ) |
Once pre-judicial and judicial collection efforts are exhausted, the assets are written off against the allowance. The Company only uses the allowance method rather than direct write-off, to ensure control.
HistoricThe historical and current re-negotiationsrenegotiations are not very relevant, and the policy is to analyze case by case in order to classify them according to the existence of risk, determining whether it is appropriate to re-classify accountsif their reclassification corresponds to pre-judicial recovery. If such re-classification is justified, an allowance is made for the account, whether overdue or falling due.collection accounts.
The maximum credit-risk exposure at the date of presentation of the information is the fair value of each one of the categories of accounts receivable indicated above.
| | | As of December 31, 2017 | | As of December 31, 2016 | | |
| | | Gross exposure | | Gross | | Exposure net | | Gross exposure | | Gross | | Exposure net | | | As of December 31, 2019 | | | As of December 31, 2018 | |
| | | according to | | impaired | | of risk | | according to | | Impaired | | of risk | | | Gross exposure | | Gross | | Exposure net | | Gross exposure | | Gross | | Exposure net | |
| | | balance | | exposure | | concentrations | | balance | | exposure | | concentrations | | | according to | | impaired | | of risk | | according to | | Impaired | | of risk | |
| | | ThUS$ | | ThUS$ | | ThUS$ | | ThUS$ | | ThUS$ | | ThUS$ | | | balance | | | exposure | | | concentrations | | | balance | | | exposure | | | concentrations | |
| | | | | | | | | | | | | | | | ThUS$ | | ThUS$ | | ThUS$ | | ThUS$ | | ThUS$ | | ThUS$ | |
| Trade accounts receivable | | | 1,175,796 | | | | (87,909 | ) | | | 1,087,887 | | | | 1,022,933 | | | | (77,054 | ) | | | 945,879 | | | | 1,073,599 | | | | (100,402 | ) | | | 973,197 | | | | 1,077,561 | | | | (97,991 | ) | | | 979,570 | |
| Other accounts receivable | | | 133,054 | | | | - | | | | 133,054 | | | | 170,264 | | | | - | | | | 170,264 | | | | 275,876 | | | | - | | | | 275,876 | | | | 188,393 | | | | - | | | | 188,393 | |
There are no relevant guarantees covering credit risk and these are valued when they are settled; no materially significant direct guarantees exist. Existing guarantees, if appropriate, are made through IATA.
NOTE 9 - ACCOUNTS RECEIVABLE FROM/PAYABLE TO RELATED ENTITIES
(a) Accounts Receivable
| | | | | | | | | | | As of | | As of | | | | | | | As of | | As of | |
| | | | | | | Country | | | | December 31, | | December 31, | | | | | | | Country | | December 31, | | December 31, | |
| Tax No. | | Related party | | Relationship | | of origin | | Currency | | 2017 | | 2016 | | | Related party | | Relationship | | of origin | | Currency | | 2019 | | 2018 | |
| | | | | | | | | | | ThUS$ | | ThUS$ | | | | | | | ThUS$ | | ThUS$ | |
| | | | | | | | | | | | | | | |
| Foreign | | Qatar Airways | | Indirect shareholder | | Qatar | | ThU$ | | | 1,845 | | | | - | | | Qatar Airways | | Indirect shareholder | | Qatar | | US$ | | | 19,400 | | | | 1,907 | |
| 78.591.370-1 | | Bethia S.A. and Subsidiaries | | Related director | | Chile | | CLP | | | 728 | | | | 538 | | | Bethia S.A. and Subsidiaries | | Related director | | Chile | | CLP | | | - | | | | 988 | |
| Foreign | | TAM Aviação Executiva e | | | | | | | | | | Delta Air Lines Inc. | | Shareholder | | U.S.A. | | USD | | | 205 | | | | - | |
| | | Taxi Aéreo S.A. | | Related director | | Brazil | | BRL | | | 2 | | | | - | | |
| 87.752.000-5 | | Granja Marina Tornagaleones S.A. | | Common shareholder | | Chile | | CLP | | | 5 | | | | 14 | | | Granja Marina Tornagaleones S.A. | | Common shareholder | | Chile | | CLP | | | 36 | | | | 31 | |
| 96.782.530-1 | | | Inmobiliaria e Inversiones Asturias S.A. | | Related director | | Chile | | CLP | | | 1 | | | | - | |
| 76.335.600-0 | | | Parque de Chile S.A. | | Related director | | Chile | | CLP | | | 2 | | | | - | |
| 96.810.370-9 | | Inversiones Costa Verde | | | | | | | | | | Inversiones Costa Verde Ltda. y CPA. | | Related director | | Chile | | CLP | | | 1 | | | | 5 | |
| | | Ltda. y CPA. | | Related director | | Chile | | CLP | | | 2 | | | | 2 | | | Total current assets | | | | | | | | | 19,645 | | | | 2,931 | |
| | | | | | | | | | |
| | | Total current assets | | | 2,582 | | | | 554 | | |
(b) Accounts payable
| | | | | | | | | | | As of | | | As of | |
| | | | | | | Country | | | | December 31, | | | December 31, | |
| Tax No. | | Related party | | Relationship | | of origin | | Currency | | 2017 | | | 2016 | |
| | | | | | | | | | | ThUS$ | | | ThUS$ | |
| | | | | | | | | | | | | | | |
| 78.997.060-2 | | Viajes Falabella Ltda. | | Related director | | Chile | | CLP | | | 534 | | | | 46 | |
| 78.591.370-1 | | Bethia S.A. and Subsidiaries | | Related director | | Chile | | CLP | | | 12 | | | | 6 | |
| Foreign | | Inversora Aeronáutica Argentina S.A. | | Related director | | Argentina | | ThUS$ | | | 4 | | | | 2 | |
| 65.216.000-K | | Comunidad Mujer | | Related director | | Chile | | CLP | | | - | | | | 13 | |
| Foreign | | Consultoría Administrativa | | | | | | | | | | | | | | |
| | | Profesional S.A. de C.V. | | Related company | | México | | MXN | | | 210 | | | | 170 | |
| Foreign | | TAM Aviação Executiva | | | | | | | | | | | | | | |
| | | e Taxi Aéreo S.A. | | Related director | | Brazil | | BRL | | | - | | | | 28 | |
| 79.773.440-3 | | Transportes San Felipe S.A | | Common property | | Chile | | CLP | | | - | | | | 4 | |
| | | Total current liabilities | | | | | | | | | 760 | | | | 269 | |
| | | | | | | | | | | As of | | | As of | |
| | | | | | | Country | | | | December 31, | | | December 31, | |
| Tax No. | | Related party | | Relationship | | of origin | | Currency | | 2019 | | | 2018 | |
| | | | | | | | | | | ThUS$ | | | ThUS$ | |
| 78.591.370-1 | | Bethia S.A. and Subsidiaries | | Related director | | Chile | | CLP | | | 53 | | | | 365 | |
| Foreign | | Inversora Aeronáutica Argentina S.A. | | Related director | | Argentina | | ARS | | | - | | | | 15 | |
| Foreign | | Patagonia Seafarms INC | | Related director | | U.S.A. | | USD | | | 3 | | | | - | |
| Foreign | | TAM Aviação Executiva e Taxi Aéreo S.A. | | Common shareholder | | Brasil | | BRL | | | - | | | | 2 | |
| | | Total current liabilities | | | | | | | | | 56 | | | | 382 | |
Transactions between related parties have been carried out on free-trade conditions between interested and duly-informed parties. The transaction times are between 30 and 45 days, and the nature of settlement of the transactions is monetary.
NOTE 10 -INVENTORIES- INVENTORIES
The composition of Inventories is as follows:
| | | As of | | As of | | | As of | | As of | |
| | | December 31, | | December 31, | | | December 31, | | December 31, | |
| | | 2017 | | 2016 | | | 2019 | | | 2018 | |
| | | ThUS$ | | ThUS$ | | | ThUS$ | | ThUS$ | |
| | | | | | | | | | | |
| Technical stock | | | 195,530 | | | | 191,864 | | | | 315,286 | | | | 233,276 | |
| Non-technical stock | | | 41,136 | | | | 49,499 | | | | 38,946 | | | | 46,068 | |
| Total | | | 236,666 | | | | 241,363 | | | | 354,232 | | | | 279,344 | |
The items included in this heading are spare parts and materials that will be used mainly in consumption in in-flight and maintenance services provided to the Company and third parties, which are valued at average cost, net of provision for obsolescence, as per the following detail:
| | | As of | | As of | | | As of | | As of | |
| | | December 31, | | December 31, | | | December 31, | | December 31, | |
| | | 2017 | | 2016 | | | 2019 | | | 2018 | |
| | | ThUS$ | | ThUS$ | | | ThUS$ | | ThUS$ | |
| | | | | | | | | | | |
| Provision for obsolescence Technical stock | | | 21,839 | | | | 31,647 | | | | 21,193 | | | | 20,500 | |
| Provision for obsolescenceNon-technical stock | | | 6,488 | | | | 3,429 | | | | 11,610 | | | | 4,621 | |
| Total | | | 28,327 | | | | 35,076 | | | | 32,803 | | | | 25,121 | |
The resulting amounts do not exceed the respective net realization values.
As ofFor the period ended December 31, 2017,2019, the Company recorded ThUS$ 155,421133,286 (ThUS$ 167,365 at120,214 for the period ended December 31, 2016) within the income statement,2018) in results, mainly duerelated to in-flighton-board consumption and maintenance, which formsis part of the Cost of sales.
NOTE 11 - OTHER FINANCIAL ASSETS
The composition of other financial assets is as follows:
| | | Current Assets | | Non-current assets | | Total Assets | | |
| | | As of | | As of | | As of | | As of | | As of | | As of | | |
| | | December 31, | | December 31, | | December 31, | | December 31, | | December 31, | | December 31, | | |
| | | 2017 | | 2016 | | 2017 | | 2016 | | 2017 | | 2016 | | | Current Assets | | | Non-current assets | | | Total Assets | |
| | | ThUS$ | | ThUS$ | | ThUS$ | | ThUS$ | | ThUS$ | | ThUS$ | | | As of
December 31,
2019 | | | As of
December 31,
2018 | | | As of
December 31,
2019 | | | As of
December 31,
2018 | | | As of
December 31,
2019 | | | As of
December 31,
2018 | |
| | | | | | | | | | | | | | | | ThUS$ | | ThUS$ | | ThUS$ | | ThUS$ | | ThUS$ | | ThUS$ | |
| (a) Other financial assets | | | | | | | | | | | | | | | | | | | | | | | | | | | | | | | | | | | | | |
| Private investment funds | | | 472,232 | | | | 536,991 | | | | - | | | | - | | | | 472,232 | | | | 536,991 | | | | 386,669 | | | | 322,428 | | | | - | | | | - | | | | 386,669 | | | | 322,428 | |
| Deposits in guarantee (aircraft) | | | 15,690 | | | | 16,819 | | | | 41,058 | | | | 56,846 | | | | 56,748 | | | | 73,665 | | | | 8,934 | | | | 9,610 | | | | 28,599 | | | | 37,636 | | | | 37,533 | | | | 47,246 | |
| Guarantees for margins of derivatives | | | 2,197 | | | | 939 | | | | - | | | | - | | | | 2,197 | | | | 939 | | | | 21,200 | | | | 661 | | | | - | | | | - | | | | 21,200 | | | | 661 | |
| Other investments | | | - | | | | - | | | | 494 | | | | 522 | | | | 494 | | | | 522 | | | | - | | | | - | | | | 494 | | | | 494 | | | | 494 | | | | 494 | |
| Domestic and foreign bonds | | | 1,421 | | | | - | | | | - | | | | - | | | | 1,421 | | | | - | | | | 19 | | | | 1,394 | | | | - | | | | - | | | | 19 | | | | 1,394 | |
| Other guarantees given | | | 6,031 | | | | 140,733 | | | | 46,019 | | | | 44,757 | | | | 52,050 | | | | 185,490 | | | | 6,507 | | | | 7,140 | | | | 15,138 | | | | 20,570 | | | | 21,645 | | | | 27,710 | |
| Other | | | - | | | | 5,935 | | | | - | | | | - | | | | - | | | | 5,935 | | |
| Subtotal of other financial assets | | | 497,571 | | | | 701,417 | | | | 87,571 | | | | 102,125 | | | | 585,142 | | | | 803,542 | | | | 423,329 | | | | 341,233 | | | | 44,231 | | | | 58,700 | | | | 467,560 | | | | 399,933 | |
| | | | | | | | | | | | | | | | | | | | | | | | | | | | | | | | | | | | | | | | | | | | | | | | | |
| (b) Hedging assets | | | | | | | | | | | | | | | | | | | | | | | | | |
| | | | | | | | | | | | | | | | | | | | | | | | | | |
| Interest accrued since the last payment date | | | | | | | | | | | | | | | | | | | | | | | | | |
| of Cross currency swap | | | 202 | | | | 64 | | | | - | | | | - | | | | 202 64 | | | | | | |
| (b) Hedging derivate assets | | | | | | | | | | | | | | | | | | | | | | | | | |
| Accrued Interest since the last payment date | | | | | | | | | | | | | | | | | | | | | | | | | |
| Cross currency swap of currencies | | | | 3 | | | | - | | | | - | | | | - | | | | 3 | | | | - | |
| Fair value of interest rate derivatives | | | 3,113 | | | | - | | | | - | | | | - | | | | 3,113 | | | | - | | | | 27,044 | | | | 19,460 | | | | 2,676 | | | | - | | | | 29,720 | | | | 19,460 | |
| Fair value of foreign currency derivatives | | | 48,322 | | | | 1,259 | | | | 519 | | | | - | | | | 48,841 | | | | 1,259 | | | | 586 | | | | 3,895 | | | | - | | | | - | | | | 586 | | | | 3,895 | |
| Fair value of fuel price derivatives | | | 10,711 | | | | 10,088 | | | | - | | | | - | | | | 10,711 | | | | 10,088 | | | | 48,542 | | | | - | | | | - | | | | - | | | | 48,542 | | | | - | |
| Subtotal of hedging assets | | | 62,348 | | | | 11,411 | | | | 519 | | | | - | | | | 62,867 | | | | 11,411 | | |
| Subtotal of hedging derivate assets | | | | 76,175 | | | | 23,355 | | | | 2,676 | | | | - | | | | 78,851 | | | | 23,355 | |
| | | | | | | | | | | | | | | | | | | | | | | | | | |
| (c) Derivatives not recognized as a hedge | | | | | | | | | | | | | | | | | | | | | | | | | |
| Foreign currency derivatives not recognized as a hedge | | | | - | | | | 19,396 | | | | - | | | | - | | | | - | | | | 19,396 | |
| Subtotal of derivatives not recognized as a hedge | | | | - | | | | 19,396 | | | | - | | | | - | | | | - | | | | 19,396 | |
| Total Other Financial Assets | | | 559,919 | | | | 712,828 | | | | 88,090 | | | | 102,125 | | | | 648,009 | | | | 814,953 | | | | 499,504 | | | | 383,984 | | | | 46,907 | | | | 58,700 | | | | 546,411 | | | | 442,684 | |
The types ofdifferent derivative hedging contracts maintained by the Company at the end of each periodfiscal year are described in Note 19.
NOTE 12 - OTHER NON-FINANCIAL ASSETS
The composition of other non-financial assets is as follows:
| | | Current assets | | Non-current assets | | Total Assets | | |
| | | As of | | As of | | As of | | As of | | As of | | As of | | |
| | | December 31, | | December 31, | | December 31, | | December 31, | | December 31, | | December 31, | | | Current assets | | | Non-current assets | | | Total Assets | |
| | | 2017 | | 2016 | | 2017 | | 2016 | | 2017 | | 2016 | | | As of
December 31,
2019 | | | As of
December 31,
2018 | | | As of
December 31,
2019 | | | As of
December 31,
2018 | | | As of
December 31,
2019 | | | As of
December 31,
2018 | |
| | | ThUS$ | | ThUS$ | | ThUS$ | | ThUS$ | | ThUS$ | | ThUS$ | | | ThUS$ | | ThUS$ | | ThUS$ | | ThUS$ | | ThUS$ | | ThUS$ | |
| | | | | | | | | | | | | | | | | | Restated | | | | Restated | | | | Restated | |
| (a) Advance payments | | | | | | | | | | | | | | | | | | | | | | | | | | | | | | | | | | | | | |
| | | | | | | | | | | | | | | | | | | | | | | | | | | | | | | | | | | | | | |
| Aircraft leases | | | 31,322 | | | | 37,560 | | | | 4,718 | | | | 14,065 | | | | 36,040 | | | | 51,625 | | |
| Aircraft insurance and other | | | 17,681 | | | | 14,717 | | | | - | | | | - | | | | 17,681 | | | | 14,717 | | | | 11,179 | | | | 16,483 | | | | 523 | | | | - | | | | 11,702 | | | | 16,483 | |
| Others | | | 10,012 | | | | 4,521 | | | | 1,186 | | | | 1,573 | | | | 11,198 | | | | 6,094 | | | | 15,167 | | | | 20,105 | | | | 1,832 | | | | 4,460 | | | | 16,999 | | | | 24,565 | |
| Subtotal advance payments | | | 59,015 | | | | 56,798 | | | | 5,904 | | | | 15,638 | | | | 64,919 | | | | 72,436 | | | | 26,346 | | | | 36,588 | | | | 2,355 | | | | 4,460 | | | | 28,701 | | | | 41,048 | |
| | | | | | | | | | | | | | | | | | | | | | | | | | | | | | | | | | | | | | | | | | | | | | | | | |
| (b) Other assets | | | | | | | | | | | | | | | | | | | | | | | | | |
| (b) Contract assets (1) | | | | | | | | | | | | | | | | | | | | | | | | | |
| | | | | | | | | | | | | | | | | | | | | | | | | | | | | | | | | | | | | | | | | | | | | | | | | |
| Aircraft maintenance reserve (*) | | | 21,505 | | | | 51,576 | | | | 51,836 | | | | 90,175 | | | | 73,341 | | | | 141,751 | | |
| GDS costs | | | | 16,593 | | | | 14,708 | | | | - | | | | - | | | | 16,593 | | | | 14,708 | |
| Credit card commissions | | | | 23,437 | | | | 21,614 | | | | - | | | | - | | | | 23,437 | | | | 21,614 | |
| Travel agencies commissions | | | | 16,546 | | | | 12,635 | | | | - | | | | - | | | | 16,546 | | | | 12,635 | |
| Subtotal advance payments | | | | 56,576 | | | | 48,957 | | | | - | | | | - | | | | 56,576 | | | | 48,957 | |
| | | | | | | | | | | | | | | | | | | | | | | | | | |
| (c) Other assets | | | | | | | | | | | | | | | | | | | | | | | | | |
| | | | | | | | | | | | | | | | | | | | | | | | | | |
| Aircraft maintenance reserve (2) | | | | 27,987 | | | | 831 | | | | 17,844 | | | | 51,836 | | | | 45,831 | | | | 52,667 | |
| Sales tax | | | 137,866 | | | | 102,351 | | | | 37,959 | | | | 40,232 | | | | 175,825 | | | | 142,583 | | | | 167,987 | | | | 187,410 | | | | 34,680 | | | | 38,186 | | | | 202,667 | | | | 225,596 | |
| Other taxes | | | 2,475 | | | | 500 | | | | - | | | | - | | | | 2,475 | | | | 500 | | | | 34,295 | | | | 15,255 | | | | - | | | | - | | | | 34,295 | | | | 15,255 | |
| Contributions to Société Internationale de Télécommunications Aéronautiques ("SITA") | | | 327 | | | | 406 | | | | 670 | | | | 591 | | | | 997 | | | | 997 | | |
| Contributions to Société Internationale de | | | | | | | | | | | | | | | | | | | | | | | | | |
| Télécommunications Aéronautiques (“SITA”) | | | | 258 | | | | 258 | | | | 739 | | | | 739 | | | | 997 | | | | 997 | |
| Judicial deposits | | | - | | | | - | | | | 124,438 | | | | 90,604 | | | | 124,438 | | | | 90,604 | | | | - | | | | - | | | | 149,310 | | | | 132,267 | | | | 149,310 | | | | 132,267 | |
| Others | | | - | | | | 611 | | | | - | | | | 104 | | | | - | | | | 715 | | | | - | | | | 1,177 | | | | - | | | | 53 | | | | - | | | | 1,230 | |
| Subtotal other assets | | | 162,173 | | | | 155,444 | | | | 214,903 | | | | 221,706 | | | | 377,076 | | | | 377,150 | | | | 230,527 | | | | 204,931 | | | | 202,573 | | | | 223,081 | | | | 433,100 | | | | 428,012 | |
| Total Other Non - Financial Assets | | | 221,188 | | | | 212,242 | | | | 220,807 | | | | 237,344 | | | | 441,995 | | | | 449,586 | | | | 313,449 | | | | 290,476 | | | | 204,928 | | | | 227,541 | | | | 518,377 | | | | 518,017 | |
(*)(1) Movement of Contracts assets:
| | | | | | | | | Adjustments | | | Difference | | | | | | | |
| | | Initial | | | | | | by the application | | | by | | | | | | Final | |
| | | balance | | | Activation | | | IFRS 15 | | | conversion | | | Amortization | | | balance | |
| | | ThUS$ | | | ThUS$ | | | ThUS$ | | | ThUS$ | | | ThUS$ | | | ThUS$ | |
| | | | | | | | | | | | | | | | | | | |
| From January 1 to December 31, 2018 | | | - | | | | 180,171 | | | | 54,361 | | | | (5,019 | ) | | | (180,556 | ) | | | 48,957 | |
| From January 1 to December 31, 2019 | | | 48,957 | | | | 166,300 | | | | - | | | | (4,950 | ) | | | (153,731 | ) | | | 56,576 | |
(2) Aircraft maintenance reserves reflect prepayment deposits made by the group to lessors of certain aircraft under operating lease agreements in order to ensure that funds are available to support the scheduled heavy maintenance of the aircraft.
These amounts are calculated based on performance measures, such as flight hours or cycles, are paid periodically (usually monthly) and are contractually required to be repaid to the lessee upon the completion of the required maintenance of the leased aircraft. At the end of the lease term, any unused maintenance reserves are either returned to the Company in cash or used to offset amounts that we may owe the lessor as a maintenance adjustment.
In some cases, (five lease agreements), if the maintenance cost incurred by LATAM is less than the corresponding maintenance reserves, the lessor is entitled to retain those excess amounts at the time the heavy maintenance is performed. The Company periodically reviews its maintenance reserves for each of its leased aircraft to ensure that they will be recovered and recognizes an expense if any such amounts are less than probable of being returned. The cost of aircraft maintenance in the last years has been higher than the related maintenance reserves for all aircraft.
As of December 31, 2017,2019, maintenance reserves total ThUS $ 73,341 (ThUS $ 141,751amount to ThUS$ 45,831 (ThUS$ 52,667 as of December 31, 2016)2018), corresponding to 148 aircraft that maintain remaining balances, which will be settled in the next maintenance or return.
Aircraft maintenance reserves are classified as current or non-current depending on the dates when the related maintenance is expected to be performed (Note 2.23).
NOTE 13 - NON-CURRENT ASSETS AND DISPOSAL GROUP CLASSIFIED AS HELD FOR SALE
Non-current assets and in disposal groupsgroup classifieds as held for sale at December 31, 20172019 and December 31, 20162018, are detailed below:
| | | As of | | As of | | | As of | | As of | |
| | | December 31, | | December 31, | | | December 31, | | December 31, | |
| | | 2017 | | 2016 | | | 2019 | | | 2018 | |
| | | ThUS$ | | ThUS$ | | | ThUS$ | | ThUS$ | |
| Current assets | | | | | | | | | | | | | |
| | | | | | | | | | | | | | |
| Aircraft | | | 236,022 | | | | 281,158 | | | | 482,806 | | | | 265 | |
| Engines and rotables | | | 9,197 | | | | 29,083 | | | | 1,943 | | | | 5,299 | |
| Other assets | | | 45,884 | | | | 26,954 | | |
| Other | | | | 401 | | | | 204 | |
| Total | | | 291,103 | | | | 337,195 | | | | 485,150 | | | | 5,768 | |
| | | | | | | | | | |
| Current liabilities | | | | | | | | | |
| Other liabilities | | | 15,546 | | | | 10,152 | | |
| Total | | | 15,546 | | | | 10,152 | | |
The balances are presented at the lower of book value and fair value less cost to sell. The fair value of these assets was determined based on quoted prices in active markets for similar assets or liabilities. This is a level II measurement as per the fair value hierarchy set out in noteNote 3.3 (2). There were no transfers between levels for recurring fair value measurements during the year.
| (a)a) | Assets reclassifiedreclassified from Property, plant and equipment to Non-current assets or groups of assets for disposal classified as held for salesale. |
During 2016, two2019, four Airbus A319 aircraft, two Airbus A320 aircraft, six Airbus A330A350, aircraft two Boeing 777 aircraft, eight A330 spare engines, A330 rotables and two buildings under the heading Non-current assets were transferred from the Property, plant and equipment heading. or groups of assets for disposal, classified as held for sale.
As a result, as of December 31, 2016, an adjustment of US $ 55 million was recorded to write down these assets to their net.
During 2016, two Airbus A319 aircraft, one Airbus A320 aircraft, two Airbus A330 aircraft, one A330 spare engine and D200 rotables were sold.
During 2017, an adjustment of US $ 17.4 million was recognized to record these assets at their net realizable value.
In addition, during 2017 seven Airbus A330 Spare engines and twoAirbus A330 aircraft were sold.
The detail of fleet classified as non-current assets or groups of assets for disposal classified as held for sale is the following:
| | | As of | | | As of | |
| | | December 31, | | | December 31, | |
| Aircraft | | 2017 | | | 2016 | |
| Boeing 777 Freighter | | | 2 | (*) | | | 2 | (*) |
| Airbus A330-200 | | | 1 | | | | 3 | |
| Airbus A320-200 | | | 1 | | | | 1 | |
| ATR42-300 | | | 1 | | | | 1 | |
| Total | | | 5 | | | | 7 | |
(*) One aircraft leased to DHL.
(b) Assets reclassified from Inventories to Non-current assets or groups of assets for disposal classified as held for sale
During in the first quarter of 2017, stocks of the fleet Airbus A330,767, were reclassified from InventoriesProperty, plants and equipment to Non-current assets or groups of assets for disposal classified as held for sale.
During 2017 an adjustmentAdditionally, during 2019, the sale of one motor spare Boeing 767 and one Boeing 767 aircraft were materialized. As a result of the above, during of 2019, adjustments for US $ 1.32 million wasof expense were recognized to record these assets at their net realizable value.
In addition, during 2017 partThe detail of the A330 inventory was sold.fleet classified as non-current assets and disposal group classified as in disregard held for sale is as follows:
| | | As of | | | As of | |
| | | December 31, | | | December 31, | |
| Aircraft | | 2019 | | | 2018 | |
| | | | | | | |
| Boeing 767 | | | 1 | | | | - | |
| Airbus A350 | | | 4 | | | | - | |
| ATR42-300 | | | - | | | | 1 | |
| Total | | | 5 | | | | 1 | |
NOTE 14 - INVESTMENTS IN SUBSIDIARIES
(a) Investments in subsidiaries
| (a) | Investments in subsidiaries |
The Company has investments in companies recognized as investments in subsidiaries. All the companies defined as subsidiaries have been consolidated within the financial statements of LATAM Airlines Group S.A. and Subsidiaries. The consolidation also includes special-purpose entities.
Detail of significant subsidiaries and summarized financial information:subsidiaries:
| | | | | | | Ownership | | | | | | | Ownership | |
| | | | | | | As of | | As of | | | As of | | As of | |
| | | Country of | | Functional | | December 31, | | December 31, | | | Country of | | Functional | | December 31, | | December 31, | |
| Name of significant subsidiary | | incorporation | | currency | | 2017 | | 2016 | | | incorporation | | currency | | 2019 | | 2018 | |
| | | | | | | % | | % | | | % | | % | |
| Lan Perú S.A. | | Peru | | US$ | | | 70.00000 | | | | 70.00000 | | |
| | | | | | | |
| Latam Airlines Perú S.A. | | | Peru | | US$ | | | 70.00000 | | | | 70.00000 | |
| Lan Cargo S.A. | | Chile | | US$ | | | 99.89803 | | | | 99.89803 | | | Chile | | US$ | | | 99.89395 | | | | 99.89803 | |
| Lan Argentina S.A. | | Argentina | | ARS | | | 99.86560 | | | | 99.86560 | | | Argentina | | ARS | | | 99.98370 | | | | 99.86560 | |
| Transporte Aéreo S.A. | | Chile | | US$ | | | 100.00000 | | | | 100.00000 | | | Chile | | US$ | | | 100.00000 | | | | 100.00000 | |
| Aerolane Líneas Aéreas Nacionales del Ecuador S.A. | | Ecuador | | US$ | | | 100.00000 | | | | 100.00000 | | |
| Latam Airlines Ecuador S.A. | | | Ecuador | | US$ | | | 100.00000 | | | | 100.00000 | |
| Aerovías de Integración Regional, AIRES S.A. | | Colombia | | COP | | | 99.19061 | | | | 99.19061 | | | Colombia | | COP | | | 99.19414 | | | | 99.19061 | |
| TAM S.A. | | Brazil | | BRL | | | 99.99938 | | | | 99.99938 | | | Brazil | | BRL | | | 99.99938 | | | | 99.99938 | |
The consolidated subsidiaries do not have significant restrictions for transferring funds to controller.
Summary financial information of significant subsidiaries
| | | | | Results for the period | | |
| | | Statement of financial position as of December 31, 2017 | | ended December 31, 2017 | | | Statement of financial position as of December 31, 2019 | | | Income for the year
ended
December 31,
2019 | |
| | | Total | | Current | | Non-current | | Total | | Current | | Non-current | | | | Net | | | Total | | Current | | Non-current | | Total | | Current | | Non-current | | | | Net | |
| Name of significant subsidiary | | Assets | | Assets | | Assets | | Liabilities | | Liabilities | | Liabilities | | Revenue | | Income | | | Assets | | | Assets | | | Assets | | | Liabilities | | | Liabilities | | | Liabilities | | | Revenue | | | Income | |
| | | ThUS$ | | ThUS$ | | ThUS$ | | ThUS$ | | ThUS$ | | ThUS$ | | ThUS$ | | ThUS$ | | | ThUS$ | | ThUS$ | | ThUS$ | | ThUS$ | | ThUS$ | | ThUS$ | | ThUS$ | | ThUS$ | |
| | | | | | | | | | | |
| Lan Perú S.A. | | | 315,607 | | | | 294,308 | | | | 21,299 | | | | 303,204 | | | | 301,476 | | | | 1,728 | | | | 1,046,423 | | | | 1,205 | | |
| Latam Airlines Perú S.A. | | | | 519,363 | | | | 481,592 | | | | 37,771 | | | | 510,672 | | | | 508,541 | | | | 2,131 | | | | 1,186,668 | | | | (1,739 | ) |
| Lan Cargo S.A. | | | 584,169 | | | | 266,836 | | | | 317,333 | | | | 371,934 | | | | 292,529 | | | | 79,405 | | | | 264,544 | | | | (30,220 | ) | | | 634,852 | | | | 334,725 | | | | 300,127 | | | | 462,666 | | | | 398,872 | | | | 63,794 | | | | 274,774 | | | | (4,157 | ) |
| Lan Argentina S.A. | | | 198,951 | | | | 166,445 | | | | 32,506 | | | | 143,731 | | | | 139,914 | | | | 3,817 | | | | 387,557 | | | | (41,636 | ) | | | 262,049 | | | | 255,641 | | | | 6,408 | | | | 89,070 | | | | 86,912 | | | | 2,158 | | | | 218,989 | | | | (133,408 | ) |
| Transporte Aéreo S.A. | | | 324,498 | | | | 30,909 | | | | 293,589 | | | | 104,357 | | | | 36,901 | | | | 67,456 | | | | 317,436 | | | | 2,172 | | | | 359,335 | | | | 101,128 | | | | 258,207 | | | | 142,423 | | | | 46,383 | | | | 96,040 | | | | 315,105 | | | | 14,610 | |
| Aerolane Líneas Aéreas Nacionales del Ecuador S.A. | | | 96,407 | | | | 66,166 | | | | 30,241 | | | | 84,123 | | | | 78,817 | | | | 5,306 | | | | 219,039 | | | | 3,722 | | |
| Latam Airlines Ecuador S.A. | | | | 99,019 | | | | 95,187 | | | | 3,832 | | | | 97,198 | | | | 86,810 | | | | 10,388 | | | | 229,797 | | | | (3,411 | ) |
| Aerovías de Integración Regional, AIRES S.A. | | | 138,138 | | | | 64,160 | | | | 73,978 | | | | 91,431 | | | | 80,081 | | | | 11,350 | | | | 279,414 | | | | 526 | | | | 187,001 | | | | 135,344 | | | | 51,657 | | | | 78,990 | | | | 70,643 | | | | 8,347 | | | | 291,235 | | | | (3,009 | ) |
| TAM S.A. (*) | | | 4,490,714 | | | | 1,843,822 | | | | 2,646,892 | | | | 3,555,423 | | | | 2,052,633 | | | | 1,502,790 | | | | 4,621,338 | | | | 160,582 | | | | 5,036,864 | | | | 2,580,665 | | | | 2,456,199 | | | | 3,497,559 | | | | 2,556,280 | | | | 941,279 | | | | 5,013,293 | | | | 185,720 | |
| | | Statement of financial position as of December 31, 2018 | | | Income for the year
ended
December 31,
2018 | |
| Name of significant subsidiary | | Total
Assets | | | Current
Assets | | | Non-current
Assets | | | Total
Liabilities | | | Current
Liabilities | | | Non-current
Liabilities | | | Revenue | | | Net
Income | |
| | | ThUS$ | | | ThUS$ | | | ThUS$ | | | ThUS$ | | | ThUS$ | | | ThUS$ | | | ThUS$ | | | ThUS$ | |
| | | Restated | | | | | | Restated | |
| Latam Airlines Perú S.A. | | | 419,325 | | | | 379,490 | | | | 39,835 | | | | 409,221 | | | | 406,159 | | | | 3,062 | | | | 871,860 | | | | 2,732 | |
| Lan Cargo S.A. | | | 513,367 | | | | 243,499 | | | | 269,868 | | | | 336,715 | | | | 292,399 | | | | 44,316 | | | | 190,997 | | | | (34,322 | ) |
| Lan Argentina S.A. | | | 243,230 | | | | 235,919 | | | | 7,311 | | | | 239,234 | | | | 236,786 | | | | 2,448 | | | | 154,878 | | | | (132,538 | ) |
| Transporte Aéreo S.A. | | | 331,496 | | | | 72,597 | | | | 258,899 | | | | 129,233 | | | | 28,277 | | | | 100,956 | | | | 231,221 | | | | (17,609 | ) |
| Latam Airlines Ecuador S.A. | | | 108,735 | | | | 96,564 | | | | 12,171 | | | | 98,238 | | | | 89,921 | | | | 8,317 | | | | 174,821 | | | | 4,354 | |
| Aerovías de Integración Regional, AIRES S.A. | | | 116,352 | | | | 55,865 | | | | 60,487 | | | | 77,984 | | | | 69,150 | | | | 8,834 | | | | 215,366 | | | | (6,396 | ) |
| TAM S.A. (*) | | | 4,420,546 | | | | 2,007,830 | | | | 2,412,716 | | | | 3,256,017 | | | | 1,832,796 | | | | 1,423,221 | | | | 3,434,453 | | | | 358,616 | |
| | | Statement of financial position as of December 31, 2017 | | | Income for the year
ended
December 31,
2017 | |
| Name of significant subsidiary | | Total
Assets | | | Current
Assets | | | Non-current
Assets | | | Total
Liabilities | | | Current
Liabilities | | | Non-current
Liabilities | | | Revenue | | | Net
Income | |
| | | ThUS$ | | | ThUS$ | | | ThUS$ | | | ThUS$ | | | ThUS$ | | | ThUS$ | | | ThUS$ | | | ThUS$ | |
| | | Restated | | | | | | Restated | |
| Latam Airlines Perú S.A. | | | 315,607 | | | | 294,308 | | | | 21,299 | | | | 303,204 | | | | 301,476 | | | | 1,728 | | | | 1,046,423 | | | | 1,205 | |
| Lan Cargo S.A. | | | 584,169 | | | | 266,836 | | | | 317,333 | | | | 371,934 | | | | 292,529 | | | | 79,405 | | | | 264,544 | | | | (30,220 | ) |
| Lan Argentina S.A. | | | 198,951 | | | | 166,445 | | | | 32,506 | | | | 143,731 | | | | 139,914 | | | | 3,817 | | | | 387,557 | | | | (41,636 | ) |
| Transporte Aéreo S.A. | | | 324,498 | | | | 30,909 | | | | 293,589 | | | | 104,357 | | | | 36,901 | | | | 67,456 | | | | 317,436 | | | | 2,172 | |
| Aerolane Líneas Aéreas Nacionales del Ecuador S.A. | | | 96,407 | | | | 66,166 | | | | 30,241 | | | | 84,123 | | | | 78,817 | | | | 5,306 | | | | 219,039 | | | | 3,722 | |
| Aerovías de Integración Regional, AIRES S.A. | | | 138,138 | | | | 64,160 | | | | 73,978 | | | | 91,431 | | | | 80,081 | | | | 11,350 | | | | 279,414 | | | | 526 | |
| TAM S.A. (*) | | | 4,490,714 | | | | 1,843,822 | | | | 2,646,892 | | | | 3,555,423 | | | | 2,052,633 | | | | 1,502,790 | | | | 4,621,338 | | | | 160,582 | |
| (*) | Corresponds to consolidated information of TAM S.A. and Subsidiaries |
| | | Statement of financial position as of December 31, 2016 | | | Results for the period
ended December 31, 2016 | |
| | | Total | | | Current | | | Non-current | | | Total | | | Current | | | Non-current | | | | | | Net | |
| Name of significant subsidiary | | Assets | | | Assets | | | Assets | | | Liabilities | | | Liabilities | | | Liabilities | | | Revenue | | | Income | |
| | | ThUS$ | | | ThUS$ | | | ThUS$ | | | ThUS$ | | | ThUS$ | | | ThUS$ | | | ThUS$ | | | ThUS$ | |
| | | | | | | | | | | | | | | | | | | | | | | | | |
| Lan Perú S.A. | | | 306,111 | | | | 283,691 | | | | 22,420 | | | | 294,912 | | | | 293,602 | | | | 1,310 | | | | 967,787 | | | | (2,164 | ) |
| Lan Cargo S.A. | | | 480,908 | | | | 144,309 | | | | 336,599 | | | | 239,728 | | | | 211,395 | | | | 28,333 | | | | 266,296 | | | | (24,813 | ) |
| Lan Argentina S.A. | | | 216,331 | | | | 194,306 | | | | 22,025 | | | | 200,172 | | | | 197,330 | | | | 2,842 | | | | 371,896 | | | | (29,572 | ) |
| Transporte Aéreo S.A. | | | 340,940 | | | | 36,986 | | | | 303,954 | | | | 124,805 | | | | 59,668 | | | | 65,137 | | | | 297,247 | | | | 8,206 | |
| Aerolane Líneas Aéreas Nacionales del Ecuador S.A. | | | 89,667 | | | | 56,064 | | | | 33,603 | | | | 81,101 | | | | 75,985 | | | | 5,116 | | | | 219,676 | | | | (1,281 | ) |
| Aerovías de Integración Regional, AIRES S.A. | | | 129,734 | | | | 55,132 | | | | 74,602 | | | | 85,288 | | | | 74,160 | | | | 11,128 | | | | 277,503 | | | | (13,675 | ) |
| TAM S.A. (*) | | | 5,287,286 | | | | 1,794,189 | | | | 3,493,097 | | | | 4,710,308 | | | | 2,837,620 | | | | 1,872,688 | | | | 4,145,951 | | | | 2,107 | |
| | | Statement of financial position as of December 31, 2015 | | | Results for the period
ended December 31, 2015 | |
| | | Total | | | Current | | | Non-current | | | Total | | | Current | | | Non-current | | | | | | Net | |
| Name of significant subsidiary | | Assets | | | Assets | | | Assets | | | Liabilities | | | Liabilities | | | Liabilities | | | Revenue | | | Income | |
| | | ThUS$ | | | ThUS$ | | | ThUS$ | | | ThUS$ | | | ThUS$ | | | ThUS$ | | | ThUS$ | | | ThUS$ | |
| | | | | | | | | | | | | | | | | | | | | | | | | |
| Lan Perú S.A. | | | 255,691 | | | | 232,547 | | | | 23,144 | | | | 240,938 | | | | 239,521 | | | | 1,417 | | | | 1,078,992 | | | | 5,068 | |
| Lan Cargo S.A. | | | 483,033 | | | | 159,294 | | | | 323,739 | | | | 217,037 | | | | 147,423 | | | | 69,614 | | | | 278,117 | | | | (74,408 | ) |
| Lan Argentina S.A. | | | 195,756 | | | | 180,558 | | | | 15,198 | | | | 170,384 | | | | 168,126 | | | | 2,258 | | | | 443,317 | | | | 9,432 | |
| Transporte Aéreo S.A. | | | 331,117 | | | | 41,756 | | | | 289,361 | | | | 122,666 | | | | 44,495 | | | | 78,171 | | | | 324,464 | | | | 5,878 | |
| Aerolane Líneas Aéreas Nacionales del Ecuador S.A. | | | 126,001 | | | | 80,641 | | | | 45,360 | | | | 116,153 | | | | 111,245 | | | | 4,908 | | | | 246,402 | | | | (1,278 | ) |
| Aerovías de Integración Regional, AIRES S.A. | | | 130,039 | | | | 62,937 | | | | 67,102 | | | | 75,003 | | | | 64,829 | | | | 10,174 | | | | 291,354 | | | | (34,079 | ) |
| TAM S.A. (*) | | | 4,711,316 | | | | 1,350,377 | | | | 3,360,939 | | | | 4,199,223 | | | | 1,963,400 | | | | 2,235,823 | | | | 4,597,611 | | | | (183,812 | ) |
(*) Correspond to consolidated information of TAM S.A. and Subsidiaries.Equity
| | | | | | | As of | | | As of | | | As of | | | As of | |
| | | | | Country | | December 31, | | | December 31, | | | December 31, | | | December 31, | |
| | | Tax No. | | of origin | | 2019 | | | 2018 | | | 2019 | | | 2018 | |
| | | | | | | % | | | % | | | ThUS$ | | | ThUS$ | |
| | | | | | | | | | | | | | | | Restated | |
| Latam Airlines Perú S.A | | 0-E | | Peru | | | 30.00000 | | | | 30.00000 | | | | 2,609 | | | | 3,032 | |
| Lan Cargo S.A. and Subsidiaries | | 93.383.000-4 | | Chile | | | 0.10196 | | | | 0.10196 | | | | 369 | | | | (101 | ) |
| Inversora Cordillera S.A. and Subsidiaries | | 0-E | | Argentina | | | 0.01630 | | | | 0.13940 | | | | (6,276 | ) | | | 8,684 | |
| Lan Argentina S.A. | | 0-E | | Argentina | | | 0.02890 | | | | 0.02890 | | | | 50 | | | | (472 | ) |
| Americonsult de Guatemala S.A. | | 0-E | | Guatemala | | | 0.87000 | | | | 1.00000 | | | | 1 | | | | 1 | |
| Americonsult S.A. and Subsidiaries | | 0-E | | Mexico | | | 0.20000 | | | | 0.20000 | | | | (7 | ) | | | 1 | |
| Americonsult Costa Rica S.A. | | 0-E | | Costa Rica | | | 0.20000 | | | | 1.00000 | | | | 2 | | | | 11 | |
| Linea Aérea Carguera de Colombiana S.A. | | 0-E | | Colombia | | | 10.00000 | | | | 10.00000 | | | | (755 | ) | | | (462 | ) |
| Aerolíneas Regionales de Integración Aires S.A. | | 0-E | | Colombia | | | 0.79880 | | | | 0.79880 | | | | 899 | | | | 378 | |
| Transportes Aereos del Mercosur S.A. | | 0-E | | Paraguay | | | 5.02000 | | | | 5.02000 | | | | 1,503 | | | | 1,740 | |
| Multiplus S.A.(*) | | 0-E | | Brazil | | | - | | | | 27.26000 | | | | - | | | | 67,096 | |
| Total | | | | | | | | | | | | | | | (1,605 | ) | | | 79,908 | |
(b) Non-controlling interestIncomes
| | | | | | | As of | | As of | | As of | | As of | | | | | | | For the year ended | | | For the year ended | |
| | | | | Country | | December 31, | | December 31, | | December 31, | | December 31, | | | | | Country | | December 31, | | December 31, | | December 31, | | December 31, | |
| Equity | | Tax No. | | of origin | | 2017 | | 2016 | | 2017 | | 2016 | | |
| | | | | | | % | | % | | ThUS$ | | ThUS$ | | | Tax No. | | of origin | | 2019 | | | 2018 | | | 2017 | | | 2019 | | | 2018 | | | 2017 | |
| | | | | | | | | | | | | | | | | | | | % | | % | | % | | ThUS$ | | ThUS$ | | ThUS$ | |
| Lan Perú S.A | | 0-E | | Peru | | | 30.00000 | | | | 30.00000 | | | | 3,722 | | | | 3,360 | | |
| | | | | | | | | | | | | | | | | | | |
| Latam Airlines Perú S.A | | | 0-E | | Peru | | | 30.00000 | | | | 30.00000 | | | | 30.00000 | | | | (1,065 | ) | | | 1,673 | | | | 360 | |
| Lan Cargo S.A. and Subsidiaries | | 93.383.000-4 | | Chile | | | 0.10196 | | | | 0.10196 | | | | 849 | | | | 957 | | | 93.383.000-4 | | Chile | | | 0.10196 | | | | 0.10196 | | | | 0.10196 | | | | 19 | | | | (406 | ) | | | (4 | ) |
| Promotora Aérea Latinoamericana S.A. and Subsidiaries | | 0-E | | Mexico | | | 51.00000 | | | | 51.00000 | | | | 4,578 | | | | 3,162 | | |
| Promotora Aerea Latinoamericana S.A. and Subsidiaries | | | 0-E | | Mexico | | | - | | | | - | | | | 51.00000 | | | | - | | | | - | | | | 1,416 | |
| Inversora Cordillera S.A. and Subsidiaries | | 0-E | | Argentina | | | 0,13940 | | | | 0.70422 | | | | 3,502 | | | | 515 | | | 0-E | | Argentina | | | 0.01630 | | | | 0.13940 | | | | 0.13940 | | | | 359 | | | | 66 | | | | 117 | |
| Lan Argentina S.A. | | 0-E | | Argentina | | | 0,02842 | | | | 0.13440 | | | | 79 | | | | (311 | ) | | 0-E | | Argentina | | | 0.02890 | | | | 0.02890 | | | | 0.02842 | | | | 48 | | | | 39 | | | | 24 | |
| Americonsult de Guatemala S.A. | | 0-E | | Guatemala | | | 1.00000 | | | | 1.00000 | | | | 1 | | | | 1 | | |
| Americonsult Costa Rica S.A. | | 0-E | | Costa Rica | | | 1.00000 | | | | 1.00000 | | | | 12 | | | | 12 | | |
| Americonsult S.A. and Subsidiaries | | | 0-E | | Mexico | | | 0.20000 | | | | 0.20000 | | | | 0.20000 | | | | (7 | ) | | | 2 | | | | - | |
| Linea Aérea Carguera de Colombiana S.A. | | 0-E | | Colombia | | | 10.00000 | | | | 10.00000 | | | | (520 | ) | | | (905 | ) | | 0-E | | Colombia | | | 10.00000 | | | | 10.00000 | | | | 10.00000 | | | | (293 | ) | | | 58 | | | | 398 | |
| Aerolíneas Regionales de Integración Aires S.A. | | 0-E | | Colombia | | | 0.80944 | | | | 0.80944 | | | | 461 | | | | 436 | | | 0-E | | Colombia | | | 0.79880 | | | | 0.79880 | | | | 0.80944 | | | | (24 | ) | | | 87 | | | | 4 | |
| Transportes Aereos del Mercosur S.A. | | 0-E | | Paraguay | | | 5.02000 | | | | 5.02000 | | | | 1,324 | | | | 1,104 | | | 0-E | | Paraguay | | | 5.02000 | | | | 5.02000 | | | | 5.02000 | | | | 420 | | | | 717 | | | | 299 | |
| Multiplus S.A. | | 0-E | | Brazil | | | 27.26000 | | | | 27.26000 | | | | 77,139 | | | | 80,313 | | |
| Multiplus S.A.(*) | | | 0-E | | Brazil | | | - | | | | 27.26000 | | | | 27.26000 | | | | 5,726 | | | | 29,739 | | | | 42,796 | |
| Total | | | | | | | | | | | | | | | 91,147 | | | | 88,644 | | | | | | | | | | | | | | | | | | | | 5,183 | | | | 31,975 | | | | 45,410 | |
| | | | | | | As of | | | As of | | | As of | | | For the period ended | |
| | | | | Country | | December 31, | | | December 31, | | | December 31, | | | December 31, | |
| Incomes | | Tax No. | | of origin | | 2017 | | | 2016 | | | 2015 | | | 2017 | | | 2016 | | | 2015 | |
| | | | | | | % | | | % | | | % | | | ThUS$ | | | ThUS$ | | | ThUS$ | |
| | | | | | | | | | | | | | |
| Lan Perú S.A | | 0-E | | Peru | | | 30.00000 | | | | 30.00000 | | | | 30.00000 | | | | 360 | | | | (649 | ) | | | 1,521 | |
| Lan Cargo S.A. and Subsidiaries | | 93.383.000-4 | | Chile | | | 0.10196 | | | | 0.10196 | | | | 0.10605 | | | | (4 | ) | | | (7 | ) | | | (69 | ) |
| Promotora Aerea Latinoamericana S.A. and Subsidiaries | | 0-E | | Mexico | | | 51.00000 | | | | 51.00000 | | | | 51.00000 | | | | 1,416 | | | | 96 | | | | 1,349 | |
| Inversora Cordillera S.A. and Subsidiaries | | 0-E | | Argentina | | | 0,13940 | | | | 0.70422 | | | | 0.70422 | | | | 117 | | | | 364 | | | | 281 | |
| Lan Argentina S.A. | | 0-E | | Argentina | | | 0,02842 | | | | 0.13440 | | | | 1.00000 | | | | 24 | | | | 77 | | | | 61 | |
| Americonsult de Guatemala S.A. | | 0-E | | Guatemala | | | 1.00000 | | | | 1.00000 | | | | 1.00000 | | | | - | | | | (4 | ) | | | 1 | |
| Americonsult Costa Rica S.A. | | 0-E | | Costa Rica | | | 1.00000 | | | | 1.00000 | | | | 1.00000 | | | | - | | | | - | | | | 5 | |
| Linea Aérea Carguera de Colombiana S.A. | | 0-E | | Colombia | | | 10.00000 | | | | 10.00000 | | | | 10.00000 | | | | 398 | | | | (106 | ) | | | 14 | |
| Aerolíneas Regionales de Integración Aires S.A. | | 0-E | | Colombia | | | 0.80944 | | | | 0.80944 | | | | 0.98307 | | | | 4 | | | | (140 | ) | | | (335 | ) |
| Transportes Aereos del Mercosur S.A. | | 0-E | | Paraguay | | | 5.02000 | | | | 5.02000 | | | | 5.02000 | | | | 299 | | | | 146 | | | | 431 | |
| Multiplus S.A. | | 0-E | | Brazil | | | 27.26000 | | | | 27.26000 | | | | 27.26000 | | | | 42,796 | | | | 41,673 | | | | 37,283 | |
| Total | | | | | | | | | | | | | | | | | | | 45,410 | | | | 41,450 | | | | 40,542 | |
NOTE 15 - INTANGIBLE ASSETS OTHER THAN GOODWILL
The details of intangible assets are as follows:
| | | Classes of intangible assets | | | Classes of intangible assets | |
| | | (net) | | | (gross) | |
| | | As of | | | As of | | | As of | | | As of | |
| | | December 31, | | | December 31, | | | December 31, | | | December 31, | |
| | | 2017 | | | 2016 | | | 2017 | | | 2016 | |
| | | ThUS$ | | | ThUS$ | | | ThUS$ | | | ThUS$ | |
| | | | | | | | | | | | | |
| Airport slots | | | 964,513 | | | | 978,849 | | | | 964,513 | | | | 978,849 | |
| Loyalty program | | | 321,440 | | | | 326,262 | | | | 321,440 | | | | 326,262 | |
| Computer software | | | 160,970 | | | | 157,016 | | | | 509,377 | | | | 419,652 | |
| Developing software | | | 123,415 | | | | 91,053 | | | | 123,415 | | | | 91,053 | |
| Trademarks (1) | | | 46,909 | | | | 57,133 | | | | 62,539 | | | | 63,730 | |
| Other assets | | | - | | | | - | | | | - | | | | 808 | |
| Total | | | 1,617,247 | | | | 1,610,313 | | | | 1,981,284 | | | | 1,880,354 | |
| | | Classes of intangible assets | | | Classes of intangible assets | |
| | | (net) | | | (gross) | |
| | | As of | | | As of | | | As of | | | As of | |
| | | December 31, | | | December 31, | | | December 31, | | | December 31, | |
| | | 2019 | | | 2018 | | | 2019 | | | 2018 | |
| | | ThUS$ | | | ThUS$ | | | ThUS$ | | | ThUS$ | |
| Airport slots | | | 845,959 | | | | 828,969 | | | | 845,959 | | | | 828,969 | |
| Loyalty program | | | 263,806 | | | | 274,420 | | | | 263,806 | | | | 274,420 | |
| Computer software | | | 220,993 | | | | 156,038 | | | | 656,699 | | | | 529,009 | |
| Developing software | | | 99,193 | | | | 151,853 | | | | 99,193 | | | | 151,853 | |
| Trademarks (1) | | | 17,959 | | | | 29,361 | | | | 51,326 | | | | 53,391 | |
| Other assets | | | 331 | | | | 431 | | | | 1,315 | | | | 1,325 | |
| Total | | | 1,448,241 | | | | 1,441,072 | | | | 1,918,298 | | | | 1,838,967 | |
Movement in Intangible assets other than goodwill:
| | | Computer | | | | | | | | | Trademarks | | | | |
| | | software | | | Developing | | | Airport | | | and loyalty | | | | |
| | | Net | | | software | | | slots (2) | | | program (1) (2) | | | Total | |
| | | ThUS$ | | | ThUS$ | | | ThUS$ | | | ThUS$ | | | ThUS$ | |
| | | | | | | | | | | | | | | | |
| Opening balance as of January 1, 2015 | | | 126,797 | | | | 74,050 | | | | 1,201,028 | | | | 478,204 | | | | 1,880,079 | |
| Additions | | | 4,954 | | | | 48,270 | | | | - | | | | - | | | | 53,224 | |
| Withdrawals | | | (4,612 | ) | | | (162 | ) | | | - | | | | (1 | ) | | | (4,775 | ) |
| Transfer software | | | 28,726 | | | | (30,426 | ) | | | - | | | | - | | | | (1,700 | ) |
| Foreing exchange | | | (14,871 | ) | | | (16,845 | ) | | | (384,041 | ) | | | (152,910 | ) | | | (568,667 | ) |
| Amortization | | | (36,736 | ) | | | - | | | | - | | | | - | | | | (36,736 | ) |
| Closing balance as of December 31, 2015 | | | 104,258 | | | | 74,887 | | | | 816,987 | | | | 325,293 | | | | 1,321,425 | |
| | | | | | | | | | | | | | | | | | | | | |
| Opening balance as of January 1, 2016 | | | 104,258 | | | | 74,887 | | | | 816,987 | | | | 325,293 | | | | 1,321,425 | |
| Additions | | | 6,688 | | | | 83,672 | | | | - | | | | - | | | | 90,360 | |
| Withdrawals | | | (736 | ) | | | (191 | ) | | | - | | | | - | | | | (927 | ) |
| Transfer software | | | 85,029 | | | | (74,376 | ) | | | - | | | | - | | | | 10,653 | |
| Foreing exchange | | | 5,689 | | | | 7,061 | | | | 161,862 | | | | 64,447 | | | | 239,059 | |
| Amortization | | | (43,912 | ) | | | - | | | | - | | | | (6,345 | ) | | | (50,257 | ) |
| Closing balance as of December 31, 2016 | | | 157,016 | | | | 91,053 | | | | 978,849 | | | | 383,395 | | | | 1,610,313 | |
| | | | | | | | | | | | | | | | | | | | | |
| Opening balance as of January 1, 2017 | | | 157,016 | | | | 91,053 | | | | 978,849 | | | | 383,395 | | | | 1,610,313 | |
| Additions | | | 8,453 | | | | 78,880 | | | | - | | | | - | | | | 87,333 | |
| Withdrawals | | | (244 | ) | | | (684 | ) | | | - | | | | - | | | | (928 | ) |
| Transfer software | | | 45,783 | | | | (45,580 | ) | | | - | | | | - | | | | 203 | |
| Foreing exchange | | | (1,215 | ) | | | (254 | ) | | | (14,336 | ) | | | (5,459 | ) | | | (21,264 | ) |
| Amortization | | | (48,823 | ) | | | - | | | | - | | | | (9,587 | ) | | | (58,410 | ) |
| Closing balance as of December 31, 2017 | | | 160,970 | | | | 123,415 | | | | 964,513 | | | | 368,349 | | | | 1,617,247 | |
| | | Computer
software
Net | | | Developing
software | | | Airport
slots (2) | | | Trademarks
and loyalty
program (1) ( 2) | | | Total | |
| | | ThUS$ | | | ThUS$ | | | ThUS$ | | | ThUS$ | | | ThUS$ | |
| Opening balance as of January 1, 2017 | | | 157,016 | | | | 91,053 | | | | 978,849 | | | | 383,395 | | | | 1,610,313 | |
| Additions | | | 8,453 | | | | 78,880 | | | | - | | | | - | | | | 87,333 | |
| Withdrawals | | | (244 | ) | | | (684 | ) | | | - | | | | - | | | | (928 | ) |
| Transfer software | | | 45,783 | | | | (45,580 | ) | | | - | | | | - | | | | 203 | |
| Foreign exchange | | | (1,215 | ) | | | (254 | ) | | | (14,336 | ) | | | (5,459 | ) | | | (21,264 | ) |
| Amortization | | | (48,823 | ) | | | - | | | | - | | | | (9,587 | ) | | | (58,410 | ) |
| Closing balance as of December 31, 2017 | | | 160,970 | | | | 123,415 | | | | 964,513 | | | | 368,349 | | | | 1,617,247 | |
| | | | | | | | | | | | | | | | | | | | | |
| Opening balance as of January 1, 2018 | | | 160,970 | | | | 123,415 | | | | 964,513 | | | | 368,349 | | | | 1,617,247 | |
| Additions | | | 791 | | | | 94,301 | | | | - | | | | - | | | | 95,092 | |
| Withdrawals | | | (403 | ) | | | (125 | ) | | | - | | | | - | | | | (528 | ) |
| Transfer software | | | 59,771 | | | | (61,087 | ) | | | - | | | | - | | | | (1,316 | ) |
| Foreign exchange | | | (10,231 | ) | | | (4,651 | ) | | | (135,544 | ) | | | (53,522 | ) | | | (203,948 | ) |
| Amortization | | | (54,549 | ) | | | - | | | | - | | | | (11,046 | ) | | | (65,595 | ) |
| Adjustment application IAS 29 by hyperinflation Argentina | | | 120 | | | | - | | | | - | | | | - | | | | 120 | |
| Closing balance as of December 31, 2018 | | | 156,469 | | | | 151,853 | | | | 828,969 | | | | 303,781 | | | | 1,441,072 | |
| | | | | | | | | | | | | | | | | | | | | |
| Opening balance as of January 1, 2019 | | | 156,469 | | | | 151,853 | | | | 828,969 | | | | 303,781 | | | | 1,441,072 | |
| Additions | | | 278 | | | | 91,371 | | | | 47,587 | | | | - | | | | 139,236 | |
| Withdrawals | | | (270 | ) | | | (1,123 | ) | | | - | | | | - | | | | (1,393 | ) |
| Transfer software | | | 136,935 | | | | (140,102 | ) | | | - | | | | - | | | | (3,167 | ) |
| Foreign exchange | | | (1,981 | ) | | | (2,806 | ) | | | (30,597 | ) | | | (11,612 | ) | | | (46,996 | ) |
| Amortization | | | (70,107 | ) | | | - | | | | - | | | | (10,404 | ) | | | (80,511 | ) |
| Closing balance as of December 31, 2019 | | | 221,324 | | | | 99,193 | | | | 845,959 | | | | 281,765 | | | | 1,448,241 | |
| (1)1) | In 2016, after the extensive work of integration after the association between LAN and TAM, during which there has been solid progress in the homologation of the optimization processes of its air connections, in addition to the restructuring and modernization of the fleet of aircraft, the Company has resolved to adopt a unique name and identity, and announceannounced that the group’s brand of the group will be LATAM, ", which would uniteunited all the companies under a single image. |
Given the above, we have proceeded to review the brands useful life, concluding that these should go from an indefinite to defined useful life. The estimatedestimate of the new useful life is 5 years, equivalent to the period for finishing allnecessary to complete the image changes necessary.change of image.
The amortization of theeach period is shownrecognized in the consolidated income statement of income in the administrative expenses. The accumulatedcumulative amortization of computer programs and brands as of December 31, 2017,2019, amounts to ThUS$ 373,463 (ThUS$ 270,041 atThUS $ 470,057 (ThUS $ 397,895 as of December 31, 2016)2018).
NOTE 16 – GOODWILL
The Goodwill amount atas of December 31, 2017 is ThUS$ 2,672,550 (ThUS$ 2,710,382 at2019, amounts to ThUS $ 2,209,576 (ThUS $ 2,294,072 as of December 31, 2016 and ThUS$ 2,280,575 at December 31, 2015)2018). The goodwill movement, separated by CGU, includes the following:
Movement of Goodwill, separated by CGU it includes the following:CGU:
| | | | | Coalition | | | | |
| Movement of Goodwill, separated by CGU: | | | | and loyalty | | | | |
| | | Air | | program | | | | | Air
Transport | | | Coalition
and loyalty
program
Multiplus | | | Total | |
| | | Transport | | Multiplus | | Total | | | ThUS$ | | ThUS$ | | ThUS$ | |
| | | ThUS$ | | ThUS$ | | ThUS$ | | |
| | | | | | | | | |
| Opening balance as of January 1, 2015 | | | 2,658,503 | | | | 654,898 | | | | 3,313,401 | | |
| Increase (decrease) due to exchange rate differences | | | (823,415 | ) | | | (209,411 | ) | | | (1,032,826 | ) | |
| Closing balance as of December 31, 2015 | | | 1,835,088 | | | | 445,487 | | | | 2,280,575 | | |
| Opening balance as of January 1, 2016 | | | 1,835,088 | | | | 445,487 | | | | 2,280,575 | | |
| Increase (decrease) due to exchange rate differences | | | 341,813 | | | | 88,261 | | | | 430,074 | | |
| Others | | | (267 | ) | | | - | | | | (267 | ) | |
| Closing balance as of December 31, 2016 | | | 2,176,634 | | | | 533,748 | | | | 2,710,382 | | |
| Opening balance as of January 1, 2017 | | | 2,176,634 | | | | 533,748 | | | | 2,710,382 | | | | 2,176,634 | | | | 533,748 | | | | 2,710,382 | |
| Increase (decrease) due to exchange rate differences | | | (29,942 | ) | | | (7,890 | ) | | | (37,832 | ) | | | (29,942 | ) | | | (7,890 | ) | | | (37,832 | ) |
| Others | | | - | | | | - | | | | - | | | | - | | | | - | | | | - | |
| Closing balance as of December 31, 2017 | | | 2,146,692 | | | | 525,858 | | | | 2,672,550 | | | | 2,146,692 | | | | 525,858 | | | | 2,672,550 | |
| Opening balance as of January 1, 2018 | | | | 2,146,692 | | | | 525,858 | | | | 2,672,550 | |
| Increase (decrease) due to exchange rate differences | | | | (300,203 | ) | | | (76,922 | ) | | | (377,125 | ) |
| Adjustment IAS 29, hyperinflation Argentina | | | | 335 | | | | - | | | | 335 | |
| Others | | | | (1,688 | ) | | | - | | | | (1,688 | ) |
| Closing balance as of December 31, 2018 | | | | 1,845,136 | | | | 448,936 | | | | 2,294,072 | |
| Opening balance as of January 1, 2019 | | | | 1,845,136 | | | | 448,936 | | | | 2,294,072 | |
| Increase (decrease) due to exchange rate differences | | | | (67,133 | ) | | | (17,363 | ) | | | (84,496 | ) |
| Transfer from Multiplus S.A. (see nota 1) | | | | 431,573 | | | | (431,573 | ) | | | - | |
| Closing balance as of December 31, 2019 | | | | 2,209,576 | | | | - | | | | 2,209,576 | |
As of December 31, 2019, the Company maintains only the CGU “Air Transport”, due to the merger of Multiplus S.A. in TAM Linhas Aereas (see Note 1), and changes in the management structure.
The Company has two cash- generating units (CGUs),CGU “Air transportation” and, “Coalition and loyalty program Multiplus”. The CGU "Air transport"transport” considers the transport of passengers and cargo, both in the domestic markets of Chile, Peru, Argentina, Colombia, Ecuador and Brazil, andas well as in a developed series of regional and international routes in America, Europe and Oceania, while the CGU "Coalition and loyalty program Multiplus” works with an integrated network associated companies in Brazil.Oceania.
The recoverable amountsamount of cash-generating units havethe CGU has been determined based on value-in-use calculations. Thesethe value in use calculations which require the use of expectedassumptions. These calculations use cash flows,flow projections covering a 5 years after tax,year period which areis based on the budgetfinancial budgets approved by the Board.management. Cash flows beyond the budget5 year period are extrapolated using the estimated revenue growth rates and average volumes, which do not exceed the average rates of long-term growth.revenue growth rates.
Management establishManagement’s cash flow projections included significant judgements and assumptions related to annual revenue growth rates, fordiscount rate, inflation rates, the exchange rate and price of fuel. The annual growth, discount, inflation and exchange for each cash generating, as well as fuel prices, based on their key assumptions. The annualrevenue growth rate is based on past performance and management'smanagement’s expectations overof market developmentsdevelopment in each country whereof the countries in which it operates. The discount rates used, are in American Dollars for the CGU "Air transportation" and Brazilian Reals for CGU "Program coalition loyalty Multiplus"“Air transport”, bothare in determined in US dollars, after taxes, and reflect specific risks related to the relevant countries of each country whereof the Company operates.operations. Inflation rates and exchange rates are based on the data available data for each countryfrom the countries and the information provided by the Central Bank of each country,the various countries where it operates, and the price of fuel price is determined based on estimated levels of production, levels,the competitive environment of the market in which they operate and its businesstheir commercial strategy.
As of December 31, 20172019 the recoverable values were determined using the following assumptions presented below:
| | | | | Air transportation | | Coalition and loyalty |
| | | | | CGU | | program Multiplus CGU (2) |
| Annual growth rate (Terminal) | | % | | 1.0 - 2.0 | | 4.0 - 5.0 |
| Exchange rate (1) | | R$/US$ | | 3.34.0 - 3.9 | | 3.3 - 3.94.9 |
| Discount rate based on the weighted average cost of capital (WACC) | | % | | 7.557.50 - 8.55 | | - |
Discount rate based on cost of equity (Ke) | | % | | - | | 12.4 - 13.48.50 |
| Fuel Price from futures price curves commodities markets | | US$/barrel | | 73-78 | | 79 - 80 |
(1) In line with the expectations of the Central Bank of Brazil
(2) The flow, as well as annual growth rte and discount, are denominated in real.
The result of the impairment test, which includes a sensitivity analysis of theits main variables, showed that the estimated recoverable amount is higher thanexceeded the carrying valueamount of the book value of net assets allocated to the cash generating unit, and therefore no impairment was not detected.
CGU´s areThe calculation of the recoverable value of the CGU is most sensitive to rates for annual revenue growth rates, discount and exchangesexchange rates. The sensitivity analysis included the individual impact of changes inthe variations of the critical estimates critical inwhen determining the recoverable amounts, namely:
| | | | | | | | | Decrease | |
| | | Increase | | | Increase | | | Minimum | |
| | | Maximum | | | Maximum | | | terminal | |
| | | WACC | | | CoE | | | growth rate | |
| | | % | | | % | | | % | |
| Air transportation CGU | | | 8.55 | | | | - | | | | 1.0 | |
| Coalition and loyalty program Multiplus CGU | | | - | | | | 13.4 | | | | 4.0 | |
| | | | | Decrease |
| | | Increase | | Minimum |
| | | Maximum | | terminal |
| | | WACC | | growth rate |
| | | % | | % |
| | | | | |
| Air transportation CGU | | 8.5 | | 1.0 |
In none of the previous cases there was an impairment inof the cash-cash generating unit was presented.unit.
NOTE 17 - PROPERTY, PLANT AND EQUIPMENT
The compositionbycategory of Property, plant and equipment is as follows:
| | | Gross Book Value | | | Acumulated depreciation | | | Net Book Value | |
| | | As of | | | As of | | | As of | | | As of | | | As of | | | As of | |
| | | December 31, | | | December 31, | | | December 31, | | | December 31, | | | December 31, | | | December 31, | |
| | | 2017 | | | 2016 | | | 2017 | | | 2016 | | | 2017 | | | 2016 | |
| | | ThUS$ | | | ThUS$ | | | ThUS$ | | | ThUS$ | | | ThUS$ | | | ThUS$ | |
| | | | | | | | | | | | | | | | | | | |
| Construction in progress (*) | | | 556,822 | | | | 470,065 | | | | - | | | | - | | | | 556,822 | | | | 470,065 | |
| Land | | | 49,780 | | | | 50,148 | | | | - | | | | - | | | | 49,780 | | | | 50,148 | |
| Buildings | | | 190,552 | | | | 190,771 | | | | (66,004 | ) | | | (60,552 | ) | | | 124,548 | | | | 130,219 | |
| Plant and equipment | | | 9,222,540 | | | | 10,099,587 | | | | (2,390,142 | ) | | | (2,350,045 | ) | | | 6,832,398 | | | | 7,749,542 | |
| Own aircraft | | | 8,544,185 | | | | 9,436,684 | | | | (2,138,612 | ) | | | (2,123,025 | ) | | | 6,405,573 | | | | 7,313,659 | |
| Other (**) | | | 678,355 | | | | 662,903 | | | | (251,530 | ) | | | (227,020 | ) | | | 426,825 | | | | 435,883 | |
| Machinery | | | 39,084 | | | | 39,246 | | | | (29,296 | ) | | | (26,821 | ) | | | 9,788 | | | | 12,425 | |
| Information technology equipment | | | 166,713 | | | | 163,695 | | | | (136,557 | ) | | | (123,981 | ) | | | 30,156 | | | | 39,714 | |
| Fixed installations and accessories | | | 186,989 | | | | 178,363 | | | | (106,212 | ) | | | (94,451 | ) | | | 80,777 | | | | 83,912 | |
| Motor vehicles | | | 70,290 | | | | 96,808 | | | | (58,812 | ) | | | (67,855 | ) | | | 11,478 | | | | 28,953 | |
| Leasehold improvements | | | 186,679 | | | | 192,100 | | | | (102,454 | ) | | | (87,559 | ) | | | 84,225 | | | | 104,541 | |
| Other property, plants and equipment | | | 3,640,838 | | | | 3,005,981 | | | | (1,355,475 | ) | | | (1,177,351 | ) | | | 2,285,363 | | | | 1,828,630 | |
| Financial leasing aircraft | | | 3,551,041 | | | | 2,905,556 | | | | (1,328,421 | ) | | | (1,152,190 | ) | | | 2,222,620 | | | | 1,753,366 | |
| Other | | | 89,797 | | | | 100,425 | | | | (27,054 | ) | | | (25,161 | ) | | | 62,743 | | | | 75,264 | |
| Total | | | 14,310,287 | | | | 14,486,764 | | | | (4,244,952 | ) | | | (3,988,615 | ) | | | 10,065,335 | | | | 10,498,149 | |
(*) As of December 31, 2017, includes pre-delivery payments to aircraft manufacturers for ThUS$ 543,720 (ThUS$ 434,250 as of December 31, 2016)
(**) Mainly considers rotable and tools.
(a) Movement in the different categories of Property, plant and equipment:follows:
| | | | | | | | | | | | | | | | | | | | | | | | | | | | | Other | | | | |
| | | | | | | | | | | | | | | | | Information | | | Fixed | | | | | | | | | property, | | | Property, | |
| | | | | | | | | | | | Plant and | | | | | technology | | | installations | | | Motor | | | Leasehold | | | plant and | | | Plant and | |
| | | Construction | | | | | | Buildings | | | equipment | | | | | equipment | | | & accessories | | | vehicles | | | improvements | | | equipment | | | equipment | |
| | | in progress | | | Land | | | net | | | net | | | | | net | | | net | | | net | | | net | | | net | | | net | |
| | | ThUS$ | | | ThUS$ | | | ThUS$ | | | ThUS$ | | | | | ThUS$ | | | ThUS$ | | | ThUS$ | | | ThUS$ | | | ThUS$ | | | ThUS$ | |
| | | | | | | | | | | | | | | | | | | | | | | | | | | | | | | | | |
| Opening balance as of January 1, 2015 | | | 937,279 | | | | 57,988 | | | | 167,006 | | | | 6,954,089 | | | | | | 51,009 | | | | 43,783 | | | | 1,965 | | | | 56,523 | | | | 2,503,434 | | | | 10,773,076 | |
| Additions | | | 39,711 | | | | - | | | | 439 | | | | 1,304,199 | | | | | | 15,322 | | | | 1,692 | | | | 280 | | | | 13,188 | | | | 64,226 | | | | 1,439,057 | |
| Disposals | | | - | | | | - | | | | (500 | ) | | | (76,675 | ) | | (1) | | | (27 | ) | | | - | | | | (8 | ) | | | - | | | | (11 | ) | | | (77,221 | ) |
| Retirements | | | (1,262 | ) | | | - | | | | (956 | ) | | | (38,240 | ) | | | | | (104 | ) | | | (476 | ) | | | (4 | ) | | | - | | | | (8,902 | ) | | | (49,944 | ) |
| Depreciation expenses | | | - | | | | - | | | | (7,161 | ) | | | (521,688 | ) | | | | | (16,196 | ) | | | (11,649 | ) | | | (378 | ) | | | (13,973 | ) | | | (174,474 | ) | | | (745,519 | ) |
| Foreing exchange | | | (932 | ) | | | (11,786 | ) | | | (18,248 | ) | | | (129,933 | ) | | | | | (6,126 | ) | | | (13,269 | ) | | | (638 | ) | | | (1,659 | ) | | | (252,709 | ) | | | (435,300 | ) |
| Other increases (decreases) | | | 168,016 | | | | (889 | ) | | | (49,089 | ) | | | (150,677 | ) | | | | | 11 | | | | 68,877 | | | | 308 | | | | 9 | | | | (2,058 | ) | | | 34,508 | |
| Changes, total | | | 205,533 | | | | (12,675 | ) | | | (75,515 | ) | | | 386,986 | | | | | | (7,120 | ) | | | 45,175 | | | | (440 | ) | | | (2,435 | ) | | | (373,928 | ) | | | 165,581 | |
| Closing balance as of December 31, 2015 | | | 1,142,812 | | | | 45,313 | | | | 91,491 | | | | 7,341,075 | | | | | | 43,889 | | | | 88,958 | | | | 1,525 | | | | 54,088 | | | | 2,129,506 | | | | 10,938,657 | |
| Opening balance as of January 1, 2016 | | | 1,142,812 | | | | 45,313 | | | | 91,491 | | | | 7,341,075 | | | | | | 43,889 | | | | 88,958 | | | | 1,525 | | | | 54,088 | | | | 2,129,506 | | | | 10,938,657 | |
| Additions | | | 14,481 | | | | - | | | | 272 | | | | 1,301,093 | | | | | | 7,392 | | | | 292 | | | | 6 | | | | 54,181 | | | | 13,013 | | | | 1,390,730 | |
| Disposals | | | - | | | | - | | | | - | | | | (16,918 | ) | | (2) | | | (59 | ) | | | - | | | | (32 | ) | | | - | | | | (2,972 | ) | | | (19,981 | ) |
| Retirements | | | (284 | ) | | | - | | | | (68 | ) | | | (39,816 | ) | | | | | (55 | ) | | | (1,258 | ) | | | - | | | | - | | | | (2,604 | ) | | | (44,085 | ) |
| Depreciation expenses | | | - | | | | - | | | | (6,234 | ) | | | (562,131 | ) | | | | | (14,909 | ) | | | (13,664 | ) | | | (293 | ) | | | (23,283 | ) | | | (124,038 | ) | | | (744,552 | ) |
| Foreing exchange | | | 5,081 | | | | 4,835 | | | | 2,538 | | | | 51,770 | | | | | | 2,924 | | | | 9,384 | | | | 223 | | | | 2,849 | | | | 93,383 | | | | 172,987 | |
| Other increases (decreases) | | | (692,025 | ) | | | - | | | | 42,220 | | | | (285,198 | ) | | (3) | | | 532 | | | | 200 | | | | (384 | ) | | | 16,706 | | | | (277,658 | ) | | | (1,195,607 | ) |
| Changes, total | | | (672,747 | ) | | | 4,835 | | | | 38,728 | | | | 448,800 | | | | | | (4,175 | ) | | | (5,046 | ) | | | (480 | ) | | | 50,453 | | | | (300,876 | ) | | | (440,508 | ) |
| Closing balance as of December 31, 2016 | | | 470,065 | | | | 50,148 | | | | 130,219 | | | | 7,789,875 | | | | | | 39,714 | | | | 83,912 | | | | 1,045 | | | | 104,541 | | | | 1,828,630 | | | | 10,498,149 | |
| Opening balance as of January 1, 2017 | | | 470,065 | | | | 50,148 | | | | 130,219 | | | | 7,789,875 | | | | | | 39,714 | | | | 83,912 | | | | 1,045 | | | | 104,541 | | | | 1,828,630 | | | | 10,498,149 | |
| Additions | | | 11,145 | | | | - | | | | - | | | | 258,615 | | | | | | 5,708 | | | | 329 | | | | 77 | | | | 8,156 | | | | 41,483 | | | | 325,513 | |
| Disposals | | | - | | | | - | | | | - | | | | (16,004 | ) | | | | | (6 | ) | | | (10 | ) | | | (43 | ) | | | - | | | | (27 | ) | | | (16,090 | ) |
| Retirements | | | (127 | ) | | | - | | | | (6 | ) | | | (24,341 | ) | | | | | (473 | ) | | | (497 | ) | | | - | | | | - | | | | (1,610 | ) | | | (27,054 | ) |
| Depreciation expenses | | | - | | | | - | | | | (7,946 | ) | | | (496,857 | ) | | | | | (14,587 | ) | | | (14,124 | ) | | | (187 | ) | | | (27,266 | ) | | | (204,237 | ) | | | (765,204 | ) |
| Foreing exchange | | | 107 | | | | (368 | ) | | | (275 | ) | | | (4,603 | ) | | | | | (183 | ) | | | (820 | ) | | | (8 | ) | | | (243 | ) | | | (5,113 | ) | | | (11,506 | ) |
| Other increases (decreases) | | | 75,632 | | | | - | | | | 2,556 | | | | (653,457 | ) | | | | | (17 | ) | | | 11,987 | | | | (448 | ) | | | (963 | ) | | | 626,237 | | | | 61,527 | |
| Changes, total | | | 86,757 | | | | (368 | ) | | | (5,671 | ) | | | (936,647 | ) | | | | | (9,558 | ) | | | (3,135 | ) | | | (609 | ) | | | (20,316 | ) | | | 456,733 | | | | (432,814 | ) |
| Closing balance as of December 31, 2017 | | | 556,822 | | | | 49,780 | | | | 124,548 | | | | 6,853,228 | | | | | | 30,156 | | | | 80,777 | | | | 436 | | | | 84,225 | | | | 2,285,363 | | | | 10,065,335 | |
| | | Gross Book Value | | | Accumulated depreciation | | | Net Book Value | |
| | | As of | | | As of | | | As of | | | As of | | | As of | | | As of | |
| | | December 31, | | | December 31, | | | December 31, | | | December 31, | | | December 31, | | | December 31, | |
| | | 2019 | | | 2018 | | | 2019 | | | 2018 | | | 2019 | | | 2018 | |
| | | ThUS$ | | | ThUS$ | | | ThUS$ | | | ThUS$ | | | ThUS$ | | | ThUS$ | |
| | | | | | Restated | | | | | | Restated | | | | | | Restated | |
| Construction in progress (1) | | | 372,589 | | | | 630,320 | | | | - | | | | - | | | | 372,589 | | | | 630,320 | |
| Land | | | 48,406 | | | | 45,424 | | | | - | | | | - | | | | 48,406 | | | | 45,424 | |
| Buildings | | | 133,488 | | | | 179,907 | | | | (58,626 | ) | | | (67,342 | ) | | | 74,862 | | | | 112,565 | |
| Plant and equipment | | | 13,993,044 | | | | 13,333,837 | | | | (4,630,001 | ) | | | (4,361,337 | ) | | | 9,363,043 | | | | 8,972,500 | |
| Own aircraft | | | 13,268,562 | | | | 12,595,223 | | | | (4,421,211 | ) | | | (4,096,975 | ) | | | 8,847,351 | | | | 8,498,248 | |
| Other (2) | | | 724,482 | | | | 738,614 | | | | (208,790 | ) | | | (264,362 | ) | | | 515,692 | | | | 474,252 | |
| Machinery | | | 33,658 | | | | 34,253 | | | | (28,441 | ) | | | (27,659 | ) | | | 5,217 | | | | 6,594 | |
| Information technology equipment | | | 161,992 | | | | 160,936 | | | | (141,216 | ) | | | (138,372 | ) | | | 20,776 | | | | 22,564 | |
| Fixed installations and accessories | | | 171,469 | | | | 182,629 | | | | (111,635 | ) | | | (111,620 | ) | | | 59,834 | | | | 71,009 | |
| Motor vehicles | | | 67,060 | | | | 69,653 | | | | (60,327 | ) | | | (60,531 | ) | | | 6,733 | | | | 9,122 | |
| Leasehold improvements | | | 234,249 | | | | 211,322 | | | | (135,789 | ) | | | (128,055 | ) | | | 98,460 | | | | 83,267 | |
| Right of use | | | 5,693,553 | | | | 4,987,953 | | | | (2,823,855 | ) | | | (2,439,509 | ) | | | 2,869,698 | | | | 2,548,444 | |
| Aircraft | | | 5,438,404 | | | | 4,761,529 | | | | (2,669,864 | ) | | | (2,305,195 | ) | | | 2,768,540 | | | | 2,456,334 | |
| Other assets | | | 255,149 | | | | 226,424 | | | | (153,991 | ) | | | (134,314 | ) | | | 101,158 | | | | 92,110 | |
| Total | | | 20,909,508 | | | | 19,836,234 | | | | (7,989,890 | ) | | | (7,334,425 | ) | | | 12,919,618 | | | | 12,501,809 | |
| (1) | During the first halfAs of 2015 three Airbus A340December 31, 2019, includes advances paid to aircraft were sold.manufacturers for ThUS$ 348,148 (ThUS$ 612,236 as of December 31, 2018) |
During the second half of 2015 seven Dash-200 aircraft were sold.
During the second half of 2015 two Airbus A319 aircraft were sold.
| (2) | During 2016 the sale of two Airbus A330 aircraft was materialized. |
| (3) | During 2016 the reclassification to non-current assets or groups of assets for disposal classified as held for sale (see Note 13) of two Airbus A319 aircraft, two Airbus A320 aircraft, six Airbus A330 aircraftConsider mainly rotables and two Boeing 777 aircraft was materialized.tools. |
| F-76a) | Movement in the different categories of Property, plant and equipment: |
(b) Composition of the fleet:
| | | | | | | | | | | | | | | Information | | | Fixed | | | | | | | | | | | | Property, | |
| | | | | | | | | | | | Plant and | | | technology | | | installations | | | Motor | | | Leasehold | | | Rights | | | Plant and | |
| | | Construction | | | | | | Buildings | | | equipment | | | equipment | | | & accessories | | | Vehicles | | | improvements | | | of use | | | equipment | |
| | | in progress | | | Land | | | net | | | net | | | net | | | net | | | net | | | net | | | net | | | net | |
| | | ThUS$ | | | ThUS$ | | | ThUS$ | | | ThUS$ | | | ThUS$ | | | ThUS$ | | | ThUS$ | | | ThUS$ | | | ThUS$ | | | ThUS$ | |
| | | | | | | | | | | | | | | | | | | | | | | | | | | | | | | |
| Opening balance as of January 1, 2017 Restated | | | 470,065 | | | | 50,148 | | | | 130,219 | | | | 9,618,505 | | | | 39,714 | | | | 83,912 | | | | 1,045 | | | | 104,541 | | | | 2,931,101 | | | | 13,429,250 | |
| Additions | | | 11,145 | | | | - | | | | - | | | | 300,098 | | | | 5,708 | | | | 329 | | | | 77 | | | | 8,156 | | | | 288,142 | | | | 613,655 | |
| Disposals | | | - | | | | - | | | | - | | | | (16,031 | ) | | | (6 | ) | | | (10 | ) | | | (43 | ) | | | - | | | | - | | | | (16,090 | ) |
| Retirements | | | (127 | ) | | | - | | | | (6 | ) | | | (25,951 | ) | | | (473 | ) | | | (497 | ) | | | - | | | | - | | | | - | | | | (27,054 | ) |
| Depreciation expenses | | | - | | | | - | | | | (7,946 | ) | | | (701,094 | ) | | | (14,587 | ) | | | (14,124 | ) | | | (187 | ) | | | (27,266 | ) | | | (375,510 | ) | | | (1,140,714 | ) |
| Foreign exchange | | | 107 | | | | (368 | ) | | | (275 | ) | | | (9,716 | ) | | | (183 | ) | | | (820 | ) | | | (8 | ) | | | (243 | ) | | | - | | | | (11,506 | ) |
| Other increases (decreases) | | | 75,632 | | | | - | | | | 2,556 | | | | (27,220 | ) | | | (17 | ) | | | 11,987 | | | | (448 | ) | | | (963 | ) | | | 21,584 | | | | 83,111 | |
| Changes, total | | | 86,757 | | | | (368 | ) | | | (5,671 | ) | | | (479,914 | ) | | | (9,558 | ) | | | (3,135 | ) | | | (609 | ) | | | (20,316 | ) | | | (65,784 | ) | | | (498,598 | ) |
| Closing balance as of December 31, 2017 | | | 556,822 | | | | 49,780 | | | | 124,548 | | | | 9,138,591 | | | | 30,156 | | | | 80,777 | | | | 436 | | | | 84,225 | | | | 2,865,317 | | | | 12,930,652 | |
| Opening balance as of January 1, 2018 Restated | | | 556,822 | | | | 49,780 | | | | 124,548 | | | | 9,138,591 | | | | 30,156 | | | | 80,777 | | | | 436 | | | | 84,225 | | | | 2,865,317 | | | | 12,930,652 | |
| Additions | | | 7,927 | | | | - | | | | - | | | | 635,367 | | | | 4,995 | | | | 64 | | | | 24 | | | | 20,410 | | | | 326,298 | | | | 995,085 | |
| Disposals | | | - | | | | (8 | ) | | | (1,412 | ) | | | (4,747 | ) | | | (30 | ) | | | (74 | ) | | | (14 | ) | | | - | | | | - | | | | (6,285 | ) |
| Retirements | | | (80 | ) | | | - | | | | (19 | ) | | | (63,774 | ) | | | (92 | ) | | | (27 | ) | | | - | | | | (4 | ) | | | - | | | | (63,996 | ) |
| Depreciation expenses | | | - | | | | - | | | | (6,219 | ) | | | (705,577 | ) | | | (11,677 | ) | | | (12,538 | ) | | | (146 | ) | | | (27,766 | ) | | | (391,138 | ) | | | (1,155,061 | ) |
| Foreign exchange | | | (714 | ) | | | (4,348 | ) | | | (4,244 | ) | | | (94,488 | ) | | | (1,819 | ) | | | (8,499 | ) | | | (28 | ) | | | (2,351 | ) | | | (13,751 | ) | | | (130,242 | ) |
| Other increases (decreases) | | | 65,992 | | | | - | | | | (89 | ) | | | 78,341 | | | | 732 | | | | 10,195 | | | | 273 | | | | 8,753 | | | | (238,282 | ) | | | (74,085 | ) |
| Adjustment application IAS 29 | | | 373 | | | | - | | | | - | | | | 3,869 | | | | 299 | | | | 1,111 | | | | 89 | | | | - | | | | - | | | | 5,741 | |
| Changes, total | | | 73,498 | | | | (4,356 | ) | | | (11,983 | ) | | | (151,009 | ) | | | (7,592 | ) | | | (9,768 | ) | | | 198 | | | | (958 | ) | | | (316,873 | ) | | | (428,843 | ) |
| Closing balance as of December 31, 2018 Restated | | | 630,320 | | | | 45,424 | | | | 112,565 | | | | 8,987,582 | | | | 22,564 | | | | 71,009 | | | | 634 | | | | 83,267 | | | | 2,548,444 | | | | 12,501,809 | |
| Opening balance as of January 1, 2019 (Restated ) | | | 630,320 | | | | 45,424 | | | | 112,565 | | | | 8,987,582 | | | | 22,564 | | | | 71,009 | | | | 634 | | | | 83,267 | | | | 2,548,444 | | | | 12,501,809 | |
| Additions | | | 21,884 | | | | 7,950 | | | | - | | | | 1,694,640 | | | | 6,580 | | | | 26 | | | | 73 | | | | 34,988 | | | | 753,164 | | | | 2,519,305 | |
| Disposals | | | - | | | | (28 | ) | | | (47 | ) | | | (23,945 | ) | | | (13 | ) | | | (75 | ) | | | (11 | ) | | | - | | | | - | | | | (24,119 | ) |
| Retirements | | | (20 | ) | | | - | | | | - | | | | (64,838 | ) | | | (85 | ) | | | (77 | ) | | | - | | | | (362 | ) | | | - | | | | (65,382 | ) |
| Depreciation expenses | | | - | | | | - | | | | (5,768 | ) | | | (776,225 | ) | | | (8,574 | ) | | | (11,945 | ) | | | (94 | ) | | | (19,001 | ) | | | (400,384 | ) | | | (1,221,991 | ) |
| Foreign exchange | | | (1,340 | ) | | | (1,103 | ) | | | (914 | ) | | | (24,615 | ) | | | (234 | ) | | | (2,007 | ) | | | (125 | ) | | | (432 | ) | | | (4,561 | ) | | | (35,331 | ) |
| Other increases (decreases) | | | (278,255 | ) | | | (3,837 | ) | | | (30,974 | ) | | | (418,083 | ) | | | 538 | | | | 2,903 | | | | - | | | | - | | | | (26,965 | ) | | | (754,673 | ) |
| Changes, total | | | (257,731 | ) | | | 2,982 | | | | (37,703 | ) | | | 386,934 | | | | (1,788 | ) | | | (11,175 | ) | | | (157 | ) | | | 15,193 | | | | 321,254 | | | | 417,809 | |
| Closing balance as of December 31, 2019 | | | 372,589 | | | | 48,406 | | | | 74,862 | | | | 9,374,516 | | | | 20,776 | | | | 59,834 | | | | 477 | | | | 98,460 | | | | 2,869,698 | | | | 12,919,618 | |
| | | | | Aircraft included | | | | |
| | | | | in Property, | | | Operating | | | Total | |
| | | | | plant and equipment | | | leases | | | fleet | |
| | | | | As of | | | As of | | | As of | | | As of | | | As of | | | As of | |
| | | | | December 31, | | | December 31, | | | December 31, | | | December 31, | | | December 31, | | | December 31, | |
| Aircraft | | Model | | 2017 | | | 2016 | | | 2017 | | | 2016 | | | 2017 | | | 2016 | |
| | | | | | | | | | | | | | | | | | | | | |
| Boeing 767 | | 300ER | | | 34 | | | | 34 | | | | 2 | | | | 3 | | | | 36 | | | | 37 | |
| Boeing 767 | | 300F | | | 8 | (1) | | | 8 | (1) | | | 2 | | | | 3 | | | | 10 | (1) | | | 11 | (1) |
| Boeing 777 | | 300ER | | | 4 | | | | 4 | | | | 6 | | | | 6 | | | | 10 | | | | 10 | |
| Boeing 777 | | Freighter | | | - | | | | - | | | | - | | | | 2 | | | | - | | | | 2 | |
| Boeing 787 | | 800 | | | 6 | | | | 6 | | | | 4 | | | | 4 | | | | 10 | | | | 10 | |
| Boeing 787 | | 900 | | | 4 | | | | 4 | | | | 10 | | | | 8 | | | | 14 | | | | 12 | |
| Airbus A319 | | 100 | | | 37 | | | | 36 | | | | 9 | | | | 12 | | | | 46 | | | | 48 | |
| Airbus A320 | | 200 | | | 93 | (2) | | | 93 | | | | 38 | | | | 53 | | | | 131 | (2) | | | 146 | |
| Airbus A320 | | NEO | | | 1 | | | | 1 | | | | 3 | | | | 1 | | | | 4 | | | | 2 | |
| Airbus A321 | | 200 | | | 30 | | | | 30 | | | | 17 | | | | 17 | | | | 47 | | | | 47 | |
| Airbus A350 | | 900 | | | 5 | (3) | | | 5 | | | | 2 | (3) | | | 2 | | | | 7 | (3) | | | 7 | |
| Total | | | | | 222 | | | | 221 | | | | 93 | | | | 111 | | | | 315 | | | | 332 | |
| (b) | Composition of the fleet: |
| | | | | Aircraft included | | | Aircraft included | | | | |
| | | | | in Property, | | | as Rights | | | Total | |
| | | | | plant and equipment | | | of use assets | | | fleet | |
| | | | | As of | | | As of | | | As of | | | As of | | | As of | | | As of | |
| | | | | December 31, | | | December 31, | | | December 31, | | | December 31, | | | December 31, | | | December 31, | |
| Aircraft | | Model | | 2019 | | | 2018 | | | 2019 | | | 2018 | | | 2019 | | | 2018 | |
| | | | | | | | | | | | | | | | | | | | | |
| Boeing 767 | | 300ER | | | 28 | | | | 33 | | | | 2 | | | | 2 | | | | 30 | | | | 35 | |
| Boeing 767 | | 300F | | | 11 | (1) | | | 9 | (1) | | | 1 | | | | 1 | | | | 12 | (1) | | | 10 | (1) |
| Boeing 777 | | 300ER | | | 4 | | | | 4 | | | | 6 | | | | 6 | | | | 10 | | | | 10 | |
| Boeing 777 | | 200ER | | | - | | | | - | | | | - | | | | 2 | | | | - | | | | 2 | |
| Boeing 787 | | 800 | | | 6 | | | | 6 | | | | 4 | | | | 4 | | | | 10 | | | | 10 | |
| Boeing 787 | | 900 | | | 6 | | | | 4 | | | | 10 | | | | 10 | | | | 16 | | | | 14 | |
| Airbus A319 | | 100 | | | 37 | | | | 37 | | | | 9 | | | | 9 | | | | 46 | | | | 46 | |
| Airbus A320 | | 200 | | | 96 | (2) | | | 97 | (2) | | | 46 | | | | 34 | | | | 142 | (2) | | | 131 | (2) |
| Airbus A320 | | NEO | | | 7 | | | | 1 | | | | 6 | | | | 3 | | | | 13 | | | | 4 | |
| Airbus A321 | | 200 | | | 30 | | | | 30 | | | | 19 | | | | 19 | | | | 49 | | | | 49 | |
| Airbus A350 | | 900 | | | 2 | | | | 5 | | | | 7 | (3) | | | 4 | (3) | | | 9 | (3) | | | 9 | |
| Total | | | | | 227 | | | | 226 | | | | 110 | | | | 94 | | | | 337 | | | | 320 | |
(1) TwoOne aircraft leased to FEDEX as of December 2017; three aircraft as of December 2016.Aerotransportes Mas de Carga S.A. de C.V.
(2) Three aircraft leased to Salam Air and onetwo to Sundair
(3) Four aircraft leased to Qatar Air. TwoAirways, which are in operating leases and two in Properties, plant and equipment.assets by right of use.
(c) Method used for the depreciation of Property, plant and equipment:
| (c) | Method used for the depreciation of Property, plant and equipment: |
| | | | | Useful life | | (years) | | | | | Useful life (years) | |
| | | Method | | minimum | | maximum | | | Method | | minimum | | maximum | |
| Buildings | | Straight line without residual value | | | 20 | | | | 50 | | | Straight line without residual value | | | 20 | | | | 50 | |
| Plant and equipment | | Straight line with residual value of 20% in the short-haul fleet and 36% in the long-haul fleet. (*) | | | 5 | | | | 23 | | | Straight line with residual value of 20% in the short-haul fleet and 36% in the long-haul fleet. (*) | | | 5 | | | | 30 | |
| Information technology equipment | | Straight line without residual value | | | 5 | | | | 10 | | | Straight line without residual value | | | 5 | | | | 10 | |
| Fixed installations and accessories | | Straight line without residual value | | | 10 | | | | 10 | | | Straight line without residual value | | | 10 | | | | 10 | |
| Motor vehicle | | Straight line without residual value | | | 10 | | | | 10 | | | Straight line without residual value | | | 10 | | | | 10 | |
| Leasehold improvements | | Straight line without residual value | | | 5 | | | | 5 | | | Straight line without residual value | | | 5 | | | | 8 | |
| Other property, plant and equipment | | Straight line with residual value of 20% in the short-haul fleet and 36% in the long-haul fleet. (*) | | | 10 | | | | 23 | | |
| Assets for rights of use | | | Straight line without residual value | | | 1 | | | | 25 | |
(*) Except for the Boeing 767 300ER and Boeing 767 300F fleets which consider a lower residual value due to the extension of their useful life to 22 and 23 years respectively. Additionally certain technical components, which are depreciated based on the basis of cycles and flight hours.
| (*) | Except in the case of the Boeing 767 300ER and Boeing 767 300F fleets that consider a lower residual value due to the extension of their useful life to 22 and 30 years respectively. Additionally, certain technical components are depreciated based on cycles and hours flown. |
The aircraft with remarketing clause (**) under modality of financial leasing, which are depreciated according to the duration of their contracts, between 12 and 18 years. Its residual values are estimated according to market value at the end of such contracts.
(**)
| (**) | Aircraft with remarketing clause are those that are required to sell at the end of the contract. |
In the year 2019, the charge to income for the depreciation of the contract.
As of December 31, 2017, the deferred charge for the period,year, which is included in the consolidated statement of income, amounts to ThUS $ 765,204 (ThUS $ 744,552 asThUS$ 1,221,991, ThUS$ 1,155,061 and ThUS$ 1,462,562 for the same period of December 31, 2016).the year 2018 and 2017; those amounts include depreciation of assets for right of use, for ThUS$ 400,384, ThUS$ 391,138 and ThUS$ 375,510, respectively. This chargeexpense is recognized in the items of cost of sales and administrative expenses of the consolidated statement of income.
(d) Additional information regarding Property, plant and equipment:
| (d) | Additional information regarding Property, plant and equipment: |
(i) Property, plant and equipment pledged as guarantee:
| (i) | Property, plant and equipment pledged as guarantee: |
Description of Property, plant and equipment pledged as guarantee:
| | | | | | | As of | | | As of | |
| | | | | | | December 31, | | | December 31, | |
| | | | | | | 2017 | | | 2016 | |
| Guarantee | | Assets | | | | Existing | | | Book | | | Existing | | | Book | |
| agent (*) | | committed | | Fleet | | Debt | | | Value | | | Debt | | | Value | |
| | | | | | | ThUS$ | | | ThUS$ | | | ThUS$ | | | ThUS$ | |
| | | | | | | | | | | | | | | | | |
| Wilmington | | Aircraft and engines | | Airbus A321 / A350 | | | 637,934 | | | | 721,602 | | | | 596,224 | | | | 722,979 | |
| Trust Company | | | | Boeing 767 | | | 593,655 | | | | 888,948 | | | | 811,723 | | | | 1,164,364 | |
| | | | | Boeing 787 | | | 720,267 | | | | 842,127 | | | | 739,031 | | | | 899,445 | |
| | | | | | | | - | | | | - | | | | | | | | | |
| Banco Santander S.A. | | Aircraft and engines | | Airbus A319 | | | - | | | | - | | | | 50,671 | | | | 91,889 | |
| | | | | Airbus A320 | | | 199,165 | | | | 291,649 | | | | 462,950 | | | | 709,788 | |
| | | | | Airbus A321 | | | 29,296 | | | | 40,584 | | | | 32,853 | | | | 44,227 | |
| | | | | | | | - | | | | - | | | | | | | | | |
| BNP Paribas | | Aircraft and engines | | Airbus A319 | | | 84,767 | | | | 136,407 | | | | 134,346 | | | | 228,384 | |
| | | | | Airbus A320 | | | 110,267 | | | | 175,650 | | | | 128,173 | | | | 181,838 | |
| | | | | | | | - | | | | | | | | | | | | | |
| Credit Agricole | | Aircraft and engines | | Airbus A319 | | | 20,874 | | | | 38,826 | | | | 26,014 | | | | 37,389 | |
| | | | | Airbus A320 | | | 46,895 | | | | 98,098 | | | | 71,794 | | | | 144,157 | |
| | | | | Airbus A321 | | | 30,322 | | | | 85,463 | | | | 40,609 | | | | 93,110 | |
| | | | | | | | - | | | | - | | | | - | | | | | |
| Wells Fargo | | Aircraft and engines | | Airbus A320 | | | 224,786 | | | | 306,660 | | | | 252,428 | | | | 333,419 | |
| | | | | | | | | | | | - | | | | | | | | | |
| Bank of Utah | | Aircraft and engines | | Airbus A320 / A350 | | | 614,632 | | | | 666,665 | | | | 670,826 | | | | 709,280 | |
| | | | | | | | - | | | | - | | | | | | | | | |
| Natixis | | Aircraft and engines | | Airbus A320 | | | 34,592 | | | | 72,388 | | | | 45,748 | | | | 66,738 | |
| | | | | Airbus A321 | | | 378,418 | | | | 481,397 | | | | 377,104 | | | | 514,625 | |
| | | | | | | | - | | | | - | | | | | | | | | |
| Citibank N. A. | | Aircraft and engines | | Airbus A320 | | | 94,882 | | | | 141,817 | | | | 111,243 | | | | 166,370 | |
| | | | | Airbus A321 | | | 36,026 | | | | 72,741 | | | | 42,867 | | | | 70,166 | |
| | | | | | | | - | | | | - | | | | | | | | | |
| KfW IPEX-Bank | | Aircraft and engines | | Airbus A319 | | | 5,592 | | | | 5,505 | | | | 7,494 | | | | 6,360 | |
| | | | | Airbus A320 | | | 21,296 | | | | 30,513 | | | | 28,696 | | | | 36,066 | |
| Airbus Financial Services | | Aircraft and engines | | Airbus A319 | | | 22,927 | | | | 26,973 | | | | 30,199 | | | | 33,823 | |
| PK AirFinance US, Inc. | | Aircraft and engines | | Airbus A320 | | | 46,500 | | | | 56,539 | | | | 54,786 | | | | 46,341 | |
| JP Morgan | | Aircraft and engines | | Boeing 777 (1) | | | 169,674 | | | | 216,000 | | | | 192,671 | | | | 236,400 | |
| Banco BBVA | | Land and buildings (2) | | | | | 55,801 | | | | 66,876 | | | | 50,381 | | | | 69,498 | |
| | | | | | | | | | | | | | | | | | | | | |
| Total direct guarantee | | | | | | | 4,178,568 | | | | 5,463,428 | | | | 4,958,831 | | | | 6,606,656 | |
| | | | | | | As of | | | As of | |
| | | | | | | December 31, | | | December 31, | |
| | | | | | | 2019 | | | 2018 | |
| Guarantee | | Creditor | | | | Existing | | | Book | | | Existing | | | Book | |
| agent (1) | | company | | Fleet | | Debt | | | Value | | | Debt | | | Value | |
| | | | | | | ThUS$ | | | ThUS$ | | | ThUS$ | | | ThUS$ | |
| | | | | | | | | | | | | | | | | |
| Wilmington | | MUFG | | Airbus A319 | | | 74,713 | | | | 256,937 | | | | 96,057 | | | | 234,329 | |
| Trust Company | | | | Airbus A320 | | | 70,644 | | | | 256,651 | | | | 98,903 | | | | 220,390 | |
| | | | | Boeing 767 | | | 61,728 | | | | 196,244 | | | | 82,793 | | | | 206,868 | |
| | | | | Boeing 787 | | | 120,938 | | | | 127,283 | | | | 144,312 | | | | 133,388 | |
| | | | | Airbus A321 | | | 353,774 | | | | 452,107 | | | | 389,080 | | | | 477,778 | |
| | | | | Boeing 787 | | | 332,131 | | | | 374,998 | | | | 365,375 | | | | 398,510 | |
| | | Aircraft and engines | | Airbus A350 | | | 180,320 | | | | 192,620 | | | | 198,301 | | | | 204,860 | |
| | | | | Boeing 787 | | | 143,475 | | | | 191,804 | | | | 162,378 | | | | 204,961 | |
| Banco Santander S.A. | | Aircraft and engines | | Airbus A320 | | | - | | | | - | | | | 172,474 | | | | 275,511 | |
| | | | | Airbus A321 | | | - | | | | - | | | | 25,661 | | | | 41,957 | |
| BNP Paribas | | Aircraft and engines | | Airbus A319 | | | - | | | | - | | | | 9,693 | | | | 19,113 | |
| BNP Paribas | | | | Airbus A319 | | | - | | | | - | | | | 17,009 | | | | 26,407 | |
| Credit Agricole | | | | Airbus A319 | | | - | | | | - | | | | 11,154 | | | | 31,865 | |
| | | | | Airbus A320 | | | 85,986 | | | | 95,148 | | | | 134,328 | | | | 132,301 | |
| | | | | Airbus A321 / A350 | | | 83,281 | | | | 67,882 | | | | 22,439 | | | | 24,939 | |
| | | | | Boeing 767 | | | 10,404 | | | | 35,226 | | | | 21,830 | | | | 43,568 | |
| | | Aircraft and engines | | Boeing 787 | | | 74,023 | | | | 36,594 | | | | 74,023 | | | | 42,228 | |
| Wells Fargo | | Aircraft and engines | | Airbus A320 | | | - | | | | - | | | | 196,540 | | | | 285,877 | |
| Bank Of Utah | | Aircraft and engines (2) | | Airbus A320 / A350 | | | 296,441 | | | | 378,462 | | | | 502,006 | | | | 630,065 | |
| | | | | Boeing 787 | | | 217,500 | | | | 259,934 | | | | - | | | | - | |
| | | Aircraft and engines (2) | | Airbus A320 / A350 | | | 44,088 | | | | - | | | | 54,014 | | | | - | |
| | | Aircraft and engines | | | | | | | | | | | | | | | | | | |
| Natixis | | | | Airbus A321 | | | 282,927 | | | | 384,224 | | | | 324,524 | | | | 410,771 | |
| Citibank N.A. | | Aircraft and engines | | Airbus A320 | | | - | | | | - | | | | 78,049 | | | | 132,296 | |
| | | | | Airbus A321 | | | - | | | | - | | | | 28,938 | | | | 70,333 | |
| UMB Bank | | Aircraft and engines | | Airbus A320 | | | 106,250 | | | | 149,607 | | | | - | | | | - | |
| MUFG Bank | | Aircraft and engines | | Airbus A320 | | | 216,411 | | | | 310,311 | | | | - | | | | - | |
| | | | | | | | | | | | | | | | | | | | | |
| PK AirFinance US, Inc. | | Aircraft and engines | | Airbus A320 | | | - | | | | - | | | | 37,615 | | | | 52,435 | |
| Banco BBVA | | Land and buildings (3) | | | | | - | | | | - | | | | 50,785 | | | | 64,500 | |
| Total direct guarantee | | | | | | | 2,755,034 | | | | 3,766,032 | | | | 3,298,281 | | | | 4,365,250 | |
(*) Due to the characteristics of a syndicated loan, the guarantee agent is the representative of the creditors.
| (1) | For syndicated loans, is the Guarantee Agent that, represent different creditors. |
(1) These assets are classified under Non-current assets and disposal group classified as held for sale
| (2) | As of December 31, 2019, three A350 aircraft are classified under Non-current assets or groups of assets for disposal as held for sale. |
(2) Corresponds to a debt classified in item loans to exporters (see Note 19).
| (3) | Corresponds to a debt classified under item loans to exporters (see Note 19). |
The amounts of existingthe current debt are presented at their nominal value. BookThe book value corresponds to the carrying value of the goods providedgranted as guarantees.collateral.
Additionally, there are indirect guarantees related toassociated with assets recordedregistered in Property, plantproperties, plants and equipment whose total debt atas of December 31, 2017 amounted2019, amounts to ThUS$ 1,087,0521,762,611 (ThUS$ 913,494 at1,633,504 as of December 31, 2016)2018). The book value of the assets with indirect guarantees as of December 31, 20172019, amounts to ThUS$ 2,222,6203,866,237 (ThUS$ 1,740,8153,258,950 as of December 31, 2016)2018).
(ii) Commitments and othersAs of December 31, 2019, the Company keeps valid letters of credit related to assets by right of use according to the following detail:
| | | | | | Value | | | Release |
| Creditor Guarantee | | Debtor | | Type | | ThUS$ | | | date |
| | | | | | | | | |
| GE Capital Aviation Services Limited | | Lan Cargo S.A. | | One letter of credit | | | 1,100 | | | Nov 30, 2020 |
| Avolon Aerospace AOE 62 Limited | | Latam Airlines Group S.A. | | Three letter of credit | | | 2,167 | | | Sep 30, 2020 |
| Bank of Utah | | Latam Airlines Group S.A. | | One letter of credit | | | 2,000 | | | Mar 24, 2020 |
| GE Capital Aviation Services Ltd. | | Latam Airlines Group S.A. | | Three letter of credit | | | 14,327 | | | Jan 20, 2020 |
| ORIX Aviation Systems Limited | | Latam Airlines Group S.A. | | Four letter of credit | | | 10,034 | | | Sep 26, 2020 |
| Sky High XXIV Leasing Company | | Latam Airlines Group S.A. | | Eight letter of credit | | | 6,831 | | | Aug 05, 2020 |
| Merlin Aviation Leasing (Ireland) 18 Limited | | Tam Linhas Aéreas S.A. | | One letter of credit | | | 3,852 | | | Mar 15, 2020 |
| Shapphire Leasing (AOE) Limited | | Tam Linhas Aéreas S.A. | | One letter of credit | | | 7,500 | | | Oct 19, 2020 |
| Wells Fargo Bank | | Latam Airlines Group S.A. | | Nine letter of credit | | | 15,160 | | | Mar 13, 2020 |
| Banc Of America | | Latam Airlines Group S.A. | | Three letter of credit | | | 1,044 | | | Jul 7, 2020 |
| Macquaire Aircraft Leasing Services | | Latam Airlines Group S.A. | | Five letter of credit | | | 2,582 | | | Aug 1, 2020 |
| TC Skyward Aviation US Inc | | Tam Linhas Aéreas S.A. | | One letter of credit | | | 13,100 | | | Oct 6, 2020 |
| RB Comercial Properties 49 | | | | | | | | | | |
| Empreendimentos Imobiliarios LTDA | | Tam Linhas Aéreas S.A. | | One letter of credit | | | 35,974 | | | Apr 29, 2020 |
| | | | | | | 115,671 | | | |
| (ii) | Commitments and others |
Fully depreciated assets and commitments for future purchases are as follows:
| | | As of | | | As of | |
| | | December 31, | | | December 31, | |
| | | 2017 | | | 2016 | |
| | | ThUS$ | | | ThUS$ | |
| | | | | | | |
| Gross book value of fully depreciated property, plant and equipment still in use | | | 136,811 | | | | 116,386 | |
| | | | | | | | | |
| Commitments for the acquisition of aircraft (*) | | | 15,400,000 | | | | 15,100,000 | |
| | | | | | | | | |
| (*) Acording to the manufacturer’s price list. | | | | | | | | |
| | | As of | | | As of | |
| | | December 31, | | | December 31, | |
| | | 2019 | | | 2018 | |
| | | ThUS$ | | | ThUS$ | |
| | | | | | | |
| Gross book value of fully depreciated property, plant and equipment still in use | | | 261,792 | | | | 192,606 | |
| Commitments for the acquisition of aircraft (*)(**) | | | 7,390,000 | | | | 14,400,000 | |
| (*) | According to the manufacturer’s price list. |
| (**) | The current commitments do not consider 10 Airbus aircraft of the A350 family, included in a sales contract with Delta Air Lines, Inc. |
Purchase commitment of aircraft
| | | Year of delivery | | | | |
| Manufacturer | | 2018 | | | 2019 | | | 2020 | | | 2021 | | | 2022 | | | Total | |
| | | | | | | | | | | | | | | | | | | | | | | | | |
| Airbus S.A.S. | | | 13 | | | | 11 | | | | 16 | | | | 21 | | | | 11 | | | | 72 | |
| A320-NEO | | | 7 | | | | 3 | | | | 9 | | | | 8 | | | | 5 | | | | 32 | |
| A321 | | | - | | | | 1 | | | | - | | | | - | | | | - | | | | 1 | |
| A321-NEO | | | 2 | | | | 3 | | | | 5 | | | | 5 | | | | 4 | | | | 19 | |
| A350-1000 | | | - | | | | - | | | | 2 | | | | 8 | | | | 2 | | | | 12 | |
| A350-900 | | | 4 | | | | 4 | | | | - | | | | - | | | | - | | | | 8 | |
| The Boeing Company | | | - | | | | 6 | | | | 2 | | | | 2 | | | | - | | | | 10 | |
| Boeing 777 | | | - | | | | 2 | | | | - | | | | - | | | | - | | | | 2 | |
| Boeing 787-9 | | | - | | | | 4 | | | | 2 | | | | 2 | | | | - | | | | 8 | |
| Total | | | 13 | | | | 17 | | | | 18 | | | | 23 | | | | 11 | | | | 82 | |
| | | Year of delivery | | | | |
| Manufacturer | | 2020 | | | 2021 | | | 2022 | | | 2023 | | | 2024-2026 | | | Total | |
| Airbus S.A.S. (*) | | | 3 | | | | 10 | | | | 11 | | | | 9 | | | | 11 | | | | 44 | |
| A320-NEO Family | | | 3 | | | | 10 | | | | 11 | | | | 9 | | | | 9 | | | | 42 | |
| A350 Family | | | - | | | | - | | | | - | | | | - | | | | 2 | | | | 2 | |
| The Boeing Company | | | 2 | | | | 2 | | | | - | | | | 2 | | | | - | | | | 6 | |
| Boeing 787-9 | | | 2 | | | | 2 | | | | - | | | | 2 | | | | - | | | | 6 | |
| Total | | | 5 | | | | 12 | | | | 11 | | | | 11 | | | | 11 | | | | 50 | |
| (*) | During the third quarter of 2019 the company signed a sale contract with Delta Air Lines, Inc. for 14 Airbus A350 family aircraft, 10 were within the current aircraft purchase commitments and 4 that were already in PPE were classified as assets held for sale as of December 31, 2019. |
As of December 31, 2017,2019, as a result of the different aircraft purchase contracts and agreements signed with Airbus SAS, there remain 52are remaining to receive 42 Airbus aircraft of the A320 family, with deliveries between 20182020 and 2022,2024, and 202 Airbus aircraft of the A350 family with dates of delivery between 2018 and 2022.
for 2026. The approximate amount, according to manufacturer’s list prices, is ThUS$ 12,600,000, according to the manufacturer’s price list.5,640,000.
As of December 31, 2017,2019, as a result of the different aircraft purchase agreementscontracts signed with The Boeing Company, there are 8remaining 6 Boeing 787 Dreamliner aircraft, remaining, with delivery dates between 20192020 and 2021, and 2 Boeing 777 aircraft, with delivery scheduled for the year 2019.
2023. The approximate amount, according to the manufacturer'smanufacturer’s list prices, is ThUS $ 2,800,000.ThUS$ 1,750,000.
| (iii) | Capitalized interest costs with respect to Property, plant and equipment. |
| | | | | For the periods ended | |
| | | | | December 31, | |
| | | | | | 2017 | | | | 2016 | | | | 2015 | |
| Average rate of capitalization of capitalized interest costs | | % | | | 4.21 | | | | 3.54 | | | | 2.79 | |
| Costs of capitalized interest | | ThUS$ | | | 11,053 | | | | (696 | ) | | | 22,551 | |
The detail of the main financial leases is as follows:
| | | | | | | As of | | | As of | |
| | | | | | | December 31, | | | December 31, | |
| Lessor | | Aircraft | | Model | | 2017 | | | 2016 | |
| | | | | | | | | | | |
| Bandurria Leasing Limitd | | Airbus A319 | | 100 | | | 3 | | | | - | |
| Bandurria Leasing Limitd | | Airbus A320 | | 200 | | | 4 | | | | - | |
| Becacina Leasing LLC | | Boeing 767 | | 300ER | | | 1 | | | | 1 | |
| Caiquen Leasing LLC | | Boeing 767 | | 300F | | | 1 | | | | 1 | |
| Cernicalo Leasing LLC | | Boeing 767 | | 300F | | | - | | | | 2 | |
| Cisne Leasing LLC | | Boeing 767 | | 300ER | | | 2 | | | | 2 | |
| Codorniz Leasing Limited | | Airbus A319 | | 100 | | | - | | | | 2 | |
| Conure Leasing Limited | | Airbus A320 | | 200 | | | 2 | | | | 2 | |
| Flamenco Leasing LLC | | Boeing 767 | | 300ER | | | 1 | | | | 1 | |
| FLYAFI 1 S.R.L. | | Boeing 777 | | 300ER | | | 1 | | | | 1 | |
| FLYAFI 2 S.R.L. | | Boeing 777 | | 300ER | | | 1 | | | | 1 | |
| FLYAFI 3 S.R.L. | | Boeing 777 | | 300ER | | | 1 | | | | 1 | |
| Garza Leasing LLC | | Boeing 767 | | 300ER | | | 1 | | | | 1 | |
| General Electric Capital Corporation | | Airbus A330 | | 200 | | | - | | | | 3 | |
| Intraelo BETA Corpotation (KFW) | | Airbus A320 | | 200 | | | - | | | | 1 | |
| Jilguero Leasing LLC | | Boing B767 | | 300ER | | | 3 | | | | - | |
| Loica Leasing Limited | | Airbus A319 | | 100 | | | 2 | | | | 2 | |
| Loica Leasing Limited | | Airbus A320 | | 200 | | | 2 | | | | 2 | |
| Mirlo Leasing LLC | | Boeing 767 | | 300ER | | | 1 | | | | 1 | |
| NBB Rio de Janeiro Lease CO and Brasilia Lease LLC (BBAM) | | Airbus A320 | | 200 | | | 1 | | | | 1 | |
| NBB São Paulo Lease CO. Limited (BBAM) | | Airbus A321 | | 200 | | | 1 | | | | 1 | |
| Osprey Leasing Limited | | Airbus A319 | | 100 | | | 8 | | | | 8 | |
| Patagon Leasing Limited | | Airbus A319 | | 100 | | | 3 | | | | - | |
| Petrel Leasing LLC | | Boeing 767 | | 300ER | | | 1 | | | | 1 | |
| Pilpilen Leasing Limited | | Airbus A320 | | 200 | | | - | | | | 4 | |
| Pochard Leasing LLC | | Boeing 767 | | 300ER | | | 2 | | | | 2 | |
| Quetro Leasing LLC | | Boeing 767 | | 300ER | | | 3 | | | | 3 | |
| SG Infraestructure Italia S.R.L. | | Boeing 777 | | 300ER | | | 1 | | | | 1 | |
| SL Alcyone LTD (Showa) | | Airbus A320 | | 200 | | | 1 | | | | 1 | |
| Torcaza Leasing Limited | | Airbus A320 | | 200 | | | 8 | | | | - | |
| Tricahue Leasing LLC | | Boeing 767 | | 300ER | | | 3 | | | | 3 | |
| Wacapou Leasing S.A | | Airbus A320 | | 200 | | | 1 | | | | 1 | |
| Wells Fargo Bank North National Association | | Airbus A319 | | 100 | | | 1 | | | | - | |
| | | | | | | | | | | | | |
| Total | | | | | | | 60 | | | | 50 | |
Financial leasing contracts where the Company acts as the lessee of aircrafts establish duration between 12 and 18 year terms and semi-annual, quarterly and monthly payments of obligations.
Additionally, the lessee will have the obligation to contract and maintain active the insurance coverage for the aircrafts, perform maintenance on the aircrafts and update the airworthiness certificates at their own cost.
The assets acquired under the financial leasing modality are classified under Other property, plant and equipment. As of December 31, 2017, the Company registered sixty aircraft under this modality (fifty aircraft as of December 31, 2016).
The book value of assets under financial leases as of December 31, 2017 amounts to ThUS$ 2,107,526 (ThUS$ 1,753,366 at December 31, 2016).
The minimum payments under financial leases are as follows:
| | | As of December 31, 2017 | | | As of December 31, 2016 | | | As of December 31, 2015 | |
| | | Gross | | | | | | Present | | | Gross | | | | | | Present | | | Gross | | | | | | Present | |
| | | Value | | | Interest | | | Value | | | Value | | | Interest | | | Value | | | Value | | | Interest | | | Value | |
| | | ThUS$ | | | ThUS$ | | | ThUS$ | | | ThUS$ | | | ThUS$ | | | ThUS$ | | | ThUS$ | | | ThUS$ | | | ThUS$ | |
| | | | | | | | | | | | | | | | | | | | | | | | | | | | |
| No later than one year | | | 303,863 | | | | (32,447 | ) | | | 271,416 | | | | 285,168 | | | | (32,365 | ) | | | 252,803 | | | | 360,862 | | | | (47,492 | ) | | | 313,370 | |
| Between one and five years | | | 835,696 | | | | (30,050 | ) | | | 805,646 | | | | 704,822 | | | | (43,146 | ) | | | 661,676 | | | | 1,003,237 | | | | (75,363 | ) | | | 927,874 | |
| Over five years | | | 36,788 | | | | (816 | ) | | | 35,972 | | | | 43,713 | | | | (120 | ) | | | 43,593 | | | | 95,050 | | | | (1,406 | ) | | | 93,644 | |
| Total | | | 1,176,347 | | | | (63,313 | ) | | | 1,113,034 | | | | 1,033,703 | | | | (75,631 | ) | | | 958,072 | | | | 1,459,149 | | | | (124,261 | ) | | | 1,334,888 | |
| | | | | For the year ended | |
| | | | | December 31, | |
| | | | | 2019 | | | 2018 | | | 2017 | |
| | | | | | | | | | | | |
| Average rate of capitalization of capitalized interest costs | | % | | | 4.72 | | | | 4.64 | | | | 4,12 | |
| Costs of capitalized interest | | ThUS$ | | | 1,444 | | | | 13,007 | | | | 8,210 | |
NOTE 18 - CURRENT AND DEFERRED TAXES
In the period ended December 31, 2017,2019, the income tax provision was calculated for such period, applying the partially integrated taxation system and a rate of 25.5% for the business year 2017,27%, in accordance with the Law No. 20,780 published in the Official Journal of the Republic of Chile on September 29, 2014.
Among the main changes is the progressive increase of the First Category Tax which will reach 27% in 2018 if the "Partially Integrated Taxation System" is chosen. Alternatively, if the Company chooses the "Attributed Income Taxation System" the top rate would reach 25% in 2017.
As LATAM Airlines Group S.A. is a public company, by default it must choose the "Partially Integrated Taxation System", unless a future Extraordinary Meeting of Shareholders of the Company agrees, by a minimum of 2/3 of the votes, to choose the "Attributed Income Taxation System". This decision was taken in the last quarter of 2016.
On February 8, 2016, an amendment to the abovementioned Law was issued (as Law 20,899) stating, as its main amendments, that Companies such Latam Airlines Group S.A. had to mandatorily choose the "Partially Integrated Taxation System" and could not elect to use the other system.
The Partially Integrated Taxation System is basedDeferred taxes are recognized, on the taxation bytemporary differences arising between the perceptiontax bases of profits and the Attributed Income Taxation System is based on the taxation by the accrual of profits.
Assets and deferred tax liabilities are offset if there is a legal right to offset the assets and liabilities always correspond toand their carrying amounts in the same entity and tax authority.consolidated financial statements.
No deferred tax has been recorded for permanent difference, since they are caused by transactions that are recorded in the financial statements and that will not have impact on income taxes.
(a.1) The composition of the current tax assets is the following:
| | | Current assets | | | Non-current assets | | | Total assets | |
| | | As of | | | As of | | | As of | | | As of | | | As of | | | As of | |
| | | December 31, | | | December 31, | | | December 31, | | | December 31, | | | December 31, | | | December 31, | |
| | | 2017 | | | 2016 | | | 2017 | | | 2016 | | | 2017 | | | 2016 | |
| | | ThUS$ | | | ThUS$ | | | ThUS$ | | | ThUS$ | | | ThUS$ | | | ThUS$ | |
| | | | | | | | | | | | | | | | | | | |
| Provisional monthly | | | | | | | | | | | | | | | | | | | | | | | | |
| payments (advances) | | | 65,257 | | | | 43,821 | | | | - | | | | - | | | | 65,257 | | | | 43,821 | |
| Other recoverable credits | | | 12,730 | | | | 21,556 | | | | 17,532 | | | | 20,272 | | | | 30,262 | | | | 41,828 | |
| Total assets by current tax | | | 77,987 | | | | 65,377 | | | | 17,532 | | | | 20,272 | | | | 95,519 | | | | 85,649 | |
| (a.1) | The composition of the current tax assets is the following: |
(a.2) The composition of the current tax liabilities are as follows:
| | | Current assets | | | Non-current assets | | | Total assets | |
| | | As of | | | As of | | | As of | | | As of | | | As of | | | As of | |
| | | December 31, | | | December 31, | | | December 31, | | | December 31, | | | December 31, | | | December 31, | |
| | | 2019 | | | 2018 | | | 2019 | | | 2018 | | | 2019 | | | 2018 | |
| | | ThUS$ | | | ThUS$ | | | ThUS$ | | | ThUS$ | | | ThUS$ | | | ThUS$ | |
| Provisional monthly payments (advances) | | | 10,968 | | | | 48,480 | | | | - | | | | - | | | | 10,968 | | | | 48,480 | |
| Other recoverable credits | | | 18,353 | | | | 20,654 | | | | - | | | | 757 | | | | 18,353 | | | | 21,411 | |
| Total assets by current tax | | | 29,321 | | | | 69,134 | | | | - | | | | 757 | | | | 29,321 | | | | 69,891 | |
| | | Current liabilities | | | Non-current liabilities | | | Total liabilities | |
| | | As of | | | As of | | | As of | | | As of | | | As of | | | As of | |
| | | December 31, | | | December 31, | | | December 31, | | | December 31, | | | December 31, | | | December 31, | |
| | | 2017 | | | 2016 | | | 2017 | | | 2016 | | | 2017 | | | 2016 | |
| | | ThUS$ | | | ThUS$ | | | ThUS$ | | | ThUS$ | | | ThUS$ | | | ThUS$ | |
| | | | | | | | | | | | | | | | | | | |
| Income tax provision | | | 3,511 | | | | 9,632 | | | | - | | | | - | | | | 3,511 | | | | 9,632 | |
| Additional tax provision | | | - | | | | 4,654 | | | | - | | | | - | | | | - | | | | 4,654 | |
| Total liabilities by current tax | | | 3,511 | | | | 14,286 | | | | - | | | | - | | | | 3,511 | | | | 14,286 | |
| (a.2) | The composition of the current tax liabilities are as follows: |
(b) Deferred taxes
| | | Current liabilities | | | Non-current liabilities | | | Total liabilities | |
| | | As of | | | As of | | | As of | | | As of | | | As of | | | As of | |
| | | December 31, | | | December 31, | | | December 31, | | | December 31, | | | December 31, | | | December 31, | |
| | | 2019 | | | 2018 | | | 2019 | | | 2018 | | | 2019 | | | 2018 | |
| | | ThUS$ | | | ThUS$ | | | ThUS$ | | | ThUS$ | | | ThUS$ | | | ThUS$ | |
| Income tax provision | | | 11,925 | | | | 3,738 | | | | - | | | | - | | | | 11,925 | | | | 3,738 | |
| Total liabilities by current tax | | | 11,925 | | | | 3,738 | | | | - | | | | - | | | | 11,925 | | | | 3,738 | |
The balances of deferred tax are the following:
| | | Assets | | | Liabilities | |
| | | As of | | | As of | | | As of | | | As of | |
| | December 31, | | | December 31, | | | December 31, | | | December 31, | |
| Concept | | 2017 | | | 2016 | | | 2017 | | | 2016 | |
| | | ThUS$ | | | ThUS$ | | | ThUS$ | | | ThUS$ | |
| | | | | | | | | | | | | |
| Depreciation | | | 210,855 | | | | 11,735 | | | | 1,401,277 | | | | 1,387,760 | |
| Leased assets | | | (103,201 | ) | | | (35,922 | ) | | | 275,142 | | | | 203,836 | |
| Amortization | | | (484 | ) | | | (15,820 | ) | | | 54,335 | | | | 61,660 | |
| Provisions | | | (9,771 | ) | | | 222,253 | | | | 690 | | | | (59,096 | ) |
| Revaluation of financial instruments | | | (734 | ) | | | - | | | | (4,484 | ) | | | (3,223 | ) |
| Tax losses | | | 290,973 | | | | 202,536 | | | | (1,188,586 | ) | | | (1,126,200 | ) |
| Intangibles | | | - | | | | - | | | | 406,536 | | | | 430,705 | |
| Others | | | (23,617 | ) | | | (202 | ) | | | 4,787 | | | | 20,317 | |
| Total | | | 364,021 | | | | 384,580 | | | | 949,697 | | | | 915,759 | |
| | | Assets | | | Liabilities | |
| | | As of | | | As of | | | As of | | | As of | |
| Concept | | December 31, | | | December 31, | | | December 31, | | | December 31, | |
| | | 2019 | | | 2018 | | | 2019 | | | 2018 | |
| | | ThUS$ | | | ThUS$ | | | ThUS$ | | | ThUS$ | |
| | | | | | Restated | | | | | | Restated | |
| Properties, Plants and equipment | | | 186,311 | | | | 150,831 | | | | 1,700,215 | | | | 1,733,327 | |
| Assets by right of use | | | 42,011 | | | | 202 | | | | (91,470 | ) | | | (85,550 | ) |
| Amortization | | | (903 | ) | | | (983 | ) | | | 52,233 | | | | 55,880 | |
| Provisions | | | (139,346 | ) | | | (38,303 | ) | | | (182,913 | ) | | | (75,631 | ) |
| Revaluation of financial instruments | | | 422 | | | | 445 | | | | (9,857 | ) | | | 458 | |
| Tax losses | | | 155,539 | | | | 170,980 | | | | (1,200,729 | ) | | | (1,198,170 | ) |
| Intangibles | | | - | | | | - | | | | 349,082 | | | | 351,238 | |
| Others | | | (8,451 | ) | | | (9,643 | ) | | | 242 | | | | 5,019 | |
| Total | | | 235,583 | | | | 273,529 | | | | 616,803 | | | | 786,571 | |
The balance of deferred tax assets and liabilities are composed primarily of temporary differences to be reversed in the long term.
Movements of Deferred tax assets and liabilities
| (a) | From January 1 to December 31, 2015 |
(a) From January 1 to December 31, 2017
| | | Opening | | Recognized in | | Recognized in | | Exchange | | | | Ending | | | Opening | | Recognized in | | Recognized in | | Exchange | | Ending | |
| | | balance | | consolidated | | comprehensive | | rate | | | | balance | | | balance | | consolidated | | comprehensive | | rate | | balance | |
| | | Assets/(liabilities) | | income | | income | | variation | | Others | | Asset (liability) | | | Assets/(liabilities) | | income | | income | | variation | | Asset (liability) | |
| | | ThUS$ | | ThUS$ | | ThUS$ | | ThUS$ | | ThUS$ | | ThUS$ | | | ThUS$ | | ThUS$ | | ThUS$ | | ThUS$ | | ThUS$ | |
| Depreciation | | | (871,640 | ) | | | (267,891 | ) | | | - | | | | 8,540 | | | | - | | | | (1,130,991 | ) | |
| Leased assets | | | (185,775 | ) | | | (73,330 | ) | | | - | | | | 7,803 | | | | - | | | | (251,302 | ) | |
| | | | | | | | | | | | | |
| Properties, Plants and equipment | | | | (1,615,783 | ) | | | 46,403 | | | | - | | | | 616 | | | | (1,568,764 | ) |
| Assets by right of use | | | | 61,343 | | | | 14,506 | | | | - | | | | - | | | | 75,849 | |
| Amortization | | | (160,100 | ) | | | 84,330 | | | | - | | | | 4,606 | | | | - | | | | (71,164 | ) | | | (77,480 | ) | | | 22,486 | | | | - | | | | 174 | | | | (54,820 | ) |
| Provisions | | | 351,077 | | | | 150,362 | | | | 3,911 | | | | (126,813 | ) | | | - | | | | 378,537 | | | | 281,369 | | | | (286,267 | ) | | | (785 | ) | | | (4,778 | ) | | | (10,461 | ) |
| Revaluation of financial instruments | | | 12,806 | | | | 19,760 | | | | (21,103 | ) | | | (3,179 | ) | | | - | | | | 8,284 | | | | 3,223 | | | | 2,417 | | | | (1,770 | ) | | | (120 | ) | | | 3,750 | |
| Tax losses (*) | | | 722,749 | | | | 320,397 | | | | - | | | | (33,364 | ) | | | - | | | | 1,009,782 | | |
| Tax losses | | | | 1,328,736 | | | | 152,081 | | | | - | | | | (1,257 | ) | | | 1,479,560 | |
| Intangibles | | | (523,275 | ) | | | (8,362 | ) | | | - | | | | 167,323 | | | | - | | | | (364,314 | ) | | | (430,705 | ) | | | 24,436 | | | | - | | | | (267 | ) | | | (406,536 | ) |
| Others | | | 9,587 | | | | 45,638 | | | | - | | | | (62,182 | ) | | | (6,845 | ) | | | (13,802 | ) | | | (20,539 | ) | | | (7,547 | ) | | | - | | | | (319 | ) | | | (28,405 | ) |
| | | | | | | | | | | | | | | | | | | | | | | | | | |
| Total | | | (644,571 | ) | | | 270,904 | | | | (17,192 | ) | | | (37,266 | ) | | | (6,845 | ) | | | (434,970 | ) | | | (469,836 | ) | | | (31,485 | ) | | | (2,555 | ) | | | (5,951 | ) | | | (509,827 | ) |
| (b) | From January 1 to December 31, 2016 |
(b) From January 1 to December 31, 2018 Restated (Unaudited)
| | | Opening | | Recognized in | | Recognized in | | Exchange | | | | Ending | | | Opening | | Recognized in | | Recognized in | | Exchange | | Ending | |
| | | balance | | consolidated | | comprehensive | | rate | | | | balance | | | balance | | consolidated | | comprehensive | | rate | | balance | |
| | | Assets/(liabilities) | | income | | income | | variation | | Others | | Asset (liability) | | | Assets/(liabilities) | | income | | income | | variation | | Asset (liability) | |
| | | ThUS$ | | ThUS$ | | ThUS$ | | ThUS$ | | ThUS$ | | ThUS$ | | | ThUS$ | | ThUS$ | | ThUS$ | | ThUS$ | | ThUS$ | |
| Depreciation | | | (1,130,991 | ) | | | (241,435 | ) | | | - | | | | (3,599 | ) | | | - | | | | (1,376,025 | ) | |
| Leased assets | | | (251,302 | ) | | | 14,833 | | | | - | | | | (3,289 | ) | | | - | | | | (239,758 | ) | |
| | | | | | | | | | | | | |
| Property, plant and equipment | | | | (1,568,764 | ) | | | (19,735 | ) | | | - | | | | 6,003 | | | | (1,582,496 | ) |
| Assets for right of use | | | | 75,849 | | | | 9,903 | | | | - | | | | - | | | | 85,752 | |
| Amortization | | | (71,164 | ) | | | (4,375 | ) | | | - | | | | (1,941 | ) | | | - | | | | (77,480 | ) | | | (54,820 | ) | | | (3,735 | ) | | | - | | | | 1,692 | | | | (56,863 | ) |
| Provisions | | | 378,537 | | | | (149,969 | ) | | | 921 | | | | 53,448 | | | | (1,568 | ) | | | 281,369 | | | | (10,461 | ) | | | 92,804 | | | | 1,566 | | | | (46,581 | ) | | | 37,328 | |
| Revaluation of financial instruments | | | 8,284 | | | | 28,294 | | | | (34,695 | ) | | | 1,340 | | | | - | | | | 3,223 | | | | 3,750 | | | | (2,326 | ) | | | (269 | ) | | | (1,168 | ) | | | (13 | ) |
| Tax losses (*) | | | 1,009,782 | | | | 304,892 | | | | - | | | | 14,062 | | | | - | | | | 1,328,736 | | |
| Tax losses | | | | 1,479,560 | | | | (98,154 | ) | | | - | | | | (12,256 | ) | | | 1,369,150 | |
| Intangibles | | | (364,314 | ) | | | 4,131 | | | | - | | | | (70,522 | ) | | | - | | | | (430,705 | ) | | | (406,536 | ) | | | 20,000 | | | | - | | | | 35,298 | | | | (351,238 | ) |
| Others | | | (13,802 | ) | | | (30,185 | ) | | | - | | | | 22,234 | | | | 1,214 | | | | (20,539 | ) | | | (28,405 | ) | | | 5,439 | | | | - | | | | 8,304 | | | | (14,662 | ) |
| | | | | | | | | | | | | | | | | | | | | | | | | | |
| Total | | | (434,970 | ) | | | (73,814 | ) | | | (33,774 | ) | | | 11,733 | | | | (354 | ) | | | (531,179 | ) | | | (509,827 | ) | | | 4,196 | | | | 1,297 | | | | (8,708 | ) | | | (513,042 | ) |
| (c) | From January 1 to December 31, 2017 |
(c) From January 1 to December 31, 2019
| | | Opening | | Recognized in | | Recognized in | | Exchange | | Ending | | | Opening | | Recognized in | | Recognized in | | Exchange | | Ending | |
| | | balance | | consolidated | | comprehensive | | rate | | balance | | | balance | | consolidated | | comprehensive | | rate | | balance | |
| | | Assets/(liabilities) | | income | | income | | variation | | Asset (liability) | | | Assets/(liabilities) | | income | | income | | variation | | Asset (liability) | |
| | | ThUS$ | | ThUS$ | | ThUS$ | | ThUS$ | | ThUS$ | | | ThUS$ | | ThUS$ | | ThUS$ | | ThUS$ | | ThUS$ | |
| Depreciation | | | (1,376,025 | ) | | | 185,282 | | | | - | | | | 322 | | | | (1,190,421 | ) | |
| Leased assets | | | (239,758 | ) | | | (138,879 | ) | | | - | | | | 294 | | | | (378,343 | ) | |
| | | | | | | | | | | | | |
| Property, plant and equipment | | | | (1,582,496 | ) | | | 67,237 | | | | - | | | | 1,355 | | | | (1,513,904 | ) |
| Assets for right of use | | | | 85,752 | | | | 47,729 | | | | - | | | | - | | | | 133,481 | |
| Amortization | | | (77,480 | ) | | | 22,486 | | | | - | | | | 174 | | | | (54,820 | ) | | | (56,863 | ) | | | 3,345 | | | | - | | | | 382 | | | | (53,136 | ) |
| Provisions | | | 281,369 | | | | (286,267 | ) | | | (785 | ) | | | (4,778 | ) | | | (10,461 | ) | | | 37,328 | | | | 13,881 | | | | 2,873 | | | | (10,515 | ) | | | 43,567 | |
| Revaluation of financial instruments | | | 3,223 | | | | 2,417 | | | | (1,770 | ) | | | (120 | ) | | | 3,750 | | | | (13 | ) | | | 10,142 | | | | 414 | | | | (264 | ) | | | 10,279 | |
| Tax losses (*) | | | 1,328,736 | | | | 152,081 | | | | - | | | | (1,257 | ) | | | 1,479,560 | | |
| Tax losses | | | | 1,369,150 | | | | (10,116 | ) | | | - | | | | (2,766 | ) | | | 1,356,268 | |
| Intangibles | | | (430,705 | ) | | | 24,436 | | | | - | | | | (267 | ) | | | (406,536 | ) | | | (351,238 | ) | | | (11,718 | ) | | | - | | | | 13,874 | | | | (349,082 | ) |
| Others | | | (20,539 | ) | | | (7,547 | ) | | | - | | | | (319 | ) | | | (28,405 | ) | | | (14,662 | ) | | | 5,844 | | | | - | | | | 125 | | | | (8,693 | ) |
| | | | | | | | | | | | | | | | | | | | | | |
| Total | | | (531,179 | ) | | | (45,991 | ) | | | (2,555 | ) | | | (5,951 | ) | | | (585,676 | ) | | | (513,042 | ) | | | 126,344 | | | | 3,287 | | | | 2,191 | | | | (381,220 | ) |
Deferred tax assets not recognized:
| | | As of | | As of | | | As of | | As of | |
| | | December 31, | | December 31, | | | December 31, | | December 31, | |
| | | 2017 | | 2016 | | | 2019 | | 2018 | |
| | | ThUS$ | | ThUS$ | | | ThUS$ | | ThUS$ | |
| | | | | | | | | | | |
| Tax losses | | | 81,155 | | | | 115,801 | | | | 110,933 | | | | 137,761 | |
| Total Deferred tax assets not recognized | | | 81,155 | | | | 115,801 | | | | 110,933 | | | | 137,761 | |
Deferred tax assets on tax loss,losses are recognized only to the extent that it is likely probable that future taxable profit will be available against which the realizationtemporary differences can be utilized. As a result, as of futureDecember 31, 2019, the Company no longer recognizes deferred tax benefit By the aboveassets for ThUS $ 110.933 (ThUS $ 137,761 as of December 31, 2018) with respect to losses of ThUS $ 338,679 (ThUS $ 447,150 at December 31, 2017, the Company has not recognized deferred tax assets of ThUS$ 81,155 (ThUS$ 115,801 at December 31, 2016) according with a loss of ThUS$ 247,920 (ThUS$ 340,591 at December 31, 2016)2018).
Deferred tax expense and current income taxes:
| | | For the period ended | |
| | | December 31, | |
| | | 2017 | | | 2016 | | | 2015 | |
| | | ThUS$ | | | ThUS$ | | | ThUS$ | |
| Current tax expense | | | | | | | | | | | | |
| Current tax expense | | | 127,024 | | | | 87,307 | | | | 92,916 | |
| Adjustment to previous period’s current tax | | | 489 | | | | 2,083 | | | | (395 | ) |
| Total current tax expense, net | | | 127,513 | | | | 89,390 | | | | 92,521 | |
| | | | | | | | | | | | | |
| Deferred tax expense | | | | | | | | | | | | |
| Deferred expense for taxes related to the creation and reversal of temporary differences | | | 45,991 | | | | 73,814 | | | | (270,904 | ) |
| Reduction (increase) in value of deferred tax assets during the evaluation of its usefulness | | | - | | | | - | | | | - | |
| Total deferred tax expense, net | | | 45,991 | | | | 73,814 | | | | (270,904 | ) |
| Income tax expense | | | 173,504 | | | | 163,204 | | | | (178,383 | ) |
| | | For the year ended | |
| | | December 31, | |
| | | 2019 | | | 2018 | | | 2017 | |
| | | ThUS$ | | | ThUS$ | | | ThUS$ | |
| | | | | | Restated | | | Restated | |
| | | | | | | | | | |
| Current tax expense | | | | | | | | | | | | |
| Current tax expense | | | 72,999 | | | | 77,713 | | | | 127,024 | |
| Adjustment to previous period’s current tax | | | (352 | ) | | | 362 | | | | 489 | |
| Total current tax expense, net | | | 72,647 | | | | 78,075 | | | | 127,513 | |
| | | | | | | | | | | | | |
| Deferred tax expense | | | | | | | | | | | | |
| | | | | | | | | | | | | |
| Deferred expense for taxes related to the creation and reversal of temporary differences | | | (126,344 | ) | | | (4,196 | ) | | | 31,485 | |
| Total deferred tax expense, net | | | (126,344 | ) | | | (4,196 | ) | | | 31,485 | |
| Income tax expense | | | (53,697 | ) | | | 73,879 | | | | 158,998 | |
Composition of income tax expense (income):
| | | | For the year ended | |
| | | For the period ended | | | December 31, | |
| | | December 31, | | | 2019 | | 2018 | | 2017 | |
| | | 2017 | | 2016 | | 2015 | | | ThUS$ | | ThUS$ | | ThUS$ | |
| | | ThUS$ | | ThUS$ | | ThUS$ | | | | | Restated | | Restated | |
| | | | | | | | | | | | | | | |
| Current tax expense, net, foreign | | | 100,657 | | | | 80,600 | | | | 89,460 | | | | 76,806 | | | | 65,850 | | | | 100,657 | |
| Current tax expense, net, Chile | | | 26,856 | | | | 8,790 | | | | 3,061 | | | | (4,159 | ) | | | 12,225 | | | | 26,856 | |
| Total current tax expense, net | | | 127,513 | | | | 89,390 | | | | 92,521 | | | | 72,647 | | | | 78,075 | | | | 127,513 | |
| | | | | | | | | | | | | | | | | | | | | | | | | |
| Deferred tax expense, net, foreign | | | 21,846 | | | | 119,175 | | | | (280,445 | ) | | | 37,294 | | | | 58,271 | | | | 21,846 | |
| Deferred tax expense, net, Chile | | | 24,145 | | | | (45,361 | ) | | | 9,541 | | | | (163,638 | ) | | | (62,467 | ) | | | 9,639 | |
| Deferred tax expense, net, total | | | 45,991 | | | | 73,814 | | | | (270,904 | ) | | | (126,344 | ) | | | (4,196 | ) | | | 31,485 | |
| Income tax expense | | | 173,504 | | | | 163,204 | | | | (178,383 | ) | | | (53,697 | ) | | | 73,879 | | | | 158,998 | |
Profit before tax by the legal tax rate in Chile (25.5% and 24.0%(27% at December 31, 20172019 and 2016, respectively)
| | | For the period ended | | | For the period ended | |
| | | December 31, | | | December 31, | |
| | | 2017 | | | 2016 | | | 2015 | | | 2017 | | | 2016 | | | 2015 | |
| | | ThUS$ | | | ThUS$ | | | ThUS$ | | | % | | | % | | | % | |
| | | | | | | | | | | | | | | | | | | |
| Tax expense using the legal rate (*) | | | 95,425 | | | | 65,449 | | | | (89,472 | ) | | | 25.50 | | | | 24.00 | | | | 22.50 | |
| Tax effect by change in tax rate (*) | | | 897 | | | | - | | | | - | | | | 0.24 | | | | - | | | | - | |
| Tax effect of rates in other jurisdictions | | | 42,326 | | | | 16,333 | | | | (21,803 | ) | | | 11.31 | | | | 5.99 | | | | 5.48 | |
| Tax effect of non-taxable operating revenues | | | (44,593 | ) | | | (62,419 | ) | | | (106,381 | ) | | | (11.92 | ) | | | (22.89 | ) | | | 26.75 | |
| Tax effect of disallowable expenses | | | 35,481 | | | | 132,469 | | | | 38,677 | | | | 9.48 | | | | 48.58 | | | | (9.73 | ) |
| Tax effect of the use of tax losses not previously recognized | | | 211 | | | | - | | | | - | | | | 0.06 | | | | - | | | | - | |
| Other increases (decreases) in legal tax charge | | | 43,757 | | | | 11,372 | | | | 596 | | | | 11.69 | | | | 4.17 | | | | (0.15 | ) |
| Total adjustments to tax expense using the legal rate | | | 78,079 | | | | 97,755 | | | | (88,911 | ) | | | 20.86 | | | | 35.85 | | | | 22.35 | |
| Tax expense using the effective rate | | | 173,504 | | | | 163,204 | | | | (178,383 | ) | | | 46.36 | | | | 59.85 | | | | 44.85 | |
(*) On September 29, 2014, Law No. 20,780 "Amendment to the system of income taxation and introduces various adjustments in the tax system." was published in the Official Journal of the Republic of Chile. Within major tax reforms that this law contains, the First- Category Tax rate is gradually modified from 2014 to 2018 and should be declared and paid in tax year 2015.2018)
Thus, at
| | | For the year ended | | | For the year ended | |
| | | December 31, | | | December 31, | |
| | | 2019 | | | 2018 | | | 2017 | | | 2019 | | | 2018 | | | 2017 | |
| | | ThUS$ | | | ThUS$ | | | ThUS$ | | | % | | | % | | | % | |
| | | | | | | | | | | | | | | | | | | |
| Tax expense using the legal rate | | | 38,318 | | | | 112,230 | | | | 95,425 | | | | 27.00 | | | | 27.00 | | | | 25.50 | |
| | | | | | | | | | | | | | | | | | | | | | | | | |
| Tax effect by change in tax rate | | | - | | | | 5,587 | | | | 897 | | | | - | | | | 1.34 | | | | 0.24 | |
| Tax effect of rates in other jurisdictions | | | 20,082 | | | | 15,905 | | | | 42,326 | | | | 14.15 | | | | 3.83 | | | | 11.31 | |
| Tax effect of non-taxable operating revenues | | | (13,125 | ) | | | (3,076 | ) | | | (44,593 | ) | | | (9.25 | ) | | | (0.74 | ) | | | (11.92 | ) |
| Tax effect of disallowable expenses | | | 66,257 | | | | 61,295 | | | | 35,481 | | | | 46.69 | | | | 14.75 | | | | 9.48 | |
| Tax effect of due to the non-use of tax losses | | | - | | | | 46,492 | | | | 211 | | | | - | | | | 11.18 | | | | 0.06 | |
| Other increases (decreases) in legal tax charge | | | (165,229 | ) | | | (164,554 | ) | | | 43,757 | | | | (116.43 | ) | | | (39.59 | ) | | | 11.69 | |
| Total adjustments to tax expense using the legal rate | | | (92,015 | ) | | | (38,351 | ) | | | 78,079 | | | | (64.84 | ) | | | (9.23 | ) | | | 20.86 | |
| Tax expense using the effective rate | | | (53,697 | ) | | | 73,879 | | | | 173,504 | | | | (37.84 | ) | | | 17.77 | | | | 46.36 | |
Other increases (decreases) in legal tax charges for US $ 165.2 million (US $ 164.6 million as of December 31, 20172018) mainly include the Company presentseffect of the reconciliationreduction of incomethe deferred tax expenseliability of US $ 145.9 million (US $ 172.9 to 31 December 2018) that occurs at the early termination of the aircraft financing that were on leasing with special purpose vehicle outside Chile; and legal tax rate considering the rate increase.other adjustments for permanent differences in other group companies for US $ 19.3 million (US $ 8.3 as of December 31, 2018).
Deferred taxes related to items charged to net equity:
| | | For the period ended | |
| | | December 31, | |
| | | 2017 | | | 2016 | |
| | | ThUS$ | | | ThUS$ | |
| | | | | | | |
| Aggregate deferred taxation of components of other comprehensive income | | | (2,555 | ) | | | (33,774 | ) |
| Aggregate deferred taxation related to items charged to net equity | | | - | | | | (807 | ) |
| | | For the period ended | |
| | | December 31, | |
| | | 2019 | | | 2018 | |
| | | ThUS$ | | | ThUS$ | |
| | | | | | | |
| Aggregate deferred taxation of components of other comprehensive income | | | 3,287 | | | | 1,297 | |
NOTE 19 - OTHER FINANCIAL LIABILITIES
The composition of other financial liabilities is as follows:
| | | As of | | | As of | |
| | | December 31, | | | December 31, | |
| | | 2017 | | | 2016 | |
| | | ThUS$ | | | ThUS$ | |
| Current | | | | | | | | |
| (a) Interest bearing loans | | | 1,288,749 | | | | 1,814,647 | |
| (b) Hedge derivatives | | | 12,200 | �� | | | 24,881 | |
| Total current | | | 1,300,949 | | | | 1,839,528 | |
| | | | | | | | | |
| Non-current | | | | | | | | |
| (a) Interest bearing loans | | | 6,602,891 | | | | 6,790,273 | |
| (b) Hedge derivatives | | | 2,617 | | | | 6,679 | |
| Total non-current | | | 6,605,508 | | | | 6,796,952 | |
| | | As of | | | As of | |
| | | December 31, | | | December 31, | |
| | | 2019 | | | 2018 | |
| | | ThUS$ | | | ThUS$ | |
| | | | | | Restated | |
| Current | | | | | | |
| (a) Interest bearing loans | | | 1,421,261 | | | | 1,397,156 | |
| (b) Lease Liability | | | 414,027 | | | | 363,497 | |
| (c) Hedge derivatives | | | 50,372 | | | | 25,921 | |
| (d) Derivative non classified as hedge accounting | | | - | | | | 7,712 | |
| Total current | | | 1,885,660 | | | | 1,794,286 | |
| | | | | | | | | |
| Non-current | | | | | | | | |
| (a) Interest bearing loans | | | 5,772,266 | | | | 5,864,570 | |
| (b) Lease Liability | | | 2,758,130 | | | | 2,494,552 | |
| (b) Hedge derivatives | | | 22 | | | | 340 | |
| Total non-current | | | 8,530,418 | | | | 8,359,462 | |
| (a) | Interest bearing loans |
Obligations with credit institutions and debt instruments:
| | | As of | | | As of | |
| | | December 31, | | | December 31, | |
| | | 2017 | | | 2016 | |
| | | ThUS$ | | | ThUS$ | |
| Current | | | | | | | | |
| Loans to exporters | | | 314,618 | | | | 278,164 | |
| Bank loans (1) | | | 59,017 | | | | 290,810 | |
| Guaranteed obligations | | | 531,173 | | | | 578,014 | |
| Other guaranteed obligations | | | 2,170 | | | | 1,908 | |
| Subtotal bank loans | | | 906,978 | | | | 1,148,896 | |
| | | | | | | | | |
| Obligation with the public (2) | | | 14,785 | | | | 312,043 | |
| Financial leases | | | 276,541 | | | | 268,040 | |
| Other loans | | | 90,445 | | | | 85,668 | |
| Total current | | | 1,288,749 | | | | 1,814,647 | |
| | | As of | | As of | | | As of | | As of | |
| | | December 31, | | December 31, | | | December 31, | | December 31, | |
| | | 2017 | | 2016 | | | 2019 | | 2018 | |
| | | ThUS$ | | ThUS$ | | | ThUS$ | | ThUS$ | |
| | | | | | | |
| Current | | | | | | |
| Loans to exporters | | | | 341,475 | | | | 400,721 | |
| Bank loans | | | | 16,534 | | | | 37,743 | |
| Guaranteed obligations (4) | | | | 237,951 | | | | 324,976 | |
| Other guaranteed obligations | | | | 97,730 | | | | 97,143 | |
| Subtotal bank loans | | | | 693,690 | | | | 860,583 | |
| Obligation with the public | | | | 32,061 | | | | 14,643 | |
| Financial leases (4) | | | | 594,249 | | | | 425,100 | |
| Other loans | | | | 101,261 | | | | 96,830 | |
| Total current | | | | 1,421,261 | | | | 1,397,156 | |
| | | | | | | | | | |
| Non-current | | | | | | | | | | | | | | | | |
| Bank loans | | | 260,433 | | | | 294,477 | | | | 200,721 | | | | 184,998 | |
| Guaranteed obligations (3) | | | 3,505,669 | | | | 4,180,538 | | |
| Guaranteed obligations (4) | | | | 1,919,376 | | | | 2,209,045 | |
| Other guaranteed obligations | | | 240,007 | | | | 254,512 | | | | 482,702 | | | | 576,309 | |
| Subtotal bank loans | | | 4,006,109 | | | | 4,729,527 | | | | 2,602,799 | | | | 2,970,352 | |
| | | | | | | | | | |
| Obligation with the public (4) (5) (6) | | | 1,569,281 | | | | 997,302 | | |
| Financial leases | | | 832,964 | | | | 754,321 | | |
| Obligation with the public (1)(2)(3) | | | | 2,032,873 | | | | 1,538,436 | |
| Financial leases (4) | | | | 1,136,594 | | | | 1,199,754 | |
| Other loans | | | 194,537 | | | | 309,123 | | | | - | | | | 156,028 | |
| Total non-current | | | 6,602,891 | | | | 6,790,273 | | | | 5,772,266 | | | | 5,864,570 | |
| Total obligations with financial institutions | | | 7,891,640 | | | | 8,604,920 | | | | 7,193,527 | | | | 7,261,726 | |
(1) On September 29, 2016 TAM Linhas Aéreas S.A. obtained financing for US$ 200 million, guaranteed with 18% of the shares of Multiplus S.A., percentage adjustable depending on the shares price. Additionally, TAM obtained a hedging economic (Cross Currency Swap) for the same amount and period, in order to convert the commitment currency from US$ to BRL.
On March 30, 2017, TAM Linhas Aéreas S.A. restructured the financing mentioned in the previous paragraph, modifying the nominal amount of the transaction to US $ 137 million.
On September 27, 2017, TAM Linhas Aéreas S.A. made the payment of capital plus interest corresponding to the last installment of the financing described above. Simultaneously, all the garments were lifted on the shares of Multiplus S.A. delivered as collateral.
(2) On April 25, 2017, the payment of the principal plus interest on the long-term bonds issued by the company TAM Capital Inc. for an amount of US$ 300,000,000 at an interest rate of 7.375% annual. The payment consisted of 100% of the capital, US$ 300,000,000, and interest accrued as of the date of payment for ThUS $ 11,063.
(3) On April 10, 2017, the issuance and private placement of debt securities in the amount of US$ 140,000,000 was made under the current structure of the Enhanced Equipment Trust Certificates ("EETC") issued and placed the year 2015 to finance the acquisition of eleven Airbus A321-200, two Airbus A350-900 and four Boeing 787-9 with arrivals between July 2015 and April 2016. The offer is made up of Class C Certificates, which are subordinate to the Current Class A Certificates and Class B Certificates held by the Company. The term of the Class C Certificates is six years and expires in 2023.
(4) On AprilFebruary 11, 2017,2019, LATAM Finance Limited, a company incorporated in the Cayman Islands with limited liability and exclusively owned by LATAM Airlines Group SA, has issued and placed on the international market, pursuant to Rule 144 -A144-A and Regulation S of the securities laws of the United States of America, unsecured long-term unsecured bonds in thefor a nominal amount of US$ 700,000,000, maturing in 2024US $ 600,000,000 at an annual interest rate of 6.875%7.00%.
The bonds were placed at an issue price of 99.309% with respect to its even value. The bonds have semiannual interest payments and amortization of all capital at maturity and maturity date on March 1, 2026, unless they will be redeemed early according to their terms. As reported into the essential fact of April 6, 2017,market, the Issueissuance and placement of the 144-A Bonds was intended to finance general corporate purposes of LATAM.purposes.
(5)(2) On August 17, 2017,June 6, 2019, LATAM made the placementAirlines Group S.A. has issued in the local market (Santiago Stock Exchange) of thelong-term unsecured bonds called Series A Bonds (BLATM-A), Series B (BLATM-B), Series C (BLATM-) C) and Series D (BLATM-D)E (BLATM-E), which correspond to the first issueseries of bonds charged to the line inscribedregistered in the Securities Registry ofRegistro de Comisión para el Mercado Financiero (“CMF”) under the Commission for the Financial Market (“CMF”), under number 862Nº 921 dated November 26, 2018 for a total of UF 9,000,000.
The total amount placed of the Series A Bondissued was UF 2,500,000; The total amount placed of the Series B Bond was UF 2,500,000. The total amount placed of the Series C Bond was UF 1,850,000. The total amount placed of the Series D Bond was UF 1,850,000, thus totaling UF 8,700,000.
The Series A Bonds have5,000,000 with an expiration date on June 1, 2022April 15, 2029 and a 3.60% annual coupon rate with semiannual interest payments. The placement rate was 2.73%, equivalent to an annual interest rateamount of 5.25%. The Series B Bonds have an expiration date on January 1, 2028 and an annual interest rate of 5.75%. The Series C Bonds have an expiration date on June 1, 2022 and an annual interest rate of 5.25%. The Series D Bonds have an expiration date on January 1, 2028 and an annual interest rate of 5.75%.ThUS$ 215,093.
The proceedsfunds from the issuance were allocated 50% to the refinancing of liabilities, 30% for the financing of investments and 20% for general corporate purposes.
(3) On July 11, 2019, LATAM Finance Limited, a company incorporated in the Cayman Islands with limited liability and exclusive property of LATAM Airlines Group SA, issued a re-opening of the LATAM 2026 bond, issued on February 11 of 2019, for US $ 200,000,000. This re-opening had a placement rate of 5.979%.
Simultaneously, dated July 11, 2019, LATAM Airlines Group S.A. announced an offer for the repurchase of up to US $ 300 million of the Series A, Series B, Series C and Series D Bonds were allocated in full to the partial financing of the early redemption of the total bonds of TAM Capital 3 inc.
(6) On September 1, 2017, TAM Capital 3 Inc., a company controlled indirectly by TAM S.A. through its subsidiary TAM Linhas Aéreas SA,unsecured LATAM 2020 bond, which consolidates its financial statements with LATAM, made the full advance redemption of the bonds it placed abroadwas issued on June 3, 2011,9, 2015 for an amount of US $ 500 million at a 8.375%coupon rate of 7.25% and with andue in June 2020. Offer repurchase price was 103.8 cents per dollar of nominal amount for the bonds offered until July 24, 2019, after this date and until August 7, 2019, the offered repurchase price was reduced to 100.8 cents for dollar at the expiration dateof the offer, a total of US $ 238,412,000 of the bonds were redeemed, of which US $ 238,162,000 arrived on June 3, 2021. or before July 24, 2019 and US $ 250,000 after that date.
The total redemption was partially financed with the placement of bonds in the local market described in number (5) above, and the balance, with other funds availablenet proceeds obtained from the Company.re-opening of the LATAM 2026 bond was used to pay a portion of the public offer of the LATAM 2020 bond. The remainder of the public offer was paid in cash.
All interest-bearing liabilities are recorded accordingOn December 17, 2019, LATAM Airlines Group S.A. The repurchase of the remainder (US $ 262 million) of the unsecured bond LATAM2020 ended, which, added to the effective rate method. Under IFRS, inrepurchase of July 11, 2019, ends the case of fixed rate loans, the effective rate determined does not vary over the durationentire balance of the loan, whereasbond. The repurchase was carried out through the buy-back mechanism called “Make-Whole,” which is a right of the bond issuer to repurchase the entire outstanding balance of debt based on a price that is calculated using government treasury bonds. of the United States with maturity close to that of the bond and adding a spread. The repurchase price was 102,45 cents per dollar of nominal bond amount.
(4) In the year ended December 31, 2019, the Company sold its participation in variable rate loans,8 permanent establishments. As a result of the effective rate changes toabove, the dateclassification of each paymentfinancial liabilities associated with 41 aircraft of interest.guaranteed obligations became financial leases.
Currency balances that make the interest bearing loans:
| | | As of | | | As of | |
| | | December 31, | | | December 31, | |
| | | 2017 | | | 2016 | |
| | ThUS$ | | | ThUS$ | |
| Currency | | | | | | |
| | | | | | | |
| Brazilian real | | | 130 | | | | 1,253 | |
| Chilean peso (U.F.) | | | 521,122 | | | | 203,194 | |
| US Dollar | | | 7,370,388 | | | | 8,400,473 | |
| | | | | | | | | |
| Total | | | 7,891,640 | | | | 8,604,920 | |
| | | As of | | | As of | |
| | | December 31, | | | December 31, | |
| | | 2019 | | | 2018 | |
| Currency | | ThUS$ | | | ThUS$ | |
| Chilean peso (U.F.) | | | 611,542 | | | | 500,398 | |
| US Dollar | | | 6,581,985 | | | | 6,761,328 | |
| Total | | | 7,193,527 | | | | 7,261,726 | |
Interest-bearing loans due in installments to December 31, 20172019
Debtor: LATAM Airlines Group S.A. and Subsidiaries, Tax No. 89.862.200-2, Chile.
| | | | | | | | | Nominal values | | | Accounting values | | | | | | | | | |
| | | | | | | | | | | | More than | | | More than | | | More than | | | | | | | | | | | | More than | | | More than | | | More than | | | | | | | | | | | | | | | |
| | | | | | | | | Up to | | | 90 days | | | one to | | | three to | | | More than | | | Total | | | Up to | | | 90 days | | | one to | | | three to | | | More than | | | Total | | | | | | | | | |
| | | | | Creditor | | | | 90 | | | to one | | | three | | | five | | | five | | | nominal | | | 90 | | | to one | | | three | | | five | | | five | | | accounting | | | | | Effective | | | Nominal | |
| Tax No. | | Creditor | | country | | Currency | | days | | | year | | | years | | | years | | | years | | | value | | | days | | | year | | | years | | | years | | | years | | | value | | | Amortization | | rate | | | rate | |
| | | | | | | | | ThUS$ | | | ThUS$ | | | ThUS$ | | | ThUS$ | | | ThUS$ | | | ThUS$ | | | ThUS$ | | | ThUS$ | | | ThUS$ | | | ThUS$ | | | ThUS$ | | | ThUS$ | | | | | % | | | % | |
| | | | | | | | | | | | | | | | | | | | | | | | | | | | | | | | | | | | | | | | | | | | | | | | | | | |
| Loans to exporters | | | | | | | | | | | | | | | | | | | | | | | | | | | | | | | | | | | | | | | | | | | | | | | | | | | | | | | | | | |
| | | | | | | | | | | | | | | | | | | | | | | | | | | | | | | | | | | | | | | | | | | | | | | | | | | | | | | | | | | | | | | | | |
| 97.032.000-8 | | BBVA | | Chile | | ThUS$ | | | 75,000 | | | | - | | | | - | | | | - | | | | - | | | | 75,000 | | | | 75,781 | | | | - | | | | - | | | | - | | | | - | | | | 75,781 | | | At Expiration | | | 2.30 | | | | 2.30 | |
| 97.032.000-8 | | BBVA | | Chile | | UF | | | - | | | | 55,801 | | | | - | | | | - | | | | - | | | | 55,801 | | | | - | | | | 55,934 | | | | - | | | | - | | | | - | | | | 55,934 | | | At Expiration | | | 3.57 | | | | 2.77 | |
| 97.036.000-K | | SANTANDER | | Chile | | ThUS$ | | | 30,000 | | | | - | | | | - | | | | - | | | | - | | | | 30,000 | | | | 30,129 | | | | - | | | | - | | | | - | | | | - | | | | 30,129 | | | At Expiration | | | 2.49 | | | | 2.49 | |
| 97.030.000-7 | | ESTADO | | Chile | | ThUS$ | | | 40,000 | | | | - | | | | - | | | | - | | | | - | | | | 40,000 | | | | 40,071 | | | | - | | | | - | | | | - | | | | - | | | | 40,071 | | | At Expiration | | | 2.57 | | | | 2.57 | |
| 97.003.000-K | | BANCO DO BRASIL | | Chile | | ThUS$ | | | 100,000 | | | | - | | | | - | | | | - | | | | - | | | | 100,000 | | | | 100,696 | | | | - | | | | - | | | | - | | | | - | | | | 100,696 | | | At Expiration | | | 2.40 | | | | 2.40 | |
| 97.951.000-4 | | HSBC | | Chile | | ThUS$ | | | 12,000 | | | | - | | | | - | | | | - | | | | - | | | | 12,000 | | | | 12,007 | | | | - | | | | - | | | | - | | | | - | | | | 12,007 | | | At Expiration | | | 2.03 | | | | 2.03 | |
| | | | | | | | | | | | | | | | | | | | | | | | | | | | | | | | | | | | | | | | | | | | | | | | | | | | | | | | | | | | | | | | | |
| Bank loans | | | | | | | | | | | | | | | | | | | | | | | | | | | | | | | | | | | | | | | | | | | | | | | | | | | | | | | | | | |
| | | | | | | | | | | | | | | | | | | | | | | | | | | | | | | | | | | | | | | | | | | | | | | | | | | | | | | | | | | | | | | | | |
| 97.023.000-9 | | CORPBANCA | | Chile | | UF | | | 21,298 | | | | 21,360 | | | | 42,006 | | | | - | | | | - | | | | 84,664 | | | | 21,542 | | | | 21,360 | | | | 41,548 | | | | - | | | | - | | | | 84,450 | | | Quarterly | | | 3.68 | | | | 3.68 | |
| 0-E | | BLADEX | | U.S.A. | | ThUS$ | | | - | | | | 15,000 | | | | 15,000 | | | | - | | | | - | | | | 30,000 | | | | - | | | | 15,133 | | | | 14,750 | | | | - | | | | - | | | | 29,883 | | | Semiannual | | | 5.51 | | | | 5.51 | |
| 97.036.000-K | | SANTANDER | | Chile | | ThUS$ | | | - | | | | - | | | | 202,284 | | | | - | | | | - | | | | 202,284 | | | | 439 | | | | - | | | | 202,284 | | | | - | | | | - | | | | 202,723 | | | Quarterly | | | 4.41 | | | | 4.41 | |
| | | | | | | | | | | | | | | | | | | | | | | | | | | | | | | | | | | | | | | | | | | | | | | | | | | | | | | | | | | | | | | | | |
| Obligations with the public | | | | | | | | | | | | | | | | | | | | | | | | | | | | | | | | | | | | | | | | | | | | | | | | | | | | | | | | | | |
| 0-E | | BANK OF NEW YORK | | U.S.A. | | ThUS$ | | | - | | | | - | | | | 500,000 | | | | - | | | | 700,000 | | | | 1,200,000 | | | | - | | | | 13,047 | | | | 492,745 | | | | - | | | | 697,536 | | | | 1,203,328 | | | At Expiration | | | 7.44 | | | | 7.03 | |
| 97.030.000-7 | | ESTADO | | Chile | | UF | | | - | | | | - | | | | - | | | | 189,637 | | | | 189,637 | | | | 379,274 | | | | - | | | | 1,738 | | | | | | | | 189,500 | | | | 189,500 | | | | 380,738 | | | At Expiration | | | 5.50 | | | | 5.50 | |
| | | | | | | | | | | | | | | | | | | | | | | | | | | | | | | | | | | | | | | | | | | | | | | | | | | | | | | | | | | | | | | | | |
| Guaranteed obligations | | | | | | | | | | | | | | | | | | | | | | | | | | | | | | | | | | | | | | | | | | | | | | | | | | | | | | | | | | |
| | | | | | | | | | | | | | | | | | | | | | | | | | | | | | | | | | | | | | | | | | | | | | | | | | | | | | | | | | | | | | | | | |
| 0-E | | CREDIT AGRICOLE | | France | | ThUS$ | | | 7,767 | | | | 23,840 | | | | 54,074 | | | | 12,410 | | | | - | | | | 98,091 | | | | 8,101 | | | | 23,840 | | | | 52,924 | | | | 12,026 | | | | - | | | | 96,891 | | | Quarterly | | | 2.66 | | | | 2.22 | |
| 0-E | | BNP PARIBAS | | U.S.A. | | ThUS$ | | | 10,929 | | | | 44,145 | | | | 114,800 | | | | 119,948 | | | | 285,399 | | | | 575,221 | | | | 13,328 | | | | 44,781 | | | | 111,319 | | | | 117,987 | | | | 282,714 | | | | 570,129 | | | Quarterly | | | 3.41 | | | | 3.40 | |
| 0-E | | WELLS FARGO | | U.S.A. | | ThUS$ | | | 27,223 | | | | 82,402 | | | | 225,221 | | | | 233,425 | | | | 240,716 | | | | 808,987 | | | | 30,143 | | | | 82,402 | | | | 203,371 | | | | 224,295 | | | | 236,179 | | | | 776,390 | | | Quarterly | | | 2.46 | | | | 1.75 | |
| 0-E | | WILMINGTON TRUST | | U.S.A. | | ThUS$ | | | 20,427 | | | | 61,669 | | | | 175,334 | | | | 183,332 | | | | 594,091 | | | | 1,034,853 | | | | 26,614 | | | | 61,669 | | | | 169,506 | | | | 180,520 | | | | 590,723 | | | | 1,029,032 | | | Quarterly | | | 4.48 | | | | 4.48 | |
| 0-E | | CITIBANK | | U.S.A. | | ThUS$ | | | 11,994 | | | | 36,501 | | | | 101,230 | | | | 104,308 | | | | 97,184 | | | | 351,217 | | | | 13,231 | | | | 36,501 | | | | 95,208 | | | | 101,558 | | | | 94,807 | | | | 341,305 | | | Quarterly | | | 3.31 | | | | 2.47 | |
| 0-E | | BTMU | | U.S.A. | | ThUS$ | | | 2,856 | | | | 8,689 | | | | 24,007 | | | | 25,278 | | | | 13,904 | | | | 74,734 | | | | 3,082 | | | | 8,689 | | | | 22,955 | | | | 24,941 | | | | 13,849 | | | | 73,516 | | | Quarterly | | | 2.87 | | | | 2.27 | |
| 0-E | | APPLE BANK | | U.S.A. | | ThUS$ | | | 1,401 | | | | 4,278 | | | | 11,828 | | | | 12,474 | | | | 7,242 | | | | 37,223 | | | | 1,583 | | | | 4,278 | | | | 11,303 | | | | 12,303 | | | | 7,212 | | | | 36,679 | | | Quarterly | | | 2.78 | | | | 2.18 | |
| 0-E | | US BANK | | U.S.A. | | ThUS$ | | | 15,157 | | | | 45,992 | | | | 126,550 | | | | 132,441 | | | | 152,693 | | | | 472,833 | | | | 17,364 | | | | 45,992 | | | | 109,705 | | | | 125,006 | | | | 148,318 | | | | 446,385 | | | Quarterly | | | 4.00 | | | | 2.82 | |
| 0-E | | DEUTSCHE BANK | | U.S.A. | | ThUS$ | | | 2,965 | | | | 9,127 | | | | 25,826 | | | | 28,202 | | | | 30,786 | | | | 96,906 | | | | 3,534 | | | | 9,127 | | | | 25,130 | | | | 27,739 | | | | 30,323 | | | | 95,853 | | | Quarterly | | | 4.39 | | | | 4.39 | |
| 0-E | | NATIXIS | | France | | ThUS$ | | | 14,645 | | | | 44,627 | | | | 107,068 | | | | 91,823 | | | | 154,848 | | | | 413,011 | | | | 15,642 | | | | 44,627 | | | | 105,056 | | | | 90,823 | | | | 153,124 | | | | 409,272 | | | Quarterly | | | 3.42 | | | | 3.40 | |
| 0-E | | PK AIRFINANCE | | U.S.A. | | ThUS$ | | | 2,163 | | | | 6,722 | | | | 19,744 | | | | 17,871 | | | | - | | | | 46,500 | | | | 2,225 | | | | 6,722 | | | | 19,744 | | | | 17,871 | | | | - | | | | 46,562 | | | Monthly | | | 3.18 | | | | 3.18 | |
| 0-E | | KFW IPEX-BANK | | Germany | | ThUS$ | | | 2,397 | | | | 6,678 | | | | 16,173 | | | | 1,640 | | | | - | | | | 26,888 | | | | 2,428 | | | | 6,677 | | | | 16,174 | | | | 1,640 | | | | - | | | | 26,919 | | | Quarterly | | | 3.31 | | | | 3.31 | |
| 0-E | | AIRBUS FINANCIAL | | U.S.A. | | ThUS$ | | | 1,855 | | | | 5,654 | | | | 15,416 | | | | - | | | | - | | | | 22,925 | | | | 1,900 | | | | 5,654 | | | | 15,416 | | | | - | | | | - | | | | 22,970 | | | Monthly | | | 3.19 | | | | 3.19 | |
| 0-E | | INVESTEC | | England | | ThUS$ | | | 1,374 | | | | 7,990 | | | | 20,440 | | | | 22,977 | | | | 10,597 | | | | 63,378 | | | | 1,808 | | | | 8,181 | | | | 19,801 | | | | 22,769 | | | | 10,565 | | | | 63,124 | | | Semiannual | | | 6.04 | | | | 6.04 | |
| - | | SWAP Aviones llegados | | - | | ThUS$ | | | 301 | | | | 749 | | | | 765 | | | | - | | | | - | | | | 1,815 | | | | 301 | | | | 749 | | | | 765 | | | | - | | | | - | | | | 1,815 | | | Quarterly | | | | | | | - | |
| | | | | | | | | | | | | | | | | | | | | | | | | | | | | | | | | | | | | | | | | | | | | | | | | | | | | | | | | | | | | | | | | |
| Other guaranteed obligations | | | | | | | | | | | | | | | | | | | | | | | | | | | | | | | | | | | | | | | | | | | | | | | | | | | | | | | | | | |
| | | | | | | | | | | | | | | | | | | | | | | | | | | | | | | | | | | | | | | | | | | | | | | | | | | | | | | | | | | | | | | | | |
| 0-E | | CREDIT AGRICOLE | | France | | ThUS$ | | | - | | | | - | | | | 241,287 | | | | - | | | | - | | | | 241,287 | | | | 2,170 | | | | - | | | | 240,007 | | | | - | | | | - | | | | 242,177 | | | At Expiration | | | 3.38 | | | | 3.38 | |
| | | | | | | | | | | | | | | | | | | | | | | | | | | | | | | | | | | | | | | | | | | | | | | | | | | | | | | | | | | | | | | | | |
| Financial leases | | | | | | | | | | | | | | | | | | | | | | | | | | | | | | | | | | | | | | | | | | | | | | | | | | | | | | | | | | |
| | | | | | | | | | | | | | | | | | | | | | | | | | | | | | | | | | | | | | | | | | | | | | | | | | | | | | | | | | | | | | | | | |
| 0-E | | ING | | U.S.A. | | ThUS$ | | | 5,347 | | | | 10,779 | | | | 26,831 | | | | - | | | | - | | | | 42,957 | | | | 5,717 | | | | 10,779 | | | | 26,500 | | | | - | | | | - | | | | 42,996 | | | Quarterly | | | 5.67 | | | | 5.00 | |
| 0-E | | CITIBANK | | U.S.A. | | ThUS$ | | | 11,206 | | | | 34,267 | | | | 86,085 | | | | 49,853 | | | | 2,863 | | | | 184,274 | | | | 12,013 | | | | 34,267 | | | | 84,104 | | | | 49,516 | | | | 2,859 | | | | 182,759 | | | Quarterly | | | 3.78 | | | | 3.17 | |
| 0-E | | PEFCO | | U.S.A. | | ThUS$ | | | 12,526 | | | | 32,850 | | | | 22,407 | | | | - | | | | - | | | | 67,783 | | | | 12,956 | | | | 32,850 | | | | 22,088 | | | | - | | | | - | | | | 67,894 | | | Quarterly | | | 5.46 | | | | 4.85 | |
| 0-E | | BNP PARIBAS | | U.S.A. | | ThUS$ | | | 13,146 | | | | 33,840 | | | | 48,823 | | | | 2,296 | | | | - | | | | 98,105 | | | | 13,548 | | | | 33,840 | | | | 48,253 | | | | 2,293 | | | | - | | | | 97,934 | | | Quarterly | | | 3.66 | | | | 3.25 | |
| 0-E | | WELLS FARGO | | U.S.A. | | ThUS$ | | | 10,630 | | | | 33,866 | | | | 91,162 | | | | 64,471 | | | | 20,984 | | | | 221,113 | | | | 11,460 | | | | 33,866 | | | | 88,674 | | | | 63,860 | | | | 20,903 | | | | 218,763 | | | Quarterly | | | 3.17 | | | | 2.67 | |
| 97.036.000-K | | SANTANDER | | Chile | | ThUS$ | | | 5,459 | | | | 16,542 | | | | 45,416 | | | | 46,472 | | | | 3,134 | | | | 117,023 | | | | 5,813 | | | | 16,542 | | | | 44,010 | | | | 46,153 | | | | 3,128 | | | | 115,646 | | | Quarterly | | | 2.51 | | | | 1.96 | |
| 0-E | | RRPF ENGINE | | England | | ThUS$ | | | 265 | | | | 2,430 | | | | 6,856 | | | | 7,441 | | | | 8,991 | | | | 25,983 | | | | 265 | | | | 2,430 | | | | 6,856 | | | | 7,441 | | | | 8,991 | | | | 25,983 | | | Monthly | | | 4.01 | | | | 4.01 | |
| | | | | | | | | | | | | | | | | | | | | | | | | | | | | | | | | | | | | | | | | | | | | | | | | | | | | | | | | | | | | | | | | |
| Other loans | | | | | | | | | | | | | | | | | | | | | | | | | | | | | | | | | | | | | | | | | | | | | | | | | | | | | | | | | | |
| | | | | | | | | | | | | | | | | | | | | | | | | | | | | | | | | | | | | | | | | | | | | | | | | | | | | | | | | | | | | | | | | |
| 0-E | | CITIBANK (*) | | U.S.A. | | ThUS$ | | | 21,822 | | | | 67,859 | | | | 196,210 | | | | - | | | | - | | | | 285,891 | | | | 22,586 | | | | 67,859 | | | | 194,537 | | | | - | | | | - | | | | 284,982 | | | Quarterly | | | 6.00 | | | | 6.00 | |
| | | | | | | | | | | | | | | | | | | | | | | | | | | | | | | | | | | | | | | | | | | | | | | | | | | | | | | | | | | | | | | | | |
| | | Total | | | | | | | 482,153 | | | | 713,657 | | | | 2,562,843 | | | | 1,346,299 | | | | 2,513,069 | | | | 7,618,021 | | | | 508,477 | | | | 729,534 | | | | 2,484,733 | | | | 1,318,241 | | | | 2,490,731 | | | | 7,531,716 | | | | | | | | | | | |
(*) Bonus securitized with the future flows of credit card sales in the United States and Canada.
Interest-bearing loans due in installments to December 31, 2017
Debtor: TAM S.A. and Subsidiaries, Tax No. 02.012.862/0001-60, Brazil.
| | | | | | | | | Nominal values | | | Accounting values | | | | | | | | | |
| | | | | | | | | | | | More than | | | More than | | | More than | | | | | | | | | | | | More than | | | More than | | | More than | | | | | | | | | | | | | | | |
| | | | | | | | | Up to | | | 90 days | | | one to | | | three to | | | More than | | | Total | | | Up to | | | 90 days | | | one to | | | three to | | | More than | | | Total | | | | | | | | | |
| | | | | Creditor | | | | 90 | | | to one | | | three | | | five | | | five | | | nominal | | | 90 | | | to one | | | three | | | five | | | five | | | accounting | | | | | Effective | | | Nominal | |
| Tax No. | | Creditor | | country | | Currency | | days | | | year | | | years | | | years | | | years | | | value | | | days | | | year | | | years | | | years | | | years | | | value | | | Amortization | | rate | | | rate | |
| | | | | | | | | ThUS$ | | | ThUS$ | | | ThUS$ | | | ThUS$ | | | ThUS$ | | | ThUS$ | | | ThUS$ | | | ThUS$ | | | ThUS$ | | | ThUS$ | | | ThUS$ | | | ThUS$ | | | | | % | | | % | |
| | | | | | | | | | | | | | | | | | | | | | | | | | | | | | | | | | | | | | | | | | | | | | | | | | | |
| Bank loans | | | | | | | | | | | | | | | | | | | | | | | | | | | | | | | | | | | | | | | | | | | | | | | | | | | | | | | | | | |
| | | | | | | | | | | | | | | | | | | | | | | | | | | | | | | | | | | | | | | | | | | | | | | | | | | | | | | | | | | | | | | | | |
| 0-E | | NEDERLANDSCHE | | | | | | | | | | | | | | | | | | | | | | | | | | | | | | | | | | | | | | | | | | | | | | | | | | | | | | | | | | | | | | |
| | | CREDIETVERZEKERING MAATSCHAPPIJ | | Holland | | ThUS$ | | | 130 | | | | 401 | | | | 1,161 | | | | 690 | | | | - | | | | 2,382 | | | | 142 | | | | 401 | | | | 1,161 | | | | 690 | | | | - | | | | 2,394 | | | Monthly | | | 6.01 | | | | 6.01 | |
| | | | | | | | | | | | | | | | | | | | | | | | | | | | | | | | | | | | | | | | | | | | | | | | | | | | | | | | | | | | | | | | | |
| Financial leases | | | | | | | | | | | | | | | | | | | | | | | | | | | | | | | | | | | | | | | | | | | | | | | | | | | | | | | | | | |
| | | | | | | | | | | | | | | | | | | | | | | | | | | | | | | | | | | | | | | | | | | | | | | | | | | | | | | | | | | | | | | | | |
| 0-E | | NATIXIS | | France | | ThUS$ | | | 2,853 | | | | 6,099 | | | | 19,682 | | | | 70,402 | | | | - | | | | 99,036 | | | | 3,592 | | | | 6,099 | | | | 19,682 | | | | 70,402 | | | | - | | | | 99,775 | | | Quarterly/Semiannual | | | 5.59 | | | | 5.59 | |
| 0-E | | WACAPOU LEASING S.A. | | Luxemburg | | ThUS$ | | | 696 | | | | 2,125 | | | | 6,020 | | | | 3,206 | | | | - | | | | 12,047 | | | | 732 | | | | 2,125 | | | | 6,020 | | | | 3,207 | | | | - | | | | 12,084 | | | Quarterly | | | 3.69 | | | | 3.69 | |
| 0-E | | SOCIÉTÉ GÉNÉRALE MILAN BRANCH | | Italy | | ThUS$ | | | 8,964 | | | | 27,525 | | | | 208,024 | | | | - | | | | - | | | | 244,513 | | | | 9,992 | | | | 27,525 | | | | 208,024 | | | | - | | | | - | | | | 245,541 | | | Quarterly | | | 4.87 | | | | 4.81 | |
| 0-E | | BANCO IBM S.A | | Brazil | | BRL | | | 21 | | | | - | | | | - | | | | - | | | | - | | | | 21 | | | | 21 | | | | - | | | | - | | | | - | | | | - | | | | 21 | | | Monthly | | | 6.89 | | | | 6.89 | |
| 0-E | | SOCIETE GENERALE | | France | | BRL | | | 101 | | | | 8 | | | | - | | | | - | | | | - | | | | 109 | | | | 101 | | | | 8 | | | | - | | | | - | | | | - | | | | 109 | | | Monthly | | | 6.89 | | | | 6.89 | |
| | | | | | | | | | | | | | | | | | | | | | | | | | | | | | | | | | | | | | | | | | | | | | | | | | | | | | | | | | | | | | | | | |
| | | Total | | | | | | | 12,765 | | | | 36,158 | | | | 234,887 | | | | 74,298 | | | | - | | | | 358,108 | | | | 14,580 | | | | 36,158 | | | | 234,887 | | | | 74,299 | | | | - | | | | 359,924 | | | | | | | | | | | |
| | | | | | | | | | | | | | | | | | | | | | | | | | | | | | | | | | | | | | | | | | | | | | | | | | | | | | | | | | | | | | | | | |
| | | Total consolidated | | | | | | | 494,918 | | | | 749,815 | | | | 2,797,730 | | | | 1,420,597 | | | | 2,513,069 | | | | 7,976,129 | | | | 523,057 | | | | 765,692 | | | | 2,719,620 | | | | 1,392,540 | | | | 2,490,731 | | | | 7,891,640 | | | | | | | | | | | |
Interest-bearing loans due in installments to December 31, 2016
Debtor: LATAM Airlines Group S.A. and Subsidiaries, Tax No. 89.862.200-2, Chile.
| | | | | | | | | Nominal values | | Accounting values | | | | | | | | | | | | | | | Nominal values | | Accounting values | | | | | | | |
| | | | | | | | | | | More than | | More than | | More than | | | | | | | | More than | | More than | | More than | | | | | | | | | | | | | | | More than | | More than | | More than | | | | | | | | More than | | More than | | More than | | | | | | | | | |
| | | | | | | | | Up to | | 90 days | | one to | | three to | | More than | | Total | | Up to | | 90 days | | one to | | three to | | More than | | Total | | | | | | | | | Up to | | 90 days | | one to | | three to | | More than | | Total | | Up to | | 90 days | | one to | | three to | | More than | | Total | | | | | |
| | | | | Creditor | | | | 90 | | to one | | three | | five | | five | | nominal | | 90 | | to one | | three | | five | | five | | accounting | | | | Effective | | Nominal | | | Creditor | | 90 | | to one | | three | | five | | five | | nominal | | 90 | | to one | | three | | five | | five | | accounting | | Effective | | Nominal | |
| Tax No. | | Creditor | | country | | Currency | | days | | year | | years | | years | | years | | value | | days | | year | | years | | years | | years | | value | | Amortization | | rate | | rate | | | Creditor | | country | | Currency | | days | | year | | years | | years | | years | | value | | days | | year | | years | | years | | years | | value | | Amortization | | rate | | rate | |
| | | | | | | | | ThUS$ | | ThUS$ | | ThUS$ | | ThUS$ | | ThUS$ | | ThUS$ | | ThUS$ | | ThUS$ | | ThUS$ | | ThUS$ | | ThUS$ | | ThUS$ | | | | % | | % | | | ThUS$ | | ThUS$ | | ThUS$ | | ThUS$ | | ThUS$ | | ThUS$ | | ThUS$ | | ThUS$ | | ThUS$ | | ThUS$ | | ThUS$ | | ThUS$ | | % | | % | |
| | | | | | | | | | | | | | | | | | | | | | | | | | | | | | | | | | | | | | | | | | | | | | | | | | | | | | | | | | | | | | | | | | | |
| Loans to exporters | Loans to exporters | | | | | | | | | | | | | | | | | | | | | | | | | | | | | | | | | | | | | | | | | | | | | | | | | | | | | | | | | | | | | | | | | | | | | | | | | | | | | | | | | | | | | | | |
| | | | | | | | | | | | | | | | | | | | | | | | | | | | | | | | | | | | | | | | | | | | | | | | | | | | | | | | | | | | | | | | | | | | | | | | | | | | | | | | | | | | | | | | |
| 97.032.000-8 | | BBVA | | Chile | | ThUS$ | | | 75,000 | | | | - | | | | - | | | | - | | | | - | | | | 75,000 | | | | 75,234 | | | | - | | | | - | | | | - | | | | - | | | | 75,234 | | | At Expiration | | | 1.85 | | | | 1.85 | | | BBVA | | Chile | | US$ | | | 24,000 | | | | 75,000 | | | | - | | | | - | | | | - | | | | 99,000 | | | | 24,910 | | | | 75,000 | | | | - | | | | - | | | | - | | | | 99,910 | | | At Expiration | | | 3.29 | | | | 3.29 | |
| 97.032.000-8 | | BBVA | | Chile | | UF | | | - | | | | 50,381 | | | | - | | | | - | | | | - | | | | 50,381 | | | | - | | | | 50,324 | | | | - | | | | - | | | | - | | | | 50,324 | | | At Expiration | | | 5.23 | | | | 4.43 | | |
| 97.036.000-K | | SANTANDER | | Chile | | ThUS$ | | | 30,000 | | | | - | | | | - | | | | - | | | | - | | | | 30,000 | | | | 30,183 | | | | - | | | | - | | | | - | | | | - | | | | 30,183 | | | At Expiration | | | 2.39 | | | | 2.39 | | |
| 97.030.000-7 | | ESTADO | | Chile | | ThUS$ | | | 40,000 | | | | - | | | | - | | | | - | | | | - | | | | 40,000 | | | | 40,098 | | | | - | | | | - | | | | - | | | | - | | | | 40,098 | | | At Expiration | | | 1.91 | | | | 1.91 | | |
| 97.003.000-K | | BANCO DO BRASIL | | Chile | | ThUS$ | | | 70,000 | | | | - | | | | - | | | | - | | | | - | | | | 70,000 | | | | 70,323 | | | | - | | | | - | | | | - | | | | - | | | | 70,323 | | | At Expiration | | | 3.08 | | | | 3.08 | | | BANCO DO BRASIL | | Chile | | UF | | | 150,000 | | | | 50,000 | | | | - | | | | - | | | | - | | | | 200,000 | | | | 150,257 | | | | 50,283 | | | | - | | | | - | | | | - | | | | 200,540 | | | At Expiration | | | 2.93 | | | | 2.93 | |
| 97.951.000-4 | | HSBC | | Chile | | ThUS$ | | | 12,000 | | | | - | | | | - | | | | - | | | | - | | | | 12,000 | | | | 12,002 | | | | - | | | | - | | | | - | | | | - | | | | 12,002 | | | At Expiration | | | 1.79 | | | | 1.79 | | | HSBC | | Chile | | US$ | | | 12,000 | | | | - | | | | - | | | | - | | | | - | | | | 12,000 | | | | 12,016 | | | | - | | | | - | | | | - | | | | - | | | | 12,016 | | | At Expiration | | | 3.25 | | | | 3.25 | |
| 76.100.458-1 | | | BLADEX | | Chile | | US$ | | | - | | | | 29,000 | | | | - | | | | - | | | | - | | | | 29,000 | | | | - | | | | 29,009 | | | | - | | | | - | | | | - | | | | 29,009 | | | At Expiration | | | 2.82 | | | | 2.82 | |
| | | | | | | | | | | | | | | | | | | | | | | | | | | | | | | | | | | | | | | | | | | | | | | | | | | | | | | | | | | | | | | | | | | | | | | | | | | | | | | | | | | | | | | | | | | | | | | | | | | | | | | | | | | | | | | | | | | |
| Bank loans | Bank loans | | | | | | | | | | | | | | | | | | | | | | | | | | | | | | | | | | | | | | | | | | | | | | | | | | | | | | | | | | | | | | | | | | | | | | | | | | | | | | | | | | | | | | | | | | | | | | | | | | | | | | | | | | | | | | | | | | |
| | | | | | | | | | | | | | | | | | | | | | | | | | | | | | | | | | | | | | | | | | | | | | | | | | | | | | | | | | | | | | | | | | | | | | | | | | | | | | | | | | | | | | | | | | | | | | | | | | | | | | | | | | | | | | | | | | | |
| 97.023.000-9 | | CORPBANCA | | Chile | | UF | | | 19,229 | | | | 57,686 | | | | 60,186 | | | | 16,254 | | | | - | | | | 153,355 | | | | 19,819 | | | | 57,686 | | | | 59,176 | | | | 16,189 | | | | - | | | | 152,870 | | | Quarterly | | | 4.06 | | | | 4.06 | | | CORPBANCA | | Chile | | UF | | | 5,205 | | | | 10,410 | | | | - | | | | - | | | | - | | | | 15,615 | | | | 5,192 | | | | 10,369 | | | | - | | | | - | | | | - | | | | 15,561 | | | Quarterly | | | 3.35 | | | | 3.35 | |
| 0-E | | BLADEX | | U.S.A. | | ThUS$ | | | - | | | | 12,500 | | | | 30,000 | | | | - | | | | - | | | | 42,500 | | | | - | | | | 12,667 | | | | 29,625 | | | | - | | | | - | | | | 42,292 | | | Semiannual | | | 5.14 | | | | 5.14 | | | SANTANDER | | Spain | | US$ | | | - | | | | - | | | | 137,860 | | | | - | | | | - | | | | 137,860 | | | | 255 | | | | - | | | | 137,860 | | | | - | | | | - | | | | 138,115 | | | Quarterly | | | 3.62 | | | | 4.61 | |
| 0-E | | DVB BANK SE | | U.S.A. | | ThUS$ | | | - | | | | - | | | | 28,911 | | | | - | | | | - | | | | 28,911 | | | | 3 | | | | - | | | | 28,911 | | | | - | | | | - | | | | 28,914 | | | Quarterly | | | 1.86 | | | | 1.86 | | |
| 97.036.000-K | | SANTANDER | | Chile | | ThUS$ | | | - | | | | - | | | | 158,194 | | | | - | | | | - | | | | 158,194 | | | | 542 | | | | - | | | | 158,194 | | | | - | | | | - | | | | 158,736 | | | Quarterly | | | 3.55 | | | | 3.55 | | |
| 76.362.099-9 | | | BTG PACTUAL CHILE | | Chile | | UF | | | - | | | | - | | | | 62,769 | | | | - | | | | - | | | | 62,769 | | | | 113 | | | | - | | | | 62,172 | | | | - | | | | - | | | | 62,285 | | | At Expiration | | | 3.10 | | | | 3.10 | |
| | | | | | | | | | | | | | | | | | | | | | | | | | | | | | | | | | | | | | | | | | | | | | | | | | | | | | | | | | | | | | | | | | | | | | | | | | | | | | | | | | | | | | | | | | | | | | | | | | | | | | | | | | | | | | | | | | | |
| Obligations with the public | Obligations with the public | | | | | | | | | | | | | | | | | | | | | | | | | | | | | | | | | | | | | | | | | | | | | | | | | | | | | | | | | | | | | | | | | | | | | | | | | | | | | | | | | | | | | | | | | | | | | | | | | | | | | | | | | | | | | | | | | | |
| 0-E | | BANK OF NEW YORK | | U.S.A. | | ThUS$ | | | - | | | | - | | | | - | | | | 500,000 | | | | - | | | | 500,000 | | | | 2,291 | | | | - | | | | - | | | | 489,885 | | | | - | | | | 492,176 | | | At Expiration | | | 7.77 | | | | 7.25 | | | ESTADO | | Chile | | UF | | | - | | | | - | | | | 164,485 | | | | - | | | | 353,547 | | | | 518,032 | | | | - | | | | 2,642 | | | | 164,398 | | | | - | | | | 366,656 | | | | 533,696 | | | At Expiration | | | 4.81 | | | | 4.81 | |
| 97.030.000-7 | | | BANK OF NEW YORK | | U.S.A. | | US$ | | | - | | | | - | | | | - | | | | 700,000 | | | | 800,000 | | | | 1,500,000 | | | | 18,640 | | | | 10,779 | | | | - | | | | 698,256 | | | | 803,563 | | | | 1,531,238 | | | At Expiration | | | 7.16 | | | | 6.94 | |
| | | | | | | | | | | | | | | | | | | | | | | | | | | | | | | | | | | | | | | | | | | | | | | | | | | | | | | | | | | | | | | | | | | | | | | | | | | | | | | | | | | | | | | | | | | | | | | | | | | | | | | | | | | | | | | | | | | |
| Guaranteed obligations | Guaranteed obligations | | | | | | | | | | | | | | | | | | | | | | | | | | | | | | | | | | | | | | | | | | | | | | | | | | | | | | | | | | | | | | | | | | | | | | | | | | | | | | | | | | | | | | | | | | | | | | | | | | | | | | | | | | | | | | | | | | |
| | | | | | | | | | | | | | | | | | | | | | | | | | | | | | | | | | | | | | | | | | | | | | | | | | | | | | | | | | | | | | | | | | | | | | | | | | | | | | | | | | | | | | | | | | | | | | | | | | | | | | | | | | | | | | | | | | | |
| 0-E | | | BNP PARIBAS | | U.S.A. | | US$ | | | 8,115 | | | | 36,282 | | | | 93,788 | | | | 100,622 | | | | 275,134 | | | | 513,941 | | | | 10,058 | | | | 36,855 | | | | 91,224 | | | | 99,297 | | | | 273,038 | | | | 510,472 | | | Quarterly | | | 3.81 | | | | 3.81 | |
| 0-E | | | WILMINGTON TRUST | | U.S.A. | | US$ | | | 22,090 | | | | 66,710 | | | | 183,332 | | | | 196,452 | | | | 397,639 | | | | 866,223 | | | | 27,229 | | | | 66,710 | | | | 178,784 | | | | 194,741 | | | | 395,983 | | | | 863,447 | | | Quarterly | | | 4.45 | | | | 4.45 | |
| 0-E | | | CITIBANK | | U.S.A. | | US$ | | | 4,805 | | | | 14,608 | | | | 40,414 | | | | 42,626 | | | | 41,022 | | | | 143,475 | | | | 5,461 | | | | 14,608 | | | | 36,178 | | | | 40,932 | | | | 40,310 | | | | 137,489 | | | Quarterly | | | 3.76 | | | | 2.68 | |
| 0-E | | | NATIXIS | | France | | US$ | | | 10,675 | | | | 32,708 | | | | 84,674 | | | | 78,123 | | | | 76,726 | | | | 282,906 | | | | 11,410 | | | | 32,708 | | | | 83,072 | | | | 77,195 | | | | 75,928 | | | | 280,313 | | | Quarterly | | | 3.82 | | | | 3.82 | |
| 0-E | | | INVESTEC | | England | | US$ | | | 1,538 | | | | 8,976 | | | | 22,977 | | | | 10,596 | | | | - | | | | 44,087 | | | | 1,867 | | | | 9,112 | | | | 22,597 | | | | 10,565 | | | | - | | | | 44,141 | | | Semiannual | | | 6.35 | | | | 6.35 | |
| 0-E | | | MUFG | | U.S.A. | | US$ | | | 2,973 | | | | 18,593 | | | | 53,816 | | | | 57,993 | | | | 189,285 | | | | 322,660 | | | | 3,182 | | | | 18,593 | | | | 53,367 | | | | 57,694 | | | | 188,471 | | | | 321,307 | | | Quarterly | | | 3.43 | | | | 3.43 | |
| - | | | SWAP Received Aircraft | | - | | US$ | | | 80 | | | | 78 | | | | - | | | | - | | | | - | | | | 158 | | | | 80 | | | | 78 | | | | - | | | | - | | | | - | | | | 158 | | | Quarterly | | | - | | | | - | |
| | | | | | | | | | | | | | | | | | | | | | | | | | | | | | | | | | | | | | | | | | | | | | | | | | | | | | | | | | |
| Other guaranteed obligations | | | | | | | | | | | | | | | | | | | | | | | | | | | | | | | | | | | | | | | | | | | | | | | | | | | | | | | | | |
| | | | | | | | | | | | | | | | | | | | | | | | | | | | | | | | | | | | | | | | | | | | | | | | | | | | | | | | | | |
| 0-E | | | CREDIT AGRICOLE | | France | | US$ | | | - | | | | - | | | | 253,692 | | | | - | | | | - | | | | 253,692 | | | | 2,370 | | | | - | | | | 252,747 | | | | - | | | | - | | | | 255,117 | | | At Expiration | | | 3.74 | | | | 3.74 | |
| 0-E | | | MUFG | | U.S.A. | | US$ | | | 23,669 | | | | 71,432 | | | | 188,440 | | | | 44,482 | | | | - | | | | 328,023 | | | | 23,929 | | | | 71,431 | | | | 185,938 | | | | 44,017 | | | | - | | | | 325,315 | | | Quarterly | | | 3.54 | | | | 3.54 | |
| | | | | | | | | | | | | | | | | | | | | | | | | | | | | | | | | | | | | | | | | | | | | | | | | | | | | | | | | | |
| Financial leases | | | | | | | | | | | | | | | | | | | | | | | | | | | | | | | | | | | | | | | | | | | | | | | | | | | | | | | | | |
| | | | | | | | | | | | | | | | | | | | | | | | | | | | | | | | | | | | | | | | | | | | | | | | | | | | | | | | | | |
| 0-E | | | ING | | U.S.A. | | US$ | | | 3,875 | | | | 7,931 | | | | - | | | | - | | | | - | | | | 11,806 | | | | 3,952 | | | | 7,931 | | | | - | | | | - | | | | - | | | | 11,883 | | | Quarterly | | | 5.71 | | | | 5.01 | |
| 0-E | | CREDIT AGRICOLE | | France | | ThUS$ | | | 11,073 | | | | 29,252 | | | | 62,209 | | | | 32,172 | | | | 3,711 | | | | 138,417 | | | | 11,454 | | | | 29,252 | | | | 60,781 | | | | 31,221 | | | | 3,631 | | | | 136,339 | | | Quarterly | | | 2.21 | | | | 1.81 | | | CREDIT AGRICOLE | | France | | US$ | | | 4,831 | | | | 14,723 | | | | 6,537 | | | | - | | | | - | | | | 26,091 | | | | 4,943 | | | | 14,723 | | | | 6,537 | | | | - | | | | - | | | | 26,203 | | | Quarterly | | | 3.15 | | | | 2.52 | |
| 0-E | | BNP PARIBAS | | U.S.A. | | ThUS$ | | | 10,496 | | | | 42,401 | | | | 111,962 | | | | 118,181 | | | | 345,078 | | | | 628,118 | | | | 12,792 | | | | 43,023 | | | | 108,271 | | | | 116,067 | | | | 341,481 | | | | 621,634 | | | Quarterly | | | 2.97 | | | | 2.96 | | | CITIBANK | | U.S.A. | | US$ | | | 17,972 | | | | 52,790 | | | | 113,746 | | | | 16,399 | | | | - | | | | 200,907 | | | | 18,633 | | | | 52,790 | | | | 112,712 | | | | 16,368 | | | | - | | | | 200,503 | | | Quarterly | | | 3.39 | | | | 2.80 | |
| 0-E | | WELLS FARGO | | U.S.A. | | ThUS$ | | | 31,448 | | | | 95,186 | | | | 260,112 | | | | 269,512 | | | | 400,087 | | | | 1,056,345 | | | | 35,211 | | | | 95,186 | | | | 233,012 | | | | 257,387 | | | | 391,253 | | | | 1,012,049 | | | Quarterly | | | 2.37 | | | | 1.68 | | | PEFCO | | U.S.A. | | US$ | | | 1,901 | | | | 1,926 | | | | - | | | | - | | | | - | | | | 3,827 | | | | 1,918 | | | | 1,926 | | | | - | | | | - | | | | - | | | | 3,844 | | | Quarterly | | | 5.65 | | | | 5.03 | |
| 0-E | | WILMINGTON TRUST | | U.S.A. | | ThUS$ | | | 15,554 | | | | 49,236 | | | | 135,254 | | | | 140,848 | | | | 626,444 | | | | 967,336 | | | | 20,997 | | | | 49,236 | | | | 130,792 | | | | 138,455 | | | | 622,153 | | | | 961,633 | | | Quarterly | | | 4.25 | | | | 4.25 | | | BNP PARIBAS | | U.S.A. | | US$ | | | 8,523 | | | | 23,197 | | | | 25,182 | | | | 20,717 | | | | 10,110 | | | | 87,729 | | | | 9,042 | | | | 23,197 | | | | 24,675 | | | | 20,424 | | | | 9,975 | | | | 87,313 | | | Quarterly | | | 3.85 | | | | 3.72 | |
| 0-E | | CITIBANK | | U.S.A. | | ThUS$ | | | 17,495 | | | | 53,162 | | | | 146,932 | | | | 154,774 | | | | 175,805 | | | | 548,168 | | | | 19,059 | | | | 53,162 | | | | 138,257 | | | | 150,891 | | | | 172,087 | | | | 533,456 | | | Quarterly | | | 2.72 | | | | 1.96 | | | WELLS FARGO | | U.S.A. | | US$ | | | 32,321 | | | | 97,956 | | | | 248,086 | | | | 199,037 | | | | 14,284 | | | | 591,684 | | | | 34,868 | | | | 97,956 | | | | 233,822 | | | | 195,209 | | | | 14,138 | | | | 575,993 | | | Quarterly | | | 2.67 | | | | 1.98 | |
| 97.036.000-K | | SANTANDER | | Chile | | ThUS$ | | | 5,347 | | | | 16,204 | | | | 44,472 | | | | 46,386 | | | | 26,165 | | | | 138,574 | | | | 5,680 | | | | 16,204 | | | | 42,707 | | | | 45,815 | | | | 26,063 | | | | 136,469 | | | Quarterly | | | 1.98 | | | | 1.44 | | | SANTANDER | | Chile | | US$ | | | 5,690 | | | | 17,255 | | | | 46,472 | | | | 3,134 | | | | - | | | | 72,551 | | | | 5,959 | | | | 17,255 | | | | 45,805 | | | | 3,128 | | | | - | | | | 72,147 | | | Quarterly | | | 3.00 | | | | 2.46 | |
| 0-E | | BTMU | | U.S.A. | | ThUS$ | | | 2,787 | | | | 8,470 | | | | 23,393 | | | | 24,635 | | | | 26,705 | | | | 85,990 | | | | 3,001 | | | | 8,470 | | | | 22,132 | | | | 24,149 | | | | 26,519 | | | | 84,271 | | | Quarterly | | | 2.31 | | | | 1.72 | | | RRPF ENGINE | | England | | US$ | | | 864 | | | | 2,348 | | | | 7,441 | | | | 8,075 | | | | 915 | | | | 19,643 | | | | 908 | | | | 2,348 | | | | 7,441 | | | | 8,075 | | | | 915 | | | | 19,687 | | | Monthly | | | 4.01 | | | | 4.01 | |
| 0-E | | APPLE BANK | | U.S.A. | | ThUS$ | | | 1,364 | | | | 4,167 | | | | 11,516 | | | | 12,146 | | | | 13,561 | | | | 42,754 | | | | 1,538 | | | | 4,166 | | | | 10,889 | | | | 11,902 | | | | 13,464 | | | | 41,959 | | | Quarterly | | | 2.29 | | | | 1.69 | | | APPLE BANK | | U.S.A. | | US$ | | | 1,483 | | | | 4,509 | | | | 12,474 | | | | 7,242 | | | | - | | | | 25,708 | | | | 1,632 | | | | 4,509 | | | | 12,162 | | | | 7,212 | | | | - | | | | 25,515 | | | Quarterly | | | 3.33 | | | | 2.73 | |
| 0-E | | US BANK | | U.S.A. | | ThUS$ | | | 14,817 | | | | 44,958 | | | | 123,705 | | | | 129,462 | | | | 219,666 | | | | 532,608 | | | | 17,298 | | | | 44,958 | | | | 104,709 | | | | 120,509 | | | | 211,895 | | | | 499,369 | | | Quarterly | | | 3.99 | | | | 2.81 | | | BTMU | | U.S.A. | | US$ | | | 3,010 | | | | 9,148 | | | | 25,278 | | | | 13,904 | | | | - | | | | 51,340 | | | | 3,191 | | | | 9,148 | | | | 24,661 | | | | 13,849 | | | | - | | | | 50,849 | | | Quarterly | | | 3.33 | | | | 2.73 | |
| 0-E | | DEUTSCHE BANK | | U.S.A. | | ThUS$ | | | 4,992 | | | | 15,365 | | | | 24,725 | | | | 26,984 | | | | 45,197 | | | | 117,263 | | | | 5,570 | | | | 15,365 | | | | 24,023 | | | | 26,515 | | | | 44,522 | | | | 115,995 | | | Quarterly | | | 3.86 | | | | 3.86 | | | NATIXIS | | France | | US$ | | | 702 | | | | 2,173 | | | | 2,279 | | | | - | | | | - | | | | 5,154 | | | | 723 | | | | 2,173 | | | | 2,279 | | | | - | | | | - | | | | 5,175 | | | Quarterly | | | 4.41 | | | | 4.41 | |
| 0-E | | NATIXIS | | France | | ThUS$ | | | 12,289 | | | | 37,388 | | | | 98,873 | | | | 82,066 | | | | 192,235 | | | | 422,851 | | | | 13,038 | | | | 37,388 | | | | 97,469 | | | | 81,130 | | | | 190,048 | | | | 419,073 | | | Quarterly | | | 2.60 | | | | 2.57 | | | KFW IPEX-BANK | | Germany | | US$ | | | 1,760 | | | | 3,568 | | | | - | | | | - | | | | - | | | | 5,328 | | | | 1,769 | | | | 3,568 | | | | - | | | | - | | | | - | | | | 5,337 | | | Quarterly | | | 3.55 | | | | 3.55 | |
| 0-E | | PK AIRFINANCE | | U.S.A. | | ThUS$ | | | 2,018 | | | | 6,268 | | | | 18,413 | | | | 24,944 | | | | 3,144 | | | | 54,787 | | | | 2,071 | | | | 6,269 | | | | 18,412 | | | | 24,944 | | | | 3,144 | | | | 54,840 | | | Monthly | | | 2.40 | | | | 2.40 | | | AIRBUS FINANCIAL | | U.S.A. | | US$ | | | 1,977 | | | | 5,687 | | | | - | | | | - | | | | - | | | | 7,664 | | | | 1,992 | | | | 5,687 | | | | - | | | | - | | | | - | | | | 7,679 | | | Monthly | | | 3.31 | | | | 3.31 | |
| 0-E | | KFW IPEX-BANK | | Germany | | ThUS$ | | | 2,288 | | | | 7,015 | | | | 17,869 | | | | 9,019 | | | | - | | | | 36,191 | | | | 2,319 | | | | 7,015 | | | | 17,869 | | | | 9,019 | | | | - | | | | 36,222 | | | Quarterly | | | 2.55 | | | | 2.55 | | | US BANK | | U.S.A. | | US$ | | | 15,862 | | | | 48,132 | | | | 132,441 | | | | 135,200 | | | | 17,492 | | | | 349,127 | | | | 17,610 | | | | 48,132 | | | | 119,881 | | | | 130,865 | | | | 17,188 | | | | 333,676 | | | Quarterly | | | 4.01 | | | | 2.82 | |
| 0-E | | AIRBUS FINANCIAL | | U.S.A. | | ThUS$ | | | 1,797 | | | | 5,476 | | | | 15,262 | | | | 7,664 | | | | - | | | | 30,199 | | | | 1,841 | | | | 5,477 | | | | 15,261 | | | | 7,664 | | | | - | | | | 30,243 | | | Monthly | | | 2.49 | | | | 2.49 | | | PK AIRFINANCE | | U.S.A. | | US$ | | | 2,487 | | | | 7,729 | | | | 17,871 | | | | - | | | | - | | | | 28,087 | | | | 2,530 | | | | 7,729 | | | | 17,871 | | | | - | | | | - | | | | 28,130 | | | Monthly | | | 3.45 | | | | 3.45 | |
| 0-E | | INVESTEC | | England | | ThUS$ | | | 1,298 | | | | 7,526 | | | | 19,290 | | | | 21,667 | | | | 22,421 | | | | 72,202 | | | | 1,771 | | | | 7,733 | | | | 18,533 | | | | 21,368 | | | | 22,309 | | | | 71,714 | | | Semiannual | | | 5.67 | | | | 5.67 | | |
| - | | SWAP Aviones llegados | | - | | ThUS$ | | | 403 | | | | 1,067 | | | | 1,658 | | | | 158 | | | | - | | | | 3,286 | | | | 403 | | | | 1,067 | | | | 1,658 | | | | 158 | | | | - | | | | 3,286 | | | Quarterly | | | - | | | | - | | |
| | | | | | | | | | | | | | | | | | | | | | | | | | | | | | | | | | | | | | | | | | | | | | | | | | | | | | | | | | | | |
| Other guaranteed obligations | | | | | | | | | | | | | | | | | | | | | | | | | | | | | | | | | | | | | | | | | | | | | | | | | | | | | | | | | | | |
| | | | | | | | | | | | | | | | | | | | | | | | | | | | | | | | | | | | | | | | | | | | | | | | | | | | | | | | | | | | |
| 0-E | | CREDIT AGRICOLE | | France | | ThUS$ | | | - | | | | - | | | | 256,860 | | | | - | | | | - | | | | 256,860 | | | | 1,908 | | | | - | | | | 254,512 | | | | - | | | | - | | | | 256,420 | | | Quarterly | | | 2.85 | | | | 2.85 | | |
| | | | | | | | | | | | | | | | | | | | | | | | | | | | | | | | | | | | | | | | | | | | | | | | | | | | | | | | | | | | |
| Financial leases | | | | | | | | | | | | | | | | | | | | | | | | | | | | | | | | | | | | | | | | | | | | | | | | | | | | | | | | | | | |
| | | | | | | | | | | | | | | | | | | | | | | | | | | | | | | | | | | | | | | | | | | | | | | | | | | | | | | | | | | | |
| 0-E | | ING | | U.S.A. | | ThUS$ | | | 5,089 | | | | 15,653 | | | | 31,151 | | | | 11,805 | | | | - | | | | 63,698 | | | | 5,641 | | | | 15,652 | | | | 30,577 | | | | 11,771 | | | | - | | | | 63,641 | | | Quarterly | | | 5.62 | | | | 4.96 | | |
| 0-E | | CREDIT AGRICOLE | | France | | ThUS$ | | | 1,754 | | | | 5,403 | | | | - | | | | - | | | | - | | | | 7,157 | | | | 1,780 | | | | 5,403 | | | | - | | | | - | | | | - | | | | 7,183 | | | Quarterly | | | 1.85 | | | | 1.85 | | |
| 0-E | | CITIBANK | | U.S.A. | | ThUS$ | | | 4,956 | | | | 15,312 | | | | 44,177 | | | | 13,804 | | | | - | | | | 78,249 | | | | 5,622 | | | | 15,312 | | | | 43,413 | | | | 13,762 | | | | - | | | | 78,109 | | | Quarterly | | | 6.40 | | | | 5.67 | | |
| 0-E | | PEFCO | | U.S.A. | | ThUS$ | | | 15,979 | | | | 47,048 | | | | 63,957 | | | | 3,827 | | | | - | | | | 130,811 | | | | 16,852 | | | | 47,048 | | | | 63,072 | | | | 3,819 | | | | - | | | | 130,791 | | | Quarterly | | | 5.39 | | | | 4.79 | | |
| 0-E | | BNP PARIBAS | | U.S.A. | | ThUS$ | | | 12,520 | | | | 38,494 | | | | 75,958 | | | | 22,147 | | | | - | | | | 149,119 | | | | 13,122 | | | | 38,494 | | | | 74,776 | | | | 22,079 | | | | - | | | | 148,471 | | | Quarterly | | | 3.69 | | | | 3.26 | | |
| 0-E | | WELLS FARGO | | U.S.A. | | ThUS$ | | | 4,678 | | | | 14,261 | | | | 39,862 | | | | 42,663 | | | | 1,862 | | | | 103,326 | | | | 5,018 | | | | 14,260 | | | | 38,834 | | | | 42,430 | | | | 1,861 | | | | 102,403 | | | Quarterly | | | 3.98 | | | | 3.54 | | |
| 0-E | | DVB BANK SE | | U.S.A. | | ThUS$ | | | 4,680 | | | | 9,447 | | | | - | | | | - | | | | - | | | | 14,127 | | | | 4,713 | | | | 9,448 | | | | - | | | | - | | | | - | | | | 14,161 | | | Quarterly | | | 2.57 | | | | 2.57 | | |
| 0-E | | RRPF ENGINE | | England | | ThUS$ | | | - | | | | - | | | | 6,402 | | | | 6,955 | | | | 11,917 | | | | 25,274 | | | | - | | | | - | | | | 6,402 | | | | 6,955 | | | | 11,917 | | | | 25,274 | | | Monthly | | | 2.35 | | | | 2.35 | | |
| | | | | | | | | | | | | | | | | | | | | | | | | | | | | | | | | | | | | | | | | | | | | | | | | | | | | | | | | | | | | | | | | | | | | | | | | | | | | | | | | | | | | | | | | | | | | | | | | | | | | | | | | | | | | | | | | | | |
| Other loans | Other loans | | | | | | | | | | | | | | | | | | | | | | | | | | | | | | | | | | | | | | | | | | | | | | | | | | | | | | | | | | | | | | | | | | | | | | | | | | | | | | | | | | | | | | | | | | | | | | | | | | | | | | | | | | | | | | | | | | |
| | | | | | | | | | | | | | | | | | | | | | | | | | | | | | | | | | | | | | | | | | | | | | | | | | | | | | | | | | | | | | | | | | | | | | | | | | | | | | | | | | | | | | | | | | | | | | | | | | | | | | | | | | | | | | | | | | | |
| 0-E | | BOEING | | U.S.A. | | ThUS$ | | | - | | | | - | | | | 26,214 | | | | - | | | | - | | | | 26,214 | | | | 185 | | | | - | | | | 26,214 | | | | - | | | | - | | | | 26,399 | | | At Expiration | | | 2.35 | | | | 2.35 | | | CITIBANK (*) | | U.S.A. | | US$ | | | 24,595 | | | | 76,431 | | | | - | | | | - | | | | - | | | | 101,026 | | | | 24,830 | | | | 76,431 | | | | - | | | | - | | | | - | | | | 101,261 | | | Quarterly | | | 6.00 | | | | 6.00 | |
| 0-E | | CITIBANK (*) | | U.S.A. | | ThUS$ | | | 20,555 | | | | 63,942 | | | | 184,866 | | | | 101,026 | | | | - | | | | 370,389 | | | | 21,541 | | | | 63,942 | | | | 182,043 | | | | 100,866 | | | | - | | | | 368,392 | | | Quarterly | | | 6.00 | | | | 6.00 | | |
| | | | | | | | | | | | | | | | | | | | | | | | | | | | | | | | | | | | | | | | | | | | | | | | | | | | | | | | | | | | | | | | | | | | | | | | | | | | | | | | | | | | | | | | | | | | | | | | | | | | | | | | | | | | | | | | | | | |
| | | Total | | | 451,906 | | | | 753,268 | | | | 2,122,383 | | | | 1,819,099 | | | | 2,113,998 | | | | 7,260,654 | | | | 480,920 | | | | 754,207 | | | | 2,040,524 | | | | 1,774,950 | | | | 2,082,347 | | | | 7,132,948 | | | | | | | | | | | | | Total | | | 393,003 | | | | 789,300 | | | | 1,924,054 | | | | 1,634,602 | | | | 2,176,154 | | | | 6,917,113 | | | | 431,469 | | | | 803,680 | | | | 1,876,183 | | | | 1,617,827 | | | | 2,186,165 | | | | 6,915,324 | | | | | | | | | |
(*) Securitized bond with the future flows from the sales with credit card in United States and Canada.Canada, through the company Guanay Finance Limited.
Interest-bearing loans due in installments to December 31, 20162019
Debtor: TAM S.A. and Subsidiaries, Tax No. 02.012.862/0001-60, Brazil.
| | | | | | | | | | | Nominal values | | | | Accounting values | | | | | | | | | | | | | | | Nominal values | | Accounting values | | | | | | | |
| | | | | | | | | | | More than | | More than | | More than | | | | | | | | More than | | More than | | More than | | | | | | | | | | | | | | | More than | | More than | | More than | | | | | | | | More than | | More than | | More than | | | | | | | | | |
| | | | | | | | | Up to | | 90 days | | one to | | three to | | More than | | Total | | Up to | | 90 days | | one to | | three to | | More than | | Total | | | | | | | | | Up to | | 90 days | | one to | | three to | | More than | | Total | | Up to | | 90 days | | one to | | three to | | More than | | Total | | | | | |
| | | | | Creditor | | | | 90 | | to one | | three | | five | | five | | nominal | | 90 | | to one | | three | | five | | five | | accounting | | | | Effective | | Nominal | | | Creditor | | 90 | | to one | | three | | five | | five | | nominal | | 90 | | to one | | three | | five | | five | | accounting | | Effective | | Nominal | |
| Tax No. | | Creditor | | country | | Currency | | days | | year | | years | | years | | years | | value | | days | | year | | years | | years | | years | | value | | Amortization | | rate | | rate | | | Creditor | | country | | Currency | | days | | year | | years | | years | | years | | value | | days | | year | | years | | years | | years | | value | | Amortization | | rate | | rate | |
| | | | | | | | | ThUS$ | | ThUS$ | | ThUS$ | | ThUS$ | | ThUS$ | | ThUS$ | | ThUS$ | | ThUS$ | | ThUS$ | | ThUS$ | | ThUS$ | | ThUS$ | | | | % | | % | | | ThUS$ | | ThUS$ | | ThUS$ | | ThUS$ | | ThUS$ | | ThUS$ | | ThUS$ | | ThUS$ | | ThUS$ | | ThUS$ | | ThUS$ | | ThUS$ | | % | | % | |
| | | | | | | | | | | | | | | | | | | | | | | | | | | | | | | | | | | | | | | |
| Bank loans | Bank loans | | | | | | | | | | | | | | | | | | | | | | | | | | | | | | | | | | | | | | | | | | | | | | | | | | | | | | | | | | | | | | | | | | | | | | | | | | | | | | | | | | | | | |
| | | | | | | | | | | | | | | | | | | | | | | | | | | | | | | | | | | | | | | | | | | | | | | | | | | | | | | | | | |
| 0-E | | NEDERLANDSCHE | | | | | | | | | | | | | | | | | | | | | | | | | | | | | | | | | | | | | | | | | | | | | | | | | | | | | | | | | |
| | | CREDIETVERZEKERING MAATSCHAPPIJ | | Holland | | ThUS$ | | | 122 | | | | 378 | | | | 1,094 | | | | 1,234 | | | | 54 | | | | 2,882 | | | | 137 | | | | 378 | | | | 1,094 | | | | 1,233 | | | | 55 | | | | 2,897 | | | Monthly | | | 6.01 | | | | 6.01 | | |
| 0-E | | CITIBANK | | U.S.A | | ThUS$ | | | - | | | | 200,000 | | | | - | | | | - | | | | - | | | | 200,000 | | | | (151 | ) | | | 199,729 | | | | - | | | | - | | | | - | | | | 199,578 | | | At Expiration | | | 3.39 | | | | 3.14 | | |
| | | | | | | | | | | | | | | | | | | | | | | | | | | | | | | | | | | | | | | | | | | | | | | | | | | | | | | | | | |
| Obligation with the public | | | | | | | | | | | | | | | | | | | | | | | | | | | | | | | | | | | | | | | | | | | | | | | | | | | | | | | | | |
| | | | | | | | | | | | | | | | | | | | | | | | | | | | | | | | | | | | | | | | | | | | | | | | | | | | | | | | | | | | | | | | | | | | | | | | | | | | | | | | | | | | | | |
| 0-E | | THE BANK OF NEW YORK | | U.S.A | | ThUS$ | | | - | | | | 300,000 | | | | - | | | | 500,000 | | | | - | | | | 800,000 | | | | 8,173 | | | | 301,579 | | | | 4,119 | | | | 503,298 | | | | - | | | | 817,169 | | | At Expiration | | | 8.17 | | | | 8.00 | | | NEDERLANDSCHE CREDIETVERZEKERING MAATSCHAPPIJ | | Holland | | US$ | | | 148 | | | | 452 | | | | 689 | | | | - | | | | - | | | | 1,289 | | | | 153 | | | | 452 | | | | 689 | | | | - | | | | - | | | | 1,294 | | | Monthly | | | 6.01 | | | | 6.01 | |
| | | | | | | | | | | | | | | | | | | | | | | | | | | | | | | | | | | | | | | | | | | | | | | | | | | | | | | | | | | | | | | | | | | | | | | | | | | | | | | | | | | | | | | | | | | | | | | | | | | | | | | | | | | | | | | | | |
| Financial leases | Financial leases | | | | | | | | | | | | | | | | | | | | | | | | | | | | | | | | | | | | | | | | | | | | | | | | | | | | | | | | | | | | | | | | | | | | | | | | | | | | | | | | | | | | | | | | | | | | | | | | | | | | | | | | | | | | | | | | |
| | | | | | | | | | | | | | | | | | | | | | | | | | | | | | | | | | | | | | | | | | | | | | | | | | | | | | | | | | | | | | | | | | | | | | | | | | | | | | | | | | | | | | | | | | | | | | | | | | | | | | | | | | | | | | | | | |
| 0-E | | AFS INVESTMENT IX LLC | | U.S.A | | ThUS$ | | | 2,086 | | | | 6,437 | | | | 18,556 | | | | 8,369 | | | | - | | | | 35,448 | | | | 2,253 | | | | 6,437 | | | | 18,556 | | | | 8,369 | | | | - | | | | 35,615 | | | Monthly | | | 1.25 | | | | 1.25 | | | NATIXIS | | France | | US$ | | | 3,243 | | | | 6,906 | | | | 76,107 | | | | - | | | | - | | | | 86,256 | | | | 3,723 | | | | 6,906 | | | | 76,107 | | | | - | | | | - | | | | 86,736 | | | Quarterly/Semiannual | | | 6.29 | | | | 6.29 | |
| 0-E | | DVB BANK SE | | U.S.A | | ThUS$ | | | 118 | | | | 164 | | | | - | | | | - | | | | - | | | | 282 | | | | 119 | | | | 164 | | | | - | | | | - | | | | - | | | | 283 | | | Monthly | | | 2.50 | | | | 2.50 | | | WACAPOU LEASING S.A. | | Luxemburg | | US$ | | | 757 | | | | 2,317 | | | | 3,206 | | | | - | | | | - | | | | 6,280 | | | | 777 | | | | 2,317 | | | | 3,206 | | | | - | | | | - | | | | 6,300 | | | Quarterly | | | 4.32 | | | | 4.32 | |
| 0-E | | GENERAL ELECTRIC CAPITAL CORPORATION | | U.S.A | | ThUS$ | | | 3,771 | | | | 5,075 | | | | - | | | | - | | | | - | | | | 8,846 | | | | 3,794 | | | | 5,075 | | | | - | | | | - | | | | - | | | | 8,869 | | | Monthly | | | 2.30 | | | | 2.30 | | | SOCIÉTÉ GÉNÉRALE MILAN BRANCH | | Italy | | US$ | | | 9,855 | | | | 160,076 | | | | - | | | | - | | | | - | | | | 169,931 | | | | 10,409 | | | | 159,876 | | | | - | | | | - | | | | - | | | | 170,285 | | | Quarterly | | | 5.39 | | | | 5.39 | |
| 0-E | | KFW IPEX-BANK | | Germany | | ThUS$ | | | 579 | | | | 1,544 | | | | - | | | | - | | | | - | | | | 2,123 | | | | 583 | | | | 1,544 | | | | - | | | | - | | | | - | | | | 2,127 | | | Monthly/Quarterly | | | 2.80 | | | | 2.80 | | | GA Telessis LLC | | U.S.A | | US$ | | | 306 | | | | 1,100 | | | | 2,385 | | | | 2,694 | | | | 7,010 | | | | 13,495 | | | | 399 | | | | 1,100 | | | | 2,385 | | | | 2,694 | | | | 7,010 | | | | 13,588 | | | Monthly | | | 14.72 | | | | 14.72 | |
| 0-E | | NATIXIS | | France | | ThUS$ | | | 2,675 | | | | 5,732 | | | | 18,485 | | | | 38,820 | | | | 41,731 | | | | 107,443 | | | | 3,533 | | | | 5,732 | | | | 18,485 | | | | 38,820 | | | | 41,731 | | | | 108,301 | | | Quarterly/Semiannual | | | 4.90 | | | | 4.90 | | |
| 0-E | | WACAPOU LEASING S.A. | | Luxemburg | | ThUS$ | | | 668 | | | | 2,038 | | | | 5,768 | | | | 6,280 | | | | - | | | | 14,754 | | | | 709 | | | | 2,038 | | | | 5,768 | | | | 6,280 | | | | - | | | | 14,795 | | | Quarterly | | | 3.00 | | | | 3.00 | | |
| 0-E | | SOCIÉTÉ GÉNÉRALE MILAN BRANCH | | Italy | | ThUS$ | | | 8,547 | | | | 26,275 | | | | 74,783 | | | | 169,730 | | | | - | | | | 279,335 | | | | 9,779 | | | | 26,275 | | | | 74,783 | | | | 169,730 | | | | - | | | | 280,567 | | | Quarterly | | | 4.18 | | | | 4.11 | | |
| 0-E | | BANCO IBM S.A | | Brazil | | BRL | | | 260 | | | | 749 | | | | 22 | | | | - | | | | - | | | | 1,031 | | | | 260 | | | | 749 | | | | 21 | | | | - | | | | - | | | | 1,030 | | | Monthly | | | 13.63 | | | | 13.63 | | |
| 0-E | | HP FINANCIAL SERVICE | | Brazil | | BRL | | | 222 | | | | - | | | | - | | | | - | | | | - | | | | 222 | | | | 222 | | | | - | | | | - | | | | - | | | | - | | | | 222 | | | Monthly | | | 10.02 | | | | 10.02 | | |
| 0-E | | SOCIETE GENERALE | | France | | BRL | | | 102 | | | | 307 | | | | 110 | | | | - | | | | - | | | | 519 | | | | 102 | | | | 307 | | | | 110 | | | | - | | | | - | | | | 519 | | | Monthly | | | 13.63 | | | | 13.63 | | |
| | | | | | | | | | | | | | | | | | | | | | | | | | | | | | | | | | | | | | | | | | | | | | | | | | | | | | | | | | | | | | | | | | | | | | | | | | | | | | | | | | | | | | | | | | | | | | | | | | | | | | | | | | | | | | | | | |
| | | Total | | | 19,150 | | | | 548,699 | | | | 118,818 | | | | 724,433 | | | | 41,785 | | | | 1,452,885 | | | | 29,513 | | | | 550,007 | | | | 122,936 | | | | 727,730 | | | | 41,786 | | | | 1,471,972 | | | | | | | | | | | Total | | | 14,309 | | | | 170,851 | | | | 82,387 | | | | 2,694 | | | | 7,010 | | | | 277,251 | | | | 15,461 | | | | 170,651 | | | | 82,387 | | | | 2,694 | | | | 7,010 | | | | 278,203 | | | | | | | | | |
| | | | | | | | | | | | | | | | | | | | | | | | | | | | | | | | | | | | | | | | | | | | | | | | | | | | | | | | | | | | | | | | | | | | | | | | | | | | | | | | | | | | | | | | | | | | | | | | | | | | | | | | | | | | | | | | | |
| | | Total consolidated | | | 471,056 | | | | 1,301,967 | | | | 2,241,201 | | | | 2,543,532 | | | | 2,155,783 | | | | 8,713,539 | | | | 510,433 | | | | 1,304,214 | | | | 2,163,460 | | | | 2,502,680 | | | | 2,124,133 | | | | 8,604,920 | | | | | | | | | | | Total consolidated | | | 407,312 | | | | 960,151 | | | | 2,006,441 | | | | 1,637,296 | | | | 2,183,164 | | | | 7,194,364 | | | | 446,930 | | | | 974,331 | | | | 1,958,570 | | | | 1,620,521 | | | | 2,193,175 | | | | 7,193,527 | | | | | | | | | |
Interest-bearing loans due in installments to December 31, 2018
Debtor: LATAM Airlines Group S.A. and Subsidiaries, Tax No. 89.862.200-2, Chile.
| | | | | | | | | Nominal values | | | Accounting values | | | | | | | | | |
| | | | | | | | | | | | More than | | | More than | | | More than | | | | | | | | | | | | More than | | | More than | | | More than | | | | | | | | | | | | | | | |
| | | | | | | | | Up to | | | 90 days | | | one to | | | three to | | | More than | | | Total | | | Up to | | | 90 days | | | one to | | | three to | | | More than | | | Total | | | | | | | | | |
| | | | | Creditor | | | | 90 | | | to one | | | three | | | five | | | five | | | nominal | | | 90 | | | to one | | | three | | | five | | | five | | | accounting | | | | | Effective | | | Nominal | |
| Tax No. | | Creditor | | country | | Currency | | days | | | year | | | years | | | years | | | years | | | value | | | days | | | year | | | years | | | years | | | years | | | value | | | Amortization | | rate | | | rate | |
| | | | | | | | | ThUS$ | | | ThUS$ | | | ThUS$ | | | ThUS$ | | | ThUS$ | | | ThUS$ | | | ThUS$ | | | ThUS$ | | | ThUS$ | | | ThUS$ | | | ThUS$ | | | ThUS$ | | | | | % | | | % | |
| | | | | | | | | | | | | | | | | | | | | | | | | | | | | | | | | | | | | | | | | | | | | | | | | | | |
| Loans to exporters | | | | | | | | | | | | | | | | | | | | | | | | | | | | | | | | | | | | | | | | | | | | | | | | | | |
| | | | | | | | | | | | | | | | | | | | | | | | | | | | | | | | | | | | | | | | | | | | | | | | | | | |
| 97.032.000-8 | | BBVA | | Chile | | US$ | | | 38,000 | | | | 75,000 | | | | - | | | | - | | | | - | | | | 113,000 | | | | 38,432 | | | | 75,623 | | | | - | | | | - | | | | - | | | | 114,055 | | | At Expiration | | | 3.36 | | | | 3.36 | |
| 97.032.000-8 | | BBVA | | Chile | | UF | | | - | | | | 50,785 | | | | - | | | | - | | | | - | | | | 50,785 | | | | - | | | | 50,930 | | | | - | | | | - | | | | - | | | | 50,930 | | | At Expiration | | | 3.31 | | | | 3.31 | |
| 97.036.000-K | | SANTANDER | | Chile | | US$ | | | 23,000 | | | | - | | | | - | | | | - | | | | - | | | | 23,000 | | | | 23,025 | | | | - | | | | - | | | | - | | | | - | | | | 23,025 | | | At Expiration | | | 3.90 | | | | 3.90 | |
| 97.003.000-K | | BANCO DO BRASIL | | Chile | | US$ | | | 200,000 | | | | - | | | | - | | | | - | | | | - | | | | 200,000 | | | | 200,698 | | | | - | | | | - | | | | - | | | | - | | | | 200,698 | | | At Expiration | | | 3.64 | | | | 3.64 | |
| 97.951.000-4 | | HSBC | | Chile | | US$ | | | 12,000 | | | | - | | | | - | | | | - | | | | - | | | | 12,000 | | | | 12,013 | | | | - | | | | - | | | | - | | | | - | | | | 12,013 | | | At Expiration | | | 3.14 | | | | 3.14 | |
| | | | | | | | | | | | | | | | | | | | | | | | | | | | | | | | | | | | | | | | | | | | | | | | | | | | | | | | | | | | | | | | | |
| Bank loans | | | | | | | | | | | | | | | | | | | | | | | | | | | | | | | | | | | | | | | | | | | | | | | | | | | | | | | | | | | | | | | | |
| | | | | | | | | | | | | | | | | | | | | | | | | | | | | | | | | | | | | | | | | | | | | | | | | | | | | | | | | | | | | | | | | |
| 97.023.000-9 | | CORPBANCA | | Chile | | UF | | | 5,461 | | | | 16,385 | | | | 16,385 | | | | - | | | | - | | | | 38,231 | | | | 5,480 | | | | 16,385 | | | | 16,232 | | | | - | | | | - | | | | 38,097 | | | Quarterly | | | 3.35 | | | | 3.35 | |
| 0-E | | BLADEX | | U.S.A. | | US$ | | | - | | | | 15,000 | | | | - | | | | - | | | | - | | | | 15,000 | | | | - | | | | 14,964 | | | | - | | | | - | | | | - | | | | 14,964 | | | Semiannual | | | 6.74 | | | | 6.74 | |
| 97.036.000-K | | SANTANDER | | Chile | | US$ | | | - | | | | - | | | | 102,521 | | | | - | | | | - | | | | 102,521 | | | | 223 | | | | - | | | | 102,521 | | | | - | | | | - | | | | 102,744 | | | Quarterly | | | 5.60 | | | | 5.60 | |
| 76.362.099-9 | | BTG PACTUAL CHILE | | Chile | | UF | | | - | | | | - | | | | - | | | | 65,862 | | | | - | | | | 65,862 | | | | 118 | | | | - | | | | - | | | | 64,957 | | | | - | | | | 65,075 | | | At Expiration | | | 3.10 | | | | 3.10 | |
| | | | | | | | | | | | | | | | | | | | | | | | | | | | | | | | | | | | | | | | | | | | | | | | | | | | | | | | | | | | | | | | | |
| Obligations with the public | | | | | | | | | | | | | | | | | | | | | | | | | | | | | | | | | | | | | | | | | | | | | | | | | | | | | | | | | | | | | | | | |
| 0-E | | BANK OF NEW YORK | | U.S.A. | | US$ | | | - | | | | - | | | | 500,000 | | | | - | | | | 700,000 | | | | 1,200,000 | | | | 13,057 | | | | - | | | | 495,617 | | | | - | | | | 697,869 | | | | 1,206,543 | | | At Expiration | | | 7.44 | | | | 7.03 | |
| 97.030.000-7 | | ESTADO | | Chile | | UF | | | - | | | | - | | | | - | | | | 172,591 | | | | 172,591 | | | | 345,182 | | | | 1,586 | | | | - | | | | - | | | | 172,420 | | | | 172,530 | | | | 346,536 | | | At Expiration | | | 5.50 | | | | 5.50 | |
| | | | | | | | | | | | | | | | | | | | | | | | | | | | | | | | | | | | | | | | | | | | | | | | | | | | | | | | | | | | | | | | | |
| Guaranteed obligations | | | | | | | | | | | | | | | | | | | | | | | | | | | | | | | | | | | | | | | | | | | | | | | | | | | | | | | | | | | | | | | | |
| | | | | | | | | | | | | | | | | | | | | | | | | | | | | | | | | | | | | | | | | | | | | | | | | | | | | | | | | | | | | | | | | |
| 0-E | | CREDIT AGRICOLE | | France | | US$ | | | 658 | | | | 1,986 | | | | 5,384 | | | | 2,052 | | | | - | | | | 10,080 | | | | 715 | | | | 1,986 | | | | 5,384 | | | | 2,052 | | | | - | | | | 10,137 | | | Quarterly | | | 3.23 | | | | 3.23 | |
| 0-E | | BNP PARIBAS | | U.S.A. | | US$ | | | 10,553 | | | | 43,430 | | | | 114,247 | | | | 117,556 | | | | 225,912 | | | | 511,698 | | | | 13,334 | | | | 44,191 | | | | 110,977 | | | | 115,747 | | | | 224,093 | | | | 508,342 | | | Quarterly | | | 4.55 | | | | 4.55 | |
| 0-E | | WILMINGTON TRUST | | U.S.A. | | US$ | | | 20,689 | | | | 65,846 | | | | 178,818 | | | | 237,334 | | | | 450,071 | | | | 952,758 | | | | 26,365 | | | | 65,846 | | | | 173,617 | | | | 235,058 | | | | 447,686 | | | | 948,572 | | | Quarterly | | | 4.47 | | | | 4.47 | |
| 0-E | | CITIBANK | | U.S.A. | | US$ | | | 10,776 | | | | 32,790 | | | | 90,991 | | | | 72,189 | | | | 62,619 | | | | 269,365 | | | | 11,923 | | | | 32,790 | | | | 86,130 | | | | 70,048 | | | | 61,203 | | | | 262,094 | | | Quarterly | | | 3.82 | | | | 2.93 | |
| 0-E | | US BANK | | U.S.A. | | US$ | | | 15,506 | | | | 47,050 | | | | 129,462 | | | | 135,489 | | | | 84,177 | | | | 411,684 | | | | 17,433 | | | | 47,050 | | | | 114,729 | | | | 129,547 | | | | 82,137 | | | | 390,896 | | | Quarterly | | | 4.00 | | | | 2.82 | |
| 0-E | | NATIXIS | | France | | US$ | | | 10,247 | | | | 31,350 | | | | 88,688 | | | | 77,693 | | | | 116,546 | | | | 324,524 | | | | 11,250 | | | | 31,350 | | | | 86,883 | | | | 76,760 | | | | 115,285 | | | | 321,528 | | | Quarterly | | | 4.69 | | | | 4.69 | |
| 0-E | | PK AIRFINANCE | | U.S.A. | | US$ | | | 2,319 | | | | 7,208 | | | | 24,944 | | | | 3,144 | | | | - | | | | 37,615 | | | | 2,387 | | | | 7,208 | | | | 24,944 | | | | 3,144 | | | | - | | | | 37,683 | | | Monthly | | | 4.15 | | | | 4.14 | |
| 0-E | | INVESTEC | | England | | US$ | | | 1,454 | | | | 8,472 | | | | 21,667 | | | | 22,421 | | | | - | | | | 54,014 | | | | 1,879 | | | | 8,661 | | | | 21,154 | | | | 22,309 | | | | - | | | | 54,003 | | | Semiannual | | | 7.17 | | | | 7.17 | |
| - | | SWAP Received Aircraft | | - | | US$ | | | 194 | | | | 414 | | | | 158 | | | | - | | | | - | | | | 766 | | | | 194 | | | | 414 | | | | 158 | | | | - | | | | - | | | | 766 | | | Quarterly | | | - | | | | - | |
| | | | | | | | | | | | | | | | | | | | | | | | | | | | | | | | | | | | | | | | | | - | | | | | | | | | | | | | | | | | | | | | | | |
| Other guaranteed obligations | | | | | | | | | | | | | | | | | | | | | | | | | | | | | | | | | | | | | | | | | | | | | | | | | | | | | | | | | | | | | | | | |
| | | | | | | | | | | | | | | | | | | | | | | | | | | | | | | | | | | | | | | | | | | | | | | | | | | | | | | | | | | | | | | | | |
| 0-E | | CREDIT AGRICOLE | | France | | US$ | | | - | | | | - | | | | 253,692 | | | | - | | | | - | | | | 253,692 | | | | 2,646 | | | | - | | | | 252,207 | | | | - | | | | - | | | | 254,853 | | | At Expiration | | | 4.11 | | | | 4.11 | |
| 0-E | | DVB BANK SE | | Germany | | US$ | | | 23,417 | | | | 70,626 | | | | 191,207 | | | | 117,084 | | | | 19,731 | | | | 422,065 | | | | 23,871 | | | | 70,626 | | | | 188,231 | | | | 116,185 | | | | 19,686 | | | | 418,599 | | | Quarterly | | | 4.42 | | | | 4.42 | |
| | | | | | | | | | | | | | | | | | | | | | | | | | | | | | | | | | | | | | | | | | | | | | | | | | | | | | | | | | | | | | | | | |
| Financial leases | | | | | | | | | | | | | �� | | | | | | | | | | | | | | | | | | | | | | | | | | | | | | | | | | | | | | | | | | | | | | | | | | | |
| | | | | | | | | | | | | | | | | | | | | | | | | | | | | | | | | | | | | | | | | | | | | | | | | | | | | | | | | | | | | | | | | |
| 0-E | | ING | | U.S.A. | | US$ | | | 3,687 | | | | 11,338 | | | | 11,806 | | | | - | | | | - | | | | 26,831 | | | | 3,923 | | | | 11,338 | | | | 11,657 | | | | - | | | | - | | | | 26,918 | | | Quarterly | | | 5.70 | | | | 5.01 | |
| 0-E | | CREDIT AGRICOLE | | France | | US$ | | | 13,171 | | | | 24,577 | | | | 18,655 | | | | - | | | | - | | | | 56,403 | | | | 13,187 | | | | 24,331 | | | | 18,655 | | | | - | | | | - | | | | 56,173 | | | Quarterly | | | 3.66 | | | | 3.31 | |
| 0-E | | CITIBANK | | U.S.A. | | US$ | | | 13,209 | | | | 40,365 | | | | 77,587 | | | | 40,997 | | | | - | | | | 172,158 | | | | 13,998 | | | | 40,365 | | | | 75,830 | | | | 40,801 | | | | - | | | | 170,994 | | | Quarterly | | | 4.40 | | | | 3.80 | |
| 0-E | | PEFCO | | U.S.A. | | US$ | | | 5,486 | | | | 13,094 | | | | 3,827 | | | | - | | | | - | | | | 22,407 | | | | 5,641 | | | | 13,094 | | | | 3,743 | | | | - | | | | - | | | | 22,478 | | | Quarterly | | | 5.64 | | | | 5.02 | |
| 0-E | | BNP PARIBAS | | U.S.A. | | US$ | | | 7,926 | | | | 29,494 | | | | 22,147 | | | | - | | | | - | | | | 59,567 | | | | 8,320 | | | | 29,493 | | | | 21,891 | | | | - | | | | - | | | | 59,704 | | | Quarterly | | | 3.90 | | | | 3.58 | |
| 0-E | | WELLS FARGO | | U.S.A. | | US$ | | | 31,673 | | | | 95,981 | | | | 263,239 | | | | 230,417 | | | | 98,028 | | | | 719,338 | | | | 34,816 | | | | 95,981 | | | | 245,615 | | | | 224,395 | | | | 96,589 | | | | 697,396 | | | Quarterly | | | 2.77 | | | | 2.09 | |
| 97.036.000-K | | SANTANDER | | Chile | | US$ | | | 5,576 | | | | 16,895 | | | | 46,386 | | | | 26,165 | | | | - | | | | 95,022 | | | | 6,000 | | | | 16,895 | | | | 45,346 | | | | 26,063 | | | | - | | | | 94,304 | | | Quarterly | | | 3.68 | | | | 3.14 | |
| 0-E | | RRPF ENGINE | | England | | US$ | | | 552 | | | | 2,531 | | | | 7,142 | | | | 7,752 | | | | 5,035 | | | | 23,012 | | | | 552 | | | | 2,531 | | | | 7,142 | | | | 7,752 | | | | 5,035 | | | | 23,012 | | | Monthly | | | 4.01 | | | | 4.01 | |
| 0-E | | APPLE BANK | | U.S.A. | | US$ | | | 1,444 | | | | 4,393 | | | | 12,146 | | | | 12,808 | | | | 753 | | | | 31,544 | | | | 1,658 | | | | 4,393 | | | | 11,726 | | | | 12,713 | | | | 752 | | | | 31,242 | | | Quarterly | | | 3.93 | | | | 3.33 | |
| 0-E | | BTMU | | U.S.A. | | US$ | | | 2,933 | | | | 8,916 | | | | 24,635 | | | | 25,937 | | | | 768 | | | | 63,189 | | | | 3,199 | | | | 8,916 | | | | 23,798 | | | | 25,751 | | | | 767 | | | | 62,431 | | | Quarterly | | | 4.06 | | | | 3.46 | |
| 0-E | | NATIXIS | | France | | US$ | | | 10,056 | | | | 7,951 | | | | 5,154 | | | | - | | | | - | | | | 23,161 | | | | 10,135 | | | | 7,952 | | | | 5,154 | | | | - | | | | - | | | | 23,241 | | | Quarterly | | | 4.28 | | | | 4.12 | |
| 0-E | | KFW IPEX-BANK | | Germany | | US$ | | | 1,699 | | | | 5,188 | | | | 5,328 | | | | - | | | | - | | | | 12,215 | | | | 1,723 | | | | 5,188 | | | | 5,328 | | | | - | | | | - | | | | 12,239 | | | Quarterly | | | 4.20 | | | | 4.19 | |
| 0-E | | AIRBUS FINANCIAL | | U.S.A. | | US$ | | | 1,915 | | | | 5,838 | | | | 7,664 | | | | - | | | | - | | | | 15,417 | | | | 1,954 | | | | 5,838 | | | | 7,664 | | | | - | | | | - | | | | 15,456 | | | Monthly | | | 4.19 | | | | 4.19 | |
| | | | | | | | | | | | | | | | | | | | | | | | | | | | | | | | | | | | | | | | | | | | | | | | | | | | | | | | | | | | | | | | | |
| Other loans | | | | | | | | | | | | | | | | | | | | | | | | | | | | | | | | | | | | | | | | | | | | | | | | | | | | | | | | | | | | | | | | |
| | | | | | | | | | | | | | | | | | | | | | | | | | | | | | | | | | | | | | | | | | | | | | | | | | | | | | | | | | | | | | | | | |
| 0-E | | BOEING | | U.S.A. | | US$ | | | - | | | | - | | | | 55,727 | | | | - | | | | - | | | | 55,727 | | | | - | | | | 1,229 | | | | 55,727 | | | | - | | | | - | | | | 56,956 | | | At Expiration | | | 4.01 | | | | 4.01 | |
| 0-E | | CITIBANK (*) | | U.S.A. | | US$ | | | 23,167 | | | | 72,018 | | | | 101,026 | | | | - | | | | - | | | | 196,211 | | | | 23,583 | | | | 72,018 | | | | 100,301 | | | | - | | | | - | | | | 195,902 | | | Quarterly | | | 6.00 | | | | 6.00 | |
| | | | | | | | | | | | | | | | | | | | | | | | | | | | | | | | | | | | | | | | | | | | | | | | | | | | | | | | | | | | | | | | | |
| | | Total | | | | | | | 496,768 | | | | 804,921 | | | | 2,380,633 | | | | 1,367,491 | | | | 1,936,231 | | | | 6,986,044 | | | | 535,318 | | | | 807,586 | | | | 2,318,361 | | | | 1,345,702 | | | | 1,923,632 | | | | 6,930,599 | | | | | | | | | | | |
(*) Securitized bond with the future flows from the sales with credit card in United States and Canada, through the company Guanay Finance Limited.
Interest-bearing loans due in installments to December 31, 2018
Debtor: TAM S.A. and Subsidiaries, Tax No. 02.012.862/0001-60, Brazil.
| | | | | | | | | Nominal values | | | Accounting values | | | | | | | | | |
| | | | | | | | | | | | More than | | | More than | | | More than | | | | | | | | | | | | More than | | | More than | | | More than | | | | | | | | | | | | | | | |
| | | | | | | | | Up to | | | 90 days | | | one to | | | three to | | | More than | | | Total | | | Up to | | | 90 days | | | one to | | | three to | | | More than | | | Total | | | | | | | | | |
| | | | | Creditor | | | | 90 | | | to one | | | three | | | five | | | five | | | nominal | | | 90 | | | to one | | | three | | | five | | | five | | | accounting | | | | | Effective | | | Nominal | |
| Tax No. | | Creditor | | country | | Currency | | days | | | year | | | years | | | years | | | years | | | value | | | days | | | year | | | years | | | years | | | years | | | value | | | Amortization | | rate | | | rate | |
| | | | | | | | | ThUS$ | | | ThUS$ | | | ThUS$ | | | ThUS$ | | | ThUS$ | | | ThUS$ | | | ThUS$ | | | ThUS$ | | | ThUS$ | | | ThUS$ | | | ThUS$ | | | ThUS$ | | | | | % | | | % | |
| Bank loans | | | | | | | | | | | | | | | | | | | | | | | | | | | | | | | | | | | | | | | | | | | | | | | | | | |
| | | | | | | | | | | | | | | | | | | | | | | | | | | | | | | | | | | | | | | | | | | | | | | | | | | |
| 0-E | | NEDERLANDSCHE CREDIETVERZEKERING MAATSCHAPPIJ | | Holland | | US$ | | | 138 | | | | 426 | | | | 1,233 | | | | 54 | | | | - | | | | 1,851 | | | | 147 | | | | 426 | | | | 1,233 | | | | 54 | | | | - | | | | 1,860 | | | Monthly | | | 6.01 | | | | 6.01 | |
| | | | | | | | | | | | | | | | | | | | | | | | | | | | | | | | | | | | | | | | | | | | | | | | | | | | | | | | | | | | | | | | | |
| Financial leases | | | | | | | | | | | | | | | | | | | | | | | | | | | | | | | | | | | | | | | | | | | | | | | | | | | | | | | | | | | | | | | | |
| | | | | | | | | | | | | | | | | | | | | | | | | | | | | | | | | | | | | | | | | | | | | | | | | | | | | | | | | | | | | | | | | |
| 0-E | | NATIXIS | | France | | US$ | | | 3,043 | | | | 6,490 | | | | 44,525 | | | | 41,731 | | | | - | | | | 95,789 | | | | 3,656 | | | | 6,490 | | | | 44,525 | | | | 41,731 | | | | - | | | | 96,402 | | | Quarterly/Semiannual | | | 6.87 | | | | 6.87 | |
| 0-E | | WACAPOU LEASING S.A. | | Luxemburg | | US$ | | | 728 | | | | 2,219 | | | | 6,280 | | | | - | | | | - | | | | 9,227 | | | | 756 | | | | 2,219 | | | | 6,280 | | | | - | | | | - | | | | 9,255 | | | Quarterly | | | 4.81 | | | | 4.81 | |
| 0-E | | SOCIÉTÉ GÉNÉRALE MILAN BRANCH | | Italy | | US$ | | | 9,422 | | | | 28,872 | | | | 169,930 | | | | - | | | | - | | | | 208,224 | | | | 10,212 | | | | 28,871 | | | | 169,730 | | | | - | | | | - | | | | 208,813 | | | Quarterly | | | 5.88 | | | | 5.82 | |
| 0-E | | GA Telessis LLC | | U.S.A | | US$ | | | 299 | | | | 908 | | | | 2,496 | | | | 2,623 | | | | 6,876 | | | | 13,202 | | | | 568 | | | | 908 | | | | 3,823 | | | | 2,623 | | | | 6,876 | | | | 14,798 | | | Quarterly | | | 15.62 | | | | 15.62 | |
| | | | | | | | | | | | | | | | | | | | | | | | | | | | | | | | | | | | | | | | | | | | | | | | | | | | | | | | | | | | | | | | | |
| | | Total | | | | | | | 13,630 | | | | 38,915 | | | | 224,464 | | | | 44,408 | | | | 6,876 | | | | 328,293 | | | | 15,339 | | | | 38,914 | | | | 225,591 | | | | 44,408 | | | | 6,876 | | | | 331,128 | | | | | | | | | | | |
| | | | | | | | | | | | | | | | | | | | | | | | | | | | | | | | | | | | | | | | | | | | | | | | | | | | | | | | | | | | | | | | | |
| | | Total consolidated | | | | | | | 510,398 | | | | 843,836 | | | | 2,605,097 | | | | 1,411,899 | | | | 1,943,107 | | | | 7,314,337 | | | | 550,657 | | | | 846,500 | | | | 2,543,952 | | | | 1,390,110 | | | | 1,930,508 | | | | 7,261,727 | | | | | | | | | | | |
The movement of the lease liabilities corresponding to the period reported is as follows:
| | | | | | | | | Lease | |
| | | | | | | | | Liability | |
| | | Aircraft | | | Others | | | total | |
| | | ThUS$ | | | ThUS$ | | | ThUS$ | |
| | | | | | | | | | |
| Opening balance as January 1, 2018 Restated | | | 3,037,585 | | | | 109,387 | | | | 3,146,972 | |
| | | | | | | | | | | | | |
| New contracts | | | 283,620 | | | | 36,191 | | | | 319,811 | |
| Renegotiations | | | (240,047 | ) | | | 1,397 | | | | (238,650 | ) |
| Payments | | | (526,071 | ) | | | (30,316 | ) | | | (556,387 | ) |
| Accrued interest | | | 174,327 | | | | 8,623 | | | | 182,950 | |
| Exchange differences | | | - | | | | (5,667 | ) | | | (5,667 | ) |
| Other variations | | | 8,395 | | | | 625 | | | | 9,020 | |
| | | | | | | | | | | | | |
| Changes | | | (299,776 | ) | | | 10,853 | | | | (288,923 | ) |
| | | | | | | | | | | | | |
| Closing balance as of december 31, 2018 Restated | | | 2,737,809 | | | | 120,240 | | | | 2,858,049 | |
| | | | | | | | | | | | | |
| | | | | | | | | | | | | |
| Opening balance as January 1, 2019 Restated | | | 2,737,809 | | | | 120,240 | | | | 2,858,049 | |
| | | | | | | | | | | | | |
| New contracts | | | 719,525 | | | | 23,878 | | | | 743,403 | |
| Renegotiations | | | (41,535 | ) | | | 12,208 | | | | (29,327 | ) |
| Payments | | | (539,549 | ) | | | (37,391 | ) | | | (576,940 | ) |
| Accrued interest | | | 165,981 | | | | 11,968 | | | | 177,949 | |
| Exchange differences | | | - | | | | 1,614 | | | | 1,614 | |
| Cumulative translation adjustment | | | - | | | | (467 | ) | | | (467 | ) |
| Other variations | | | - | | | | (2,124 | ) | | | (2,124 | ) |
| | | | | | | | | | | | | |
| Changes | | | 304,422 | | | | 9,686 | | | | 314,108 | |
| | | | | | | | | | | | | |
| Closing balance as of December 31, 2019 Restated | | | 3,042,231 | | | | 129,926 | | | | 3,172,157 | |
The company recognizes the interest payments related to the lease liabilities in the consolidated result under Financial expenses (See Note 27 (d)).
| | | | | | | | | Total hedge | |
| | | Current liabilities | | | Non-current liabilities | | | derivatives | |
| | | As of | | | As of | | | As of | | | As of | | | As of | | | As of | |
| | | December 31, | | | December 31, | | | December 31, | | | December 31, | | | December 31, | | | December 31, | |
| | | 2017 | | | 2016 | | | 2017 | | | 2016 | | | 2017 | | | 2016 | |
| | | ThUS$ | | | ThUS$ | | | ThUS$ | | | ThUS$ | | | ThUS$ | | | ThUS$ | |
| | | | | | | | | | | | | | | | | | | |
| Accrued interest from the last date of interest rate swap | | | 1,189 | | | | 2,148 | | | | - | | | | - | | | | 1,189 | | | | 2,148 | |
| Fair value of interest rate derivatives | | | 8,919 | | | | 9,578 | | | | 2,617 | | | | 6,679 | | | | 11,536 | | | | 16,257 | |
| Fair value of foreign currency derivatives | | | 2,092 | | | | 13,155 | | | | - | | | | - | | | | 2,092 | | | | 13,155 | |
| Total hedge derivatives | | | 12,200 | | | | 24,881 | | | | 2,617 | | | | 6,679 | | | | 14,817 | | | | 31,560 | |
| | | Current liabilities | | | Non-current liabilities | | | Total hedge
derivatives | |
| | | As of | | | As of | | | As of | | | As of | | | As of | | | As of | |
| | | December 31, | | | December 31, | | | December 31, | | | December 31, | | | December 31, | | | December 31, | |
| | | 2019 | | | 2018 | | | 2019 | | | 2018 | | | 2019 | | | 2018 | |
| | | ThUS$ | | | ThUS$ | | | ThUS$ | | | ThUS$ | | | ThUS$ | | | ThUS$ | |
| Accrued interest from the last date of interest rate swap | | | 1,723 | | | | 2,321 | | | | - | | | | 340 | | | | 1,723 | | | | 2,661 | |
| Fair value of interest rate derivatives | | | 302 | | | | 335 | | | | 22 | | | | - | | | | 324 | | | | 335 | |
| Fair value of fuel derivatives | | | - | | | | 15,678 | | | | - | | | | - | | | | - | | | | 15,678 | |
| Fair value of foreign currency derivatives | | | 48,347 | | | | 7,587 | | | | - | | | | - | | | | 48,347 | | | | 7,587 | |
| Total hedge derivatives | | | 50,372 | | | | 25,921 | | | | 22 | | | | 340 | | | | 50,394 | | | | 26,261 | |
| (d) | Derivatives do not qualify for hedge accounting |
| | | Current liabilities | | | Non-current liabilities | | | Total derivatives of
no coverage | |
| | | As of | | | As of | | | As of | | | As of | | | As of | | | As of | |
| | | 31 December of | | | 31 December of | | | 31 December of | | | 31 December of | | | 31 December of | | | 31 December of | |
| | | 2019 | | | 2018 | | | 2019 | | | 2018 | | | 2019 | | | 2018 | |
| | | ThUS$ | | | ThUS$ | | | ThUS$ | | | ThUS$ | | | ThUS$ | | | ThUS$ | |
| | | | | | | | | | | | | | | | | | | |
| Derivative of foreign currency not registered as hedge | | | - | | | | 7,712 | | | | - | | | | - | | | | - | | | | 7,712 | |
| Total derived not qualify as hedge accounting | | | - | | | | 7,712 | | | | - | | | | - | | | | - | | | | 7,712 | |
The foreign currency derivatives correspond to options, forwards and swaps.
Hedging operation
The fair values of net assets/ (liabilities), by type of derivative, of the contracts held as hedging instruments are presented below:
| | | As of | | As of | | | As of | | As of | |
| | | December 31, | | December 31, | | | December 31, | | December 31, | |
| | | 2017 | | | 2016 | | | 2019 | | 2018 | |
| | | ThUS$ | | ThUS$ | | | ThUS$ | | ThUS$ | |
| | | | | | | | | | | |
| Cross currency swaps (CCS) (1) | | | 38,875 | | | | (12,286 | ) | | | (22,662 | ) | | | 15,099 | |
| Interest rate swaps (2) | | | (6,542 | ) | | | (16,926 | ) | | | 2,618 | | | | (2,194 | ) |
| Fuel options (3) | | | 10,711 | | | | 10,088 | | | | 48,542 | | | | (15,811 | ) |
| Currency forward - options US$/GBP$ (4) | | | - | | | | 618 | | |
| Currency forward - options US$/EUR$ (4) | | | - | | | | 109 | | |
| Currency options R$/US$ (4) | | | 4,370 | | | | (1,752 | ) | | | (41 | ) | | | - | |
| Currency options CLP/US$ (4) | | | 636 | | | | - | | |
| (1) | Covers the significant variations in cash flows associated with market risk implicit in the changes in the 3-month LIBOR interest rate and the exchange rate US$/UF of bank loans. These contracts are recorded as cash flow hedges and fair value. |
| (2) | Covers the significant variations in cash flows associated with market risk implicit in the increases in the 3 months LIBOR interest rates for long-term loans incurred in the acquisition of aircraft and bank loans. These contracts are recorded as cash flow hedges. |
| (3) | Covers significant variations in cash flows associated with market risk implicit in the changes in the price of future fuel purchases. These contracts are recorded as cash flow hedges. |
| (4) | CoversThey cover the exposure to foreign exchange risk exposure of operating cash flows, mainly caused mainly by fluctuations in the exchange ratefluctuation of the CLP/US$, R$/US$, US$/EUR and US$/GBP.GBP exchange rate. These contracts are recordedregistered as cash flow hedges.hedge contracts. |
During the periods presented, the Company only has cash flow and fair value hedges (in the case of CCS). In the case of fuel hedges, the cash flows subject to such hedges will occur and will impact results in the next 312 months from the date of the consolidated statement of financial position, while in the case of hedges of interest rates, these they will occur and will impact results throughout the life of the associated loans, up to their maturity. In the case of currency hedges through a CCS, there is a group of hedging relationships, in which two types of hedge accounting are generated, one of cash flow for the US $ / UF component; and another of fair value, for the floating rate component US $. The other group of hedging relationships only generates cash flow hedge accounting for the US $ / UF component.
During the periods presented, noAll hedging operations of futurehave been performed for highly probable transaction that have not been realized have occurred.transactions.
Since none of the coverage resulted in the recognition of a non-financial asset, no portion of the result of the derivatives recognized in equity was transferred to the initial value of such assets.
The amounts recognized in comprehensive income during the period and transferred from net equity to income are as follows:
| | | For the period ended | |
| | | December 31, | |
| | | 2017 | | | 2016 | | | 2015 | |
| | | ThUS$ | | | ThUS$ | | | ThUS$ | |
| | | | | | | | | | |
| Debit (credit) recognized in comprehensive income during the period | | | 18,344 | | | | 127,390 | | | | 80,387 | |
| Debit (credit) transferred from net equity to income during the period | | | (15,000 | ) | | | (113,403 | ) | | | (151,244 | ) |
| | | For the year ended
December 31, | |
| | | 2019 | | | 2018 | | | 2017 | |
| | | ThUS$ | | | ThUS$ | | | ThUS$ | |
| | | | | | | | | | |
| Debit (credit) recognized in comprehensive income during the period | | | 66,856 | | | | (27,797 | ) | | | 18,344 | |
| Debit (credit) transferred from net equity to income during the period | | | (30,074 | ) | | | 39,915 | | | | (15,000 | ) |
NOTE 20 - TRADE AND OTHER ACCOUNTS PAYABLES
The composition of Trade and other accounts payables is as follows:
| | | As of | | | As of | |
| | | December 31, | | | December 31, | |
| | | 2017 | | | 2016 | |
| | | ThUS$ | | | ThUS$ | |
| | | | | | | |
| Current | | | | | | | | |
| (a) Trade and other accounts payables | | | 1,349,201 | | | | 1,117,926 | |
| (b) Accrued liabilities at the reporting date | | | 346,001 | | | | 475,142 | |
| Total trade and other accounts payables | | | 1,695,202 | | | | 1,593,068 | |
| | | As of | | | As of | |
| | | December 31, | | | December 31, | |
| | | 2019 | | | 2018 | |
| | | ThUS$ | | | ThUS$ | |
| Current | | | | | | |
| (a) Trade and other accounts payables | | | 1,671,304 | | | | 1,279,976 | |
| (b) Accrued liabilities at the reporting date | | | 551,570 | | | | 394,327 | |
| Total trade and other accounts payables | | | 2,222,874 | | | | 1,674,303 | |
| (a) | Trade and other accounts payable: |
| | | As of | | As of | | | As of | | As of | |
| | | December 31, | | December 31, | | | December 31, | | December 31, | |
| | | 2017 | | 2016 | | | 2019 | | 2018 | |
| | | ThUS$ | | ThUS$ | | | ThUS$ | | ThUS$ | |
| | | | | | | | | | | |
| Trade creditors | | | 1,096,540 | | | | 876,163 | | | | 1,408,690 | | | | 1,048,033 | |
| Leasing obligation | | | 4,448 | | | | 10,446 | | |
| Other accounts payable | | | 248,213 | | | | 231,317 | | | | 262,614 | | | | 231,943 | |
| Total | | | 1,349,201 | | | | 1,117,926 | | | | 1,671,304 | | | | 1,279,976 | |
The details of Trade and other accounts payables are as follows:
| | | As of | | | As of | |
| | | December 31, | | | December 31, | |
| | | 2017 | | | 2016 | |
| | | ThUS$ | | | ThUS$ | |
| | | | | | | |
| Boarding Fee | | | 249,898 | | | | 170,053 | |
| Aircraft Fuel | | | 219,601 | | | | 188,276 | |
| Suppliers technical purchases | | | 114,690 | | | | 40,305 | |
| Airport charges and overflight | | | 106,534 | | | | 77,484 | |
| Handling and ground handling | | | 103,784 | | | | 87,406 | |
| Other personnel expenses | | | 89,621 | | | | 81,632 | |
| Professional services and advisory | | | 81,679 | | | | 79,270 | |
| Marketing | | | 75,220 | | | | 61,053 | |
| Leases, maintenance and IT services | | | 69,873 | | | | 44,287 | |
| Services on board | | | 68,605 | | | | 44,589 | |
| Air companies | | | 31,381 | | | | 21,197 | |
| Land services | | | 31,151 | | | | 74,260 | |
| Maintenance | | | 26,244 | | | | 25,962 | |
| Crew | | | 24,163 | | | | 29,074 | |
| Achievement of goals | | | 5,732 | | | | 17,801 | |
| Communications | | | 5,273 | | | | 7,500 | |
| Aviation insurance | | | 5,108 | | | | 7,694 | |
| Aircraft and engines leasing | | | 4,285 | | | | 10,446 | |
| SEC agreement (*) | | | - | | | | 4,719 | |
| Others | | | 36,359 | | | | 44,918 | |
| Total trade and other accounts payables | | | 1,349,201 | | | | 1,117,926 | |
| | | As of | | | As of | |
| | | December 31, | | | December 31, | |
| | | 2019 | | | 2018 | |
| | | ThUS$ | | | ThUS$ | |
| | | | | | | |
| Aircraft Fuel | | | 476,320 | | | | 304,426 | |
| Boarding Fee | | | 234,070 | | | | 210,621 | |
| Suppliers technical purchases | | | 145,973 | | | | 75,402 | |
| Handling and ground handling | | | 114,163 | | | | 84,213 | |
| Other personnel expenses | | | 93,490 | | | | 92,047 | |
| Professional services and advisory | | | 87,825 | | | | 83,182 | |
| Airport charges and overflight | | | 81,459 | | | | 82,181 | |
| Air companies | | | 79,958 | | | | 59,524 | |
| Marketing | | | 60,850 | | | | 60,303 | |
| Services on board | | | 59,647 | | | | 44,434 | |
| Leases, maintenance and IT services | | | 59,011 | | | | 55,427 | |
| Achievement of goals | | | 30,635 | | | | 21,943 | |
| Maintenance | | | 42,202 | | | | 8,244 | |
| Crew | | | 22,921 | | | | 21,265 | |
| Land services | | | 18,166 | | | | 26,014 | |
| Jol Fleet | | | 3,997 | | | | - | |
| Aviation insurance | | | 3,050 | | | | 11,943 | |
| Others | | | 57,567 | | | | 38,807 | |
| Total trade and other accounts payables | | | 1,671,304 | | | | 1,279,976 | |
(*) Provision made for payments of fines, on July 25, 2016 LATAM reached agreements with the U.S. Department of Justice ("DOJ") U.S. and the Securities and Exchange Commission ("SEC") both authorities of the United States of America, in force as of this date, regarding the investigation on payments by LAN Airlines S.A. made in 2006-2007 to a consultant who advised on the resolution of labor matters in Argentina. The amount to the SEC agreement is ThUS$ 6,744 plus interests of ThUS$ 2,694.
As of December 31, 2017, the debt was paid in full.
| | | As of | | | As of | |
| | | December 31, | | | December 31, | |
| | | 2017 | | | 2016 | |
| | �� | ThUS$ | | | ThUS$ | |
| | | | | | | |
| Accrued personnel expenses | | | 125,246 | | | | 113,785 | |
| Aircraft and engine maintenance | | | 92,711 | | | | 244,949 | |
| Accounts payable to personnel (*) | | | 99,862 | | | | 89,523 | |
| Others accrued liabilities | | | 28,182 | | | | 26,885 | |
| Total accrued liabilities | | | 346,001 | | | | 475,142 | |
| | | As of | | | As of | |
| | | December 31, | | | December 31, | |
| | | 2019 | | | 2018 | |
| | | ThUS$ | | | ThUS$ | |
| | | | | | | |
| Aircraft and engine maintenance | | | 292,793 | | | | 170,731 | |
| Accrued personnel expenses | | | 118,199 | | | | 116,242 | |
| Accounts payable to personnel (*) | | | 91,153 | | | | 81,222 | |
| Others accrued liabilities (**) | | | 49,425 | | | | 26,132 | |
| Total accrued liabilities | | | 551,570 | | | | 394,327 | |
| (*) | Profits and bonus participation (Note 23 letter b). |
(*) Profits and bonds participation (Note 23 letter b)
NOTE 21 - OTHER PROVISIONS
Other provisions:
| | | Current liabilities | | Non-current liabilities | | Total Liabilities | | |
| | | As of | | As of | | As of | | As of | | As of | | As of | | | Current liabilities | | Non-current liabilities | | Total Liabilities | |
| | | December 31, | | December 31, | | December 31, | | December 31, | | December 31, | | December 31, | | | As of | | As of | | As of | | As of | | As of | | As of | |
| | | 2017 | | 2016 | | 2017 | | 2016 | | 2017 | | 2016 | | | December 31, | | December 31, | | December 31, | | December 31, | | December 31, | | December 31, | |
| | | ThUS$ | | ThUS$ | | ThUS$ | | ThUS$ | | ThUS$ | | ThUS$ | | | 2019 | | 2018 | | 2019 | | 2018 | | 2019 | | 2018 | |
| | | | | | | | | | | | | | | | ThUS$ | | ThUS$ | | ThUS$ | | ThUS$ | | ThUS$ | | ThUS$ | |
| Provision for contingencies (1) | | | | | | | | | | | | | | | | | | | | | | | | | | |
| Tax contingencies | | | 1,913 | | | | 1,425 | | | | 258,305 | | | | 313,064 | | | | 260,218 | | | | 314,489 | | | | 2,033 | | | | 2,982 | | | | 164,190 | | | | 197,038 | | | | 166,223 | | | | 200,020 | |
| Civil contingencies | | | 497 | | | | 993 | | | | 62,858 | | | | 56,413 | | | | 63,355 | | | | 57,406 | | | | 2,202 | | | | 1,207 | | | | 66,605 | | | | 59,834 | | | | 68,807 | | | | 61,041 | |
| Labor contingencies | | | 373 | | | | 225 | | | | 28,360 | | | | 29,307 | | | | 28,733 | | | | 29,532 | | | | 971 | | | | 605 | | | | 26,505 | | | | 23,244 | | | | 27,476 | | | | 23,849 | |
| Other | | | - | | | | - | | | | 15,187 | | | | 15,046 | | | | 15,187 | | | | 15,046 | | | | - | | | | - | | | | 19,886 | | | | 13,976 | | | | 19,886 | | | | 13,976 | |
| Provision for European Commision investigation (2) | | | - | | | | - | | | | 9,883 | | | | 8,664 | | | | 9,883 | | | | 8,664 | | |
| Provision for European | | | | | | | | | | | | | | | | | | | | | | | | | |
| Commission investigation (2) | | | | - | | | | - | | | | 9,217 | | | | 9,403 | | | | 9,217 | | | | 9,403 | |
| Total other provisions (3) | | | 2,783 | | | | 2,643 | | | | 374,593 | | | | 422,494 | | | | 377,376 | | | | 425,137 | | | | 5,206 | | | | 4,794 | | | | 286,403 | | | | 303,495 | | | | 291,609 | | | | 308,289 | |
| (1) | Provisions for contingencies: |
The tax contingencies correspond to litigation and tax criteria related to the tax treatment applicable to direct and indirect taxes, which are found in both administrative and judicial stage.
The civil contingencies correspond to different demands of civil order filed against the Company.
The labor contingencies correspond to different demands of labor order filed against the Company.
The Provisions are recognized in the consolidated income statement in administrative expenses or tax expenses, as appropriate.
| (2) | Provision made for proceedings brought by the European Commission for possible breaches of free competition in the freight market. |
| (3) | Total other provision atas of December 31, 2017,2019, and 2016,December 31, 2018, include the fair value correspond to those contingencies from the business combination with TAM S.A and subsidiaries, with a probability of loss under 50%, which are not provided for the normal application of IFRS enforcement and that only must be recognized in the context of a business combination in accordance with IFRS 3. |
Movement of provisions:
| | | | | | European | | | | |
| | | Legal | | | Commission | | | | |
| | | claims (1) | | | Investigation (2) | | | Total | |
| | | ThUS$ | | | ThUS$ | | | ThUS$ | |
| | | | | | | | | | |
| Opening balance as of January 1, 2015 | | | 705,552 | | | | 9,999 | | | | 715,551 | |
| Increase in provisions | | | 54,675 | | | | - | | | | 54,675 | |
| Provision used | | | (19,522 | ) | | | - | | | | (19,522 | ) |
| Difference by subsidiaries conversion | | | (220,266 | ) | | | - | | | | (220,266 | ) |
| Reversal of provision | | | (100,740 | ) | | | - | | | | (100,740 | ) |
| Exchange difference | | | (1,246 | ) | | | (1,033 | ) | | | (2,279 | ) |
| Closing balance as of December 31, 2015 | | | 418,453 | | | | 8,966 | | | | 427,419 | |
| | | | | | | | | | | | | |
| Opening balance as of January 1, 2016 | | | 418,453 | | | | 8,966 | | | | 427,419 | |
| Increase in provisions | | | 141,797 | | | | - | | | | 141,797 | |
| Provision used | | | (21,997 | ) | | | - | | | | (21,997 | ) |
| Difference by subsidiaries conversion | | | 79,396 | | | | - | | | | 79,396 | |
| Reversal of provision | | | (201,425 | ) | | | - | | | | (201,425 | ) |
| Exchange difference | | | 249 | | | | (302 | ) | | | (53 | ) |
| Closing balance as of December 31, 2016 | | | 416,473 | | | | 8,664 | | | | 425,137 | |
| | | | | | | | | | | | | |
| Opening balance as of January 1, 2017 | | | 416,473 | | | | 8,664 | | | | 425,137 | |
| Increase in provisions | | | 106,943 | | | | - | | | | 106,943 | |
| Provision used | | | (14,860 | ) | | | - | | | | (14,860 | ) |
| Difference by subsidiaries conversion | | | (5,830 | ) | | | - | | | | (5,830 | ) |
| Reversal of provision | | | (135,109 | ) | | | - | | | | (135,109 | ) |
| Exchange difference | | | (124 | ) | | | 1,219 | | | | 1,095 | |
| Closing balance as of December 31, 2017 | | | 367,493 | | | | 9,883 | | | | 377,376 | |
| | | | | | European | | | | |
| | | Legal | | | Commission | | | | |
| | | claims (1) | | | Investigation (2) | | | Total | |
| | | ThUS$ | | | ThUS$ | | | ThUS$ | |
| Opening balance as of January 1, 2017 | | 416,473 | | | 8,664 | | | 425,137 | |
| Increase in provisions | | | 106,943 | | | | - | | | | 106,943 | |
| Provision used | | | (14,860 | ) | | | - | | | | (14,860 | ) |
| Difference by subsidiaries conversion | | | (5,830 | ) | | | - | | | | (5,830 | ) |
| Reversal of provision | | | (135,109 | ) | | | - | | | | (135,109 | ) |
| Exchange difference | | | (124 | ) | | | 1,219 | | | | 1,095 | |
| | | | | | | | | | | | | |
| Closing balance as of December 31, 2017 | | | 367,493 | | | | 9,883 | | | | 377,376 | |
| | | | | | | | | | | | | |
| Opening balance as of January 1, 2018 | | | 367,493 | | | | 9,883 | | | | 377,376 | |
| Increase in provisions | | | 106,870 | | | | - | | | | 106,870 | |
| Provision used | | | (59,032 | ) | | | - | | | | (59,032 | ) |
| Difference by subsidiaries conversion | | | (48,330 | ) | | | - | | | | (48,330 | ) |
| Reversal of provision | | | (66,965 | ) | | | - | | | | (66,965 | ) |
| Exchange difference | | | (1,150 | ) | | | (480 | ) | | | (1,630 | ) |
| | | | | | | | | | | | | |
| Closing balance as of December 31, 2018 | | | 298,886 | | | | 9,403 | | | | 308,289 | |
| | | | | | | | | | | | | |
| Opening balance as of January 1, 2019 | | | 298,886 | | | | 9,403 | | | | 308,289 | |
| Increase in provisions | | | 134,847 | | | | - | | | | 134,847 | |
| Provision used | | | (82,212 | ) | | | - | | | | (82,212 | ) |
| Difference by subsidiaries conversion | | | (10,764 | ) | | | - | | | | (10,764 | ) |
| Reversal of provision | | | (58,063 | ) | | | - | | | | (58,063 | ) |
| Exchange difference | | | (302 | ) | | | (186 | ) | | | (488 | ) |
| | | | | | | | | | | | | |
| Closing balance as of December 31, 2019 | | | 282,392 | | | | 9,217 | | | | 291,609 | |
| (1) | Cumulative balances include judicial deposit delivered as security, with respect to the "Aeroví“Aerovía Fundo"Fundo” (FA), for US $ 100US$ 88 million, made in order to suspend the application of the tax credit. The Company is discussing in the Court the constitutionality of the requirement made by FA in a lawsuit. Initially it was covered by the effects of a precautionary measure, this means that the Company would not be obliged to collect the tax, as long as there is no judicial decision in this regard. However, the decision taken by the judge in the first instance was published unfavorably, revoking the injunction. As the lawsuit is still underway (TAM appealed this first decision), the Company needed to make the judicial deposit, for the suspension of the enforceability of the tax credit; deposit that was classified in this item, discounting the existing provision for this purpose. Finally, if the final decision is favorable to the Company, the deposit made will return to TAM. On the other hand, if the court confirms the first decision, said deposit will become a final payment in favor of the Government of Brazil. The procedural stage as of December 31, 20172019 is described in Note 31 in the Role of the case 2001.51.01.012530-0. |
| (2)2) | European Commission Provision: |
Provision constituted on the occasion of the process initiated in December 2007 by the General Competition Directorate of the European Commission against more than 25 cargo airlines, among which is Lan Cargo SA, which forms part of the global investigation initiated in 2006 for possible infractions of free competition in the air cargo market, which was carried out jointly by the European and United States authorities.
With respect to Europe, the General Directorate of Competition imposed fines totaling € 799,445,000 (seven hundred and ninety-nine million four hundred and forty-five thousand Euros) for infractions of European Union regulations on free competition against eleven (11) airlines, among which are LATAM Airlines Group SA and its subsidiary Lan Cargo S.A. S.A .,For its part, LATAM Airlines Group S.A. and Lan Cargo S.A., jointly and severally, have been fined for the amount of € 8,220,000 (eight million two hundred and twenty thousand Euros), for these infractions, an amount that was provisioned in the financial statements of LATAM. On January 24, 2011, LATAM Airlines Group S.A. and Lan Cargo S.A. They appealed the decision before the Court of Justice of the European Union. On December 16, 2015, the European Court resolved the appeal and annulled the Commission'sCommission’s Decision. The European Commission did not appeal the judgment, but on March 17, 2017, the European Commission again adopted its original decision to impose on the eleven lines original areas, the same fine previously imposed, amounting to a total of 776,465,000 Euros In the case of LAN Cargo and its parent, LATAM Airlines Group S.A. imposed the same fine of 8.2 million Euros. The procedural stage as of December 31, 20172019 is described in Note 31 in section (ii) judgments received by LATAM Airlines Group S.A. and Subsidiaries.
NOTE 22 - OTHER NON-FINANCIAL LIABILITIES
| | | Current liabilities | | Non-current liabilities | | Total Liabilities | | | Current liabilities | | Non-current liabilities | | Total Liabilities | |
| | | As of | | As of | | As of | | As of | | As of | | As of | | | As of | | As of | | As of | | As of | | As of | | As of | |
| | | December 31, | | December 31, | | December 31, | | December 31, | | December 31, | | December 31, | | | December 31, | | December 31, | | December 31, | | December 31, | | December 31, | | December 31, | |
| | | 2017 | | 2016 | | 2017 | | 2016 | | 2017 | | 2016 | | | 2019 | | 2018 | | 2019 | | 2018 | | 2019 | | 2018 | |
| | | ThUS$ | | ThUS$ | | ThUS$ | | ThUS$ | | ThUS$ | | ThUS$ | | | ThUS$ | | ThUS$ | | ThUS$ | | ThUS$ | | ThUS$ | | ThUS$ | |
| | | | | | | | | | | | | | | |
| Deferred revenues (*) | | | 2,690,961 | | | | 2,655,086 | | | | 158,305 | | | | 213,781 | | | | 2,849,266 | | | | 2,868,867 | | |
| Deferred revenues (1)(2) | | | | 2,689,083 | | | | 2,330,058 | | | | 851,383 | | | | 644,702 | | | | 3,540,466 | | | | 2,974,760 | |
| Sales tax | | | 22,902 | | | | 19,402 | | | | - | | | | - | | | | 22,902 | | | | 19,402 | | | | 2,556 | | | | 12,726 | | | | - | | | | - | | | | 2,556 | | | | 12,726 | |
| Retentions | | | 38,197 | | | | 45,542 | | | | - | | | | - | | | | 38,197 | | | | 45,542 | | | | 43,916 | | | | 34,434 | | | | - | | | | - | | | | 43,916 | | | | 34,434 | |
| Others taxes | | | 8,695 | | | | 7,465 | | | | - | | | | - | | | | 8,695 | | | | 7,465 | | | | 7,555 | | | | 7,700 | | | | - | | | | - | | | | 7,555 | | | | 7,700 | |
| Dividends payable | | | 46,590 | | | | 20,766 | | | | - | | | | - | | | | 46,590 | | | | 20,766 | | | | 57,129 | | | | 54,580 | | | | - | | | | - | | | | 57,129 | | | | 54,580 | |
| Other sundry liabilities | | | 16,618 | | | | 13,984 | | | | - | | | | - | | | | 16,618 | | | | 13,984 | | | | 34,982 | | | | 15,248 | | | | - | | | | - | | | | 34,982 | | | | 15,248 | |
| Total other non-financial liabilities | | | 2,823,963 | | | | 2,762,245 | | | | 158,305 | | | | 213,781 | | | | 2,982,268 | | | | 2,976,026 | | | | 2,835,221 | | | | 2,454,746 | | | | 851,383 | | | | 644,702 | | | | 3,686,604 | | | | 3,099,448 | |
(*) Note 2.20.Deferred Income Movement
| | | | | | Adjustment | | | | | | | |
| | | Deferred income | | | application | | | | | | | |
| | | | | | | | | | | | Loyalty | | | | | | IAS 29, | | | | | | | |
| | | | | | (1) | | | | | | (accreditation | | | Expiration of | | | Argentina | | | Others | | | | |
| | | Initial balance | | | Recognition | | | Use | | | and exchange) | | | tickets | | | hyperinflation | | | provisions | | | Final balance | |
| | | ThUS$ | | | ThUS$ | | | ThUS$ | | | ThUS$ | | | ThUS$ | | | ThUS$ | | | ThUS$ | | | ThUS$ | |
| From January 1 toDecember 31, 2018 | | | 2,849,266 | | | | 7,690,972 | | | | (8,230,750 | ) | | | 944,246 | | | | (284,730 | ) | | | 927 | | | | 4,829 | | | | 2,974,760 | |
| | | | | | | | | | | | | | | | | | | | | | | | | | | | | | | | | |
| From January 1 toDecember 31, 2019 | | | 2,974,760 | | | | 8,264,970 | | | | (7,703,011 | ) | | | 124,548 | | | | (156,435 | ) | | | 2,232 | | | | 33,402 | | | | 3,540,466 | |
The balance comprises, mainly, deferred income by services not yet rendered at December 31, 2017 and 2016; and programs such as: LATAM Pass, LATAM Fidelidade y Multiplus:
| (1) | The balance includes, mainly, deferred income for services not provided as of December 31, 2019 and December 31, 2018; and programs such as: LATAM Pass, LATAM Fidelidade and Multiplus: |
LATAM Pass is the frequent passenger program created by LAN to reward the preference and loyalty of its customers with multiple benefits and privileges, through the accumulation of kilometersmiles that can be exchanged for free flight tickets or for a varied range of products and services. Customers accumulate LATAM Pass kilometersmiles every time they fly on LAN, TAM, oneworld® member companies and other airlines associated with the program, as well as buying at stores or using the services of a vast network of companies that have an agreement with the program around the world.
For its part, TAM, thinking of people who travel constantly, created the LATAM Fidelidade program, in order to improve the service and give recognition to those who choose the company. Through the program, customers accumulate points in a wide variety of loyalty programs in a single account and can redeem them in all TAM destinations and associated airline companies, and even more, participate in the Multiplus Fidelidade Network.
Multiplus is a coalition of loyalty programs, with the objective of operating accumulation and exchange of points. This program has a network integrated by associated companies, including hotels, financial institutions, retail companies, supermarkets, vehicle leases and magazines, among many other partners from different segments.
After the merger of Multiplus S.A. described in Note1, the Latam Fidelidade programs and the Multiplus coalition and loyalty program become part of the Latam Pass Brazil Program.
During 2018 the Company signed a renewal of the agreement with Banco Santander-Chile, which one extends its alliance in Chile to continue developing travel benefits to its respective clients during the next 7 years, and during 2019 signed a renewal of the agreement with Banco Crédito del Perú.
On September 26, 2019, the Company signed a framework agreement with Delta Air Lines, Inc, in which the latter agreed to pay ThUS $ 350,000 for compensation of costs and revenues that the Company must incur or cease to receive, respectively, during the transition period until the implementation of the strategic alliance. ThUS$ 150,000 was received on September 2019.
During December 2019, the Company sold its rights to receive future payments of the committed transition. The payments consisted of ThUS $ 200,000 payable in 8 quarterly installments of ThUS $ 25,000 as of January 2, 2020. On December 13, 2019, the Company received ThUS $ 194,068 for said sale. Account receivable was derecognized and ThUS$ 5,932 was recognized as financial cost on income statement.
| F-99(2) | As of December 31, 2019, Deferred Income includes ThUS $ 315,225 corresponding to the balance due from the compensation committed from Delta Airlines Inc., which will be recognized in income, on a systematic basis over the period in which related cost it intends to compensate, until the implementation of the strategic alliance. During the year, the Company recognized ThUS $ 4,435 for this concept. |
Additionally, the Company maintains a balance of ThUS $ 30,340 in the Commercial accounts payable item of the Statement of Financial Position regarding to Delta compensation, for the cost already incurred.
NOTE 23 - EMPLOYEE BENEFITS
| | | As of | | As of | | |
| | | December 31, | | December 31, | | | As of | | As of | |
| | | 2017 | | 2016 | | | December 31, | | December 31, | |
| | | ThUS$ | | ThUS$ | | | 2019 | | 2018 | |
| | | | | | | | ThUS$ | | ThUS$ | |
| Retirements payments | | | 55,119 | | | | 49,680 | | | | 64,824 | | | | 56,126 | |
| Resignation payments | | | 10,124 | | | | 10,097 | | | | 9,722 | | | | 8,802 | |
| Other obligations | | | 35,844 | | | | 22,545 | | | | 19,024 | | | | 17,437 | |
| Total liability for employee benefits | | | 101,087 | | | | 82,322 | | | | 93,570 | | | | 82,365 | |
| (a) | The movement in retirements and resignation payments and other obligations: |
| | | | | | Increase (decrease) | | | | | | Actuarial | | | | | | | |
| | | Opening | | | current service | | | Benefits | | | (gains) | | | Currency | | | Closing | |
| | | balance | | | provision | | | paid | | | losses | | | translation | | | balance | |
| | | ThUS$ | | | ThUS$ | | | ThUS$ | | | ThUS$ | | | ThUS$ | | | ThUS$ | |
| | | | | | | | | | | | | | | | | | | |
| From January 1 to December 31, 2015 | | | 74,102 | | | | (13,609 | ) | | | (3,824 | ) | | | 14,631 | | | | (6,029 | ) | | | 65,271 | |
| From January 1 to December 31, 2016 | | | 65,271 | | | | 17,487 | | | | (4,536 | ) | | | 3,105 | | | | 995 | | | | 82,322 | |
| From January 1 to December 31, 2017 | | | 82,322 | | | | 21,635 | | | | (5,399 | ) | | | (2,763 | ) | | | 5,292 | | | | 101,087 | |
| | | | | | Increase (decrease) | | | | | | Actuarial | | | | | | | |
| | | Opening | | | current service | | | Benefits | | | (gains) | | | Currency | | | Closing | |
| | | balance | | | provision | | | paid | | | losses | | | translation | | | balance | |
| | | ThUS$ | | | ThUS$ | | | ThUS$ | | | ThUS$ | | | ThUS$ | | | ThUS$ | |
| From January 1 to December 31, 2018 | | | 101,087 | | | | (7,384 | ) | | | (6,018 | ) | | | 5,819 | | | | (11,139 | ) | | | 82,365 | |
| From January 1 to December 31, 2019 | | | 82,365 | | | | 11,242 | | | | (4,390 | ) | | | 10,636 | | | | (6,283 | ) | | | 93,570 | |
The principal assumptions used in the calculation to the provision in Chile are presented below:
| | | As of | | | For the period ended | |
| | | December 31, | | | December 31, | |
| Assumptions | | 2017 | | 2016 | | | 2019 | | 2018 | |
| | | | | | | | | | | |
| Discount rate | | | 4.55 | % | | | 4.54 | % | | | 3.13 | % | | | 4.27 | % |
| Expected rate of salary increase | | | 4.50 | % | | | 4.50 | % | | | 4.5 | % | | | 4.50 | % |
| Rate of turnover | | | 6.98 | % | | | 6.16 | % | | | 6.04 | % | | | 6.60 | % |
| Mortality rate | | | RV-2014 | | | | RV-2009 | | | | RV-2014 | | | | RV-2014 | |
| Inflation rate | | | 2.72 | % | | | 2.86 | % | | | 2.8 | % | | | 2.7 | % |
| Retirement age of women | | | 60 | | | | 60 | | | | 60 | | | | 60 | |
| Retirement age of men | | | 65 | | | | 65 | | | | 65 | | | | 65 | |
The discount rate corresponds to the 20-year term rate of the BCP Central Bank of Chile Bonds. The RV-2014 mortality tables correspond to those established by the Commission for the Financial Market of Chile and for the determination of the inflation rates; the market performance curves of Central Bank of Chile papers of the BCUs have been used. BCP long term at the date of scope.
The calculation of the present value of the defined benefit obligation is sensitive to the variation of some actuarial assumptions such as discount rate, salary increase, rotation and inflation.
The sensitivity analysis for these variables is presented below:
| | | Effect on the liability | | |
| | | As of | | As of | | | Effect on the liability | |
| | | December 31, | | December 31, | | | As of | | As of | |
| | | 2017 | | 2016 | | | December 31, | | December 31, | |
| | | ThUS$ | | ThUS$ | | | 2019 | | 2018 | |
| | | | | | | | ThUS$ | | ThUS$ | |
| Discount rate | | | | | | | | | | | | | |
| Change in the accrued liability an closing for increase in 100 p.b. | | | (5,795 | ) | | | (5,665 | ) | | | (7,257 | ) | | | (6,538 | ) |
| Change in the accrued liability an closing for decrease of 100 p.b. | | | 6,617 | | | | 5,952 | | | | 5,365 | | | | 4,918 | |
| | | | | | | | | | | | | | | | | |
| Rate of wage growth | | | | | | | | | | | | | | | | |
| Change in the accrued liability an closing for increase in 100 p.b. | | | 6,412 | | | | 6,334 | | | | 4,989 | | | | 4,750 | |
| Change in the accrued liability an closing for decrease of 100 p.b. | | | (5,750 | ) | | | (5,644 | ) | | | (7,159 | ) | | | (6,547 | ) |
| (b) | The liability for short-term: |
| | | As of | | | As of | |
| | | December 31, | | | December 31, | |
| | | 2017 | | | 2016 | |
| | | ThUS$ | | | ThUS$ | |
| | | | | | | |
| Profit-sharing and bonuses (*) | | | 99,862 | | | | 89,523 | |
| | | As of
December 31,
2019 | | | As of
December 31,
2018 | |
| | | ThUS$ | | | ThUS$ | |
| | | | | | | | | |
| Profit-sharing and bonuses (*) | | | 91,153 | | | | 81,222 | |
| (*) | Accounts payables to employees (Note 20 letter b) |
The participation in profits and bonuses correspond to an annual incentives plan for achievement of objectives.
| (c) | Employment expenses are detailed below: |
| | | For the periods ended | |
| | | December 31, | |
| | | 2017 | | | 2016 | | | 2015 | |
| | | ThUS$ | | | ThUS$ | | | ThUS$ | |
| | | | | | | | | | |
| Salaries and wages | | | 1,604,552 | | | | 1,549,402 | | | | 1,631,320 | |
| Short-term employee benefits | | | 145,245 | | | | 132,436 | | | | 171,366 | |
| Termination benefits | | | 85,070 | | | | 79,062 | | | | 51,684 | |
| Other personnel expenses | | | 188,767 | | | | 190,233 | | | | 218,435 | |
| Total | | | 2,023,634 | | | | 1,951,133 | | | | 2,072,805 | |
| | | For the year ended | |
| | | December 31, | |
| | | 2019 | | | 2018 | | | 2017 | |
| | | ThUS$ | | | ThUS$ | | | ThUS$ | |
| Salaries and wages | | | 1,478,804 | | | | 1,481,357 | | | | 1,604,552 | |
| Short-term employee benefits | | | 147,576 | | | | 132,394 | | | | 145,245 | |
| Termination benefits | | | 54,256 | | | | 54,007 | | | | 85,070 | |
| Other personnel expenses | | | 114,126 | | | | 152,211 | | | | 188,767 | |
| Total | | | 1,794,762 | | | | 1,819,969 | | | | 2,023,634 | |
NOTE 24 - ACCOUNTS PAYABLE, NON-CURRENT
| | | As of | | As of | | |
| | | December 31, | | December 31, | | | As of | | As of | |
| | | 2017 | | 2016 | | | December 31, | | December 31, | |
| | | ThUS$ | | ThUS$ | | | 2019 | | 2018 | |
| | | | | | | | ThUS$ | | ThUS$ | |
| Aircraft and engine maintenance | | | 483,795 | | | | 347,085 | | | | 412,710 | | | | 513,544 | |
| Fleet (JOL) | | | | 190,225 | | | | - | |
| Provision for vacations and bonuses | | | 14,725 | | | | 12,080 | | | | 15,868 | | | | 15,357 | |
| Other sundry liabilities | | | 312 | | | | 226 | | | | 307 | | | | 376 | |
| Total accounts payable, non-current | | | 498,832 | | | | 359,391 | | | | 619,110 | | | | 529,277 | |
NOTE 25 - EQUITY
The Company’s objective is to maintain an appropriate level of capitalization that enables it to ensure access to the financial markets for carrying out its medium and long-term objectives, optimizing the return for its shareholders and maintaining a solid financial position.
The paid capital of the Company at December 31, 20172019 amounts to ThUS$ 3,146,265 (*) divided into 606,407,693 common stock of a same series (ThUS$ 3,149,5643,146,265 (**) divided into 606,407,693 shares as of December 31, 2016)2018), a single series nominative, ordinary character with no par value. There are no special series of shares and no privileges. The form of its stock certificates and their issuance, exchange, disablement, loss, replacement and other similar circumstances, as well as the transfer of the shares, is governed by the provisions of Corporations Law and its regulations.
(*) Includes deduction of issuance costs for ThUS $ThUS$ 3,299 and adjustment for placement of 10,282 shares for ThUS $ThUS$ 156, approved at the Extraordinary Shareholders Meeting of the Company on April 27, 2017.
(**) Includes adjustment for placement of the aforementioned 10,282 shares for ThUS $ 156.
| (b) | Subscribed and paid shares |
On August 18, 2016, the Company held an extraordinary shareholders’ meeting of shareholders inat which it was approved to increase the capital by issuing 61,316,424 payment shares, of payment, all ordinary, shares, without par value. As of December 31, 2017,2016, 60,849,592 shares had been placed against thissaid increase, according to the following breakdown: (a) 30,499,685 shares subscribed and paid at the end of the preferred subscriptionpre-emptive option period, which expired on December 23, 2016; December 2016, raisingcollecting the equivalent of US$US $ 304,996,850; and (b) 30,349,907 additional shares subscribed on December 28, 2016, earningcollecting the equivalent of US$ 303,499,070.
As a result of the Due to this last described placement, as of December 31, 2017,2019, the number Company sharesof subscribed and paid amountsshares of the Company reached 606,407,693. On August 18, 2019, there was a full reduction of capital after the expiration of the three-year legal term to 606,407,693.
Atsubscribe the balance of 466,832 shares depending on the placement of this capital increase. Consequently, at December 31, 2017,2019 the Company'sstatutory capital stockof the Company is represented by 608,374,525606,874,525 shares, all of the same and unique series, nominative,registered, ordinary, with nowithout par value, which is divided into: (a) the 606,407,693 subscribed and paid shares mentioned above; and (b) 1,966,832 shares pending subscription and payment, of which: (i) 1,500,000 shares are allocated to compensation stock option plans; and (ii) 466,832 correspond to the balance of shares pending placement of the last capital increase.
During 2016, the Company's capital stock was expressed in 613,164,243 shares, all of the same and unique series, nominative, ordinary, with no par value, that is, 551,847,819 shares already authorized at the beginning of the year and 61,316,424 shares authorized in the last Capital increase dated August 18, 2016. However, on December 21, 2016, the deadline for the subscription and payment of 4,789,718 shares that were destined to compensation plans for workers expired, so that the Company's capital stock was reduced to 608,374,525 shares.
into. The following table shows the movement of the authorized and fully paid shares previously described above:
Movement of authorized shares
| | Nro. Of | |
| | shares | |
| | | |
Autorized shares as of January 1, 2016 | | | 551,847,819 | |
Increase capital approved at Extraordinary Shareholders meeting dated August 18, 2016 | | | 61,316,424 | |
Full capital decrease due to maturity of the subscription and payment period of the compensation plan 2011, December 21, 2016 (*) | | | (4,789,718 | ) |
Authorized shares as of December 31, 2016 | | | 608,374,525 | |
| | | | |
Autorized shares as of January 1, 2017 | | | 608,374,525 | |
There is no movement of authorized shares during the period 2017 | | | - | |
Authorized shares as of December 31, 2017 | | | 608,374,525 | |
| | | | | Expired shares | | | | |
| | | Opening | | | intended for
compensation plans | | | Closing | |
| Nro. Of shares | | balance | | | and others | | | balance | |
| From July 1 to December 31, 2018 | | | 608,374,525 | | | | (1,500,000 | )(*) | | | 606,874,525 | |
| From July 1 to December 31, 2019 | | | 606,874,525 | | | | (466,832 | ) | | | 606,407,693 | |
(*) See Note 34 (a.1)On June 11, 2018, the term of subscription and payment of 1,500,000 shares to create and implement compensation plans for Company employees expired.
Movement fully paid shares
| | | | | | Movement | | | | | | | |
| | | | | | value | | | Cost of issuance | | | | |
| | | | | | of shares | | | and placement | | | Paid- in | |
| | | N° of | | | (1) | | | of shares (2) | | | Capital | |
| | | shares | | | ThUS$ | | | ThUS$ | | | ThUS$ | |
| | | | | | | | | | | | | |
| Paid shares as of January 1, 2016 | | | 545,547,819 | | | | 2,552,066 | | | | (6,361 | ) | | | 2,545,705 | |
| Approved at Extraordinary Shereholders meeting dated August 18, 2016 | | | 60,849,592 | | | | 608,496 | | | | - | | | | 608,496 | |
| Capital reserve | | | - | | | | - | | | | (4,793 | ) | | | (4,793 | ) |
| Increase (decrease) by transfers and other changes (4) | | | 10,282 | | | | 156 | | | | - | | | | 156 | |
| Paid shares as of December 31, 2016 | | | 606,407,693 | | | | 3,160,718 | | | | (11,154 | ) | | | 3,149,564 | |
| Paid shares as of January 1, 2017 | | | 606,407,693 | | | | 3,160,718 | | | | (11,154 | ) | | | 3,149,564 | |
| Capital reserve | | | - | | | | - | | | | (3,299 | ) | | | (3,299 | ) |
| Paid shares as of December 31, 2017 | | | 606,407,693 | (3) | | | 3,160,718 | | | | (14,453 | ) | | | 3,146,265 | |
| | | | | | Movement | | | | | | | |
| | | | | | value | | | Cost of issuance | | | | |
| | | | | | of shares | | | and placement | | | Paid- in | |
| | | N° of | | | (1) | | | of shares (2) | | | Capital | |
| | | shares | | | ThUS$ | | | ThUS$ | | | ThUS$ | |
| Paid shares as of January 1, 2018 | | | 606,407,693 | | | | 3,160,718 | | | | (14,453 | ) | | | 3,146,265 | |
| There are no movements of shares paid during the 2018 period | | | - | | | | - | | | | - | | | | - | |
| Paid shares as of December 31, 2018 | | | 606,407,693 | | | | 3,160,718 | | | | (14,453 | ) | | | 3,146,265 | |
| Paid shares as of January 1, 2019 | | | 606,407,693 | | | | 3,160,718 | | | | (14,453 | ) | | | 3,146,265 | |
| There are no movements of shares paid during the 2019 period | | | - | | | | - | | | | - | | | | - | |
| Paid shares as of December 31, 2019 | | | 606,407,693 | | | | 3,160,718 | | | | (14,453 | ) | | | 3,146,265 | |
| (1) | Amounts reported represent only those arising from the payment of the shares subscribed. |
(1) Amounts reported represent only those arising from the payment of the shares subscribed.
| (2) | Decrease of capital by capitalization of reserves for cost of issuance and placement of shares established according to Extraordinary Shareholder´s Meetings, where such decreases were authorized. |
(2) Decrease of capital by capitalization of reserves for cost of issuance and placement of shares established according to Extraordinary Shareholder´s Meetings, where such decreases were authorized.
(3) At December 31, 2017, the difference between authorized shares and fully paid shares are 1,966,832 shares, of which 1,500,000 correspond to compensation plans for executives of LATAM Airlines Group S.A. and subsidiaries (see Note 34(a.2)) and 466,832 correspond to the shares issued and unsubscribed from the capital increase approved at the Extraordinary Shareholders Meeting held on August 18, 2016.
(4) These 10,282 shares were placed in January 2014 and charged to the Compensation plan 2011 (See Note 34 (a.1))
(c) Treasury stock
At December 31, 2017,2019, the Company held no treasury stock, the remaining of ThUS$ (178) corresponds to the difference between the amount paid for the shares and their book value, at the time of the full right decrease of the shares which held in its portfolio.
(d) Reserve of share- based payments
| (d) | Reserve of share- based payments |
Movement of Reserves of share- based payments:
| | | | | Stock | | | | | | | | | | | | Stock | | | | |
| | | Opening | | option | | Deferred | | Net movement | | Closing | | | Opening | | option | | Closing | |
| Periods | | balance | | plan | | tax | | of the period | | balance | | | balance | | plan | | balance | |
| | | ThUS$ | | ThUS$ | | ThUS$ | | ThUS$ | | ThUS$ | | | | ThUS$ | | | | ThUS$ | | | | ThUS$ | |
| | | | | | | | | | | | | |
| From January 1 to December 31, 2015 | | | 29,642 | | | | 8,924 | | | | (2,919 | ) | | | 6,005 | | | | 35,647 | | |
| From January 1 to December 31, 2016 | | | 35,647 | | | | 3,698 | | | | (807 | ) | | | 2,891 | | | | 38,538 | | |
| From January 1 to December 31, 2017 | | | 38,538 | | | | 943 | | | | - | | | | 943 | | | | 39,481 | | | | 38,538 | | | | 943 | | | | 39,481 | |
| From January 1 to December 31, 2018 | | | | 39,481 | | | | (1,607 | ) | | | 37,874 | |
| From January 1 to December 31, 2019 | | | | 37,874 | | | | (1,585 | ) | | | 36,289 | |
These reserves are related to the “Share-based payments” explained in Note 34.
(e) Other sundry reserves
Movement of Other sundry reserves:
| | | Opening | | | Legal | | | Closing | |
| Periods | | balance | | | reserves | | | balance | |
| | | ThUS$ | | | ThUS$ | | | ThUS$ | |
| | | | | | | | | | |
| From January 1 to December 31, 2015 | | | 2,635,748 | | | | (1,069 | ) | | | 2,634,679 | |
| From January 1 to December 31, 2016 | | | 2,634,679 | | | | 5,602 | | | | 2,640,281 | |
| From January 1 to December 31, 2017 | | | 2,640,281 | | | | (501 | ) | | | 2,639,780 | |
| | | Opening | | | Transactions
with | | | Legal | | | Closing | |
| Periods | | balance | | | minorities | | | reserves | | | balance | |
| | | ThUS$ | | | ThUS$ | | | ThUS$ | | | ThUS$ | |
| From January 1 to December 31, 2017 | | | 2,640,281 | | | | - | | | | (501 | ) | | | 2,639,780 | |
| From January 1 to December 31, 2018 | | | 2,639,780 | | | | - | | | | (864 | ) | | | 2,638,916 | |
| From January 1 to December 31, 2019 | | | 2,638,916 | | | | (184,135 | ) | | | (2,312 | ) | | | 2,452,469 | |
Balance of Other sundry reserves comprisescomprise the following:
| | | As of | | As of | | As of | | |
| | | December 31, | | December 31, | | December 31, | | | As of | | As of | | As of | |
| | | 2017 | | 2016 | | 2015 | | | December 31, | | December 31, | | December 31, | |
| | | ThUS$ | | ThUS$ | | ThUS$ | | | 2019 | | 2018 | | 2017 | |
| | | | | | | | | | ThUS$ | | ThUS$ | | ThUS$ | |
| Higher value for TAM S.A. share exchange (1) | | | 2,665,692 | | | | 2,665,692 | | | | 2,665,692 | | | | 2,665,692 | | | | 2,665,692 | | | | 2,665,692 | |
| Reserve for the adjustment to the value of fixed assets (2) | | | 2,620 | | | | 2,620 | | | | 2,620 | | | | 2,620 | | | | 2,620 | | | | 2,620 | |
| Transactions with non-controlling interest (3) | | | (25,911 | ) | | | (25,911 | ) | | | (25,891 | ) | | | (210,048 | ) | | | (25,913 | ) | | | (25,911 | ) |
| Cost of issuance and placement of shares | | | 0 | | | | (9 | ) | | | (4,793 | ) | |
| Others | | | (2,621 | ) | | | (2,111 | ) | | | (2,949 | ) | | | (5,795 | ) | | | (3,483 | ) | | | (2,621 | ) |
| Total | | | 2,639,780 | | | | 2,640,281 | | | | 2,634,679 | | | | 2,452,469 | | | | 2,638,916 | | | | 2,639,780 | |
(1) Corresponds to the difference between the value of the shares of TAM S.A., acquired by Sister Holdco S.A. (under the Subscriptions) and by Holdco II S.A. (by virtue of the Exchange Offer), which is recorded in the declaration of completion of the merger by absorption, and the fair value of the shares exchanged by LATAM Airlines Group S.A. as of June 22, 2012.
(2) Corresponds to the technical revaluation of the fixed assets authorized by the Commission for the Financial Market in the year 1979, in Circular No. 1529. The revaluation was optional and could be made only once; the originated reserve is not distributable and can only be capitalized.
(3) The balance as of December 31, 2019 corresponds to the loss generated by: Lan Pax Group S.A. e Inversiones Lan S.A. in the acquisition of shares of Aerovías de Integración Regional Aires S.A. for ThUS$ (3,480) and ThUS$ (20), respectively; the acquisition of TAM S.A. of the minority interest in Aerolinhas Brasileiras S.A. for ThUS$ (885), the acquisition of Inversiones Lan S.A. of the minority participation in Aires Integra Regional Airlines S.A. for an amount of ThUS$ (2) and the acquisition of a minority stake in Aerolane S.A. by Lan Pax Group S.A. for an amount of ThUS$ (21,526) through Holdco Ecuador S.A. The loss due to the acquisition of the minority interest of Multiplus S.A. for ThUS$ (184.135) (see Note 1).
| (1)(f) | Corresponds to the differenceReserves with effect in the shares value of TAM S.A. acquired (under subscriptions) by Sister Holdco S.A. and Holdco II S.A. (under the Exchange Offer), as stipulated in the Declaration of Posting of Merger by Absorption and the fair value of these exchange shares of LATAM Airlines Group S.A. at June 22, 2012.other comprehensive income. |
| (2) | Corresponds to the technical revaluation of fixed assets authorized by the Commission for the Financial Market in 1979, in Circular N° 1529. The revaluation was optional and could be taken only once, the reserve is not distributable and can only be capitalized. |
| (3) | The balance at December 31, 2017, correspond to the loss generated by the participation of Lan Pax Group S.A. and Inversiones Lan S.A. in the acquisition of shares of Aerovías de Integración Regional Aires of ThUS$ (3,480) and ThUS$ (20), respectively; the acquisition of TAM S.A. of the minority holding of Aerolinhas Brasileiras S.A. of ThUS$ (885) and the acquisition of minority interest of Aerolane S.A. by Lan Pax group S.A. through Holdco Ecuador S.A. for US$ (21,526). |
(f) Reserves with effect in other comprehensive income.
Movement of Reserves with effect in other comprehensive income:
| | | | | | | Actuarial gain | | | | | Currency | | Cash flow | | | Actuarial gain | | | |
| | | Currency | | Cash flow | | or loss on defined | | | | | translation | | hedging | | | or loss on defined | | | |
| | | translation | | hedging | | benefit plans | | | | | reserve | | reserve | | | benefit plans reserve | | | Total | |
| | | reserve | | reserve | | reserve | | Total | | | ThUS$ | | ThUS$ | | ThUS$ | | ThUS$ | |
| Opening balance as of January 1, 2017 | | | | (2,086,555 | ) | | | 1,506 | | | | (12,900 | ) | | | (2,097,949 | ) |
| Increase (decrease) by application of new accounting standards | | | | 215,299 | | | | - | | | | - | | | | 215,299 | |
| Initial balance Restated | | | | (1,871,256 | ) | | | 1,506 | | | | (12,900 | ) | | | (1,882,650 | ) |
| | | ThUS$ | | ThUS$ | | ThUS$ | | ThUS$ | | | | | | | | | | | | | | | | | |
| | | | | | | | | | | |
| Opening balance as of January 1, 2015 | | | (1,193,871 | ) | | | (151,340 | ) | | | - | | | | (1,345,211 | ) | |
| Derivatives valuation gains (losses) | | | - | | | | 82,730 | | | | - | | | | 82,730 | | | | - | | | | 18,436 | | | | - | | | | 18,436 | |
| Deferred tax | | | - | | | | (21,900 | ) | | | - | | | | (21,900 | ) | | | - | | | | (1,802 | ) | | | - | | | | (1,802 | ) |
| Actuarial reserves by employee benefit plans | | | - | | | | - | | | | (14,627 | ) | | | (14,627 | ) | | | - | | | | - | | | | 2,758 | | | | 2,758 | |
| Deferred tax actuarial IAS by employee benefit plans | | | - | | | | - | | | | 3,910 | | | | 3,910 | | | | - | | | | - | | | | (784 | ) | | | (784 | ) |
| Difference by subsidiaries conversion | | | (1,382,170 | ) | | | - | | | | - | | | | (1,382,170 | ) | |
| Closing balance as of December 31, 2015 | | | (2,576,041 | ) | | | (90,510 | ) | | | (10,717 | ) | | | (2,677,268 | ) | |
| Translation difference subsidiaries | | | | (54,458 | ) | | | - | | | | - | | | | (54,458 | ) |
| Closing balance as of December 31, 2017 Restated | | | | (1,925,714 | ) | | | 18,140 | | | | (10,926 | ) | | | (1,918,500 | ) |
| | | | | | | | | | | | | | | | | | | | | | | | | | | | | | | | | |
| Opening balance as of January 1, 2016 | | | (2,576,041 | ) | | | (90,510 | ) | | | (10,717 | ) | | | (2,677,268 | ) | |
| Opening balance as of January 1, 2018 Restated | | | | (1,925,714 | ) | | | 18,140 | | | | (10,926 | ) | | | (1,918,500 | ) |
| Derivatives valuation gains (losses) | | | - | | | | 126,360 | | | | - | | | | 126,360 | | | | - | | | | (26,899 | ) | | | - | | | | (26,899 | ) |
| Deferred tax | | | - | | | | (34,344 | ) | | | - | | | | (34,344 | ) | | | - | | | | (574 | ) | | | - | | | | (574 | ) |
| Actuarial reserves by employee benefit plans | | | - | | | | - | | | | (3,104 | ) | | | (3,104 | ) | | | - | | | | - | | | | (5,818 | ) | | | (5,818 | ) |
| Deferred tax actuarial IAS by employee benefit plans | | | - | | | | - | | | | 921 | | | | 921 | | | | - | | | | - | | | | 1,566 | | | | 1,566 | |
| Difference by subsidiaries conversion | | | 489,486 | | | | - | | | | - | | | | 489,486 | | |
| Closing balance as of December 31, 2016 | | | (2,086,555 | ) | | | 1,506 | | | | (12,900 | ) | | | (2,097,949 | ) | |
| Translation difference subsidiaries | | | | (730,930 | ) | | | - | | | | - | | | | (730,930 | ) |
| Closing balance as of December 31, 2018 | | | | (2,656,644 | ) | | | (9,333 | ) | | | (15,178 | ) | | | (2,681,155 | ) |
| | | | | | | | | | | | | | | | | | | | | | | | | | | | | | | | | |
| Opening balance as of January 1, 2017 | | | (2,086,555 | ) | | | 1,506 | | | | (12,900 | ) | | | (2,097,949 | ) | |
| Opening balance as of January 1, 2019 | | | | (2,656,644 | ) | | | (9,333 | ) | | | (15,178 | ) | | | (2,681,155 | ) |
| Derivatives valuation gains (losses) | | | - | | | | 18,436 | | | | - | | | | 18,436 | | | | - | | | | 65,880 | | | | - | | | | 65,880 | |
| Deferred tax | | | - | | | | (1,802 | ) | | | - | | | | (1,802 | ) | | | - | | | | 345 | | | | - | | | | 345 | |
| Actuarial reserves by employee benefit plans | | | - | | | | - | | | | 2,758 | | | | 2,758 | | | | - | | | | - | | | | (10,635 | ) | | | (10,635 | ) |
| Deferred tax actuarial IAS by employee benefit plans | | | - | | | | - | | | | (784 | ) | | | (784 | ) | | | - | | | | - | | | | 2,873 | | | | 2,873 | |
| Difference by subsidiaries conversion | | | (45,036 | ) | | | - | | | | - | | | | (45,036 | ) | |
| Closing balance as of December 31, 2017 | | | (2,131,591 | ) | | | 18,140 | | | | (10,926 | ) | | | (2,124,377 | ) | |
| Translation difference subsidiaries | | | | (233,643 | ) | | | - | | | | - | | | | (233,643 | ) |
| Closing balance as of December 31, 2019 | | | | (2,890,287 | ) | | | 56,892 | | | | (22,940 | ) | | | (2,856,335 | ) |
(f.1) Currency translation reserve
| (f.1) | Currency translation reserve |
These originate from exchange differences arising from the translation of any investment in foreign entities (or Chilean investment with a functional currency different to that of the parent), and from loans and other instruments in foreign currency designated as hedges for such investments. When the investment (all or part) is sold or disposed and loss of control occurs, these reserves are shown in the consolidated statement of income as part of the loss or gain on the sale or disposal. If the sale does not involve loss of control, these reserves are transferred to non-controlling interests.
| F-106(f.2) | Cash flow hedging reserve |
(f.2) Cash flow hedging reserve
These originate from the fair value valuation at the end of each period of the outstanding derivative contracts that have been defined as cash flow hedges. When these contracts expire, these reserves should be adjusted, and the corresponding results recognized.
(f.3) Reserves of actuarial gains or losses on defined benefit plans
| (f.3) | Reserves of actuarial gains or losses on defined benefit plans |
Correspond to the increase or decrease in the obligation present value for defined benefit plan due to changes in actuarial assumptions, and experience adjustments, which is the effects of differences between the previous actuarial assumptions and what has actually occurred.
(g) Retained earnings
Movement of Retained earnings:
| | | | | | Result | | | | | | Other | | | | |
| | | Opening | | | for the | | | | | | increase | | | Closing | |
| Periods | | balance | | | period | | | Dividends | | | (decreases) | | | balance | |
| | | ThUS$ | | | ThUS$ | | | ThUS$ | | | ThUS$ | | | ThUS$ | |
| | | | | | | | | | | | | | | | |
| From January 1 to December 31, 2015 | | | 536,190 | | | | (219,274 | ) | | | - | | | | 1,034 | | | | 317,950 | |
| From January 1 to December 31, 2016 | | | 317,950 | | | | 69,220 | | | | (20,766 | ) | | | - | | | | 366,404 | |
| From January 1 to December 31, 2017 | | | 366,404 | | | | 155,304 | | | | (46,590 | ) | | | - | | | | 475,118 | |
| | | | | | Increase | | | | | | | | | Other | | | | |
| | | | | | (decrease) by | | | Result | | | | | | increase | | | | |
| | | Opening | | | new standards | | | for the | | | | | | (decreases) | | | Closing | |
| Periods | | balance | | | (1) | | | period | | | Dividends | | | (1) (2) | | | balance | |
| | | | ThUS$ | | | | ThUS$ | | | | ThUS$ | | | | ThUS$ | | | | ThUS$ | | | | ThUS$ | |
| | | | | | | | | | | | | | | | | | | | | | | | | |
| From January 1 to December 31, 2017 (Restated) | | | 366,404 | | | | (460,173 | ) | | | 108,896 | | | | (46,591 | ) | | | - | | | | (31,464 | ) |
| From January 1 to December 31, 2018 (Restated) | | | (31,464 | ) | | | (9,548 | ) | | | 309,811 | | | | (54,580 | ) | | | 4,752 | | | | 218,971 | |
| From January 1 to December 31, 2019 | | | 218,971 | | | | - | | | | 190,430 | | | | (57,129 | ) | | | - | | | | 352,272 | |
(h) Dividends per share
| (1) | Adjustments adoption IFRS 9 and IFRS 15 ThUS (9,548) and IFRS 16 ThUS (460,173) (See Note 2). |
| (2) | Variation effect in Accumulated results, by application IAS 29, Argentina hyperinflation: |
| | | Minimum mandatory | | | Final dividend | |
| | | dividend | | | dividend | |
| Description of dividend | | 2017 | | | 2016 | |
| | | | | | | |
| Date of dividend | | | 12/31/2017 | | | | 12-31-2016 | |
| Amount of the dividend (ThUS$) | | | 46,590 | | | | 20,766 | (*) |
| Number of shares among which the dividend is distributed | | | 606,407,693 | | | | 606,407,693 | |
| Dividend per share (US$) | | | 0.0768 | | | | 0.0342 | |
(*) In accordance with the Material Fact issued on April 27, 2017, LATAM Airlines Group S.A. shareholders approved the distribution of the final dividend proposed by the board of directors in the Ordinary Session of April 4, 2017, amounting to ThUS $ 20,766, which corresponds to 30% of the profits for the year corresponding to the year 2016.
The payment was made on May 18, 2017.
| Items | | ThUS$ | |
| | F-107 | | |
| Property, plant and equipment | | | 4,573 | |
| Intangible assets other than goodwill | | | 69 | |
| Goodwill | | | 335 | |
| Deferred incomes | | | (377 | ) |
| Other non-financial assets | | | 152 | |
| Total Adjust accumulated results | | | 4,752 | |
| | | Minimum mandatory | | | Minimum mandatory | |
| | | dividend | | | dividend | |
| Description of dividend | | 2019 | | | 2018 | |
| | | | | | | |
| Date of dividend | | | 12-31-2019 | | | | 12-31-2018 | |
| Amount of the dividend (ThUS$) | | | 57,129 | | | | 54,580 | |
| Number of shares among which the dividend is distributed | | | 606,407,693 | | | | 606,407,693 | |
| Dividend per share (US$) | | | 0.0942 | | | | 0.0900 | |
NOTE 26 - REVENUE
The detail of revenues is as follows:
| | | For the periods ended | | | For the year ended | |
| | | December 31, | | | December 31, | |
| | | 2017 | | 2016 | | 2015 | | | 2019 | | 2018 | | 2017 | |
| | | ThUS$ | | ThUS$ | | ThUS$ | | | ThUS$ | | ThUS$ | | ThUS$ | |
| | | | | | | | | | | | | | | |
| Passengers LAN | | | 4,313,287 | | | | 4,104,348 | | | | 4,241,918 | | |
| Passengers TAM | | | 4,181,190 | | | | 3,773,367 | | | | 4,168,696 | | |
| Passengers | | | | 9,005,629 | | | | 8,708,988 | | | | 8,494,477 | |
| Cargo | | | 1,119,430 | | | | 1,110,625 | | | | 1,329,431 | | | | 1,064,434 | | | | 1,186,468 | | | | 1,119,430 | |
| Total | | | 9,613,907 | | | | 8,988,340 | | | | 9,740,045 | | | | 10,070,063 | | | | 9,895,456 | | | | 9,613,907 | |
NOTE 27 - COSTS AND EXPENSES BY NATURE
| (a) | Costs and operating expenses |
The main operating costs and administrative expenses are detailed below:
| | | For the periods ended | | | For the year ended | |
| | | December 31, | | | December 31, | |
| | | 2017 | | 2016 | | 2015 | | | 2019 | | 2018 | | 2017 | |
| | | ThUS$ | | ThUS$ | | ThUS$ | | | ThUS$ | | ThUS$ | | ThUS$ | |
| | | | | | | | | | | | | | | |
| Aircraft fuel | | | 2,318,816 | | | | 2,056,643 | | | | 2,651,067 | | | | 2,929,008 | | | | 2,983,028 | | | | 2,318,816 | |
| Other rentals and landing fees | | | 1,172,129 | | | | 1,077,407 | | | | 1,109,826 | | |
| Aircraft rentals | | | 579,551 | | | | 568,979 | | | | 525,134 | | |
| Other rentals and landing fees (*) | | | | 1,275,859 | | | | 1,206,881 | | | | 1,233,640 | |
| Aircraft maintenance | | | 430,825 | | | | 366,153 | | | | 437,235 | | | | 444,611 | | | | 366,627 | | | | 422,943 | |
| Comissions | | | 252,474 | | | | 269,296 | | | | 302,774 | | |
| Comisions | | | | 221,884 | | | | 222,506 | | | | 252,474 | |
| Passenger services | | | 288,662 | | | | 286,621 | | | | 295,439 | | | | 261,330 | | | | 280,279 | | | | 288,662 | |
| Other operating expenses | | | 1,381,546 | | | | 1,424,595 | | | | 1,293,320 | | | | 1,291,895 | | | | 1,229,311 | | | | 1,374,368 | |
| Total | | | 6,424,003 | | | | 6,049,694 | | | | 6,614,795 | | | | 6,424,587 | | | | 6,288,632 | | | | 5,890,903 | |
(*) Lease expenses are included within this amount (See Note 2.21)
| | | For the period ended | |
| | | December 31, | |
| | | 2019 | | | 2018 | | | 2017 | |
| | | ThUS$ | | | ThUS$ | | | ThUS$ | |
| | | | | | Restated | | | Restated | |
| | | | | | | | | | |
| Payments for leases of low-value assets | | | 31,982 | | | | 27,929 | | | | 35,240 | |
| Total | | | 31,982 | | | | 27,929 | | | | 35,240 | |
| (b) | Depreciation and amortization |
Depreciation and amortization are detailed below:
| | | For the period ended | | | For the year ended | |
| | | December 31, | | | December 31, | |
| | | 2017 | | 2016 | | 2015 | | | 2019 | | 2018 | | 2017 | |
| | | ThUS$ | | ThUS$ | | ThUS$ | | | ThUS$ | | ThUS$ | | ThUS$ | |
| | | | | | | | | | | | | | | |
| Depreciation (*) | | | 943,215 | | | | 910,071 | | | | 897,670 | | | | 1,389,465 | | | | 1,307,032 | | | | 1,318,725 | |
| Amortization | | | 58,410 | | | | 50,257 | | | | 36,736 | | | | 80,511 | | | | 65,596 | | | | 58,410 | |
| Total | | | 1,001,625 | | | | 960,328 | | | | 934,406 | | | | 1,469,976 | | | | 1,372,628 | | | | 1,377,135 | |
(*) IncludeIncluded within this amount is the depreciation of Property, plantthe Properties, plants and equipment (See Note 17 (a)) and the maintenance cost of the aircraft held under operating leases.recognized as assets by right of use. The amount of maintenance cost amount included withinin the depreciation line item atfor the period ended December 31, 20172019 is ThUS$ 359,940445,680 and ThUS$ 345,651366,393 for the same period of 2016.2018.
The costs for personnel expenses are disclosed in Note 23 liability for employee benefits.
The detail of financial costs is as follows:
| | | For the period ended | | | For the year ended | |
| | | December 31, | | | December 31, | |
| | | 2017 | | 2016 | | 2015 | | | 2019 | | 2018 | | 2017 | |
| | | ThUS$ | | ThUS$ | | ThUS$ | | | ThUS$ | | ThUS$ | | ThUS$ | |
| | | | | | | | | | | | | | | |
| Bank loan interest | | | 347,551 | | | | 352,405 | | | | 331,511 | | | | 325,650 | | | | 283,786 | | | | 347,551 | |
| Financial leases | | | 37,522 | | | | 32,573 | | | | 42,855 | | | | 61,980 | | | | 62,202 | | | | 37,522 | |
| Lease liabilities | | | | 181,814 | | | | 182,868 | | | | 185,947 | |
| Other financial instruments | | | 8,213 | | | | 31,358 | | | | 38,991 | | | | 20,490 | | | | 10,281 | | | | 8,213 | |
| Total | | | 393,286 | | | | 416,336 | | | | 413,357 | | | | 589,934 | | | | 539,137 | | | | 579,233 | |
Costs and expenses by nature presented in this noteNote plus the Employee expenses disclosed in Note 23, are equivalent to the sum of cost of sales, distribution costs, administrative expenses, other expenses and financing costs presented in the consolidated statement of income by function.
NOTE 28 - OTHER INCOME, BY FUNCTION
Other income by function is as follows:
| | | For the period ended | | | For the year ended | |
| | | December 31, | | | December 31, | |
| | | 2017 | | 2016 | | 2015 | | | 2019 | | 2018 | | 2017 | |
| | | ThUS$ | | ThUS$ | | ThUS$ | | | ThUS$ | | ThUS$ | | ThUS$ | |
| | | | | | | | | | | | | | | |
| Coalition and loyalty program Multiplus | | | 240,952 | | | | 174,197 | | | | 154,958 | | |
| Coalition and loyalty program Multiplus (*) | | | | 36,172 | | | | 126,443 | | | | 240,952 | |
| Tours | | | 109,463 | | | | 133,575 | | | | 113,225 | | | | 96,997 | | | | 108,448 | | | | 109,463 | |
| Aircraft leasing | | | 103,741 | | | | 65,011 | | | | 46,547 | | | | 102,704 | | | | 78,056 | | | | 103,741 | |
| Customs and warehousing | | | 26,793 | | | | 24,548 | | | | 25,457 | | | | 29,353 | | | | 26,667 | | | | 26,793 | |
| Duty free | | | | 543 | | | | 3,555 | | | | 6,585 | |
| Maintenance | | | 6,585 | | | | 17,090 | | | | 11,669 | | | | 10,471 | | | | 16,569 | | | | 8,038 | |
| Duty free | | | 8,038 | | | | 11,141 | | | | 16,408 | | |
| Other miscellaneous income | | | 54,317 | | | | 113,186 | | | | 17,517 | | | | 84,624 | | | | 113,020 | | | | 54,317 | |
| Total | | | 549,889 | | | | 538,748 | | | | 385,781 | | | | 360,864 | | | | 472,758 | | | | 549,889 | |
NOTE 29 - FOREIGN CURRENCY AND EXCHANGE RATE DIFFERENCES
The functional currency of LATAM Airlines Group S.A. is the US dollar, also it has subsidiaries whose functional currency is different to the US dollar, such as the chilean peso, argentine peso, colombian peso, brazilian real and guaraní.
The functional currency is defined as the currency of the primary economic environment in which an entity operates and in each entity and all other currencies are defined as foreign currency.
Considering the above, the balances by currency mentioned in this noteNote correspond to the sum of foreign currency of each of the entities that make LATAM Airlines Group S.A. and Subsidiaries.
The foreign currency detail of balances of monetary items in current and non-current assets is as follows:
| | | As of | | As of | | | As of | | As of | |
| | December 31, | | December 31, | | | December 31, | | December 31, | |
| Current assets | | 2017 | | 2016 | | | 2019 | | 2018 | |
| | | ThUS$ | | ThUS$ | | | ThUS$ | | ThUS$ | |
| | | | | | | | | | | |
| Cash and cash equivalents | | | 260,092 | | | | 201,416 | | | | 242,624 | | | | 606,673 | |
| Argentine peso | | | 7,309 | | | | 4,438 | | | | 10,974 | | | | 4,236 | |
| Brazilian real | | | 14,242 | | | | 9,705 | | | | 9,407 | | | | 34,360 | |
| Chilean peso | | | 81,693 | | | | 30,221 | | | | 50,421 | | | | 415,399 | |
| Colombian peso | | | 1,105 | | | | 1,137 | | | | 5,971 | | | | 2,732 | |
| Euro | | | 11,746 | | | | 1,695 | | | | 21,927 | | | | 20,339 | |
| U.S. dollar | | | 108,327 | | | | 128,694 | | | | 77,933 | | | | 51,382 | |
| Other currency | | | 35,670 | | | | 25,526 | | | | 65,991 | | | | 78,225 | |
| | | | | | | | | | | | | | | | | |
| Other financial assets, current | | | 36,484 | | | | 14,573 | | | | 47,328 | | | | 57,132 | |
| Argentine peso | | | 21 | | | | 12 | | | | 7 | | | | 11 | |
| Brazilian real | | | 17 | | | | 734 | | | | 17,395 | | | | 25,829 | |
| Chilean peso | | | 26,605 | | | | 585 | | | | 26,008 | | | | 25,904 | |
| Colombian peso | | | 150 | | | | - | | | | 138 | | | | 139 | |
| U.S. dollar | | | 9,343 | | | | 12,879 | | | | 2,795 | | | | 4,923 | |
| Other currency | | | 348 | | | | 363 | | | | 985 | | | | 326 | |
| | | As of | | As of | | | As of | | As of | |
| | December 31, | | December 31, | | | December 31, | | December 31, | |
| Current assets | | 2017 | | 2016 | | | 2019 | | 2018 | |
| | | ThUS$ | | ThUS$ | | | ThUS$ | | ThUS$ | |
| | | | | | | | | | | |
| Other non - financial assets, current | | | 107,170 | | | | 107,789 | | | | 81,521 | | | | 106,952 | |
| Argentine peso | | | 16,507 | | | | 16,086 | | | | 11,263 | | | | 13,077 | |
| Brazilian real | | | 19,686 | | | | 20,158 | | | | 20,553 | | | | 37,794 | |
| Chilean peso | | | 34,258 | | | | 1,619 | | | | 24,451 | | | | 30,916 | |
| Colombian peso | | | 340 | | | | 713 | | | | 61 | | | | 434 | |
| Euro | | | 2,722 | | | | 1,563 | | | | 2,878 | | | | 3,935 | |
| U.S. dollar | | | 21,907 | | | | 50,157 | | | | 5,140 | | | | 8,949 | |
| Other currency | | | 11,750 | | | | 17,493 | | | | 17,175 | | | | 11,847 | |
| | | | | | | | | | | | | | | | | |
| Trade and other accounts receivable, current | | | 373,447 | | | | 251,204 | | | | 501,006 | | | | 518,006 | |
| Argentine peso | | | 49,680 | | | | 54,356 | | | | 22,809 | | | | 54,053 | |
| Brazilian real | | | 22,006 | | | | 30,675 | | | | 1,457 | | | | 6,037 | |
| Chilean peso | | | 82,369 | | | | 90,482 | | | | 125,342 | | | | 112,133 | |
| Colombian peso | | | 1,169 | | | | 9,720 | | | | 545 | | | | 5,065 | |
| Euro | | | 48,286 | | | | 21,923 | | | | 32,711 | | | | 49,044 | |
| U.S. dollar | | | 34,268 | | | | 14,086 | | | | 257,421 | | | | 2,938 | |
| Other currency | | | 135,669 | | | | 29,962 | | | | 60,721 | | | | 288,736 | |
| | | | | | | | | | | | | | | | | |
| Accounts receivable from related entities, current | | | 958 | | | | 554 | | | | 537 | | | | 593 | |
| Chilean peso | | | 735 | | | | 554 | | | | 42 | | | | 200 | |
| U.S. dollar | | | 223 | | | | - | | | | 495 | | | | 393 | |
| | | | | | | | | | | | | | | | | |
| Tax current assets | | | 33,575 | | | | 28,198 | | | | 19,506 | | | | 20,774 | |
| Argentine peso | | | 1,679 | | | | 1,798 | | | | 1,560 | | | | 812 | |
| Brazilian real | | | 3,934 | | | | 2,462 | | | | 1,006 | | | | 1,106 | |
| Chilean peso | | | 3,317 | | | | 6,333 | | | | 1,111 | | | | 4,860 | |
| Colombian peso | | | 660 | | | | 1,418 | | | | 54 | | | | 5 | |
| Euro | | | 179 | | | | 273 | | | | 264 | | | | - | |
| U.S. dollar | | | 327 | | | | 177 | | | | - | | | | 429 | |
| Peruvian sol | | | 21,948 | | | | 14,387 | | |
| Peruvian sun | | | | 13,707 | | | | 13,306 | |
| Other currency | | | 1,531 | | | | 1,350 | | | | 1,804 | | | | 256 | |
| | | | | | | | | | | | | | | | | |
| Total current assets | | | 811,726 | | | | 603,734 | | | | 892,522 | | | | 1,310,130 | |
| Argentine peso | | | 75,196 | | | | 76,690 | | | | 46,613 | | | | 72,189 | |
| Brazilian real | | | 59,885 | | | | 63,734 | | | | 49,818 | | | | 105,126 | |
| Chilean peso | | | 228,977 | | | | 129,794 | | | | 227,375 | | | | 589,412 | |
| Colombian peso | | | 3,424 | | | | 12,988 | | | | 6,769 | | | | 8,375 | |
| Euro | | | 62,933 | | | | 25,454 | | | | 57,780 | | | | 73,318 | |
| U.S. Dollar | | | 174,395 | | | | 205,993 | | | | 343,784 | | | | 69,014 | |
| Other currency | | | 206,916 | | | | 89,081 | | | | 160,383 | | | | 392,696 | |
| | | As of | | As of | | | As of | | As of | |
| | December 31, | | December 31, | | | December 31, | | December 31, | |
| Non-current assets | | 2017 | | 2016 | | | 2019 | | 2018 | |
| | | ThUS$ | | ThUS$ | | | ThUS$ | | ThUS$ | |
| | | | | | | | | | | |
| Other financial assets, non-current | | | 20,975 | | | | 26,772 | | | | 10,243 | | | | 21,850 | |
| Brazilian real | | | 3,831 | | | | 2,769 | | | | 4,441 | | | | 4,941 | |
| Chilean peso | | | 74 | | | | 83 | | | | 65 | | | | 68 | |
| Colombian peso | | | 281 | | | | 285 | | | | 296 | | | | 145 | |
| Euro | | | 7,853 | | | | 6,966 | | | | 1,525 | | | | 7,438 | |
| U.S. dollar | | | 7,273 | | | | 14,920 | | | | 2,169 | | | | 7,441 | |
| Other currency | | | 1,663 | | | | 1,749 | | | | 1,747 | | | | 1,817 | |
| | | | | | | | | | | | | | | | | |
| Other non - financial assets, non-current | | | 9,108 | | | | 19,069 | | | | 29,166 | | | | 31,126 | |
| Argentine peso | | | 172 | | | | 142 | | | | 54 | | | | 86 | |
| Brazilian real | | | 6,368 | | | | 6,029 | | | | 7,891 | | | | 7,465 | |
| U.S. dollar | | | 38 | | | | 8,309 | | | | 3 | | | | 3 | |
| Other currency | | | 2,530 | | | | 4,589 | | | | 21,218 | | | | 23,572 | |
| | | | | | | | | | | | | | | | | |
| Accounts receivable, non-current | | | 6,887 | | | | 7,356 | | | | 4,722 | | | | 5,378 | |
| Chilean peso | | | 6,887 | | | | 7,356 | | | | 4,722 | | | | 5,378 | |
| | | | | | | | | | | | | | | | | |
| Deferred tax assets | | | 2,081 | | | | 2,110 | | | | 3,339 | | | | 2,102 | |
| Colombian peso | | | 86 | | | | 117 | | | | 487 | | | | 78 | |
| U.S. dollar | | | | 856 | | | | 29 | |
| Other currency | | | 1,995 | | | | 1,993 | | | | 1,996 | | | | 1,995 | |
| | | | | | | | | | | | | | | | | |
| Total non-current assets | | | 39,051 | | | | 55,307 | | | | 47,470 | | | | 60,456 | |
| Argentine peso | | | 172 | | | | 142 | | | | 54 | | | | 86 | |
| Brazilian real | | | 10,199 | | | | 8,798 | | | | 12,332 | | | | 12,406 | |
| Chilean peso | | | 6,961 | | | | 7,439 | | | | 4,787 | | | | 5,446 | |
| Colombian peso | | | 367 | | | | 402 | | | | 783 | | | | 223 | |
| Euro | | | 7,853 | | | | 6,966 | | | | 1,525 | | | | 7,438 | |
| U.S. dollar | | | 7,311 | | | | 23,229 | | | | 3,028 | | | | 7,473 | |
| Other currency | | | 6,188 | | | | 8,331 | | | | 24,961 | | | | 27,384 | |
The foreign currency detail of balances of monetary items in current liabilities and non-current is as follows:
| | | Up to 90 days | | 91 days to 1 year | | | Up to 90 days | | 91 days to 1 year | |
| | | As of | | As of | | As of | | As of | | | As of | | As of | | As of | | As of | |
| | December 31, | | December 31, | | December 31, | | December 31, | | | December 31, | | December 31, | | December 31, | | December 31, | |
| Current liabilities | | 2017 | | 2016 | | 2017 | | 2016 | | | 2019 | | 2018 | | 2019 | | 2018 | |
| | | ThUS$ | | ThUS$ | | ThUS$ | | ThUS$ | | | ThUS$ | | ThUS$ | | ThUS$ | | ThUS$ | |
| | | | | | | | | | | | | | | | | | | |
| Other financial liabilities, current | | | 36,000 | | | | 287,175 | | | | 115,182 | | | | 455,086 | | | | 69,623 | | | | 63,920 | | | | 210,627 | | | | 107,815 | |
| Argentine peso | | | | 1 | | | | 3 | | | | 2 | | | | - | |
| Brazilian real | | | | 128 | | | | 261 | | | | 118 | | | | - | |
| Chilean peso | | | 21,542 | | | | 55,962 | | | | 79,032 | | | | 108,010 | | | | 42,625 | | | | 41,694 | | | | 15,229 | | | | 68,901 | |
| Euro | | | | 145 | | | | 704 | | | | 339 | | | | - | |
| U.S. dollar | | | 14,458 | | | | 231,213 | | | | 36,150 | | | | 347,076 | | | | 26,676 | | | | 16,773 | | | | 194,896 | | | | 38,914 | |
| Other currency | | | | 48 | | | | 4,485 | | | | 43 | | | | - | |
| | | | | | | | | | | | | | | | | | | | | | | | | | | | | | | | | |
| Trade and other accounts payables, current | | | 919,373 | | | | 585,149 | | | | 33,707 | | | | 16,097 | | | | 1,338,123 | | | | 970,872 | | | | 10,091 | | | | 37,809 | |
| Argentine peso | | | 122,452 | | | | 20,838 | | | | 8,636 | | | | 907 | | | | 252,799 | | | | 229,907 | | | | 1,096 | | | | 6,142 | |
| Brazilian real | | | 28,810 | | | | 40,740 | | | | 669 | | | | 27 | | | | 59,837 | | | | 30,974 | | | | 320 | | | | 1,152 | |
| Chilean peso | | | 233,202 | | | | 60,701 | | | | 11,311 | | | | 12,255 | | | | 322,996 | | | | 198,766 | | | | 1,295 | | | | 26,113 | |
| Colombian peso | | | 2,964 | | | | 9,049 | | | | 855 | | | | 578 | | | | 2,558 | | | | 7,915 | | | | 868 | | | | 752 | |
| Euro | | | 58,081 | | | | 23,445 | | | | 9,165 | | | | 5 | | | | 113,733 | | | | 84,903 | | | | 484 | | | | 1,375 | |
| U.S. dollar | | | 409,380 | | | | 374,431 | | | | 1,154 | | | | 962 | | | | 480,129 | | | | 325,385 | | | | 4,263 | | | | 55 | |
| Peruvian sol | | | 39,064 | | | | 33,701 | | | | 825 | | | | 1,093 | | | | 24,197 | | | | 37,285 | | | | 1,447 | | | | 1,124 | |
| Mexican peso | | | 2,732 | | | | 1,535 | | | | 115 | | | | - | | | | 5,233 | | | | 5,975 | | | | 33 | | | | 167 | |
| Pound sterling | | | 5,839 | | | | 1,769 | | | | 199 | | | | 246 | | | | 20,289 | | | | 13,395 | | | | 119 | | | | 305 | |
| Uruguayan peso | | | 1,890 | | | | 6,899 | | | | - | | | | - | | | | 1,018 | | | | 847 | | | | 29 | | | | - | |
| Other currency | | | 14,959 | | | | 12,041 | | | | 778 | | | | 24 | | | | 55,334 | | | | 35,520 | | | | 137 | | | | 624 | |
| | | | | | | | | | | | | | | | | | | | | | | | | | | | | | | | | |
| Accounts payable to related entities, current | | | 760 | | | | 220 | | | | - | | | | - | | | | 53 | | | | 365 | | | | - | | | | - | |
| Chilean peso | | | 546 | | | | 23 | | | | - | | | | - | | | | 53 | | | | 253 | | | | - | | | | - | |
| U.S. dollar | | | 4 | | | | 8 | | | | - | | | | - | | | | - | | | | 112 | | | | - | | | | - | |
| Other currency | | | 210 | | | | 189 | | | | - | | | | - | | |
| | | | | | | | | | | | | | | | | | | | | | | | | | | | | | | | | |
| Other provisions, current | | | 959 | | | | 511 | | | | - | | | | - | | | | 2,079 | | | | 1,434 | | | | - | | | | - | |
| Chilean peso | | | 30 | | | | 28 | | | | - | | | | - | | | | 27 | | | | 28 | | | | - | | | | - | |
| Other currency | | | 929 | | | | 483 | | | | - | | | | - | | | | 2,052 | | | | 1,406 | | | | - | | | | - | |
| | | | | | | | | | | | | | | | | | | | | | | | | | | | | | | | | |
| Tax liabilities, current | | | - | | | | (204 | ) | | | 174 | | | | 2,501 | | | | - | | | | 13 | | | | - | | | | - | |
| Argentine peso | | | - | | | | - | | | | 174 | | | | 2,501 | | | | - | | | | 4 | | | | - | | | | - | |
| Brazilian real | | | - | | | | (3 | ) | | | - | | | | - | | | | - | | | | - | | | | - | | | | - | |
| Chilean peso | | | - | | | | (25 | ) | | | - | | | | - | | | | - | | | | 9 | | | | - | | | | - | |
| Other currency | | | - | | | | (176 | ) | | | - | | | | - | | |
| | | Up to 90 days | | 91 days to 1 year | | | Up to 90 days | | 91 days to 1 year | |
| | | As of | | As of | | As of | | As of | | | As of | | As of | | As of | | As of | |
| | December 31, | | December 31, | | December 31, | | December 31, | | | December 31, | | December 31, | | December 31, | | December 31, | |
| Current liabilities | | 2017 | | 2016 | | 2017 | | 2016 | | | 2019 | | 2018 | | 2019 | | 2018 | |
| | | ThUS$ | | ThUS$ | | ThUS$ | | ThUS$ | | | ThUS$ | | ThUS$ | | ThUS$ | | ThUS$ | |
| | | | | | | | | | | | | | | | | | | |
| Other non-financial liabilities, current | | | 25,190 | | | | 33,439 | | | | - | | | | - | | | | 19,335 | | | | 38,120 | | | | - | | | | - | |
| Argentine peso | | | 393 | | | | 13,463 | | | | - | | | | - | | | | 348 | | | | 1,089 | | | | - | | | | - | |
| Brazilian real | | | 542 | | | | 430 | | | | - | | | | - | | | | 1,537 | | | | 1,455 | | | | - | | | | - | |
| Chilean peso | | | 11,283 | | | | 14,999 | | | | - | | | | - | | | | 705 | | | | 14,130 | | | | - | | | | - | |
| Colombian peso | | | 837 | | | | 578 | | | | - | | | | - | | | | 3,059 | | | | 1,009 | | | | - | | | | - | |
| Euro | | | 5,954 | | | | 168 | | | | - | | | | - | | | | 3,133 | | | | 4,411 | | | | - | | | | - | |
| U.S. dollar | | | 3,160 | | | | 684 | | | | - | | | | - | | | | 4,531 | | | | 10,468 | | | | - | | | | - | |
| Other currency | | | 3,021 | | | | 3,117 | | | | - | | | | - | | | | 6,022 | | | | 5,558 | | | | - | | | | - | |
| | | | | | | | | | | | | | | | | | | | | | | | | | | | | | | | | |
| Total current liabilities | | | 982,282 | | | | 906,290 | | | | 149,063 | | | | 473,684 | | | | 1,429,213 | | | | 1,074,724 | | | | 220,718 | | | | 145,624 | |
| Argentine peso | | | 122,845 | | | | 34,301 | | | | 8,810 | | | | 3,408 | | | | 253,148 | | | | 231,003 | | | | 1,098 | | | | 6,142 | |
| Brazilian real | | | 29,352 | | | | 41,167 | | | | 669 | | | | 27 | | | | 61,502 | | | | 32,690 | | | | 438 | | | | 1,152 | |
| Chilean peso | | | 266,603 | | | | 131,688 | | | | 90,343 | | | | 120,265 | | | | 366,406 | | | | 254,880 | | | | 16,524 | | | | 95,014 | |
| Colombian peso | | | 3,801 | | | | 9,627 | | | | 855 | | | | 578 | | | | 5,617 | | | | 8,924 | | | | 868 | | | | 752 | |
| Euro | | | 64,035 | | | | 23,613 | | | | 9,165 | | | | 5 | | | | 117,011 | | | | 90,018 | | | | 823 | | | | 1,375 | |
| U.S. dollar | | | 427,002 | | | | 606,336 | | | | 37,304 | | | | 348,038 | | | | 511,336 | | | | 352,738 | | | | 199,159 | | | | 38,969 | |
| Other currency | | | 68,644 | | | | 59,558 | | | | 1,917 | | | | 1,363 | | | | 114,193 | | | | 104,471 | | | | 1,808 | | | | 2,220 | |
| | | More than 1 to 3 years | | More than 3 to 5 years | | More than 5 years | | | More than 1 to 3 years | | More than 3 to 5 years | | More than 5 years | |
| | | As of | | As of | | As of | | As of | | As of | | As of | | | As of | | As of | | As of | | As of | | As of | | As of | |
| | December 31, | | December 31, | | December 31, | | December 31, | | December 31, | | December 31, | | | December 31, | | December 31, | | December 31, | | December 31, | | December 31, | | December 31, | |
| Non-current liabilities | | 2017 | | 2016 | | 2017 | | 2016 | | 2017 | | 2016 | | | 2019 | | 2018 | | 2019 | | 2018 | | 2019 | | 2018 | |
| | | ThUS$ | | ThUS$ | | ThUS$ | | ThUS$ | | ThUS$ | | ThUS$ | | | ThUS$ | | ThUS$ | | ThUS$ | | ThUS$ | | ThUS$ | | ThUS$ | |
| | | | | | | | | | | | | | | | | | | | | | | | | | | |
| Other financial liabilities, non-current | | | 276,436 | | | | 178,793 | | | | 263,798 | | | | 747,218 | | | | 189,500 | | | | 41,785 | | | | 366,889 | | | | 299,735 | | | | 12,915 | | | | 281,785 | | | | 376,535 | | | | 179,406 | |
| Chilean peso | | | 41,548 | | | | 59,177 | | | | 189,500 | | | | 16,189 | | | | 189,500 | | | | - | | | | 236,346 | | | | 16,259 | | | | 2,291 | | | | 237,377 | | | | 369,525 | | | | 172,530 | |
| Brazillian real | | | | 700 | | | | 948 | | | | 40 | | | | - | | | | - | | | | - | |
| Euro | | | | 550 | | | | 296 | | | | 141 | | | | - | | | | - | | | | - | |
| U.S. dollar | | | 234,888 | | | | 119,616 | | | | 74,298 | | | | 731,029 | | | | - | | | | 41,785 | | | | 128,820 | | | | 280,197 | | | | 10,308 | | | | 44,408 | | | | 7,010 | | | | 6,876 | |
| Other currency | | | | 473 | | | | 2,035 | | | | 135 | | | | - | | | | - | | | | - | |
| | | | | | | | | | | | | | | | | | | | | | | | | | | | | | | | | | | | | | | | | | | | | | | | | |
| Accounts payable, non-current | | | 362,964 | | | | 195,629 | | | | - | | | | - | | | | - | | | | - | | | | 151,254 | | | | 294,704 | | | | - | | | | - | | | | - | | | | - | |
| Chilean peso | | | 13,251 | | | | 10,474 | | | | - | | | | - | | | | - | | | | - | | | | 14,367 | | | | 14,027 | | | | - | | | | - | | | | - | | | | - | |
| U.S. dollar | | | 348,329 | | | | 183,904 | | | | - | | | | - | | | | - | | | | - | | | | 135,541 | | | | 279,437 | | | | - | | | | - | | | | - | | | | - | |
| Other currency | | | 1,384 | | | | 1,251 | | | | - | | | | - | | | | - | | | | - | | | | 1,346 | | | | 1,240 | | | | - | | | | - | | | | - | | | | - | |
| | | | | | | | | | | | | | | | | | | | | | | | | | | | | | | | | | | | | | | | | | | | | | | | | |
| Other provisions, non-current | | | 41,514 | | | | 39,513 | | | | - | | | | - | | | | - | | | | - | | | | 36,615 | | | | 36,120 | | | | - | | | | - | | | | - | | | | - | |
| Argentine peso | | | 940 | | | | 635 | | | | - | | | | - | | | | - | | | | - | | | | 485 | | | | 542 | | | | - | | | | - | | | | - | | | | - | |
| Brazillian real | | | 24,074 | | | | 23,541 | | | | - | | | | - | | | | - | | | | - | | | | 20,538 | | | | 19,815 | | | | - | | | | - | | | | - | | | | - | |
| Chilean peso | | | - | | | | 38 | | | | - | | | | - | | | | - | | | | - | | |
| Colombian peso | | | 551 | | | | 569 | | | | - | | | | - | | | | - | | | | - | | | | 281 | | | | 295 | | | | - | | | | - | | | | - | | | | - | |
| Euro | | | 9,883 | | | | 8,664 | | | | - | | | | - | | | | - | | | | - | | | | 9,217 | | | | 9,403 | | | | - | | | | - | | | | - | | | | - | |
| U.S. dollar | | | 6,066 | | | | 6,066 | | | | - | | | | - | | | | - | | | | - | | | | 6,094 | | | | 6,065 | | | | - | | | | - | | | | - | | | | - | |
| | | | | | | | | | | | | | | | | | | | | | | | | | | | | | | | | | | | | | | | | | | | | | | | | |
| Provisions for employees benefits, non-current | | | 77,579 | | | | 68,774 | | | | - | | | | - | | | | - | | | | - | | | | 80,628 | | | | 72,674 | | | | - | | | | - | | | | - | | | | - | |
| Brazilian real | | | - | | | | 28 | | | | - | | | | - | | | | - | | | | - | | |
| Chilean peso | | | 73,399 | | | | 68,380 | | | | - | | | | - | | | | - | | | | - | | | | 80,628 | | | | 72,187 | | | | - | | | | - | | | | - | | | | - | |
| U.S. dollar | | | 4,180 | | | | 366 | | | | - | | | | - | | | | - | | | | - | | | | - | | | | 487 | | | | - | | | | - | | | | - | | | | - | |
| | | | | | | | | | | | | | | | | | | | | | | | | | |
| Other non-financial liabilities, non-current | | | - | | | | 3 | | | | - | | | | - | | | | - | | | | - | | |
| Colombian peso | | | - | | | | 3 | | | | - | | | | - | | | | - | | | | - | | |
| | | | | | | | | | | | | | | | | | | | | | | | | | | | | | | | | | | | | | | | | | | | | | | | | |
| Total non-current liabilities | | | 758,493 | | | | 482,712 | | | | 263,798 | | | | 747,218 | | | | 189,500 | | | | 41,785 | | | | 635,386 | | | | 703,233 | | | | 12,915 | | | | 281,785 | | | | 376,535 | | | | 179,406 | |
| Argentine peso | | | 940 | | | | 635 | | | | - | | | | - | | | | - | | | | - | | | | 485 | | | | 542 | | | | - | | | | - | | | | - | | | | - | |
| Brazilian real | | | 24,074 | | | | 23,569 | | | | - | | | | - | | | | - | | | | - | | | | 21,238 | | | | 20,763 | | | | 40 | | | | - | | | | - | | | | - | |
| Chilean peso | | | 128,198 | | | | 138,069 | | | | 189,500 | | | | 16,189 | | | | 189,500 | | | | - | | | | 331,341 | | | | 102,473 | | | | 2,291 | | | | 237,377 | | | | 369,525 | | | | 172,530 | |
| Colombian peso | | | 551 | | | | 572 | | | | - | | | | - | | | | - | | | | - | | | | 281 | | | | 295 | | | | - | | | | - | | | | - | | | | - | |
| Euro | | | 9,883 | | | | 8,664 | | | | - | | | | - | | | | - | | | | - | | | | 9,767 | | | | 9,699 | | | | 141 | | | | - | | | | - | | | | - | |
| U.S. dollar | | | 593,463 | | | | 309,952 | | | | 74,298 | | | | 731,029 | | | | - | | | | 41,785 | | | | 270,455 | | | | 566,186 | | | | 10,308 | | | | 44,408 | | | | 7,010 | | | | 6,876 | |
| Other currency | | | 1,384 | | | | 1,251 | | | | - | | | | - | | | | - | | | | - | | | | 1,819 | | | | 3,275 | | | | 135 | | | | - | | | | - | | | | - | |
| | | As of | | As of | | | As of | | As of | |
| | December 31, | | December 31, | | | December 31, | | December 31, | |
| General summary of foreign currency: | | 2017 | | 2016 | | | 2019 | | 2018 | |
| | | ThUS$ | | ThUS$ | | | ThUS$ | | ThUS$ | |
| | | | | | | | | | | |
| Total assets | | | 850,777 | | | | 659,041 | | | | 939,992 | | | | 1,370,586 | |
| Argentine peso | | | 75,368 | | | | 76,832 | | | | 46,667 | | | | 72,275 | |
| Brazilian real | | | 70,084 | | | | 72,532 | | | | 62,150 | | | | 117,532 | |
| Chilean peso | | | 235,938 | | | | 137,233 | | | | 232,162 | | | | 594,858 | |
| Colombian peso | | | 3,791 | | | | 13,390 | | | | 7,552 | | | | 8,598 | |
| Euro | | | 70,786 | | | | 32,420 | | | | 59,305 | | | | 80,756 | |
| U.S. dollar | | | 181,706 | | | | 229,222 | | | | 346,812 | | | | 76,487 | |
| Other currency | | | 213,104 | | | | 97,412 | | | | 185,344 | | | | 420,080 | |
| | | | | | | | | | | | | | | | | |
| Total liabilities | | | 2,343,136 | | | | 2,651,689 | | | | 2,674,767 | | | | 2,446,785 | |
| Argentine peso | | | 132,595 | | | | 38,344 | | | | 254,731 | | | | 237,687 | |
| Brazilian real | | | 54,095 | | | | 64,763 | | | | 83,218 | | | | 54,605 | |
| Chilean peso | | | 864,144 | | | | 406,211 | | | | 1,086,087 | | | | 862,274 | |
| Colombian peso | | | 5,207 | | | | 10,777 | | | | 6,766 | | | | 9,971 | |
| Euro | | | 83,083 | | | | 32,282 | | | | 127,742 | | | | 101,092 | |
| U.S. dollar | | | 1,132,067 | | | | 2,037,140 | | | | 998,268 | | | | 1,071,190 | |
| Other currency | | | 71,945 | | | | 62,172 | | | | 117,955 | | | | 109,966 | |
| | | | | | | | | | | | | | | | | |
| Net position | | | | | | | | | | | | | | | | |
| Argentine peso | | | (57,227 | ) | | | 38,488 | | | | (208,064 | ) | | | (165,412 | ) |
| Brazilian real | | | 15,989 | | | | 7,769 | | | | (21,068 | ) | | | 62,927 | |
| Chilean peso | | | (628,206 | ) | | | (268,978 | ) | | | (853,925 | ) | | | (267,416 | ) |
| Colombian peso | | | (1,416 | ) | | | 2,613 | | | | 786 | | | | (1,373 | ) |
| Euro | | | (12,297 | ) | | | 138 | | | | (68,437 | ) | | | (20,336 | ) |
| U.S. dollar | | | (950,361 | ) | | | (1,807,918 | ) | | | (651,456 | ) | | | (994,703 | ) |
| Other currency | | | 141,159 | | | | 35,240 | | | | 67,389 | | | | 310,114 | |
ExchangeThe exchange differences recognized in income,profit or loss, except for financial instruments measured at fair value through profit or loss, for the period ended December 31, 2017, 20162019 and 2015, generated2018, meant a charge of ThUS $ 18,718, a credit of ThUS $ 121,651ThUS$ 32,571 and a charge of ThUS $ 467,896,ThUS$ 38,070, respectively.
ExchangeThe exchange differences recognized in equitythe statement of comprehensive income as reserves for exchange differences for conversion, for the period ended December 31, 2017, 20162019 and 2015, generated2018, meant a charge of ThUS $ 47,495, a credit of ThUS $ 494,362ThUS$ 243,271 and a charge of ThUS $1, 409,439,ThUS$ 743,516, respectively.
The following shows the current exchange rates for the U.S. dollar, on the dates indicated:
| | | As of December 31, | | | As of
December 31, | | As of December 31, | |
| | | 2017 | | 2016 | | 2015 | | 2014 | | | 2019 | | 2018 | | 2017 | | 2016 | |
| | | | | | | | | | | | | | | | | | | |
| Argentine peso | | | 18.57 | | | | 15.84 | | | | 12.97 | | | | 8.55 | | | | 59.83 | | | | 37.74 | | | | 18.57 | | | | 15.84 | |
| Brazilian real | | | 3.31 | | | | 3.25 | | | | 3.98 | | | | 2.66 | | | | 4.01 | | | | 3.87 | | | | 3.31 | | | | 3.25 | |
| Chilean peso | | | 614.75 | | | | 669.47 | | | | 710.16 | | | | 606.75 | | | | 748.74 | | | | 694.77 | | | | 614.75 | | | | 669.47 | |
| Colombian peso | | | 2,984.77 | | | | 3,000.25 | | | | 3,183.00 | | | | 2,389.50 | | | | 3,271.55 | | | | 3,239.45 | | | | 2,984.77 | | | | 3,000.25 | |
| Euro | | | 0.83 | | | | 0.95 | | | | 0.92 | | | | 0.82 | | | | 0.89 | | | | 0.87 | | | | 0.83 | | | | 0.95 | |
| Strong bolivar | | | 3,345.00 | | | | 673.76 | | | | 198.70 | | | | 12.00 | | |
| Australian dollar | | | 1.28 | | | | 1.38 | | | | 1.37 | | | | 1.22 | | | | 1.43 | | | | 1.42 | | | | 1.28 | | | | 1.38 | |
| Boliviano | | | 6.86 | | | | 6.86 | | | | 6.85 | | | | 6.86 | | | | 6.86 | | | | 6.86 | | | | 6.86 | | | | 6.86 | |
| Mexican peso | | | 19.66 | | | | 20.63 | | | | 17.34 | | | | 14.74 | | | | 18.89 | | | | 19.68 | | | | 19.66 | | | | 20.63 | |
| New Zealand dollar | | | 1.41 | | | | 1.44 | | | | 1.46 | | | | 1.28 | | | | 1.49 | | | | 1.49 | | | | 1.41 | | | | 1.44 | |
| Peruvian Sol | | | 3.24 | | | | 3.35 | | | | 3.41 | | | | 2.99 | | | | 3.31 | | | | 3.37 | | | | 3.24 | | | | 3.35 | |
| Uruguayan peso | | | 28.74 | | | | 29.28 | | | | 29.88 | | | | 24.25 | | | | 37.24 | | | | 32.38 | | | | 28.74 | | | | 29.28 | |
NOTE 30 - EARNINGS / (LOSS) PER SHARE
| | | For the period ended | |
| | | December 31, | |
| Basic earnings / (loss) per share | | 2017 | | | 2016 | | | 2015 | |
| | | | | | | | | | |
| Earnings / (loss) attributable to owners of the parent (ThUS$) | | | 155,304 | | | | 69,220 | | | | (219,274 | ) |
| | | | | | | | | | | | | |
| Weighted average number of shares, basic | | | 606,407,693 | | | | 546,559,599 | | | | 545,547,819 | |
| | | | | | | | | | | | | |
| Basic earnings / (loss) per share (US$) | | | 0.25610 | | | | 0.12665 | | | | (0.40193 | ) |
| | | | | | | | | | | | | |
| | | For the period ended | |
| | | December 31, | |
| Diluted earnings / (loss) per share | | 2017 | | | 2016 | | | 2015 | |
| | | | | | | | | | |
| Earnings / (loss) attributable to owners of the parent (ThUS$) | | | 155,304 | | | | 69,220 | | | | (219,274 | ) |
| | | | | | | | | | | | | |
| Weighted average number of shares, basic | | | 606,407,693 | | | | 546,559,599 | (*) | | | 545,547,819 | |
| | | | | | | | | | | | | |
| Weighted average number of shares, diluted | | | 606,407,693 | | | | 546,559,599 | | | | 545,547,819 | |
| | | | | | | | | | | | | |
| Diluted earnings / (loss) per share (US$) | | | 0.25610 | | | | 0.12665 | | | | (0.40193 | ) |
| | | For the year ended | |
| | | December 31, | |
| Basic earnings / (loss) per share | | 2019 | | | 2018 | | | 2017 | |
| | | | | | Restated | | | Restated | |
| | | | | | | | | |
| Earnings / (loss) attributable to owners of the parent (ThUS$) | | | 190,430 | | | | 309,811 | | | | 108,896 | |
| | | | | | | | | | | | |
| Weighted average number of shares, basic | | | 606,407,693 | | | | 606,407,693 | | | | 606,407,693 | |
| | | | | | | | | | | | | |
| Basic earnings / (loss) per share (US$) | | | 0.31403 | | | | 0.51090 | | | | 0.17958 | |
(*) In the calculation of diluted earnings per share have not been considered the compensation plan disclosed in Note 34 (a.1), because the average market price is lower than the price of options.
| | | For the year ended | |
| | | December 31, | |
| Diluted earnings / (loss) per share | | 2019 | | | 2018 | | | 2017 | |
| | | | | | Restated | | | Restated | |
| | | | | | | | | |
| Earnings / (loss) attributable to owners of the parent (ThUS$) | | | 190,430 | | | | 309,811 | | | | 108,896 | |
| | | | | | | | | | | | |
| Weighted average number of shares, basic | | | 606,407,693 | | | | 606,407,693 | | | | 606,407,693 | |
| | | | | | | | | | | | |
| Weighted average number of shares, diluted | | | 606,407,693 | | | | 606,407,693 | | | | 606,407,693 | |
| | | | | | | | | | | | | |
| Diluted earnings / (loss) per share (US$) | | | 0.31403 | | | | 0.51090 | | | | 0.17958 | |
NOTE 31 – CONTINGENCIES
| 1) | Lawsuits filed by LATAM Airlines Group S.A. and Subsidiaries |
| Company | | Court | | Case Number | | Origin | | Stage of trial | | Amounts Committed (*) |
| | | | | | | | | | | ThUS$ |
| | | | | | | | | | | |
Atlantic Aviation Investments
LLC (AAI).
Tam Viagens S.A. | | Supreme Court of the State of New York County of New York.Fazenda Pública do Município de São Paulo. | | 07-60229201004194-37.2018.8.26.0053 | | Atlantic Aviation Investments LLC. ("AAI"),This is a voidance action appealing the charges for violations and fines (67.168.795 / 67.168.833 / 67.168.884 / 67.168.906 / 67.168.914 / 67.168.965). We are arguing that numbers are missing from the ISS calculation base since the company supposedly made improper deductions. | | The lawsuit was assigned on January 31, 2018. That same day, a decision was rendered suspending the charges without any bond. The municipality filed an indirect subsidiary LATAM Airlines Groupappeal against this decision on April 30, 2018. A decision was rendered on November 11, 2019 fully in favor of Tam Viagens S.A., incorporated under We are waiting to see if the laws of the State of Delaware, sued in August 29th , 2007 Varig Logistics S.A. ("Variglog") for non-payment of four documented loans in credit agreements governed by New York law. These contracts establish the acceleration of the loans in the event of sale of the original debtor, VRG Linhas Aéreas S.A.Municipality files an appeal. | | The decision ordering Variglog to pay principal, interest and costs to AAI is in the enforcement stage in Switzerland. A settlement for CHF 24,541,781.45 was reached in Brazil for the Swiss funds, and it was agreed that it would be divided as follows: (i) 54.6% of Variglog’s assets for the Swiss funds; and (ii) 45.4% to AAI, subject to approval of the Brazilian Bankruptcy Commission. Variglog also filed a petition in Switzerland for recognition of the decision declaring its condition of being in judicial recovery, and subsequently, of being declared in bankruptcy. The Brazilian courts approved the AAI settlement and Variglog’s bankruptcy on April 11, 2016, which were confirmed by those courts on September 21, 2016. The final decision approving the agreement was certified September 23, 2016. US$8.9 million have been recovered thus far to date, leaving a balance of US$2.08 million pending. Variglog funds remain under embargo by AAII in Switzerland.
| | 10,97695,216
Plus interests
and costs
|
| 2) | Lawsuits received by LATAM Airlines Group S.A. and Subsidiaries |
| Company | | Court | | Case Number | | Origin | | Stage of trial | | Amounts Committed (*) |
| | | | | | | | | | | ThUS$ |
| | | | | | | | | | | |
| LATAM Airlines Group S.A. y Lan Cargo S.A. | | European Commission. | | - | | Investigation of alleged infringements to free competition of cargo airlines, especially fuel surcharge. On December 26,th , 2007, the General Directorate for Competition of the European Commission notified Lan Cargo S.A. and LATAM Airlines Group S.A. the instruction process against twenty five cargo airlines, including Lan Cargo S.A., for alleged breaches of competition in the air cargo market in Europe, especially the alleged fixed fuel surcharge and freight. | | On April 14,th, 2008, the notification of the European Commission was replied. The appeal was filed on January 24, 2011. On May 11, 2015, we attended a hearing at which we petitioned for the vacation of the Decision based on discrepancies in the Decision between the operating section, which mentions four infringements (depending on the routes involved) but refers to Lan in only one of those four routes; and the ruling section (which mentions one single conjoint infraction). On November 9,th, 2010, the General Directorate for Competition of the European Commission notified Lan Cargo S.A. and LATAM Airlines Group S.A. the imposition of a fine in the amount of THUS$ 9,823.135 (8.220.0009,217 (8,220,000 Euros) This fine is being appealed by Lan Cargo S.A. and LATAM Airlines Group S.A. On December 16, 2015, the European Court of Justice revoked the Commission’s decision because of discrepancies. The European Commission did not appeal the decision, but presented a new one on March 17, 2017 reiterating the imposition of the same fine on the eleven original airlines. The fine totals 776,465,000 Euros. It imposed the same fine as before on Lan Cargo and its parent, LATAM Airlines Group S.A., totaling 8.2 million Euros. On May 31, 2017 Lan Cargo S.A. and LATAM Airlines Group S.A. filed a petition with the General Court of the European Union seeking vacation of this decision. We presented our defense in December 2017. On July 12, 2019, we attended a hearing before the European Court of Justice to confirm our petition for vacation of judgment or otherwise, a reduction in the amount of the fine. LATAM AIRLINES GROUP, S.A. expects that the ruling by the General Court of the European Union may reduce the amount of this fine. | | 9,8239,217 |
| Company | | Court | | Case Number | | Origin | | Stage of trial | | Amounts Committed (*) |
| | | | | | | | | | | ThUS$ |
| | | | | | | | | | | |
| Lan Cargo S.A. y LATAM Airlines Group S.A. | | In the High Court of Justice Chancery División (England) Ovre Romerike District Court (Norway) y Directie Juridische Zaken Afdeling Ceveil Recht (Netherlands) , Cologne Regional Court (Landgerich Köln Germany). | | - | | Lawsuits filed against European airlines by users of freight services in private lawsuits as a result of the investigation into alleged breaches of competition of cargo airlines, especially fuel surcharge. Lan Cargo S.A. and LATAM Airlines Group S.A., have been sued in court proceedings directly and/or in third party, based in England, Norway, the Netherlands and Germany. | | Cases are in the uncovering evidence stage. In the case in England, mediation was held with nearly all the airlines involved in the aim of attempting to reach an agreement. It began in September, and LATAM Airlines Group S.A. reached an agreement for approximately GBP 636,000. A settlement was signed in December 2018 and payment was made in January 2019. This lawsuit ended for all plaintiffs in the class action, except for one who signed a settlement for approximately GBP 222,469.63 in December 2019. The payment will be made in January 2020, which will put an end to the entire lawsuit in England. The amount remains undetermined for the lawsuits in the remaining countries (Norway, the Netherlands and Germany). | | -0- |
| | | | | | | | | | | |
| Aerolinhas Brasileiras S.A. | | Federal Justice. | | 0008285-53.2015.403.6105 | | An action seeking to quash a decision and petioning for early protection in order to obgain a revocation of the penalty imposed by the Brazilian Competition Authority (CADE) in the investigation of cargo airlines alleged fair trade violations, in particular the fuel surcharge. | | This action was filed by presenting a guaranty – policy – in order to suspend the effects of the CADE’s decision regarding the payment of the following fines: (i) ABSA: ThUS$10,438; (ii) Norberto Jochmann: ThUS$201; (iii) Hernan Merino: ThUS$ 102; (iv) Felipe Meyer :ThUS$ 102. The action also deals with the affirmative obligation required by the CADE consisting of the duty to publish the condemnation in a widely circulating newspaper. This obligation had also been stayed by the court of federal justice in this process. Awaiting CADE’s statement. ABSA began a judicial review in search of an additional reduction in the fine amount. At this timeThe Judge’s decision was published on March 12, 2019, and we cannot predict the final amount of the fine as the judicial review by the Federal Court Judge is still pending. | | 11,828 |
Company | | Court | | Case Number | | Origin | | Stage of trialfiled an appeal against it on March 13, 2019 | | Amounts10,403
Committed (*)
|
| | | | | | | | | | ThUS$ |
| | | | | | | | | | | |
Aerolinhas Brasileiras S.A. | | Federal Justice. | | 0001872-58.2014.4.03.6105 | | An annulment action with a motion for preliminary injunction, was filed on 02/28/02/2014, in order to cancel tax debts of PIS, CONFINS, IPI and II, connected with the administrative process 10831.005704/2006.43. | | We have been waiting since August 21, 2015 for a statement by Serasa on TAM’s letter of indemnity and a statement by the Union. The statement was authenticated on January 29, 2016. A petition on evidence and replications were filed on June 20, 2016. A new insurance policy was submitted on March 3,30, 2016 with the change to the guarantee requested by PGFN. On 05/20/2016 the process was sent to PGFN, which was declaredmanifested on June 3, 06/03/2016. A decision is pending.pending | | 15,81114,061 |
| Company | | Court | | Case Number | | Origin | | Stage of trial | | Amounts Committed (*) |
| | | | | | | | | | | |
Tam Linhas Aéreas S.A.
| | Department of Federal Revenue of Brazil | | 19515.720476/2015-83
| | Alleged irregularities in the SAT payments for the periods 01/2011 to 12/2012 | | A judgment by CARF is pending since April 12, 2016.
| | 66,258ThUS$ |
| | | | | | | | | | | |
Tam Linhas Aéreas S.A | | Department of Federal Revenue of Brazil | | 19515.720476/2015-83 | | Alleged irregularities in the SAT payments for the periods 01/2011 to 12/2012 | | The lawsuit was converted into a measure in January 2018. A statement will be made after the prosecutor’s measure has concluded. The Brazilian Administrative Council of Tax Appeals (CARF) issued a decision in favor of the Company on September 22, 2018. We are currently expecting that the Ministry of Finance of Brazil will appeal. | | 59,481 |
| | | | | | | | | | |
| Tam Linhas Aéreas S.A. | | Court of the Second Region. | | 2001.51.01.012530-0 | | Ordinary judicial action brought for the purpose of declaring the nonexistence of legal relationship obligating the company to collect the Air Fund. | | Unfavorable court decision in first instance. Currently expecting the ruling on the appeal filed by the company. In order to suspend chargeability of Tax Credit a Guaranty Deposit to the Court was delivered for MUS$THUS$106. The court decision requesting that the Expert make all clarifications requested by the parties in a period of 30 days was published on March 29, 2016. The plaintiffs’ submitted a petition on June 21, 2016 requesting acceptance of the opinion of their consultant and an urgent ruling on the dispute. No amount additional to the deposit that has already been made is required if this case is lost. | | 100,24087,538 |
| | | | | | | | | | | |
Tam Linhas Aéreas S.A. | | Internal Revenue Service of Brazil. | | 10880.725950/2011-05 | | Compensation credits of the Social Integration Program (PIS) and Contribution for Social Security Financing (COFINS) Declared on DCOMPs. | | The objection (manifestaç(manifestação de inconformidade)inconformidade) filed by the company was rejected, which is why the voluntary appeal was filed. The case was assigned to the 1st Ordinary Group of Brazil’s Administrative Council of Tax Appeals (CARF) on June 8, 2015. TAM’s appeal was included in the CARF session held August 25, 2016. An agreement that converted the proceedings into a formal case was published on October 7, 2016. The amount has been reduced after some set-offs were approved by the Department of Federal Revenue of Brazil. | | 64,38326,293 |
| Company | | Court | | Case Number | | Origin | | Stage of trial | | Amounts Committed (*) |
| | | | | | | | | | | ThUS$ |
| | | | | | | | | | | |
| Aerovías de Integración Regional, AIRES S.A. | | United States Court of Appeals for the Eleventh Circuit, Florida, U.S.A. 45th Civil Court of the Bogota Circuit in Colombia. | | 2013-20319 CA 01 | | The July 30,th , 2012 Aerovías de Integración Recional, Aires S.A. ( LATAM(LATAM AIRLINES COLOMBIA) initiated a legal process in Colombia against Regional One INC and Volvo Aero Services LLC, to declare that these companies are civilly liable for moral and material damages caused to LATAM AIRLINES COLOMBIA arising from breach of contractual obligations of the aircraft HK-4107. The June 20,th , 2013 AIRES SA And / Or LATAM AIRLINES COLOMBIA was notified of the lawsuit filed in U.S. for Regional One INC and Dash 224 LLC for damages caused by the aircraft HK-4107 arguing failure of LATAM AIRLINES COLOMBIAGROUP S.A. customs duty to obtain import declaration when the aircraft in April 2010 entered Colombia for maintenance required by Regional One. | | Colombia. This case is being heard by the 45th Civil Court of the BogotáBogota Circuit in Colombia. Statements were taken from witnesses presented by REGIONAL ONE and VAS on October 31, 2018. The court received the expert opinions requested by REGIONAL ONE and VAS and given their petition, it asked the experts to expand upon their opinions. It also changed the experts requested by LATAM AIRLINES COLOMBIA. The case was brought before the Court on September 10, 2018 and these rulings are pending processing so that a new hearing can be scheduled. On October 31, 2018, the judge postponed the deadline for the parties to answer the objection because of a serious error brought to light by VAS regarding the translation submitted by the expert. The process has been in the judge’s chambers since March 11, 2019 to decide on replacing the damage estimation expert as requested by LATAM AIRLINES COLOMBIA. The one previously appointed did not take office. A petition has also been made by VAS objecting to the translation of the documents in English into Spanish due to serious mistakes, which was served to the parties in October 2018. The 45th Civil Circuit Court issued an order on August 16, 2016 setting13, 2019 that did not decide on the hearing date pursuantpending matters but rather voided all actions since September 14, 2018 and ordered the case to Article 101be referred to the 46th Civil Circuit Court according to article 121 of the General Code of Procedure. Said article says that court decisions must be rendered in no more than one (1) year as from the service of the court order admitting the claim. If that period expires without any ruling being issued, the Judge will automatically forfeit competence over the proceedings and must give the Administrative Room of the Superior Council of the Judiciary notice of that fact the next day, in addition to referring the case file to the next sitting judge in line, who will have competence and will issue a ruling in no more than 6 months. The case was sent to the 46th Civil Circuit Court on September 4, 2019, which claims that there was a competence conflict and then sent the case to the Superior Court of Bogotá to decide which court, the 45th or 46th, had to continue with the case. Florida. On June 4, 2019, the State Court of Florida allowed REGIONAL ONE to add a new claim against LATAM AIRLINES COLOMBIA for February 2, 2017. Atdefault on a verbal contract. Given the new claim, LATAM AIRLINES COLOMBIA petitioned that hearing, a reconciliation shouldthe Court postpone the trial to August 2019 to have been attempted,the time to investigate the facts in dispute determined, interrogatories made and evidence admitted. Atalleged by REGIONAL ONE to prove a verbal contract. The State Court granted the petitionpostponement of Regional One’s attorneysa jury trial to June 2020. In the meantime, the discovery stage continues, including verbal statements by experts on January 27, 2017, which was accepted by the respondent, the hearing tobehalf of both parties. There may be held on February 2, 2017 was postponed. A reconciliation hearing was held on June 14, 2017 that failed. This commenced the evidentiary stage in which the legal representative of LATAM Airlines Colombia was interrogated. The judge must now decree which evidence must be presented and analyzed. The U.S. Federal Court for the State of Florida rendered a decision on March 26, 2014 sustaining the petition of Lan Colombia Airlines to stay the proceedingssome change in the U.S. as long as the lawsuitcommitted amount, which will be reported in Colombia was pending. The U.S. Court also closed the case administratively. The Federal Court of Appeals confirmed the closing of the U.S. case on April 1, 2015. On October 13, 2015, Regional One filed a petition with the U.S. Court seeking a reopening of the case. Lan Colombia Airlines presented its arguments for keeping the case closed, which were sustained by the Court on August 23, 2016. The case in the U.S. continues to be closed.due course. | | 12,443 |
Company | | Court | | Case Number
| | Origin | | Stage of trial | | Amounts
Committed (*)
|
| | | | | | | | | | ThUS$ |
| | | | | | | | | | |
Tam Linhas
Aéreas S.A.
| | Internal Revenue Service of Brazil | | 10880.722.355/2014-52 | | On August 19th, 2014 the Federal Tax Service issued a notice of violation stating that compensation credits Program (PIS) and the Contribution for the Financing of Social Security COFINS by TAM are not directly related to the activity of air transport.
| | An administrative objection was filed on September 17th, 2014. A first-instance ruling was rendered on June 1, 2016 that was partially favorable. The separate fine was revoked. A voluntary appeal was filed on June 30, 2016, which is pending a decision by CARF. On January 9, 2016, the case was referred to the Second Division, Fourth Chamber, of the Third Section of the Administrative Council of Tax Appeals (CARF). | | 73,890 |
| | | | | | | | | | |
Tam Viagens S.A.
| | Department of Finance to the municipality of São Paulo. | | 67.168.795 / 67.168.833 / 67.168.884 / 67.168.906 / 67.168.914 / 67.168.965
| | A claim was filed alleging infraction and seeking a fine because of a deficient basis for calculation of the service tax (ISS) because the company supposedly made incorrect deductions. | | We received notice of the petition on December 22, 2015. The objection was filed on January 19, 2016. The company was notified on November 23, 2016 of the decision that partially sustained the interim infringement ruling. An ordinary appeal was filed on December 19, 2016 before the Municipal Tax Council of Sao Paulo and a judgment is pending. | | 108,396 |
| | | | | | | | | | |
Tam Linhas Aéreas S.A.
| | Labor Court of São Paulo.
| | 0001734-78.2014.5.02.0045
| | Action filed by the Ministry of Labor, which requires compliance with legislation on breaks, extra hours and others. | | This case is in the initial stages. It could possibly impact both operations and employee work shift control. TAM won in the first instance, but the Prosecutor’s Office has appealed the trial court’s decision. That decision was sustained by the appellate court. A petition by the Prosecutor’s Office for clarification is now pending before the courts. The Office of the Public Prosecutor withdrew the petition for clarification and the case was closed in favor of LATAM. Now pending are the measures pertaining to lawsuit management so that transfer to the court is declared. | | 16,170 |
Company | | Court | | Case Number
| | Origin | | Stage of trial | | Amounts
Committed (*)
|
| | | | | | | | | | ThUS$ |
| | | | | | | | | | |
TAM S.A. | | Conselho Administrativo de Recursos Fiscais. | | 13855.720077/2014-02 | | Notice of an alleged infringement presented by Secretaria da Receita Federal do Brasil requiring the payment of IRPJ and CSLL, taxes related to the income earned by TAM on March, 2011, in relation of the reduction of the statute capital of Multiplus S.A.
| | On January 12, 2014, it was filed an appeal against the object of the notice of infringement. Currently, the company is waiting for the court judgment regarding the appeal filed in the Conselho Administrativo de Recursos Fiscais (CARF) The case will be put into the system again for re-assignment for hearing and reporting because of the departure of Eduardo de Andrade, a CARF council member. The decision was against TAM. The lawsuit was on August 13, 2017. The administrative court’s decision was that TAM Linhas Aereas must pay Corporate Income Tax (IRPJ) and the Social Contribution based on Net Profits (CSLL). The Company was summoned to hear a decision on December 18, 2017. TAM filed an appeal on December 28, 2017 and must now await the appellate decision. | | 149,031 |
| | | | | | | | | | |
TAM Linhas Aéreas S.A. | | Sao Paulo Labor Court, Sao Paulo
| | 1001531-73.2016.5.02.0710 | | The Ministry of Labor filed an action seeking that the company adapt the ergonomics and comfort of seats.
| | In August 2016, the Ministry of Labor filed a new lawsuit before the competent Labor Court in Sao Paulo, in the same terms as case 0000009-45.2016.5.02.090, as previously reported. The judgment is pending. (16/02/2018).
| | 17,230 |
| Company | | Court | | Case Number | | Origin | | Stage of trial | | Amounts Committed (*) |
| | | | | | | | | | | ThUS$ |
| | | | | | | | | | | |
LATAM Airlines GroupTam Linhas Aéreas S.A.
| | Internal Revenue Service of Brazil | | 10880.722.355/2014-52 | | On August 19, 2014 the Federal Tax Service issued a notice of violation stating that compensation credits Program (PIS) and the Contribution for the Financing of Social Security COFINS by TAM are not directly related to the activity of air transport. | | An administrative objection was filed on September 17, 2014. A first-instance ruling was rendered on June 1, 2016 that was partially favorable. The separate fine was revoked. A voluntary appeal was filed on June 30, 2016, which is pending a decision by CARF. On September 9, 2016, the case was referred to the Second Division, Fourth Chamber, of the Third Section of the Administrative Council of Tax Appeals (CARF). | | 65,895 |
| | | | | | | | | | |
TAM Linhas Aéreas S.A. | | Sao Paulo Labor Court, Sao Paulo | | 1001531-73.2016.5.02.0710 | | The Ministry of Labor filed an action seeking that the company adapt the ergonomics and comfort of seats. | | In August 2016, the Ministry of Labor filed a new lawsuit before the competent Labor Court in Sao Paulo, in the same terms as case 0000009-45.2016.5.02.090, as previously reported, the hearing date is set for October 22, 2018. We were served the decision completely dismissing the claim in March 2019, against which the plaintiff has filed an appeal. We are now awaiting the hearing by the Court of Appeals. | | 17,982 |
| | | | | | | | | | |
| LATAM Airlines Group S.A. | | 22° Civil Court of Santiago | | C-29.945-2016 | | The Company received notice of a civil liability claim by Inversiones Ranco Tres S.A. on January 18, 2017. It is represented by Mr. Jorge Enrique Said Yarur. It was filed against LATAM Airlines Group S.A. for an alleged contractual default by the Company and against Ramon Eblen Kadiz, Jorge Awad Mehech, Juan Jose Cueto Plaza, Enrique Cueto Plaza and Ignacio Cueto Plaza, directors and officers, for alleged breaches of their duties. In the case of Juan Jose Cueto Plaza, Enrique Cueto Plaza and Ignacio Cueto Plaza, it alleges a breach, as controllers of the Company, of their duties under the incorporation agreement. LATAM has retained legal counsel specializing in this area to defend it. | | The claim was answered on March 22, 2017 and the plaintiff filed its replication on April 4, 2017. LATAM filed its rejoinder on April 13, 2017, which concluded the argument stage of the lawsuit. A reconciliation hearing was held on May 2, 2017, but the parties did not reach an agreement.The Court issued the evidentiary decree on May 12, 2017. We filed a petition for reconsideration because we disagreed with certain points of evidence. That petition was partially sustained by the Court on June 27, 2017. The evidentiary stage commenced and then concluded on July 20, 2017. Observations to the evidence must now be presented. That period expires August 1, 2017. We filed our observations to the evidence on August 1, 2017. We were served the decision on December 13, 2017 that dismissed the claim since LATAM was in no way liable. The plaintiff filed an appeal on December 26, 2017. Now pending isArguments were pled before the admissionSantiago Court of Appeals on April 23, 2019, and on April 30, 2019, this Court confirmed the ruling of the appealtrial court absolving LATAM. The losing party was ordered to pay costs in both cases. On May 18, 2019, Inversiones Ranco Tres S.A. filed a remedy of vacation of judgment based on technicalities and on substance against the Appellate Court decision. The Appellate Court admitted both appeals on May 29, 2019 and the appeals are pending a hearing by the Court of Appeals. Supreme Court. | | 21,54717,705
|
| | | | | | | | | | |
TAM Linhas Aéreas S.A.
| | 10th Jurisdiction of Federal Tax
Enforcement of Sao Paulo
| | 0020869-47.2017.4.03.6182
| | Tax Enforcement Lien No. 0061196-68.2016.4.03.6182 on Profit-Based Social Contributions from 2004 to 2007.
| | This tax enforcement was referred to the 10th Federal Jurisdiction on February 16, 2017. A petition reporting our request to submit collateral was recorded on April 18, 2017. At this time, the period is pending for the plaintiff to respond to our petition.
| | 42,548 |
| | | | | | | | | | |
TAM Linhas Aéreas S.A.
| | Federal Revenue Bureau
| | 10880.900360/2017-55 | | A claim regarding the negative Company Income Tax (IRPJ) balance. Appraisals of compensation that were not accepted.
| | The case was referred to the National Claims Management Center of the Federal Revenue Bureau for Sao Paulo on May 11, 2017. | | 15,910 |
| Company | | Court | | Case Number | | Origin | | Stage of trial | | Amounts Committed (*) | | Court | | Case Number | | Origin | | Stage of trial | | Amounts Committed (*) |
| | | | ThUS$ | | | | | | | | | | ThUS$ |
| | | | | | | | | | | | | |
| TAM Linhas Aéreas S.A. | | Internal Revenue Service of Brazil | | 16643.000085/2009-47 | | Notice of claim to recover income taxes and social contributions paid on the basis of net profits (SCL) according to the royalty expenses and use of the TAM trademark. | | Before the Internal Revenue Service of Brazil. A service of process is expected in the lawsuit on admissibility of the special appeal, filed by the General Counsel of the National Treasury, as well as notification of the decision rendered by the Administrative Council of Tax Appeals (CARF). The decision was made to file a lawsuit on December 5, 2017. | | 17,657 | | 10th Jurisdiction of Federal Tax Enforcement of Sao Paulo | | 0061196-68.2016.4.03.6182 | | Tax Enforcement Lien No. 0020869-47.2017.4.03.6182 on Profit-Based Social Contributions from 2004 to 2007. | | This tax enforcement was referred to the 10th Federal Jurisdiction on February 16, 2017. A petition reporting our request to submit collateral was recorded on April 18, 2017. At this time, the period is pending for the plaintiff to respond to our petition. The bond was replaced. We are waiting for the evidentiary period to begin. | | 39,584 |
| | | | | | | | | | | | |
TAM Linhas Aéreas S.A. | | Internal Revenue Service of Brazil | | 10831.012344/2005-55 | | Notice of an infringement filed by the Company to request the import tax (II), the Social Integration Program (PIS) of the Social Security Funding Contribution (COFINS) as a result of an unidentified international cargo loss. | | Before the Internal Revenue Service of Brazil. The administrative decision was against the company. The matter is pending a decision by the CARF. | | 17,844 | | Department of Federal Revenue of Brazil | | 5002912.29.2019.4.03.6100 | | A lawsuit disputing the debit in the administrative proceeding 16643.000085/2009-47, reported in previous Notes, consisting of a notice demanding recovery of the Income and Social Assessment Tax on the net profit (SCL) resulting from the itemization of royalties and use of the TAM trademark | | The lawsuit was assigned on February 28, 2019. A decision was rendered on March 1, 2019 stating that no guarantee was required. A final decision is now pending. | | 11,139 |
| | | | | | | | | | | | |
TAM Linhas Aéreas S.A. | | Treasury Department of the State of Sao Paulo | | 3.123.785-0 | | Notice of an infringement to demand payment of the tax on the circulation of merchandise and services (ICMS) assessable on aircraft imports. | | Before the Treasury Department of the State of Sao Paulo. A decision is now pending on the appeal that the company has filed with the Federal Supreme Court (STF). | | 14,647 | | DERAT SPO (Delegacía de Receita Federal) | | 13808.005459/2001-45 | | Collection of the Social Security Funding Contribution (COFINS) based on gross revenue of the company in the period 1999-2000. | | The decision on collection was pending through June 2, 2010. | | 23,228 |
| | | | | | | | | | | | |
TAM Linhas Aéreas S.A. | | Treasury Department of the State of Sao Paulo | | 4.037.054 | | Action brought by the Treasury Department of the State of Sao Paulo because of non-payment of the tax on the circulation of merchandise and services (ICMS) in relation to telecommunications services. | | Before the Treasury Department of the State of Sao Paulo. Defensive arguments have been presented. The first-instance decision sustained all parts of the notice. We filed an ordinary appeal on which a decision is pending by the Sao Paulo Tax Court. | | 10,808 | |
TAM Linhas Aéreas S.A | | | Delegacía de Receita Federal | | 10611.720630/2017-16 | | This is an administrative claim about a fine for the incorrectness of an import declaration (new lawsuit). | | The administrative defensive arguments were presented September 28, 2017. The Court dismissed the Company’s appeal in August 2019. Then on September 17, 2019, Company filed a special appeal (CRSF (Higher Tax Appeals Chamber)) that is pending a decision. | | 20,410 |
| | | | | | | | | | | | | |
TAM Linhas Aéreas S.A. | | DERAT SPO (Delegacía de Receita Federal) | | 13808.005459/2001-45 | | Collection of the Social Security Funding Contribution (COFINS) based on gross revenue of the company in the period 1999-2000 | | The decision on collection was pending through June 2, 2010. | | 27,226 | |
TAM Linhas Aéreas S.A | | | Delegacía de Receita Federal | | 10611.720852/2016-58 | | An improper charge of the Contribution for the Financing of Social Security (COFINS) on an import (new lawsuit). | | We are currently awaiting a decision. There is no predictable decision date because it depends on the court of the government agency. | | 14,631 |
| | | | | | | | | | | | |
TAM Linhas Aéreas S.A | | | Delegacía de Receita Federal | | 16692.721.933/2017-80 | | The Internal Revenue Service of Brazil issued a notice of violation because TAM applied for credits offsetting the contributions for the Social Integration Program (PIS) and the Social Security Funding Contribution (COFINS) that do not bear a direct relationship to air transport. | | An administrative defense was presented on May 29, 2018. | | 31,381 |
| | | | | | | | | | | | |
SNEA (Sindicato Nacional das empresas aeroviárias) | | | União Federal | | 0012177-54.2016.4.01.3400 | | A claim against the 72% increase in airport control fees (TAT-ADR) and approach control fees (TAT-APP) charged by the Airspace Control Department (“DECEA”). | | A decision is now pending on the appeal presented by SNEA. | | 63,951 |
| Company | | Court | | Case Number | | Origin | | Stage of trial | | Amounts Committed (*) |
| | | | | | | | | | | ThUS$ |
| | | | | | | | | | |
Pantanal Linhas Aéreas S.A. | | Tax Enforcement Court | | 0253410-30.2012.8.26.0014 | | A lawsuit seeking enforcement of the fine and ICMS. | | A decision is pending on the appeal. | | 10,877 |
| | | | | | | | | | |
TAM Linhas Aéreas S.A | | Federal Revenue Bureau
| | 10880.938.664/2016-12
| | An administrative lawsuit about compensation not being proportional to the negative corporate income tax balance. | | A decision is pending by CARF on the appeal.
| | 27,369 |
| | | | | | | | | | |
TAM Linhas Aéreas S.A.
| | Vara das execucões fiscais.
| | 1997.0002503-9 | | This is a tax collection claim for a customs fine—forfeiture of the temporary customs clearance of goods (new lawsuit).
| | Collateral insurance was offered in 2016 and accepted by the Ministry of Finance in a petition made November 9, 2016. The defensive arguments were presented (attachments against the tax collection) and the decision was favorable to TAM, which makes the payment of a fine more unlikely for TAM. Now pending in the lawsuit is a decision in the appeal made by the Ministry of Finance. | | 9,983 |
| | | | | | | | | | |
TAM Linhas Aéreas S.A.
| | Delegacía de Receita Federal | | 10611.720630/2017-16 | | This is an administrative claim about a fine for the incorrectness of an import declaration (new lawsuit). | | The administrative defensive arguments were presented September 28, 2017. | | 22,253
|
| | | | | | | | | | |
TAM Linhas Aéreas S.A. | | Delegacía de Receita Federal | | 10611.720852/2016-58 | | An improper charge of the Contribution for the Financing of Social Security (COFINS) on an import (new lawsuit). | | We are currently awaiting a decision. There is no predictable decision date because it depends on the court of the government agency. | | 16,079
|
| | | | | | | | | | |
TAM Linhas Aéreas S.A
| | Delegacía de Receita Federal
| | 16692.721.933/2017-80
| | The Internal Revenue Service of Brazil issued a notice of violation because TAM applied for credits offsetting the contributions for the Social Integration Program (PIS) and the Social Security Funding Contribution (COFINS) that do not bear a direct relationship to air transport (new claim).
| | We are awaiting the presentation of an administrative defense.
| | 34.321
|
Company | | Court | | Case Number | | Origin | | Stage of trial | | Amounts
Committed (*)
|
| | | | | | | | | | ThUS$ |
| | | | | | | | | | |
SNEA (Sindicato Nacional das empresas aeroviárias)
| | União Federal
| | 0012177-54.2016.4.01.3400
| | A claim against the 72% increase in airport control fees (TAT-ADR) and approach control fees (TAT-APP) charged by the Airspace Control Department (“DECEA”). | | A decision is now pending on the appeal presented by SNEA.
| | 23.118
|
| | | | | | | | | | | |
TAM Linhas Aéreas S/A | | União Federal | | 2001.51.01.020420-0 | | TAM and other airlines filed a recourse claim seeking a finding that there is no legal or tax basis to be released from collecting the Additional Airport Fee (“ATAERO”). | | A decision by the superior court is pending. The amount is indeterminate because even though TAM is the plaintiff, if the ruling is against it, it could be ordered by the trial judge to pay certain fees. | | -0- |
| | | | | | | | | | |
TAM Linhas Aéreas S/A | | Delegacia da Receita Federal | | 10880-900.424/2018-07 | | This is a claim for a negative Legal Entity Income Tax (IRPJ) balance for the 2014 calendar year (2015 fiscal year) because set-offs were not allowed. | | The administrative defensive arguments were presented March 19, 2018. An administrative decision is now pending. | | 17,202 |
| | | | | | | | | | |
TAM Linhas Aéreas S/A | | Department of Federal Revenue of Brazil | | 19515-720.823/2018-11 | | An administrative claim to collect alleged differences in SAT payments for the periods 11/2013 to 12/2017. | | A defense was presented on November 28, 2018. The Court dismissed the Company’s appeal in August 2019. Then on September 17, 2019, Company filed a voluntary appeal (CRSF (Administrative Tax Appeals Board)) that is pending a decision. | | 120,551 |
| | | | | | | | | | |
TAM Linhas Aéreas S/A | | Department of Federal Revenue of Brazil | | 10880.938832/2013-19 | | The decision denied the reallocation petition and did not equate the Social Security Tax (COFINS) credit declarations for the second quarter of 2011, which were determined to be in the non-cumulative system | | An administrative defense was argued on March 19, 2019. The decision is pending. | | 16,108 |
| | | | | | | | | | |
TAM Linhas Aéreas S/A | | Department of Federal Revenue of Brazil | | 10880.938834/2013-16 | | The decision denied the reallocation petition and did not equate the Social Security Tax (COFINS) credit declarations for the third quarter of 2011, which were determined to be in the non-cumulative system. | | An administrative defense was argued on March 19, 2019. The decision is pending. | | 11,777 |
| | | | | | | | | | |
TAM Linhas Aéreas S/A | | Department of Federal Revenue of Brazil | | 10880.938837/2013-41 | | The decision denied the reallocation petition and did not equate the Social Security Tax (COFINS) credit declarations for the fourth quarter of 2011, which were determined to be in the non-cumulative system. | | An administrative defense was argued on March 19, 2019. The decision is pending. | | 15,782 |
| Company | | Court | | Case Number | | Origin | | Stage of trial | | Amounts Committed (*) |
| | | | | | | | | | ThUS$ |
| | | | | | | | | | |
TAM Linhas Aéreas S/A | | Department of Federal Revenue of Brazil | | 10880.938838/2013-96 | | The decision denied the reallocation petition and did not equate the Social Security Tax (COFINS) credit declarations for the first quarter of 2012, which were determined to be in the non-cumulative system. | | We presented our administrative defense. | | 10,891 |
| | | | | | | | | | |
TAM Linhas Aéreas S/A | | Department of Federal Revenue of Brazil | | 0012541-56.2016.5.03.0144 | | A class action in which the Union is petitioning that TAM be ordered to make payment of the correct calculation of Sundays and holidays. | | A hearing was set for December 17, 2019 | | 14,423 |
| | | | | | | | | | |
LATAM Airlines Argentina | | Commercial Trial Court No. 15 of Buenos Aires. | | 11479/2012 | | Proconsumer and Rafaella Cabrera filed a claim citing discriminating fees charged to foreign users as compared to domestic users for services retained in Argentina. | | The trial court judge dismissed Mrs. Cabrera’s claim on March 7, 2019 and sustained the motion of lack of standing entered by Proconsumer. The ruling was appealed by the plaintiff on April 8, 2019 and will be decided by Room D. | | -0- |
| | | | | | | | | | |
LATAM Airlines Group Argentina, Brasil, Perú, Ecuador, y TAM Mercosur. | | Commercial and Civil Trial Court No. 11 of Buenos Aires. | | 1408/2017 | | Consumidores Libres Coop. Ltda. filed this claim on March 14, 2017 regarding a provision of services. It petitioned for the reimbursement of certain fees or the difference in fees charged for passengers who purchased a ticket in the last 10 years but did not use it. | | Federal Commercial and Civil Trial Court No. 11 in the city of Buenos Aires. After two years of arguments on jurisdiction and competence, the claim was assigned to this court and an answer was filed on March 19, 2019 | | -0- |
| TAM Linhas Aéreas S.A | | Department of Federal Revenue of Brazil | | 10.880.938842/2013-54 | | The decision denied the petition for reassignment and did not equate the CONFINS credit statements for the third quarter of 2012 that had been determined to be in the non-accumulative system. | | We presented our administrative defense. | | 11,521 |
| | | | | | | | | | |
| TAM Linhas Aéreas S.A | | Department of Federal Revenue of Brazil | | 10.880.93844/2013-43 | | The decision denied the petition for reassignment and did not equate the CONFINS credit statements for the third quarter of 2012 that had been determined to be in the non-accumulative system. | | We presented our administrative defense | | 10,876 |
| Company | | Court | | Case Number | | Origin | | Stage of trial | | Amounts Committed (*) |
| | | | | | | | | | ThUS$ |
| | | | | | | | | | |
| TAM Linhas Aéreas S.A | | Department of Federal Revenue of Brazil | | 10880.938841/2013-18 | | The decision denied the petition for reassignment and did not equate the CONFINS credit statements for the second quarter of 2012 that had been determined to be in the non-accumulative system. | | We presented our administrative defense. | | 10,292 |
| | | | | | | | | | |
| TAM Linhas Aéreas S.A | | Receita Federal de Brasil | | 10840.727719/2019-71 | | Collection of PIS / COFINS tax for the period of 2014. | | We presented our administrative defense on January 11, 2020 | | 42,276 |
| | | | | | | | | | |
| Latam-Airlines Ecuador S.A. | | Tribunal Distrital de lo Fiscal | | 17509-2014-0088 | | An audit of the 2006 Income Tax Return that disallowed fuel expenses, fees and other items because the necessary support was not provided, according to Management. | | On August 6, 2018, the District Tax Claims Court rendered a decision denying the request for a refund of a mistaken payment. An appeal seeking vacation of this judgment by the Court was filed on September 5 and we are awaiting a decision by the Appellate judges. As of December 31, 2018, the lawyers believe that the probability of recovering this amount has fallen by 30% to 40%, so the provision was increased to $8.7 million. We have applied IFRIC 23 as of 12/31/19 because of the percentage loss (more than 50%), and we have recorded the entire provision in the income tax item. | | 12,505 |
| | | | | | | | | | |
| Latam Airlines Group S.A. | | Southern District of Florida. United States District Court | | 19cv23965 | | A lawsuit filed by Jose Ramon Lopez Regueiro against American Airlines Inc. and Latam Airlines Group S.A. seeking an indemnity for damages caused by the commercial use of the Jose Marti International Airport in Cuba that he says were repaired and reconditioned by his family before the change in government in 1959. | | Latam Airlines Group S.A. was served this claim on September 27, 2019. LATAM Airlines Group filed a motion to dismiss on November 26, 2019. In response, a motion to suspend discovery was filed on December 23, 2019 while the Court was deciding on the motion to dismiss. The provision is undetermined. | | -0- |
| - | In order to deal with any financial obligations arising from legal proceedings in effect at December 31, 2017,2019, whether civil, tax, or labor, LATAM Airlines Group S.A. and Subsidiaries, has made provisions, which are included in Other non-current provisions that are disclosed in Note 21. |
| - | The Company has not disclosed the individual probability of success for each contingency in order to not negatively affect its outcome. |
| (*) | The Company has reported the amounts involved only for the lawsuits for which a reliable estimation can be made of the financial impacts and of the possibility of any recovery, pursuant to Paragraph 86 of IAS 37 Provisions, Contingent Liabilities and Contingent Assets. |
| II. | Governmental InvestigationsInvestigations.. |
| 1) | On July 25, 2016, LATAM reached agreements with the U.S. Department of Justice (“DOJ”) and the U.S. Securities and Exchange Commission (“SEC”) regarding the investigation of payments for US$1,150,000 by Lan Airlines S.A. in 2006-2007 to a consultant advising it in the resolution of labor matters in Argentina. |
1) On July 25, 2016, LATAM reached agreements with theU.S. Department of Justice (“DOJ”) and theU.S. Securities and Exchange Commission (“SEC”) regarding the investigation of payments for US$1,150,000 by Lan Airlines S.A. in 2006-2007 to a consultant advising it in the resolution of labor matters in Argentina.
The purpose of the investigation was to determine whether these payments violated the U.S. Foreign Corrupt Practices Act (“FCPA”) that: (i) forbids bribery of foreign government authorities in order to obtain a commercial advantage; and (ii) requires the companies that must abide by the FCPA to keep appropriate accounting records and implant an adequate internal control system. The FCPA is applicable to LATAM because of its ADR program in effect on the U.S. securities market.
After an exhaustive investigation, the DOJ and SEC concluded that there was no violation of the bribery provisions of the FCPA, which is consistent with the results of LATAM’s internal investigation. However, the DOJ and SEC consider that LANLATAM accounted for these payments incorrectly and, consequently, infringed the part of the FCPA requiring companies to keep accurate accounting records. These authorities also consider that LAN’sLATAM’s internal controls in 2006-2007 were weak, so LANLATAM would have also violated the provisions in the FCPA requiring it to maintain an adequate internal control system.
The agreements signed, included the following:
| a) | (a) The agreement with the DOJ involves: (i) entering into a Deferred Prosecution Agreement (“DPA”), which is a public contract under which the DOJ files public charges alleging an infringement of the FCPA accounting regulations. LATAM is not obligated to answer these charges, the DOJ will not pursue them for a period of 3 years, and the DOJ will dismiss the charges after expiration of that 3-year period provided LATAM complies with all terms of the DPA. In exchange, LATAM must admit to the negotiated events described in the DPA and agree to pay the negotiated fine explained below and abide by other terms stipulated in the agreement; (ii) clauses in which LATAM admits that the payments to the consultant in Argentina were incorrectly accounted for and that at the time those payments were made (2006-2007), it did not have adequate internal controls in place; (iii) LATAM’s agreement to have an outside consultant monitor, evaluate and report to the DOJ on the effectiveness of LATAM’s compliance program for a period of 27 months; and LATAM’s agreement to continue evaluating and reporting directly to the DOJ on the effectiveness of its compliance program for a period of 9 months after the consultant’s work concludes; and (iv) LATAM paid a fine of ThUS$ 12,750. |
| b) | The agreement with the SEC involves: (i) accepting a Cease and Desist Order, which is an administrative resolution of the SEC closing the investigation, in which LATAM will accept certain obligations and statements of fact that are described in the document; (ii) accepting the same obligations regarding the consultant mentioned above; and (iii) LATAM paid a fine of KUS$6,744 and interest of ThUS$ 2,694. |
Nothing is owed to the SEC at this time as ThUS$ 4,719 was paid in July 2017.
(b) The agreement with the SEC involves: (i) accepting a Cease and Desist Order, which is an administrative resolution of the SEC closing the investigation, in which LATAM will accept certain obligations and statements of fact that are described in the document; (ii) accepting the same obligations regarding the consultant mentioned above; and (iii) LATAM paid a fine of ThUS$ 6,744 and interest of ThUS$ 2,694.
LATAM continued to cooperate withOn May 15, 2019, the Chilean authorities on this matter. The investigation continues. The 7th Criminal Court set the hearing date for October 24, 2017, at the request of the Office of the Public Prosecutor. The Prosecutor has petitionedexternal consultant certified that the investigation beAnticorruption program of LATAM Airlines Group S.A. It is reasonably designed and implemented to prevent and detect violations within LATAM to anti-corruption laws.
On July 23, 2019, the DOJ approved the certification made by the consultant on May 15, 2019 regarding the Anticorruption program of LATAM Airlines Group S.A.
On January 31, 2020, the Florida Court sustained the DOJ’s motion to withdraw the criminal action filed against LATAM Airlines Group S.A. as LATAM had fulfilled all the conditions in the DPA. So, the DOJ case is closed.
| 2) | LATAM received six Requests for Information from the Central-North Metropolitan Region Legal Division, on October 25, 2016, on November 11, 2016, on March 8, 2017, on March 22, 2017, on July 7, 2017 and the last on August 28, 2017. It requested information related to the investigation of payments made by LAN Airlines in 2006 and 2007 to a consultant who advised it on the resolution of labor matters in Argentina. It also requested an explanation of information provided to the market. The five requests have already been answered and the requested information has been provided. The 7th Criminal Court set the hearing date for October 24, 2017 at the request of the Public Prosecutor. A reopening of the investigation was denied at that hearing and that denial was confirmed by the Santiago Court of Appeals on November 20, 2017. |
2) On April 6, 2019, LATAM Airlines Group S.A. received notification of the resolution issued by the National Economic Prosecutor’s Office (FNE), which begins an investigation into the LATAM Pass frequent passenger program. The last move in the cause Role No. 2530-19 leading this investigation corresponds to LATAM Airlines Group S.A. response in May 2019.
| 3) | The ecuatorian airline affiliate, LATAM Airlines Ecuador was given notice on August 26, 2016 of an investigation of LATAM Airlines Ecuador and two other airlines begun, at its own initiative, by one of the Investigative Departments of the Ecuadoran Market Power Control Commission, limited to alleged signs of conscious parallelism in relation to specific fares on one domestic route in Ecuador from August 2012 to February 2013. The Investigative Prefecture has 180 days (through February 21, 2017) to issue a report on whether to quash the investigation or file charges against two or more of the parties involved. That period can be extended for another 180 days. A proceeding would begin only if the decision is made to file charges. The Commission extended the term of the investigation for another 180 days (through August 18, 2017) LATAM Airlines Ecuador is cooperating with the authority and has retained a law firm and economist expert in the subject to advise the company during this process and any additional information requested will be furnished. We received notice on August 23, 2017 that the Market Regulatory Commission decided to quash the investigation against AEROLANE LÍNEAS AÉREAS NACIONALES DEL ECUADOR S.A. and two other airlines because there was insufficient information to charge them. This decision is final. |
3) On July 9, 2019, LATAM Airlines Group S.A. received the resolution issued by the National Economic Prosecutor’s Office (FNE), which begins an investigation into the Alliance Agreement between LATAM Airlines Group S.A. and American Airlines INC. The last move in the cause Role No. 2565-19 leading this investigation corresponds to a statement on September 11, 2019
4) On July 26, 2019, the National Consumer Service of Chile (SERNAC) issued the Ordinary Resolution No. 12,711 which proposed to initiate a collective voluntary mediation procedure on effectively informing passengers of their rights in cases of cancellation of flights or no show to boarding, as well as the obligation to return the respective boarding fees as provided by art. 133 C of the Aeronautical Code. The Company has voluntarily decided to participate in this procedure, the terms and conditions of which are being negotiated.
5) On October 15, 2019, LATAM Airlines Group S.A. received the resolution issued by the National Economic Prosecuting Authority (FNE) advising of the start of an investigation into the agreement between LATAM Airlines Group S.A. and Delta Airlines, Inc. (Case number 2585-19). The Company is cooperating in this investigation.
6) On December 11, 2019, LATAM Airlines Group S.A. received Office No. 122019 / FFD / 208993 by the Fiscalía Regional Metropolitana Centro Norte, requesting information on statements that appeared in the press in Brazil about alleged payments to public officials within the framework of the Asociación Brasileña de Compañías Aéreas, ABEAR. Cause No. 2585-19. The Company is currently cooperating with this process.
NOTE 32 – COMMITMENTS
The Company and its subsidiaries do not maintain credit agreements that set limits on certain financial indicators of the Company or its subsidiaries, with the exception of those detailed below:
With respect to the various loans signedcontracts concluded by the Company for the financing of Boeing 767, 767F, 777F and 787 aircraft which carrythat have the guarantee of the Export - Import Bank of the United States Export–Import Bank,of America, limits have been set onestablished for some financial indicators of the Company’s financial indicatorsparent company on a consolidated basis, forin respect of which, in any case, non-compliance does not generate accelerationaccelerate payment of the loans.
Moreover, and related to these same contracts, restrictions are also in place on the Company’s management in terms of its ownership, in relation to the ownership structure and the controlling group, and disposal of the assets which mainly refers to important transfers of assets.loan.
The Company and its subsidiaries do not maintain financial credit contracts with banks in Chile that indicate someestablished limits measured semiannually on financial indicatorsthe basis of the Company or its subsidiaries.Consolidated Financial Statements are the following:
| F-132I. | Debt to EBITDAR: The ratio of the Company’s financial obligations, on a consolidated basis, to EBITDAR must not exceed 6 times. |
EBITDAR: It is defined as the net result, excluding interest, depreciation, amortization, rental income and profits or extraordinary losses not related to ordinary course of business.
| II. | Fixed charge index: EBITDAR of the last twelve months on the sum of the cash on a consolidated basis required to cover interest expenses during said period, plus lease rental expenses, plus dividends declared or paid by the Company. This index should not be less than 1.2 times. |
| III. | Minimum liquidity: The cash and cash equivalent of the Consolidated Company must not be less than ThUS$ 75,000. |
Regarding the renewable credit line of credit (“Revolving Credit Facility ("Revolving Credit Facility"Facility”) established with guaranteed aircraft,a consortium of twelve banks led by Citibank, with a guarantee of airplanes, engines, spare parts and supplies for a total amount available of US $ 450US$ 600 million, this includes restrictions of minimum liquidity, measured at the level of the Consolidated Company (with a minimum level of US$ 750 million) and measured at the individual level for the companies LATAM Airlines Group S.A.SA and TAM Linhas Aéreas S.A. which remain stand by while(with a minimum level of US$ 400 million). Compliance with these restrictions is a precondition for using the creditline; If the line is not used. This credit line establishedused, these restrictions must be reported quarterly, and failure to comply with a consortiumthese restrictions results in acceleration of eleven banks led by Citibank, is not used asloan payment. As of December 31, 2017.2019, this line of credit is not used.
As of December 31, 2017,2019 this line of credit established with a consortium of twelve banks led by Citibank, is not used.
As of December 31, 2019, the Company is in compliance with all the financial indicators detailed above.
| (b) | Commitments under operating leases as lessee |
Details of the main operating leases are as follows:
| | | | | As of | | | As of | |
| | | | | December 31, | | | December 31, | |
| Lessor | | Aircraft | | 2017 | | | 2016 | |
| | | | | | | | | |
| ACS Aero 1 Alpha limited | | Airbus A320 | | | 1 | | | | - | |
| Aircraft 76B-26329 Inc. | | Boeing 767 | | | 1 | | | | 1 | |
| Aircraft 76B-27615 Inc. | | Boeing 767 | | | - | | | | 1 | |
| Aircraft 76B-28206 Inc. | | Boeing 767 | | | 1 | | | | 1 | |
| Aviación Centaurus, A.I.E. | | Airbus A319 | | | 3 | | | | 3 | |
| Aviación Centaurus, A.I.E. | | Airbus A321 | | | 1 | | | | 1 | |
| Aviación Real A.I.E. | | Airbus A319 | | | 1 | | | | 1 | |
| Aviación Real A.I.E. | | Airbus A320 | | | 1 | | | | 1 | |
| Aviación Tritón A.I.E. | | Airbus A319 | | | 3 | | | | 3 | |
| Avolon Aerospace AOE 19 Limited | | Airbus A320 | | | - | | | | 1 | |
| Avolon Aerospace AOE 20 Limited | | Airbus A320 | | | - | | | | 1 | |
| Avolon Aerospace AOE 6 Limited | | Airbus A320 | | | - | | | | 1 | |
| Avolon Aerospace AOE 62 Limited | | Boeing 777 | | | 1 | | | | 1 | |
| Avolon Aerospace AOE 100 Limited | | Airbus A320 | | | 2 | | | | - | |
| AWAS 5234 Trust | | Airbus A320 | | | 1 | | | | 1 | |
| Baker & Spice Aviation Limited | | Airbus A320 | | | 1 | | | | 1 | |
| Bank of America | | Airbus A321 | | | 2 | | | | 2 | |
| Bank of Utah | | Boeing 787 | | | 2 | | | | - | |
| CIT Aerospace International | | Airbus A320 | | | 1 | | | | 2 | |
| ECAF I 1215 DAC | | Airbus A320 | | | - | | | | 1 | |
| ECAF I 2838 DAC | | Airbus A320 | | | 1 | | | | 1 | |
| ECAF I 40589 DAC | | Boeing 777 | | | 1 | | | | 1 | |
| Eden Irish Aircr Leasing MSN 1459 | | Airbus A320 | | | 1 | | | | 1 | |
| GECAS Sverige Aircraft Leasing Worldwide AB | | Airbus A320 | | | - | | | | 1 | |
| GFL Aircraft Leasing Netherlands B.V. | | Airbus A320 | | | - | | | | 1 | |
| IC Airlease One Limited | | Airbus A321 | | | 1 | | | | 1 | |
| JSA Aircraft 38484, LLC | | Boeing 787 | | | 1 | | | | 1 | |
| JSA Aircraft 7126, LLC | | Airbus A320 | | | 1 | | | | 1 | |
| JSA Aircraft 7128, LLC | | Airbus A321 | | | 1 | | | | 1 | |
| JSA Aircraft 7239, LLC | | Airbus A321 | | | 1 | | | | 1 | |
| JSA Aircraft 7298, LLC | | Airbus A321 | | | 1 | | | | 1 | |
| Macquarie Aerospace Finance 5125-2 Trust | | Airbus A320 | | | 1 | | | | 1 | |
| Macquarie Aerospace Finance 5178 Limited | | Airbus A320 | | | 1 | | | | 1 | |
| | | | | As of | | | As of | |
| | | | | December 31, | | | December 31, | |
| Lessor | | Aircraft | | 2017 | | | 2016 | |
| | | | | | | | | |
| Magix Airlease Limited | | Airbus A320 | | | - | | | | 1 | |
| MASL Sweden (8) AB | | Airbus A320 | | | - | | | | 1 | |
| Merlin Aviation Leasing (Ireland) 18 Limited | | Airbus A320 | | | 1 | | | | 1 | |
| Merlin Aviation Leasing (Ireland) 7 Limited | | Airbus A320 | | | 1 | | | | - | |
| NBB Cuckoo Co., Ltd | | Airbus A321 | | | 1 | | | | 1 | |
| NBB Grosbeak Co., Ltd | | Airbus A321 | | | 1 | | | | 1 | |
| NBB Redstart Co. Ltd | | Airbus A321 | | | 1 | | | | 1 | |
| NBB-6658 Lease Partnership | | Airbus A321 | | | 1 | | | | 1 | |
| NBB-6670 Lease Partnership | | Airbus A321 | | | 1 | | | | 1 | |
| Orix Aviation Systems Limited | | Airbus A320 | | | 4 | | | | 5 | |
| PAAL Aquila Company Limited | | Airbus A321 | | | 2 | | | | 2 | |
| PAAL Gemini Company Limited | | Airbus A321 | | | 1 | | | | 1 | |
| SASOF II (J) Aviation Ireland Limited | | Airbus A319 | | | - | | | | 1 | |
| Shenton Aircraft Leasing Limited | | Airbus A320 | | | 1 | | | | 1 | |
| Sky High XXIV Leasing Company Limited | | Airbus A320 | | | 5 | | | | 5 | |
| Sky High XXV Leasing Company Limited | | Airbus A320 | | | 2 | | | | 2 | |
| SMBC Aviation Capital Limited | | Airbus A320 | | | 4 | | | | 6 | |
| SMBC Aviation Capital Limited | | Airbus A321 | | | 2 | | | | 2 | |
| TC-CIT Aviation Ireland Limited | | Airbus A320 | | | - | | | | 1 | |
| Volito Aviation August 2007 AB | | Airbus A320 | | | 2 | | | | 2 | |
| Volito Aviation November 2006 AB | | Airbus A320 | | | 2 | | | | 2 | |
| Volito November 2006 AB | | Airbus A320 | | | 2 | | | | 2 | |
| Wells Fargo Bank North National Association | | Airbus A319 | | | 2 | | | | 3 | |
| Wells Fargo Bank North National Association | | Airbus A320 | | | - | | | | 2 | |
| Wells Fargo Bank Northwest National Association | | Airbus A320 | | | 5 | | | | 7 | |
| Wells Fargo Bank Northwest National Association | | Airbus A350 | | | 2 | | | | 2 | |
| Wells Fargo Bank Northwest National Association | | Boeing 767 | | | 2 | | | | 3 | |
| Wells Fargo Bank Northwest National Association | | Boeing 777 | | | 4 | | | | 6 | |
| Wells Fargo Bank Northwest National Association | | Boeing 787 | | | 11 | | | | 11 | |
| Wilmington Trust Company | | Airbus A319 | | | - | | | | 1 | |
| Total | | | | | 93 | | | | 111 | |
The rentals are shown in results for the period for which they are incurred.
The minimum future lease payments not yet payable are the following:
| | | As of | | | As of | |
| | | December 31, | | | December 31, | |
| | | 2017 | | | 2016 | |
| | | ThUS$ | | | ThUS$ | |
| | | | | | | |
| No later than one year | | | 462,205 | | | | 533,319 | |
| Between one and five years | | | 1,620,253 | | | | 1,459,362 | |
| Over five years | | | 1,498,064 | | | | 1,262,509 | |
| Total | | | 3,580,522 | | | | 3,255,190 | |
The minimum operating lease payments charged to income are the following:
| | | For the period ended | |
| | | December 31, | |
| | | 2017 | | | 2016 | | | 2015 | |
| | | ThUS$ | | | ThUS$ | | | ThUS$ | |
| | | | | | | | | | |
| Minimum operating lease payments | | | 579,551 | | | | 568,979 | | | | 525,134 | |
| Total | | | 579,551 | | | | 568,979 | | | | 525,134 | |
During 2017 two Airbus A320-200N were added for a period of twelve years each and two Airbus A319-100 aircraft, fifteen Airbus A320 aircraft were returned. On the other hand, two Boeing 787-9 aircraft were added for a period of twelve year each and one Boeing 767-300ER aircraft and one Boeing 767-300 Freighter aircraft were returned.
The operating lease agreements entered into by the Parent Company and its subsidiariesCompany’s financing contracts generally establish that aircraft maintenance must be carried outclauses related to changes in accordance with the technical provisions of the manufacturerownership structure and in the margins agreed in the contracts with the lessor, a cost assumed by the lessee. Additionally, for each aircraft, the lessee must purchase policies that cover the associated riskcontroller and the amountdisposition of the assets involved.(as refer mainly to important transfers of assets).
In particular, the contract “Indenture” signed between Guanay Finance Limited (see Note 1), LATAM Airlines Group S.A. and Citibank, N.A. on November 7, 2013, it includes clauses related to changes in the ownership structure and Company controller, which generate the anticipation of certain payment obligations. As forresult of the rent payments, these are unrestricted and cannotacquisition of 20% of the shares of LATAM Airlines Group S.A. by Delta Air Lines, Inc., the debt held by Guanay Finance Limited, which mature in December 2020, will be netted from other accounts receivable or payablepaid in March 2020, this was considered by the lessor andCompany.
Finally, we Note that the lessee.particular terms of the aforementioned clauses regarding the Indenture contract are not included in any other financing contract that the Company maintains in force as of this date.
(b) Other commitments
At December 31, 2017 the Company has existing letters of credit related to operating leasing as follows:
| | | | | | Value | | | Release |
Creditor Guarantee | | Debtor | | Type | | ThUS$ | | | date |
GE Capital Aviation Services Limited | | Lan Cargo S.A. | | One letter of credit | | | 1,100 | | | Nov 30, 2018 |
ACS Aero 1 Alpha Limited | | LATAM Airlines Group S.A. | | One letter of credit | | | 3,255 | | | Aug 31, 2018 |
Bank of America | | LATAM Airlines Group S.A. | | Three letter of credit | | | 1,043 | | | Jul 2, 2018 |
Bank of Utah | | LATAM Airlines Group S.A. | | One letter of credit | | | 2,000 | | | Mar 24, 2019 |
Engine Lease Finance Corporation | | LATAM Airlines Group S.A. | | One letter of credit | | | 4,750 | | | Oct 8, 2018 |
GE Capital Aviation Services Ltd. | | LATAM Airlines Group S.A. | | Six letter of credit | | | 22,105 | | | Apr 30, 2018 |
International Lease Finance Corp | | LATAM Airlines Group S.A. | | Three letter of credit | | | 1,450 | | | Aug 5, 2018 |
ORIX Aviation Systems Limited | | LATAM Airlines Group S.A. | | Two letter of credit | | | 7,366 | | | Dec 11, 2018 |
Wells Fargo Bank | | LATAM Airlines Group S.A. | | Nine letter of credit | | | 15,160 | | | Mar 2, 2018 |
CIT Aerospace International | | Tam Linhas Aéreas S.A. | | One letter of credit | | | 6,000 | | | Oct 25, 2018 |
Wells Fargo Bank North N.A. | | Tam Linhas Aéreas S.A. | | One letter of credit | | | 5,500 | | | Jul 15, 2018 |
| | | | | | | 69,729 | | | |
At December 31, 2017 the Company has existing letters of credit, certificates of deposits and warranty insurance policies as follows:
| | | | | | Value | | | Release |
| Creditor Guarantee | | Debtor | | Type | | Value
ThUS$ | | | Release
date | |
| | | | | | | | | | |
Servicio Nacional de Aduana del Ecuador | | Líneas Aéreas Nacionales del Ecuador S.A. | | Three letter of credit | | | 1,705 | | | Aug 5, 2018 |
| Corporación Peruana de Aeropuertos y Aviación Comercial | | LanLatam Airlines Perú S.A. | | Twenty six letter of credit | | | 3,493 | | | | Jan-31-20 | |
| Lima Airport Partners S.R.L. | | Latam Airlines Perú S.A. | | Twenty one letter of credit | | | 2,990 | | | | Feb-17-20 | |
| Superintendencia Nacional de Aduanas y de Administración Tributaria | | Latam Airlines Perú S.A. | | Twenty five letter of credit | | | 1,897200,000 | | | Jan 31, 2018 | Feb-12-20 | |
Lima Airport Partners S.R.L.Instituto Nacional de Defensa de la Compentencia y de la Protección | | LanLatam Airlines Perú S.A. | | EighteenForty three letter of credit | | | 9961,483 | | | Apr 30, 2018 |
Superintendencia Nacional de Aduanas y de Administración TributariaFeb-27-20 | | Lan Perú S.A. | | Ten letter of credit | | | 80,000 | | | Jan 21, 2018 |
| Aena Aeropuertos S.A. | | LATAMLatam Airlines Group S.A. | | Four letter of credit | | | 2,8092,820 | | | Nov 15, 2018 | Nov-15-20 | |
| American Alternative Insurance Corporation | | LATAMLatam Airlines Group S.A. | | SixSeven letter of credit | | | 3,6903,790 | | | Apr 5, 2018 | Abr-05-20 | |
Comisión EuropeaCitibank N.A. | | LATAMLatam Airlines Group S.A. | | One letter of credit | | | 9,86827,226 | | | Jun 16, 2018 | Dec-20-20 | |
Deutsche Bank A.G.Comisión Europea | | LATAMLatam Airlines Group S.A. | | One letter of credit | | | 15,0009,346 | | | Mar 31, 2018 | Dec-31-20 | |
| Deutsche Bank A.G. | | Latam Airlines Group S.A. | | One letter of credit | | | 2,500 | | | | March-31-20 | |
| Dirección General de Aeronáutica Civil | | LATAMLatam Airlines Group S.A. | | Fifty threeForty six letter of credit | | | 19,75918,487 | | | Feb 28, 2018 | Feb-28-20 | |
| Empresa Pública de Hidrocarburos del Ecuador EP Petroecuador | | LATAMLatam Airlines Group S.A. | | One letter of credit | | | 5,500 | | | Jun 18, 2018 | Jun-18-20 | |
| Metropolitan Dade County | | LATAMLatam Airlines Group S.A. | | Eight letter of credit | | | 2,2732,298 | | | Mar 13, 2018 | March-13-20 | |
4ª Vara Mista de BayeuxNuminous LLC | | Tam Linhas AéreasLatam Airlines Group S.A. | | One insurance policies guaranteeletter of credit | | | 1,0442,200 | | | Mar 25, 2021 | Oct-15-20 | |
| Conselho Administrativo de Conselhos Federais | | Tam Linhas Aéreas S.A. | | One insurance policies guaranteeTwo letter of credit | | | 12,7031,730 | | | May 19, 2020 | Nov-24-20 | |
Fundação de Proteão de Defesa do Consumidor Procon | | Tam Linhas Aéreas S.A. | | TwoThree insurance policiespolicy guarantee | | | 3,9263,728 | | | Apr 1, 2021 | Apr-01-21 | |
| União Federal | | Tam Linhas Aéreas S.A. | | OneAn insurance policiespolicy guarantee | | | 6,6041,277 | | | Oct 20, 2021 | Sep-28-21 | |
União Federal -FazendaAena Aeropuertos S.A. | | Tam Linhas Aéreas S.A. | | One letter of credit | | | 1,405 | | | | Aug-14-20 | |
| Procuradoria da Fazenda Nacional | | Tam Linhas Aéreas S.A. | | One insurance policies guaranteeletter of credit | | | 41,2438,017 | | | Jul 30, 2020 | Aug-10-20 | |
União Federal - Procuradoira - Gral da fazenda Nacional | | Tam Linhas Aéreas S.A. | | Four insurance policies guarantee | | | 50,196 | | | Jan 4, 2020 |
União Federal Vara Comarca de DFRB Comercial Properties 49 Empreendimentos Imobiliarios LTDA | | Tam Linhas Aéreas S.A. | | One insurance policies guaranteeletter of credit | | | 1,55135,974 | | | Sep 28, 2021 | Apr-29-20 | |
UniãTribunal de Justição Federal Vara Comarca de SPSão Paulo. | | Tam Linhas Aéreas S.A. | | OneAn insurance policiespolicy guarantee | | | 19,2681,927 | | | Feb 22, 2021 | Sep-23-24 | |
| 17a Vara Cível da Comarca da Capital de João Pessoa/PB. | | Tam Linhas Aéreas S.A. | | An insurance policy guarantee | | | 3,050 | | | | Jun-25-23 | |
| 10ª Vara de Execuções Fiscais Federais de São Paulo/SP. | | Tam Linhas Aéreas S.A. | | An insurance policy guarantee | | | 33,938 | | | | Oct-03-20 | |
| Vara da Fazenda Pública da Comarca do Rio de Janeiro - RJ | | Tam Linhas Aéreas S.A. | | An insurance policy guarantee | | | 1,043 | | | | Sep-25-23 | |
| Vara das Execuções Fiscais Estaduais | | Tam Linhas Aéreas S.A. | | Three insurance policy guarantee | | | 6,770 | | | | Jul-05-23 | |
| Vara Civel Campinas. | | Tam Linhas Aéreas S.A. | | An insurance policy guarantee | | | 1,709 | | | | Jun-14-24 | |
| Procon | | ABSA Linhas Aereas Brasileira S/A | | An insurance policy guarantee | | | 10,453 | | | | May-19-20 | |
| Vara Federal da Subseção de Campinas SP | | ABSA Linhas Aereas Brasileira S/A | | An insurance policy guarantee | | | 15,856 | | | | Feb-20-21 | |
| Vara Federal da Subseção de Campinas SP | | ABSA Linhas Aereas Brasileira S/A | | One letter of credit | | | 2,329 | | | | Oct-20-21 | |
| Conselho Administrativo de Conselhos Federais | | ABSA Linhas Aereas Brasileira S/A | | An insurance policy guarantee | | | 5,435 | | | | Oct-20-21 | |
| | | | | | | | 280,032416,774 | | | | | |
The credit letters related to right of use assets are included in Note 17 letter (d) Additional information Property, Plant and Equipment, in numeral (i) Property Plant and equipment delivered under guarantee.
NOTE 33 - TRANSACTIONS WITH RELATED PARTIES
| (a) | Details of transactions with related parties as follows: |
| | | | | | | | | | | | | Transaction amount | | |
| | | | | Nature of | | | | Nature of | | | | with related parties | | | | | Nature of | | | | Nature of | | | | Transaction amount
with related parties | |
| | | | | relationship with | | Country | | related parties | | | | As of December 31, | | | | | relationship with | | Country | | related parties | | | | As of December 31, | |
| Tax No. | | Related party | | related parties | | of origin | | transactions | | Currency | | 2017 | | | 2016 | | | 2015 | | | Related party | | related parties | | of origin | | transactions | | Currency | | 2019 | | 2018 | | 2017 | |
| | | | | | | | | | | | | ThUS$ | | ThUS$ | | ThUS$ | | | ThUS$ | | ThUS$ | | ThUS$ | |
| 96.810.370-9 | | Inversiones Costa Verde Ltda. y CPA. | | Related director | | Chile | | Tickets sales | | CLP | | | 18 | | | | 6 | | | | 15 | | | Inversiones Costa Verde Ltda. y CPA. | | Related director | | Chile | | Tickets sales | | CLP | | 16 | | | 16 | | | | 18 | |
| | | | | | | | | | | | | | | | | | | | |
| 65.216.000-K | | Comunidad Mujer | | Related director | | Chile | | Tickets sales | | CLP | | | 14 | | | | 9 | | | | 2 | | | Comunidad Mujer | | Related director | | Chile | | Tickets sales | | CLP | | - | | | - | | | | 14 | |
| | | | | Services provided for advertising | | CLP | | | - | | | | (12 | ) | | | (10 | ) | |
| | | | | | | | | | | | | | | | | | | | |
| 78.591.370-1 | | Bethia S.A and subsidiaries | | Related director | | Chile | | Services received of cargo transport | | CLP | | | 1,643 | | | | (394 | ) | | | (259 | ) | | Bethia S.A and subsidiaries | | Related director | | Chile | | Services received of cargo transport | | CLP | | 556 | | | 1,778 | | | | 1,643 | |
| | | | | Services received from National and International Courier | | CLP | | | (382 | ) | | | (285 | ) | | | (227 | ) | | | | | Services received from National and International Courier | | CLP | | (3) | | | (85 | ) | | | (382 | ) |
| | | | | Services provided of cargo transport | | CLP | | | (17 | ) | | | 192 | | | | 30 | | | | | | Services provided of cargo transport | | CLP | | - | | | - | | | | (17 | ) |
| | | | | | | | | | | | | | | | | | | | | | | | Sales commissions | | CLP | | (218) | | | (821 | ) | | | (761 | ) |
| 65.216.000-K | | Viajes Falabella Ltda. | | Related director | | Chile | | Sales commissions | | CLP | | | (761 | ) | | | (727 | ) | | | (50 | ) | |
| | | | | | | | | | | | | | | | | | | | | | | | Services received advertising | | CLP | | (726 | ) | | (1,025 | ) | | | | |
| 79.773.440-3 | | Transportes San Felipe S.A | | Related director | | Chile | | Services received of transfer of passengers | | CLP | | | - | | | | (84 | ) | | | (127 | ) | | Transportes San Felipe S.A | | Related director | | Chile | | Tickets sales | | CLP | | - | | | - | | | | 1 | |
| | | | | Tickets sales | | CLP | | | 1 | | | | 3 | | | | 7 | | |
| | | | | | | | | | | | | | | | | | | | |
| 87.752.000-5 | | Granja Marina Tornagaleones S.A. | | Common shareholder | | Chile | | Tickets sales | | CLP | | | 72 | | | | 76 | | | | 117 | | | Granja Marina Tornagaleones S.A. | | Common shareholder | | Chile | | Tickets sales | | CLP | | 61 | | | 51 | | | | 72 | |
| | | | | | | | | | | | | | | | | | | | |
| Foreign | | | Consultoría Administrativa Profesional S.A. de C.V. | | Associate | | Mexico | | Professional counseling services received | | MXN | | - | | | - | | | | (2,357 | ) |
| 96.782.530-1 | | | Inmobiliaria Inversiones Asturias S.A. | | Related director | | Chile | | Tickets sales | | CLP | | - | | | 25 | | | | - | |
| 76.335.600-0 | | | Parque de Chile S.A. | | Related director | | Chile | | Tickets sales | | CLP | | 9 | | | 20 | | | | - | |
| 96.989.370-3 | | | Rio Dulce S.A. | | Related director | | Chile | | Tickets sales | | CLP | | - | | | 18 | | | | - | |
| Foreign | | | Inversora Aeronáutica Argentina | | Related director | | Argentina | | Property leases received | | ARS$ | | - | | | (231 | ) | | | (251 | ) |
| Foreign | | Consultoría Administrativa Profesional S.A. de C.V. | | Associate | | Mexico | | Professional counseling services received | | MXN | | | (2,357 | ) | | | (2,563 | ) | | | (1,191 | ) | | TAM Aviação Executiva e Taxi Aéreo S/A | | Common shareholder | | Brazil | | Services provided | | BRL | | 58 | | | 62 | | | | 45 | |
| | | | | | | | | | | | | | | | | | | | | | | | Services received of cargo transport | | BRL | | 2 | | | 8 | | | | - | |
| Foreign | | Inversora Aeronáutica Argentina | | Related director | | Argentina | | Leases as lessor | | ARS | | | (251 | ) | | | (264 | ) | | | (269 | ) | |
| | | | | Revenue billboard advertising maintaining | | US$ | | | - | | | | - | | | | 1 | | |
| | | | | | | | | | | | | | | | | | | | |
| Foreign | | TAM Aviação Executiva e Taxi Aéreo S/A | | Related director | | Brazil | | Services provided | | BRL | | | 45 | | | | (120 | ) | | | (61 | ) | |
| | | | | Services received at airports | | BRL | | | (39 | ) | | | 7 | | | | 5 | | | | | | Services provided | | BRL | | (10 | ) | | - | | | | - | |
| | | | | | | | | | | | | | | | | | | | | | | | Services received at airports | | BRL | | - | | | (2 | ) | | | (39 | ) |
| Foreign | | Qatar Airways | | Indirect shareholder | | Qatar | | Services provided by aircraft lease | | US$ | | | 31,707 | | | | - | | | | - | | | Qatar Airways | | Indirect shareholder | | Qatar | | Services provided by aircraft lease | | US$ | | 39,528 | | | 21,321 | | | | 31,707 | |
| | | | | Interlineal received service | | US$ | | | (2,139 | ) | | | - | | | | - | | | Interlineal received service | | US$ | | (2,050 | ) | | (6,345 | ) | | | (2,139 | ) |
| | | | | Interlineal provided service | | US$ | | | 5,279 | | | | - | | | | - | | | Interlineal provided service | | US$ | | 3,739 | | | 8,635 | | | | 5,279 | |
| | | | | Services provided of handling | | US$ | | | 1,002 | | | | - | | | | - | | | Services provided of handling | | US$ | | 1,106 | | | 1,392 | | | | 1,002 | |
| | | | Services provided / received others | | US$ | | 996 | | | 1,805 | | | | - | |
The balances of Accounts receivable and accounts payable to related parties are disclosed in Note 9.
Transactions between related parties have been carried out on free-tradeunder market conditions between interested and duly-informedduly informed parties.
| (b) | Compensation of key management |
The Company has defined for these purposes that key management personnel are the executives who define the Company’s policies and majormacro guidelines and who directly affect the results of the business, considering the levels of Vice-Presidents, Chief Executives and Directors (Senior).Senior Directors.
| | | For the period ended | | | For the year ended | |
| | | December 31, | | | December 31, | |
| | | 2017 | | 2016 | | 2015 | | | 2019 | | 2018 | | 2017 | |
| | | ThUS$ | | ThUS$ | | ThUS$ | | | ThUS$ | | ThUS$ | | ThUS$ | |
| | | | | | | | | | | | | | | |
| Remuneration | | | 17,826 | | | | 16,514 | | | | 17,185 | | | | 13,701 | | | | 14,841 | | | | 17,826 | |
| Management fees | | | 468 | | | | 556 | | | | 547 | | | | 411 | | | | 307 | | | | 468 | |
| Non-monetary benefits | | | 740 | | | | 778 | | | | 864 | | | | 1,815 | | | | 748 | | | | 740 | |
| Short-term benefits | | | 36,970 | | | | 23,459 | | | | 19,814 | | | | 31,124 | | | | 45,653 | | | | 36,970 | |
| Long-term benefits | | | | 8,577 | | | | 2,412 | | | | - | |
| Share-based payments | | | 13,173 | | | | 8,085 | | | | 10,811 | | | | 3,296 | | | | (7,210 | ) | | | 13,173 | |
| Termination benefits | | | | 1,428 | | | | 1,404 | | | | - | |
| Total | | | 69,177 | | | | 49,392 | | | | 49,221 | | | | 60,352 | | | | 58,155 | | | | 69,177 | |
NOTE 34 - SHARE-BASED PAYMENTS
| (a) | Compensation plan for increase of capital |
Compensation plans implemented by providing options for the subscription and payment of shares that have been granted by LATAM Airlines Group S.A. to employees of the Company and its subsidiaries, are recognized in the financial statements in accordance with the provisions of IFRS 2 "Share-based“Share-based Payment”, showing the effect of the fair value of the options granted under compensation in linear between the date of grant of such options and the date on which these irrevocable.
| (a.1) | Compensation plan 2011 |
On December 21, 2016, the subscription and payment period of the 4,800,000 shares corresponding to the compensation plan approved at the Extraordinary Shareholders' Meeting held on December 21, 2011, expired.
Of the total shares allocated to the 2011 Compensation Plan, only 10,282 shares were subscribed and paid, having been placed on the market in January 2014. In view of the above, at the expiration2013 not current as of this date the 2011 Compensation Plan had a balance of 4,789,718 shares pending of subscription and payment, which was deducted from the authorized capital of the Company.
| | | Number of Stock Options | |
| | | In share-based payment arrangements | |
| | | | | | Options | | | Expired | | | | |
| | | Opening | | | waived by | | | Action | | | Closing | |
| Periods | | balance | | | executives | | | Options | | | Balance | |
| From January 1 to December 31, 2016 | | | 4,518,000 | | | | (4,172,000 | ) | | | (346,000 | ) | | | - | |
| From January 1 to December 31, 2017 | | | - | | | | - | | | | - | | | | - | |
These options was valued and recorded at fair value at the grant date, determined by the "Black-Scholes-Merton”. No result has been recognized as of December 2017 (ThUS$ 2,989 at December 31, 2016).
| (a.2) | Compensation plan 2013 |
At the Extraordinary Shareholders’ Meeting held on June 11, 2013, the Company’s shareholders of the Company approved, motions including increasing corporate equity,among other matters, the increase in the share capital, of which 1,500,000 shares were allocated to compensation plans for the employees of the Company. Company and its subsidiaries, in conformityaccordance with the stipulations established inprovisions of Article 24 of the Corporations Law. With regard to this compensation, a defined date for implementation does not exist.Law on Public Limited Companies.
On June 11, 2018, expired the term to subscribe said actions, which were neither subscribed nor paid, reducing the capital of full rights.
| (b) | Compensation plan 2016-2018 |
The company implemented a retention plan long-term for executives, which lasts until December 2018, with a vesting period between October 2018 and March 2019, which consists of an extraordinary bonus whose calculation formula is based on the variation the value to experience the action of LATAM Airlines Group S.A. for a period of time.
This benefit is recognizedrecorded in accordance with the provisions of IFRS 2 "Share-based Payments"“Payments based on shares” and has been considered as a cash settled award and, therefore, recorded at fair value as a liability, which is updated toat the closing datedate. of each financial statement with effect on profit or loss.the result of the period.
| | | Base Units | |
| | | Opening | | | | | | | | | | | | Closing | |
| Periods | | balance | | | Granted | | | Annulled | | | Exercised | | | Balance | |
| From January 1 to December 31, 2016 | | | 4,719,720 | | | | - | | | | - | | | | - | | | | 4,719,720 | |
| From January 1 to December 31, 2017 | | | 4,719,720 | | | | 37,359 | | | | (1,193,286 | ) | | | (630,897 | ) | | | 2,932,896 | |
| | | Base Units | |
| | | Opening | | | | | | | | | | | | Closing | |
| Periods | | balance | | | Granted | | | Annulled | | | Exercised | | | Balance | |
| From January 1 to December 31, 2018 | | | 2,932,896 | | | | - | | | | (171,419 | ) | | | (1,168,700 | ) | | | 1,592,777 | |
| From January 1 to December 31, 2019 | | | 1,592,777 | | | | 93,481 | | | | - | | | | (1,686,258 | ) | | | - | |
The fair value has been determined on the basis of the best estimate of the future value of the Company share multiplied by the number of units granted bases.
AtAs of December 31, 2017,2019 and 2018, the carrying amount ofrecorded is ThUS$ 13,173, is3,296 and ThUS$ (7,210), respectively, classified under "Administrative expenses" inthe line “Administrative expenses” of the Consolidated Income Statement of Income by Function.function.
We inform you that this Compensation Plan is finished (LP1).
| (c) | SubsidiariesLP2 compensation plans (2019-2020) |
The company implemented a long-term retention plan for executives that lasts until March 2020, with a period of enforceability between October 2019 and March 2020, which consists of an extraordinary bonus whose calculation formula is based on the variation of the value experienced by the action of LATAM Airlines Group SA for a certain period of time.
At December 31, 2019 the required action price for its collection is under the initial target.
| (d) | LP3 compensation plans (2020-2023) |
The Company implemented a program for a group of executives, which lasts until March 2023, with a period of enforceability between October 2020 and March 2023, where the collection percentage is annual and cumulative. The methodology is an allocation, of quantity of units, where a goal of the value of the action is set.
The bonus is applicable, if the target of the price of the action defined in each year is met. In case the bonus is accumulated, until the last year, the total bonus is doubled (in the case of the share price is activated).
| (e) | Subsidiary compensation plans |
| (c.1)(e.1) | Stock OptionsStock-based payments |
As indicated in Note 1, and the consequent resignation of the executives of Multiplus S.A., subsidiaries the option plans granted were canceled. (As of TAM S.A., have outstanding stock options at December 31, 2017, which2018, the options for current shares amounted to 316,025247,500 shares (at December 31, 2016, the distribution of outstanding stock options amounted to 394,698 for Multiplus S.A.).
Multiplus S.A.
| | | | | | | | | 4nd Extraordinary | | | | |
| | | 3rd Grant | | | 4th Grant | | | Grant | | | | |
| Description | | 03/21/2012 | | | 04/03/2013 | | | 11/20/2013 | | | Total | |
| Outstanding option number as December 31, 2016 | | | 84,249 | | | | 173,399 | | | | 137,050 | | | | 394,698 | |
| Outstanding option number as December 31, 2017 | | | 84,249 | | | | 163,251 | | | | 68,525 | | | | 316,025 | |
For Multiplus S.A., the plan's terms provide that the options granted to the usual prizes are divided into three equal parts and employees may exercise one-third of their two, three and four, options respectively, as long as they keep being employees of the company. The agreed term of the options is seven years after the grant of the option. The first extraordinary granting was divided into two equal parts, and only half of the options may be exercised after three years and half after four years. The second extraordinary granting was also divided into two equal parts, which may be exercised after one and two years respectively.
| Multiplus S.A. | | | | | | | | | | | | |
| | | | | | | | | 4nd Extraordinary | | | | |
| | | 3rd Grant | | | 4th Grant | | | Grant | | | | |
| Description | | 03/21/2012 | | | 04/03/2013 | | | 11/20/2013 | | | Total | |
| Outstanding option number as December 31, 2018 | | | 84,249 | | | | 163,251 | | | | - | | | | 247,500 | |
| Outstanding option number as December 31, 2019 | | | - | | | | - | | | | - | | | | - | |
The acquisition of the share'sshare’s rights, in both companies is as follows:
| | | Number of shares | | Number of shares | | | Number of shares | | Number of shares | |
| | | Accrued options | | Non accrued options | | | Accrued options | | Non accrued options | |
| | | As of | | As of | | As of | | As of | | | As of | | As of | | As of | | As of | |
| | | December 31, | | December 31, | | December 31, | | December 31, | | | December 31, | | December 31, | | December 31, | | December 31, | |
| Company | | 2017 | | 2016 | | 2017 | | 2016 | | | 2019 | | 2018 | | 2019 | | 2018 | |
| Multiplus S.A. | | | - | | | | - | | | | 316,025 | | | | 394,698 | | | | - | | | | 247,500 | | | | - | | | | 247,500 | |
In accordance with IFRS 2 - Payments based on shares, the fair value of the option must be recalculated and recorded in the liability of the Company, once cash payment is made (cash-settled). The fair value of these options was calculated using the "Black-Scholes-Merton"“Black-Scholes-Merton” method, where the assumptions were updated with information from LATAM Airlines Group S.A. As of December 31, 2017 and December 31, 20162018 there is no value recorded in liabilities and results.
| (c.2)(e.2) | Payments based on restricted stock |
In MayAs of 2014December 31, 2019, payment contracts based on restricted shares signed with the Management Councilexecutives of Multiplus S.A. approved a plan to grant restricted stock, a total of 91,103 ordinary, registered book entry securities with no face value, issued by the Company to beneficiaries.were canceled, as described in Note 1.
The quantity of restricted stock units was calculated based on employees’ expected remunerations divided by the average price of shares in Multiplus S.A. traded on the BM&F Bovespa exchange in the month prior to issue, April of 2014. This benefits plan will only grant beneficiaries the right to the restricted stock when the following conditions have been met:
a. Compliance with the performance goal defined by this Council as return on Capital Invested.
b. The Beneficiary must remain as an administrator or employee of the Company for the period running from the date of issue to the following dates described, in order to obtain rights over the following fractions: (i) 1/3 (one third) after the 2nd year from the issue date; (ii) 1/3 (one third) after the 3rd year from the issue date; (iii) 1/3 (one third) after the 4th year from the issue date.
| | | | | | | | | Not acquired due | | | | |
| | | Opening | | | | | | to breach of employment | | | Closing | |
| | | balance | | | Exercised | | | retention conditions | | | balance | |
| | | | | | | | | | | | | |
| From January 1 to December 31, 2018 | | | 309,710 | | | | (83,958 | ) | | | (8,916 | ) | | | 216,836 | |
| From January 1 to December 31, 2019 | | | 216,836 | | | | - | | | | - | | | | 216,836 | |
Number shares in circulation
| | | | | | | | | | | | Not acquired due | | | | |
| | | Opening | | | | | | | | | to breach of employment | | | Closing | |
| | | balance | | | Granted | | | Exercised | | | retention conditions | | | balance | |
| From January 1 to December 31, 2016 | | | 175,910 | | | | 138,282 | | | | (15,811 | ) | | | (60,525 | ) | | | 237,856 | |
| From January 1 to December 31, 2017 | | | 237,856 | | | | 129,218 | | | | (41,801 | ) | | | (15,563 | ) | | | 309,710 | |
NOTE 35 - STATEMENT OF CASH FLOWS
(a) The Company has done significant non-cash transactions mainly with financial leases, which are detailed in Note 17 letter (d), additional information in numeral (iv) Financial leases.
| (a) | The Company has carried out non-monetary transactions mainly related to financial lease and lease liabilities, which are described in Note 19 Other financial liabilities. |
(b) Other inflows (outflows) of cash:
| (b) | Other inflows (outflows) of cash: |
| | | For the periods ended | | | For theyear ended | |
| | | December 31, | | | December 31, | |
| | | 2017 | | 2016 | | 2015 | | | 2019 | | 2018 | | 2017 | |
| | | ThUS$ | | ThUS$ | | ThUS$ | | | ThUS$ | | ThUS$ | | ThUS$ | |
| Delta Air Lines Inc. compensation (1) | | | | 350,000 | | | | - | | | | - | |
| Fuel hedge | | | | (9,966 | ) | | | 77,234 | | | | 19,862 | |
| Hedging margin guarantees | | | | (21,200 | ) | | | 1,573 | | | | (4,201 | ) |
| Currency hedge | | | | - | | | | (1,282 | ) | | | (17,798 | ) |
| Change reservation systems | | | | - | | | | - | | | | (16,120 | ) |
| Tax paid on bank transaction | | | | (11,369 | ) | | | 318 | | | | (6,635 | ) |
| Fuel derivatives premiums | | | | (17,102 | ) | | | (13,947 | ) | | | (2,832 | ) |
| Bank commissions, taxes paid and other | | | | (20,627 | ) | | | (8,179 | ) | | | (7,738 | ) |
| Guarantees | | | | (5,474 | ) | | | 14,755 | | | | 59,988 | |
| Court deposits | | | | (22,976 | ) | | | (30,860 | ) | | | (33,457 | ) |
| | | | | | | | | | | | | | | | | | | | |
| Guarantees | | | 59,988 | | | | (51,559 | ) | | | (2,125 | ) | |
| Fuel hedge | | | 19,862 | | | | (50,029 | ) | | | (243,587 | ) | |
| DOJ fine | | | - | | | | (12,750 | ) | | | - | | |
| SEC agreement | | | - | | | | (4,719 | ) | | | - | | |
| Fuel derivatives premiums | | | (2,832 | ) | | | (6,840 | ) | | | (20,932 | ) | |
| Hedging margin guarantees | | | (4,201 | ) | | | 1,184 | | | | 87,842 | | |
| Tax paid on bank transaction | | | (6,635 | ) | | | (10,668 | ) | | | (7,176 | ) | |
| Bank commissions, taxes paid and other | | | (7,738 | ) | | | (769 | ) | | | (5,137 | ) | |
| Change reservation systems | | | (16,120 | ) | | | - | | | | 11,000 | | |
| Currency hedge | | | (17,798 | ) | | | (39,534 | ) | | | 1,802 | | |
| Court deposits | | | (33,457 | ) | | | (33,635 | ) | | | (6,314 | ) | |
| Others | | | - | | | | 50 | | | | - | | |
| Total Other inflows (outflows) Operation flow | | | (8,931 | ) | | | (209,269 | ) | | | (184,627 | ) | | | 241,286 | | | | 39,612 | | | | (8,931 | ) |
| | | | | | | | | | | | | | | | | | | | | | | | | |
| Others deposits in guarantees | | | 3,754 | | | | - | | | | - | | | | - | | | | - | | | | 3,754 | |
| Recovery loans convertible into shares | | | - | | | | 8,896 | | | | 20,000 | | |
| Certificate of bank deposits | | | - | | | | - | | | | 3,497 | | |
| Tax paid on bank transaction | | | (2,594 | ) | | | (3,716 | ) | | | (12,921 | ) | | | (2,249 | ) | | | (2,476 | ) | | | (2,594 | ) |
| Others | | | (10,383 | ) | | | (4,337 | ) | | | - | | | | - | | | | - | | | | (10,383 | ) |
| | | | | | | | | | | | | | |
| Total Other inflows (outflows) Investment flow | | | (9,223 | ) | | | 843 | | | | 10,576 | | | | (2,249 | ) | | | (2,476 | ) | | | (9,223 | ) |
| | | | | | | | | | | | | | | | | | | | | | | | | |
| Loan guarantee | | | 80,615 | | | | (74,186 | ) | | | - | | | | - | | | | - | | | | 80,615 | |
| Credit card loan manager | | | - | | | | - | | | | 3,227 | | |
| Early redemption of bonds TAM 2020 | | | - | | | | - | | | | (15,328 | ) | |
| Guarantees bonds emission | | | - | | | | - | | | | (26,111 | ) | |
| Settlement of derivative contracts | | | | (2,976 | ) | | | (11,675 | ) | | | (40,695 | ) |
| Aircraft Financing advances | | | (26,214 | ) | | | (125,149 | ) | | | (28,144 | ) | | | (55,728 | ) | | | 55,728 | | | | (26,214 | ) |
| Settlement of derivative contracts | | | (40,695 | ) | | | (29,828 | ) | | | (35,891 | ) | |
| Others | | | - | | | | - | | | | 2,490 | | | | - | | | | - | | | | - | |
| | | | | | | | | | | | | | |
| Total Other inflows (outflows) Financing flow | | | 13,706 | | | | (229,163 | ) | | | (99,757 | ) | | | (58,704 | ) | | | 44,053 | | | | 13,706 | |
| | | For the periods ended | |
| | | December 31, | |
| | | 2017 | | | 2016 | | | 2015 | |
| | | ThUS$ | | | ThUS$ | | | ThUS$ | |
| | | | | | | | | | |
| Latam Airlines Group S.A. | | | (20,766 | ) | | | - | | | | - | |
| Multiplus S.A. (*) | | | (45,876 | ) | | | (40,823 | ) | | | (34,632 | ) |
| Lan Perú S.A. (*) | | | - | | | | (400 | ) | | | (400 | ) |
| Total dividends paid | | | (66,642 | ) | | | (41,223 | ) | | | (35,032 | ) |
(*) Dividends paid to minority shareholders
| | | For the period ended | |
| | | December 31, | |
| | | 2019 | | | 2018 | | | 2017 | |
| | | ThUS$ | | | ThUS$ | | | ThUS$ | |
| Latam Airlines Group S.A. | | | (54,580 | ) | | | (46,591 | ) | | | (20,766 | ) |
| Multiplus S.A. (*) | | | - | | | | (26,029 | ) | | | (45,876 | ) |
| Latam Airlines Perú S.A. (*) | | | (536 | ) | | | - | | | | - | |
| Total dividends paid | | | (55,116 | ) | | | (72,620 | ) | | | (66,642 | ) |
| d)(*) | Dividends paid to minority shareholders |
| (d) | Reconciliation of liabilities arising from financing activities: |
| | | As of | | Cash flows | | Non-Flow Movements | | As of | | | As of | | Cash flows | | Non-Flow Movements | | As of | |
| Obligations with | | December 31, | | Obtainment | | Payment | | Interest accrued | | | | December 31, | | |
| financial institutions | | 2016 | | Capital | | Capital | | Interest | | and others | | Reclassifications | | 2017 | | |
| | | | December 31, | | Obtainment | | Payment | | Interest accrued | | | | December 31, | |
| Obligations with financial institutions | | | 2018 | | Capital | | Capital | | Interest | | and others | | Reclassifications | | 2019 | |
| | | ThUS$ | | ThUS$ | | ThUS$ | | ThUS$ | | ThUS$ | | ThUS$ | | ThUS$ | | | ThUS$ | | ThUS$ | | ThUS$ | | ThUS$ | | ThUS$ | | ThUS$ | | ThUS$ | |
| | | | | | | | | | | | | | | | | | Restated | | | | | | | | | | | | | |
| Loans to exporters | | | 278,164 | | | | 130,000 | | | | (99,719 | ) | | | (7,563 | ) | | | 13,737 | | | | - | | | | 314,619 | | | | 400,721 | | | | 93,000 | | | | (145,505 | ) | | | (12,934 | ) | | | 6,193 | | | | - | | | | 341,475 | |
| Bank loans | | | 585,287 | | | | 70,357 | | | | (345,552 | ) | | | (21,127 | ) | | | 32,668 | | | | - | | | | 321,633 | | | | 222,741 | | | | 164,095 | | | | (165,549 | ) | | | (11,352 | ) | | | 7,320 | | | | - | | | | 217,255 | |
| Guaranteed obligations | | | 4,758,552 | | | | 182,140 | | | | (486,599 | ) | | | (154,072 | ) | | | 155,907 | | | | (419,085 | ) | | | 4,036,843 | | | | 2,534,021 | | | | 607,797 | | | | (282,721 | ) | | | (93,335 | ) | | | 93,286 | | | | (701,721 | ) | | | 2,157,327 | |
| Other guaranteed obligations | | | 256,420 | | | | - | | | | (15,022 | ) | | | (8,890 | ) | | | 9,667 | | | | - | | | | 242,175 | | | | 673,452 | | | | - | | | | (92,549 | ) | | | (28,417 | ) | | | 27,946 | | | | - | | | | 580,432 | |
| Obligation with the public | | | 1,309,345 | | | | 1,055,167 | | | | (797,828 | ) | | | (128,764 | ) | | | 146,146 | | | | - | | | | 1,584,066 | | | | 1,553,079 | | | | 1,009,836 | | | | (487,086 | ) | | | (144,932 | ) | | | 134,037 | | | | - | | | | 2,064,934 | |
| Financial leases | | | 1,022,361 | | | | - | | | | (344,005 | ) | | | (46,874 | ) | | | 58,937 | | | | 419,085 | | | | 1,109,504 | | | | 1,624,854 | | | | - | | | | (591,861 | ) | | | (72,311 | ) | | | 68,440 | | | | 701,721 | | | | 1,730,843 | |
| Other loans | | | 394,791 | | | | 13,107 | | | | (124,688 | ) | | | (22,434 | ) | | | 22,024 | | | | - | | | | 282,800 | | | | 252,858 | | | | 27,864 | | | | (178,777 | ) | | | (9,648 | ) | | | 8,964 | | | | - | | | | 101,261 | |
| Lease liability | | | | 2,858,049 | | | | - | | | | (398,992 | ) | | | (177,949 | ) | | | 891,049 | | | | - | | | | 3,172,157 | |
| Total Obligations with financial institutions | | | 8,604,920 | | | | 1,450,771 | | | | (2,213,413 | ) | | | (389,724 | ) | | | 439,086 | | | | - | | | | 7,891,640 | | | | 10,119,775 | | | | 1,902,592 | | | | (2,343,040 | ) | | | (550,878 | ) | | | 1,237,235 | | | | - | | | | 10,365,684 | |
| | | As of | | | Cash flows | | | Non-Flow Movements | | | As of | |
| | | December 31, | | | Obtainment | | | Payment | | | Interest accrued | | | | | | December 31, | |
| Obligations with financial institutions | | 2017 | | | Capital | | | Capital | | | Interest | | | and others | | | Reclassifications | | | 2018 | |
| | | ThUS$ | | | ThUS$ | | | ThUS$ | | | ThUS$ | | | ThUS$ | | | ThUS$ | | | ThUS$ | |
| | | Restated | | | | | | | | | | | | | | | | | | Restated | |
| Loans to exporters | | | 314,619 | | | | 293,001 | | | | (202,000 | ) | | | (10,467 | ) | | | 5,568 | | | | - | | | | 400,721 | |
| Bank loans | | | 321,633 | | | | 74,663 | | | | (167,548 | ) | | | (13,961 | ) | | | 7,954 | | | | - | | | | 222,741 | |
| Guaranteed obligations | | | 4,036,843 | | | | - | | | | (315,698 | ) | | | (122,639 | ) | | | 99,320 | | | | (1,163,805 | ) | | | 2,534,021 | |
| Other guaranteed obligations | | | 242,175 | | | | 704,398 | | | | (274,339 | ) | | | (16,873 | ) | | | 18,091 | | | | - | | | | 673,452 | |
| Obligation with the public | | | 1,584,066 | | | | - | | | | 1,561 | | | | (107,629 | ) | | | 75,081 | | | | - | | | | 1,553,079 | |
| Financial leases | | | 1,109,504 | | | | - | | | | (691,390 | ) | | | (69,808 | ) | | | 112,743 | | | | 1,163,805 | | | | 1,624,854 | |
| Other loans | | | 282,800 | | | | 55,728 | | | | (88,934 | ) | | | (15,978 | ) | | | 19,242 | | | | - | | | | 252,858 | |
| Lease liability | | | 3,146,972 | | | | - | | | | (373,440 | ) | | | (182,948 | ) | | | 267,465 | | | | - | | | | 2,858,049 | |
| Total Obligations with financial institutions | | | 11,038,612 | | | | 1,127,790 | | | | (2,111,788 | ) | | | (540,303 | ) | | | 605,464 | | | | - | | | | 10,119,775 | |
(e) Advances of aircraft
Below are the cash flows associated with aircraft purchases, which are included in the statement of consolidated cash flow, in the item Purchases of properties, plants and equipment:
| | | For the periods ended | | | For the period ended | |
| | | December 31, | | | December 31, | |
| | | 2017 | | 2016 | | | 2019 | | 2018 | | 2017 | |
| | | MUS$ | | MUS$ | | | ThUS$ | | ThUS$ | | ThUS$ | |
| | | | | | | | | | | | | |
| Increases (payments) | | | (205,143 | ) | | | (170,684 | ) | | | (86,288 | ) | | | (212,163 | ) | | | (205,143 | ) |
| Recoveries | | | 78,641 | | | | 727,585 | | | | 349,702 | | | | 157,508 | | | | 103,065 | |
| Total cash flows | | | (126,502 | ) | | | 556,901 | | | | 263,414 | | | | (54,655 | ) | | | (102,078 | ) |
| F-142f) | The net effect by the hyperinflation application in the consolidated statement of cash flow for the exercise ended December 31, 2018 corresponds to: |
| | | For the period ended | |
| | | December 31, | |
| | | 2019 | | | 2018 | |
| | | ThUS$ | | | ThUS$ | |
| | | | | | | |
| Net cash flows from (used in) operating activities | | | 118,797 | | | | 6,088 | |
| Net cash flows from (used in) investment activities | | | 64,516 | | | | (17,611 | ) |
| Net cash flows from (used in) financing activities | | | (56,866 | ) | | | 3,914 | |
| Effects of variation in the exchange rate on cash and cash equivalents | | | (126,447 | ) | | | 7,609 | |
| Net increase (decrease) in cash and cash equivalents | | | - | | | | - | |
NOTE 36 - THE ENVIRONMENT
LATAM Airlines Group S.A has a commitment to sustainable development seeking to generate value taking into account the governance, environmental and social aspects. The company manages environmental issues at a corporate level, centralized in the Sustainability Management. For the company to monitor and minimize its impact on the environment is a commitment of the highest level; where the continuous improvement and contribute to the solution of the global climate change problem, generating added value to the company and the region, are the pillars of its management.
One of the functions of the Sustainability Management in environmental issues, together with the various areas of the Company, is to ensure environmental compliance, implement a management system and environmental programs that comply with the requirements every day more.more demanding worldwide; in addition to continuous improvement programs in their internal processes, which generate environmental, social and economic benefits and which are added to those currently carried out.
Within the sustainability strategy, the Environment dimension of LATAM Airlines Group S.A., is called Climate Change and is based on the goal of achieving world leadership in this area, and for which we work on the following aspects:
i. Carbon footprint
ii. Eco Efficiency
iii. Sustainable Alternative Energy
iv. Standards and Certifications
This is how, during 2017,2019, the following initiatives have been carried out:
| - | Implementation of an Environmental Management System for the main operations of the company. It is highlighted that the company during 20162018 has recertified its environmental management system in Miami facilities following the guidelines of the international standard ISO 14.001. |
| - | Maintenance of the Stage 2 Certification of IATA Environmental Assestment (IEnvA) whose scope is the international flights operated from Chile, the most advanced level of this certification; being the first in the continent and one of the four airlines in the world that have this certification. |
| - | Maintenance of the Stage 1 Certification of IEnvA of our operation in Colombian, achieved in 2018 |
| - | Preparation of the environmental chapter for the sustainability report of the company 2019, which allows to measure progress in environmental issues. |
| - | Answer to the questionnaire of the DJSI. |
| - | Measurement and external verification of the Corporate Carbon Footprint. |
| - | Neutralization of domestic air operations in Colombia. |
| - | Neutralization of land operations in all spanish speaking countries through the operationspurchase of Colombia and Peru withcarbon credits for an emblematic reforestation projectsproject in the respective countries.Amazon. |
| - | Incorporation of 100% electric power from renewable sources in the maintenance base facilities and the corporate building of operations in Chile. |
| - | Implementation of the Recycle Your Trip program, which seeks to manage the waste generated on board domestic flights in Chile. This program aims to incorporate a hub every 6 months. |
It is highlighted that in 2017,2019, LATAM Airlines Group maintained its inclusion for the fourthsixth consecutive year in the world category of the Dow Jones Sustainability Index, with only 3 airlines in the world belonging to this select group.
NOTE 37 - EVENTS SUBSEQUENT TO THE DATE OF THE FINANCIAL STATEMENTS
Subsequent to the closing date of the financial statements as of December 31, 20172019, there has been a significant variation in the exchange rate (Central Bank of Brazil) R $ / US $, from R $ 4.03 to US$ to R $ 4.85 per US$ to March 13, 2020, which represents a depreciation of 20.23% of the Brazilian currency.
On March 12, 2020, LATAM Airlines and its Affiliates announced the suspension of its guidance 2020 in light of the uncertainty due to the COVID-19 (coronavirus) outbreak that is affecting the demand for air traffic. Accordingly, LATAM Airlines Group and its affiliates announced a decrease in capacity of approximately 30% of international operations. On March 16, 2020, LATAM Airlines and its affiliates updated the decrease in capacity to approximately 70% of the total operations, corresponding 90% to international operations and 40% to domestic operations.
As of this date, it is not possible to quantify the exact impact on demand or how long it may take to recover, making it impossible to estimate results for the full year.
After December 31, 2019 and until the date of issuance of these financial statements, there is no knowledge of other events of a financial or other events thatnature, which significantly affect the balances or their interpretation.interpretation thereof.
The consolidated financial statements of LATAM Airlines Group S.A. and Subsidiaries as of December 31, 2017,2019, have been approved in anthe Extraordinary Board Meeting onSession of March 14, 2018.16, 2020.
SIGNATURES
The registrant hereby certifies that it meets all of the requirements for filing on Form 20-F and that it has duly caused and authorized the undersigned to sign this annual report on its behalf.
Date: April 4, 2018March 18, 2020 | LATAM AIRLINES GROUP S.A. |
| | |
| | By: /s/ Enrique Cueto/s/ Ramiro Alfonsín Balza |
| | Name: Enrique CuetoRamiro Alfonsín Balza |
| | Title: LatamLATAM Airlines Group CEOCFO |
134